Attached files
| file | filename |
|---|---|
| 8-K - FIRST NATIONAL CORP /VA/ | fncform8k050818.htm |
Exhibit 99.1

Investor Presentation May 2018

Forward-Looking Statements The Company makes forward-looking statements in this presentation that are subject to risks and uncertainties. These forward-looking statements may include statements regarding profitability, liquidity, adequacy of capital, the allowance for loan losses, interest rate sensitivity, market risk, growth strategy, and financial and other goals. The words, “believes,” “expects,” “may,” “will,” “should,” “projects,” “contemplates,” “anticipates,” “forecasts,” “intends,” or other similar words or terms are intended to identify forward-looking statements. These forward-looking statements are subject to significant uncertainties. Because of these uncertainties, actual future results may be materially different from the results indicated by these forward-looking statements. In addition, past results of operations do not necessarily indicate future results. The following presentation should be read in conjunction with the consolidated financial statements and related notes included in Part II, Item 8, and Item 1A. Risk Factors of the Company’s Form 10-K for the year ended December 31, 2017. 2

First National Corporation Customer Map Ticker “FXNC” quoted on OTC Markets Group exchangeCommunity banking since 190715 branches across 6 counties and 3 MSAs in VirginiaWealth management division $220 million AUMLow-cost deposit portfolio at 0.35% Providing solutions to small businessesManagement team with track record of successAnnual loan growth averaged 10% last 5 yearsSuperior asset quality with NPAs/Assets of 0.09% The strategic objective is to grow total assets in excess of $1 billion through organic growth opportunities and strategic acquisitions in like markets, with a focus on serving as trusted advisors to small businesses and individuals. Financial information as of and for the quarter ended March 31, 2018, except for annual loan growth. 3

First National Outperformed Major Indices Source: SNL Financial, as of April 16, 2018Peers include banking companies headquartered in Virginia with total assets between $500 million and $1 billion. 4
Q1 2018 and Full Year 2017 Highlights Q1 2018 compared to Q1 2017Profitability ratios improved with ROE of 18.47%, ROA of 1.45% and efficiency ratio of 62.39%Net interest income increased 9% and wealth management increased 17%Noninterest expenses increased 2%, including the recent expansion into Richmond marketNet loans increased 5% and deposits increased 6% from prior yearNonperforming assets to total assets decreased to 0.09%2017 HighlightsRecord year of revenues totaling $33.6 millionPre-tax income increased 23%Return on equity of 11.57%Efficiency ratio improved to 66.42%Expanded into Richmond with branch and experienced bankers 5

Net Interest Income and Margin Dollars in thousands. Quarterly financial information is unaudited. Net interest income increased $555 thousand, or 9%, to $6.5 million in the first quarter of 2018 compared to the first quarter of 2017.Net interest margin increased 9 basis points to 3.79% for the quarter ended March 31, 2018, compared to 3.70% for the same period of 2017. 6

Noninterest Income Dollars in thousands. Quarterly financial information is unaudited. Wealth management fees increased $60 thousand, or 17%, for the quarter ended March 31, 2018 compared to the same period of 2017.Service charges on deposit accounts and ATM and check card fees remained stable. 7
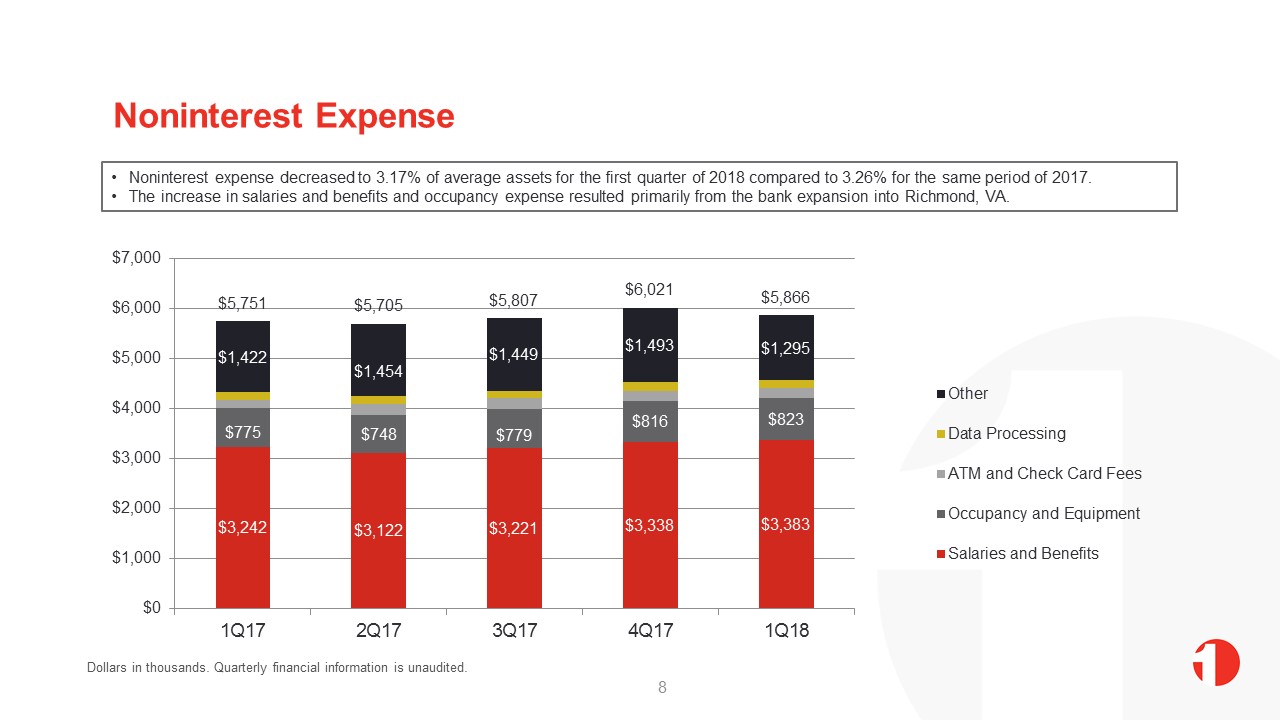
Noninterest Expense Dollars in thousands. Quarterly financial information is unaudited. Noninterest expense decreased to 3.17% of average assets for the first quarter of 2018 compared to 3.26% for the same period of 2017.The increase in salaries and benefits and occupancy expense resulted primarily from the bank expansion into Richmond, VA. 8

Improved Efficiency Total revenue is comprised of net interest income and noninterest income.Dollars in millions. Quarterly financial information is unaudited. The efficiency ratio improved to 62.4% for Q1 2018 compared to 69.5% for Q1 2017 due to continued revenue growth and expense management. 9

Earnings and Profitability Basic and diluted earnings per share. Quarterly financial information is unaudited. During the fourth quarter of 2017, the company recorded a $752 thousand, or $0.16 per diluted share, charge to income tax expense for the re-measurement of net deferred tax assets, which resulted from the new 21% Federal corporate income tax rate established by the Tax Cuts and Jobs Act enacted in December 2017. 10

Loan Portfolio and Improved Yield Dollars in millions. Quarterly financial information is unaudited. Loans increased $23M, or 5%, to $521 million at March 31, 2018 compared to the prior year, while the yield on loans improved 24 basis points to 4.92%. 11
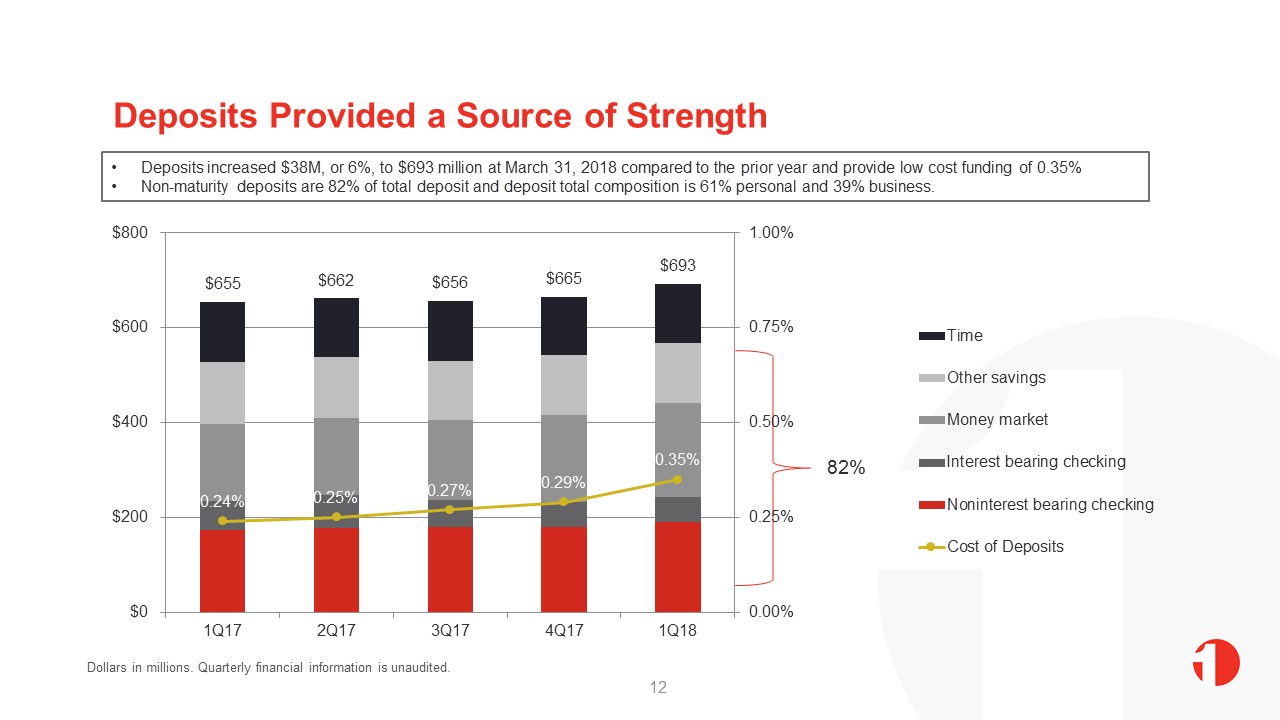
Deposits Provided a Source of Strength Dollars in millions. Quarterly financial information is unaudited. Deposits increased $38M, or 6%, to $693 million at March 31, 2018 compared to the prior year and provide low cost funding of 0.35%Non-maturity deposits are 82% of total deposit and deposit total composition is 61% personal and 39% business. 82% 12

Asset Quality Nonperforming assets comprised of nonaccrual loans and other real estate owned. Peers median ratio was based on banks in Virginia with assets between $500 million to $1 billion. Dollars in thousands. Quarterly financial information is unaudited. Nonperforming assets remained low at 0.09% of total assets at March 31, 2018.The allowance for loan losses totaled $5.3 million, or 1.01% of total loans. 13

Capital Position 14

Strategies to Build Shareholder Value Grow Assets Without Adding Significant Overhead Deploy Cash and Securities into Loans Deposit Growth in Vibrant Virginia Markets Diversify Noninterest Income Experienced Board & Management Team Track Record of Value-Creating Acquisitions 15
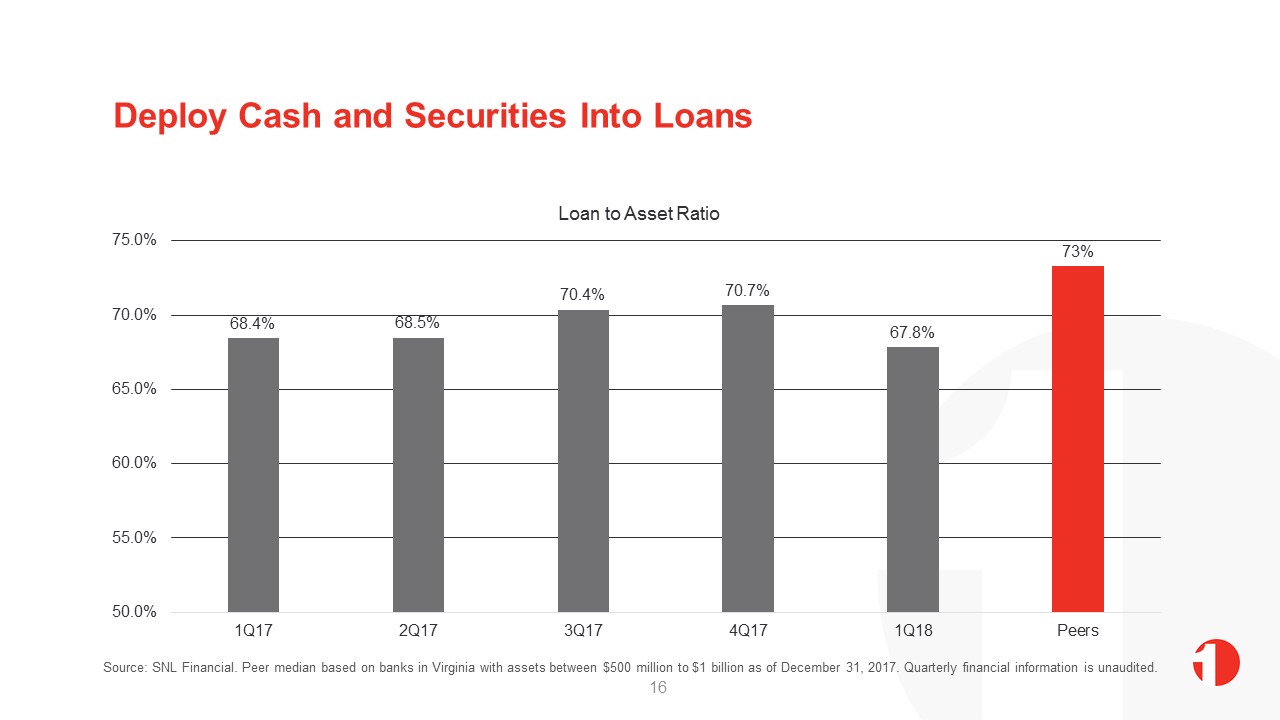
Deploy Cash and Securities Into Loans Source: SNL Financial. Peer median based on banks in Virginia with assets between $500 million to $1 billion as of December 31, 2017. Quarterly financial information is unaudited. 16

Grow Deposits in Vibrant Virginia Markets Virginia’s unemployment rate is lower than the nation at 3.5% 1: Source: Virginia Employment Commission, April 20182: Source: Virginia Economic Development Partnership3: Source: SNL Financial includes City of Winchester, Frederick, Shenandoah and Warren Counties; Cities of Staunton and Waynesboro, Rockingham, Buckingham and Price Edward Counties; and deposits within 3 miles of the Patterson Avenue First Bank office. Diverse economies with large regional medical centers and higher education, including Virginia Commonwealth University, University of Richmond, Shenandoah University and Mary Baldwin University Projected Population Growth: 2010 – 2020 1 Virginia is headquarters to 37 Fortune 1000 firms 2 Virginia ranked 5th “Best States for Business” ranking by Forbes More than $9 billion deposits within First Bank’s branch footprint 3 Staunton-Waynesboro MSAPopulation: 118,502Growth: 8% Richmond MSAPopulation: 1,208,101Growth: 13% Winchester MSAPopulation: 104,508Growth: 20% 17

Track Record of Value-Creating Acquisitions Acquisition Opportunities in Virginia Branch Acquisition Success Six branches acquired in 2015 including $186 million in deposits Hired Regional President and a market executive to deploy deposits into loans in the Staunton-Waynesboro MSA Opened Loan Production Office and hired a market executive in Harrisonburg, VA 22 thousand deposit accounts with 0.19% cost of deposits at closing 1 Source: SNL Financial. 18
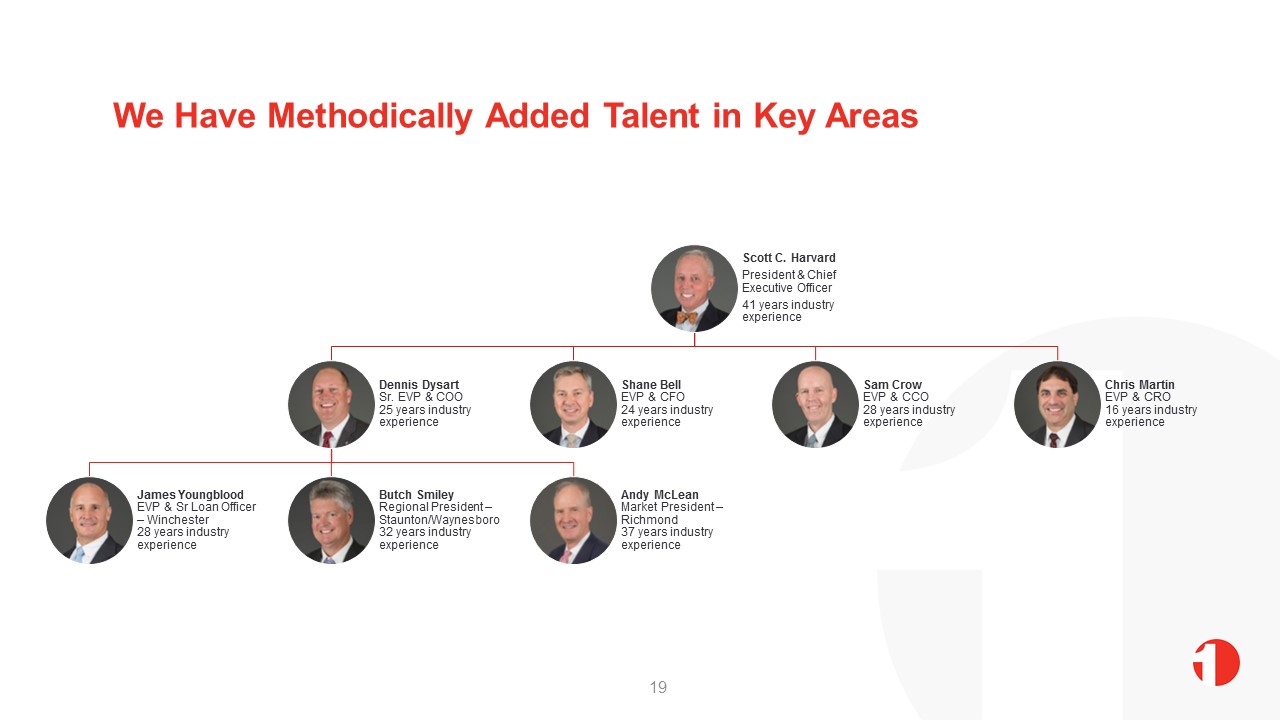
We Have Methodically Added Talent in Key Areas 19

Stock Profile Source: SNL Financial, data as of April 16, 20181 Most recent cash dividend paid on March 16, 20182 At March 31, 2018 Ticker symbol FXNC Exchange OTC Market price $18.70 Common shares outstanding 4,952,575 Market capitalization $92.6 million Insider ownership 16.9% Institutional ownership 10.1% Quarterly cash dividend 1 $0.05, dividend yield 1.07% Average volume (LTM) 2,017 EPS (LTM) $1.54 Tangible book value per share 2 $11.89 20

Appendix 21

(dollars in thousands) At or for the year ended, except per share data 12/31/2013 12/31/2014 12/31/2015 12/31/2016 12/31/2017 Balance Sheet Assets $522,890 $518,165 $692,321 $716,000 $739,110 Loans, net 346,449 371,692 433,475 480,746 516,875 Deposits 450,711 444,338 627,116 645,570 664,980 Tangible common equity 38,888 44,884 43,607 50,582 57,212 Balance Sheet Ratios Loans / Deposits 79.23% 85.16% 70.00% 75.29% 78.53% TCE / TA 7.44% 8.66% 6.32% 7.08% 7.75% Leverage ratio 1 10.68% 12.90% 8.12% 8.48% 8.46% Total capital ratio 1 16.62% 19.14% 13.86% 13.47% 13.12% Performance Net income 2 $8,961 $6,493 $1,542 $5,907 $6,448 Diluted EPS $1.83 $1.32 $0.31 $1.20 $1.30 ROAA 1.85% 1.45% 0.41% 0.84% 0.89% ROAE 21.87% 13.49% 4.58% 12.00% 11.57% Net interest margin 3.72% 3.86% 3.52% 3.61% 3.77% Efficiency ratio 74.79% 73.96% 80.92% 71.05% 66.42% Asset Quality NPAs / Assets 2.81% 1.91% 0.94% 0.25% 0.17% NCOs / Avg loans 0.53% 0.02% 0.27% 0.04% 0.02% Reserves / Loans 2.98% 1.77% 1.26% 1.09% 1.02% Financial Performance 1 First Bank capital ratios.2 Net income available to common shareholders. 22

Peer Comparison Source: SNL Financial. Peers defined as banks in Virginia with assets between $500 million and $1 billion as of 12/31/17. Capital ratios are for bank subsidiaries at 12/31/17. Return on Assets Return on Equity Efficiency Ratio Net Interest Margin Loans / Deposits Cash & Securities / Deposits NPAs / Assets Reserves / Loans Peer 0.57% FXNC 0.89% Peer 6.4% FXNC 11.6% Peer 75.1% FXNC 66.4% Peer 3.66% FXNC 3.77% Peer 88.1% FXNC 78.5% Peer 18.2% FXNC 26.9% Peer 1.30% FXNC 0.17% Peer 0.92% FXNC 1.02% Median of peer group FXNC 1 standard deviation from the mean 1-4 Family / Loans CRE & Multi / Loans C&I / Loans Non-interest bearing / Deposits Savings & MMDA / Deposits Time / Deposits Total Risk-Based Capital Leverage Ratio Peer 33.3% FXNC 32.3% Peer 39.5% FXNC 42.6% Peer 8.6% FXNC 7.4% Peer 23.1% FXNC 27.2% Peer 40.9% FXNC 46.6% Peer 28.3% FXNC 18.4% Peer 13.1% First Bank 13.1% Peer 10.3% First Bank 8.5% 23
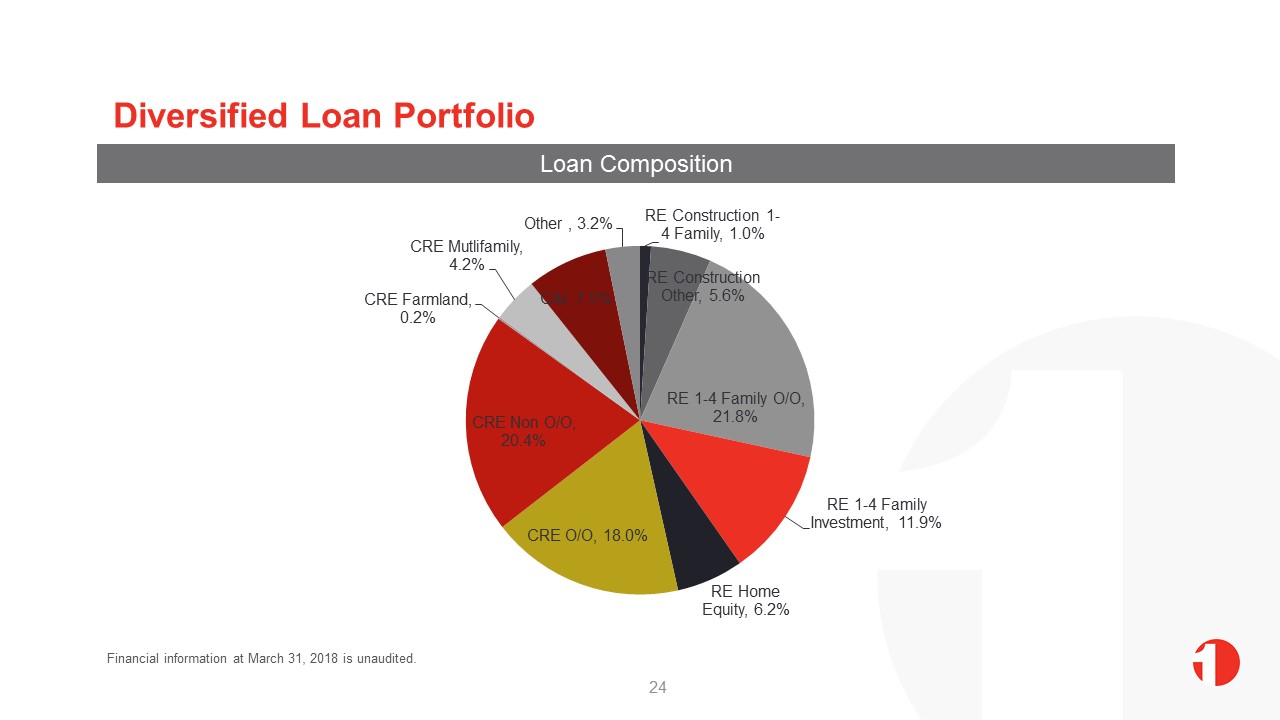
Diversified Loan Portfolio Loan Composition Financial information at March 31, 2018 is unaudited. 24

Low Cost Deposits Deposit Composition Non-maturity deposits 82% of total depositsLow cost funding of 0.35%Comprised of 61% personal, 39% business$15 thousand average balance of non-maturity deposits Financial information at March 31, 2018 is unaudited. 25

Scott Harvard, President and CEO(540) 465-6121sharvard@fbvirginia.comShane Bell, Executive VP and CFO(540) 465-6130sbell@fbvirginia.com 26