Attached files
| file | filename |
|---|---|
| 8-K - FORM 8-K - SIMMONS FIRST NATIONAL CORP | f8k_050718.htm |
Exhibit 99.1

NASDAQ-GS: SFNC Investor Presentation
Forward-Looking Statements and Non-GAAP Financial Measures 2 Certainstatementscontainedinthispresentationmaynotbebasedonhistoricalfactsandare"forward-lookingstatements"withinthemeaningofSection27Aof theSecuritiesActof1933,asamended,andSection21EoftheSecuritiesExchangeActof1934,asamended.Theseforward-lookingstatementsmaybeidentifiedby referencetoafutureperiod(s)orbytheuseofforward-lookingterminology,suchas"anticipate,""estimate,""expect,""foresee,""may,""might,""will,""would," "could"or"intend,"futureorconditionalverbtenses,andvariationsornegativesofsuchterms.Theseforward-lookingstatementsinclude,withoutlimitation,those relatingtotheCompany'sfuturegrowth,revenue,assets,assetquality,profitabilityandcustomerservice,criticalaccountingpolicies,netinterestmargin,non- interestrevenue,marketconditionsrelatedtotheCompany'scommonstockrepurchaseprogram,allowanceforloanlosses,theeffectofcertainnewaccounting standardsontheCompany'sfinancialstatements,incometaxdeductions,creditquality,thelevelofcreditlossesfromlendingcommitments,netinterestrevenue, interestratesensitivity,loanlossexperience,liquidity,capitalresources,marketrisk,earnings,effectofpendinglitigation,acquisitionstrategy,legalandregulatory limitationsandcomplianceandcompetition. Readersarecautionednottoplaceunduerelianceontheforward-lookingstatementscontainedinthispresentationinthatactualresultscoulddiffermaterially fromthoseindicatedinsuchforward-lookingstatements,duetoavarietyoffactors.Thesefactorsinclude,butarenotlimitedto,changesintheCompany's operatingorexpansionstrategy,availabilityofandcostsassociatedwithobtainingadequateandtimelysourcesofliquidity,theabilitytomaintaincreditquality, possibleadverserulings,judgments,settlementsandotheroutcomesofpendinglitigation,theabilityoftheCompanytocollectamountsdueunderloan agreements,changesinconsumerpreferences,effectivenessoftheCompany'sinterestrateriskmanagementstrategies,lawsandregulationsaffectingfinancial institutionsingeneralorrelatingtotaxes,theeffectofpendingorfuturelegislation,theabilityoftheCompanytorepurchaseitscommonstockonfavorableterms, theabilityoftheCompanytosuccessfullyimplementitsacquisitionstrategy,changesininterestratesandcapitalmarkets,inflation,customeracceptanceofthe Company'sproductsandservices,andotherriskfactors.OtherrelevantriskfactorsmaybedetailedfromtimetotimeintheCompany'spressreleasesandfilings withtheSecuritiesandExchangeCommission.Anyforward-lookingstatementspeaksonlyasofthedateofthisReport,andweundertakenoobligationtoupdate theseforward-lookingstatementstoreflecteventsorcircumstancesthatoccurafterthedateofthisReport. Annualized,proforma,projectedandestimatednumbersareusedforillustrativepurposeonly,arenotforecastsandmaynotreflectactualresults. Non-GAAPFinancialMeasures Thisdocumentcontainsfinancialinformationdeterminedbymethodsotherthaninaccordancewithgenerallyacceptedaccountingprinciples(GAAP).The Company'smanagementusesthesenon-GAAPfinancialmeasuresintheiranalysisofthecompany'sperformance.ThesemeasurestypicallyadjustGAAP performancemeasurestoincludethetaxbenefitassociatedwithrevenueitemsthataretax-exempt,aswellasadjustincomeavailabletocommonshareholdersfor certainsignificantactivitiesornonrecurringtransactions.SincethepresentationoftheseGAAPperformancemeasuresandtheirimpactdifferbetweencompanies, managementbelievespresentationsofthesenon-GAAPfinancialmeasuresprovideusefulsupplementalinformationthatisessentialtoaproperunderstandingof theoperatingresultsofthecompany'scorebusinesses.Thesenon-GAAPdisclosuresshouldnotbeviewedasasubstituteforoperatingresultsdeterminedin accordancewithGAAP,noraretheynecessarilycomparabletonon-GAAPperformancemeasuresthatmaybepresentedbyothercompanies.

(1) Based on April 25, 2018 closing price of $30.50. (2) As of March 31, 2018. Company Profile 3 SOUTHEAST DIVISION SOUTHWEST DIVISION NORTH TEXAS DIVISION Arkansas SW Missouri (Springfield) Tennessee South TexasSt. Louis Kansas CityColorado KansasOklahoma Dallas / Fort Worth Metroplex Loans $2.8 billion Deposits $1.5 billion Loans $4.4 billion Deposits $6.6 billion Loans $2.4 billion Deposits $2.4 billion BRANCHES BY STATE TennesseeOklahoma Texas Arkansas Colorado MissouriKansas 82 44 3 7 27 17 20 Total 200 TICKER: SFNC Founded Footprint (2) Total Assets (2) Market Cap (1) 1903 $2.8 billion $15.6 billion7 States

(1) Includes Southwest Bank trust assets. Non-Banking Business Units 4 ▪ $174 million nationwide credit card portfolio ▪ Loan yield (including fees) over 13.9% ▪ History of excellent credit quality (1.63% net charge-off ratio in Q1 2018) TRUST (1) ▪ Q1 2018: $5.3 billion in trust assets ($3.1 billion AUM) ▪ Q1 2018: Profit Margin: ~31.0% ▪ Growing investment management business ROYALTY TRUST ▪ FY 2017 Revenue: $1.9 million ▪ FY 2017 NIBT Margin: 26.9% INVESTMENTS ▪ Q1 2018 Retail Group: $1.4 billion AUM – $210 million in fee-based / advisory assets INSURANCE (EMPLOYEE BENEFITS & LIFE) ▪ Q1 2018 Revenue: $910 thousand ▪ Q1 2018 Profit Margin: 46.6% ▪ Q1 2018 Mortgage Originations: $132.7 million ▪ 70.1% Purchase vs. 29.9% Refinance

Note: Per share information has been adjusted to reflect the effects of the Company’s two-for-one stock split, which occurred on February 8, 2018. Note: Core excludes non-core income and expense items (e.g. merger related cost and branch rightsizing cost). Core NIM excludes interest purchase accounting interest accretion. Core results are non-GAAP measurements. See Appendix for non-GAAP reconciliations. (1) Tax adjustment to revalue deferred tax assets and liabilities to account for future impact for lower corporate tax rates resulting from the “Tax Cuts and Jobs Act,” signed into law December 22, 2017. (2) Efficiency ratio is non-interest expense before foreclosed property expense and amortization of intangibles as a percent of net interest income (fully taxable equivalent) and non-interest revenues, excluding gains and losses from securities transactions and non- core items. See Appendix for non-GAAP reconciliations. Financial Highlights 5 2017 Results (YTD) 2016 2017 Change 2016 2017 Change $ in millions, except per share data Earnings Earnings $ % Diluted EPS Diluted EPS $ % GAAP Results 96.79$ 92.94$ (3.85)$ (4.0%) 1.56$ 1.33$ (0.23)$ (14.7%) Non-Core Items 4.62 14.64 10.02 216.9% 0.08 0.21 0.13 162.5% SAB 118 Adjustment?¹? - 11.47 11.47 NA - 0.16 0.16 NA Non-GAAP Core Results 101.41$ 119.05$ 17.64$ 17.4% 1.64$ 1.70$ 0.06$ 3.7% ROA 1.25% 0.92% Core ROA 1.31% 1.18% ROTCE 13.92% 11.26% Core ROTCE 14.56% 14.28% Efficiency Ratio?²? 56.32% 55.27% NIM 4.19% 4.07% Core NIM 3.83% 3.76% Q1 2018 Results (QTD) Q1 2017 Q1 2018 Change Q1 2017 Q1 2018 Change $ in millions, except per share data Earnings Earnings $ % Diluted EPS Diluted EPS $ % GAAP Results 22.12$ 51.31$ 29.19$ 132.0% 0.35$ 0.55$ 0.20$ 57.1% Non-Core Items 0.41 1.31 0.89 217.0% 0.01 0.02 0.01 100.0% SAB 118 Adjustment?¹? - - - NA - - - NA Non-GAAP Core Results 22.53$ 52.62$ 30.09$ 133.5% 0.36$ 0.57$ 0.21$ 58.3% ROA 1.07% 1.38% Core ROA 1.09% 1.41% ROTCE 12.22% 18.77% Core ROTCE 12.44% 19.23% Efficiency Ratio?²? 60.92% 53.24% NIM 4.04% 4.17% Core NIM 3.80% 3.82%

(1) Per share information has been adjusted to reflect the effects of the Company’s two-for-one stock split, which occurred on February8,2018. Note:Core excludes non-core income and expense items (e.g. merger related cost and branch rightsizing cost). Core results are non-GAAP measurements. See Appendix for non-GAAP reconciliations. Financial Highlights –Q1 2018 6 NON-RECURRING ITEMS SELECTED HIGHLIGHTS (1) ▪ Merger-related & branch right-sizing costs: $1.8 million pre-tax ▪ Loan balances increased $208 million from Q4 2017 ▪ Deposits increased $564 million from Q4 2017 ▪ Total assets were $15.6 billion ▪ ROAA of 1.38% and Core ROAA of 1.41% ▪ ROACE of 9.90% and Core ROACE of 10.15% ▪ ROTCE of 18.77% and Core ROTCE of 19.23% ▪ NIM of 4.17% and Core NIM of 3.82% ▪ Diluted EPS of $0.55 and Core Diluted EPS of $0.57 ▪ Equity to asset ratio of 13.52% and tangible common equity to tangible asset ratio of 7.94% ▪ Book value per share was $22.86 and tangible book value per share was $12.62 2-FOR-1 STOCK SPLIT ▪ Board approved a two-for-one stock split in the form of a 100% stock dividend ▪ Record date of January 30, 2018 and payable date occurred on February 8, 2018 ▪ All per share information has been restated for the stock split
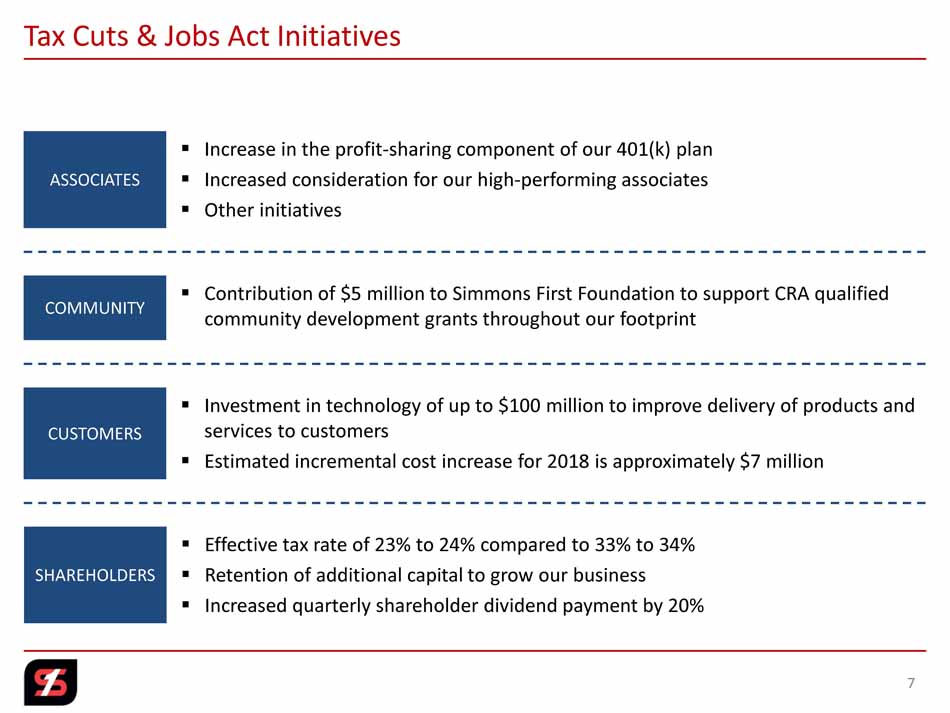
Tax Cuts & Jobs Act Initiatives 7 ASSOCIATES ▪ Increase in the profit-sharing component of our 401(k) plan ▪ Increased consideration for our high-performing associates ▪ Other initiatives ▪ Contribution of $5 million to Simmons First Foundation to support CRA qualified community development grants throughout our footprint COMMUNITY ▪ Investment in technology of up to $100 million to improve delivery of products and services to customers ▪ Estimated incremental cost increase for 2018 is approximately $7 million CUSTOMERS ▪ Effective tax rate of 23% to 24% compared to 33% to 34% ▪ Retention of additional capital to grow our business ▪ Increased quarterly shareholder dividend payment by 20% SHAREHOLDERS

$- $2.0 $4.0 $6.0 $8.0 $10.0 $12.0 $14.0 2014 2015 2016 2017 FY18 Q1 Loans Deposits $4.6 $7.6 $8.4 $15.1 $15.6 $- $2.0 $4.0 $6.0 $8.0 $10.0 $12.0 $14.0 $16.0 $18.0 2014 2015 2016 2017 FY18 Q1 (1) Efficiency ratio is non-interest expense before foreclosed property expense and amortization of intangibles as a percent of net interest income (fully taxable equivalent) and non-interest revenues, excluding gains and losses from securities transactions and non-core items. See Appendix for non-GAAP reconciliations. Note:Core excludes non-core income and expense items (e.g. merger related cost and branch rightsizing cost). Core results are non-GAAP measurements. See Appendix for non- GAAP reconciliations. Performance Trends 8 TOTAL ASSETS ($ IN BILLIONS) EFFICIENCY RATIO (1) NON-INTEREST INCOME / REVENUE TOTAL LOANS & DEPOSITS ($ IN BILLIONS) Deposits 11.7$ 26.66% 25.36% 33.30% 28.11% 21.76% 23.79% 26.49% 33.16% 27.52% 21.76% 10.0% 15.0% 20.0% 25.0% 30.0% 35.0% 2014 2015 2016 2017 FY18 Q1 GAAP Core 67.2% 59.0% 56.3% 55.3% 53.2% 20.0% 30.0% 40.0% 50.0% 60.0% 70.0% 2014 2015 2016 2017 FY18 Q1 Loans 10.9$

12.8% 14.2% 13.5% 9.8% 9.6% 4.0% 6.0% 8.0% 10.0% 12.0% 14.0% 16.0% 2014 2015 2016 2017 FY18 Q1 14.5% 16.7% 15.1% 11.4% 13.8% 9.0% 10.0% 11.0% 12.0% 13.0% 14.0% 15.0% 16.0% 17.0% 18.0% 2014 2015 2016 2017 FY18 Q1 13.4% 16.0% 14.5% 9.8% 9.6% 3.0% 6.0% 9.0% 12.0% 15.0% 18.0% 2014 2015 2016 2017 FY18 Q1 8.8% 11.2% 11.0% 9.2% 8.6% 4.0% 5.0% 6.0% 7.0% 8.0% 9.0% 10.0% 11.0% 12.0% 2014 2015 2016 2017 FY18 Q1 Performance Trends 9 TIER 1 LEVERAGE RATIO TOTAL RISK-BASED CAPITAL RATIO TIER 1 RISK-BASED CAPITAL RATIO CET1 CAPITAL RATIO Well Cap. 5.0% Well Cap. 6.5% Well Cap. 8.0% Well Cap. 10.0%
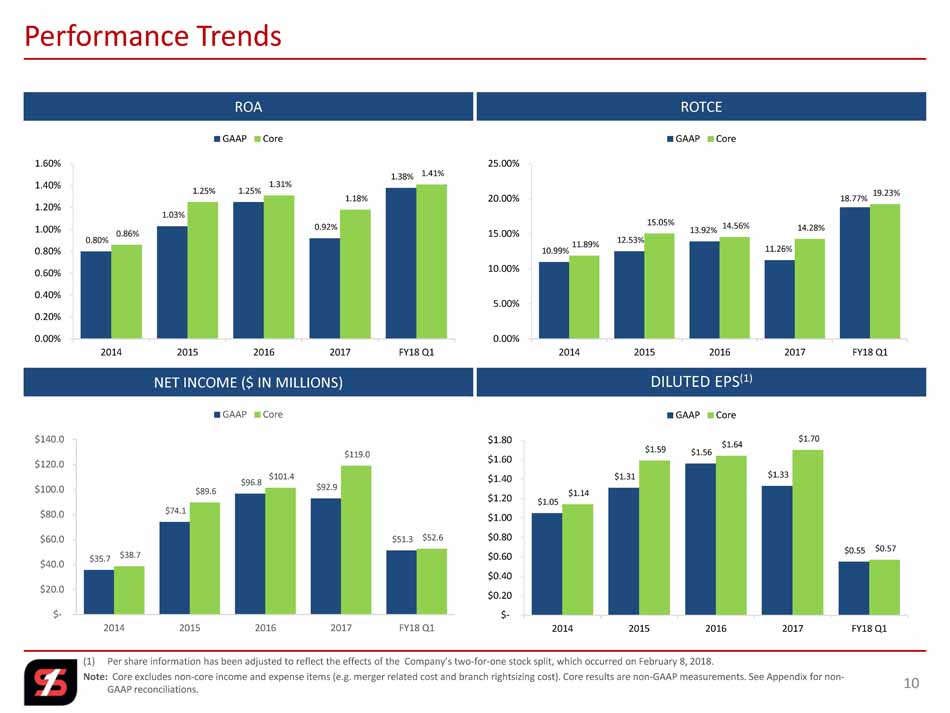
0.80% 1.03% 1.25% 0.92% 1.38% 0.86% 1.25% 1.31% 1.18% 1.41% 0.00% 0.20% 0.40% 0.60% 0.80% 1.00% 1.20% 1.40% 1.60% 2014 2015 2016 2017 FY18 Q1 GAAP Core (1) Per share information has been adjusted to reflect the effects of the Company’s two-for-one stock split, which occurred on February 8, 2018. Note:Core excludes non-core income and expense items (e.g. merger related cost and branch rightsizing cost). Core results are non-GAAP measurements. See Appendix for non- GAAP reconciliations. Performance Trends 10 ROA DILUTED EPS (1) NET INCOME ($ IN MILLIONS) ROTCE 10.99% 12.53% 13.92% 11.26% 18.77% 11.89% 15.05% 14.56% 14.28% 19.23% 0.00% 5.00% 10.00% 15.00% 20.00% 25.00% 2014 2015 2016 2017 FY18 Q1 GAAP Core $1.05 $1.31 $1.56 $1.33 $0.55 $1.14 $1.59 $1.64 $1.70 $0.57 $- $0.20 $0.40 $0.60 $0.80 $1.00 $1.20 $1.40 $1.60 $1.80 2014 2015 2016 2017 FY18 Q1 GAAP Core $35.7 $74.1 $96.8 $92.9 $51.3 $38.7 $89.6 $101.4 $119.0 $52.6 $- $20.0 $40.0 $60.0 $80.0 $100.0 $120.0 $140.0 2014 2015 2016 2017 FY18 Q1 GAAP Core

(1) As of March 31, 2018. (2) Includes credit card, indirect, and equipment finance (nationwide). Loan Portfolio (1) 11 TOTAL LOAN PORTFOLIO $10.9 billion Agriculture 1.2% Credit Card 1.6% Consumer 3.0% Construction 12.5% Single Family Residential 17.7% Commercial Real Estate 45.8% Commercial 17.0% Other 1.3% Total % of $ in billions Loans Total Southeast Division 4.4$ 40.4% Southwest Division 2.4 21.8% North Texas Division 2.8 25.8% Other?²? 1.3 12.1% % of Re-Pricing Total Variable, Adj. or Fixed < 1 Yr. Maturity 52% Fixed Rate 48% % of CRE-Loans Total Owner Occupied 26% Non-Owner Occupied 74% % of Loan Concentration Total Capital C&D 81% CRE 272% % of Loan Concentration (Including Loan Discounts) Total Capital C&D 81% CRE 264%
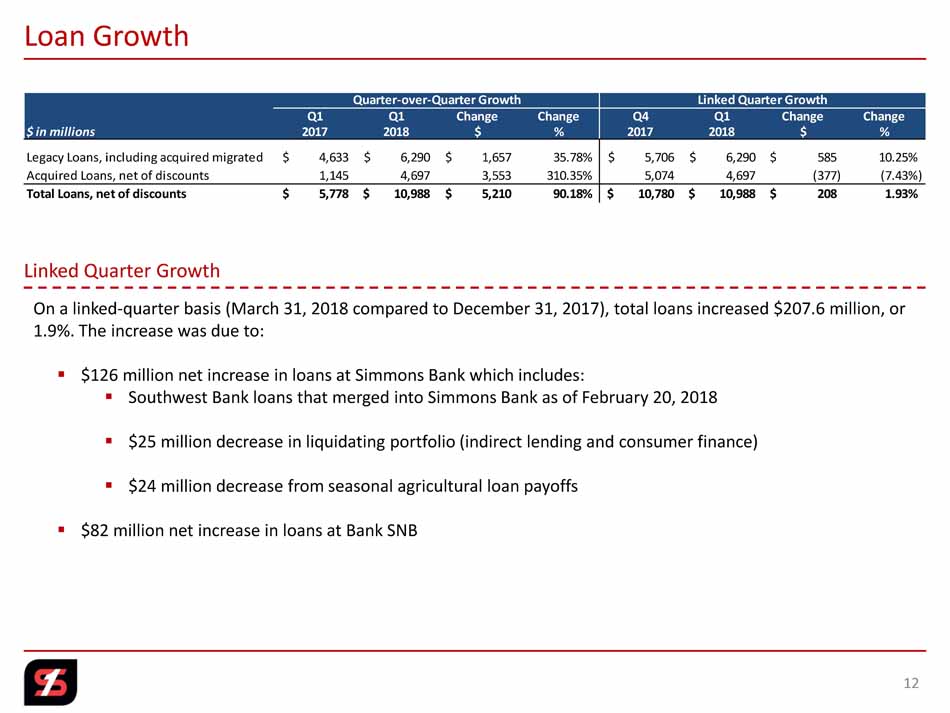
Loan Growth 12 Linked Quarter Growth On a linked-quarter basis (March 31, 2018 compared to December 31, 2017), total loans increased $207.6 million, or 1.9%. The increase was due to: ▪ $126 million net increase in loans at Simmons Bank which includes: ▪ Southwest Bank loans that merged into Simmons Bank as of February 20, 2018 ▪ $25 million decrease in liquidating portfolio (indirect lending and consumer finance) ▪ $24 million decrease from seasonal agricultural loan payoffs ▪ $82 million net increase in loans at Bank SNB Quarter-over-Quarter Growth Linked Quarter Growth Q1 Q1 Change Change Q4 Q1 Change Change $ in millions 2017 2018 $ % 2017 2018 $ % Legacy Loans, including acquired migrated 4,633$ 6,290$ 1,657$ 35.78% 5,706$ 6,290$ 585$ 10.25% Acquired Loans, net of discounts 1,145 4,697 3,553 310.35% 5,074 4,697 (377) (7.43%) Total Loans, net of discounts 5,778$ 10,988$ 5,210$ 90.18% 10,780$ 10,988$ 208$ 1.93%

2018 Non-Performing Loans 2008 2009 2010 2011 2012 2013 2014 2015 2016 2017 Q1 SFNC 0.81% 1.35% 1.98% 1.74% 1.42% 1.07% 0.74% 0.68% 1.16% 0.93% 0.86% All US Banks?¹? 2.38% 4.77% 4.68% 4.13% 3.56% 2.89% 2.28% 1.82% 1.64% 0.97% NA 2018 Non-Performing Assets 2008 2009 2010 2011 2012 2013 2014 2015 2016 2017 Q1 SFNC 0.64% 1.12% 1.71% 1.52% 1.61% 1.91% 1.30% 0.89% 0.93% 0.57% 0.54% All US Banks?¹? 1.34% 2.38% 2.37% 2.04% 1.73% 1.40% 1.10% 0.92% 0.83% 0.71% NA 2018 Net Charge-Offs 2008 2009 2010 2011 2012 2013 2014 2015 2016 2017 Q1 SFNC 0.43% 0.59% 0.71% 0.49% 0.40% 0.27% 0.30% 0.24% 0.40% 0.35% 0.24% SFNC?²? 0.30% 0.38% 0.52% 0.30% 0.26% 0.15% 0.20% 0.16% 0.35% 0.31% 0.20% All US Banks?¹? 1.70% 2.91% 2.95% 1.81% 1.26% 0.77% 0.54% 0.47% 0.48% 0.47% NA (1) Source: SNL Financial, all US Banks as of December 31, 20XX. March 31, 2018 unavailable. (2) Excluding credit card net charge-offs. Credit Quality: Legacy Loan Portfolio (Excluding Acquired Loans) 13 "Great Recession"
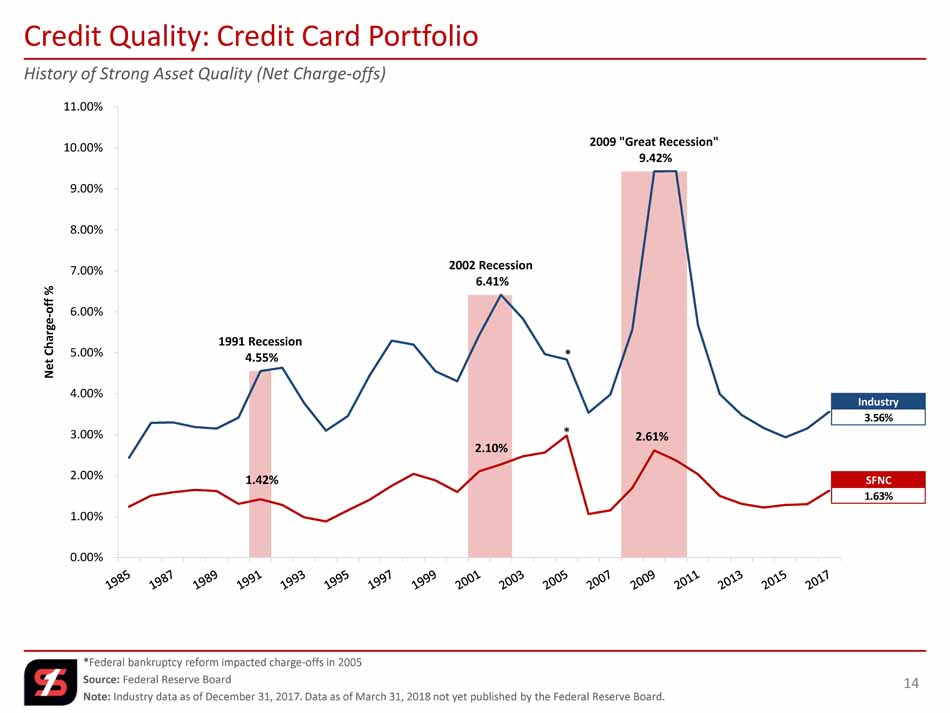
History of Strong Asset Quality (Net Charge-offs) *Federal bankruptcy reform impacted charge-offs in 2005 Source:Federal Reserve Board Note:Industry data as of December 31, 2017. Data as of March 31, 2018 not yet published by the Federal Reserve Board. Credit Quality: Credit Card Portfolio 14 SFNC 1.63% Industry 3.56% 1991 Recession 4.55% 2002 Recession 6.41% 2009 "Great Recession" 9.42% 1.42% 2.10% * 2.61% * 0.00% 1.00% 2.00% 3.00% 4.00% 5.00% 6.00% 7.00% 8.00% 9.00% 10.00% 11.00% N e t C h a r g e - o f f %
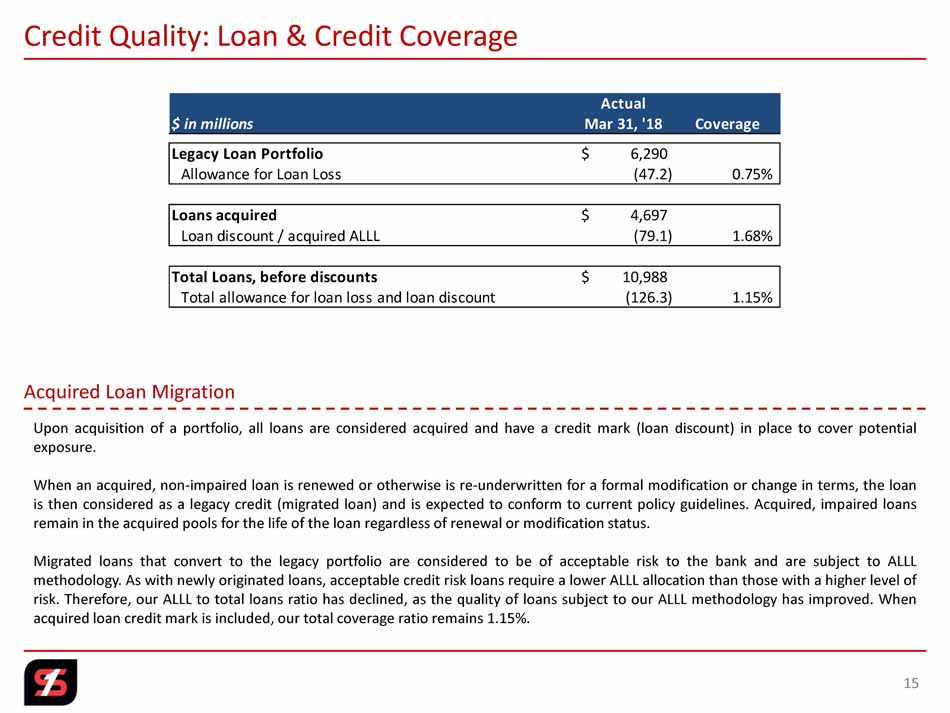
Credit Quality: Loan & Credit Coverage 15 Uponacquisitionofaportfolio,allloansareconsideredacquiredandhaveacreditmark(loandiscount)inplacetocoverpotential exposure. Whenanacquired,non-impairedloanisrenewedorotherwiseisre-underwrittenforaformalmodificationorchangeinterms,theloan isthenconsideredasalegacycredit(migratedloan)andisexpectedtoconformtocurrentpolicyguidelines.Acquired,impairedloans remainintheacquiredpoolsforthelifeoftheloanregardlessofrenewalormodificationstatus. MigratedloansthatconverttothelegacyportfolioareconsideredtobeofacceptablerisktothebankandaresubjecttoALLL methodology.Aswithnewlyoriginatedloans,acceptablecreditriskloansrequirealowerALLLallocationthanthosewithahigherlevelof risk.Therefore,ourALLLtototalloansratiohasdeclined,asthequalityofloanssubjecttoourALLLmethodologyhasimproved.When acquiredloancreditmarkisincluded,ourtotalcoverageratioremains1.15%. Acquired Loan Migration Actual $ in millions Mar 31, '18 Coverage Legacy Loan Portfolio 6,290$ Allowance for Loan Loss (47.2) 0.75% Loans acquired 4,697$ Loan discount / acquired ALLL (79.1) 1.68% Total Loans, before discounts 10,988$ Total allowance for loan loss and loan discount (126.3) 1.15%
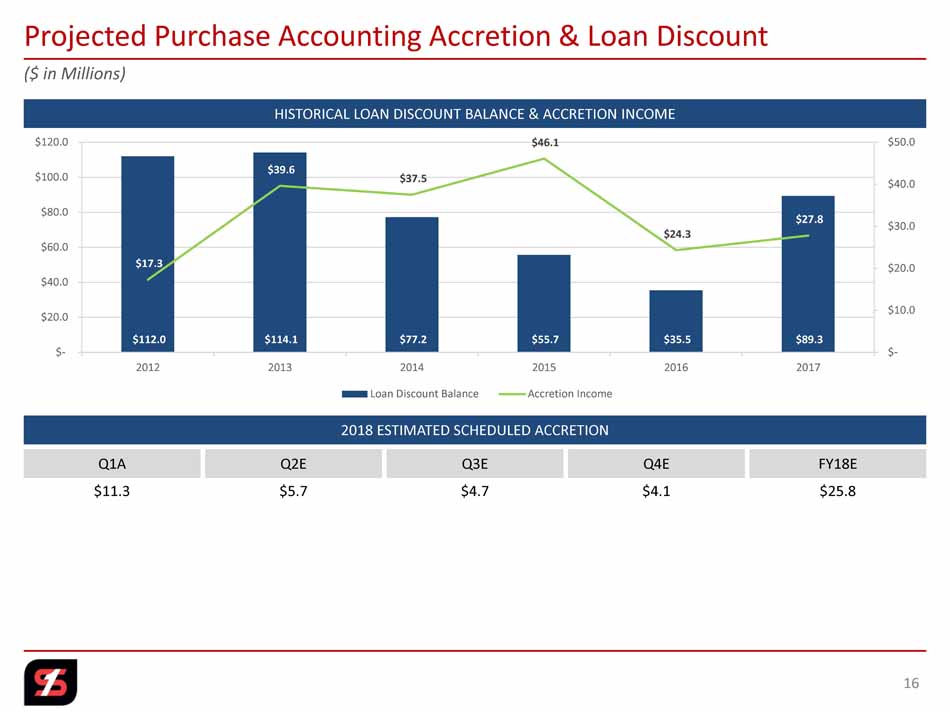
($ in Millions) Projected Purchase Accounting Accretion & Loan Discount 16 HISTORICAL LOAN DISCOUNT BALANCE & ACCRETION INCOME 2018 ESTIMATED SCHEDULED ACCRETION $112.0 $114.1 $77.2 $55.7 $35.5 $89.3 $17.3 $39.6 $37.5 $46.1 $24.3 $27.8 $- $10.0 $20.0 $30.0 $40.0 $50.0 $- $20.0 $40.0 $60.0 $80.0 $100.0 $120.0 2012 2013 2014 2015 2016 2017 Loan Discount Balance Accretion Income $11.3 $5.7 $4.7 $4.1 Q1A Q2E Q4EQ3E FY18E $25.8

(1) Deal ratios as of closed date. Source: SNL Financial. (2) Metropolitan was acquired from Section 363 Bankruptcy. (3) Estimated system conversion dates. Acquisitions Since 2013 17 2013 –2014 Consolidated eight charters to one National to State Charter Conversion (Fed Member Bank) 2015 2016 2017 $ in millions System Total Trust Purchase Price / Estimated Bank Announced Closed Conversion Assets AUM Price?¹? Earnings?¹?Book Value?¹? TBV?¹? Cost Savings Metropolitan National Bank?²? Sep-13 Nov-13 Mar-14 920$ 370$ 54$ 12.5 x 88% 89% 40% Delta Trust & Bank Mar-14 Aug-14 Oct-14 420 815 67 14.9 x 153% 157% 35% First State Bank May-14 Feb-15 Sep-15 1,915 - 272 12.2 x 167% 170% 20% Liberty Bank May-14 Feb-15 Apr-15 1,065 - 213 12.1 x 191% 198% 25% Trust Company of the Ozarks Apr-15 Oct-15 Jan-16 15 1,000 24 NA NA NA 15% Citizens National Bank May-16 Sep-16 Oct-16 585 200 82 18.0 x 130% 130% 25% Hardeman County Investments Nov-16 May-17 Sep-17 462 - 71 17.4 x 138% 179% 30% Southwest Bancorp, Inc (OKSB)?³? Dec-16 Oct-17 May-18 2,468 - 532 24.7 x 180% 190% 35% First Texas BHC, Inc. Jan-17 Oct-17 Feb-18 2,019 430 461 23.2 x 192% 228% 32%

Complementary Lines of Business & Future Expansion 18 MORTGAGE BANKING WEALTH MANAGEMENT & TRUST TREASURY SERVICES SBA LENDING TEAM INSURANCE CREDIT CARDS EQUIPMENT FINANCE MORTGAGE WAREHOUSE HEALTHCARE ENERGY LENDING

$10 Billion Threshold & Dodd-Frank Impact 19 DFAST (DODD-FRANK STRESS TEST ACT) As part of the Dodd-Frank financial reform legislation in 2010, financial institutions with total consolidated assets of more than $10 billion are required to conduct an annual stress test. SFNC is well underway in the preparation for the DFAST requirements. A gap analysis has been prepared, theAudit and Compliance Groups have been strengthened, and the Company is preparing to invest in IT system requirements. SFNC's expected reporting timeline is: AUDIT & COMPLIANCE REGULATORY COST To strengthen the Audit and Regulatory Compliance groups, as well as to prepare for the increased regulatory requirements associated with exceeding $10 billion in assets, the Company has incurred the following costs: DURBIN AMENDMENT TheDurbinamendment,passedaspartoftheDodd-FrankAct,requiredtheFederalReservetolimitfeeschargedtoretailersfordebitcardprocessing.Forfinancial institutionswithtotalassetsof$10billionormoreasofDecember31 st ofagivenyear,thedebitcardfeesarereducedbeginningonJuly1 st ofthefollowingyear. DuetotheacquisitionsofSouthwestBancorp,Inc.andFirstTexasBHC,Inc.,SFNCexceededthe$10billionthresholdasofDecember31,2017. Theeffectivedate fortheimpactoftheDurbinAmendmentisJuly1,2018.SFNC'sestimatedreductionindebitcardfeesperyearis: • "As of" date for first stress test - December 31, 2018 • First stresstest reporting date - July 31, 2019 • First public disclosure - October 15-31, 2019 • 2015 - $4 million • 2016 - $7 million • 2017 - $10 million • 2018E - $10 million • 2017 - $0 • 2018 - $7 million pre-tax • 2019 - $14 million pre-tax

Subordinated Debt Offering & Kroll Rating 20 SENIOR UNSECURED DEBT SHORT-TERM DEBTSUBORDINATED DEBT SENIOR UNSECURED DEBT SHORT-TERM DEBTSUBORDINATED DEBT SHORT-TERM DEPOSITDEPOSIT BBB+ BBB K2 SIMMONS FIRST NATIONAL CORPORATION SIMMONS BANK A- A- BBB+ K2 K2 SUBORDINATED DEBT OFFERING ▪ On March 21, 2018, announced pricing of $330 million aggregate principal amount of 5.00% Fixed-to-Floating Rate Subordinated Notes due 2028 ▪ $222.3 million of net proceeds from sale of the Notes to repay outstanding indebtedness and the remainder for general corporate purposes

$0.14 $0.16 $0.18 $0.20 $0.22 $0.24 $0.27 $0.29 $0.31 $0.34 $0.37 $0.38 $0.38 $0.38 $0.38 $0.40 $0.42 $0.44 $0.46 $0.48 $0.50 $0.60 $- $0.20 $0.40 $0.60 Note: Per share information has been adjusted to reflect the effects of the Company’s two-for-one stock split, which occurred onFebruary 8, 2018. Note: See Appendix for non-GAAP reconciliations. (1) Based on April 25, 2018 closing stock price of $30.50. (2) FY18 Q1 EPS of $0.55. (3) FY18 Q1 Core EPS of $0.57, excludes non-core income and expense items and is a non-GAAP measurement. 108 Years of Consistent Dividend History 21 P R O J E C T E D 2018 Current Dividend Yield?¹? 2.0% 2018 Dividend Payout Ratio GAAP Earnings?²? 27.3% Core Earnings?³? 26.3%

Dividend + Stock Appreciation (04/25/17 –04/25/18) Note: Stock Price $30.50 as of April 25, 2018. Per share information has been adjusted to reflect the effects of the Company’s two-for-one stock split, which occurred on February 8, 2018. Source: SNL Financial 1 Year Total Shareholder Return 22 (20.0%) (15.0%) (10.0%) (5.0%) 0.0% 5.0% 10.0% 15.0% 20.0% SNL Mid Cap Bank 8.6% SFNC 14.9%

(20.0%) (10.0%) 0.0% 10.0% 20.0% 30.0% 40.0% 50.0% 60.0% Dividend + Stock Appreciation (04/25/15 –04/25/18) Note: Stock Price $30.50 as of April 25, 2018. Per share information has been adjusted to reflect the effects of the Company’s two-for-one stock split, which occurred on February 8, 2018. Source: SNL Financial 3 Year Total Shareholder Return 23 SFNC 47.8% SNL Mid Cap Bank 55.3%
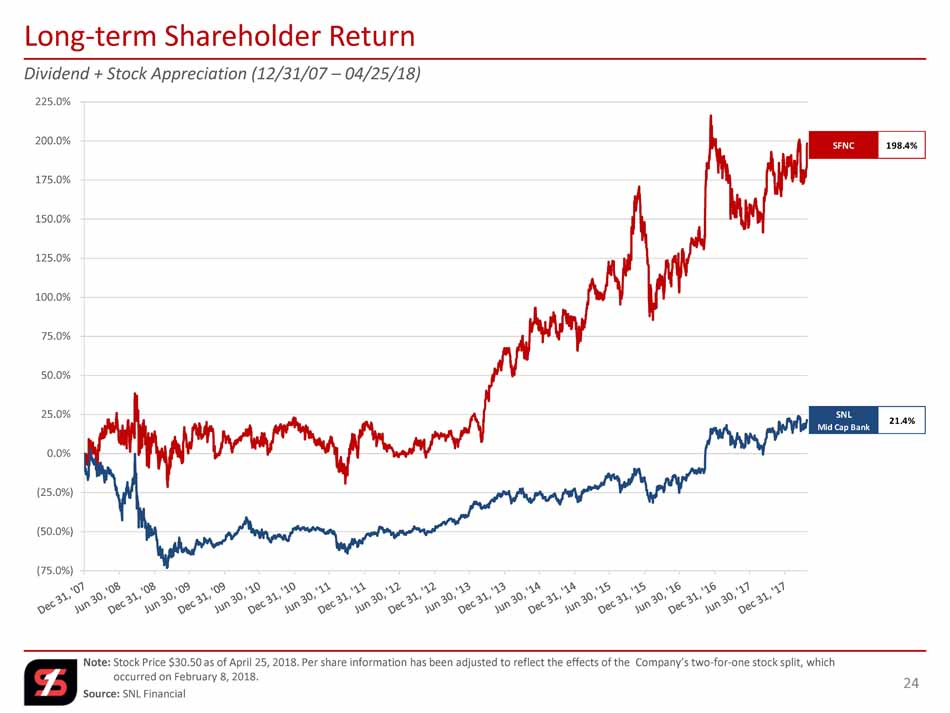
(75.0%) (50.0%) (25.0%) 0.0% 25.0% 50.0% 75.0% 100.0% 125.0% 150.0% 175.0% 200.0% 225.0% Dividend + Stock Appreciation (12/31/07 –04/25/18) Note: Stock Price $30.50 as of April 25, 2018. Per share information has been adjusted to reflect the effects of the Company’s two-for-one stock split, which occurred on February 8, 2018. Source: SNL Financial Long-term Shareholder Return 24 SFNC 198.4% SNL Mid Cap Bank 21.4%

Note: Per share information has been adjusted to reflect the effects of the Company’s two-for-one stock split, which occurred on February 8, 2018. (1) LTM Core EPS excludes non-core income and expense items and is a non-GAAP measurement. See Appendix for non-GAAP reconciliations. (2) Based upon the Company’s average five analyst consensus EPS of $2.35 for 2018 and $2.54 for 2019, as of April 25, 2018. EPS estimates adjusted for stock split. (3) Tangible Book Value is a non-GAAP measurement. See Appendix for non-GAAP reconciliations. Source:SNL Financial Investment Profile 25 Market Data as of 04/25/18 SFNC Stock Price 30.50$ 52-Week High 30.90$ 52-Week Low 24.88$ Common Shares Outstanding (millions) 92.2 Market Capitalization (millions) 2,813.4$ % Institutional Ownership 61% Valuation & Per Share Data Price / LTM EPS 19.4 x Price / LTM Core EPS?¹? 16.1 x Price / 2018 Consensus EPS?²? 13.0 x Price / 2019 Consensus EPS?²? 12.0 x Price / Book Value 1.3 x Price / Tangible Book Value?³? 2.4 x
Strategic Focus 26 ▪"Table Stakes" –Asset Quality –Regulatory Compliance ▪Internal revenue opportunities ▪Efficiency initiatives ▪Branding in new markets and product enhancements ▪Acquisitions – Traditional banking –enhance current footprint and consider expanding into adjoining states (inside-out strategy) – Non-banking –trust, investments, insurance and credit card

Why Simmons First? 27 ▪Multiple paths to potential above-average earnings growth –M&A accretion, cost savings and revenue enhancements –Continued efficiency initiatives –Organic legacy loan growth ▪Experienced and deep management ▪Exceptional balance sheet ▪Consistent historical earnings performance ▪Attractive dividend yield and total shareholder return Committed to delivering a sophisticated and diverse range of products with the service level of a community bank

Appendix 28

Non-GAAP Reconciliations 29 Q1 Q1 $ in thousands 2015 2016 2017 2017 2018 Calculation of Core Return on Average Assets Net income available to common stockholders 74,107$ 96,790$ 92,940$ 22,120$ 51,312$ Net non-core items, net of taxes, adjustment 15,515 4,619 26,109 412 1,306 Core earnings 89,622$ 101,409$ 119,049$ 22,532$ 52,618$ Average total assets 7,164,788$ 7,760,233$ 10,074,951$ 8,414,470$ 15,088,210$ Return on average assets 1.03% 1.25% 0.92% 1.07% 1.38% Core return on average assets 1.25% 1.31% 1.18% 1.09% 1.41% Calculation of Return on Tangible Common Equity Net income available to common stockholders 74,107$ 96,790$ 92,940$ 22,120$ 51,312$ Amortization of intangibles, net of taxes 2,972 3,611 4,659 942 2,096 Total income available to common stockholders 77,079$ 100,401$ 97,599$ 23,062$ 53,408$ Net non-core items, net of taxes 15,515 4,619 26,109 412 1,306 Core earnings 89,622 101,409 119,049 22,532 52,618 Amortization of intangibles, net of taxes 2,972 3,611 4,659 942 2,096 Total core income available to common stockholders 92,594$ 105,020$ 123,708$ 23,474$ 54,714$ Average common stockholders' equity 938,521$ 1,105,775$ 1,390,815$ 1,166,473$ 2,103,052$ Average intangible assets: Goodwill (281,133) (332,974) (455,453) (348,837) (844,148) Other intangibles (42,104) (51,710) (68,896) (52,169) (104,718) Total average intangibles (323,237) (384,684) (524,349) (401,006) (948,866) Average tangible common stockholders' equity 615,284$ 721,091$ 866,466$ 765,467$ 1,154,186$ Return on average common equity 7.90% 8.75% 6.68% 7.69% 9.90% Return on tangible common equity (non-GAAP) 12.53% 13.92% 11.26% 12.22% 18.77% Core return on average common equity (non-GAAP) 9.55% 9.17% 8.56% 7.83% 10.15% Core return on tangible common equity (non-GAAP) 15.05% 14.56% 14.28% 12.44% 19.23%

(1) Effective tax rate of 26.135% for 2018 and 39.225% for prior periods, adjusted for non-deductible merger-related and branch right sizing costs and deferred tax items. (2) Tax adjustment to revalue deferred tax assets and liabilities to account for the future impact of lower corporate tax. Non-GAAP Reconciliations 30 Q1 Q1 $ in thousands 2013 2014 2015 2016 2017 2017 2018 Calculation of Core Earnings Net Income 23,231$ 35,688$ 74,107$ 96,790$ 92,940$ 22,120$ 51,312$ Non-core items Early termination agreements (temp) - - 2,209 - - - - Gain on sale of Merchant services - (1,000) - - - - - Gain on sale of banking operations - - (2,110) - - - - Gain from early retirement of TRUPS - - - (594) - - - Gain on sale of P&C insurance business - - - - (3,708) - - Loss on FDIC LS termination/Gain on FDIC-assisted transactions - - 7,476 - - - - Donation to Simmons Foundation - - - - 5,000 - - Merger related costs 6,376 7,470 13,760 4,835 21,923 524 1,711 Change-in-control payments - 885 - - - - - (Gain) loss on sale of securities 193 - - - - - - Branch right sizing 641 (3,059) 3,144 3,359 169 154 57 Charter consolidation costs - 652 - - - - - Tax Effect?¹? (2,829) (1,929) (8,964) (2,981) (8,746) (266) (462) Net non-core items (before SAB 118 adjustment) 4,381 3,019 15,515 4,619 14,638 412 1,306 SAB 118 adjustment?²? - - - - 11,471 - - Core earnings (non-GAAP) 27,612$ 38,707$ 89,622$ 101,409$ 119,049$ 22,532$ 52,618$

Note: Per share information has been adjusted to reflect the effects of the Company’s two-for-one stock split, which occurred on February 8, 2018. (1) Effective tax rate of 26.135% for 2018 and 39.225% for prior periods, adjusted for non-deductible merger-related and branch right sizing costs and deferred tax items. (2) Tax adjustment to revalue deferred tax assets and liabilities to account for the future impact of lower corporate tax. Non-GAAP Reconciliations 31 Q1 Q1 $ per Share 2013 2014 2015 2016 2017 2017 2018 Calculation of Diluted Earnings per Share (EPS) Diluted earnings per share 0.71$ 1.05$ 1.31$ 1.56$ 1.33$ 0.35$ 0.55$ Non-core items Early termination agreements (temp) - - 0.04 - - - - Gain on sale of Merchant services - (0.03) - - - - - Gain on sale of banking operations - - (0.04) - - - - Gain from early retirement of TRUPS - - - (0.01) - - - Gain on sale of P&C insurance business - - - - (0.04) - - Loss on FDIC LS termination/Gain on FDIC-assisted transactions - - 0.14 - - - - Donation to Simmons Foundation - - - - 0.07 - - Merger related costs 0.19 0.22 0.25 0.08 0.31 0.01 0.02 Change-in-control payments - 0.03 - - - - - (Gain) loss on sale of securities 0.01 - - - - - - Branch right sizing 0.02 (0.08) 0.06 0.06 - - - Charter consolidation costs - 0.02 - - - - - Tax effect?¹? (0.09) (0.07) (0.17) (0.05) (0.13) - - Net non-core items (before SAB 118 adjustment) 0.13 0.09 0.28 0.08 0.21 0.01 0.02 SAB 118 adjustment?²? - - - - 0.16 - - Diluted core earnings per share (non-GAAP) 0.84$ 1.14$ 1.59$ 1.64$ 1.70$ 0.36$ 0.57$ Stock Price as of 04/25/2018 30.50$ Price / 2017 EPS 22.9 x Price / 2017 Core EPS 17.9 x

(1) Efficiency ratio is noninterest expense before foreclosed property expense and amortization of intangibles as a percent of net interest income (fully taxable equivalent) and noninterest revenues, excluding gains and losses from securities transactions and non-core items. Non-GAAP Reconciliations 32 Q1 Q1 $ in thousands 2015 2016 2017 2017 2018 Calculation of Efficiency Ratio Non-interest expense 256,970$ 255,085$ 312,379$ 66,322$ 98,073$ Non-core non-interest expense adjustment (18,747) (8,435) (27,357) (635) (1,772) Other real estate and foreclosure expense adjustment (4,861) (4,389) (3,042) (550) (1,020) Amortization of intangibles adjustment (4,889) (5,942) (7,666) (1,550) (2,837) Efficiency ratio numerator 228,473$ 236,319$ 274,314$ 63,587$ 92,444$ Net-interest income 278,595$ 279,206$ 354,930$ 72,380$ 134,966$ Non-interest income 94,661 139,382 138,765 30,060 37,535 Non-core non-interest income adjustment 5,731 (835) (3,972) 43 (4) Fully tax-equivalent adjustment 8,517 7,722 7,723 1,965 1,130 (Gain) loss on sale of securities (307) (5,848) (1,059) (63) (6) Efficiency ratio denominator 387,197$ 419,627$ 496,387$ 104,385$ 173,621$ Efficiency ratio?¹? 59.01% 56.32% 55.27% 60.92% 53.24%

Note: Per share information has been adjusted to reflect the effects of the Company’s two-for-one stock split, which occurred on February 8, 2018. Non-GAAP Reconciliations 33 Q1 Q1 $ in thousands, except per share and share count 2015 2016 2017 2017 2018 Calculation of Core Net Interest Margin Net interest income 278,595$ 279,206$ 354,930$ 72,380$ 134,966$ Fully tax-equivalent adjustment 8,517 7,722 7,723 1,965 1,130 Fully tax-equivalent net interest income 287,112 286,928 362,653 74,345 136,096 Total accretable yield (46,131) (24,257) (27,793) (4,427) (11,294) Core net interest income 240,981$ 262,671$ 334,860$ 69,918$ 124,802$ Average earning assets 6,305,966$ 6,855,322$ 8,908,418$ 7,469,709$ 13,251,549$ Net interest margin 4.55% 4.19% 4.07% 4.04% 4.17% Core net interest margin (non-GAAP) 3.82% 3.83% 3.76% 3.80% 3.82% March, 31 2018 Calculation of Tangible Book Value per Share Total common stockholders' equity 2,109,051$ Total intangibles (945,191) Tangible common stockholders' equity 1,163,860$ Shares of common stock outstanding 92,242,389 Book value per common share 22.86$ Tangible book value per common share (non-GAAP) 12.62$ Stock Price as of 04/25/2018 30.50$ Price / Book Value per Share 1.3 x Price / Tangible Book Value per Share 2.4 x

34