Attached files
| file | filename |
|---|---|
| 8-K - 8-K - C&J Energy Services, Inc. | cj8-kinvestorpresentation2.htm |
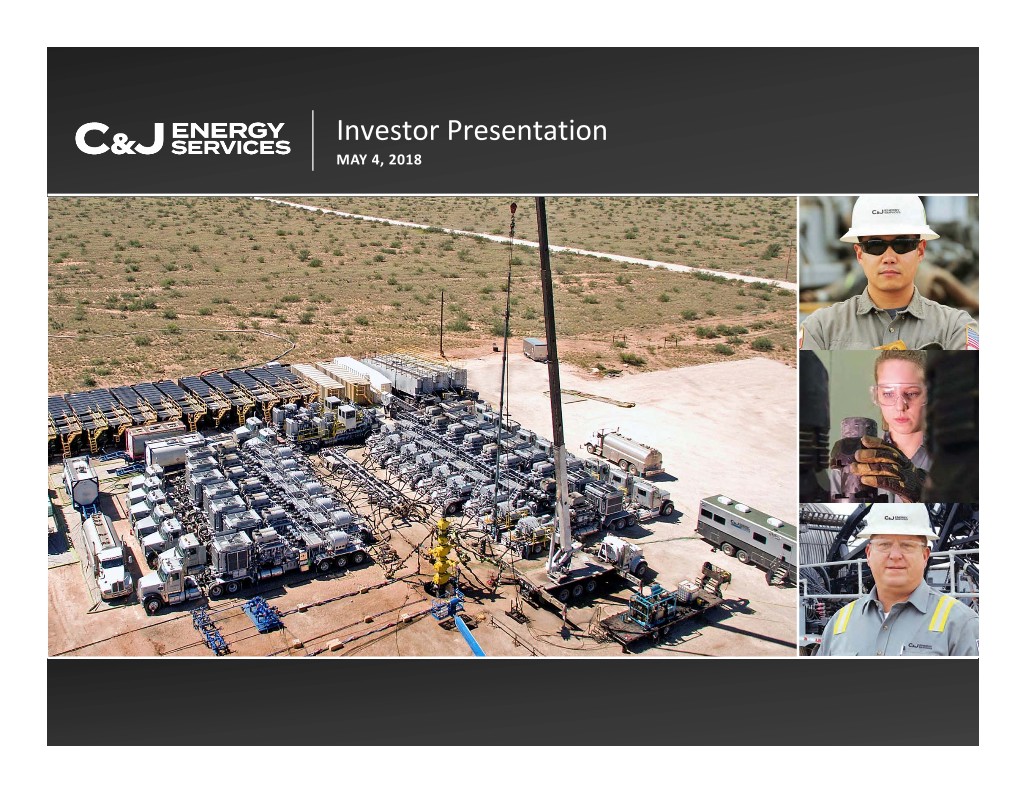
Investor Presentation MAY 4, 2018 1
Important Disclaimer This presentation contains certain statements and information that may constitute “forward-looking statements” within the meaning of Section 27A of the Securities Act of 1933, as amended, and Section 21E of the Securities Exchange Act of 1934, as amended. All statements, other than statements of historical fact, that address activities, events or developments that we expect, believe or anticipate will or may occur in the future are forward-looking statements. The words “anticipate,” “believe,” “ensure,” “expect,” “if,” “once” “intend,” “plan,” “estimate,” “project,” “forecasts,” “predict,” “outlook,” “will,” “could,” “should,” “potential,” “would,” “may,” “probable,” “likely,” and similar expressions that convey the uncertainty of future events or outcomes, and the negative thereof, are intended to identify forward-looking statements. Forward-looking statements contained in this presentation, which are not generally historical in nature, include those that express a belief, expectation or intention regarding our future activities, plans and goals and our current expectations with respect to, among other things: our ability to successfully integrate the O-Tex cementing business with our own; our operating cash flows, the availability of capital and our liquidity; our future revenue, income and operating performance; our ability to sustain and improve our utilization, revenue and margins; our ability to maintain acceptable pricing for our services; future capital expenditures; our ability to finance equipment, working capital and capital expenditures; our ability to execute our long-term growth strategy; our ability to successfully develop our research and technology capabilities and implement technological developments and enhancements; and the timing and success of strategic initiatives and special projects. Forward-looking statements are not assurances of future performance and actual results could differ materially from our historical experience and our present expectations or projections. These forward-looking statements are based on management’s current expectations and beliefs, forecasts for our existing operations, experience, expectations and perception of historical trends, current conditions, anticipated future developments and their effect on us, and other factors believed to be appropriate. Although management believes the expectations and assumptions reflected in these forward-looking statements are reasonable as and when made, no assurance can be given that these assumptions are accurate or that any of these expectations will be achieved (in full or at all). Our forward-looking statements involve significant risks, contingencies and uncertainties, most of which are difficult to predict and many of which are beyond our control. Known material factors that could cause actual results to differ materially from those in the forward-looking statements include, but are not limited to, risks associated with the following: a decline in demand for our services, including due to declining commodity prices, overcapacity and other competitive factors affecting our industry; the cyclical nature and volatility of the oil and gas industry, which impacts the level of exploration, production and development activity and spending patterns by our customers; a decline in, or substantial volatility of, crude oil and gas commodity prices, which generally leads to decreased spending by our customers and negatively impacts drilling, completion and production activity; pressure on pricing for our core services, including due to competition and industry and/or economic conditions, which may impact, among other things, our ability to implement price increases or maintain pricing on our core services; the loss of, or interruption or delay in operations by, one or more significant customers; the failure by one or more of our significant customers to amounts when due, or at all; changes in customer requirements in markets or industries we serve; costs, delays, compliance requirements and other difficulties in executing our short-and long-term business plans and growth strategies; the effects of recent or future acquisitions on our business, including our ability to successfully integrate our operations and the costs incurred in doing so; business growth outpacing the capabilities of our infrastructure; operating hazards inherent in our industry, including the possibility of accidents resulting in personal injury or death, property damage or environmental damage; adverse weather conditions in oil or gas producing regions; the loss of, or interruption or delay in operations by, one or more of our key suppliers; the effect of environmental and other governmental regulations on our operations, including the risk that future changes in the regulation of hydraulic fracturing could reduce or eliminate demand for our hydraulic fracturing services; the incurrence of significant costs and liabilities resulting from litigation; the incurrence of significant costs and liabilities or severe restrictions on our operations or the inability to perform certain operations resulting from a failure to comply, or our compliance with, new or existing regulations; the effect of new or existing regulations, industry and/or commercial conditions on the availability of and costs for raw materials, consumables and equipment; the loss of, or inability to attract, key management personnel; a shortage of qualified workers; damage to or malfunction of equipment; our ability to maintain sufficient liquidity and/or obtain adequate financing to allow us to execute our business plan; and our ability to comply with covenants under our new credit facility. For additional information regarding known material factors that could affect our operating results and performance, please see our most recently filed Annual Report on Form 10-K, subsequent Quarterly Reports on Form 10-Q, and recent Current Reports on Form 8-K, which are available at the SEC’s website, http://www.sec.gov. Should one or more of these known material risks occur, or should the underlying assumptions change or prove incorrect, our actual results, performance, achievements or plans could differ materially from those expressed or implied in any forward-looking statement. Readers are cautioned not to place undue reliance on forward-looking statements, which speak only as of the date hereof. All subsequent written or oral forward-looking statements concerning us are expressly qualified in their entirety by the cautionary statements above. We undertake no obligation to publicly update or revise any forward-looking statements after the date they are made, whether as a result of new information, future events or otherwise, except as required by law. All information in this presentation is as of March 31, 2018 unless otherwise indicated. Non-GAAP Financial Measures: This presentation includes Adjusted EBITDA, a measure not calculated in accordance with generally accepted accounting principles in the U.S. ("U.S. GAAP"). Please see slide 24 for a reconciliation of net income (loss), the nearest measure calculated in accordance with U.S. GAAP, or pro forma net income (loss) prepared and presented in accordance with Article 11 of Regulation S-X, to Adjusted EBITDA. 2
Why Invest in C&J Energy Services?
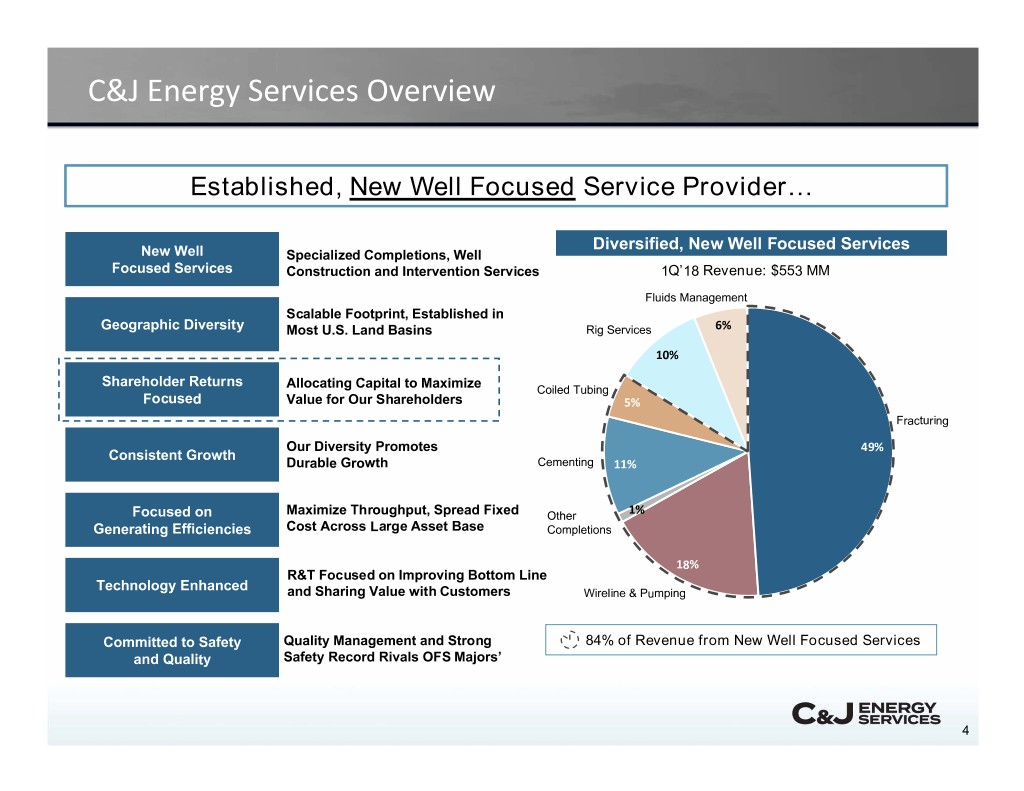
C&J Energy Services Overview Established, New Well Focused Service Provider… Diversified, New Well Focused Services New Well Specialized Completions, Well Focused Services Construction and Intervention Services 1Q’18 Revenue: $553 MM Fluids Management Scalable Footprint, Established in Geographic Diversity Most U.S. Land Basins Rig Services 6% 10% Shareholder Returns Allocating Capital to Maximize Coiled Tubing Focused Value for Our Shareholders 5% Fracturing Our Diversity Promotes 49% Consistent Growth Durable Growth Cementing 11% Focused on Maximize Throughput, Spread Fixed Other 1% Generating Efficiencies Cost Across Large Asset Base Completions 18% R&T Focused on Improving Bottom Line Technology Enhanced and Sharing Value with Customers Wireline & Pumping Committed to Safety Quality Management and Strong 84% of Revenue from New Well Focused Services and Quality Safety Record Rivals OFS Majors’ 4
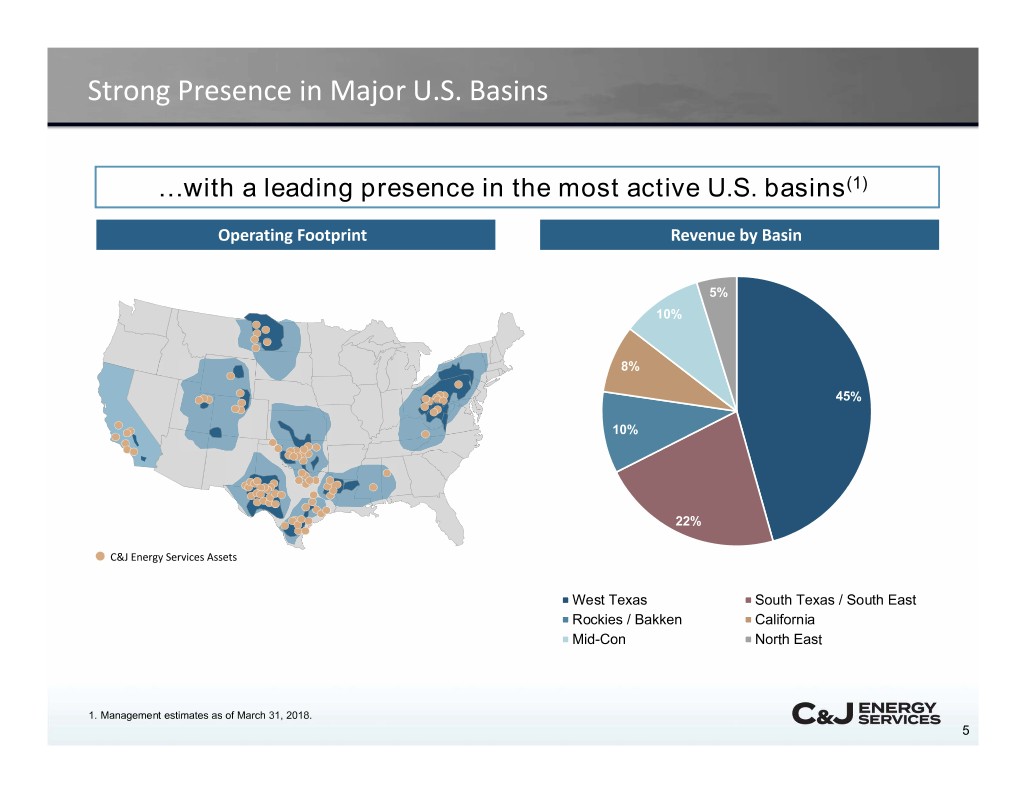
Strong Presence in Major U.S. Basins …with a leading presence in the most active U.S. basins(1) Operating Footprint Revenue by Basin 5% 10% 8% 45% 10% 22% C&J Energy Services Assets West Texas South Texas / South East Rockies / Bakken California Mid-Con North East 1. Management estimates as of March 31, 2018. 5
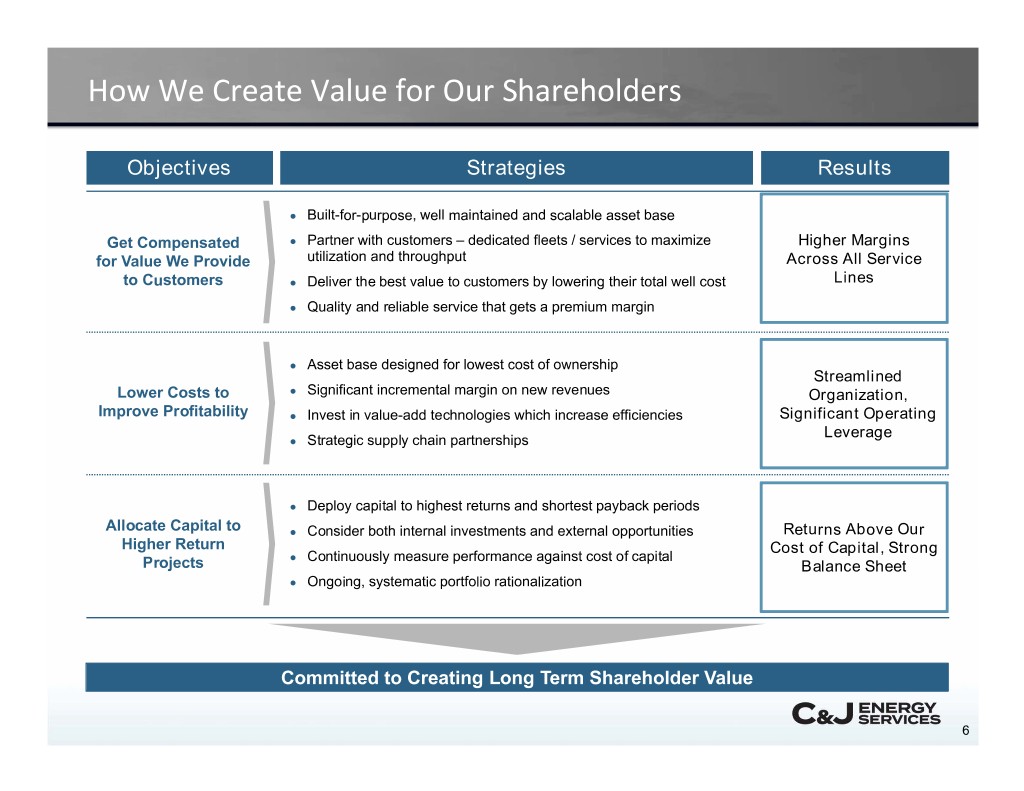
How We Create Value for Our Shareholders Objectives Strategies Results ● Built-for-purpose, well maintained and scalable asset base Get Compensated ● Partner with customers – dedicated fleets / services to maximize Higher Margins for Value We Provide utilization and throughput Across All Service to Customers ● Deliver the best value to customers by lowering their total well cost Lines ● Quality and reliable service that gets a premium margin ● Asset base designed for lowest cost of ownership Streamlined Lower Costs to ● Significant incremental margin on new revenues Organization, Improve Profitability ● Invest in value-add technologies which increase efficiencies Significant Operating Leverage ● Strategic supply chain partnerships ● Deploy capital to highest returns and shortest payback periods Allocate Capital to ● Consider both internal investments and external opportunities Returns Above Our Higher Return Cost of Capital, Strong ● Continuously measure performance against cost of capital Projects Balance Sheet ● Ongoing, systematic portfolio rationalization Committed to Creating Long Term Shareholder Value 6
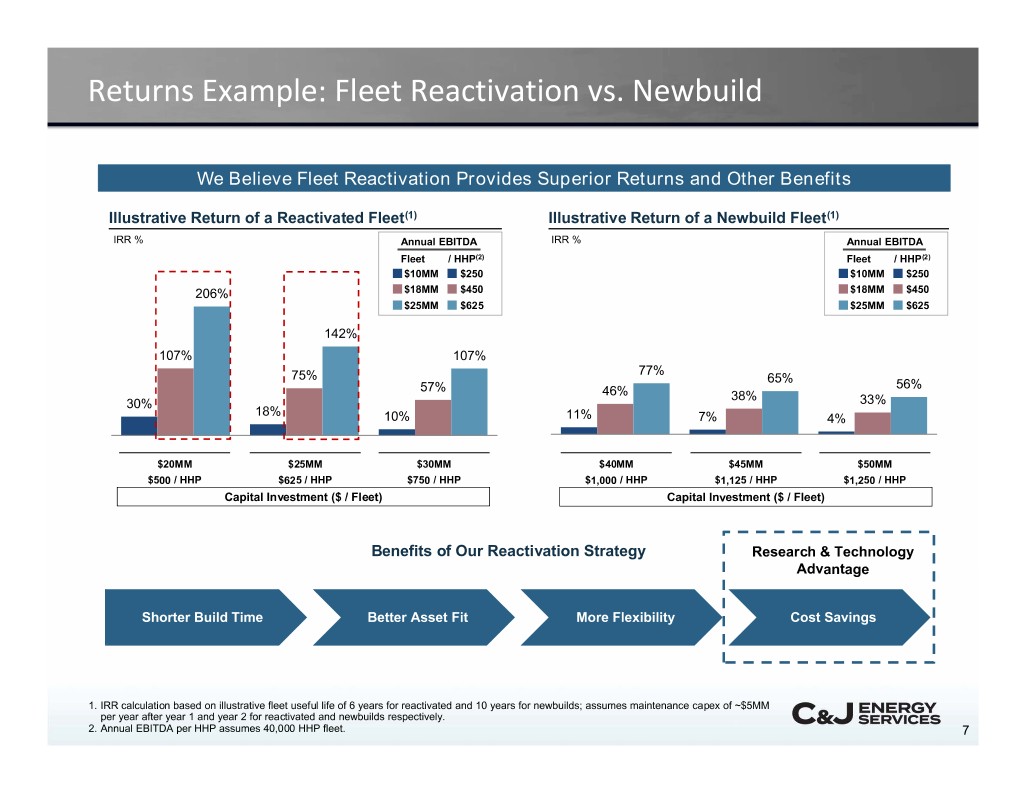
Returns Example: Fleet Reactivation vs. Newbuild We Believe Fleet Reactivation Provides Superior Returns and Other Benefits Illustrative Return of a Reactivated Fleet(1) Illustrative Return of a Newbuild Fleet(1) IRR % Annual EBITDA IRR % Annual EBITDA Fleet / HHP(2) Fleet / HHP(2) $10MM $250 $10MM $250 206% $18MM $450 $18MM $450 $25MM $625 $25MM $625 142% 107% 107% 77% 75% 65% 57% 56% 46% 38% 30% 33% 18% 10% 11% 7% 4% $20MM $25MM $30MM $40MM $45MM $50MM $500 / HHP $625 / HHP $750 / HHP $1,000 / HHP $1,125 / HHP $1,250 / HHP Capital Investment ($ / Fleet) Capital Investment ($ / Fleet) Benefits of Our Reactivation Strategy Research & Technology Advantage Shorter Build Time Better Asset Fit More Flexibility Cost Savings 1. IRR calculation based on illustrative fleet useful life of 6 years for reactivated and 10 years for newbuilds; assumes maintenance capex of ~$5MM per year after year 1 and year 2 for reactivated and newbuilds respectively. 2. Annual EBITDA per HHP assumes 40,000 HHP fleet. 7
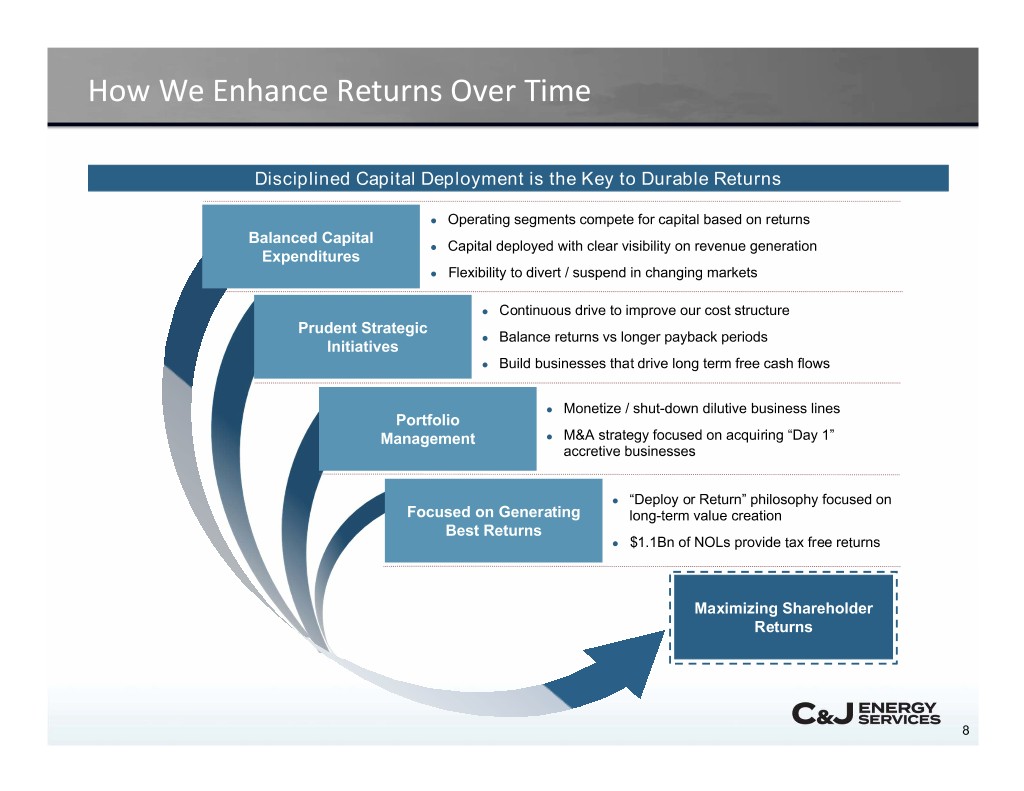
How We Enhance Returns Over Time Disciplined Capital Deployment is the Key to Durable Returns ● Operating segments compete for capital based on returns Balanced Capital ● Capital deployed with clear visibility on revenue generation Expenditures ● Flexibility to divert / suspend in changing markets ● Continuous drive to improve our cost structure Prudent Strategic ● Balance returns vs longer payback periods Initiatives ● Build businesses that drive long term free cash flows ● Monetize / shut-down dilutive business lines Portfolio Management ● M&A strategy focused on acquiring “Day 1” accretive businesses ● “Deploy or Return” philosophy focused on Focused on Generating long-term value creation Best Returns ● $1.1Bn of NOLs provide tax free returns Maximizing Shareholder Returns 8
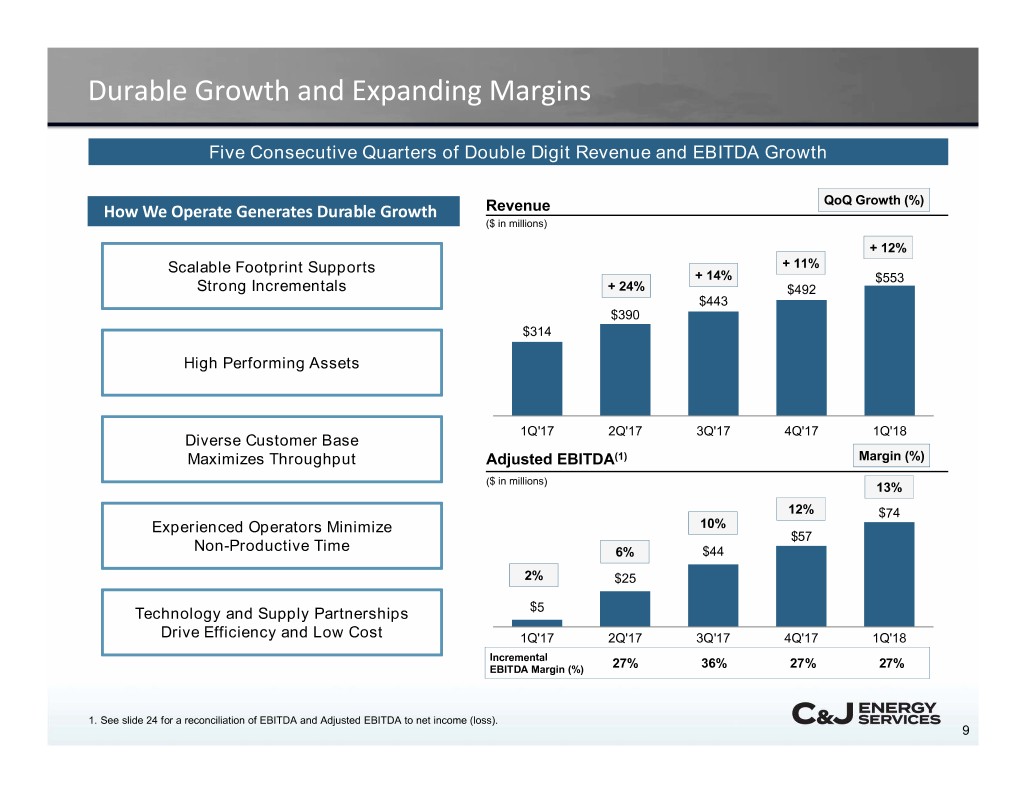
Durable Growth and Expanding Margins Five Consecutive Quarters of Double Digit Revenue and EBITDA Growth QoQ Growth (%) How We Operate Generates Durable GrowthHow We Operate Generates Durable Growth Revenue ($ in millions) + 12% Scalable Footprint Supports + 11% + 14% $553 Strong Incrementals + 24% $492 $443 $390 $314 High Performing Assets 1Q'17 2Q'17 3Q'17 4Q'17 1Q'18 Diverse Customer Base Maximizes Throughput Adjusted EBITDA(1) Margin (%) ($ in millions) 13% 12% $74 Experienced Operators Minimize 10% $57 Non-Productive Time 6% $44 2% $25 Technology and Supply Partnerships $5 Drive Efficiency and Low Cost 1Q'17 2Q'17 3Q'17 4Q'17 1Q'18 Incremental EBITDA Margin (%) 27% 36% 27% 27% 1. See slide 24 for a reconciliation of EBITDA and Adjusted EBITDA to net income (loss). 9
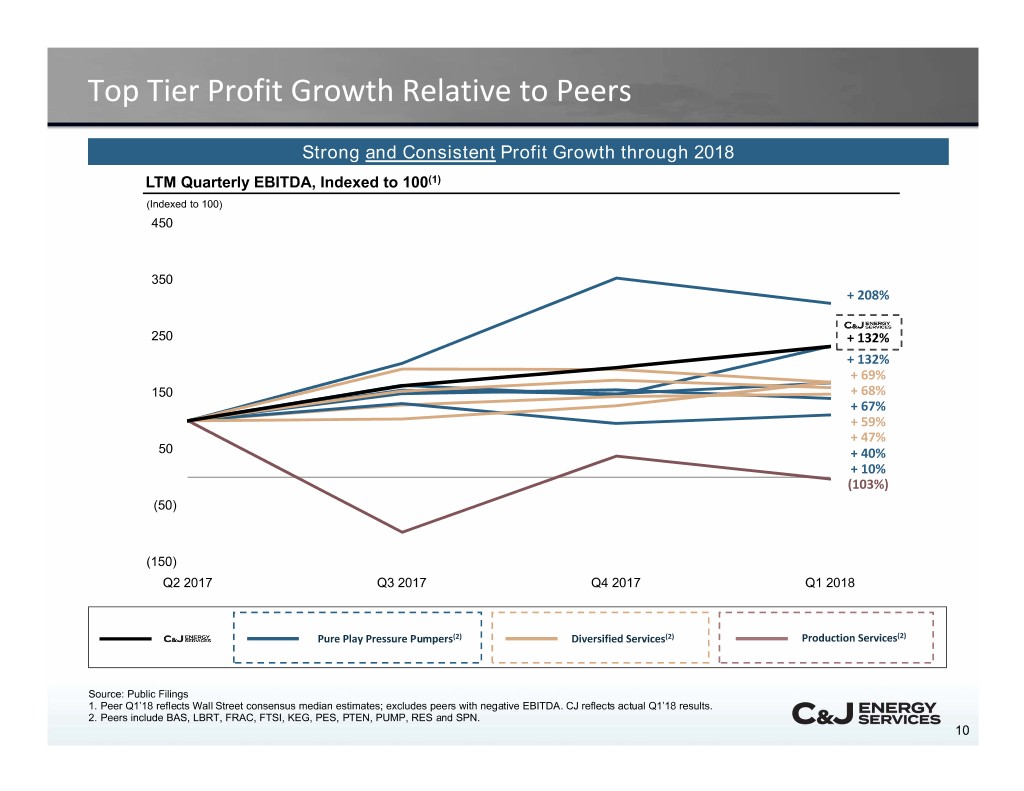
Top Tier Profit Growth Relative to Peers Strong and Consistent Profit Growth through 2018 LTM Quarterly EBITDA, Indexed to 100(1) (Indexed to 100) 450 350 + 208% 250 + 132% + 132% + 69% 150 + 68% + 67% + 59% + 47% 50 + 40% + 10% (103%) (50) (150) Q2 2017 Q3 2017 Q4 2017 Q1 2018 Pure Play Pressure Pumpers(2) Diversified Services(2) Production Services(2) Source: Public Filings 1. Peer Q1’18 reflects Wall Street consensus median estimates; excludes peers with negative EBITDA. CJ reflects actual Q1’18 results. 2. Peers include BAS, LBRT, FRAC, FTSI, KEG, PES, PTEN, PUMP, RES and SPN. 10
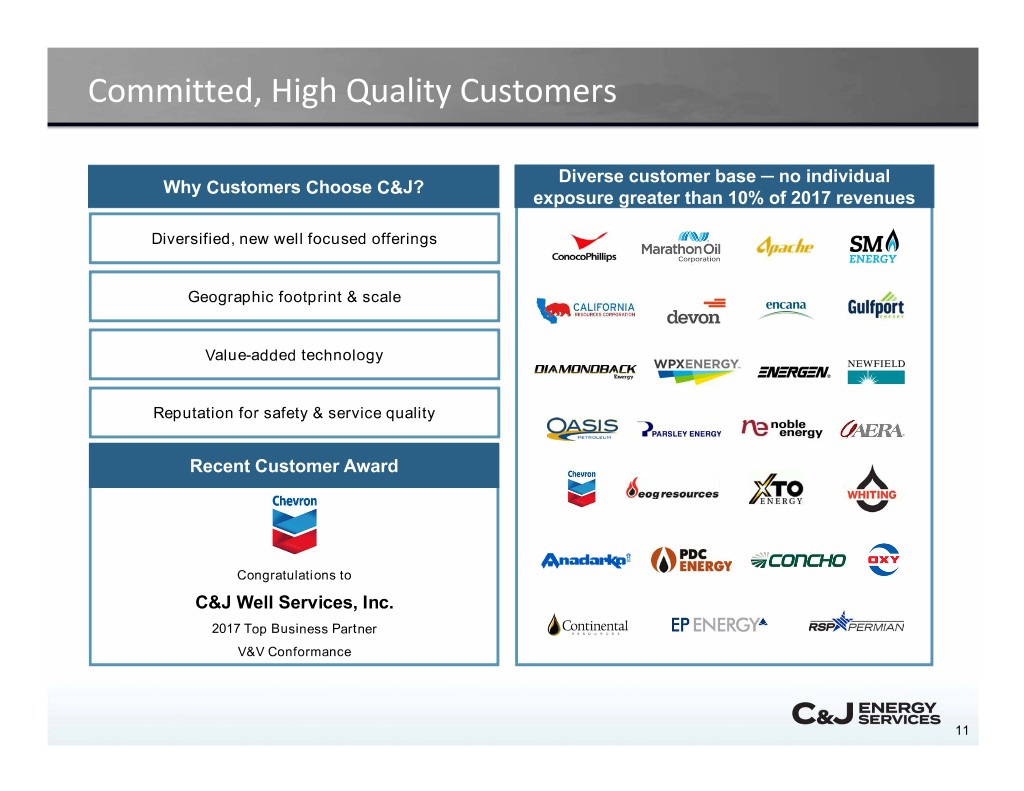
Committed, High Quality Customers Diverse customer base ─ no individual Why Customers Choose C&J? exposure greater than 10% of 2017 revenues Diversified, new well focused offerings Geographic footprint & scale Value-added technology Reputation for safety & service quality Logos from next few pages Recent Customer Award Congratulations to C&J Well Services, Inc. 2017 Top Business Partner V&V Conformance 11
Our Service Lines
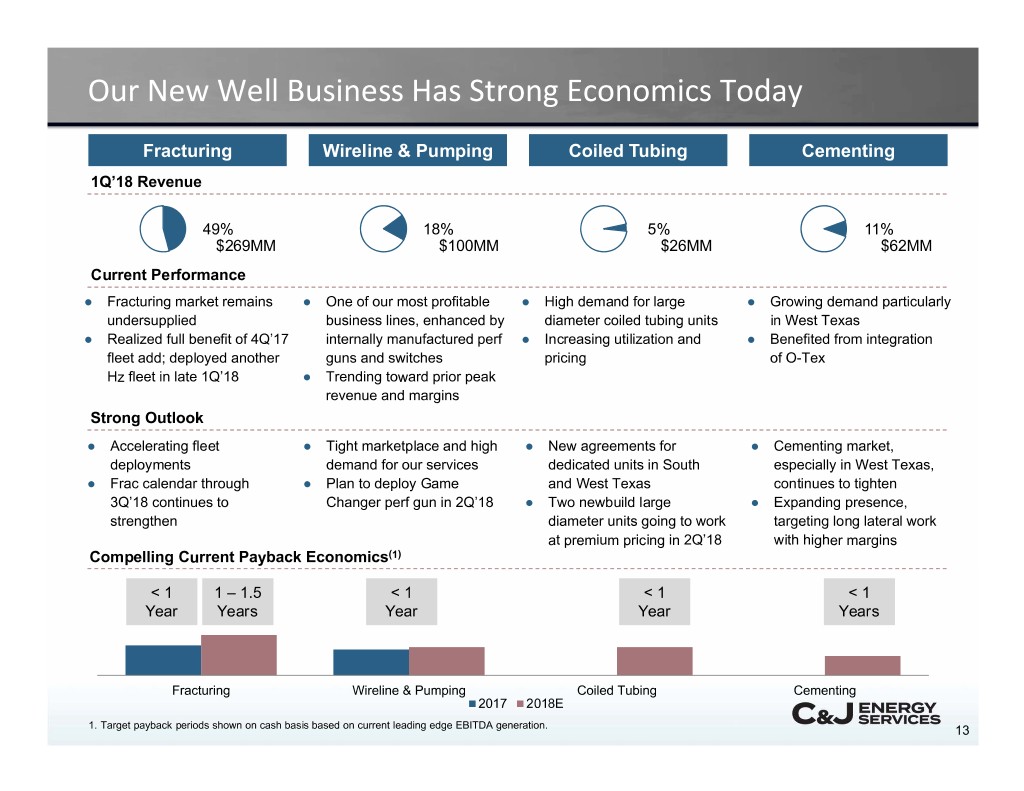
Our New Well Business Has Strong Economics Today Fracturing Wireline & Pumping Coiled Tubing Cementing 1Q’18 Revenue 49% 18% 5% 11% $269MM $100MM $26MM $62MM Current Performance ● Fracturing market remains ● One of our most profitable ● High demand for large ● Growing demand particularly undersupplied business lines, enhanced by diameter coiled tubing units in West Texas ● Realized full benefit of 4Q’17 internally manufactured perf ● Increasing utilization and ● Benefited from integration fleet add; deployed another guns and switches pricing of O-Tex Hz fleet in late 1Q’18 ● Trending toward prior peak revenue and margins Strong Outlook ● Accelerating fleet ● Tight marketplace and high ● New agreements for ● Cementing market, deployments demand for our services dedicated units in South especially in West Texas, ● Frac calendar through ● Plan to deploy Game and West Texas continues to tighten 3Q’18 continues to Changer perf gun in 2Q’18 ● Two newbuild large ● Expanding presence, strengthen diameter units going to work targeting long lateral work at premium pricing in 2Q’18 with higher margins Compelling Current Payback Economics(1) < 1 1 – 1.5 < 1 < 1 < 1 Year Years Year Year Years Fracturing Wireline & Pumping Coiled Tubing Cementing 2017 2018E 1. Target payback periods shown on cash basis based on current leading edge EBITDA generation. 13
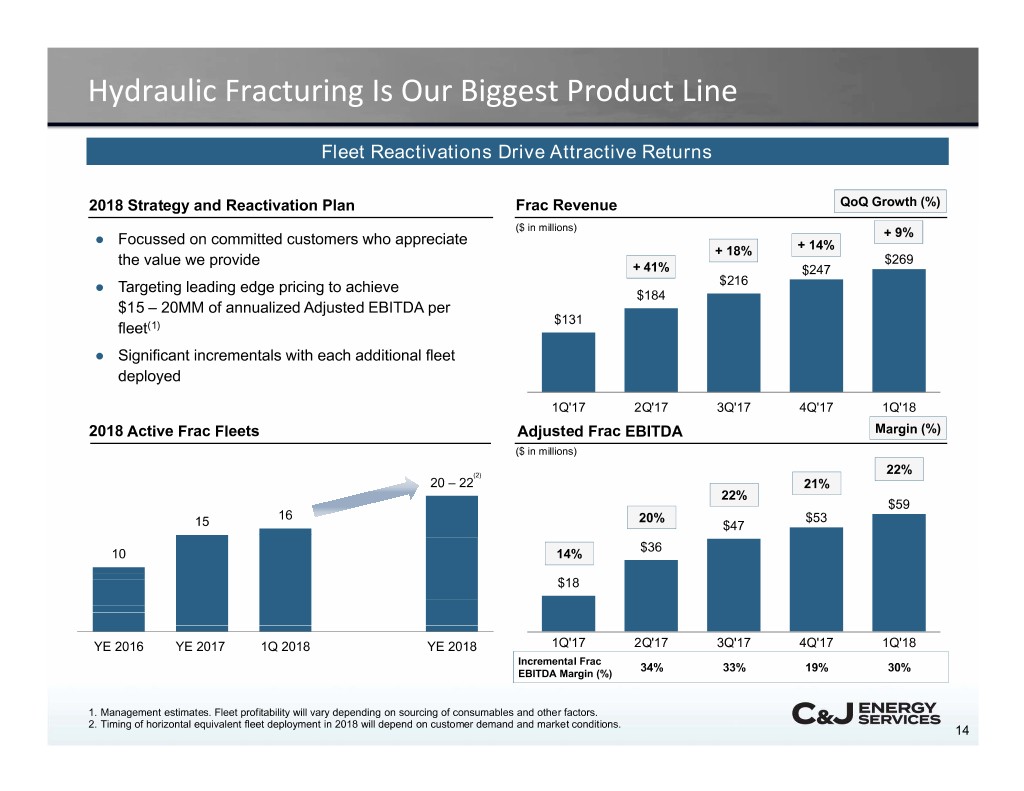
Hydraulic Fracturing Is Our Biggest Product Line Fleet Reactivations Drive Attractive Returns 2018 Strategy and Reactivation Plan Frac Revenue QoQ Growth (%) ($ in millions) ● Focussed on committed customers who appreciate + 9% + 18% + 14% the value we provide $269 + 41% $247 ● Targeting leading edge pricing to achieve $216 $184 $15 – 20MM of annualized Adjusted EBITDA per $131 fleet(1) ● Significant incrementals with each additional fleet deployed 1Q'17 2Q'17 3Q'17 4Q'17 1Q'18 2018 Active Frac Fleets Adjusted Frac EBITDA Margin (%) ($ in millions) (2) 22% 20 – 22 21% 22% $59 16 20% $53 15 $47 $36 10 14% $18 YE 2016 YE 2017 1Q 2018 YE 2018 1Q'17 2Q'17 3Q'17 4Q'17 1Q'18 Incremental Frac 34% 33%19% 30% EBITDA Margin (%) 1. Management estimates. Fleet profitability will vary depending on sourcing of consumables and other factors. 2. Timing of horizontal equivalent fleet deployment in 2018 will depend on customer demand and market conditions. 14
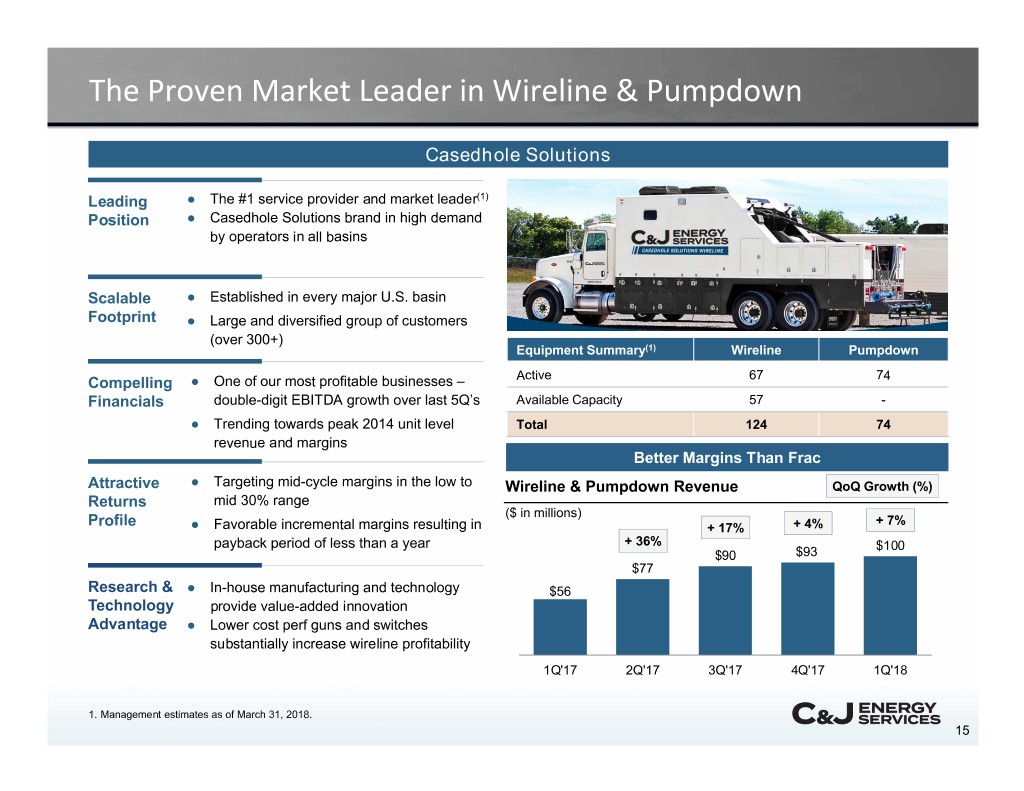
The Proven Market Leader in Wireline & Pumpdown Casedhole Solutions Leading ● The #1 service provider and market leader(1) Position ● Casedhole Solutions brand in high demand by operators in all basins Scalable ● Established in every major U.S. basin Footprint ● Large and diversified group of customers (over 300+) Equipment Summary(1) Wireline Pumpdown Active 67 74 Compelling ● One of our most profitable businesses – Financials double-digit EBITDA growth over last 5Q’s Available Capacity 57 - ● Trending towards peak 2014 unit level Total 124 74 revenue and margins Better Margins Than Frac Attractive ● Targeting mid-cycle margins in the low to Wireline & Pumpdown Revenue QoQ Growth (%) Returns mid 30% range ($ in millions) Profile + 7% ● Favorable incremental margins resulting in + 17% + 4% payback period of less than a year + 36% $100 $90 $93 $77 Research & ● In-house manufacturing and technology $56 Technology provide value-added innovation Advantage ● Lower cost perf guns and switches substantially increase wireline profitability 1Q'17 2Q'17 3Q'17 4Q'17 1Q'18 1. Management estimates as of March 31, 2018. 15
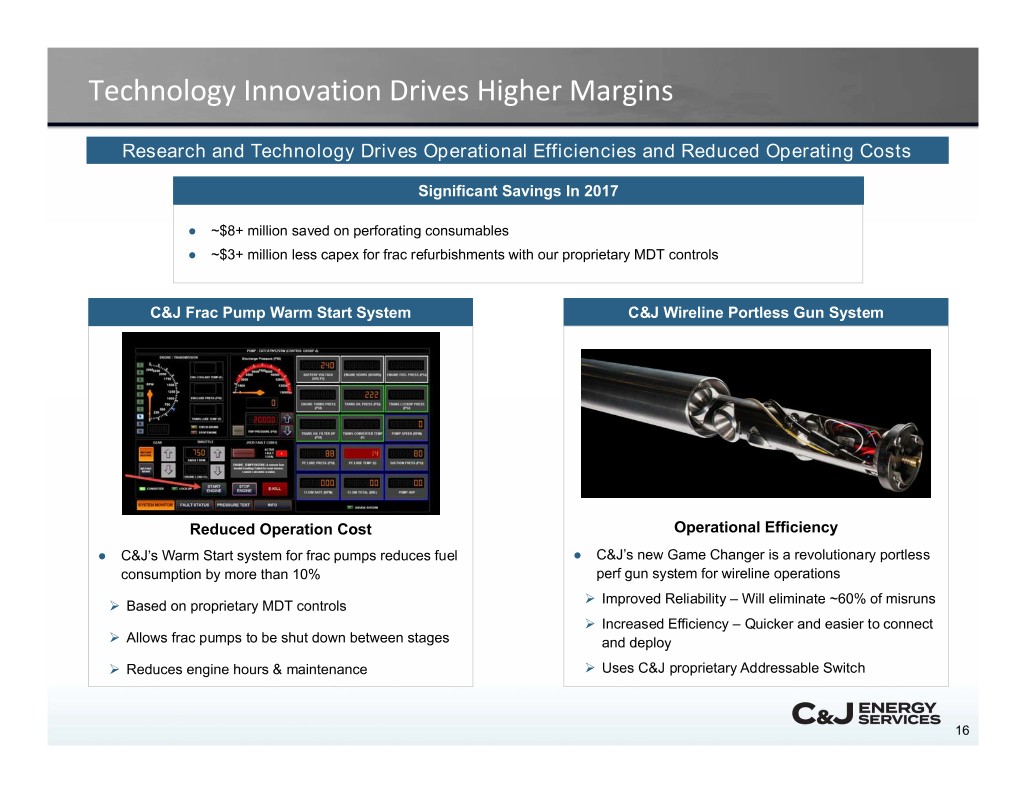
Technology Innovation Drives Higher Margins Research and Technology Drives Operational Efficiencies and Reduced Operating Costs Significant Savings In 2017 ● ~$8+ million saved on perforating consumables ● ~$3+ million less capex for frac refurbishments with our proprietary MDT controls C&J Frac Pump Warm Start System C&J Wireline Portless Gun System Reduced Operation Cost Operational Efficiency ● C&J’s Warm Start system for frac pumps reduces fuel ● C&J’s new Game Changer is a revolutionary portless consumption by more than 10% perf gun system for wireline operations Improved Reliability – Will eliminate ~60% of misruns Based on proprietary MDT controls Increased Efficiency – Quicker and easier to connect Allows frac pumps to be shut down between stages and deploy Reduces engine hours & maintenance Uses C&J proprietary Addressable Switch 16
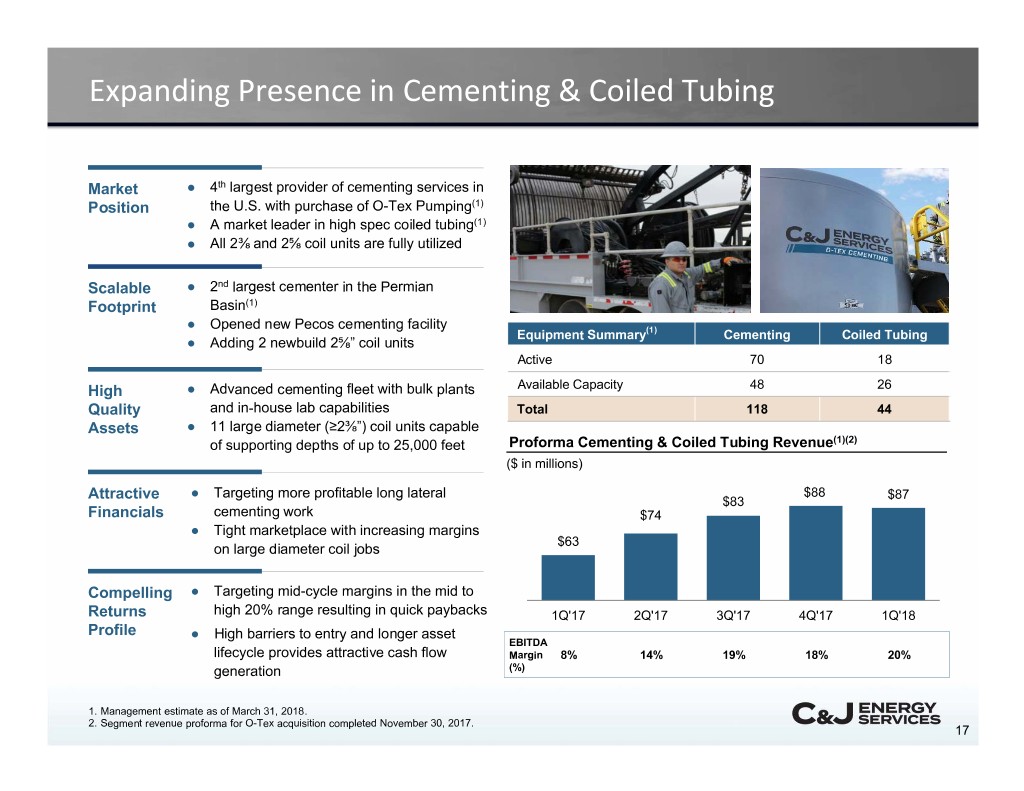
Expanding Presence in Cementing & Coiled Tubing Market ● 4th largest provider of cementing services in Position the U.S. with purchase of O-Tex Pumping(1) ● A market leader in high spec coiled tubing(1) ● All 2⅜ and 2⅝ coil units are fully utilized Scalable ● 2nd largest cementer in the Permian Footprint Basin(1) ● Opened new Pecos cementing facility Equipment Summary(1) Cementing Coiled Tubing ● Adding 2 newbuild 2⅝” coil units Active 70 18 High ● Advanced cementing fleet with bulk plants Available Capacity 48 26 Quality and in-house lab capabilities Total 118 44 Assets ● 11 large diameter (≥2⅜”) coil units capable of supporting depths of up to 25,000 feet Proforma Cementing & Coiled Tubing Revenue(1)(2) ($ in millions) Attractive ● Targeting more profitable long lateral $88 $87 $83 Financials cementing work $74 ● Tight marketplace with increasing margins $63 on large diameter coil jobs Compelling ● Targeting mid-cycle margins in the mid to Returns high 20% range resulting in quick paybacks 1Q'17 2Q'17 3Q'17 4Q'17 1Q'18 Profile ● High barriers to entry and longer asset EBITDA lifecycle provides attractive cash flow Margin 8%14% 19% 18% 20% generation (%) 1. Management estimate as of March 31, 2018. 2. Segment revenue proforma for O-Tex acquisition completed November 30, 2017. 17
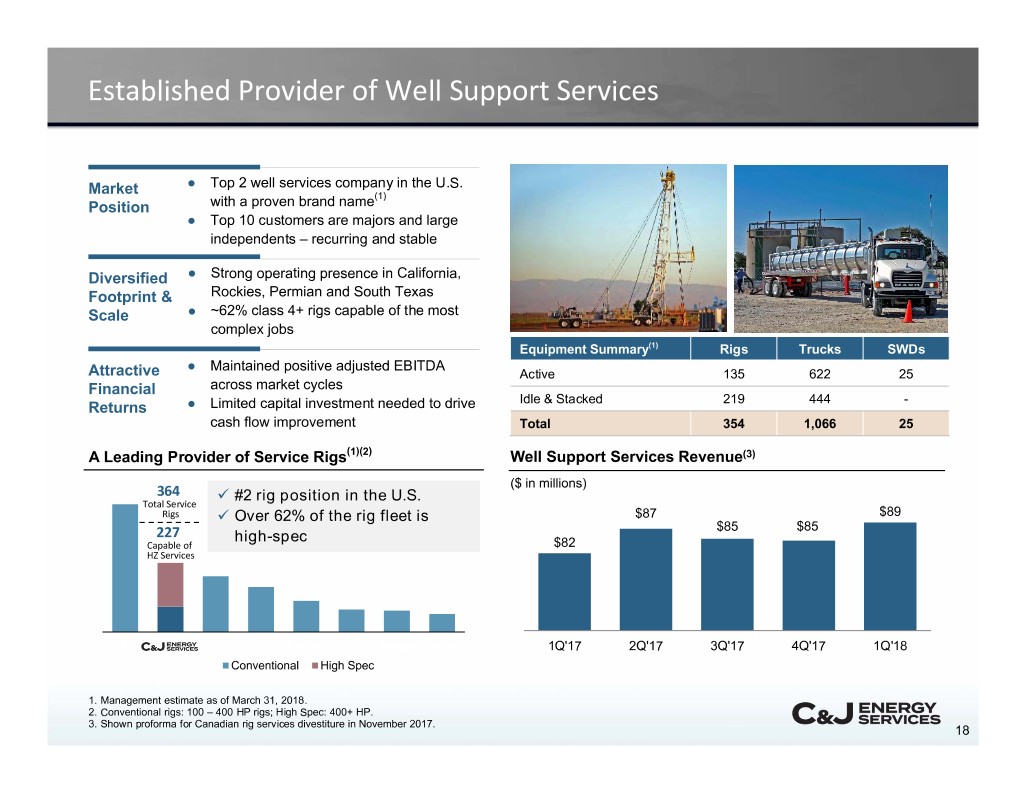
Established Provider of Well Support Services ● Top 2 well services company in the U.S. Market (1) Position with a proven brand name ● Top 10 customers are majors and large independents – recurring and stable Diversified ● Strong operating presence in California, Footprint & Rockies, Permian and South Texas Scale ● ~62% class 4+ rigs capable of the most complex jobs Equipment Summary(1) Rigs Trucks SWDs ● Maintained positive adjusted EBITDA Attractive Active 135 622 25 Financial across market cycles Idle & Stacked 219 444 - Returns ● Limited capital investment needed to drive cash flow improvement Total 354 1,066 25 A Leading Provider of Service Rigs(1)(2) Well Support Services Revenue(3) ($ in millions) 364 #2 rig position in the U.S. Total Service Rigs Over 62% of the rig fleet is $87 $89 $85 $85 227 high-spec Capable of $82 HZ Services KEG CJ BAS SPN Forbes PES Ranger Nine 1Q'17 2Q'17 3Q'17 4Q'17 1Q'18 Conventional High Spec 1. Management estimate as of March 31, 2018. 2. Conventional rigs: 100 – 400 HP rigs; High Spec: 400+ HP. 3. Shown proforma for Canadian rig services divestiture in November 2017. 18
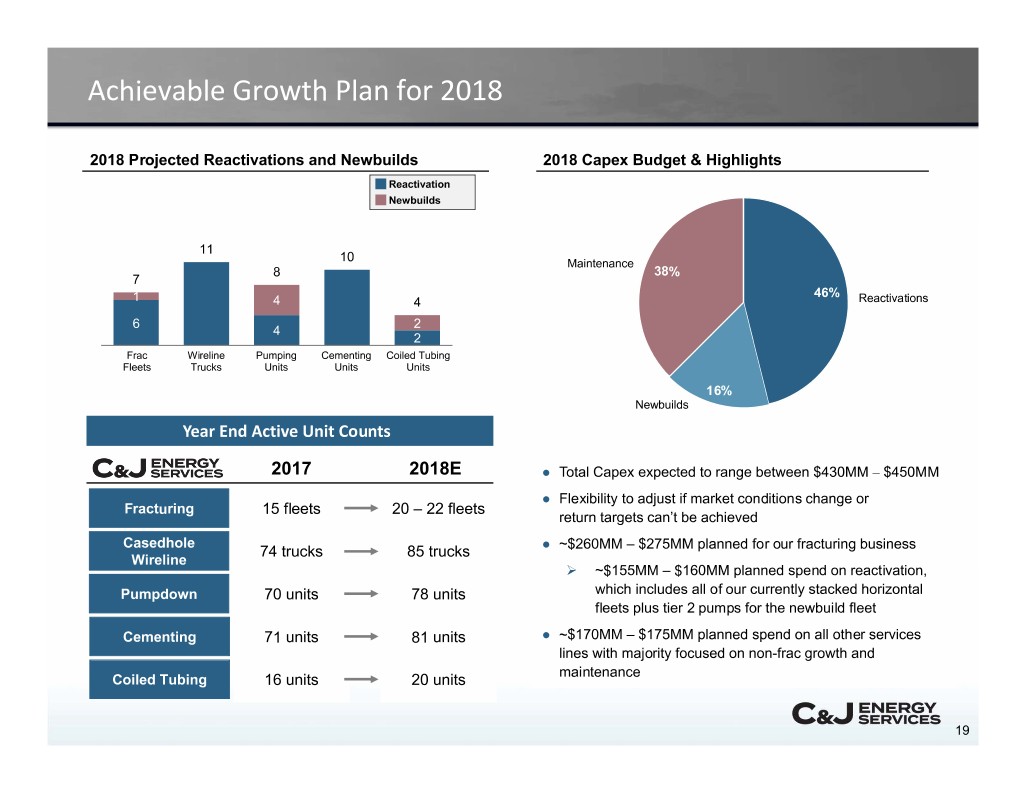
Achievable Growth Plan for 2018 2018 Projected Reactivations and Newbuilds 2018 Capex Budget & Highlights Reactivation Newbuilds 11 10 Maintenance 8 38% 7 46% 1 4 4 Reactivations 6 2 4 2 Frac Wireline Pumping Cementing Coiled Tubing Fleets Trucks Units Units Units 16% Newbuilds Year End ActiveYear End Active Unit Counts Units 2017 2018E ● Total Capex expected to range between $430MM – $450MM ● Flexibility to adjust if market conditions change or Fracturing 15 fleets 20 – 22 fleets return targets can’t be achieved Casedhole 74 trucks 85 trucks ● ~$260MM – $275MM planned for our fracturing business Wireline ~$155MM – $160MM planned spend on reactivation, Pumpdown 70 units 78 units which includes all of our currently stacked horizontal fleets plus tier 2 pumps for the newbuild fleet Cementing 71 units 81 units ● ~$170MM – $175MM planned spend on all other services lines with majority focused on non-frac growth and maintenance Coiled Tubing 16 units 20 units 19
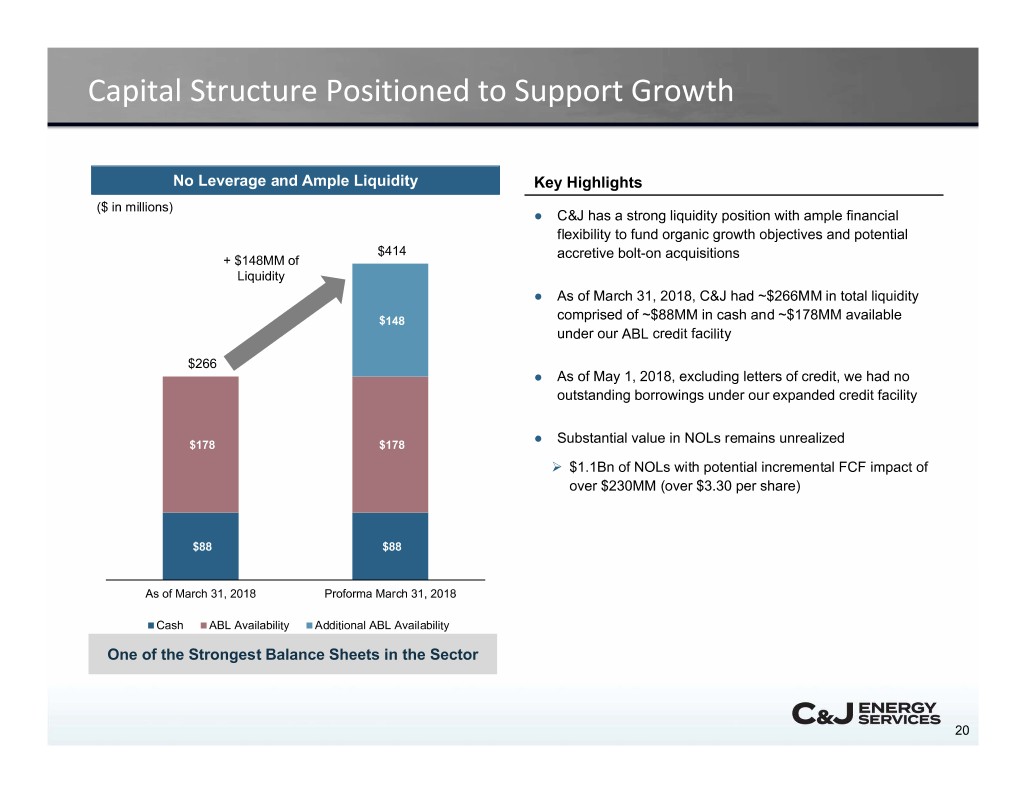
Capital Structure Positioned to Support Growth No Leverage and Ample Liquidity Key Highlights ($ in millions) ● C&J has a strong liquidity position with ample financial flexibility to fund organic growth objectives and potential $414 accretive bolt-on acquisitions + $148MM of Liquidity ● As of March 31, 2018, C&J had ~$266MM in total liquidity $148 comprised of ~$88MM in cash and ~$178MM available under our ABL credit facility $266 ● As of May 1, 2018, excluding letters of credit, we had no outstanding borrowings under our expanded credit facility $178 $178 ● Substantial value in NOLs remains unrealized $1.1Bn of NOLs with potential incremental FCF impact of over $230MM (over $3.30 per share) $88 $88 As of March 31, 2018 Proforma March 31, 2018 Cash ABL Availability Additional ABL Availability One of the Strongest Balance Sheets in the Sector 20
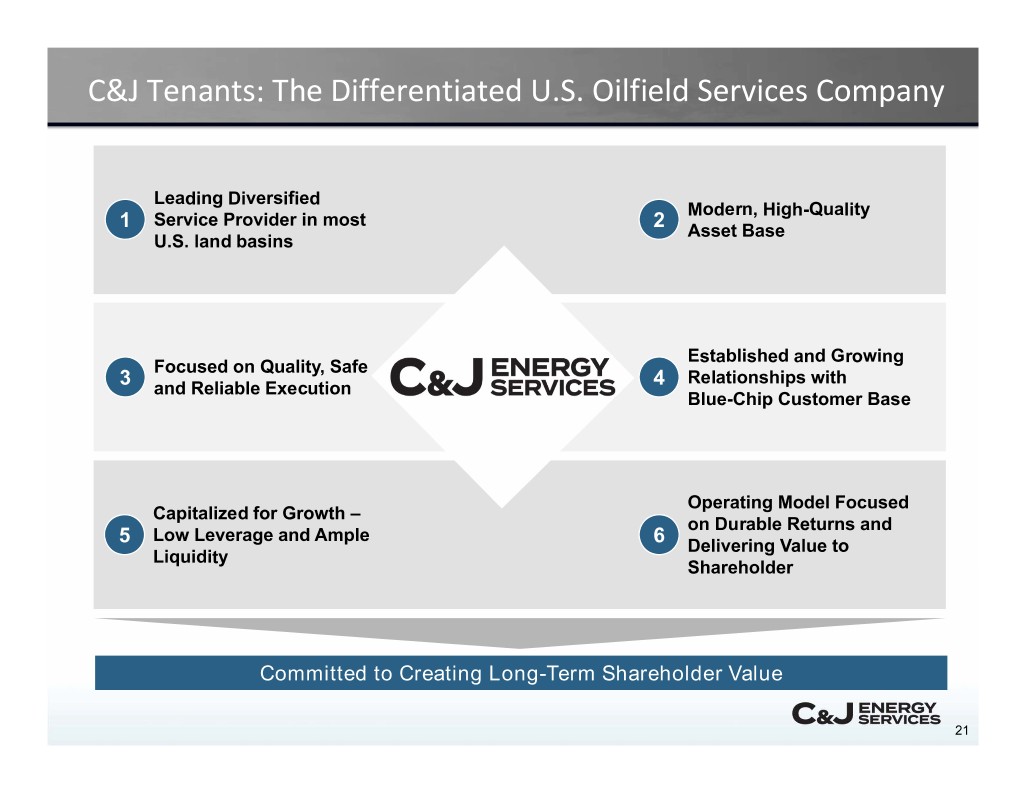
C&J Tenants: The Differentiated U.S. Oilfield Services Company Leading Diversified Modern, High-Quality 1 Service Provider in most 2 Asset Base U.S. land basins Established and Growing Focused on Quality, Safe 3 4 Relationships with and Reliable Execution Blue-Chip Customer Base Operating Model Focused Capitalized for Growth – on Durable Returns and Low Leverage and Ample 5 6 Delivering Value to Liquidity Shareholder Committed to Creating Long-Term Shareholder Value 21
APPENDIX A: Financial Review
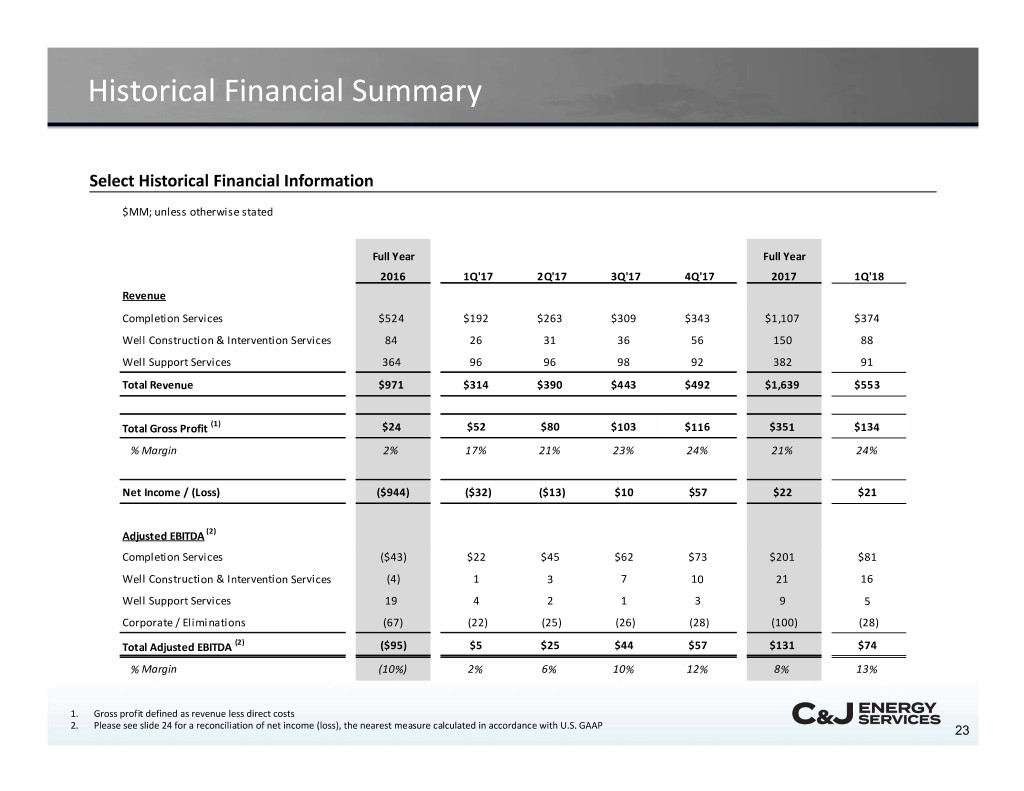
Historical Financial Summary Select Historical Financial Information $MM; unless otherwise stated Full Year Full Year 2016 1Q'17 2Q'17 3Q'17 4Q'17 2017 1Q'18 Revenue Completion Services $524 $192 $263 $309 $343 $1,107 $374 Well Construction & Intervention Services 84 26 31 36 56 150 88 Well Support Services 364 96 96 98 92 382 91 Total Revenue $971 $314 $390 $443 $492 $1,639 $553 Total Gross Profit (1) $24 $52 $80 $103 $116 $351 $134 % Margin 2% 17% 21% 23% 24% 21% 24% Net Income / (Loss) ($944) ($32) ($13) $10 $57 $22 $21 Adjusted EBITDA (2) Completion Services ($43) $22 $45 $62 $73 $201 $81 Well Construction & Intervention Services (4) 1 3 7 10 21 16 Well Support Services 19 4 2 1 3 9 5 Corporate / Eliminations (67) (22) (25) (26) (28) (100) (28) Total Adjusted EBITDA (2) ($95) $5 $25 $44 $57 $131 $74 % Margin (10%) 2% 6% 10% 12% 8% 13% 1. Gross profit defined as revenue less direct costs 2. Please see slide 24 for a reconciliation of net income (loss), the nearest measure calculated in accordance with U.S. GAAP 23
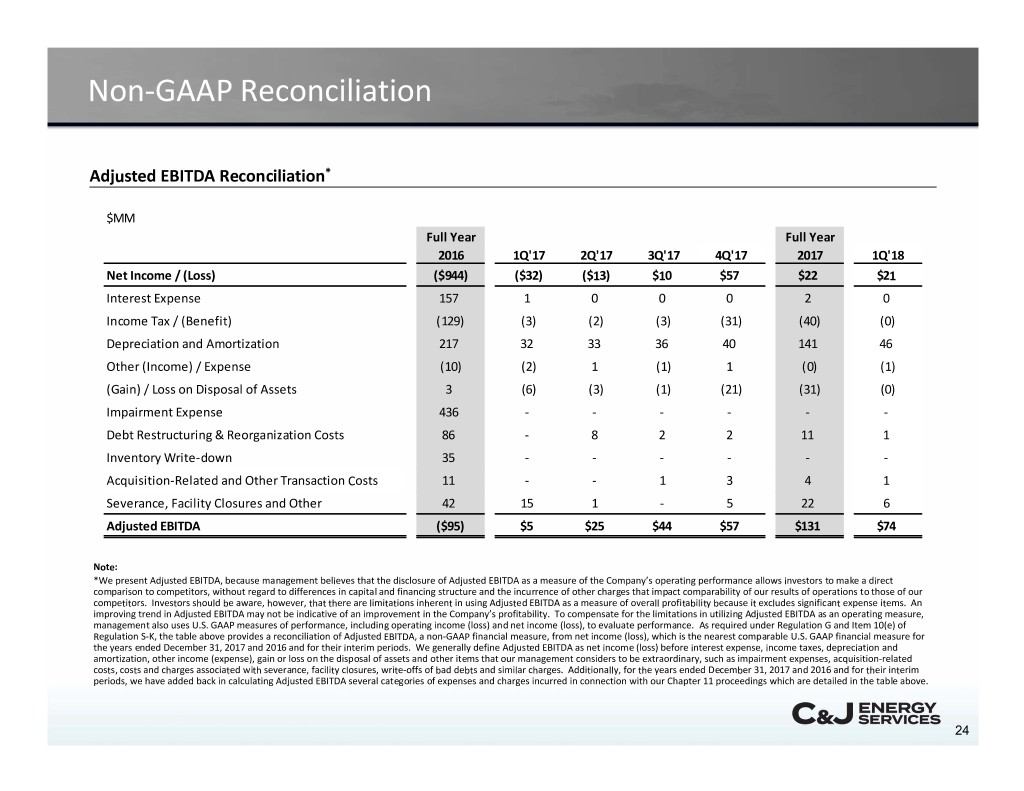
Non‐GAAP Reconciliation Adjusted EBITDA Reconciliation* $MM Full Year Full Year 2016 1Q'17 2Q'17 3Q'17 4Q'17 2017 1Q'18 Net Income / (Loss) ($944) ($32) ($13) $10 $57 $22 $21 Interest Expense 157 1 0 0 0 2 0 Income Tax / (Benefit) (129) (3) (2) (3) (31) (40) (0) Depreciation and Amortization 217 32 33 36 40 141 46 Other (Income) / Expense (10) (2) 1 (1) 1 (0) (1) (Gain) / Loss on Disposal of Assets 3 (6) (3) (1) (21) (31) (0) Impairment Expense 436 ‐ ‐ ‐ ‐ ‐ ‐ Debt Restructuring & Reorganization Costs 86 ‐ 8 2 2 11 1 Inventory Write‐down 35 ‐ ‐ ‐ ‐ ‐ ‐ Acquisition‐Related and Other Transaction Costs 11 ‐ ‐ 1 3 4 1 Severance, Facility Closures and Other 42 15 1 ‐ 5 22 6 Adjusted EBITDA ($95) $5 $25 $44 $57 $131 $74 Note: *We present Adjusted EBITDA, because management believes that the disclosure of Adjusted EBITDA as a measure of the Company’s operating performance allows investors to make a direct comparison to competitors, without regard to differences in capital and financing structure and the incurrence of other charges that impact comparability of our results of operations to those of our competitors. Investors should be aware, however, that there are limitations inherent in using Adjusted EBITDA as a measure of overall profitability because it excludes significant expense items. An improving trend in Adjusted EBITDA may not be indicative of an improvement in the Company’s profitability. To compensate for the limitations in utilizing Adjusted EBITDA as an operating measure, management also uses U.S. GAAP measures of performance, including operating income (loss) and net income (loss), to evaluate performance. As required under Regulation G and Item 10(e) of Regulation S‐K, the table above provides a reconciliation of Adjusted EBITDA, a non‐GAAP financial measure, from net income (loss), which is the nearest comparable U.S. GAAP financial measure for the years ended December 31, 2017 and 2016 and for their interim periods. We generally define Adjusted EBITDA as net income (loss) before interest expense, income taxes, depreciation and amortization, other income (expense), gain or loss on the disposal of assets and other items that our management considers to be extraordinary, such as impairment expenses, acquisition‐related costs, costs and charges associated with severance, facility closures, write‐offs of bad debts and similar charges. Additionally, for the years ended December 31, 2017 and 2016 and for their interim periods, we have added back in calculating Adjusted EBITDA several categories of expenses and charges incurred in connection with our Chapter 11 proceedings which are detailed in the table above. 24
