Attached files
| file | filename |
|---|---|
| EX-32.2 - EXHIBIT 32.2 - C&J Energy Services, Inc. | cjes12312016ex-322.htm |
| EX-32.1 - EXHIBIT 32.1 - C&J Energy Services, Inc. | cjes12312016ex-321.htm |
| EX-31.2 - EXHIBIT 31.2 - C&J Energy Services, Inc. | cjes12312016ex-312.htm |
| EX-31.1 - EXHIBIT 31.1 - C&J Energy Services, Inc. | cjes12312016ex-311.htm |
| EX-23.1 - EXHIBIT 23.1 - C&J Energy Services, Inc. | cjes12312016ex-231.htm |
| EX-21.1 - EXHIBIT 21.1 - C&J Energy Services, Inc. | exhibit211listofsignifican.htm |
| EX-4.4 - EXHIBIT 4.4 - C&J Energy Services, Inc. | cjes12312016ex-44.htm |
UNITED STATES
SECURITIES AND EXCHANGE COMMISSION
WASHINGTON, D.C. 20549
FORM 10-K
(Mark One)
ý | ANNUAL REPORT PURSUANT TO SECTION 13 OR 15(d) OF THE SECURITIES EXCHANGE ACT OF 1934 |
FOR THE FISCAL YEAR ENDED DECEMBER 31, 2016
OR
¨ | TRANSITION REPORT PURSUANT TO SECTION 13 OR 15(d) OF THE SECURITIES EXCHANGE ACT OF 1934 |
FOR THE TRANSITION PERIOD FROM TO
Commission File Number: 000-55404
C&J Energy Services, Inc.
(Exact name of registrant as specified in its charter)
Delaware | 81-4808566 | |
(State or other jurisdiction of incorporation or organization) | (I.R.S. Employer Identification No.) | |
3990 Rogerdale Rd. Houston, Texas 77042 (Address of principal executive offices) | ||
(713) 325-6000
(Registrant’s telephone number, including area code)
Securities registered pursuant to Section 12(b) of the Act: None
Securities registered pursuant to Section 12(g) of the Act: Warrants, each exercisable to purchase one share of Common Stock, $0.01 par value per share
Indicate by check mark if the Registrant is a well-known seasoned issuer, as defined in Rule 405 of the Securities Act. Yes ¨ No ý
Indicate by check mark if the Registrant is not required to file reports pursuant to Section 13 or Section 15(d) of the Act. Yes ¨ No ý
Indicate by check mark whether the Registrant (1) has filed all reports required to be filed by Section 13 or 15(d) of the Securities Exchange Act of 1934 during the preceding 12 months (or for such shorter period that the Registrant was required to file such reports), and (2) has been subject to such filing requirements for the past 90 days. Yes ý No ¨
Indicate by check mark whether the registrant has submitted electronically and posted on its corporate Web site, if any, every Interactive Data File required to be submitted and posted pursuant to Rule 405 of Regulation S-T (§232.405 of this chapter) during the preceding 12 months (or for such shorter period that the registrant was required to submit and post such files). Yes ý No ¨
Indicate by check mark if disclosure of delinquent filers pursuant to Item 405 of Regulation S-K (§229.405 of this chapter) is not contained herein and will not be contained, to the best of the Registrant’s knowledge, in definitive proxy or information statements incorporated by reference in Part III of this Form 10-K or any amendment to this Form 10-K. ý
Indicate by check mark whether the Registrant is a large accelerated filer, an accelerated filer, a non-accelerated filer or a smaller reporting company. See the definitions of “large accelerated filer,” “accelerated filer” and “smaller reporting company” in Rule 12b-2 of the Exchange Act
Large accelerated filer | ¨ | Accelerated filer | ¨ | |||
Non-accelerated filer | x (do not check if a smaller reporting company) | Smaller reporting company | ¨ | |||
Indicate by check mark whether the Registrant is a shell company (as defined in Rule 12b-2 of the Act). Yes ¨ No ý
The aggregate market value of the registrant’s common stock held by non-affiliates on June 30, 2016 (the last business day of the registrant’s most recently completed second fiscal quarter) based upon the closing price on the New York Stock Exchange on that date was approximately $34.0 million.
The number of shares of the registrant’s common stock, par value $0.01 per share, outstanding at February 24, 2017, was 56,217,229.
DOCUMENTS INCORPORATED BY REFERENCE
None
TABLE OF CONTENTS
Page | ||||
PART I
CAUTIONARY NOTE REGARDING FORWARD-LOOKING STATEMENTS
This Annual Report on Form 10-K (this “Annual Report”) includes certain statements and information that may constitute “forward-looking statements” within the meaning of Section 27A of the Securities Act of 1933, as amended (the “Securities Act”), and Section 21E of the Securities Exchange Act of 1934, as amended (the “Exchange Act”). The words “anticipate,” “believe,” “ensure,” “expect,” “if,” “intend,” “plan,” “estimate,” “project,” “forecasts,” “predict,” “outlook,” “aim,” “will,” “could,” “should,” “potential,” “would,” “may,” “probable,” “likely,” and similar expressions that convey the uncertainty of future events or outcomes, and the negative thereof, are intended to identify forward-looking statements. Forward-looking statements, which are not generally historical in nature, include those that express a belief, expectation or intention regarding our future activities, plans and goals and our current expectations with respect to, among other things, the impact of our emergence from bankruptcy on our business and relationships, future sales of or the availability for future sale of substantial amounts of our common stock, including the exercise of outstanding Warrants, our plan to list our common stock on the NYSE MKT, our business strategy and our financial strategy.
Forward-looking statements are not assurances of future performance and actual results could differ materially from our historical experience and our present expectations or projections. These forward-looking statements are based on management’s current expectations and beliefs, forecasts for our existing operations, experience, expectations and perception of historical trends, current conditions, anticipated future developments and their effect on us, and other factors believed to be appropriate. Although management believes the expectations and assumptions reflected in these forward-looking statements are reasonable as and when made, no assurance can be given that these assumptions are accurate or that any of these expectations will be achieved (in full or at all). Our forward-looking statements involve significant risks, contingencies and uncertainties, most of which are difficult to predict and many of which are beyond our control. Known material factors that could cause actual results to differ materially from those in the forward-looking statements include, but are not limited to, risks associated with the following:
• | a decline in demand for our services, including due to declining commodity prices, overcapacity and other competitive factors affecting our industry; |
• | the cyclical nature and volatility of the oil and gas industry, which impacts the level of exploration, production and development activity and spending patterns by E&P companies; |
• | a decline in, or substantial volatility of, crude oil and gas commodity prices, which generally leads to decreased spending by our customers and negatively impacts drilling, completion and production activity; |
• | pressure on pricing for our core services, including due to competition and industry and/or economic conditions, which may impact, among other things, our ability to implement price increases or maintain pricing on our core services; |
• | the loss of, or interruption or delay in operations by, one or more significant customers; |
• | the failure to pay amounts when due, or at all, by one or more significant customers; |
• | changes in customer requirements in markets or industries we serve; |
• | costs, delays, regulatory compliance requirements and other difficulties in executing our long-term growth strategy, including those related to expansion into new geographic regions and new business lines; |
• | the effects of future acquisitions on our business, including our ability to successfully integrate our operations and the costs incurred in doing so; |
• | business growth outpacing the capabilities of our infrastructure; |
• | adverse weather conditions in oil or gas producing regions; |
• | the effect of environmental and other governmental regulations on our operations, including the risk that future changes in the regulation of hydraulic fracturing could reduce or eliminate demand for our hydraulic fracturing services; |
1
• | the incurrence of significant costs and liabilities resulting from litigation; |
• | the incurrence of significant costs and liabilities resulting from our failure to comply, or our compliance with, new or existing environmental regulations or an accidental release of hazardous substances into the environment; |
• | the loss of, or inability to attract, key management personnel; |
• | a shortage of qualified workers; |
• | the loss of, or interruption or delay in operation by, one or more of our key suppliers; |
• | operating hazards inherent in our industry, including the significant possibility of accidents resulting in personal injury or death, property damage or environmental damage; |
• | accidental damage to or malfunction of equipment; |
• | uncertainty regarding our ability to improve our operating structure, financial results and profitability and to maintain relationships with suppliers, customers, employees and other third parties following emergence from bankruptcy and other risks and uncertainties related to our emergence from bankruptcy; |
• | our ability to maintain sufficient liquidity and/or obtain adequate financing to allow us to execute our business plan; and |
• | our ability to comply with covenants under our new credit facility. |
For additional information regarding known material factors that could affect our operating results and performance, please read (1) “Risk Factors” in Part I, Item 1A and (2) “Management’s Discussion and Analysis of Financial Condition and Results of Operations” in Part II, Item 7 of this Annual Report. Should one or more of these known material risks occur, or should the underlying assumptions prove incorrect, our actual results, performance, achievements or plans could differ materially from those expressed or implied in any forward-looking statement.
Readers are cautioned not to place undue reliance on forward-looking statements, which speak only as of the date hereof. We undertake no obligation to publicly update or revise any forward-looking statements after the date they are made, whether as a result of new information, future events or otherwise, except as required by law.
2
Item 1.
Overview of Our Business
C&J Energy Services, Inc., a Delaware corporation (the “Successor” and together with its consolidated subsidiaries for periods subsequent to the Plan Effective Date (as defined below), “C&J” or the “Company”) is a leading provider of well construction, well completion, well support and other complementary oilfield services to oil and gas exploration and production (“E&P”) companies in North America. We offer a comprehensive, vertically-integrated suite of services throughout the life cycle of the well, including hydraulic fracturing, cased-hole wireline and pumpdown, cementing, directional drilling, coiled tubing, service rigs, fluids management and other support services. The Company is headquartered in Houston, Texas and operates in all active onshore basins in the continental United States and Western Canada.
C&J’s business was founded in Texas in 1997 as a partnership and converted to a Delaware corporation (“Old C&J”) in connection with our initial public offering that we completed in July 2011 with a listing on the New York Stock Exchange (“NYSE”) under the symbol “CJES.” In 2015, Old C&J combined with the completion and production services business (the “C&P Business”) of Nabors Industries Ltd. (“Nabors”) in a transformative transaction (referred to herein as the “Nabors Merger”) that nearly tripled the Company’s size, significantly expanding the Company’s Completion Services business and adding the Well Support Services business to the Company’s service offering. Upon the closing of the Nabors Merger, Old C&J became a subsidiary of C&J Energy Services Ltd. (the “Predecessor”) and shares of common stock of Old C&J were converted into common shares of the Predecessor on a 1-for-1 basis.
Due to a severe industry downturn, on July 20, 2016, the Predecessor and certain of its subsidiaries (collectively with the Predecessor, the “Predecessor C&J Companies” and for periods prior to the Plan Effective Date, “C&J” or the “Company”) voluntarily filed petitions for reorganization seeking relief under the provisions of Chapter 11 of the United States Bankruptcy Code (the “Bankruptcy Code”) in the United States Bankruptcy Court for the Southern District of Texas, Houston Division (the "Bankruptcy Court"), with ancillary recognition proceedings filed in Canada and Bermuda (collectively, the “Chapter 11 Proceeding”). Contemporaneously with the commencement of the Chapter 11 Proceeding, trading in the Predecessor’s common shares was suspended and ultimately delisted from the NYSE. On July 21, 2016, the Predecessor’s common shares began trading on the OTC Markets Group Inc.’s (“OTC”) Pink® Open Market under the symbol “CJESQ.”
On December 16, 2016, the Bankruptcy Court entered an order (the “Confirmation Order”) confirming the plan of reorganization (the “Restructuring Plan”) of the Predecessor C&J Companies. On January 6, 2017 (the “Plan Effective Date”), the Predecessor C&J Companies substantially consummated the Restructuring Plan and emerged from the Chapter 11 Proceeding. As part of the transactions undertaken pursuant to the Restructuring Plan, effective on the Plan Effective Date, the Predecessor’s equity was canceled and the Predecessor transferred all of its assets and operations to the Successor. On January 12, 2017, trades in the Successor’s common stock began being reported on the OTC “Grey marketplace” under the symbol “CJJY.” Our common stock has been approved for listing on the NYSE MKT and we expect it to begin trading on the NYSE MKT under the symbol “CJ” on March 6, 2017. We expect that our common stock will continue to trade on the OTC “Grey marketplace” until the close of the market on March 3, 2017.
Upon emergence from the Chapter 11 Proceeding, we adopted Fresh Start accounting in accordance with the provisions set forth in Accounting Standards Codification (“ASC”) 852 - Reorganizations. For more information regarding the adoption of Fresh Start accounting, see Note 4 - Fresh Start Accounting in Part II, Item 8 “Financial Statements and Supplementary Data” of this Annual Report.
The Successor is the successor issuer to the Predecessor for purposes of and pursuant to Rule 12g-3 of the Exchange Act. References to “C&J,” the “Company,” “we,” “us” or “our” in this Annual Report on Form 10-K (this “Annual Report”) are to the Successor, together with our consolidated subsidiaries when referring to periods following the Plan Effective Date, and to the Predecessor C&J Companies when referring to periods prior to the Plan Effective Date.
We file annual, quarterly and current reports and other documents with the U.S. Securities and Exchange Commission (“SEC”) under the Exchange Act. You may read and copy any materials we file with the SEC at the SEC’s Public Reference Room at 100 F Street, NE, Washington, DC 20549. You may obtain information on the operations of the Public Reference Room by calling the SEC at (800) SEC-0330. In addition, the SEC maintains a website at www.sec.gov that contains reports and other information regarding issuers that file electronically with the SEC.
Our principal executive offices are located at 3990 Rogerdale Road, Houston, Texas 77042 and our main telephone number at that address is (713) 325-6000. Our website is available at www.cjenergy.com. We make available free of charge through our website all reports filed with or furnished to the SEC pursuant to Section 13(a) or 15(d) of the Exchange Act,
3
including our Annual Report on Form 10-K, Quarterly Reports on Form 10-Q, Current Reports on Form 8-K, Proxy Statement on Schedule 14A and all amendments to those reports, as soon as reasonably practicable after such material is electronically filed with or furnished to the SEC. Information contained on or available through our website is not a part of or incorporated into this Annual Report or any other report that we may file with or furnish to the SEC.
Our Reportable Business Segments and Strategy
As of December 31, 2016, our reportable business segments were:
• | Completion Services, which consists of the following service lines: (1) hydraulic fracturing; (2) Casedhole Solutions, which includes cased-hole wireline, pumpdown services, wireline logging, perforating, pressure pumping, well site make-up and pressure testing and other complementary services; (3) well construction services, specifically cementing and directional drilling services; and (4) research & technology (R&T), which is primarily engaged in the engineering and production of certain parts and components, such as perforating guns and addressable switches, which are used in the completion process. |
• | Well Support Services, which consists of the following service lines: (1) rig services, including workover and other support services primarily used for routine repair and maintenance of oil and gas wells, re-drilling operations and plugging & abandonment operations; (2) fluids management services, which provides storage, transportation and disposal services for produced fluids and fluids used in the drilling, completion and workover of oil and gas wells; (3) coiled tubing services, primarily used for frac plug drill-out during completion operations and for well workover and maintenance; (4) artificial lift applications; and (5) other well support services. |
• | Other Services, which consists of our smaller, non-core service lines that have either been divested, or are in the process of being divested, including our specialty chemical business (divested in June 2016), equipment manufacturing and repair (initial divestiture in January 2017, and remainder divested in February 2017) and our international coiled tubing operations in the Middle East (operations ceased late 2015, and began winding down in 2016). |
In line with the discontinuance of these small, ancillary service lines and divisions, we now currently manage our business through two operating segments. Accordingly, on a go forward basis beginning with our quarterly report for the period ended March 31, 2017, we will only disclose two reportable segments. Each reportable business segment is described in more detail below; for additional financial information about each of our reportable business segments, including revenue from external customers and total assets by reportable business segment, see Note 14 - Segment Information in Part II, Item 8 “Financial Statements and Supplementary Data” of this Annual Report.
Our core service lines are primarily included in our Completion Services and Well Support Services segments. Operating results in our core service lines are driven primarily by four interrelated, fluctuating variables: (1) the drilling, completion and production activities of our customers, which is in turn primarily driven by oil and natural gas prices and directly affects the demand for our services; (2) the price we are able to charge for our services, which is in turn primarily driven by the level of demand for our services and the supply of equipment capacity in the market; (3) the cost of products and labor involved in providing our services, and our ability to pass those costs on to our customers; and (4) our activity, or “utilization” levels, and service performance.
Management evaluates the performance of our reportable segments primarily based on Adjusted EBITDA because it provides important information to us about the activity and profitability of our service lines within each segment and aids us in analytical comparisons for purposes of, among other things, efficiently allocating our assets and resources. Adjusted EBITDA is a non-GAAP financial measure computed as total earnings before net interest expense, income taxes, depreciation and amortization, other income (expense), net gain or loss on disposal of assets, acquisition-related costs, and certain non-routine items. For additional information about Adjusted EBITDA for each of our reportable business segments, please see Note 14 - Segment Information in Part II, Item 8 "Financial Statements and Supplementary Data" of this Annual Report.
Our operating strategy is focused on maintaining high asset utilization levels to maximize revenue generation while controlling costs to gain a competitive advantage and drive returns. We believe that the quality and efficiency of our service execution and our alignment with customers who recognize the value that C&J provides through efficiency gains are central to our efforts to support utilization and grow our business. Although our management team monitors asset utilization, among other factors, for purposes of assessing our overall activity levels and customer demand, asset utilization cannot be relied on as the sole indicator of our financial and/or operational performance. Furthermore, given the volatile and cyclical nature of
4
activity drivers in the U.S. onshore oilfield services industry, coupled with the varying prices we are able to charge for our services and the cost of providing those services, among other factors, operating margins can fluctuate widely depending on supply and demand at a given point in the cycle, and we therefore do not rely solely on operating margins as an indicator of financial performance. For additional information about factors impacting our business and results of operations, please see “Industry Trends and Outlook” in Part II, Item 7 “Management’s Discussion and Analysis of Financial Condition and Results of Operations” in this Annual Report.
Completion Services
The core services provided through our Completion Services segment are hydraulic fracturing and cased-hole wireline and pumpdown services. We utilize our in-house manufacturing capabilities, including our data acquisition and control instruments business, to offer a technologically advanced and efficiency focused range of completion techniques. Our strategy is to offer our completion services as a bundled package in order to provide an integrated, value-added solution and maximize efficiency for our customers. Our well construction services, specifically cementing and directional drilling services, and our R&T division, which includes manufacturing capabilities, are also managed through our Completions Services segment.
Hydraulic Fracturing. Our fleet of approximately 820,000 hydraulic horsepower (“HHP”) is capable of handling the most technically demanding well completions in conventional and unconventional high-pressure formations. We leverage our R&T capabilities to provide customers with a more efficiently and effectively engineered frac designs, refracturing and other reservoir stimulation services that help regain production and increase well recovery. We also can provide our services using smaller frac fleets in response to customer demand for vertical fracs and restimulation services.
Casedhole Wireline and Pumpdown Services. Through our cased-hole wireline and pumpdown services line, we are one of the leading providers of perforating, pumpdown, pipe recovery, pressure pumping, and wellsite make-up and pressure testing services. We operate and maintain 127 wireline trucks and 57 pumpdown units in order to provide these services to our customers. We are highly experienced in safely servicing deep, high-pressure, high-temperature wells in some of the most active onshore basins in the United States, and provide premium perforating services for both wireline and tubing-conveyed applications. Our in-house manufacturing capabilities through our R&T division allow us to manage costs and lead times with regard to hardware and perforating charges, providing us with a competitive advantage and allowing us to achieve high returns. We believe we are one of the most efficient providers of perforating services, and as such we are able to command a market premium for these services.
Cementing. Our cementing service line consists of 36 units operating in the Permian Basin and Northeast producing basins, each of which is equipped with full-service laboratory capabilities. Since acquiring this business in March 2015, we have been recognized as a leading provider in customer satisfaction surveys for both 2015 and 2016.
Not all of these assets are utilized fully or at all at any time, due to, among other things, routine scheduled maintenance and downtime. Additionally, throughout 2016, in response to the challenging market conditions, we focused on various operational rightsizing measures to better align our assets with industry demand, which primarily included stacking or idling unproductive equipment and closing or consolidating facilities across our asset base within each business line. Going forward, we would expect certain rightsizing measures from 2016 to help us moderate select cost inflation even as the market continues to improve and we enter equipment back into service in 2017 and beyond.
The majority of revenue for this segment is generated by our hydraulic fracturing service line, and we consider our hydraulic fracturing service line and cased-hole wireline and pumpdown services line to be our core service lines within this reportable business segment.
For the year ended December 31, 2016, revenue from our Completion Services segment was $544.0 million, representing approximately 56.0% of our total revenue, with net loss of $253.8 million and Adjusted EBITDA of $(39.6) million.
Well Support Services
Our Well Support Services segment focuses on post-completion activities at the well site, and includes rig services, including workover, plugging and abandonment, fluids management, coiled tubing, artificial lift applications and other specialized well site services.
5
Rig Services. As part of our services that help prolong the productive life of an oil or gas well, we operate the second largest fleet in North America, consisting of 459 workover and well servicing rigs throughout the continental U.S. and Western Canada. These rigs range from 150 to 900 horsepower and are involved in the routine repair and maintenance of oil and gas wells, re-drilling operations and plugging and abandonment operations. Workover services can include deepening or extending wellbores into new formations by drilling horizontal or lateral wellbores, sealing off depleted production zones and accessing previously bypassed production zones, converting former production wells into injection wells for enhanced recovery operations and conducting major subsurface repairs due to equipment failures. Workover services may last from a few days to several weeks, depending on the complexity of the workover. Maintenance services provided with our rig fleet are generally required throughout the life cycle of an oil or gas well. Examples of these maintenance services include routine mechanical repairs to the pumps, tubing and other equipment, removing debris and formation material from wellbores, and pulling rods and other downhole equipment from wellbores to identify and resolve production problems. Maintenance services are generally less complicated than completion and workover related services and require less time to perform. Our rig fleet is also used in the process of permanently shutting-in oil or gas wells that are at the end of their productive lives. These plugging and abandonment services generally require auxiliary equipment in addition to a well servicing rig. The demand for plugging and abandonment services is not significantly impacted by the demand for oil and gas because well operators are required by state regulations to plug wells that are no longer productive.
Fluids Management. We provide a full range of fluid services, including the storage, transportation and disposal of various fluids used in the drilling, completion and workover of oil and gas wells utilizing a service fleet of 1,121 fluid trucks and trailers and 4,243 portable tanks. This large fleet of trucks and trailers and portable tanks enable us to rapidly deploy our equipment across a broad geographic area. Included in our fleet of fluid trucks and trailers are over 70 specialized trucks and trailers that are optimized to transport condensate. We also own 29 private salt water disposal wells. Demand and pricing for our fluids management services generally correspond to demand for our rig services.
Coiled Tubing. We offer a complete range of coiled tubing services to help customers accomplish a wide variety of goals in their horizontal completion, workover and well maintenance projects. We operate a fleet of 44 coiled tubing units. Approximately 70 percent of our coiled tubing fleet consists of large diameter coil, meaning two inches or larger in diameter, which allows us to service wells with longer lateral lengths. Our coiled tubing services allow customers to complete projects quickly and safely across a wide spectrum of pressures, without having to shut in their wells.
We also provide artificial lift applications and other specialty well site support services.
The majority of revenue for this segment is generated by our rig services line, and we consider our rig services line, fluids management service line and coiled tubing service line to be our core service lines within this reportable business segment.
For the year ended December 31, 2016, revenue from our Well Support Services segment was $419.6 million, representing approximately 43.2% of our total revenue, with net loss of $426.7 million and Adjusted EBITDA of $17.5 million.
Other Services
Our Other Services segment consists of our smaller, non-core service lines that have either been divested, or are in the process of being divested, including our specialty chemical business (divested in June 2016), equipment manufacturing and repair (initial divestiture in January 2017, and remainder divested February 2017) and our international coiled tubing operations in the Middle East (operations ceased late 2015, and began winding down in 2016).
Our Other Services segment contributed $7.6 million of revenue for the year ended December 31, 2016, representing approximately 0.8% of our total revenue, with net loss of $58.8 million and Adjusted EBITDA of $(5.8) million.
Other Information About Our Business
Geographic Areas
We operate in all active onshore basins in the continental United States and Western Canada. During the year ended December 31, 2016, approximately $933.6 million, or 96.1%, of our consolidated revenue from external customers was derived from the United States, and the majority of our long lived assets were located in the United States. We also generated approximately $37.1 million, or 3.8%, of our 2016 consolidated revenue from rig services operations in Canada and approximately $0.4 million, or less than 0.1%, of our 2016 consolidated revenue from our artificial lift applications business in Ecuador and the Middle East.
6
From late 2011 through mid-2016, we worked to establish an operational presence in key countries in the Middle East, and opened offices in Dubai, Saudi Arabia and Oman. We were successful in winning a short-term contract to provide coiled tubing services in Saudi Arabia, which we completed in September 2015. However, we were not successful in winning any other work in Saudi Arabia or elsewhere in the region. Given the Company’s financial position and the severe industry downturn, coupled with changes in the Company’s executive management team with a resulting shift in short- and long-term growth strategy, in mid-2016 we re-evaluated our business plan with respect to international expansion generally, and the Middle East specifically. We determined that it was appropriate to significantly scale back our investment in this area to preserve liquidity and focus on the advancement of our core business in the United States. We are in the process of unwinding our footprint in the region, including selling assets and excess inventory to other operators in the region. The only business line we are currently offering in the Middle East is our artificial lift systems.
Seasonality
Our operations are subject to seasonal factors and our overall financial results reflect the seasonal variations that impact activity in our core business lines. Specifically, we typically have experienced a pause by our customers around the holiday season in the fourth quarter, which may be compounded as our customers exhaust their annual capital spending budgets towards year end. Additionally, our operations are directly affected by weather conditions. During the winter months our customers may delay operations or we may not be able to operate or move our equipment between locations during periods of heavy snow, ice or rain, and during the spring some areas impose transportation restrictions due to the muddy conditions caused by the spring thaws. During the summer months, our operations may be impacted by tropical weather systems.
Sales and Marketing
Sales of our Completion Services and Well Support Services are primarily generated by the efforts of our sales force. In our core business lines of hydraulic fracturing and rig services, these services are typically contracted well in advance for relatively long duration engagements, which results in sales backlogs that could be as long as several months during periods of high demand for our services. The remainder of our core business lines tends to be call-out type work and typically have no, or very limited, backlogs of sales.
Sales and marketing activities are typically performed through our local operations in each geographic region, with the exception of hydraulic fracturing, which is centralized to a specific sales team at the corporate level. For our other core business lines, we believe our local field sales personnel have a strong understanding of region-specific issues and customer operating procedures and, therefore, can effectively target marketing activities. We also have multiple corporate sales representatives that supplement our field sales efforts and focus on large accounts and selling technical services. Our sales representatives collaborate with our legal team to identify customer contracting needs in advance of potential operations, which we believe streamlines our customer onboarding process. Our sales representatives work closely with our local managers and field sales personnel to target compelling market opportunities. We facilitate teamwork among our sales representatives by basing a portion of their compensation on aggregate company sales targets rather than individual sales targets. We believe this emphasis on teamwork enables us to better serve our existing customers and will also allow us to further expand our customer base.
Customers
We serve a diverse group of independent and major national oil and gas companies that are active in our core areas of operations across the continental United States and in Western Canada. We monitor closely the financial condition of our customers, their capital expenditure plans and other indications of their drilling, completion and production services activity. In particular, we seek to identify distressed customers and apply what we believe to be appropriate business and legal measures to protect us from any defaults or failures to pay.
Our top ten customers accounted for approximately 46.0%, 53.6% and 51.1% of our consolidated revenue for the years ended December 31, 2016, 2015 and 2014, respectively. There were no individual customers that accounted for more than 10.0% of our consolidated revenues during the year ended December 31, 2016. For the year ended December 31, 2015, revenue from Oxy USA, Inc. represented 15.5% of our consolidated revenue. For the year ended December 31, 2014, revenue from Anadarko Petroleum Corporation individually represented 16.4% of our consolidated revenue. Other than those listed above, no other customer accounted for more than 10.0% of our consolidated revenue in 2016, 2015 or 2014. If we were to lose any material customer, we may not be able to redeploy our equipment at similar utilization or pricing levels and such loss could have an adverse effect on our business until the equipment is redeployed at similar utilization or pricing levels.
Competition
7
We operate in highly competitive areas of the oilfield services industry with significant potential for excess capacity. Completion and well servicing equipment can be moved from one region to another in response to changes in levels of activity and market conditions, which may result in an oversupply of such equipment in any particular area. Utilization and pricing for our services have in the past been negatively affected by increases in supply relative to demand in our core operating areas and geographic markets.
Additionally, the demand for our services depends primarily on the level of spending by oil and gas companies for drilling, completion and production activities, which is affected by short-term and long-term trends in oil and natural gas prices and numerous other factors over which we have no control. Severe declines and sustained weakness and volatility in commodity prices over the course of 2015, and for most of 2016, and the consequent negative impact on the level of drilling, completion and production activity and capital expenditures by our customers, adversely affected the demand for our services. This, in turn, negatively impacted our ability to maintain adequate utilization of our asset base and negotiate pricing at levels generating sufficient margins.
Our revenues and earnings are directly affected by changes in utilization and pricing levels for our services, which fluctuate in direct response to changes in the level of drilling, completion and production activity by our customers. Pressure on pricing for our services, including due to competition and industry and/or economic conditions, may impact, among other things, our ability to maintain utilization and profitability. During periods of declining pricing for our services, we may not be able to reduce our costs accordingly, which could further adversely affect our results. Furthermore, even when we are able to increase our prices, we may not be able to do so at a rate that is sufficient to offset any rising costs. Also, we may not be able to successfully increase prices without adversely affecting our utilization levels. The inability to maintain our utilization and pricing levels, or to increase our prices as costs increase, could have a material adverse effect on our business, financial position and results of operations.
Our competitors include many large and small energy service companies, including some of the largest integrated oilfield services companies that possess substantially greater financial and other resources than we do. Our larger competitors’ greater resources could allow them to compete more effectively than we can, including by reducing prices for services in our core operating areas. Our major competitors for our Completion Services include Halliburton, Schlumberger, Keane Group, RPC, Inc., FTS International, Inc. (formerly known as Frac Tech Services), Basic Energy Services, Superior Energy Services, CalFrac Well Services, a significant number of regional, mostly-private businesses, and to a smaller extent, both Weatherford International and Baker Hughes, both of which have recently announced plans to exit the hydraulic fracturing business. Our major competitors for our Well Support Services include Key Energy Services, Basic Energy Services, Superior Energy Services, Precision, Forbes and Pioneer Energy Services, as well as a significant number of mostly-private, regional businesses.
Generally, we believe that the principal competitive factors in the markets that we serve are price, technical expertise, equipment capacity, work force capability, safety record, reputation and experience. Although we believe our customers consider all of these factors, price is often the primary factor in determining which service provider is awarded work, particularly during times of weak commodity prices such as those we experienced from late 2014 through mid-2016. Throughout this severe, prolonged downturn for our industry, our customer base demonstrated a more intense focus and placed a higher priority on receiving the lowest service cost pricing possible. Additionally, projects for certain of our core service lines are often awarded on a bid basis, which tends to further increase competition based primarily on price. During this downturn, our utilization and pricing levels were also negatively impacted by predatory pricing from certain large competitors, who elected to operate at negative margins for these services. During healthier market conditions, we believe many of our customers choose to work with us based on the safety, performance and quality of our crews, equipment and services, although even then, we must be competitive in our pricing. We seek to differentiate ourselves from our major competitors by our operating philosophy, which is focused on delivering the highest quality customer service and equipment, coupled with superior execution and operating efficiency. As part of this strategy, we target high volume, high efficiency customers with service intensive, 24-hour work, which is where we believe we can differentiate our services from our competitors.
See Part II, Item 7 “Management’s Discussion and Analysis of Financial Condition and Results of Operations - Industry Trends and Outlook” for additional discussion of the market challenges within our industry.
Research & Technology, Intellectual Property
Over the last several years we have significantly invested in technological advancement, including the development of a state-of-the-art research and technology center staffed by a team of highly skilled engineers focused on developing innovative, fit-for-purpose solutions designed to enhance our service offerings, increase efficiencies, provide cost savings to our operations and add value for our customers. We believe that one of the strategic benefits of this business line is the ability to develop and implement new technologies and respond to changes in customer requirements and industry demand. Several of
8
our research and technology initiatives are generating monthly cost savings for our completion services operations, which is central to our overall strategy of proactively managing our costs to maximize returns. Additionally, several of these investments are delivering value-added products and services that, in addition to producing revenue, are generating demand from key customers. We believe these capabilities can provide a competitive advantage as customers look for innovative means for extracting oil and gas in the most economical and efficient way possible. However, as with our other service lines, over the last year we have been forced to implement meaningful cost reductions that significantly scaled back the size and resources of this business line.
We seek patent and trademark protections for our technology when we deem it prudent, and we aggressively pursue protection of these rights. We believe our patents and trademarks are adequate for the conduct of our business and that no single patent or trademark is critical to our business. We also rely, to a significant extent, on the technical expertise and know-how of our personnel to maintain our competitive position.
See Part II, Item 7 “Management’s Discussion and Analysis of Financial Condition and Results of Operations - Results of Operations” for additional detail as to our investment in technological advancement.
Suppliers
We purchase raw materials (such as proppant, guar, acid, chemicals, completion fluids and coiled tubing strings) and finished products (such as fluid-handling equipment) used in our Completion Services segment and certain raw materials and finished products used in our Well Support Services segment from various third-party suppliers.
We are not materially dependent on any single supply source for these materials or products and we believe that we would be able to make satisfactory alternative arrangements in the event of any interruption in the supply of these materials and/or products by one of our suppliers. However, if alternative sources of supply are unavailable and we are unable to purchase the necessary materials and/or products needed for our business in a timely manner and in the quantities required, we may be delayed in providing our services, which could have a material adverse effect on our business, financial condition, results of operations and cash flows. For example, in the past, our industry has faced sporadic guar and proppant shortages and trucking shortages associated with hydraulic fracturing operations requiring work stoppages, which adversely impacted the operating results of several of our competitors. Additionally, increasing costs of certain raw materials, such as guar, may negatively impact demand for our services or the profitability of our business operations.
During the year ended December 31, 2016, Unimin Corporation and U.S. Silica Company supplied 8.4% and 5.2%, respectively, of the materials and/or products used in our Completion Services segment; but no single third party supplier supplied 5.0% or more of the materials and/or products used in our Well Support Services segment. Additionally, with respect to our Completion Services segment, as part of our financial restructuring we rejected all of our take or pay contracts for proppant and chemicals, which enabled us to negotiate two new proppant contracts covering approximately 80.0% of our forecasted volume needs for 2017 and beyond. In conjunction with the sale of our manufacturing business line, we also entered into a preferred supply agreement with a third party to supply us with components and finished goods to repair and refurbish certain of our stacked hydraulic fracturing equipment.
Quality, Health, Safety and Environmental (“QHSE”) Program
Our business involves the operation of heavy and powerful equipment which can result in serious injuries to our employees and third parties and substantial damage to property. We commit substantial resources toward employee safety and QHSE management training programs, as well as our extensive employee review process. We have comprehensive QHSE-focused training programs designed to minimize accidents in the workplace and improve the efficiency of our operations. We believe that our QHSE policies and procedures, which are reviewed internally for compliance with industry changes, provide a solid framework to ensure our operations minimize the hazards inherent in our work and meet regulatory requirements and customer demands. Further, we have developed our own QHSE management system to help ensure compliance with our procedures and processes in an effort to drive continuous improvement. Our reputation and proven safety record has allowed us to earn work certification from several industry leaders that we believe have some of the most demanding safety requirements, including ConocoPhillips, ExxonMobil, Chevron and Royal Dutch Shell.
Our record and reputation for safety is important to all aspects of our business. In the oilfield services industry, a critical competitive factor in establishing and maintaining long-term customer relationships is having an experienced, skilled and well-trained work force. In recent years, many of our larger customers have placed an added emphasis on the safety records and quality management systems of their contractors. We strive to meet or exceed the safety and quality management
9
requirements of our customers, and we believe our continued focus on safety will gain even further importance to our customers as the market improves.
Risk Management and Insurance
Our operations are subject to hazards inherent in the oil and gas industry, including blowouts, explosions, cratering, fires, oil spills, surface and underground pollution and contamination, hazardous material spills, loss of well control, loss of or damage to the wellbore, formation or underground reservoir, damaged or lost equipment, and damage or loss from inclement weather or natural disasters. Any of these hazards could result in personal injury or death, damage to or destruction of equipment and facilities, loss of oil and natural gas production, suspension of operations, environmental and natural resources damage and damage to the property of others. Additionally, because our business involves the transportation of heavy equipment and materials, we may also experience traffic accidents which may result in personal injury or death, damage to or destruction of equipment and the property of others and hazardous material spills. If a serious accident were to occur involving our employees, equipment and/or services, it could result in C&J being named as a defendant in lawsuits asserting large claims for damages.
Despite our efforts to maintain high safety standards, we from time to time have suffered accidents, and it is likely that we will experience accidents in the future. In addition to the property and personal losses from these accidents, the frequency and severity of these incidents affect our operating costs and insurability, and our relationship with customers, employees and regulatory agencies. Any significant increase in the frequency or severity of these incidents, or the general level of compensatory payments, could adversely affect the cost of, or our ability to obtain, workers’ compensation and other forms of insurance, and could have other material adverse effects on our financial condition and results of operations.
We maintain insurance policies for workers’ compensation, automobile liability, general liability, which also includes sudden and accidental pollution insurance, and property damage relating to catastrophic events, together with excess loss liability coverage. These insurance policies carry self-insured retention limits or deductibles on a per occurrence basis. We have deductibles per occurrence for: workers’ compensation of $1,000,000; automobile liability claims of $1,000,000; general liability claims, including sudden and accidental pollution claims, of $250,000, plus an additional annual aggregate deductible of $250,000; and property damage for catastrophic events of $25,000. The excess loss liability coverage is subject to a self-insured retention of $5,000,000 for each occurrence and in the aggregate.
With respect to the C&P Business that we acquired from Nabors in the Nabors Merger, and as a result of the settlement agreement negotiated with Nabors in connection the Chapter 11 Proceeding, we assumed, among other liabilities, all liabilities of the C&P Business to the extent arising out of or resulting from the operation of the C&P Business at any time before, at or after the closing of the Nabors Merger, including liability for death, personal injury and property damage resulting from or caused by the assets, products and services of the C&P Business; other than those liabilities specifically identified in the settlement agreement, as incorporated into the Restructuring Plan, for which Nabors maintains a continuing indemnification obligation.
As discussed below, our Master Service Agreements (“MSAs”) with our customers generally provide, among other things, that our customers generally assume (without regard to fault) liability for underground pollution and pollution emanating from the wellbore as a result of an explosion, fire or blowout. We retain the risk for any liability not indemnified by our customers in excess of our insurance coverage. Our insurance coverage may be inadequate to cover our liabilities. In addition, we may not be able to maintain adequate insurance in the future at rates we consider reasonable and commercially justifiable or on terms as favorable as our current arrangements.
We seek to enter into MSAs with each of our customers before providing any services. Our sales and operations teams work closely with our legal team to identify and prioritize MSAs for negotiation, which we believe increases the efficiency of our risk management efforts. These MSAs delineate our and our customers’ respective warranty and indemnification obligations with respect to the services we provide. With respect to warranty issues, our MSAs typically provide that our obligations are limited to replacing any defective good or services, or in the alternative, providing the customer with a refund. Our MSAs typically provide for knock-for-knock indemnification for all losses, which means that we and our customers assume (without regard to fault) liability for damages to our respective personnel and property. For catastrophic losses, our MSAs generally include industry-standard carve-outs from the knock-for-knock indemnities, pursuant to which our customers (typically the exploration and production company) assume (without regard to fault) liability for (i) damage to the well bore, including the cost to re-drill; (ii) damage to the formation, underground strata and the reservoir; (iii) damages or claims arising from loss of control of a well or a blowout; and (iv) allegations of subsurface trespass. Additionally, our MSAs often provide carve-outs to the “without regard to fault” concept that would permit, for example, us to be held responsible for events of catastrophic loss only if they arise as a result of our gross negligence or willful misconduct. Our MSAs typically
10
provide for industry-standard pollution indemnities, pursuant to which we assume liability for surface pollution associated with our equipment and originating above the surface (without regard to fault), and our customer assumes (without regard to fault) liability arising from all other pollution, including, without limitation, underground pollution and pollution emanating from the wellbore as a result of an explosion, fire or blowout. In certain circumstances, we agree to exceptions from our MSAs’ catastrophic loss and pollution indemnities to the extent incidents arise from our gross negligence or willful misconduct.
The description of insurance policies set forth above is a summary of certain material terms of our insurance policies currently in effect and may change in the future as a result of market and/or other conditions. Similarly, the summary of MSAs set forth above is a summary of the material terms of the typical MSA that we have in place and does not reflect every MSA that we have entered into or may enter into in the future, some of which may contain indemnity structures and risk allocations between our customers and us that are different than those described here.
Employees
As of February 24, 2017, we have 5,261 employees. The delivery of our services requires personnel with specialized skills and experience who can perform physically demanding work. Subject to industry and local market conditions, the additional crew members needed for our core service lines in our Completion Services and Well Support Services segments are generally available for hire on relatively short notice.
Due to the severe deterioration in market conditions over the course of 2015 and through mid-2016, we significantly reduced our headcount as part of our continuing effort to align our business with the prolonged industry downturn and resulting reduction in demand for our services. During the latter part of the third quarter of 2016, the market conditions began to improve, as commodity prices appeared to stabilize and customers began to increase drilling activity. We are actively monitoring demand for our services and will seek to hire additional employees as needed to take advantage of available opportunities.
Our employees are not represented by any labor unions or covered by collective bargaining agreements. We consider our relations with our employees to be generally good.
Government Regulations and Environmental, Health and Safety Matters
We are significantly affected by stringent and complex federal, state and local laws and regulations, including those governing worker health and safety, motor carrier operations, the transportation of explosives, the use, management and disposal of certain radioactive materials, the handling of hazardous materials and the emission or discharge of substances into the environment or otherwise relating to environmental protection. Regulations concerning equipment certification create an ongoing need for regular maintenance, which is incorporated into our daily operating procedures. The regulatory burden on the industry increases the cost of doing business and consequently affects profitability. Any failure by us to comply with such local, state and federal laws and regulations may result in governmental authorities taking actions against our business that could adversely impact our operations and financial condition, including the following:
• | issuance of administrative, civil and criminal penalties; |
• | modification, denial or revocation of permits or other authorizations; |
• | imposition of limitations on our operations through injunctions or other governmental actions; and |
• | performance of site investigatory, remedial or other corrective actions. |
Worker Health and Safety
We are subject to the requirements of the federal Occupational Safety and Health Act (“OSHA”), and comparable state statutes that regulate the protection of the health and safety of workers. In December 2015, the U.S. Departments of Justice and Labor announced a plan to more frequently and effectively prosecute worker health and safety violations, including enhanced penalties. In addition, the OSHA hazard communication standard requires that information be maintained about hazardous materials used or produced in operations and that this information be provided to employees, state and local government authorities and the public.
Motor Carrier Operations
11
Among the services we provide, we operate as a motor carrier and therefore are subject to regulation by the United States Department of Transportation (“DOT”) and various state agencies. These regulatory authorities exercise broad powers, governing activities such as the authorization to engage in motor carrier operations; regulatory safety; hazardous materials labeling, placarding and marking; financial reporting; and certain mergers, consolidations and acquisitions. There are additional regulations specifically relating to the trucking industry, including testing and specification of equipment and product handling requirements. The trucking industry is subject to possible regulatory and legislative changes that may affect the economics of the industry by requiring changes in operating practices or by changing the demand for common or contract carrier services or the cost of providing truckload services. Some of these possible changes include increasingly stringent environmental regulations, changes in the hours of service regulations which govern the amount of time a driver may drive in any specific period and requiring onboard black box recorder devices or limits on vehicle weight and size. For example, in December 2016, the DOT finalized minimum training standards for new drivers seeking a commercial driver’s license. Certain motor vehicle operators are required to register with the DOT. This registration requires an acceptable operating record. The DOT periodically conducts compliance reviews and may revoke registration privileges based on certain safety performance criteria, and a revocation could result in a suspension of operations. Since 2010, the DOT has pursued its Compliance, Safety, Accountability (“CSA”) program, in an effort to improve commercial truck and bus safety. A component of CSA is the Safety Measurement System (“SMS”), which analyzes all safety violations recorded by federal and state law enforcement personnel to determine a carrier’s safety performance. The SMS is intended to allow DOT to identify carriers with safety issues and intervene to address those problems. However, in January 2016 the DOT proposed its Safety Determination rule, which would alter the DOT's methodology for determining when a motor carrier is unfit to operate a commercial motor vehicle. A final rule remains pending, and, at this time, we cannot predict whether the rule will be adopted as proposed nor the effect such a revision may have on our safety rating.
Interstate motor carrier operations are subject to safety requirements prescribed by DOT. To a large degree, intrastate motor carrier operations are subject to safety regulations that mirror federal regulations. Such matters as weight and dimension of equipment are also subject to federal and state regulations. DOT regulations also mandate drug testing of drivers. From time to time, various legislative proposals are introduced, including proposals to increase federal, state or local taxes, including taxes on motor fuels, which may increase our costs or adversely impact the recruitment of drivers. We cannot predict whether, or in what form, any increase in such taxes applicable to us will be enacted.
Radioactive Materials
In addition, some of our operations utilize equipment that contains sealed, low-grade radioactive sources. Our activities involving the use of radioactive materials are regulated by the United States Nuclear Regulatory Commission (“NRC”) and state regulatory agencies under agreement with the NRC. Standards implemented by these regulatory agencies require us to obtain licenses or other approvals for the use of such radioactive materials. We believe that we have obtained these licenses and approvals as necessary and applicable. Numerous governmental agencies issue regulations to implement and enforce these laws, for which compliance is often costly and difficult. The violation of these laws and regulations may result in the denial or revocation of permits, issuance of corrective action orders, injunctions prohibiting some or all of our operations, assessment of administrative and civil penalties, and even criminal prosecution.
Hazardous Substances
We generate wastes, including hazardous wastes, which are subject to the federal Resource Conservation and Recovery Act (“RCRA”), and comparable state statutes. The U.S. Environmental Protection Agency (“EPA”), the NRC, and state agencies have limited the approved methods of disposal for some types of hazardous and nonhazardous wastes. RCRA currently excludes drilling fluids, produced waters and certain other wastes associated with the exploration, development or production of oil and natural gas from regulation as “hazardous waste.” Disposal of such non-hazardous oil and natural gas exploration, development and production wastes is usually regulated by state law. Other wastes handled at exploration and production sites or generated in the course of providing well services may not fall within this exclusion. Moreover, stricter standards for waste handling and disposal may be imposed on the oil and natural gas industry in the future. For example, in December 2016, the EPA and environmental groups entered into a consent decree to address EPA’s alleged failure to timely assess its RCRA Subtitle D criteria regulations exempting certain exploration and production related oil and gas wastes from regulation as hazardous wastes under RCRA. The consent decree requires EPA to propose a rulemaking no later than March 15, 2019 for revision of certain Subtitle D criteria regulations pertaining to oil and gas wastes or to sign a determination that revision of the regulations is not necessary. Removal of RCRA’s exemption for exploration and production wastes has the potential to significantly increase waste disposal costs, which in turn will result in increased operating costs and could adversely impact our business and results of operations. The impact of future revisions to environmental laws and regulations cannot be predicted. Additionally, Naturally Occurring Radioactive Materials (“NORM”) may contaminate extraction and processing equipment used in the oil and natural gas industry. The waste resulting from such contamination is regulated by
12
federal and state laws. Standards have been developed for: worker protection; treatment, storage, and disposal of NORM and NORM waste; management of NORM-contaminated waste piles, containers and tanks; and limitations on the relinquishment of NORM contaminated land for unrestricted use under RCRA and state laws. It is possible that we may incur costs or liabilities associated with elevated levels of NORM.
The Federal Comprehensive Environmental Response, Compensation, and Liability Act (“CERCLA” or the “Superfund” law), and comparable state statutes impose liability, without regard to fault or legality of the original conduct, on classes of persons that are considered to have contributed to the release of a hazardous substance into the environment. Such classes of persons include the current and past owners or operators of sites where a hazardous substance was released, and companies that disposed or arranged for disposal of hazardous substances at off-site locations such as landfills. Under CERCLA, these persons may be subject to strict, joint and several liability for the costs of cleaning up the hazardous substances that have been released into the environment and for damages to natural resources, and it is not uncommon for neighboring landowners and other third parties to file claims for personal injury and property damage allegedly caused by the hazardous substances released into the environment. We currently own, lease, or operate numerous properties and facilities that for many years have been used for industrial activities, including oil and natural gas related operations. Hazardous substances, wastes, or hydrocarbons may have been released on or under the properties owned or leased by us, or on or under other locations where such substances have been taken for recycling or disposal. In addition, some of these properties have been operated by third parties or by previous owners whose treatment and disposal or release of hazardous substances, wastes, or hydrocarbons, was not under our control. These properties and the substances disposed or released on them may be subject to CERCLA, RCRA and analogous state laws. Under such laws, we could be required to remove previously disposed substances and wastes and remediate contaminated property (including groundwater contamination) ,including instances where the prior owner or operator caused the contamination, or perform remedial plugging of disposal wells or waste pit closure operations to prevent future contamination. These laws and regulations may also expose us to liability for our acts that were in compliance with applicable laws at the time the acts were performed.
Water Discharges
The Federal Water Pollution Control Act (the “Clean Water Act”), and comparable state statutes impose restrictions and strict controls regarding the discharge of pollutants into state waters or waters of the United States. The discharge of pollutants into jurisdictional waters is prohibited unless the discharge is permitted by the EPA or applicable state agencies. The Clean Water Act also prohibits the discharge of dredge and fill material into regulated waters, including jurisdictional wetlands, unless authorized by an appropriately issued permit. In September 2015, the EPA and U.S. Army Corps of Engineers (the “Corps”) issued a new rule defining the scope of the EPA’s and the Corps’ jurisdiction over wetlands and other waters. To the extent the rule expands the range of properties subject to the Clean Water Act’s jurisdiction, we could face increased costs and delays with respect to obtaining permits for dredge and fill activities in wetland areas. The rule has been challenged in court on the grounds that it unlawfully expands the reach of Clean Water Act programs, and, as of October 2015, implementation of the rule has been stayed pending resolution of the court challenge. The process for obtaining permits has the potential to delay the development of natural gas and oil projects. Also, spill prevention, control and countermeasure regulations under federal law require appropriate containment berms and similar structures to help prevent the contamination of navigable waters in the event of a petroleum hydrocarbon tank spill, rupture or leak.
In addition, the Clean Water Act and analogous state laws require individual permits or coverage under general permits for discharges of storm water runoff from certain types of facilities. Moreover, the Oil Pollution Act of 1990 (“OPA”) imposes a variety of requirements on responsible parties related to the prevention of oil spills and liability for damages, including natural resource damages, resulting from such spills in waters of the United States. A responsible party includes the owner or operator of an onshore facility. The Clean Water Act and analogous state laws provide for administrative, civil and criminal penalties for unauthorized discharges and, together with the OPA, impose rigorous requirements for spill prevention and response planning, as well as substantial potential liability for the costs of removal, remediation, and damages in connection with any unauthorized discharges.
The Safe Water Drinking Act (“SDWA”) regulates the underground injection of substances through the Underground Injection Control (“UIC”) program. Hydraulic fracturing generally is exempt from regulation under the UIC program, and the hydraulic fracturing process is typically regulated by state oil and gas commissions. However, the EPA has asserted that hydraulic fracturing with fluids containing diesel fuel is subject to regulation under the UIC program. In addition, in response to recent seismic events near underground injection wells used for the disposal of oil and gas-related wastewater, federal and some state agencies have begun investigating whether such wells have caused increased seismic activity, and some states have imposed volumetric injection limits, shut down or imposed moratorium on the use of such injection wells. If new regulatory initiatives are implemented that restrict or prohibit the use of underground injection wells in areas where we rely
13
upon the use of such wells in our operations, our costs to operate may significantly increase and our ability to perform services may be delayed or limited, which could have an adverse effect on our results of operations and financial position.
Air Emissions
Some of our operations also result in emissions of regulated air pollutants. The federal Clean Air Act (“CAA”) and analogous state laws require permits for certain facilities that have the potential to emit substances into the atmosphere that could adversely affect environmental quality. These laws and their implementing regulations also impose generally applicable limitations on air emissions and require adherence to maintenance, work practice, reporting and record keeping, and other requirements. Failure to obtain a permit or to comply with permit or other regulatory requirements could result in the imposition of substantial administrative, civil and even criminal penalties. In addition, we or our customers could be required to shut down or retrofit existing equipment, leading to additional expenses and operational delays.
Many of these regulatory requirements, including New Source Performance Standards (“NSPS”) and Maximum Achievable Control Technology (“MACT”) standards are expected to be made more stringent over time as a result of stricter ambient air quality standards and other air quality protection goals adopted by the EPA. For example, in October 2015, the EPA lowered the National Ambient Air Quality Standard, (“NAAQS”) for ozone from 75 to 70 parts per billion for both the 8-hour primary and secondary standards. State implementation of the revised NAAQS could result in stricter permitting requirements, delay or prohibit our ability to obtain such permits, and result in increased expenditures for pollution control equipment, the costs of which could be significant. In addition, in 2012, the EPA issued federal regulations requiring the reduction of volatile organic compound (“VOC”) emissions from certain fractured and refractured natural gas wells for which well completion operations are conducted and further requiring that most wells use reduced emission completions, also known as “green completions.” These regulations also establish specific new requirements regarding emissions from production related wet seal and reciprocating compressors, and from pneumatic controllers and storage vessels.
Compliance with these and other air pollution control and permitting requirements has the potential to delay the development of oil and natural gas projects and increase costs for us and our customers. Although we do not believe our operations will be materially adversely affected by these requirements, our business could be materially affected if our customers’ operations are significantly affected by these or other similar requirements. These requirements could increase the cost of doing business for us and our customers, reduce the demand for the oil and gas our customers produce, and thus have an adverse effect on the demand for our products and services.
Climate Change
More stringent laws and regulations relating to climate change may be adopted in the future and could cause us to incur additional operating costs or reduce the demand for our services. The EPA has determined that emissions of carbon dioxide, methane, and other greenhouse gases (“GHGs”) present an endangerment to the environment because emissions of such gases are, according to the EPA, contributing to the warming of the earth’s atmosphere and other climatic changes. Based on these findings, EPA has adopted regulations that restrict emissions of GHGs under existing provisions of the CAA, including rules that require preconstruction and operating permit reviews for GHG emissions from certain large stationary sources. The EPA has also adopted rules requiring the monitoring and reporting of GHG emissions from specified GHG sources, including, among others, certain oil and natural gas production facilities, on an annual basis. More recently, in June 2016, the EPA issued final rules that establish new air emission controls for emissions of methane from certain equipment and processes in the oil and natural gas source category, including production, processing transmission and storage activities. The EPA’s final rule package includes first-time standards to address emissions of methane from equipment and processes across the source category, including hydraulically fractured oil and natural gas well completions. The Bureau of Land Management (“BLM”) also finalized similar rules in November 2016 which seek to limit methane emissions from new and existing oil and gas operations on federal lands through limitations on the venting and flaring of gas, as well as enhanced leak detection and repair requirements for certain equipment and processes. However, both the U.S. House of Representatives and the Senate have introduced resolutions seeking to repeal the BLM methane rules under the Congressional Review Act and future implementation of the BLM methane rules is uncertain. In any event, both the EPA and BLM methane rules impose substantially similar requirements. We do not believe our operations are currently subject to these requirements, but our business could be affected if our customers’ operations become subject to these or other similar requirements. Moreover, these requirements could increase the cost of doing business for us and our customers, reduce the demand for the oil and gas our customers produce, and thus have a material adverse effect on the demand for our products and services.
In addition, Congress has from time to time considered legislation to reduce emissions of GHGs, and almost one-half of the states have established or joined GHG cap and trade programs. Most of these cap and trade programs work by requiring major sources of emissions or major producers of fuels, to acquire and surrender emission allowances. The number of
14
allowances available for purchase is reduced each year in an effort to achieve the overall greenhouse gas emission reduction goal. In addition, in 2015, the U.S. participated in the United Nations Conference on Climate Change, which led to the creation of the Paris Agreement. The Paris Agreement requires countries to review and “represent a progression” in their intended nationally determined contributions, which set GHG emission reduction goals, every five years beginning in 2020. However, the Paris Agreement is not binding and, at present, the U.S.’s continued participation in the agreement remains uncertain. Although it is not possible at this time to predict how legislation or new regulations that may be adopted to address GHG emissions would impact our business, any new federal, regional or state restrictions on emissions of carbon dioxide or other GHGs that may be imposed in areas in which we conduct business could result in increased compliance costs or additional operating restrictions on our customers. Such restrictions could potentially make our customers’ products more expensive and thus reduce demand for such products, which in turn could have a material adverse effect on the demand for our services and our business. Finally, it should be noted that some scientists have concluded that increasing concentrations of GHGs in the earth’s atmosphere may produce climatic changes that have significant physical effects, such as increased frequency and severity of storms, droughts, and floods and other climatic events; if any such effects were to occur, they could have an adverse effect on our assets and operations.
Hydraulic Fracturing
Hydraulic fracturing is an important and common practice that is used to stimulate production of natural gas and/or oil from dense subsurface rock formations. The hydraulic fracturing process involves the injection of water, sand and chemicals under pressure into the formation to fracture the surrounding rock and stimulate production. We commonly perform hydraulic fracturing services for our customers. Hydraulic fracturing typically is regulated by state oil and natural gas commissions, but, as noted above, the EPA has asserted federal regulatory authority pursuant to the SDWA over certain hydraulic fracturing activities involving the use of diesel fuel and issued permitting guidance in February 2014 that applies to such activities. In addition, the EPA has taken the following actions and issued final regulations under the CAA governing performance standards, including standards for the capture of air emissions released during hydraulic fracturing; an advanced notice of proposed rulemaking in March 2014 under the Toxic Substances Control Act that would require companies to disclose information regarding the chemicals used in hydraulic fracturing; and proposed rules in April 2015 to prohibit the discharge of wastewater from hydraulic fracturing operations to publicly owned wastewater treatment plants. Also, the BLM finalized rules in March 2015 that impose new or more stringent standards for performing hydraulic fracturing on federal and Native American lands. The U.S. District Court of Wyoming struck down BLM's enforcement of the rule; the decision was appealed to the Tenth Circuit by the BLM and the matter remains pending. Also, in December 2016, the EPA released its final report on the potential impacts of hydraulic fracturing on drinking water resources. The final report concluded that “water cycle” activities associated with hydraulic fracturing may impact drinking water resources “under some circumstances,” noting that the following hydraulic fracturing water cycle activities and local- or regional-scale factors are more likely than others to result in more frequent or more severe impacts: water withdrawals for fracturing in times or areas of low water availability; surface spills during the management of fracturing fluids, chemicals or produced water; injection of fracturing fluids into wells with inadequate mechanical integrity; injection of fracturing fluids directly into groundwater resources; discharge of inadequately treated fracturing wastewater to surface waters; and disposal or storage of fracturing wastewater in unlined pits.
In addition, various state and local governments have implemented, or are considering, increased regulatory oversight of hydraulic fracturing through additional permit requirements, operational restrictions, disclosure requirements, well construction and temporary or permanent bans on hydraulic fracturing in certain areas. For example, in May 2013, the Texas Railroad Commission adopted new rules governing well casing, cementing and other standards for ensuring that hydraulic fracturing operations do not contaminate nearby water resources. Local governments also may seek to adopt ordinances within their jurisdictions regulating the time, place and manner of drilling activities in general or hydraulic fracturing activities in particular or prohibit the performance of well drilling in general or hydraulic fracturing in particular. We believe that we follow applicable standard industry practices and legal requirements for groundwater protection in our hydraulic fracturing activities. If new federal, state or local laws or regulations that significantly restrict hydraulic fracturing are adopted, such legal requirements could result in delays, eliminate certain drilling and injection activities and make it more difficult or costly to perform hydraulic fracturing. Any such regulations limiting or prohibiting hydraulic fracturing could result in decreased oil and natural gas exploration and production activities and, therefore, adversely affect demand for our services and our business. Such laws or regulations could also materially increase our costs of compliance and doing business.
There have been no material incidents or citations related to our hydraulic fracturing operations in the past five years. During that period we have not been involved in any litigation over alleged environmental violations, have not been ordered to pay any material monetary fine or penalty with respect to alleged environmental violations, and are not currently facing any type of governmental enforcement action or other regulatory proceeding involving alleged environmental violations related to our hydraulic fracturing operations. In addition, pursuant to our MSAs, we are generally liable for only surface
15
pollution, not underground or flowback pollution, which our customers are generally liable for and for which we are typically indemnified by our customers.
We maintain insurance against some risks associated with underground contamination that may occur as a result of well services activities. However, this insurance is limited to activities at the well site and may not continue to be available or may not be available at premium levels that justify its purchase. The occurrence of a significant event not fully insured or indemnified against could have a materially adverse effect on our financial condition and results of operations.
Overall, we do not anticipate that compliance with existing environmental laws and regulations will have a material effect on our financial condition or results of operations. It is possible, however, that substantial costs for compliance or penalties for non-compliance may be incurred in the future. Moreover, it is possible that other developments, such as the adoption of stricter environmental laws, regulations, and enforcement policies, could result in additional costs or liabilities that we cannot currently quantify.
16
Item 1A. Risk Factors
We face many challenges and risks in the industry in which we operate. Before investing in our common stock you should carefully consider each of the following risk factors and all of the other information set forth in this Annual Report, including under the section titled “Cautionary Note Regarding Forward-Looking Statements”, and in our other reports filed with the SEC, and the documents and other information incorporated by reference herein and therein, for a detailed discussion of known material factors which could materially affect our business, financial condition or future results. The risks and uncertainties described are not the only ones we face. Additional risk factors not presently known to us or which we currently consider immaterial may also adversely affect our business, financial condition or future results. If any of these risks were actually to occur, our business, financial condition or results of operations could be materially adversely affected. In that case, the trading price of our common stock could decline and you could lose all or part of your investment.
Risks Relating to Our Emergence from Bankruptcy
We recently emerged from bankruptcy, which could adversely affect our business and relationships.
Due to a severe industry downturn beginning in late 2014, on July 20, 2016, the Predecessor C&J Companies voluntarily filed petitions for reorganization seeking relief under the provisions of Chapter 11 of the Bankruptcy Code in the Bankruptcy Court. On December 16, 2016, the Bankruptcy Court entered a Confirmation Order confirming the Restructuring Plan of the Predecessor C&J Companies. On January 6, 2017, the Predecessor C&J Companies substantially consummated the Restructuring Plan and emerged from the Chapter 11 Proceeding.
Our recent emergence from the Chapter 11 Proceeding could adversely affect our business and relationships with customers, employees, suppliers and others. Due to uncertainties, many risks exist, including the following:
• | we may have difficulty obtaining the capital we need to run and grow our business; |
• | key suppliers could terminate their relationship with us or require financial assurances or enhanced performance; |
• | our ability to renew existing contracts and compete for new business may be adversely affected; |
• | our ability to attract, motivate and/or retain key executives and employees may be adversely affected; |
• | employees may be distracted from performance of their duties or more easily attracted to other employment opportunities, and current and former employees could pursue claims against us; and |
• | competitors may take business away from us, and our ability to attract and retain customers may be negatively impacted. |
The occurrence of one or more of these events could have a material and adverse effect on our operations, financial condition and reputation. We cannot assure you that having been through a Chapter 11 Proceeding will not adversely affect our operations in the future.
Our actual financial results after emergence from our Chapter 11 Proceeding may not be comparable to our projections filed with the Bankruptcy Court in the course of our Chapter 11 Proceeding, and will not be comparable to our historical financial results as a result of the implementation of our Restructuring Plan and the transactions contemplated thereby, as well as our adoption of Fresh Start accounting following emergence.
We filed with the Bankruptcy Court projected financial information to demonstrate to the Bankruptcy Court the feasibility of our Restructuring Plan and our ability to continue operations following our emergence from the Chapter 11 Proceeding. Those projections were prepared solely for the purpose of the Chapter 11 Proceeding and have not been, and will not be, updated on an ongoing basis and should not be relied upon by investors. At the time they were prepared, the projections reflected numerous assumptions concerning our anticipated future performance with respect to then prevailing and anticipated market and economic conditions that were and remain beyond our control and that may not materialize. Projections are inherently subject to substantial and numerous uncertainties and to a wide variety of significant business, economic and competitive risks and the assumptions underlying the projections and/or valuation estimates may prove to be wrong in material respects. Actual results will likely vary significantly from those contemplated by the projections. As a result, investors should not rely on these projections.
17
Additionally, in accordance with the provisions of Financial Accounting Standards Board Accounting Standards Codification No. 852 - Reorganizations, we will apply Fresh Start accounting in our financial statements commencing with our financial statements as of and for the three month period ended March 31, 2017. We expect that this will dramatically impact 2017 first quarter operating results as certain pre-bankruptcy debts were discharged in accordance with the Restructuring Plan immediately prior to our emergence from bankruptcy and our assets and liabilities will be adjusted to their fair values upon emergence. As a result, our financial information subsequent to emergence from bankruptcy will not be comparable to our financial statements prior to emergence.
The warrants we issued in accordance with the Restructuring Plan are exercisable for shares of common stock of the Company. The exercise of such equity instruments would have a dilutive effect to stockholders of the Company.
In accordance with the terms of the Restructuring Plan, on the Plan Effective Date, we issued 1,180,083 warrants that are exercisable into shares of common stock of the Company at an initial exercise price of $27.95 per warrant. In addition, the Warrant Agreement provides for the issuance in the future of up to 2,360,166 warrants to the Unsecured Claims Representative (as defined in the Restructuring Plan) for the benefit of the former holders of Unsecured Creditor Claims (as defined in the Restructuring Plan). The exercise of these warrants into common stock would have a dilutive effect to the holdings of our existing stockholders. The warrants will not expire until January 6, 2024 and may create an overhang on the market for, and have a negative effect on the market price of, our common stock.
There is no guarantee that the warrants issued by the Company in accordance with the Restructuring Plan will be or continue to be in the money, and unexercised warrants may expire worthless. Further, the terms of such warrants may be amended.
If our stock price is below $27.95 per share, the warrants will have limited economic value, and they may expire worthless. In addition, the warrant agreement provides that the terms of the warrants may be amended without the consent of any holder to cure any ambiguity or correct any defective provision, but requires the approval by the holders of at least a certain percentage of the then-outstanding warrants originally issued to make any change that adversely affects the interests of the holders. Accordingly, we may amend the terms of the warrants in a manner adverse to a holder if holders of at least a certain percentage of the then outstanding warrants approve of such amendment.
There is a limited trading market for our securities and the market price of our securities is subject to volatility.
Upon emergence from the Chapter 11 Proceeding, our old common stock was canceled and we issued new common stock. Our common stock has been approved for listing on the NYSE MKT and we expect to begin trading under the symbol “CJ” on March 6, 2017. The market price of our common stock could be subject to wide fluctuations in response to, and the level of trading that develops with our common stock may be affected by, numerous factors beyond our control such as our limited trading history subsequent to our emergence from bankruptcy, our limited trading volume, the concentration of holdings of our common stock, the lack of comparable historical financial information due to our adoption of Fresh Start accounting, actual or anticipated variations in our operating results and cash flow, business conditions in our markets and the general state of the securities markets and the market for energy-related stocks, as well as general economic and market conditions and other factors that may affect our future results, including those described in this Annual Report. No assurance can be given that an active market will develop for our common stock or as to the liquidity of the trading market for our common stock. Our common stock may be traded only infrequently, and reliable market quotations may not be available. Holders of our common stock may experience difficulty in reselling, or an inability to sell, their shares. In addition, if an active trading market does not develop or is not maintained, significant sales of our common stock, or the expectation of these sales, could materially and adversely affect the market price of our common stock.
Upon our emergence from bankruptcy, the composition of our shareholder base and Board of Directors changed significantly. As a result, the future strategy and plans of the Company may differ materially from those in the past.
Pursuant to our Restructuring Plan, the composition of our Board of Directors (the “Board”) changed significantly effective upon our emergence from the Chapter 11 Proceeding. Our Board is now made up of seven directors, five of which have not previously served on the Board. The new directors have different backgrounds, experiences and perspectives from those individuals who previously served on the Board and, thus, may have different views on the issues that will determine the future of the Company. As a result, the future strategy and plans of the Company may differ materially from those of the past.
As a result of the implementation of our Restructuring Plan, we believe our ability to use net operating loss carryforwards to offset future taxable income for U.S. federal income tax purposes may be subject to limitation under Section 382.
18
Under U.S. federal income tax law, a corporation is generally permitted to deduct from taxable income net operating losses (“NOLs”) carried forward from prior years. As of December 31, 2016, we reported consolidated federal NOL carryforwards of approximately $530.6 million. Our ability to utilize our NOL carryforwards to offset future taxable income and to reduce U.S. federal income tax liability is subject to certain requirements and restrictions. In general, under Section 382 of the Internal Revenue Code of 1986, as amended (the “Code”), a corporation that undergoes an “ownership change” is subject to limitations on its ability to utilize its pre-change NOLs to offset future taxable income. An ownership change generally occurs if one or more shareholders (or groups of shareholders) who are each deemed to own at least 5% of our stock have aggregate increases in their ownership of such stock of more than 50 percentage points over such stockholders’ lowest ownership percentage during the testing period (generally a rolling three year period). We believe we experienced an ownership change in January 2017 as a result of the implementation of our Restructuring Plan under Chapter 11 of the U.S. Bankruptcy Code and that our pre-change NOLs are subject to limitation under Section 382 as a result. Such limitation may cause U.S. federal income taxes to be paid earlier than otherwise would be paid if such limitation were not in effect and could cause our pre-change NOLs to expire unused, in each case reducing or eliminating the benefit of such NOLs. Similar rules and limitations may apply for state income tax purposes.
As a result of the implementation of our Restructuring Plan, NOLs and other tax attributes may be subject to reduction, causing less NOL or tax deductions to be available to offset future taxable income for U.S. federal income tax purposes.
As a result of consummating our Restructuring Plan, the obligations of the Predecessor with respect to the Original Credit Agreement (the "Old C&J Debt") was canceled and discharged and certain lenders were issued common stock in the reorganized Company (See Note 2 - Chapter 11 Proceeding and Emergence and Note 17 - Subsequent Events). This exchange may give rise to cancellation of debt income (“CODI”) to the extent that the fair market value of the common stock and other rights exchanged with the lenders is less than the adjusted issue price of the Old C&J Debt. Other settlements with holders of Claims under the Restructuring Plan may have resulted in satisfaction of debts for less than the amount of the liability resulting in CODI. The Code provides that CODI arising under a discharge in a Chapter 11 bankruptcy proceeding is excluded from taxable income. A taxpayer excluding CODI under these circumstances may be required to reduce certain tax attributes, such as NOLs and depreciable basis by an amount up to the amount of excluded CODI (the “Tax Attribute Reduction Rules”). We expect to realize CODI as a result of consummating our Restructuring Plan, but expect to exclude such CODI from our taxable income, which would cause a partial reduction of our tax attributes under the Tax Attribute Reduction Rules. Any reduction in our tax attributes will result in fewer deductions available to offset future taxable income. Based upon our estimate of fair market value as determined under the Code and accompanying tax authorities the estimated CODI and required tax attribute reduction from the effects of the Restructuring Plan will not cause a significant change in our recorded deferred tax liability. Our current estimates show that any required reduction in deferred tax assets recorded for our tax attributes will be less than the valuation allowance that is currently reducing the carrying value of such deferred tax assets in our financial statements. The consummation of the Restructuring Plan occurred in 2017, and the related fair market value, CODI and any associated tax attribute reduction as determined by the Code are estimates at this time and will not be finalized until the 2017 tax return is filed in 2018. Our estimates are subject to change throughout this period.
Risks Related to Our Business
Our business is cyclical and dependent upon conditions in the oil and natural gas industry that impact the level of exploration, development and production of oil and natural gas and capital expenditures by oil and natural gas companies. Our customers’ willingness to undertake drilling, completion and production activities depends largely upon prevailing industry conditions that are influenced by numerous factors that are beyond our control. Any of these factors could have a material adverse effect on our business, financial condition, results of operations and cash flow.
We depend on our customers’ willingness to make operating and capital expenditures to explore for, develop and produce oil and natural gas. If these expenditures decline, our business will suffer. The oil and gas industry has traditionally been volatile, is highly sensitive to supply and demand cycles and is influenced by a combination of long-term, short-term and cyclical trends. Our customers’ willingness to conduct drilling, completion and production activities depends largely upon prevailing industry conditions that are influenced by numerous factors over which we have no control, such as:
• | the supply of and demand for oil and natural gas, including current natural gas storage capacity and usage; |
• | the ability or willingness of the Organization of Petroleum Exporting Countries (“OPEC”) to set and maintain production levels for oil; |
• | the current and expected future prices for oil and natural gas and the perceived stability and sustainability of those prices; |
19
• | the level of global and domestic oil and natural gas inventories; |
• | the supply of and demand for hydraulic fracturing and other well service equipment in the continental United States and Western Canada; |
• | the cost of exploring for, developing, producing and delivering oil and natural gas; |
• | public pressure on, and legislative and regulatory interest within, federal, state and local governments to stop, significantly limit or regulate hydraulic fracturing activities; |
• | the expected rates of decline of current oil and natural gas production; |
• | lead times associated with acquiring equipment and products and availability of personnel; |
• | regulation of drilling activity; |
• | the availability of water resources, suitable proppant and chemicals in sufficient quantities for use in hydraulic fracturing fluids; |
• | the discovery and development rates of new oil and natural gas reserves; |
• | available pipeline and other transportation capacity; |
• | weather conditions, including hurricanes that can affect oil and natural gas operations over a wide area; |
• | political instability in oil and natural gas producing countries; |
• | domestic and worldwide economic conditions; |
• | technical advances affecting energy consumption; |
• | the price and availability of alternative fuels; and |
• | merger and divestiture activity among oil and natural gas producers. |
Volatility or weakness in oil prices or natural gas prices (or the perception that oil prices or natural gas prices will decrease or remain depressed) generally leads to decreased spending by our customers, which in turn negatively impacts drilling, completion and production activity. In particular, the demand for new or existing drilling, completion and production work is driven by available investment capital for such work. When these capital investments decline, our customers’ demand for our services declines. Because these types of services can be easily “started” and “stopped,” and oil and natural gas producers generally tend to be less risk tolerant when commodity prices are low or volatile, we typically experience a more rapid decline in demand for our services compared with demand for other types of energy services. Any negative impact on the spending patterns of our customers may cause lower pricing and utilization for our core service lines, which could have a material adverse effect on our business, financial condition, results of operations and cash flows.
Spending by exploration and production companies can also be impacted by conditions in the capital markets. Limitations on the availability of capital, or higher costs of capital, for financing expenditures may cause exploration and production companies to make additional reductions to capital budgets in the future even if oil prices remain at current levels or natural gas prices increase from current levels. Any such cuts in spending may cause our customers to curtail their drilling programs, including completion and production activities and any discretionary spending on well services, which may result in a reduction in the demand for our services, the rates we can charge and the utilization of our assets. Moreover, reduced discovery rates of new oil and natural gas reserves, or a decrease in the development rate of reserves, in our market areas, whether due to increased governmental regulation, limitations on exploration and drilling activity or other factors, could also have a material adverse impact on our business, even in a stronger oil and natural gas price environment.
Fluctuations in oil and natural gas prices could adversely affect drilling, completion and production activities by oil and natural gas companies and our revenues, cash flows and profitability. If oil and natural gas prices remain volatile, or if oil or natural gas prices remain low or decline further, the demand for our services could be adversely affected.
20
The demand for our services depends on the level of spending by oil and gas companies for drilling, completion and production activities, which are affected by short-term and long-term trends in oil and natural gas prices, including current and anticipated oil and natural gas prices. Oil and natural gas prices, as well as the level of drilling, completion and production activities, historically have been extremely volatile and are expected to continue to be so. For example, during 2016, NYMEX crude oil prices reached a high of $54.06 per barrel and a low of $26.21 per barrel, and entering 2017 we have recently witnessed prices as high as $54.45 per barrel. In line with the sustained weakness and volatility in oil prices over the course of 2016, we experienced a significant decline in drilling, completion and production activities across our customer base, which resulted in reduced demand and increased competition and pricing pressure to varying degrees across our service lines and operating areas.
Worldwide military, political and economic events, including initiatives by OPEC, affect both the demand for, and the supply of, oil and natural gas. Weather conditions, governmental regulation (both in the United States and elsewhere), levels of consumer demand, the availability of pipeline capacity and other factors that will be beyond our control may also affect the supply of, demand for, and price of oil and natural gas. Volatility or weakness in oil prices or natural gas prices (or the perception that oil prices or natural gas prices will decrease) affects the spending patterns of our customers and may result in the drilling of fewer new wells or lower completion and production spending on existing wells. This, in turn, could result in lower demand for our services and cause lower pricing and utilization levels for our services. If oil and natural gas prices continue to remain low or decline further, or if there is a further reduction in drilling and completion activities, the demand for our services and our results of operations could be materially and adversely affected.
We participate in a capital-intensive industry, and we may not be able to finance future growth of our operations or future acquisitions, which could adversely affect our operations and financial position.
The successful execution of our growth strategy depends on our ability to generate sufficient cash flows and our access to capital, both of which are impacted by numerous factors beyond our control, including financial, business, economic and other factors, such as volatility in commodity prices and pressure from competitors. If we are unable to generate sufficient cash flows or to obtain additional capital on favorable terms or at all, we may be unable to continue growing our business, conduct necessary corporate activities, take advantage of business opportunities that arise or engage in activities that may be in our long-term best interest, which may adversely impact our ability to sustain or improve our current level of profitability. Furthermore, any failure to make scheduled payments of interest and principal on our outstanding indebtedness could harm our ability to incur additional indebtedness on acceptable terms or at all, and also could constitute an event of default under our New Credit Facility. Our inability to generate sufficient cash flow to satisfy our debt obligations or to obtain alternative financing could materially and adversely affect our business, financial condition, results of operations, cash flows and prospects, and we could be forced into bankruptcy or liquidation.
The oilfield services industry is highly competitive with significant potential for excess capacity. We may not be able to meet the specific needs of oil and natural gas exploration and production companies at competitive prices which could adversely affect our business and operating results.
The oilfield services industry is highly competitive. The principal competitive factors in our markets are generally technical expertise, the availability and condition of equipment, work force capability, safety record, reputation and experience. We compete with large national and multi-national companies that have longer operating histories, greater financial resources and greater name recognition than we do and who can operate at a loss in the regions in which we operate. Additionally, some of our competitors provide a broader array of services and/or have a stronger presence in more geographic markets. Our reputation for safety and quality may not be sufficient to enable us to maintain our competitive position, and our competitors may be able to respond more quickly to new or emerging technologies and services and changes in customer requirements. As a result of competition, we may lose market share or be unable to maintain or increase prices for our present services or to acquire additional business opportunities, which could have a material adverse effect on our business, financial condition, results of operations and cash flows.
Additionally, significant increases in overall market capacity have caused active price competition and led to lower pricing and utilization levels for our services. Completion and well servicing equipment, such as hydraulic fracturing fleets, can be moved from one region to another in response to changes in levels of activity and market conditions, which may result in an oversupply of equipment in an area. For example, natural gas prices declined sharply in 2009 and remained depressed through 2015, which resulted in reduced drilling activity in natural gas shale plays. This drove many oilfield services companies operating in those areas to relocate their equipment to more oil- and liquids-rich shale plays, such as the Eagle Ford Shale and Permian Basin. As drilling activity and completion capacity migrated into the oil- and liquids-rich regions from the gas-rich regions, the increase in supply relative to demand negatively impacted pricing and utilization of our services, particularly for hydraulic fracturing services. Furthermore, as we entered 2015, we experienced a slowdown in activity across our customer
21
base as operators reacted to the rapid decline in commodity prices that began during the fourth quarter of 2014. The entire year proved to be extremely challenging for the North American oilfield services industry due to the sustained weakness and volatility in oil prices at levels that caused severe reductions in drilling, completion and production activities, which in turn resulted in reduced demand and increased competition and pricing pressure to varying degrees across our service lines and operating areas.
We may be unable to implement price increases or maintain existing prices on our core services.
We generate revenue from our core service lines, the majority of which is provided on a spot market basis. Pressure on pricing for our core services, including due to competition and industry and/or economic conditions, may impact, among other things, our ability to implement price increases or maintain pricing on our core services. We operate in a very competitive industry and, as a result, we may not always be successful in raising, or maintaining our existing prices. Additionally, during periods of increased market demand, a significant amount of new service capacity, including hydraulic fracturing equipment, may enter the market, which also puts pressure on the pricing of our services and limits our ability to increase or maintain prices. Furthermore, during periods of declining pricing for our services, we may not be able to reduce our costs accordingly, which could further adversely affect our profitability.
Even when we are able to increase our prices, we may not be able to do so at a rate that is sufficient to offset such rising costs. Also, we may not be able to successfully increase prices without adversely affecting our activity levels. The inability to maintain our prices or to increase our prices as costs increase could have a material adverse effect on our business, financial position and results of operations.
We may not be able to service our debt obligations in accordance with their terms.
On January 6, 2017, we entered into a new revolving credit and security agreement (the “New Credit Facility”). Our ability to meet our debt service obligations under, and comply with the financial covenants contained in, our New Credit Facility or future debt agreements depends on our future performance, which is affected by financial, business, economic and other factors, many of which are beyond our control, including volatility in commodity prices and pressure from competitors. Should our revenues decline, we may not be able to generate sufficient cash flow to pay our debt service obligations when due. Additionally, revenue, utilization and pricing level declines may result in our not being in compliance with one or more of the financial covenants under our New Credit Facility or future debt agreements in future periods. Any failure to satisfy our debt obligations or to comply with the applicable financial covenants could materially and adversely affect our business, financial condition, results of operations, cash flows and prospects.
If we are unable to meet our debt service obligations or should we fail to comply with, or obtain relief from, the financial and other restrictive covenants contained in our New Credit Facility or future debt agreements, we may trigger an event of default. Upon such an event of default, our lenders may refuse to fund borrowings and have the right to terminate their commitments and potentially accelerate all of our outstanding debt. If an event of default occurs and the lenders under our New Credit Facility or future debt agreements accelerate the maturity of any loans or other debt outstanding. We may not be able to make all required payments or borrow sufficient funds to refinance such indebtedness. Even if new financing is available at that time it may not be on terms that are acceptable to us.
Any reduction of the borrowing base under our New Credit Facility could require us to repay that portion of indebtedness that exceeds the new borrowing base under our New Credit Facility earlier than anticipated, which could adversely impact our liquidity.
Our New Credit Facility allows us to borrow amounts up to the lesser of $100 million and a borrowing base based on the value of our accounts receivable and inventory. Reductions in accounts receivable and inventory due to events or market forces beyond our control could reduce the amount available to us under our New Credit Facility and could result in a redetermination, and potentially a reduction, of our borrowing bases under our New Credit Facility. If our New Credit Facility eventually becomes fully drawn, any reduction in the borrowing bases could require us to make mandatory prepayments under our New Credit Facility to the extent existing indebtedness under the New Credit Facility exceeds the borrowing base. We may have insufficient cash on hand to be able to make mandatory prepayments under our New Credit Facility. Any failure to repay indebtedness in excess of our borrowing bases in accordance with the terms of the New Credit Facility would constitute an event of default under the New Credit Facility. Such event of default would permit our lenders to accelerate our outstanding debt, which if actually accelerated, would become immediately due and payable and could permit our secured lenders to foreclose on any of our assets securing indebtedness.
We are subject to restrictive covenants in our New Credit Facility, which may restrict our operational flexibility.
22
The New Credit Facility governing our indebtedness contains, and future debt agreements may contain, financial and other restrictive covenants that may limit our ability to obtain future financings to withstand a future downturn in our business or the economy in general, conduct necessary corporate activities, take advantage of business opportunities that arise and/or to engage in activities that may be in our long-term best interests.
Specifically, our New Credit Facility includes a Fixed Charge Coverage Ratio and minimum liquidity threshold covenants and restrictive covenants that limit our ability and that of our subsidiaries to, among other things:
• | sell or otherwise dispose of assets; |
• | make certain restricted payments and investments; |
• | create, incur, assume, suffer to exist or guarantee additional indebtedness; |
• | create, incur, assume, or suffer to exist liens on our assets; |
• | make capital expenditures, investments or acquisitions; |
• | repurchase, redeem or retire our capital shares; |
• | merge or consolidate, or transfer all or substantially all of our assets and the assets of our subsidiaries; |
• | engage in specified transactions with subsidiaries and affiliates; and |
• | pursue other corporate activities. |
We may be prevented from taking advantage of business opportunities that arise because of the limitations imposed on us by restrictive covenants under the New Credit Facility, which could: limit our ability to plan for, or react to, market conditions, to meet capital needs or otherwise restrict our activities or business plan; and adversely affect our ability to finance our operations, enter into acquisitions or to engage in other business activities that would be in our interest.
Please see “Liquidity and Capital Resources - Description of Our New Credit Facility” in Part II, Item 7 “Management’s Discussion and Analysis of Financial Condition and Results of Operations” for additional information about the New Credit Facility, including the financial and other restrictive covenants contained therein.
We may become more leveraged and our indebtedness could adversely affect our operations and financial condition.
Our business is capital intensive and we may seek to raise debt capital to fund our business and growth strategy. Indebtedness could have negative consequences that could materially and adversely affect our business, financial condition, results of operations, cash flows and prospects, such as:
• | requiring us to dedicate a substantial portion of our cash flow from operating activities to payments on our indebtedness, thereby reducing the availability of cash flow to fund working capital, capital expenditures, research and development efforts, potential strategic acquisitions and other general corporate purposes; |
• | limiting our ability to obtain additional financing to fund growth, working capital or capital expenditures, or to fulfill debt service requirements or other cash requirements; |
• | increasing our vulnerability to economic downturns and changing market conditions; |
• | placing us at a competitive disadvantage relative to competitors that have less debt; |
• | to the extent that our debt is subject to floating interest rates, increasing our vulnerability to fluctuations in market interest rates; and |
• | preventing our ability to buy back our common stock or pay cash dividends. |
23
Disruptions in the capital and credit markets, continued low commodity prices, our debt level and other factors may restrict our ability to raise capital on favorable terms, or at all.
Disruptions in the capital and credit markets, in particular with respect to companies in the energy sector, could limit our ability to access these markets or may significantly increase our cost to borrow. Continued low commodity prices, among other factors, have caused some lenders to increase interest rates, enact tighter lending standards which we may not satisfy as a result of our debt level or otherwise, refuse to refinance existing debt at maturity on favorable terms, or at all, and in certain instances have reduced or ceased to provide funding to borrowers. If we are unable to access the capital and credit markets on favorable terms or at all, it could adversely affect our business, financial condition and results of operations.
Reliance upon a few large customers may adversely affect our revenue and operating results.
Our top ten customers represented approximately 46.0%, 53.6% and 51.1% of our consolidated revenue for the years ended December 31, 2016, 2015 and 2014, respectively. It is likely that we will continue to derive a significant portion of our revenue from a relatively small number of customers in the future. If a major customer fails to pay us, revenue would be impacted and our operating results and financial condition could be harmed. Additionally, if we were to lose any material customer, we may not be able to redeploy our equipment at similar utilization or pricing levels and such loss could have an adverse effect on our business until the equipment is redeployed at similar utilization or pricing levels.
Delays in deliveries of key raw materials or increases in the cost of key raw materials could harm our business, results of operations and financial condition.
We have established relationships with a limited number of suppliers of our raw materials (such as proppant, guar, chemicals or coiled tubing) and finished products (such as fluid-handling equipment). Should any of our current suppliers be unable to provide the necessary raw materials or finished products or otherwise fail to deliver the products in a timely manner and in the quantities required, any resulting delays in the provision of services could have a material adverse effect on our business, financial condition, results of operations and cash flows. Additionally, increasing costs of certain raw materials, including guar, may negatively impact demand for our services or the profitability of our business operations. In the past, our industry faced sporadic shortages associated with hydraulic fracturing operations, such as proppant and guar, requiring work stoppages, which adversely impacted the operating results of several competitors. We may not be able to mitigate any future shortages of raw materials, including proppants.
We are vulnerable to the potential difficulties associated with rapid growth, mergers, acquisitions and expansion.
We believe that our future success depends on our ability to take advantage of and manage the rapid growth that we have experienced, as well as the demands from increased responsibility on our management personnel. The following factors could present difficulties to us:
• | lack of sufficient executive-level personnel; |
• | increased administrative burden; |
• | long lead times associated with acquiring additional equipment; |
• | ability to manage significant levels of idle equipment in sustained periods of depressed oil and natural gas prices; and |
• | ability to maintain the level of focused service attention that we have historically been able to provide to our customers. |
In addition, in the future we may seek to grow our business through acquisitions that enhance our existing operations. The success of any completed acquisition will depend on our ability to integrate effectively the acquired business into our existing operations. The process of integrating acquired businesses may involve unforeseen difficulties and may require a disproportionate amount of our managerial and financial resources. Our operating results could be adversely affected if we do not successfully manage these potential difficulties in integrating the businesses we may acquire.
Our operations are subject to hazards inherent in the oilfield services industry.
24
Risks inherent to our industry, such as equipment defects, vehicle accidents, explosions and uncontrollable flows of gas or well fluids, can cause personal injury, loss of life, suspension of operations, damage to formations, damage to facilities, business interruption and damage to, or destruction of property, equipment and the environment. For example, transportation of heavy equipment creates the potential for our trucks to become involved in roadway accidents, which in turn could result in personal injury or property damages lawsuits being filed against us. In addition, our hydraulic fracturing and well completion services could become a source of spills or releases of fluids, including chemicals used during hydraulic fracturing activities, at the site where such services are performed, or could result in the discharge of such fluids into underground formations that were not targeted for fracturing or well completion activities, such as potable aquifers. These risks could expose us to substantial liability for personal injury, wrongful death, property damage, loss of oil and natural gas production, pollution and other environmental damages and could result in a variety of claims, losses and remedial obligations that could have an adverse effect on our business and results of operations. The existence, frequency and severity of such incidents will affect operating costs, insurability and relationships with customers, employees and regulators. In particular, our customers may elect not to purchase our services if they view our safety record as unacceptable, which could cause us to lose customers and substantial revenue.
Our operational personnel have experienced accidents which have, in some instances, resulted in serious injuries. Our safety procedures may not always prevent such damages. Our insurance coverage may be inadequate to cover our liabilities. In addition, we may not be able to maintain adequate insurance in the future at rates we consider reasonable and commercially justifiable or on terms as favorable as our current arrangements. The occurrence of a significant uninsured claim, a claim in excess of the insurance coverage limits maintained by us or a claim at a time when we are not able to obtain liability insurance could have a material adverse effect on our ability to conduct normal business operations and on our financial condition, results of operations and cash flows.
We may be unable to employ a sufficient number of key employees, technical personnel and other skilled and qualified workers.
The delivery of our services and products requires personnel with specialized skills and experience who can perform physically demanding work. As a result of the volatility in the energy service industry and the demanding nature of the work, workers may choose to pursue employment in fields that offer a different work environment. Our ability to be productive and profitable will depend upon our ability to employ and retain skilled workers. In addition, our ability to expand our operations depends in part on our ability to increase the size of our skilled labor force. At times, demand for skilled workers in our geographic area of operations is high, and the supply is limited. A significant increase in the wages paid by competing employers could result in a reduction of our skilled labor force, increases in the wage rates that we pay, or both. If either of these events were to occur, our capacity and profitability could be diminished and our growth potential could be impaired.
We depend heavily on the efforts of our executive officers, managers and other key employees to manage our operations. The unexpected loss or unavailability of key members of management or technical personnel may have a material adverse effect on our business, financial condition, prospects or results of operations.
Weather conditions could materially impair our business.
Our operations may be adversely affected by severe weather events and natural disasters. Furthermore, our customers’ operations may be adversely affected by seasonal weather conditions. For example, hurricanes, tropical storms, heavy snow, ice or rain may result in customer delays and other disruptions to our services. Repercussions of severe weather conditions may include:
• | curtailment of services; |
• | weather-related damage to facilities and equipment, resulting in suspension of operations; |
• | inability to deliver equipment, personnel and products to job sites in accordance with contract schedules; |
• | increase in the price of insurance; and |
• | loss of productivity. |
These constraints could also delay our operations, reduce our revenue and materially increase our operating and capital costs.
25
Federal and state legislative and regulatory initiatives relating to hydraulic fracturing could result in increased costs and additional operating restrictions or delays as well as adversely affect demand for our support services.
Hydraulic fracturing is an important and common practice that is used to stimulate production of natural gas and/or oil from dense subsurface rock formations. The hydraulic fracturing process involves the injection of water, sand and chemicals under pressure into the formation to fracture the surrounding rock and stimulate production. We commonly perform hydraulic fracturing services for our customers.
Hydraulic fracturing typically is regulated by state oil and natural gas commissions, but the EPA has asserted federal regulatory authority pursuant to the SDWA over certain hydraulic fracturing activities involving the use of diesel fuel and issued permitting guidance in February 2014 that applies to such activities. Also, in May 2014, the EPA published an advanced notice of proposed rulemaking under the Toxic Substances and Control Act that would require the disclosure of chemicals used in hydraulic fracturing fluids. In addition, in June 2016, the EPA finalized regulations that prohibit the discharge of wastewater from hydraulic fracturing operations to publicly owned wastewater treatment plants.
Certain governmental reviews are also either underway or being proposed that focus on environmental aspects of hydraulic fracturing practices. For example, in December 2016, the EPA released its final report on the potential impacts of hydraulic fracturing on drinking water resources. The final report concluded that “water cycle” activities associated with hydraulic fracturing may impact drinking water resources under some circumstances,” noting that the following hydraulic fracturing water cycle activities and local- or regional-scale factors are more likely than others to result in more frequent or more severe impacts: water withdrawals for fracturing in times or areas of low water availability; surface spills during the management of fracturing fluids, chemicals or produced water; injection of fracturing fluids into wells with inadequate mechanical integrity; injection of fracturing fluids directly into groundwater resources; discharge of inadequately treated fracturing wastewater to surface waters; and disposal or storage of fracturing wastewater in unlined pits. Since the report did not find a direct link between hydraulic fracturing itself and contamination of groundwater resources, this years-long study report does not appear to provide any basis for further regulation of hydraulic fracturing at the federal level.
Various state and local governments have implemented, or are considering, increased regulatory oversight of hydraulic fracturing through additional permit requirements, operational restrictions, disclosure requirements, well construction, and temporary or permanent bans on hydraulic fracturing in certain areas. For example, in May 2013, the Texas Railroad Commission adopted new rules governing well casing, cementing and other standards for ensuring that hydraulic fracturing operations do not contaminate nearby water resources. In addition, state and federal regulatory agencies have recently focused on a possible connection between the disposal of wastewater in underground injection wells and the increased occurrence of seismic activity, and regulatory agencies at all levels are continuing to study the possible linkage between oil and gas activity and induced seismicity. In response to these concerns, regulators in some states are seeking to impose additional requirements on hydraulic fracturing fluid disposal practices, including restrictions on the operations of produced water disposal wells and imposing more stringent requirements on the permitting of such wells. The adoption and implementation of any new laws or regulations that restrict our ability to dispose of produced water gathered from our customer’s activities by limiting volumes, disposal rates, disposal well locations or otherwise, or requiring us to shut down disposal wells, could have a material adverse effect on our fluid transportation business, financial condition and results of operations.
Local governments also may seek to adopt ordinances within their jurisdictions regulating the time, place and manner of drilling activities in general or hydraulic fracturing activities in particular or prohibit the performance of well drilling in general or hydraulic fracturing in particular. If new federal, state or local laws or regulations that significantly restrict hydraulic fracturing are adopted, such legal requirements could result in delays, eliminate certain drilling and injection activities and make it more difficult or costly to perform hydraulic fracturing. Any such regulations limiting or prohibiting hydraulic fracturing could result in decreased oil and natural gas exploration and production activities and, therefore, adversely affect demand for our services and our business. Such laws or regulations could also materially increase our costs of compliance and doing business.
The adoption of new laws or regulations imposing reporting obligations on, or otherwise limiting, the hydraulic fracturing process could make it more difficult to complete oil and natural gas wells in shale formations, increase our costs of compliance and adversely affect the hydraulic fracturing services that we render for our exploration and production customers. In addition, if hydraulic fracturing becomes regulated at the federal level as a result of federal legislation or regulatory initiatives by the EPA, fracturing activities could become subject to additional permitting requirements, and also to attendant permitting delays and potential increases in cost, which could adversely affect our business and results of operations.
Climate change legislation or regulations restricting emissions of GHGs could result in increased operating costs and reduced demand for our services.
26
The EPA has determined that emissions of carbon dioxide, methane and other GHGs present an endangerment to the environment because emissions of such gases are contributing to the warming of the earth’s atmosphere and other climatic changes. Based on these findings, the EPA adopted regulations that restrict emissions of GHGs under existing provisions of the federal Clean Air Act including one that requires a reduction in emissions of GHGs from motor vehicles and another that requires certain preconstruction and operating permit reviews for GHG emissions from certain large stationary sources. The EPA has also adopted rules requiring the monitoring and reporting of GHGs from specified GHG emission sources, including, among others, certain oil and natural gas production facilities, on an annual basis. More recently, in June 2016, the EPA finalized regulations under the Clean Air Act that address emissions of methane from equipment and processes across the source category, including hydraulically fractured oil and natural gas well completions, and also imposes leak detection and repair requirements on operators. The BLM finalized similar rules in November 2016 that limit methane emissions from new and existing oil and gas operations on federal lands through limitations on the venting and flaring of gas, as well as enhanced leak detection and repair requirements. However, both the U.S. House of Representatives and the Senate have introduced resolutions seeking to repeal the BLM methane rules under the Congressional Review Act and future implementation of the BLM methane rules is uncertain. In any event, both the EPA and BLM methane rules impose substantially similar requirements.
From time to time the U.S. Congress has considered legislation to reduce emissions of GHGs, and almost one-half of the states have established GHG cap and trade programs. Most of these cap and trade programs work by requiring major sources of emissions or major producers of fuels, to acquire and surrender emission allowances. The number of allowances available for purchase is reduced each year in an effort to achieve the overall greenhouse gas emission reduction goal. In addition, in 2015, the U.S. participated in the United Nations Conference on Climate Change, which led to the creation of the Paris Agreement. The Paris Agreement requires countries to review and “represent a progression” in their intended nationally determined contributions, which set GHG emission reduction goals, every five years beginning in 2020. However, the Paris Agreement is not binding and, at present, the U.S.’s continued participation in the agreement remains uncertain.
Any new federal, regional or state restrictions on emissions of GHGs that may be imposed in areas in which we conduct business could result in increased compliance costs or additional operating restrictions on our customers. Such actions could also potentially make our customers’ products more expensive and thus reduce demand for those products, which could have a material adverse effect on the demand for our services and our business. Finally, some scientists have concluded that increasing concentrations of GHGs in the earth’s atmosphere may produce climate changes that have significant physical effects, such as increased frequency and severity of storms, droughts, and floods and other climatic events. If any such effects were to occur, they could have an adverse effect on our results of operations if they were to damage our equipment or facilities.
We are subject to extensive and costly environmental, and occupational health and safety laws, and regulations that may require us to take actions that will adversely affect our results of operations.
Our business is significantly affected by stringent and complex federal, state and local laws and regulations governing the emission or discharge of substances into the environment, protection of the environment and worker health and safety. Any failure by us to comply with such environmental and occupational health and safety laws and regulations may result in governmental authorities taking actions against our business that could adversely impact our operations and financial condition, including the following:
• | issuance of administrative, civil and criminal penalties; |
• | modification, denial or revocation of permits or other authorizations; |
• | imposition of limitations on our operations or orders prohibiting our operations altogether; and |
• | performance of site investigatory, remedial or other corrective actions. |
As part of our business, we handle, transport, and dispose of a variety of fluids and substances used by our customers in connection with their oil and natural gas exploration and production activities. We also generate and dispose of nonhazardous and hazardous wastes. The generation, handling, transportation, and disposal of these fluids, substances, and wastes are regulated by a number of laws, including CERCLA, RCRA, Clean Water Act, SDWA and analogous state laws. Failure to properly handle, transport or dispose of these materials or otherwise conduct our operations in accordance with these and other environmental laws could expose us to liability for governmental penalties, third-party claims, cleanup costs associated with releases of such materials, damages to natural resources, and other damages, as well as potentially impair our ability to conduct our operations. Moreover, certain of these environmental laws impose joint and several, strict liability even though our conduct in performing such activities was lawful at the time it occurred or the conduct of, or conditions caused by, prior operators or other third parties was the basis for such liability. In addition, environmental laws and regulations are subject
27
to frequent change and if existing laws, regulatory requirements or enforcement policies were to change in the future, we may be required to make significant unanticipated capital and operating expenditures.
More stringent trucking regulations may increase our costs and negatively impact our results of operations.
As part of the services we provide, we operate as a motor carrier and therefore are subject to regulation by the DOT, and by other various state agencies. These regulatory authorities exercise broad powers, governing activities such as the authorization to engage in motor carrier operations and regulatory safety, and hazardous materials labeling, placarding and marking. There are additional regulations specifically relating to the trucking industry, including testing and specification of equipment and product handling requirements. In addition, the trucking industry is subject to possible regulatory and legislative changes that may affect the economics of the industry by requiring changes in operating practices or by changing the demand for common or contract carrier services or the cost of providing truckload services. Some of these possible changes include increasingly stringent environmental regulations, changes in the hours of service regulations which govern the amount of time a driver may drive in any specific period, require onboard black box recorder devices or limits on vehicle weight and size. For example, in December 2016, the DOT finalized minimum training standards for new drivers seeking a commercial driver’s license. Certain motor vehicle operators are required to register with the DOT. This registration requires an acceptable operating record. The DOT periodically conducts compliance reviews and may revoke registration privileges based on certain safety performance criteria, and a revocation could result in a suspension of operations. Since 2010, the DOT has pursued its Compliance, Safety, Accountability (“CSA”) program, in an effort to improve commercial truck and bus safety. A component of CSA is the Safety Measurement System (“SMS”), which analyzes all safety violations recorded by federal and state law enforcement personnel to determine a carrier’s safety performance. The SMS is intended to allow DOT to identify carriers with safety issues and intervene to address those problems. However, in January 2016 the DOT proposed its Safety Determination rule, which would alter the DOT's methodology for determining when a motor carrier is unfit to operate a commercial motor vehicle. A final rule remains pending, and at this time, we cannot predict whether the rule will be adopted as proposed nor the effect such a revision may have on our safety rating.
Interstate motor carrier operations are subject to safety requirements prescribed by the DOT. To a large degree, intrastate motor carrier operations are subject to state safety regulations that mirror federal regulations. Such matters as weight and dimension of equipment are also subject to federal and state regulations.
From time to time, various legislative proposals are introduced, including proposals to increase federal, state or local taxes, including taxes on motor fuels, which may increase our costs or adversely impact the recruitment of drivers. We cannot predict whether, or in what form, any increase in such taxes applicable to us will be enacted.
New technology may hurt our competitive position.
The energy service industry is subject to the introduction of new techniques and services using new technologies, some of which may be subject to patent protection. As competitors and others use or develop new technologies or technologies comparable to ours in the future, we may lose market share or be placed at a competitive disadvantage. Further, we may face competitive pressure to implement or acquire certain new technologies at a substantial cost. Some of our competitors have greater financial, technical and personnel resources than we do, which may allow them to gain technological advantages or implement new technologies before we can. Additionally, we may be unable to implement new technologies or products at all, on a timely basis or at an acceptable cost. Limits on our ability to effectively use or implement new technologies may have a material adverse effect on our business, financial condition and results of operations.
Our assets require significant amounts of capital for maintenance, upgrades and refurbishment and may require significant capital expenditures for new equipment.
Our hydraulic fracturing fleets and other completion service-related equipment require significant capital investment in maintenance, upgrades and refurbishment to maintain their competitiveness. The costs of components and labor required to maintain our fleets have increased in the past and may increase in the future with increases in demand, which will require us to incur additional costs to make our remaining active fleets operational. Our fleets and other equipment typically do not generate revenue while they are undergoing maintenance, refurbishment or upgrades. Any maintenance, upgrade or refurbishment project for our assets could increase our indebtedness or reduce cash available for other opportunities. Further, such projects may require proportionally greater capital investments as a percentage of total asset value, which may make such projects difficult to finance on acceptable terms. To the extent we are unable to fund such projects, we may have less equipment available for service or our equipment may not be attractive to potential or current customers. Additionally, competition or advances in technology within our industry may require us to update or replace existing fleets or build or acquire new fleets. Such demands on our capital or reductions in demand for our hydraulic fracturing fleets and other completion service related
28
equipment and the increase in cost to maintain labor necessary for such maintenance and improvement, in each case, could have a material adverse effect on our business, liquidity position, financial condition, prospects and results of operations and may increase the cost to make our inactive fleets operational.
If we fail to maintain an effective system of internal controls, we may not be able to accurately report our financial results or prevent fraud. As a result, current and potential stockholders could lose confidence in our financial reporting, which would harm our business and the trading price of our common stock.
Effective internal controls are necessary for us to provide reliable financial reports, prevent fraud and operate successfully as a public company. If we cannot provide reliable financial reports or prevent fraud, our reputation and operating results would be harmed. We are currently a non-accelerated filer. Accordingly, we are currently exempt from the requirements of Section 404(b) of the Sarbanes-Oxley Act of 2002, and our independent registered public accounting firm is not required to audit the design and operating effectiveness of our internal controls and management’s assessment of the design and the operating effectiveness of such internal controls in connection with our 2016 audit. We cannot be certain that our efforts to develop and maintain our internal controls will be successful, that we will be able to maintain adequate controls over our financial processes and reporting in the future or that we will be able to comply with our obligations under Section 404 of the Sarbanes Oxley Act. Any failure to develop or maintain effective internal controls, or difficulties encountered in implementing or improving our internal controls, could harm our operating results or cause us to fail to meet our reporting obligations. Ineffective internal controls could also cause investors to lose confidence in our reported financial information, which would likely have a negative effect on the trading price of our common stock.
We could be adversely affected by violations of the U.S. Foreign Corrupt Practices Act and similar foreign anti-bribery laws.
The United States Foreign Corrupt Practices Act (the “FCPA”) and similar worldwide anti-bribery laws generally prohibit companies and their intermediaries and partners from making, offering or authorizing improper payments to non-U.S. government officials for the purpose of obtaining or retaining business. Although we are seeking to wind-down our international operations, we previously did business and may do business in the future in countries or regions where strict compliance with anti-bribery laws may conflict with local customs and practices. Our employees, intermediaries, and partners may face, directly or indirectly, corrupt demands by government officials, political parties and officials, tribal or insurgent organizations, or private entities in the countries in which we operate or may operate in the future. As a result, we face the risk that an unauthorized payment or offer of payment could be made by one of our employees, intermediaries, or partners even if such parties are not always subject to our control or are not themselves subject to the FCPA or other anti-bribery laws to which we may be subject. We are committed to doing business in accordance with applicable anti-bribery laws, and have implemented policies and procedures concerning compliance with such laws. Our existing safeguards and any future improvements, however, may prove to be less than effective, and our employees, intermediaries, and partners may engage in conduct for which we might be held responsible. Violations of the FCPA and other anti-bribery laws (either due to our acts, the acts of our intermediaries or partners, or our inadvertence) may result in criminal and civil sanctions and could subject us to other liabilities in the U.S. and elsewhere. Even allegations of such violations could disrupt our business and result in a material adverse effect on our business and operations.
The ability to attract and retain key personnel is critical to the success of our business and may be affected by our recent Chapter 11 Proceeding, the implementation of our Restructuring Plan and the transactions contemplated thereby.
The success of our business depends on our ability to attract and retain key personnel. The ability to attract and retain the talented employee base that our business demands may be difficult in light of our recent emergence from the Chapter 11 Proceeding, the uncertainties currently facing the business and changes we may make to our organizational structure to adjust to changing circumstances. We may need to adjust our compensation structure or enter into retention or other arrangements that could be costly to maintain. If executives, managers or other key personnel resign, retire or are terminated, or their service is otherwise interrupted, we may not be able to replace them in a timely manner and we could experience significant declines in productivity.
Certain provisions of our Certificate of Incorporation, Bylaws, Stockholders Agreement and our stockholder rights plan may make it difficult for stockholders to change the composition of our Board and may discourage, delay or prevent a merger or acquisition that some stockholders may consider beneficial.
Certain provisions of our Certificate of Incorporation and our Bylaws may have the effect of delaying or preventing changes in control if our Board determines that such changes in control are not in the best interests of the Company and our stockholders. The provisions in our Certificate of Incorporation and our Bylaws include, among other things, those that:
29
• | classify the Board; |
• | limit removal of directors; |
• | authorize our Board to issue preferred stock and to determine the price and other terms, including preferences and voting rights, of those shares without stockholder approval; |
• | establish advance notice procedures for nominating directors or presenting matters at stockholder meetings; |
• | prohibit cumulative voting; |
• | prohibit action by written consent following the termination of the Stockholders Agreement (as defined below); and |
• | provide that only the Board may call special meetings of stockholders. |
In addition, we have adopted a stockholder rights plan. While our stockholder rights plan and the above provisions have the effect of encouraging persons seeking to acquire control of the Company to negotiate with our Board, they could enable the Board to hinder or frustrate a transaction that some, or a majority, of the stockholders may believe to be in their best interests. These provisions may prevent or discourage attempts to remove and replace incumbent directors. These provisions may also frustrate or prevent any attempts by our stockholders to replace or remove our current management by making it more difficult for stockholders to replace members of our Board, which is responsible for appointing the members of our management.
We may issue preferred stock on terms that could adversely affect the voting power or value of our common stock.
Except as provided in a Stockholders Agreement with the Holders (as defined below), dated as of January 6, 2017 (as amended the “Stockholders Agreement”), our Certificate of Incorporation authorizes our Board to issue, without the approval of our stockholders, one or more classes or series of preferred stock having such designations, preferences, limitations and relative rights, including preferences over our common stock respecting dividends and distributions, as the Board may determine. The terms of one or more classes or series of preferred stock could adversely affect the voting power or value of our common stock. For example, we might grant holders of preferred stock the right to elect some number of directors in all events or on the happening of specified events or the right to veto specified transactions. Similarly, the repurchase or redemption rights or liquidation preferences we might assign to holders of preferred stock could affect the residual value of the common stock.
There may be circumstances in which the interests of our significant stockholders could be in conflict with the interests of our other stockholders.
Each of GSO Capital Solutions Fund II (Luxembourg) S.a.r.l. (together with its affiliates, “GSO”) and Solus Alternative Asset Management LP (together with its affiliates, “Solus”) or certain funds or accounts affiliated with and/or managed by them (each a “Holder” and, collectively, the “Holders”), both currently own approximately 13.4% of our outstanding common stock and are parties to the Stockholders Agreement, which gives them consent rights over certain material transactions. Circumstances may arise in which these Holders may have an interest in pursuing or preventing acquisitions, divestitures or other transactions, including the issuance of additional shares or debt, that, in their judgment, could enhance their investment in us or another company in which they invest. Such transactions might adversely affect us or other holders of our common stock.
Furthermore, pursuant to the Stockholders Agreement, GSO currently has the right to designate for nomination up to three directors and Solus currently has the right to designate for nomination up to two directors, as well as one non-voting observer, to the Board, subject in each case to maintaining certain levels of share ownership. The Stockholders Agreement also provides that, for so long as the Holders hold specified amounts of our common stock, in addition to the approval of our Board, the approvals of the Holders, in their capacity as stockholders, shall be required for certain corporate actions such as change in control transactions and acquisitions with a value in excess of $100 million.
In addition, our concentration of share ownership may adversely affect the trading price of our common stock because investors may perceive disadvantages in owning shares in companies with significant stockholders.
30
Future sales or the availability for sale of substantial amounts of our common stock, or the perception that these sales may occur, could adversely affect the trading price of our common stock and could impair our ability to raise capital through future sales of equity securities.
Our Amended and Restated Certificate of Incorporation authorizes us to issue 1,000,000,000 shares of common stock, of which an estimated 56,217,229 shares were outstanding as of February 24, 2017. This number includes 55,463,903 shares issued in connection with our emergence from bankruptcy, almost all of which are freely transferable without restriction or further registration pursuant to Section 1145 of the Bankruptcy Code. We also have 8,046,021 shares of common stock authorized for issuance as equity awards under the 2017 C&J Energy Services, Inc. Management Incentive Plan, of which 255,570 shares are issuable pursuant to outstanding options and 864,130 shares are issuable pursuant to outstanding restricted stock awards. In addition, as of February 24, 2017, warrants to purchase up to 1,178,894 shares of our common stock were outstanding and immediately exercisable, and we may issue in the future up to 2,360,166 Warrants to the Unsecured Claims Representative (as defined in the Restructuring Plan) for the benefit of the former holders of Unsecured Creditor Claims (as defined in the Restructuring Plan). Shares issued upon exercise of these warrants will generally be freely transferable without restriction or registration under the Securities Act pursuant to Section 1145 of the Bankruptcy Code.
A large percentage of our shares of common stock are held by a relatively small number of investors. We entered into a registration rights agreement, (the “Registration Rights Agreement”) with certain of those investors pursuant to which we have agreed to file a registration statement with the SEC to facilitate potential future sales of such shares by them. Sales of a substantial number of shares of our common stock in the public markets, or even the perception that these sales might occur (such as upon the filing of the aforementioned registration statement), could impair our ability to raise capital through a future sale of, or pay for acquisitions using, our equity securities.
We may issue shares of our common stock or other securities from time to time as consideration for future acquisitions and investments. If any such acquisition or investment is significant, the number of shares of our common stock, or the number or aggregate principal amount, as the case may be, of other securities that we may issue may in turn be substantial. We may also grant registration rights covering those shares of our common stock or other securities in connection with any such acquisitions and investments.
We cannot predict the effect that future sales of our common stock will have on the price at which our common stock trades or the size of future issuances of our common stock or the effect, if any, that future issuances will have on the market price of our common stock. Sales of substantial amounts of our common stock, or the perception that such sales could occur, may adversely affect the trading price of our common stock.
Item 1B. Unresolved Staff Comments
None.
Item 2. Properties
We lease office space for our principal executive headquarters, which is located at 3990 Rogerdale Rd., Houston, Texas 77042. In addition, we own or lease numerous other smaller facilities and administrative offices across the geographic regions in which we operate, including local sales offices and temporary facilities to house employees in regions where infrastructure is limited. Our leased properties are subject to various lease terms and expirations.
We believe all properties that we currently occupy are suitable for their intended uses. We believe that our current facilities are sufficient to conduct our operations. However, we continue to evaluate the purchase or lease of additional properties or the consolidation of our properties, as our business requires.
The following table shows our active owned and leased properties, categorized by geographic region as of December 31, 2016.
31
Region | Administrative and Sales Offices; Research and Technology Facilities | Operational Field Services Facilities | |
United States | |||
Owned | 4 | 102 | |
Leased | 18 | 106 | |
Canada | |||
Owned | — | 14 | |
Leased | 5 | 2 | |
Total | 27 | 224 | |
Item 3. Legal Proceedings
We are subject to various legal proceedings and claims incidental to or arising in the ordinary course of our business. Our management does not expect the outcome in any of these known legal proceedings, individually or collectively, to have a material adverse effect on our consolidated financial condition or results of operations.
Shareholder Litigation relating to the Nabors Merger
In July 2014, following the announcement that Old C&J, Nabors, and the Predecessor had entered into the Nabors Merger Agreement, a purported shareholder of Old C&J filed a putative class action lawsuit challenging the Nabors Merger. The lawsuit is styled City of Miami General Employees’ and Sanitation Employees’ Retirement Trust, et al. (“Plaintiff”) v. Comstock, et al.; C.A. No. 9980-CB, in the Court of Chancery of the State of Delaware, filed on July 30, 2014 (the “Shareholder Litigation”). Plaintiff in the Shareholder Litigation generally alleges that the board of directors of Old C&J (the “Old C&J Board”) breached their fiduciary duties by allegedly approving the Merger Agreement at an unfair price and through an unfair process. Plaintiff alleges that the Old C&J Board, or certain of them (i) failed to fully inform themselves of the market value of Old C&J, maximize its value and obtain the best price reasonably available for Old C&J, (ii) acted in bad faith and for improper motives, (iii) erected barriers to discourage other strategic alternatives and (iv) put their personal interests ahead of the interests of Old C&J shareholders. The Shareholder Litigation further alleges that Old C&J, Nabors and the Predecessor aided and abetted the alleged breaches of fiduciary duties by the Old C&J Board.
On October 29, 2015, Plaintiff filed an amended complaint naming additional defendants and generally alleging, in addition to the allegations described above, that (i) the special committee of the Old C&J Board and its advisors improperly conducted the court-ordered solicitation that the Delaware Supreme Court vacated and (ii) the proxy statement filed in connection with the Nabors Merger contains alleged misrepresentations and omits allegedly material information concerning the Nabors Merger and court-ordered solicitation process. The Shareholder Litigation asserts, in addition to the claims described above, claims for breach of fiduciary duty and aiding and abetting breach of fiduciary duty against the special committee of the Old C&J Board, its financial advisor Morgan Stanley, and certain employees of Old C&J. Following the death of Josh Comstock, our founder and former Chief Executive Officer and Chairman of the Old C&J Board, Plaintiff substituted the executor of Mr. Comstock’s estate in place of Mr. Comstock as a defendant in the Shareholder Litigation.
The defendants in the Shareholder Litigation filed motions to dismiss the amended complaint. On August 24, 2016, the Court of Chancery of the State of Delaware granted defendants’ motions and dismissed the Shareholder Litigation in its entirety with prejudice. On September 22, 2016, Plaintiffs filed a Notice of Appeal to the Delaware Supreme Court, appealing the dismissal of the Shareholder Litigation. Oral argument was held on March 1, 2017, and Plaintiffs’ appeal is still pending.
We cannot predict the outcome of this or any other lawsuit that might be filed, nor can we predict the amount of time and expense that will be required to resolve the Shareholder Litigation. We believe the Shareholder Litigation is without merit and we intend to defend against it vigorously.
U.S. Department of Justice Criminal Investigation into Pre-Nabors Merger Incident
32
There is a pending criminal investigation led by the United States Attorney’s Office for the District of North Dakota in connection with a fatality that occurred at a C&P Business facility in Williston, North Dakota on October 3, 2014 prior to the Company’s acquisition of the C&P Business in the Nabors Merger. We are cooperating fully with the investigation, and expect to continue to do so. At this time, the Company cannot predict the outcome of the investigation.
Item 4. Mine Safety Disclosures
Not applicable.
33
PART II
Item 5. Market for Registrant’s Common Equity and Related Shareholder Matters and Issuer Purchases of Equity Securities
Market Price of and Dividends on the Registrant’s Common Equity and Related Shareholder Matters
Old C&J completed its initial public offering in 2011 with a listing on the NYSE under the ticker “CJES.” Upon the closing of the Nabors Merger, shares of common stock of Old C&J were converted into common shares of the Predecessor on a 1-for-1 basis and the Predecessor's common shares began trading on the NYSE under the ticker “CJES.” Contemporaneously with the commencement of the Chapter 11 Proceeding, trading in the Predecessor’s common shares on the NYSE was suspended and such shares were ultimately delisted from the NYSE. On July 21, 2016, the Predecessor’s common shares began trading on the OTC’s Pink® Open Market under the symbol “CJESQ.”
On January 6, 2017, pursuant to the Restructuring Plan, all of our Predecessor’s outstanding common stock was canceled and the Successor issued an aggregate of 55,463,903 shares of new common stock to the Holders of Allowed Secured Lender Claims (as defined in the Restructuring Plan). The Successor also issued 1,180,083 Warrants (subject to adjustments pursuant to the terms of the Warrants) at an initial exercise price of $27.95 per warrant (subject to adjustments pursuant to the terms of the Warrants) to former holders of interests in our Predecessor and will issue in the future up to an additional 2,360,166 Warrants (subject to adjustments pursuant to the terms of the Warrants) at an initial exercise price of $27.95 per warrant (subject to adjustments pursuant to the terms of the Warrants) to the Unsecured Claims Representative for the benefit of the former holders of Unsecured Creditor Claims in accordance with the terms of the Restructuring Plan, the Confirmation Order, the Unsecured Creditor Agreement (as defined in the Plan) and the Warrant Agreement.
The common stock of the Company is not currently traded on a national securities exchange and no broker dealer is making an active market in our common stock, but certain transactions in the Company’s common stock have been reported on the OTC “Grey marketplace” under the symbol “CJJY” beginning January 12, 2017. Broker-dealers must report OTC “Grey marketplace” trades to FINRA; therefore trade data is available on http://www.otcmarkets.com and other public sources. Information contained in or available through the OTC Markets website is not part of or incorporated into this Annual Report or any other report that we may file with or furnish to the SEC. Our common stock has been approved for trading on the NYSE MKT and we expect it to begin trading on the NYSE MKT under the symbol "CJ" on March 6, 2017. We expect that transactions in our common stock will continue to be reported on the OTC until the close of the market on March 3, 2017.
The number of shareholders of record of our common stock was approximately 24 as of February 24, 2017. The number of registered holders does not include holders that have shares of common stock held for them in “street name,” meaning that the shares are held for their accounts by a broker or other nominee. In these instances, the brokers or other nominees are included in the number of registered holders, but the underlying holders of the common stock that have shares held in “street name” are not.
We have not declared or paid any cash dividends on our common stock. We currently intend to retain all future earnings for the development and growth of our business, and we do not anticipate declaring or paying any cash dividends to holders of our common stock in the foreseeable future. Payments of dividends, if any, will be at the discretion of our Board and will depend on our results of operations, financial condition, capital requirements and other factors deemed relevant by our Board. Additionally, covenants contained in our New Credit Facility restrict the payment of cash dividends on our common stock. Please read Part II, Item 7 “Management’s Discussion and Analysis of Financial Condition and Results of Operations-Liquidity and Capital Resources-Description of our Credit Agreement” in this Annual Report.
Recent Sales of Unregistered Securities
Rights Offering, Backstop Commitment Agreement
On December 6, 2016, we entered into a backstop commitment agreement (the “Backstop Commitment Agreement”), pursuant to which certain holders of our unsecured indebtedness as of such date (the “Backstop Parties”) agreed to backstop a $200 million cash investment in the Company pursuant to a rights offering (the “Rights Offering”) conducted in accordance with the Restructuring Plan.
In accordance with the Restructuring Plan, the Backstop Commitment Agreement and the Rights Offering procedures, we offered eligible creditors, including the Backstop Parties, the right to purchase common stock upon emergence from the Chapter 11 Proceeding for an aggregate purchase price of $200 million. The Rights Offering, which commenced on
34
November 15, 2016 and ended on December 9, 2016, provided holders of eligible secured claims under our prior credit agreement as of the record date set therefor to be granted rights entitling each such holder to subscribe to purchase an amount of common stock (such common stock offered for purchase pursuant to the Rights Offering, the “Rights Offering Shares”) up to such holders’ respective pro rata share of such eligible secured claims at a per share price of $13.58. Under the Backstop Commitment Agreement, the Backstop Parties agreed to purchase, severally and not jointly, the Rights Offering Shares that were not duly subscribed to by parties other than Backstop Parties pursuant to the Rights Offering at the same per share price as the Rights Offering (the “Backstop Commitment”).
We paid the Backstop Parties on the Plan Effective Date a put option premium equal to 5.0% of the $200 million committed amount (the “Put Option Premium”) in the form of common stock at the same per share price offered in the Rights Offering. All amounts paid to the Backstop Parties in their capacities as such for the Put Option Premium were paid pro rata based on the amount of their respective Backstop Commitments. As a condition to the closing of the transactions contemplated by the Backstop Commitment Agreement, we entered into a Registration Rights Agreement with the Backstop Parties entitling such Backstop Parties to request that the Company register their securities for sale under the Securities Act at various times and upon the terms and conditions set forth in the Registration Rights Agreement.
New Common Stock
On the Plan Effective Date, pursuant to the terms of the Restructuring Plan, we issued an aggregate of 55,463,903 shares of common stock to the Holders of Allowed Secured Lender Claims (as defined in the Restructuring Plan). We also issued 1,180,083 warrants (subject to adjustments pursuant to the terms of the Warrants) at an initial exercise price of $27.95 per warrant (subject to adjustments pursuant to the terms of the Warrants) to former holders of Interests in our Predecessor and will issue in the future up to an additional 2,360,166 warrants (subject to adjustments pursuant to the terms of the Warrants) at an initial exercise price of $27.95 per warrant (subject to adjustments pursuant to the terms of the Warrants) to the Unsecured Claims Representative for the benefit of the former holders of Unsecured Creditor Claims after the Plan Effective Date in accordance with the terms of the Restructuring Plan, the Confirmation Order, the Unsecured Creditor Agreement and the Warrant Agreement.
Of the 55,463,903 shares of common stock issued on the Plan Effective Date,
• | 39,999,997 shares of common stock were issued pro rata to certain holders of claims arising under our Predecessor's prior credit agreement (the “Plan Shares”); |
• | 14,408,789 shares of common stock were issued to participants in the Right Offering at a per share purchase price of $13.58, for an aggregate purchase price of approximately $195.7 million (the “Rights Offering Shares”); |
• | 318,743 shares of common stock were issued to the Backstop Parties under the Backstop Parties’ commitment to purchase Unsubscribed Shares (as defined in the Backstop Commitment Agreement) at a per share purchase price of $13.58, for an aggregate purchase price of approximately $4.3 million (the “Backstop Shares”); and |
• | 736,374 shares of common stock were issued to the Backstop Parties as the Put Option Premium (as defined in the Backstop Commitment Agreement) under the Backstop Commitment Agreement, representing 5.0% of the $200 million committed amount and a per share purchase price of $13.58 (the “Put Option Shares”). |
The Warrants, Plan Shares, Rights Offering Shares and Put Option Shares were issued pursuant to an exemption from the registration requirements of the Securities Act under Section 1145 of the Bankruptcy Code. The Backstop Shares were issued pursuant to the exemption from the registration requirements of the Securities Act provided by Section 4(a)(2) thereof.
Purchases of Equity Securities by the Issuer or Affiliated Purchasers
Repurchases of Equity Securities
The following table summarizes stock repurchase activity for the fiscal year ended December 31, 2016 (in thousands, except average price paid per share). All of the repurchases below are the Predecessor common shares that were withheld to satisfy tax withholding obligations of employees that arose upon the vesting of restricted shares. The value of such shares is based on the closing price of the Predecessor common shares on the vesting date. No shares were purchased as part of a publicly announced program.
35
Total Number of Shares Purchased (a) | Average Price Paid Per Share | ||||||
January 1—January 31 | 6,800 | $ | 4.76 | ||||
February 1—February 29 | 120,618 | 2.19 | |||||
March 1—March 31 | 63,582 | 1.77 | |||||
April 1—April 30 | 8,065 | 1.92 | |||||
May 1—May 31 | 970 | 0.84 | |||||
June 1—June 30 | 105,593 | 0.55 | |||||
July 1—July 31 | 4,429 | 0.56 | |||||
August 1—August 31 | — | — | |||||
September 1—September 30 | — | — | |||||
October 1—October 31 | 3,369 | 0.59 | |||||
November 1—November 30 | — | — | |||||
December 1—December 31 | — | — | |||||
(a) Represents shares that were withheld by us to satisfy tax withholding obligations of employees that arose upon the vesting of restricted shares. The value of such shares is based on the closing price of our common shares on the vesting date.
Stock Performance Graph
The following graph compares the cumulative total return to shareholders on our (as the Predecessor) common shares, the Russell 2000 Index and an industry Peer Group. The Peer Group consists of Basic Energy Services, Inc.; Key Energy Services, Inc.; Superior Energy Services, Inc.; RPC, Inc. and Pioneer Energy Services Corp. The graph assumes that $100.00 was invested in our common shares on July 29, 2011 (the date Old C&J common shares began to trade in connection with our initial public offering) and in the comparison groups and assumes the reinvestment of all cash dividends prior to any tax effect. We have not declared any dividends during the periods covered by this graph. This graph depicts the past performance of our common shares through January 5, 2017 (the date prior to our emergence from the Chapter 11 Proceeding), and in no way should be used to predict future share performance.
36
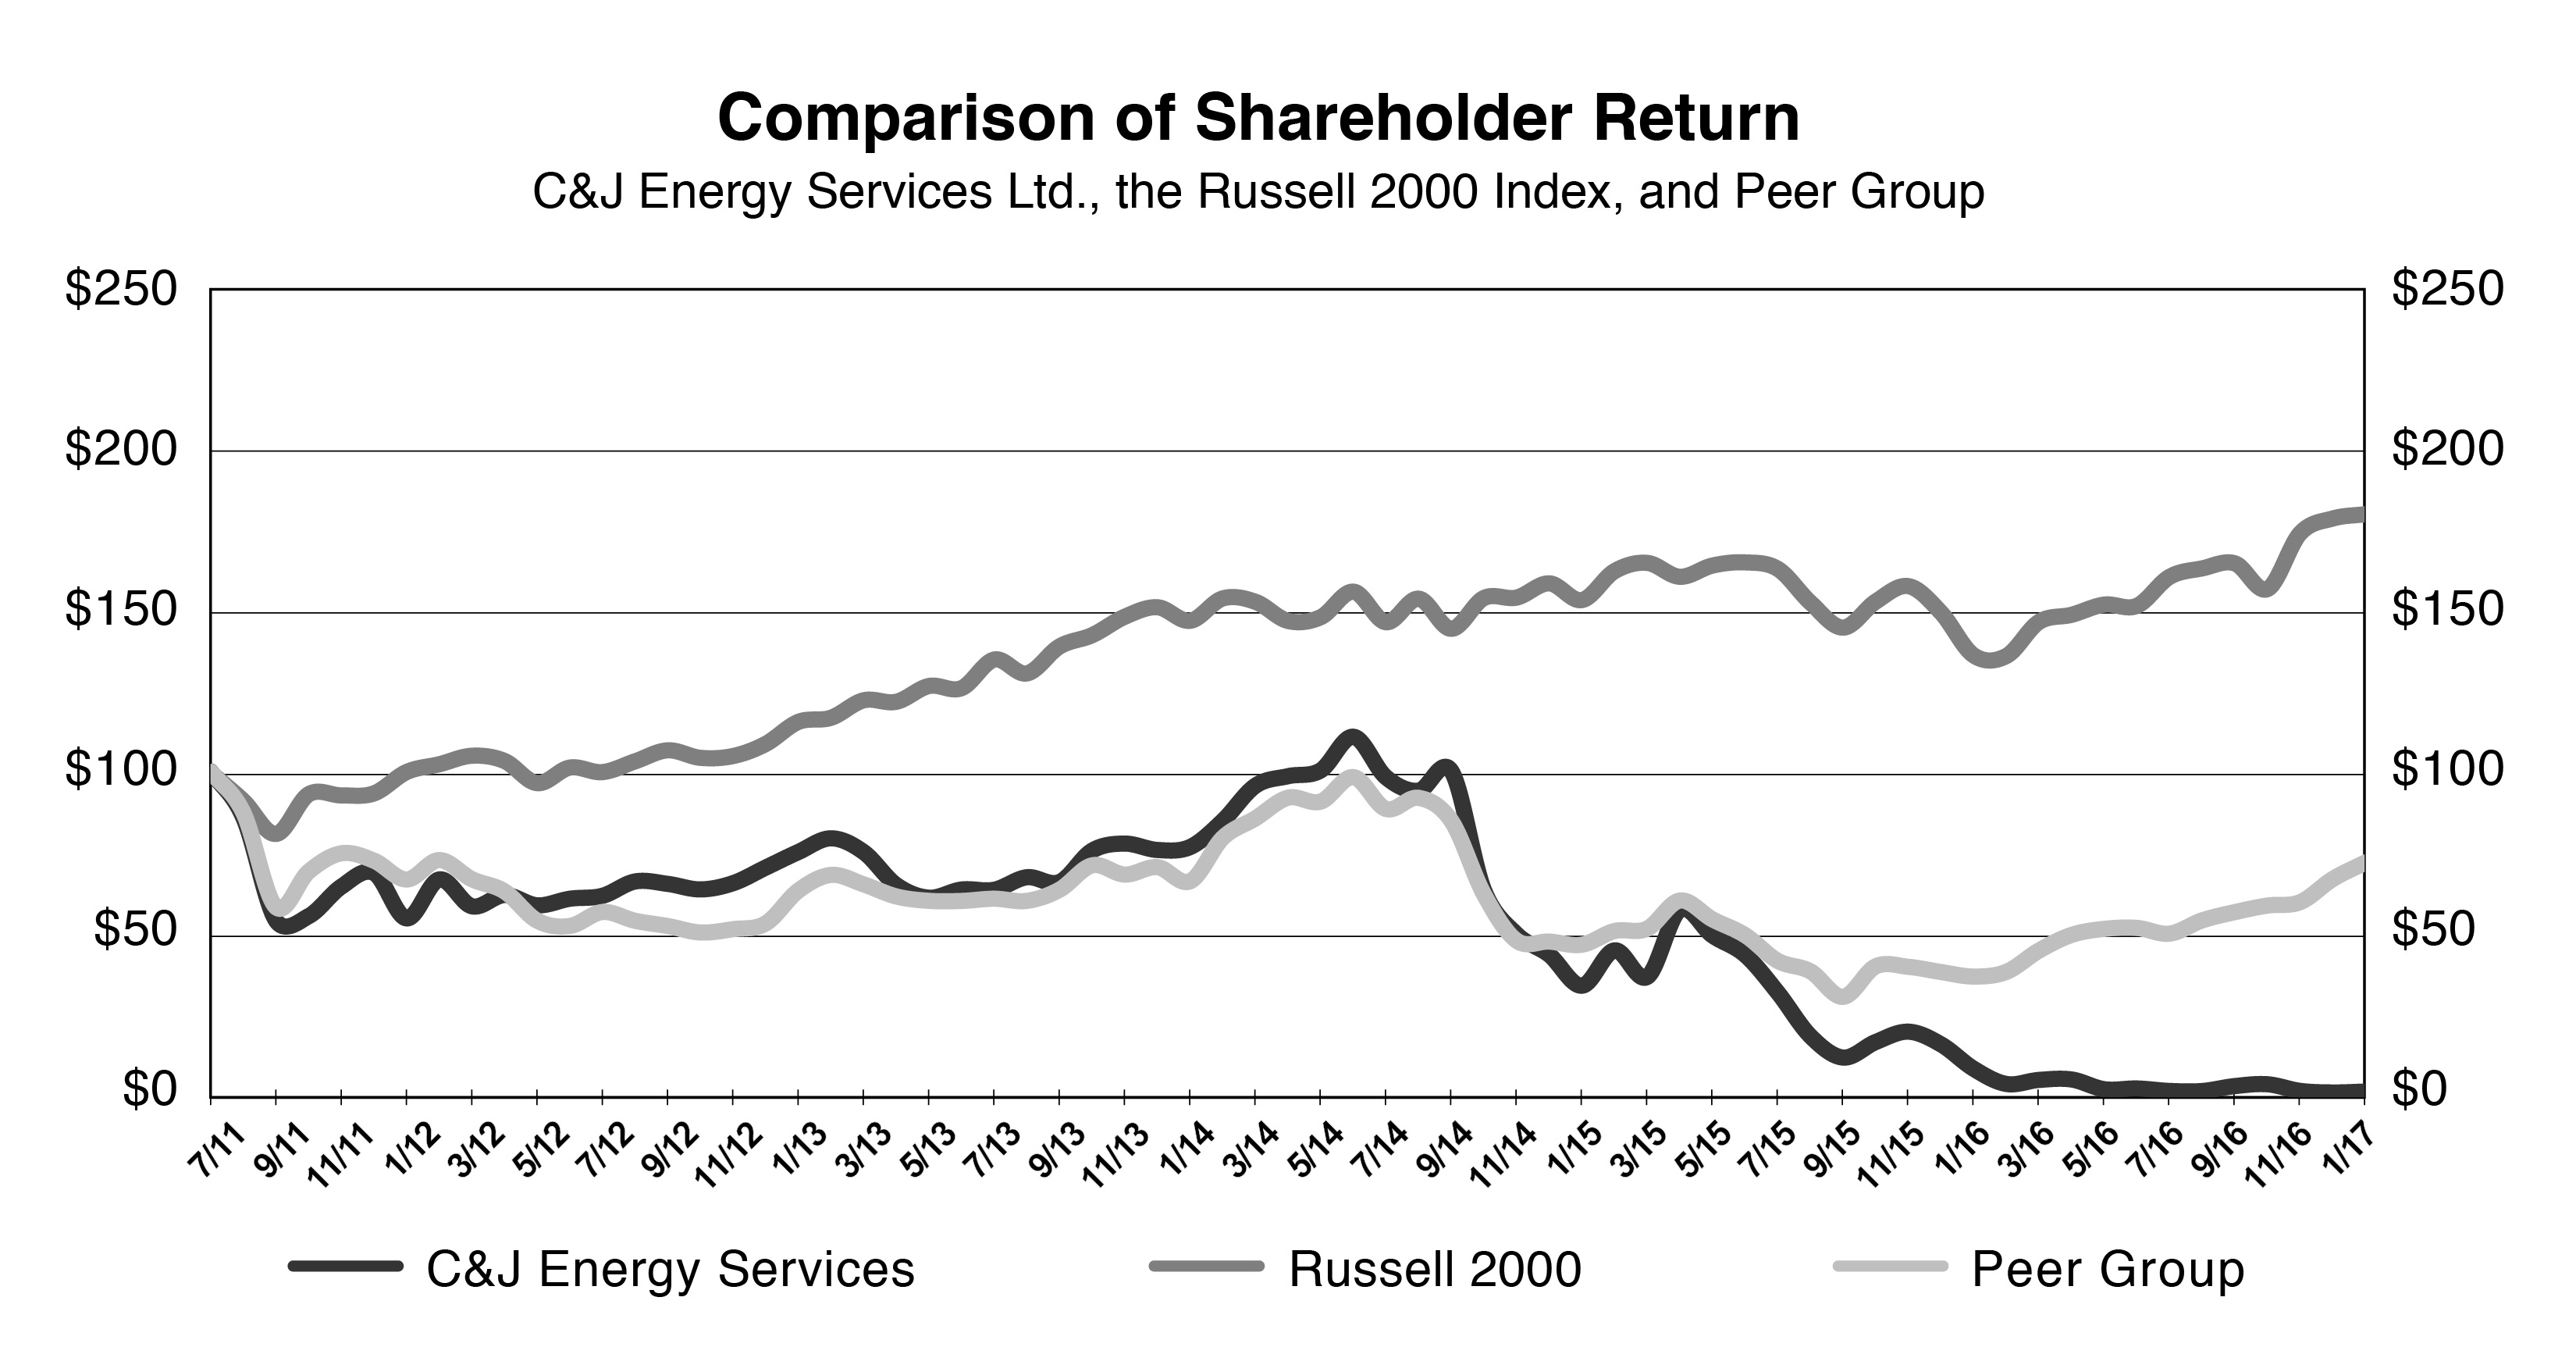
Item 6. Selected Financial Data
This section presents our selected consolidated financial data for the periods and as of the dates indicated. The selected historical consolidated financial data presented below is not intended to replace our historical consolidated financial statements. The following selected consolidated financial data should be read in conjunction with both Part II, Item 7 “Management’s Discussion and Analysis of Financial Condition and Results of Operations” and Part II, Item 8 “Financial Statements and Supplementary Data” of this Annual Report in order to understand those factors, such as the Nabors Merger, which may affect the comparability of the Selected Financial Data:
Years Ended December 31, | ||||||||||||||||||||
2016 | 2015 | 2014 | 2013 | 2012 | ||||||||||||||||
(In thousands except per share amounts) | ||||||||||||||||||||
Revenue | $ | 971,142 | $ | 1,748,889 | $ | 1,607,944 | $ | 1,070,322 | $ | 1,111,501 | ||||||||||
Net income (loss) | (944,289 | ) | (872,542 | ) | 68,823 | 66,405 | 182,350 | |||||||||||||
Net income (loss) per common share | ||||||||||||||||||||
Basic | (7.98 | ) | (8.48 | ) | 1.28 | 1.25 | 3.51 | |||||||||||||
Diluted | (7.98 | ) | (8.48 | ) | 1.22 | 1.20 | 3.37 | |||||||||||||
Total assets | 1,361,601 | 2,198,952 | 1,612,746 | 1,132,300 | 1,012,757 | |||||||||||||||
Long-term debt and capital lease obligations, excluding current portion | — | 1,108,123 | 349,875 | 164,205 | 173,705 | |||||||||||||||
37
ITEM 7. MANAGEMENT’S DISCUSSION AND ANALYSIS OF FINANCIAL CONDITION AND RESULTS OF OPERATIONS
The following discussion and analysis of our financial condition and results of operations is intended to assist you in understanding our business and results of operations together with our present financial condition. This section should be read in conjunction with the audited consolidated financial statements and the related notes thereto included elsewhere in this Annual Report. This discussion and analysis contains forward-looking statements that involve risks and uncertainties. Our actual results may differ materially from those discussed in any forward-looking statement because of various factors, including, without limitation, those described in the sections titled “Cautionary Note Regarding Forward-Looking Statements” and Part I, Item 1A “Risk Factors” of this Annual Report.
Introductory Note and Corporate Overview
C&J Energy Services, Inc., a Delaware corporation (the “Successor” and together with its consolidated subsidiaries and for periods subsequent to the Plan Effective Date (as defined below), “C&J” or the “Company”), is a leading provider of well construction, well completion, well support and other complementary oilfield services to oil and gas exploration and production (“E&P”) companies in North America. The Company offers a comprehensive, vertically-integrated suite of services throughout the life cycle of the well, including hydraulic fracturing, cased-hole wireline and pumpdown, cementing, directional drilling, coiled tubing, rig services, fluids management and other support services. The Company is headquartered in Houston, Texas and operates in all active onshore basins in the continental United States and Western Canada. For a description of our history, including our formation, the Nabors Merger and the Chapter 11 Proceeding, please see “Overview of our Business” in Part I, Item 1 of this Annual Report.
Business Overview
We are a leading provider of well construction, well completion, well support and other complementary oilfield services to oil and gas exploration and production companies in North America. We offer a comprehensive, vertically-integrated suite of services throughout the life cycle of the well, including hydraulic fracturing, cased-hole wireline and pumpdown, cementing, directional drilling, coiled tubing, rig services, fluids management and other support services. We are headquartered in Houston, Texas and operate in all active onshore basins in the continental United States and Western Canada.
Our operating and financial performance is heavily influenced by drilling, completion and production activity by our customers, which is significantly impacted by commodity prices. We have invested heavily in strategic initiatives to strengthen, expand and diversify our company through service line diversification, vertical integration and technological advancement. In our day-to-day operations, we utilize equipment and products manufactured by our vertically integrated businesses, and we also sell such equipment and products to third-party customers in the global energy services industry.
In late 2014, oil prices began a substantial and rapid decline, and the severe weakness and volatility continued throughout 2015. As we entered 2016, we experienced a sharp drop in activity across our customer base as operators reacted to further declines in oil prices and the deteriorating onshore drilling rig count. The significant volatility in commodity prices continued through much of 2016 and, although both crude oil and natural gas prices began to increase modestly and stabilize in late 2016, commodity prices, in general, remain significantly lower than the industry average experienced in recent years. Notwithstanding the relatively low level of prices, our customers have gradually started to increase activity, which resulted in slightly improved operational and financial performance in both the third and fourth quarters of 2016. Additionally, as discussed below under “Our Reportable Business Segments-Completion Services-Completion Services Outlook” and “Our Reportable Business Segments-Well Support Services-Well Support Services Outlook,” we are expecting improved activity levels and pricing across several of our business lines during 2017 and 2018.
Recent Developments
Chapter 11 Proceeding
On the Plan Effective Date, the Predecessor C&J Companies substantially consummated the Restructuring Plan and emerged from the Chapter 11 Proceeding. Upon emergence from the Chapter 11 Proceeding, the Company adopted Fresh Start accounting in accordance with the provisions set forth in Accounting Standards Codification (“ASC”) 852 - Reorganizations. For more information regarding the adoption of Fresh Start accounting, see Note 4 - Fresh Start Accounting in Part II, Item 8 “Financial Statements and Supplementary Data” of this Annual Report.
38
For a description of the Chapter 11 Proceeding, please see “Overview of Our Business” in Part I, Item 1 of this Annual Report. For additional discussion of the known, material risks associated with our emergence from the Chapter 11 Proceeding , please see “Risk Factors” in Part I, Item 1A of this Annual Report, as well as “Liquidity and Capital Resources” in this Part II, Item 7 of this Annual Report.
Our Reportable Business Segments
As of December 31, 2016, our reportable business segments were:
• | Completion Services, which consists of the following service lines: (1) hydraulic fracturing; (2) Casedhole Solutions, which includes cased-hole wireline and pumpdown services, wireline logging, perforating, pressure pumping, well site make-up and pressure testing and other complementary services; (3) well construction services, specifically cementing and directional drilling services; and (4) research & technology (R&T), which is primarily engaged in the engineering and production of certain parts and components, such as perforating guns and addressable switches, which are used in the completion process |
• | Well Support Services, which consists of the following service lines: (1) rig services, including workover and other support services primarily used for routine repair and maintenance of oil and gas wells, re-drilling operations and plugging & abandonment operations; (2) fluids management services, which provides storage, transportation and disposal services for produced fluids and fluids used in the drilling, completion and workover of oil and gas wells; (3) coiled tubing services, primarily used for frac plug drill-out during completion operations and for well workover and maintenance; (4) artificial lift applications; and (5) other well support services. |
• | Other Services, which consists of our smaller non-core service lines that have either been divested, or are in the process of being divested, including our specialty chemical business (divested in June 2016), equipment manufacturing and repair business (initial divestiture in January 2017, and remainder divested in February 2017) and our international coiled tubing operations in the Middle East (operations ceased late 2015, and began winding down in 2016). |
Our reportable business segments are described in more detail below; for financial information about our reportable business segments, including revenue from external customers and total assets by reportable business segment, please see “Note 14 - Segment Information” in Part II, Item 8 “Financial Statements and Supplementary Data” of this Annual Report.
Completion Services
The core services provided through our Completion Services segment are hydraulic fracturing and cased-hole wireline and pumpdown services. We utilize our in-house manufacturing capabilities, including our data acquisition and control instruments business, to offer a technologically advanced and efficiency focused range of completion techniques. Our strategy is to offer our completion services as a bundled package in order to provide an integrated, value-added solution and maximize efficiency for our customers. Our well construction services, specifically cementing and directional drilling services, and our R&T division, which includes manufacturing capabilities, are also managed through our Completions Services segment. The majority of revenue for this segment is generated by our hydraulic fracturing business, and we consider our hydraulic fracturing service line and our cased-hole wireline and pumpdown services line to be our core service lines within this segment.
During the fourth quarter of 2016, our hydraulic fracturing service line deployed, on average, approximately 430,000 horsepower out of our current estimated fleet of approximately 820,000 horsepower. In our cased-hole wireline and pumpdown services line, we deployed, on average, approximately 60 wireline trucks and 42 pumpdown units out of our current estimated fleet of approximately 127 trucks and 57 pumpdown units. In our cementing service line, we deployed, on average, approximately 9 units out of our current estimated asset base of approximately 36 units. However, not all of our deployed assets are utilized fully, or at all, at any given time, due to, among other things, routine scheduled maintenance and downtime. Additionally, in response to the continued competitive landscape, we have focused on operational rightsizing measures to better align our assets with current industry demand, which has included stacking or idling unproductive equipment across our asset base within each service line.
Management evaluates the operational performance of our Completions Services segment and allocates resources primarily based on Adjusted EBITDA because management believes that Adjusted EBITDA provides important information about the activity and profitability of our lines of business within this segment. Adjusted EBITDA is a non-GAAP financial
39
measure computed as total earnings (loss) before net interest expense, income taxes, depreciation and amortization, other income (expense), net, net gain or loss on disposal of assets, acquisition-related costs, and non-routine items.
For the year ended December 31, 2016, revenue from our Completion Services segment was $544.0 million, representing approximately 56.0% of our total revenue, compared with revenue of $1.1 billion for the year ended December 31, 2015, which represents a 52.2% year-over-year decrease. Adjusted EBITDA from this segment for the year ended December 31, 2016 was $(39.6) million, compared with $39.9 million of Adjusted EBITDA for the year ended December 31, 2015, which represents a 199.4% year-over-year decrease.
Year Ended | |||||||
December 31, 2016 | December 31, 2015 | ||||||
Revenue | |||||||
Hydraulic Fracturing | $ | 353,929 | $ | 797,914 | |||
Wireline & Pumpdown | 159,317 | 296,202 | |||||
Other (Cementing, Directional Drilling and Research & Technology) | 30,712 | 44,405 | |||||
Total revenue | $ | 543,958 | $ | 1,138,521 | |||
Adjusted EBITDA | $ | (39,628 | ) | $ | 39,851 | ||
Average active hydraulic fracturing horsepower | 480,000 | 790,000 | |||||
Total fracturing stages | 11,413 | 16,011 | |||||
Average active wireline trucks | 68 | 115 | |||||
Average active pumpdown units | 44 | 56 | |||||
Please read Note 14 - Segment Information” in Part II, Item 8 “Financial Statements and Supplementary Data” of this Annual Report, for a reconciliation of Adjusted EBITDA, a non-GAAP financial measure, to net income (loss), which is the nearest comparable U.S. GAAP financial measure (in thousands) on a reportable segment basis for the years ended December 31, 2016 and 2015.
Due to improving commodity prices and higher North American drilling rig count, fourth quarter revenue and Adjusted EBITDA from our Completion Services segment benefited from higher overall utilization and slightly improved pricing levels in all service lines within most of our core operating basins. In our hydraulic fracturing service line, we witnessed an increase in completion activity, which resulted in the reduction of available frac days, slightly higher pricing and improved margins throughout the fourth quarter. Despite the improved market conditions, the primary driver behind the majority of the margin improvement continued to be our efforts to aggressively control costs. In our cased-hole wireline and pumpdown services line, increases in completion activity caused capacity to tighten in most of our core operating basins, which resulted in increased utilization and greater market share gains as well as higher overall pricing. Additionally, our wireline operations continue to experience cost savings from utilizing our in-house manufactured perforating equipment and addressable switches. In our cementing service line, which comprises the vast majority of the remaining revenue in the Completion Services segment, key customers in our core Northeast and West Texas markets requested that we deploy additional crews due to increased efficiencies and superior service quality, which allowed us to continue expanding our growing market share position.
Completion Services Outlook
In 2017, we expect our Completion Services segment to experience improved overall activity levels as many of our key customers continue to increase their rig count and completion activity. Due to improving market conditions and increasing customer demand, available frac days continue to decrease and many customers have begun to inquire about securing dedicated hydraulic fracturing fleets. Additionally, we were recently awarded a substantial package of completion services work in the Eagle Ford Shale Trend in South Texas, and we anticipate increasing our operating fleet count to eleven horizontal hydraulic fracturing fleets during the first quarter of 2017. As a result, we are expecting that pricing for many of our services will increase, our utilization will improve and that we would redeploy additional hydraulic fracturing fleets, wireline trucks and
40
pumpdown units during 2017 and 2018, in each case assuming that current market trends continue. However, improving activity levels, pricing and the deployment of equipment are all dependent upon macroeconomic and commodity price stability, and our expectations could change if market conditions change. Despite the continued competitive landscape, we have recently begun to experience market share gains in most of our completion services’ lines as certain competitors continue to withdraw or permanently leave the marketplace. As we continue to emerge from the challenging commodity price environment, our primary focus will be to remain one of the premier completion services providers and to continue to service the needs of all of our customers in a safe, cost efficient manner, which will best position the Company for future growth and success.
Well Support Services
Our Well Support Services segment focuses on post-completion activities at the well site, and includes rig services, including workover, plug and abandonment, fluids management, coiled tubing, artificial lift applications and other specialized well site services. The majority of revenue for this segment is generated by our rig services line, and we consider our rig services line, fluids management service line and coiled tubing service line to be our core service lines within this segment.
During the fourth quarter of 2016, our workover rig services line deployed, on average, approximately 145 workover rigs per workday out of our estimated average fleet of approximately 483 workover rigs. In our coiled tubing service line, we deployed, on average, approximately 25 units out of our current estimated average fleet of approximately 44 coiled tubing units. In our fluids management service line, we deployed, on average, approximately 640 fluid services trucks per workday and approximately 1,054 frac tanks per workday out of our estimated average fleets of approximately 1,329 trucks and 4,903 tanks, respectively. In our fluids management service line, we own 29 private salt water disposal wells for fluids disposal purposes. However, not all of our deployed assets are utilized fully, or at all, at any given time, due to, among other things, routine scheduled maintenance and downtime. Additionally, in response to the continued competitive landscape, we have focused on operational rightsizing measures to better align our assets with current industry demand, which has included idling unproductive equipment across our asset base within each service line.
Management evaluates the operation and performance of our Well Support Services segment and allocates resources primarily based on activity levels, specifically rig and trucking hours, as well as Adjusted EBITDA. The following table presents rig and trucking hours for our Well Support Services for the period from the Nabors Merger date, March 24, 2015 through December 31, 2015 and for the year ended December 31, 2016 (dollars in millions):
Year Ended | |||||||
December 31, 2016 | December 31, 2015 | ||||||
Revenue | |||||||
Rig Services | $ | 197,003 | $ | 248,547 | |||
Fluids Management Services | 132,486 | 169,934 | |||||
Coiled Tubing Services | 55,829 | 122,878 | |||||
Other Well Support Services (includes ESPCT) | 34,279 | 40,783 | |||||
Total revenue | $ | 419,597 | $ | 582,142 | |||
Adjusted EBITDA | $ | 17,460 | $ | 79,966 | |||
Average active workover rigs | 197 | 275 | |||||
Total workover rig hours | 430,076 | 465,926 | |||||
Average coiled tubing units | 45 | 45 | |||||
Average active coiled tubing units | 27 | 34 | |||||
Average fluids management trucks | 1,411 | 1,444 | |||||
Average active fluids management trucks | 725 | 1,076 | |||||
Total fluids management truck hours | 1,384,898 | 1,653,417 | |||||
41
Please read Note 14 - Segment Information” in Part II, Item 8 “Financial Statements and Supplementary Data” of this Annual Report, for a reconciliation of Adjusted EBITDA, a non-GAAP financial measure, to net income (loss), which is the nearest comparable U.S. GAAP financial measure (in thousands) on a reportable segment basis for the years ended December 31, 2016 and 2015.
During the fourth quarter, both revenue and Adjusted EBITDA declined in our Well Support Services segment primarily due to downtime associated with severe weather in certain core operating basins and the typical fourth quarter seasonal slowdown as customers exhausted their annual budgets and began budgeting for the coming year. Despite lower overall segment revenue and Adjusted EBITDA, revenue in our rig services service line increased slightly as pricing stabilized and our average daily working rig count increased prior to the effects of the seasonal slowdown. We witnessed stable, to slightly higher, rig services activity and pricing in our core operating regions in the Southwest, Rocky Mountains, California and Western Canada; however, the fragmented marketplace remains extremely competitive. After a slow start due to warm weather, our Western Canada rig services service line experienced increased utilization, which partially offset some of the utilization decline and competitive pricing experienced in the United States in both our rig services and fluids management service lines. In our fluids management service line, utilization was negatively impacted by the seasonal slowdown and pricing pressure due to the predatory pricing tactics of certain of our competitors. In our coiled tubing service line, pricing remained competitive and utilization was negatively affected by the seasonal slowdown, but we continued to enhance our overall market share position as completion activity increased and competitors continued to leave the marketplace.
Well Support Services Outlook
In 2017, we expect activity levels to gradually improve, as higher overall commodity prices have encouraged certain of our largest customers to begin allocating more capital towards well workover and maintenance, which could result in higher overall utilization and enhanced revenue growth in this segment. Additionally, in our rig services service line, we have recently witnessed opportunities to continue to grow market share due to our superior service quality and safety track record. In our fluids management service line, we continue to focus on quality work with core customers and to aggressively manage costs in order to maintain profitability while the market continues to suffer from overall low pricing. We have also won additional work in most of our core basins due to competitor service quality issues, and we have recently witnessed pockets of pricing improvement in select core regions. Despite these recent positive data points, the fluids management service line continues to suffer from significant over capacity and increased competition from continued infrastructure build-out. In our coiled tubing service line, we continue to high grade our customer base and have remained focused on higher margin completion oriented work and acid and nitrogen workover and maintenance work in select basins. We have experienced increases in activity, and pricing to a smaller extent, in select core basins, such as South Texas, and we continue to expand our market share in West Texas and the Mid-Continent. As a result, we are expecting modest increases in rig and truck hours as well as modest growth in coiled tubing units deployed during 2017 and 2018. Similarly, we are expecting pricing to remain flat with modest increases possible in rig services and fluids management, with more significant gains in coiled tubing due to a combination of better pricing, utilization and efficiency gains during 2017 and 2018. Despite these recent segment improvements, activity levels are dependent upon macroeconomic and commodity price stability, and the market remains competitive and customers remain highly price sensitive. We will continue with our strategy of aggressive cost control and focusing on markets and customers that generate positive Adjusted EBITDA. Our near-term strategy will continue to focus on enhancing margins and profitability, properly managing capital spending levels and positioning the business to capitalize on opportunities as the market recovers.
Other Services
Our Other Services segment consists of our smaller, non-core service lines that have either been divested, or are in the process of being divested, including our specialty chemical business (divested in June 2016), our equipment manufacturing and repair business (initial divestiture in January 2017, and remainder divested in February 2017) and our international coiled tubing operations in the Middle East (operations ceased late 2015, and began winding down in 2016).
Our Other Services segment contributed $7.6 million of revenue for the year ended December 31, 2016, representing approximately 0.8% of our total revenue, compared with $28.2 million of revenue for the year ended December 31, 2015, which represents a 73.1% year-over-year decrease. Adjusted EBITDA from this segment for the year ended December 31, 2016 was $(5.8) million compared with $(1.3) million for the year ended December 31, 2015, which represents a 335.3% year-over-year decrease. Like our core services lines, the businesses comprising our Other Services reportable business segment were negatively impacted by the widespread reduction in drilling, completion and production activity over the course of the year.
42
With respect to the fourth quarter of 2016, revenue from our Other Services segment was $1.9 million, representing approximately 0.2% of our total revenue, compared to revenue of $2.0 million for the third quarter of 2016, which represents a 5.0% decrease quarter over quarter. Fourth quarter Adjusted EBITDA from this segment was ($1.2 million), compared to Adjusted EBITDA of ($2.1 million) for the third quarter of 2016, which represents a 42.9% sequential increase.
Please read Note 14 - Segment Information” in Part II, Item 8 “Financial Statements and Supplementary Data” of this Annual Report, for a reconciliation of Adjusted EBITDA, a non-GAAP financial measure, to net income (loss), which is the nearest comparable U.S. GAAP financial measure (in thousands) on a reportable business segment basis for the years ended December 31, 2016 and 2015.
Unlike the utilization and pricing improvements witnessed in our core service lines in our Completion Services segment and Well Support Services segment, the majority of the businesses comprising our Other Services segment were negatively impacted by lower overall demand. Although the rig count has increased and commodity prices have stabilized, most customers are still hesitant to expand their capital budgets for additional services, which continues to negatively affect the service lines in this segment. During 2016, we re-evaluated our strategy pertaining to international expansion and suspended our coiled tubing operations in the Middle East indefinitely. With the exception of our artificial lift business, we are in the process of unwinding our footprint in the region, including selling assets and excess inventory to other operators in the region. Additionally, we divested our specialty chemical business on June 29, 2016 and began the process of selling our equipment manufacturing and repair service line, with the initial sale closing on January 25, 2017, and the remaining sale closing on February 28, 2017. In line with the discontinuance of these small, ancillary service lines and divisions, we now currently manage our business through two reportable segments. Accordingly, on a go forward basis beginning with our quarterly report for the period ended March 31, 2017, we will only disclose two reportable segments.
Operating Overview & Strategy
Our results of operations in our core service lines are driven primarily by four interrelated, fluctuating variables: (1) the drilling, completion and production activities of our customers, which is primarily driven by oil and natural gas prices and directly affects the demand for our services; (2) the price we are able to charge for our services, which is primarily driven by the level of demand for our services and the supply of equipment capacity in the market; (3) the cost of products and labor involved in providing our services, and our ability to pass those costs on to our customers; and (4) our activity, or “utilization” levels, and service performance.
Our operating strategy is focused on maintaining high asset utilization levels to maximize revenue generation while controlling cost to gain a competitive advantage and drive returns. We believe that the quality and efficiency of our service execution and aligning with customers who recognize the value that we provide through efficiency gains are central to our efforts to support utilization and grow our business. However, asset utilization is not necessarily indicative of our financial and/or operational performance and should not be given undue reliance. Given the volatile and cyclical nature of activity drivers in the U.S. onshore oilfield services industry, coupled with the varying prices we are able to charge for our services and the cost of providing those services, among other factors, operating margins can fluctuate widely depending on supply and demand at a given point in the cycle.
Historically, our utilization levels have been highly correlated to U.S. onshore spending by our customers as a group. Generally, as capital spending by our customers increases, drilling, completion and production activity also increases, resulting in increased demand for our services, and therefore more days or hours worked (as the case may be). Conversely, when drilling, completion and production activity levels decline due to lower spending by our customers, we generally provide fewer services, which results in fewer days or hours worked (as the case may be). Additionally, during periods of decreased spending by our customers, we may be required to discount our rates or provide other pricing concessions to remain competitive and support utilization, which negatively impacts our revenue and operating margins. During periods of pricing weakness for our services, we may not be able to reduce our costs accordingly, and our ability to achieve any cost reductions from our suppliers typically lags behind the decline in pricing for our services, which could further adversely affect our results. For additional information about factors impacting our business and results of operations, please see “Industry Trends and Outlook” in this Part II, Item 7 “Management’s Discussion and Analysis of Financial Condition and Results of Operations.”
Management evaluates the performance of our reportable business segments primarily based on Adjusted EBITDA because management believes Adjusted EBITDA provides important information about the activity and profitability of our lines of business within each reportable business segment and aids us in analytical comparisons for purposes of, among other things, efficiently allocating our assets and resources. Our management team also monitors asset utilization, among other factors, for purposes of assessing our overall activity levels and customer demand. For our Completion Services operations, we measure our asset utilization levels primarily by the total number of days that our asset base works on a monthly basis, based
43
on the available working days per month, which excludes scheduled maintenance days. We generally consider an asset to be working such days that it is at or in transit to a job location, regardless of the number of hours worked or whether it generated any revenue during such time. In our Well Support Services operations, we measure activity levels primarily by the number of hours our assets work on a monthly basis, based on the available working days per month. However, given the variance in revenue and profitability from job to job, depending on the type of service to be performed and the equipment, personnel and consumables required for the job, as well as competitive factors and market conditions in the region in which the services are performed, asset utilization cannot be relied on as indicative of our financial or operating performance. For additional information, please see “Our Reportable Business Segments” in this Part II, Item 7 “Management’s Discussion and Analysis of Financial Condition and Results of Operations.”
Industry Trends and Outlook
We face many challenges and risks in the industry in which we operate. Although many factors contributing to these risks are beyond our ability to control, we continuously monitor these risks and have taken steps to mitigate them to the extent practicable. In addition, while we believe that we are well positioned to capitalize on available growth opportunities, we may not be able to achieve our business objectives and, consequently, our results of operations may be adversely affected. Please read the factors described in the sections titled “Cautionary Note Regarding Forward-Looking Statements” and “Risk Factors” in Part I, Item 1A of this Annual Report for additional information about the known material risks that we face.
General Industry Trends
The oil and gas industry has traditionally been volatile and is influenced by a combination of long-term, short-term and cyclical trends, including the domestic and international supply and demand for oil and gas, current and expected future prices for oil and gas and the perceived stability and sustainability of those prices, production depletion rates and the resultant levels of cash flows generated and allocated by oil and gas companies to their drilling, completion and workover budgets. The oil and gas industry is also impacted by general domestic and international economic conditions, political instability in oil producing countries, government regulations (both in the United States and elsewhere), levels of consumer demand, the availability of pipeline capacity, weather conditions, and other factors that are beyond our control. Severe declines and sustained weakness and volatility in commodity prices over the course of 2015 and for most of 2016, and the consequent negative impact on the level of drilling, completion and production activity and capital expenditures by our customers, adversely affected the demand for our services. However, relative to the first half of 2016, crude oil prices, in particular, have increased substantially compared to all-time lows experienced in February of 2016, and customers have gradually increased activity, which resulted in improved operational and financial performance in both the third and fourth quarters of 2016.
Demand for our services tends to be extremely volatile and cyclical, as it is a direct function of our customers’ willingness to make operating and capital expenditures to explore for, develop and produce hydrocarbons in the United States and, to a lesser extent, in Western Canada. Our customers’ willingness to undertake such activities and expenditures depends largely upon prevailing industry conditions that are influenced by numerous factors which are beyond our control, including, among other things, current and expected future levels of oil and gas prices and the perceived stability and sustainability of those prices, which, in turn, is driven primarily by the supply of, and demand for, oil and gas. Oil and gas prices, and therefore the level of drilling, completion and workover activity by our customers, historically have been extremely volatile and are expected to continue to be highly volatile. For example, during 2015 and in early 2016, NYMEX crude oil prices reached their lowest levels since 2009, declining to as low as $26.21 per barrel. Natural gas prices declined significantly in 2009 and have remained depressed relative to pre-2009 levels.
Declines or sustained weakness in oil and gas prices influences our customers to curtail their operations, reduce their capital expenditures, and request pricing concessions to reduce their operating costs. The demand for drilling, completion and workover services is driven by available investment capital for such activities and in a lower oil and gas price environment, demand for service and maintenance generally decreases as oil and gas producers decrease their activity and expenditures. Because the type of services that we offer can be easily “started” and “stopped,” and oil and gas producers generally tend to be less risk tolerant when commodity prices are low or volatile, we typically experience a more rapid decline in demand for our services compared with demand for other types of energy services. A prolonged low level of customer activity, such as we experienced in 2015 and early 2016, adversely affects our financial condition and results of operations.
Competition and Demand for Our Services
We operate in highly competitive areas of the oilfield services industry with significant potential for excess capacity. Completion and well servicing equipment can be moved from one region to another in response to changes in levels of activity and market conditions, which may result in an oversupply of such equipment in any particular area. Utilization and
44
pricing for our services have in the past been negatively affected by increases in supply relative to demand in our core operating areas and geographic markets.
Additionally, the demand for our services depends primarily on the level of spending by oil and gas companies for drilling, completion and production activities, which is affected by short-term and long-term trends in oil and natural gas prices and numerous other factors over which we have no control. Severe declines and sustained weakness and volatility in commodity prices over the course of 2015, and for most of 2016, and the consequent negative impact on the level of drilling, completion and production activity and capital expenditures by our customers, adversely affected the demand for our services. This, in turn, negatively impacted our ability to maintain adequate utilization of our asset base and to negotiate pricing at levels generating sufficient margins.
Our revenues and earnings are directly affected by changes in utilization and pricing levels for our services, which fluctuate in direct response to changes in the level of drilling, completion and production activity by our customers. Pressure on pricing for our services, including due to competition and industry and/or economic conditions, may impact, among other things, our ability to maintain utilization and profitability. During periods of declining pricing for our services, we may not be able to reduce our costs accordingly, which could further adversely affect our results. Furthermore, even when we are able to increase our prices, we may not be able to do so at a rate that is sufficient to offset any rising costs. Also, we may not be able to successfully increase prices without adversely affecting our utilization levels. The inability to maintain our utilization and pricing levels, or to increase our prices as costs increase, could have a material adverse effect on our business, financial position and results of operations.
Our competitors include many large and small energy service companies, including some of the largest integrated oilfield services companies that possess substantially greater financial and other resources than we do. Our larger competitors’ greater resources could allow them to compete more effectively than we can, including by reducing prices for services in our core operating areas. Our major competitors for our Completion Services include Halliburton, Schlumberger, Keane Group, RPC, Inc., FTS International, Inc. (formerly known as Frac Tech Services), Basic Energy Services, Superior Energy Services, CalFrac Well Services, a significant number of regional, mostly-private businesses, and to a smaller extent, both Weatherford International and Baker Hughes, both of which have recently announced plans to exit the hydraulic fracturing business. Our major competitors for our Well Support Services include Key Energy Services, Basic Energy Services, Superior Energy Services, Precision, Forbes and Pioneer Energy Services, as well as a significant number of mostly-private, regional businesses.
Generally, we believe that the principal competitive factors in the markets that we serve are price, technical expertise, equipment capacity, work force capability, safety record, reputation and experience. Although we believe our customers consider all of these factors, price is often the primary factor in determining which service provider is awarded work, particularly during times of weak commodity prices such as those we experienced from late 2014 through mid-2016. Throughout this severe, prolonged downturn for our industry, our customer base demonstrated a more intense focus and placed a higher priority on receiving the lowest service cost pricing possible. Additionally, projects for certain of our core service lines are often awarded on a bid basis, which tends to further increase competition based primarily on price. During this downturn, our utilization and pricing levels were also negatively impacted by predatory pricing from certain large competitors, who elected to operate at negative margins for these services. During healthier market conditions, we believe many of our customers choose to work with us based on the safety, performance and quality of our crews, equipment and services, although even then, we must be competitive in our pricing. We seek to differentiate ourselves from our major competitors by our operating philosophy, which is focused on delivering the highest quality customer service and equipment, coupled with superior execution and operating efficiency. As part of this strategy, we target high volume, high efficiency customers with service intensive, 24-hour work, which is where we believe we can differentiate our services from our competitors.
See Part II, Item 7 “Management’s Discussion and Analysis of Financial Condition and Results of Operations- Industry Trends and Outlook” for additional discussion of the market challenges within our industry.
Current Market Conditions and Outlook
The challenging market conditions experienced through the first half of 2016 began to abate towards the latter part of the third quarter as commodity prices began to stabilize and customers began re-initiating their drilling and completion programs. In our Completion Services segment, we experienced increasing utilization levels as customers accelerated completion activity to take advantage of higher commodity prices. In some cases, we were able to increase pricing slightly within some of our core service lines primarily due to a lack of available service capacity in select core operating basins. In our Well Support Services segment, customers began to allocate slightly more capital towards well maintenance and workover activities as commodity prices stabilized, which particularly enhanced the financial performance of our workover rig, plug & abandonment and other specialty services service lines. Despite the increased activity levels, the operating environment
45
remains competitive, and we continue to evaluate alternatives to further rightsize our service lines with current market conditions. Additionally, as discussed above under “Our Reportable Business Segments-Completion Services-Completion Services Outlook” and “Our Reportable Business Segments-Well Support Services-Well Support Services Outlook,” we are expecting improved activity levels and pricing across several of our business lines during 2017 and 2018.
Despite the recent improvement in commodity prices and customer activity levels, we are taking a measured approach regarding potential operational and financial improvement in 2017. As long as macroeconomic conditions remain stable and commodity prices continue to improve, we would expect higher levels of activity from the majority of our customer base in 2017, which should result in continued operational and financial improvement, especially in our Completion Services segment. In our hydraulic fracturing service line, we continued to deploy approximately ten horizontal and three small vertical fracturing fleets during the fourth quarter, and based on current projections and customer discussions, we expect to add an additional horizontal fracturing fleet into service by the end of the first quarter of 2017. In our cased-hole wireline and pumpdown service line, we deployed two additional wireline trucks and three additional pumpdown units in the fourth quarter, and if completion activity continues to increase, we would expect to add more wireline trucks and pumpdown units into service by the end of the first quarter of 2017.
Conditions within our Well Support Service segment remain more challenged, as both pricing and the operational environment remain competitive. During the fourth quarter, our average daily workover rig count per work day increased by approximately 4.0% to 145 workover rigs, but our average daily counts for both fluids management trucks and frac tanks declined by approximately 8.0% to 640 trucks and 18.0% to 1,054 frac tanks, respectively. Our fluids management service line continues to struggle with extremely competitive pricing from both private and public peers, lower overall completion activity levels compared to prior peak levels and continued competition from infrastructure build-out. In our coiled tubing service line, our average deployed unit count remained flat in the fourth quarter, totaling 25 units, as both market conditions and service pricing have remained competitive. As completion activity increases and select competitors continue to the leave the marketplace, we expect higher overall activity levels to result in higher utilization and enhanced overall profitability. However, until customers start allocating significantly more capital towards workover and maintenance of existing wells, we would expect only gradual increases in both utilization and pricing within the majority of our Well Support Services’ service lines in 2017.
We are actively monitoring the market and managing our business in line with demand for services, and we will make adjustments as necessary to effectively respond to changes in market conditions. Our top priorities remain to drive revenue by maximizing utilization, improve margins through cost controls, protect and grow market share by focusing on the quality and efficiency of our service execution and ensure we are strategically positioned to capitalize on future market improvement.
Please see “Liquidity and Capital Resources” in this Part II, Item 7 “Management’s Discussion and Analysis of Financial Condition and Results of Operations,” in addition to “Cautionary Note Regarding Forward-Looking Statements” and “Risk Factors” in Part I, Item 1A of this Annual Report.
Results of Operations
The following is a comparison of our results of operations for the year ended December 31, 2016, compared to the year ended December 31, 2015, and a comparison of our results of operations for the year ended December 31, 2015, compared to the year ended December 31, 2014. Our results for the 2016 and 2015 years include the financial and operating results of Old C&J for the entire period and the C&P Business from the March 24, 2015 (the "Merger Effective Time") through December 31, 2016. Results for periods prior to March 24, 2015 reflect the financial and operating results of Old C&J exclusively, and do not include the financial and operating results of the C&P Business. Accordingly, comparisons of the 2016 and 2015 results to prior years may not be meaningful.
We revised our reportable segments during the first quarter of 2015 in connection with the Nabors Merger. As a result of the revised reportable segment structure, we restated the corresponding items of reportable segment information for the 2014 year.
Results for the Year Ended December 31, 2016 Compared to the Year Ended December 31, 2015
The following table summarizes the change in our results of operations for the year ended December 31, 2016, compared to the year ended December 31, 2015 (in thousands):
46
Years Ended December 31, | ||||||||||||
2016 | 2015 | $ Change | ||||||||||
Completion Services: | ||||||||||||
Revenue | $ | 543,958 | $ | 1,138,521 | $ | (594,563 | ) | |||||
Operating income (loss) | $ | (253,513 | ) | $ | (754,874 | ) | $ | 501,361 | ||||
Well Support Services: | ||||||||||||
Revenue | $ | 419,597 | $ | 582,142 | $ | (162,545 | ) | |||||
Operating income (loss) | $ | (430,808 | ) | $ | (159,165 | ) | $ | (271,643 | ) | |||
Other Services: | ||||||||||||
Revenue | $ | 7,587 | $ | 28,226 | $ | (20,639 | ) | |||||
Operating income (loss) | $ | (51,778 | ) | $ | (69,129 | ) | $ | 17,351 | ||||
Corporate / Elimination: | ||||||||||||
Revenue | $ | — | $ | — | $ | — | ||||||
Operating income (loss) | $ | (133,909 | ) | $ | (115,154 | ) | $ | (18,755 | ) | |||
Combined: | ||||||||||||
Revenue | $ | 971,142 | $ | 1,748,889 | $ | (777,747 | ) | |||||
Costs and expenses: | ||||||||||||
Direct costs | 947,255 | 1,523,194 | (575,939 | ) | ||||||||
Selling, general and administrative expenses | 229,267 | 239,697 | (10,430 | ) | ||||||||
Research and development | 7,718 | 16,704 | (8,986 | ) | ||||||||
Depreciation and amortization | 217,440 | 276,353 | (58,913 | ) | ||||||||
Impairment Expense | 436,395 | 791,807 | (355,412 | ) | ||||||||
Loss on disposal of assets | 3,075 | (544 | ) | 3,619 | ||||||||
Operating income (loss) | (870,008 | ) | (1,098,322 | ) | 228,314 | |||||||
Other income (expense): | ||||||||||||
Interest expense, net | (157,465 | ) | (82,086 | ) | (75,379 | ) | ||||||
Other income (expense), net | 9,504 | 8,773 | 731 | |||||||||
Total other expenses, net | (147,961 | ) | (73,313 | ) | (74,648 | ) | ||||||
Loss before reorganization items and income taxes | (1,017,969 | ) | (1,171,635 | ) | 153,666 | |||||||
Reorganization items | 55,330 | — | 55,330 | |||||||||
Income tax expense (benefit) | (129,010 | ) | (299,093 | ) | 170,083 | |||||||
Net income (loss) | $ | (944,289 | ) | $ | (872,542 | ) | $ | (71,747 | ) | |||
Revenue
Revenue decreased $777.7 million, or 44.5%, for the year ended December 31, 2016, as compared to the year ended December 31, 2015. The decrease in revenue was primarily due to (i) a decrease of $594.6 million in our Completion Services segment as a result of significantly lower utilization and pricing levels across this segment caused by the extremely competitive market environment given the severe decline in U.S. onshore drilling and completion activity, partially offset by the fact that revenue for the corresponding prior year period only included C&P Business Completion Services revenue from the Merger Effective Time to December 31, 2015. The $162.5 million decrease in revenue in our Well Support Services segment was primarily due to the unprecedented low levels of customer activity during 2016 in areas that typically maintain moderate levels of well support services activity, partially offset by the fact that revenue for the corresponding prior year period only included C&P Business Well Support Services revenue from the Merger Effective Time to December 31, 2015. The $20.6 million decrease in our Other Services segment was primarily due to continued weak demand for our services driven by the low commodity prices characterizing this severe, prolonged industry downturn.
47
Direct Costs
Direct costs decreased $575.9 million, or 37.8%, to $947.3 million for the year ended December 31, 2016, as compared to $1.5 billion for the year ended December 31, 2015. The decrease in direct costs was primarily due to the corresponding decrease in revenue which was negatively impacted by overall lower utilization levels across our Completion Services and Well Support Services segments resulting from the extremely competitive market environment caused by the severe decline in U.S. onshore drilling and completion activity as well as the unprecedented slowdown in well support services activity, and partially offset by the shorter period for the C&P Business from the Merger Effective Time to December 31, 2015, as noted above. As utilization fell in our Completion Services segment, we strategically stacked additional equipment, closed unprofitable facilities, reduced head count and aggressively cut costs in order to further lower our operational cost structure. Similarly, in our Well Support Services segment, we exited select service lines in certain basins, closed unprofitable facilities and further reduced head count.
As a percentage of revenue, direct costs increased to 97.5% for the year ended December 31, 2016, up from 87.1% for the year ended December 31, 2015, primarily due to substantially lower pricing for our services due to competitive market conditions resulting from the rapid and sustained decline in commodity prices, partially offset by reductions to our cost structure, as noted above.
Selling, General and Administrative Expenses ("SG&A") and Research and Development Expenses ("R&D")
SG&A decreased $10.4 million, or 4.4%, to $229.3 million for the year ended December 31, 2016, as compared to $239.7 million for the year ended December 31, 2015. The decrease in SG&A was primarily due to a $32.1 million decrease in acquisition-related costs and a $12.6 million decrease in employee related costs as a result of headcount reductions. These amounts are partially offset by $30.4 million in costs related to the Chapter 11 Proceeding and related restructuring activities, by a $2.0 million increase in legal fees and settlements as a result of the Chapter 11 Proceeding and by the fact that SG&A associated with the C&P Business was only incurred from the Merger Effective Time to December 31, 2015.
We also incurred $7.7 million in R&D for the year ended December 31, 2016, as compared to $16.7 million for the corresponding prior year period. The decrease in R&D was primarily due to our cost control initiatives, which included scaling back our R&T business line and initiatives and delaying certain projects.
Depreciation and Amortization Expense ("D&A")
D&A decreased $58.9 million, or 21.3%, to $217.4 million for the year ended December 31, 2016 as compared to $276.4 million for the same period in 2015. The decrease in D&A was primarily the result of significant impairment charges recorded during 2015 and the first half of 2016 due to the steep decline in asset utilization levels related to the sustained downturn in the oil and gas industry.
Impairment Expense
Due to the severe downturn in the oil and gas industry, and the resulting weakness in demand for our services, we determined that it was necessary to test goodwill for impairment and to test property, plant and equipment ("PP&E") and other intangible assets for recoverability during the third and fourth quarters of 2015 and throughout 2016. Based on our assessment, we recorded impairment expense of $436.4 million for the year ended December 31, 2016, consisting of $314.3 million of goodwill impairment related to impairment of all remaining goodwill associated with our Well Support Services segment, along with $61.0 million related to other intangible assets and $61.1 million related to PP&E within each of our Completion Services, Well Support Services, and Other Services segments.
Impairment expense for the year ended December 31, 2015 was $791.8 million and consisted of $385.0 million of goodwill impairment related to the Completion Services and Other Services segments, $393.1 million of PP&E impairment related to the Completion Services and Other Services segments, and $13.7 million related to other intangible assets.
Reorganization items
Reorganization items of $55.3 million for the year ended December 31, 2016 are primarily related to professional fees of $41.2 million, contract termination settlements of $20.3 million and revisions of estimated claims of $0.8 million, partially offset by $5.2 million in related party settlements and $1.8 million in vendor claims adjustments in connection with our Chapter 11 Proceeding.
48
Interest Expense, net
Interest expense increased $75.4 million, or 91.8%, to $157.5 million for the year ended December 31, 2016. The increase is primarily due to $91.9 million of accelerated amortization of original issue discount and deferred financing costs, which we fully amortized as of June 30, 2016 as a result of our entry into a restructuring support agreement related to our Chapter 11 Proceeding, and due to $3.5 million in interest expense primarily related to higher levels of borrowings under the Revolving Credit Facility and DIP Facility, partially offset by $20.0 million of lower interest expense due to the Chapter 11 Proceeding in that interest expense subsequent to a Chapter 11 filing is recognized only to the extent that it will be paid during the cases or that it is probable that it will be an allowed claim. As a result, we did not accrue interest that we believed was not probable of being treated as an allowed claim in the Chapter 11 Proceeding.
Income Taxes
We recorded an income tax benefit of $129.0 million for the year ended December 31, 2016, at an effective rate of 12.0%, compared to income tax benefit of $299.1 million for the year ended December 31, 2015, at an effective rate of 25.5%. The decrease in the effective tax rate is primarily due to valuation allowances applied against certain deferred tax assets, including net operating loss carryforwards. The effective rate, and resulting benefit, is less than the expected statutory rate primarily due to impairment charges that were not deductible for tax, the impact of permanent differences, including non-deductible reorganization costs and the valuation allowance reducing the carrying value of certain deferred tax assets.
Results for the Year Ended December 31, 2015 Compared to the Year Ended December 31, 2014
The following table summarizes the change in our results of operations for the year ended December 31, 2015, when compared to the year ended December 31, 2014 (in thousands):
49
Years Ended December 31, | ||||||||||||
2015 | 2014 | $ Change | ||||||||||
Completion Services: | ||||||||||||
Revenue | $ | 1,138,521 | $ | 1,400,133 | $ | (261,612 | ) | |||||
Operating income (loss) | $ | (754,874 | ) | $ | 187,615 | $ | (942,489 | ) | ||||
Well Support Services: | ||||||||||||
Revenue | $ | 582,142 | $ | 188,256 | $ | 393,886 | ||||||
Operating income (loss) | $ | (159,165 | ) | $ | 28,471 | $ | (187,636 | ) | ||||
Other Services: | ||||||||||||
Revenue | $ | 28,226 | $ | 19,555 | $ | 8,671 | ||||||
Operating income (loss) | $ | (69,129 | ) | $ | 16,579 | $ | (85,708 | ) | ||||
Corporate / Elimination: | ||||||||||||
Revenue | $ | — | $ | — | $ | — | ||||||
Operating income (loss) | $ | (115,154 | ) | $ | (108,921 | ) | $ | (6,233 | ) | |||
Combined: | ||||||||||||
Revenue | $ | 1,748,889 | $ | 1,607,944 | $ | 140,945 | ||||||
Costs and expenses: | ||||||||||||
Direct costs | 1,523,194 | 1,179,227 | 343,967 | |||||||||
Selling, general and administrative expenses | 239,697 | 182,518 | 57,179 | |||||||||
Research and development | 16,704 | 14,327 | 2,377 | |||||||||
Depreciation and amortization | 276,353 | 108,145 | 168,208 | |||||||||
Impairment Expense | 791,807 | — | 791,807 | |||||||||
Loss on disposal of assets | (544 | ) | (17 | ) | (527 | ) | ||||||
Operating income | (1,098,322 | ) | 123,744 | (1,222,066 | ) | |||||||
Other income (expense): | ||||||||||||
Interest expense, net | (82,086 | ) | (9,840 | ) | (72,246 | ) | ||||||
Other income (expense), net | 8,773 | 598 | 8,175 | |||||||||
Total other expenses, net | (73,313 | ) | (9,242 | ) | (64,071 | ) | ||||||
Income before income taxes | (1,171,635 | ) | 114,502 | (1,286,137 | ) | |||||||
Income tax expense | (299,093 | ) | 45,679 | (344,772 | ) | |||||||
Net income | $ | (872,542 | ) | $ | 68,823 | $ | (941,365 | ) | ||||
Revenue
Revenue increased $140.9 million, or 8.8%, for the year ended December 31, 2015, as compared to the year ended December 31, 2014. The increase in revenue was primarily due to our significantly larger asset base and expanded operations as a result of the Nabors Merger and the incremental impact of $822.2 million of revenue contributed by the C&P Business, offset by a $681.3 million decrease in revenue from Old C&J due to significantly lower utilization and pricing levels across our Completion Services segment resulting from the extremely competitive market environment caused by the decline in U.S. onshore drilling and completion activity.
Direct Costs
Direct costs increased $344.0 million, or 29.2%, to $1.5 billion for the year ended December 31, 2015, as compared to $1.2 billion for the year ended December 31, 2014, primarily due to our significantly larger asset base and expanded operations as a result of the Nabors Merger, including additional direct costs of $697.6 million from the C&P Business, partially offset by a $353.7 million decrease in direct cost attributable to Old C&J.
50
As a percentage of revenue, direct costs increased to 87.1% for the year ended December 31, 2015, up from 73.3% for the year ended December 31, 2014, primarily due to substantially lower pricing for our services due to competitive market conditions resulting from the rapid decline in commodity prices, partially offset by reductions to our cost structure achieved through our supply chain and procurement synergy savings following the Nabors Merger.
Selling, General and Administrative Expenses ("SG&A") and Research and Development Expenses ("R&D")
SG&A increased $57.2 million, or 31.3%, to $239.7 million for the year ended December 31, 2015, as compared to $182.5 million for the year ended December 31, 2014. Excluding an increase of $22.5 million in acquisition-related costs, the remaining increase in SG&A for the year ended December 31, 2015 was primarily driven by a significantly greater employee base as a result of the Nabors Merger, partially offset by the implementation of our integration plan following the Nabors Merger and market-driven cost control initiatives, including reductions in headcount and facilities.
We also incurred $16.7 million in R&D for the year ended December 31, 2015, as compared to $14.3 million for the corresponding prior year period. We remain committed to investing in key technologies that will lower our cost base for key inputs, enhance synergy savings and improve our operational capabilities and efficiencies. However, as part of our cost control measures, during the latter half of 2015, we scaled back our R&T business line and delayed certain projects.
Depreciation and Amortization Expense ("D&A")
D&A increased $168.2 million, or 155.5%, to $276.4 million for the year ended December 31, 2015 as compared to $108.1 million for the same period in 2014. The increase in D&A was primarily related to our significantly larger asset base as a result of the Nabors Merger, as well as the deployment of new equipment in the Old C&J core service lines.
Impairment Expense
Due to the continued downturn in the oil and gas industry, and the resulting further deterioration in demand for our services, we determined that it was necessary to test goodwill for impairment and to test PP&E and intangible assets for recoverability during the third quarter of 2015 and again during the fourth quarter of 2015. As a result, we recorded impairment expense of $791.8 million for the year ended December 31, 2015, consisting of $385.0 million of goodwill impairment related to the Completion Services and Other Services segments, $393.1 million of PP&E impairment related to the Completion Services, Well Support Services, and Other Services segments, and $13.7 million related to other intangible assets.
No impairment expense was incurred for the year ended December 31, 2014.
Interest Expense, net
Interest expense increased $72.2 million, or 734.2%, to $82.1 million for the year ended December 31, 2015 due to higher levels of borrowings, primarily to finance the Nabors Merger.
Income Taxes
We recorded an income tax benefit of $299.1 million for the year ended December 31, 2015, at an effective rate of 25.5%, compared to income tax expense of $45.7 million for the year ended December 31, 2014, at an effective rate of 39.9%. The decrease in the effective tax rate is primarily due to a pre-tax loss in the current year, as compared to pre-tax income in the prior year. The effective rate, and resulting benefit, is less than the expected statutory rate primarily due to impairment charges that were not deductible for tax, the impact of permanent differences on the tax rate and the recognition of non-deductible acquisition related costs.
Liquidity and Capital Resources
Sources of Liquidity and Capital Resources
Our primary uses of cash are for operating costs and expenditures and capital expenditures. The energy services business is capital-intensive, requiring significant investment to maintain, upgrade and purchase equipment to meet our customers’ needs and industry demand. Our capital requirements consist primarily of:
51
• | growth capital expenditures, which are capital expenditures made to acquire additional equipment and other assets, increase our service lines, expand geographically or advance other strategic initiatives for the purpose of growing our business; and |
• | capital expenditures related to our existing equipment, such as maintenance, refurbishment and other activities to extend the useful life of partially or fully depreciated assets. |
In addition, in prior periods, a significant amount of our cash flow was used to service our indebtedness; however, as a result of the Chapter 11 Proceeding, substantially all of our debt was discharged and we expect that interest expense will be a smaller component of our expenses in the near term. Our primary sources of liquidity have historically included cash flows from operations and borrowings under debt facilities. Future cash flows are subject to a number of variables, and are highly dependent on the drilling, completion and production activity by our customers, which in turn is highly dependent on oil and gas prices.
Additionally, we currently have only $63.4 million of available borrowing capacity under our New Credit Facility. Accordingly, we may seek to access capital from other sources, such as the capital markets and/or increase the borrowing capacity under our New Credit Facility. If, however, we are not able to access needed capital, we may be required to reduce our expenditures which would limit our ability to grow and could adversely affect our operating results, financial conditions and cash flows.
During 2016, we initially relied on cash from operations and our Original Credit Agreement for liquidity. However, prior to commencement of the Chapter 11 Proceeding in May 2016, we breached a financial covenant under our Original Credit Agreement and were prohibited from making any further borrowings under such facility. As a result, after that date, our principal source of liquidity was limited to cash on hand. As part of the Chapter 11 Proceeding, on July 29, 2016, we entered into the DIP Credit Agreement, providing the $100 million DIP Facility that was intended to provide the Company with sufficient liquidity to fund the administration of the Chapter 11 Proceeding. On the Plan Effective Date, we repaid all amounts outstanding under the DIP Facility with the proceeds from the Rights Offering and the DIP Facility was canceled and discharged. As a result of the debt-to-equity conversion feature of the Restructuring Plan, we emerged from the Chapter 11 Proceeding substantially debt free. On the Plan Effective Date, we entered into a New Credit Facility (as defined below) with PNC Bank, National Association, as administrative agent. For additional information about the New Credit Facility, please see “Description of our Indebtedness- Description of our New Credit Facility” below. For additional information about the Chapter 11 Proceeding and emergence, please see “Overview of Our Business” in Part I, Item 1 of this Annual Report, Note 2 –Chapter 11 Proceeding and Emergence and Note 5 – Debt and Capital Lease Obligations in Part II, Item 8 “Financial Statements and Supplementary Data”; and “Risk Factors” in Part I, Item 1A of this Annual Report.
Financial Condition and Cash Flows
The net cash provided by or used in our operating, investing and financing activities is summarized below (in thousands):
Years Ended December 31, | ||||||||||||
2016 | 2015 | 2014 | ||||||||||
Cash flow provided by (used in): | ||||||||||||
Operating activities | $ | (107,372 | ) | $ | 103,005 | $ | 181,837 | |||||
Investing activities | (26,927 | ) | (825,156 | ) | (343,412 | ) | ||||||
Financing activities | 174,264 | 734,126 | 157,178 | |||||||||
Effect of exchange rate on cash | (1,282 | ) | 3,908 | — | ||||||||
Decrease (increase) in cash and cash equivalents | $ | 38,683 | $ | 15,883 | $ | (4,397 | ) | |||||
Cash Provided by (Used in) Operating Activities
Net cash from operating activities decreased $210.4 million for the year ended December 31, 2016 as compared to the corresponding period in 2015. The decrease in operating cash flow was primarily due to (i) the increase in net loss during the year ended December 31, 2016, after excluding the effects of changes in non-cash items and (ii) the decline in cash collections of accounts receivable due to higher collection levels during the second and third quarters of 2015 from accounts acquired as part of the Nabors Merger, partially offset by positive changes in operating assets and liabilities which included (i)
52
a decrease in the use of cash to satisfy obligations related to accounts payable and accrued liabilities due to higher disbursement levels during the second and third quarters of 2015 from trade payables acquired in connection with the Nabors Merger and (ii) a decrease in the use of cash related to accounts payable and accrued expenses during the third and fourth quarters of 2016 both resulting from the automatic stay associated with the Chapter 11 Proceeding.
Net cash provided by operating activities decreased $78.8 million for the year ended December 31, 2015 as compared to the corresponding period in 2014. The decrease in operating cash flow was primarily due to (a) the decline in net income during the year ended December 31, 2015, after excluding the effects of changes in non-cash items, (b) cash used to satisfy obligations related to accounts payable and accrued liabilities in connection with the Nabors Merger and (c) incremental cash used to pay down accounts payable, partially offset by positive changes which included an increase in cash provided from the collection of accounts receivable acquired in connection with the Nabors Merger and operating assets and liabilities related to normal fluctuations in the timing of cash collections and cash requirements.
Cash Flows Used in Investing Activities
Net cash used in investing activities decreased $798.2 million for the year ended December 31, 2016 as compared to the corresponding period in 2015. This decrease was primarily due to the cash consideration of $693.6 million paid at the closing of the Nabors Merger for the acquisition of the C&P Business during the first quarter of 2015 as well as a decline in capital expenditure purchases as a result of the sustained downturn in the oil and gas industry, partially offset by a $43.4 million purchase price reduction for the C&P Business related to a working capital adjustment during the third quarter of 2015 and proceeds from the divestiture of our specialty chemical business (divested in June 2016) and disposals of property, plant and equipment.
Net cash used in investing activities increased $481.7 million for the year ended December 31, 2015 as compared to the corresponding period in 2014. This increase was primarily due to the cash consideration of $693.6 million paid at the closing of the Nabors Merger for the acquisition of the C&P Business, partially offset by a $43.4 million purchase price reduction for the C&P Business related to a working capital adjustment and a decline in capital expenditure purchases as a result of the downturn in the oil and gas industry.
Cash Flows Provided by Financing Activities
Net cash provided by financing activities decreased $559.9 million for the year ended December 31, 2016 as compared to the corresponding period in 2015. The decrease is primarily related to proceeds received from our Credit Agreement to fund the cash consideration portion of the acquisition of the C&P Business at the closing of the Nabors Merger, partially offset by the payoff of the long-term debt of Old C&J, both during the first quarter of 2015.
Net cash provided by financing activities increased $576.9 million for the year ended December 31, 2015 as compared to the corresponding period in 2014. The increase is primarily related to proceeds received from our Credit Agreement to fund the cash consideration portion of the acquisition of the C&P Business at the closing of the Nabors Merger as well as to pay off the long-term debt of Old C&J.
Description of our Indebtedness
Description of the New Credit Facility
The Company and certain of its subsidiaries, as borrowers (the “Borrowers”), have entered into a revolving credit and security agreement (the “New Credit Facility”) dated the Plan Effective Date, with PNC Bank, National Association, as administrative agent (the “Lender”).
The New Credit Facility allows the Borrowers to incur revolving loans in an aggregate amount up to the lesser of $100 million and a borrowing base, which borrowing base is based upon the value of the Borrowers’ accounts receivable and inventory, subject to eligibility criteria and customary reserves which may be modified in the Lender’s permitted discretion. The New Credit Facility also contains an availability block, which will reduce the amount otherwise available to be borrowed under the New Credit Facility by $20 million until the later of the delivery of financial statements for the fiscal year ending December 31, 2017 and the date on which the Company achieves a fixed charge coverage ratio of 1.10:1.0.
The New Credit Facility also provides for the issuance of letters of credit, which would reduce borrowing capacity thereunder. The maturity date of the New Credit Facility is January 6, 2021.
53
If at any time the amount of loans and other extensions of credit outstanding under the New Credit Facility exceed the borrowing base, the Borrowers may be required, among other things, to prepay outstanding loans immediately.
The Borrowers’ obligations under the New Credit Facility are secured by liens on a substantial portion of the Borrowers’ personal property, subject to certain exclusions and limitations. Upon the occurrence of certain events, additional collateral, including a portion of the Borrowers’ real properties, may also be required to be pledged. Each of the Borrowers is jointly and severally liable for the obligations of the other Borrowers under the New Credit Facility.
At the Borrowers’ election, interest on borrowings under the New Credit Facility will be determined by reference to either LIBOR plus an applicable margin of 4.0% per annum or an “alternate base rate” plus an applicable margin of 3.0% per annum. Beginning after the fiscal year ending on or about December 31, 2017, these margins will be subject to a step-down of 0.50% in the event that the Company achieves a fixed charge coverage ratio of 1.15:1.0 or greater. Interest will be payable quarterly for loans bearing interest based on the alternative base rate and on the last day of the interest period applicable to LIBOR-based loans. The Borrowers will also be required to pay a fee on the unused portion of the New Credit Facility equal to 1.0% per annum in the event that utilization is less than 50.0% of the total commitment and 0.75% per annum in the event that utilization is greater than or equal to 50.0% of the total commitment.
A termination fee of 1.00% of the maximum amount available will be payable if the loans are repaid in full and the New Credit Facility is terminated prior to the first anniversary of the Plan Effective Date.
The New Credit Facility contains covenants that limit the Borrowers’ and their subsidiaries’ ability to incur additional indebtedness, grant liens, make loans or investments, make distributions, merge into or consolidate with other persons, make capital expenditures or engage in certain asset dispositions including a sale of all or substantially all of the Company’s assets.
The New Credit Facility also contains the following financial covenants:
• | a minimum liquidity covenant under which the Borrowers must not permit availability under the New Credit Facility, plus certain unrestricted cash and cash equivalents, to be less than $100.0 million as of the last day of each fiscal month through the fiscal month ending August 31, 2017; and |
• | a fixed charge coverage ratio under which Borrowers must maintain a fixed charge coverage ratio of at least 1.0 to 1.0 as of the last day of any fiscal month on or after September 30, 2017 on which, (a) for any date occurring through (and including) December 31, 2017, availability under the New Credit Facility, plus certain unrestricted cash and cash equivalents, is less than $50 million and (b) for any date occurring from and after January 1, 2018, availability under the New Credit Facility, plus certain unrestricted cash and cash equivalents, is less than $40 million. |
The fixed charge coverage ratio is generally defined in the New Credit Facility as the ratio of (i) EBITDA minus certain capital expenditures and cash taxes paid to (ii) the sum of cash interest expenses, scheduled principal payments on borrowed money and certain distributions.
Debtor-in-Possession $100 Million Term Loan Facility
Prior to the execution of the New Credit Facility, certain DIP Lenders agreed to fund a $100 million DIP Facility.
The borrowers under the DIP Facility were the Company and CJ Holding Co. All obligations under the DIP Facility were guaranteed by the Company’s subsidiaries that were debtors in the Bankruptcy cases. Borrowings under the DIP Credit Agreement were generally secured by superpriority priming liens on substantially all of the assets of the borrowers and guarantors.
The DIP Facility was scheduled to mature on March 31, 2017.
Amounts outstanding under the DIP Facility bore interest based on, at the option of the borrower, the London Interbank Offered Rate (“LIBOR”) or an alternative base rate, plus an applicable margin equal to 9.0% in the case of LIBOR loans and 8.0% in the case of base rate loans. The alternative base rate was equal to the highest of (i) the published ‘prime rate’, (ii) the Federal Funds Effective Rate (as defined in the DIP Credit Agreement) plus 0.5% and (iii) LIBOR plus 1.0%.
54
The DIP Facility also required that the Company pay various fees to the DIP Lenders, including a commitment fee equal to 5.0% of the unused commitments thereunder.
In accordance with the Restructuring Plan, on the Plan Effective Date, we repaid all amounts outstanding under the DIP Facility with the proceeds from the Rights Offering and the DIP Facility was canceled and discharged.
Description of the Original Credit Agreement
On March 24, 2015, we entered into a credit agreement (the “Original Credit Agreement”), among C&J, CJ Lux Holdings S.à r.l. (“Luxco”), CJ Holding Co, Bank of America, N.A., as Administrative Agent (in such capacity, the “Administrative Agent”), Swing Line Lender and an L/C Issuer, and the other lenders party thereto. The Original Credit Agreement provided for senior secured credit facilities (collectively, the “Credit Facilities”) in an aggregate principal amount of $1.66 billion, consisting of (a) a $600.0 million revolving credit facility (“Revolving Credit Facility” or “Revolver”) and (b) a Term Loan B Facility in the aggregate principal amount of $1.06 billion, comprised of two tranches: (i) a tranche consisting of $575.0 million in original aggregate principal amount of term loans maturing on March 24, 2020 (the “Five-Year Term Loans”) and (ii) a tranche consisting of a $485.0 million in original aggregate principal amount of term loans maturing on March 24, 2022 (the “Seven-Year Term Loans”).
The borrowers under the Revolving Credit Facility were C&J, Luxco and CJ Holding Co. The borrower under the Term Loan B Facility was CJ Holding Co. All obligations under the Original Credit Agreement were guaranteed by CJ Holding Co.'s wholly-owned domestic subsidiaries, other than immaterial subsidiaries and certain other customary exceptions.
Borrowings under the Revolving Credit Facility were scheduled to mature on March 24, 2020 (except that if any Five-Year Term Loans had not been repaid prior to September 24, 2019, the Revolving Credit Facility was scheduled to mature on September 24, 2019).
Borrowings under the Revolving Credit Facility were non-amortizing. The Term Loan B Facility required the borrower thereunder to make quarterly amortization payments in an amount equal to 1.0% per annum, with the remaining balance payable on the applicable maturity date.
Amounts outstanding under the Revolving Credit Facility bore interest based on, at the option of the borrower, the LIBOR or an alternative base rate, plus an applicable margin based on the ratio of consolidated total indebtedness of C&J and its subsidiaries to consolidated EBITDA of C&J and its subsidiaries for the most recent four fiscal quarter period for which financial statements are available (the “Total Leverage Ratio”). The Revolving Credit Facility also required that the borrowers pay a commitment fee equal to a percentage of unused commitments which varied based on the Total Leverage Ratio.
Five-Year Term Loans outstanding under the Term Loan B Facility bore interest based on, at the option of the borrower, LIBOR (which, in the case of the Term Loan B Facility, was deemed to be no less than 1.0% per annum), plus a margin of 5.5%, or an alternative base rate, plus a margin of 4.5%. Seven-Year Term Loans outstanding under the Term Loan B Facility bore interest based on, at the option of the borrower, LIBOR (which, in the case of the Term Loan B Facility, will be deemed to be no less than 1.0% per annum), plus a margin of 6.25%, or an alternative base rate, plus a margin of 5.25%.
The alternative base rate was equal to the highest of (i) the Administrative Agent’s prime rate, (ii) the Federal Funds Effective Rate plus 0.5% and (iii) LIBOR plus 1.0%.
On the Plan Effective Date, except as otherwise specifically provided for in the Restructuring Plan, the obligations of the Debtors under the Original Credit Agreement, any guarantees, and any other certificate, share, note, bond, indenture, purchase right, option, warrant, or other instrument or document directly or indirectly evidencing or creating any indebtedness or obligation of or ownership interest in any of the Debtors giving rise to any claim or equity interest (except as provided under the Restructuring Plan), were canceled as to the Debtors and their affiliates, and the reorganized Company and its affiliates ceased to have any obligations thereunder.
Contractual Obligations
The following table summarizes our contractual cash obligations as of December 31, 2016 (in thousands):
55
Contractual Obligation | Total | Less than 1 year | 1-3 years | 3-5 years | More than 5 years | |||||||||||||||
DIP Facility (1) | $ | 25,538 | $ | 25,538 | $ | — | $ | — | $ | — | ||||||||||
Operating leases | 25,599 | 6,934 | 7,394 | 5,822 | 5,449 | |||||||||||||||
Total | $ | 51,137 | $ | 32,472 | $ | 7,394 | $ | 5,822 | $ | 5,449 | ||||||||||
(1) | Includes estimated interest costs at an interest rate of 10.0% along with related charges. |
Off-Balance Sheet Arrangements
We had no off-balance sheet arrangements, as defined in Item 303(a)(4)(ii) of Regulation S-K, as of December 31, 2016.
Critical Accounting Policies
The selection and application of accounting policies is an important process that has developed as our business activities have evolved and as the accounting standards have developed. Accounting standards generally do not involve a selection among alternatives, but involve the implementation and interpretation of existing standards, and the use of judgment applied to the specific set of circumstances existing in our business. We make every effort to properly comply with all applicable standards on or before their adoption, and we believe the proper implementation and consistent application of the accounting standards are critical.
Our discussion and analysis of our financial condition and results of operations is based upon our consolidated financial statements, which have been prepared in accordance with accounting principles generally accepted in the United States of America (“U.S. GAAP”). The preparation of these consolidated financial statements requires us to make estimates and assumptions that affect the reported amounts of assets, liabilities, expenses and related disclosures. We base our estimates and assumptions on historical experience and on various other factors that we believe to be reasonable under the circumstances. We evaluate our estimates and assumptions on an ongoing basis. The results of our analysis form the basis for making assumptions about the carrying values of assets and liabilities that are not readily apparent from other sources. Our actual results may differ from these estimates under different assumptions or conditions.
We believe the following critical accounting policies involve significant areas of management’s judgments and estimates in the preparation of our consolidated financial statements.
Property, Plant and Equipment. Property, plant and equipment are recorded at cost less accumulated depreciation. Maintenance and repairs, which do not improve or extend the life of the related assets, are charged to expense when incurred. Refurbishments are capitalized when the life of the equipment is extended. When property and equipment are sold or otherwise disposed of, the asset account and related accumulated depreciation account are relieved, and any gain or loss is included in operating income. The cost of property and equipment currently in service is depreciated on a straight-line basis over the estimated useful lives of the related assets, which range from three to 25 years.
PP&E are evaluated on a quarterly basis to identify events or changes in circumstances (“triggering events”) that indicate the carrying value of certain PP&E may not be recoverable. PP&E are reviewed for impairment upon the occurrence of a triggering event. An impairment loss is recorded in the period in which it is determined that the carrying amount of PP&E is not recoverable. The determination of recoverability is made based upon the estimated undiscounted future net cash flows of assets grouped at the lowest level for which there are identifiable cash flows independent of the cash flows of other groups of assets with such cash flows to be realized over the estimated remaining useful life of the primary asset within the asset group, excluding interest expense. We determined the lowest level of identifiable cash flows that are independent of other asset groups to be at the service line level, which consists of the well services, hydraulic fracturing, coiled tubing, wireline, pumpdown, directional drilling, cementing, artificial lift applications, international coiled tubing, equipment manufacturing and repair services, specialty chemicals and data acquisition and control instruments provider service lines as well as the vertically integrated research and technology service line. If the estimated undiscounted future net cash flows for a given asset group is less than the carrying amount of the related assets, an impairment loss is determined by comparing the estimated fair value with the carrying value of the related assets. The impairment loss is then allocated across the asset group's major classifications.
Goodwill, Indefinite-Lived Intangible Assets and Definite-Lived Intangible Assets. Goodwill is allocated to our three reporting units: Completion Services, Well Support Services and Other Services, all of which are consistent with the presentation of our three reportable segments. At the reporting unit level, we test goodwill for impairment on an annual basis as
56
of October 31 of each year, or when events or changes in circumstances, referred to as triggering events, indicate the carrying value of goodwill may not be recoverable and that a potential impairment exists.
Judgment is used in assessing whether goodwill should be tested for impairment more frequently than annually. Factors such as unexpected adverse economic conditions, competition, market changes and other external events may require more frequent assessments.
Before employing detailed impairment testing methodologies, we may first evaluate the likelihood of impairment by considering qualitative factors relevant to each reporting unit, such as macroeconomic, industry, market or any other factors that have a significant bearing on fair value. If we first utilize a qualitative approach and determine that it is more likely than not that goodwill is impaired, detailed testing methodologies are then applied. Otherwise, we conclude that no impairment has occurred. Detailed impairment testing, or Step 1 testing, involves comparing the fair value of each reporting unit to its carrying value, including goodwill. Fair value reflects the price a market participant would be willing to pay in a potential sale of the reporting unit. If the fair value exceeds carrying value, then it is concluded that no goodwill impairment has occurred. If the carrying value of the reporting unit exceeds its fair value, a second step is required to measure possible goodwill impairment loss. The second step, or Step 2 testing, includes hypothetically valuing the tangible and intangible assets and liabilities of the reporting unit as if the reporting unit had been acquired in a business combination. Then, the implied fair value of the reporting unit’s goodwill is compared to the carrying value of that goodwill. If the carrying value of the reporting unit’s goodwill exceeds the implied fair value of the goodwill, an impairment loss is recognized in an amount equal to the excess, not to exceed the carrying value.
Our Step 1 impairment analysis involves the use of a blended income and market approach. Significant management judgment is necessary to evaluate the impact of operating and macroeconomic changes on each reporting unit. Critical assumptions include projected revenue growth, fleet count, utilization, gross profit rates, SG&A rates, working capital fluctuations, capital expenditures, discount rates, terminal growth rates, and price-to-earnings multiples. Our market capitalization is also used to corroborate reporting unit valuations.
Similar to goodwill, indefinite-lived intangible assets are subject to annual impairment tests or more frequently if events or circumstances indicate the carrying amount may not be recoverable.
Definite-lived intangible assets are amortized over their estimated useful lives. These intangibles are reviewed for impairment when events or changes in circumstances (a triggering event) indicate that the asset may have a net book value in excess of recoverable value. In these cases, we perform a recoverability test on its definite-lived intangible assets by comparing the estimated future net undiscounted cash flows expected to be generated from the use of the asset to the carrying amount of the asset for recoverability. If the estimated undiscounted cash flows exceed the carrying amount of the asset, an impairment does not exist and a loss will not be recognized. If the undiscounted cash flows are less than the carrying amount of the asset, the asset is not recoverable and the amount of impairment must be determined by fair valuing the asset.
Mergers and Acquisitions. In accordance with accounting guidance for business combinations, we allocate the purchase price of an acquired business to its identifiable assets and liabilities based on estimated fair values. The excess of the purchase price over the amount allocated to the assets and liabilities, if any, is recorded as goodwill. We use all available information to estimate fair values. We typically engage outside appraisal firms to assist in the fair value determination of identifiable intangible assets such as trade names and any other significant assets or liabilities. We adjust the preliminary purchase price allocation, as necessary, up to one year after the acquisition closing date as we obtain more information regarding asset valuations and liabilities assumed.
Our purchase price allocation methodology contains uncertainties because it requires management to make assumptions and to apply judgment to estimate the fair value of acquired assets and liabilities. Management estimates the fair value of assets and liabilities based upon quoted market prices, the carrying value of the acquired assets and widely accepted valuation techniques, including discounted cash flows and market multiple analysis. Unanticipated events or circumstances may occur which could affect the accuracy of our fair value estimates, including assumptions regarding industry economic factors and business strategies. If actual results are materially different than the assumptions we used to determine fair value of the assets and liabilities acquired through a business combination, it is possible that adjustments to the carrying values of such assets and liabilities will have an impact on our net earnings.
See “Note 13 – Mergers and Acquisitions” in Item 8 “Financial Statements and Supplementary Data” of our Annual Report on Form 10-K for the acquisition-related information associated with mergers and acquisitions completed in the last three fiscal years.
57
Revenue Recognition. All revenue is recognized when persuasive evidence of an arrangement exists, the service is complete or the equipment has been delivered to the customer, the amount is fixed or determinable and collectibility is reasonably assured, as follows:
Completion Services Segment
Hydraulic Fracturing Revenue. Through our hydraulic fracturing service line, we provide hydraulic fracturing services on a spot market basis or pursuant to contractual arrangements, such as term contracts and pricing agreements. Under either scenario, revenue is recognized and customers are invoiced upon the completion of each job, which can consist of one or more fracturing stages. Once a job has been completed to the customer’s satisfaction, a field ticket is written that includes charges for the service performed and the consumables (such as fluids and proppants) used during the course of service. The field ticket may also include charges for the mobilization and set-up of equipment, the personnel on the job, any additional equipment used on the job, and other miscellaneous consumables. Rates for services performed on a spot market basis are based on an agreed-upon hourly spot market rate for a specified number of hours of service.
Pursuant to pricing agreements and other contractual arrangements which we may enter into from time to time, such as those associated with an award from a bid process, customers typically commit to targeted utilization levels based on a specified number of hours of service at agreed-upon pricing, but without termination penalties or obligations to pay for services not used by the customer. In addition, the agreed-upon pricing is typically subject to periodic review, as specifically defined in the agreement, and may be adjusted upon the agreement of both parties.
Casedhole Wireline Revenue. Through our cased-hole wireline service line, we provide cased-hole wireline logging, perforating, pressure pumping, well site make-up and pressure testing and other complementary services, on a spot market basis. Jobs for these services are typically short-term in nature, lasting anywhere from a few hours to multiple days. We typically charge the customer for these services on a per job basis at agreed-upon spot market rates. Revenue is recognized based on a field ticket issued upon the completion of the job.
Revenue from Materials Consumed While Performing Certain Completion Services. We generate revenue from consumables used during the course of providing services.
With respect to hydraulic fracturing services, we generate revenue from the fluids, proppants and other materials that are consumed while performing a job. For services performed on a spot market basis, the required consumables are typically provided by us and the customer is billed for those consumables at cost plus an agreed-upon markup. For services performed on a contractual basis, when the consumables are provided by us, the customer typically is billed for those consumables at a negotiated contractual rate. When consumables are supplied by the customer, we typically charge handling fees based on the amount of consumables used.
Other Completion Services. We generate revenue from certain smaller service lines, specifically directional drilling services, cementing services, and research and technology business lines.
With respect to our directional drilling services, we provide these services on a spot market basis. Jobs for these services are typically short-term in nature, lasting anywhere from a few days to multiple weeks. We typically charge the customer for these services on a per day basis at agreed-upon spot market rates depending on the level of services required and the complexity of the job. Revenue is recognized and customers are invoiced upon the completion of each job. Once a job has been completed to the customer’s satisfaction, a field ticket is written that includes charges for the service performed.
With respect to our cementing services, we provide these services on a spot market or project basis. Jobs for these services are typically short-term in nature and are generally completed in a few hours. We typically charge the customer for these services on a per job basis at agreed-upon spot market rates or agreed-upon job pricing for a particular project. Revenue is recognized and customers are invoiced upon the completion of each job. Once a job has been completed to the customer’s satisfaction, a field ticket is written that includes charges for the service performed and the consumables (such as blended bulk cement and chemical additives) used during the course of service.
Well Support Services Segment
Rig Services Revenue. Through our rig service line, we primarily provide workover and well servicing rigs that are involved in routine repair and maintenance, completions, re-drilling and plug and abandonment operations. These services are provided on an hourly basis at prices that approximate spot market rates. Revenue is recognized and a field ticket is generated upon the earliest of the completion of a job or at the end of each day. A rig services job can last anywhere from a few hours to
58
multiple days depending on the type of work being performed. The field ticket includes the base hourly rate charge and, if applicable, charges for additional personnel or equipment not contemplated in the base hourly rate.
Fluids Management Services Revenue. Through our fluids management service line, we primarily provide transportation, storage and disposal services for fluids used in the drilling, completion and workover of oil and gas wells. Rates for these services vary and can be on a per job, per hour or per load basis, or on the basis of quantities sold or disposed. Revenue is recognized upon the completion of each job or load, or delivered product, based on a completed field ticket.
Coiled Tubing and Other Stimulation Services Revenue. Through our coiled tubing service line, we provide a range of coiled tubing and other well stimulation services, including nitrogen and pressure pumping services, primarily on a spot market basis. Jobs for these services are typically short-term in nature, lasting anywhere from a few hours to multiple days. Revenue is recognized upon completion of each day’s work based upon a completed field ticket. The field ticket includes charges for the services performed and the consumables (such as stimulation fluids, nitrogen and coiled tubing materials) used during the course of service. The field ticket may also include charges for the mobilization and set-up of equipment, the personnel on the job, any additional equipment used on the job, and other miscellaneous consumables. We typically charge the customer for the services performed and resources provided on an hourly basis at agreed-upon spot market rates.
Other Special Well Site Services Revenue. Through our other special well site service line, we primarily provide fishing, contract labor, and tool rental services for completion and workover of oil and gas wells. Rates for these services vary and can be on a per job, per hour or on the basis of rental days per month. Revenue is recognized based on a field ticket issued upon the completion of each job or on a monthly billing for rental services provided.
In addition, ancillary to coiled tubing and other stimulation services revenue, we generate revenue from stimulation fluids, nitrogen, coiled tubing materials and other consumables used during those processes.
With respect to our artificial lift applications, we generate revenue primarily from the sale of manufactured equipment and products. Revenue is recognized upon the completion, delivery and customer acceptance of each order.
Other Services Segment
Revenue within the Other Services Segment is generated from certain of our smaller non-core service lines that have either been divested or are in the process of being divested, such as, equipment manufacturing and repair operations and our international coiled tubing operations in the Middle East.
Accounts Receivable and Allowance for Doubtful Accounts. Accounts receivable are generally stated at the amount billed to customers. We provide an allowance for doubtful accounts, which is based upon a review of outstanding receivables, historical collection information and existing economic conditions. Provisions for doubtful accounts are recorded when it is deemed probable that the customer will not make the required payments at either the contractual due dates or in the future. At December 31, 2016 and 2015, the allowance for doubtful accounts totaled $3.0 million and $7.9 million, respectively. Bad debt expense of $1.7 million, $8.1 million and $0.7 million was included in direct costs on the consolidated statements of operations for the years ended December 31, 2016, 2015 and 2014, respectively.
Share-Based Compensation. Our share-based compensation consists of restricted shares and nonqualified share options. We recognize share-based compensation expense on a straight-line basis over the requisite service period of the award. We value restricted share grants based on the closing price of our common shares on the grant date, and we value option grants based on the grant date fair value by using the Black-Scholes option-pricing model, which requires the use of highly subjective assumptions.
The Black-Scholes option-pricing model requires inputs such as the expected term of the grant, expected volatility and risk-free interest rate. Further, the forfeiture rate also affects the amount of aggregate compensation that we are required to record as an expense. We will continue to use judgment in evaluating the expected term, volatility and forfeiture rate related to our share-based compensation on a prospective basis and will incorporate these factors into our option-pricing model. Each of these inputs is subjective and generally requires significant management judgment. If, in the future, we determine that another method for calculating the fair value of our stock options is more reasonable, or if another method for calculating these input assumptions is prescribed by authoritative guidance, and, therefore, should be used to estimate expected volatility or expected term, the fair value calculated for our employee stock options could change significantly. Higher volatility and longer expected terms generally result in an increase to share-based compensation expense determined at the date of grant.
59
Income Taxes. We are subject to income and other similar taxes in all areas in which we operate. When recording income tax expense, certain estimates are required because: (a) income tax returns are generally filed months after the close of our annual accounting period; (b) tax returns are subject to audit by taxing authorities and audits can often take years to complete and settle; and (c) future events often impact the timing of when we recognize income tax expenses and benefits.
We account for income taxes utilizing the asset and liability method. Under this method, deferred tax assets and liabilities are recognized for the future tax consequences attributable to differences between the financial statement carrying amounts of existing assets and liabilities and their respective tax bases. Deferred tax assets and liabilities are measured using enacted tax rates expected to apply to taxable income in the years in which those temporary differences are expected to be recovered or settled. The effect on deferred tax assets and liabilities of a change in tax rates is recognized as income or expense in the period that includes the enactment date.
The ultimate realization of deferred tax assets is dependent upon the generation of future taxable income during the periods in which those temporary differences become deductible. In assessing the likelihood and extent that deferred tax assets will be realized, consideration is given to projected future taxable income and tax planning strategies. A valuation allowance is recorded when, in the opinion of management, it is more likely than not that some portion or all of the deferred tax assets will not be realized.
We have federal, state and international net operating loss carryforwards that will expire in the years 2021 through 2036. After considering the scheduled reversal of deferred tax liabilities, projected future taxable income, the limitations on use of NOLs under Section 382 and tax planning strategies, we established a valuation allowance due to the uncertainty regarding the ultimate realization of the deferred tax assets associated with our carryforwards.
On the Plan Effective Date, we believe we experienced an ownership change for purposes of Internal Revenue Code Section 382 as result of our Restructuring Plan and that our pre-change NOLs are subject to an annual limitation. The ownership change and resulting annual limitation on use of NOLs are not expected to result in the expiration of our NOL carryforwards if we are able to generate sufficient future taxable income within the carryforward periods. However, the potential limitation on the amount of NOLs available to offset taxable income in a specific year may result in the payment of income taxes before all NOLs have been utilized. Additionally, a subsequent ownership change may result in further limitation on the ability to utilize existing NOLs and other tax attributes.
We recognize the financial statement effects of a tax position when it is more-likely-than-not, based on the technical merits, that the position will be sustained upon examination. A tax position that meets the more-likely-than-not recognition threshold is measured as the largest amount of tax benefit that is greater than 50.0% likely of being realized upon ultimate settlement with a taxing authority. We reverse a previously recognized tax position in the first period in which it is no longer more-likely-than-not that the tax position would be sustained upon examination. We will record income tax related interest and penalties, if applicable, as a component of the provision for income tax expense. The Company recorded income tax expense for unrecognized tax benefits equal to $6.5 million and zero for the periods ending December 31, 2016 and December 31, 2015 respectively.
Recent Accounting Pronouncements
In May 2014, the Financial Accounting Standards Board ("FASB") issued a comprehensive new revenue recognition standard, Accounting Standards Update ("ASU") No. 2014-09, Revenue from Contracts with Customers ("ASU 2014-09") that will supersede existing revenue recognition guidance under U.S. GAAP. In August 2015, the FASB issued an accounting standards update for a one-year deferral of the revenue recognition standard's effective date for all entities, which changed the effectiveness to annual reporting periods beginning after December 15, 2017, including interim periods within that reporting period. The core principle of the new guidance is that a company should recognize revenue to depict the transfer of promised goods or services to customers in an amount that reflects the consideration to which the company expects to be entitled in exchange for those goods or services. The standard creates a five step model that requires companies to exercise judgment when considering the terms of a contract and all relevant facts and circumstances. The standard allows for several transition methods: (a) a full retrospective adoption in which the standard is applied to all of the periods presented, or (b) a modified retrospective adoption in which the standard is applied only to the most current period presented in the financial statements, including additional disclosures of the standard’s application impact to individual financial statement line items. We are currently evaluating the impact, if any, of adopting this new accounting standard on our results of operations and financial position.
In July 2015, the FASB issued ASU No. 2015-11, Simplifying the Measurement of Inventory ("ASU 2015-11"), which changes the measurement principle for inventory from the lower of cost or market to lower of cost and net realizable
60
value. ASU 2015-11 is part of the FASB’s simplification initiative and applies to entities that measure inventory using a method other than last-in, first-out ("LIFO") or the retail inventory method. The guidance will require prospective application at the beginning of our first quarter of fiscal 2018, but permits adoption in an earlier period. We do not expect this ASU to have a material impact on our consolidated financial statements.
In November 2015, the FASB issued ASU No. 2015-17, Income Taxes (Topic 740): Balance Sheet Classification of Deferred Taxes ("ASU 2015-17”). ASU 2015-17 amends existing guidance on income taxes to require the classification of all deferred tax assets and liabilities as non-current on the balance sheet. We are required to adopt this ASU for years beginning after December 15, 2016, with early adoption permitted, and the guidance may be applied either prospectively or retrospectively. We do not expect this ASU to have a material impact on our consolidated financial statements.
In February 2016, the FASB issued ASU No. 2016-02, Leases (Topic 842) ("ASU 2016-02"). ASU No. 2016-02 seeks to increase transparency and comparability among organizations by recognizing lease assets and lease liabilities on the balance sheet and by disclosing key information about leasing arrangements. Unlike current U.S. GAAP, which requires only capital leases to be recognized on the balance sheet, ASU No. 2016-02 will require both operating and finance leases to be recognized on the balance sheet. Additionally, the new guidance will require disclosures to help investors and other financial statement users better understand the amount, timing, and uncertainty of cash flows arising from leases, including qualitative and quantitative requirements. The amendments in ASU No. 2016-02 are effective for fiscal years beginning after December 15, 2018, including interim periods within those fiscal years, and early application is permitted. We are currently evaluating the impact of adopting this new accounting standard on our results of operations and financial position.
In March 2016, the FASB issued ASU No. 2016-09, Compensation—Stock Compensation (Topic 718): Improvements to Employee Share-Based Payment Accounting ("ASU 2016-09"), to simplify certain provisions in stock compensation accounting, including the simplification of accounting for a stock payment's tax consequences. The ASU amends the guidance for classifying awards as either equity or liabilities, allows companies to estimate the number of stock awards they expect to vest, and revises the tax withholding requirements for stock awards. The amendments in ASU No. 2016-09 are effective for public companies for fiscal years beginning after December 15, 2016, including interim periods within those fiscal years, and early application is permitted. We are currently evaluating the impact of adopting this new accounting standard on our results of operations and financial position.
In June 2016, the FASB issued ASU No. 2016-13, Financial Instruments-Credit Losses (Topic 326): Measurement of Credit Losses on Financial Instruments (“ASU 2016-13”), which amends U.S. GAAP by introducing a new impairment model for financial instruments that is based on expected credit losses rather than incurred credit losses. The new impairment model applies to most financial assets, including trade accounts receivable. The amendments in ASU 2016-13 are effective for interim and annual reporting periods beginning after December 15, 2019, although it may be adopted one year earlier, and requires a modified retrospective transition approach. We are currently evaluating the impact this standard will have on our results of operations and financial position.
In October 2016, the FASB issued ASU No. 2016-16, Income Taxes (Topic 740): Intra-Entity Transfers of Assets Other Than Inventory ("ASU 2016-16"), which requires an entity to recognize the income tax consequences of an intra-entity asset transfer, other than an intra-entity asset transfer of inventory, when the transfer occurs. The ASU is effective for the interim and annual reporting periods beginning after December 15, 2017, including interim periods within those fiscal years, and early application is permitted. We are currently evaluating the impact of adopting this new accounting standard on our results of operations and financial position.
Inflation
Inflation in the United States has been relatively low in recent years and did not have a material impact on our results of operations for the years ended December 31, 2016, 2015 and 2014. Although the impact of inflation has been insignificant in recent years, it is still a factor in the U.S. economy, and we tend to experience inflationary pressure on the cost of our equipment, materials and supplies as increasing oil and natural gas prices increase activity in our areas of operations.
61
Item 7A. Quantitative and Qualitative Disclosures About Market Risk
Market risk is the risk of loss arising from adverse changes in market rates and prices. The principal market risk to which we are exposed is commodity price risk, which is the risk related to increases in the prices of fuel, materials and supplies consumed in performing our services. We are also exposed to risks related to interest rate fluctuations and customer credit.
Commodity Price Risk. Our material and fuel purchases expose us to commodity price risk. Our material costs primarily include the cost of inventory consumed while performing our stimulation services such as proppants, chemicals, guar, coiled tubing and fluid supplies. Our fuel costs consist primarily of diesel fuel used by our various trucks and other motorized equipment. The prices for fuel and the raw materials (particularly guar and proppants) in our inventory are volatile and are impacted by changes in supply and demand, as well as market uncertainty and regional shortages. Historically, we have generally been able to pass along price increases to our customers; however, we may be unable to do so in the future. We do not engage in commodity price hedging activities.
Interest Rate Risk. We are exposed to changes in interest rates on our floating rate borrowings under our New Credit Facility. As of December 31, 2016, the outstanding balance under our DIP Facility was $25.0 million. The impact of a 1.0% increase in interest rates under the terms of the New Credit Facility on our outstanding debt as of December 31, 2016 would have resulted in an increase in interest expense of approximately $0.3 million for the year.
Customer Credit Risk. Financial instruments that potentially subject us to concentrations of credit risk are trade receivables. We extend credit to customers and other parties in the normal course of business. We have established various procedures to manage our credit exposure, including credit evaluations and maintaining an allowance for doubtful accounts.
62
Item 8. Financial Statements and Supplementary Data
Index to
Consolidated Financial Statements
Management's Report on Internal Control Over Financial Reporting | |
Reports of Independent Registered Public Accounting Firms | |
Consolidated Balance Sheets as of December 31, 2016 and 2015 | |
Consolidated Statements of Operations for the Years Ended December 31, 2016, 2015 and 2014 | |
Consolidated Statements of Comprehensive Income (Loss) for the Years Ended December 31, 2016, 2015 and 2014 | |
Consolidated Statements of Changes in Shareholders’ Equity for the Years Ended December 31, 2016, 2015 and 2014 | |
Consolidated Statements of Cash Flows for the Years Ended December 31, 2016, 2015 and 2014 | |
Notes to Consolidated Financial Statements | |
63
Management’s Report on Internal Control Over Financial Reporting
Management of the Company is responsible for establishing and maintaining adequate internal control over financial reporting (as defined in Rules 13a-15(f) and 15d-15(f) of the Exchange Act). Internal control over financial reporting is a process designed by, or under the supervision of, the Company’s principal executive and principal financial officers, or persons performing similar functions, and effected by the Company’s board of directors, management and other personnel, to provide reasonable assurance regarding the reliability of financial reporting and the preparation of financial statements for external purposes in accordance with generally accepted accounting principles in the United States and includes those policies and procedures that (i) pertain to the maintenance of records that in reasonable detail accurately and fairly reflect the transactions and dispositions of the assets of the Company; (ii) provide reasonable assurance that transactions are recorded as necessary to permit preparation of financial statements in accordance with generally accepted accounting principles, and that receipts and expenditures of the Company are being made only in accordance with authorizations of management and directors of the Company; and (iii) provide reasonable assurance regarding prevention or timely detection of unauthorized acquisition, use or disposition of the Company’s assets that could have a material effect on the financial statements.
Because of its inherent limitations, internal control over financial reporting may not prevent or detect misstatements. Therefore, even those systems determined to be effective can provide only reasonable assurance with respect to financial statement preparation and presentation. Also, projections of any evaluation of effectiveness to future periods are subject to the risk that controls may become inadequate because of changes in conditions, or that the degree of compliance with the policies or procedures may deteriorate.
Management with the participation of the Company’s principal executive and financial officers assessed the effectiveness of the Company’s internal control over financial reporting as of December 31, 2016. In making this assessment, it used the criteria set forth in 2013 by the Committee of Sponsoring Organizations of the Treadway Commission (COSO) in Internal Control-Integrated Framework. Management’s assessment included an evaluation of the design of internal control over financial reporting and testing of the operational effectiveness of its internal control over financial reporting. Based on this assessment, management has concluded that the Company maintained effective internal control over financial reporting as of December 31, 2016.
/s/ Donald J. Gawick | /s/ Mark C. Cashiola | |
Donald J. Gawick President, Chief Executive Officer and Director (Principal Executive Officer) | Mark C. Cashiola Chief Financial Officer (Principal Financial Officer and Principal Accounting Officer) | |
March 2, 2017
64
Report of Independent Registered Public Accounting Firm
The Board of Directors and Shareholders
C&J Energy Services, Inc.:
We have audited the accompanying consolidated balance sheets of C&J Energy Services Ltd. and subsidiaries (Debtor-in-Possession) as of December 31, 2016 and 2015, and the related consolidated statements of operations, comprehensive income (loss), shareholders’ equity, and cash flows for each of the years in the three‑year period ended December 31, 2016. These consolidated financial statements are the responsibility of the Company’s management. Our responsibility is to express an opinion on these consolidated financial statements based on our audits.
We conducted our audits in accordance with the standards of the Public Company Accounting Oversight Board (United States). Those standards require that we plan and perform the audit to obtain reasonable assurance about whether the financial statements are free of material misstatement. An audit includes examining, on a test basis, evidence supporting the amounts and disclosures in the financial statements. An audit also includes assessing the accounting principles used and significant estimates made by management, as well as evaluating the overall financial statement presentation. We believe that our audits provide a reasonable basis for our opinion.
In our opinion, the consolidated financial statements referred to above present fairly, in all material respects, the financial position of C&J Energy Services Ltd. and subsidiaries (Debtor-in-Possession) as of December 31, 2016 and 2015, and the results of their operations and their cash flows for each of the years in the three‑year period ended December 31, 2016, in conformity with U.S. generally accepted accounting principles.
/s/ KPMG LLP
Houston, Texas
March 2, 2017
65
C&J ENERGY SERVICES LTD. (DEBTOR-IN-POSSESSION) AND SUBSIDIARIES
CONSOLIDATED BALANCE SHEETS
(Amounts in thousands, except share data)
As of December 31, | ||||||||
2016 | 2015 | |||||||
ASSETS | ||||||||
Current assets: | ||||||||
Cash and cash equivalents | $ | 64,583 | $ | 25,900 | ||||
Accounts receivable, net of allowance of $2,951 and $7,917 as of December 31, 2016 and 2015 respectively | 137,222 | 274,691 | ||||||
Inventories, net | 54,471 | 102,257 | ||||||
Prepaid and other current assets | 37,392 | 72,560 | ||||||
Deferred tax assets | 6,020 | 9,035 | ||||||
Total current assets | 299,688 | 484,443 | ||||||
Property, plant and equipment, net of accumulated depreciation of $683,189 and $499,894 at December 31, 2016 and 2015, respectively | 950,811 | 1,210,441 | ||||||
Other assets: | ||||||||
Goodwill | — | 307,677 | ||||||
Intangible assets, net | 76,057 | 147,861 | ||||||
Deferred financing costs, net of accumulated amortization of $6,396 as of December 31, 2015 | — | 14,355 | ||||||
Other noncurrent assets | 35,045 | 34,175 | ||||||
Total assets | $ | 1,361,601 | $ | 2,198,952 | ||||
LIABILITIES AND SHAREHOLDERS’ EQUITY (DEFICIT) | ||||||||
Current liabilities: | ||||||||
Accounts payable | $ | 75,193 | $ | 184,859 | ||||
Payroll and related costs | 18,287 | 10,516 | ||||||
Accrued expenses | 59,129 | 52,069 | ||||||
DIP Facility | 25,000 | — | ||||||
Current portion of debt and capital lease obligations | — | 13,433 | ||||||
Related party payables | — | 28,206 | ||||||
Other current liabilities | 3,026 | 1,785 | ||||||
Total current liabilities | 180,635 | 290,868 | ||||||
Deferred tax liabilities | 15,613 | 149,151 | ||||||
Long-term debt and capital lease obligations, net of original issue discount and financing costs of $86,368 as of December 31, 2015 | — | 1,108,123 | ||||||
Other long-term liabilities | 18,577 | 18,167 | ||||||
Total liabilities not subject to compromise | 214,825 | 1,566,309 | ||||||
Liabilities subject to compromise | 1,445,346 | — | ||||||
Commitments and contingencies | ||||||||
Shareholders’ equity | ||||||||
Common shares, par value of $0.01, 750,000,000 shares authorized, 119,529,942 and 120,420,120 issued and outstanding as of December 31, 2016 and 2015, respectively | 1,195 | 1,204 | ||||||
Additional paid-in capital | 1,009,426 | 997,766 | ||||||
Accumulated other comprehensive loss | (2,600 | ) | (4,025 | ) | ||||
Retained deficit | (1,306,591 | ) | (362,302 | ) | ||||
Total shareholders’ equity (deficit) | (298,570 | ) | 632,643 | |||||
Total liabilities and shareholders’ equity (deficit) | $ | 1,361,601 | $ | 2,198,952 | ||||
See accompanying notes to consolidated financial statements
66
C&J ENERGY SERVICES LTD. (DEBTOR-IN-POSSESSION) AND SUBSIDIARIES
CONSOLIDATED STATEMENTS OF OPERATIONS
(Amounts in thousands, except per share data)
Years Ended December 31, | ||||||||||||
2016 | 2015 | 2014 | ||||||||||
Revenue | $ | 971,142 | $ | 1,748,889 | $ | 1,607,944 | ||||||
Costs and expenses: | ||||||||||||
Direct costs | 947,255 | 1,523,194 | 1,179,227 | |||||||||
Selling, general and administrative expenses | 229,267 | 239,697 | 182,518 | |||||||||
Research and development | 7,718 | 16,704 | 14,327 | |||||||||
Depreciation and amortization | 217,440 | 276,353 | 108,145 | |||||||||
Impairment expense | 436,395 | 791,807 | — | |||||||||
(Gain) loss on disposal of assets | 3,075 | (544 | ) | (17 | ) | |||||||
Operating income (loss) | (870,008 | ) | (1,098,322 | ) | 123,744 | |||||||
Other income (expense): | ||||||||||||
Interest expense, net | (157,465 | ) | (82,086 | ) | (9,840 | ) | ||||||
Other income (expense), net | 9,504 | 8,773 | 598 | |||||||||
Total other income (expense) | (147,961 | ) | (73,313 | ) | (9,242 | ) | ||||||
Income (loss) before reorganization items and income taxes | (1,017,969 | ) | (1,171,635 | ) | 114,502 | |||||||
Reorganization items | 55,330 | — | — | |||||||||
Income tax expense (benefit) | (129,010 | ) | (299,093 | ) | 45,679 | |||||||
Net income (loss) | $ | (944,289 | ) | $ | (872,542 | ) | $ | 68,823 | ||||
Net income (loss) per common share: | ||||||||||||
Basic | $ | (7.98 | ) | $ | (8.48 | ) | $ | 1.28 | ||||
Diluted | $ | (7.98 | ) | $ | (8.48 | ) | $ | 1.22 | ||||
Weighted average common shares outstanding: | ||||||||||||
Basic | 118,305 | 102,853 | 53,838 | |||||||||
Diluted | 118,305 | 102,853 | 56,513 | |||||||||
See accompanying notes to consolidated financial statements
67
C&J ENERGY SERVICES LTD. (DEBTOR-IN-POSSESSION) AND SUBSIDIARIES
CONSOLIDATED STATEMENTS OF COMPREHENSIVE INCOME (LOSS)
(In thousands)
Years Ended December 31, | |||||||||||
2016 | 2015 | 2014 | |||||||||
Net income (loss) | $ | (944,289 | ) | $ | (872,542 | ) | $ | 68,823 | |||
Other comprehensive income (loss): | |||||||||||
Foreign currency translation gain (loss), net of income tax (expense) benefit of ($31) and $1,369 as of December 31, 2016 and 2015, respectively | 1,425 | (3,980 | ) | (45 | ) | ||||||
Comprehensive income (loss) | $ | (942,864 | ) | $ | (876,522 | ) | $ | 68,778 | |||
See accompanying notes to consolidated financial statements
68
C&J ENERGY SERVICES LTD. (DEBTOR-IN-POSSESSION) AND SUBSIDIARIES
CONSOLIDATED STATEMENTS OF CHANGES IN SHAREHOLDERS’ EQUITY
(Amounts in thousands)
Common Shares | Additional Paid-in Capital | Other Comprehensive Loss | Retained Earnings (Deficit) | Total | |||||||||||||||||||
Number of Shares | Amount, at $0.01 par value | ||||||||||||||||||||||
Balance, December 31, 2013 | 54,604 | $ | 546 | $ | 254,188 | $ | — | $ | 441,417 | $ | 696,151 | ||||||||||||
Issuance of restricted shares, net of forfeitures | 723 | 7 | (7 | ) | — | — | — | ||||||||||||||||
Employee tax withholding on restricted shares vesting | (153 | ) | (2 | ) | (4,376 | ) | — | — | (4,378 | ) | |||||||||||||
Issuance of common shares for stock options exercised | 159 | 2 | 831 | — | — | 833 | |||||||||||||||||
Tax effect of share-based compensation | — | — | 2,118 | — | — | 2,118 | |||||||||||||||||
Share-based compensation | — | — | 18,350 | — | — | 18,350 | |||||||||||||||||
Net income | — | — | — | — | 68,823 | 68,823 | |||||||||||||||||
Foreign currency translation loss, net of tax | — | — | — | (45 | ) | — | (45 | ) | |||||||||||||||
Balance, December 31, 2014 | 55,333 | 553 | 271,104 | (45 | ) | 510,240 | 781,852 | ||||||||||||||||
Issuance of common shares, net of issuance costs | 62,542 | 625 | 709,642 | — | — | 710,267 | |||||||||||||||||
Issuance of restricted shares, net of forfeitures | 2,613 | 26 | 3,006 | — | — | 3,032 | |||||||||||||||||
Employee tax withholding on restricted shares vesting | (222 | ) | (2 | ) | (2,619 | ) | — | — | (2,621 | ) | |||||||||||||
Issuance of common shares for stock options exercised | 154 | 2 | 451 | — | — | 453 | |||||||||||||||||
Tax effect of share-based compensation | — | — | (2,367 | ) | — | — | (2,367 | ) | |||||||||||||||
Share-based compensation | — | — | 18,549 | — | — | 18,549 | |||||||||||||||||
Net loss | — | — | — | — | (872,542 | ) | (872,542 | ) | |||||||||||||||
Foreign currency translation loss, net of tax | — | — | — | (3,980 | ) | — | (3,980 | ) | |||||||||||||||
Balance, December 31, 2015 | 120,420 | 1,204 | 997,766 | (4,025 | ) | (362,302 | ) | 632,643 | |||||||||||||||
Forfeitures of restricted shares | (576 | ) | (6 | ) | 6 | — | — | — | |||||||||||||||
Employee tax withholding on restricted shares vesting | (314 | ) | (3 | ) | (494 | ) | — | — | (497 | ) | |||||||||||||
Tax effect of share-based compensation | — | — | (5,592 | ) | — | — | (5,592 | ) | |||||||||||||||
Share-based compensation | — | — | 17,740 | — | — | 17,740 | |||||||||||||||||
Net loss | — | — | — | — | (944,289 | ) | (944,289 | ) | |||||||||||||||
Foreign currency translation gain, net of tax | — | — | — | 1,425 | — | 1,425 | |||||||||||||||||
Balance, December 31, 2016 | 119,530 | $ | 1,195 | $ | 1,009,426 | $ | (2,600 | ) | $ | (1,306,591 | ) | $ | (298,570 | ) | |||||||||
See accompanying notes to consolidated financial statements
69
C&J ENERGY SERVICES LTD. (DEBTOR-IN-POSSESSION) AND SUBSIDIARIES
CONSOLIDATED STATEMENTS OF CASH FLOWS
(Amounts in thousands)
Years Ended December 31, | ||||||||||||
2016 | 2015 | 2014 | ||||||||||
Cash flows from operating activities: | ||||||||||||
Net income (loss) | $ | (944,289 | ) | $ | (872,542 | ) | $ | 68,823 | ||||
Adjustments to reconcile net income (loss) to net cash provided by operating activities: | ||||||||||||
Depreciation and amortization | 217,440 | 276,353 | 108,145 | |||||||||
Impairment expense | 436,395 | 791,807 | — | |||||||||
Inventory write-down | 35,350 | 31,109 | — | |||||||||
Contingent consideration adjustment | (4,700 | ) | (11,147 | ) | — | |||||||
Deferred income taxes | (129,533 | ) | (273,144 | ) | 33,185 | |||||||
Provision for doubtful accounts, net of write-offs | 1,735 | 8,071 | 600 | |||||||||
Equity (earnings) loss from unconsolidated affiliate | 5,663 | (500 | ) | (471 | ) | |||||||
(Gain) loss on disposal of assets | 3,075 | (544 | ) | (17 | ) | |||||||
Share-based compensation expense | 17,740 | 18,549 | 18,350 | |||||||||
Amortization of deferred financing costs | 48,310 | 10,926 | 1,168 | |||||||||
Accretion of original issue discount | 52,414 | 6,187 | — | |||||||||
Reorganization items | 30,611 | — | — | |||||||||
Changes in operating assets and liabilities: | ||||||||||||
Accounts receivable | 137,075 | 278,150 | (135,784 | ) | ||||||||
Inventories | 4,244 | 21,123 | (50,001 | ) | ||||||||
Prepaid expenses and other current assets | 24,447 | (26,821 | ) | (12,154 | ) | |||||||
Accounts payable | (75,016 | ) | (168,607 | ) | 132,420 | |||||||
Payroll and related costs and accrued expenses | 35,028 | 17,400 | 14,157 | |||||||||
Income taxes receivable (payable) | 3,604 | (108 | ) | (301 | ) | |||||||
Other | (6,965 | ) | (3,257 | ) | 3,717 | |||||||
Net cash provided by (used in) operating activities | (107,372 | ) | 103,005 | 181,837 | ||||||||
Cash flows from investing activities: | ||||||||||||
Purchases of and deposits on property, plant and equipment | (57,909 | ) | (166,321 | ) | (307,598 | ) | ||||||
Proceeds from disposal of property, plant and equipment | 32,809 | 4,468 | 719 | |||||||||
Payments made for business acquisitions, net of cash acquired | (1,419 | ) | (663,303 | ) | (33,533 | ) | ||||||
Investment in unconsolidated subsidiary | (408 | ) | — | (3,000 | ) | |||||||
Net cash used in investing activities | (26,927 | ) | (825,156 | ) | (343,412 | ) | ||||||
Cash flows from financing activities: | ||||||||||||
Proceeds from revolving debt | 174,000 | 338,000 | 229,000 | |||||||||
Payments on revolving debt | (10,600 | ) | (532,000 | ) | (64,000 | ) | ||||||
Proceeds from term loans | — | 1,001,400 | — | |||||||||
Payments on term loans | (2,650 | ) | (7,950 | ) | — | |||||||
Proceeds from DIP Facility | 23,000 | — | — | |||||||||
Payments of capital lease obligations | (2,388 | ) | (3,874 | ) | (4,165 | ) | ||||||
Financing costs | (1,009 | ) | (55,450 | ) | (2,265 | ) | ||||||
Proceeds from issuance of common shares for stock options exercised | — | 453 | 833 | |||||||||
Registration costs associated with issuance of common shares | — | (1,465 | ) | — | ||||||||
Employee tax withholding on restricted shares vesting | (497 | ) | (2,621 | ) | (4,378 | ) | ||||||
Excess tax benefit (expense) from share-based compensation | (5,592 | ) | (2,367 | ) | 2,153 | |||||||
Net cash provided by financing activities | 174,264 | 734,126 | 157,178 | |||||||||
Effect of exchange rate on cash | (1,282 | ) | 3,908 | — | ||||||||
Net increase (decrease) in cash and cash equivalents | 38,683 | 15,883 | (4,397 | ) | ||||||||
Cash and cash equivalents, beginning of year | 25,900 | 10,017 | 14,414 | |||||||||
Cash and cash equivalents, end of year | $ | 64,583 | $ | 25,900 | $ | 10,017 | ||||||
See accompanying notes to consolidated financial statements
70
C&J ENERGY SERVICES LTD. (DEBTOR IN POSSESSION) AND SUBSIDIARIES
NOTES TO CONSOLIDATED FINANCIAL STATEMENTS
Note 1 – Organization, Nature of Business and Summary of Significant Accounting Policies
C&J Energy Services, Inc., a Delaware corporation (the "Successor" and together with its consolidated subsidiaries and for periods subsequent to the Plan Effective Date as defined below, “C&J” or the “Company”) is a leading provider of well construction, well completion, well support and other complementary oilfield services to oil and gas exploration and production companies in North America. The Company offers a comprehensive, vertically-integrated suite of services throughout the life cycle of the well, including hydraulic fracturing, cased-hole wireline and pumpdown, cementing, directional drilling, coiled tubing, service rigs, fluids management and other support services. The Company is headquartered in Houston, Texas and operates in all active onshore basins in the continental United States and Western Canada.
C&J's business was founded in Texas in 1997 as a partnership and converted to a Delaware corporation ("Old C&J") in 2010 in connection with an initial public offering that was completed in July 2011 with a listing on the New York Stock Exchange ("NYSE") under the symbol "CJES." In 2015, Old C&J combined with the completion and production services business (the "C&P Business") of Nabors Industries Ltd. ("Nabors") in a transaction (referred to herein as the "Nabors Merger") that nearly tripled the Company's size, significantly expanding the Company's Completion Services business and adding Well Support Services to the Company's service offering. Upon the closing of the Nabors Merger, Old C&J became a subsidiary of C&J Energy Services Ltd. (the "Predecessor" and shares of common stock of Old C&J were converted into common shares of the Predecessor on a 1-for-1 basis. Due to the severe industry downturn, on July 20, 2016, the Predecessor and certain other subsidiaries of the Company (the "Debtors" or the "Reorganized Debtors") filed voluntary petitions for reorganization seeking relief under the provisions of Chapter 11 with the United States Bankruptcy Court in the Southern District of Texas, Houston Division ("Bankruptcy Court"). These Chapter 11 cases were being administered under the caption "In re: CJ Holding Co., et al., Case No. 16-33590", and the Predecessor commenced ancillary proceedings in Canada on behalf of the Canadian Entities and a provisional liquidation proceeding in Bermuda on behalf of the Bermudian Entities (collectively, the "Chapter 11 Proceeding"). Throughout the Chapter 11 Proceeding, the Debtors continued operations and management of their assets in the ordinary course as debtors-in-possession under the jurisdiction of the Bankruptcy Court in accordance with the applicable provisions of the United States Bankruptcy Code and orders of the Bankruptcy Court.
On January 6, 2017 (the "Plan Effective Date"), the Predecessor substantially consummated the plan of reorganization (the "Restructuring Plan") and emerged from the Chapter 11 cases, as part of the transactions undertaken pursuant to the Restructuring Plan, the Predecessor equity was canceled and the Predecessor transferred all of its assets and operations to the Successor. As a result, the Company became the Successor issuer to the Predecessor. See Note 2 - Chapter 11 Proceeding and Emergence for additional information about the Chapter 11 Proceeding and emergence from the Chapter 11 bankruptcy.
C&J was listed on the New York Stock Exchange ("NYSE") under the symbol "CJES". Contemporaneously with the commencement of the Chapter 11 Proceeding, trading in the Predecessor's common shares on the NYSE was suspended and such shares were ultimately delisted from the NYSE. On July 21, 2016, the Predecessor's common shares began trading on the OTC Markets Group Inc.'s ("OTC") Pink® Open Market under the symbol "CJESQ." On January 12, 2017, trades in the Successor's common stock began trading on the OTC "Grey marketplace" under the symbol "CJJY".
Basis of Presentation and Principles of Consolidation. The consolidated financial statements have been prepared in conformity with accounting principles generally accepted in the United States of America (“U.S. GAAP”) and include all of the accounts of C&J and its consolidated subsidiaries. All significant inter-company transactions and account balances have been eliminated upon consolidation.
The Company’s results for the year ended 2015 include results from the C&P Business from the closing of the Nabors Merger on March 24, 2015 through December 31, 2015. Results for periods prior to March 24, 2015 reflect the financial and operating results of Old C&J, and do not include the financial and operating results of the C&P Business.
Correction of Immaterial Errors. During the fourth quarter of 2015, the Company recorded out-of-period adjustments to correct the overstatement from the over-accrual of direct costs related to periods from 2008 through December 31, 2014, resulting in a $9.8 million increase to net income. In evaluating whether these errors, individually and in the aggregate, and the corrections of the errors had a material impact to the periods such errors and corrections related to, the Company evaluated both the quantitative and qualitative impact to its consolidated financial statements for such periods. In assessing the quantitative impact, the Company considered the errors in each impacted period relative to the amount of reported
71
C&J ENERGY SERVICES LTD. (DEBTOR-IN-POSSESSION) AND SUBSIDIARIES
NOTES TO CONSOLIDATED FINANCIAL STATEMENTS
direct costs, net income or loss, and current and total liabilities. The Company considered a number of qualitative factors, including, among others, that the errors and the correction of the errors (i) did not change a net loss into net income or vice versa, (ii) did not have an impact on the Company's debt covenant compliance and (iii) did not result in a change in the Company's earnings trends when considering the overall competitive and economic environment within which it operated from 2008 through December 31, 2014. Based upon the Company's quantitative and qualitative evaluation, it determined that the errors and the correction of such errors did not have a material impact to prior periods, individually or in the aggregate, and were not material to the year ending December 31, 2015.
Reclassifications. Certain reclassifications have been made to prior period amounts to conform to current period financial statement presentation, including changes in accounting principle from the adoption of Accounting Standards Update ("ASU") No. 2015-03, Interest - Imputation of Interest (Subtopic 835-30): Simplifying the Presentation of Debt Issuance Costs which requires deferred financing costs to be presented on the balance sheet as a direct deduction from the carrying amount of a debt liability, consistent with debt discounts. Because ASU 2015-03 was applied on a retrospective basis, deferred financing costs of $34.0 million related to the Company's Term Loan B facility have been reclassified to long-term debt and capital lease obligations as of December 31, 2015. These reclassifications had no effect on the consolidated financial position, results of operations or cash flows of the Company.
Use of Estimates. The preparation of financial statements in conformity with U.S. GAAP requires management to make estimates and assumptions that affect the reported amounts of assets and liabilities and disclosure of contingent assets and liabilities at the date of the financial statements, and the reported amounts of revenue and expenses during the reporting period. Estimates are used in, but are not limited to, determining the following: allowance for doubtful accounts, valuation of long-lived assets and intangibles, useful lives used in depreciation and amortization, inventory reserves, income taxes and liabilities subject to compromise. The accounting estimates used in the preparation of the consolidated financial statements may change as new events occur, as more experience is acquired, or as additional information is obtained and as the Company’s operating environment changes.
Cash and Cash Equivalents. For purposes of the consolidated statement of cash flows, cash is defined as cash on-hand, demand deposits, and short-term investments with initial maturities of three months or less. The Company maintains its cash and cash equivalents in various financial institutions, which at times may exceed federally insured amounts. Management believes that this risk is not significant. Cash balances related to the Company's captive insurance subsidiaries, which totaled $16.1 million and $18.3 million at December 31, 2016 and December 31, 2015, respectively, are included in cash and cash equivalents in the consolidated balance sheets, and the Company expects to use these cash balances to fund the operations of the captive insurance subsidiaries and to settle future anticipated claims.
Accounts Receivable and Allowance for Doubtful Accounts. Accounts receivable are generally stated at the amount billed to customers. The Company provides an allowance for doubtful accounts, which is based upon a review of outstanding receivables, historical collection information and existing economic conditions. Provisions for doubtful accounts are recorded when it is deemed probable that the customer will not make the required payments at either the contractual due dates or in the future. At December 31, 2016 and 2015, the allowance for doubtful accounts totaled $3.0 million and $7.9 million, respectively. Bad debt expense of $1.7 million, $8.1 million and $0.7 million was included in selling, general, and administrative expenses on the consolidated statements of operations for the years ended December 31, 2016, 2015 and 2014, respectively.
Inventories. Inventories for the Completion Services segment consist of finished goods, including equipment components, chemicals, proppants, supplies and materials for the segment’s operations. Inventories for the Other Services segment consists of raw materials, work-in-process and finished goods, including equipment components, supplies and materials.
Inventories are stated at the lower of cost or market (net realizable value) on a first-in, first-out basis and appropriate consideration is given to deterioration, obsolescence and other factors in evaluating net realizable value. As a result of unfavorable oil and gas industry market conditions that have continued to deteriorate, the Company determined that the market values of certain inventory items were below their cost basis and recorded expense of $35.4 million and $31.1 million to direct costs for the years ended December 31, 2016 and 2015 respectively.
Inventories consisted of the following (in thousands):
72
C&J ENERGY SERVICES LTD. (DEBTOR-IN-POSSESSION) AND SUBSIDIARIES
NOTES TO CONSOLIDATED FINANCIAL STATEMENTS
As of December 31, | ||||||||
2016 | 2015 | |||||||
Raw materials | $ | 16,367 | $ | 34,720 | ||||
Work-in-process | 5,022 | 13,574 | ||||||
Finished goods | 38,091 | 58,657 | ||||||
Total inventory | 59,480 | 106,951 | ||||||
Inventory reserve | (5,009 | ) | (4,694 | ) | ||||
Inventory, net | $ | 54,471 | $ | 102,257 | ||||
Property, Plant and Equipment. Property, plant and equipment (PP&E) are reported at cost less accumulated depreciation. Maintenance and repairs, which do not improve or extend the life of the related assets, are charged to expense when incurred. Refurbishments are capitalized when the value of the equipment is enhanced for an extended period. When property and equipment are sold or otherwise disposed of, the asset account and related accumulated depreciation account are relieved, and any gain or loss is included in operating income.
The cost of property and equipment currently in service is depreciated, on a straight-line basis, over the estimated useful lives of the related assets, which range from three to 25 years. Depreciation expense was $206.7 million, $261.8 million, and $97.2 million for the years ended December 31, 2016, 2015 and 2014, respectively. Major classifications of property, plant and equipment and their respective useful lives were as follows (in thousands):
Estimated Useful Lives | As of December 31, | |||||||||
2016 | 2015 | |||||||||
Land | Indefinite | $ | 46,000 | $ | 44,592 | |||||
Building and leasehold improvements | 5-25 years | 121,915 | 153,320 | |||||||
Office furniture, fixtures and equipment | 3-5 years | 29,435 | 28,709 | |||||||
Machinery and equipment | 3-10 years | 1,219,645 | 1,225,505 | |||||||
Transportation equipment | 5 years | 179,426 | 224,057 | |||||||
1,596,421 | 1,676,183 | |||||||||
Less: accumulated depreciation | (683,189 | ) | (499,894 | ) | ||||||
913,232 | 1,176,289 | |||||||||
Construction in progress | 37,579 | 34,152 | ||||||||
Property, plant and equipment, net | $ | 950,811 | $ | 1,210,441 | ||||||
PP&E are evaluated on a quarterly basis to identify events or changes in circumstances (“triggering events”) that indicate the carrying value of certain PP&E may not be recoverable. PP&E are reviewed for impairment upon the occurrence of a triggering event. An impairment loss is recorded in the period in which it is determined that the carrying amount of PP&E is not recoverable. The determination of recoverability is made based upon the estimated undiscounted future net cash flows of assets grouped at the lowest level for which there are identifiable cash flows independent of the cash flows of other groups of assets with such cash flows to be realized over the estimated remaining useful life of the primary asset within the asset group, excluding interest expense. The Company determined the lowest level of identifiable cash flows that are independent of other asset groups to be at the service line level, which consists of the well services, hydraulic fracturing, coiled tubing, wireline, pumpdown, directional drilling, cementing, artificial lift applications, international coiled tubing, equipment manufacturing and repair services and data acquisition and control instruments provider service lines as well as the research and technology ("R&T") service line. If the estimated undiscounted future net cash flows for a given asset group is less than the carrying amount of the related assets, an impairment loss is determined by comparing the estimated fair value with the carrying value of the related assets. The impairment loss is then allocated across the asset group's major classifications.
73
C&J ENERGY SERVICES LTD. (DEBTOR-IN-POSSESSION) AND SUBSIDIARIES
NOTES TO CONSOLIDATED FINANCIAL STATEMENTS
The Company concluded that the sharp fall in commodity prices during the second half of 2014 constituted a triggering event that resulted in a significant slowdown in activity across the Company’s customer base, which in turn has increased competition and put pressure on pricing for its services throughout 2015 and 2016. Although the severity and extent of this continued downturn is uncertain, absent a significant recovery in commodity prices, activity and pricing levels may continue to decline in future periods. As a result of the triggering event during the fourth quarter of 2014, PP&E recoverability testing was performed throughout 2015 and 2016 on the asset groups in each of the Company’s service lines. For the 2016 year, the recoverability testing for the coiled tubing, directional drilling, cementing, artificial lift applications and international coiled tubing asset groups yielded an estimated undiscounted net cash flow that was less than the carrying amount of the related assets. The estimated fair value for each respective asset group was compared to its carrying value, and impairment expense of $61.1 million was recognized during 2016 and allocated across each respective asset group's major classification. The impairment charge was primarily related to underutilized equipment in the Completion Services and Other Services segments. The fair value of these assets was based on the projected present value of future cash flows that these assets are expected to generate. Should industry conditions not significantly improve or worsen, additional impairment charges may be required in future periods.
On June 29, 2016, the Company sold a majority of the assets comprising their specialty chemicals supply business, including PP&E, for approximately $9.3 million of net cash.
PP&E impairment expense for the years ended December 31, 2016 and 2015 were recognized across each asset group as follows (in thousands):
Years Ended December 31, | ||||||||
2016 | 2015 | |||||||
Hydraulic Fracturing | $ | — | $ | 255,283 | ||||
Coiled Tubing | 36,130 | 94,546 | ||||||
Cementing | 11,814 | — | ||||||
Directional Drilling | 1,933 | 6,625 | ||||||
International Coiled Tubing | 4,663 | 6,931 | ||||||
Equipment Manufacturing and Repair Services | 3,238 | 13,847 | ||||||
Specialty Chemicals | — | 3,070 | ||||||
Artificial lift | 2,784 | — | ||||||
Research and Technology | 518 | 12,777 | ||||||
Total PP&E impairment expense | $ | 61,080 | $ | 393,079 | ||||
Goodwill, Indefinite-Lived Intangible Assets and Definite-Lived Intangible Assets. Goodwill is allocated to the Company’s three reporting units: Completion Services, Well Support Services and Other Services, all of which are consistent with the presentation of the Company’s three reportable segments. At the reporting unit level, the Company tests goodwill for impairment on an annual basis as of October 31 of each year, or when events or changes in circumstances, referred to as triggering events, indicate the carrying value of goodwill may not be recoverable and that a potential impairment exists.
Judgment is used in assessing whether goodwill should be tested for impairment more frequently than annually. Factors such as unexpected adverse economic conditions, competition, market changes and other external events may require more frequent assessments. During the third quarter of 2015, sustained low commodity price levels and the resulting impact on the Company’s results of operations, coupled with the sustained weakness in the Company’s share price were deemed triggering events that led to an interim period test for goodwill impairment. During the first quarter of 2016, commodity price levels remained depressed which materially and negatively impacted the Company's results of operations, and the further declines in the Company's share price led to another interim period test for goodwill impairment. See Note 6 - Goodwill and Other Intangible Assets for further discussion on impairment testing results.
Before employing detailed impairment testing methodologies, the Company may first evaluate the likelihood of impairment by considering qualitative factors relevant to each reporting unit, such as macroeconomic, industry, market or any other factors that have a significant bearing on fair value. If the Company first utilizes a qualitative approach and determines that it is more likely than not that goodwill is impaired, detailed testing methodologies are then applied. Otherwise, the Company concludes that no impairment has occurred. Detailed impairment testing, or Step 1 testing, involves comparing the fair value of each reporting unit to its carrying value, including goodwill. Fair value reflects the price a market participant would be willing to pay in a potential sale of the reporting unit. If the fair value exceeds carrying value, then it is concluded
74
C&J ENERGY SERVICES LTD. (DEBTOR-IN-POSSESSION) AND SUBSIDIARIES
NOTES TO CONSOLIDATED FINANCIAL STATEMENTS
that no goodwill impairment has occurred. If the carrying value of the reporting unit exceeds its fair value, a second step is required to measure possible goodwill impairment loss. The second step, or Step 2 testing, includes hypothetically valuing the tangible and intangible assets and liabilities of the reporting unit as if the reporting unit had been acquired in a business combination. Then, the implied fair value of the reporting unit’s goodwill is compared to the carrying value of that goodwill. If the carrying value of the reporting unit’s goodwill exceeds the implied fair value of the goodwill, an impairment loss is recognized in an amount equal to the excess, not to exceed the carrying value.
The Company’s Step 1 impairment analysis involves the use of a blended income and market approach. Significant management judgment is necessary to evaluate the impact of operating and macroeconomic changes on each reporting unit. Critical assumptions include projected revenue growth, fleet count, utilization, gross profit rates, sales, general and administrative ("SG&A") rates, working capital fluctuations, capital expenditures, discount rates, terminal growth rates, and price-to-earnings multiples. The Company’s market capitalization is also used to corroborate reporting unit valuations.
Similar to goodwill, indefinite-lived intangible assets are subject to annual impairment tests or more frequently if events or circumstances indicate the carrying amount may not be recoverable.
Definite-lived intangible assets are amortized over their estimated useful lives. Along with PP&E, these intangibles are reviewed for impairment when a triggering event indicates that the asset may have a net book value in excess of recoverable value. In these cases, the Company performs a recoverability test on its PP&E and definite-lived intangible assets by comparing the estimated future net undiscounted cash flows expected to be generated from the use of these assets to the carrying amount of the assets for recoverability. If the estimated undiscounted cash flows exceed the carrying amount of the assets, an impairment does not exist and a loss will not be recognized. If the undiscounted cash flows are less than the carrying amount of the assets, the assets are not recoverable and the amount of impairment must be determined by fair valuing the assets.
For further discussion of the application of this accounting policy regarding impairments, please see Note 6 - Goodwill and Other Intangible Assets.
Deferred Financing Costs. Costs incurred to obtain term debt financing are presented on the balance sheet as a direct deduction from the carrying amount of the term debt, consistent with debt discounts, and accreted over the term of the loan using the effective interest method. Costs incurred to obtain revolver based financing are capitalized and amortized over the term of the loan using the effective interest method. These costs are classified within interest expense on the consolidated statements of operations and were $48.3 million, $10.9 million and $1.2 million for the years ended December 31, 2016, 2015 and 2014, respectively. Accumulated amortization of deferred financing costs was $58.8 million and $10.5 million at December 31, 2016 and 2015, respectively. As of December 31, 2016, and prior to emergence from the Chapter 11 Proceeding, deferred financing costs were fully amortized to zero.
Revenue Recognition. All revenue is recognized when persuasive evidence of an arrangement exists, the service is complete or the equipment has been delivered to the customer, the amount is fixed or determinable and collectibility is reasonably assured, as follows:
Completion Services Segment
Hydraulic Fracturing Revenue. Through its hydraulic fracturing service line, the Company provides hydraulic fracturing services on a spot market basis or pursuant to contractual arrangements, such as term contracts and pricing agreements. Under either scenario, revenue is recognized and customers are invoiced upon the completion of each job, which can consist of one or more fracturing stages. Once a job has been completed to the customer’s satisfaction, a field ticket is written that includes charges for the service performed and the consumables (such as fluids and proppants) used during the course of service. The field ticket may also include charges for the mobilization and set-up of equipment, the personnel on the job, any additional equipment used on the job, and other miscellaneous consumables.
Rates for services performed on a spot market basis are based on an agreed-upon hourly spot market rate for a specified number of hours of service.
Pursuant to pricing agreements and other contractual arrangements which the Company may enter into from time to time, such as those associated with an award from a bid process, customers typically commit to targeted utilization levels based on a specified number of hours of service at agreed-upon pricing, but without termination penalties or obligations to pay for services not used by the customer. In addition, the agreed-upon pricing is typically subject to periodic review, as specifically defined in the agreement, and may be adjusted upon the agreement of both parties.
75
C&J ENERGY SERVICES LTD. (DEBTOR-IN-POSSESSION) AND SUBSIDIARIES
NOTES TO CONSOLIDATED FINANCIAL STATEMENTS
Casedhole Solutions Revenue. Through its Casedhole Solutions service line, the Company provides cased-hole wireline, pumpdown services, wireline logging, perforating, pressure pumping, well site make-up and pressure testing and other complementary services, on a spot market basis. Jobs for these services are typically short-term in nature, lasting anywhere from a few hours to multiple days. The Company typically charges the customer for these services on a per job basis at agreed-upon spot market rates. Revenue is recognized based on a field ticket issued upon the completion of the job.
Revenue from Materials Consumed While Performing Certain Completion Services. The Company generates revenue from consumables used during the course of providing services.
With respect to hydraulic fracturing services, the Company generates revenue from the fluids, proppants and other materials that are consumed while performing a job. For services performed on a spot market basis, the required consumables are typically provided by the Company and the customer is billed for those consumables at cost plus an agreed-upon markup. For services performed on a contractual basis, when the consumables are provided by the Company, the customer typically is billed for those consumables at a negotiated contractual rate. When consumables are supplied by the customer, the Company typically charges handling fees based on the amount of consumables used.
Other Completion Services. The Company generates revenue from certain smaller well construction service lines, specifically cementing and directional drilling services, and R&T which is primarily engaged in the engineering and production of certain parts and components, such as perforating guns and addressable switches, which are used in the completion process.
With respect to its directional drilling services, the Company provides these services on a spot market basis. Jobs for these services are typically short-term in nature, lasting anywhere from a few days to multiple weeks. The Company typically charges the customer for these services on a per day basis at agreed-upon spot market rates depending on the level of services required and the complexity of the job. Revenue is recognized and customers are invoiced upon the completion of each job. Once a job has been completed to the customer’s satisfaction, a field ticket is written that includes charges for the service performed.
With respect to its cementing services, the Company provides these services on a spot market or project basis. Jobs for these services are typically short-term in nature and are generally completed in a few hours. The Company typically charges the customer for these services on a per job basis at agreed-upon spot market rates or agreed-upon job pricing for a particular project. Revenue is recognized and customers are invoiced upon the completion of each job. Once a job has been completed to the customer’s satisfaction, a field ticket is written that includes charges for the service performed and the consumables (such as blended bulk cement and chemical additives) used during the course of service.
Well Support Services Segment
Rig Services Revenue. Through its rig service line, the Company provides workover and well servicing rigs that are primarily used for routine repair and maintenance of oil and gas wells, re-drilling operations and plugging and abandonment operations. These services are provided on an hourly basis at prices that approximate spot market rates. Revenue is recognized and a field ticket is generated upon the earliest of the completion of a job or at the end of each day. A rig services job can last anywhere from a few hours to multiple days depending on the type of work being performed. The field ticket includes the base hourly rate charge and, if applicable, charges for additional personnel or equipment not contemplated in the base hourly rate.
Fluids Management Services Revenue. Through its fluids management service line, the Company primarily provides storage, transportation and disposal services for fluids used in the drilling, completion and workover of oil and gas wells. Rates for these services vary and can be on a per job, per hour or per load basis, or on the basis of quantities sold or disposed. Revenue is recognized upon the completion of each job or load, or delivered product, based on a completed field ticket.
Coiled Tubing Services Revenue. Through its coiled tubing service line, the Company provides a range of coiled tubing services primarily used for frac plug drill-out during completion operations and for well workover and maintenance, primarily on a spot market basis. Jobs for these services are typically short-term in nature, lasting anywhere from a few hours to multiple days. Revenue is recognized upon completion of each day’s work based upon a completed field ticket. The field ticket includes charges for the services performed and the consumables (such as stimulation fluids, nitrogen and coiled tubing materials) used during the course of service. The field ticket may also include charges for the mobilization and set-up of equipment, the personnel on the job, any additional equipment used on the job, and other miscellaneous consumables. The Company typically charges the customer for the services performed and resources provided on an hourly basis at agreed-upon spot market rates.
76
C&J ENERGY SERVICES LTD. (DEBTOR-IN-POSSESSION) AND SUBSIDIARIES
NOTES TO CONSOLIDATED FINANCIAL STATEMENTS
In addition, ancillary to coiled tubing services revenue, the Company generates revenue from stimulation fluids, nitrogen, coiled tubing materials and other consumables used during those processes.
Other Special Well Site Services Revenue. Through its other special well site service line, the Company primarily provides fishing, contract labor, and tool rental services for completion and workover of oil and gas wells. Rates for these services vary and can be on a per job, per hour or on the basis of rental days per month. Revenue is recognized based on a field ticket issued upon the completion of each job or on a monthly billing for rental services provided.
With respect to its artificial lift applications, the Company generates revenue primarily from the sale of manufactured equipment and products. Revenue is recognized upon the completion, delivery and customer acceptance of each order.
Other Services Segment
Revenue within the Other Services Segment is generated from certain of the Company's smaller, non-core service lines that have either been divested or are in the process of being divested, such as, equipment manufacturing and repair operations and the Company's international coiled tubing operations in the Middle East.
Share-Based Compensation. The Company’s share-based compensation plans provide the ability to grant equity awards to the Company’s employees, consultants and non-employee directors. As of December 31, 2016, only nonqualified stock options and restricted shares had been granted under such plans. The Company values option grants based on the grant date fair value by using the Black-Scholes option-pricing model and values restricted stock grants based on the closing price of C&J’s common shares on the grant date. The Company recognizes share-based compensation expense on a straight-line basis over the requisite service period for the entire award. Further information regarding the Company’s share-based compensation arrangements and the related accounting treatment can be found in Note 8 – Share-Based Compensation.
Fair Value of Financial Instruments. The Company’s financial instruments consist of cash and cash equivalents, accounts receivable, accounts payable, the DIP Facility (as defined in Note 5 - Debt and Capital Lease Obligations). The recorded values of cash and cash equivalents, accounts receivable, accounts payable and the DIP Facility approximate their fair values given the short-term nature of these instruments.
Equity Method Investments. The Company has investments in joint ventures which are accounted for under the equity method of accounting as the Company has the ability to exercise significant influence over operating and financial policies of the joint venture. Judgment regarding the level of influence over each equity method investment includes considering key factors such as ownership interest, representation on the board of directors, participation in policy-making decisions and material intercompany transactions. Under the equity method, original investments are recorded at cost and adjusted by the Company’s share of undistributed earnings and losses of these investments. The Company eliminates all significant intercompany transactions, including the intercompany portion of transactions with equity method investees, from the consolidated financial results.
The carrying value of the Company's equity method investments at December 31, 2016 and December 31, 2015 was $9.0 million and $14.3 million, respectively, and is included in other noncurrent assets on the consolidated balance sheets. The Company’s share of the net income (loss) from the unconsolidated affiliates was approximately ($5.7) million for the year ended December 31, 2016 and approximately $0.5 million for each of the years ended December 31, 2015 and 2014, and is included in other expense, net, on the consolidated statements of operations.
Income Taxes. We are subject to income and other similar taxes in all areas in which we operate. When recording income tax expense, certain estimates are required because: (a) income tax returns are generally filed months after the close of our annual accounting period; (b) tax returns are subject to audit by taxing authorities and audits can often take years to complete and settle; and (c) future events often impact the timing of when we recognize income tax expenses and benefits.
The Company accounts for income taxes utilizing the asset and liability method. Under this method, deferred tax assets and liabilities are recognized for the future tax consequences attributable to differences between the financial statement carrying amounts of existing assets and liabilities and their respective tax bases. Deferred tax assets and liabilities are measured using enacted tax rates expected to apply to taxable income in the years in which those temporary differences are expected to be recovered or settled. The effect on deferred tax assets and liabilities of a change in tax rates is recognized as income or expense in the period that includes the enactment date.
77
C&J ENERGY SERVICES LTD. (DEBTOR-IN-POSSESSION) AND SUBSIDIARIES
NOTES TO CONSOLIDATED FINANCIAL STATEMENTS
The ultimate realization of deferred tax assets is dependent upon the generation of future taxable income during the periods in which those temporary differences become deductible. In assessing the likelihood and extent that deferred tax assets will be realized, consideration is given to projected future taxable income and tax planning strategies. A valuation allowance is recorded when, in the opinion of management, it is more likely than not that some portion or all of the deferred tax assets will not be realized.
The Company has federal, state and international net operating loss carryforwards that will expire in the years 2021 through 2036. After considering the scheduled reversal of deferred tax liabilities, projected future taxable income, the potential limitation on use of NOLs under Section 382 and tax planning strategies and tax planning strategies, the Company established a valuation allowance due to the uncertainty regarding the ultimate realization of the deferred tax assets associated with its carryforwards.
On the Plan Effective Date, the Company believes it experienced an ownership change for purposes of Internal Revenue Code Section 382 as result of its Restructuring Plan and that its pre-change NOLs are subject to an annual limitation. The ownership change and resulting annual limitation on use of NOLs are not expected to result in the expiration of the Company's NOL carryforwards if it is able to generate sufficient future taxable income within the carryforward periods. However, the limitation on the amount of NOL available to offset taxable income in a specific year may result in the payment of income taxes before all NOLs have been utilized. Additionally, a subsequent ownership change may result in further limitation on the ability to utilize existing NOLs and other tax attributes.
The Company recognizes the financial statement effects of a tax position when it is more-likely-than-not, based on the technical merits, that the position will be sustained upon examination. A tax position that meets the more-likely-than-not recognition threshold is measured as the largest amount of tax benefit that is greater than 50.0% likely of being realized upon ultimate settlement with a taxing authority. Previously recognized tax positions are reversed in the first period in which it is no longer more-likely-than-not that the tax position would be sustained upon examination. Income tax related interest and penalties, if applicable, are recorded as a component of the provision for income tax expense. The Company recorded income tax expense for unrecognized tax benefits equal to $6.5 million and zero for the periods ending December 31, 2016 and December 31, 2015 respectively.
Earnings Per Share. Basic earnings per share is based on the weighted average number of common shares (“common shares”) outstanding during the applicable period and excludes shares subject to outstanding stock options and shares of restricted stock. Diluted earnings per share is computed based on the weighted average number of common shares outstanding during the period plus, when their effect is dilutive, incremental shares consisting of shares subject to outstanding stock options and restricted stock.
The following is a reconciliation of the components of the basic and diluted earnings per share calculations for the applicable periods:
Years Ended December 31, | ||||||||||||
2016 | 2015 | 2014 | ||||||||||
(In thousands, except per share amounts) | ||||||||||||
Numerator: | ||||||||||||
Net income (loss) attributed to common shareholders | $ | (944,289 | ) | $ | (872,542 | ) | $ | 68,823 | ||||
Denominator: | ||||||||||||
Weighted average common shares outstanding - basic | 118,305 | 102,853 | 53,838 | |||||||||
Effect of potentially dilutive securities: | ||||||||||||
Stock options | — | — | 2,245 | |||||||||
Restricted stock | — | — | 430 | |||||||||
Weighted average common shares outstanding - diluted | 118,305 | 102,853 | 56,513 | |||||||||
Net income (loss) per common share: | ||||||||||||
Basic | $ | (7.98 | ) | $ | (8.48 | ) | $ | 1.28 | ||||
Diluted | $ | (7.98 | ) | $ | (8.48 | ) | $ | 1.22 | ||||
A summary of securities excluded from the computation of basic and diluted earnings per share is presented below for the applicable periods:
78
C&J ENERGY SERVICES LTD. (DEBTOR-IN-POSSESSION) AND SUBSIDIARIES
NOTES TO CONSOLIDATED FINANCIAL STATEMENTS
Years Ended December 31, | |||||||||
2016 | 2015 | 2014 | |||||||
(In thousands) | |||||||||
Basic earnings per share: | |||||||||
Unvested restricted stock | 1,529 | 2,610 | 1,448 | ||||||
Diluted earnings per share: | |||||||||
Anti-dilutive stock options | 4,808 | 3,661 | 201 | ||||||
Anti-dilutive restricted stock | 1,490 | 2,125 | 3 | ||||||
Potentially dilutive securities excluded as anti-dilutive | 6,298 | 5,786 | 204 | ||||||
On January 6, 2017, the Debtors substantially consummated the Restructuring Plan and emerged from the Chapter 11 Proceeding. As part of the transactions undertaken pursuant to the Restructuring Plan, all of the existing shares of the Predecessor common equity that were used in the above earnings per share calculations were canceled as of the Plan Effective Date.
Recent Accounting Pronouncements.
In May 2014, the Financial Accounting Standards Board ("FASB") issued a comprehensive new revenue recognition standard, Accounting Standards Update ("ASU") No. 2014-09, Revenue from Contracts with Customers ("ASU 2014-09") that will supersede existing revenue recognition guidance under U.S. GAAP. In August 2015, the FASB issued an accounting standards update for a one-year deferral of the revenue recognition standard's effective date for all entities, which changed the effectiveness to annual reporting periods beginning after December 15, 2017, including interim periods within that reporting period. The core principle of the new guidance is that a company should recognize revenue to depict the transfer of promised goods or services to customers in an amount that reflects the consideration to which the company expects to be entitled in exchange for those goods or services. The standard creates a five step model that requires companies to exercise judgment when considering the terms of a contract and all relevant facts and circumstances. The standard allows for several transition methods: (a) a full retrospective adoption in which the standard is applied to all of the periods presented, or (b) a modified retrospective adoption in which the standard is applied only to the most current period presented in the financial statements, including additional disclosures of the standard’s application impact to individual financial statement line items. The Company is currently evaluating the impact, if any, of adopting this new accounting standard on its results of operations and financial position.
In July 2015, the FASB issued ASU No. 2015-11, Simplifying the Measurement of Inventory ("ASU 2015-11"), which changes the measurement principle for inventory from the lower of cost or market to lower of cost and net realizable value. ASU 2015-11 is part of the FASB’s simplification initiative and applies to entities that measure inventory using a method other than last-in, first-out ("LIFO") or the retail inventory method. The guidance will require prospective application at the beginning of the Company's first quarter of fiscal 2018, but permits adoption in an earlier period. The Company does not expect this ASU to have a material impact on its consolidated financial statements.
In November 2015, the FASB issued ASU No. 2015-17, Income Taxes (Topic 740): Balance Sheet Classification of Deferred Taxes ("ASU 2015-17”). ASU 2015-17 amends existing guidance on income taxes to require the classification of all deferred tax assets and liabilities as non-current on the balance sheet. The Company is required to adopt this ASU for years beginning after December 15, 2016, with early adoption permitted, and the guidance may be applied either prospectively or retrospectively. The Company does not expect this ASU to have a material impact on its consolidated financial statements.
In February 2016, the FASB issued ASU No. 2016-02, Leases (Topic 842) ("ASU 2016-02"). ASU No. 2016-02 seeks to increase transparency and comparability among organizations by recognizing lease assets and lease liabilities on the balance sheet and by disclosing key information about leasing arrangements. Unlike current U.S. GAAP, which requires only capital leases to be recognized on the balance sheet, ASU No. 2016-02 will require both operating and finance leases to be recognized on the balance sheet. Additionally, the new guidance will require disclosures to help investors and other financial statement users better understand the amount, timing, and uncertainty of cash flows arising from leases, including qualitative and quantitative requirements. The amendments in ASU No. 2016-02 are effective for fiscal years beginning after December 15, 2018, including interim periods within those fiscal years, and early application is permitted. The Company is currently evaluating the impact of adopting this new accounting standard on its results of operations and financial position.
In March 2016, the FASB issued ASU No. 2016-09, Compensation—Stock Compensation (Topic 718): Improvements to Employee Share-Based Payment Accounting ("ASU 2016-09"), to simplify certain provisions in stock
79
C&J ENERGY SERVICES LTD. (DEBTOR-IN-POSSESSION) AND SUBSIDIARIES
NOTES TO CONSOLIDATED FINANCIAL STATEMENTS
compensation accounting, including the simplification of accounting for a stock payment's tax consequences. The ASU amends the guidance for classifying awards as either equity or liabilities, allows companies to estimate the number of stock awards they expect to vest, and revises the tax withholding requirements for stock awards. The amendments in ASU No. 2016-09 are effective for public companies for fiscal years beginning after December 15, 2016, including interim periods within those fiscal years, and early application is permitted. The Company is currently evaluating the impact of adopting this new accounting standard on its results of operations and financial position.
June 2016, the FASB issued ASU No. 2016-13, Financial Instruments-Credit Losses (Topic 326): Measurement of Credit Losses on Financial Instruments (“ASU 2016-13”), which amends U.S. GAAP by introducing a new impairment model for financial instruments that is based on expected credit losses rather than incurred credit losses. The new impairment model applies to most financial assets, including trade accounts receivable. The amendments in ASU 2016-13 are effective for interim and annual reporting periods beginning after December 15, 2019, although it may be adopted one year earlier, and requires a modified retrospective transition approach. The Company is currently evaluating the impact this standard will have on its results of operations and financial position.
In October 2016, the FASB issued ASU No. 2016-16, Income Taxes (Topic 740): Intra-Entity Transfers of Assets Other Than Inventory ("ASU 2016-16"), which requires an entity to recognize the income tax consequences of an intra-entity asset transfer, other than an intra-entity asset transfer of inventory, when the transfer occurs. The ASU is effective for the interim and annual reporting periods beginning after December 15, 2017, including interim periods within those fiscal years, and early application is permitted. The Company is currently evaluating the impact of adopting this new accounting standard on its results of operations and financial position.
Note 2 - Chapter 11 Proceeding and Emergence
Overview
On July 8, 2016, C&J and certain of its direct and indirect subsidiaries, including C&J Corporate Services (Bermuda) Ltd. (together with C&J, collectively the “Bermudian Entities”), C&J Energy Production Services-Canada Ltd. and Mobile Data Technologies Ltd. (together, the “Canadian Entities”), entered into a Restructuring Support and Lock-Up Agreement (the “Restructuring Support Agreement”), with certain lenders (the “Supporting Lenders”) holding approximately 90.0% of the secured claims and interests arising under the Credit Agreement, dated as of March 24, 2015 (as amended and otherwise modified, the “Credit Agreement”). The Restructuring Support Agreement contemplated the implementation of a restructuring of the Company, including eliminating all amounts owed under the Company’s Credit Agreement, through a debt-to-equity conversion and equity rights offering, which transaction was effectuated through the Restructuring Plan under Chapter 11 of Title 11 (“Chapter 11”) of the United States Bankruptcy Code (the “Bankruptcy Code”), which was subject to the approval of the Bankruptcy Court.
To implement the restructuring, on July 20, 2016 (the "Petition Date"), the Debtors filed voluntary petitions for reorganization (the "Bankruptcy Petitions") seeking relief under the provisions of Chapter 11 with the Bankruptcy Court. These Chapter 11 cases were being administered under the caption "In re: CJ Holding Co., et al., Case No. 16-33590", and the Company commenced ancillary proceedings in Canada on behalf of the Canadian Entities and a provisional liquidation proceeding in Bermuda on behalf of the Bermudian Entities. Throughout the Chapter 11 Proceeding, the Debtors continued operations and management of their assets in the ordinary course as debtors-in-possession under the jurisdiction of the Bankruptcy Court in accordance with the applicable provisions of the Bankruptcy Code and orders of the Bankruptcy Court.
The Restructuring Support Agreement contained certain Restructuring Plan-related milestones, including deadlines: (a) to file the Restructuring Plan and related disclosure statement; (b) for entry of interim and final DIP orders; (c) for entry of the Disclosure Statement order; (d) for entry of the Confirmation Order; and (e) for the Plan Effective Date to occur. In accordance with the Restructuring Support Agreement, the Debtors filed the Restructuring Plan with the Bankruptcy Court on August 19, 2016, with a first amendment to the Restructuring Plan filed on September 28, 2016 and a second amendment filed on November 3, 2016. On November 4, 2016, the Bankruptcy Court approved the Disclosure Statement, finding that the Disclosure Statement contained adequate information as required by the Bankruptcy Code. The Debtors then launched a solicitation of acceptances of the Restructuring Plan, as required by the Bankruptcy Code. On December 16, 2016, the Confirmation Order confirming the Restructuring Plan was entered by the Bankruptcy Court. On January 6, 2017, the Debtors substantially consummated the Restructuring Plan and emerged from their Chapter 11 cases. As part of the transactions undertaken pursuant to the Restructuring Plan, C&J’s equity was canceled, and all of C&J's assets and operations were transferred to the Successor, C&J Energy Services, Inc. As a result, the Successor became the successor issuer to the Predecessor.
80
C&J ENERGY SERVICES LTD. (DEBTOR-IN-POSSESSION) AND SUBSIDIARIES
NOTES TO CONSOLIDATED FINANCIAL STATEMENTS
The key terms of the restructuring included in the Restructuring Plan were as follows:
• | Debt-to-equity Conversion: The Supporting Lenders were issued new common equity in the reorganized Company ("New Equity"), and all of the existing shares of the Predecessor common equity were canceled as of the Plan Effective Date. |
• | The Rights Offering: Certain of the Supporting Lenders (the "Backstop Parties") agreed to provide an equity rights offering for an investment in the Successor in an amount of up to $200 million as part of the approved Restructuring Plan (the “Rights Offering”). The Rights Offering was consummated on the Plan Effective Date pursuant to a Backstop Commitment Agreement, which also provided for a commitment premium of 5.0% of the $200 million committed amount payable in New Equity to the Backstop Parties (the “Backstop Fee”). The Rights Offering shares were issued at a price that reflects a discount of 20.0% to the Restructuring Plan value, which was $750 million. |
• | DIP Facility: Certain of the Supporting Lenders (the “DIP Lenders”) provided a superpriority secured delayed draw term loan facility to the Predecessor in an aggregate principal amount of up to $100 million (the “DIP Facility”). As further discussed below, on July 25, 2016, the Bankruptcy Court entered an order approving the Debtors’ entry into the DIP Facility on an interim basis, pending a final hearing. On July 29, 2016, the Debtors entered into a superpriority secured debtor-in-possession credit agreement, among the Debtors, the DIP Lenders and Cortland Capital Market Services LLC, as Administrative Agent (the “DIP Credit Agreement”), which set forth the terms and conditions of the DIP Facility. On September 25, 2016, the Bankruptcy Court entered a final order approving entry into the DIP Facility and DIP Credit Agreement. The Company repaid all amounts outstanding under the DIP Facility on the Plan Effective Date using proceeds from the Rights Offering. |
• | The New Credit Facility: The Company and certain of its subsidiaries, as borrowers (the “Borrowers”), entered into a revolving credit and security agreement (the “New Credit Facility”) dated the Plan Effective Date, with PNC Bank, National Association, as administrative agent (the “Lender”). The New Credit Facility allows the Borrowers to incur revolving loans in an aggregate amount up to the lesser of $100 million and a borrowing base, which borrowing base is based upon the value of the Borrowers’ accounts receivable and inventory. The New Credit Facility also contains an availability block, which will reduce the amount otherwise available to be borrowed under the New Credit Facility by $20 million until the later of the delivery of financial statements for the fiscal year ending December 31, 2017 and the date on which the Company achieves a fixed charge coverage ratio of 1.10:1.0. The New Credit Facility also provides for the issuance of letters of credit, which would reduce borrowing capacity thereunder. The maturity date of the New Credit Facility is January 6, 2021. |
• | The New Warrants: On the Plan Effective Date, the Company issued new seven-year warrants exercisable on a net-share settled basis into up to 6.0% of the New Equity at a strike price of $27.95 per warrant (the “New Warrants”). New Warrants representing up to 2.0% of the New Equity were issued to existing holders of Predecessor common equity as a result of such holders voting as a class to accept the Restructuring Plan, and the remaining New Warrants representing up to 4.0% of the New Equity were issued to the Debtors' general unsecured creditors. |
• | Distributions: The DIP Lenders received payment in full in cash on the Plan Effective Date from cash on hand and proceeds from the Rights Offering. The Supporting Lenders received all of the New Equity, subject to dilution on account of the Management Incentive Plan (as defined below), the Rights Offering, the Backstop Fee and the New Warrants, along with all of the subscription rights under the Rights Offering. Under the Restructuring Plan, mineral contractor claimants will be paid in full in the ordinary course of business. Additionally, subject to the terms of the Restructuring Plan, certain other unsecured claimants will share in a $33.0 million cash recovery pool, plus a portion of the New Warrants, as described above. |
• | Management Incentive Plan: 10.0% of the New Equity was reserved for a management incentive program to be issued to management of the reorganized Company after the Plan Effective Date at the discretion of the board of the reorganized Company (the “Management Incentive Plan”). |
• | Governance: The board of the reorganized Company was appointed by the Supporting Lenders and includes the reorganized Company’s Chief Executive Officer. |
81
C&J ENERGY SERVICES LTD. (DEBTOR-IN-POSSESSION) AND SUBSIDIARIES
NOTES TO CONSOLIDATED FINANCIAL STATEMENTS
Reorganization Process
On and after the Petition Date, the Bankruptcy Court issued certain additional interim and final orders with respect to the Company's’ first-day motions and other operating motions that allowed the Company to operate the business in the ordinary course. The first-day motions provided for, among other things, the payment of certain pre-petition employee expenses and benefits, the use of the Company’s existing cash management system, the payment of certain pre-petition amounts to certain critical vendors and mineral lien claimants, the ability to pay certain pre-petition taxes and regulatory fees, and the payment of certain pre-petition claims owed on account of insurance policies and programs.
Subject to certain exceptions under the Bankruptcy Code, the filing of the Bankruptcy Petitions automatically stayed the continuation of any judicial or administrative proceedings or other actions against the Debtors or their property to recover, collect or secure a claim arising prior to the filing of the Bankruptcy Petitions. Most creditor actions to obtain possession of property from the Debtors, or to create, perfect or enforce any lien against the Debtors’ property, or to collect on monies owed or otherwise exercise rights or remedies with respect to a pre-petition claim were stayed.
Under Section 365 and other relevant sections of the Bankruptcy Code, the Debtors may assume, assume and assign, or reject certain executory contracts and unexpired leases, including leases of real property and equipment, subject to the approval of the Bankruptcy Court and certain other conditions, including Supporting Lender approval in accordance with the Restructuring Support Agreement.
Under Chapter 11, the Restructuring Plan determined the rights and satisfaction of claims and interests of various creditors and security holders and was subject to negotiation amongst the Debtors’ creditors, including the Supporting Lenders and other interested parties, and required Bankruptcy Court approval via the Confirmation Order. The Restructuring Plan, among other things, provides mechanisms for treatment of the Debtors’ pre-petition obligations, treatment of the Predecessor’s existing equity holders, potential income tax liabilities and certain corporate governance and administrative matters pertaining to the Successor.
Under the priority scheme established by the Bankruptcy Code, unless creditors agree otherwise, pre-petition liabilities and post-petition liabilities must be satisfied in full before shareholders are entitled to receive any distribution or retain any property under a Chapter 11 plan. The ultimate recovery to creditors and shareholders was determined upon confirmation of the Restructuring Plan.
The Company filed schedules and statements with the Bankruptcy Court setting forth, among other things, the assets and liabilities of each of the Debtors. These schedules and statements were subject to further amendment or modification after filing. Certain holders of pre-petition claims that are not governmental units were required to file proofs of claim by the deadline for general claims, (the “bar date”), which was set by the Bankruptcy Court as November 8, 2016. Differences between amounts scheduled by the Debtors and claims by creditors will be investigated and will be reconciled and resolved to within an immaterial amount in connection with the claims resolution process. In light of the expected number of creditors, the claims resolution process may take considerable time to complete and is continuing after the Debtors emergence from bankruptcy. Accordingly, the ultimate number and amount of allowed claims is not presently known, nor can the ultimate recovery with respect to allowed claims be presently asserted. As of December 31, 2016, the Company estimated that approximately $960 million of filed claims had not yet been resolved.
Liabilities Subject to Compromise
As of December 31, 2016, the Company has segregated liabilities and obligations whose treatment and satisfaction were dependent on the outcome of its reorganization under the Chapter 11 Proceeding and has classified these items as liabilities subject to compromise. Generally, all actions to enforce or otherwise effect repayment of pre-petition liabilities of the Debtors, as well as all pending litigation against the Debtors, were stayed while the Company is subject to the Chapter 11 Proceeding. The ultimate amount and treatment for these types of liabilities will be subject to the claims resolution processes in the Chapter 11 Proceeding and the terms of the Restructuring Plan confirmed by the Bankruptcy Court in the Chapter 11 Proceeding. Liabilities subject to compromise includes only those liabilities that are obligations of the Debtors and excludes the obligations of the Company's non-debtor subsidiaries. As noted above, those liabilities subject to compromise may vary significantly from the stated amounts of claims filed with the Bankruptcy Court.
Principal and accrued interest owed to the Supporting Lenders as of the Petition Date were settled via the issuance of New Equity under the Restructuring Plan. Interest expense incurred subsequent to the Petition Date was not accrued since it was not treated as an allowed claim under the Restructuring Plan. For the year ended December 31, 2016, the Company did not accrue interest totaling $60.5 million under the Credit Agreement subsequent to the Petition Date.
82
C&J ENERGY SERVICES LTD. (DEBTOR-IN-POSSESSION) AND SUBSIDIARIES
NOTES TO CONSOLIDATED FINANCIAL STATEMENTS
As of December 31, 2016, the Company classified the entire principal balance of the Revolving Credit Facility, the Five-Year Term Loans and the Seven-Year Term Loans (see Note 5 - Debt and Capital Lease Obligations for defined terms), as well as interest that was accrued but unpaid as of the Petition Date, as liabilities subject to compromise in accordance with ASC 852 - Reorganizations. The components of liabilities subject to compromise are as follows (in thousands):
December 31, 2016 | |||||
Revolving Credit Facility | $ | 284,400 | |||
Five-Year Term Loans | 569,250 | ||||
Seven-Year Term Loans | 480,150 | ||||
Total debt subject to compromise | 1,333,800 | ||||
Accrued interest on debt subject to compromise | 37,516 | ||||
Accounts payable and other estimated allowed claims | 60,780 | ||||
Related party payables | 13,250 | ||||
Total liabilities subject to compromise | $ | 1,445,346 | |||
Reorganization Items
The Company classifies all income, expenses, gains or losses that were incurred or realized as a result of the Chapter 11 Proceeding as reorganization items in its consolidated statements of operations. In addition, the Company reports professional fees and related costs associated with and incurred during the Chapter 11 Proceeding as reorganization items. The components of reorganization items are as follows (in thousands):
Year Ended December 31, 2016 | ||||
Professional fees | $ | 41,240 | ||
Contract termination settlements | 20,383 | |||
Revision of estimated claims | 782 | |||
Related party settlement | (5,226 | ) | ||
Vendor claims adjustment | (1,849 | ) | ||
Total reorganization items | $ | 55,330 | ||
In accordance with the requirements of ASC 852 - Reorganizations, the following are condensed combined financial statements of the Debtor entities:
83
C&J ENERGY SERVICES LTD. (DEBTOR-IN-POSSESSION) AND SUBSIDIARIES
NOTES TO CONSOLIDATED FINANCIAL STATEMENTS
C&J ENERGY SERVICES LTD. AND CERTAIN SUBSIDIARIES (DEBTOR-IN-POSSESSION) (1)
CONDENSED COMBINED BALANCE SHEET
(In thousands)
(Unaudited)
December 31, 2016 | |||||
ASSETS | |||||
Current assets: | |||||
Cash and cash equivalents | $ | 47,780 | |||
Accounts receivable, net of allowance of $2,951 | 136,608 | ||||
Inventories, net | 52,413 | ||||
Prepaid and other current assets | 36,801 | ||||
Deferred tax assets | 5,817 | ||||
Total current assets | 279,419 | ||||
Property, plant and equipment, net of accumulated depreciation of $681,788 | 950,207 | ||||
Intangible assets, net | 59,934 | ||||
Investments in non-debtor subsidiaries | 7,489 | ||||
Intercompany receivables from non-debtor subsidiaries | 42,909 | ||||
Other noncurrent assets | 33,397 | ||||
Total assets | $ | 1,373,355 | |||
LIABILITIES AND SHAREHOLDERS' DEFICIT | |||||
Current liabilities: | |||||
Accounts payable | $ | 74,993 | |||
Accrued expenses and other | 76,624 | ||||
DIP Facility | 25,000 | ||||
Total current liabilities | 176,617 | ||||
Deferred tax liabilities | 15,196 | ||||
Intercompany payables to non-debtor subsidiaries | 3,557 | ||||
Other long-term liabilities | 11,903 | ||||
Total liabilities not subject to compromise | 207,273 | ||||
Liabilities subject to compromise | 1,445,346 | ||||
Total liabilities | 1,652,619 | ||||
Total shareholders' deficit | (279,264 | ) | |||
Total liabilities and shareholders’ deficit | $ | 1,373,355 | |||
84
C&J ENERGY SERVICES LTD. (DEBTOR-IN-POSSESSION) AND SUBSIDIARIES
NOTES TO CONSOLIDATED FINANCIAL STATEMENTS
C&J ENERGY SERVICES LTD. AND CERTAIN SUBSIDIARIES (DEBTOR-IN-POSSESSION) (1)
CONDENSED COMBINED STATEMENTS OF OPERATIONS AND COMPREHENSIVE LOSS
(In thousands)
(Unaudited)
Year Ended December 31, 2016 | ||||
Revenue | $ | 970,837 | ||
Costs and expenses: | ||||
Direct costs | 940,352 | |||
Selling, general and administrative expenses | 238,679 | |||
Research and development | 7,718 | |||
Depreciation and amortization | 214,335 | |||
Impairment expense | 423,216 | |||
(Gain) loss on disposal of assets | 3,097 | |||
Operating loss | (856,560 | ) | ||
Other income (expense): | ||||
Interest expense, net | (155,132 | ) | ||
Equity in losses of non-debtor subsidiaries | (30,133 | ) | ||
Other income (expense), net | 19,375 | |||
Total other income (expense) | (165,890 | ) | ||
Loss before reorganization items and income taxes | (1,022,450 | ) | ||
Reorganization items | 55,330 | |||
Income tax benefit | (133,768 | ) | ||
Net loss | (944,012 | ) | ||
Comprehensive loss, net of income taxes: | ||||
Net loss | (944,012 | ) | ||
Other comprehensive income (loss): | ||||
Foreign currency translation gain (loss), net of tax | 1,425 | |||
Comprehensive loss | $ | (942,587 | ) | |
85
C&J ENERGY SERVICES LTD. (DEBTOR-IN-POSSESSION) AND SUBSIDIARIES
NOTES TO CONSOLIDATED FINANCIAL STATEMENTS
C&J ENERGY SERVICES LTD. AND CERTAIN SUBSIDIARIES (DEBTOR-IN-POSSESSION) (1)
CONDENSED COMBINED STATEMENT OF CASH FLOWS
(In thousands)
(Unaudited)
Year Ended December 31, 2016 | ||||
Cash flows from operating activities: | ||||
Net loss | $ | (944,012 | ) | |
Adjustments to reconcile net loss to net cash used in operating activities | 855,421 | |||
Net cash used in operating activities | (88,591 | ) | ||
Cash flows from investing activities: | ||||
Purchases of and deposits on property, plant and equipment | (54,499 | ) | ||
Proceeds from disposal of property, plant and equipment | 32,786 | |||
Investment in unconsolidated affiliate | (408 | ) | ||
Payments made for business acquisitions, net of cash acquired | (1,419 | ) | ||
Investment in non-debtor subsidiaries | (8,244 | ) | ||
Payments made for intercompany receivables | (8,538 | ) | ||
Net cash used in investing activities | (40,322 | ) | ||
Cash flows from financing activities: | ||||
Proceeds from revolving debt | 174,000 | |||
Payments on revolving debt | (10,600 | ) | ||
Payments on term loans | (2,650 | ) | ||
Proceeds from DIP Facility | 23,000 | |||
Payments of capital lease obligations | (2,388 | ) | ||
Financing costs | (1,009 | ) | ||
Payments on non-debtor intercompany notes | (2,281 | ) | ||
Employee tax withholding on restricted shares vesting | (497 | ) | ||
Excess tax expense from share-based compensation | (5,592 | ) | ||
Net cash provided by financing activities | 171,983 | |||
Effect of exchange rate changes on cash | (2,129 | ) | ||
Net increase in cash and cash equivalents | 40,941 | |||
Cash and cash equivalents, beginning of period | 6,839 | |||
Cash and cash equivalents, end of period | $ | 47,780 | ||
(1) As of December 31, 2016, the subsidiaries of C&J Energy Services Ltd. that had filed voluntary petitions seeking relief under the Chapter 11 Proceeding were CJ Holding Co.; Blue Ribbon Technology Inc.; C&J Corporate Services (Bermuda) Ltd.; C&J Energy Production Services-Canada Ltd.; C&J Energy Services, Inc.; C&J Spec-Rent Services, Inc.; C&J VLC, LLC; C&J Well Services Inc.; ESP Completion Technologies LLC; KVS Transportation, Inc.; Mobile Data Technologies Ltd.; Tellus Oilfield Inc.; Tiger Cased Hole Services Inc.; and Total E&S, Inc. The condensed combined balance sheet, the condensed combined statements of operations and comprehensive loss and the condensed combined statement of cash flows above include only those entities that were subject to Chapter 11 Proceeding as of December 31, 2016. All direct and indirect investments in debtor subsidiaries that were included in the condensed combined financial statements have been eliminated.
Note 3 – Liquidity
As of December 31, 2016, the Company had a cash balance of approximately $64.6 million, and $75.0 million of available borrowing capacity under the DIP Facility. As of December 31, 2016, the Company had borrowings totaling $25.0 million associated with the DIP Facility, all of which are classified as a current liability on the consolidated balance sheet.
As of December 31, 2016 and prior to Plan Effective Date, the Company's primary sources of liquidity were from cash on hand and borrowings under the DIP Facility. On the Plan Effective Date, the Debtors emerged from the Chapter 11 Proceeding, and in connection with the Restructuring Plan, the Company closed on the $200 million Rights Offering. Proceeds from the Rights Offering were used to repay $25.0 million associated with the DIP Facility, and the DIP Facility was canceled
86
C&J ENERGY SERVICES LTD. (DEBTOR-IN-POSSESSION) AND SUBSIDIARIES
NOTES TO CONSOLIDATED FINANCIAL STATEMENTS
and discharged. On the Plan Effective Date, the Company entered into the New Credit Facility, which allows the Borrowers to incur revolving loans in an aggregate amount up to the lesser of $100 million and a borrowing base, which borrowing base is based upon the value of the Company's accounts receivable and inventory. The New Credit Facility also contains an availability block, which will reduce the amount otherwise available to be borrowed under the New Credit Facility by $20 million until the later of the delivery of financial statements for the fiscal year ending December 31, 2017 and the date on which the Company achieves a fixed charge coverage ratio of 1.10:1.0. The New Credit Facility also provides for the issuance of letters of credit, which would further reduce borrowing capacity.
As of February 24, 2017, the Company had a cash balance of approximately $115.0 million and $63.4 million of available borrowing capacity under the Company's New Credit Facility after taking into consideration the $20 million availability block and the Company's current outstanding letters of credit of approximately $15.1 million (see Note 5 - Debt and Capital Lease Obligations for defined terms).
The Company's ability to maintain adequate liquidity after emerging from the Chapter 11 Proceeding depends on its ability to successfully implement the Restructuring Plan, successful operation of its business, and appropriate management of operating expenses and capital spending. The Company's anticipated liquidity needs are highly sensitive to changes in each of these and other factors.
Note 4 – Fresh Start Accounting
The Company will adopt the fresh start accounting provisions ("Fresh Start") on the Plan Effective Date in connection with the Company's emergence from bankruptcy. Although the effective date of the Restructuring Plan was January 6, 2017, the Company will account for the consummation of the Restructuring Plan as if it had occurred on January 1, 2017 and has implemented Fresh Start reporting as of that date. The adoption of Fresh Start accounting will result in a new reporting entity, the Successor, for financial reporting purposes. The presentation is analogous to that of a new business entity such that on the Plan Effective Date the Successor's consolidated financial statements reflect a new capital structure with no beginning retained earnings or deficit and a new basis in the identifiable assets and liabilities assumed. In order to adopt Fresh Start accounting, the Company has to meet the following two conditions: (i) holders of existing voting shares of the Predecessor immediately before the Plan Effective Date received less than 50.0% of the voting shares of the Successor and (ii) the reorganization value of the Successor was less than its post-petition liabilities and estimated allowed claims.
As part of Fresh Start accounting, the Company is required to determine the reorganization value of the Successor upon emergence from the Chapter 11 Proceeding. Reorganization value approximates the fair value of the entity, before considering liabilities, and approximates the amount a willing buyer would pay for the assets of the entity immediately after the restructuring. The fair value of the Successor's assets will be determined with the assistance of a third party valuation expert who is expected to use available comparable market data and quotations, discounted cash flow analysis, and other methods in determining the appropriate asset fair values. The reorganization value will be allocated to the Company's individual assets based on their estimated fair values.
Enterprise value, which was used to derive reorganization value, represents the estimated fair value of an entity’s capital structure which generally consists of long term debt and shareholders’ equity. The Successor’s enterprise value, as approved by the Bankruptcy Court in support of the Restructuring Plan, was estimated to be $750 million which represented the mid-point of a determined range of $600 million to $900 million. The Successor's enterprise value of $750 million was determined based upon $725.9 million of New Equity and New Warrants as approved by the Bankruptcy Court and $24.1 million of other liabilities that were not eliminated or discharged under the Restructuring Plan. The Successor's enterprise value was determined with the assistance of a separate third party valuation expert who used available comparable market data and quotations, discounted cash flow analysis and other internal financial information and projections. This enterprise value combined with the Company’s Rights Offering was the basis for deriving equity value. The Company’s estimates of fair value are inherently subject to significant uncertainties and contingencies beyond its control. Accordingly, there can be no assurance that the estimates, assumptions, valuations, appraisals and financial projections will be realized, and actual results could vary materially. Moreover, the market value of the Company’s common stock subsequent to its emergence from bankruptcy may differ materially from the equity valuation derived for accounting purposes.
The unaudited pro forma balance sheet below summarizes the impact of the reorganization and the Fresh Start accounting as if the effective date of the emergence from bankruptcy had occurred on December 31, 2016. The reorganization value has been allocated to the assets acquired based upon their estimated fair values, as shown below. The estimated fair values of certain assets and liabilities, including property, plant and equipment, other intangible assets, taxes (including uncertain tax positions), and contingencies require significant judgments and estimates. C&J continues to assess the fair values
87
of certain assets acquired and liabilities assumed, and these estimated fair values are preliminary and subject to material change (in thousands):
Predecessor December 31, 2016 | Reorganization Adjustments | Fresh Start Adjustments | Successor Pro forma December 31, 2016 | |||||||||||||
(Unaudited) | (Unaudited) | (Unaudited) | ||||||||||||||
ASSETS | ||||||||||||||||
Current assets: | ||||||||||||||||
Cash and cash equivalents | $ | 64,583 | $ | 111,281 | (b)(c)(d)(e)(f)(g) | $ | — | $ | 175,864 | |||||||
Accounts receivable | 137,222 | — | — | 137,222 | ||||||||||||
Inventories, net | 54,471 | — | — | 54,471 | ||||||||||||
Prepaid and other current assets | 37,392 | — | — | 37,392 | ||||||||||||
Deferred tax assets | 6,020 | — | — | 6,020 | ||||||||||||
Total current assets | 299,688 | 111,281 | — | 410,969 | ||||||||||||
Property, plant and equipment, net | 950,811 | — | (349,435 | ) | (h) | 601,376 | ||||||||||
Other assets: | ||||||||||||||||
Intangible assets, net | 76,057 | — | (26,057 | ) | (h) | 50,000 | ||||||||||
Deferred financing costs | — | 2,248 | (g) | — | 2,248 | |||||||||||
Other noncurrent assets | 35,045 | — | — | 35,045 | ||||||||||||
Total assets | $ | 1,361,601 | $ | 113,529 | $ | (375,492 | ) | $ | 1,099,638 | |||||||
LIABILITIES AND SHAREHOLDER'S EQUITY | ||||||||||||||||
Current liabilities: | ||||||||||||||||
Accounts payable | $ | 75,193 | $ | — | $ | — | $ | 75,193 | ||||||||
Payroll and related costs | 18,287 | — | — | 18,287 | ||||||||||||
Accrued expenses | 59,129 | (16,051 | ) | (d)(e) | — | 43,078 | ||||||||||
DIP Facility | 25,000 | (25,000 | ) | (e) | — | — | ||||||||||
Other current liabilities | 3,026 | — | — | 3,026 | ||||||||||||
Total current liabilities | 180,635 | (41,051 | ) | — | 139,584 | |||||||||||
Deferred tax liabilities | 15,613 | — | — | 15,613 | ||||||||||||
Other long-term liabilities | 18,577 | — | — | 18,577 | ||||||||||||
Total liabilities not subject to compromise | 214,825 | (41,051 | ) | — | 173,774 | |||||||||||
Liabilities subject to compromise | 1,445,346 | (1,445,346 | ) | (a)(b)(c) | — | |||||||||||
Commitments and contingencies | ||||||||||||||||
Shareholders' equity: | ||||||||||||||||
Common stock | 1,195 | 555 | (1,195 | ) | (i) | 555 | ||||||||||
Additional paid-in capital | 1,009,426 | 925,309 | (a)(f) | (1,009,426 | ) | (i) | 925,309 | |||||||||
Accumulated other comprehensive loss | (2,600 | ) | — | 2,600 | (i) | — | ||||||||||
Retained earnings (deficit) | (1,306,591 | ) | 674,062 | (a)(c)(d) | 632,529 | (h)(i) | — | |||||||||
Total shareholders' equity | (298,570 | ) | 1,599,926 | (375,492 | ) | 925,864 | ||||||||||
Total liabilities and shareholders' equity | $ | 1,361,601 | $ | 113,529 | $ | (375,492 | ) | $ | 1,099,638 | |||||||
(a) To record the discharge of indebtedness under the old Credit Agreement in exchange for the New Equity and to
reflect the issuance of the New Warrants.
88
(b) To record the settlement of liabilities subject to compromise related to contract cures, 503(b)(9) claims and critical
vendors.
(c) To record the settlement of liabilities subject to compromise related to the general unsecured creditors.
(d) To record the professional fees to be paid at or subsequent to emergence.
(e) To record repayment of DIP Facility and related accrued interest.
(f) To record the cash proceeds received from the $200 million rights offering.
(g) To record deferred loan costs associated with the closing of the New Credit Facility.
(h) To record the Fresh Start accounting adjustments based upon the individual net asset fair values.
(i) To eliminate the historical equity of the Predecessor company in accordance with ASC 852, Reorganizations.
Note 5 - Debt and Capital Lease Obligations
Long term debt and capital lease obligations consisted of the following as of December 31, 2016 and 2015 (in thousands):
As of December 31, | ||||||||
2016 | 2015 | |||||||
Revolving Credit Facility | $ | 284,400 | $ | 121,000 | ||||
Five-Year Term Loans, net of original issue discount and deferred financing costs of $34,336 as of December 31, 2015 | 569,250 | 536,353 | ||||||
Seven-Year Term Loans, net of original issue discount and deferred financing costs of $52,032 as of December 31, 2015 | 480,150 | 429,330 | ||||||
Capital leases | — | 34,873 | ||||||
Total debt and capital lease obligations | 1,333,800 | 1,121,556 | ||||||
Less: liabilities subject to compromise | (1,333,800 | ) | — | |||||
Less: current portion of long-term debt and capital lease obligations | — | (13,433 | ) | |||||
Long-term debt and capital lease obligations | $ | — | $ | 1,108,123 | ||||
DIP Facility | $ | 25,000 | $ | — | ||||
On July 20, 2016, the Debtors filed Bankruptcy Petitions in the Bankruptcy Court seeking relief under Chapter 11 of the Bankruptcy Code under the caption “In re: CJ Holding Co., et al., Case No. 16-33590.” The filing of the Bankruptcy Petitions constituted an event of default with respect to the Company's Credit Agreement. As a result, the Company’s pre-petition secured indebtedness under the Credit Agreement became immediately due and payable and any efforts to enforce such payment obligations were automatically stayed as a result of the Chapter 11 Proceeding. As of December 31, 2016, $1.3 billion of debt under the Company's Credit Agreement was classified as liabilities subject to compromise.
Additional information regarding the Chapter 11 Proceeding is included in Note 2 - Chapter 11 Proceeding and Emergence.
New Credit Facility
On January 6, 2017, in connection with the emergence from bankruptcy, the Company entered into a revolving credit and security agreement (the "New Credit Facility") with PNC Bank, National Association, as administrative agent (the "Lender").
The New Credit Facility allows the Borrowers to incur revolving loans in an aggregate amount up to the lesser of $100 million and a borrowing base, which borrowing base is based upon the value of the Borrowers’ accounts receivable and inventory, subject to eligibility criteria and customary reserves which may be modified in the Lender’s permitted discretion. The New Credit Facility also contains an availability block, which will reduce the amount otherwise available to be borrowed under the New Credit Facility by $20 million until the later of the delivery of financial statements for the fiscal year ending December 31, 2017 and the date on which the Company achieves a fixed charge coverage ratio of 1.10:1.0. The New Credit Facility also provides for the issuance of letters of credit, which would reduce borrowing capacity thereunder. The maturity date of the New Credit Facility is January 6, 2021.
89
C&J ENERGY SERVICES LTD. (DEBTOR-IN-POSSESSION) AND SUBSIDIARIES
NOTES TO CONSOLIDATED FINANCIAL STATEMENTS
If at any time the amount of loans and other extensions of credit outstanding under the New Credit Facility exceed the borrowing base, the Borrowers may be required, among other things, to prepay outstanding loans immediately.
The Borrowers’ obligations under the New Credit Facility are secured by liens on a substantial portion of the Borrowers’ personal property, subject to certain exclusions and limitations. Upon the occurrence of certain events, additional collateral, including a portion of the Borrowers’ real properties, may also be required to be pledged. Each of the Borrowers is jointly and severally liable for the obligations of the other Borrowers under the New Credit Facility.
At the Borrowers’ election, interest on borrowings under the New Credit Facility will be determined by reference to either LIBOR plus an applicable margin of 4.0% per annum or an “alternate base rate” plus an applicable margin of 3.0% per annum. Beginning after the fiscal year ending on or about December 31, 2017, these margins will be subject to a step-down of 0.5% in the event that the Company achieves a fixed charge coverage ratio of 1.15:1.0 or greater. Interest will be payable quarterly for loans bearing interest based on the alternative base rate and on the last day of the interest period applicable to LIBOR-based loans. The Borrowers will also be required to pay a fee on the unused portion of the New Credit Facility equal to 1.0% per annum in the event that utilization is less than 50.0% of the total commitment and 0.75% per annum in the event that utilization is greater than or equal to 50.0% of the total commitment.
A termination fee of 1.0% of the maximum amount available will be payable if the loans are repaid in full and the New Credit Facility is terminated prior to the first anniversary of the Plan Effective Date.
The New Credit Facility contains covenants that limit the Borrowers’ and their subsidiaries’ ability to incur additional indebtedness, grant liens, make loans or investments, make distributions, merge into or consolidate with other persons, make capital expenditures or engage in certain asset dispositions including a sale of all or substantially all of the Company’s assets.
The New Credit Facility also contains certain financial covenants:
• | on or prior to August 31, 2017, a monthly minimum liquidity covenant equal to $100 million; and |
• | beginning on September 30, 2017, a monthly minimum fixed charge coverage ratio of 1.0:1.0, tested only if (a) as of any month-end on or prior to December 31, 2017, liquidity is less than $50 million, and (b) as of any month-end thereafter, liquidity is less than $40 million. |
DIP Facility
In connection with the commencement of the Chapter 11 Proceeding, the Company filed a motion seeking Bankruptcy Court approval of debtor-in-possession financing on the terms set forth in a contemplated $100 million Superpriority Secured Debtor-in-Possession Credit Agreement (the “DIP Credit Agreement”). On July 25, 2016, the Bankruptcy Court entered an order approving, on an interim basis, the financing to be provided pursuant to the DIP Facility, and on July 29, 2016, the DIP Credit Agreement was entered into by and among the Company, the other Debtors, the DIP Lenders and Cortland Capital Market Services LLC, as administrative agent on July 29, 2016, the Company accessed $25 million under the DIP Facility. On September 25, 2016, the Bankruptcy Court entered a final order (the “Final DIP Order”) authorizing the Debtors’ entry into the DIP Facility. In addition to approving the terms of the DIP Facility described above, the Final DIP Order contained a number of significant bankruptcy related provisions.
The borrowers under the DIP Facility were the Company and CJ Holding Co. All obligations under the DIP Facility were guaranteed by the Company’s subsidiaries that were debtors in the Bankruptcy cases. Borrowings under the DIP Credit Agreement were generally secured by superpriority priming liens on substantially all of the assets of the borrowers and guarantors.
Amounts outstanding under the DIP Facility bore interest based on, at the option of the borrower, the London Interbank Offered Rate (“LIBOR”) or an alternative base rate, plus an applicable margin equal to 9.0% in the case of LIBOR loans and 8.0% in the case of base rate loans. The alternative base rate was equal to the highest of (i) the published ‘prime rate’, (ii) the Federal Funds Effective Rate (as defined in the DIP Credit Agreement) plus 0.5% and (iii) LIBOR plus 1.0%. The DIP Facility also required that the Company pay various fees to the DIP Lenders, including a commitment fee equal to 5.0% of the unused commitments thereunder. The DIP Facility could be prepaid from time to time without premium or penalty, except for a 2.0% prepayment penalty payable in the event the DIP facility was refinanced or replaced with the proceeds of another financing during the pendency of the Bankruptcy cases. The DIP Facility was scheduled to mature on March 31, 2017.
90
C&J ENERGY SERVICES LTD. (DEBTOR-IN-POSSESSION) AND SUBSIDIARIES
NOTES TO CONSOLIDATED FINANCIAL STATEMENTS
The Company was required under the terms of the DIP Credit Agreement to comply with various covenants and milestones, including the requirement to deliver periodic 13-week budgets. The DIP Credit Agreement contained a covenant requiring our actual receipts and expenditures to remain within a certain variance of the amounts set forth in such budgets.
The DIP Credit Agreement also contained customary restrictive covenants (in each case, subject to exceptions) that limited, among other things, the Company's ability to create, incur, assume or suffer to exist liens or indebtedness, sell or otherwise dispose of assets, make certain restricted payments and investments, enter into transactions with affiliates, make capital expenditures and prepay certain indebtedness. The activities of the Company's subsidiaries that were not debtors in the Bankruptcy cases were extremely limited pursuant to the DIP Credit Agreement.
In accordance with the Restructuring Plan, on the Plan Effective Date, the Company repaid all amounts outstanding under the DIP Facility with the proceeds from the Rights Offering and the DIP Facility was canceled and discharged.
Credit Agreement
On March 24, 2015, in connection with the closing of the Nabors Merger, the Company entered into a new credit agreement with Bank of America N.A., as administrative agent and other lending parties (the “Original Credit Agreement”). At the closing, the Original Credit Agreement provided for senior secured credit facilities in an aggregate principal amount of $1.66 billion, consisting of (i) a revolving credit facility (“Revolving Credit Facility” or the “Revolver”) in the aggregate principal amount of $600.0 million and (ii) a term loan B facility (“Term Loan B”) in the aggregate principal amount of $1.06 billion. The Company simultaneously repaid all amounts outstanding and terminated Old C&J’s prior credit agreement; no penalties were due in connection with such repayment and termination. The borrowers under the Revolver are the Company and certain wholly-owned subsidiaries of the Company, specifically, CJ Lux Holdings S.à. r.l. and CJ Holding Co. The borrower under the Term Loan B is CJ Holding Co. All obligations under the Original Credit Agreement are guaranteed by the Company’s wholly-owned domestic subsidiaries, other than immaterial subsidiaries.
On September 29, 2015, the Company obtained and entered into a waiver and amendments to the Original Credit Agreement (as amended by the amendments, the "Amended Credit Agreement"). The Amended Credit Agreement, among other things, suspended the quarterly maximum Total Leverage Ratio (defined below) and quarterly minimum Interest Coverage Ratio (defined below) covenants set forth in the Original Credit Agreement. The suspension of these financial covenants commenced with the fiscal quarter ending September 30, 2015 and would last through the fiscal quarter ending June 30, 2017. Upon reinstatement of these covenants as of the quarter ending September 30, 2017, the required levels initially would be more lenient than those in effect under the terms of the Original Credit Agreement and would gradually adjust to those prior levels over the subsequent fiscal quarters (see Other Information below). The effectiveness of the covenant suspension was also subject to certain conditions that, among other things, would reduce the capacity of the Company to make investments and restricted payments through the quarter ending December 31, 2017.
On May 10, 2016, the Company obtained a temporary limited waiver agreement from certain of the lenders pursuant to which, effective as of March 31, 2016, such lenders agreed to not consider a breach of the Minimum Cumulative Consolidated EBITDA Covenant measured as of March 31, 2016 an event of default through May 31, 2016. Minimum Cumulative Consolidated EBITDA is defined as total earnings (loss) before net interest expense, income taxes, depreciation and amortization, other income (expense), and net gain or loss on disposal of assets, and excludes, among other things, stock based compensation expense, acquisition-related costs, and non-routine items.
On May 31, 2016, the Company obtained and entered into the Forbearance Agreement with certain of the lenders pursuant to which, among other things, such lenders agreed not to pursue default remedies against the Company with respect to its breach of the Minimum Cumulative Consolidated EBITDA Covenant or certain specified payment defaults.
On June 30, 2016, this forbearance was extended through July 17, 2016 pursuant to the Second Forbearance Agreement, and prior to the termination of the Second Forbearance Agreement, this forbearance period was once again extended through July 20, 2016. The Second Forbearance Agreement provided that the forbearance would terminate upon the occurrence of certain events, including the failure of the Company to enter into the Restructuring Support Agreement on or prior to July 8, 2016. On July 8, 2016, the Company entered into the Restructuring Support Agreement with the Supporting Lenders. The Restructuring Support Agreement contemplated the implementation of a restructuring of the Company through a debt-to-equity conversion and Rights Offering, which transaction was effectuated through the Restructuring Plan.
On July 20, 2016, the Debtors filed Bankruptcy Petitions in the Bankruptcy Court seeking relief under Chapter 11. Additional information, including definitions of capitalized defined terms, regarding the Chapter 11 Proceeding is included in Note 2 - Chapter 11 Proceeding and Emergence.
91
C&J ENERGY SERVICES LTD. (DEBTOR-IN-POSSESSION) AND SUBSIDIARIES
NOTES TO CONSOLIDATED FINANCIAL STATEMENTS
Revolving Credit Facility
The Revolver was scheduled to mature on March 24, 2020 (except that if any Five-Year Term Loans (as defined herein) had not been repaid prior to September 24, 2019, the Revolver was scheduled to mature on September 24, 2019). Borrowings under the Revolver are non-amortizing. Amounts outstanding under the Revolver bore interest based on, at the option of the borrower, LIBOR or an alternative base rate, plus an applicable margin determined pursuant to a pricing grid based on the ratio of consolidated total indebtedness of C&J and its subsidiaries to Consolidated EBITDA of C&J and its subsidiaries for the most recent four fiscal quarter period for which financial statements are available (the “Total Leverage Ratio”).
On July 20, 2016, the Debtors filed the Bankruptcy Petitions which constituted an event of default under the Credit Agreement and accelerated the Revolver indebtedness to become immediately due and payable; however, any efforts to enforce such payment obligations were automatically stayed as a result of the Chapter 11 Proceeding. On the Plan Effective Date, pursuant to the Restructuring Support Agreement entered into on July 8, 2016, holders of the Revolver received their pro rata share of 100.0% of the New Equity in the reorganized company, subject to dilution from the issuance of New Equity on account of the Management Incentive Plan, the Rights Offering, the Backstop Fee and the New Warrants as discussed further in Note 2 - Chapter 11 Proceeding and Emergence.
Term Loan B Facility
Borrowings under the Term Loan B are comprised of two tranches: a tranche consisting of $575.0 million in aggregate principal amount of term loans maturing on March 24, 2020 (the “Five-Year Term Loans”) and a tranche consisting of a $485.0 million in aggregate principal amount of term loans maturing on March 24, 2022 (the “Seven-Year Term Loans”). The Company was required to make quarterly amortization payments in an amount equal to 1.0% per annum, with the remaining balance payable on the applicable maturity date. As of December 31, 2016 and 2015, the Company had borrowings outstanding under the Five-Year Term Loans and the Seven-Year Term Loans of $569.3 million and $480.2 million and $570.7 million and $481.4 million, respectively.
Five-Year Term Loans outstanding under the Term Loan B bore interest based on, at the option of the Company, (i) LIBOR subject to a floor of 1.0% per annum, plus a margin of 5.5%, or (ii) an alternative base rate, plus a margin of 4.5%. Seven-Year Term Loans outstanding under the Term Loan B bore interest based on, at the option of the Company, (i) LIBOR subject to a floor of 1.0% per annum, plus a margin of 6.25%, or (ii) an alternative base rate, plus a margin of 5.25%.
The alternative base rate was equal to the highest of (i) the Administrative Agent’s prime rate, (ii) the Federal Funds Effective Rate plus 0.5%, or (iii) LIBOR plus 1.0%.
On July 20, 2016, the Debtors filed the Bankruptcy Petitions which constituted an event of default under the Credit Agreement and accelerated the Term Loan B Facility indebtedness to become immediately due and payable; however, any efforts to enforce such payment obligations were automatically stayed as a result of the Chapter 11 Proceeding. On the Plan Effective Date, pursuant to the Restructuring Support Agreement entered into on July 8, 2016, holders of the Term Loan B Facility debt received their pro rata share of 100.0% of the New Equity in the reorganized company, subject to dilution from the issuance of New Equity on account of the Management Incentive Plan, the Rights Offering, the Backstop Fee and the New Warrants as discussed further in Note 2 - Chapter 11 Proceeding and Emergence.
Capital Lease Obligations
In October 2016, the Company entered into amended lease agreements related to the Company’s corporate headquarters and its R&T facility, both originally entered into during 2013 and accounted for as capital leases. The Company determined that both amended lease agreements qualify as a new operating lease under ASC 840 - Leases, which resulted in accounting for the amended leases as a sale-leaseback pursuant to the requirements of ASC 840. The conversion from capital lease to operating lease accounting treatment resulted in the deferral of $6.3 million of gain. As of December 31, 2016, the Company had no capital lease obligations.
Interest Expense
As of June 30, 2016, based on the negotiations between the Company and the lenders, it became evident that the restructuring of the Company's capital structure would not include a restructuring of the Company's Revolving Credit Facility, the Five-Year Term Loans and the Seven-Year Term Loans, and these debt obligations, as demand obligations, would not be
92
C&J ENERGY SERVICES LTD. (DEBTOR-IN-POSSESSION) AND SUBSIDIARIES
NOTES TO CONSOLIDATED FINANCIAL STATEMENTS
paid in the ordinary course of business over the term of these loans. As a result, during the second quarter of 2016, the Company accelerated the amortization of the associated original issue discount and deferred financing costs, fully amortizing these amounts as of June 30, 2016. In addition, the Company has not accrued interest that it believes is not probable of being treated as an allowed claim in the Chapter 11 Proceeding. For the year ended December 31, 2016, the Company did not accrue interest totaling $60.5 million under the Credit Agreement subsequent to the Petition Date. For the year ended December 31, 2016, interest expense consisted of the following (in thousands):
Years Ended December 31, | ||||||||
2016 | 2015 | |||||||
Revolving Credit Facility | $ | 8,504 | $ | 7,058 | ||||
Five-Year Term Loans | 23,330 | 29,302 | ||||||
Seven-Year Term Loans | 21,762 | 27,557 | ||||||
DIP Facility | 2,087 | — | ||||||
Capital leases | 1,206 | 1,005 | ||||||
Accretion of original issue discount | 4,193 | 6,187 | ||||||
Amortization of deferred financing costs | 4,590 | 10,926 | ||||||
Original issue discount accelerated amortization | 48,221 | — | ||||||
Deferred financing costs accelerated amortization | 43,720 | — | ||||||
Interest income and other | (148 | ) | 51 | |||||
Interest expense, net | $ | 157,465 | $ | 82,086 | ||||
Note 6 - Goodwill and Other Intangible Assets
During the first quarter of 2016, utilization and commodity price levels continued to fall towards unprecedented levels and the resulting negative impact on the Company’s results of operations, coupled with the sustained decrease in the Company’s stock price, were deemed triggering events that led to an interim period test for goodwill impairment. The Company chose to bypass a qualitative approach and instead opted to employ the detailed Step 1 impairment testing methodologies discussed below.
Income approach
The income approach impairment testing methodology is based on a discounted cash flow model, which utilizes present values of cash flows to estimate fair value. For the Completion Services and Well Support Services reporting units, the future cash flows were projected based on estimates of projected revenue growth, fleet and rig count, utilization, gross profit rates, SG&A rates, working capital fluctuations, and capital expenditures. For the Other Services reporting unit, the future cash flows were projected based primarily on estimates of future demand for manufactured and refurbished equipment as well as parts and service, gross profit rates, SG&A rates, working capital fluctuations, and capital expenditures. Forecasted cash flows for the three reporting units took into account known market conditions as of March 31, 2016, and management’s anticipated business outlook, both of which have been impacted by the sustained decline in commodity prices.
A terminal period was used to reflect an estimate of stable, perpetual growth. The terminal period reflects a terminal growth rate of 2.5% for all three reporting units, including an estimated inflation factor.
The future cash flows were discounted using a market-participant risk-adjusted weighted average cost of capital (“WACC”) of 14.5% for Completion Services, 14.0% for Well Support Services, and 16.0% for Other Services reporting units. These assumptions were derived from unobservable inputs and reflect management’s judgments and assumptions.
Market approach
The market approach impairment testing methodology is based upon the guideline public company method. The application of the guideline public company method was based upon selected public companies operating within the same industry as the Company. Based on this set of comparable competitor data, price-to-earnings multiples were derived and a range of price-to-earnings multiples was determined for each reporting unit. Selected market multiples were 10.6x for
93
C&J ENERGY SERVICES LTD. (DEBTOR-IN-POSSESSION) AND SUBSIDIARIES
NOTES TO CONSOLIDATED FINANCIAL STATEMENTS
Completion Services, 10.5x for Well Support Services and 11.0x for Other Services reporting units.
The fair value determined under the market approach is sensitive to these market multiples, and a decline in any of the multiples could reduce the estimated fair value of any of the three reporting units below their respective carrying values. Earnings estimates were derived from unobservable inputs that require significant estimates, judgments and assumptions as described in the income approach.
The estimated fair value determined under the income approach was consistent with the estimated fair value determined under the market approach. The concluded fair value for the Completion Services and Well Support Services reporting units consisted of a weighted average, with an 80.0% weight under the income approach and a 20.0% weight under the market approach. The concluded fair value for the Other Services reporting unit consisted of a weighted average with a 50.0% weight under the income approach and a 50.0% weight under the market approach.
The results of the Step 1 impairment testing indicated potential impairment in the Well Support Services reporting unit. The goodwill associated with both the Completion Services and Other Services reporting units was completely impaired during the third quarter of 2015. As a way to validate the estimated reporting unit fair values, the total market capitalization of the Company was compared to the total estimated fair value of all reporting units, and an implied control premium was derived. Market data in support of the implied control premium was used in this reconciliation to corroborate the estimated reporting unit fair values.
Step 2 of the goodwill impairment testing for the Well Support Services reporting units was performed during the first quarter of 2016, and the results concluded that there was no value remaining to be allocated to the goodwill associated with this reporting unit. As a result, the Company recognized impairment expense of $314.3 million during 2016.
As of December 31, 2016, there is no goodwill remaining to be allocated across the Company's three reporting units.
The changes in the carrying amount of goodwill for the years ended December 31, 2016 and 2015 are as follows (in thousands):
Completion Services | Well Support Services | Other Services | Total | |||||||||||||
As of December 31, 2014 | $ | 200,149 | $ | 15,085 | $ | 4,719 | $ | 219,953 | ||||||||
Acquisitions | 141,435 | 334,241 | — | 475,676 | ||||||||||||
Impairment expense | (340,464 | ) | (39,785 | ) | (4,719 | ) | (384,968 | ) | ||||||||
Foreign currency translation and other adjustments | (1,120 | ) | (1,864 | ) | — | (2,984 | ) | |||||||||
As of December 31, 2015 | — | 307,677 | — | 307,677 | ||||||||||||
Measurement period adjustments | 8 | 5,382 | — | 5,390 | ||||||||||||
Impairment expense | (8 | ) | (314,293 | ) | — | (314,301 | ) | |||||||||
Foreign currency translation and other adjustments | — | 1,234 | — | 1,234 | ||||||||||||
As of December 31, 2016 | $ | — | $ | — | $ | — | $ | — | ||||||||
Indefinite-Lived Intangible Assets
The Company had approximately $6.0 million of intangible assets with indefinite useful lives, which are subject to annual impairment tests or more frequently if events or circumstances indicate the carrying amount may not be recoverable.
The Company’s intangible assets associated with intellectual property, research and development (“IPR&D”) consist of technology that is still in the testing phase; however, given the continued market downturn management has made the decision to postpone these projects. Based on the Company's evaluation, it was determined that the IPR&D carry value of $6.0 million was impaired and written down to zero as of December 31, 2016.
Definite-Lived Intangible Assets
94
C&J ENERGY SERVICES LTD. (DEBTOR-IN-POSSESSION) AND SUBSIDIARIES
NOTES TO CONSOLIDATED FINANCIAL STATEMENTS
The Company reviews definite-lived intangible assets, along with PP&E, for impairment when a triggering event indicates that the asset may have a net book value in excess of recoverable value. During 2016, management determined the sustained low commodity price levels coupled with the sustained decrease in the Company’s share price were deemed triggering events that provided indicators that its definite-lived intangible assets may be impaired. The Company performed a recoverability test on all of its definite-lived intangible assets and PP&E by comparing the estimated future net undiscounted cash flows expected to be generated from the use of these assets to the carrying amounts of the assets for recoverability. If the estimated undiscounted cash flows exceed the carrying amount of the assets, an impairment does not exist and a loss will not be recognized. If the undiscounted cash flows are less than the carrying amount of the assets, the assets are not recoverable and the amount of impairment must be determined by fair valuing the assets.
Recoverability testing through June 30, 2016 resulted in the determination that certain intangible assets associated with the Company’s wireline and artificial lift lines of business were not recoverable. The fair value of the wireline and artificial lift assets was determined to be approximately $38.2 million and zero, respectively, resulting in impairment expense of $50.4 million and $4.6 million, respectively. For the year ended December 31, 2016, the Company recorded $55.0 million of impairment expense, as the intangible assets assessed were determined not to be recoverable. For the year ended December 31, 2015, recoverability testing resulted in $11.2 million of impairment expense as the intangible assets assessed were determined not to be recoverable.
The changes in the carrying amounts of other intangible assets for the year ended December 31, 2016 are as follows (in thousands):
Amortization Period | December 31, 2015 | Impairment Expense | Amortization Expense | Move from Indefinite-Lived to Definite- Lived | Foreign Currency Translation Adjustment | December 31, 2016 | ||||||||||||||||||||
Customer relationships | 8-15 years | $ | 122,814 | $ | (41,990 | ) | $ | — | $ | — | $ | 2 | $ | 80,826 | ||||||||||||
Trade name | 10-15 years | 42,580 | (12,588 | ) | — | — | 2 | 29,994 | ||||||||||||||||||
Developed technology | 5-15 years | 19,897 | — | — | 1,610 | 9 | 21,516 | |||||||||||||||||||
Non-compete | 4-5 years | 2,710 | (110 | ) | — | — | — | 2,600 | ||||||||||||||||||
Patents | 10 years | 373 | (338 | ) | — | — | — | 35 | ||||||||||||||||||
IPR&D | Indefinite | 7,598 | (5,988 | ) | — | (1,610 | ) | — | — | |||||||||||||||||
195,972 | (61,014 | ) | — | — | 13 | 134,971 | ||||||||||||||||||||
Less: accumulated amortization | (48,111 | ) | — | (10,789 | ) | — | (14 | ) | (58,914 | ) | ||||||||||||||||
Intangible assets, net | $ | 147,861 | $ | (61,014 | ) | $ | (10,789 | ) | $ | — | $ | (1 | ) | $ | 76,057 | |||||||||||
Amortization expense for the years ended December 31, 2016, 2015 and 2014 totaled $10.8 million, $14.5 million and $10.9 million, respectively.
Estimated amortization expense for each of the next five years and thereafter is as follows (in thousands):
Years Ending December 31, | ||||
2017 | $ | 9,045 | ||
2018 | 9,045 | |||
2019 | 9,034 | |||
2020 | 7,260 | |||
2021 | 6,686 | |||
Thereafter | 34,987 | |||
$ | 76,057 | |||
Note 7 – Income Taxes
The provision for income taxes consisted of the following (in thousands):
95
C&J ENERGY SERVICES LTD. (DEBTOR-IN-POSSESSION) AND SUBSIDIARIES
NOTES TO CONSOLIDATED FINANCIAL STATEMENTS
Years Ended December 31, | ||||||||||||
2016 | 2015 | 2014 | ||||||||||
Current provision: | ||||||||||||
Federal | $ | 2,047 | $ | (23,784 | ) | $ | 11,184 | |||||
State | (1,588 | ) | (2,265 | ) | 1,310 | |||||||
Foreign | 64 | 100 | — | |||||||||
Total current provision | 523 | (25,949 | ) | 12,494 | ||||||||
Deferred (benefit) provision: | ||||||||||||
Federal | (122,302 | ) | (248,279 | ) | 31,978 | |||||||
State | (8,864 | ) | (20,553 | ) | 2,036 | |||||||
Foreign | 1,633 | (4,312 | ) | (829 | ) | |||||||
Total deferred provision | (129,533 | ) | (273,144 | ) | 33,185 | |||||||
Provision for income taxes | $ | (129,010 | ) | $ | (299,093 | ) | $ | 45,679 | ||||
The following table reconciles the statutory tax rates to the Company’s effective tax rate:
Years Ended December 31, | |||||||||
2016 | 2015 | 2014 | |||||||
Federal statutory rate | 35.0 | % | 35.0 | % | 35.0 | % | |||
State taxes, net of federal benefit | 0.3 | % | 1.4 | % | 3.0 | % | |||
Domestic production activities deduction | — | % | (0.2 | )% | (1.0 | )% | |||
Effect of foreign losses | (2.0 | )% | (0.3 | )% | 2.4 | % | |||
Impairment | (8.8 | )% | (9.8 | )% | — | % | |||
Valuation allowance | (10.9 | )% | — | % | — | % | |||
Other | (1.6 | )% | (0.6 | )% | 0.5 | % | |||
Effective income tax rate | 12.0 | % | 25.5 | % | 39.9 | % | |||
The Company’s deferred tax assets and liabilities consisted of the following (in thousands):
As of December 31, | ||||||||
2016 | 2015 | |||||||
Deferred tax assets: | ||||||||
Accrued liabilities | $ | 25,470 | $ | 8,046 | ||||
Allowance for doubtful accounts | 2,630 | 7,364 | ||||||
Stock-based compensation | 11,530 | 19,503 | ||||||
Inventory reserve | 9,131 | 8,712 | ||||||
Net operating losses | 231,360 | 68,821 | ||||||
163j interest limitation | 58,426 | 15,345 | ||||||
Amortization of goodwill and intangible assets | 4,526 | — | ||||||
Other | 3,774 | 3,567 | ||||||
Total deferred tax assets | 346,847 | 131,358 | ||||||
Deferred tax liabilities: | ||||||||
Prepaids | (2,123 | ) | (9,677 | ) | ||||
Earnout liabilities | — | (4,328 | ) | |||||
Depreciation on property, plant and equipment | (179,428 | ) | (228,981 | ) | ||||
Amortization of goodwill and intangible assets | — | (28,033 | ) | |||||
Other | (3,873 | ) | (378 | ) | ||||
Total deferred tax liabilities | (185,424 | ) | (271,397 | ) | ||||
Valuation allowances | (171,016 | ) | (77 | ) | ||||
Net deferred tax liability | $ | (9,593 | ) | $ | (140,116 | ) | ||
96
C&J ENERGY SERVICES LTD. (DEBTOR-IN-POSSESSION) AND SUBSIDIARIES
NOTES TO CONSOLIDATED FINANCIAL STATEMENTS
The Company has approximately $530.6 million of U.S. federal net operating loss carryforwards (“NOLs”) which, if not utilized, will begin to expire in the year 2035 and state NOLs of approximately $224.4 million which, if not utilized, will expire in various years between 2025 and 2036. Additionally, the Company has approximately $105.5 million of NOLs in other jurisdictions which, if not utilized, will expire in various years between 2020 and 2036. As of December 31, 2016 we have recorded a deferred tax asset of approximately $231.4 million relating to NOLs. A valuation allowance of $171.0 million has been provided for NOLs that the Company believes are more likely than not to expire unutilized.
The Company’s U.S. federal income tax returns for the tax years 2013 through 2015 remain open to examination by the Internal Revenue Service under the applicable U.S. federal statute of limitations provisions. The various states in which the Company is subject to income tax are generally open to examination for the tax years after 2012. The Company's 2015 Federal income tax return and the Company’s 2011, 2012 and 2013 Louisiana tax returns are currently under examination.
During the year ended December 31, 2016, the company realized tax expense of $1.6 million on the deferred charges relating to income tax expense on intercompany profits that resulted from the sale of our intellectual property rights outside of North America to our subsidiary in Luxembourg. The remaining $14.8 million of deferred charges are included within other noncurrent assets on the consolidated balance sheet. The deferred charges are amortized as a component of income tax expense over the economic life of the intellectual property.
A reconciliation of unrecognized tax benefit balances is as follows (in thousands):
Years Ended December 31, | |||||||
2016 | 2015 | ||||||
Balance at beginning of year | $ | — | $ | — | |||
Additions based on tax positions related to the current year | 6,525 | — | |||||
Additions for tax positions of prior years | — | — | |||||
Reductions for tax positions of prior years | — | — | |||||
Reductions for audit settlements | — | — | |||||
Reductions resulting from a lapse of applicable statute of limitations periods | — | — | |||||
Balance at end of year | $ | 6,525 | $ | — | |||
The balances of unrecognized tax benefits, the amount of related interest and penalties is $6.5 million as of December 31, 2016, all of which is subject to reasonably possible changes in the next 12 months.
The Company classifies interest and penalties within the provision for income taxes. The Company recognized interest expense of zero in the provision for income taxes for each of the years ended December 31, 2016, 2015 and 2014.
Note 8 - Share-Based Compensation
Equity Plans
In connection with the Nabors Merger, the Company approved and adopted the C&J Energy Services 2015 Long Term Incentive Plan (the “2015 LTIP”), effective as of March 23, 2015, contingent upon the consummation of the Nabors Merger. The 2015 LTIP served as an assumption of the Old C&J 2012 Long-Term Incentive Plan, including the sub-plan titled the C&J International Middle East FZCO Phantom Equity Arrangement (the “2012 LTIP”), with certain non-material revisions made and no increase in the number of shares remaining available for issuance under the 2012 LTIP. Prior to the adoption of the 2015 LTIP, all share-based awards granted to Old C&J employees, consultants and non-employee directors were granted under the 2012 LTIP and, following the 2015 LTIP’s adoption, no further awards will be granted under the 2012 LTIP. Awards that were previously outstanding under the 2012 LTIP will continue and remain outstanding under the 2015 LTIP, as adjusted to reflect the Nabors Merger. At the closing of the Nabors Merger, restricted shares and stock option awards were granted under the 2015 LTIP to certain employees of the C&P Business and approximately 0.4 million C&J common shares underlying those awards were deemed part of the consideration paid to Nabors for the Nabors Merger.
The 2015 LTIP provides for the grant of share-based awards to the Company’s employees, consultants and non-employee directors. The following types of awards are available for issuance under the 2015 LTIP: incentive stock options and nonqualified stock options, share appreciation rights, restricted shares, restricted share units, dividend equivalent rights, performance awards and share awards. As of December 31, 2016 only nonqualified stock options and restricted shares have been awarded under the 2015 LTIP and 2012 LTIP. No grants were issued during the year ended December 31, 2016.
97
C&J ENERGY SERVICES LTD. (DEBTOR-IN-POSSESSION) AND SUBSIDIARIES
NOTES TO CONSOLIDATED FINANCIAL STATEMENTS
A total of 4.3 million common shares were originally authorized and approved for issuance under the 2012 LTIP and on June 4, 2015, the shareholders of the Company approved the First Amendment to the 2015 LTIP, which increased the number of common shares that may be issued under the 2015 LTIP by approximately 3.6 million shares. The shareholders of the Company approved the Second Amendment to the 2015 LTIP in February 2016, which increased the number of common shares that may be issued by approximately 6.0 million shares. Including the add-back of approximately 0.9 million restricted shares and 0.7 million options canceled or expired under the 2012 LTIP and 2015 LTIP during 2016, approximately 11.3 million shares were available for issuance under the 2015 LTIP as of December 31, 2016. The number of common shares available for issuance under the 2015 LTIP is subject to adjustment in the event of a reclassification, recapitalization, merger, consolidation, reorganization, spin-off, split-up, issuance of warrants, rights or debentures, share dividend, share split or reverse share split, cash dividend, property dividend, combination or exchange of shares, repurchase of shares, change in corporate structure or any similar corporate event or transaction. The number of common shares available for issuance may also increase due to the termination of an award granted under the 2015 LTIP, the 2012 LTIP or the Prior Plans (as defined below), by expiration, forfeiture, cancellation or otherwise without the issuance of the common shares.
Prior to the approval of the 2012 LTIP, all share-based awards granted to Old C&J’s employees, consultants and non-employee directors were granted under the C&J Energy Services 2006 Stock Option Plan and subsequently under the C&J Energy Services 2010 Stock Option Plans (collectively known as the “Prior Plans”). No additional awards will be granted under the Prior Plans.
Stock Options
The fair value of each option award granted under the 2015 LTIP, the 2012 LTIP and the Prior Plans is estimated on the date of grant using the Black-Scholes option-pricing model. Option awards are generally granted with an exercise price equal to the market price of the Company’s common shares on the grant date. For options granted prior to Old C&J’s initial public offering, which closed on August 3, 2011, the calculation of Old C&J’s share price involved the use of different valuation techniques, including a combination of an income and/or market approach. Determination of the fair value was a matter of judgment and often involved the use of significant estimates and assumptions. Additionally, due to the Company’s lack of historical volume of option activity, the expected term of options granted is derived using the “plain vanilla” method. In addition, expected volatilities have been based on comparable public company data, with consideration given to the Company’s limited historical data. The Company makes estimates with respect to employee termination and forfeiture rates of the options within the valuation model. The risk-free rate is based on the approximate U.S. Treasury yield rate in effect at the time of grant. No options were granted during the year ended December 31, 2016. During the year ended December 31, 2015, approximately 0.3 million replacement option awards were granted by the Company to employees in connection with the Nabors Merger.
The following table presents the assumptions used in determining the fair value of option awards during the year ended December 31, 2015. No stock options were granted by the Company for the year ended December 31, 2016 and for the year ended December 31, 2014.
Year Ended December 31, | |||
2015 | |||
Expected volatility | 52.3% | ||
Expected dividends | None | ||
Exercise price | $7.93 - $27.12 | ||
Expected term (in years) | 0.3 - 4.3 | ||
Risk-free rate | 0.03% - 1.3% | ||
The weighted average grant date fair value of options granted during the year ended December 31, 2015, was $4.74.
A summary of the Company’s stock option activity for the year ended December 31, 2016 is presented below.
98
C&J ENERGY SERVICES LTD. (DEBTOR-IN-POSSESSION) AND SUBSIDIARIES
NOTES TO CONSOLIDATED FINANCIAL STATEMENTS
Shares | Weighted Average Exercise Price | Weighted Average Remaining Contractual Life | Aggregate Intrinsic Value | |||||||||||
(in thousands) | (in years) | (in thousands) | ||||||||||||
Outstanding at January 1, 2014 | 5,283 | $ | 11.69 | 6.36 | $ | 65,351 | ||||||||
Granted | — | — | — | — | ||||||||||
Exercised | (159 | ) | 5.23 | — | — | |||||||||
Forfeited | (57 | ) | 29.00 | — | — | |||||||||
Outstanding at December 31, 2014 | 5,067 | $ | 11.70 | 5.40 | $ | 21,395 | ||||||||
Granted | 267 | 10.49 | — | — | ||||||||||
Exercised | (154 | ) | 2.94 | — | — | |||||||||
Forfeited | (61 | ) | 19.03 | — | — | |||||||||
Outstanding at December 31, 2015 | 5,119 | $ | 11.82 | 4.41 | $ | 2,874 | ||||||||
Granted | — | — | — | — | ||||||||||
Exercised | — | — | — | — | ||||||||||
Forfeited | (703 | ) | 3.19 | — | — | |||||||||
Outstanding at December 31, 2016 | 4,416 | $ | 13.18 | 3.86 | $ | — | ||||||||
Exercisable at December 31, 2016 | 4,416 | $ | 13.18 | 3.86 | $ | — | ||||||||
The total intrinsic value of options exercised during the years ended December 31, 2016 and 2015 was zero and $0.6 million, respectively. As of December 31, 2016, there was no more remaining unrecognized compensation cost related to outstanding stock options.
Restricted Shares
Historically, restricted shares were valued based on the closing price of the Company’s common shares on the NYSE on the date of grant. During the year ended December 31, 2016 there were no restricted shares granted to employees and non-employee directors under the 2015 LTIP. During the year ended December 31, 2015 approximately 2.8 million restricted shares were granted to employees and non-employee directors under the 2015 LTIP, including approximately 0.6 million replacement restricted shares, at fair market values ranging from $3.55 to $15.10 per share.
To the extent permitted by law, the recipient of an award of restricted shares will have all of the rights of a shareholder with respect to the underlying common shares, including the right to vote the common shares and to receive all dividends or other distributions made with respect to the common shares. Dividends on restricted shares will be deferred until the lapsing of the restrictions imposed on the shares and will be held by the Company for the account of the recipient (either in cash or to be reinvested in restricted shares) until such time. Payment of the deferred dividends and accrued interest, if any, shall be made upon the lapsing of restrictions on the restricted shares, and any dividends deferred in respect of any restricted shares shall be forfeited upon the forfeiture of such restricted shares. As of December 31, 2016, the Company had not issued any dividends.
A summary of the status and changes during the year ended December 31, 2016 of the Company’s shares of non-vested restricted shares is presented below:
Shares | Weighted Average Grant-Date Fair Value | ||||||
(in thousands) | |||||||
Non-vested at January 1, 2016 | 3,271 | $ | 15.70 | ||||
Forfeited | (576 | ) | 15.30 | ||||
Vested | (1,797 | ) | 15.92 | ||||
Non-vested at December 31, 2016 | 898 | $ | 15.34 | ||||
99
C&J ENERGY SERVICES LTD. (DEBTOR-IN-POSSESSION) AND SUBSIDIARIES
NOTES TO CONSOLIDATED FINANCIAL STATEMENTS
As of December 31, 2016 and 2015, respectively, there were $8.9 million and $29.9 million of total unrecognized compensation cost related to restricted shares. That cost is expected to be recognized over a weighted-average period of 1.42 years. The weighted-average grant-date fair value per share of restricted shares granted during the year ended December 31, 2015 was $13.50.
As of December 31, 2016, the Company had 5.3 million stock options and restricted shares outstanding to employees and non-employee directors, 0.3 million of which were issued under the 2006 Plan, 3.9 million were issued under the 2010 Plan, 0.2 million were issued under the 2012 Plan and the remaining 0.9 million were issued under the 2015 Plan. As of December 31, 2015, the Company had 8.4 million stock options and restricted shares outstanding to employees and non-employee directors, 0.9 million of which were issued under the 2006 Plan, 4.0 million were issued under the 2010 Plan , 0.7 million were issued under the 2012 Plan and the remaining 2.8 million were issued under the 2015 Plan.
Share-based compensation expense was $17.7 million, $18.5 million and $18.4 million for the years ended December 31, 2016, 2015 and 2014, respectively, and is included in selling, general and administrative expenses, direct costs and research and development on the consolidated statements of operations. The total income tax benefit recognized in the consolidated statements of operations in connection with share-based compensation expense was approximately $6.2 million, $6.5 million and $6.4 million for the years ended December 31, 2016, 2015 and 2014, respectively.
Emergence from Chapter 11 Proceeding
On January 6, 2017, the Debtors substantially consummated the Restructuring Plan and emerged from the Chapter 11 Proceeding. As part of the transactions undertaken pursuant to the Restructuring Plan, all of the existing shares of the Predecessor common equity were canceled as of the Plan Effective Date. As a result, on the Plan Effective Date all equity based awards issued under the equity plans discussed above were canceled as part of the Restructuring Plan, and the equity plans discussed above were dissolved.
Note 9 – Related Party Transactions
The Company obtained support services from Nabors Corporate Services, Inc., on a transitional basis, for the processing of payroll, benefits and certain administrative services of the C&P business in normal course following the completion of the Nabors Merger. As of December 31, 2015, the Company’s payable balance was $28.2 million and the support service fees incurred during 2015 totaled $136.4 million. During 2016 and prior to the Confirmation Date, the Company, the Official Committee of Unsecured Creditors of CJ Holding Co, the Steering Committee of Lenders under the Credit Agreement and the DIP Facility, and Nabors entered into a mediated settlement agreement that was subsequently approved by the Bankruptcy Court whereby, among other things, Nabors was awarded two allowed proofs of claim totaling $13.25 million. As of December 31, 2016, the allowed proofs of claim are included in liabilities subject to compromise on the consolidated balance sheet.
The Company leases certain properties from Nabors, and Nabors leases certain properties from the Company. For the year ended December 31, 2016, the Company incurred obligations to Nabors of approximately $0.6 million under the leases, and Nabors incurred obligations to C&J of less than $0.1 million under the leases. The Company plans to continue the leasing arrangements with Nabors for the foreseeable future.
The Company provided certain services to Shehtah Nabors LP, a Nabors partnership with a third party, pursuant to a Management Agreement and a Cash Flow Sharing Agreement (collectively, “Shehtah Agreements”). Nabors incurred obligations to the Company of approximately $1.8 million under the Shehtah Agreements during 2016. There were no amounts due to the Company under the Shehtah Agreements at December 31, 2016.
The Company utilizes the services of certain saltwater disposal wells owned by Pyote Water Solutions, LLC, Pyote Water Systems, LLC, Pyote Water Systems II, LLC and Pyote Water Systems III, LLC (together “Pyote”) used in the disposal of certain fluids associated with oil and gas production. A former member of the Company's Board of Directors, who served from March 24, 2015 until December 16, 2016, holds the position of President and Chief Manager of Pyote and serves as Chairman of the Board of Governors of Pyote. Amounts invoiced from Pyote totaled approximately $0.8 million and $0.6 million for the years ended December 31, 2016 and 2015, respectively. Amounts payable to this vendor at December 31, 2016 and 2015 were less than $0.1 million for both years. In addition, the Company provides certain workover rig services, fluid hauling services and plug and abandonment services to Pyote. Revenues from Pyote totaled approximately $0.3 million for the year ended December 31, 2015, and no services were provided to Pyote during 2016. There were no amounts due to the Company from Pyote at December 31, 2016.
100
C&J ENERGY SERVICES LTD. (DEBTOR-IN-POSSESSION) AND SUBSIDIARIES
NOTES TO CONSOLIDATED FINANCIAL STATEMENTS
The Company obtains trucking and crane services from certain vendors affiliated with two of its executive officers. For the year ended December 31, 2014, purchases from these vendors totaled $7.4 million, and there were no purchases from these vendors for the years ended December 31, 2016 and 2015.
The Company purchased certain of its equipment from vendors affiliated with a member of its Board of Directors. For the years ended December 31, 2015, and 2014, purchases from these vendors totaled $1.9 million and $5.7 million, respectively. Amounts payable to these vendors at December 31, 2015 were less than $0.1 million. There were no purchases from these vendors for the year ended December 31, 2016.
The Company obtains office space, equipment rentals, tool repair services and other supplies from vendors affiliated with several employees. For the years ended December 31, 2016, 2015 and 2014, purchases from these vendors totaled $0.5 million, $0.5 million and $1.0 million, respectively. Amounts payable to these vendors at December 31, 2016 and 2015 were less than $0.1 million for each respective year.
The Company has an unconsolidated equity method investment with a vendor that provided the Company with raw material for its discontinued specialty chemical business. For the years ended December 31, 2016, 2015 and 2014, purchases from this vendor were $1.7 million, $11.8 million and $21.8 million, respectively. Amounts payable to this vendor at December 31, 2016 and 2015 were $2.1 million and $1.5 million, respectively.
The Company obtained drilling fluids from a vendor which was affiliated with one of its employees. For the year ended December 31, 2015, purchases from this vendor totaled $2.1 million. Amounts due to this vendor at December 31, 2015 were $0.2 million. There were no purchases from this vendor for the year ended December 31, 2016.
The Company obtains machined parts from a vendor which is affiliated with several of its employees. For the year ended December 31, 2014, purchases from this vendor totaled $0.4 million. There were no purchases from this vendor for the years ended December 31, 2016 and 2015.
Note 10 – Business Concentration
Concentration of Credit Risk
Financial instruments that potentially subject the Company to concentrations of credit risk consist primarily of cash and cash equivalents and accounts receivable. Concentrations of credit risk with respect to accounts receivable are limited because the Company performs credit evaluations, sets credit limits, and monitors the payment patterns of its customers. Cash balances on deposits with financial institutions, at times, may exceed federally insured limits. The Company regularly monitors the institutions’ financial condition.
The Company’s top ten customers accounted for approximately 46.0%, 53.6% and 51.1% of the Company’s consolidated revenue for the years ended December 31, 2016, 2015 and 2014, respectively. For the year ended December 31, 2016, no individual customer accounted for 10.0% or more of the Company's consolidated revenue. For the year ended December 31, 2015, revenue from one customer represented 15.5% of the Company’s consolidated revenue. For the year ended December 31, 2014 revenue from two customers individually represented 16.4% and 9.6% of the Company’s consolidated revenue. Other than those noted above, no other customer accounted for 10.0% or more of the Company’s consolidated revenue in 2016, 2015 or 2014. Revenue was earned from each of these customers within the Company’s Completion Services and Well Support Services segments.
Note 11 - Commitments and Contingencies
Environmental
The Company is subject to various federal, state and local environmental laws and regulations that establish standards and requirements for the protection of the environment. The Company continues to monitor the status of these laws and regulations. However, the Company cannot predict the future impact of such standards and requirements on its business, which are subject to change and can have retroactive effectiveness.
Currently, the Company has not been fined, cited or notified of any environmental violations or liabilities that would have a material adverse effect upon its consolidated financial position, liquidity or capital resources. However, management does recognize that by the very nature of its business, material costs could be incurred in the near term to maintain compliance. The amount of such future expenditures is not determinable due to several factors, including the unknown
101
C&J ENERGY SERVICES LTD. (DEBTOR-IN-POSSESSION) AND SUBSIDIARIES
NOTES TO CONSOLIDATED FINANCIAL STATEMENTS
magnitude of possible regulation or liabilities, the unknown timing and extent of the corrective actions which may be required, the determination of the Company’s liability in proportion to other responsible parties and the extent to which such expenditures are recoverable from insurance or indemnification.
Litigation
The Company is, and from time to time may be, involved in claims and litigation arising in the ordinary course of business. Because there are inherent uncertainties in the ultimate outcome of such matters, it is presently not possible to determine the ultimate outcome of any pending or potential claims or litigation against the Company; however, management believes that the outcome of those matters that are presently known to the Company will not have a material adverse effect on the Company’s consolidated financial position, results of operations or liquidity.
Contingent Consideration Liability
On May 18, 2015, the Company acquired all of the outstanding equity interests of ESP Completion Technologies LLC, a manufacturer of wellheads, artificial lift completion tools and electric submersible pumps for approximately $34.0 million and including a contingent consideration liability valued at approximately $14.4 million at the date of the acquisition. If the acquiree is able to achieve certain levels of EBITDA over a three-year period, the Company will be obligated to make future tiered payments of up to $29.5 million. The contingent consideration liability is remeasured on a fair value basis each quarter until it is paid or expires. As of December 31, 2016, the earn-out was estimated to have zero value.
Operating Leases
The Company leases certain property and equipment under non-cancelable operating leases. The remaining terms of the operating leases generally range from 1 to 11 years.
Lease expense under all operating leases totaled $10.0 million, $14.2 million and $14.0 million for the years ended December 31, 2016, 2015 and 2014, respectively. As of December 31, 2016, the future minimum lease payments under non-cancelable operating leases were as follows (in thousands):
Years Ending December 31, | ||||
2017 | $ | 6,934 | ||
2018 | 4,205 | |||
2019 | 3,189 | |||
2020 | 2,985 | |||
2021 | 2,836 | |||
Thereafter | 5,450 | |||
$ | 25,599 | |||
Note 12 – Employee Benefit Plans
The Company maintains a contributory profit sharing plan under a 401(k) arrangement which covers all employees meeting certain eligibility requirements. Eligible employees can make annual contributions to the plan up to the maximum amount allowed by current federal regulations, but no more than 80.0% of compensation as noted in the plan document. The Company’s 401(k) contributions for the years ended December 31, 2016, 2015 and 2014 totaled zero, $4.8 million and $2.3 million, respectively.
Note 13 – Mergers and Acquisitions
2015
Merger between Old C&J and the C&P Business of Nabors
On March 24, 2015, Old C&J and Nabors completed the combination of Old C&J with the C&P Business. The resulting combined company was renamed C&J Energy Services Ltd. At the closing of the combination, Nabors received total
102
C&J ENERGY SERVICES LTD. (DEBTOR-IN-POSSESSION) AND SUBSIDIARIES
NOTES TO CONSOLIDATED FINANCIAL STATEMENTS
consideration of $1.4 billion, subject to working capital adjustments, in the form of $688.1 million in cash, $5.5 million in cash to reimburse Nabors for operating assets acquired prior to March 24, 2015, and $714.8 million in C&J common shares. The C&J common share value was based upon Old C&J’s closing stock price on March 23, 2015 and consisted of approximately 62.5 million C&J common shares issued to Nabors and approximately 0.4 million designated C&J common shares attributable to replacement restricted share and share option awards issued to certain employees of the C&P Business for the pre-acquisition-related employee service period. Upon the closing of the combination and as of December 31, 2015, Nabors owned approximately 53.0% of the outstanding and issued common shares of Old C&J, with the remainder held by former Old C&J shareholders.
On September 25, 2015, C&J and Nabors agreed to a working capital adjustment of $43.4 million in favor of C&J, which was accounted for as a reduction to the purchase price of the C&P Business.
The Nabors Merger was accounted for using the acquisition method of accounting for business combinations. In applying the acquisition method of accounting, Old C&J and Nabors were required to determine both the accounting acquirer and the accounting acquiree with the accounting acquirer deemed to be the party possessing the controlling financial interest. Irrespective of Nabors 53.0% common share ownership in C&J immediately following the closing of the Nabors Merger, Old C&J and Nabors determined that Old C&J possessed the controlling financial interest, based on, among other factors, the presence of a majority of Old C&J directors on the C&J board of directors and through the composition of C&J senior management consisting almost entirely of the executive officers of Old C&J. Old C&J and Nabors therefore concluded the business combination should be treated as a reverse acquisition with Old C&J as the accounting acquirer.
C&J financed the cash portion of the Nabors Merger and repaid previously outstanding revolver debt with borrowings drawn under the Original Credit Agreement which provided for senior secured credit facilities in an aggregate principal amount of $1.66 billion. See Note 5 – Debt and Capital Lease Obligations for further discussion on the Company’s Original Credit Agreement.
The purchase price was allocated to the net assets acquired based upon their estimated fair values, as shown below (in thousands). The estimated fair values of certain assets and liabilities, including accounts receivable, inventory, property plant and equipment, other intangible assets, taxes (including uncertain tax positions), and contingencies required significant judgments and estimates.
All of the goodwill associated with the Nabors Merger was allocated to the Completion Services and Well Support Services reporting units. As part of the Company's interim test for goodwill impairment, during the third quarter of 2015, all of the goodwill allocated to the Completion Services reporting unit was written off. In addition, during the first quarter of 2016, all of the goodwill allocated to the Well Support Services reporting unit was written off. See Note 6 - Goodwill and Other Intangible Assets for further discussion.
The purchase price was initially allocated to the net assets acquired during the first quarter of 2015 and subsequently adjusted during 2015 and in the first quarter of 2016 in connection with the measurement period based upon revised estimated fair values, as follows (in thousands):
103
C&J ENERGY SERVICES LTD. (DEBTOR-IN-POSSESSION) AND SUBSIDIARIES
NOTES TO CONSOLIDATED FINANCIAL STATEMENTS
Amounts Recognized as of Merger Date | Measurement Period Adjustments (1) | Estimated Fair Value | ||||||||||
Accounts receivable | $ | 262,973 | $ | 11,079 | $ | 274,052 | ||||||
Inventory | 35,491 | (7,372 | ) | 28,119 | ||||||||
Other current assets | 8,857 | (1,940 | ) | 6,917 | ||||||||
Property, plant and equipment | 1,024,622 | (59,378 | ) | 965,244 | ||||||||
Goodwill | 444,162 | 12,684 | 456,846 | |||||||||
Other intangible assets | 28,300 | 13,700 | 42,000 | |||||||||
Other assets | 11,171 | (2,913 | ) | 8,258 | ||||||||
Total assets acquired | 1,815,576 | (34,140 | ) | 1,781,436 | ||||||||
Accounts payable | (195,913 | ) | 19,610 | (176,303 | ) | |||||||
Other current liabilities | (23,813 | ) | (7,503 | ) | (31,316 | ) | ||||||
Deferred income taxes | (187,515 | ) | (21,368 | ) | (208,883 | ) | ||||||
Total liabilities assumed | (407,241 | ) | (9,261 | ) | (416,502 | ) | ||||||
Net assets acquired | $ | 1,408,335 | $ | (43,401 | ) | $ | 1,364,934 | |||||
(1) The measurement period adjustments reflect changes in the estimated fair values of certain assets and liabilities, including income taxes. The measurement period adjustments were recorded to reflect new information obtained about facts and circumstances existing as of the date the Nabors Merger was consummated and did not result from intervening events subsequent to that date.
The fair value and gross contractual amount of accounts receivable acquired on March 24, 2015 was $274.1 million and $296.2 million, respectively. Based on the age of certain accounts receivable, a portion of the gross contractual amount was estimated to be uncollectible.
Property, plant and equipment assets acquired consist of the following fair values (in thousands) and ranges of estimated useful lives. As with fair value estimates, the determination of estimated useful lives requires judgments and assumptions.
Estimated Useful Lives | Estimated Fair Value | ||||
Land | Indefinite | $ | 42,741 | ||
Building and leasehold improvements | 2-25 | 79,456 | |||
Office furniture, fixtures and equipment | 2-5 | 2,845 | |||
Machinery & Equipment | 2-10 | 628,791 | |||
Transportation equipment | 2-5 | 166,457 | |||
Construction in progress | 44,954 | ||||
Property, plant and equipment | $ | 965,244 | |||
Other intangibles were assessed a fair value of $42.0 million with a weighted average amortization period of approximately 11 years. These intangible assets consist of developed technology of $19.6 million, amortizable over 5 – 15 years, customer relationships of $13.0 million, amortizable over 15 years, trade name of $8.5 million, amortizable over ten years, and non-compete agreements of $0.9 million, amortizable over five years. The amount allocated to goodwill represents the excess of the purchase price over the fair value of the net assets acquired. Goodwill was allocated between C&J’s Completion Services and Well Support Services reporting units on the basis of historical levels of EBITDA with $141.4 million allocated to Completion Services and $315.4 million allocated to Well Support Services. The goodwill recognized as a result of the Nabors Merger was primarily attributable to the expected increased economies of scale, capabilities, resources and geographic footprint of the combined company as well as the cost savings opportunities as C&J expected to capitalize on synergies from the new combined company. The tax deductible portion of goodwill and other intangibles is $60.8 million and $22.3 million, respectively.
104
C&J ENERGY SERVICES LTD. (DEBTOR-IN-POSSESSION) AND SUBSIDIARIES
NOTES TO CONSOLIDATED FINANCIAL STATEMENTS
The Company treated the Nabors Merger as a non-taxable transaction. Such treatment resulted in the acquired assets and liabilities having carryover basis for tax purposes. A deferred tax liability in the amount of $208.9 million was recorded to account for the differences between the preliminary purchase price allocation and carryover tax basis.
Acquisition-related costs associated with the Nabors Merger were expensed as incurred and totaled $42.7 million for the year ended December 31, 2015, and are included in selling, general and administrative expenses.
The results of operations for the C&P Business that have been included in C&J's consolidated financial statements from the March 24, 2015 acquisition date through December 31, 2015 include revenue of $822.2 million and a net loss of $211.1 million. The following unaudited pro forma results of operations have been prepared as though the Nabors Merger was completed on January 1, 2014. Pro forma amounts are based on the purchase price allocation of the acquisition and are not necessarily indicative of results that may be reported in the future (in thousands, except per share data):
Year Ended December 31, 2015 | Year Ended December 31, 2014 | |||||||
Revenues | $ | 2,114,671 | $ | 3,861,412 | ||||
Net loss | $ | (879,231 | ) | $ | (244,183 | ) | ||
Net loss per common share: | ||||||||
Basic | $ | (7.52 | ) | $ | (2.09 | ) | ||
Diluted | $ | (7.52 | ) | $ | (2.09 | ) | ||
Acquisition of Artificial Lift Provider
On May 18, 2015, the Company acquired all of the outstanding equity interests of ESP Completion Technologies LLC, a manufacturer of wellheads, artificial lift completion tools and electric submersible pumps ("Artificial Lift Provider") for approximately $34.0 million consisting of cash of approximately $13.6 million, a holdback of $6.0 million, and an earn-out valued at approximately $14.4 million on the acquisition date.
During the second quarter of 2016, C&J and the sellers agreed to a working capital adjustment of $0.5 million in favor of C&J, which was accounted for as a reduction to the purchase price of ESP Completion Technologies LLC. The adjusted purchase price of $33.5 million was allocated to the net assets acquired based upon their estimated fair values, as follows (in thousands):
Current assets | $ | 5,822 | ||
Property, plant and equipment | 2,529 | |||
Goodwill | 24,219 | |||
Other intangible assets | 5,173 | |||
Total assets acquired | 37,743 | |||
Current liabilities | (1,927 | ) | ||
Deferred income taxes | (2,067 | ) | ||
Other liabilities | (276 | ) | ||
Total liabilities assumed | (4,270 | ) | ||
Net assets acquired | $ | 33,473 | ||
If Artificial Lift Provider is able to achieve certain levels of EBITDA over a three-year period, the Company will be obligated to make future tiered payments of up to $29.5 million. This could result in a maximum total purchase price of $49.1 million. The potential payment is considered contingent consideration. At the acquisition date, the fair value of this earn-out was determined using a Monte Carlo simulation model over many simulated possible future outcomes which yielded a value of $14.4 million. The earn-out has been remeasured on a fair value basis each quarter and will continue to be remeasured each quarter until the contingent consideration is paid or expires. As of December 31, 2016, the earn-out was estimated to have zero value.
2014
105
C&J ENERGY SERVICES LTD. (DEBTOR-IN-POSSESSION) AND SUBSIDIARIES
NOTES TO CONSOLIDATED FINANCIAL STATEMENTS
Acquisition of Tiger
On May 30, 2014, the Company acquired all of the outstanding equity interests of Tiger for approximately $33.2 million, including working capital adjustments.
Tiger provides cased-hole wireline, logging, perforating, pipe recovery and tubing-conveyed perforating services. The acquisition of Tiger increased the Company’s existing wireline capabilities and provides a presence on the U.S. West Coast. The results of Tiger’s operations since the date of the acquisition have been included in the Company’s consolidated financial statements and are reflected in the Completion Services segment in Note 14 – Segment Information.
The purchase price was allocated to the net assets acquired based upon their estimated fair values, as follows (in thousands):
Current assets | $ | 3,851 | ||
Property and equipment | 8,176 | |||
Goodwill | 14,671 | |||
Other intangible assets | 17,340 | |||
Total assets acquired | $ | 44,038 | ||
Current liabilities | $ | 1,223 | ||
Deferred income taxes | 8,556 | |||
Other liabilities | 1,015 | |||
Total liabilities assumed | $ | 10,794 | ||
Net assets acquired | $ | 33,244 | ||
Note 14 - Segment Information
In accordance with Accounting Standards Codification No. 280 - Segment Reporting the Company routinely evaluates whether its separate operating and reportable segments have changed. This determination is made based on the following factors: (1) the Company’s chief operating decision maker (“CODM”) is currently managing each operating segment as a separate business and evaluating the performance of each segment and making resource allocation decisions distinctly and expects to do so for the foreseeable future, and (2) discrete financial information for each operating segment is available.
The Company’s reportable segments are: (i) Completion Services, (ii) Well Support Services and (iii) Other Services. This segment structure reflects the financial information and reports used by the Company’s management, including its CODM, to make decisions regarding the Company’s business, including performance evaluation and resource allocation decisions. The Company revised its reportable segments during the first quarter of 2015 in connection with the Nabors Merger. As a result of the revised reportable segment structure, the Company has restated the corresponding items of segment information for the 2014 year. The following is a brief description of the Company's three reportable segments:
Completion Services
Completion Services consists of the following service lines: (1) hydraulic fracturing; (2) Casedhole Solutions, which includes cased-hole wireline, pumpdown services, wireline logging, perforating, pressure pumping, well site make-up and pressure testing and other complementary services; (3) well construction services, specifically cementing and directional drilling services; and (4) R&T, which is primarily engaged in the engineering and production of certain parts and components, such as perforating guns and addressable switches, which are used in the completion process.
Well Support Services
Well Support Services consists of the following service lines: (1) rig services, including workover and other support services primarily used for repair and maintenance of oil and gas wells, re-drilling operations and plugging and abandonment operations; (2) fluids management services, which provides storage, transportation and disposal services for produced fluids and fluids used in the drilling, completion and workover of oil and gas wells; (3) coiled tubing services, primarily used for frac plug drill-out during completion operations and for well workover and routine maintenance; (4) artificial lift; and (5) other specialty well site services.
106
C&J ENERGY SERVICES LTD. (DEBTOR-IN-POSSESSION) AND SUBSIDIARIES
NOTES TO CONSOLIDATED FINANCIAL STATEMENTS
Other Services
Other Services consists of smaller, non-core business lines that have either been divested, or are in the process of being divested, including the specialty chemical business (divested in 2016), equipment manufacturing and repair business (in the process of being divested) and the Company's international coiled tubing operations in the Middle East (operations ceased in 2016).
The following tables set forth certain financial information with respect to the Company’s reportable segments.
Completion Services | Well Support Services | Other Services | Corporate / Elimination | Total | ||||||||||||||||
Year Ended December 31, 2016 | ||||||||||||||||||||
Revenue from external customers | $ | 543,958 | $ | 419,597 | $ | 7,587 | $ | — | $ | 971,142 | ||||||||||
Inter-segment revenues | 1,049 | 224 | 29,115 | (30,388 | ) | — | ||||||||||||||
Depreciation and amortization | 131,237 | 84,105 | 2,307 | (209 | ) | 217,440 | ||||||||||||||
Operating loss | (253,513 | ) | (430,808 | ) | (51,778 | ) | (133,909 | ) | (870,008 | ) | ||||||||||
Net loss | (253,845 | ) | (426,716 | ) | (58,757 | ) | (204,971 | ) | (944,289 | ) | ||||||||||
Adjusted EBITDA | (39,628 | ) | 17,460 | (5,777 | ) | (66,897 | ) | (94,842 | ) | |||||||||||
Capital expenditures | 15,622 | 16,295 | 8,451 | 17,541 | 57,909 | |||||||||||||||
As of December 31, 2016 | ||||||||||||||||||||
Total assets | $ | 692,437 | $ | 557,292 | $ | 52,978 | $ | 58,894 | $ | 1,361,601 | ||||||||||
Goodwill | — | — | — | — | — | |||||||||||||||
Year Ended December 31, 2015 | ||||||||||||||||||||
Revenue from external customers | $ | 1,138,521 | $ | 582,142 | $ | 28,226 | $ | — | $ | 1,748,889 | ||||||||||
Inter-segment revenues | 4,276 | 226 | 150,754 | (155,256 | ) | — | ||||||||||||||
Depreciation and amortization | 170,452 | 100,858 | 5,159 | (116 | ) | 276,353 | ||||||||||||||
Operating loss | (754,874 | ) | (159,165 | ) | (69,129 | ) | (115,154 | ) | (1,098,322 | ) | ||||||||||
Net income (loss) | (755,704 | ) | (163,103 | ) | (68,584 | ) | 114,849 | (872,542 | ) | |||||||||||
Adjusted EBITDA | 39,851 | 79,966 | (1,327 | ) | (71,734 | ) | 46,756 | |||||||||||||
Capital expenditures | 79,211 | 55,612 | 30,444 | 1,054 | 166,321 | |||||||||||||||
As of December 31, 2015 | ||||||||||||||||||||
Total assets | $ | 968,438 | $ | 1,045,223 | $ | 124,328 | $ | 60,963 | $ | 2,198,952 | ||||||||||
Goodwill | — | 307,677 | — | — | 307,677 | |||||||||||||||
Year Ended December 31, 2014 | ||||||||||||||||||||
Revenue from external customers | $ | 1,400,133 | $ | 188,256 | $ | 19,555 | $ | — | $ | 1,607,944 | ||||||||||
Inter-segment revenues | 366 | 122 | 228,162 | (228,650 | ) | — | ||||||||||||||
Depreciation and amortization | 86,514 | 18,184 | 3,796 | (349 | ) | 108,145 | ||||||||||||||
Operating income (loss) | 187,615 | 28,471 | 16,579 | (108,921 | ) | 123,744 | ||||||||||||||
Net income (loss) | 187,536 | 28,471 | 16,029 | (163,213 | ) | 68,823 | ||||||||||||||
Adjusted EBITDA | 274,113 | 46,689 | 20,375 | (88,231 | ) | 252,946 | ||||||||||||||
Capital expenditures | 254,455 | 57,817 | 9,240 | (13,914 | ) | 307,598 | ||||||||||||||
As of December 31, 2014 | ||||||||||||||||||||
Total assets | $ | 1,218,005 | $ | 209,490 | $ | 186,908 | $ | (1,657 | ) | $ | 1,612,746 | |||||||||
Goodwill | 200,149 | 15,085 | 4,719 | — | 219,953 | |||||||||||||||
Management evaluates reportable segment performance and allocates resources based on total earnings (loss) before net interest expense, income taxes, depreciation and amortization, other income (expense), net gain or loss on disposal
107
C&J ENERGY SERVICES LTD. (DEBTOR-IN-POSSESSION) AND SUBSIDIARIES
NOTES TO CONSOLIDATED FINANCIAL STATEMENTS
of assets, acquisition-related costs, and non-routine items (“Adjusted EBITDA”), because Adjusted EBITDA is considered an important measure of each reportable segment’s performance. In addition, management believes that the disclosure of Adjusted EBITDA as a measure of each reportable segment’s operating performance allows investors to make a direct comparison to competitors, without regard to differences in capital and financing structure. Investors should be aware, however, that there are limitations inherent in using Adjusted EBITDA as a measure of overall profitability because it excludes significant expense items. An improving trend in Adjusted EBITDA may not be indicative of an improvement in the Company’s profitability. To compensate for the limitations in utilizing Adjusted EBITDA as an operating measure, management also uses U.S. GAAP measures of performance, including operating income (loss) and net income (loss), to evaluate performance, but only with respect to the Company as a whole and not on a reportable segment basis.
As required under Item 10(e) of Regulation S-K of the Securities Exchange Act of 1934, as amended, included below is a reconciliation of Adjusted EBITDA, a non-GAAP financial measure, to net income (loss), which is the nearest comparable U.S. GAAP financial measure (in thousands) on a consolidated basis for the years ended December 31, 2016, 2015 and 2014, and on a reportable segment basis for the years ended December 31, 2016, 2015 and 2014.
Years Ended December 31, | ||||||||||||
2016 | 2015 | 2014 | ||||||||||
Net income (loss) | $ | (944,289 | ) | $ | (872,542 | ) | $ | 68,823 | ||||
Interest expense, net | 157,465 | 82,086 | 9,840 | |||||||||
Income tax (benefit) expense | (129,010 | ) | (299,093 | ) | 45,679 | |||||||
Depreciation and amortization | 217,440 | 276,353 | 108,145 | |||||||||
Other (income) expense, net | (9,504 | ) | (8,773 | ) | (598 | ) | ||||||
(Gain) loss on disposal of assets | 3,075 | (544 | ) | (17 | ) | |||||||
Impairment expense | 436,395 | 791,807 | — | |||||||||
Immaterial accounts payable accrual correction | — | (13,190 | ) | — | ||||||||
Acquisition-related costs | 10,534 | 42,662 | 20,159 | |||||||||
Severance, facility closures and other | 31,498 | 5,849 | 35 | |||||||||
Customer settlement/bad debt write-off | 1,113 | 7,997 | — | |||||||||
Incremental insurance reserve | — | 3,035 | — | |||||||||
Insurance settlement | — | — | 880 | |||||||||
Debt restructuring costs | 30,401 | — | — | |||||||||
Reorganization costs | 55,330 | — | — | |||||||||
Inventory write-down | 35,350 | 31,109 | — | |||||||||
Legal settlements | 1,020 | — | — | |||||||||
Share-based compensation expense acceleration | 7,792 | — | — | |||||||||
Insurance reserve true-up | 548 | — | — | |||||||||
Adjusted EBITDA | $ | (94,842 | ) | $ | 46,756 | $ | 252,946 | |||||
108
C&J ENERGY SERVICES LTD. (DEBTOR-IN-POSSESSION) AND SUBSIDIARIES
NOTES TO CONSOLIDATED FINANCIAL STATEMENTS
Year Ended December 31, 2016 | ||||||||||||||||||||
Completion Services | Well Support Services | Other Services | Corporate / Elimination | Total | ||||||||||||||||
Net loss | $ | (253,845 | ) | $ | (426,716 | ) | $ | (58,757 | ) | $ | (204,971 | ) | $ | (944,289 | ) | |||||
Interest expense, net | 706 | (145 | ) | — | 156,904 | 157,465 | ||||||||||||||
Income tax benefit | — | — | — | (129,010 | ) | (129,010 | ) | |||||||||||||
Depreciation and amortization | 131,237 | 84,105 | 2,307 | (209 | ) | 217,440 | ||||||||||||||
Impairment expense | 69,822 | 357,817 | 8,756 | — | 436,395 | |||||||||||||||
Debt restructuring costs | — | — | — | 30,401 | 30,401 | |||||||||||||||
Reorganization costs | — | — | — | 55,330 | 55,330 | |||||||||||||||
Other (income) expense, net | (374 | ) | (3,947 | ) | 6,979 | (12,162 | ) | (9,504 | ) | |||||||||||
(Gain) loss on disposal of assets | (769 | ) | (4,192 | ) | 3,060 | 4,976 | 3,075 | |||||||||||||
Severance, facility closures and other | 7,601 | 3,978 | 7,558 | 12,361 | 31,498 | |||||||||||||||
Acquisition-related costs | 202 | — | 209 | 10,123 | 10,534 | |||||||||||||||
Share-based compensation expense acceleration | — | — | — | 7,792 | 7,792 | |||||||||||||||
Customer settlement/bad debt write-off | 375 | 738 | — | — | 1,113 | |||||||||||||||
Legal settlements | — | — | — | 1,020 | 1,020 | |||||||||||||||
Insurance reserve true-up | — | — | — | 548 | 548 | |||||||||||||||
Inventory write-down | 5,417 | 5,822 | 24,111 | — | 35,350 | |||||||||||||||
Adjusted EBITDA | $ | (39,628 | ) | $ | 17,460 | $ | (5,777 | ) | $ | (66,897 | ) | $ | (94,842 | ) | ||||||
Year Ended December 31, 2015 | ||||||||||||||||||||
Completion Services | Well Support Services | Other Services | Corporate / Elimination | Total | ||||||||||||||||
Net income (loss) | $ | (755,704 | ) | $ | (163,103 | ) | $ | (68,584 | ) | $ | 114,849 | $ | (872,542 | ) | ||||||
Interest expense, net | 358 | (41 | ) | — | 81,769 | 82,086 | ||||||||||||||
Income tax benefit | — | — | — | (299,093 | ) | (299,093 | ) | |||||||||||||
Depreciation and amortization | 170,452 | 100,858 | 5,159 | (116 | ) | 276,353 | ||||||||||||||
Impairment expense | 617,047 | 134,331 | 40,429 | — | 791,807 | |||||||||||||||
Other (income) expense, net | 472 | 3,979 | (545 | ) | (12,679 | ) | (8,773 | ) | ||||||||||||
(Gain) loss on disposal of assets | 287 | (899 | ) | 19 | 49 | (544 | ) | |||||||||||||
Acquisition-related costs | — | — | 46 | 42,616 | 42,662 | |||||||||||||||
Severance, facility closures and other | 2,303 | 2,248 | 608 | 690 | 5,849 | |||||||||||||||
Inventory write-downs | 8,620 | 1,153 | 21,336 | — | 31,109 | |||||||||||||||
Customer settlement/bad debt write-off | 4,269 | 3,728 | — | — | 7,997 | |||||||||||||||
Immaterial accounts payable accrual correction | (10,552 | ) | (2,638 | ) | — | — | (13,190 | ) | ||||||||||||
Incremental insurance reserve | 2,299 | 350 | 205 | 181 | 3,035 | |||||||||||||||
Adjusted EBITDA | $ | 39,851 | $ | 79,966 | $ | (1,327 | ) | $ | (71,734 | ) | $ | 46,756 | ||||||||
109
C&J ENERGY SERVICES LTD. (DEBTOR-IN-POSSESSION) AND SUBSIDIARIES
NOTES TO CONSOLIDATED FINANCIAL STATEMENTS
Year Ended December 31, 2014 | ||||||||||||||||||||
Completion Services | Well Support Services | Other Services | Corporate / Elimination | Total | ||||||||||||||||
Net income (loss) | $ | 187,536 | $ | 28,471 | $ | 16,029 | $ | (163,213 | ) | $ | 68,823 | |||||||||
Interest expense, net | 463 | — | — | 9,377 | 9,840 | |||||||||||||||
Income tax expense | — | — | — | 45,679 | 45,679 | |||||||||||||||
Depreciation and amortization | 86,514 | 18,184 | 3,796 | (349 | ) | 108,145 | ||||||||||||||
Other (income) expense, net | (384 | ) | — | 550 | (764 | ) | (598 | ) | ||||||||||||
(Gain) loss on disposal of assets | (51 | ) | 34 | — | — | (17 | ) | |||||||||||||
Acquisition-related costs | — | — | — | 20,159 | 20,159 | |||||||||||||||
Severance, facility closures and other | 35 | — | — | — | 35 | |||||||||||||||
Insurance settlement | — | — | — | 880 | 880 | |||||||||||||||
Adjusted EBITDA | $ | 274,113 | $ | 46,689 | $ | 20,375 | $ | (88,231 | ) | $ | 252,946 | |||||||||
Note 15 – Quarterly Financial Data (unaudited)
Summarized quarterly financial data for the years ended December 31, 2016 and 2015 are presented below (in thousands, except per share amounts).
Quarters Ended | ||||||||||||||||
March 31, 2016 | June 30, 2016 | September 30, 2016 | December 31, 2016 | |||||||||||||
Revenue | $ | 269,615 | $ | 225,168 | $ | 232,537 | $ | 243,822 | ||||||||
Operating loss | (500,416 | ) | (182,437 | ) | (85,553 | ) | (101,602 | ) | ||||||||
Loss before reorganization items and income taxes | (522,560 | ) | (302,368 | ) | (86,636 | ) | (106,405 | ) | ||||||||
Net loss | (428,412 | ) | (291,116 | ) | (106,390 | ) | (118,371 | ) | ||||||||
Net loss per common share: | ||||||||||||||||
Basic | $ | (3.65 | ) | $ | (2.46 | ) | $ | (0.90 | ) | $ | (1.00 | ) | ||||
Diluted | $ | (3.65 | ) | $ | (2.46 | ) | $ | (0.90 | ) | $ | (1.00 | ) | ||||
Quarters Ended | ||||||||||||||||
March 31, 2015 | June 30, 2015 | September 30, 2015 | December 31, 2015 | |||||||||||||
Revenue | $ | 401,216 | $ | 511,165 | $ | 427,497 | $ | 409,011 | ||||||||
Operating loss | (30,202 | ) | (77,350 | ) | (493,338 | ) | (497,432 | ) | ||||||||
Loss before income taxes | (35,556 | ) | (99,477 | ) | (524,378 | ) | (512,224 | ) | ||||||||
Net loss | (30,663 | ) | (65,121 | ) | (455,016 | ) | (321,742 | ) | ||||||||
Net loss per common share: | ||||||||||||||||
Basic | $ | (0.51 | ) | $ | (0.56 | ) | $ | (3.89 | ) | $ | (2.75 | ) | ||||
Diluted | $ | (0.51 | ) | $ | (0.56 | ) | $ | (3.89 | ) | $ | (2.75 | ) | ||||
Note 16 - Supplemental Cash Flow Disclosures
Listed below are supplemental cash flow disclosures for the year ended December 31, 2016, 2015 and 2014:
110
C&J ENERGY SERVICES LTD. (DEBTOR-IN-POSSESSION) AND SUBSIDIARIES
NOTES TO CONSOLIDATED FINANCIAL STATEMENTS
Years Ended December 31, | ||||||||||||
2016 | 2015 | 2014 | ||||||||||
Cash paid for interest | $ | 19,153 | $ | 64,950 | $ | 8,525 | ||||||
Cash paid for (refunded from) income taxes | $ | (14,943 | ) | $ | (13,815 | ) | $ | 16,125 | ||||
Cash paid for reorganization items | $ | 24,719 | $ | — | $ | — | ||||||
Non-cash investing and financing activity: | ||||||||||||
Capital lease obligations | $ | — | $ | — | $ | 25,847 | ||||||
Change in accrued capital expenditures | $ | (3,182 | ) | $ | (42,793 | ) | $ | 8,120 | ||||
Non-cash consideration for business acquisition | $ | — | $ | 735,125 | $ | — | ||||||
Note 17 – Subsequent Events
Emergence from Chapter 11 Proceeding
On January 6, 2017, the Predecessor substantially consummated the Restructuring Plan and emerged from the Chapter 11 Proceeding. See Note 2 - Chapter 11 Proceeding and Emergence for additional information regarding confirmation of the Restructuring Plan and emergence from the Chapter 11 bankruptcy.
New Credit Facility
On January 6, 2017, in connection with the emergence from bankruptcy, the Company entered into the New Credit Facility with PNC Bank, National Association. See Note 5 - Debt and Capital Lease Obligations for additional information about the New Credit Facility.
Warrant Agreement
On the Plan Effective Date, by operation of the Restructuring Plan, the Company entered into a warrant agreement (the “Warrant Agreement”) with American Stock Transfer & Trust Company, LLC, which provides for the Company’s issuance of up to 1,180,083 New Warrants to former holders of common equity interests in the Predecessor on the Plan Effective Date and up to 2,360,166 New Warrants to the Debtors' general unsecured creditors after the Plan Effective Date.
The New Warrants are exercisable from the date of issuance, or the Plan Effective Date, until 5:00 p.m., New York City time, on January 6, 2024. The New Warrants are initially exercisable for one share of the Company’s common stock, par value $0.01 per share, per New Warrant at an initial exercise price of $27.95 per New Warrant (the “Exercise Price”).
Cancellation of indebtedness
In accordance with the Restructuring Plan, on the Plan Effective Date, the obligations of the Predecessor with respect to the Original Credit Agreement indebtedness were canceled and discharged (collectively, the “Old C&J Debt”). The obligations of the Predecessor under the Old C&J Debt were canceled in exchange for 39,999,997 shares of common stock issued to certain holders of claims arising under the Original Credit Agreement.
Issuance of New Common Stock
On the Plan Effective Date, pursuant to the terms of the Restructuring Plan, the Successor issued an aggregate of 55,463,903 shares of its common stock to the Holders of Allowed Secured Lender Claims (as defined in the Restructuring Plan), including 15,463,906 shares of common stock issued in connection with the Rights Offering.
Management Incentive Plan
In accordance with the terms of the Restructuring Plan, effective January 6, 2017, a total of 8,046,021 shares of common stock were authorized, approved and reserved for future issuance under that certain 2017 C&J Energy Services, Inc. Management Incentive Plan (the "MIP"). On January 31, 2017, the board of directors (the "Board") of the Company and the Compensation Committee of the Board approved grants of 12,603 shares of restricted stock under the MIP to the Company’s non-employee directors. The awards granted to the non-employee directors shall vest in full on the first anniversary of the date of grant, subject to each director’s continued service.
111
C&J ENERGY SERVICES LTD. (DEBTOR-IN-POSSESSION) AND SUBSIDIARIES
NOTES TO CONSOLIDATED FINANCIAL STATEMENTS
On February 5, 2017, the Board approved grants of restricted stock and nonqualified stock options under the MIP to certain of the Company’s executive officers totaling 369,246 shares of restricted stock and 255,570 nonqualified stock options. The awards granted to the executive officers effective as of February 5, 2017, shall vest according to the following schedule: (i) 34% vests immediately on the date of grant, (ii) 22% vests on the first anniversary of the date of grant, (iii) 22% vests on the second anniversary of the date of grant and (iv) 22% vests on the third anniversary of the date of grant, in each case, subject to each executive officer’s continued employment.
Effective as of February 5, 2017, 482,281 shares of restricted stock were granted under the MIP to certain of the Company's non-executive employees. These awards granted to the non-executive employees shall vest according to the following schedule: (i) 34% vests immediately on the date of grant, (ii) 22% vests on the first anniversary of the date of grant, (iii) 22% vests on the second anniversary of the date of grant and (iv) 22% vests on the third anniversary of the date of grant, in each case, subject to each non-executive employees' continued employment.
112
Item 9. Changes in and Disagreements With Accountants on Accounting and Financial Disclosure
None.
Item 9A. Controls and Procedures
Evaluation of Disclosure Controls and Procedures. As required by Rule 13a-15(b) under the Exchange Act, the Company has evaluated, under the supervision and with the participation of its management, including its principal executive officer and principal financial officer, the effectiveness of the design and operation of our disclosure controls and procedures (as defined in Rules 13a-15(e) and 15d-15(e) under the Exchange Act) and internal control over financial reporting (as defined in Rules 13a-15(f) and 15d-15(f) under the Exchange Act) as of the end of the period covered by this Annual Report. The Company’s disclosure controls and procedures are designed to provide reasonable assurance that information required to be disclosed by the Company in reports that it files under the Exchange Act is accumulated and communicated to its management, including its principal executive officer and principal financial officer, as appropriate, to allow timely decisions regarding required disclosure and is recorded, processed, summarized and reported within the time periods specified in the rules and forms of the SEC. Based upon that evaluation, the Company’s principal executive officer and principal financial officer concluded that its disclosure controls and procedures were effective as of December 31, 2016.
Management’s Report Regarding Internal Control. Management is responsible for establishing and maintaining adequate internal control over financial reporting. The Company’s internal control over financial reporting is a process designed under the supervision of its Chief Executive Officer and Chief Financial Officer to provide reasonable assurance regarding the reliability of financial reporting and the preparation of the Company’s financial statements for external purposes in accordance with generally accepted accounting principles. As of December 31, 2016, management, including the Company’s Chief Executive Officer and Chief Financial Officer, assessed the effectiveness of its internal control over financial reporting. Based on their assessment, management determined that the Company maintained effective internal control over financial reporting as of December 31, 2016. Because of its inherent limitations, internal control over financial reporting may not prevent or detect misstatements. Also, projections of any evaluation of effectiveness to future periods are subject to the risk that controls may become inadequate because of changes in conditions, or that the degree of compliance with the policies or procedures may deteriorate. Management’s report on internal control over financial reporting is included in Part II, Item 8 “Financial Statements and Supplementary Data” of this Annual Report.
Changes in Internal Controls over Financial Reporting. There have been no changes in our system of internal control over financial reporting (as such term is defined in Rules 13a-15(f) and 15d-15(f) under the Exchange Act) during the quarter ended December 31, 2016 that have materially affected, or are reasonably likely to materially affect, the Company’s internal control over financial reporting.
Item 9B. Other Information
On February 27, 2017, the parties to the Stockholders Agreement entered into an amendment to the Stockholders Agreement (“Stockholders Agreement Amendment No. 1”) to revise the provision regarding termination of the agreement. As amended, the Stockholders Agreement will terminate automatically (i) immediately prior to the earlier of (A) our common stock being listed on the NASDAQ Global Market, the NASDAQ Global Select Market or the New York Stock Exchange or (B) the closing of a firmly underwritten Public Offering (as defined therein), or (ii) upon the occurrence of both (A) each of GSO and Solus holding less than 5% of the outstanding common stock and (B) all Holders collectively holding less than 20% of the outstanding common stock.
The foregoing description does not purport to be complete and is qualified in its entirety by reference to the full text of the Stockholders Agreement Amendment No. 1, a copy of which is filed as Exhibit 4.4 to this Annual Report and incorporated by reference herein.
113
PART III
Item 10. Directors, Executive Officers and Corporate Governance
Information About Our Directors and Executive Officers
At and immediately prior to January 6, 2017, the Plan Effective Date of our Restructuring Plan, our Board was comprised of the following individuals: the Company’s Chief Executive Officer, Donald Gawick, Jay Golding, William Restrepo, Michael Roemer, James Trimble and H.H. “Tripp” Wommack III. Both Mr. Gawick and Mr. Roemer remained a member of Board following the Plan Effective Date and continue to currently serve. During the 2016 fiscal year, the following persons also served on the Board: Joshua Comstock, the Company’s founder and prior Chief Executive Officer, through March 2016; Randall McMullen, Jr., the Company’s prior Chief Executive Officer (immediately subsequent to Mr. Comstock), President and Chief Financial Officer, through June 2016; and Sheldon Erikson, through May 2016. Additional information concerning our former board members is included in our definitive proxy statement for our 2016 Annual Meeting of Shareholders.
As of the Plan Effective Date, by operation of the Restructuring Plan and pursuant to the Company’s Certificate of Incorporation and Bylaws, as well as the Stockholders Agreement, the Board consists of seven members divided into three classes. The Company’s Bylaws provide that the Company’s Chief Executive Officer will serve on the Board, and the Stockholders Agreement provides that certain funds affiliated with and/or managed by certain of our largest stockholders have the right to designate nominees to serve on the Board as directors, subject in each case to maintaining certain levels of share ownership; specifically, (a) GSO may designate for nomination up to three directors to the Board and (b) Solus may designate for nomination up to two directors to the Board, as well as designating one non-voting observer to the Board. In addition, the Stockholders Agreement provides that the Board or a nominating committee thereof shall designate the Company’s Chief Executive Officer and one other director for nomination to the Board.
As of the Plan Effective Date and continuing to date, the Company’s directors and executive officers are as set forth in the following table, including their names, ages, titles and director classification.
Name | Age | Position at The Registrant |
Donald Gawick | 59 | President and Chief Executive Officer and Director Class III |
E. Michael Hobbs | 54 | Chief Operating Officer |
Mark Cashiola | 41 | Chief Financial Officer |
Danielle Hunter | 34 | Executive Vice President, General Counsel, Chief Risk & Compliance Officer and Corporate Secretary |
Patrick Bixenman | 54 | Chief Administrative Officer and President, Research & Technology |
Edward Keppler | 52 | President, Corporate Operational Development |
Timothy Wallace | 55 | President, Completion Services |
Nicholas Petronio | 70 | President, Well Services |
Patrick Murray(1) | 74 | Chairman of the Board, Director Class III |
Stuart Brightman(1) | 60 | Director Class I |
Michael Zawadzki(2) | 36 | Director Class I |
John Kennedy(2) | 64 | Director Class II |
Michael Roemer | 58 | Director Class II |
Steven Mueller(2) | 63 | Director Class III |
(1) Messrs. Brightman and Murray were designated for nomination to the Board by Solus pursuant to the Stockholders Agreement.
(2) Messrs. Zawadzki, Kennedy and Mueller were designated for nomination to the Board by GSO pursuant to the Stockholders Agreement.
Directors. Biographical information for each director of the Company is set forth below.
Donald Gawick. Mr. Gawick has served as a member of our Board since July 2016. He also currently serves as our President and Chief Executive Officer, a position he was appointed to in June 2016, having previously served as our Chief
114
Operating Officer. Mr. Gawick was President and Chief Executive Officer of C&J’s wireline business, Casedhole Solutions, Inc. (“Casedhole Solutions”), from March 2010 through June 2012, when C&J acquired Casedhole Solutions. Mr. Gawick continued in his role of President of Casedhole Solutions until his promotion to Chief Operating Officer in October 2012. Mr. Gawick started his oilfield career in 1979 with Schlumberger and between 1979 and March 2010, he held numerous management positions with Schlumberger, focusing on operations and marketing, including oversight of all of Schlumberger’s oilfield business segments. In addition, he has held senior leadership positions in oilfield services in sales business and new technology development, service delivery and Health-Safety-Environmental management, with assignments throughout the United States, as well as in Canada, Europe, the Far East and Latin America. Mr. Gawick holds a Bachelor of Science degree in Electrical Engineering from the University of Manitoba.
Stuart Brightman. Mr. Brightman joined our Board in January 2017, effective upon emergence from the Chapter 11 Proceeding in accordance with the Restructuring Plan. Mr. Brightman has served as President and Chief Executive Officer of Tetra Technologies, Inc. (“Tetra”) since May 2009, at which time he was also appointed to serve on its board of directors. He served as Executive Vice President and Chief Operating Officer of Tetra from April 2005 to May 2009. Mr. Brightman also serves as chairman of the board of directors of Tetra’s CSI Compressco GP Inc. subsidiary, the general partner of CSI Compressco LP, one of Tetra’s consolidated subsidiaries and a publicly traded limited partnership subject to the reporting requirements of the Exchange Act. From April 2004 to April 2005, Mr. Brightman was self-employed. Mr. Brightman served as president of the Dresser Flow Control division of Dresser, Inc. from April 2002 until April 2004. Dresser Flow Control, which manufactures and sells valves, actuators, and other equipment and provides related technology and services for the oil and gas industry, had revenues in excess of $400 million in 2004. From November 1998 to April 2002, Mr. Brightman was president of the Americas Operation of the Dresser Valve Division of Dresser, Inc. He served in other capacities during the earlier portion of his career with Dresser, from 1993 to 1998. From 1982 to 1993, Mr. Brightman served in several financial and operational positions with Cameron Iron Works and its successor, Cooper Oil Tools. Mr. Brightman holds a Bachelor of Science degree from the University of Pennsylvania and a Master of Business Administration degree from the Wharton School of Business.
Michael Roemer. Mr. Roemer has served as a member of our Board since December 2010, and was reappointed to the Board of the reorganized Company in January 2017 effective upon emergence from the Chapter 11 Proceeding in accordance with the Restructuring Plan. Mr. Roemer previously served as the Chief Financial Officer of Hammond, Kennedy, Whitney & Company, Inc. ("HKW"), a private equity group, and as a partner in several affiliate funds of HKW from 2000 until January 2012. Upon his retirement from HKW, Mr. Roemer founded Roemer Financial Consulting, through which he provides financial accounting advice. Prior to joining HKW, Mr. Roemer served as a shareholder and Vice President of Flackman, Goodman & Potter, P.A., a public accounting firm, from 1988 to 2000. Mr. Roemer is a licensed Certified Public Accountant with over 35 years’ experience, and is a member of the American Institute of Certified Public Accountants and the New Jersey Society of Certified Public Accountants. Mr. Roemer holds a Bachelor of Science degree in Accounting from the University of Rhode Island.
Michael Zawadzki. Mr. Zawadzki joined our Board in January 2017, effective upon emergence from the Chapter 11 Proceeding in accordance with the Restructuring Plan. Mr. Zawadzki is a Senior Managing Director with GSO Capital Partners, focused principally on the sourcing, execution, and management of investments in the energy sector. Mr. Zawadzki is a senior member of GSO’s energy team and sits on the investment committees for GSO’s energy funds. Since joining GSO in July 2006, Mr. Zawadzki has led or played a critical role in transactions totaling over $3 billion of invested capital. Prior to joining GSO, from 2004 to 2006, Mr. Zawadzki was with Citigroup Private Equity, where he completed numerous private equity and subordinated debt investments. From 2002 to 2004, Mr. Zawadzki worked in the investment banking division of Salomon Smith Barney, focused on the media and telecommunications industries. Mr. Zawadzki currently serves on the board of directors of Titan Energy (since October 2016), Sequel Energy Group (since November 2016), 3Bear Energy (since September 2016), and Community Development Capital Group (since November 2013). Mr. Zawadzki received a Bachelor of Science in Economics from the Wharton School of the University of Pennsylvania, where he graduated magna cum laude.
John Kennedy. Mr. Kennedy joined our Board in January 2017, effective upon emergence from the Chapter 11 Proceeding in accordance with the Restructuring Plan. Mr. Kennedy was President and Chief Executive Officer of Wilson International, a wholly-owned business unit of Smith International from 1999 to 2010 and of Schlumberger from August 2010 to May 2012. He joined Wilson International after having previously served as Senior Vice President and Chief Financial Officer of Smith International, Inc. from 1997 to 1999. Mr. Kennedy also served as Vice President of Finance and Chief Accounting Officer of Smith International from 1994 to 1997, also holding the title of Treasurer from 1991 to 1997. He has served as the Co-Chairman of the board of directors of MicroSeismic, Inc., a post he has held since January 2017, along with Chairman of the audit committee since January 2015. He was appointed to MicroSeismic’s board of directors in September 2013. Mr. Kennedy also currently serves as an advisor to Sumitomo Corporation of the Americas and as Vice Chairman of the board of directors of Global Stainless Supply Inc., a wholly owned subsidiary of Sumitomo Corporation, positions which he has held since July 2015 and November 2015, respectively. Mr. Kennedy also currently serves as Vice Chairman of the
115
Operating Segment Board of Directors of Sumitomo Corporation. Mr. Kennedy previously served on the board of directors for Edgen Group Inc. from January to November 2013 and CE Franklin Inc. from 1999 to May 2012. His career has spanned over 45 years in both executive finance and operating positions providing a broad range of expertise in acquisitions, divestitures, recapitalizations and reorganizations in companies with global operations. Mr. Kennedy is also a member of the Chartered Association of Corporate Treasurers (FCT). He graduated from Wimbledon College in 1970 and Farnborough College of Technology in 1973.
Steven Mueller. Mr. Mueller joined our Board in January 2017, effective upon emergence from the Chapter 11 Proceeding in accordance with the Restructuring Plan. Mr. Mueller serves as a Senior Advisor for First Reserve, a private equity fund focused on energy investments, having joined the First Reserve Senior Advisor Program in October 2016. Mr. Mueller served as a director of Southwestern Energy Company from July 2009 to May 2016, serving as Chairman of the board of directors from May 2014 to May 2016. Previously, Mr. Mueller served as the Chief Executive Officer of Southwestern Energy from May 2009 until his retirement in January 2016. Mr. Mueller also held the title of President of Southwestern Energy from May 2009 until December 2014, having previously served as the President and Chief Operating Officer since June 2008. He joined Southwestern Energy from CDX Gas, LLC, a privately owned company where he was employed as Executive Vice President from September 2007 to May 2008. From 2001 until its acquisition by Forest Oil in 2007, Mr. Mueller served first as the Senior Vice President and General Manager Onshore and later as the Executive Vice President and Chief Operating Officer of The Houston Exploration Company. Mr. Mueller has over 40 years of experience in the oil and gas industry and served in multiple operational and managerial roles at Tenneco Oil Company, Fina Oil Company, American Exploration Company and Belco Oil & Gas Company. Mr. Mueller holds a Bachelor of Science degree in Geologic Engineering from the Colorado School of Mines.
Patrick Murray. Mr. Murray joined our Board in January 2017, effective upon emergence from the Chapter 11 Proceeding in accordance with the Restructuring Plan. He currently serves as Chairman of the Board. In 2007, Mr. Murray retired from Dresser, Inc., where had been the Chairman of the Board and Chief Executive Officer since 2004. From 2000 until becoming Chairman of the Board, Mr. Murray served as President and Chief Executive Officer of Dresser, Inc. Mr. Murray was President of Halliburton Company’s Dresser Equipment Group, Inc.; Vice President, Strategic Initiatives of Dresser Industries, Inc.; and Vice President, Operations of Dresser, Inc. from 1996 to 2000. Mr. Murray served as the President of Sperry-Sun Drilling Services from 1988 through 1996. Mr. Murray joined NL Industries in 1973 as a Systems Application Consultant and served in a variety of increasingly senior management positions. Mr. Murray has been on the board of directors of Harvest Natural Resources (NYSE: HNR) since October, 2000. Mr. Murray also serves on the board of the World Affairs Council of Dallas Fort Worth, on the board of advisors for the Maguire Energy Institute at the Edwin L. Cox School of Business, Southern Methodist University, and as Chairman of the Board of Regents of Seton Hall University. Mr. Murray holds a Bachelor of Science degree in Accounting and a Master of Business Administration from Seton Hall University. He also served for two years in the U.S. Army as a commissioned officer.
Executive Officers. Biographical information for the Company’s executive officers who do not serve on the Board of Directors and so whose biographical information was not included above in “Directors” is set out below.
E. Michael Hobbs. Mr. Hobbs serves as C&J’s Chief Operating Officer, a position he has held since August 2016. He previously served as President of C&J’s Well Services division since June 2015. Mr. Hobbs was Chief Operating Officer of the Company’s wireline division, Casedhole Solutions, at the time C&J acquired it in June 2012. Following C&J’s acquisition of Casedhole Solutions through October 2012, he served as Vice President - Operations for Casedhole Solutions. Mike first joined Casedhole Solutions in April 2010 as Vice President and General Manager for the Southern region, before being promoted to Chief Operating Officer in 2011. Mr. Hobbs is a 37-year veteran of the oilfield services industry, starting his career in 1980. He spent the early fourteen years of his career with Schlumberger, holding numerous operational and management positions in the Permian Basin. After leaving Schlumberger in 1997, Mr. Hobbs founded E.M. Hobbs, Inc. where he was influential in the development and implementation of many of the multi-stage completion procedures and techniques that are currently used today within the wireline service industry. Before leaving E.M. Hobbs, Inc. in 2004, Mr. Hobbs grew the company to 21 units in five locations in Texas and New Mexico. E.M. Hobbs is now known as E&P Wireline owned by Schlumberger.
Mark Cashiola. Mr. Cashiola serves as C&J’s Chief Financial Officer, a position he has held since June 2016. Mark joined C&J in January 2011 and previously served as the Company’s Vice President - Controller and Chief Accounting Officer. He has over 18 years of finance and accounting experience, the majority of which has been spent in the energy industry. Prior to joining C&J, Mark was Senior Controller for Precision Drilling Trust beginning in late 2008 through 2010 and Assistant Controller for Grey Wolf, Inc., prior to its acquisition by Precision, from 2005 through late 2008. Mark began his career in public practice working for Arthur Andersen, L.L.P. and KPMG, L.L.P. for a combined six years, most recently as
116
Audit Manager. Mark received a B.B.A. in Accounting from Texas A&M University and is a Certified Public Accountant in the State of Texas.
Danielle Hunter. Ms. Hunter serves as C&J’s Executive Vice President, General Counsel and Chief Risk & Compliance Officer, a position she has held since June 2016. She also serves as the Company’s Corporate Secretary. Ms. Hunter joined C&J in June 2011 and previously served as the Company’s Vice President - Corporate & Compliance and Associate General Counsel. Prior to joining C&J, Ms. Hunter practiced corporate / transactional law at Vinson & Elkins L.L.P. from 2007 through 2011, representing public and private companies and investment banking firms in numerous capital markets offerings, and mergers and acquisitions, primarily in the oil and gas industry. She also counseled clients with respect to corporate governance, compliance, SEC disclosure / reporting, and general corporate matters. Ms. Hunter served as a judicial law clerk to the Honorable Judge Tucker Melancon, United States District Court - Western District of Louisiana, from 2006 to 2007. Ms. Hunter graduated magna cum laude and order of the coif with a Juris Doctor from Tulane Law School in 2006.
Patrick Bixenman. Mr. Bixenman serves as C&J’s Chief Administrative Officer, a position he has held since August 2016. He also serves as President of C&J’s Research & Technology division, having joined C&J in October 2012 to build this division from the ground up. Through the Research & Technology division, C&J develops products and provides technical support to C&J’s legacy core service lines of hydraulic fracturing, coiled tubing and wireline services. Pat also initiated development of drilling products that allowed the Company to enter the directional drilling services business. Prior to joining C&J, Pat was employed by Schlumberger from 1985 through 2012, where he gained significant technology development and manufacturing experience in wireline logging, coiled tubing, completions tools, artificial lift, drill stem testing, and subsea intervention trees. While employed by Schlumberger, Mr. Bixenman held numerous key management positions, including Engineering Manager, Manufacturing Center Manager and Technology Center Manager. Mr. Bixenman graduated from Tennessee Technology University with a B.S. in Mechanical Engineering in 1983 and Rice University with a Masters in Mechanical Engineering in 1988.
Edward Keppler. Mr. Keppler serves as C&J’s President of Corporate Operational Development, a position he has held since October 2016. He is responsible for structural and tactical operational issues across all of C&J’s service lines to provide strategic direction and support through the development of standards, processes, and systems to increase efficiency and quality for C&J’s operations. Mr. Keppler previously served as President of the Company’s Drilling & Completion Services division from March 2015 to October 2016. Prior to assuming the role of President - Drilling & Completion Services in March 2015, he served as the Company’s Senior Vice President - Corporate Oilfield Operations from July 2013. Mr. Keppler first joined C&J with the Company’s acquisition of its wireline business, Casedhole Solutions, in June 2012. He previously served as the President of Casedhole Solutions from October 2012 through July 2013, having joined Casedhole Solutions as its Vice President and General Manager for the North Region in May 2010. Prior to joining Casedhole Solutions, Mr. Keppler was employed by Schlumberger from 1991 through 2010, where he gained significant wireline experience in the North American market with extensive expertise in cased-hole operations, perforating, open-hole logging, and wellbore formation sampling. While employed by Schlumberger, Mr. Keppler held numerous key management positions, including wireline district manager in six different locations, regional operations manager for the state of Alaska, Engineering Sustaining Manager and Cased-Hole Service Delivery Manager for the U.S. Mr. Keppler’s last position before joining Casedhole Solutions was Global Wireline Technical Support Manager for Weatherford. Mr. Keppler graduated from New Mexico State University with a Bachelor of Science in Mechanical Engineering in 1990.
Timothy Wallace. Mr. Wallace serves as President of C&J’s Drilling & Completion Services division, a position he has held since October 2016. Tim previously served as the Company’s Senior Vice President of Sales & Marketing for the Drilling & Completion Services division, a position he was appointed to in January 2016. Tim served as C&J’s Senior Vice President-Casedhole Solutions from July 2013 through January 2016. Tim first joined C&J with the Company’s acquisition of its wireline business, Casedhole Solutions, in June 2012, and from that time through July 2013 he served as C&J’s Vice President of Wireline Operations. Mr. Wallace joined Casedhole Solutions in October 2011 as the Southwest Regional Wireline Operations Manager. Before arriving at Casedhole Solutions, Mr. Wallace was employed for 28 years with Schlumberger. While at Schlumberger, he held positions in operations management, sales management, software project management, corporate sales, field sales and field operations at various locations in North America, with extensive international travel. Mr. Wallace graduated from Louisiana Tech University with a Bachelor of Science in Petroleum Engineering in 1984.
Nicholas Petronio. Mr. Petronio serves as President of C&J’s Well Services division, a position he has held since August 2016. He previously served as Senior Vice President for Operational Development in the Well Services division, having joined the Company in March 2015 when C&J combined with the completion and production services business of Nabors Industries Ltd. A veteran of the oil and gas industry, Mr. Petronio served as Assistant to the Chairman of Nabors from 2010 to 2015. He was President of Pool Well Services in Houston, a subsidiary of Nabors, from 1999 to 2010. The company operated a fleet of more than 750 workover rigs and 350 oilfield trucks and managed a workforce of 3,400 that provided well services to
117
customers in eight states. Pool was renamed Nabors Well Services in 2005. Mr. Petronio joined Pool as Construction Manager in 1978 and held numerous roles of increasing responsibility within the company, including Vice President of Equipment and Environmental Affairs and Senior Vice President of Eastern U.S. Operations before being named President in 1999. Mr. Petronio started his career in 1968 with General Dynamics’ Electric Boat division before joining Marathon-LeTourneau as a as a technical manager from 1976 to 1978. Mr. Petronio earned a Bachelor of Science in Civil Engineering from the University of Rhode Island and a Masters in Civil Engineering (Applied Mechanics) from the University of Connecticut. Nick is a past President of the Association of Energy Services Companies (AESC). He is currently a Registered Professional Engineer in the State of Texas.
Corporate Governance
We are committed to adhering to sound principles of ethical conduct and good corporate governance. We have adopted corporate policies and practices that promote the effective functioning of our Company and ensure that it is managed with integrity and in the best interest of our shareholders.
The Board has adopted a corporate code of business conduct and ethics (the “Code of Business Conduct and Ethics”), which provides basic principles and guidelines to assist our directors, officers, employees, contractors, agents and other representatives in complying with the legal and ethical requirements governing our business conduct. This Code of Business Conduct and Ethics is supplemented by our Financial Code of Ethics, which sets forth the ethical principles by which our Chief Executive Officer, Chief Financial Officer (or other principal financial officer), Controller (or other principal accounting officer) and other senior financial officers are expected to conduct themselves when carrying out their duties and responsibilities. Any amendment to, or waiver from, a provision of the Code of Business Conduct and Ethics or Financial Code of Ethics that (i) applies to our Chief Executive Officer, Chief Financial Officer(or other principal financial officer), Controller (or other principal accounting officer) or any person performing functions similar to those performed by such officers, and (ii) relates to any element of the code of ethics definitions, as enumerated in Item 406(b) of Securities and Exchange Commission (“SEC”) Regulation S-K, will be posted on the Company’s website at www.cjenergy.com within four business days following the date of the amendment or waiver. Copies of the Code of Business Conduct and Ethics and the Financial Code of Ethics are available on our website at http://www.cjenergy.com/company-profile/corporate-governance under “Governance Documents and Corporate Policies.” Information on our website is not incorporated by reference into this Annual report or any other filing we file with or furnish to the SEC. Shareholders may also obtain electronic or printed copies by sending a written request to C&J Energy Services, Inc. at 3990 Rogerdale Rd. Houston, Texas 77042, Attn: Corporate Secretary, or by emailing Investors@cjenergy.com.
Other important corporate policies and practices include the following:
• | Policy for Complaint Procedures. In keeping with our commitment to maintaining the highest standards of ethical and legal conduct, and pursuant to the requirements of the Sarbanes-Oxley Act of 2002 (“Sarbanes-Oxley”) and applicable rules and regulations of the SEC, our Policy for Complaint Procedures (also known as the “Whistleblower Policy”) sets forth established procedures for (i) the receipt, retention and treatment of complaints received by the Company regarding (a) financial reporting, accounting, internal accounting controls or auditing matters, (b) potential violations of applicable laws, rules and regulations or of the Company’s codes, standards, policies and procedures and (c) any other activities which otherwise may amount to unethical or improper conduct, and (ii) the confidential, anonymous submission by employees of concerns regarding questionable accounting matters, compliance matters and ethical matters. A copy of the Policy for Complaint Procedures is available on our website at http://www.cjenergy.com/company-profile/corporate-governance under “Governance Documents and Corporate Policies”. Shareholders may also obtain electronic or printed copies of the policy, free of charge, by sending a written request to C&J Energy Services, Inc. at 3990 Rogerdale Rd. Houston, Texas 77042, Attn: Corporate Secretary, or by emailing Investors@cjenergy.com. |
• | Related Persons Transaction Policy. Our written Related Persons Transaction Policy provides guidelines for the review and approval of certain transactions, arrangements or relationships involving the Company and any of our directors (or nominees for director), executive officers, shareholder owing more than 5% of the Company, and any immediate family members of any such person. As a general matter, we discourage such “related persons transactions” because they may present potential or actual conflicts of interest and create the appearance that decisions are based on considerations other than the best interest of the Company and its shareholders. Additionally, our Corporate Code of Business Conduct and Ethics restricts our directors, officers and employees from engaging in any business or conduct, or entering into any agreement or arrangement, that would give rise to an actual or potential conflict of interest. Under the Corporate Code |
118
of Business Conduct and Ethics, conflicts of interest occur when an individual’s private or family interests interfere in any way with the interest of the Company or its shareholders. Our Related Person Transaction Policy supplements our Corporate Code of Business Conduct and Ethics and is intended to assist us in complying with the disclosure obligations concerning certain related person transactions under the SEC rules. Please see Item 13. Certain Relationships And Related Transactions, And Director Independence, “Transactions with Related Persons” for additional information regarding our Related Persons Transaction Policy.
• | Insider Trading Policy. Our Insider Trading Policy provides guidelines to our directors, officers, employees, agents, advisors and consultants with respect to transactions in the Company’s securities for the purposes of promoting compliance with applicable securities laws. Integrity and fair dealing are fundamental to the way we do business and we believe that it is vitally important that we maintain the confidence of our shareholders and the public markets. Our commitment to integrity and fair dealing means that our directors, officers and employees do not misuse material, non-public information, or take personal advantage of such information, to the detriment of or unfair advantage over others who do not have that information. We are determined to preserve our reputation, and we take our obligation to prevent insider trading violations seriously. |
• | Anti-Hedging Policy. Our Anti-Hedging Policy prohibits our directors, officers, employees, agents, advisors and consultants from engaging in hedging, monetization and other speculative transactions that are designed to hedge or offset any decrease in the market value of the Company’s securities. Such transactions are prohibited because they present the appearance of a “bet” against the Company. They also allow the holder to own the Company’s securities without the full risks and rewards of ownership, which potentially separates the holder’s interest from that of the Company and its other shareholders. Transactions involving Company-based derivative securities are also prohibited, whether or not entered into for hedging or monetization purposes. This policy supplements our Insider Trading Policy. |
• | Conflict Minerals Policy and Program. Our Conflict Minerals Policy is part of our commitment to being a responsible corporate citizen and complying with SEC regulations requiring publicly traded companies to file annual reports disclosing certain “conflict minerals” (defined as tin, tantalum, tungsten and gold) to the extent that they originate from the Democratic Republic of Congo and its adjoining countries (“Conflict Areas”) and are necessary to functionality of products we manufacture or contract to manufacture. We are committed to the responsible sourcing of materials, products and components and to exercising diligence over our sourcing practices so as not to support conflict, human rights abuses or crimes against humanity. We are taking steps to establish a due diligence framework and compliance program to implement the Conflict Minerals Policy across the Company. We are also communicating to our suppliers our expectation that they will cooperate with our efforts to procure materials, products, and components that either do not originate from the Conflict Areas or are otherwise conflict-free. A copy of the Conflict Minerals is available on our website at http://www.cjenergy.com/company-profile/corporate-governance under “Governance Documents and Corporate Policies”. Shareholders may also obtain electronic or printed copies of the policy, free of charge, by sending a written request to C&J Energy Services, Inc. at 3990 Rogerdale Rd. Houston, Texas 77042, Attn: Corporate Secretary, or by emailing Investors@cjenergy.com. |
• | International Business Requirements Compliance Program. We are committed to maintaining the highest ethical and legal standards, complying with both the letter and spirit of applicable laws and regulations in each country in which we do business. We have adopted robust policies and procedures to provide additional guidance to our directors, officers, employees, agents, contractors, partners and other third parties representing the Company to ensure that our business practices and operations are in compliance with applicable laws, including the following: |
◦ | Anti-Corruption Policy and related Compliance Procedures, to ensure compliance with the United States Foreign Corrupt Practices Act of 1977 (“FCPA”), which makes it a crime to give, or to offer to give, anything of value to non-U.S. government officials (including employees of state-owned companies, such as national oil and transportation companies) or to improperly influence the performance of the officials’ duties. The FCPA also includes requirements that public companies, like C&J, have strong internal controls and accurate books and records. Many other countries have also adopted their own domestic anti-corruption and anti-bribery laws. Our Anti-Corruption Policy and related Compliance Procedures are designed to ensure that our business practices and |
119
operations are in compliance with applicable anti-corruption, anti-bribery and record keeping laws, including the FCPA and Sarbanes-Oxley;
◦ | Compliance Policy on Trade Restrictions, Sanctions & Anti-Money Laundering Requirements and related Compliance Procedure, to ensure compliance with trade sanctions maintained by the U.S. government against targeted foreign countries, as well as terrorists and international drug traffickers, according to U.S. foreign policy and national security objectives; and |
◦ | Export Compliance Policy and related Compliance Procedures, to ensure compliance with U.S. laws and regulations governing the export of goods, technologies and services from the U.S., the release of sensitive technologies to foreign persons in the U.S., and the retransfer of U.S.-origin goods and technologies abroad. |
Information About Our Board and Its Committees
Our Board currently consists of seven directors with three standing committees to assist it in discharging its responsibilities: the Audit Committee, the Compensation Committee and the Nominating & Governance Committee. Details as to the membership of the Board and each committee and the function of each committee are provided below.
The following table identifies the current members of the Board, their respective classes, the standing committees of the Board on which they serve, and the chairman of each committee as of the date of this Annual Report. The Board appoints members to its various committees on an annual basis at a regularly scheduled meeting, typically following the annual general meeting of shareholders. Additional information about each committee is set forth below under the heading “Committees of Our Board.” Each committee has a charter, which is available on our website at http://www.cjenergy.com/company-profile under “Corporate Governance,” and shareholders may obtain printed copies, free of charge, by sending a written request to C&J Energy Services, Inc. at 3990 Rogerdale Rd. Houston, Texas 77042, Attn: Corporate Secretary, or by emailing Investors@cjenergy.com. Biographies and other background information concerning each of our current directors are set forth under the heading “Information About our Directors and Executive Officers.
Name of Director | Class | Audit Committee(2) | Compensation Committee(2) | Nominating & Governance Committee(2) | ||||
Donald J. Gawick (1) | III | |||||||
Patrick M. Murray + | III | |||||||
Stuart Brightman+ | I | * | * | |||||
Michael Zawadzki + | I | * | * | |||||
John Kennedy+ | II | * | ** | * | ||||
Michael Roemer+ | II | ** | * | * | ||||
Steven Mueller+ | III | * | * | ** | ||||
* | Committee Member |
** | Chairman |
+ | Independent. The rules and regulations of the SEC and NYSE require that each of the Audit Committee, Compensation Committee and Nominating & Governance Committee be comprised solely of independent directors. |
(1) | President and Chief Executive Officer. |
(2) | Immediately prior to the Plan Effective Date, our Audit Committee consisted of Messrs. Roemer and Trimble; our Compensation Committee consisted of Messrs. Roemer and Golding; and our Nominating & Governance Committee consisted of Messrs. Roemer and Golding. Prior to his resignation from the Board on December 16, 2016, Mr. Wommack also served on the Audit Committee, Compensation Committee and Nominating & Governance Committee. Additionally, prior to his resignation from the Board on May 26, 2016, Mr. Erikson served on the Compensation Committee and Nominating & Governance Committee; Mr. Golding was appointed to the Board to replace the position vacated by Mr. Erikson. Each of Messrs. Erikson, Golding, Roemer, Trimble and Wommack were independent as defined by and required under the rules and regulations of the SEC and NYSE for service on the Audit Committee, Compensation Committee and Nominating & Governance Committee, as applicable. |
Class I directors initially serve for a one-year term of office ending in 2018, Class II directors initially serve for a two-year term of office ending in 2019; and Class III directors initially serve for a three-year term of office ending in 2020. Following their respective initial terms, each Class I, II and III director will be elected for a three-year term of office.
120
During 2016, the Board held 50 meetings. As noted above, of the current directors, only Messrs. Gawick and Roemer served on the Board during 2016. Each then serving director attended at least 75% of the aggregate of the total number of meetings of the Board in 2016 and the total number of meetings held by each committee on which he served in 2016. Directors are encouraged but not required to attend our annual shareholder meetings, and none of our then serving directors were in attendance at our 2016 annual shareholder meeting.
Board Governance
We are committed to good corporate governance. Our Board has adopted several governance documents to guide the operation and direction of the Board and its committees, which include Corporate Governance Guidelines, and charters for the Audit Committee, Compensation Committee, and Nominating & Governance Committee, as well as those policies described above under the heading “Corporate Governance.” A summary of the Corporate Governance Guidelines follow immediately below, and summaries of each committee charter are set forth below under the heading “-Committees of Our Board.” The Corporate Governance Guidelines and committee charters are available on our website at http://www.cjenergy.com/company-profile under “Corporate Governance”. Shareholders may also obtain printed copies of these documents, free of charge, by sending a written request to C&J Energy Services, Inc. at 3990 Rogerdale Rd. Houston, Texas 77042, Attn: Corporate Secretary or by emailing Investors@cjenergy.com.
Corporate Governance Guidelines
Effective January 6, 2017, our Board adopted Corporate Governance Guidelines to provide a framework within which the Board, assisted by its committees, can conduct its business and fulfill its duties to our shareholders. The Corporate Governance Guidelines are reviewed periodically as deemed necessary by the Nominating & Governance Committee, and any proposed additions to or amendments of the Corporate Governance Guidelines are presented to the Board for its approval. Among other matters, the Corporate Governance Guidelines include provisions concerning the following:
1.Director Qualification Standards
• | Our Nominating & Governance Committee is responsible for evaluating candidates for nomination to our Board and will conduct appropriate inquiries into the backgrounds and qualifications of possible candidates. |
• | A majority of directors on our Board must be “independent” as defined by the rules and regulations of the SEC and NYSE. Each year, our Nominating & Governance Committee will review the relationships between us and each director and will report the results of its review to our Board, which will then determine which directors satisfy the applicable independence standards. |
• | Nominees for directorship will be selected by the Nominating and Governance Committee in accordance with the policies and principles in its charter, subject to the requirements in the our organizational documents and our legal requirements under contract, including, requirements with respect to the nomination and appointment of Board Designees (as defined in the Stockholders Agreement) and their replacements, as selected by GSO or Solus, as applicable, pursuant to our organizational documents and Sections 2.1.2 and 2.1.3 of the Stockholders Agreement. |
2.Director Responsibilities
• | The basic responsibility of each director is to exercise his business judgment to act in what he reasonably believes to be in the best interests of the Company and our shareholders. |
• | Directors are expected to attend meetings of the Board and of committees on which they serve and to spend the time needed and meet as frequently as necessary to properly discharge their responsibilities. The Chairman of the Board is responsible for establishing the agenda for each Board meeting. Attendance at Board and committee meetings is considered by our Nominating & Governance Committee in assessing each director’s performance. |
• | Directors are encouraged but not required to attend each annual general meeting. |
3.Director Access to Independent Advisors and Management
121
• | Our Board and each committee has the power to hire independent legal, financial or other experts and advisors as it may deem necessary, without consulting or obtaining approval of any officer of the Company in advance. |
• | Directors have full and free access to officers and employees of the Company. |
4.Management Evaluation and Succession Planning
• | Each year, the Nominating and Governance Committee will lead the Board in the annual performance review of our executive management team, including our Chief Executive Officer. |
• | The Nominating and Governance Committee will meet annually on succession planning. Our Chief Executive Officer should, at all times, make available his recommendations and evaluations of potential successors, along with a review of any development plans recommended for such individuals. |
5.Annual Performance Evaluation of the Board and Committees, Director Orientation and Continuing Education
• | Each year, the Nominating and Governance Committee will lead the Board in its annual performance review. As part of this process, the Nominating and Governance Committee will receive comments from all directors and report to the full Board with an assessment of the Board’s performance following the end of each fiscal year. |
• | Each year, the Nominating and Governance Committee will lead the Board in its annual performance review of the Board’s committees. As part of this process, the Nominating and Governance Committee will request that the chairman of each committee report to the full Board about the committee’s annual evaluation of its performance and evaluation of this charter following the end of each fiscal year. |
• | Our Nominating and Governance Committee is responsible for developing and annually evaluating orientation and continuing education programs for directors. |
Board Leadership Structure
Our founder and former Chief Executive Officer, Joshua Comstock, served as Chairman of the Board until his death on March 11, 2016. In connection with the succession evaluation following the death of Mr. Comstock, the Board decided to separate the roles of Chairman and Chief Executive Officer, but then did not immediately designate a Chairman to replace Mr. Comstock.
In connection with our emergence from the Chapter 11 Proceeding and instituting the reorganized Company, it was determined that the roles of Chairman and Chief Executive Officer should remain separate, and on January 6, 2017, Mr. Murray was appointed to serve as the Chairman of the Board. The Board believes that this governance structure will allow Mr. Gawick to focus his time and energy on managing the Company and Mr. Murray to lead the Board in its fundamental role of providing guidance, advice and counsel regarding our business, operations and strategy, and that having a separate Chairman will better position the Board in evaluating the performance of management. The Board believes that Mr. Murray’s deep knowledge and understanding of our industry, along with his experience as a former Chairman of the Board and Chief Executive Officer of a publicly traded company, puts him in the best position to lead our Board.
Going forward, each year our Nominating & Governance Committee will review whether this leadership structure is in the Company’s and our shareholder’s best interests, in light of its evaluation of the desirability of having a single individual act as Chairman and Chief Executive Officer, and such individual’s ability to simultaneously execute such roles.
Director Independence
From our initial public offering in July 2011 through our delisting from the NYSE in July 2016 in connection with the Chapter 11 Proceeding, we were a publicly traded company on the NYSE under the symbol “CJES.” During our tenure as a NYSE-listed company, we were required to comply with the rules of the NYSE and were subject to the related rules and regulations of the SEC, including Sarbanes-Oxley. Although we have not been listed on a national exchange for a period of time as a result of our Chapter 11 Proceeding, we have continued to look to the NYSE regulations for guidance, among other reasons, as a matter of best practices. Furthermore, on February 28, 2016, our common stock was approved for listing on the NYSE MKT and is expected to begin trading under the symbol "CJ" on March 6, 2017.
122
The NYSE regulations require listed companies to have a board of directors with at least a majority of independent directors. Additionally, each of the Audit Committee, Compensation Committee and Nominating and Governance Committee are required to be comprised solely of independent directors, as that term is defined by the applicable rules and regulations of the NYSE and SEC. Rather than adopting categorical standards, our Board assesses director independence on a case-by-case basis, in each case consistent with the applicable rules and regulations of the SEC and the NYSE. After reviewing all relationships each director has with the Company, including the nature and extent of any business relationships between the Company and such person, our Board has affirmatively determined that each of Messrs. Murray, Brightman, Kennedy, Mueller, Roemer and Zawadzki has no material relationships with the Company and, therefore, is “independent” as defined under the applicable rules and regulations of the SEC and the NYSE. Mr. Zawadzki is employed by GSO, a significant shareholder of the Company, and was designated for nomination to the Board by GSO pursuant to the Stockholders Agreement. Mr. Gawick, our President and Chief Executive Officer, is not considered to be “independent” because of his employment position with the Company.
With respect to the former members of our Board who served during 2016, each of Messrs. Erickson, Golding, Trimble and Wommack were determined by our Board to be “independent” prior to their departures in 2016. None of Messrs. Comstock, McMullen or Restrepo were considered to be “independent” during the period of time they served on the Board, as discussed further below.
Executive Sessions
To facilitate candid discussion among the directors, our non-employee directors meet in executive session as determined to be necessary, including in conjunction with regular board and/or committee meetings. The chairman of the Board or the respective committee presides at each executive session in conjunction with regular board and/or committee meetings.
Board’s Role in Risk Oversight
The Board believes that risk management is an integral part of setting and implementing our business strategy, which includes, among other things, identifying and assessing the risks and opportunities facing the Company. It is management’s responsibility to manage the Company’s risk exposure and potential impact of the many risks that are associated with our business and a primary function of our Board is to assist and oversee management in this effort. The Board, as a whole and also at the committee level, has oversight responsibility. The Board’s committees assist the Board in fulfilling its oversight responsibilities with respect to risks within its areas of responsibilities, as further discussed below. We believe the Board’s role in risk oversight is consistent with the Company’s leadership structure (as discussed under the heading “-Board Leadership Structure”), with our Chief Executive Officer and other members of senior management having direct responsibility for risk management, and the remaining directors involved in providing oversight of management’s efforts to reduce, mitigate or eliminate the risks that we face.
The primary means by which the Board and its designated committees oversee our risk management structure and policies is through its regular communications with management and our internal audit department. In connection with our quarterly Board meetings, the full Board (or the appropriate Committee in the case of risks that are under the purview of a particular Committee) receives regular reports from members of senior management on areas of material risk to the Company, including operational, financial, legal and regulatory, and strategic risks. The Chairman of each of the Committees will discuss and review significant matters with management outside of the quarterly Board meetings as needed. When a Committee receives a separate report or the Chairman has separate discussions, the Committee Chairman may discuss that report with the full Board.
As part of its charter, the Audit Committee is responsible for reviewing and discussing our policies with respect to risk assessment and risk management generally, and also specifically with respect to financial reporting, internal controls and accounting matters, legal, tax and regulatory compliance and the internal audit function. The Audit Committee is responsible for ensuring that an effective risk assessment process is in place, and quarterly reports are made to the Audit Committee on material risks facing the Company. Upon request, both the full Board and Audit Committee may receive reports from those executive officers who are deemed responsible for particular risks due to being in a position that makes them most likely to be able to impact the effects of such risks. The Audit Committee also oversees our internal audit department, which is responsible for monitoring the Company’s adherence to our significant corporate policies and internal controls.
Our Compensation Committee assists our Board in fulfilling its oversight responsibilities with respect to the management of risks arising from our compensation and health and welfare benefits policies and programs. Our Nominating and Governance Committee assists our Board in fulfilling its oversight responsibilities with respect to the
123
management of risks associated with corporate governance, Board organization, membership and structure and succession planning for our Chief Executive Officer and other members of senior management.
Board Diversity
Our Board seeks independent directors who represent a mix of backgrounds and experiences that will enhance the quality of our Board’s deliberations and decisions. Our Nominating and Governance Committee is responsible for identifying and recommending to our Board qualified individuals to be nominated to serve on our Board. Our Board’s objective is to select individuals that have a demonstrated record of integrity, sound business judgment, leadership, objectivity, independence of mind and commitment. In selecting potential Board candidates, our Board considers diversity in its broadest sense, including, among other things, diversity of background, perspective, personal and professional experiences, geography, gender, race and ethnicity, as well as the existing skill-set of our Board and the needs of our Company. We believe that this process has resulted in a Board that is comprised of highly qualified directors that reflect diversity as we define such concept. We discuss each of our directors’ qualifications and characteristics under the heading “Information about our Directors and Executive Officers.”
Our Nominating and Governance Committee factors the effectiveness of our diversity policy into its annual evaluation of our Board and its committees. Part of this review focuses on whether or not our Board includes the appropriate skills and characteristics that reflect a diverse, effective Board. We believe that the evaluation program has been designed such that any diversity-related deficiencies would be identified as part of the process.
Committees of Our Board
As noted above, our Board has three standing committees: the Audit Committee, the Compensation Committee and the Nominating & Governance Committee. A description of each committee, its function and charter, are provided below:
Audit Committee
Our Audit Committee is responsible for the oversight of risks relating to financial reporting, internal controls and accounting matters, as well as legal, tax and regulatory compliance, and our internal audit systems. Pursuant to its charter, the purposes of the Audit Committee are to:
• | Oversee the quality, integrity and reliability of the financial statements and other financial information we provide to any governmental body or the public; |
• | Oversee our compliance with legal, tax and regulatory requirements, as well as with our significant corporate codes, policies and procedures; |
• | Oversee the qualifications, independence and performance of our independent registered public accounting firm; |
• | Oversee the effectiveness and performance of our internal audit function, including our internal audit department; |
• | Oversee the effectiveness and performance of our systems of internal controls regarding finance, accounting, legal compliance and ethics that our management and Board have established; |
• | Provide an open avenue of communication among our independent registered public accounting firm, financial and senior management, the internal audit department and our Board, always emphasizing that the independent registered public accounting firm is accountable to our Audit Committee; |
• | Annually prepare an “Audit Committee Report” for inclusion in the proxy statement for each annual general meeting of shareholders, in accordance with applicable rules and regulations; and |
• | Perform such other functions as our Board may assign to our Audit Committee from time to time. |
In connection with these purposes and to satisfy its oversight responsibilities, our Audit Committee annually selects, engages and evaluates the performance and ongoing qualifications of, and determines the compensation for, our independent registered public accounting firm, reviews our annual and quarterly financial statements, and confirms the independence of our independent registered public accounting firm. Our Audit Committee meets regularly with our management, internal auditors and independent registered public accounting firm regarding the adequacy of our financial
124
controls and our compliance with legal, tax and regulatory matters and our significant corporate policies. Our Audit Committee separately meets regularly with our independent registered public accounting firm, internal auditors, Chief Financial Officer, Chief Accounting Officer/Controller and other members of senior management. Our Audit Committee Chairman routinely meets between formal committee meetings with our Chief Financial Officer, Controller, internal auditors and our independent registered public accounting firm. Our Audit Committee also receives regular reports regarding issues such as the status and findings of audits being conducted by the internal and independent auditors, accounting changes that could affect our financial statements and proposed audit adjustments.
While our Audit Committee has the responsibilities and powers set forth in its charter, it is not the duty of our Audit Committee to plan or conduct audits, to determine that our financial statements are complete and accurate or to determine that such statements are in accordance with accounting principles generally accepted in the United States (“U.S. GAAP”) and other applicable rules and regulations. Our management is responsible for the preparation of our financial statements in accordance with U.S. GAAP and our internal controls. Our independent registered public accounting firm is responsible for the audit work on our financial statements. It is also not the duty of our Audit Committee to conduct investigations or to assure compliance with laws and regulations and our corporate policies and procedures. Our management is responsible for compliance with applicable laws and regulations, as well as compliance with our policies and procedures.
The current members of the Audit Committee are Messrs. Roemer (Chairman), Kennedy and Mueller. We have an audit committee consisting of at least three members, each of whom meets certain independence standards established under the rules and regulations of the SEC and the NYSE. Our Board has determined that all members of our Audit Committee are independent as that term is defined by the listing requirements of the NYSE and by Rule 10A-3 promulgated under the Securities Exchange Act of 1934, as amended (the “Exchange Act”). Additionally, our Board has determined that each member of the Audit Committee is financially literate, and that Mr. Roemer has the necessary accounting and financial expertise to serve as Chairman. Our Board has also determined that Mr. Roemer is an “audit committee financial expert” following a determination that Mr. Roemer met the criteria for such designation under the rules and regulations of the SEC. For information regarding Mr. Roemer’s business experience please read “Information about our Directors and Officers.”
The Audit Committee held 7 meetings during 2016. Of the current members of the Audit Committee, only Mr. Roemer was a member of the Board and the Audit Committee during 2016.
Compensation Committee
Our Compensation Committee is responsible for the oversight of risks relating to the compensation of our executive officers and directors, as well as our compensation and benefit plans, policies and programs. Pursuant to its charter, the purposes of the Compensation Committee are to:
• | Review, evaluate, and approve our agreements, plans, policies and programs to compensate our executive officers and directors; |
• | Oversee our employee benefit plans, policies and programs, including our incentive compensation plans and equity-based plans, to compensate our non-executive employees as well as executive officers; |
• | Fulfill our Board’s responsibility relating to compensation of our executive officers and directors; |
• | Review and discuss with management the “Compensation Discussion and Analysis” disclosures proposed to be included in our proxy statement for each annual meeting of shareholders or our annual report on Form 10-K, as applicable, and determine whether to recommend to our Board that the proposed Compensation Discussion and Analysis disclosure be included in the proxy statement or annual report, in accordance with applicable rules and regulations; |
• | Annually prepare a “Compensation Committee Report” for inclusion in the proxy statement for each annual meeting of shareholders or annual report on Form 10-K, as applicable, in accordance with applicable rules and regulations of the SEC; and |
• | Perform such other functions as our Board may assign to our Compensation Committee from time to time. |
In connection with these purposes, our Board has delegated to the Compensation Committee the overall responsibility for establishing, implementing and monitoring compensation for our executive officers. Together with management (with the exception of compensation matters related to our Chief Executive Officer), and any counsel or other
125
advisors it deems appropriate, the Compensation Committee reviews and discusses each particular executive compensation matter presented and makes a final determination. For example, the Compensation Committee reviews and approves the compensation of our executive officers and makes appropriate adjustments based on Company performance, achievement of predetermined goals and changes in an officer’s duties and responsibilities. Additionally, following each shareholder meeting at which “say-on-pay” resolutions are proposed for a shareholder advisory vote, the Compensation Committee will review the results of the shareholder advisory vote, and consider whether to make any adjustments to our executive compensation policies and practices. The Compensation Committee is also responsible for approving all employment agreements related to our executive officers.
In addition, our Board has delegated to the Compensation Committee the responsibility for establishing, implementing and monitoring the compensation for our directors. Our Compensation Committee establishes reviews and approves the compensation of our directors and makes appropriate adjustments based on their performance, duties and responsibilities and competitive environment. Our Compensation Committee’s primary objectives in establishing and implementing director compensation are to:
• | Ensure the ability to attract, motivate and retain the talent necessary to provide qualified Board leadership; and |
• | Use the appropriate mix of long-term and short-term compensation to ensure high Board and/or committee performance. |
Under its charter, our Compensation Committee has the sole authority to select, retain, approve the fees and other retention terms of, and terminate the services of an independent compensation consultant or other experts to assist the Compensation Committee in fulfilling its responsibilities, including the evaluation of the compensation of our executive officers and directors.
The current members of the Compensation Committee are Messrs. Kennedy (Chairman), Brightman, Mueller, Roemer and Zawadzki, each of whom our Board has determined to be independent and eligible for service on the Compensation Committee under the rules and regulations of the SEC and the NYSE.
The Compensation Committee held 7 meetings during 2016. Of the current members of the Compensation Committee, only Mr. Roemer was a member of the Board and the Compensation Committee during 2016.
Nominating & Governance Committee
Our Nominating & Corporate Governance Committee is responsible for the oversight of risks relating to corporate governance, Board organization, membership and structure, and succession planning for our senior management team, including our Chief Executive Officer. Pursuant to its charter, the purposes of our Nominating & Governance Committee are to:
• | Advise our Board and make recommendations regarding appropriate corporate governance practices and assist our Board in implementing those practices; |
• | Assist our Board by identifying individuals qualified to become members of our Board, consistent with criteria approved by the Board, and recommending director nominees for election at each annual general meeting of shareholders or for appointment to fill vacancies; |
• | Advise our Board and make recommendations regarding the appropriate composition of our Board and its committees; |
• | Lead our Board in its annual review of the performance of the Board and its committees and of senior management, including our Chief Executive Officer; |
• | Direct all matters relating to succession planning for the Company’s Chief Executive Officer, as well as succession planning for the other members of the senior management team in consultation with our Chief Executive Officer and succession planning of our accounting and financial personnel in consultation with the Audit Committee; and |
• | Perform such other functions as our Board may assign to our Nominating & Governance Committee from time to time. |
126
In connection with these purposes, our Nominating & Governance Committee evaluates potential new members of our Board, actively monitors and advises the Board about appropriate corporate governance practices, evaluates director independence under the applicable standards, and identifies the qualities and characteristics necessary for an effective Chief Executive Officer.
Our Nominating & Governance Committee is responsible for developing and recommending to the Board appropriate criteria for selecting new directors and actively seeking out candidates for recommendation to our Board. In considering candidates for our Board, our Nominating & Governance Committee considers the entirety of each candidate’s credentials. There is currently no set of specific minimum qualifications that must be met by a nominee recommended by our Nominating & Governance Committee, as different factors may assume greater or lesser significance at particular times. Furthermore, the needs of our Board may vary in light of its composition, and our Nominating & Governance Committee’s perceptions about future issues and needs. However, while the Board does not maintain a formal list of qualifications, in making its evaluation and recommendation of candidates, our Nominating & Governance Committee may consider, among other factors, diversity, age, skill, experience in the context of the needs of our Board, independence qualifications and whether a prospective nominee has relevant business and financial experience, industry or other specialized expertise and a high moral character.
Our Nominating & Governance Committee may consider candidates for our Board from any reasonable source, including from a search firm engaged by our Nominating & Governance Committee or shareholder recommendations. Our Nominating & Governance Committee does not intend to alter the manner in which it evaluates candidates based on whether the candidate is recommended by a shareholder. However, in evaluating a candidate’s relevant business experience, our Nominating & Governance Committee may consider previous experience as a member of our Board.
The current members of the Nominating & Governance Committee are Messrs. Mueller (Chairman), Brightman, Kennedy, Roemer and Zawadzki, each of whom our Board has determined to be independent under the rules and regulations of the SEC and the NYSE.
The Nominating & Governance Committee held 5 meeting during 2016. Of the current members of the Nominating & Governance Committee, only Mr. Roemer was a member of the Board and the Nominating & Governance Committee during 2016.
Communications with the Board
Our Board welcomes communications from our shareholders and other interested parties. Shareholders and any other interested parties may send communications to our Board, any committee of our Board, the Chairman of our Board, or to any director in particular, by writing to:
C&J Energy Services, Inc.
3990 Rogerdale Rd.
Houston, Texas 77042
Attn: General Counsel and Corporate Secretary
Shareholders and any other interested parties should mark the envelope containing each communication as “Shareholder Communication with Directors” and clearly identify the intended recipient(s) of the communication.
Our General Counsel will review each communication received from shareholders and other interested parties and will forward the communications, as expeditiously as reasonably practicable, to the addressees if: (1) the communication complies with the requirements of any applicable policy adopted by our Board relating to the subject matter of the communication and (2) the communication falls within the scope of matters generally considered by our Board.
Section 16(a) Beneficial Ownership Reporting Compliance
Each person who, at any time during the fiscal year 2016, was a director, executive officer or beneficial owner of more than 10% of our common stock was required by Section 16(a) of the Exchange Act to file reports of ownership and changes in ownership of our securities (Forms 3, 4 and 5) with the SEC, and to furnish us with copies of the reports.
Based solely on our review of the reports furnished to us and written representations received from our directors and executive officers during the fiscal year 2016, we believe that, during the fiscal year 2016, all of our directors, executive officers and beneficial owners of more than 10% of our common stock timely complied with all Section 16(a) filing requirements.
127
Item 11. Executive Compensation
Compensation Discussion and Analysis
Executive Summary
This Compensation Discussion and Analysis (“CD&A”) provides information about the compensation objectives, policies and program for our executive offices, specifically including the individuals who served as our principal executive officer, principal financial officer, and the other three most highly-compensated executive officers during fiscal year 2016 (collectively referred to as the “Named Executive Officers”), as set out below:
• | Donald Gawick, President and Chief Executive Officer |
• | E. Michael Hobbs, Chief Operating Officer |
• | Mark Cashiola, Chief Financial Officer and Chief Accounting Officer |
• | Danielle Hunter, Executive Vice President, General Counsel, Chief Risk and Compliance Officer, and Corporate Secretary |
• | Edward Keppler, President - Corporate Operational Development |
This CD&A also provides information regarding three Named Executive Officers who are no longer executive officers of the Company; specifically: Mr. Joshua Comstock, our Founder and former Chairman and Chief Executive Officer, whose employment with the Company terminated on March 11, 2016 upon his death; Mr. Randall McMullen, Jr. Former President and Chief Financial Officer, as well as successor Chief Executive Officer to Mr. Comstock, whose employment with the Company terminated on June 13, 2016; and Mr. Theodore Moore, Former Executive Vice President, General Counsel and Chief Risk Officer, whose employment with the Company terminated on June 13, 2016.
This CD&A provides a general description of our 2016 compensation program and specific information about its various components, which primarily consisted of base salaries and short-term incentive programs, and is intended to place in perspective the information contained in the executive compensation tables that follow this discussion under the heading “Executive Compensation.” The 2016 compensation program and decisions described in this CD&A were determined by our Predecessor’s Compensation Committee (the “Legacy Compensation Committee”), which was composed of three independent directors: Messrs. H.H. “Tripp” Wommack, III (Chairman), Jay Golding, and Michael Roemer. Mr. Sheldon Erikson also served on the Legacy Compensation Committee during 2016 through the date of his resignation from the Board on May 26, 2016.
Following the Company’s emergence from its Chapter 11 Proceeding on January 6, 2017, compensation decisions for the Named Executive Officers are made by our current Compensation Committee (the “Compensation Committee”), which is comprised of the following five members: Messrs. Kennedy (Chairman), Brightman, Mueller, Roemer and Zawadzki. While this CD&A focuses on compensation for the Named Executive Officers for 2016, as the last completed fiscal year, in accordance with the rules of the SEC, we also describe compensation actions effected after the end of the last completed fiscal year to the extent we believe such discussion enhances the understanding of our executive compensation disclosures and our executive compensation structure. See “-Actions Taken for the 2017 Fiscal Year” below for additional information.
As used in this CD&A and in the sections entitled “Executive Compensation” and “Director Compensation” below, the terms “we,” “us,” “our,” and the “Company” refer, when discussing time periods prior to the Company’s emergence from its Chapter 11 Proceeding, to our Predecessor and its Board of Directors and Compensation Committee. Additionally, the term “share”, “shares” or “shareholders” refer, when discussing time periods prior to the Company’s emergence from its Chapter 11 Proceeding, to our Predecessor’s stock and stockholders.
Overview of Our Executive Compensation Program
Compensation Philosophy and Objectives
The primary objectives of our compensation program are as follows:
• | To attract and retain a talented and experienced employee base by competitive positioning within the industry; |
128
• | To motivate best-in-class performance by linking compensation with the achievement of strategic business and financial objectives; and |
• | To align the interests of our employees with those of our stakeholders by providing an incentive to our employees to focus on the long-term success of the Company and rewarding our employees for individual successes and contributions. |
To this end, we have focused on designing a compensation program for our employees, including our executive officers (and specifically, the Named Executive Officers), that includes a large component of incentive compensation based on our overall performance and the individual successes and contributions of our employees. We believe that incentive compensation elements, such as equity awards and cash bonuses, communicate to our executives that they will be paid for performance and align the interests of our executives with our shareholders’ interests.
We expect that our Compensation Committee will continue to design our executive compensation policies and program in a manner that allows us to attract and retain individuals with the background and skills necessary to successfully execute our business strategy in a demanding environment, to motivate those individuals to reach near-term and long-term goals in a way that aligns their interests with that of our shareholders, and to reward key contributors for individual and overall success in reaching near-term and long-term goals, importantly including enhancing our share valuation. In doing so, we anticipate that the Compensation Committee will work with an independent compensation consultant to the extent deemed necessary or appropriate to assist in further tailoring our compensation program to that of a large scale, public company within our industry so that we remain competitive.
Key Components of Our Executive Compensation Program
In designing our executive compensation program, the Legacy Compensation Committee relied on three primary elements of compensation:
• | Base salary; |
• | Annual short-term incentive cash bonus awards; and |
• | Annual long-term incentive equity awards. |
We believe that annual short-term cash incentive bonuses and annual long-term equity incentive awards are optimal vehicles for providing performance-based incentive because, among other reasons, they are flexible in application and can be tailored to meet our compensation objectives. Typically, the determination of an employee’s cash incentive bonus reflects the Compensation Committee’s assessment of the employee’s relative contribution to achieving or exceeding our annual, near-term objectives, while the determination of an employee’s long-term equity incentive awards is based, in large part, on the employee’s demonstrated and expected contribution to our longer term goal objectives.
We have historically granted equity awards to employees, including our Named Executive Officers, pursuant to an omnibus plan that provided broad flexibility to our Compensation Committee to tailor awards to meet our compensation objectives.
In accordance with the Restructuring Plan, 10% of the equity of the Company was reserved for a management incentive program to allow for the issuance of equity to management of the reorganized Company after emergence at the discretion of the Board. On January 12, 2017, the Board adopted the C&J Energy Services, Inc. 2017 Management Incentive Plan (the “MIP”), effective as of January 6, 2017, which provides that a maximum of 8,046,021 shares of our common stock may be issued or transferred pursuant to awards under the MIP. Persons eligible to receive awards under the MIP include our non-employee directors, our employees and affiliates, and certain of our consultants and advisors.
The MIP provides for the grant of equity-based awards, including but not limited to stock options, restricted stock units, restricted stock, performance awards and other forms of awards granted or denominated in shares of our common stock, as well as certain cash-based awards. The Compensation Committee is responsible for administering the MIP with broad authority to, among other things: (i) select participants; (ii) determine the types of awards that participants are to receive and the number of shares that are to be subject to such awards; and (iii) establish the terms and conditions of awards, including the price (if any) to be paid for the shares or the award. If any stock option or other stock-based award granted under the MIP expires, terminates or is cancelled for any reason without having been exercised in full, the number of shares of common stock underlying any unexercised award shall again be available for the purpose of awards under the MIP. If any shares of restricted
129
stock, performance awards or other stock-based awards denominated in shares of our common stock awarded under the MIP are forfeited for any reason, the number of forfeited shares shall again be available for purposes of awards under the MIP. Any award under the MIP settled in cash shall not be counted against the maximum share limitation. As is customary in incentive plans of this nature, each share limit and the number and kind of shares available under the MIP and any outstanding awards, as well as the exercise or purchase prices of awards, and performance targets under certain types of performance-based awards, are subject to adjustment in the event of certain reorganizations, mergers, combinations, recapitalizations, stock splits, stock dividends or other similar events that change the number or kind of shares outstanding, and extraordinary dividends or distributions of property to our stockholders.
Other key components of our executive compensation program historically have included severance and change in control benefits, retirement benefits (including 401(k) contributions), health and welfare benefits and other limited perquisites. We also maintain employment agreements with each of our executive officers and enter into award agreements with each recipient of an equity award that governs the terms and conditions of that award.
The key components of our 2016 executive compensation program, which reflect cost savings necessitated by our financial and business condition, are described in greater detail under heading “-Components of 2016 Compensation of our Named Executive Officers” and “Executive Compensation.”
Shareholder-Friendly Features of Our Executive Compensation Program
Our compensation objectives and policies are focused on, and our compensation program is designed to, align the interests of the Named Executive Officers with the interests of our shareholders and the delivery of shareholder value through sustainable growth strategies. Notably, our executive compensation program contains the following shareholder-friendly features:
• | Our equity award agreements with our Named Executive Officers do not contain “single trigger” vesting acceleration provisions. |
• | Our employment agreements for our Named Executive Officers contain “double trigger” severance and change in control provisions. |
• | We do not provide tax gross-ups on any potential golden parachute payments. |
• | All long-term incentive awards are paid in shares of our common stock via awards of restricted stock and/or stock options. |
• | We do not allow for the backdating or repricing of stock options. |
• | The Compensation Committee has discretion and authority with respect to the payment of cash and equity incentive awards. |
• | The Compensation Committee has utilized a compensation consultant that is independent from management. |
Compensation Setting Process
Role of the Compensation Committee and Named Executive Officers in Setting Compensation
The Compensation Committee has the authority to oversee our executive compensation program and to implement any formal equity-based compensation plans or policies that the Compensation Committee deems appropriate for our employees, including the Named Executive Officers. The Compensation Committee consults with certain of our executive officers regarding our compensation and benefit programs, other than with respect to such executive officer’s own compensation and benefits, but the Compensation Committee is ultimately responsible for making all compensation decisions for the Named Executive Officers.
Role of Compensation Consultants in Setting Compensation
The Compensation Committee has the authority to engage a compensation consultant at any time if it determines that it would be appropriate to consider the recommendations of an independent outside source. Historically, the Legacy Compensation Committee from time to time engaged Pearl Meyer and Partners (“Pearl Meyer”) as an independent
130
compensation consultant to review the Company’s executive compensation program and non-employee director compensation program, with the information provided by the consultant being one of the various factors considered in making compensation decisions. Following our emergence from the Chapter 11 Proceeding, the Compensation Committee engaged Pearl Meyer to review the Company’s executive compensation program and make recommendations regarding the grants of transaction success equity awards to the Company’s executive officers.
Key Factors in Setting Compensation
The Legacy Compensation Committee selected a peer group of companies for purposes of evaluating 2016 executive compensation. The Legacy Compensation Committee’s general criteria for selecting a peer group included:
• | Companies that are direct competitors for the same space, products and/or services; |
• | Companies that competed with us for the same executive team talent; |
• | Companies with a similar Standard Industry Classification code or in a similar sector; |
• | Companies that are most statistically related to us with similar revenue size; |
• | Companies that generally are subject to the same market conditions (or specifically, oilfield services companies); and |
• | Companies that are tracked similarly or which are considered comparable investments by outside analysts. |
For purposes of evaluating 2016 compensation, the peer group included the following companies:
Archrock, Inc. | Oceaneering International, Inc. | ||
Basic Energy Services, Inc. | Oil States International, Inc. | ||
Ensco plc | Patterson-UTI Energy, Inc. | ||
FMC Technologies, Inc. | Pioneer Energy Services Corp. | ||
Helmerich & Payne, Inc. | RPC, Inc. | ||
Key Energy Services Inc. | Superior Energy Services, Inc. | ||
Newpark Resources, Inc. | Transocean Ltd. | ||
Timing of Compensation Decisions
Compensation decisions, including decisions with respect to annual cash short-term incentive bonus awards historically were made by the Legacy Compensation Committee at a regular meeting held in in December of each year. Occasionally, the Legacy Compensation Committee deferred final approval of compensation decisions to the first quarter of the following year to permit additional review and revisions to compensation and award decisions based on final financial results for the prior year and finalizing the business plan for the following year. For various reasons, decisions on long-term equity compensation awards were typically made in the first quarter or at other times in the year. Also, compensation adjustments may be made due to promotions or changes in duties during a year.
Components of 2016 Compensation of our Named Executive Officers
Each of our Named Executive Officers has an employment agreement which generally provide that the Named Executive Officers are eligible to receive the following compensation and benefits: (i) an annualized base salary; (ii) eligibility to receive an annual cash incentive bonus award with a designated target range of a specified percentage of annualized base salary that is based on the achievement of certain performance targets set forth by the Legacy Compensation Committee; (iii) eligibility to receive annual long-term equity compensation awards (or cash awards upon mutual agreement of us and the executive) at a target award level of no less than the executive’s “Total Cash Compensation”, which is the sum of (a) the executive’s annualized base salary for the prior calendar year and (b) the greater of the annual cash incentive bonus award paid to the Named Executive Officer in either of the prior two calendar years; (iv) eligibility to receive discretionary bonuses as determined solely by our Board; (v) employee benefits for the executive and the executive’s eligible family members that we
131
ordinarily provide to similarly situated employees (including, but not limited to, medical and dental insurance, retirement plans, disability insurance and life insurance); and (vi) certain fringe benefits and perquisites. The following table enumerates certain of the foregoing items of compensation and benefits that each of the Named Executive Officers are entitled to or eligible to, or were entitled to or were eligible to, receive under the employment agreements, which are described in more detail in “Executive Compensation-Summary Compensation Table.”
Name | Annualized Base Salary | Target Cash Incentive Bonus Award as a Percentage of 2016 Base Salary | ||
Donald Gawick | $875,000 | 150-250% | ||
Mark Cashiola | $425,000 | 100% | ||
E. Michael Hobbs | $500,000 | 150% | ||
Danielle Hunter | $400,000 | 100% | ||
Edward Keppler | $400,000 | 75% | ||
Joshua Comstock | $1,100,000 | 200-300% | ||
Randall McMullen, Jr. | $650,000 | 100-200% | ||
Theodore Moore | $450,000 | 100% | ||
Base Salary
Each Named Executive Officer’s base salary is provided for in the respective employment agreement as a fixed component of compensation that may be annually adjusted by the Compensation Committee. We generally do not adjust base pay for our Named Executive Officers based strictly on our performance, rather we take individual accomplishments and market trends into account as well. As such, base pay functions as an important counterbalance to incentive, discretionary, and equity compensation, all of which are generally contingent on our performance or success. The Compensation Committee will review the base salaries for each Named Executive Officer annually as well as at the time of any promotion or significant change in job responsibilities, and in connection with each review considers individual and Company performance over the course of that year.
In March 2016, the Company implemented reductions in base salaries for all employees, including a 10% reduction in the salaries of the Named Executive Officers, which remained in effect through 2016 and continues in effect today. Accordingly, the Named Executive Officers received less than the amounts stated in the table above. The total base salary earned by each Named Executive Officer in 2016 is reported in “Summary Compensation Table.”
Annual Short-Term Incentive Cash Bonus Awards
The employment agreements provide that each Named Executive Officer is eligible to receive an annual cash incentive bonus award, which is stated in each employment agreement with a designated target range of a specified percentage of annualized base salary. The actual amount of each annual bonus is based on the achievement of certain performance targets set forth by the Compensation Committee and is determined by the Compensation Committee in its sole discretion and may be higher or lower than the target range in the Named Executive Officer’s employment agreement. Bonus payments, if any, are typically paid between December 15 of the applicable year for which the bonus was earned and March 15 of the year following the year in which the bonus was earned. In the event that any executive is terminated for cause in advance of the bonus payment date, however, such executive would forfeit any right to receive a bonus for that year.
Given the Company’s performance as a result of the highly challenging market conditions in our industry and the Company’s Chapter 11 Proceeding, we did not pay the annual year-end cash incentive bonuses for 2016. However, in May 2016, in anticipation of the Company’s Chapter 11 Proceeding, the Board approved the terms of the C&J Energy Services 2016 Senior Executive Incentive Plan (the “SEIP Plan”) and the C&J Energy Services 2016 Key Employee Incentive Plan.
Pursuant to the terms of the SEIP Plan, our named executive officers and certain other executive officers received performance-based cash awards on a quarterly basis. A participant’s target award opportunity under the SEIP Plan was equal to 50% to 100% of the participant’s year-end cash bonus target, plus 25% to 50% of the participant's annual long-term incentive target and, depending on the level of achievement of the set performance goals, a participant’s final award could have been as little as zero or as much as 150% of the target award opportunity. Awards were earned under the SEIP Plan based on the Company’s achievement during each 2016 calendar quarter of performance goals related to the Company’s Adjusted EBITDA,
132
defined as adjusted earnings before interest, taxes, depreciation and amortization, weighted at 80%, and the Company’s total recordable injury rate, weighted at 20%.
Actual payouts were made in cash quarterly upon the Legacy Compensation Committee’s certification of the achievement of certain performance targets set forth in the SEIP Plan. The fourth quarter performance targets were certified by the Compensation Committee. The SEIP plan was terminated in the fourth quarter of 2016, and the final payments were made on January 30, 2017. The total SEIP Plan payments earned by each Named Executive Officer in 2016 is reported in “Summary Compensation Table.”
Annual Long-Term Equity Compensation Awards
The employment agreements provide that each Named Executive Officer is eligible to receive an annual long-term equity compensation award (or cash award upon mutual agreement of the Company and the executive) at a target award level of no less than the executive’s “Total Cash Compensation,” which is the sum of (a) the executive’s annualized base salary for the prior calendar year and (b) the greater of the annual cash incentive bonus award paid to the Named Executive Officer in either of the prior two calendar years.
As discussed above, we maintain the 2015 Long Term Incentive Plan (the “LTIP”), which was an amendment and restatement of our 2012 Long Term Incentive Plan. The LTIP also includes a sub-plan titled the C&J International Middle East FZCO Phantom Equity Arrangement (the “MENA”). We also previously maintained the 2006 Stock Option Plan and the 2010 Stock Option Plan. As a result of the Company’s Chapter 11 Proceeding, all outstanding unvested awards granted under the foregoing plans were terminated for no consideration. On January 12, 2017, the Board adopted the MIP, effective as of January 6, 2017. A maximum of 8,046,021 shares of our common stock may be issued or transferred pursuant to awards under the MIP as the Company’s prior omnibus plan was terminated in conjunction with the Chapter 11 Proceeding.
Given the Company’s performance as a result of the highly challenging market conditions in our industry and the Company’s Chapter 11 Proceeding, we did not grant any equity compensation awards for 2016. Following the Company’s Chapter 11 Proceeding, we currently maintain and only intend to grant equity awards under the MIP.
Post-Emergence Long-Term Equity Compensation Awards for 2017
Following emergence, in January and February 2017, the Compensation Committee approved equity grants (the “Emergence Grants”) to non-employee directors and selected members of the Company's senior management, including each of the Named Executive Officers. The Compensation Committee based its decision to approve the Emergence Grant on a review of market practices for companies following the emergence from Chapter 11 bankruptcy, and because the grants served the following objectives:
• | Strengthen alignment with the interests of our new stockholders; |
• | Provide an incentive to maximize stockholder value; and |
• | Enhance the ability to retain key talent through the post-emergence period. |
These awards were granted in the form of restricted stock and stock options. The stock options have an exercise price per share based on the fair market value of a share of the Company’s common stock (“Common Stock”) on the applicable date of grant, which was $42.65. The restricted stock and the stock options granted to senior management are subject to the following vesting schedule: (i) 34% vests immediately on the grant date; (ii) 22% vests on the first anniversary of the grant date; (iii) 22% vests on the second anniversary of the grant date; and (iv) 22% vests on the third anniversary of the grant date. These awards were made from the MIP, which was approved by the Compensation Committee.
Other Benefits and Perquisites
Under the employment agreements, each Named Executive Officer and eligible family members are eligible to receive the health and welfare benefits generally made available to our other full-time, salaried employees (including, but not limited to, medical and dental insurance, retirement plans, disability insurance and life insurance), as well as other fringe benefits and perquisites, including provision for an automobile (or an automobile allowance) for business and personal use and related insurance coverage, use of the Company aircraft for business purposes and reimbursement of reasonable business expenses. On April 1, 2016, the Company aircraft was sold with no replacement aircraft purchased.
133
Prior to his death, Mr. Comstock was also eligible to use the Company aircraft for personal purposes under the terms of his employment agreement, provided that the use of the aircraft was imputed as income to him and he was also responsible for reimbursing the Company for the incremental costs associated with operating the aircraft. In the event that Mr. Comstock’s family accompanied him on a business-related trip using the Company aircraft, amounts associated with respect to his family’s travel costs were reported as compensation to Mr. Comstock (no additional direct operating costs is incurred in such situations). Additionally, Mr. Comstock owned a personal aircraft that he occasionally used for business travel and we partially reimbursed Mr. Comstock for the expenses associated with business travel. In the event that Mr. Comstock’s family accompanied him on a business-related trip using his personal aircraft, the amounts that we reimbursed him with respect to his family’s travel costs were reported as compensation to Mr. Comstock (no additional direct operating costs was incurred in such situations). Amounts imputed as income to Mr. Comstock in 2016 for personal use of the Company aircraft or with respect to his family’s travel cost on business trips are included in the “All Other Compensation” column of the “Summary Compensation Table.”
We do not maintain a defined benefit pension plan for our executive officers or other employees because we believe such plans primarily reward longevity rather than performance. Nevertheless, we recognize the importance of providing our employees with assistance in saving for their retirement. We therefore maintain a retirement plan, or the “401(k) Plan”, that is qualified under Section 401(k) of the Internal Revenue Code. Historically, following the completion of one year of service plus an additional required waiting period, we offer matching contributions for each of our employees, including our Named Executive Officers, up to 4% of their qualifying compensation each year, subject to certain limitations imposed by the Internal Revenue Code. Effective January 1, 2016, we eliminated the Company matching contributions to the 401(k) Plan but we may decide to offer matching contributions again in the future.
Severance and Change in Control Benefits
We believe it is important that the Named Executive Officers focus their attention and energy on our business without any distractions regarding the effects of a termination that is beyond their control or our change in control. Therefore, the employment agreements each provide that they will be entitled to receive severance benefits and certain accelerated vesting of their outstanding equity awards in the event their employment is terminated under certain circumstances. Specifically, substantially all severance payment obligations to the Named Executive Officers associated with a change in control are “double trigger” payments, which require termination of employment within a specified period prior to or following a change in control to receive the benefit. Our Board believes that double trigger payments are typically more appropriate than single trigger payments (where a payment is made upon the occurrence of a change in control alone) because they financially protect the employee if he is terminated following a change in control transaction, without providing a potential windfall if the employee is not terminated. For more detailed information regarding our severance and change in control benefits under the employment agreements and other compensation arrangements in effect for our Named Executive Officers during 2016, please read “Executive Compensation-Potential Payments upon Termination or Change in Control.”
Waiver and Release Agreements
Mr. McMullen
In connection with his termination of employment, Mr. McMullen entered into a waiver and release agreement (the “McMullen Agreement”) with us pursuant to which Mr. McMullen received the payments and benefits payable upon a termination without cause pursuant to his employment agreement, except that (i) for purposes of calculating such payments and benefits, his annual base salary and target annual bonus were deemed to be a higher amount than is provided for under his employment agreement due to his appointment to Chief Executive Officer in March 2016 without a corresponding change in his employment agreement and (ii) notwithstanding the terms of the employment agreement, as a result of certain restrictions applicable to us under our credit facility, Mr. McMullen received a lump sum cash payment in an amount equal to the value of outstanding restricted shares held by him at the time of his termination of employment, based on the closing price of the Company’s company shares on the New York Stock Exchange on the termination date, in lieu of any accelerated vesting of such shares.
Mr. Moore
In connection with his termination of employment, Mr. Moore entered into a waiver and release agreement (the “Moore Agreement”) with us pursuant to which Mr. Moore received the payments and benefits payable upon a termination without cause pursuant to his employment agreement, except that Mr. Moore waived any acceleration of unvested equity awards under the terms of his employment agreement.
134
Stock Ownership Guidelines
Historically, we have elected not to adopt formal stock ownership guidelines for our Named Executive Officers. Our Compensation Committee recently considered this position and, following consultation with the Company's independent compensation consultant, intends to adopt formal stock ownership guidelines applicable to our Named Executive Officers in 2017.
Tax Deductibility of Executive Compensation
As part of its role in determining the amounts and type of compensation to grant to the Named Executive Officers, the Compensation Committee takes into consideration the deductibility of executive compensation under Section 162(m) of the Internal Revenue Code, which provides that we may not deduct certain compensation in excess of $1,000,000 that is paid to our Chief Executive Officer or our three other most highly compensated executive officers (other than our Chief Financial Officer) unless the compensation is “performance-based” within the meaning of Section 162(m) of the Internal Revenue Code. The Compensation Committee considers its primary goal to design compensation strategies that further the best interests of our shareholders. Although deductibility of compensation is preferred when possible, tax deductibility is not a primary objective of our compensation programs, and we believe that achieving our compensation objectives is more important than the benefit of tax deductibility of compensation in certain circumstances.
Relation of Compensation Policies and Practices to Risk Management
We anticipate that our compensation policies and practices will continue to be tailored to provide rewards for short-term and long-term performance, both on an individual basis and at the entity level. In general, optimal financial and operational performance, particularly in a competitive business, requires some degree of risk-taking. However, at this time our Compensation Committee retains a significant amount of discretion with respect to the compensation packages of our Named Executive Officers, which we believe prevents management from entering into actions that could have a material adverse effect on us in the long-run to simply achieve a specific short-term goal. We also believe that the compensation program that our general employee population is eligible to receive does not entice the employees to take unnecessary risks in their day to day activities.
We expect our compensation arrangements to contain a number of design elements that serve to minimize the incentive for taking unwarranted risk to achieve short-term, unsustainable results. Those elements include delaying the rewards, subjecting such rewards to forfeiture in the case of certain terminations of employment, and subjecting such awards to equity claw-backs under certain scenarios related to violations of our risk management policies and practices.
In combination with our risk-management practices, we do not believe that risks arising from our compensation policies and practices for our employees, including our Named Executive Officers, are reasonably likely to have a material adverse effect on us.
Actions Taken For the 2017 Fiscal Year
Based on, among other factors, the Company’s business following emergence from the Chapter 11 Proceeding, performance and prevailing industry conditions, the Compensation Committee is assessing potential changes to our executive compensation program for the 2017 fiscal year. As discussed above under “Post-Emergence Long-Term Equity Compensation Awards for 2017,” on February 5, 2017, the Compensation Committee approved the Emergence Grants to non-employee directors and selected members of the Company’s senior management, including each of the Named Executive Officers, which consisted of awards of restricted stock and stock options under the MIP.
135
REPORT OF THE COMPENSATION COMMITTEE
As discussed herein, the Compensation Discussion and Analysis included in this Annual Report focuses on compensation for the Named Executive Officers of C&J Energy Services Ltd., the predecessor of C&J Energy Services, Inc., during the last completed fiscal year (2016). The 2016 compensation program and decisions described herein were determined by such predecessor’s Compensation Committee, and were not determined by the Compensation Committee of the Board of Directors of C&J Energy Services, Inc. While Mr. Roemer was a member of such predecessor’s Compensation Committee during the 2016 fiscal year, Messrs. Kennedy, Brightman, Mueller, and Zawadzki were not and, accordingly, did not participate in any determinations relating to the 2016 compensation program and decisions applicable to the Named Executive Officers.
The Compensation Committee of the Board of Directors of C&J Energy Services, Inc.:
• | Has reviewed and discussed the Compensation Discussion and Analysis required by Item 402(b) of Regulation S-K with management; and |
• | Based on the review and discussions referred to above, recommended to the Board of Directors that the Compensation Discussion and Analysis be included in this Annual Report. |
Respectfully submitted by the Compensation Committee of the Board of Directors of C&J Energy Services, Inc.
John J. Kennedy (Chairman)
Stuart M. Brightman
Steven Mueller
Michael Roemer
Michael Zawadzki
136
EXECUTIVE COMPENSATION
Summary Compensation Table
The table below sets forth the annual compensation earned during the 2016, 2015 and 2014 fiscal years by our Named Executive Officers:
Name and Principal Position | Year | Salary ($)(1) | Bonus ($)(2) | Share Awards ($)(3) | Option Awards($) | All Other Compensation ($)(4) | Total ($) | |||||||||||||
Donald J. Gawick | 2016 | 654,106 | 2,766,669 | — | — | 29,369 | 3,450,144 | |||||||||||||
Chief Executive Officer | 2015 | 484,973 | 555,000 | 1,290,998 | — | 35,725 | 2,366,696 | |||||||||||||
2014 | 423,077 | 637,500 | 999,991 | — | 35,360 | 2,095,928 | ||||||||||||||
Mark Cashiola | 2016 | 316,188 | 776,202 | — | — | 32,344 | 1,124,734 | |||||||||||||
Chief Financial Officer | ||||||||||||||||||||
E. Michael Hobbs | 2016 | 380,229 | 665,752 | — | — | 17,350 | 1,063,331 | |||||||||||||
Chief Operating Officer | ||||||||||||||||||||
Danielle Hunter | 2016 | 286,486 | 708,851 | — | — | 30,413 | 1,025,750 | |||||||||||||
Executive Vice President | ||||||||||||||||||||
and General Counsel | ||||||||||||||||||||
Edward Keppler | 2016 | 366,077 | 532,876 | — | — | 23,090 | 922,043 | |||||||||||||
President, Corporate | ||||||||||||||||||||
Operational Development | ||||||||||||||||||||
Joshua Comstock (5) | 2016 | 245,173 | — | — | — | 1,514,718 | 1,759,891 | |||||||||||||
Former Chief Executive | 2015 | 969,946 | 3,300,000 | 9,089,996 | — | 160,247 | 13,520,189 | |||||||||||||
Officer | 2014 | 843,077 | 1,750,000 | 3,270,010 | — | 47,887 | 5,910,974 | |||||||||||||
Randall McMullen, Jr. (5) | 2016 | 358,123 | 650,000 | — | — | 6,382,102 | 7,390,225 | |||||||||||||
Former Chief | 2015 | 575,112 | 650,000 | 2,174,000 | — | 39,860 | 3,438,972 | |||||||||||||
Executive Officer and | 2014 | 509,038 | 1,020,000 | 1,883,011 | — | 39,126 | 3,451,175 | |||||||||||||
Former Chief | ||||||||||||||||||||
Financial Officer | ||||||||||||||||||||
Theodore Moore (5) | 2016 | 219,072 | 230,625 | — | — | 1,832,560 | 2,282,257 | |||||||||||||
Former Executive Vice | 2015 | 393,373 | 450,000 | 1,024,996 | — | 39,604 | 1,907,973 | |||||||||||||
President and General | 2014 | 349,039 | 487,500 | 734,011 | — | 38,870 | 1,609,420 | |||||||||||||
Counsel | ||||||||||||||||||||
(1) | In March 2016, the Company implemented reductions in base salaries for all employees, including a 10% reduction in the salaries of the Named Executive Officers. Base salary adjustments for Messrs. Gawick and Cashiola and for Ms. Hunter for the 2016 fiscal year were generally effective June 23, 2016 in connection with their appointments to their current positions and entry into new employment agreements. Base salary adjustments for Mr. Hobbs for the fiscal year ended December 31, 2016 was generally effective August 22, 2016 in connection with his appointment to his current position and entry into a new employment agreement. Base salary adjustments for the Named Executive Officers for the fiscal year 2015 year were generally effective March 24, 2015 in connection with the closing of the Nabors Merger and entry into new employment agreements. Base salary adjustments for the |
137
Named Executive Officers for the 2014 fiscal year were generally effective January 5, 2014, except that Mr. Comstock’s 2014 salary was not effective until February 2, 2014.
(2) | For 2016, the amounts in this column reflect amounts earned under the 2016 Senior Executive Incentive Plan, regardless of when it was paid. For years prior to 2016, the amounts in this column reflect amounts earned for the applicable year under the annual cash incentive bonus component of such Named Executive Officer’s employment agreement, regardless of when it was paid. |
(3) | This column reflects (a) restricted shares awarded under the annual equity incentive bonus component of such Named Executive Officer’s employment agreement, regardless of when it was granted, (b) for 2015, the merger success equity bonus granted to each Named Executive Officer pursuant to such Named Executive Officer’s employment agreement and (c) for 2015, the phantom units granted to each Named Executive Officer under the MENA (although the accounting value on the grant date of the awards was $0, therefore no values are reflected for these awards in the table above for the 2015 year). The amounts in this column represent the aggregate grant date fair value of such awards computed in accordance with Financial Accounting Standards Board (“FASB”), Accounting Standards Codification (“ASC”) Topic 718. |
(4) | The amounts in this column for the 2016 fiscal year include the following amounts for each of the Named Executive Officers: (i) for subsidized healthcare, life and disability insurances: $4,613.52 to Mr. Comstock, $9,227.04 to Mr. McMullen, $13,569.84 to Mr. Gawick, $9,227.04 to Mr. Moore, $18,454.08 to Mr. Cashiola, $9,268.68 to Mr. Keppler, $16,523.25 to Ms. Hunter, and $13,569.84 to Mr. Hobbs; (ii) for automobile allowances and related fuel and maintenance costs $6,300 to Mr. Comstock, $7,367 to Mr. McMullen, $15,799 to Mr. Gawick, $7,367 to Mr. Moore, $13,890 to Mr. Cashiola, $13,821 to Mr. Keppler, $13,890 to Ms. Hunter, and $3,780 to Mr. Hobbs; (iii) $10,407.22 to Mr. Comstock for income that we imputed to him during 2016 for the personal use of the Company’s airplane; and (iv) $1,493,397.60 for severance payments and benefits paid to Mr. Comstock’s estate following his death, which consisted of value attributable to acceleration of vesting of equity awards, $6,365,508 for severance payments and benefits paid to Mr. McMullen following his termination of employment, which (among other things) consisted of payment of accrued vacation, acceleration of vesting of equity awards, a lump sum payment in an amount equal to two times the result of his annualized base salary plus target annual bonus and a lump sum payment equal to 18 months of Consolidated Omnibus Budget Reconciliation Act of 1985, as amended (“COBRA”) premiums and $1,815,966 for severance payments and benefits paid to Mr. Moore following his termination of employment, which (among other things) consisted of payment of accrued vacation, a lump sum payment in an amount equal to two times the result of his annualized base salary plus target annual bonus and a lump sum payment equal to 18 months of COBRA premiums. |
(5) | On March 11, 2016, Mr. Comstock’s employment with the Company terminated due to his death. On June 13, 2016, Mr. McMullen’s and Mr. Moore’s employment with the Company terminated due to their departure. Amounts shown for Messrs. Comstock, McMullen and Moore reflect payments or benefits earned through the applicable date of termination, including severance payments and benefits. |
Grants of Plan-Based Awards for the 2016 Fiscal Year
Given the Company’s performance as a result of the highly challenging market conditions in our industry and the Company’s Chapter 11 Proceeding, the Company did not grant any plan-based awards for the 2016 fiscal year.
Narrative Disclosure to the Summary Compensation Table and Grants of Plan-Based Awards for the 2016 Fiscal Year
Employment Agreements
We maintain employment agreements with each of the Named Executive Officers. The employment agreements set forth the duties of each Named Executive Officer’s position. Each employment agreement set forth the Named Executive Officer’s base salary, annual bonus target ranges, and eligibility for various other benefits such as health and welfare benefits and/or retirement opportunities. The employment agreements also provided that each Named Executive Officer was entitled to receive annual equity awards under our equity incentive plans, although the terms and conditions of such awards were to be determined by the Compensation Committee on an individual basis and governed by individual award agreements. For potential severance and change in control benefits under these employment agreements, see the “-Potential Payments upon Termination or Change in Control” section below.
Percentage of Salary and Bonus in Comparison to Total Compensation
The amount of salary and bonus that each of our current Named Executive Officers received for 2016 in relation to their respective total compensation amounts reported in the “Summary Compensation Table” for 2016 is as follows:
138
Name | Salary & Bonus as Percentage of Total Compensation | |
Donald Gawick | 99.0 | % |
Mark Cashiola | 97.0 | % |
E. Michael Hobbs | 98.0 | % |
Danielle Hunter | 97.0 | % |
Edward Keppler | 97.0 | % |
Severance
During 2016, each of Messrs. Comstock, McMullen and Moore experienced a termination of employment. In connection with each termination of employment, such Named Executive Officers received certain severance payments and benefits, which are described in more detail below under “-Potential Payments upon Termination or Change in Control.”
Outstanding Equity Awards at 2016 Fiscal Year-End
The following table provides information on the equity awards held by the Named Executive Officers as of December 31, 2016. This table includes unexercised options that were vested as of December 31, 2016, as well as unvested options and restricted shares. The vesting dates for each award are shown in the accompanying footnotes. As a result of the Company’s Chapter 11 Proceeding, all outstanding unvested awards granted were terminated for no consideration.
139
Option Awards | Share Awards | |||||||||
Name | Number of Securities Underlying Unexercised Options (#) Exercisable | Number of Securities Underlying Unexercised Options (#) Unexercisable | Option Exercise Price ($) | Option Expiration Date | Number of Shares That Have Not Vested (#) | Market Value of Shares That Have Not Vested ($)(9) | ||||
Donald J. Gawick | 3,167(4) | — | 18.89 | 6/19/2022 | ||||||
13,473(6) | 3,099 | |||||||||
16,666(7) | 3,833 | |||||||||
44,150(8) | 10,155 | |||||||||
Mark Cashiola | 10,000 | — | 10.00 | 1/17/2021 | ||||||
45,000(3) | — | 29.00 | 7/28/2021 | |||||||
3,166(6) | 728 | |||||||||
15,673(8) | 3,605 | |||||||||
Everett Hobbs | 2,488(4) | — | 18.89 | 6/19/2022 | ||||||
4,716(6) | 1,085 | |||||||||
26,490(8) | 6,093 | |||||||||
Danielle Hunter | 5,000 | — | 15.50 | 5/23/2021 | ||||||
7,500(3) | — | 29.00 | 7/28/2021 | |||||||
977(6) | 225 | |||||||||
5,408(8) | 1,244 | |||||||||
Edward Keppler | 1,900(4) | — | 18.89 | 6/19/2022 | ||||||
4,716(6) | 1,085 | |||||||||
28,697(8) | 6,600 | |||||||||
Joshua Comstock | 105,000(1) | — | 1.43 | 11/11/2018 | — | — | ||||
17,500(1) | — | 10.00 | 12/23/2020 | |||||||
1,662,468(2) | — | 10.00 | 12/23/2020 | |||||||
275,000(3) | — | 29.00 | 7/28/2021 | |||||||
29,583(4) | — | 18.89 | 6/19/2022 | |||||||
Randall McMullen, Jr. | 17,500(1) | — | 10.00 | 12/23/2020 | — | — | ||||
1,187,477(2) | — | 10.00 | 12/23/2020 | |||||||
200,000(3) | — | 29.00 | 7/28/2021 | |||||||
17,034(4) | — | 18.89 | 6/19/2022 | |||||||
Theodore Moore | 40,000(5) | — | 10.00 | 2/01/2021 | — | — | ||||
100,000(3) | — | 29.00 | 7/28/2021 | |||||||
6,610(4) | — | 18.89 | 6/19/2022 | |||||||
(1) | Each of these options was granted from Legacy C&J’s 2006 Stock Option Plan and became fully vested on December 23, 2010. |
(2) | Each of these options was granted from Legacy C&J’s 2010 Stock Option Plan on December 23, 2010 and vested in equal one third installments on each of December 23, 2011, December 23, 2012 and December 23, 2013. |
(3) | Each of these options was granted from Legacy C&J’s 2010 Stock Option Plan and vested in equal one third installments on each of July 28, 2012, July 28, 2013 and July 28, 2014. |
140
(4) | Each of these options was granted from the LTIP and vested in equal one third installments on each of June 19, 2013, June 19, 2014 and June 19, 2015. |
(5) | Each of these options was granted from Legacy C&J’s 2010 Stock Option Plan and vested in equal one third installments on each of February 1, 2012, February 1, 2013 and February 1, 2014. |
(6) | Each of these restricted share awards was granted from the LTIP and vested or would have vested in equal one third installments subject to continued employment by the award holder on the applicable vesting dates. The first tranche vested on February 11, 2015, the second tranche vested on February 11, 2016, and the remaining tranche would have vested on February 11, 2017. |
(7) | Each of these restricted share awards was granted from the LTIP and vested or would have vested subject to the following two-tiered vesting schedule: (1) the restricted shares were first subject to certification by the Compensation Committee of the achievement of positive “EBITDA” (as defined in the award agreement) (the “Performance-Based Vesting Schedule”) in any calendar quarter during the period beginning on April 1, 2015 and ending on December 31, 2017; and (2) in addition to satisfaction of the Performance-Based Vesting Schedule, the restricted shares were subject to a time-based vesting schedule such that one third of the restricted shares would have become unrestricted on each of the first, second, and third anniversaries of the date of grant. |
(8) | Each of these restricted share awards was granted from the LTIP and vested or would have vested in equal one third installments subject to continued employment by the award holder on the applicable vesting dates. The first tranche vested on June 5, 2016, the second tranche would have vested on June 5, 2017 and the remaining tranche would have vested on June 5, 2018. |
(9) | The market value of the restricted share awards was calculated by multiplying the applicable number of restricted shares outstanding as of December 31, 2016 by $0.23, which was the market value of C&J’s common shares on the “grey market” on December 31, 2016. |
Option Exercises and Shares Vested in the 2016 Fiscal Year
The following table presents information regarding the exercise of options and the vesting of restricted share awards held by the Named Executive Officers during 2016.
Option Awards | Share Awards | |||||||
Name | Number of Shares Acquired on Exercise (#) | Value Realized on Exercise ($) | Number of Shares Acquired on Vesting (#) | Value Realized on Vesting ($)(1) | ||||
Donald Gawick | — | — | 53,914 | 74,910 | ||||
Mark Cashiola | — | — | 14,112 | 17,728 | ||||
E. Michael Hobbs | — | — | 23,143 | 27,114 | ||||
Danielle Hunter | — | — | 9,120 | 10,908 | ||||
Edward Keppler | — | — | 23,988 | 28,498 | ||||
Joshua Comstock | — | — | 850,683 | 1,493,398 | ||||
Randall McMullen, Jr. | — | — | 101,767 | 146,292 | ||||
Theodore Moore | — | — | 44,754 | 64,653 | ||||
(1) | This amount was calculated based on the market price of C&J’s common shares on the applicable vesting date, multiplied by the number of restricted shares that vested on that date. For awards vesting on (a) February 11, 2016, the price was $2.14, (b) April 4, 2016, the price was $1.34 and (c) June 5, 2016, the price was $0.55. |
Pension Benefits
While we provide our employees with the opportunity to participate in the 401(k) Plan, we do not currently maintain a defined benefit pension plan. Please read “Compensation Discussion and Analysis-Components of 2016 Executive Compensation Program-Other Benefits and Policies.”
Nonqualified Deferred Compensation
We do not provide a nonqualified deferred compensation plan for our employees, including our Named Executive Officers, at this time.
Potential Payments Upon Termination or Change in Control
The following discussion and table reflect the payments and benefits that each of the Named Executive Officers other than Messrs. Comstock, McMullen and Moore would have been eligible to receive in the event of certain terminations,
141
assuming that each such termination occurred on December 31, 2016. As a result, the payments and benefits disclosed represent what would have been due and payable to the Named Executive Officers under the applicable agreements and plans in existence between the Named Executive Officers and C&J as of December 31, 2016. The payments and benefits described below do not contemplate any changes to such agreements or plans, or new agreements or plans adopted, after December 31, 2016.
As described above under “Compensation Discussion and Analysis-Executive Summary”, the employment of each of Messrs. Comstock, McMullen and Moore was terminated during fiscal year 2016. In connection with such termination, the estate of Mr. Comstock received the payments and benefits due under his employment agreement in connection with a termination as a result of death. In connection with their termination of employment, Messrs. McMullen and Moore each entered into a Waiver and Release Agreement with the Company.
As a result of his termination of employment, the estate of Mr. Comstock received value equal to $1,493,397.60, which consisted of value attributable to acceleration of vesting of equity awards.
As a result of his termination of employment, Mr. McMullen received $6,365,508, which (among other things) consisted of (i) payment for accrued vacation, (ii) $94,129 representing acceleration of vesting of equity awards, (iii) $5,675,000 representing a lump sum equal to the result of two times his annualized base salary plus target annual bonus and (iv) $37,386 representing COBRA premiums.
As a result of his termination of employment, Mr. Moore received $1,853,980, which (among other things) consisted of (i) payment for accrued vacation, (ii) $1,800,000 representing a lump sum equal to the result of two times his annualized base salary plus target annual bonus and (iii) $37,386 representing COBRA premiums.
Employment Agreements in effect as of December 31, 2016
The employment agreements between us and the Named Executive Officers that existed as of December 31, 2016 contained certain severance provisions.
If the Named Executive Officer is terminated other than for cause by us or the Named Executive Officer resigns for good reason (each as defined in the employment agreements), in each case, outside of the period beginning 30 days prior to the effective date of a change of control (as defined in the employment agreements) and ending on the two year anniversary of the effective date of such change of control (such period, the “Protected Period”), then the Named Executive Officer would be eligible to receive: (i) to the extent unpaid, the sum of the Named Executive Officer’s base salary earned through the date of termination and any accrued, unused vacation pay earned by the Named Executive Officer and any unreimbursed business expenses, (ii) subject to satisfaction of any applicable performance targets, any of the Named Executive Officer’s unpaid bonuses with respect to a previous calendar year completed prior to the date of termination (without regard to any continued employment requirement) (each (i) and (ii), the “Accrued Obligations”), (iii) other than Mr. Keppler, payment of the annual bonus for the calendar year in which the termination occurs (based on actual results and payable at the time bonuses are paid to active executives) and (iv) (a) lump sum payment of an amount equal to two times (or one times in the case of Mr. Keppler) the Named Executive Officer’s annualized base salary in effect on the date of termination and (b) a lump sum payment of an amount equal to all COBRA premiums that would be payable for the 18 month period beginning on the date of termination, assuming that the Named Executive Officer and the Named Executive Officer’s eligible dependents elected COBRA coverage (without regard to whether actual coverage was elected or would be applicable for the entire 18 month period). All Named Executive Officers other than Mr. Keppler also would receive accelerated vesting of any unvested equity awards.
If the Named Executive Officer is terminated other than for cause by us (including due to non-renewal of the employment agreement by us) or the Named Executive Officer resigns for good reason, during the Protected Period in connection with a change of control, then the Named Executive Officer would be eligible to receive (in lieu of the ordinary severance payments and benefits described above): (i) the Accrued Obligations, (ii) other than Mr. Keppler, payment of the annual bonus for the calendar year in which the termination occurs at the target level and (iii) (a) lump sum payment of an amount equal to three times (or one times in the case of Mr. Keppler) the Named Executive Officer’s annualized base salary in effect on the date of termination and (b) a lump sum payment of an amount equal to all COBRA premiums that would be payable for the 36 month period beginning on the date of termination, assuming that the Named Executive Officer and the Named Executive Officer’s eligible dependents elected COBRA coverage (without regard to whether actual coverage was elected or would be applicable for the entire 36 month period). All Named Executive Officers other than Mr. Keppler also would receive accelerated vesting of any unvested equity awards.
142
If the Named Executive Officer is terminated by reason of death or permanent disability (as defined in the employment agreement), then the Named Executive Officer would be eligible to receive: (i) the Accrued Obligations, (ii) payment of the annual bonus for the calendar year in which the termination occurs based on actual performance and (iii) timely payment or provision of any and all benefit obligations provided under the employment agreement (which includes, but is not limited to, employee benefits, sick-leave benefits, disability insurance and paid vacation), which under their terms are payable in the event of the Named Executive Officer’s death or permanent disability. All Named Executive Officers other than Mr. Keppler also would receive accelerated vesting of any unvested equity awards.
If any portion of the payments under the employment agreements would constitute “excess parachute payments” and would have resulted in the imposition of an excise tax on the Named Executive Officer, then the payments made to such Named Executive Officer would have either been (1) delivered in full or (2) reduced in accordance with the Named Executive Officer’s employment agreement until no portion of the payments are subject to an excise tax, whichever would have resulted in the Named Executive Officer receiving the greatest benefit on an after-tax basis.
Pursuant to each of our Named Executive Officers’ employment agreements, all payments of deferred compensation paid upon a termination of employment would have been paid on the second day following the sixth month after the Named Executive Officer’s termination of employment if so required by Section 409A of the Code (or, if earlier, death or any date that otherwise complied with Section 409A of the Code).
Equity Award Agreements
None of our Named Executive Officers received equity awards in 2016; although each received awards of restricted stock and/or options in prior years.
Our form agreements for awards granted to the Named Executive Officers under the LTIP take into account that each Named Executive Officer is also a party to an employment agreement with us. To the extent that the employment agreement includes provisions that govern the treatment of equity awards (whether in the case of a termination of service or a change of control or otherwise), the provisions of the employment agreement will supersede the terms of our form award agreements and govern the treatment of such equity awards. To the extent the employment agreement does not include such provisions, the provisions of each applicable award agreement will govern.
Potential Payments Upon Termination or Change in Control Table
The following table quantifies the amounts that each of our Named Executive Officers other than Messrs. Comstock, McMullen and Moore would have received under the terms of the respective employment agreements upon certain terminations, assuming that such an event occurred on December 31, 2016. These amounts could not be determined with any certainty outside of the occurrence of an actual termination. The value of any accelerated equity vesting upon a hypothetical termination is based on the market value of Legacy C&J’s common shares on December 31, 2016, which was $0.23 per share. We have also assumed for purposes of the table below that all Accrued Obligations and other similar expenses were paid current or equaled $0 as of December 31, 2016. Where applicable, amounts reported reflect each Named Executive Officer’s salary and target or actual bonus as of December 31, 2016. Any actual payments that may be made pursuant to the agreements described above are dependent on various factors, which may or may not exist at the time the Named Executive Officer is actually terminated. Therefore, such amounts and disclosures should be considered “forward-looking statements.” Messrs. Comstock, McMullen and Moore are not included in the table below because they terminated employment during fiscal year 2016 prior to December 31, 2016, but the payments and benefits actually received by the estate of Mr. Comstock and each of Messrs. McMullen and Moore are described and quantified above.
143
Name and Principal Position | Without Cause or For Good Reason Termination, Outside of a Change in Control ($) | Without Cause or For Good Reason Termination, or Non-Renewal by us, in Connection with Change in Control ($)(4) | Termination Due to Death or Disability ($)(6) | |||||
Donald J. Gawick | ||||||||
Chief Operating Officer | ||||||||
Severance (Multiple of Salary and Target Bonus) | 3,937,500 | 5,906,250 | — | |||||
Bonus (1) | — | 1,181,250 | — | |||||
Continued Medical | 20,362 | 40,725 | — | |||||
Accelerated Equity (2) | 17,086 | 17,086 | 17,086 | |||||
Total | 3,974,948 | 7,145,311 | 17,086 | |||||
Mike Hobbs | ||||||||
Chief Operating Officer | ||||||||
Severance (Multiple of Salary and Target Bonus) | 2,250,000 | 3,375,000 | — | |||||
Bonus (1) | — | 675,000 | — | |||||
Continued Medical | 20,362 | 40,725 | — | |||||
Accelerated Equity (2) | 7,177 | 7,177 | 7,177 | |||||
Total | 2,277,539 | 4,097,902 | 7,177 | |||||
Mark Cashiola | ||||||||
Chief Financial Officer | ||||||||
Severance (Multiple of Salary and Target Bonus) | 1,530,000 | 2,295,000 | — | |||||
Bonus (1) | — | 382,500 | — | |||||
Continued Medical | 28,162 | 56,323 | — | |||||
Accelerated Equity (2) | 4,333 | 4,333 | 4,333 | |||||
Total | 1,562,495 | 2,738,156 | 4,333 | |||||
Danielle E. Hunter | ||||||||
Executive Vice President and General Counsel | ||||||||
Severance (Multiple of Salary and Target Bonus) | 1,440,000 | 2,160,000 | — | |||||
Bonus (1) | — | 360,000 | — | |||||
Continued Medical | 15,930 | 31,859 | — | |||||
Accelerated Equity (2) | 1,469 | 1,469 | 1,469 | |||||
Total | 1,457,399 | 2,553,328 | 1,469 | |||||
Edward J. Keppler | ||||||||
President, Corporate Operational Development | ||||||||
Severance (Multiple of Salary and Target Bonus) | 630,000 | 630,000 | — | |||||
Bonus (1) | — | — | — | |||||
Continued Medical | 28,162 | 56,323 | — | |||||
Accelerated Equity (2) | — | — | — | |||||
Total | 658,162 | 686,323 | — | |||||
(1) | Each Named Executive Officer would receive the actual cash incentive bonus earned under the employment agreement for the year of termination for a termination without cause or for good reason outside of a change in control or due to death or disability. The amount of the cash incentive bonus earned by each Named Executive Officer under the employment agreement for 2016 was $0. Each Named Executive Officer would receive the Named Executive Officer’s target bonus amount for the year of termination for a termination without cause or for good reason in connection with a change in control. |
(2) | Equity awards that were subject to Section 162(m) of the Code will be accelerated at actual performance levels in the event that the Named Executive Officer is terminated “Without Cause or For Good Reason Termination Outside of a Change in Control”. As of December 31, 2016, the |
144
performance metric applicable to outstanding equity awards that were subject to Section 162(m) of the Code had been achieved. As a result, for such awards, the actual amounts have been included for purposes of this table.
145
DIRECTOR COMPENSATION
Annual compensation for our non-employee directors is comprised of cash and equity-based compensation. Our President and Chief Executive Officer, Mr. Gawick, does not receive additional compensation for his services as a director. All compensation that Mr. Gawick received for his services to us during 2016 as an employee is described under the headings “Compensation Discussion and Analysis” and “Executive Compensation.”
The Board believes that compensation for non-employee directors should be competitive and should fairly compensate directors for the time and skills devoted to serving our company. With the assistance of our independent compensation consultant, the Compensation Committee periodically reviews our director compensation practices and compares them against the practices of companies in our compensation peer group as well as against the practices of public company boards generally. The Compensation Committee requested information from our independent compensation consultant regarding the compensation provided to non-employee directors at our peer companies and our independent compensation consultant produces year-end compensation reports for the Compensation Committee for each fiscal year. The Compensation Committee utilized our independent compensation consultant’s most current report when making certain compensation decisions for our non-employee directors for the 2016 year. Based on such findings, the Compensation Committee determined that no changes were necessary for 2016.
In 2016, cash compensation paid to our non-employee directors consisted of an annual retainer of $50,000, a fee of $1,500 per board meeting attended in person or telephonically, and a fee of $1,500 per committee meeting attended in person or telephonically if held on a day different than the day of a full board meeting. Non-employee directors also received cash compensation for serving as the chairman of the committees: our Audit Committee Chairman received an annual fee of $15,000, while our Nominating & Governance Committee Chairman and our Compensation Committee Chairman each received an annual fee of $10,000. We also reimbursed our non-employee directors for reasonable out-of-pocket expenses associated with travel to and attendance at our Board and committee meetings.
The following table discloses the compensation earned by and/or awarded to each of our non-employee directors in 2016.
Name | Fees Earned in Cash ($) | Share Awards ($) | Total ($) |
Sheldon Erickson(1) | 63,500 | — | 63,500 |
William Restrepo(1) | 179,000 | — | 179,000 |
Michael Roemer | 231,199 | — | 231,199 |
James Trimble (1) | 186,087 | — | 186,087 |
H. H. “Tripp” Wommack, III(1) | 219,297 | — | 219,297 |
Jay Golding (1) | 175,040 | — | 175,040 |
(1) | Messrs. Restrepo, Trimble, Wommack and Golding no longer serve as non-employee directors following our emergence from the Chapter 11 Proceeding, and Mr. Erickson resigned from the Board in May 2016. |
In connection with the Company’s emergence from the Chapter 11 Proceeding and in accordance with the Stockholders Agreement, the Stockholder Steering Committee initially set 2017 director compensation, which was subsequently ratified and approved by the Board. In 2017, cash compensation paid to our non-employee directors consists of an annual cash retainer of $87,500. Additionally, each non-employee director receives an annual equity retainer of $87,500 of restricted common stock, which restricted shares are subject to a ratable three year vesting period. Non-employee directors will also receive equity compensation for serving as the Chairman of the Board and Chairman of each Board committee, as follows:: (i) $50,000 to the Board Chairman; (ii) $20,000 to the Audit Committee Chairman; (iii) $15,000 to the Compensation Committee Chairman; and (iv) $15,000 to the Nominating & Governance Committee Chairman. Mr. Zawadzki does not receive compensation for serving as a director for so long as GSO has the right to designate directors for nomination pursuant to the Stockholders Agreement.
COMPENSATION COMMITTEE INTERLOCKS AND INSIDER PARTICIPATION
During 2016, no person who served as a member of the Compensation Committee served as an officer or employee of the Company, nor did any person who served as a member of the Compensation Committee have any relationship with the Company requiring disclosure herein. Additionally, none of our executive officers (including any person who served as an executive officer at any point in 2016) has served as a director or member of a compensation committee (or other committee
146
performing similar functions) of any other entity of which an executive officer served on our Board or our Compensation Committee.
Item 12. Security Ownership of Certain Beneficial Owners and Management and Related Shareholder Matters
Beneficial Ownership Information
The following table shows the amount of our common shares beneficially owned as of February 24, 2017 (unless otherwise indicated) by (1) each person known by us to own beneficially more than 5% of our common shares; (2) each of our Named Executive Officers, (3) each of our directors and (4) all of our current directors and executive officers as a group.
Name and Address of Beneficial Owner(1) | Aggregate Number of Shares Owned | Acquirable within 60 Days(4) | Percent of Class Outstanding(5) | |||
Solus Alternative Asset Management LP(2)(6) | 7,553,128 | — | 13.4 | % | ||
GSO Capital Solutions Fund II (Luxembourg) S.a.r.l(2)(7) | 7,520,635 | — | 13.4 | % | ||
Luxor Capital Group, LP(2)(8) | 4,099,414 | — | 7.3 | % | ||
D.E. Shaw & Company, L.P.(2)(9) | 3,728,642 | — | 6.6 | % | ||
BlueMountain Capital Management, LLC(2)(10) | 3,203,584 | — | 5.7 | % | ||
Magnetar Financial, LLC(2)(11) | 3,003,912 | — | 5.3 | % | ||
Donald Gawick(3) | 159,804 | 35,137 | * | |||
Mark Cashiola(3) | 65,249 | 9,740 | * | |||
E. Michael Hobbs(3) | 44,342 | 14,365 | * | |||
Edward Keppler(3) | 21,089 | 4,806 | * | |||
Danielle Hunter(3) | 41,561 | 8,994 | * | |||
Stuart Brightman(3) | 2,052 | — | * | |||
Michael Roemer(3) | 2,747 | 226 | * | |||
Michael Zawadzki(12) | — | — | — | |||
John Kennedy(3) | 2,403 | — | * | |||
Steven Mueller(3) | 2,403 | — | * | |||
Patrick Murray(3) | 3,224 | — | * | |||
Executive Officers and Directors as Group (14 persons) | 418,631 | 89,446 | * | |||
* | Represents less than 1% of the outstanding common stock. |
(1) | Except as otherwise indicated, the mailing address of each person or entity named in the table is C&J Energy Services, Inc, 3990 Rogerdale Rd., Houston, Texas 77042. |
(2) | Reflects information provided to the Company by such named person as of February 24, 2017. |
(3) | The number of shares beneficially owned by the named person includes (a) any shares of restricted stock, whether vested or unvested, held by such person and (b) any shares that could be purchased upon the exercise of options and/or warrants held by the named person as of February 24, 2017, or within 60 days after February 24, 2017. Unless otherwise indicated, each of the persons below has sole voting and investment power with respect to the shares beneficially owned by such person. |
(4) | Reflects the number of shares that could be purchased upon the exercise of options and/or warrants held by the named person as of February 24, 2017 or within 60 days after February 24, 2017. |
(5) | Based on 56,217,229 common shares estimated to be issued and outstanding as of February 24, 2017. |
(6) | Reflects shares of common stock directly held by certain funds and accounts (the “Solus Funds”) for which Solus Alternative Asset Management LP is the investment manager. Solus GP LLC is the general partner of Solus Alternative Asset Management LP, and Christopher Pucillo is the managing member of Solus GP LLC. Each of Solus Alternative Asset Management LP, Solus GP LLC and Christopher Pucillo may be deemed to have shared voting power and/or shared investment power with respect to the shares of common stock held by each Solus Fund. Each of the foregoing entities and individuals disclaims beneficial ownership of the shares |
147
of common stock described in this paragraph. The mailing address of each of the entities and persons identified in this paragraph is c/o Solus Alternative Asset Management LP, 410 Park Avenue, 11th Floor, New York, New York 10022.
(7) | Reflects securities directly held by GSO Capital Solutions Fund II (Luxembourg) S.a.r.l. (“GSO CSF II Lux”). The sole shareholder of GSO CSF II Lux is GSO Capital Solutions Fund II LP. The general partners of GSO Capital Solutions Fund II LP are GSO Capital Solutions Associates II (Delaware) LLC and GSO Capital Solutions Associates II (Cayman) Ltd. GSO Holdings I L.L.C. is the managing member of GSO Capital Solutions Associates II (Delaware) LLC and a shareholder of GSO Capital Solutions Associates II (Cayman) Ltd. Blackstone Holdings II L.P. is a managing member of GSO Holdings I L.L.C., an affiliate of GSO Capital Partners LP and The Blackstone Group L.P., with respect to securities beneficially owned by GSO Capital Solutions Associates II (Delaware) LLC. Blackstone Holdings I/II GP Inc. is the general partner of Blackstone Holdings II L.P. The Blackstone Group L.P. is the controlling shareholder of Blackstone Holdings I/II GP Inc. Blackstone Group Management L.L.C. is the general partner of The Blackstone Group L.P. Blackstone Group Management L.L.C. is wholly-owned by Blackstone's senior managing directors and controlled by its founder, Stephen A. Schwarzman. In addition, each of Bennett J. Goodman and J. Albert Smith III serves as an executive of GSO Holdings I L.L.C. and may be deemed to have shared voting power and/or investment power with respect to the securities held by GSO CSF II Lux. Each of the foregoing entities and individuals disclaims beneficial ownership of the shares held directly by GSO CSF II Lux (other than GSO CSF II Lux to the extent of its direct holdings). In the ordinary course of business, GSO Capital Partners LP and its affiliates, including Blackstone, manage, advise or sub-advise certain funds whose portfolio companies may have relationships with us. The address of GSO CSF II Lux is 345 Park Avenue, 31st Floor, New York, New York 10154. |
(8) | Consists of 4,099,414 shares of common stock held by Luxor Capital Group, LP. Luxor Capital Group, LP is an investment manager. Luxor Management, LLC is the general partner of Luxor Capital Group, LP. Christian Leone is the managing member of Luxor Management, LLC and may be deemed to beneficially own the shares beneficially owned by Luxor Capital Group, LP. |
(9) | Consists of (i) 2,417,773 shares of common stock held by D.E. Shaw Galvanic Portfolios, L.L.C. and (ii) 1,310,869 shares of common stock held by D.E. Shaw Valence Portfolios, L.L.C. (collectively, the “D.E. Shaw Funds”). David E. Shaw is the President and sole shareholder of D.E. Shaw & Co., Inc., which is the general partner of D.E. Shaw & Co., LP., which in turn is the managing member and investment advisor of D.E. Shaw Galvanic Portfolios, L.L.C. and D.E. Shaw Valence Portfolios, L.L.C. Each of D.E. Shaw & Co., LP, D.E. Shaw & Co., Inc. and David E. Shaw may be deemed to have shared voting power and/or investment power with respect to the shares of common stock held by each D.E Shaw Fund. Each of the foregoing entities and individuals disclaims beneficial ownership of the shares of common stock described in this paragraph other than each D.E. Shaw Fund to the extent of its direct holdings. The mailing address of each of the entities and persons identified in this paragraph is c/o D.E. Shaw & Co., L.P., 1166 Avenue of the Americas, Ninth Floor, New York, NY 10036, United States. |
(10) | Consists of (i) 1,739,369 shares of common stock held by Blue Mountain Credit Alternatives Master Fund L.P., (ii) 111,554 shares of common stock held by BlueMountain Kicking Horse Fund L.P., (iii) 316,956 shares of common stock held by BlueMountain Montenvers Master Fund SCA SICAV-SIF, (iv) 100,203 shares of common stock held by BlueMountain Guadalupe Peak Fund L.P., (v) 631,613 shares of common stock held by BlueMountain Summit Trading L.P., (vi) 97,838 shares of common stock held by BlueMountain Logan Opportunities Master Fund L.P. and (vii) 206,051 shares of common stock held by BlueMountain Foinaven Master Fund L.P. (collectively, the “BlueMountain Funds”). BlueMountain Capital Management, LLC is the investment manager of each BlueMountain Fund and may be deemed to have shared voting power and/or shared investment power with respect to the securities described in this paragraph. Members of the investment committee of BlueMountain Capital Management, LLC, which is made up of Andrew Feldstein, Derek Smith, Marina Lutova and David Zorub, may also be deemed to have shared voting power and/or shared investment power over the securities described in this paragraph. Each of the foregoing entities and persons disclaims beneficial ownership of the securities described in this paragraph other than each BlueMountain Fund to the extent of its direct holdings The mailing address of each of the entities and persons identified in this paragraph is c/o BlueMountain Capital Management, LLC, 280 Park Ave., 12th Floor, New York, New York 10017. |
(11) | Consists of 3,003,912 shares of common stock held by MTP Energy Fund Ltd (“Magnetar”). Magnetar may be deemed to have sole voting and investment power over the securities described in this paragraph and disclaims beneficial ownership of the shares of common stock described in this paragraph other than to the extent of its direct holdings. The mailing address of each of Magnetar is c/o MTP Energy Management LLC, 1603 Orrington Avenue, 13th Floor, Evanston, Illinois 60201. |
(12) | Michael Zawadzki is an employee of GSO Capital Partners LP and/or one of its affiliates. Mr. Zawadzki disclaims beneficial ownership of our common stock held by GSO CSF II Lux. |
Equity Compensation Plan Information
In accordance with the Restructuring Plan, 10% of the equity of the Company was reserved for a management incentive program to allow for the issuance of equity to management of the reorganized Company after emergence at the discretion of the Board. On January 12, 2017, the Board adopted the C&J Energy Services, Inc. 2017 Management Incentive Plan (the “MIP”), effective as of January 6, 2017, which provides that a maximum of 8,046,021 shares of our common stock may be issued or transferred pursuant to awards under the MIP. Persons eligible to receive awards under the MIP include our
148
non-employee directors, our employees and affiliates, and certain of our consultants and advisors. As of February 24, 2017, 838,384 shares of our common stock have been issued or are subject to outstanding awards under the MIP.
Upon the effective date of the Company’s emergence from the Chapter 11 Proceeding, the Company’s prior omnibus incentive plans were terminated, specifically (i) the 2015 Long Term Incentive Plan (as amended and in effect, the “2015 LTIP”); (ii) the 2012 Long-Term Incentive Plan, including the sub-plan titled the C&J International Middle East FZCO Phantom Equity Arrangement (the “2012 LTIP”); (iii) 2010 Stock Option Plan (the “2010 Option Plan”); and the 2006 Stock Option Plan (the “2006 Option Plan”, and together with the 2015 LTIP, 2012 LTIP and the 2010 Option Plan, the “Prior Plans”)). Awards that were previously outstanding under the Prior Plans were canceled effective on the Company’s emergence from the Chapter 11 Proceeding.
The following table sets forth certain information regarding the Prior Plans as of December 31, 2016:
Plan Category | Number of securities to be issued upon exercise of outstanding options, warrants and rights (A)(1) | Weighted-average exercise price of outstanding options, warrants and rights (B) | Number of securities remaining available for future issuance under equity compensation plans (excluding securities reflected in Column (A)) (C)(2)(3) | |||||||
Equity compensation plans approved by security holders(4) | 4,416,247 | $ | 13.18 | 11,276,328 | ||||||
Equity compensation plans not approved by security holders | — | — | — | |||||||
Total | 4,416,247 | $ | 13.18 | 11,276,328 | ||||||
(1) | Consists of (i) 311,500 non-qualified stock options issued and outstanding under the C&J Energy Services Ltd. 2006 Stock Option Plan (the “2006 Plan”), (ii) 3,899,076 non-qualified stock options issued and outstanding under the C&J Energy Services Ltd. 2010 Stock Option Plan (the “2010 Plan”), (iii) 71,866 non-qualified stock options issued and outstanding under the C&J Energy Services Ltd. 2012 Long-Term Incentive Plan (the “2012 LTIP”, and together with the 2006 Plan and the 2010 Plan, the "Prior Plans") and 133,805 non-qualified stock options issued and outstanding under the C&J Energy Services 2015 Long Term Incentive Plan (as amended to date, the “2015 LTIP”) |
(2) | Also excluded are 112,447 restricted shares issued and outstanding under the 2012 LTIP and 785,521 restricted shares issued and outstanding under the 2015 LTIP. |
(3) | The number of common shares available for issuance under the 2015 LTIP is subject to adjustment in the event of a reclassification, recapitalization, merger, consolidation, reorganization, spin-off, split-up, issuance of warrants, rights or debentures, stock dividend, stock split or reverse stock split, cash dividend, property dividend, combination or exchange of shares, repurchase of shares, change in corporate structure or any similar corporate event or transaction. The number of common shares available for issuance may also increase due to the termination of an award granted under the 2015 LTIP or the Prior Plans by expiration, forfeiture, cancellation or otherwise without the issuance of the common shares. |
(4) | The 2015 LTIP was approved and adopted effective as of March 23, 2015, contingent upon the consummation of the Nabors Merger. The 2015 LTIP served as an assumption of the 2012 LTIP, including the sub-plan titled the C&J International Middle East FZCO Phantom Equity Arrangement, with certain non-material revisions made and no increase in the number of shares remaining available for issuance under the 2012 LTIP. No additional awards will be granted under the Prior Plans. See Note 8 - Share-Based Compensation in Part II, Item 8 “Financial Statements and Supplementary Data” for additional information regarding these equity compensation plans. |
Item 13. Certain Relationships and Related Transactions, and Director Independence
Related Persons Transactions
Related Persons Transactions Policy
149
The Board has adopted a Related Persons Transactions Policy (the “Related Persons Transactions Policy”), which provides guidelines for the review of all transactions or arrangements involving the Company, on one side, and, on the other side, a person with a position of control over the Company (such as a director or senior officer of the Company), or a person or entity, who beneficially owns more than 5% of the Company’s common shares, as well as family members or affiliates of the aforementioned (each, a “Related Person”), to determine whether such persons have a direct or indirect material interest in the transaction. Specifically, the Related Persons Transactions Policy covers any transaction (i) in which the aggregate amount involved exceeds or may be expected to exceed $120,000 in any calendar year, (ii) the Company is or will be a participant and (iii) any Related Person, as defined below, has or will have a direct or indirect interest (other than solely as a result of being a director or a less than 10% beneficial owner of another entity). Related persons transactions are also subject to our Code of Conduct and Ethics, which restricts our directors, officers and employees from engaging in any business or conduct or entering into any agreement or arrangement that would give rise to an actual or potential conflict of interest. Under our Code of Conduct and Ethics, conflicts of interest occur when private or family interests interfere, or appear to interfere, in any way with our interests. We have processes for reporting actual or potential conflicts of interests, including related person transactions, under both our Code of Business Conduct and Ethics and our Related Persons Transactions Policy.
Under the terms of our Code of Business Conduct and Ethics, our General Counsel is primarily responsible for developing and implementing procedures and controls to obtain information from our directors, officers and employees with respect to any proposed transaction or arrangement that may constitute a potential conflict of interest, including with respect to related person transactions. Our General Counsel is required to report to the Board any actual or potential conflict of interest involving a director or officer, or a member of such person’s immediate family, and the Board will determine whether the possible conflict of interest indeed constitutes a conflict of interest. Board approval is required prior to the consummation of any proposed transaction or arrangement that is determined by the Board to constitute a conflict of interest. Any director who has an interest in the transaction will be recused from the review and approval process.
Pursuant to our Related Persons Transactions Policy, the Audit Committee is required to review the material facts and either approve or disapprove, those related persons transactions, in which (1) the aggregate amount involved exceeds, or is expected to exceed, $120,000 in any calendar year and (2) any Related Person has or will have a direct or indirect interest (other than solely as a result of being a director of, or holding less than a 10% beneficial ownership interest in, another entity). In determining whether to approve a related person transaction, the Audit Committee will take into account, among other factors it deems appropriate with respect to the particular transaction:
• | The nature and extent of the Related Person’s interest in the transaction; |
• | The material terms of the transaction, including, without limitation, the amount and type of transaction; |
• | Whether the transaction is on terms no less favorable than terms generally available to an unaffiliated third-party under the same or similar circumstances; |
• | The importance of the transaction to the Related Person; |
• | The importance of the transaction to us; and |
• | Whether the transaction would impair the judgment of a director or executive officer to act in the best interest of our Company. |
Thereafter, on at least an annual basis, the Audit Committee is required to review and assess any ongoing transaction, arrangement or relationship with the Related Person to confirm that such transaction, arrangement or relationship remains appropriate. Any member of the Audit Committee who is a Related Person with respect to the transaction will be recused from the review and approval process.
Transactions with Related Persons
Supply and Services Transactions
We utilize the services of certain saltwater disposal wells owned by Pyote Water Solutions, LLC, Pyote Water Systems, LLC, Pyote Water Systems II, LLC and Pyote Water Systems III, LLC (together “Pyote”) for the disposal of certain of our customers’ fluids associated with oil and gas production. Payments to Pyote totaled approximately $780,000 and $565,000 for the years ended December 31, 2016 and December 31, 2015, respectively. Mr. H. H. “Tripp” Wommack, III, a former
150
member of our Board who served from March 24, 2015 until December 16, 2016, serves as Chairman of the Board of Governors, President and Chief Manager of Pyote.
In addition, we provide certain workover rig services, fluid hauling services and plug and abandonment services to Pyote. Payments from Pyote totaled approximately $284,000 for the year ended December 31, 2015. We plan to continue our relationship with Pyote for the foreseeable future.
Transactions Related to the Nabors Merger
Following the closing of the Nabors Merger in March 2015, Nabors was considered a “related person” of the Company for purposes of Item 404 of Regulation S-K due to Nabors’s ownership of approximately 52% of the Company’s common shares, although those shares were canceled in the Chapter 11 Proceeding and Nabors ceased to be a shareholder as of January 6, 2017. Nabors’ Chief Financial Officer, William Restrepo, also served on our Board from the closing of the Nabors Merger in March 2015 through January 6, 2017.
Since the closing of the Nabors Merger and continuing to date, we lease certain properties from Nabors, and Nabors leases certain properties from us. For the year ended December 31, 2016, we incurred obligations to Nabors of approximately $640,000 under the leases, and Nabors incurred obligations to us of approximately $62,000 under the leases. We plan to continue the leasing arrangements with Nabors for the foreseeable future.
Additionally, following the closing of the Nabors Merger through December 2016, we provided certain services to Shehtah Nabors LP, a Nabors partnership with a third party, pursuant to a Management Agreement and a Cash Flow Sharing Agreement (collectively, “Shehtah Agreements”). Nabors incurred obligations to us of approximately $1.8 million under the Shehtah Agreements during 2016. In connection with our Chapter 11 Proceeding, we entered into a settlement agreement with Nabors which provided, among other things, for the cancellation of outstanding amounts owed between the parties under the leases and the Shehtah Agreements, as well as the termination of certain contracts with continuing obligations between the parties relating to the Nabors Merger.
Transactions Related to Chapter 11
Rights Offering, Backstop Commitment Agreement
On December 6, 2016, we entered into a Backstop Commitment Agreement with the Backstop Parties, which include certain of our significant stockholders, pursuant to which the Backstop Parties agreed to backstop a $200 million cash investment in the Company pursuant to the Rights Offering conducted in accordance with the Restructuring Plan.
In accordance with the Restructuring Plan, the Backstop Commitment Agreement and the Rights Offering procedures, we offered eligible creditors, including the Backstop Parties, the right to purchase common stock upon emergence from the Chapter 11 Proceeding for an aggregate purchase price of $200 million.
The Rights Offering, which commenced on November 15, 2016 and ended on December 9, 2016, provided holders of eligible secured claims under our prior credit agreement as of the record date set therefor to be granted rights entitling each such holder to subscribe to purchase an amount of common stock (the “Rights Offering Shares”), up to such holders’ respective pro rata share of such eligible secured claims. The Rights Offerings Shares, collectively, reflect an aggregate purchase price of $200 million at the per share price of $13.58.
Under the Backstop Commitment Agreement, the Backstop Parties agreed to purchase, severally and not jointly, the Rights Offering Shares that were not duly subscribed to by parties other than Backstop Parties pursuant to the Rights Offering at the same per share price as the Rights Offering (the “Backstop Commitment”).
We paid the Backstop Parties on the Plan Effective Date a put option premium equal to 5% of the $200 million committed amount as the Put Option Premium in the form of common stock at the same per share price offered in the Rights Offering. All amounts paid to the Backstop Parties in their capacities as such for the Put Option Premium were paid pro rata based on the amount of their respective Backstop Commitments on the Closing Date (as compared to the aggregate Backstop Commitment of all Backstop Parties).
As a condition to the closing of the transactions contemplated by the Backstop Commitment Agreement, we entered into the Registration Rights Agreement with the Backstop Parties entitling such Backstop Parties to request that the
151
Company register their securities for sale under the Securities Act at various times and upon the terms and conditions set forth in the Registration Rights Agreement.
Registration Rights Agreement
We are party to a Registration Rights Agreement with the Backstop Parties, which include certain of our significant stockholders. The Registration Rights Agreement requires us to file a shelf registration statement within 10 calendar days after the date that we file our Annual Report on Form 10-K for the year ended December 31, 2016 or the latest date we would be required to file a Form 10-K specified in the SEC’s rules and regulations applicable to non-accelerated filers. The Registration Rights Agreement also provides the registration rights holders the ability to demand registrations or underwritten shelf takedowns subject to certain requirements and exceptions.
In addition, if we propose to register shares of our common stock in certain circumstances, the registration rights holders will have certain “piggyback” registration rights, subject to restrictions set forth in the Registration Rights Agreement, to include their shares of common stock in the registration statement.
Parties to the Registration Rights Agreement who collectively have beneficial ownership of a majority of the registrable securities may, beginning 60 days after the Plan Effective Date, request for us to use reasonable best efforts to relist on a national securities exchange within 60 days of such request so long as we meet the eligibility requirements for a national securities exchange acceptable to such registration rights holders.
Stockholders Agreement
We are party to a Stockholders Agreement with certain funds affiliated with and/or managed by each of GSO, Solus, and BlueMountain (each a Holder).
The Stockholders Agreement provides that the Board will consist of seven directors and grants rights to designate nominees to serve as directors to GSO and Solus as follows: (a) GSO may designate up to three directors for nomination to the Board and (b) Solus may designate up to two directors for nomination to the Board and may also designate one non-voting observer to the Board. In addition, the Board or a nominating committee thereof shall designate our Chief Executive Officer and one other director for nomination to the Board.
Certain significant actions by us require the consent of one or more of the Holders. These actions include, but are not limited to, the issuance of equity securities of the Company representing more than 10% of the shares of common stock issued pursuant to the Restructuring Plan (excluding shares of common stock issued pursuant to New Warrants), the incurrence of indebtedness in excess of $100 million in the aggregate, the consummation of acquisitions greater than $100 million and any voluntary registration of our common stock under Section 12 of the Exchange Act. Under the Stockholders Agreement, the Holders will be entitled to certain preemptive rights upon the issuance of certain types of equity or debt securities by the Company.
The Stockholders Agreement provides that it will terminate automatically (i) immediately prior to the registration of the shares of common stock pursuant to Section 12(b) of the Exchange Act in connection with (A) our common stock being listed on the NASDAQ Global Market, the NASDAQ Global Select Market or the New York Stock Exchange or (B) the closing of a firmly underwritten Public Offering (as defined therein), or (ii) upon the occurrence of both (A) each of GSO and Solus holding less than 5% of the outstanding common stock and (B) all Holders collectively holding less than 20% of the outstanding common stock.
DIRECTOR INDEPENDENCE
From our initial public offering in July 2011 through delisting in July 2016 as a result of filing the Chapter 11 Proceeding, we were a publicly traded company on the NYSE. During our tenure as a NYSE-listed company, we were required to comply with the rules of the NYSE and were subject to the related rules and regulations of the SEC, including Sarbanes-Oxley. Although we have not been listed on a national exchange for a period of time as a result of the Chapter 11 Proceeding, we have continued to look to the NYSE regulations for guidance, among other reasons, as a matter of best practices. Furthermore, on February 28, 2016, our common stock was approved for listing on the NYSE MKT and is expected to begin trading under the symbol "CJ" on March 6, 2017.
The NYSE rules require listed companies to have a board of directors with at least a majority of independent directors. Additionally, each of the Audit Committee, Compensation Committee and Nominating & Governance Committee are
152
required to be comprised solely of independent directors, as that term is defined by the applicable rules and regulations of the NYSE and SEC. Rather than adopting categorical standards, each year our Board assessed director independence on a case-by-case basis, in each case consistent with the applicable rules and regulations of the SEC and the NYSE.
After reviewing all relationships each director has with the Company, including the nature and extent of any business relationships between the Company and such person, our Predecessor’s board of directors affirmatively determined that each person who served on our Predecessor’s board of directors during 2016 was “independent” as that term is defined under the applicable rules and regulations of the SEC and the NYSE, with the exception of the following persons due to the their role with the Company: (i) Mr. Comstock, the Company’s Founder and former Chairman and Chief Executive Officer (terminated from the Board in March 2016); (ii) Mr. McMullen, the Company’s former Chief Executive Officer (as successor to Mr. Comstock), President and Chief Financial Officer (terminated from the Board in March 2016); and (iii) Mr. Gawick, the Company’s current Chief Executive Officer (as successor to Mr. McMullen). Additionally, Mr. William Restrepo was not considered to be independent due to his employment as an executive officer of Nabors, which beneficially owned approximately 52% of our common shares as a result of the Nabors Merger.
In connection with the appointment of the current Board, the Board assessed the independence of each director in accordance with the rules and regulations of the SEC and the NYSE, even though we were not at that time and continue to not be a publicly traded company. After reviewing all relationships each director has with the Company, including the nature and extent of any business relationships between the Company and such person, the Board affirmatively determined that each of Messrs. Murray, Brightman, Kennedy, Mueller, Roemer and Zawadzki has no material relationships with the Company and, therefore, is “independent” as defined under the applicable rules and regulations of the SEC and the NYSE. Mr. Zawadzki is employed by GSO, a significant shareholder of the Company, and was designated for nomination to the Board by GSO pursuant to the Stockholders Agreement. Mr. Gawick, our President and Chief Executive Officer, is not considered to be “independent” because of his employment position with the Company.
Item 14. Principal Accounting Fees and Services
Audit and other fee information
Set forth below is a summary of certain fees paid to KPMG for services related to the fiscal years ended December 31, 2016 and December 31, 2015. In determining the independence of KPMG, Old C&J's Audit Committee considered whether the provision of non-audit services is compatible with maintaining KPMG's independence.
2016 | 2015 | |||||||
Audit fees | $ | 1,938,086 | $ | 2,361,750 | ||||
Audit related fees | 20,000 | 140,000 | ||||||
Tax fees | 4,357 | 52,977 | ||||||
Total | $ | 1,962,443 | $ | 2,554,727 | ||||
Audit fees
Audit fees consisted of amounts incurred for services performed in association with the annual financial statement audit, fees related to the audit of internal controls over financial reporting under Section 404 of Sarbanes-Oxley, review of financial statements included in the Company's Quarterly Reports on Form 10-Q, and other services normally provided by the Company's independent registered public accounting firm in connection with regulatory filings or engagements for the fiscal years shown.
Audit related fees
Audit related fees consisted of amounts incurred for accounting consultation in connection with the Nabors Merger.
Tax Fees
Tax fees consisted of services provided for sales and use tax planning
Policy on Audit Committee Pre-Approval of Audit and Non-Audit Services
153
All of the services described above were pre-approved by the Old C&J Audit Committee pursuant to paragraph (c)(7)(i)(C) of Rule 2-01 of Regulation S-X under the Exchange Act, to the extent that rule was applicable during fiscal years 2014 and 2015.
On March 24, 2016, the Old C&J Audit Committee adopted a policy requiring pre-approval by the Audit Committee of all services (audit, tax and non-audit) to be provided to the Company by our independent registered public accounting firm, in each case subject to a specific budget. In accordance with this Pre-Approval Policy, in April 2015 our Audit Committee gave its annual approval for the provision of such services by KPMG for the 2015 fiscal year. Additionally, in February 2016, in accordance with this Pre-Approval Policy, the Audit Committee gave its annual approval for the provision of such services by KPMG for the 2016 fiscal year. Any proposed services to be provided by the independent registered public accounting firm not covered by one of these approvals, including proposed services exceeding pre-approved budget levels, requires special pre-approval by our Audit Committee. In certain circumstances and for certain services, our Audit Committee delegates its responsibilities to pre-approve services performed by the independent registered public accounting firm to the Chairman of our Audit Committee. However, our Audit Committee does not under any circumstance delegate its responsibilities to pre-approve services performed by the independent registered public accounting firm to management.
Prior to the adoption of the current Pre-Approval Policy, the Company’s Audit Committee had adopted a policy requiring pre-approval of all services (audit, tax and non-audit) to be provided to the Company by our independent registered public accounting firm, which policy was substantially the same as the Pre-Approval Policy currently in effect. In accordance with this policy, our Audit Committee has given its annual approval for the provision of audit services by KPMG through December 31, 2016.
KPMG does not provide any internal audit services to us.
154
PART IV
Item 15. Exhibits, Financial Statement Schedules
(a)(1) Financial Statements
Our Consolidated Financial Statements and accompanying footnotes are included under Part II, Item 8 “Financial Statements and Supplementary Data” of this Annual Report.
(a)(2) Financial Statements Schedules
All other schedules have been omitted because they are either not applicable, not required or the information called for therein appears in the consolidated financial statements or notes thereto or will be filed within the required timeframe.
(a)(2) Exhibits
The following documents are included as exhibits to this Annual Report:
Exhibit No. | Description of Exhibit. | ||
2.1 | Second Amended Joint Plan of Reorganization (as Modified) of CJ Holding Company, et al., Pursuant to Chapter 11 of the Bankruptcy Code, dated December 15, 2016 (incorporated by reference to Exhibit 2.1 to the Current Report on Form 8-K filed by C&J Energy Services Ltd. on December 22, 2016 (File No. 000-55404)). | ||
3.1 | Amended and Restated Certificate of Incorporation of C&J Energy Services, Inc. (incorporated by reference to Exhibit 3.1 to the Registrant’s Current Report on Form 8-K filed on January 6, 2017(File No. 000-55404)). | ||
3.2 | Bylaws of C&J Energy Services, Inc. (incorporated by reference to Exhibit 3.2 to the Registrant’s Current Report on Form 8-K filed on January 6, 2017(File No. 000-55404)). | ||
3.3 | Certificate of Designation of Series A Participating Cumulative Preferred Stock of C&J Energy Services, Inc. (incorporated by reference to Exhibit 3.1 to the Registrant’s Current Report on Form 8-K filed on January 9, 2017 (File No. 000-55404)). | ||
4.1 | Form of specimen Warrant certificate (incorporated by reference to Exhibit 4.1 to the Registrant’s Current Report on Form 8-K filed on January 6, 2017(File No. 000-55404)). | ||
4.2 | Warrant Agreement, dated as of January 6, 2017, by and between C&J Energy Services, Inc. and American Stock Transfer & Trust Company, LLC, as warrant agent (incorporated by reference to Exhibit 10.2 to the Registrant’s Current Report on Form 8-K filed on January 6, 2017(File No. 000-55404)). | ||
4.3 | Stockholders Agreement, dated as of January 6, 2017, by and among C&J Energy Services, Inc. and the parties thereto (incorporated by reference to Exhibit 10.3 to the Registrant’s Current Report on Form 8-K filed on January 6, 2017(File No. 000-55404)). | ||
*4.4 | Amendment No. 1 to Stockholders Agreement, dated as of February 27, 2017, by and among C&J Energy Services, Inc. and the parties thereto. | ||
4.5 | Registration Rights Agreement, dated as of January 6, 2017, by and among C&J Energy Services, Inc. and the parties thereto (incorporated by reference to Exhibit 10.4 to the Registrant’s Current Report on Form 8-K filed on January 6, 2017(File No. 000-55404)). | ||
4.6 | Rights Agreement, dated as of January 6, 2017, between C&J Energy Services, Inc. and American Stock Transfer & Trust Company, LLC, as Rights Agent, which includes the Form of Certificate of Designation of Series A Participating Cumulative Preferred Stock of C&J Energy Services, Inc. as Exhibit A, the Summary of Terms of Rights Agreement as Exhibit B and the Form of Right Certificate as Exhibit C (incorporated by reference to Exhibit 4.1 to the Registrant’s Current Report on Form 8-K filed on January 9, 2017(File No. 000-55404)). | ||
155
10.1 | Credit Agreement, dated as of January 6, 2017, by and among C&J Energy Services, Inc., the lenders party thereto and PNC Bank, National Association, as administrative agent. (incorporated by reference to Exhibit 10.1 to the Registrant’s Current Report on Form 8-K filed on January 6, 2017(File No. 000-55404)). | ||
10.2+ | C&J Energy Services, Inc. 2017 Management Incentive Plan. (incorporated by reference to Exhibit 10.1 to the Registrant’s Current Report on Form 8-K filed on January 13, 2017(File No. 000-55404)). | ||
10.3+ | First Amendment to the C&J Energy Services, Inc. 2017 Management Incentive Plan (incorporated by reference to Exhibit 10.1 to the Registrant’s Current Report on Form 8-K filed on February 6, 2017(File No. 000-55404)). | ||
10.4+ | Restricted Share Agreement (C&J Executive Employment Agreements) under the 2017 Management Incentive Plan (incorporated by reference to Exhibit 10.2 to the Registrant’s Current Report on Form 8-K filed on February 6, 2017(File No. 000-55404)). | ||
10.5+ | Restricted Share Agreement (Restrictive Covenants) under the 2017 Management Incentive Plan (incorporated by reference to Exhibit 10.3 to the Registrant’s Current Report on Form 8-K filed on February 6, 2017(File No. 000-55404)). | ||
10.6+ | Restricted Share Agreement (Non-Employee Directors) under the 2017 Management Incentive Plan (incorporated by reference to Exhibit 10.4 to the Registrant’s Current Report on Form 8-K filed on February 6, 2017(File No. 000-55404)). | ||
10.7+ | Nonqualified Stock Option Agreement (C&J Executive Employment Agreements) under the 2017 Management Incentive Plan (incorporated by reference to Exhibit 10.5 to the Registrant’s Current Report on Form 8-K filed on February 6, 2017(File No. 000-55404)). | ||
10.8+ | Nonqualified Stock Option Agreement (Restrictive Covenants) under the 2017 Management Incentive Plan (incorporated by reference to Exhibit 10.6 to the Registrant’s Current Report on Form 8-K filed on February 6, 2017(File No. 000-55404)). | ||
10.9 | Tax Matters Agreement, dated as of March 24, 2015, by and between Nabors Industries Ltd. and Nabors Red Lion Limited (incorporated herein by reference to Exhibit 10.2 to C&J Energy Services Ltd.’s Current Report on Form 8-K12G3, filed on March 25, 2015 (File No. 000-55404)). | ||
* 21.1 | List of Subsidiaries of C&J Energy Services, Inc. | ||
* 23.1 | Consent of KPMG LLP | ||
* 31.1 | Certification of Chief Executive Officer pursuant to Rule 13a-14(a) and 15d-14(a) as adopted pursuant to Section 302 of the Sarbanes-Oxley Act of 2002 | ||
* 31.2 | Certification of Chief Financial Officer pursuant to Rule 13a-14(a) and 15d-14(a) as adopted pursuant to Section 302 of the Sarbanes-Oxley Act of 2002 | ||
** 32.1 | Certification of Chief Executive Officer pursuant to 18 U.S.C. §1350 as adopted by Section 906 of the Sarbanes-Oxley Act of 2002 | ||
** 32.2 | Certification of Chief Financial Officer pursuant to 18 U.S.C. §1350 as adopted by Section 906 of the Sarbanes-Oxley Act of 2002 | ||
*§101.INS | XBRL Instance Document | |
*§101.SCH | XBRL Taxonomy Extension Schema Document | |
* §101.CAL | XBRL Taxonomy Extension Calculation Linkbase Document | |
* §101.LAB | XBRL Taxonomy Extension Label Linkbase Document | |
* §101.PRE | XBRL Taxonomy Extension Presentation Linkbase Document | |
* §101.DEF | XBRL Taxonomy Extension Definition Linkbase Document | |
* | Filed herewith |
** | Furnished herewith in accordance with Item 601(b)(32) of Regulation S-K |
+ | Management contract or compensatory plan or arrangement |
156
SIGNATURES
Pursuant to the requirements of the Securities Exchange Act of 1934, the registrant has duly caused this report to be signed on its behalf by the undersigned thereunto duly authorized, this 2nd day of March, 2017.
C&J Energy Services, Inc. | ||
By: | /s/ Mark C. Cashiola | |
Mark C. Cashiola | ||
Chief Financial Officer | ||
(Principal Financial Officer and Principal Accounting Officer) | ||
By: | /s/ Danielle E. Hunter | |
Danielle E. Hunter | ||
Executive Vice President, General Counsel, Chief Risk and Compliance Officer and Corporate Secretary | ||
Pursuant to the requirements of the Securities Exchange Act of 1934, this report has been signed below by the following persons on behalf of the registrant and in the capacities and on the dates indicated.
157
Signatures and Capacities | Date | |||||
By: | /s/ Donald J. Gawick | March 2, 2017 | ||||
Donald J. Gawick, President and Chief Executive Officer and Director | ||||||
(Principal Executive Officer) | ||||||
By: | /s/ Mark C. Cashiola | March 2, 2017 | ||||
Mark C. Cashiola, Chief Financial Officer | ||||||
(Principal Financial Officer and Principal Accounting Officer) | ||||||
By: | /s/ Patrick Murray | March 2, 2017 | ||||
Patrick Murray, Director and Chairman of the Board | ||||||
By: | /s/ Stuart Brightman | March 2, 2017 | ||||
Stuart Brightman, Director | ||||||
By: | /s/ John Kennedy | March 2, 2017 | ||||
John Kennedy, Director | ||||||
By: | /s/ Steven Mueller | March 2, 2017 | ||||
Steven Mueller, Director | ||||||
By: | /s/ Michael Roemer | March 2, 2017 | ||||
Michael Roemer, Director | ||||||
By: | /s/ Michael Zawadzki | March 2, 2017 | ||||
Michael Zawadzki, Director | ||||||
158
EXHIBIT INDEX
The following documents are included as exhibits to this Annual Report.
Exhibit No. | Description of Exhibit. | ||
2.1 | Second Amended Joint Plan of Reorganization (as Modified) of CJ Holding Company, et al., Pursuant to Chapter 11 of the Bankruptcy Code, dated December 15, 2016 (incorporated by reference to Exhibit 2.1 to the Current Report on Form 8-K filed by C&J Energy Services Ltd. on December 22, 2016 (File No. 000-55404)). | ||
3.1 | Amended and Restated Certificate of Incorporation of C&J Energy Services, Inc. (incorporated by reference to Exhibit 3.1 to the Registrant’s Current Report on Form 8-K filed on January 6, 2017(File No. 000-55404)). | ||
3.2 | Bylaws of C&J Energy Services, Inc. (incorporated by reference to Exhibit 3.2 to the Registrant’s Current Report on Form 8-K filed on January 6, 2017(File No. 000-55404)). | ||
3.3 | Certificate of Designation of Series A Participating Cumulative Preferred Stock of C&J Energy Services, Inc. (incorporated by reference to Exhibit 3.1 to the Registrant’s Current Report on Form 8-K filed on January 9, 2017 (File No. 000-55404)). | ||
4.1 | Form of specimen Warrant certificate (incorporated by reference to Exhibit 4.1 to the Registrant’s Current Report on Form 8-K filed on January 6, 2017(File No. 000-55404)). | ||
4.2 | Warrant Agreement, dated as of January 6, 2017, by and between C&J Energy Services, Inc. and American Stock Transfer & Trust Company, LLC, as warrant agent (incorporated by reference to Exhibit 10.2 to the Registrant’s Current Report on Form 8-K filed on January 6, 2017(File No. 000-55404)). | ||
4.3 | Stockholders Agreement, dated as of January 6, 2017, by and among C&J Energy Services, Inc. and the parties thereto (incorporated by reference to Exhibit 10.3 to the Registrant’s Current Report on Form 8-K filed on January 6, 2017(File No. 000-55404)). | ||
*4.4 | Amendment No. 1 to Stockholders Agreement, dated as of February 27, 2017, by and among C&J Energy Services, Inc. and the parties thereto. | ||
4.5 | Registration Rights Agreement, dated as of January 6, 2017, by and among C&J Energy Services, Inc. and the parties thereto (incorporated by reference to Exhibit 10.4 to the Registrant’s Current Report on Form 8-K filed on January 6, 2017(File No. 000-55404)). | ||
4.6 | Rights Agreement, dated as of January 6, 2017, between C&J Energy Services, Inc. and American Stock Transfer & Trust Company, LLC, as Rights Agent, which includes the Form of Certificate of Designation of Series A Participating Cumulative Preferred Stock of C&J Energy Services, Inc. as Exhibit A, the Summary of Terms of Rights Agreement as Exhibit B and the Form of Right Certificate as Exhibit C (incorporated by reference to Exhibit 4.1 to the Registrant’s Current Report on Form 8-K filed on January 9, 2017(File No. 000-55404)). | ||
10.1 | Credit Agreement, dated as of January 6, 2017, by and among C&J Energy Services, Inc., the lenders party thereto and PNC Bank, National Association, as administrative agent. (incorporated by reference to Exhibit 10.1 to the Registrant’s Current Report on Form 8-K filed on January 6, 2017(File No. 000-55404)). | ||
10.2+ | C&J Energy Services, Inc. 2017 Management Incentive Plan. (incorporated by reference to Exhibit 10.1 to the Registrant’s Current Report on Form 8-K filed on January 13, 2017(File No. 000-55404)). | ||
10.3+ | First Amendment to the C&J Energy Services, Inc. 2017 Management Incentive Plan (incorporated by reference to Exhibit 10.1 to the Registrant’s Current Report on Form 8-K filed on February 6, 2017(File No. 000-55404)). | ||
10.4+ | Restricted Share Agreement (C&J Executive Employment Agreements) under the 2017 Management Incentive Plan (incorporated by reference to Exhibit 10.2 to the Registrant’s Current Report on Form 8-K filed on February 6, 2017(File No. 000-55404)). | ||
10.5+ | Restricted Share Agreement (Restrictive Covenants) under the 2017 Management Incentive Plan (incorporated by reference to Exhibit 10.3 to the Registrant’s Current Report on Form 8-K filed on February 6, 2017(File No. 000-55404)). | ||
10.6+ | Restricted Share Agreement (Non-Employee Directors) under the 2017 Management Incentive Plan (incorporated by reference to Exhibit 10.4 to the Registrant’s Current Report on Form 8-K filed on February 6, 2017(File No. 000-55404)). | ||
10.7+ | Nonqualified Stock Option Agreement (C&J Executive Employment Agreements) under the 2017 Management Incentive Plan (incorporated by reference to Exhibit 10.5 to the Registrant's Current Report on Form 8-K filed on February 6, 2017 (File No. 000-55404)). | ||
159
10.8+ | Nonqualified Stock Option Agreement (Restrictive Covenants) under the 2017 Management Incentive Plan (incorporated by reference to Exhibit 10.6 to the Registrant’s Current Report on Form 8-K filed on February 6, 2017(File No. 000-55404)). | ||
10.9 | Tax Matters Agreement, dated as of March 24, 2015, by and between Nabors Industries Ltd. and Nabors Red Lion Limited (incorporated herein by reference to Exhibit 10.2 to C&J Energy Services Ltd.’s Current Report on Form 8-K12G3, filed on March 25, 2015 (File No. 000-55404)). | ||
* 21.1 | List of Subsidiaries of C&J Energy Services, Inc. | ||
* 23.1 | Consent of KPMG LLP | ||
* 31.1 | Certification of Chief Executive Officer pursuant to Rule 13a-14(a) and 15d-14(a) as adopted pursuant to Section 302 of the Sarbanes-Oxley Act of 2002 | ||
* 31.2 | Certification of Chief Financial Officer pursuant to Rule 13a-14(a) and 15d-14(a) as adopted pursuant to Section 302 of the Sarbanes-Oxley Act of 2002 | ||
** 32.1 | Certification of Chief Executive Officer pursuant to 18 U.S.C. §1350 as adopted by Section 906 of the Sarbanes-Oxley Act of 2002 | ||
** 32.2 | Certification of Chief Financial Officer pursuant to 18 U.S.C. §1350 as adopted by Section 906 of the Sarbanes-Oxley Act of 2002 | ||
* §101.INS | XBRL Instance Document | ||
* §101.SCH | XBRL Taxonomy Extension Schema Document | ||
* §101.CAL | XBRL Taxonomy Extension Calculation Linkbase Document | ||
* §101.LAB | XBRL Taxonomy Extension Label Linkbase Document | ||
* §101.PRE | XBRL Taxonomy Extension Presentation Linkbase Document | ||
* §101.DEF | XBRL Taxonomy Extension Definition Linkbase Document | ||
* | Filed herewith |
** | Furnished herewith in accordance with Item 601(b)(32) of Regulation S-K |
+ | Management contract or compensatory plan or arrangement |
160