Attached files
| file | filename |
|---|---|
| 8-K - 8-K - APARTMENT INVESTMENT & MANAGEMENT CO | a8-kq12018earningsrelease.htm |

Page
Earnings Release | ||
Addendum A: Philadelphia Market Profile | ||
Consolidated Statements of Operations | ||
Consolidated Balance Sheets | ||
Schedule 1 – Funds From Operations and Adjusted Funds From Operations Reconciliation | ||
Schedule 2 – Funds From Operations and Adjusted Funds From Operations Information | ||
Schedule 3 – Property Net Operating Income | ||
Schedule 4 – Apartment Home Summary | ||
Schedule 5 – Capitalization and Financial Metrics | ||
Schedule 6 – Same Store Operating Results | ||
Schedule 7 – Real Estate Portfolio Data by Market | ||
Schedule 8 – Disposition and Acquisition Activity | ||
Schedule 9 – Real Estate Capital Additions Information | ||
Schedule 10 – Redevelopment/Development Portfolio | ||
Glossary and Reconciliations of Non-GAAP Financial and Operating Measures | ||

Aimco Reports First Quarter Results
Denver, Colorado, May 7, 2018 - Apartment Investment and Management Company (“Aimco”) (NYSE: AIV) announced today first quarter results for 2018.
Chairman and Chief Executive Officer Terry Considine comments: “Aimco had a solid first quarter. Operating results were on target, occupancy was up year-over-year, with high resident retention resulting from Aimco focus on customer selection and satisfaction. Average monthly revenue per apartment home reached $2,052, up 7% year-over-year. And Aimco was recognized as a top workplace in Colorado for the sixth consecutive year.
“Aimco agreed to $600 million in acquisitions: Bent Tree Apartments in Fairfax County, Virginia, and six properties in the Philadelphia area. Aimco plans to fund these acquisitions by the sale of its Asset Management business, the sale of Chestnut Hill Village and four Affordable properties, and issuance of OP Units at $53 per share.”
Chief Financial Officer Paul Beldin adds: “First quarter 2018 AFFO of $0.54 per share was $0.02 per share ahead of the midpoint of our guidance range and Pro forma FFO of $0.60 per share was $0.01 ahead of the midpoint of guidance. AFFO was ahead of the midpoint primarily due to stronger operations, including the contribution from Bent Tree, and the timing of capital projects moved to later in 2018. Aimco is updating its full year 2018 guidance to reflect both first quarter results and the effect of year-to-date transactions. We now expect AFFO to be in the range of $2.08 to $2.18 per share.”
Financial Results: First Quarter Pro forma FFO Up 3%; AFFO Up 6%
FIRST QUARTER | |||||||||||
(all items per common share - diluted) | 2018 | 2017 | Variance | ||||||||
Net income | $ | 0.52 | $ | 0.07 | 643 | % | |||||
Funds From Operations (FFO) / Pro forma Funds From Operations (Pro forma FFO) | $ | 0.60 | $ | 0.58 | 3 | % | |||||
Deduct Aimco share of Capital Replacements | $ | (0.06 | ) | $ | (0.07 | ) | (14 | %) | |||
Adjusted Funds From Operations (AFFO) | $ | 0.54 | $ | 0.51 | 6 | % | |||||
Net Income (per diluted common share) - Year-over-year, first quarter net income increased due to higher gains on the sale of apartment communities and a higher tax benefit resulting from an intercompany transfer of assets related to the Asset Management business.
Pro forma FFO (per diluted common share) - Aimco’s first quarter Pro forma FFO increased by $0.02 per share, or 3%, on a year-over-year basis. Property results contributed the following to Pro forma FFO:
• | $0.02 from Same Store Property Net Operating Income growth of 2.7%, driven by a 2.6% increase in revenue, offset by a 2.1% increase in expenses; and |
• | $0.01 from leasing activity related to renovated homes at Redevelopment communities, the second quarter 2017 reacquisition of a 47% interest in the Palazzo communities, and the first quarter 2018 acquisition of Bent Tree Apartments, offset in part by lower Property Net Operating Income from apartment communities sold in 2018 and 2017. |
As compared to 2017, higher legal costs and other factors reduced Pro forma FFO by $0.01.
Adjusted Funds From Operations (per diluted common share) - The $0.02 increase year-over-year in Pro forma FFO per share plus $0.01 in lower capital replacement spending due to fewer apartment homes increased AFFO per share by $0.03, or 6%.
| 2 |
Operating Results: First Quarter Same Store NOI Up 2.7%
FIRST QUARTER | ||||||||||
Year-over-Year | Sequential | |||||||||
2018 | 2017 | Variance | 4th Qtr. | Variance | ||||||
Average Rent per Apartment Home | $1,808 | $1,762 | 2.6 | % | $1,802 | 0.3 | % | |||
Other Income per Apartment Home* | 105 | 109 | (3.7 | %) | 109 | (3.7 | %) | |||
Average Revenue per Apartment Home* | $1,913 | $1,871 | 2.2 | % | $1,911 | 0.1 | % | |||
Average Daily Occupancy | 96.3 | % | 96.0 | % | 0.3 | % | 96.3 | % | — | % |
$ in Millions | ||||||||||
Revenue, before utility reimbursements | $144.9 | $141.2 | 2.6 | % | $144.8 | 0.1 | % | |||
Expenses, net of utility reimbursements | 38.9 | 38.1 | 2.1 | % | 35.6 | 9.4 | % | |||
NOI | $106.0 | $103.1 | 2.7 | % | $109.2 | (3.0 | %) | |||
* | In 2018, Aimco changed its presentation of revenues and expenses to reflect utilities costs net of amounts reimbursed by residents, which were previously included in revenue. 2017 amounts have been revised to conform to this presentation. |
Same Store Rental Rates - Aimco measures changes in rental rates by comparing, on a lease-by-lease basis, the rate on a newly executed lease to the rate on the expiring lease for that same apartment. Newly executed leases are classified either as a new lease, where a vacant apartment is leased to a new customer, or as a renewal. The table below details changes in new and renewal lease rates.
2018 | Jan | Feb | Mar | 1st Qtr. | ||||
Renewal rent increases | 5.1 | % | 4.9 | % | 4.8 | % | 4.9 | % |
New lease rent increases | (0.1 | %) | 0.4 | % | 0.6 | % | 0.4 | % |
Weighted average rent increases | 2.6 | % | 2.7 | % | 2.7 | % | 2.7 | % |
Average Daily Occupancy | 96.3 | % | 96.2 | % | 96.2 | % | 96.3 | % |
Redevelopment
Redevelopment is Aimco’s second line of business where Aimco creates value by repositioning communities within the Aimco portfolio. Aimco also undertakes ground-up development when warranted by risk-adjusted investment returns, either directly in connection with the redevelopment of an existing apartment community, or on a more limited basis, at a new location. Aimco invests to earn risk-adjusted returns in excess of those expected from the apartment communities sold in paired trades to fund the redevelopment and development. Of these two activities, Aimco favors redevelopment because it permits adjustment of the scope and timing of spending to align with changing market conditions and customer preferences.
During the first quarter, Aimco invested $47 million in redevelopment and development. In Center City, Philadelphia, Aimco continued construction on the fourth and final tower of Park Towne Place. Initial move-ins have occurred and at the end of April, 31% of the tower is pre-leased.
Construction is underway, on plan and on budget at Parc Mosaic, Aimco’s $117 million, 226 apartment home community being developed on the site of its former Eastpointe community in Boulder, Colorado. Aimco expects Parc Mosaic will be available for occupancy in the summer of 2019.
During the first quarter, Aimco leased 59 apartment homes at its redevelopment communities. At March 31, 2018, Aimco’s exposure to lease-up at active redevelopment and development projects was approximately
| 3 |
527 apartment homes, of which 201 were in the fourth tower of Park Towne Place and 215 were being constructed at Parc Mosaic.
Portfolio Management: Revenue Per Apartment Home Up 7% to $2,052
Aimco’s portfolio of apartment communities is diversified across “A,” “B” and “C+” price points, averaging “B/B+” in quality and is diversified across some of the largest markets in the U.S.
As part of its portfolio strategy, Aimco seeks to sell up to 10% of its portfolio annually and to reinvest the proceeds from such sales in accretive uses such as capital enhancements, redevelopments, occasional developments, and selective acquisitions with projected Free Cash Flow internal rates of return higher than expected from the communities being sold. Through this disciplined approach to capital recycling, Aimco has significantly increased the quality and expected growth rate of its portfolio.
FIRST QUARTER | ||||||||
2018 | 2017 | Variance | ||||||
Apartment Communities | 134 | 141 | (7 | ) | ||||
Apartment Homes | 37,228 | 39,173 | (1,945 | ) | ||||
Average Revenue per Apartment Home* | $ | 2,052 | $ | 1,922 | 7 | % | ||
Portfolio Average Rents as a Percentage of Local Market Average Rents | 113 | % | 112 | % | 1 | % | ||
Percentage A (1Q 2018 Average Revenue per Apartment Home $2,736) | 49 | % | 51 | % | (2 | %) | ||
Percentage B (1Q 2018 Average Revenue per Apartment Home $1,797) | 35 | % | 35 | % | — | % | ||
Percentage C+ (1Q 2018 Average Revenue per Apartment Home $1,660) | 16 | % | 14 | % | 2 | % | ||
NOI Margin | 71 | % | 71 | % | — | % | ||
Free Cash Flow Margin | 66 | % | 65 | % | 1 | % | ||
* | In 2018, Aimco changed its presentation of revenues and expenses to reflect utilities costs net of amounts reimbursed by residents, which were previously included in revenue. 2017 amounts have been revised to conform to this presentation. |
First Quarter Real Estate Portfolio - For its entire portfolio, Aimco’s average monthly revenue per apartment home was $2,052 for first quarter 2018, a 7% increase compared to first quarter 2017. This increase is due to year-over-year growth in Same Store revenue as well as Aimco’s second quarter 2017 reacquisition of the 47% interest in the Palazzo communities, lease-up of redevelopment and acquisition properties, and the sale of apartment communities with average monthly revenues per apartment home lower than those of the retained portfolio.
Acquisitions - Aimco evaluates potential acquisitions with an eye for unique and opportunistic investments and funds acquisitions pursuant to its strict paired trade discipline. As previously announced, subsequent to quarter end, Aimco entered into a transaction to acquire six apartment communities in the Philadelphia area for a purchase price of $445 million. The portfolio includes 1,006 existing apartment homes, 110 apartment homes under construction, and 185,000 square feet of office and retail space. This “A” quality portfolio is located primarily in the Center City and University City submarkets of Philadelphia. Aimco anticipates its operation of the five operating communities will generate a year one NOI yield of 5.3%, and for all six communities, average revenue per apartment home of $2,200 and a ten-year expected free cash flow internal rate of return of about 8%.
The $445 million acquisition will be funded initially through taking title subject to $290 million of non-recourse property debt, issuance of $90 million in Aimco Properties, L.P. OP Units valued in the transaction at their estimated net asset value of $53 per unit, and payment of $65 million in cash funded from bank borrowings. The ultimate paired trade funding includes the sale of Chestnut Hill Village, located in north Philadelphia, and the sale of the Asset Management business, described below.
| 4 |
On May 1, 2018, Aimco completed the acquisition of four of the six apartment communities including 665 apartment homes and 153,000 square feet of office and retail space. Aimco anticipates the acquisition of the fifth apartment community during the summer of 2018 and the acquisition of the final apartment community upon completion of construction, expected in the first half of 2019. Please refer to Addendum A following the release and before the supplemental schedules for additional information regarding the Philadelphia market and Aimco’s investments within the market.
In the first quarter, Aimco purchased for $160 million Bent Tree Apartments, a 748-apartment home community in Fairfax County, Virginia. Bent Tree is a “B” quality community located in a market Aimco knows well from its ownership of two nearby communities built by the same developer. Further, Aimco believes the same business plan used at these communities will produce greater than market rate NOI growth for Bent Tree. The community is expected to achieve a 5.6% year one NOI cap rate. Before consideration of capital enhancement opportunities, new lease rents are 4% higher than expiring leases, as compared to new lease rents that have decreased elsewhere in northern Virginia. Aimco funded the acquisition with bank borrowings pending the expected third quarter sale of the Asset Management business, described below.
Dispositions - In the first quarter, Aimco sold three apartment communities with 513 apartment homes for a gain of approximately $51 million, net of income tax, and gross proceeds of $72 million resulting in $65 million in net proceeds to Aimco. Two of these communities are located in southern Virginia and one is located in suburban Maryland. Proceeds from these sales were used to repay outstanding borrowings on Aimco’s revolving credit facility, effectively funding the equity portion of the Palazzo reacquisition as well as Aimco’s 2017 redevelopment and development activities.
At the end of the first quarter, Aimco completed the previously announced sale of its interests in the entities owning the La Jolla Cove property in settlement of legal actions filed in 2014 by a group of disappointed buyers who had hoped to acquire the property. Aimco provided seller financing with a stated value of $49 million and received net cash proceeds of approximately $5 million in the sale.
As previously announced, in April 2018, Aimco entered into a binding agreement to sell for $590 million its Asset Management business and the four Hunters Point affordable apartment communities. Aimco expects to close this transaction during the third quarter of 2018. After payment of closing costs and repayment of property level debt encumbering the Hunters Point apartment communities, the net proceeds to Aimco are expected to be approximately $512 million, which Aimco plans to use to: repay the borrowings on its credit facility used to fund the acquisition of Bent Tree Apartments and the acquisition of the apartment communities in the Philadelphia portfolio; reduce overall leverage; fund 2018 redevelopment; and redeem its Class A preferred stock, which is callable in second quarter 2019. Taken together, these transactions are expected to reduce Aimco’s AFFO by $0.03 per share and $0.04 per share in 2018 and 2019, respectively, before becoming accretive in 2021.
| 5 |
Balance Sheet
Aimco Leverage
Aimco’s leverage strategy seeks to increase financial returns while using leverage with appropriate caution. Aimco limits risk through balance sheet structure, employing low leverage, primarily non-recourse and long-dated property debt; builds financial flexibility by maintaining ample unused and available credit as well as holding properties with substantial value unencumbered by property debt; and uses partners’ capital when it enhances financial returns or reduces investment risk.
Non-recourse Property Debt - During the first quarter, Aimco closed two non-recourse, fixed-rate property loans totaling $242 million. These loans have 10-year terms and a weighted average interest rate of 3.48%, 126 basis points above the corresponding treasury rates at the time of pricing. The net effect of 2018 fixed-rate property debt refinancing activities has been to lower Aimco’s weighted average fixed interest rate by nearly 10 basis points since December 31, 2017, to 4.55%, reducing prospective interest expense by more than $3 million.
Aimco also closed two non-recourse, variable-rate property loans totaling $119 million. These loans each have a five-year term and bear interest at 30-day LIBOR plus 1.25%. The five-year terms fill a hole in Aimco’s laddered maturities and, taken together with the planned repayment of the variable term loan, reduce Aimco exposure to increasing short-term interest rates to less than 7% of Aimco total leverage.
Aimco total leverage includes Aimco share of long-term, non-recourse, property debt encumbering apartment communities in its Real Estate portfolio, its term loan, outstanding borrowings under its revolving credit facility, and outstanding preferred equity. Aimco leverage excludes non-recourse property debt obligations of consolidated partnerships served by its Asset Management business.
AS OF MARCH 31, 2018 | |||||||
$ in Millions | Amount | % of Total | Weighted Avg. Maturity (Yrs.) | ||||
Aimco share of long-term, non-recourse property debt | $ | 3,710 | 87 | % | 7.4 | ||
Term loan | 250 | 6 | % | 1.3 | |||
Outstanding borrowings on revolving credit facility | 79 | 2 | % | 3.8 | |||
Preferred Equity* | 226 | 5 | % | 40.0 | |||
Total leverage | $ | 4,265 | 100 | % | 8.7 | ||
Cash, restricted cash and investments in securitization trust assets | (174 | ) | |||||
Net Leverage | $ | 4,091 | |||||
* Aimco’s Preferred Equity is perpetual in nature; however, for illustrative purposes, Aimco has computed the weighted average maturity of its total leverage assuming a 40-year maturity for its Preferred Equity. | |||||||
| 6 |
Leverage Ratios
Aimco target leverage ratios are Proportionate Debt and Preferred Equity to Adjusted EBITDA below 7.0x and Adjusted EBITDA to Interest Expense and Preferred Dividends greater than 2.5x. Aimco calculates Adjusted EBITDA and Adjusted Interest Expense used in its leverage ratios based on current quarter amounts, annualized.
FIRST QUARTER 2018 | |
Proportionate Debt to Adjusted EBITDA | 6.8x |
Proportionate Debt and Preferred Equity to Adjusted EBITDA | 7.2x |
Adjusted EBITDA to Adjusted Interest Expense | 3.6x |
Adjusted EBITDA to Adjusted Interest Expense and Preferred Dividends | 3.2x |
Aimco’s leverage ratios have been calculated on a pro forma basis to reflect the acquisition of Bent Tree Apartments and the disposition of three apartment communities during the period as if the transactions had closed on January 1, 2018.
Future improvement in leverage metrics is expected from the repayment of bank borrowings and property level debt with the proceeds from Aimco’s expected third quarter sale of its Asset Management business and the Hunters Point communities. Aimco also expects to use the proceeds from this sale to redeem its Class A preferred stock, which is callable in second quarter 2019. Aimco expects its Proportionate Debt to Adjusted EBITDA and Proportionate Debt and Preferred Equity to Adjusted EBITDA ratios to decrease by the end of 2018 to 6.3x and 6.7x, respectively.
Liquidity
At March 31, 2018, Aimco held cash and restricted cash of $91 million and had available capacity to borrow $509 million under its revolving credit facility, after consideration of outstanding borrowings of $79 million and $12 million of letters of credit backed by the facility. Aimco uses its credit facility primarily for working capital and other short-term purposes and to secure letters of credit.
Aimco also manages its financial flexibility by maintaining an investment grade rating and holding apartment communities that are unencumbered by property debt. At March 31, 2018, Aimco held unencumbered apartment communities with an estimated fair market value of approximately $2.0 billion.
Dividend - As previously announced, the Aimco Board of Directors declared a quarterly cash dividend of $0.38 per share of Class A Common Stock for the quarter ended March 31, 2018. On an annualized basis, this represents an increase of 6% compared to the dividends paid during 2017. This dividend is payable on May 31, 2018, to stockholders of record on May 18, 2018.
| 7 |
2018 Outlook
($ Amounts represent Aimco Share) | YEAR-TO-DATE MARCH 31, 2018 | FULL YEAR 2018 | PREVIOUS FULL YEAR 2018 | |
Net Income per share | $0.52 | $4.05 to $4.55 | $0.36 to $0.46 | |
Pro forma FFO per share | $0.60 | $2.39 to $2.49 | $2.42 to $2.52 | |
AFFO per share | $0.54 | $2.08 to $2.18 | $2.11 to $2.21 | |
Select Components of FFO | ||||
Same Store Operating Measures | ||||
Revenue change compared to prior year | 2.6% | 2.10% to 3.10% | 2.10% to 3.10% | |
Expense change compared to prior year | 2.1% | 2.60% to 3.60% | 2.60% to 3.60% | |
NOI change compared to prior year | 2.7% | 1.70% to 3.10% | 1.70% to 3.10% | |
Other Earnings | ||||
Asset Management Contribution | $10M | $22M to $24M | $36M | |
Tax Benefits | $4M | $16M to $18M | $16M to $18M | |
Offsite Costs | ||||
Property management expenses | $5M | $20M | $20M | |
General and administrative expenses | $11M | $44M | $44M | |
Total Offsite Costs | $16M | $64M | $64M | |
Capital Investments | ||||
Redevelopment/Development | $47M | $120M to $200M | $120M to $200M | |
Capital enhancements | $19M | $80M to $100M | $80M to $100M | |
Transactions | ||||
Property dispositions | $65M | $790M to $870M | $180M to $220M | |
Property acquisitions [1] | $160M | $551M | $0M | |
Portfolio Quality | ||||
Average revenue per apartment home [2] | $2,052 | ~$2,100 | ~$2,100 | |
Balance Sheet | ||||
Proportionate Debt to Adjusted EBITDA | 6.8x | ~6.3x | ~6.5x | |
Proportionate Debt and Preferred Equity to Adjusted EBITDA | 7.2x | ~6.7x | ~6.9x | |
[1] | Aimco does not predict or guide to acquisitions. These amounts represent the value of assets acquired or under contract to be acquired in 2018. Aimco monitors potential transactions with an eye for unique and opportunistic investments and funds acquisitions pursuant to its strict paired trade discipline. | |||
[2] | Previous full year guidance for average revenue per apartment home is adjusted to exclude amounts of utilities costs reimbursed by residents, which were previously included in revenue. | |||
($ Amounts represent Aimco Share) | SECOND QUARTER 2018 |
Net income per share | $0.03 to $0.07 |
Pro forma FFO per share | $0.57 to $0.61 |
AFFO per share | $0.48 to $0.52 |
| 8 |
Earnings Conference Call Information
Live Conference Call: | Conference Call Replay: |
Tuesday, May 8, 2018 at 1:00 p.m. ET | Replay available until August 8, 2018 |
Domestic Dial-In Number: 1-888-317-6003 | Domestic Dial-In Number: 1-877-344-7529 |
International Dial-In Number: 1-412-317-6061 | International Dial-In Number: 1-412-317-0088 |
Passcode: 1743062 | Passcode: 10118742 |
Live webcast and replay: www.aimco.com/investors | |
Supplemental Information
The full text of this Earnings Release and the Supplemental Information referenced in this release are available on Aimco’s website at www.aimco.com/investors.
Glossary & Reconciliations of Non-GAAP Financial and Operating Measures
Financial and operating measures found in this Earnings Release and the Supplemental Information include certain financial measures used by Aimco management that are measures not defined under accounting principles generally accepted in the United States (“GAAP”). Certain Aimco terms and Non-GAAP measures are defined in the Glossary in the Supplemental Information and Non-GAAP measures reconciled to the most comparable GAAP measures.
About Aimco
Aimco is a real estate investment trust focused on the ownership and management of quality apartment communities located in select markets in the United States. Aimco is one of the country’s largest owners and operators of apartments, with ownership interests in 184 communities in 22 states and the District of Columbia. Aimco common shares are traded on the New York Stock Exchange under the ticker symbol AIV, and are included in the S&P 500. For more information about Aimco, please visit our website at www.aimco.com.
Contact
Suzanne Sorkin, Vice President, Investor Relations/FP&A
Investor Relations 303-793-4661, investor@aimco.com
| 9 |
Forward-looking Statements
This Earnings Release and Supplemental Information contain forward-looking statements within the meaning of the federal securities laws, including, without limitation, statements regarding projected results and specifically forecasts of second quarter and full year 2018 results, including but not limited to: FFO, Pro forma FFO and selected components thereof; AFFO; Aimco redevelopment/development investments and projected yield on such investments, timelines and Net Operating Income contribution; expectations regarding sales of Aimco apartment communities and the use of proceeds thereof; and Aimco liquidity and leverage metrics.
These forward-looking statements are based on management’s judgment as of this date, which is subject to risks and uncertainties. Risks and uncertainties include, but are not limited to: Aimco’s ability to maintain current or meet projected occupancy, rental rate and property operating results; the effect of acquisitions, dispositions, redevelopments and developments; Aimco’s ability to meet budgeted costs and timelines, and achieve budgeted rental rates related to Aimco redevelopments and developments; and Aimco’s ability to comply with debt covenants, including financial coverage ratios.
Actual results may differ materially from those described in these forward-looking statements and, in addition, will be affected by a variety of risks and factors, some of which are beyond Aimco’s control, including, without limitation:
• | Real estate and operating risks, including fluctuations in real estate values and the general economic climate in the markets in which Aimco operates and competition for residents in such markets; national and local economic conditions, including the pace of job growth and the level of unemployment; the amount, location and quality of competitive new housing supply; the timing of acquisitions, dispositions, redevelopments and developments; and changes in operating costs, including energy costs; |
• | Financing risks, including the availability and cost of capital markets’ financing; the risk that cash flows from operations may be insufficient to meet required payments of principal and interest; and the risk that earnings may not be sufficient to maintain compliance with debt covenants; |
• | Insurance risks, including the cost of insurance, and natural disasters and severe weather such as hurricanes; and |
• | Legal and regulatory risks, including costs associated with prosecuting or defending claims and any adverse outcomes; the terms of governmental regulations that affect Aimco and interpretations of those regulations; and possible environmental liabilities, including costs, fines or penalties that may be incurred due to necessary remediation of contamination of apartment communities presently or previously owned by Aimco. |
In addition, Aimco’s current and continuing qualification as a real estate investment trust involves the application of highly technical and complex provisions of the Internal Revenue Code and depends on Aimco’s ability to meet the various requirements imposed by the Internal Revenue Code, through actual operating results, distribution levels and diversity of stock ownership.
Readers should carefully review Aimco’s financial statements and the notes thereto, as well as the section entitled “Risk Factors” in Item 1A of Aimco’s Annual Report on Form 10-K for the year ended December 31, 2017, and the other documents Aimco files from time to time with the Securities and Exchange Commission.
These forward-looking statements reflect management’s judgment as of this date, and Aimco assumes no obligation to revise or update them to reflect future events or circumstances. This press release does not constitute an offer of securities for sale.
| 10 |
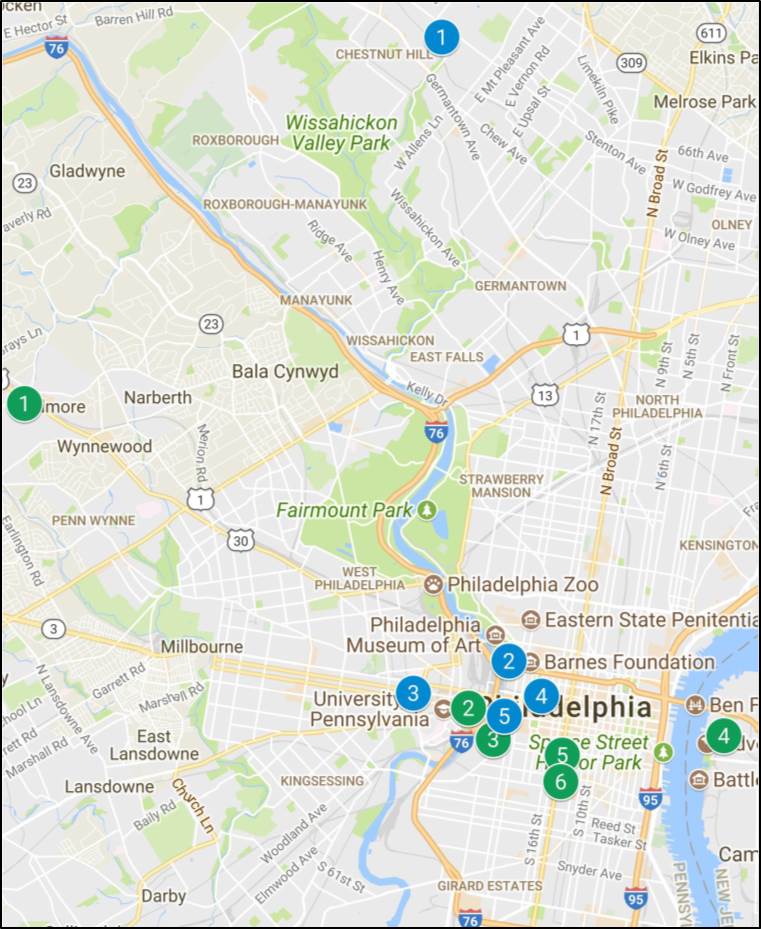
Addendum A
Philadelphia Market Profile
Philadelphia is a market that Aimco knows well and Aimco is excited by the opportunity to rebalance its portfolio there by adding high quality communities in attractive submarkets. When thinking about Philadelphia, Aimco is focused primarily on the Center City submarket as it holds 42% of all jobs in Philadelphia.
The education and medical sectors, or “eds and meds,” are at the foundation of Philadelphia’s stable economy, representing a solid resident base for Aimco’s communities. Philadelphia boasts a strong university system, including 90 institutions of higher education, with 19 colleges and universities in and around greater Center City. In fact, one in six doctors in the United States received some of his or her medical training in Philadelphia, and Philadelphia was one of the leaders in National Institutes of Health grants, ranking 4th nationally in 2017.
These institutions of higher education help support a highly educated labor pool as these universities produce talented graduates in high income fields. In recent years, Philadelphia has seen more students who are educated there staying as the market becomes increasingly attractive to the millennial generation. According to Campus Philly, students’ interest in staying in the Philadelphia area after graduation has increased nine percentage points since 2010, with 67% of current college students reporting they want to stay in greater Philadelphia after graduating.
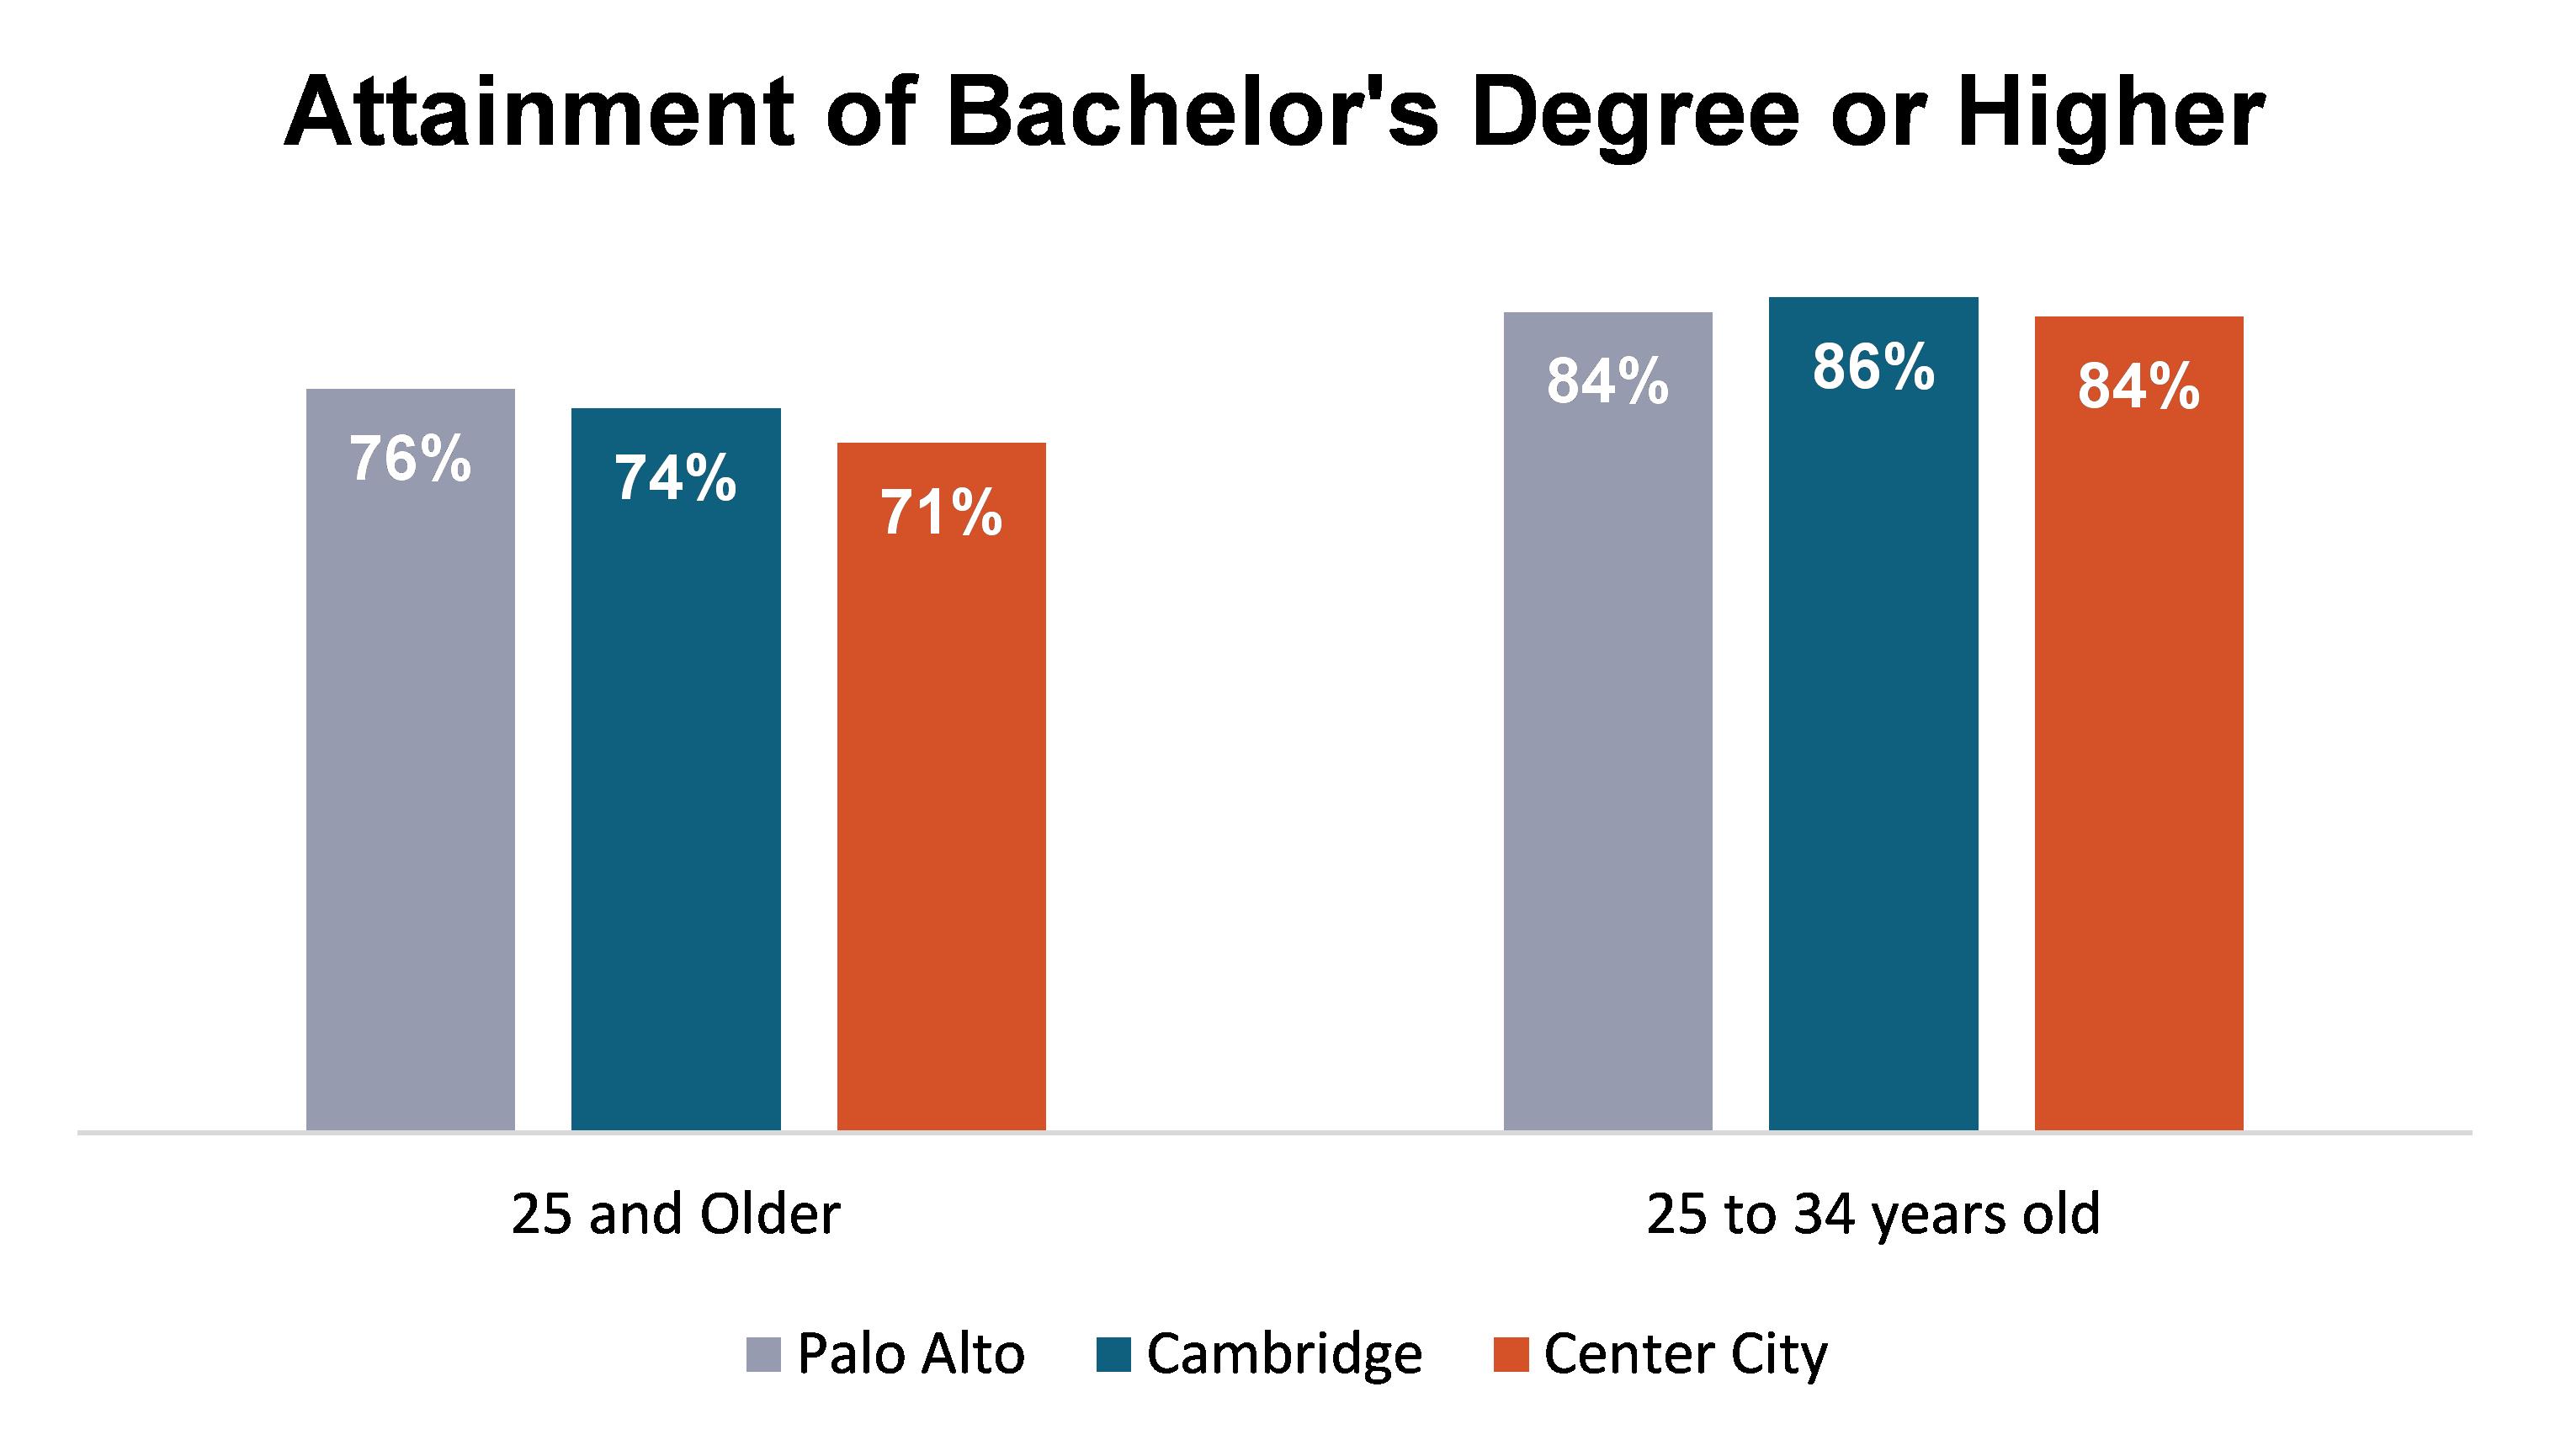
These facts are more pronounced when examining the demographics of Center City. More than 71% of Center City residents have a bachelor’s degree or higher. When looking at the prime renter cohort aged 25-34, that number increases to 84%, similar to education levels in Palo Alto and Cambridge.
This educated workforce is also drawn to Philadelphia by its thriving cultural scene. Philadelphia is home to 243 museums, art galleries, theater and dance companies, and music venues in Center City, placing it third in the nation in the number of arts and cultural institutions downtown, behind only Manhattan and Washington, D.C. Philadelphia is a highly walkable and bike-able city, making it well-positioned for those employers looking to attract millennials who want to live, work and play in close proximity. Millennials now represent 40% of the 190,000 downtown population according to the Center City District and Central Philadelphia Development Corporation.
| 11 |
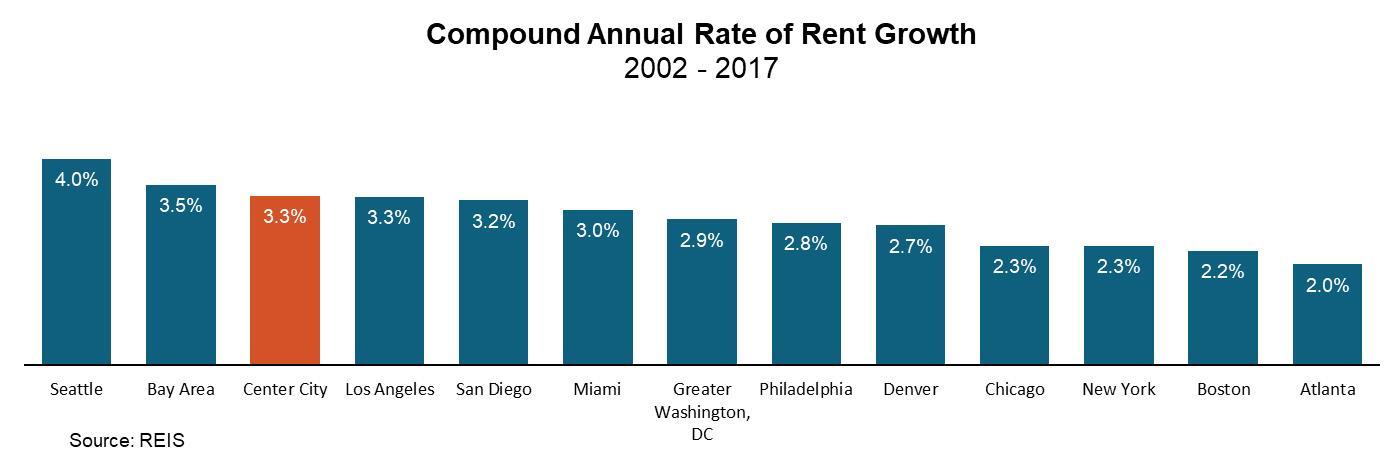
These characteristics translate to a market that provides steady and consistent rent growth with lower volatility than many gateway markets. Since 2002, according to REIS, Center City has had a compound annual rate of rent growth of approximately 3.3%, placing it number three among Aimco’s target markets, behind only Seattle and the Bay Area.
However, these trends have not gone unnoticed by multifamily developers, and in 2016 and 2017 Aimco saw elevated levels of supply, especially in Center City, with approximately 1,500 units delivered each year. MPF Research forecasts approximately 1,900 units in 2018 with some relief in 2019 as only 1,400 units are expected to deliver. Aimco is optimistic that the market will absorb the upcoming supply in part due to its recent success at leasing up the redevelopments at Park Towne Place and The Sterling during this time. This belief is also driven by expectations for continued strong job growth. In 2018, Philadelphia has the third highest ratio of job growth to new supply among the 50 largest multifamily markets in the United States based on data from Green Street and MPF Research.
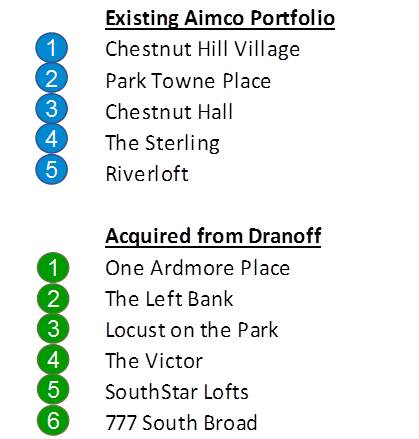
Upon the sale of Chestnut Hill Village later in 2018, Aimco’s Philadelphia portfolio will be located primarily in the desirable submarkets of Center City and University City. Three of the six acquired communities are
located within mature Center City neighborhoods, in close proximity to the nearest Aimco property. An additional acquired community is located in the heart of University City, the neighborhood west of the Schuylkill, defined by the University of Pennsylvania, Drexel University, and a growing economy marked by technology spin-offs from these two schools.
| 12 |
Consolidated Statements of Operations | |||||||||
(in thousands, except per share data) (unaudited) | |||||||||
Three Months Ended | |||||||||
March 31, | |||||||||
2018 | 2017 | ||||||||
REVENUES | |||||||||
Rental and other property revenues attributable to Real Estate | $ | 225,393 | $ | 225,228 | |||||
Rental and other property revenues of partnerships served by Asset Management business | 18,808 | 18,562 | |||||||
Tax credit and transaction revenues | 3,519 | 2,691 | |||||||
Total revenues | 247,720 | 246,481 | |||||||
OPERATING EXPENSES | |||||||||
Property operating expenses attributable to Real Estate | 78,287 | 79,626 | |||||||
Property operating expenses of partnerships served by Asset Management business | 9,195 | 9,198 | |||||||
Depreciation and amortization | 92,548 | 87,168 | |||||||
General and administrative expenses | 11,355 | 10,962 | |||||||
Other expenses, net | 2,958 | 1,738 | |||||||
Total operating expenses | 194,343 | 188,692 | |||||||
Operating income | 53,377 | 57,789 | |||||||
Interest income | 2,172 | 2,192 | |||||||
Interest expense | (47,795 | ) | (47,882 | ) | |||||
Other, net | 224 | 465 | |||||||
Income before income taxes and gain on dispositions | 7,978 | 12,564 | |||||||
Income tax benefit | 37,388 | 4,985 | |||||||
Income before gain on dispositions | 45,366 | 17,549 | |||||||
Gain (loss) on dispositions of real estate, inclusive of related income tax | 50,324 | (394 | ) | ||||||
Net income | 95,690 | 17,155 | |||||||
Noncontrolling interests: | |||||||||
Net income attributable to noncontrolling interests in consolidated real estate partnerships | (6,206 | ) | (951 | ) | |||||
Net income attributable to preferred noncontrolling interests in Aimco OP | (1,937 | ) | (1,949 | ) | |||||
Net income attributable to common noncontrolling interests in Aimco OP | (3,755 | ) | (557 | ) | |||||
Net income attributable to noncontrolling interests | (11,898 | ) | (3,457 | ) | |||||
Net income attributable to Aimco | 83,792 | 13,698 | |||||||
Net income attributable to Aimco preferred stockholders | (2,148 | ) | (2,148 | ) | |||||
Net income attributable to participating securities | (119 | ) | (59 | ) | |||||
Net income attributable to Aimco common stockholders | $ | 81,525 | $ | 11,491 | |||||
Net income attributable to Aimco per common share – basic and diluted | $ | 0.52 | $ | 0.07 | |||||
Weighted average common shares outstanding – basic | 156,609 | 156,259 | |||||||
Weighted average common shares outstanding – diluted | 156,740 | 156,754 | |||||||
| 13 |
Consolidated Balance Sheets | |||||||||
(in thousands) (unaudited) | |||||||||
March 31, 2018 | December 31, 2017 | ||||||||
Assets | |||||||||
Real estate | $ | 8,110,787 | $ | 7,927,753 | |||||
Accumulated depreciation | (2,596,457 | ) | (2,522,358 | ) | |||||
Net real estate | 5,514,330 | 5,405,395 | |||||||
Cash and cash equivalents | 51,894 | 60,498 | |||||||
Restricted cash | 38,999 | 34,827 | |||||||
Goodwill | 37,808 | 37,808 | |||||||
Other assets | 333,344 | 234,931 | |||||||
Assets held for sale | — | 17,959 | |||||||
Assets of partnerships served by Asset Management business [1]: | |||||||||
Real estate, net | 220,408 | 224,873 | |||||||
Cash and cash equivalents | 18,374 | 16,288 | |||||||
Restricted cash | 29,764 | 30,928 | |||||||
Other assets | 10,369 | 15,533 | |||||||
Total Assets | $ | 6,255,290 | $ | 6,079,040 | |||||
Liabilities and Equity | |||||||||
Non-recourse property debt secured by Aimco Real Estate communities | $ | 3,719,098 | $ | 3,563,041 | |||||
Debt issue costs | (18,119 | ) | (17,932 | ) | |||||
Non-recourse property debt, net | 3,700,979 | 3,545,109 | |||||||
Term loan, net | 249,729 | 249,501 | |||||||
Revolving credit facility borrowings | 78,635 | 67,160 | |||||||
Accrued liabilities and other | 207,202 | 200,540 | |||||||
Liabilities of partnerships served by Asset Management business [1]: | |||||||||
Non-recourse property debt, net | 225,502 | 227,141 | |||||||
Accrued liabilities and other | 17,404 | 19,812 | |||||||
Deferred income | 11,814 | 12,487 | |||||||
Total Liabilities | 4,491,265 | 4,321,750 | |||||||
Preferred noncontrolling interests in Aimco OP | 101,378 | 101,537 | |||||||
Equity: | |||||||||
Perpetual preferred stock | 125,000 | 125,000 | |||||||
Class A Common Stock | 1,573 | 1,572 | |||||||
Additional paid-in capital | 3,885,279 | 3,900,042 | |||||||
Accumulated other comprehensive income | 3,544 | 3,603 | |||||||
Distributions in excess of earnings | (2,345,206 | ) | (2,367,073 | ) | |||||
Total Aimco equity | 1,670,190 | 1,663,144 | |||||||
Noncontrolling interests in consolidated real estate partnerships | (2,755 | ) | (1,716 | ) | |||||
Common noncontrolling interests in Aimco OP | (4,788 | ) | (5,675 | ) | |||||
Total equity | 1,662,647 | 1,655,753 | |||||||
Total liabilities and equity | $ | 6,255,290 | $ | 6,079,040 | |||||
[1] | In April 2018, Aimco announced the planned third quarter sale of the Asset Management business. The assets included under this heading will be sold and the liabilities will be assumed by the buyer as a result of the transaction. | ||||||||
| 14 |
Supplemental Schedule 1 | |||||||||
Funds From Operations and Adjusted Funds From Operations Reconciliation | |||||||||
Three Months Ended March 31, 2018 Compared to Three Months Ended March 31, 2017 | |||||||||
(in thousands, except per share data) (unaudited) | |||||||||
Three Months Ended March 31, | |||||||||
2018 | 2017 | ||||||||
Net income attributable to Aimco common stockholders | $ | 81,525 | $ | 11,491 | |||||
Adjustments: | |||||||||
Real estate depreciation and amortization, net of noncontrolling partners’ interest | 90,394 | 82,881 | |||||||
Gain on dispositions and other, net of noncontrolling partners’ interest | (47,023 | ) | (439 | ) | |||||
Income tax adjustments related to gain on dispositions and other items [1] | (30,720 | ) | 1,032 | ||||||
Common noncontrolling interests in Aimco OP’s share of above adjustments | (557 | ) | (3,850 | ) | |||||
Amounts allocable to participating securities | (15 | ) | (38 | ) | |||||
FFO Attributable to Aimco common stockholders | $ | 93,604 | $ | 91,077 | |||||
Litigation costs, net of common noncontrolling interests in Aimco OP and participating securities [2] | 349 | — | |||||||
Pro forma FFO Attributable to Aimco common stockholders | $ | 93,953 | $ | 91,077 | |||||
Capital Replacements, net of common noncontrolling interests in Aimco OP and participating securities | (9,767 | ) | (10,946 | ) | |||||
AFFO Attributable to Aimco common stockholders | $ | 84,186 | $ | 80,131 | |||||
Weighted average common shares outstanding | 156,609 | 156,259 | |||||||
Dilutive common share equivalents | 131 | 495 | |||||||
Total shares and dilutive share equivalents | 156,740 | 156,754 | |||||||
Net income attributable to Aimco per common share – diluted | $ | 0.52 | $ | 0.07 | |||||
FFO / Pro forma FFO per share – diluted | $ | 0.60 | $ | 0.58 | |||||
AFFO per share – diluted | $ | 0.54 | $ | 0.51 | |||||
[1] | Income taxes related to gain on dispositions and other items for the three months ended March 31, 2018 includes a $33.6 million tax benefit related to an intercompany transfer of assets related to the Asset Management business. Aimco announced in April 2018 the planned sale of this business. Upon completion of the anticipated sale, the related taxes will be reflected within Aimco’s statement of operations within gain on dispositions of real estate, inclusive of related income tax. Accordingly, Aimco has excluded the benefit related to the reorganization from FFO. | ||||||||
[2] | Aimco is engaged in litigation with Airbnb to protect its property right to select its residents and their neighbors. Due to the unpredictable nature of these cases and associated legal costs, Aimco excludes such costs from Pro forma FFO and AFFO. | ||||||||
| 15 |
Supplemental Schedule 2(a) | |||||||||
Funds From Operations and Adjusted Funds From Operations Information | (Page 1 of 2) | ||||||||
Three Months Ended March 31, 2018 Compared to Three Months Ended March 31, 2017 | |||||||||
(consolidated amounts, in thousands) (unaudited) | |||||||||
Three Months Ended | |||||||||
March 31, | |||||||||
2018 | 2017 | ||||||||
Real Estate [1] | |||||||||
Revenues, before utility reimbursements [2] | |||||||||
Same Store | $ | 145,520 | $ | 141,906 | |||||
Redevelopment/Development | 43,768 | 41,880 | |||||||
Acquisition | 6,543 | 3,699 | |||||||
Other Real Estate | 19,333 | 18,732 | |||||||
Total revenues, before utility reimbursements | 215,164 | 206,217 | |||||||
Expenses, net of utility reimbursements [2] | |||||||||
Same Store | 39,125 | 38,284 | |||||||
Redevelopment/Development | 14,259 | 14,175 | |||||||
Acquisition | 2,197 | 1,799 | |||||||
Other Real Estate | 6,585 | 6,271 | |||||||
Total expenses, net of utility reimbursements | 62,166 | 60,529 | |||||||
Real Estate net operating income | 152,998 | 145,688 | |||||||
Property management expenses | (5,163 | ) | (5,002 | ) | |||||
Casualties | (1,061 | ) | (1,865 | ) | |||||
Other expenses, net | (678 | ) | (426 | ) | |||||
Interest expense on non-recourse property debt | (41,190 | ) | (43,549 | ) | |||||
Interest income | 1,849 | 1,721 | |||||||
FFO related to Sold and Held for Sale communities [3] | 474 | 6,639 | |||||||
Contribution from Real Estate | 107,229 | 103,206 | |||||||
Asset Management [4] | |||||||||
Net operating income of partnerships served by Asset Management business | 10,721 | 10,516 | |||||||
Interest expense on non-recourse property debt of partnerships | (3,286 | ) | (3,230 | ) | |||||
FFO related to Sold and Held for Sale communities | — | 168 | |||||||
Amount available for payment of Asset Management fees | 7,435 | 7,454 | |||||||
Tax credit income, net | 1,816 | 2,513 | |||||||
Other income | 1,645 | 462 | |||||||
Asset management expenses | (1,375 | ) | (1,562 | ) | |||||
Contribution from Asset Management | 9,521 | 8,867 | |||||||
General and administrative and investment management expenses | (11,355 | ) | (10,962 | ) | |||||
Depreciation and amortization related to non-real estate assets | (2,236 | ) | (2,438 | ) | |||||
Other expenses, net | (1,769 | ) | (409 | ) | |||||
Interest expense on corporate borrowings | (3,324 | ) | (996 | ) | |||||
Historic tax credit benefit | — | 1,201 | |||||||
Other tax benefits, net | 3,797 | 3,841 | |||||||
Preferred dividends and distributions | (4,085 | ) | (4,097 | ) | |||||
Common noncontrolling interests in Aimco OP | (4,312 | ) | (4,407 | ) | |||||
Amounts allocated to participating securities | (134 | ) | (97 | ) | |||||
Aimco share of amounts associated with unconsolidated partnerships | 518 | 564 | |||||||
Noncontrolling interests’ share of the above amounts | (246 | ) | (3,196 | ) | |||||
FFO Attributable to Aimco common stockholders | $ | 93,604 | $ | 91,077 | |||||
Pro forma adjustment for litigation costs [5] | 349 | — | |||||||
Pro Forma FFO Attributable to Aimco common stockholders | $ | 93,953 | $ | 91,077 | |||||
Capital Replacements, net of noncontrolling interests’ share | (9,767 | ) | (10,946 | ) | |||||
AFFO Attributable to Aimco common stockholders | $ | 84,186 | $ | 80,131 | |||||
Please see the following page for footnote descriptions
| 16 |
Supplemental Schedule 2(a) (continued) | ||
Funds From Operations and Adjusted Funds From Operations Information | (Page 2 of 2) | |
[1] | Contribution from Real Estate consists of property net operating income and other items of income or expense that relate to this portfolio, including property management expenses, casualty losses, interest expense related to non-recourse property debt encumbering the communities in this portfolio, and interest income Aimco earns on its investment in a securitization trust that holds certain Aimco property debt. | |
[2] | In 2018, Aimco changed its presentation of revenues and expenses to reflect utilities costs net of amounts reimbursed by residents, which were previously included in revenue. 2017 amounts have been revised to conform to this presentation. | |
[3] | In first quarter 2018, Aimco sold two apartment communities located in southern Virginia and one apartment community located in suburban Maryland. Aimco also sold its interests in the entities owning the La Jolla Cove property. | |
[4] | In April 2018, Aimco announced the planned third quarter sale of its Asset Management business. | |
[5] | Aimco is engaged in litigation with Airbnb to protect Aimco’s property right to select its residents and their neighbors. Due to the unpredictable nature of these cases and associated legal costs, Aimco excludes such costs from Pro forma FFO and AFFO. The amount presented is net of noncontrolling interests share of such costs. | |
| 17 |

Supplemental Schedule 2(b) | |||||||||||||||||
Partially Owned Entities | |||||||||||||||||
Three Months Ended March 31, 2018 Compared to Three Months Ended March 31, 2017 | |||||||||||||||||
(Proportionate amounts, in thousands) (unaudited) | |||||||||||||||||
Noncontrolling Interests [1] | Unconsolidated [2] | ||||||||||||||||
Three Months Ended March 31, | Three Months Ended March 31, | ||||||||||||||||
2018 | 2017 | 2018 | 2017 | ||||||||||||||
Real estate | |||||||||||||||||
Revenues, before utility reimbursements | $ | 776 | $ | 6,517 | $ | 560 | $ | 570 | |||||||||
Expenses, net of utility reimbursements | 266 | 2,045 | 171 | 91 | |||||||||||||
Net operating income | 510 | 4,472 | 389 | 479 | |||||||||||||
Property management expenses, net | (33 | ) | (124 | ) | (65 | ) | (61 | ) | |||||||||
Casualties | 5 | (12 | ) | — | — | ||||||||||||
Other Expense, net | (7 | ) | (26 | ) | — | — | |||||||||||
Interest expense on non-recourse property debt on Real Estate Operations | (176 | ) | (1,431 | ) | (82 | ) | (86 | ) | |||||||||
FFO related to Sold and Held For Sale Apartment Communities | (40 | ) | 192 | — | — | ||||||||||||
Contribution from Real Estate | 259 | 3,071 | 242 | 332 | |||||||||||||
Contribution from Asset Management | — | 134 | 275 | 232 | |||||||||||||
Other non-property expenses, net | (13 | ) | (9 | ) | 1 | — | |||||||||||
FFO | $ | 246 | $ | 3,196 | $ | 518 | $ | 564 | |||||||||
Noncontrolling interests share of pro forma adjustment for litigation costs | 16 | — | — | — | |||||||||||||
Pro Forma FFO | $ | 262 | $ | 3,196 | $ | 518 | $ | 564 | |||||||||
Noncontrolling interests’ share of Capital Replacements | (493 | ) | (699 | ) | — | — | |||||||||||
AFFO | $ | (231 | ) | $ | 2,497 | $ | 518 | $ | 564 | ||||||||
Total apartment communities [3] | 9 | 4 | |||||||||||||||
Total apartment homes [3] | 3,592 | 142 | |||||||||||||||
Noncontrolling interests’ share of consolidated apartment homes/Aimco share of unconsolidated apartment homes [3] | 3,404 | 72 | |||||||||||||||
[1] | Amounts represent the noncontrolling interests’ proportionate share of consolidated amounts. The decrease from 2017 to 2018 is primarily due to the June 30, 2017 reacquisition of the limited partners’ interest in the Palazzo joint venture. | ||||||||||||||||
[2] | Amounts represent Aimco’s proportionate share of the unconsolidated real estate partnerships’ operations. | ||||||||||||||||
[3] | Apartment community information excludes Sold or Held for Sale Communities. | ||||||||||||||||
| 18 | |
Supplemental Schedule 3(a) | ||||||||||||||||||||||
Property Net Operating Income - Real Estate | ||||||||||||||||||||||
Trailing Five Quarters | ||||||||||||||||||||||
(consolidated amounts, in thousands) (unaudited) | ||||||||||||||||||||||
Three Months Ended | ||||||||||||||||||||||
March 31, 2018 | December 31, 2017 | September 30, 2017 | June 30, 2017 | March 31, 2017 | ||||||||||||||||||
Revenues, before utility reimbursements [1] | ||||||||||||||||||||||
Same Store | $ | 145,520 | $ | 145,440 | $ | 145,120 | $ | 143,037 | $ | 141,906 | ||||||||||||
Redevelopment/Development | 43,768 | 43,365 | 44,015 | 42,434 | 41,880 | |||||||||||||||||
Acquisition | 6,543 | 4,846 | 4,662 | 4,268 | 3,699 | |||||||||||||||||
Other Real Estate | 19,333 | 19,183 | 19,426 | 18,857 | 18,732 | |||||||||||||||||
Total revenues, before utility reimbursements | $ | 215,164 | $ | 212,834 | $ | 213,223 | $ | 208,596 | $ | 206,217 | ||||||||||||
Expenses, net of utility reimbursements [1] | ||||||||||||||||||||||
Same Store | $ | 39,125 | $ | 35,746 | $ | 37,542 | $ | 37,439 | $ | 38,284 | ||||||||||||
Redevelopment/Development | 14,259 | 15,915 | 14,717 | 14,714 | 14,175 | |||||||||||||||||
Acquisition | 2,197 | 1,674 | 1,767 | 1,736 | 1,799 | |||||||||||||||||
Other Real Estate | 6,585 | 6,049 | 6,879 | 6,184 | 6,271 | |||||||||||||||||
Total expenses, net of utility reimbursements | $ | 62,166 | $ | 59,384 | $ | 60,905 | $ | 60,073 | $ | 60,529 | ||||||||||||
Property Net Operating Income | ||||||||||||||||||||||
Same Store | $ | 106,395 | $ | 109,694 | $ | 107,578 | $ | 105,598 | $ | 103,622 | ||||||||||||
Redevelopment/Development | 29,509 | 27,450 | 29,298 | 27,720 | 27,705 | |||||||||||||||||
Acquisition | 4,346 | 3,172 | 2,895 | 2,532 | 1,900 | |||||||||||||||||
Other Real Estate | 12,748 | 13,134 | 12,547 | 12,673 | 12,461 | |||||||||||||||||
Total Property Net Operating Income | $ | 152,998 | $ | 153,450 | $ | 152,318 | $ | 148,523 | $ | 145,688 | ||||||||||||
Property net operating income in the table above is presented on a consolidated basis, which includes 100% of consolidated real estate partnership results and excludes the results of unconsolidated real estate partnerships, which are accounted for using the equity method of accounting. | ||||||||||||||||||||||
[1] | In 2018, Aimco changed its presentation of revenues and expenses to reflect utilities costs net of amounts reimbursed by residents, which were previously included in revenue. 2017 amounts have been revised to conform to this presentation. | |||||||||||||||||||||
| 19 | |
Supplemental Schedule 3(b) | ||||||||||||||||||||
Property Net Operating Income - Sold and Held For Sale Communities | ||||||||||||||||||||
Trailing Five Quarters | ||||||||||||||||||||
(consolidated amounts, in thousands) (unaudited) | ||||||||||||||||||||
Three Months Ended | ||||||||||||||||||||
March 31, 2018 | December 31, 2017 | September 30, 2017 | June 30, 2017 | March 31, 2017 | ||||||||||||||||
Sold and Held for Sale Property Net Operating Income | ||||||||||||||||||||
Sold Apartment Communities: | ||||||||||||||||||||
Real Estate [1] | $ | 326 | $ | 6,001 | $ | 8,310 | $ | 7,592 | $ | 6,874 | ||||||||||
Asset Management | — | — | (36 | ) | 52 | 263 | ||||||||||||||
Total Sold and Held for Sale Property Net Operating Income | $ | 326 | $ | 6,001 | $ | 8,274 | $ | 7,644 | $ | 7,137 | ||||||||||
Property net operating income for Sold and Held for Sale communities presented above reflects consolidated, or 100%, amounts and is included in the FFO related to sold and held for sale apartment communities lines on Supplemental Schedule 2. | |
[1] | In first quarter 2018, Aimco sold two apartment communities located in southern Virginia and one apartment community located in suburban Maryland. Aimco also sold its interests in the entities owning the La Jolla Cove property. |
| 20 | |
Supplemental Schedule 4 | ||||||||||
Apartment Home Summary | ||||||||||
As of March 31, 2018 | ||||||||||
(unaudited) | ||||||||||
Number of Apartment Communities | Number of Apartment Homes | Aimco Share of Apartment Homes | ||||||||
Real Estate Portfolio: | ||||||||||
Consolidated | ||||||||||
Same Store | 95 | 26,367 | 26,220 | |||||||
Redevelopment/Development | 13 | 6,280 | 6,269 | |||||||
Acquisitions | 2 | 1,211 | 1,211 | |||||||
Other Real Estate | 20 | 3,228 | 3,199 | |||||||
Total Consolidated | 130 | 37,086 | 36,899 | |||||||
Unconsolidated | 4 | 142 | 72 | |||||||
Total Real Estate Portfolio | 134 | 37,228 | 36,971 | |||||||
Asset Management: | ||||||||||
Consolidated | 39 | 6,211 | n/a | |||||||
Unconsolidated | 7 | 687 | n/a | |||||||
Total Asset Management | 46 | 6,898 | n/a | |||||||
Total | 180 | 44,126 | 36,971 | |||||||
| 21 |
Supplemental Schedule 5(a) | ||||||||||||||||||||||
Capitalization and Financial Metrics | ||||||||||||||||||||||
As of March 31, 2018 | ||||||||||||||||||||||
(dollars in thousands) (unaudited) | ||||||||||||||||||||||
Leverage Balances and Characteristics [1] | ||||||||||||||||||||||
Debt | Aimco Amounts | Aimco Share of Unconsolidated Partnerships | Noncontrolling Interests | Total Aimco Share | Weighted Average Maturity (Years) | Weighted Average Stated Interest Rate | ||||||||||||||||
Fixed rate loans payable | $ | 3,517,822 | $ | 6,949 | $ | (16,505 | ) | $ | 3,508,266 | 7.5 | 4.55 | % | ||||||||||
Floating rate loans payable | 118,613 | — | — | $ | 118,613 | 4.9 | 3.07 | % | ||||||||||||||
Floating rate tax-exempt bonds | 82,663 | — | — | 82,663 | 5.8 | 2.61 | % | |||||||||||||||
Total non-recourse property debt | $ | 3,719,098 | $ | 6,949 | $ | (16,505 | ) | $ | 3,709,542 | [2] | 7.4 | 4.46 | % | |||||||||
Term loan | 250,000 | — | — | 250,000 | 1.3 | [3] | 3.23 | % | ||||||||||||||
Revolving credit facility borrowings | 78,635 | — | — | 78,635 | 3.8 | 3.68 | % | |||||||||||||||
Preferred Equity | 226,378 | — | — | 226,378 | 40.0 | [4] | 7.21 | % | ||||||||||||||
Total Leverage | $ | 4,274,111 | $ | 6,949 | $ | (16,505 | ) | $ | 4,264,555 | 8.7 | 4.51 | % | ||||||||||
Cash and restricted cash | (90,893 | ) | — | 1,182 | (89,711 | ) | ||||||||||||||||
Securitization trust assets | (83,587 | ) | — | — | (83,587 | ) | [5] | |||||||||||||||
Net Leverage | $ | 4,099,631 | $ | 6,949 | $ | (15,323 | ) | $ | 4,091,257 | |||||||||||||
Leverage Ratios [6] | |||||||
First Quarter 2018 | |||||||
Debt to Adjusted EBITDA | 6.8x | ||||||
Debt and Preferred Equity to Adjusted EBITDA | 7.2x | ||||||
Adjusted EBITDA to Adjusted Interest | 3.6x | ||||||
Adjusted EBITDA to Adjusted Interest and Preferred Dividends | 3.2x | ||||||
Revolving Line of Credit Debt Coverage Covenants | |||||||
Amount | Covenant | ||||||
Fixed Charge Coverage Ratio | 2.02x | 1.40x | |||||
Credit Ratings | |||||||
Standard and Poor’s | Corporate Credit Rating | BBB- (stable) | |||||
Fitch Ratings | Issuer Default Rating | BBB- (stable) | |||||
[1] | Aimco excludes the non-recourse property debt obligations of consolidated partnerships served by the Asset Management business from its net leverage calculations because they are not Aimco’s obligations and have limited effect on the amount of fees and other payments Aimco expects to receive. In April 2018, Aimco announced the planned third quarter sale of the Asset Management business. | ||||||||||
[2] | Represents the carrying amount of Aimco’s debt. At March 31, 2018, Aimco’s debt had a mark-to-market asset of $4.5 million. Aimco computed the fair value of its debt utilizing a Money-Weighted Average Interest Rate on its fixed-rate property debt of 3.99%, which rate takes into account the timing of amortization and maturities, and a market rate of 4.01% that considers the duration of the existing property debt using a similar lending source, the loan-to-value and coverage, as well as timing of amortization and maturities. | ||||||||||
[3] | Aimco’s term loan provides for a one year extension option, which has been included in the weighted average maturity. | ||||||||||
[4] | Preferred Equity is perpetual in nature; however, for illustrative purposes, Aimco has computed the weighted average of its total leverage assuming a 40-year maturity for its Preferred Equity. | ||||||||||
[5] | In 2011, $673.8 million of Aimco’s loans payable were securitized in a trust holding only these loans. Aimco purchased the subordinate positions in the trust that holds these loans for $51.5 million. These investments have a face value of $100.9 million and a carrying amount of $83.6 million, and are included in other assets (attributable to the Real Estate portfolio) on Aimco’s Consolidated Balance Sheet at March 31, 2018. The amount of these investments effectively reduces Aimco’s leverage. | ||||||||||
[6] | Aimco’s leverage ratios have been calculated on a pro forma basis to reflect the acquisition of Bent Tree Apartments and the disposition of three apartment communities during the period as if the transactions had closed on January 1, 2018. | ||||||||||
| 22 |
Supplemental Schedule 5(b) | |||||||||||||||||||
As of March 31, 2018 | |||||||||||||||||||
Capitalization and Financial Metrics | |||||||||||||||||||
(share, unit and dollar amounts in thousands) (unaudited) | |||||||||||||||||||
Aimco Share Non-Recourse Property Debt | |||||||||||||||||||
Amortization | Maturities | Total | Maturities as a Percent of Total | Average Rate on Maturing Debt | |||||||||||||||
2018 2Q | $ | 19,298 | $ | — | $ | 19,298 | — | % | — | % | |||||||||
2018 3Q | 19,895 | — | 19,895 | — | % | — | % | ||||||||||||
2018 4Q | 20,874 | 35,530 | 56,404 | 0.98 | % | 4.15 | % | ||||||||||||
Total 2018 | 60,067 | 35,530 | 95,597 | 0.98 | % | 4.15 | % | ||||||||||||
2019 1Q | 20,281 | 54,103 | 74,384 | 1.50 | % | 4.56 | % | ||||||||||||
2019 2Q | 19,804 | 212,577 | 232,381 | 5.89 | % | 5.77 | % | ||||||||||||
2019 3Q | 17,889 | 213,437 | 231,326 | 5.91 | % | 5.74 | % | ||||||||||||
2019 4Q | 18,662 | — | 18,662 | — | % | — | % | ||||||||||||
Total 2019 | 76,636 | 480,117 | 556,753 | 13.30 | % | 5.62 | % | ||||||||||||
2020 | 71,568 | 252,021 | 323,589 | 6.98 | % | 5.88 | % | ||||||||||||
2021 | 56,256 | 635,258 | [1] | 691,514 | 17.60 | % | 5.27 | % | |||||||||||
2022 | 48,501 | 233,439 | 281,940 | 6.47 | % | 4.77 | % | ||||||||||||
2023 | 39,331 | 254,524 | 293,855 | 7.05 | % | 4.05 | % | ||||||||||||
2024 | 34,290 | 252,191 | 286,481 | 6.99 | % | 3.39 | % | ||||||||||||
2025 | 28,325 | 187,447 | 215,772 | 5.19 | % | 3.53 | % | ||||||||||||
2026 | 23,168 | 155,571 | 178,739 | 4.31 | % | 3.34 | % | ||||||||||||
2027 | 15,132 | 215,557 | 230,689 | 5.97 | % | 3.37 | % | ||||||||||||
Thereafter | 249,895 | 203,866 | 453,761 | 5.65 | % | 3.32 | % | ||||||||||||
Total | $ | 703,169 | $ | 2,905,521 | $ | 3,608,690 | |||||||||||||
Securitization Trust Assets | 100,852 | [1] | |||||||||||||||||
Aimco share non-recourse property debt | $ | 3,709,542 | |||||||||||||||||
Preferred Equity | ||||||||||||
Shares/Units Outstanding as of March 31, 2018 | Date First Available for Redemption by Aimco | Coupon | Amount | |||||||||
Class A Perpetual Preferred Stock | 5,000 | 5/17/2019 | 6.875 | % | $ | 125,000 | ||||||
Preferred Partnership Units | 3,816 | 7.633 | % | 101,378 | ||||||||
Total Preferred Equity | 7.214 | % | $ | 226,378 | ||||||||
Common Stock, Partnership Units and Equivalents | |||
As of | |||
March 31, 2018 | |||
Class A Common Stock outstanding | 156,695 | ||
Participating unvested restricted stock | 239 | ||
Dilutive options, share equivalents and non-participating unvested restricted stock | 243 | ||
Total shares and dilutive share equivalents | 157,177 | ||
Common Partnership Units and equivalents | 7,247 | ||
Total shares, units and dilutive share equivalents | 164,424 | ||
[1] | The securitized property loans mature in 2021, and will repay Aimco’s subordinate positions in the securitization trust, which reduces Aimco’s 2021 refunding requirements from $736.1 million to $635.3 million, or 17.6% of total non-recourse property debt outstanding at March 31, 2018. | ||||||||||
| 23 |
Supplemental Schedule 6(a) | ||||||||||||||||||||||||||||||||||||||||||||||
Same Store Operating Results | ||||||||||||||||||||||||||||||||||||||||||||||
Three Months Ended March 31, 2018 Compared to Three Months Ended March 31, 2017 | ||||||||||||||||||||||||||||||||||||||||||||||
(proportionate amounts, in thousands, except community, home and per home data) (unaudited) | ||||||||||||||||||||||||||||||||||||||||||||||
Revenues, Before Utility Reimbursements [1] | Expenses, Net of Utility Reimbursements [1] | Net Operating Income | Net Operating Income Margin | Average Daily Occupancy During Period | Average Revenue per Aimco Apartment Home | |||||||||||||||||||||||||||||||||||||||||
Apartment Communities | Apartment Homes | Aimco Share of Apartment Homes | 1Q 2018 | 1Q 2017 | Growth | 1Q 2018 | 1Q 2017 | Growth | 1Q 2018 | 1Q 2017 | Growth | 1Q 2018 | 1Q 2018 | 1Q 2017 | 1Q 2018 | 1Q 2017 | ||||||||||||||||||||||||||||||
Atlanta | 5 | 817 | 817 | $ | 3,944 | $ | 3,976 | (0.8 | %) | $ | 1,527 | $ | 1,475 | 3.5 | % | $ | 2,417 | $ | 2,501 | (3.4 | %) | 61.3% | 95.4% | 95.7% | $ | 1,687 | $ | 1,695 | ||||||||||||||||||
Bay Area | 8 | 1,432 | 1,432 | 12,360 | 11,879 | 4.0 | % | 2,543 | 2,749 | (7.5 | %) | 9,817 | 9,130 | 7.5 | % | 79.4% | 97.5% | 95.9% | 2,952 | 2,883 | ||||||||||||||||||||||||||
Boston | 14 | 4,379 | 4,379 | 22,162 | 21,533 | 2.9 | % | 7,522 | 7,413 | 1.5 | % | 14,640 | 14,120 | 3.7 | % | 66.1% | 95.9% | 95.5% | 1,759 | 1,716 | ||||||||||||||||||||||||||
Chicago | 9 | 2,882 | 2,882 | 13,773 | 13,450 | 2.4 | % | 3,634 | 3,752 | (3.1 | %) | 10,139 | 9,698 | 4.5 | % | 73.6% | 96.7% | 97.2% | 1,648 | 1,601 | ||||||||||||||||||||||||||
Denver | 7 | 1,925 | 1,886 | 8,727 | 8,420 | 3.6 | % | 2,713 | 2,124 | 27.7 | % | 6,014 | 6,296 | (4.5 | %) | 68.9% | 94.9% | 95.0% | 1,626 | 1,566 | ||||||||||||||||||||||||||
Greater New York | 9 | 496 | 496 | 4,411 | 4,396 | 0.3 | % | 1,580 | 1,565 | 1.0 | % | 2,831 | 2,831 | — | % | 64.2% | 96.4% | 95.7% | 3,076 | 3,088 | ||||||||||||||||||||||||||
Greater Washington, DC | 12 | 5,085 | 5,057 | 22,598 | 22,386 | 0.9 | % | 6,146 | 6,038 | 1.8 | % | 16,452 | 16,348 | 0.6 | % | 72.8% | 96.4% | 96.7% | 1,545 | 1,526 | ||||||||||||||||||||||||||
Los Angeles | 10 | 2,965 | 2,964 | 23,005 | 22,396 | 2.7 | % | 4,561 | 4,579 | (0.4 | %) | 18,444 | 17,817 | 3.5 | % | 80.2% | 96.8% | 95.9% | 2,672 | 2,627 | ||||||||||||||||||||||||||
Miami | 3 | 873 | 873 | 5,603 | 5,358 | 4.6 | % | 1,508 | 1,388 | 8.6 | % | 4,095 | 3,970 | 3.1 | % | 73.1% | 97.9% | 95.9% | 2,185 | 2,133 | ||||||||||||||||||||||||||
Philadelphia | 2 | 499 | 420 | 2,302 | 2,376 | (3.1 | %) | 662 | 607 | 9.1 | % | 1,640 | 1,769 | (7.3 | %) | 71.2% | 96.7% | 96.0% | 1,888 | 1,962 | ||||||||||||||||||||||||||
San Diego | 6 | 2,001 | 2,001 | 11,087 | 10,666 | 3.9 | % | 2,317 | 2,337 | (0.9 | %) | 8,770 | 8,329 | 5.3 | % | 79.1% | 97.0% | 96.9% | 1,905 | 1,834 | ||||||||||||||||||||||||||
Seattle | 2 | 239 | 239 | 1,543 | 1,510 | 2.2 | % | 482 | 486 | (0.8 | %) | 1,061 | 1,024 | 3.6 | % | 68.8% | 92.8% | 95.5% | 2,319 | 2,207 | ||||||||||||||||||||||||||
Other Markets | 8 | 2,774 | 2,774 | 13,339 | 12,874 | 3.6 | % | 3,728 | 3,597 | 3.6 | % | 9,611 | 9,277 | 3.6 | % | 72.1% | 95.2% | 94.3% | 1,684 | 1,640 | ||||||||||||||||||||||||||
Total | 95 | 26,367 | 26,220 | $ | 144,854 | $ | 141,220 | 2.6 | % | $ | 38,923 | $ | 38,110 | 2.1 | % | $ | 105,931 | $ | 103,110 | 2.7 | % | 73.1% | 96.3% | 96.0% | $ | 1,913 | $ | 1,871 | ||||||||||||||||||
[1] | In 2018, Aimco changed its presentation of revenues and expenses to reflect utilities costs net of amounts reimbursed by residents, which were previously included in revenue. 2017 amounts have been revised to conform to this presentation. Including such reimbursements in revenue would have resulted in same store revenue growth of 2.9% and same store expense growth of 3.2%. The table below presents growth in revenue inclusive of utility reimbursements by market: | ||||
Revenue Growth | |||||
1Q 2017 to 1Q 2018 | |||||
Atlanta | (0.7 | %) | |||
Bay Area | 4.0 | % | |||
Boston | 3.1 | % | |||
Chicago | 2.6 | % | |||
Denver | 3.9 | % | |||
Greater New York | 0.3 | % | |||
Greater Washington, DC | 1.1 | % | |||
Los Angeles | 3.0 | % | |||
Miami | 4.3 | % | |||
Philadelphia | (1.5 | %) | |||
San Diego | 4.1 | % | |||
Seattle | 2.9 | % | |||
Other Markets | 5.1 | % | |||
Total | 2.9 | % | |||
| 24 | |
Supplemental Schedule 6(b) | ||||||||||||||||||||||||||||||||||||||||||||||
Same Store Operating Results | ||||||||||||||||||||||||||||||||||||||||||||||
Three Months Ended March 31, 2018 Compared to Three Months Ended December 31, 2017 | ||||||||||||||||||||||||||||||||||||||||||||||
(proportionate amounts, in thousands, except community, home and per home data) (unaudited) | ||||||||||||||||||||||||||||||||||||||||||||||
Revenue, Before Utility Reimbursements [1] | Expenses, Net of Utility Reimbursements [1] | Net Operating Income | Net Operating Income Margin | Average Daily Occupancy During Period | Average Revenue per Aimco Apartment Home [1] | |||||||||||||||||||||||||||||||||||||||||
Apartment Communities | Apartment Homes | Aimco Share of Apartment Homes | 1Q 2018 | 4Q 2017 | Growth | 1Q 2018 | 4Q 2017 | Growth | 1Q 2018 | 4Q 2017 | Growth | 1Q 2018 | 1Q 2018 | 4Q 2017 | 1Q 2018 | 4Q 2017 | ||||||||||||||||||||||||||||||
Atlanta | 5 | 817 | 817 | $ | 3,944 | $ | 4,057 | (2.8 | %) | $ | 1,527 | $ | 1,460 | 4.6 | % | $ | 2,417 | $ | 2,597 | (6.9 | %) | 61.3% | 95.4% | 95.8% | $ | 1,687 | $ | 1,727 | ||||||||||||||||||
Bay Area | 8 | 1,432 | 1,432 | 12,360 | 12,229 | 1.1 | % | 2,543 | 1,973 | 28.9 | % | 9,817 | 10,256 | (4.3 | %) | 79.4% | 97.5% | 97.0% | 2,952 | 2,936 | ||||||||||||||||||||||||||
Boston | 14 | 4,379 | 4,379 | 22,162 | 22,125 | 0.2 | % | 7,522 | 6,899 | 9.0 | % | 14,640 | 15,226 | (3.8 | %) | 66.1% | 95.9% | 96.2% | 1,759 | 1,750 | ||||||||||||||||||||||||||
Chicago | 9 | 2,882 | 2,882 | 13,773 | 13,730 | 0.3 | % | 3,634 | 3,678 | (1.2 | %) | 10,139 | 10,052 | 0.9 | % | 73.6% | 96.7% | 96.7% | 1,648 | 1,642 | ||||||||||||||||||||||||||
Denver | 7 | 1,925 | 1,886 | 8,727 | 8,672 | 0.6 | % | 2,713 | 1,790 | 51.6 | % | 6,014 | 6,882 | (12.6 | %) | 68.9% | 94.9% | 95.4% | 1,626 | 1,606 | ||||||||||||||||||||||||||
Greater New York | 9 | 496 | 496 | 4,411 | 4,423 | (0.3 | %) | 1,580 | 1,404 | 12.5 | % | 2,831 | 3,019 | (6.2 | %) | 64.2% | 96.4% | 96.2% | 3,076 | 3,089 | ||||||||||||||||||||||||||
Greater Washington, DC | 12 | 5,085 | 5,057 | 22,598 | 22,600 | — | % | 6,146 | 5,957 | 3.2 | % | 16,452 | 16,643 | (1.1 | %) | 72.8% | 96.4% | 96.0% | 1,545 | 1,552 | ||||||||||||||||||||||||||
Los Angeles | 10 | 2,965 | 2,964 | 23,005 | 23,147 | (0.6 | %) | 4,561 | 3,882 | 17.5 | % | 18,444 | 19,265 | (4.3 | %) | 80.2% | 96.8% | 97.3% | 2,672 | 2,674 | ||||||||||||||||||||||||||
Miami | 3 | 873 | 873 | 5,603 | 5,523 | 1.4 | % | 1,508 | 1,372 | 9.9 | % | 4,095 | 4,151 | (1.3 | %) | 73.1% | 97.9% | 96.6% | 2,185 | 2,183 | ||||||||||||||||||||||||||
Philadelphia | 2 | 499 | 420 | 2,302 | 2,350 | (2.0 | %) | 662 | 536 | 23.5 | % | 1,640 | 1,814 | (9.6 | %) | 71.2% | 96.7% | 98.2% | 1,888 | 1,898 | ||||||||||||||||||||||||||
San Diego | 6 | 2,001 | 2,001 | 11,087 | 10,989 | 0.9 | % | 2,317 | 2,404 | (3.6 | %) | 8,770 | 8,585 | 2.2 | % | 79.1% | 97.0% | 96.4% | 1,905 | 1,898 | ||||||||||||||||||||||||||
Seattle | 2 | 239 | 239 | 1,543 | 1,529 | 0.9 | % | 482 | 448 | 7.6 | % | 1,061 | 1,081 | (1.9 | %) | 68.8% | 92.8% | 94.4% | 2,319 | 2,260 | ||||||||||||||||||||||||||
Other Markets | 8 | 2,774 | 2,774 | 13,339 | 13,379 | (0.3 | %) | 3,728 | 3,784 | (1.5 | %) | 9,611 | 9,595 | 0.2 | % | 72.1% | 95.2% | 95.4% | 1,684 | 1,685 | ||||||||||||||||||||||||||
Total | 95 | 26,367 | 26,220 | $ | 144,854 | $ | 144,753 | 0.1 | % | $ | 38,923 | $ | 35,587 | 9.4 | % | $ | 105,931 | $ | 109,166 | (3.0 | %) | 73.1% | 96.3% | 96.3% | $ | 1,913 | $ | 1,911 | ||||||||||||||||||
[1] | In 2018, Aimco changed its presentation of revenues and expenses to reflect utilities costs net of amounts reimbursed by residents, which were previously included in revenue. 2017 amounts have been revised to conform to this presentation. Including such reimbursements in revenue would have resulted in same store revenue growth of 0.4% and same store expense growth of 9.4%. The table below presents growth in revenue inclusive of utility reimbursements by market: | ||||
Revenue Growth | |||||
4Q 2017 to 1Q 2018 | |||||
Atlanta | (3.0 | %) | |||
Bay Area | 0.7 | % | |||
Boston | 0.5 | % | |||
Chicago | 1.2 | % | |||
Denver | 0.8 | % | |||
Greater New York | (1.0 | %) | |||
Greater Washington, DC | 0.2 | % | |||
Los Angeles | (0.5 | %) | |||
Miami | 1.8 | % | |||
Philadelphia | 0.9 | % | |||
San Diego | 0.7 | % | |||
Seattle | 1.1 | % | |||
Other Markets | 1.1 | % | |||
Total | 0.4 | % | |||
| 25 | |
Supplemental Schedule 6(c) | |||||||||||||||
Same Store Operating Expense Detail | |||||||||||||||
(proportionate amounts, in thousands) (unaudited) | |||||||||||||||
Quarterly Comparison | |||||||||||||||
1Q 2018 | % of Total | 1Q 2017 | $ Change | % Change | |||||||||||
Operating expenses [1] | $ | 18,819 | 48.3 | % | $ | 18,554 | $ | 265 | 1.4 | % | |||||
Real estate taxes | 14,903 | 38.3 | % | 14,080 | 823 | 5.8 | % | ||||||||
Utility expense, net of reimbursement [2] | 3,545 | 9.1 | % | 3,632 | (87 | ) | (2.4 | %) | |||||||
Insurance | 1,656 | 4.3 | % | 1,844 | (188 | ) | (10.2 | %) | |||||||
Total | $ | 38,923 | 100.0 | % | $ | 38,110 | $ | 813 | 2.1 | % | |||||
Sequential Comparison | |||||||||||||||
1Q 2018 | % of Total | 4Q 2017 | $ Change | % Change | |||||||||||
Operating expenses [1] | $ | 18,819 | 48.3 | % | $ | 17,355 | $ | 1,464 | 8.4 | % | |||||
Real estate taxes [3] | 14,903 | 38.3 | % | 13,174 | 1,729 | 13.1 | % | ||||||||
Utility expense, net of reimbursement [2] | 3,545 | 9.1 | % | 3,221 | 324 | 10.1 | % | ||||||||
Insurance | 1,656 | 4.3 | % | 1,837 | (181 | ) | (9.9 | %) | |||||||
Total | $ | 38,923 | 100.0 | % | $ | 35,587 | $ | 3,336 | 9.4 | % | |||||
[1] | Includes onsite payroll, repairs and maintenance, software and technology expenses, marketing, expensed turnover costs and other property related operating expenses. |
[2] | In 2018, Aimco changed its presentation of revenues and expenses to reflect utilities costs net of amounts reimbursed by residents, which were previously included in revenue. 2017 amounts have been revised to conform to this presentation. |
[3] | Real estate taxes increased first quarter 2018 compared to fourth quarter 2017, primarily due to rate and value increases effective in the first quarter for communities in the Denver, Boston and Philadelphia markets. |
| 26 |
Supplemental Schedule 7(a) | ||||||||||||||||||||||||||||||||
Real Estate Portfolio Data by Market | ||||||||||||||||||||||||||||||||
Three Months Ended March 31, 2018 Compared to Three Months Ended March 31, 2017 | ||||||||||||||||||||||||||||||||
(unaudited) | ||||||||||||||||||||||||||||||||
Three Months Ended March 31, 2018 | Three Months Ended March 31, 2017 | |||||||||||||||||||||||||||||||
Apartment Communities | Apartment Homes | Aimco Share of Apartment Homes | % Aimco NOI | Average Revenue per Aimco Apartment Home [1] | Apartment Communities | Apartment Homes | Aimco Share of Apartment Homes | % Aimco NOI | Average Revenue per Aimco Apartment Home [1] | |||||||||||||||||||||||
Atlanta | 5 | 817 | 817 | 1.6 | % | $ | 1,646 | 5 | 817 | 817 | 1.7 | % | $ | 1,652 | ||||||||||||||||||
Bay Area | 16 | 3,236 | 3,236 | 13.2 | % | 2,878 | 16 | 3,236 | 3,236 | 11.9 | % | 2,740 | ||||||||||||||||||||
Boston | 15 | 4,689 | 4,689 | 11.3 | % | 1,917 | 15 | 4,689 | 4,689 | 10.8 | % | 1,795 | ||||||||||||||||||||
Chicago | 10 | 3,246 | 3,246 | 7.2 | % | 1,643 | 10 | 3,246 | 3,246 | 7.3 | % | 1,594 | ||||||||||||||||||||
Denver | 8 | 2,151 | 2,112 | 3.9 | % | 1,626 | 8 | 2,065 | 2,026 | 4.6 | % | 1,548 | ||||||||||||||||||||
Greater New York | 18 | 1,040 | 1,040 | 3.8 | % | 3,307 | 18 | 1,040 | 1,040 | 3.9 | % | 3,306 | ||||||||||||||||||||
Greater Washington, DC | 13 | 5,833 | 5,805 | 11.5 | % | 1,535 | 14 | 5,478 | 5,430 | 11.9 | % | 1,530 | ||||||||||||||||||||
Los Angeles | 13 | 4,347 | 4,346 | 18.5 | % | 2,906 | 13 | 4,347 | 3,696 | 15.4 | % | 2,765 | ||||||||||||||||||||
Miami | 5 | 2,655 | 2,644 | 6.9 | % | 2,181 | 5 | 2,624 | 2,613 | 7.4 | % | 2,173 | ||||||||||||||||||||
Philadelphia | 5 | 2,796 | 2,717 | 6.3 | % | 1,937 | 6 | 3,244 | 3,165 | 6.7 | % | 1,770 | ||||||||||||||||||||
San Diego | 12 | 2,423 | 2,353 | 6.5 | % | 1,855 | 12 | 2,423 | 2,353 | 6.5 | % | 1,783 | ||||||||||||||||||||
Seattle | 2 | 239 | 239 | 0.7 | % | 2,319 | 2 | 239 | 239 | 0.7 | % | 2,188 | ||||||||||||||||||||
Other Markets | 12 | 3,756 | 3,727 | 8.6 | % | 1,699 | 17 | 5,725 | 5,617 | 11.2 | % | 1,514 | ||||||||||||||||||||
Total [2] | 134 | 37,228 | 36,971 | 100.0 | % | $ | 2,052 | 141 | 39,173 | 38,167 | 100.0 | % | $ | 1,922 | ||||||||||||||||||
[1] | In 2018, Aimco changed its presentation of revenues and expenses to reflect utilities costs net of amounts reimbursed by residents, which were previously included in revenue. 2017 amounts have been revised to conform to this presentation. Including these reimbursements in revenue would have resulted in total Average Revenue per Aimco Apartment Home of $2,127 and $1,996 for the quarters ended March 31, 2018 and 2017, respectively. | ||||||||
[2] | Real Estate portfolio information presented above includes those apartment communities in which Aimco held an equity interest as of the end of each period presented. | ||||||||
| 27 | |
Supplemental Schedule 7(b) | ||||||||||||||||||||||||||
Real Estate Portfolio Data by Market | ||||||||||||||||||||||||||
Fourth Quarter 2017 Market Information | ||||||||||||||||||||||||||
(unaudited) | ||||||||||||||||||||||||||
Aimco portfolio strategy seeks predictable rent growth from a portfolio of apartment communities that is diversified across “A,” “B” and “C+” price points, averaging “B/B+” in quality, and that is diversified across the largest markets in the U.S. The schedule below illustrates Aimco’s Real Estate portfolio quality based on fourth quarter 2017 data, the most recent period for which third-party data is available. Aimco adjusts the portfolio data to remove apartment communities sold through the current quarter, if any. The average age of Aimco’s portfolio, adjusted for its sizable investment in redevelopment, is approximately 24 years. | ||||||||||||||||||||||||||
Three Months Ended December 31, 2017 | ||||||||||||||||||||||||||
Apartment Communities [1] | Apartment Homes | Aimco Share of Apartment Homes | % Aimco NOI | Average Rent per Aimco Apartment Home [2] | Market Rent [3] | Percentage of Market Rent Average | Average Age of Apartment Communities | |||||||||||||||||||
Atlanta | 5 | 817 | 817 | 1.7 | % | $ | 1,598 | $ | 1,059 | 150.9 | % | 22 | ||||||||||||||
Bay Area | 16 | 3,236 | 3,236 | 13.4 | % | 2,752 | 2,711 | 101.5 | % | 21 | ||||||||||||||||
Boston | 15 | 4,689 | 4,689 | 10.8 | % | 1,793 | 2,126 | 84.3 | % | 31 | ||||||||||||||||
Chicago | 10 | 3,246 | 3,246 | 7.1 | % | 1,521 | 1,303 | 116.7 | % | 23 | ||||||||||||||||
Denver | 8 | 2,065 | 2,026 | 4.5 | % | 1,479 | 1,236 | 119.7 | % | 19 | ||||||||||||||||
Greater New York [4] | 18 | 1,040 | 1,040 | 4.1 | % | 3,205 | 3,025 | 106.0 | % | 22 | ||||||||||||||||
Greater Washington, DC | 12 | 5,085 | 5,057 | 10.8 | % | 1,478 | 1,672 | 88.4 | % | 50 | ||||||||||||||||
Los Angeles | 13 | 4,347 | 4,346 | 19.0 | % | 2,767 | 1,799 | 153.8 | % | 13 | ||||||||||||||||
Miami | 5 | 2,652 | 2,641 | 6.7 | % | 2,001 | 1,404 | 142.5 | % | 25 | ||||||||||||||||
Philadelphia | 5 | 2,796 | 2,717 | 6.5 | % | 1,820 | 1,246 | 146.1 | % | 28 | ||||||||||||||||
San Diego | 12 | 2,423 | 2,353 | 6.6 | % | 1,745 | 1,659 | 105.2 | % | 28 | ||||||||||||||||
Seattle | 2 | 239 | 239 | 0.6 | % | 2,104 | 1,618 | 130.0 | % | 4 | ||||||||||||||||
Other Markets | 12 | 3,756 | 3,727 | 8.2 | % | 1,584 | 1,328 | 119.3 | % | 26 | ||||||||||||||||
Total | 133 | 36,391 | 36,134 | 100.0 | % | $ | 1,945 | $ | 1,719 | 113.1 | % | 24 | ||||||||||||||
[1] | The portfolio information presented above includes all Real Estate apartment communities in which Aimco held an equity interest as of December 31, 2017, with the exception of three apartment communities sold during first quarter 2018. | ||||||||||
[2] | Represents rents, after concessions and vacancy loss, divided by Aimco Share of Apartment Homes. Does not include other rental income. | ||||||||||
[3] | 4Q 2017 per REIS. | ||||||||||
[4] | Average age for the New York portfolio has been adjusted based on the assessment of a third-party appraiser to better reflect the economic age of the apartment communities. The appraiser’s analysis accounted for the conditions of the communities, Aimco’s overall capital investment in the communities and the remaining useful life of the depreciable components of the communities. | ||||||||||
| 28 | |
Supplemental Schedule 8 | ||||||||||||||||||||||||||||||
Apartment Community Disposition and Acquisition Activity | ||||||||||||||||||||||||||||||
(dollars in millions, except average revenue per home) (unaudited) | ||||||||||||||||||||||||||||||
Real Estate Disposition and Acquisition Activity | ||||||||||||||||||||||||||||||
First Quarter 2018 Dispositions | ||||||||||||||||||||||||||||||
Number of Apartment Communities [1] | Number of Apartment Homes | Weighted Average Ownership | Gross Proceeds | NOI Cap Rate [2] | Free Cash Flow Cap Rate [3] | Property Debt | Net Sales Proceeds [4] | Aimco Net Proceeds [5] | Average Revenue per Apartment Home | |||||||||||||||||||||
3 | 513 | 85% | $ | 71.9 | 6.2 | % | 5.3 | % | $ | — | $ | 70.2 | $ | 64.6 | $ | 1,387 | ||||||||||||||
[1] In first quarter 2018, Aimco sold three apartment communities, two of which are located in southern Virginia and one located in suburban Maryland. | ||||||||||||||||||||||||||||||
[2] NOI Cap Rate is calculated based on Aimco’s share of the proportionate property NOI for the trailing twelve months prior to sale, less a 3% management fee, divided by Aimco gross proceeds. | ||||||||||||||||||||||||||||||
[3] Free Cash Flow Cap Rate represents the NOI Cap Rate, adjusted for assumed Capital Replacements spending of $1,200 per apartment home. | ||||||||||||||||||||||||||||||
[4] Net Sales Proceeds are after repayment of debt, if any, net working capital settlements, payment of transaction costs and debt prepayment penalties, if applicable. | ||||||||||||||||||||||||||||||
[5] Aimco Net Proceeds are Net Sales Proceeds adjusted for distributions made to noncontrolling interests in real estate partnerships. | ||||||||||||||||||||||||||||||
During the first quarter 2018, Aimco completed the previously announced sale of its interests in the entities owning the La Jolla Cove property in settlement of legal actions filed in 2014 by a group of disappointed buyers who had hoped to acquire the property. Aimco provided seller financing with a notional value of $49 million and received net cash proceeds of approximately $5 million in the sale. | ||||||||||||||||||||||||||||||
First Quarter 2018 Acquisitions | ||||||||||||||||||||||||||||||
Apartment Community Name | Location | Month Acquired | Apartment Homes | Purchase Price | Average Rent per Apartment Home [6] | |||||||||||||||||||||||||
Bent Tree Apartments | Fairfax County, VA | February | 748 | $ | 160 | $1,426 | ||||||||||||||||||||||||
[6] Represents average rent per apartment home for leases in place at the time of acquisition. Before consideration of capital enhancement opportunities, new lease rents are 4% higher than expiring leases, as compared to new lease rents that have decreased elsewhere in Northern Virginia. | ||||||||||||||||||||||||||||||
| 29 | |
Supplemental Schedule 9 | ||||
Real Estate Capital Additions Information | ||||
Three Months Ended March 31, 2018 | ||||
(consolidated amounts in thousands, except per apartment home data) (unaudited) | ||||
Aimco classifies capital additions as Capital Replacements (“CR”), Capital Improvements (“CI”), Capital Enhancements (“CE”), Redevelopment, Development or Casualty. Recurring capital additions are apportioned between CR and CI based on the useful life of the item under consideration and the period over which Aimco has owned the item. Under this method of classification, CR represents the portion of the item consumed during Aimco’s ownership of the item, while CI represents the portion of the item consumed prior to Aimco’s period of ownership. | ||||
Three Months Ended March 31, 2018 | ||||
Capital Additions | ||||
Capital Replacements | ||||
Buildings and grounds | $ | 4,093 | ||
Turnover capital additions | 1,542 | |||
Capitalized site payroll and indirect costs | 1,092 | |||
Capital Replacements | 6,727 | |||
Capital Improvements | 1,824 | |||
Capital Enhancements | 19,146 | |||
Redevelopment | 41,049 | |||
Development | 5,720 | |||
Casualty | 2,253 | |||
Total [1] | $ | 76,719 | ||
Total apartment homes | 37,086 | |||
Capital Replacements per apartment home | $ | 181 | ||
[1] | For the three months ended March 31, 2018, capital additions for Aimco’s Real Estate portfolio include $2 million of capitalized interest costs. | ||||
| 30 |
Supplemental Schedule 10 | ||||||||||||||||||||||||||||||||||||||
Redevelopment Portfolio | (Page 1 of 4) | |||||||||||||||||||||||||||||||||||||
As of March 31, 2018 | ||||||||||||||||||||||||||||||||||||||
(dollars in millions, except per home information) (unaudited) | ||||||||||||||||||||||||||||||||||||||
Aimco executes redevelopments using a range of approaches. Aimco prefers to limit risk by executing redevelopments using a phased approach, in which it renovates an apartment community in stages. Smaller phases provide Aimco the flexibility to maintain current earnings while aligning the timing of the completed apartment homes with market demand. The following table summarizes value-creating investments related to redevelopments of this nature. | ||||||||||||||||||||||||||||||||||||||
Number of Apartment Homes | Percentage of Completed Homes Leased | Potential Net Investment [1] | Inception-to-Date Net Investment | |||||||||||||||||||||||||||||||||||
Location | Total Apartment Homes | Approved for Redevelopment / To Be Constructed | Homes Completed | Current Project Scope | ||||||||||||||||||||||||||||||||||
Bay Parc | Miami, FL | 474 | 15 | — | — | % | $ | 20.0 | $ | 19.4 | Amenities and renovation of one floor of apartment homes | |||||||||||||||||||||||||||
Calhoun Beach Club | Minneapolis, MN | 332 | 275 | 59 | 100 | % | 28.7 | 10.3 | Common areas plus renovation of apartment homes | |||||||||||||||||||||||||||||
Flamingo South Beach | Miami, FL | 1,309 | — | — | — | % | 9.7 | 8.0 | Common areas only | |||||||||||||||||||||||||||||
Palazzo West at The Grove | Los Angeles, CA | 521 | 389 | 273 | 96 | % | 24.5 | 17.0 | Renovation of apartment homes | |||||||||||||||||||||||||||||
Saybrook Pointe | San Jose, CA | 324 | 324 | 268 | 96 | % | 18.3 | 15.6 | Amenities and renovation of apartment homes | |||||||||||||||||||||||||||||
Yorktown | Lombard, IL | 364 | 292 | 143 | 99 | % | 25.7 | 18.8 | Amenities plus renovation of apartment homes | |||||||||||||||||||||||||||||
Other [2] | Various | 945 | 92 | 41 | 85 | % | 12.9 | 4.4 | Various | |||||||||||||||||||||||||||||
Total | 4,269 | 1,387 | 784 | $ | 139.8 | $ | 93.5 | |||||||||||||||||||||||||||||||
Aimco undertakes ground-up development when warranted by risk-adjusted investment returns, either directly or in connection with the redevelopment of an existing apartment community or, on a more limited basis, at a new location. When smaller redevelopment phases are not possible, Aimco may engage in redevelopment activities where an entire building or community is vacated. The following table summarizes value-creating investments related to these developments and redevelopments. | ||||||||||||||||||||||||||||||||||||||
Average Revenue per Apartment Home Redeveloped or Constructed [3] | ||||||||||||||||||||||||||||||||||||||
Number of Apartment Homes | Percentage of Completed Homes Leased | Estimated Net Investment | Inception-to-Date Net Investment | |||||||||||||||||||||||||||||||||||
Location | Total Apartment Homes | Approved for Redevelopment / To Be Constructed | Homes Completed | Initial Occupancy | Stabilized Occupancy | NOI Stabilization | Prior to Investment | Expected Stabilized | Expected Incremental Commercial Revenue | |||||||||||||||||||||||||||||
Parc Mosaic | Boulder, CO | 226 | 226 | — | — | % | $ | 117.0 | $ | 30.0 | 2Q 2019 | 4Q 2020 | 1Q 2022 | n/a | $ | 3,010 | n/a | |||||||||||||||||||||
Park Towne Place | Philadelphia, PA | 942 | 942 | 697 | 89 | % | 176.0 | 155.5 | 3Q 2015 | 1Q 2019 | 2Q 2020 | 1,590 | 2,545 | 0.2 | ||||||||||||||||||||||||
Total | 1,168 | 1,168 | 697 | $ | 293.0 | $ | 185.5 | |||||||||||||||||||||||||||||||
Total | 5,437 | 2,555 | 1,481 | $ | 432.8 | $ | 279.0 | |||||||||||||||||||||||||||||||
[1] | Potential net investment relates to the current phase of the redevelopment. |
[2] | Includes Broadway Lofts located in San Diego, and Villas at Park La Brea and Palazzo East at Park La Brea, both located in Los Angeles. |
[3] | In 2018, Aimco changed its presentation of revenues and expenses to reflect utilities costs net of amounts reimbursed by residents. Reimbursed utilities are excluded from the calculation of Average Revenue per Apartment Home. This change has no effect on Aimco’s expected rental rates. |
See the following pages for Terms and Definitions and a Description of Redevelopment Projects. | |
| 31 | |
Supplemental Schedule 10 (Continued) | ||||||||||||||
Redevelopment Valuation Information | (Page 2 of 4) | |||||||||||||
(proportionate amounts, dollars in millions) (unaudited) | ||||||||||||||
Three Months Ended March 31, 2018 | ||||||||||||||
Occupancy Stabilized Communities | Communities Under Construction or in Lease-up | Total Redevelopment/Development Portfolio | ||||||||||||
Proportionate Property NOI | ||||||||||||||
Proportionate Property NOI | $ | 5.6 | $ | 23.9 | $ | 29.5 | ||||||||
Occupancy Stabilized Communities | ||||||||||||||
Annualized first quarter 2018 Proportionate Property NOI | $ | 22.4 | ||||||||||||
Range of applicable NOI capitalization rates | 4.50% to 5.00% | [1] | ||||||||||||
Communities Under Construction or in Lease-up | ||||||||||||||
Pre-redevelopment Proportionate Property NOI | $ | 99.6 | ||||||||||||
Inception-to-date net investment - Aimco share | $ | 279.0 | ||||||||||||
Projected NOI yield on incremental investment at stabilization | 6.1 | % | ||||||||||||
Projected proportionate incremental stabilized property NOI | $ | 17.0 | ||||||||||||
Total estimated post redevelopment Proportionate Property NOI | $ | 116.6 | ||||||||||||
Range of applicable NOI capitalization rates | 4.30% to 4.70% | [2] | ||||||||||||
[1] | Occupancy stabilized communities include: One Canal, a 310 home community in Boston, Massachusetts and The Sterling, a 534 home community in Center City Philadelphia. Average rents for these communities are greater than 125% of their respective local market average rents, making these communities, on average, "A" quality as defined by Aimco. Based on these factors, and information provided by the CBRE North American Cap Rate Study for Second Half 2017, NOI weighted capitalization rates may range from 4.50% - 5.00%. | |||
[2] | These communities are located in high-quality submarkets including: | |||
Location | Submarket | |||
Boulder, CO | Boulder | |||
Lombard, IL | Central DuPage County | |||
Los Angeles, CA | Mid-Wilshire | |||
Miami, FL | Downtown/South Beach | |||
Minneapolis, MN | Uptown/St. Louis Park | |||
Philadelphia, PA | Center City | |||
San Diego, CA | Downtown/Coronado | |||
San Jose, CA | South San Jose | |||
Projected stabilized average rents for these communities are greater than 125% of their respective local market average rents, making these communities, on average, "A" quality as defined by Aimco. Based on these factors, and information provided by the CBRE North American Cap Rate Study for Second Half 2017, NOI weighted capitalization rates may range from 4.30% - 4.70%. | ||||
Aimco estimates the fair value of occupancy stabilized communities by annualizing the most recent quarter’s Proportionate Property NOI and applying an appropriate capitalization rate. Aimco estimates the fair value for the communities under construction or in lease-up by discounting projected future cash flows through community stabilization. See Aimco’s September 30, 2017 NAV Presentation on Aimco’s website at www.aimco.com/investors for additional information. The fair value of these communities may also be derived by applying an appropriate capitalization rate to estimated post redevelopment Proportionate Property NOI. The post redevelopment Proportionate Property NOI may be calculated as the combination of Pre-redevelopment Proportionate Property NOI (defined on the next page) and the projected proportionate incremental stabilized property NOI as estimated based on the projected yield on current inception-to-date investment. | ||||
See the following pages for Terms and Definitions and a Description of Redevelopment Projects. | ||||
| 32 | |
Supplemental Schedule 10 (Continued) | ||||||||||||||||
Redevelopment Portfolio | (Page 3 of 4) | |||||||||||||||
Terms and Definitions | ||||||||||||||||
Estimated Net Investment - represents total estimated investment, net of tax and other credits earned by Aimco as a direct result of its redevelopment or development of the community. Total estimated investment includes all capitalized costs projected to be incurred to redevelop or develop the respective community, as determined in accordance with GAAP. | ||||||||||||||||
Stabilized Occupancy - period in which Aimco expects to achieve stabilized occupancy (greater than 90%). | ||||||||||||||||
NOI Stabilization - period in which Aimco expects to achieve stabilized rents and operating costs, generally five quarters after Stabilized Occupancy. | ||||||||||||||||
Average Revenue per Apartment Home Redeveloped or Constructed - represents the actual revenues per apartment home, which includes rents and other rental income, prior to redevelopment, and the projected revenues per apartment home following redevelopment or construction, excluding rent and other rental income from commercial leases (which are presented separately on page 1 of this schedule). Also, beginning in 2018, resident utility reimbursements are excluded from this calculation. The amounts presented in the schedule have been revised for this change. Projections of stabilized revenues per apartment home are based on management’s judgment at the start of a redevelopment or development project. These projections consider factors including but not limited to: current rent; other rental income expectations; and revenue achievement to date as compared to current market rents. | ||||||||||||||||
Pre-redevelopment Proportionate Property NOI - estimated by applying (a) market revenue and expense growth rates derived from third-party information for the period immediately preceding construction through the current period to (b) Proportionate Property NOI results immediately preceding construction. | ||||||||||||||||
Projected Stabilized NOI Yield on Incremental Investment - for redevelopment projects, represents projected stabilized incremental net operating income (including commercial lease income) as a percentage of the Estimated Net Investment. Projected incremental net operating income for redevelopment projects includes the estimated stabilized rate increase that is expected to be achieved and the estimated expense savings resulting from the redevelopment. For development projects, this represents projected stabilized net operating income as a percentage of the Estimated Net Investment. | ||||||||||||||||
Occupancy Stabilized Communities - includes communities classified as part of Redevelopment/Development for which construction has been completed, but for which the requirements to be reclassified into Same Store have not yet been met. | ||||||||||||||||
Communities Under Construction or in Lease-up - represents communities classified as part of Redevelopment/Development and included in Supplemental Schedule 10, as well as other communities classified as Redevelopment/Development that are smaller in scope and therefore not included in Supplemental Schedule 10. | ||||||||||||||||
| 33 | |
Supplemental Schedule 10 (Continued) | |
Project Summaries | (Page 4 of 4) |
Bay Parc Miami, FL | The current phase of the redevelopment includes: improvements to the leasing and lobby areas; redesign of the retail space including addition of a street café; updated landscaping; and expansion of the pool deck. During the fourth quarter 2017, Aimco commenced the redevelopment of the apartment homes on one floor of the building, which are expected to be completed in the second quarter of 2018. The common areas and amenities were completed in first quarter 2018. |
Calhoun Beach Club Minneapolis, MN | Aimco commenced an initial phase of redevelopment, which includes upgrading the 275 homes and common areas with luxury finishes and creating limited access penthouse homes with an exclusive common area on the top two floors of the 12-story building. Redevelopment of the corridors in the 12-story building was completed during the first quarter 2018. Redevelopment of additional apartment homes is pending market conditions and demand. |
Flamingo South Beach Miami, FL | The current phase of the redevelopment includes the full upgrade of the property-wide security systems, including biometrics and destination elevators, and upgrade of the common areas of the center tower and mid-rise building. |
Palazzo West at The Grove Los Angeles, CA | The current phase of the project includes the renovation of 389 apartment homes on the first three floors, or 75% of the homes in the community, and enhancements to the corridors on these floors. |
Parc Mosaic Boulder, CO | This is a ground-up development of a 226 apartment home community. Aimco commenced construction in the fourth quarter 2017 with completion anticipated in late 2019. |
Park Towne Place Philadelphia, PA | Aimco is redeveloping the four towers at this community, one at a time. During third quarter 2017, Aimco completed construction of the third tower, which is now 85% leased at rates consistent with underwriting. The success of the first three towers led Aimco to proceed with redevelopment of the fourth and final tower. Construction is on schedule. During first quarter Aimco began pre-leasing apartment homes in this tower and expects initial occupancies in the second quarter. The $176.0 million estimated net investment for the redevelopment represents a gross investment of $219.7 million, reduced by $43.7 million of historic tax credits. |
Saybrook Pointe San Jose, CA | The redevelopment includes redesigning kitchens, installing new flooring, and upgrading lighting fixtures within the apartment homes and upgrades to all community amenities. |
Yorktown Apartment Homes Lombard, IL | The current phase of the redevelopment includes modernization of the common areas, expansion of the fitness center, and lobby renovation. The renovation of the apartment homes includes upgraded finishes and creation of open living spaces. Redevelopment of additional apartment homes is pending market conditions and demand. |
| 34 | |
GLOSSARY AND RECONCILIATIONS OF NON-GAAP FINANCIAL AND OPERATING MEASURES
This Earnings Release and Supplemental Information include certain financial and operating measures used by Aimco management that are not calculated in accordance with accounting principles generally accepted in the United States, or GAAP. Aimco’s definitions and calculations of these non-GAAP financial and operating measures and other terms may differ from the definitions and methodologies used by other REITs and, accordingly, may not be comparable. These non-GAAP financial and operating measures should not be considered an alternative to GAAP net income or any other GAAP measurement of performance and should not be considered an alternative measure of liquidity.
AIMCO OP: AIMCO Properties, L.P., a Delaware limited partnership, is the operating partnership in Aimco’s UPREIT structure. Aimco owns approximately 95% of the common partnership units of the Aimco OP.
AIMCO PROPORTIONATE FINANCIAL INFORMATION: Within this Earnings Release and Supplemental Information, Aimco provides certain financial information necessary to calculate Aimco’s share of financial information. This information is not, nor is it intended to be, a presentation in accordance with GAAP. Aimco’s proportionate share of financial information includes Aimco’s share of unconsolidated real estate partnerships and excludes the noncontrolling interest partners’ share of consolidated real estate partnerships.
Aimco does not control the unconsolidated real estate partnerships and the calculation of Aimco’s share of the assets and liabilities and revenues and expenses does not represent a legal claim to a proportionate share of such items. The amount of cash distributions partners in such partnerships may receive is based upon specific provisions in the partnership agreements and may vary based on whether such distributions are generated from operations, capital events or liquidation.
Proportionate information benefits the users of Aimco’s financial information by providing the amount of revenues, expenses, assets, liabilities and other items attributable to Aimco stockholders. Other companies may calculate their proportionate information differently than Aimco does, limiting the usefulness as a comparative measure. Because of these limitations, the non-GAAP Aimco proportionate financial information should not be considered in isolation or as a substitute for information included in Aimco’s financial statements as reported under GAAP.
ASSET MANAGEMENT: Asset Management refers generally to the activities Aimco performs in its role as general partner in partnerships holding low-income housing tax credit apartment communities, and which are structured to provide for the pass-through of tax credits and deductions to their partners. Aimco holds nominal ownership positions in these partnerships, generally less than 1%. Aimco provides asset management and other services to these partnerships and receives fees and other payments in return. To the extent the amounts due Aimco are not paid currently, the balances accrue and are satisfied from the partnerships’ future operating or liquidating cash flow. Aimco also recognizes tax credit income as the tax credits and tax deductions are delivered to the partners and is generally responsible for ensuring the underlying apartment communities comply with the requirements to earn low-income housing tax credits. Aimco’s relationship with these partnerships is different than real estate ownership and is better described as an Asset Management business, from which Aimco has limited upside or downside exposure. Aimco values the Asset Management business based on the discounted future cash flows it expects to receive.
In accordance with GAAP, Aimco consolidates most of these partnerships and their underlying apartment communities. Aimco’s share of the results of operations of these apartment communities was approximately
| 35 |
95% at March 31, 2018 (inclusive of unconsolidated communities) and represents cash flows from operations that are currently available to pay fees and other amounts due under the contractual agreements.
Aimco announced in April 2018, the planned third quarter sale of the Asset Management business.
AVERAGE AGE OF APARTMENT COMMUNITIES: Calculated by Aimco on a property-by-property basis based on the year the community was originally built, adjusted for redevelopment and/or other major capital improvements that effectively reduce the age of the community. Such investments include construction of new buildings and/or amenities, replacement or modernization of mechanical, plumbing and electrical systems and other investments that are consequential in nature.
CAPITAL ADDITIONS DEFINITIONS
CAPITAL IMPROVEMENTS (CI): CI represent capital additions made to replace the portion of acquired apartment communities consumed prior to Aimco’s period of ownership.
CAPITAL REPLACEMENTS (CR): Unlike CI, CR does not increase the useful life of an asset from its original purchase condition. CR represent capital additions made to replace the portion of acquired capital assets consumed during Aimco’s period of ownership. CR is deducted in the calculation of AFFO.
CASUALTY CAPITAL ADDITIONS: Casualty capital additions represent capitalized costs incurred in connection with the restoration of an asset after a casualty event such as a hurricane, tornado, flood or fire.
CAPITAL ENHANCEMENTS (CE): CE may include kitchen and bath remodeling; energy conservation projects; and investments in longer-lived materials designed to reduce turnover costs, such as simulated wood flooring and granite countertops. CE differs from Redevelopment Additions in that they are generally lesser in scope and do not significantly disrupt property operations.
REDEVELOPMENT ADDITIONS: Redevelopment additions represent capital additions intended to enhance the value of the apartment community through the ability to generate higher average rental rates. Redevelopment additions may include costs related to entitlement, which enhance the value of a community through increased density, and costs related to renovation of exteriors, common areas or apartment homes.
DEVELOPMENT ADDITIONS: Development additions represent construction and related capitalized costs associated with ground-up development projects.
CONTRIBUTION FROM ASSET MANAGEMENT: As presented in Supplemental Schedule 2, Contribution from Asset Management consists of fees and other amounts paid to Aimco from the net operating income of partnerships that own low-income housing tax credit apartment communities less interest expense incurred on non-recourse property-level debt obligations of the partnerships; income associated with delivery of tax credits to the non-Aimco investors in the partnerships (including amounts received during the period and amounts received in previous periods); and other income; less asset management expenses (including certain allocated offsite costs related to the operation of this business).
CONTRIBUTION FROM REAL ESTATE: As presented in Supplemental Schedule 2, Contribution from Real Estate consists of property net operating income and other items of income or expense that relate to the Real Estate portfolio, including property management expenses, casualty losses, interest expense related to non-recourse property debt encumbering these communities, and interest income Aimco earns on its investment in a securitization trust that holds certain Aimco property debt.
| 36 |
FREE CASH FLOW: Free Cash Flow, as calculated for Aimco’s retained portfolio, represents an apartment community’s property net operating income, less spending for Capital Replacements. Capital Replacement spending is a measure of the cost of capital asset used during the period. Aimco believes that Free Cash Flow is useful to investors as a supplemental measure of apartment community performance because it takes into consideration costs incurred during the period to replace capital assets that have been consumed during Aimco’s ownership.
FREE CASH FLOW CAP RATE: Free Cash Flow Cap Rate represents the NOI Cap Rate, adjusted for assumed Capital Replacements spending of $1,200 per apartment home.
FREE CASH FLOW MARGIN: Free Cash Flow Margin represents an apartment community’s property net operating income less $1,200 per apartment home of assumed annual Capital Replacement spending, as a percentage of the apartment community’s rental and other property revenues.
FUNDS FROM OPERATIONS (FFO): FFO is a commonly used measure of REIT performance, which the National Association of Real Estate Investment Trusts (NAREIT) defines as net income, computed in accordance with GAAP, excluding gains from sales of, and impairment losses recognized with respect to, depreciable property, plus depreciation and amortization, and after adjustments for unconsolidated partnerships and joint ventures. Aimco computes FFO for all periods presented in accordance with the guidance set forth by NAREIT.
In addition to FFO, Aimco uses PRO FORMA FUNDS FROM OPERATIONS (Pro forma FFO) and ADJUSTED FUNDS FROM OPERATIONS (AFFO) to measure performance. Pro forma FFO represents FFO as defined above, excluding preferred equity redemption related amounts. Preferred equity redemption related amounts (gains or losses) are items that periodically affect net income attributable to Aimco common stockholders computed in accordance with GAAP. Aimco excludes preferred equity redemption related amounts (gains or losses) from its computation of Pro forma FFO because such amounts are not representative of operating performance.
Aimco is engaged in litigation with Airbnb to protect its property right to select its residents and their neighbors. Due to the unpredictable nature of these cases and associated legal costs, Aimco excludes such costs from Pro forma FFO (adjusted for noncontrolling interests).
AFFO represents Pro forma FFO reduced by Capital Replacements (also adjusted for noncontrolling interests) and is Aimco’s primary measure of current period performance.
FFO, Pro forma FFO and AFFO are non-GAAP measures that Aimco believes are helpful to investors in understanding Aimco’s performance because they capture features particular to real estate performance by recognizing that real estate generally appreciates over time or maintains residual value to a much greater extent than other capital assets such as machinery, computers or other personal property. FFO, Pro forma FFO and AFFO should not be considered alternatives to net income (loss) as determined in accordance with GAAP, as indicators of performance. There can be no assurance that Aimco’s method of computing FFO, Pro forma FFO or AFFO is comparable with that of other real estate investment trusts.
| 37 |
The following table reconciles GAAP net income per share to Pro forma FFO per share and AFFO per share, each as presented at the mid-point of Aimco’s guidance range:
(dollars per share) (unaudited) | Second Quarter | Full Year | |||||
2018 | 2018 | ||||||
Net income | $ | 0.05 | $ | 4.30 | |||
Depreciation, net | 0.54 | 2.19 | |||||
Gain on dispositions of real estate, inclusive of related income tax | — | (4.05 | ) | ||||
Pro forma FFO | 0.59 | 2.44 | |||||
Capital Replacements, net | (0.09 | ) | (0.31 | ) | |||
AFFO | $ | 0.50 | $ | 2.13 | |||
LEVERAGE RATIO DEFINITIONS
Aimco’s leverage strategy targets the ratio of Debt and Preferred Equity to Adjusted EBITDA to be below 7.0x and the ratio of Adjusted EBITDA to Adjusted Interest and Preferred Dividends to be greater than 2.5x. Aimco also focuses on the ratios of Debt to Adjusted EBITDA and Adjusted EBITDA Coverage of Adjusted Interest. Aimco believes these ratios, which are based in part on non-GAAP financial information, are commonly used by investors and analysts to assess the relative financial risk associated with balance sheets of companies within the same industry, and they are believed to be similar to measures used by rating agencies to assess entity credit quality.
Aimco leverage includes Aimco’s share of long-term, non-recourse property debt secured by apartment communities in the Real Estate portfolio, its term loan, outstanding borrowings on its revolving credit facility, and outstanding preferred equity. Aimco leverage excludes non-recourse property debt obligations of consolidated partnerships served by the Asset Management business (described further under the Asset Management definition above). The value of the Asset Management business is attributed to the fees paid to Aimco from the operation and liquidation of the underlying partnerships, and the non-recourse property debt obligations of the partnerships in this business are not Aimco’s obligations and have limited effect on the amount of fees and other amounts Aimco expects to receive under the contractual agreements. Additionally, in April 2018, Aimco announced the planned third quarter 2018 sale of the Asset Management business. Aimco reconciles consolidated balances to Aimco’s net leverage on Supplemental Schedule 5(a).
Aimco calculates its leverage ratios based on current quarter amounts, annualized.
As described further in the Leverage Ratios discussion in the Earnings Release and in Supplemental Schedule 5(a), Aimco adjusted its first quarter leverage ratios to reflect the acquisition of Bent Tree Apartments and the disposition of three apartment communities during the period as if the transactions had closed on January 1, 2018.
| 38 |
ADJUSTED EARNINGS BEFORE INTEREST, TAXES, DEPRECIATION AND AMORTIZATION (ADJUSTED EBITDA): Adjusted EBITDA represents Aimco’s share of the consolidated amount of Aimco net income, adjusted to exclude the effect of the following items for the reasons set forth below:
• | Adjusted Interest Expense, defined below, to allow investors to compare a measure of Aimco’s earnings before the effects of Aimco’s indebtedness with that of other companies in the real estate industry; |
• | preferred dividends, to allow investors to compare a measure of Aimco’s earnings before the effects of Aimco’s capital structure and indebtedness with that of other companies in the real estate industry; |
• | income taxes, to allow investors to measure Aimco’s performance independent of income taxes, which may vary significantly from other companies within Aimco’s industry due to leverage and tax planning strategies, among other factors; |
• | depreciation and amortization, gains or losses on dispositions and impairment losses related to real estate, for similar reasons to those set forth in the discussion of FFO, Pro forma FFO and AFFO above; and |
• | other items, including gains on dispositions of non-depreciable assets, as these are items that periodically affect Aimco operations, but that are not necessarily representative of Aimco’s ability to service its debt obligations. |
A reconciliation of net income attributable to Aimco Common Stockholders to Adjusted EBITDA for Aimco’s Real Estate portfolio for the three months ended March 31, 2018 is as follows:
(in thousands) (unaudited) | Three Months Ended March 31, 2018 | ||
Net income attributable to Aimco Common Stockholders | $ | 81,525 | |
Adjustments: | |||
Adjusted Interest Expense | 39,639 | ||
Income tax benefit | (37,388 | ) | |
Depreciation and amortization, net of noncontrolling interest | 92,630 | ||
Gains on disposition and other, inclusive of related income taxes and net of noncontrolling partners’ interests | (44,152 | ) | |
Preferred stock dividends | 2,148 | ||
Net income attributable to noncontrolling interests in Aimco Operating Partnership | 5,811 | ||
Pro forma adjustment (described above) | 1,231 | ||
Adjusted EBITDA | $ | 141,444 | |
Annualized Adjusted EBITDA | $ | 565,776 | |
ADJUSTED INTEREST EXPENSE: Adjusted Interest Expense represents Aimco’s proportionate share of interest expense on non-recourse property debt encumbering Real Estate apartment communities and interest on the credit facility borrowings less (i) prepayment penalties and amortization of debt issuance costs and (ii) the amount of interest income recognized by Aimco related to its investment in the subordinated tranches in a securitization trust holding primarily Aimco property debt. Adjusted Interest Expense also excludes interest expense related to non-recourse property debt obligations of consolidated partnerships served by the Asset Management business.
| 39 |
Adjusted Interest Expense and Preferred Dividends as used in the leverage ratios on Supplemental Schedule 5(a) are calculated as follows:
(in thousands) (unaudited) | Three Months Ended March 31, 2018 | ||
Interest expense per consolidated statement of operations | $ | 47,795 | |
Interest expense related to non-recourse property debt obligations of consolidated partnerships served by the Asset Management business | (3,286 | ) | |
Interest expense attributable to Real Estate portfolio | 44,509 | ||
Adjustments: | |||
Adjustments related to interest of consolidated and unconsolidated partnerships | (94 | ) | |
Debt prepayment penalties and other non-interest items | (1,482 | ) | |
Amortization of debt issue costs | (1,445 | ) | |
Interest income received on securitization investment | (1,849 | ) | |
Adjusted Interest Expense | $ | 39,639 | |
Preferred Dividends | 4,085 | ||
Adjusted Interest Expense and Preferred Dividends | $ | 43,724 | |
Annualized Adjusted Interest Expense | $ | 158,556 | |
Annualized Adjusted Interest Expense and Preferred Dividends | $ | 174,896 | |
FIXED CHARGE COVERAGE RATIO: As defined by Aimco’s credit agreement, the ratio of (a) EBITDA to (b) fixed charges, which represent the sum of (i) Aimco’s proportionate share of interest expense (excluding prepayment penalties and amortization of debt issuance costs), (ii) debt amortization and (iii) Preferred Dividends, for the four fiscal quarters preceding the date of calculation. The calculation of certain of these measures as defined by Aimco’s Credit Agreement may differ from those used by Aimco in the calculations of its Leverage Ratios.
PREFERRED DIVIDENDS: Preferred dividends include dividends paid with respect to Aimco’s Preferred Stock and the Aimco OP’s Preferred Partnership Units, exclusive of preferred equity redemption related amounts.
PREFERRED EQUITY: Preferred equity represents the redemption amounts for Aimco’s Preferred Stock and the Aimco OP’s Preferred Partnership Units and may be found in Aimco’s consolidated balance sheets and on Supplemental Schedule 5(b).
PROPORTIONATE DEBT TO ADJUSTED EBITDA RATIO: The ratio of (a) Aimco’s share of net leverage as calculated on Supplemental Schedule 5(a) and shown above, excluding Preferred Equity to (b) Adjusted EBITDA.
PROPORTIONATE DEBT AND PREFERRED EQUITY TO ADJUSTED EBITDA RATIO: The ratio of (a) Aimco’s share of net leverage attributable to its Real Estate portfolio as calculated on Supplemental Schedule 5(a) and shown above to (b) Adjusted EBITDA.
NET OPERATING INCOME (NOI) CAP RATE: NOI Cap Rate is calculated based on Aimco’s share of the proportionate property NOI for the trailing twelve months prior to sale, less a 3% management fee, divided by Aimco gross proceeds.
NET OPERATING INCOME (NOI) MARGIN: Represents an apartment community’s net operating income as a percentage of the apartment community’s rental and other property revenues.
OTHER EXPENSES, NET: Other expenses, net allocated to real estate property operating expenses and net operating income of partnerships served by Asset Management on Supplemental Schedule 2 includes
| 40 |
franchise taxes, and expenses specifically related to Aimco’s administration of its real estate partnerships, for example, services such as audit, tax and legal. Other expenses, net not allocated to Real Estate or Asset Management generally consists of risk management activities related to Aimco’s unconsolidated partnerships and certain other corporate expenses.
PROPERTY NET OPERATING INCOME (NOI) and PROPORTIONATE PROPERTY NOI: NOI is defined by Aimco as total property rental and other property revenues less direct property operating expenses, including real estate taxes. NOI does not include: property management revenues, primarily from affiliates; casualties; property management expenses; depreciation; or interest expense. NOI is helpful because it helps both investors and management to understand the operating performance of real estate excluding costs associated with decisions about acquisition pricing, overhead allocations and financing arrangements. NOI is also considered by many in the real estate industry to be a useful measure for determining the value of real estate. Reconciliations of NOI as presented in this Earnings Release and Supplemental Information to Aimco’s consolidated GAAP amounts are provided below.
Due to the diversity of its economic ownership interests in its apartment communities in the periods presented, Aimco evaluates the performance of the apartment communities in its Real Estate segment using Proportionate Property NOI, which represents Aimco’s share of the NOI for the apartment communities that Aimco consolidates and manages but excludes apartment communities that it does not consolidate. Proportionate Property NOI is defined as Aimco share of rental and other property revenue less Aimco share of property operating expenses. In its evaluation of community results, Aimco excludes from rental and other property revenues the amount of utilities cost reimbursed by residents and reflects such amount as a reduction of the related utility expense within property operating expenses. The following table presents the reconciliation of GAAP rental and other property revenue to the proportionate revenues before utility reimbursements and GAAP property operating expenses to proportionate expenses, net of utility reimbursements. The table also presents the reconciliation of consolidated Same Store revenue before utility reimbursements and expenses, net of utility reimbursements as presented on Supplemental Schedule 2a to the proportionate amounts presented on Supplemental Schedule 6.
Real Estate Segment NOI Reconciliation | ||||||||||||||||
(in thousands)(unaudited) | Three Months Ended March 31, 2018 | Three Months Ended March 31, 2017 | ||||||||||||||
Revenues, Before Utility Reimbursements | Expenses, Net of Utility Reimbursements | Revenues, Before Utility Reimbursements | Expenses, Net of Utility Reimbursements | |||||||||||||
Total attributable to Real Estate (per consolidated statements of operations) | $ | 225,393 | $ | 78,287 | $ | 225,228 | $ | 79,626 | ||||||||
Adjustment: Utility reimbursement attributable to Real Estate [1] | (8,372 | ) | (8,372 | ) | (7,357 | ) | (7,357 | ) | ||||||||
Adjustment: Sold properties and other amounts not allocated [2] | (1,857 | ) | (7,749 | ) | (11,654 | ) | (11,740 | ) | ||||||||
Attributable to Real Estate (per Supplemental Schedule 2) | 215,164 | 62,166 | 206,217 | 60,529 | ||||||||||||
Adjustment: proportionate adjustment [3] | (777 | ) | (263 | ) | (6,817 | ) | (2,001 | ) | ||||||||
Segment proportionate amounts | $ | 214,387 | $ | 61,903 | $ | 199,400 | $ | 58,528 | ||||||||
Same Store amounts (per Supplemental Schedule 2) | $ | 145,520 | $ | 39,125 | $ | 141,906 | $ | 38,284 | ||||||||
Proportionate adjustment [3] | (666 | ) | (202 | ) | (686 | ) | (174 | ) | ||||||||
Same Store amounts, adjusted (per Supplemental Schedule 6) | $ | 144,854 | $ | 38,923 | $ | 141,220 | $ | 38,110 | ||||||||
[1] | Nearly two-thirds of Aimco’s utility costs are reimbursed by residents. These reimbursements are included in rental and other property revenues on Aimco’s consolidated statements of operations prepared in accordance with GAAP. This adjustment |
| 41 |
represents the reclassification of utility reimbursements from revenues to property operating expenses for the purpose of evaluating segment results and as presented on Supplemental Schedule 2, Supplemental Schedule 3, and Supplemental Schedule 6. Aimco also excludes the reimbursement amounts from the calculation of Average Revenue per Apartment Home throughout this Earnings Release and Supplemental Schedules.
[2] | Sold properties and other amounts not allocated to Real Estate includes operating results of apartment communities sold during the periods shown or held for sale at the end of the period, as well as property management and casualty expense, which are not included in property operating expenses, net of utility reimbursements in the Supplemental Schedule 2 presentation. |
[3] | Proportionate adjustments represent the noncontrolling interests’ share of the rental and other property revenues before utility reimbursements and property operating expenses, net of utility reimbursements. Such adjustment is necessary to reconcile consolidated amounts presented on Supplemental Schedule 2 to the amounts allocated to Aimco’s Real Estate operating segment, as well as to reconcile Same Store amounts presented on Supplemental Schedule 2 to proportionate same store amounts presented on Supplemental Schedules 6. |
PORTFOLIO QUALITY RATINGS: Aimco measures the quality of apartment communities in its Real Estate portfolio based on average rents of our apartment homes compared to local market average rents as reported by a third-party provider of commercial real estate performance and analysis. Under this rating system, Aimco classifies as “A” quality apartment communities those earning rents greater than 125% of the local market average, as “B” quality apartment communities those earning rents between 90% and 125% of the local market average; “C+” quality apartment communities those earning rents greater than $1,100 per month, but lower than 90% of the local market average; and “C” quality apartment communities those earning rents less than $1,100 per month and lower than 90% of the local market average.
REAL ESTATE: Real Estate represents Aimco’s portfolio of apartment communities diversified by both price point and geography. Real Estate includes predominantly market rate apartment communities in which Aimco holds substantial equity ownership interest, generally 100%. Aimco’s Real Estate portfolio is classified into four categories, as follows:
SAME STORE: Same Store apartment communities are apartment communities that (a) are owned and managed by Aimco, (b) had reached a stabilized level of operations as of January 1, 2017 and maintained it throughout the current and the comparable prior periods and (c) are not expected to be sold within 12 months.
ACQUISITION: Includes apartment communities acquired since January 1, 2017.
REDEVELOPMENT/DEVELOPMENT: Includes apartment communities currently under construction that have not achieved a stabilized level of operations and those that have been completed in recent years that had not achieved and maintained stabilized operations for both the current and the comparable prior periods.
OTHER REAL ESTATE: Real Estate apartment communities that do not meet the Same Store, Acquisition or Redevelopment/Development definitions.
SOLD AND HELD FOR SALE APARTMENT COMMUNITIES: Apartment communities either sold since January 1, 2017, or classified as held for sale at the end of the period. For purposes of highlighting results of operations related to Aimco’s retained portfolio, results for Sold and Held For Sale Apartment Communities are excluded from property net operating income and presented separately for Real Estate and Asset Management on a net basis on Supplemental Schedule 2. Information about property net operating income for Sold and Held For Sale Apartment Communities may be found on Supplemental Schedule 3(b).
| 42 |