Attached files
| file | filename |
|---|---|
| 8-K - 8-K - RE/MAX Holdings, Inc. | a18-12828_18k.htm |
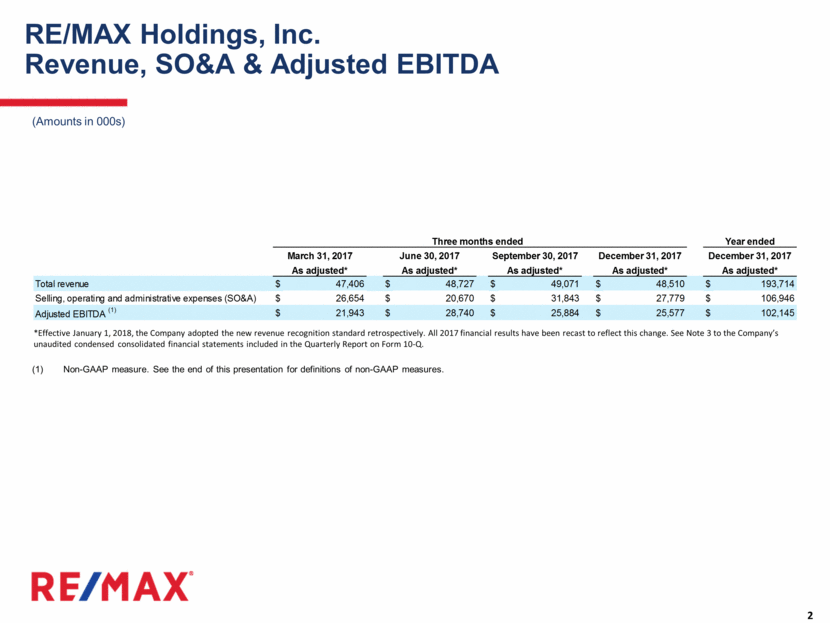
RE/MAX Holdings, Inc. Revenue, SO&A & Adjusted EBITDA *Effective January 1, 2018, the Company adopted the new revenue recognition standard retrospectively. All 2017 financial results have been recast to reflect this change. See Note 3 to the Company’s unaudited condensed consolidated financial statements included in the Quarterly Report on Form 10-Q. Non-GAAP measure. See the end of this presentation for definitions of non-GAAP measures. (Amounts in 000s) Total revenue $ 47,406 $ 48,727 $ 49,071 $ 48,510 $ 193,714 Selling, operating and administrative expenses (SO&A) $ 26,654 $ 20,670 $ 31,843 $ 27,779 $ 106,946 Adjusted EBITDA (1) $ 21,943 $ 28,740 $ 25,884 $ 25,577 $ 102,145 Three months ended Year ended September 30, 2017 As adjusted* As adjusted* March 31, 2017 June 30, 2017 As adjusted* December 31, 2017 As adjusted* December 31, 2017 As adjusted*
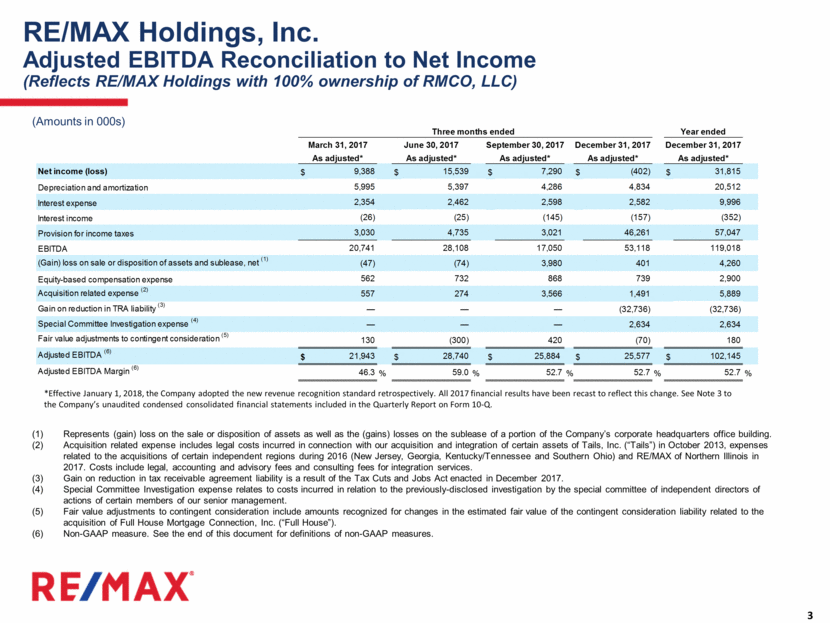
(Amounts in 000s) Represents (gain) loss on the sale or disposition of assets as well as the (gains) losses on the sublease of a portion of the Company’s corporate headquarters office building. Acquisition related expense includes legal costs incurred in connection with our acquisition and integration of certain assets of Tails, Inc. (“Tails”) in October 2013, expenses related to the acquisitions of certain independent regions during 2016 (New Jersey, Georgia, Kentucky/Tennessee and Southern Ohio) and RE/MAX of Northern Illinois in 2017. Costs include legal, accounting and advisory fees and consulting fees for integration services. Gain on reduction in tax receivable agreement liability is a result of the Tax Cuts and Jobs Act enacted in December 2017. Special Committee Investigation expense relates to costs incurred in relation to the previously-disclosed investigation by the special committee of independent directors of actions of certain members of our senior management. Fair value adjustments to contingent consideration include amounts recognized for changes in the estimated fair value of the contingent consideration liability related to the acquisition of Full House Mortgage Connection, Inc. (“Full House”). Non-GAAP measure. See the end of this document for definitions of non-GAAP measures. *Effective January 1, 2018, the Company adopted the new revenue recognition standard retrospectively. All 2017 financial results have been recast to reflect this change. See Note 3 to the Company’s unaudited condensed consolidated financial statements included in the Quarterly Report on Form 10-Q. RE/MAX Holdings, Inc. Adjusted EBITDA Reconciliation to Net Income (Reflects RE/MAX Holdings with 100% ownership of RMCO, LLC) Net income (loss) $ 9,388 $ 15,539 $ 7,290 $ (402) $ 31,815 Depreciation and amortization 5,995 5,397 4,286 4,834 20,512 Interest expense 2,354 2,462 2,598 2,582 9,996 Interest income (26) (25) (145) (157) (352) Provision for income taxes 3,030 4,735 3,021 46,261 57,047 EBITDA 20,741 28,108 17,050 53,118 119,018 (Gain) loss on sale or disposition of assets and sublease, net (1) (47) (74) 3,980 401 4,260 Equity-based compensation expense 562 732 868 739 2,900 Acquisition related expense (2) 557 274 3,566 1,491 5,889 Gain on reduction in TRA liability (3) — — — (32,736) (32,736) Special Committee Investigation expense (4) — — — 2,634 2,634 Fair value adjustments to contingent consideration (5) 130 (300) 420 (70) 180 Adjusted EBITDA (6) $ 21,943 $ 28,740 $ 25,884 $ 25,577 $ 102,145 Adjusted EBITDA Margin (6) 46.3 % 59.0 % 52.7 % 52.7 % 52.7 % December 31, 2017 As adjusted* Year ended September 30, 2017 Three months ended As adjusted* As adjusted* March 31, 2017 June 30, 2017 As adjusted* December 31, 2017 As adjusted*
The SEC has adopted rules to regulate the use in filings with the SEC and in public disclosures of financial measures that are not in accordance with U.S. GAAP, such as Adjusted EBITDA and the ratios related thereto, Adjusted net income, Adjusted basic and diluted earnings per share (Adjusted EPS) and Free cash flow. These measures are derived on the basis of methodologies other than in accordance with U.S. GAAP. The Company defines Adjusted EBITDA as EBITDA (consolidated net income before depreciation and amortization, interest expense, interest income and the provision for income taxes, each of which is presented in the unaudited condensed consolidated financial statements included earlier in this press release), adjusted for the impact of the following items that are either non-cash or that the Company does not consider representative of its ongoing operating performance: loss or gain on sale or disposition of assets and sublease, equity-based compensation expense, acquisition related expenses, special committee investigation expenses, expense or income related to changes in the estimated fair value measurement of contingent consideration, and other non-recurring items. The Company now adjusts for expense or income related to changes in the estimated fair value measurement of contingent consideration as it is a noncash item that the Company believes is not reflective of operating performance. Adjusted EBITDA was revised in prior periods to reflect this change for consistency in presentation. Because Adjusted EBITDA and Adjusted EBITDA margin omit certain non-cash items and other non-recurring cash charges or other items, the Company believes that each measure is less susceptible to variances that affect its operating performance resulting from depreciation, amortization and other non-cash and non-recurring cash charges or other items. The Company presents Adjusted EBITDA and the related Adjusted EBITDA margin because the Company believes they are useful as supplemental measures in evaluating the performance of its operating businesses and provides greater transparency into the Company’s results of operations. The Company’s management uses Adjusted EBITDA and Adjusted EBITDA margin as factors in evaluating the performance of the business. Adjusted EBITDA and Adjusted EBITDA margin have limitations as analytical tools, and you should not consider these measures in isolation or as a substitute for analyzing the Company’s results as reported under U.S. GAAP. Some of these limitations are: these measures do not reflect changes in, or cash requirements for, the Company’s working capital needs; these measures do not reflect the Company’s interest expense, or the cash requirements necessary to service interest or principal payments on its debt; these measures do not reflect the Company’s income tax expense or the cash requirements to pay its taxes; these measures do not reflect the cash requirements to pay dividends to stockholders of the Company’s Class A common stock and tax and other cash distributions to its non-controlling unitholders; these measures do not reflect the cash requirements to pay RIHI Inc. and Oberndorf pursuant to the tax receivable agreements; although depreciation and amortization are non-cash charges, the assets being depreciated and amortized will often require replacement in the future, and these measures do not reflect any cash requirements for such replacements; although equity-based compensation is a non-cash charge, the issuance of equity-based awards may have a dilutive impact on earnings per share; and other companies may calculate these measures differently so similarly named measures may not be comparable. Non-GAAP Financial Measures
The Company’s Adjusted EBITDA guidance does not include certain charges and costs. The adjustments to EBITDA in future periods are generally expected to be similar to the kinds of charges and costs excluded from Adjusted EBITDA in prior quarters, such as gain on sale or disposition of assets and sublease and acquisition related expenses, among others. The exclusion of these charges and costs in future periods will have a significant impact on the Company’s Adjusted EBITDA. The Company is not able to provide a reconciliation of the Company’s non-GAAP financial guidance to the corresponding U.S. GAAP measures without unreasonable effort because of the uncertainty and variability of the nature and amount of these future charges and costs. Adjusted net income is calculated as Net income attributable to RE/MAX Holdings, assuming the full exchange of all outstanding non-controlling interests for shares of Class A common stock as of the beginning of the period (and the related increase to the provision for income taxes after such exchange), plus primarily non-cash items and other items that management does not consider to be useful in assessing the Company’s operating performance (e.g., amortization of acquired intangible assets, gain on sale or disposition of assets and sub-lease, special committee investigation costs, acquisition-related expenses and equity-based compensation expense). Adjusted basic and diluted earnings per share (Adjusted EPS) are calculated as Adjusted net income (as defined above) divided by pro forma (assuming the full exchange of all outstanding non-controlling interests) basic and diluted weighted average shares, as applicable. When used in conjunction with GAAP financial measures, Adjusted net income and Adjusted EPS are supplemental measures of operating performance that management believes are useful measures to evaluate the Company’s performance relative to the performance of its competitors as well as performance period over period. By assuming the full exchange of all outstanding non-controlling interests, management believes these measures: facilitate comparisons with other companies that do not have a low effective tax rate driven by a non-controlling interest on a pass-through entity; facilitate period over period comparisons because they eliminate the effect of changes in Net income attributable to RE/MAX Holdings, Inc. driven by increases in its ownership of RMCO, LLC, which are unrelated to the Company’s operating performance; and eliminate primarily non-cash and other items that management does not consider to be useful in assessing the Company’s operating performance. Free cash flow is calculated as cash flows from operations less capital expenditures, both as reported under GAAP, and quantifies how much cash a company has to pursue opportunities that enhance shareholder value. The Company believes free cash flow is useful to investors as a supplemental measure as it calculates the cash flow available for working capital needs, re-investment opportunities, potential independent region and strategic acquisitions, dividend payments or other strategic uses of cash. Free cash flow after tax and non-dividend distributions to RIHI is calculated as free cash flow less tax and other non-dividend distributions paid to RIHI (the non-controlling interest holder) to enable RIHI to satisfy its income tax obligations. Similar payments would be made by the Company directly to federal and state taxing authorities as a component of the Company’s consolidated provision for income taxes if a full exchange of non-controlling interests occurred in the future. As a result and given the significance of the Company’s ongoing tax and non-dividend distribution obligations to its non-controlling interest, free cash flow after tax and non-dividend distributions, when used in conjunction with GAAP financial measures, provides a meaningful view of cash flow available to the Company to pursue opportunities that enhance shareholder value. Unencumbered cash generated is calculated as free cash flow after tax and non-dividend distributions to RIHI less quarterly debt principal payments less annual excess cash flow payment on debt, as applicable. Given the significance of the Company’s excess cash flow payment on debt, when applicable, unencumbered cash generated, when used in conjunction with GAAP financial measures, provides a meaningful view of the cash flow available to the Company to pursue opportunities that enhance shareholder value after considering its debt service obligations. Non-GAAP Financial Measures (continued)
