Attached files
| file | filename |
|---|---|
| 8-K - 8-K - HANCOCK WHITNEY CORP | d579526d8k.htm |
| Exhibit 99.1
|

Gulf South Bank Conference Fireside Chat May 7, 2018
|
Important cautionary statement about forward-looking statements This presentation contains forward-looking statements within the meaning of section 27A of the Securities Act of 1933, as amended, and section 21E of the Securities Exchange Act of 1934, as amended. Forward looking statements that we may make include statements regarding balance sheet and revenue growth, the provision for loans losses, loan growth expectations, management’s predictions about charge-offs for loans, including energy-related credits, the impact of changes in oil and gas prices on our energy portfolio, and the downstream impact on businesses that support the energy sector, especially in the Gulf Coast region, the impact of the sale of HFC on our performance and financial condition, the impact of the transactions with First NBC and Capital One (pending) on our performance and financial condition, including our ability to successfully integrate the businesses, deposit trends, credit quality trends, net interest margin trends, future expense levels, success of revenue-generating initiatives, projected tax rates, future profitability, improvements in expense to revenue (efficiency) ratio, purchase accounting impacts such as accretion levels, and the financial impact of regulatory requirements and tax reform legislation. Also, any statement that does not describe historical or current facts is a forward-looking statement. These statements often include the words “believes,” “expects,” “anticipates,” “estimates,” “intends,” “plans,” “forecast,” “goals,” “targets,” “initiatives,” “focus,” “potentially,” “probably,” “projects,” “outlook” or similar expressions or future conditional verbs such as “may,” “will,” “should,” “would,” and “could.” Forward-looking statements are based upon the current beliefs and expectations of management and on information currently available to management. Our statements speak as of the date hereof, and we do not assume any obligation to update these statements or to update the reasons why actual results could differ from those contained in such statements in light of new information or future events. Forward-looking statements are subject to significant risks and uncertainties. Any forward-looking statement made in this release is subject to the safe harbor protections set forth in the Private Securities Litigation Reform Act of 1995. Investors are cautioned against placing undue reliance on such statements. Actual results may differ materially from those set forth in the forward looking statements. Additional factors that could cause actual results to differ materially from those described in the forward-looking statements can be found in Part I, “Item 1A. Risk Factors” in our Annual Report on Form 10-K for the year ended December 31, 2017 and in other periodic reports that we file with the SEC. 2
|
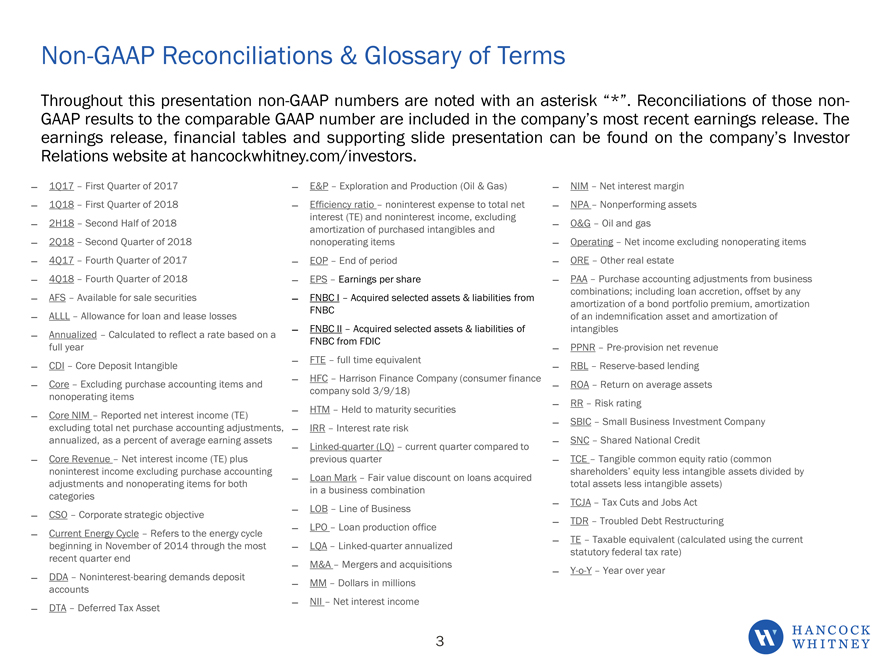
Non-GAAP Reconciliations & Glossary of Terms Throughout this presentation non-GAAP numbers are noted with an asterisk “*”. Reconciliations of those non-GAAP results to the comparable GAAP number are included in the company’s most recent earnings release. The earnings release, financial tables and supporting slide presentation can be found on the company’s Investor Relations website at hancockwhitney.com/investors. 1Q17 First Quarter of 2017 1Q18 First Quarter of 2018 2H18 Second Half of 2018 2Q18 Second Quarter of 2018 4Q17 Fourth Quarter of 2017 4Q18 Fourth Quarter of 2018 AFS Available for sale securities ALLL Allowance for loan and lease losses Annualized Calculated to reflect a rate based on a full year CDI Core Deposit Intangible Core Excluding purchase accounting items and nonoperating items Core NIM Reported net interest income (TE) excluding total net purchase accounting adjustments, annualized, as a percent of average earning assets Core Revenue Net interest income (TE) plus noninterest income excluding purchase accounting adjustments and nonoperating items for both categories CSO Corporate strategic objective Current Energy Cycle Refers to the energy cycle beginning in November of 2014 through the most recent quarter end DDA Noninterest-bearing demands deposit accounts DTA Deferred Tax Asset E&P Exploration and Production (Oil & Gas) Efficiency ratio noninterest expense to total net interest (TE) and noninterest income, excluding amortization of purchased intangibles and nonoperating items EOP End of period EPS Earnings per share FNBC I Acquired selected assets & liabilities from FNBC FNBC II Acquired selected assets & liabilities of FNBC from FDIC FTE full time equivalent HFC Harrison Finance Company (consumer finance company sold 3/9/18) HTM Held to maturity securities IRR Interest rate risk Linked-quarter (LQ) current quarter compared to previous quarter Loan Mark Fair value discount on loans acquired in a business combination LOB Line of Business LPO Loan production office LQA Linked-quarter annualized M&A Mergers and acquisitions MM Dollars in millions NII Net interest income NIM Net interest margin NPA Nonperforming assets O&G Oil and gas Operating Net income excluding nonoperating items ORE Other real estate PAA Purchase accounting adjustments from business combinations; including loan accretion, offset by any amortization of a bond portfolio premium, amortization of an indemnification asset and amortization of intangibles PPNR Pre-provision net revenue RBL Reserve-based lending ROA Return on average assets RR Risk rating SBIC Small Business Investment Company SNC Shared National Credit TCE Tangible common equity ratio (common shareholders’ equity less intangible assets divided by total assets less intangible assets) TCJA Tax Cuts and Jobs Act TDR Troubled Debt Restructuring TE Taxable equivalent (calculated using the current statutory federal tax rate) Y-o-Y Year over year
|
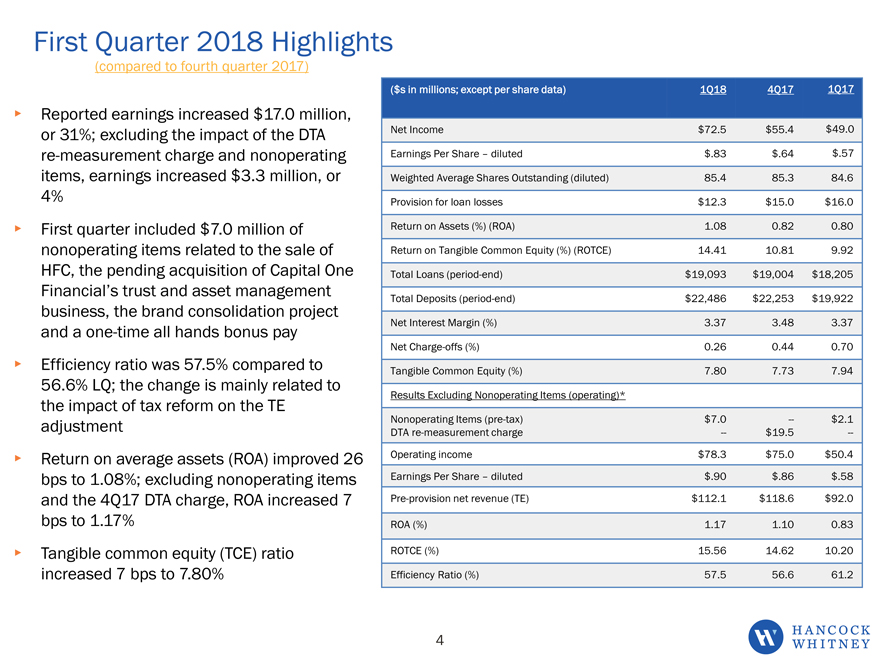
First Quarter 2018 Highlights (compared to fourth quarter 2017) Reported earnings increased $17.0 million, or 31%; excluding the impact of the DTA re-measurement charge and nonoperating items, earnings increased $3.3 million, or 4% First quarter included $7.0 million of nonoperating items related to the sale of HFC, the pending acquisition of Capital One Financial’s trust and asset management business, the brand consolidation project and a one-time all hands bonus pay Efficiency ratio was 57.5% compared to 56.6% LQ; the change is mainly related to the impact of tax reform on the TE adjustment Return on average assets (ROA) improved 26 bps to 1.08%; excluding nonoperating items and the 4Q17 DTA charge, ROA increased 7 bps to 1.17% Tangible common equity (TCE) ratio increased 7 bps to 7.80% ($s in millions; except per share data) 1Q18 4Q17 1Q17 Net Income $72.5 $55.4 $49.0 Earnings Per Share diluted $.83 $.64 $.57 Weighted Average Shares Outstanding (diluted) 85.4 85.3 84.6 Provision for loan losses $12.3 $15.0 $16.0 Return on Assets (%) (ROA) 1.08 0.82 0.80 Return on Tangible Common Equity (%) (ROTCE) 14.41 10.81 9.92 Total Loans (period-end) $19,093 $19,004 $18,205 Total Deposits (period-end) $22,486 $22,253 $19,922 Net Interest Margin (%) 3.37 3.48 3.37 Net Charge-offs (%) 0.26 0.44 0.70 Tangible Common Equity (%) 7.80 7.73 7.94 Results Excluding Nonoperating Items (operating)* Nonoperating Items (pre-tax) $7.0 — $2.1 DTA re-measurement charge — $19.5 — Operating income $78.3 $75.0 $50.4 Earnings Per Share diluted $.90 $.86 $.58 Pre-provision net revenue (TE) $112.1 $118.6 $92.0 ROA (%) 1.17 1.10 0.83 ROTCE (%) 15.56 14.62 10.20 Efficiency Ratio (%) 57.5 56.6 61.2 4
|
|
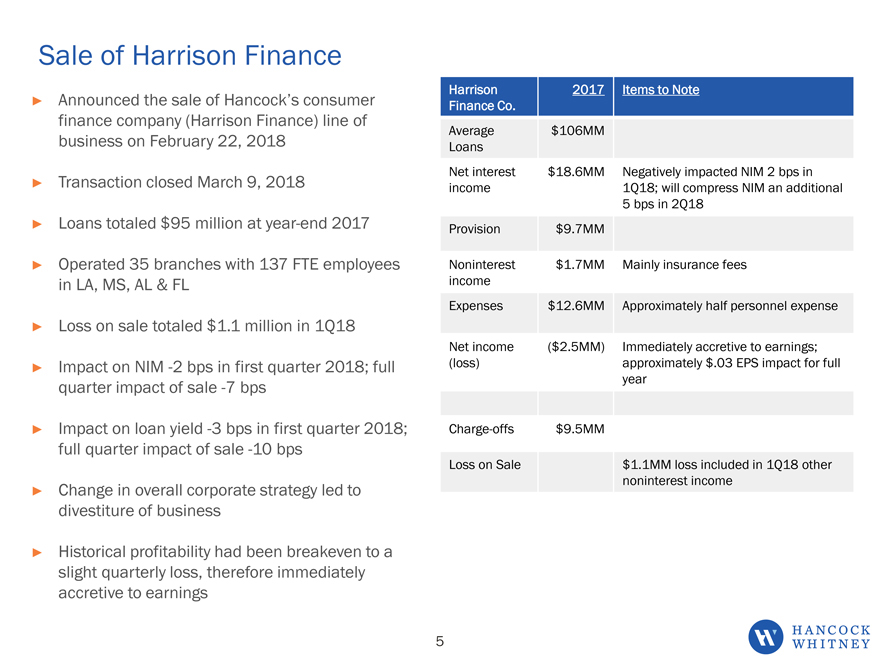
Sale of Harrison Finance Announced the sale of Hancock’s consumer finance company (Harrison Finance) line of business on February 22, 2018 Transaction closed March 9, 2018 Loans totaled $95 million at year-end 2017 Operated 35 branches with 137 FTE employees in LA, MS, AL & FL Loss on sale totaled $1.1 million in 1Q18 Impact on NIM -2 bps in first quarter 2018; full quarter impact of sale -7 bps Impact on loan yield -3 bps in first quarter 2018; full quarter impact of sale -10 bps Change in overall corporate strategy led to divestiture of business Historical profitability had been breakeven to a slight quarterly loss, therefore immediately accretive to earnings Harrison 2017 Items to Note Finance Co. Average $106MM Loans Net interest $18.6MM Negatively impacted NIM 2 bps in income 1Q18; will compress NIM an additional 5 bps in 2Q18 Provision $9.7MM Noninterest $1.7MM Mainly insurance fees income Expenses $12.6MM Approximately half personnel expense Net income ($2.5MM) Immediately accretive to earnings; (loss) approximately $.03 EPS impact for full year Charge-offs $9.5MM Loss on Sale $1.1MM loss included in 1Q18 other noninterest income 5
|
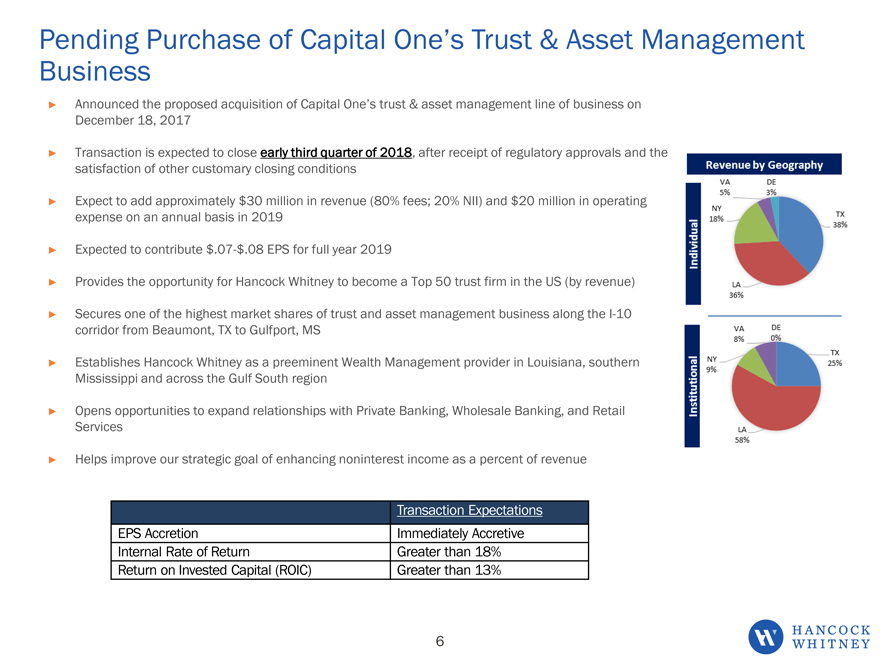
Pending Purchase of Capital One’s Trust & Asset Management Business Announced the proposed acquisition of Capital One’s trust & asset management line of business on December 18, 2017 Transaction is expected to close early third quarter of 2018, after receipt of regulatory approvals and the satisfaction of other customary closing conditions Expect to add approximately $30 million in revenue (80% fees; 20% NII) and $20 million in operating expense on an annual basis in 2019 Expected to contribute $.07-$.08 EPS for full year 2019 Provides the opportunity for Hancock Whitney to become a Top 50 trust firm in the US (by revenue) Secures one of the highest market shares of trust and asset management business along the I-10 corridor from Beaumont, TX to Gulfport, MS Establishes Hancock Whitney as a preeminent Wealth Management provider in Louisiana, southern Mississippi and across the Gulf South region Opens opportunities to expand relationships with Private Banking, Wholesale Banking, and Retail Services Helps improve our strategic goal of enhancing noninterest income as a percent of revenue Transaction Expectations EPS Accretion Immediately Accretive Internal Rate of Return Greater than 18% Return on Invested Capital (ROIC) Greater than 13% 6
|
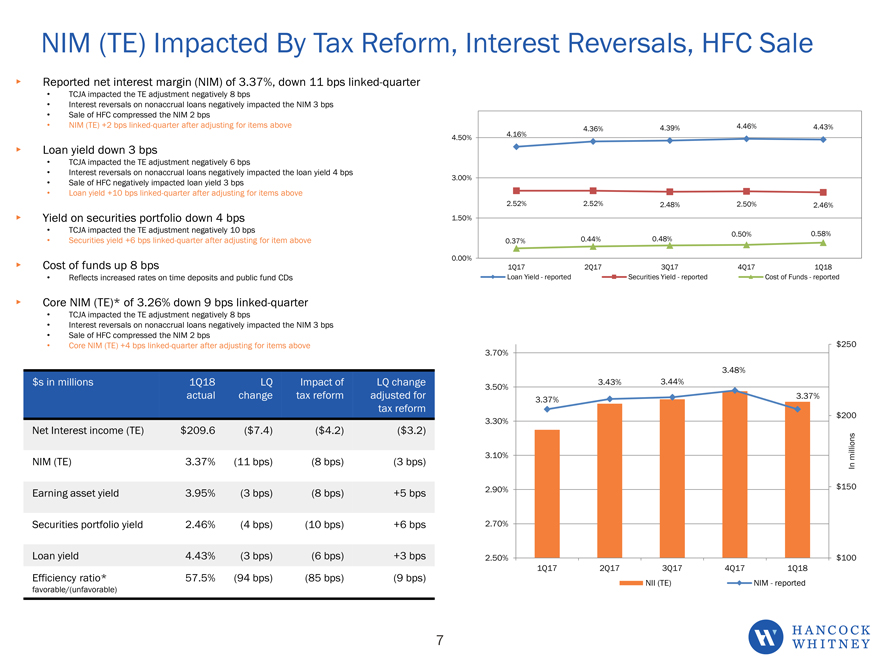
NIM (TE) Impacted By Tax Reform, Interest Reversals, HFC Sale Reported net interest margin (NIM) of 3.37%, down 11 bps linked-quarter TCJA impacted the TE adjustment negatively 8 bps Interest reversals on nonaccrual loans negatively impacted the NIM 3 bps Sale of HFC compressed the NIM 2 bps NIM (TE) +2 bps linked-quarter after adjusting for items above Loan yield down 3 bps TCJA impacted the TE adjustment negatively 6 bps Interest reversals on nonaccrual loans negatively impacted the loan yield 4 bps Sale of HFC negatively impacted loan yield 3 bps Loan yield +10 bps linked-quarter after adjusting for items above Yield on securities portfolio down 4 bps TCJA impacted the TE adjustment negatively 10 bps Securities yield +6 bps linked-quarter after adjusting for item above Cost of funds up 8 bps Reflects increased rates on time deposits and public fund CDs Core NIM (TE)* of 3.26% down 9 bps linked-quarter TCJA impacted the TE adjustment negatively 8 bps Interest reversals on nonaccrual loans negatively impacted the NIM 3 bps Sale of HFC compressed the NIM 2 bps Core NIM (TE) +4 bps linked-quarter after adjusting for items above 4.36% 4.39% 4.46% 4.43% 4.50% 4.16% 3.00% 2.52% 2.52% 2.48% 2.50% 2.46% 1.50% 0.50% 0.58% 0.37% 0.44% 0.48% 0.00% 1Q17 2Q17 3Q17 4Q17 1Q18 Loan Yield—reported Securities Yield—reported Cost of Funds—reported $s in millions 1Q18 LQ Impact of LQ change actual change tax reform adjusted for tax reform Net Interest income (TE) $209.6 ($7.4) ($4.2) ($3.2) NIM (TE) 3.37% (11 bps) (8 bps) (3 bps) Earning asset yield 3.95% (3 bps) (8 bps) +5 bps Securities portfolio yield 2.46% (4 bps) (10 bps) +6 bps Loan yield 4.43% (3 bps) (6 bps) +3 bps Efficiency ratio* 57.5% (94 bps) (85 bps) (9 bps) favorable/(unfavorable) $ 250 3.70% 3.48% 3.50% 3.43% 3.44% 3.37% 3.37% 3.30% $ 200 3.10% millions In 2.90% $ 150 2.70% 2.50% $ 100 1Q17 2Q17 3Q17 4Q17 1Q18 NII (TE) NIM—reported 7
|
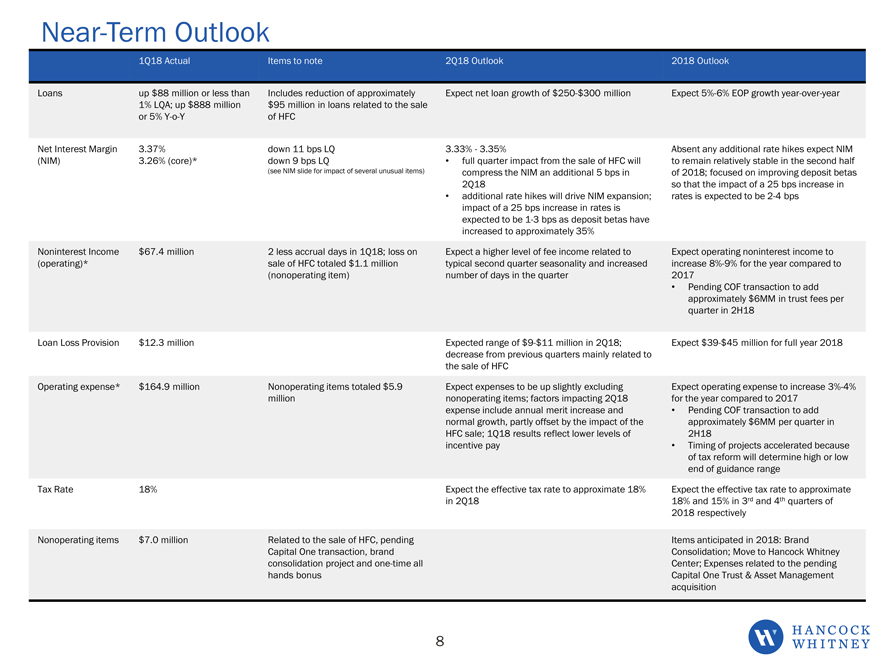
Near-Term Outlook 1Q18 Actual Items to note 2Q18 Outlook 2018 Outlook Loans up $88 million or less than Includes reduction of approximately Expect net loan growth of $250-$300 million Expect 5%-6% EOP growth year-over-year 1% LQA; up $888 million $95 million in loans related to the sale or 5% Y-o-Y of HFC Net Interest Margin 3.37% down 11 bps LQ 3.33%—3.35% Absent any additional rate hikes expect NIM (NIM) 3.26% (core)* down 9 bps LQ full quarter impact from the sale of HFC will to remain relatively stable in the second half (see NIM slide for impact of several unusual items) compress the NIM an additional 5 bps in of 2018; focused on improving deposit betas 2Q18 so that the impact of a 25 bps increase in additional rate hikes will drive NIM expansion; rates is expected to be 2-4 bps impact of a 25 bps increase in rates is expected to be 1-3 bps as deposit betas have increased to approximately 35% Noninterest Income $67.4 million 2 less accrual days in 1Q18; loss on Expect a higher level of fee income related to Expect operating noninterest income to (operating)* sale of HFC totaled $1.1 million typical second quarter seasonality and increased increase 8%-9% for the year compared to (nonoperating item) number of days in the quarter 2017 Pending COF transaction to add approximately $6MM in trust fees per quarter in 2H18 Loan Loss Provision $12.3 million Expected range of $9-$11 million in 2Q18; Expect $39-$45 million for full year 2018 decrease from previous quarters mainly related to the sale of HFC Operating expense* $164.9 million Nonoperating items totaled $5.9 Expect expenses to be up slightly excluding Expect operating expense to increase 3%-4% million nonoperating items; factors impacting 2Q18 for the year compared to 2017 expense include annual merit increase and Pending COF transaction to add normal growth, partly offset by the impact of the approximately $6MM per quarter in HFC sale; 1Q18 results reflect lower levels of 2H18 incentive pay Timing of projects accelerated because of tax reform will determine high or low end of guidance range Tax Rate 18% Expect the effective tax rate to approximate 18% Expect the effective tax rate to approximate in 2Q18 18% and 15% in 3rd and 4th quarters of 2018 respectively Nonoperating items $7.0 million Related to the sale of HFC, pending Items anticipated in 2018: Brand Capital One transaction, brand Consolidation; Move to Hancock Whitney consolidation project and one-time all Center; Expenses related to the pending hands bonus Capital One Trust & Asset Management acquisition 8
|
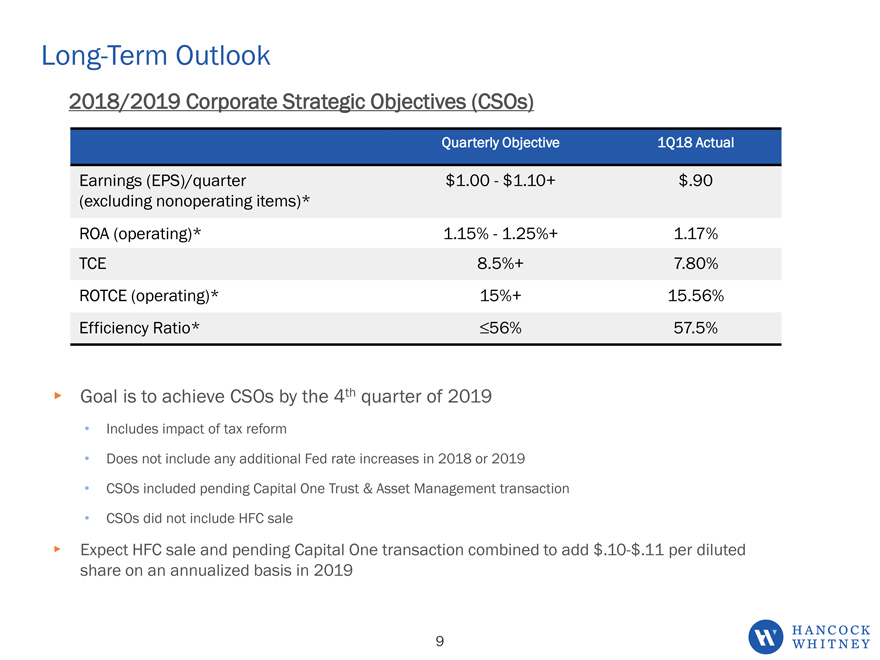
Long-Term Outlook 2018/2019 Corporate Strategic Objectives (CSOs) Quarterly Objective 1Q18 Actual Earnings (EPS)/quarter $1.00—$1.10+ $.90 (excluding nonoperating items)* ROA (operating)* 1.15%—1.25%+ 1.17% TCE 8.5%+ 7.80% ROTCE (operating)* 15%+ 15.56% Efficiency Ratio* £56% 57.5% Goal is to achieve CSOs by the 4th quarter of 2019 Includes impact of tax reform Does not include any additional Fed rate increases in 2018 or 2019 CSOs included pending Capital One Trust & Asset Management transaction CSOs did not include HFC sale Expect HFC sale and pending Capital One transaction combined to add $.10-$.11 per diluted share on an annualized basis in 2019 9
|
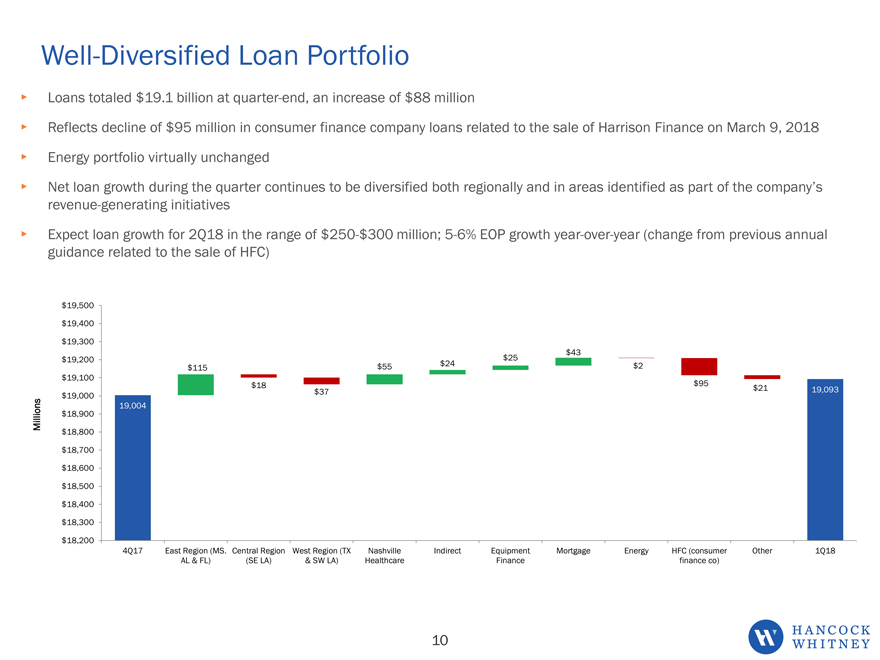
Well-Diversified Loan Portfolio Loans totaled $19.1 billion at quarter-end, an increase of $88 million Reflects decline of $95 million in consumer finance company loans related to the sale of Harrison Finance on March 9, 2018 Energy portfolio virtually unchanged Net loan growth during the quarter continues to be diversified both regionally and in areas identified as part of the company’s revenue-generating initiatives Expect loan growth for 2Q18 in the range of $250-$300 million; 5-6% EOP growth year-over-year (change from previous annual guidance related to the sale of HFC) $ 19,500 $ 19,400 $ 19,300 $ 19,200 $ 25 $ 43 $ 115 $ 55 $ 24 $ 2 $ 19,100 $ 18 $ 37 $ 95 $21 19,093 $ 19,000 19,004 Millions $ 18,900 $ 18,800 $ 18,700 $ 18,600 $ 18,500 $ 18,400 $ 18,300 $ 18,200 4Q17 East Region (MS. Central Region West Region (TX Nashville Indirect Equipment Mortgage Energy HFC (consumer Other 1Q18 AL & FL) (SE LA) & SW LA) Healthcare Finance finance co) 10
|
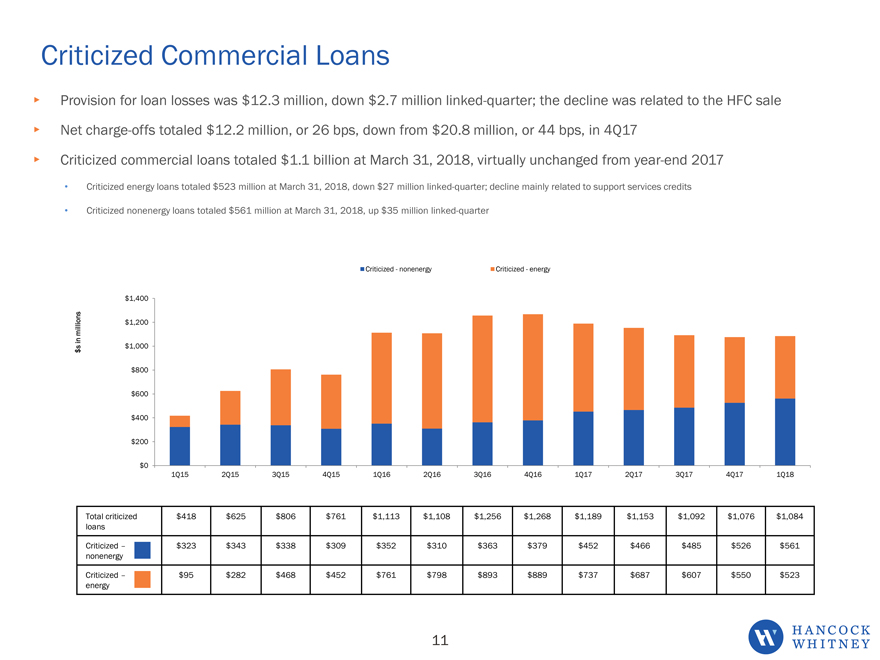
Criticized Commercial Loans Provision for loan losses was $12.3 million, down $2.7 million linked-quarter; the decline was related to the HFC sale Net charge-offs totaled $12.2 million, or 26 bps, down from $20.8 million, or 44 bps, in 4Q17 Criticized commercial loans totaled $1.1 billion at March 31, 2018, virtually unchanged from year-end 2017 Criticized energy loans totaled $523 million at March 31, 2018, down $27 million linked-quarter; decline mainly related to support services credits Criticized nonenergy loans totaled $561 million at March 31, 2018, up $35 million linked-quarter Criticized—nonenergy Criticized—energy $1,400 millions $1,200 in s $1,000 $ $800 $600 $400 $200 $0 1Q15 2Q15 3Q15 4Q15 1Q16 2Q16 3Q16 4Q16 1Q17 2Q17 3Q17 4Q17 1Q18 Total criticized $418 $ 625 $ 806 $ 761 $1,113 $1,108 $1,256 $1,268 $1,189 $1,153 $1,092 $1,076 $1,084 loans Criticized $323 $ 343 $ 338 $ 309 $352 $310 $363 $379 $452 $466 $485 $526 $561 nonenergy Criticized $95 $ 282 $ 468 $ 452 $761 $798 $893 $889 $737 $687 $607 $550 $523 energy 11
|
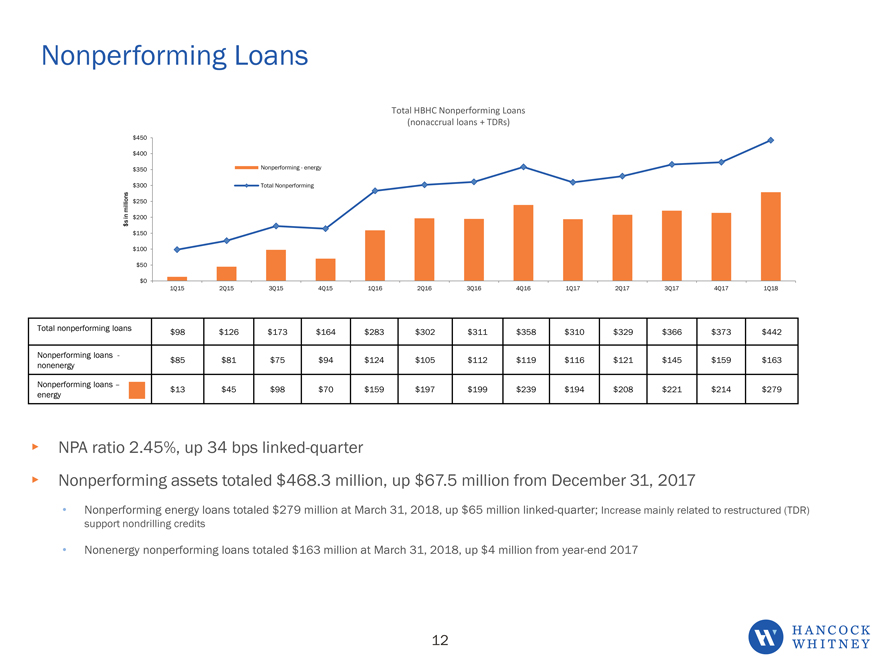
Nonperforming Loans Total HBHC Nonperforming Loans (nonaccrual loans + TDRs) $450 $400 $350 Nonperforming—energy $300 Total Nonperforming millions $250 in $200 s $ $150 $100 $50 $0 1Q15 2Q15 3Q15 4Q15 1Q16 2Q16 3Q16 4Q16 1Q17 2Q17 3Q17 4Q17 1Q18 Total nonperforming loans $98 $126 $173 $164 $283 $ 302 $311 $358 $310 $329 $366 $373 $442 Nonperforming loans— nonenergy $85 $81 $75 $94 $124 $ 105 $112 $119 $116 $121 $145 $159 $163 Nonperforming loans energy $13 $45 $98 $70 $159 $ 197 $199 $239 $194 $208 $221 $214 $279 NPA ratio 2.45%, up 34 bps linked-quarter Nonperforming assets totaled $468.3 million, up $67.5 million from December 31, 2017 Nonperforming energy loans totaled $279 million at March 31, 2018, up $65 million linked-quarter; Increase mainly related to restructured (TDR) support nondrilling credits Nonenergy nonperforming loans totaled $163 million at March 31, 2018, up $4 million from year-end 2017 12

|
Gulf South Bank Conference Fireside Chat May 7, 2018