Attached files
| file | filename |
|---|---|
| 8-K - WEX INC. 8-K - WEX Inc. | a51799044.htm |
Exhibit 99.1

WEX First Quarter 2018 Earnings May 3, 2018

WEX Forward Looking Statements This earnings presentation contains forward-looking statements, including statements regarding: financial guidance; assumptions underlying the Company's financial guidance. Any statements that are not statements of historical facts may be deemed to be forward-looking statements. When used in this earnings presentation and the discussion accompanying it, the words “anticipate,” “believe,” “continue,” “could,” “estimate,” “expect,” “intend,” “may,” “plan,” “project” and similar expressions are intended to identify forward-looking statements, although not all forward-looking statements contain such words. These forward-looking statements are subject to a number of risks and uncertainties that could cause actual results to differ materially, including: the effects of general economic conditions on fueling patterns as well as payment and transaction processing activity; the impact of foreign currency exchange rates on the Company’s operations, revenue and income; changes in interest rates; the impact of fluctuations in fuel prices; the effects of the Company’s business expansion and acquisition efforts; potential adverse changes to business or employee relationships, including those resulting from the completion of an acquisition; competitive responses to any acquisitions; uncertainty of the expected financial performance of the combined operations following completion of an acquisition; the ability to successfully integrate the Company's acquisitions; the ability to realize anticipated synergies and cost savings; unexpected costs, charges or expenses resulting from an acquisition; the Company's failure to successfully operate and expand ExxonMobil's European and Asian commercial fuel card programs; the failure of corporate investments to result in anticipated strategic value; the impact and size of credit losses; the impact of changes to the Company's credit standards; breaches of the Company’s technology systems or those of our third-party service providers and any resulting negative impact on our reputation, liabilities or relationships with customers or merchants; the Company’s failure to maintain or renew key agreements; failure to expand the Company’s technological capabilities and service offerings as rapidly as the Company’s competitors; failure to successfully implement the Company's information technology strategies and capabilities in connection with its technology outsourcing and insourcing arrangements and any resulting cost associated with that failure; the actions of regulatory bodies, including banking and securities regulators, or possible changes in banking or financial regulations impacting the Company’s industrial bank, the Company as the corporate parent or other subsidiaries or affiliates; the impact of the Company’s outstanding notes on its operations; the impact of increased leverage on the Company's operations, results or borrowing capacity generally, and as a result of acquisitions specifically; the incurrence of impairment charges if our assessment of the fair value of certain of our reporting units changes; the uncertainties of litigation; as well as other risks and uncertainties identified in Item 1A of our Annual Report for the year ended December 31, 2017, filed on Form 10-K with the Securities and Exchange Commission on March 1, 2018. The Company's forward-looking statements do not reflect the potential future impact of any alliance, merger, acquisition, disposition or stock repurchases. The forward-looking statements speak only as of the date of this earnings release and undue reliance should not be placed on these statements. The Company disclaims any obligation to update any forward-looking statements as a result of new information, future events or otherwise.Non-GAAP Information:For additional important information and disclosure regarding our use of non-GAAP metrics, specifically adjusted net income, please see our most recent earnings release, issued on May 3, 2018. See the Appendix to this presentation for an explanation and reconciliation of non-GAAP adjusted net income (or “ANI”) to GAAP net income and ANI per diluted share to GAAP net income per diluted share.

1Q2018 Highlights 20.7% 40.0% 9.2% Fleet Travel & Corporate Health & Employee Benefits 21.8% 47.2% 19.0% 1Q2018 Revenue Growth Vs. 1Q2017

Strategic Pillars HIGHLIGHTS FOR THE QUARTER Continue to experience strong organic revenue growth, driven by our acquisition and integration investments over the past few years.Run rate impact of EFS acquisition - value creation coming through in revenue.AOC synergies - both product and financial.International presence across core segments position us to capture additional global market share.High level of technology integration in all businesses, which embeds us in operations.Melanie Tinto joins the executive team in newly created CHRO role - background in leadership development.

Executing on the WEX Strategy FLEET TRAVEL & CORPORATE HEALTH & EMPLOYEE BENEFITS Leveraging artificial intelligence to elevate customer experiencePiloting intuitive mobile payments with Driver DashBringing the power of advanced analytics in an easy to consume format to our small business portfolioImproving the speed and scale of the factoring business through robotics process automation. Developing use cases on blockchain technologyDeveloping cloud native API platform to deliver a broad range of micro services in a comprehensive and easy to consume way.Enhancing and hardening the newly acquired AOC platforms to deliver improved resiliency Added over 80 new features to the platformLaunched an administrator dashboard to enable partners to better manage their businessMobile app recorded a record 1.5 million log-ins in January LEADING WITH SUPERIOR TECHNOLOGY BUILDING A BEST-IN-CLASS GROWTH ENGINE
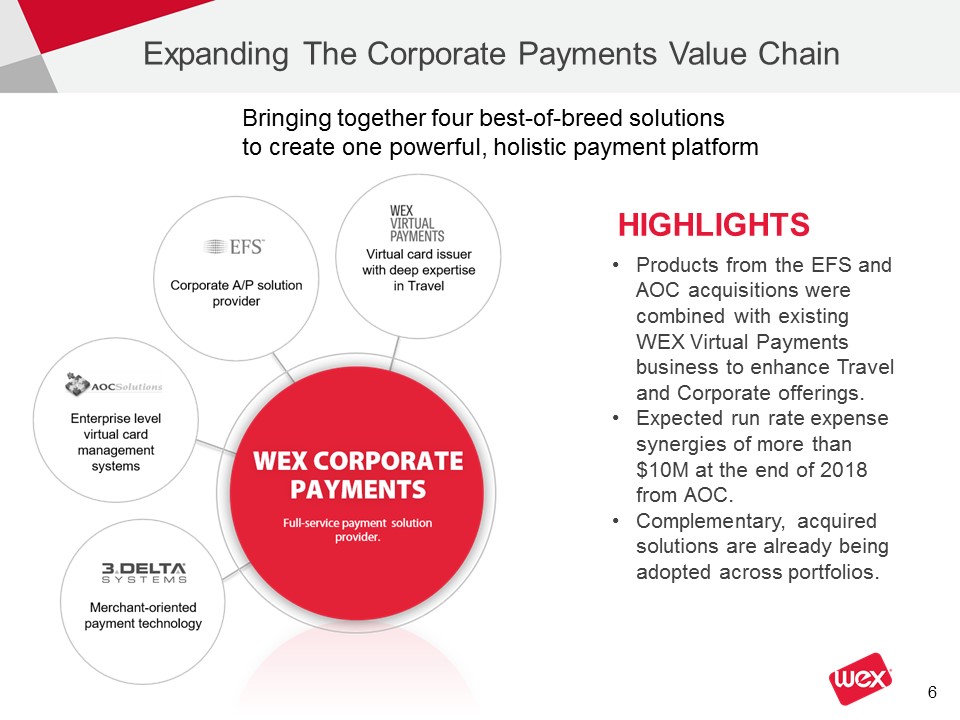
Expanding The Corporate Payments Value Chain HIGHLIGHTS Products from the EFS and AOC acquisitions were combined with existing WEX Virtual Payments business to enhance Travel and Corporate offerings.Expected run rate expense synergies of more than $10M at the end of 2018 from AOC.Complementary, acquired solutions are already being adopted across portfolios. Bringing together four best-of-breed solutions to create one powerful, holistic payment platform

WEX First Quarter 2018 Financial Results
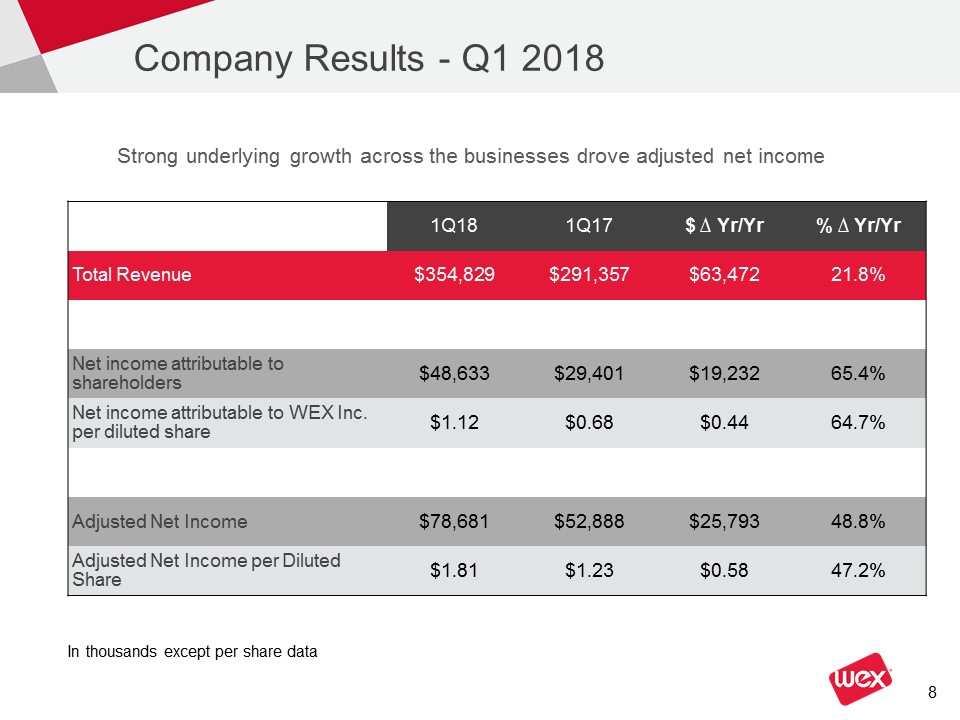
Company Results - Q1 2018 1Q18 1Q17 $ ∆ Yr/Yr % ∆ Yr/Yr Total Revenue $354,829 $291,357 $63,472 21.8% Net income attributable to shareholders $48,633 $29,401 $19,232 65.4% Net income attributable to WEX Inc. per diluted share $1.12 $0.68 $0.44 64.7% Adjusted Net Income $78,681 $52,888 $25,793 48.8% Adjusted Net Income per Diluted Share $1.81 $1.23 $0.58 47.2% Strong underlying growth across the businesses drove adjusted net income In thousands except per share data

Revenue Breakdown - Q1 2018 1Q18 1Q17 $ ∆ Yr/Yr % ∆ Yr/Yr Total Revenue $354,829 $291,357 $63,472 21.8% Segment Revenue Fleet Solutions $230,365 $190,823 $39,542 20.7% Travel and Corporate Solutions $66,779 $47,713 $19,066 40.0% Health and Employee Benefit Solutions $57,685 $52,821 $4,864 9.2% Record quarterly revenue driven by strong execution on our strategic pillars In thousands unless otherwise noted

Revenue Recognition Impacts Total Fleet Solutions $7,384 Travel and Corporate Solutions 2,195 Health and Employee Benefit Solutions (260) Total $9,319 Q1 2018 total revenue included $9.3 million due to accounting changes In thousands unless otherwise noted No impact on earningsCertain partner rebates and network fees are being reclassified for new accounting guidance

Fleet Solutions 1Q18 1Q17 $ ∆ Yr/Yr % ∆ Yr/Yr Total Segment Revenue ($) 230,365 190,823 39,542 20.7% Payment Processing ($) 106,978 86,262 20,716 24.0% Finance Fee Revenue ($) 43,604 36,429 7,175 19.7% All Other Revenue ($) 79,783 68,132 11,651 17.1% Average US Fuel Price (USD/gallon) $2.78 $2.40 $0.38 15.8% Payment Processing Transactions 109,827 102,765 7,062 6.9% Net Payment Processing Rate (%) 1.27% 1.22% 0.05% 4.1% Net Late Fee Rate (%) 0.41% 0.42% (0.01)% (2.4)% Solid organic revenue and transaction growth lead to continued strong results In thousands unless otherwise noted
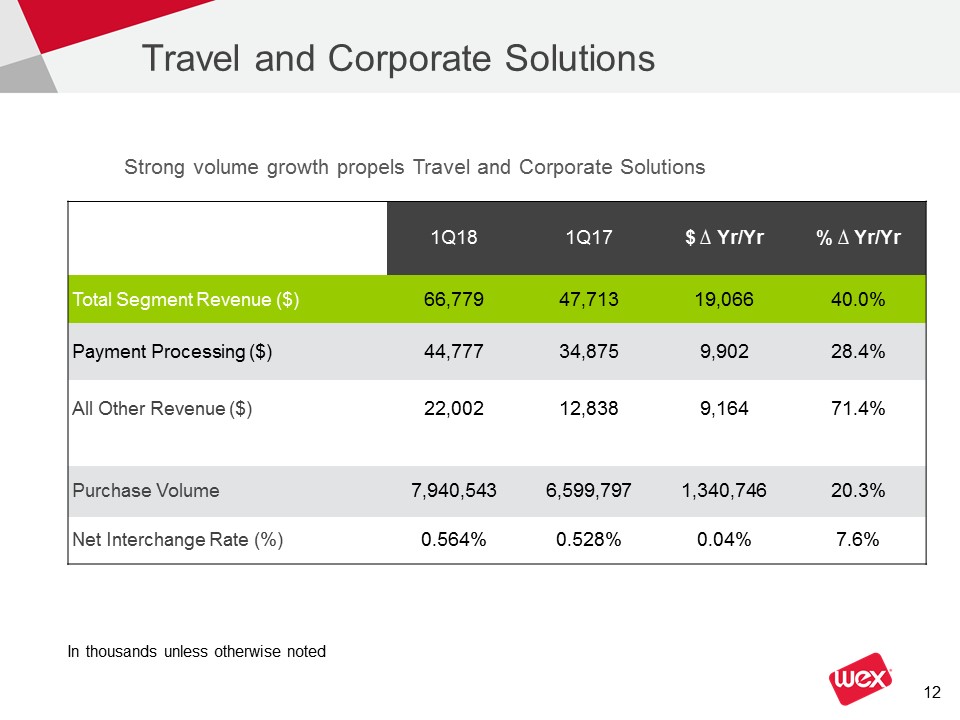
Travel and Corporate Solutions 1Q18 1Q17 $ ∆ Yr/Yr % ∆ Yr/Yr Total Segment Revenue ($) 66,779 47,713 19,066 40.0% Payment Processing ($) 44,777 34,875 9,902 28.4% All Other Revenue ($) 22,002 12,838 9,164 71.4% Purchase Volume 7,940,543 6,599,797 1,340,746 20.3% Net Interchange Rate (%) 0.564% 0.528% 0.04% 7.6% Strong volume growth propels Travel and Corporate Solutions In thousands unless otherwise noted

Health and Employee Benefit Solutions 1Q18 1Q17 $ ∆ Yr/Yr % ∆ Yr/Yr Total Segment Revenue ($) 57,685 52,821 4,864 9.2% Payment Processing ($) 16,699 15,241 1,458 9.6% Account Servicing Revenue ($) 27,025 25,315 1,710 6.8% All Other Revenue ($) 13,961 12,265 1,696 13.8% Purchase Volume* 1,503,400 1,347,219 156,181 11.6% Average Number of SaaS Accounts* 10,826 8,576 2,250 26.2% Following a good enrollment season, account growth increased double-digits In thousands unless otherwise noted* US Only

Additional Financial Items Key Updates Processing costs up due to AOC acquisition and technology insourcingFraud-related losses down to 2.8 basis pointsNon-fraud fleet credit losses at 9.7 basis pointsSales and marketing expenses up mainly due to revenue recognition changesGeneral and administrative expenses up due to debt restructuring costs, AOC acquisition, stock compensation and an IT charge

Additional Financial Items Key Updates Following tax reform in December, our Q1 tax rate decreased significantly

Additional Balance Sheet Items Key Updates Leverage ratio reduced to 3.6, down from 4.6 in Q1 last yearRepriced Term Loan B in January, reducing spreads 50 basis pointsInterest rate hedges in place with a market value of $27.7 millionSignificant mitigation of interest rate risk

Guidance 2Q2018 OUTLOOK ∆ Yr/Yr FY2018 ∆ Yr/Yr Revenue (in millions) $357 - $367 17% - 21% $1435 - $1475 15% - 18% Adj. Net Income1 (in millions) $85 - $90 57% - 66% $337 - $355 45% - 52% Adj. Net Income Earnings per Share1 $1.96 - $2.06 56% - 63% $7.75 - $8.15 43% - 51% Fleet Credit Loss (Basis Points) 10 - 15 11 - 16 Domestic Fuel Prices ($ / Gallon) $2.90 $2.80 Adj. Net Income Tax Rate 25.0% - 27.0% 25.0% - 27.0% Number of Shares Outstanding 43.5 million 43.5 million 1 The Company's adjusted net income guidance, which is a non-GAAP measure, excludes unrealized gains and losses on derivative instruments, net foreign currency remeasurement gains and losses and related derivatives, acquisition related intangible amortization, other acquisition and divestiture related items, stock-based compensation, restructuring and other costs, debt restructuring and debt issuance cost amortization, similar adjustments attributable to our non-controlling interest and certain tax related items. We are unable to reconcile our adjusted net income guidance to the comparable GAAP measure without unreasonable effort because of the difficulty in predicting the amounts to be adjusted, including but not limited to, foreign currency exchange rates, unrealized gains and losses on derivative instruments and acquisition and divestiture related items, which may have a significant impact on our financial results.

Appendix

Three Months Ended March 31, Three Months Ended March 31, 2018 2018 2017 2017 per diluted share per diluted share per dilutedshare per dilutedshare Net income attributable to shareholders $ 48,633 $ 1.12 $ 29,401 $ 0.68 Unrealized gains on derivative instruments (13,508 ) (0.31 ) (1,565 ) (0.04 ) Net foreign currency remeasurement gains (390 ) (0.01 ) (8,442 ) (0.20 ) Acquisition–related intangible amortization 35,236 0.81 37,978 0.88 Other acquisition and divestiture related items 637 0.01 2,136 0.05 Stock–based compensation 8,955 0.21 6,457 0.15 Restructuring and other costs 5,671 0.13 1,747 0.04 Debt restructuring and debt issuance cost amortization 6,692 0.15 1,954 0.05 ANI adjustments attributable to non–controlling interest (352 ) (0.01 ) (799 ) (0.02 ) Tax related items (12,893 ) (0.30 ) (15,979 ) (0.37 ) Adjusted net income attributable to shareholders $ 78,681 $ 1.81 $ 52,888 $ 1.23 WEX Non-GAAP Reconciliation

WEX Non-GAAP Reconciliation The Company's non-GAAP adjusted net income excludes unrealized gains and losses on derivatives, net foreign currency remeasurement gains and losses, acquisition-related intangible amortization, other acquisition and divestiture related items, stock-based compensation, restructuring and other costs, debt restructuring and debt issuance cost amortization, similar adjustments attributable to our non-controlling interest and certain tax related items. Although adjusted net income is not calculated in accordance with generally accepted accounting principles (“GAAP”), this non-GAAP measure is integral to the Company's reporting and planning processes and the chief operating decision maker of the Company uses segment adjusted operating income to allocate resources among our operating segments. The Company considers this measure integral because it excludes the above-specified items that the Company's management excludes in evaluating the Company's performance. Specifically, in addition to evaluating the Company's performance on a GAAP basis, management evaluates the Company's performance on a basis that excludes the above items because:Exclusion of the non-cash, mark-to-market adjustments on derivative instruments, including interest rate swap agreements, helps management identify and assess trends in the Company's underlying business that might otherwise be obscured due to quarterly non-cash earnings fluctuations associated with these derivative contracts.Net foreign currency gains and losses primarily result from the remeasurement to functional currency of cash, receivable and payable balances, certain intercompany notes denominated in foreign currencies and any gain or loss on foreign currency hedges relating to these items. The exclusion of these items helps management compare changes in operating results between periods that might otherwise be obscured due to currency fluctuations.The Company considers certain acquisition-related costs, including certain financing costs, investment banking fees, warranty and indemnity insurance, certain integration related expenses and amortization of acquired intangibles, as well as gains and losses from divestitures, to be unpredictable, dependent on factors that may be outside of our control and unrelated to the continuing operations of the acquired or divested business or the Company. In prior periods not reflected on the previous slide, the Company has adjusted for goodwill impairments, acquisition-related asset impairments and gains and losses on divestitures. In addition, the size and complexity of an acquisition, which often drives the magnitude of acquisition-related costs, may not be indicative of such future costs. The Company believes that excluding acquisition-related costs and gains or losses of divestitures facilitates the comparison of our financial results to the Company's historical operating results and to other companies in our industry.Stock-based compensation is different from other forms of compensation as it is a non-cash expense. For example, a cash salary generally has a fixed and unvarying cash cost. In contrast, the expense associated with an equity-based award is generally unrelated to the amount of cash ultimately received by the employee, and the cost to the Company is based on a stock-based compensation valuation methodology and underlying assumptions that may vary over time.Restructuring and other costs are related to employee termination benefits from certain identified initiatives to further streamline the business, improve the Company's efficiency, create synergies and to globalize the Company's operations, all with an objective to improve scale and increase profitability going forward. We exclude these items when evaluating our continuing business performance as such items are not consistently occurring and do not reflect expected future operating expense, nor do they provide insight into the fundamentals of current or past operations of our business.Debt restructuring and debt issuance cost amortization are unrelated to the continuing operations of the Company. Debt restructuring costs are not consistently occurring and do not reflect expected future operating expense, nor do they provide insight into the fundamentals of current or past operations of our business. In addition, since debt issuance cost amortization is dependent upon the financing method which can vary widely company to company, we believe that excluding these costs helps to facilitate comparison to historical results as well as to other companies within our industry.The adjustments attributable to non-controlling interest have no significant impact on the ongoing operations of the business.The tax related items are the difference between the Company’s U.S. GAAP tax provision and a pro forma tax provision based upon the Company’s adjusted net income before taxes as well as the impact from certain discrete tax items. The methodology utilized for calculating the Company’s adjusted net income tax provision is the same methodology utilized in calculating the Company’s U.S. GAAP tax provision.For the same reasons, WEX believes that adjusted net income may also be useful to investors as one means of evaluating the Company's performance. However, because adjusted net income is a non-GAAP measure, it should not be considered as a substitute for, or superior to, net income, operating income or cash flows from operating activities as determined in accordance with GAAP. In addition, adjusted net income as used by WEX may not be comparable to similarly titled measures employed by other companies.