Attached files
| file | filename |
|---|---|
| 8-K - HORIZON BANCORP INC /IN/ | hb_8k0503.htm |
Exhibit 99.1

A NASDAQ Traded Company - Symbol HBNC May 3, 2018

This presentation may contain forward-looking statements regarding the financial performance, business prospects, growth and operating strategies of Horizon Bancorp and its affiliates (collectively, “Horizon”). For these statements, Horizon claims the protection of the safe harbor for forward-looking statements contained in the Private Securities Litigation Reform Act of 1995. Statements in the presentation materials should be considered in conjunction with the other information available about Horizon, including the information in the filings we make with the Securities and Exchange Commission. Forward-looking statements provide current expectations or forecasts of future events and are not guarantees of future performance. The forward-looking statements are based on management’s expectations and are subject to a number of risks and uncertainties. We have tried, wherever possible, to identify such statements by using words such as “anticipate,” “estimate,” “project,” “intend,” “plan,” “believe,” “will” and similar expressions in connection with any discussion of future operating or financial performance.Although management believes that the expectations reflected in such forward-looking statements are reasonable, actual results may differ materially from those expressed or implied in such statements. Risks and uncertainties that could cause actual results to differ materially include risk factors relating to the banking industry and the other factors detailed from time to time in Horizon’s reports filed with the Securities and Exchange Commission, including those described in Horizon’s Annual Report on Form 10-K. Undue reliance should not be placed on the forward-looking statements, which speak only as of the date hereof. Horizon does not undertake, and specifically disclaims any obligation, to publicly release the result of any revisions that may be made to update any forward-looking statement to reflect the events or circumstances after the date on which the forward-looking statement is made, or reflect the occurrence of unanticipated events, except to the extent required by law. Forward-Looking Statements

Mark E. SecorExecutive Vice President & Chief Financial Officer *

A Growth Story *

* Growth Transformation Footnote Index included in Appendix

Branches * Legacy Footprint 2007 Locations – 16Counties – 6 Indiana Ohio Illinois Michigan

BranchesLoan Production OfficesNew Branch in 2018 7 Growth Footprint 2018 Locations – 65Counties – 27 Michigan Illinois Indiana Ohio
BranchesLoan Production OfficesNew Branch in 2018 * Growth Footprint 2018 Locations – 65Counties – 27 Michigan Illinois Indiana Ohio

($ in Millions) 2012 2017 CAGR OrganicCAGR Commercial $460 $1,618 29% 15% Res. Real Estate 441 701 10% (7)% Consumer 289 513 12% 7% Total $1,190 $2,833 19% 6% * High Quality, Well Diversified Loan Portfolio 2012 2017

Managing Commercial Real Estate Concentration Risk December 31, 2017 * Footnote Index included in Appendix
Managing Commercial Real Estate Concentration Risk December 31, 2017 * Footnote Index included in Appendix

* Strong Core Deposit Mix 2012 ($ in Millions) 2012 2017 CAGR OrganicCAGR 2017 YTD Cost Non-interest $209 $602 24% 11% 0.00% Interest 770 1,712 17% 4% 0.17% CDs 315 567 12% -15% 1.06% Total $1,294 $2,881 17% 2% 0.39% 2017
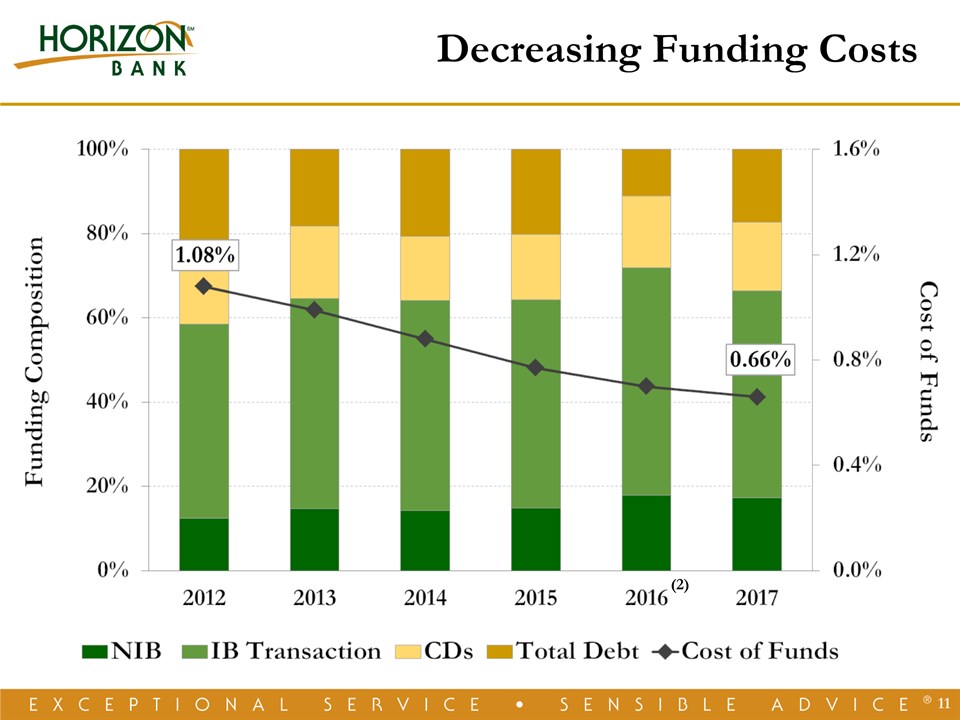
* Commercial Loan Balances Decreasing Funding Costs (2)

* Wealth Management Key Driver Of Fee Income ($’s in millions) ($’s in millions)

Core Diluted EPS CAGR 13% 13 Robust Earnings Growth Footnote Index included in Appendix (3) (3) ($’s in millions)
Core Diluted EPS CAGR 13% * Robust Earnings Growth Footnote Index included in Appendix (3) (3) ($’s in millions)

* Less Dependence on Mortgage Revenue (5) Footnote Index included in Appendix ($’s in millions)

15 Record First Quarter 2018 Footnote Index included in Appendix EPS Growth 48% EPS Growth 13% ($’s in millions) (6) (6)
* Record First Quarter 2018 Footnote Index included in Appendix EPS Growth 48% EPS Growth 13% ($’s in millions) (6) (6)

Craig M. DwightChairman & Chief Executive Officer *

*

Horizon’s Resilient History * Day 1 50th Anniversary 60th Anniversary 100th Anniversary 145th Anniversary National Banking Act of 1863 Roaring 20’s Great Depression 1973 Gas Embargo Great Recession President Ulysses S. Grant October 1929 Stock Market Crash 1933 Banking Act Creates the FDIC 1972 Horizon’s First ATM1979 Deregulation of Interest Rates 2007 1st Smart Phone SoldHorizon Survives 29 Recessions over 145 Years FDIC Deposit Insurance N/A FDIC Deposit Insurance $2,500 FDIC Deposit Insurance $40,000 FDIC Deposit Insurance $250,000 1873 1923 1933 1973 2018

145 Years of Growth Asset CAGR 9.4%
145 Years of Growth * Asset CAGR 9.4%

Creating Shareholder Value *

A Company on the Move * OrganicExpans.(11) St. JosephS. BendElkhartLake County Kalamazoo Indianapolis Carmel Ft. WayneGrand Rapids Columbus(7)Noblesville(8)Holland(8) M&A(13) Anchor MortgageAlliance American Trust Heartland 1st MortgageSummitPeoples FarmersLaPorteCNB BargersvilleLafayetteWolverine Footnote Index included in Appendix

Growth MarketsFuture Markets 22 GrandRapids AnnArbor NWOhio FortWayne Lafayette Kalamazoo SouthBend Warsaw Indianapolis NWIndiana Growth Opportunities Abound Michigan Indiana Ohio Illinois Midland Troy
Growth MarketsFuture Markets * GrandRapids AnnArbor NWOhio FortWayne Lafayette Kalamazoo SouthBend Warsaw Indianapolis NWIndiana Growth Opportunities Abound Michigan Indiana Ohio Illinois Midland Troy
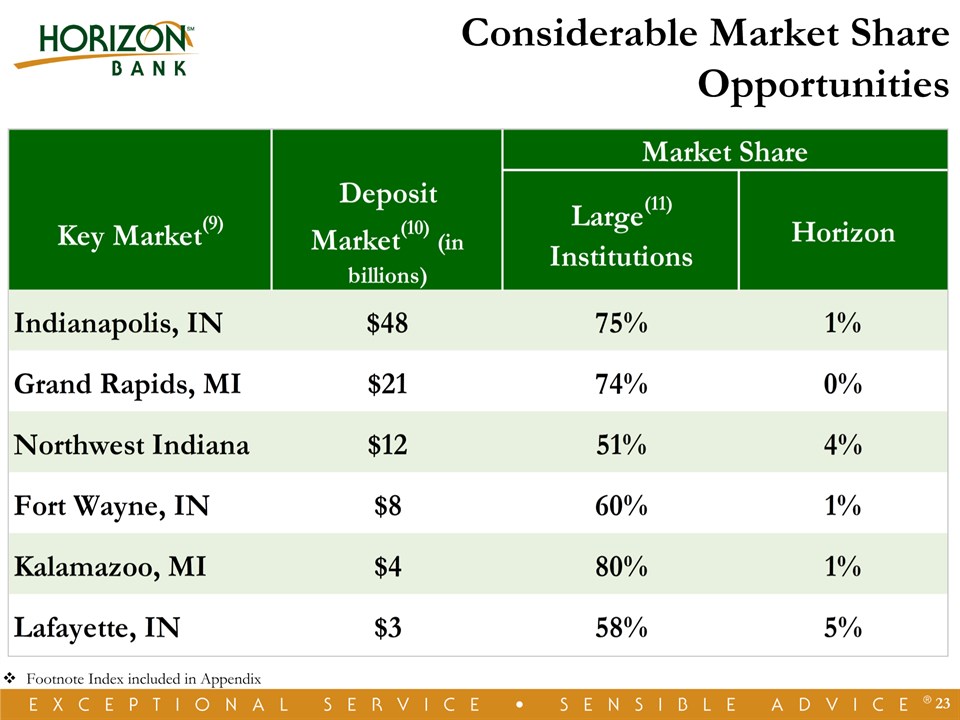
Considerable Market Share Opportunities * Footnote Index included in Appendix

* Scale Drives Shareholder Value(as of April 30, 2018) Footnote Index included in Appendix
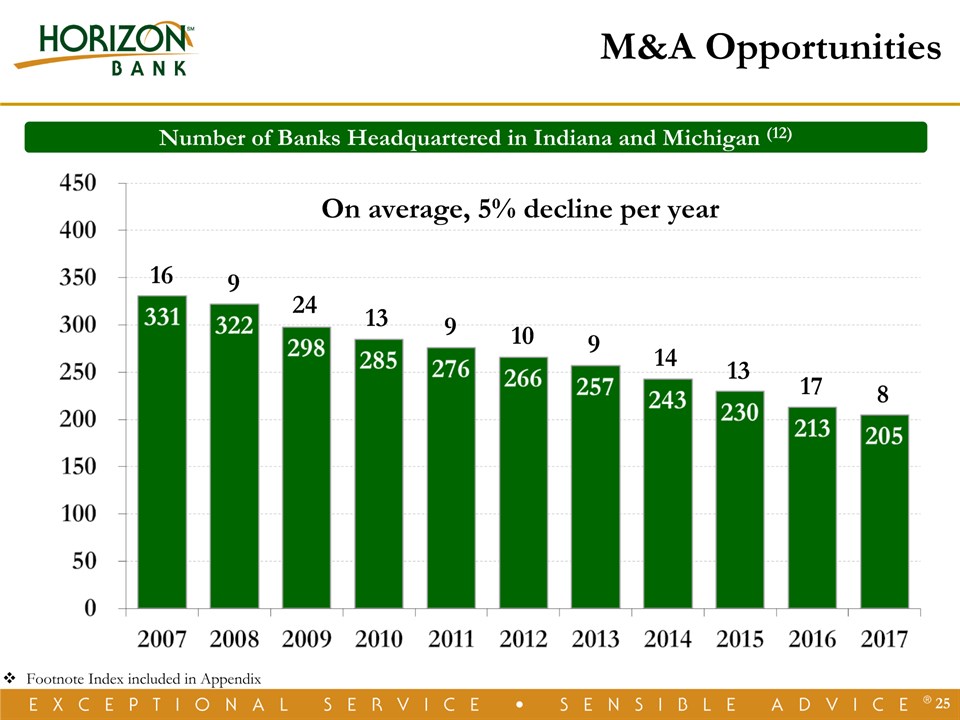
* Number of Banks Headquartered in Indiana and Michigan (12) M&A Opportunities On average, 5% decline per year Footnote Index included in Appendix 9 24 13 9 10 9 14 13 17 8 16

* Increased Liquidity &Dividends Footnote Index included in Appendix Stock Split Avg. Volume Annual Dividends

Historical Financial Performance Illustrates Ability to Execute10-year asset and net income CAGR of 12% and 15%, respectivelyThirteen acquisitions and eleven market expansions since 2002Capacity to take additional market shareConsistent, Well Executed and Disciplined Business StrategyEntering the “Sweet-Spot” for Performance and MultiplesAptitude and Skill to Continue Mergers and AcquisitionsIncreased Liquidity and Dividends * Proven Track Record

Horizon Outperforms the Market For Total Shareholder Return(as of April 30, 2018) * Horizon Bancorp: 5-Year Total Return Comparison Footnote Index included in Appendix
Thank Youfor Your Investment inHorizon Bancorp

A NASDAQ Traded Company - Symbol HBNC

Appendix *

* Footnote Index Slide 5(1) Based on the daily trading volume during the fourth quarters of 1997, 2007 and 2017, respectively.Financial data in millions, except for stock price, as of December 31, 1997, 2007 and 2017, respectively. Slide 9Percent of total commercial loans as of December 31, 2017.Slide 11(2) Excludes the impact of one-time prepayment penalties totaling $4.8 million incurred during the 4th quarter of 2016. The cost of funds including the one-time prepayment penalty totaling $4.8 million was 0.92%.Slide 13(3) Core net income and core diluted EPS exclude one-time merger expenses, gain on sale of securities, death benefit on bank owned life insurance, prepayment penalties on borrowings, gain on the remeasurement of equity interest in Lafayette Community Bancorp and tax reform bill impact.(4) 2012 results benefited from a record level of mortgage loan production volume and mortgage warehouse loan balances.Slide 14(5) Mortgage Revenue is defined as interest and fee income from mortgage warehouse loans plus gain on sale of mortgage loans.Slide 15(6) Core net income and core diluted EPS exclude one-time merger expenses, gain on sale of securities, death benefit on bank owned life insurance, prepayment penalties on borrowings, gain on the remeasurement of equity interest in Lafayette Community Bancorp and tax reform bill impact.Slide 21(7) Columbus location closed February 2018.(8) Planned new locations for 2018.

* Footnote Index (cont.) Slide 23(9) All Key Markets are MSAs, except for Northwest Indiana which consists of Lake and Porter Counties.(10) Deposit Market Share as of June 30, 2017.(11) Large Institutions defined as total assets greater than or equal to $10.0 billion at June 30, 2017.Slide 24Financial data as of December 31, 2017; market data as of April 30, 2018. Nationwide publicly traded banks, excluding merger targets.Slide 25(12) Indiana and Michigan commercial banks, savings banks and savings & loan institutions as of December 31st of each respective year.Slide 26Average daily trading volume and annual dividend amounts adjusted for the following stock splits: October 2001 3:1, October 2003 3:2, December 2011 3:2, November 2012 3:2 and November 2016 3:2.Slide 28As of April 30, 2018. SNL U.S. Bank includes all Major Exchange Banks in SNL’s coverage universe.Slide 34-36Horizon believes these non-GAAP financial measures are helpful to investors and provide a greater understanding of our business without giving effect to purchase accounting impacts and one-time acquisition and other non-recurring costs and non-core items. These measures are not necessarily comparable to similar measures that may be presented by other companies and should not be considered in isolation or as a substitute for the related GAAP measure.

* Non-GAAP Reconciliations See Footnote Index in Appendix

* Non-GAAP Reconciliations See Footnote Index in Appendix

* Non-GAAP Reconciliations See Footnote Index in Appendix