Attached files
| file | filename |
|---|---|
| EX-99.2 - EXHIBIT 99.2 - FEDERAL NATIONAL MORTGAGE ASSOCIATION FANNIE MAE | q12018financialsupplemen.htm |
| 8-K - 8-K - FEDERAL NATIONAL MORTGAGE ASSOCIATION FANNIE MAE | a2018q18k.htm |

Resource Center: 1-800-732-6643
Exhibit 99.1
Contact: Pete Bakel
202-752-2034
Date: May 3, 2018
Fannie Mae Reports Net Income of $4.3 Billion and
Comprehensive Income of $3.9 Billion for First Quarter 2018
First Quarter 2018 Results | “Our solid first quarter performance reflects the strength of our underlying business, the benefits of our business model, and our focus on customers. “We continue to drive advances in the housing finance system, providing our customers with reliable, sustainable, and innovative solutions to address America’s housing needs. “We are dedicated to working with our customers to solve the housing challenges of today and tomorrow, and enabling them to deliver real benefits and more opportunities to homebuyers and renters.” Timothy J. Mayopoulos, President and Chief Executive Officer | |
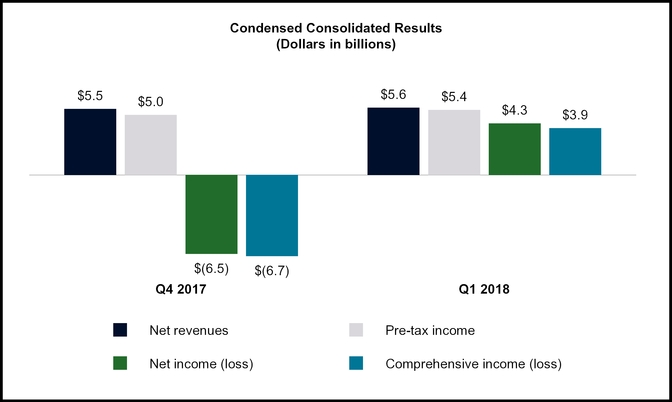
• Fannie Mae reported net income of $4.3 billion and comprehensive income of $3.9 billion for the first quarter of 2018. This compares to a net loss of $6.5 billion and a comprehensive loss of $6.7 billion in the fourth quarter of 2017, which was due to the remeasurement of the company’s deferred tax assets resulting from enactment of tax legislation during the quarter. | ||
• Fannie Mae’s pre-tax income was $5.4 billion for the first quarter of 2018 and $5.0 billion for the fourth quarter of 2017, reflecting the strength of the company’s underlying business fundamentals. | ||
Business Highlights | ||
• Fannie Mae provided approximately $113 billion in liquidity to the single-family mortgage market in the first quarter of 2018 while serving as the largest issuer of single-family mortgage-related securities in the secondary market. The company’s estimated market share of new single-family mortgage-related securities issuances was 42% for the first quarter of 2018. | ||
• Fannie Mae continued to transfer a portion of the credit risk on single-family mortgages. As of March 31, 2018, $995 billion in single-family mortgages, or approximately 34% of loans in the company’s single-family conventional guaranty book of business, measured by unpaid principal balance, were covered by a credit risk transfer transaction. | ||
• Fannie Mae announced changes to its Single-Family MBS program to facilitate proposed future enhancements to its Connecticut Avenue Securities™ (CAS) structure that will enable the company to structure future CAS offerings as notes issued by Real Estate Mortgage Investment Conduits (REMICs). The proposed enhancements are designed to expand the potential investor base for these securities and align the timing of the company’s recognition of provisions for credit losses and the related recovery from CAS transactions. Fannie Mae may issue a Connecticut Avenue Securities REMIC™ later this year, subject to FHFA approval, market conditions, and other factors. | ||
• Fannie Mae provided more than $11 billion in multifamily financing in the first quarter of 2018, which enabled the financing of 154,000 units of multifamily housing. More than 90% of the multifamily units the company financed were affordable to families earning at or below 120% of the area median income, providing support for both affordable and workforce housing. | ||
• Fannie Mae continued to transfer a portion of the credit risk on multifamily mortgages. In the first quarter of 2018, nearly 100% of the company’s new multifamily business volume had lender risk-sharing. | ||

First Quarter 2018 Results | 1 | |
WASHINGTON, DC — Fannie Mae (FNMA/OTC) reported net income of $4.3 billion (after-tax), pre-tax income of $5.4 billion, and comprehensive income of $3.9 billion for the first quarter of 2018. Fannie Mae’s net worth of $3.9 billion as of March 31, 2018 reflects the company’s comprehensive income of $3.9 billion for the first quarter of 2018 and its receipt of $3.7 billion from Treasury during the quarter pursuant to its senior preferred stock purchase agreement with Treasury to eliminate the company’s net worth deficit as of December 31, 2017. Fannie Mae expects to pay a $938 million dividend to Treasury by June 30, 2018.
SUMMARY OF FANNIE MAE’S FINANCIAL PERFORMANCE
Fannie Mae’s continued strong revenues drove the company’s first quarter 2018 results. Two primary factors drove the difference between net income in the first quarter of 2018 compared to the net loss in the fourth quarter of 2017: a $9.9 billion provision for federal income taxes in the fourth quarter of 2017 that resulted from the enactment of the Tax Cuts and Jobs Act of 2017 (the Tax Act); and net fair value gains of $1.0 billion in the first quarter of 2018.
First Quarter 2018 Results | 2 | |
Summary of Financial Results |
(Dollars in millions) | 1Q18 | 4Q17 | Variance | 1Q18 | 1Q17 | Variance | ||||||||||||||||||
Net interest income | $ | 5,232 | $ | 5,111 | $ | 121 | $ | 5,232 | $ | 5,346 | $ | (114 | ) | |||||||||||
Fee and other income | 320 | 431 | (111 | ) | 320 | 249 | 71 | |||||||||||||||||
Net revenues | 5,552 | 5,542 | 10 | 5,552 | 5,595 | (43 | ) | |||||||||||||||||
Investment gains (losses), net | 250 | 833 | (583 | ) | 250 | (9 | ) | 259 | ||||||||||||||||
Fair value gains (losses), net | 1,045 | (191 | ) | 1,236 | 1,045 | (40 | ) | 1,085 | ||||||||||||||||
Administrative expenses | (750 | ) | (703 | ) | (47 | ) | (750 | ) | (684 | ) | (66 | ) | ||||||||||||
Credit-related income | ||||||||||||||||||||||||
Benefit for credit losses | 217 | 560 | (343 | ) | 217 | 396 | (179 | ) | ||||||||||||||||
Foreclosed property expense | (162 | ) | (130 | ) | (32 | ) | (162 | ) | (217 | ) | 55 | |||||||||||||
Total credit-related income | 55 | 430 | (375 | ) | 55 | 179 | (124 | ) | ||||||||||||||||
Temporary Payroll Tax Cut Continuation Act of 2011 (“TCCA”) fees | (557 | ) | (544 | ) | (13 | ) | (557 | ) | (503 | ) | (54 | ) | ||||||||||||
Other expenses, net | (203 | ) | (411 | ) | 208 | (203 | ) | (382 | ) | 179 | ||||||||||||||
Income before federal income taxes | 5,392 | 4,956 | 436 | 5,392 | 4,156 | 1,236 | ||||||||||||||||||
Provision for federal income taxes | (1,131 | ) | (11,489 | ) | 10,358 | (1,131 | ) | (1,383 | ) | 252 | ||||||||||||||
Net income (loss) | $ | 4,261 | $ | (6,533 | ) | $ | 10,794 | $ | 4,261 | $ | 2,773 | $ | 1,488 | |||||||||||
Other comprehensive income (loss) | (323 | ) | (154 | ) | (169 | ) | (323 | ) | 6 | (329 | ) | |||||||||||||
Total comprehensive income (loss) | $ | 3,938 | $ | (6,687 | ) | $ | 10,625 | $ | 3,938 | $ | 2,779 | $ | 1,159 | |||||||||||
Net revenues, which consist of net interest income and fee and other income, were $5.6 billion for the first quarter of 2018, compared with $5.5 billion for the fourth quarter of 2017.
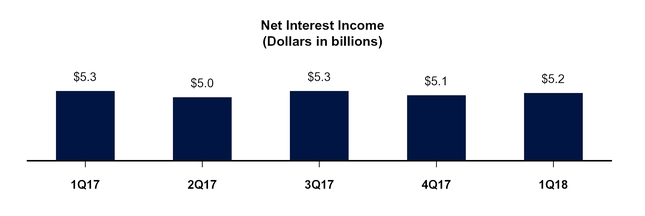
Net interest income was $5.2 billion for the first quarter of 2018, compared with $5.1 billion for the fourth quarter of 2017. The company’s net interest income in the first quarter of 2018 was derived primarily from guaranty fees on its $3.2 trillion guaranty book of business.
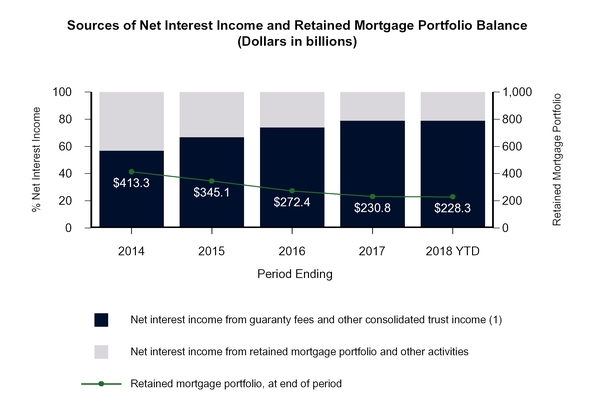
More than 75% of Fannie Mae’s net interest income in the first quarter of 2018 was derived from the loans underlying Fannie Mae MBS in consolidated trusts, which primarily generate income through guaranty fees. As shown in the chart below, in recent years, an increasing portion of Fannie Mae’s net interest income has been derived from guaranty fees, rather than from the company’s retained mortgage portfolio assets. This shift has been driven by both guaranty fee increases the company implemented in 2012 and the reduction of its retained mortgage portfolio.
First Quarter 2018 Results | 3 | |
__________
(1) | Guaranty fee income includes the impact of a 10 basis point guaranty fee increase implemented in 2012 pursuant to the Temporary Payroll Tax Cut Continuation Act of 2011, the incremental revenue from which is remitted to Treasury and not retained by the company. |
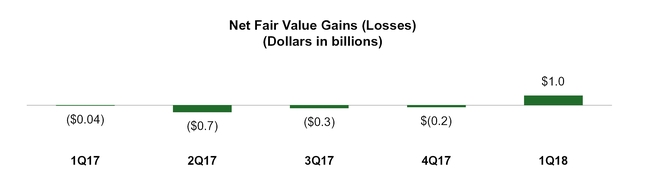
Net fair value gains were $1.0 billion in the first quarter of 2018, compared with net fair value losses of $191 million in the fourth quarter of 2017. Net fair value gains in the first quarter of 2018 were driven primarily by increases in the fair value of the company’s mortgage commitment derivatives due to rising interest rates and increases in the fair value of the company’s risk management derivatives due to an increase in longer-term swap rates.
The estimated fair value of the company’s derivatives, trading securities, and other financial instruments carried at fair value may fluctuate substantially from period to period because of changes in interest rates, the yield curve, mortgage and credit spreads, implied volatility, and activity related to these financial instruments.
First Quarter 2018 Results | 4 | |
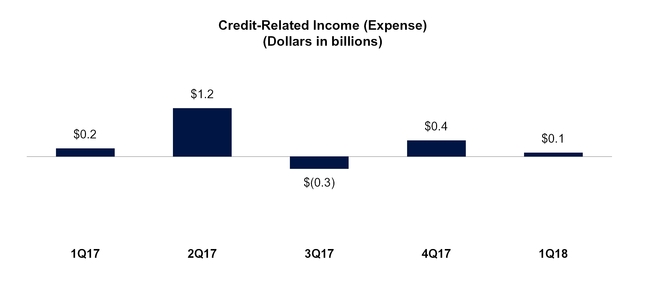
Credit-related income (expense) consists of a benefit (provision) for credit losses and foreclosed property expense. Credit-related income was $55 million in the first quarter of 2018, compared with $430 million in the fourth quarter of 2017. The decrease in credit-related income in the first quarter of 2018 was due primarily to higher actual and projected mortgage interest rates during the quarter. As mortgage interest rates rise, the company expects a decrease in future prepayments on single-family individually impaired loans, including modified loans. Lower expected prepayments lengthen the expected lives of modified loans, which increases the impairment relating to concessions provided on these loans and results in an increase in the provision for credit losses.
Provision for federal income taxes was $1.1 billion in the first quarter of 2018, compared with $11.5 billion in the fourth quarter of 2017. The decrease was driven by a $9.9 billion provision for federal income taxes in the fourth quarter of 2017 resulting from the remeasurement of the company’s deferred tax assets due to the Tax Act. The Tax Act reduced the company’s effective tax rate from 33.3% in the first quarter of 2017 to 21.0% in the first quarter of 2018.
PROVIDING LIQUIDITY AND SUPPORT TO THE MARKET
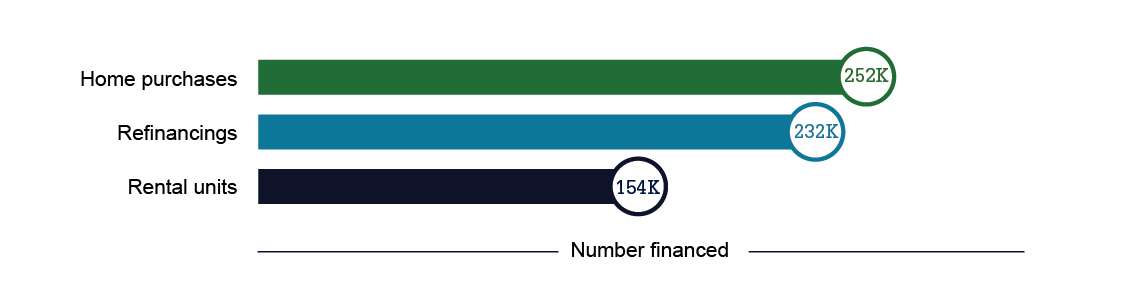
Through Fannie Mae’s single-family and multifamily business segments, the company provided $124 billion in liquidity to the mortgage market in the first quarter of 2018, which enabled the financing of 638,000 home purchases, refinancings, or rental units.
Fannie Mae Provided $124 Billion in Liquidity in the First Quarter of 2018
First Quarter 2018 Results | 5 | |
SUMMARY OF FIRST QUARTER 2018 BUSINESS SEGMENT RESULTS
Fannie Mae’s two reportable business segments—Single-Family and Multifamily—engage in complementary business activities in pursuit of Fannie Mae’s vision to be America’s most valued housing partner and to provide liquidity, access to credit, and affordability in all U.S. housing markets at all times. Fannie Mae does this while effectively managing and reducing risk to its business, taxpayers, and the housing finance system. Fannie Mae is advancing this vision by pursuing four strategic objectives: advancing a sustainable and reliable business model that reduces risk to the housing finance system and taxpayers; providing great service to its customers and partners, enabling them to serve the needs of American households more effectively; supporting and sustainably increasing access to credit and affordable housing; and building a simple, efficient, innovative, and continuously improving company.
Business Segments |
Single-Family Business
Single-Family Segment Financial Results | 1Q18 | 4Q17 | Variance | 1Q18 | 1Q17 | Variance | ||||||||||||||||||
(Dollars in millions) | ||||||||||||||||||||||||
Net interest income | $ | 4,561 | $ | 4,463 | $ | 98 | $ | 4,561 | $ | 4,756 | $ | (195 | ) | |||||||||||
Fee and other income | 158 | 186 | (28 | ) | 158 | 76 | 82 | |||||||||||||||||
Net revenues | 4,719 | 4,649 | 70 | 4,719 | 4,832 | (113 | ) | |||||||||||||||||
Investment gains (losses), net | 242 | 795 | (553 | ) | 242 | (50 | ) | 292 | ||||||||||||||||
Fair value gains (losses), net | 1,034 | (191 | ) | 1,225 | 1,034 | (12 | ) | 1,046 | ||||||||||||||||
Administrative expenses | (643 | ) | (610 | ) | (33 | ) | (643 | ) | (601 | ) | (42 | ) | ||||||||||||
Credit-related income | 34 | 437 | (403 | ) | 34 | 184 | (150 | ) | ||||||||||||||||
TCCA fees | (557 | ) | (544 | ) | (13 | ) | (557 | ) | (503 | ) | (54 | ) | ||||||||||||
Other expenses, net | (132 | ) | (273 | ) | 141 | (132 | ) | (256 | ) | 124 | ||||||||||||||
Income before federal income taxes | 4,697 | 4,263 | 434 | 4,697 | 3,594 | 1,103 | ||||||||||||||||||
Provision for federal income taxes | (1,016 | ) | (10,287 | ) | 9,271 | (1,016 | ) | (1,252 | ) | 236 | ||||||||||||||
Net income (loss) | $ | 3,681 | $ | (6,024 | ) | $ | 9,705 | $ | 3,681 | $ | 2,342 | $ | 1,339 | |||||||||||
Financial Results
• | Single-Family pre-tax income was $4.7 billion in the first quarter of 2018, compared with $4.3 billion in the fourth quarter of 2017. The increase in pre-tax income in the first quarter of 2018 was driven primarily by increases in the fair value of the company’s mortgage commitment derivatives due to rising interest rates and increases in the fair value of the company’s risk management derivatives due to an increase in longer-term swap rates during the quarter. |
Business Highlights
• | The single-family guaranty book of business continued to grow in the first quarter of 2018, while the average charged guaranty fee (net of TCCA fees) on the single-family guaranty book as of March 31, 2018 remained relatively flat compared to year end at 43 basis points. |
• | The single-family serious delinquency rate decreased from 1.24% as of December 31, 2017 to 1.16% as of March 31, 2018. The company’s serious delinquency rate declined in the first quarter of 2018 primarily because many delinquent borrowers resolved their loan delinquencies during the quarter by entering into a loan modification or resuming payments and becoming current on their loans, including loans in the areas affected by Hurricanes Harvey, Irma, and Maria (collectively, the hurricanes). |
First Quarter 2018 Results | 6 | |
Multifamily Business
Multifamily Segment Financial Results | 1Q18 | 4Q17 | Variance | 1Q18 | 1Q17 | Variance | ||||||||||||||||||
(Dollars in millions) | ||||||||||||||||||||||||
Net interest income | $ | 671 | $ | 648 | $ | 23 | $ | 671 | $ | 590 | $ | 81 | ||||||||||||
Fee and other income | 162 | 245 | (83 | ) | 162 | 173 | (11 | ) | ||||||||||||||||
Net revenues | 833 | 893 | (60 | ) | 833 | 763 | 70 | |||||||||||||||||
Fair value gains (losses), net | 11 | — | 11 | 11 | (28 | ) | 39 | |||||||||||||||||
Administrative expenses | (107 | ) | (93 | ) | (14 | ) | (107 | ) | (83 | ) | (24 | ) | ||||||||||||
Credit-related income (expense) | 21 | (7 | ) | 28 | 21 | (5 | ) | 26 | ||||||||||||||||
Other expenses, net | (63 | ) | (100 | ) | 37 | (63 | ) | (85 | ) | 22 | ||||||||||||||
Income before federal income taxes | 695 | 693 | 2 | 695 | 562 | 133 | ||||||||||||||||||
Provision for federal income taxes | (115 | ) | (1,202 | ) | 1,087 | (115 | ) | (131 | ) | 16 | ||||||||||||||
Net income (loss) | $ | 580 | $ | (509 | ) | $ | 1,089 | $ | 580 | $ | 431 | $ | 149 | |||||||||||
Financial Results
• | Multifamily pre-tax income was $695 million in the first quarter of 2018, compared with $693 million in the fourth quarter of 2017. Pre-tax income in the first quarter of 2018 was driven by net interest income, which primarily consists of guaranty fee revenue, and fee and other income, driven by yield maintenance. |
Business Highlights
• | New multifamily business volume was $11.3 billion in the first quarter of 2018, a decrease from $20.3 billion in the fourth quarter of 2017. Approximately 38% of Fannie Mae’s first quarter 2018 multifamily new business volume counted toward the Federal Housing Finance Agency’s (FHFA) 2018 multifamily volume cap. Fannie Mae supported 154,000 units of multifamily housing in the first quarter of 2018. More than 90% of the multifamily units the company financed were affordable to families earning at or below 120% of the area median income, providing support for both affordable and workforce housing. |
• | The multifamily guaranty book of business continued to grow in the first quarter of 2018, while the average charged guaranty fee on the multifamily guaranty book remained relatively flat compared to year end at 79 basis points as of March 31, 2018. |
• | The multifamily serious delinquency rate increased from 0.11% as of December 31, 2017 to 0.13% as of March 31, 2018. |
First Quarter 2018 Results | 7 | |
CREDIT RISK TRANSFER TRANSACTIONS
In late 2013, Fannie Mae began entering into credit risk transfer transactions with the goal of transferring, to the extent economically sensible, a portion of the mortgage credit risk on some of the recently acquired loans in its single-family book of business in order to reduce the economic risk to the company and taxpayers of future borrower defaults. Fannie Mae’s primary method of achieving this goal has been through the issuance of its Connecticut Avenue Securities™ (CAS) and its Credit Insurance Risk Transfer™ (CIRT™) transactions. In these transactions, the company transfers to investors a portion of the credit risk associated with losses on a reference pool of mortgage loans and in exchange pays investors a premium that effectively reduces the guaranty fee income the company retains on the loans.
As a part of Fannie Mae’s continued effort to innovate and improve the company’s credit risk transfer programs, in April 2018 the company announced changes to its Single-Family MBS program to facilitate proposed future enhancements to its benchmark CAS structure. These proposed future enhancements to the CAS program will enable the company to structure future CAS offerings as notes issued by trusts that qualify as Real Estate Mortgage Investment Conduits (REMICs). This proposed REMIC structure differs from the current CAS notes, which are issued as Fannie Mae corporate debt. The proposed enhancements to the company’s CAS program are designed to promote the continued growth of the market by expanding the potential investor base for these securities, making the program more attractive to real estate investment trust investors, as well as certain other investors, and limiting investor exposure to Fannie Mae counterparty risk, without disrupting the To-Be-Announced (TBA) MBS market. Fannie Mae may issue a CAS REMIC later this year, subject to FHFA approval, market conditions, and other factors.
Under the current CAS structure, there can be a significant lag between the time when Fannie Mae recognizes a provision for credit losses and when the company recognizes the related recovery from the CAS transaction. While a credit expense on a loan in a reference pool for a CAS transaction is recorded when it is probable that Fannie Mae has incurred a loss, for the company’s CAS issued beginning in 2016, a recovery is recorded only when an actual loss event occurs, which is typically several months after the collateral has been liquidated. The proposed new CAS structure will eliminate this timing mismatch, allowing Fannie Mae to recognize the credit loss protection benefit at the same time the credit loss is recognized in the company’s condensed consolidated financial statements.
CREDIT QUALITY
While continuing to make it possible for families to buy, refinance, or rent homes, Fannie Mae has maintained responsible credit standards. Fannie Mae monitors various loan attributes, in conjunction with housing market and economic conditions, to determine if its pricing, eligibility, and underwriting criteria accurately reflect the risks associated with loans the company acquires or guarantees. Single-family conventional loans acquired by Fannie Mae in the first quarter of 2018 had a weighted average borrower FICO credit score at origination of 743 and a weighted average original loan-to-value ratio of 75%.
First Quarter 2018 Results | 8 | |
__________
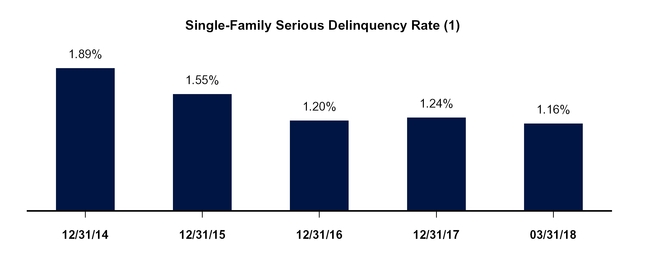
(1) | Calculated as of the date indicated based on the number of single-family conventional loans that were 90 days or more past due and loans that had been referred to foreclosure but not yet foreclosed upon, divided by the number of loans in Fannie Mae’s single-family conventional guaranty book of business. |
Fannie Mae’s single-family serious delinquency rate was 1.16% as of March 31, 2018, compared with 1.24% as of December 31, 2017 and 1.12% as of March 31, 2017. The company’s serious delinquency rate increased in the latter part of 2017 due to the impact of the hurricanes in the third quarter of 2017, as many homeowners in the hurricane-affected regions became delinquent on their loans, including those that were granted temporary forbearance. The company’s serious delinquency rate declined in the first quarter of 2018 primarily because many delinquent borrowers resolved their loan delinquencies during the quarter by obtaining a loan modification or resuming payments and becoming current on their loans, including loans in the hurricane regions.
Fannie Mae expects its single-family serious delinquency rate to remain higher compared with pre-hurricane levels during the next several months. The company expects many delinquent borrowers in the areas affected by the hurricanes will continue to resolve their loan delinquencies, either through resuming their mortgage payments and becoming current on their loans or by obtaining a loan modification. The company has already seen significant trial modification activity from the areas affected by the hurricanes in the first quarter of 2018, and expects elevated trial modification activity to continue at least through the second quarter of 2018. Over the long term, the company expects the impact of the hurricanes on its serious delinquency rate to subside and for this rate to resume its previous downward trend; however, because the company’s single-family serious delinquency rate has already declined significantly over the past several years, the company expects more modest declines and may experience period to period fluctuations in this rate.
First Quarter 2018 Results | 9 | |
FINANCIAL PERFORMANCE OUTLOOK
Fannie Mae expects to remain profitable on an annual basis for the foreseeable future; however, certain factors could result in significant volatility in the company’s financial results from quarter to quarter or year to year. Fannie Mae expects volatility from quarter to quarter in its financial results due to a number of factors, particularly changes in market conditions that result in fluctuations in the estimated fair value of the financial instruments that it marks to market through its earnings. Other factors that may result in volatility in the company’s quarterly financial results include developments that affect its loss reserves, such as changes in interest rates, home prices or accounting standards, or events such as natural disasters.
The potential for significant volatility in the company’s financial results could result in a net loss in a future quarter. The company is permitted to retain up to $3.0 billion in capital reserves as a buffer in the event of a net loss in a future quarter. However, any net loss the company experiences in the future could be greater than the amount of its capital reserves, resulting in a net worth deficit for that quarter. See “Risk Factors” in the company’s Form 10-K for the year ended December 31, 2017 (2017 Form 10-K) for a discussion of the risks associated with the limitations on the company’s ability to rebuild its capital reserves, including factors that could result in a net loss or net worth deficit in a future quarter.
ABOUT FANNIE MAE’S CONSERVATORSHIP AND AGREEMENTS WITH TREASURY
Fannie Mae has operated under the conservatorship of FHFA since September 6, 2008. Treasury has made a commitment under a senior preferred stock purchase agreement to provide funding to Fannie Mae under certain circumstances if the company has a net worth deficit. Pursuant to this agreement and the senior preferred stock the company issued to Treasury in 2008, the conservator has declared and directed Fannie Mae to pay dividends to Treasury on a quarterly basis for every dividend period for which dividends were payable since the company entered into conservatorship in 2008.
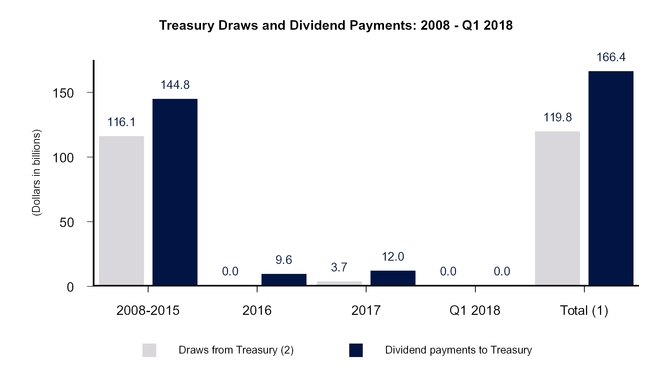
The chart below shows the funds Fannie Mae has drawn from Treasury pursuant to the senior preferred stock purchase agreement, as well as the dividend payments the company has made to Treasury on the senior preferred stock, since entering into conservatorship. Because Fannie Mae had a net worth deficit of $3.7 billion as of December 31, 2017, the company drew $3.7 billion from Treasury to eliminate this net worth deficit and no dividend was payable to Treasury for the first quarter of 2018.
First Quarter 2018 Results | 10 | |
__________
(1) | Under the terms of the senior preferred stock purchase agreement, dividend payments the company makes to Treasury do not offset prior draws of funds from Treasury, and the company is not permitted to pay down draws it has made under the agreement except in limited circumstances. Amounts may not sum due to rounding. |
(2) | Treasury draws are shown in the period for which requested, not when the funds were received by the company. Draw requests have been funded in the quarter following a net worth deficit. |
Fannie Mae expects to pay Treasury a dividend of $938 million for the second quarter of 2018 by June 30, 2018. The current dividend provisions of the senior preferred stock provide for quarterly dividends consisting of the amount, if any, by which the company’s net worth as of the end of the immediately preceding fiscal quarter exceeds a $3.0 billion capital reserve amount. The company refers to this as a “net worth sweep” dividend. The company’s net worth was $3.9 billion as of March 31, 2018.
If Fannie Mae experiences a net worth deficit in a future quarter, the company will be required to draw additional funds from Treasury under the senior preferred stock purchase agreement to avoid being placed into receivership. As of the date of this release, the maximum amount of remaining funding under the agreement is $113.9 billion. If the company were to draw additional funds from Treasury under the agreement in respect of a future period, the amount of remaining funding under the agreement would be reduced by the amount of its draw. Dividend payments Fannie Mae makes to Treasury do not restore or increase the amount of funding available to the company under the agreement. For a description of the terms of the senior preferred stock purchase agreement and the senior preferred stock, see “Business—Conservatorship and Treasury Agreements—Treasury Agreements” in the company’s 2017 Form 10-K.
Fannie Mae’s financial statements for the first quarter of 2018 are available in the accompanying Annex; however, investors and interested parties should read the company’s quarterly report on Form 10-Q for the quarter ended March 31, 2018 (First Quarter 2018 Form 10-Q), which was filed today with the Securities and Exchange Commission and is available on Fannie Mae’s website, www.fanniemae.com. The company provides further discussion of its financial results and condition, credit performance, and other matters in its First Quarter 2018 Form 10-Q. Additional information about the company’s financial and credit performance is contained in the “Fannie Mae Quarterly Financial Supplement” for the first quarter of 2018 at www.fanniemae.com.
# # #
In this release, the company has presented a number of estimates, forecasts, expectations, and other forward-looking statements, including statements regarding: future dividend payments on the senior preferred stock; the company’s profitability and financial results and the factors that will affect the company’s profitability and financial results; the company’s future credit risk transfer activity and the impact of such activity; and the company’s future serious delinquency rates and the factors that will affect the company’s single-family serious delinquency rates. These estimates, forecasts, expectations, and statements are forward-looking statements based on the company’s current assumptions regarding numerous factors. Actual results, and future projections, could be materially different from what is set forth in the forward-looking statements as a result of: home price changes; interest rate changes; unemployment rates; other macroeconomic and housing market variables; the company’s future serious delinquency rates; the company’s future guaranty fee pricing and the impact of that pricing on the company’s guaranty fee revenues and competitive environment; government policy; credit availability; changes in borrower behavior; the volume of loans it modifies; the effectiveness of its loss mitigation strategies; significant changes in modification and foreclosure activity; the volume and pace of future nonperforming and reperforming loan sales and their impact on the company’s results and serious delinquency rates; the effectiveness of its management of its real estate owned inventory and pursuit of contractual remedies; changes in the fair value of its assets and liabilities; future legislative or regulatory requirements or changes that have a significant impact on the company’s business, such as the enactment of housing finance reform legislation; actions by FHFA, Treasury, the Department of Housing and Urban Development or other regulators that affect the company’s business; the size, composition and quality of the company’s guaranty book of business and retained mortgage portfolio; the company’s market share; the life of the loans in the company’s guaranty book of business; future updates to the company’s models relating to loss reserves, including the assumptions used by these models; changes in generally accepted accounting principles; changes to the company’s accounting policies; whether the company’s counterparties meet their obligations in full; effects from activities the company takes to support the mortgage market and help borrowers; the company’s future objectives and activities in support of those objectives, including actions the company may take to reach additional underserved creditworthy borrowers; actions the company may be required to take by FHFA, in its role as the company’s conservator or as its regulator, such as changes in the type of business the company does or the implementation of the Single Security Initiative; limitations on the company’s business imposed by FHFA, in its role as the company’s conservator or as its regulator; the conservatorship and its effect on the company’s business; the investment by Treasury and its effect on the company’s business; the uncertainty of the company’s future; challenges the company faces in retaining and hiring qualified executives and other employees; the deteriorated credit performance of many loans in the company’s guaranty book of business; a decrease in the company’s credit ratings; defaults by one or more institutional counterparties; resolution or settlement agreements the company may enter into with its counterparties; operational control weaknesses; changes in the fiscal and monetary policies of the Federal Reserve, including implementation of the Federal Reserve’s balance sheet normalization program; changes in the structure and regulation of the financial services industry; the company’s ability to access the debt markets; disruptions in the housing, credit, and stock markets; government investigations and litigation; the company’s reliance on and the
First Quarter 2018 Results | 11 | |
performance of the company’s servicers; conditions in the foreclosure environment; global political risks; natural disasters, environmental disasters, terrorist attacks, pandemics, or other major disruptive events; cyber attacks or other information security breaches or threats; and many other factors, including those discussed in the “Risk Factors” and “Forward-Looking Statements” sections of and elsewhere in the company’s 2017 Form 10-K, First Quarter 2018 Form 10-Q, and elsewhere in this release.
Fannie Mae provides website addresses in its news releases solely for readers’ information. Other content or information appearing on these websites is not part of this release.
Fannie Mae helps make the 30-year fixed-rate mortgage and affordable rental housing possible for millions of Americans. We partner with lenders to create housing opportunities for families across the country. We are driving positive changes in housing finance to make the home buying process easier, while reducing costs and risk. To learn more, visit fanniemae.com and follow us on twitter.com/fanniemae.
First Quarter 2018 Results | 12 | |
ANNEX
FANNIE MAE
(In conservatorship)
Condensed Consolidated Balance Sheets — (Unaudited)
(Dollars in millions, except share amounts)
As of | |||||||||||
March 31, | December 31, | ||||||||||
2018 | 2017 | ||||||||||
ASSETS | |||||||||||
Cash and cash equivalents | $ | 10,248 | $ | 32,110 | |||||||
Restricted cash (includes $21,420 and $22,132, respectively, related to consolidated trusts) | 27,112 | 28,150 | |||||||||
Federal funds sold and securities purchased under agreements to resell or similar arrangements | 39,701 | 19,470 | |||||||||
Investments in securities: | |||||||||||
Trading, at fair value (includes $1,078 and $747, respectively, pledged as collateral) | 40,097 | 34,679 | |||||||||
Available-for-sale, at fair value | 3,888 | 4,843 | |||||||||
Total investments in securities | 43,985 | 39,522 | |||||||||
Mortgage loans: | |||||||||||
Loans held for sale, at lower of cost or fair value | 11,366 | 4,988 | |||||||||
Loans held for investment, at amortized cost: | |||||||||||
Of Fannie Mae | 147,270 | 162,809 | |||||||||
Of consolidated trusts | 3,057,884 | 3,029,812 | |||||||||
Total loans held for investment (includes $10,095 and $10,596, respectively, at fair value) | 3,205,154 | 3,192,621 | |||||||||
Allowance for loan losses | (18,734 | ) | (19,084 | ) | |||||||
Total loans held for investment, net of allowance | 3,186,420 | 3,173,537 | |||||||||
Total mortgage loans | 3,197,786 | 3,178,525 | |||||||||
Deferred tax assets, net | 16,517 | 17,350 | |||||||||
Accrued interest receivable, net (includes $7,535 and $7,560, respectively, related to consolidated trusts) | 8,076 | 8,133 | |||||||||
Acquired property, net | 3,044 | 3,220 | |||||||||
Other assets | 17,933 | 19,049 | |||||||||
Total assets | $ | 3,364,402 | $ | 3,345,529 | |||||||
LIABILITIES AND EQUITY (DEFICIT) | |||||||||||
Liabilities: | |||||||||||
Accrued interest payable (includes $8,682 and $8,598, respectively, related to consolidated trusts) | $ | 9,773 | $ | 9,682 | |||||||
Debt: | |||||||||||
Of Fannie Mae (includes $7,860 and $8,186, respectively, at fair value) | 265,401 | 276,752 | |||||||||
Of consolidated trusts (includes $28,637 and $30,493, respectively, at fair value) | 3,075,071 | 3,053,302 | |||||||||
Other liabilities (includes $389 and $492, respectively, related to consolidated trusts) | 10,219 | 9,479 | |||||||||
Total liabilities | 3,360,464 | 3,349,215 | |||||||||
Commitments and contingencies | — | — | |||||||||
Fannie Mae stockholders’ equity (deficit): | |||||||||||
Senior preferred stock, 1,000,000 shares issued and outstanding | 120,836 | 117,149 | |||||||||
Preferred stock, 700,000,000 shares are authorized—555,374,922 shares issued and outstanding | 19,130 | 19,130 | |||||||||
Common stock, no par value, no maximum authorization—1,308,762,703 shares issued and 1,158,087,567 shares outstanding | 687 | 687 | |||||||||
Accumulated deficit | (129,662 | ) | (133,805 | ) | |||||||
Accumulated other comprehensive income | 347 | 553 | |||||||||
Treasury stock, at cost, 150,675,136 shares | (7,400 | ) | (7,400 | ) | |||||||
Total stockholders’ equity (deficit) (See Note 1: Senior Preferred Stock Purchase Agreement and Senior Preferred Stock for information on our dividend obligation to Treasury) | 3,938 | (3,686 | ) | ||||||||
Total liabilities and equity (deficit) | $ | 3,364,402 | $ | 3,345,529 | |||||||
See Notes to Condensed Consolidated Financial Statements in the First Quarter 2018 Form 10-Q
First Quarter 2018 Results | 13 | |
FANNIE MAE
(In conservatorship)
Condensed Consolidated Statements of Operations and Comprehensive Income — (Unaudited)
(Dollars in millions, except share amounts)
For the Three Months | |||||||||||
Ended March 31, | |||||||||||
2018 | 2017 | ||||||||||
Interest income: | |||||||||||
Trading securities | $ | 236 | $ | 142 | |||||||
Available-for-sale securities | 71 | 101 | |||||||||
Mortgage loans (includes $26,298 and $24,954, respectively, related to consolidated trusts) | 28,034 | 27,047 | |||||||||
Other | 173 | 94 | |||||||||
Total interest income | 28,514 | 27,384 | |||||||||
Interest expense: | |||||||||||
Short-term debt | (107 | ) | (44 | ) | |||||||
Long-term debt (includes $21,715 and $20,308, respectively, related to consolidated trusts) | (23,175 | ) | (21,994 | ) | |||||||
Total interest expense | (23,282 | ) | (22,038 | ) | |||||||
Net interest income | 5,232 | 5,346 | |||||||||
Benefit for credit losses | 217 | 396 | |||||||||
Net interest income after benefit for credit losses | 5,449 | 5,742 | |||||||||
Investment gains (losses), net | 250 | (9 | ) | ||||||||
Fair value gains (losses), net | 1,045 | (40 | ) | ||||||||
Fee and other income | 320 | 249 | |||||||||
Non-interest income | 1,615 | 200 | |||||||||
Administrative expenses: | |||||||||||
Salaries and employee benefits | (381 | ) | (344 | ) | |||||||
Professional services | (243 | ) | (229 | ) | |||||||
Other administrative expenses | (126 | ) | (111 | ) | |||||||
Total administrative expenses | (750 | ) | (684 | ) | |||||||
Foreclosed property expense | (162 | ) | (217 | ) | |||||||
Temporary Payroll Tax Cut Continuation Act of 2011 (“TCCA”) fees | (557 | ) | (503 | ) | |||||||
Other expenses, net | (203 | ) | (382 | ) | |||||||
Total expenses | (1,672 | ) | (1,786 | ) | |||||||
Income before federal income taxes | 5,392 | 4,156 | |||||||||
Provision for federal income taxes | (1,131 | ) | (1,383 | ) | |||||||
Net income | 4,261 | 2,773 | |||||||||
Other comprehensive income (loss): | |||||||||||
Changes in unrealized gains on available-for-sale securities, net of reclassification adjustments and taxes | (320 | ) | 8 | ||||||||
Other | (3 | ) | (2 | ) | |||||||
Total other comprehensive income (loss) | (323 | ) | 6 | ||||||||
Total comprehensive income | 3,938 | 2,779 | |||||||||
Net income | 4,261 | 2,773 | |||||||||
Dividends distributed or available for distribution to senior preferred stockholder | $ | (938 | ) | $ | (2,779 | ) | |||||
Net income (loss) attributable to common stockholders | $ | 3,323 | $ | (6 | ) | ||||||
Earnings (loss) per share: | |||||||||||
Basic | $ | 0.58 | $ | 0.00 | |||||||
Diluted | 0.56 | 0.00 | |||||||||
Weighted-average common shares outstanding: | |||||||||||
Basic | 5,762 | 5,762 | |||||||||
Diluted | 5,893 | 5,762 | |||||||||
See Notes to Condensed Consolidated Financial Statements in the First Quarter 2018 Form 10-Q
First Quarter 2018 Results | 14 | |
FANNIE MAE
(In conservatorship)
Condensed Consolidated Statements of Cash Flows — (Unaudited)
(Dollars in millions)
For the Three Months Ended March 31, | |||||||||||
2018 | 2017 | ||||||||||
Net cash provided by (used in) operating activities | $ | (1,409 | ) | $ | 2,619 | ||||||
Cash flows provided by investing activities: | |||||||||||
Proceeds from maturities and paydowns of trading securities held for investment | 110 | 579 | |||||||||
Proceeds from sales of trading securities held for investment | — | 66 | |||||||||
Proceeds from maturities and paydowns of available-for-sale securities | 266 | 594 | |||||||||
Proceeds from sales of available-for-sale securities | 648 | 151 | |||||||||
Purchases of loans held for investment | (40,045 | ) | (41,206 | ) | |||||||
Proceeds from repayments of loans acquired as held for investment of Fannie Mae | 4,164 | 6,718 | |||||||||
Proceeds from sales of loans acquired as held for investment of Fannie Mae | 80 | — | |||||||||
Proceeds from repayments and sales of loans acquired as held for investment of consolidated trusts | 96,626 | 97,415 | |||||||||
Advances to lenders | (27,898 | ) | (28,703 | ) | |||||||
Proceeds from disposition of acquired property and preforeclosure sales | 2,360 | 3,454 | |||||||||
Net change in federal funds sold and securities purchased under agreements to resell or similar arrangements | (20,231 | ) | (4,845 | ) | |||||||
Other, net | (264 | ) | (330 | ) | |||||||
Net cash provided by investing activities | 15,816 | 33,893 | |||||||||
Cash flows used in financing activities: | |||||||||||
Proceeds from issuance of debt of Fannie Mae | 288,281 | 230,272 | |||||||||
Payments to redeem debt of Fannie Mae | (299,797 | ) | (230,601 | ) | |||||||
Proceeds from issuance of debt of consolidated trusts | 89,493 | 78,443 | |||||||||
Payments to redeem debt of consolidated trusts | (119,413 | ) | (119,208 | ) | |||||||
Payments of cash dividends on senior preferred stock to Treasury | — | (5,471 | ) | ||||||||
Proceeds from senior preferred stock purchase agreement with Treasury | 3,687 | — | |||||||||
Other, net | 442 | 185 | |||||||||
Net cash used in financing activities | (37,307 | ) | (46,380 | ) | |||||||
Net decrease in cash, cash equivalents and restricted cash | (22,900 | ) | (9,868 | ) | |||||||
Cash, cash equivalents and restricted cash at beginning of period | 60,260 | 62,177 | |||||||||
Cash, cash equivalents and restricted cash at end of period | $ | 37,360 | $ | 52,309 | |||||||
Cash paid during the period for: | |||||||||||
Interest | $ | 27,041 | $ | 25,954 | |||||||
Income taxes | — | — | |||||||||
See Notes to Condensed Consolidated Financial Statements in the First Quarter 2018 Form 10-Q
First Quarter 2018 Results | 15 | |