Attached files
| file | filename |
|---|---|
| EX-12.1 - EXHIBIT 12.1 - CNO Financial Group, Inc. | cno03312018ex121.htm |
| EX-32.2 - EXHIBIT 32.2 - CNO Financial Group, Inc. | cno03312018ex322.htm |
| EX-32.1 - EXHIBIT 32.1 - CNO Financial Group, Inc. | cno03312018ex321.htm |
| EX-31.2 - EXHIBIT 31.2 - CNO Financial Group, Inc. | cno03312018ex312.htm |
| EX-31.1 - EXHIBIT 31.1 - CNO Financial Group, Inc. | cno03312018ex311.htm |
UNITED STATES
SECURITIES AND EXCHANGE COMMISSION
Washington, D.C. 20549
Form 10-Q
þ | QUARTERLY REPORT PURSUANT TO SECTION 13 OR 15(d) OF THE SECURITIES EXCHANGE ACT OF 1934 |
For the quarterly period ended March 31, 2018
o | TRANSITION REPORT PURSUANT TO SECTION 13 OR 15(d) OF THE SECURITIES EXCHANGE ACT OF 1934 |
For the transition period from ___ to ___
Commission File Number 001-31792
CNO Financial Group, Inc.
Delaware | 75-3108137 | |
State of Incorporation | IRS Employer Identification No. | |
11825 N. Pennsylvania Street | ||
Carmel, Indiana 46032 | (317) 817-6100 | |
Address of principal executive offices | Telephone | |
Indicate by check mark whether the Registrant (1) has filed all reports required to be filed by Section 13 or 15(d) of the Securities Exchange Act of 1934 during the preceding 12 months (or for such shorter period that the registrant was required to file such reports) and (2) has been subject to such filing requirements for the past 90 days: Yes [ X ] No [ ]
Indicate by check mark whether the Registrant has submitted electronically and posted on its corporate Web site, if any, every Interactive Data File required to be submitted and posted pursuant to Rule 405 of Regulation S-T (§ 232.405 of this chapter) during the preceding 12 months (or for such shorter period that the registrant was required to submit and post such files). Yes [ X ] No [ ]
Indicate by check mark whether the Registrant is a large accelerated filer, an accelerated filer, a non-accelerated filer, smaller reporting company, or an emerging growth company. See the definitions of "large accelerated filer", "accelerated filer", "smaller reporting company", and "emerging growth company" in Rule 12b-2 of the Exchange Act. Large accelerated filer [ X ] Accelerated filer [ ] Non-accelerated filer [ ] Smaller reporting company [ ] Emerging growth company [ ]
If an emerging growth company, indicate by check mark if the registrant has elected not to use the extended transition period for complying with any new or revised financial accounting standards provided pursuant to Section 13(a) of the Exchange Act. [ ]
Indicate by check mark whether the Registrant is a shell company (as defined in Rule 12b-2 of the Exchange Act): Yes [ ] No [ X ]
Shares of common stock outstanding as of April 19, 2018: 167,356,255
TABLE OF CONTENTS
PART I - FINANCIAL INFORMATION | Page | |
Item 1. | Financial Statements (unaudited) | |
Item 2. | ||
Item 3. | ||
Item 4. | ||
PART II - OTHER INFORMATION | ||
Item 1. | ||
Item 1A. | ||
Item 2. | ||
Item 6. | ||
2
PART I - FINANCIAL INFORMATION
ITEM 1. FINANCIAL STATEMENTS.
CNO FINANCIAL GROUP, INC. AND SUBSIDIARIES
CONSOLIDATED BALANCE SHEET
(Dollars in millions)
(unaudited)
ASSETS
March 31, 2018 | December 31, 2017 | ||||||
Investments: | |||||||
Fixed maturities, available for sale, at fair value (amortized cost: March 31, 2018 - $20,820.9; December 31, 2017 - $20,702.1) | $ | 22,375.5 | $ | 22,910.9 | |||
Equity securities at fair value (cost: March 31, 2018 - $504.4; December 31, 2017 - $420.0) | 498.7 | 440.6 | |||||
Mortgage loans | 1,601.2 | 1,650.6 | |||||
Policy loans | 116.0 | 116.0 | |||||
Trading securities | 289.6 | 284.6 | |||||
Investments held by variable interest entities | 1,583.9 | 1,526.9 | |||||
Other invested assets | 951.1 | 924.5 | |||||
Total investments | 27,416.0 | 27,854.1 | |||||
Cash and cash equivalents - unrestricted | 610.8 | 578.4 | |||||
Cash and cash equivalents held by variable interest entities | 115.6 | 178.9 | |||||
Accrued investment income | 268.1 | 245.9 | |||||
Present value of future profits | 350.4 | 359.6 | |||||
Deferred acquisition costs | 1,083.6 | 1,026.8 | |||||
Reinsurance receivables | 2,153.5 | 2,175.2 | |||||
Income tax assets, net | 450.4 | 366.9 | |||||
Assets held in separate accounts | 4.7 | 5.0 | |||||
Other assets | 356.0 | 319.5 | |||||
Total assets | $ | 32,809.1 | $ | 33,110.3 | |||
(continued on next page)
The accompanying notes are an integral part
of the consolidated financial statements.
3
CNO FINANCIAL GROUP, INC. AND SUBSIDIARIES
CONSOLIDATED BALANCE SHEET, continued
(Dollars in millions)
(unaudited)
LIABILITIES AND SHAREHOLDERS' EQUITY
March 31, 2018 | December 31, 2017 | ||||||
Liabilities: | |||||||
Liabilities for insurance products: | |||||||
Policyholder account balances | $ | 11,254.5 | $ | 11,220.7 | |||
Future policy benefits | 11,312.2 | 11,521.3 | |||||
Liability for policy and contract claims | 509.1 | 530.3 | |||||
Unearned and advanced premiums | 270.3 | 261.7 | |||||
Liabilities related to separate accounts | 4.7 | 5.0 | |||||
Other liabilities | 869.0 | 751.8 | |||||
Investment borrowings | 1,646.5 | 1,646.7 | |||||
Borrowings related to variable interest entities | 1,410.5 | 1,410.7 | |||||
Notes payable – direct corporate obligations | 915.1 | 914.6 | |||||
Total liabilities | 28,191.9 | 28,262.8 | |||||
Commitments and Contingencies | |||||||
Shareholders' equity: | |||||||
Common stock ($0.01 par value, 8,000,000,000 shares authorized, shares issued and outstanding: March 31, 2018 – 167,354,255; December 31, 2017 – 166,857,931) | 1.6 | 1.7 | |||||
Additional paid-in capital | 3,075.6 | 3,073.3 | |||||
Accumulated other comprehensive income | 894.3 | 1,212.1 | |||||
Retained earnings | 645.7 | 560.4 | |||||
Total shareholders' equity | 4,617.2 | 4,847.5 | |||||
Total liabilities and shareholders' equity | $ | 32,809.1 | $ | 33,110.3 | |||
The accompanying notes are an integral part
of the consolidated financial statements.
4
CNO FINANCIAL GROUP, INC. AND SUBSIDIARIES
CONSOLIDATED STATEMENT OF OPERATIONS
(Dollars in millions, except per share data)
(unaudited)
Three months ended | ||||||||
March 31, | ||||||||
2018 | 2017 | |||||||
Revenues: | ||||||||
Insurance policy income | $ | 659.9 | $ | 663.8 | ||||
Net investment income: | ||||||||
General account assets | 329.1 | 312.0 | ||||||
Policyholder and other special-purpose portfolios | 12.8 | 75.2 | ||||||
Realized investment gains (losses): | ||||||||
Net realized investment gains (losses), excluding impairment losses | (15.2 | ) | 16.3 | |||||
Impairment losses recognized (a) | — | (8.4 | ) | |||||
Total realized gains (losses) | (15.2 | ) | 7.9 | |||||
Fee revenue and other income | 21.2 | 11.8 | ||||||
Total revenues | 1,007.8 | 1,070.7 | ||||||
Benefits and expenses: | ||||||||
Insurance policy benefits | 586.6 | 669.3 | ||||||
Interest expense | 33.6 | 30.8 | ||||||
Amortization | 71.9 | 63.5 | ||||||
Other operating costs and expenses | 207.6 | 210.4 | ||||||
Total benefits and expenses | 899.7 | 974.0 | ||||||
Income before income taxes | 108.1 | 96.7 | ||||||
Income tax expense on period income | 23.8 | 34.4 | ||||||
Net income | $ | 84.3 | $ | 62.3 | ||||
Earnings per common share: | ||||||||
Basic: | ||||||||
Weighted average shares outstanding | 167,060,000 | 173,431,000 | ||||||
Net income | $ | .50 | $ | .36 | ||||
Diluted: | ||||||||
Weighted average shares outstanding | 169,677,000 | 175,065,000 | ||||||
Net income | $ | .50 | $ | .36 | ||||
______________
(a) | No portion of the other-than-temporary impairments recognized in the periods was included in accumulated other comprehensive income. |
The accompanying notes are an integral part
of the consolidated financial statements.
5
CNO FINANCIAL GROUP, INC. AND SUBSIDIARIES
CONSOLIDATED STATEMENT OF COMPREHENSIVE INCOME
(Dollars in millions)
(unaudited)
Three months ended | |||||||
March 31, | |||||||
2018 | 2017 | ||||||
Net income | $ | 84.3 | $ | 62.3 | |||
Other comprehensive income, before tax: | |||||||
Unrealized gains (losses) for the period | (653.7 | ) | 215.8 | ||||
Adjustment to present value of future profits and deferred acquisition costs | 55.7 | 7.8 | |||||
Amount related to premium deficiencies assuming the net unrealized gains (losses) had been realized | 211.6 | (52.0 | ) | ||||
Reclassification adjustments: | |||||||
For net realized investment gains included in net income | (.4 | ) | (5.1 | ) | |||
Unrealized gains (losses) on investments | (386.8 | ) | 166.5 | ||||
Change related to deferred compensation plan | — | — | |||||
Other comprehensive income (loss) before tax | (386.8 | ) | 166.5 | ||||
Income tax (expense) benefit related to items of accumulated other comprehensive income (loss) | 85.3 | (59.3 | ) | ||||
Other comprehensive income (loss), net of tax | (301.5 | ) | 107.2 | ||||
Comprehensive income (loss) | $ | (217.2 | ) | $ | 169.5 | ||
The accompanying notes are an integral part
of the consolidated financial statements.
6
CNO FINANCIAL GROUP, INC. AND SUBSIDIARIES
CONSOLIDATED STATEMENT OF SHAREHOLDERS' EQUITY
(Dollars in millions)
(unaudited)
Common stock and additional paid-in capital | Accumulated other comprehensive income | Retained earnings | Total | ||||||||||||
Balance, December 31, 2016 | $ | 3,213.8 | $ | 622.4 | $ | 650.7 | $ | 4,486.9 | |||||||
Cumulative effect of accounting change | .9 | — | (.6 | ) | .3 | ||||||||||
Net income | — | — | 62.3 | 62.3 | |||||||||||
Change in unrealized appreciation (depreciation) of investments and other (net of applicable income tax expense of $58.7) | — | 106.1 | — | 106.1 | |||||||||||
Change in noncredit component of impairment losses on fixed maturities, available for sale (net of applicable income tax expense of $.6) | — | 1.1 | — | 1.1 | |||||||||||
Cost of common stock repurchased | (43.0 | ) | — | — | (43.0 | ) | |||||||||
Dividends on common stock | — | — | (14.0 | ) | (14.0 | ) | |||||||||
Stock options, restricted stock and performance units | 7.1 | — | — | 7.1 | |||||||||||
Balance, March 31, 2017 | $ | 3,178.8 | $ | 729.6 | $ | 698.4 | $ | 4,606.8 | |||||||
Balance, December 31, 2017 | $ | 3,075.0 | $ | 1,212.1 | $ | 560.4 | $ | 4,847.5 | |||||||
Cumulative effect of accounting change | — | (16.3 | ) | 16.3 | — | ||||||||||
Net income | — | — | 84.3 | 84.3 | |||||||||||
Change in unrealized appreciation (depreciation) of investments (net of applicable income tax benefit of $85.5) | — | (302.1 | ) | — | (302.1 | ) | |||||||||
Change in noncredit component of impairment losses on fixed maturities, available for sale (net of applicable income tax expense of $.2) | — | .6 | — | .6 | |||||||||||
Dividends on common stock | — | — | (15.3 | ) | (15.3 | ) | |||||||||
Stock options, restricted stock and performance units | 2.2 | — | — | 2.2 | |||||||||||
Balance, March 31, 2018 | $ | 3,077.2 | $ | 894.3 | $ | 645.7 | $ | 4,617.2 | |||||||
The accompanying notes are an integral part
of the consolidated financial statements.
7
CNO FINANCIAL GROUP, INC. AND SUBSIDIARIES
CONSOLIDATED STATEMENT OF CASH FLOWS
(Dollars in millions)
(unaudited)
Three months ended | |||||||
March 31, | |||||||
2018 | 2017 | ||||||
Cash flows from operating activities: | |||||||
Insurance policy income | $ | 631.4 | $ | 640.1 | |||
Net investment income | 298.8 | 295.3 | |||||
Fee revenue and other income | 21.2 | 11.8 | |||||
Insurance policy benefits | (531.4 | ) | (511.8 | ) | |||
Interest expense | (19.3 | ) | (20.5 | ) | |||
Deferrable policy acquisition costs | (60.2 | ) | (63.2 | ) | |||
Other operating costs | (246.2 | ) | (206.8 | ) | |||
Income taxes | (22.1 | ) | (1.5 | ) | |||
Net cash from operating activities | 72.2 | 143.4 | |||||
Cash flows from investing activities: | |||||||
Sales of investments | 1,163.1 | 397.4 | |||||
Maturities and redemptions of investments | 547.1 | 849.3 | |||||
Purchases of investments | (1,798.7 | ) | (1,166.4 | ) | |||
Net sales (purchases) of trading securities | (2.0 | ) | 35.6 | ||||
Other | (7.6 | ) | (8.9 | ) | |||
Net cash provided (used) by investing activities | (98.1 | ) | 107.0 | ||||
Cash flows from financing activities: | |||||||
Issuance of common stock | — | 2.9 | |||||
Payments to repurchase common stock | (4.6 | ) | (39.8 | ) | |||
Common stock dividends paid | (15.4 | ) | (14.0 | ) | |||
Amounts received for deposit products | 355.6 | 359.5 | |||||
Withdrawals from deposit products | (339.7 | ) | (312.9 | ) | |||
Issuance of investment borrowings: | |||||||
Related to variable interest entities | — | 8.7 | |||||
Payments on investment borrowings: | |||||||
Federal Home Loan Bank | (.2 | ) | (.2 | ) | |||
Related to variable interest entities | (.7 | ) | (38.1 | ) | |||
Net cash used by financing activities | (5.0 | ) | (33.9 | ) | |||
Net increase (decrease) in cash and cash equivalents | (30.9 | ) | 216.5 | ||||
Cash and cash equivalents - unrestricted and held by variable interest entities, beginning of period | 757.3 | 668.2 | |||||
Cash and cash equivalents - unrestricted and held by variable interest entities, end of period | $ | 726.4 | $ | 884.7 | |||
The accompanying notes are an integral part
of the consolidated financial statements.
8
CNO FINANCIAL GROUP, INC. AND SUBSIDIARIES
Notes to Consolidated Financial Statements
(unaudited)
___________________
BUSINESS AND BASIS OF PRESENTATION
The following notes should be read together with the notes to the consolidated financial statements included in our 2017 Annual Report on Form 10-K.
CNO Financial Group, Inc., a Delaware corporation ("CNO"), is a holding company for a group of insurance companies operating throughout the United States that develop, market and administer health insurance, annuity, individual life insurance and other insurance products. The terms "CNO Financial Group, Inc.", "CNO", the "Company", "we", "us", and "our" as used in these financial statements refer to CNO and its subsidiaries. Such terms, when used to describe insurance business and products, refer to the insurance business and products of CNO's insurance subsidiaries.
We focus on serving middle-income pre-retiree and retired Americans, which we believe are attractive, underserved, high growth markets. We sell our products through three distribution channels: career agents, independent producers (some of whom sell one or more of our product lines exclusively) and direct marketing.
Our unaudited consolidated financial statements reflect normal recurring adjustments that, in the opinion of management, are necessary for a fair statement of our financial position, results of operations and cash flows for the periods presented. As permitted by rules and regulations of the Securities and Exchange Commission (the "SEC") applicable to quarterly reports on Form 10-Q, we have condensed or omitted certain information and disclosures normally included in financial statements prepared in accordance with accounting principles generally accepted in the United States of America ("GAAP"). We have reclassified certain amounts from the prior periods to conform to the 2018 presentation. These reclassifications have no effect on net income or shareholders' equity. Results for interim periods are not necessarily indicative of the results that may be expected for a full year.
The balance sheet at December 31, 2017, presented herein, has been derived from the audited financial statements at that date but does not include all of the information and footnotes required by GAAP for complete financial statements.
When we prepare financial statements in conformity with GAAP, we are required to make estimates and assumptions that significantly affect reported amounts of various assets and liabilities and the disclosure of contingent assets and liabilities at the date of the financial statements and revenues and expenses during the reporting periods. For example, we use significant estimates and assumptions to calculate values for deferred acquisition costs, the present value of future profits, fair value measurements of certain investments (including derivatives), other-than-temporary impairments of investments, assets and liabilities related to income taxes, liabilities for insurance products, liabilities related to litigation and guaranty fund assessment accruals. If our future experience differs from these estimates and assumptions, our financial statements would be materially affected.
The accompanying financial statements include the accounts of the Company and its subsidiaries. Our consolidated financial statements exclude transactions between us and our consolidated affiliates, or among our consolidated affiliates.
INVESTMENTS
We classify our fixed maturity securities into one of two categories: (i) "available for sale" (which we carry at estimated fair value with any unrealized gain or loss, net of tax and related adjustments, recorded as a component of shareholders' equity); or (ii) "trading" (which we carry at estimated fair value with changes in such value recognized as net investment income (classified as investment income from policyholder and other special-purpose portfolios)).
Our trading securities include: (i) investments purchased with the intent of selling in the near term to generate income; (ii) investments supporting certain insurance liabilities (including investments backing the market strategies of our multibucket annuity products) and certain reinsurance agreements; and (iii) certain fixed maturity securities containing embedded derivatives for which we have elected the fair value option. The change in fair value of the income generating investments and investments supporting insurance liabilities is recognized in income from policyholder and other special-purpose portfolios (a component of net investment income). The change in fair value of securities with embedded derivatives is recognized in realized investment gains (losses). Investment income related to investments supporting certain insurance liabilities is substantially offset by the change in insurance policy benefits related to certain products.
9
CNO FINANCIAL GROUP, INC. AND SUBSIDIARIES
Notes to Consolidated Financial Statements
(unaudited)
___________________
Accumulated other comprehensive income is primarily comprised of the net effect of unrealized appreciation (depreciation) on our investments. These amounts, included in shareholders' equity as of March 31, 2018 and December 31, 2017, were as follows (dollars in millions):
March 31, 2018 | December 31, 2017 | ||||||
Net unrealized appreciation (depreciation) on fixed maturity securities, available for sale, on which an other-than-temporary impairment loss has been recognized | $ | 3.4 | $ | 2.6 | |||
Net unrealized gains on all other investments | 1,551.8 | 2,227.3 | |||||
Adjustment to present value of future profits (a) | (89.7 | ) | (94.0 | ) | |||
Adjustment to deferred acquisition costs | (237.6 | ) | (292.6 | ) | |||
Adjustment to insurance liabilities | (87.8 | ) | (295.8 | ) | |||
Deferred income tax liabilities | (245.8 | ) | (335.4 | ) | |||
Accumulated other comprehensive income | $ | 894.3 | $ | 1,212.1 | |||
________
(a) | The present value of future profits is the value assigned to the right to receive future cash flows from contracts existing at September 10, 2003, the date Conseco, Inc., an Indiana corporation, emerged from bankruptcy. |
At March 31, 2018, adjustments to the present value of future profits, deferred acquisition costs, insurance liabilities and deferred tax assets included $(80.6) million, $(134.5) million, $(87.8) million and $67.9 million, respectively, for premium deficiencies that would exist on certain blocks of business (primarily long-term care products) if unrealized gains on the assets backing such products had been realized and the proceeds from the sales of such assets were invested at then current yields.
At March 31, 2018, the amortized cost, gross unrealized gains and losses, estimated fair value, other-than-temporary impairments in accumulated other comprehensive income of fixed maturities, available for sale, were as follows (dollars in millions):
Amortized cost | Gross unrealized gains | Gross unrealized losses | Estimated fair value | Other-than-temporary impairments included in accumulated other comprehensive income | |||||||||||||||
Corporate securities | $ | 13,629.5 | $ | 1,196.1 | $ | (100.3 | ) | $ | 14,725.3 | $ | — | ||||||||
United States Treasury securities and obligations of United States government corporations and agencies | 149.4 | 24.0 | (.3 | ) | 173.1 | — | |||||||||||||
States and political subdivisions | 1,843.7 | 204.2 | (1.6 | ) | 2,046.3 | — | |||||||||||||
Debt securities issued by foreign governments | 78.0 | 1.4 | (1.7 | ) | 77.7 | — | |||||||||||||
Asset-backed securities | 2,725.6 | 165.9 | (7.7 | ) | 2,883.8 | — | |||||||||||||
Collateralized debt obligations | 363.0 | 1.7 | (.2 | ) | 364.5 | — | |||||||||||||
Commercial mortgage-backed securities | 1,398.0 | 20.7 | (16.8 | ) | 1,401.9 | — | |||||||||||||
Mortgage pass-through securities | 1.7 | .1 | — | 1.8 | — | ||||||||||||||
Collateralized mortgage obligations | 632.0 | 70.7 | (1.6 | ) | 701.1 | (.9 | ) | ||||||||||||
Total fixed maturities, available for sale | $ | 20,820.9 | $ | 1,684.8 | $ | (130.2 | ) | $ | 22,375.5 | $ | (.9 | ) | |||||||
10
CNO FINANCIAL GROUP, INC. AND SUBSIDIARIES
Notes to Consolidated Financial Statements
(unaudited)
___________________
At December 31, 2017, the amortized cost, gross unrealized gains and losses, estimated fair value, other-than-temporary impairments in accumulated other comprehensive income of fixed maturities, available for sale, and equity securities were as follows (dollars in millions):
Amortized cost | Gross unrealized gains | Gross unrealized losses | Estimated fair value | Other-than-temporary impairments included in accumulated other comprehensive income | |||||||||||||||
Corporate securities | $ | 13,286.3 | $ | 1,699.1 | $ | (27.0 | ) | $ | 14,958.4 | $ | — | ||||||||
United States Treasury securities and obligations of United States government corporations and agencies | 146.4 | 31.5 | (.2 | ) | 177.7 | — | |||||||||||||
States and political subdivisions | 1,821.9 | 234.8 | (.4 | ) | 2,056.3 | — | |||||||||||||
Debt securities issued by foreign governments | 79.5 | 3.8 | (.2 | ) | 83.1 | — | |||||||||||||
Asset-backed securities | 3,085.9 | 172.6 | (4.1 | ) | 3,254.4 | — | |||||||||||||
Collateralized debt obligations | 257.1 | 2.3 | — | 259.4 | — | ||||||||||||||
Commercial mortgage-backed securities | 1,354.0 | 33.8 | (10.3 | ) | 1,377.5 | — | |||||||||||||
Mortgage pass-through securities | 1.8 | .2 | — | 2.0 | — | ||||||||||||||
Collateralized mortgage obligations | 669.2 | 73.2 | (.3 | ) | 742.1 | (1.0 | ) | ||||||||||||
Total fixed maturities, available for sale | $ | 20,702.1 | $ | 2,251.3 | $ | (42.5 | ) | $ | 22,910.9 | $ | (1.0 | ) | |||||||
Equity securities | $ | 420.0 | $ | 23.6 | $ | (3.0 | ) | $ | 440.6 | ||||||||||
The following table sets forth the amortized cost and estimated fair value of fixed maturities, available for sale, at March 31, 2018, by contractual maturity. Actual maturities will differ from contractual maturities because borrowers may have the right to call or prepay obligations with or without penalties. Structured securities (such as asset-backed securities, collateralized debt obligations, commercial mortgage-backed securities, mortgage pass-through securities and collateralized mortgage obligations, collectively referred to as "structured securities") frequently include provisions for periodic principal payments and permit periodic unscheduled payments.
Amortized cost | Estimated fair value | ||||||
(Dollars in millions) | |||||||
Due in one year or less | $ | 424.2 | $ | 431.3 | |||
Due after one year through five years | 1,765.2 | 1,837.4 | |||||
Due after five years through ten years | 1,818.0 | 1,881.8 | |||||
Due after ten years | 11,693.2 | 12,871.9 | |||||
Subtotal | 15,700.6 | 17,022.4 | |||||
Structured securities | 5,120.3 | 5,353.1 | |||||
Total fixed maturities, available for sale | $ | 20,820.9 | $ | 22,375.5 | |||
11
CNO FINANCIAL GROUP, INC. AND SUBSIDIARIES
Notes to Consolidated Financial Statements
(unaudited)
___________________
The following table sets forth the amortized cost and estimated fair value of fixed maturities, available for sale, at December 31, 2017, by contractual maturity.
Amortized cost | Estimated fair value | ||||||
(Dollars in millions) | |||||||
Due in one year or less | $ | 328.1 | $ | 335.1 | |||
Due after one year through five years | 1,947.3 | 2,052.3 | |||||
Due after five years through ten years | 1,508.7 | 1,601.3 | |||||
Due after ten years | 11,550.0 | 13,286.8 | |||||
Subtotal | 15,334.1 | 17,275.5 | |||||
Structured securities | 5,368.0 | 5,635.4 | |||||
Total fixed maturities, available for sale | $ | 20,702.1 | $ | 22,910.9 | |||
Net Realized Investment Gains (Losses)
The following table sets forth the net realized investment gains (losses) for the periods indicated (dollars in millions):
Three months ended | |||||||
March 31, | |||||||
2018 | 2017 | ||||||
Fixed maturity securities, available for sale: | |||||||
Gross realized gains on sale | $ | 8.2 | $ | 7.0 | |||
Gross realized losses on sale | (7.7 | ) | (2.7 | ) | |||
Impairment losses recognized | — | (3.2 | ) | ||||
Net realized investment gains from fixed maturities | .5 | 1.1 | |||||
Equity securities | — | 1.9 | |||||
Change in fair value of equity securities (a) | (12.5 | ) | — | ||||
Mortgage loans | — | 1.0 | |||||
Impairments of other investments | — | (5.2 | ) | ||||
Other (a) | (3.2 | ) | 9.1 | ||||
Net realized investment gains (losses) | $ | (15.2 | ) | $ | 7.9 | ||
_________________
(a) | Changes in the estimated fair value of trading securities that we have elected the fair value option and equity securities (and are still held as of the end of the respective periods) were $(8.9) million and $3.0 million for the three months ended March 31, 2018 and 2017, respectively. |
During the first three months of 2018, we recognized net realized investment losses of $15.2 million, which were comprised of: (i) $.5 million of net gains from the sales of investments; (ii) a $12.5 million unfavorable change in the fair value of equity securities; (iii) the decrease in fair value of certain fixed maturity investments with embedded derivatives of $.5 million; and (iv) the decrease in fair value of embedded derivatives related to a modified coinsurance agreement of $2.7 million.
During the first three months of 2017, we recognized net realized investment gains of $7.9 million, which were comprised of: (i) $12.9 million of net gains from the sales of investments; (ii) the increase in fair value of certain fixed maturity investments with embedded derivatives of $2.7 million; (iii) the increase in fair value of embedded derivatives related to a
12
CNO FINANCIAL GROUP, INC. AND SUBSIDIARIES
Notes to Consolidated Financial Statements
(unaudited)
___________________
modified coinsurance agreement of $.7 million; and (iv) $8.4 million of writedowns of investments for other than temporary declines in fair value recognized through net income.
Our fixed maturity investments are generally purchased in the context of various long-term strategies, including funding insurance liabilities, so we do not generally seek to generate short-term realized gains through the purchase and sale of such securities. In certain circumstances, including those in which securities are selling at prices which exceed our view of their underlying economic value, or when it is possible to reinvest the proceeds to better meet our long-term asset-liability objectives, we may sell certain securities.
During the first three months of 2018, the $7.7 million of gross realized losses on sales of $444.3 million of fixed maturity securities, available for sale included: (i) $3.7 million related to various corporate securities; (ii) $2.0 million related to commercial mortgage-backed securities; and (iii) $2.0 million related to various other investments. Securities are generally sold at a loss following unforeseen issuer-specific events or conditions or shifts in perceived relative values. These reasons include but are not limited to: (i) changes in the investment environment; (ii) expectation that the market value could deteriorate; (iii) our desire to reduce our exposure to an asset class, an issuer or an industry; (iv) prospective or actual changes in credit quality; or (v) changes in expected portfolio cash flows.
There were no impairment losses recognized in the first three months of 2018.
During the first three months of 2017, we recognized $8.4 million of impairment losses recorded in earnings which included: (i) $3.2 million of writedowns on fixed maturities of a single issuer in the energy sector; and (ii) $5.2 million of writedowns related to a real estate investment.
We regularly evaluate all of our investments with unrealized losses for possible impairment. Our assessment of whether unrealized losses are "other than temporary" requires significant judgment. Factors considered include: (i) the extent to which fair value is less than the cost basis; (ii) the length of time that the fair value has been less than cost; (iii) whether the unrealized loss is event driven, credit-driven or a result of changes in market interest rates or risk premium; (iv) the near-term prospects for specific events, developments or circumstances likely to affect the value of the investment; (v) the investment's rating and whether the investment is investment-grade and/or has been downgraded since its purchase; (vi) whether the issuer is current on all payments in accordance with the contractual terms of the investment and is expected to meet all of its obligations under the terms of the investment; (vii) whether we intend to sell the investment or it is more likely than not that circumstances will require us to sell the investment before recovery occurs; (viii) the underlying current and prospective asset and enterprise values of the issuer and the extent to which the recoverability of the carrying value of our investment may be affected by changes in such values; (ix) projections of, and unfavorable changes in, cash flows on structured securities including mortgage-backed and asset-backed securities; (x) our best estimate of the value of any collateral; and (xi) other objective and subjective factors.
Future events may occur, or additional information may become available, which may necessitate future realized losses in our portfolio. Significant losses could have a material adverse effect on our consolidated financial statements in future periods.
Impairment losses on equity securities are recognized in net income. The manner in which impairment losses on fixed maturity securities, available for sale, are recognized in the financial statements is dependent on the facts and circumstances related to the specific security. If we intend to sell a security or it is more likely than not that we would be required to sell a security before the recovery of its amortized cost, the security is other-than-temporarily impaired and the full amount of the impairment is recognized as a loss through earnings. If we do not expect to recover the amortized cost basis, we do not plan to sell the security, and if it is not more likely than not that we would be required to sell a security before the recovery of its amortized cost, less any current period credit loss, the recognition of the other-than-temporary impairment is bifurcated. We recognize the credit loss portion in net income and the noncredit loss portion in accumulated other comprehensive income.
We estimate the amount of the credit loss component of a fixed maturity security impairment as the difference between amortized cost and the present value of the expected cash flows of the security. The present value is determined using the best estimate of future cash flows discounted at the effective interest rate implicit to the security at the date of purchase or the current yield to accrete an asset-backed or floating-rate security. The methodology and assumptions for establishing the best estimate of future cash flows vary depending on the type of security.
13
CNO FINANCIAL GROUP, INC. AND SUBSIDIARIES
Notes to Consolidated Financial Statements
(unaudited)
___________________
For most structured securities, cash flow estimates are based on bond-specific facts and circumstances that may include collateral characteristics, expectations of delinquency and default rates, loss severity, prepayment speeds and structural support, including overcollateralization, excess spread, subordination and guarantees. For corporate bonds, cash flow estimates are derived from scenario-based outcomes of expected corporate restructurings or the disposition of assets using bond-specific facts and circumstances. The previous amortized cost basis less the impairment recognized in net income becomes the security's new cost basis. We accrete the new cost basis to the estimated future cash flows over the expected remaining life of the security, except when the security is in default or considered nonperforming.
The remaining noncredit impairment, which is recorded in accumulated other comprehensive income, is the difference between the security's estimated fair value and our best estimate of future cash flows discounted at the effective interest rate prior to impairment. The remaining noncredit impairment typically represents changes in the market interest rates, current market liquidity and risk premiums. As of March 31, 2018, other-than-temporary impairments included in accumulated other comprehensive income totaled $.9 million (before taxes and related amortization).
The following table summarizes the amount of credit losses recognized in earnings on fixed maturity securities, available for sale, held at the beginning of the period, for which a portion of the other-than-temporary impairment was also recognized in accumulated other comprehensive income for the three months ended March 31, 2018 and 2017 (dollars in millions):
Three months ended | |||||||
March 31, | |||||||
2018 | 2017 | ||||||
Credit losses on fixed maturity securities, available for sale, beginning of period | $ | (2.8 | ) | $ | (5.5 | ) | |
Add: credit losses on other-than-temporary impairments not previously recognized | — | — | |||||
Less: credit losses on securities sold | — | .1 | |||||
Less: credit losses on securities impaired due to intent to sell (a) | — | — | |||||
Add: credit losses on previously impaired securities | — | — | |||||
Less: increases in cash flows expected on previously impaired securities | — | — | |||||
Credit losses on fixed maturity securities, available for sale, end of period | $ | (2.8 | ) | $ | (5.4 | ) | |
__________
(a) | Represents securities for which the amount previously recognized in accumulated other comprehensive income was recognized in earnings because we intend to sell the security or we more likely than not will be required to sell the security before recovery of its amortized cost basis. |
Gross Unrealized Investment Losses
Our investment strategy is to maximize, over a sustained period and within acceptable parameters of quality and risk, investment income and total investment return through active strategic asset allocation and investment management. Accordingly, we may sell securities at a gain or a loss to enhance the projected total return of the portfolio as market opportunities change, to reflect changing perceptions of risk, or to better match certain characteristics of our investment portfolio with the corresponding characteristics of our insurance liabilities.
14
CNO FINANCIAL GROUP, INC. AND SUBSIDIARIES
Notes to Consolidated Financial Statements
(unaudited)
___________________
The following table summarizes the gross unrealized losses and fair values of our investments with unrealized losses that are not deemed to be other-than-temporarily impaired, aggregated by investment category and length of time that such securities have been in a continuous unrealized loss position, at March 31, 2018 (dollars in millions):
Less than 12 months | 12 months or greater | Total | ||||||||||||||||||||||
Description of securities | Fair value | Unrealized losses | Fair value | Unrealized losses | Fair value | Unrealized losses | ||||||||||||||||||
United States Treasury securities and obligations of United States government corporations and agencies | $ | 18.4 | $ | (.3 | ) | $ | 12.6 | $ | — | $ | 31.0 | $ | (.3 | ) | ||||||||||
States and political subdivisions | 61.8 | (1.2 | ) | 14.5 | (.3 | ) | 76.3 | (1.5 | ) | |||||||||||||||
Debt securities issued by foreign governments | 39.4 | (1.6 | ) | 8.0 | (.2 | ) | 47.4 | (1.8 | ) | |||||||||||||||
Corporate securities | 2,594.2 | (70.8 | ) | 299.0 | (29.5 | ) | 2,893.2 | (100.3 | ) | |||||||||||||||
Asset-backed securities | 539.5 | (5.4 | ) | 67.9 | (2.3 | ) | 607.4 | (7.7 | ) | |||||||||||||||
Collateralized debt obligations | 74.4 | (.2 | ) | — | — | 74.4 | (.2 | ) | ||||||||||||||||
Commercial mortgage-backed securities | 310.4 | (4.4 | ) | 201.0 | (12.4 | ) | 511.4 | (16.8 | ) | |||||||||||||||
Mortgage pass-through securities | .1 | — | — | — | .1 | — | ||||||||||||||||||
Collateralized mortgage obligations | 77.0 | (1.6 | ) | 2.4 | — | 79.4 | (1.6 | ) | ||||||||||||||||
Total fixed maturities, available for sale | $ | 3,715.2 | $ | (85.5 | ) | $ | 605.4 | $ | (44.7 | ) | $ | 4,320.6 | $ | (130.2 | ) | |||||||||
The following table summarizes the gross unrealized losses and fair values of our investments with unrealized losses that are not deemed to be other-than-temporarily impaired, aggregated by investment category and length of time that such securities have been in a continuous unrealized loss position, at December 31, 2017 (dollars in millions):
Less than 12 months | 12 months or greater | Total | ||||||||||||||||||||||
Description of securities | Fair value | Unrealized losses | Fair value | Unrealized losses | Fair value | Unrealized losses | ||||||||||||||||||
United States Treasury securities and obligations of United States government corporations and agencies | $ | 28.2 | $ | (.2 | ) | $ | .7 | $ | — | $ | 28.9 | $ | (.2 | ) | ||||||||||
States and political subdivisions | 18.3 | (.1 | ) | 14.9 | (.3 | ) | 33.2 | (.4 | ) | |||||||||||||||
Debt securities issued by foreign governments | 7.7 | (.1 | ) | 5.4 | (.1 | ) | 13.1 | (.2 | ) | |||||||||||||||
Corporate securities | 470.5 | (6.8 | ) | 359.7 | (20.2 | ) | 830.2 | (27.0 | ) | |||||||||||||||
Asset-backed securities | 601.4 | (2.0 | ) | 122.2 | (2.1 | ) | 723.6 | (4.1 | ) | |||||||||||||||
Collateralized debt obligations | 3.0 | — | — | — | 3.0 | — | ||||||||||||||||||
Commercial mortgage-backed securities | 276.8 | (1.7 | ) | 218.2 | (8.6 | ) | 495.0 | (10.3 | ) | |||||||||||||||
Collateralized mortgage obligations | 20.5 | (.2 | ) | 11.5 | (.1 | ) | 32.0 | (.3 | ) | |||||||||||||||
Total fixed maturities, available for sale | $ | 1,426.4 | $ | (11.1 | ) | $ | 732.6 | $ | (31.4 | ) | $ | 2,159.0 | $ | (42.5 | ) | |||||||||
Equity securities | $ | 58.7 | $ | (1.7 | ) | $ | 21.2 | $ | (1.3 | ) | $ | 79.9 | $ | (3.0 | ) | |||||||||
Based on management's current assessment of investments with unrealized losses at March 31, 2018, the Company believes the issuers of the securities will continue to meet their obligations. While we do not have the intent to sell securities
15
CNO FINANCIAL GROUP, INC. AND SUBSIDIARIES
Notes to Consolidated Financial Statements
(unaudited)
___________________
with unrealized losses and it is not more likely than not that we will be required to sell securities with unrealized losses prior to their anticipated recovery, our intent on an individual security may change, based upon market or other unforeseen developments. In such instances, if a loss is recognized from a sale subsequent to a balance sheet date due to these unexpected developments, the loss is recognized in the period in which we had the intent to sell the security before its anticipated recovery.
EARNINGS PER SHARE
A reconciliation of net income and shares used to calculate basic and diluted earnings per share is as follows (dollars in millions and shares in thousands):
Three months ended | |||||||
March 31, | |||||||
2018 | 2017 | ||||||
Net income for basic and diluted earnings per share | $ | 84.3 | $ | 62.3 | |||
Shares: | |||||||
Weighted average shares outstanding for basic earnings per share | 167,060 | 173,431 | |||||
Effect of dilutive securities on weighted average shares: | |||||||
Stock options, restricted stock and performance units | 2,617 | 1,634 | |||||
Weighted average shares outstanding for diluted earnings per share | 169,677 | 175,065 | |||||
Basic earnings per common share is computed by dividing net income by the weighted average number of common shares outstanding for the period. Restricted shares (including our performance units) are not included in basic earnings per share until vested. Diluted earnings per share reflect the potential dilution that could occur if outstanding stock options were exercised and restricted stock was vested. The dilution from options and restricted shares is calculated using the treasury stock method. Under this method, we assume the proceeds from the exercise of the options (or the unrecognized compensation expense with respect to restricted stock and performance units) will be used to purchase shares of our common stock at the average market price during the period, reducing the dilutive effect of the exercise of the options (or the vesting of the restricted stock and performance units).
BUSINESS SEGMENTS
The Company manages its business through the following operating segments: Bankers Life, Washington National and Colonial Penn, which are defined on the basis of product distribution; and corporate operations, comprised of holding company activities and certain noninsurance company businesses. We also have a long-term care in run-off segment which is comprised of certain long-term care business that was recaptured in 2016 due to the termination of certain reinsurance agreements.
We measure segment performance by excluding net realized investment gains (losses), fair value changes in embedded derivative liabilities (net of related amortization), fair value changes related to the agent deferred compensation plan, income taxes and other non-operating items consisting primarily of earnings attributable to variable interest entities ("VIEs") ("pre-tax operating earnings") because we believe that this performance measure is a better indicator of the ongoing business and trends in our business. Our primary investment focus is on investment income to support our liabilities for insurance products as opposed to the generation of net realized investment gains (losses), and a long-term focus is necessary to maintain profitability over the life of the business.
The net realized investment gains (losses), fair value changes in embedded derivative liabilities (net of related amortization), fair value changes related to the agent deferred compensation plan and other non-operating items consisting primarily of earnings attributable to VIEs depend on market conditions or represent unusual items that do not necessarily relate to the underlying business of our segments. Net realized investment gains (losses) and fair value changes in embedded derivative liabilities (net of related amortization) may affect future earnings levels since our underlying business is long-term in
16
CNO FINANCIAL GROUP, INC. AND SUBSIDIARIES
Notes to Consolidated Financial Statements
(unaudited)
___________________
nature and changes in our investment portfolio may impact our ability to earn the assumed interest rates needed to maintain the profitability of our business.
Operating information by segment was as follows (dollars in millions):
Three months ended | |||||||
March 31, | |||||||
2018 | 2017 | ||||||
Revenues: | |||||||
Bankers Life: | |||||||
Insurance policy income: | |||||||
Annuities | $ | 4.6 | $ | 6.0 | |||
Health | 302.2 | 311.6 | |||||
Life | 103.9 | 101.5 | |||||
Net investment income (a) | 237.9 | 272.9 | |||||
Fee revenue and other income (a) | 19.6 | 10.6 | |||||
Total Bankers Life revenues | 668.2 | 702.6 | |||||
Washington National: | |||||||
Insurance policy income: | |||||||
Annuities | .5 | .6 | |||||
Health | 163.8 | 159.8 | |||||
Life | 6.7 | 6.7 | |||||
Net investment income (a) | 65.4 | 67.4 | |||||
Fee revenue and other income (a) | .2 | .3 | |||||
Total Washington National revenues | 236.6 | 234.8 | |||||
Colonial Penn: | |||||||
Insurance policy income: | |||||||
Health | .5 | .6 | |||||
Life | 73.6 | 72.4 | |||||
Net investment income (a) | 11.0 | 10.9 | |||||
Fee revenue and other income (a) | .5 | .2 | |||||
Total Colonial Penn revenues | 85.6 | 84.1 | |||||
Long-term care in run-off: | |||||||
Insurance policy income - health | 4.1 | 4.6 | |||||
Net investment income (a) | 8.4 | 9.7 | |||||
Total Long-term care in run-off revenues | 12.5 | 14.3 | |||||
Corporate operations: | |||||||
Net investment income | 1.2 | 10.4 | |||||
Fee and other income | 1.8 | 2.4 | |||||
Total corporate revenues | 3.0 | 12.8 | |||||
Total revenues | $ | 1,005.9 | $ | 1,048.6 | |||
(continued on next page)
17
CNO FINANCIAL GROUP, INC. AND SUBSIDIARIES
Notes to Consolidated Financial Statements
(unaudited)
___________________
(continued from previous page)
Three months ended | |||||||
March 31, | |||||||
2018 | 2017 | ||||||
Expenses: | |||||||
Bankers Life: | |||||||
Insurance policy benefits | $ | 411.1 | $ | 451.2 | |||
Amortization | 47.0 | 46.3 | |||||
Interest expense on investment borrowings | 6.1 | 4.2 | |||||
Other operating costs and expenses | 114.5 | 111.2 | |||||
Total Bankers Life expenses | 578.7 | 612.9 | |||||
Washington National: | |||||||
Insurance policy benefits | 137.7 | 146.7 | |||||
Amortization | 14.5 | 14.3 | |||||
Interest expense on investment borrowings | 2.1 | 1.3 | |||||
Other operating costs and expenses | 48.0 | 49.0 | |||||
Total Washington National expenses | 202.3 | 211.3 | |||||
Colonial Penn: | |||||||
Insurance policy benefits | 56.7 | 52.7 | |||||
Amortization | 4.6 | 4.0 | |||||
Interest expense on investment borrowings | .3 | .2 | |||||
Other operating costs and expenses | 25.5 | 27.5 | |||||
Total Colonial Penn expenses | 87.1 | 84.4 | |||||
Long-term care in run-off: | |||||||
Insurance policy benefits | 12.0 | 13.2 | |||||
Other operating costs and expenses | .5 | .7 | |||||
Total Long-term care in run-off expenses | 12.5 | 13.9 | |||||
Corporate operations: | |||||||
Interest expense on corporate debt | 11.9 | 11.5 | |||||
Other operating costs and expenses | 18.5 | 21.7 | |||||
Total corporate expenses | 30.4 | 33.2 | |||||
Total expenses | 911.0 | 955.7 | |||||
Pre-tax operating earnings by segment: | |||||||
Bankers Life | 89.5 | 89.7 | |||||
Washington National | 34.3 | 23.5 | |||||
Colonial Penn | (1.5 | ) | (.3 | ) | |||
Long-term care in run-off | — | .4 | |||||
Corporate operations | (27.4 | ) | (20.4 | ) | |||
Pre-tax operating earnings | $ | 94.9 | $ | 92.9 | |||
___________________
(a) | It is not practicable to provide additional components of revenue by product or services. |
18
CNO FINANCIAL GROUP, INC. AND SUBSIDIARIES
Notes to Consolidated Financial Statements
(unaudited)
___________________
A reconciliation of segment revenues and expenses to consolidated revenues and expenses and net income (loss) is as follows (dollars in millions):
Three months ended | |||||||
March 31, | |||||||
2018 | 2017 | ||||||
Total segment revenues | $ | 1,005.9 | $ | 1,048.6 | |||
Net realized investment gains (losses) | (15.2 | ) | 7.9 | ||||
Revenues related to VIEs | 17.1 | 14.2 | |||||
Consolidated revenues | 1,007.8 | 1,070.7 | |||||
Total segment expenses | 911.0 | 955.7 | |||||
Insurance policy benefits - fair value changes in embedded derivative liabilities | (30.9 | ) | 5.5 | ||||
Amortization related to fair value changes in embedded derivative liabilities | 5.8 | (1.1 | ) | ||||
Expenses related to VIEs | 13.8 | 13.9 | |||||
Consolidated expenses | 899.7 | 974.0 | |||||
Income before tax | 108.1 | 96.7 | |||||
Income tax expense on period income | 23.8 | 34.4 | |||||
Net income | $ | 84.3 | $ | 62.3 | |||
ACCOUNTING FOR DERIVATIVES
Our freestanding and embedded derivatives, which are not designated as hedging instruments, are held at fair value and are summarized as follows (dollars in millions):
Fair value | ||||||||
March 31, 2018 | December 31, 2017 | |||||||
Assets: | ||||||||
Other invested assets: | ||||||||
Fixed index call options | $ | 141.5 | $ | 170.2 | ||||
Reinsurance receivables | (4.1 | ) | (1.4 | ) | ||||
Total assets | $ | 137.4 | $ | 168.8 | ||||
Liabilities: | ||||||||
Future policy benefits: | ||||||||
Fixed index products | $ | 1,315.4 | $ | 1,334.8 | ||||
Total liabilities | $ | 1,315.4 | $ | 1,334.8 | ||||
Our fixed index annuity products provide a guaranteed minimum rate of return and a higher potential return that is based on a percentage (the "participation rate") of the amount of increase in the value of a particular index, such as the Standard & Poor's 500 Index, over a specified period. Typically, on each policy anniversary date, a new index period begins. We are generally able to change the participation rate at the beginning of each index period during a policy year, subject to contractual minimums. The Company accounts for the options attributed to the policyholder for the estimated life of the contract as embedded derivatives. These accounting requirements often create volatility in the earnings from these products. We typically buy call options (including call spreads) referenced to the applicable indices in an effort to offset or hedge potential increases to
19
CNO FINANCIAL GROUP, INC. AND SUBSIDIARIES
Notes to Consolidated Financial Statements
(unaudited)
___________________
policyholder benefits resulting from increases in the particular index to which the policy's return is linked. The notional amount of these options was $3.0 billion at both March 31, 2018 and December 31, 2017.
From time to time, we utilize United States Treasury interest rate futures primarily to hedge interest rate risk related to anticipated mortgage loan transactions.
We are required to establish an embedded derivative related to a modified coinsurance agreement pursuant to which we assume the risks of a block of health insurance business. The embedded derivative represents the mark-to-market adjustment for approximately $125 million in underlying investments held by the ceding reinsurer.
We purchase certain fixed maturity securities that contain embedded derivatives that are required to be held at fair value on the consolidated balance sheet. We have elected the fair value option to carry the entire security at fair value with changes in fair value recognized in net income.
The following table provides the pre-tax gains (losses) recognized in net income for derivative instruments, which are not designated as hedges for the periods indicated (dollars in millions):
Three months ended | ||||||||
March 31, | ||||||||
2018 | 2017 | |||||||
Net investment income (loss) from policyholder and other special-purpose portfolios: | ||||||||
Fixed index call options | $ | (5.6 | ) | $ | 44.5 | |||
Net realized gains (losses): | ||||||||
Embedded derivative related to modified coinsurance agreement | (2.7 | ) | .7 | |||||
Insurance policy benefits: | ||||||||
Embedded derivative related to fixed index annuities | 37.0 | 2.3 | ||||||
Total | $ | 28.7 | $ | 47.5 | ||||
Derivative Counterparty Risk
If the counterparties to the call options fail to meet their obligations, we may recognize a loss. We limit our exposure to such a loss by diversifying among several counterparties believed to be strong and creditworthy. At March 31, 2018, all of our counterparties were rated "A-" or higher by S&P Global Ratings ("S&P").
We also enter into exchange-traded interest rate future contracts. The contracts are marked to market and margined on a daily basis. The Company has minimal exposure to credit-related losses in the event of nonperformance.
The Company and its subsidiaries are parties to master netting arrangements with its counterparties related to entering into various derivative contracts. Exchange-traded derivatives require margin accounts which we offset.
20
CNO FINANCIAL GROUP, INC. AND SUBSIDIARIES
Notes to Consolidated Financial Statements
(unaudited)
___________________
The following table summarizes information related to derivatives with master netting arrangements or collateral as of March 31, 2018 and December 31, 2017 (dollars in millions):
Gross amounts not offset in the balance sheet | |||||||||||||||||||||||||
Gross amounts recognized | Gross amounts offset in the balance sheet | Net amounts of assets presented in the balance sheet | Financial instruments | Cash collateral received | Net amount | ||||||||||||||||||||
March 31, 2018: | |||||||||||||||||||||||||
Fixed index call options | $ | 141.5 | $ | — | $ | 141.5 | $ | — | $ | — | $ | 141.5 | |||||||||||||
December 31, 2017: | |||||||||||||||||||||||||
Fixed index call options | 170.2 | — | 170.2 | — | — | 170.2 | |||||||||||||||||||
REINSURANCE
The cost of reinsurance ceded totaled $24.5 million and $26.3 million in the first quarters of 2018 and 2017, respectively. We deduct this cost from insurance policy income. Reinsurance recoveries netted against insurance policy benefits totaled $23.4 million and $24.1 million in the first quarters of 2018 and 2017, respectively.
From time to time, we assume insurance from other companies. Any costs associated with the assumption of insurance are amortized consistent with the method used to amortize deferred acquisition costs. Reinsurance premiums assumed totaled $7.2 million and $8.0 million in the first quarters of 2018 and 2017, respectively. Insurance policy benefits related to reinsurance assumed totaled $9.3 million and $12.0 million in the first quarters of 2018 and 2017, respectively.
INCOME TAXES
The Company's interim tax expense is based upon the estimated annual effective tax rate for the respective period. Under authoritative guidance, certain items are required to be excluded from the estimated annual effective tax rate calculation. Such items include changes in judgment about the realizability of deferred tax assets resulting from changes in projections of income expected to be available in future years, and items deemed to be unusual, infrequent, or that can not be reliably estimated. In these cases, the actual tax expense or benefit applicable to that item is treated discretely and is reported in the same period as the related item. The components of income tax expense are as follows (dollars in millions):
Three months ended | |||||||
March 31, | |||||||
2018 | 2017 | ||||||
Current tax expense | $ | 5.3 | $ | 20.6 | |||
Deferred tax expense | 18.5 | 13.8 | |||||
Income tax expense calculated based on estimated annual effective tax rate | $ | 23.8 | $ | 34.4 | |||
On December 22, 2017, President Trump signed into law the "Tax Cuts and Jobs Act" (the "Tax Reform Act") which enacted a broad range of changes to the Internal Revenue Code (the "Code") including individual and corporate reforms and numerous changes to U.S. international tax provisions. The Tax Reform Act reduces the corporate tax rate to 21 percent from 35 percent effective January 1, 2018, and makes significant changes to the taxation of life insurance companies. Among other things, the Tax Reform Act modifies the computation of life insurance reserves, increases the capitalization rate and extends the amortization period for policy acquisition costs, imposes limitations on the deductibility of performance-based compensation to "covered employees" and interest expense, and allows for the expensing of certain capital expenditures. For net operating losses ("NOLs") arising after December 31, 2017, the Tax Reform Act limits the ability to utilize NOL carryforwards to 80% of taxable income. In addition, NOLs arising after 2017 can be carried forward indefinitely, but carryback is prohibited. As a
21
CNO FINANCIAL GROUP, INC. AND SUBSIDIARIES
Notes to Consolidated Financial Statements
(unaudited)
___________________
result of the reduction in the federal corporate income tax rate, we reduced the value of our net deferred tax assets by $172.5 million (net of the reduction in the valuation allowance for deferred tax assets) which was recorded as additional income tax expense in the fourth quarter of 2017.
The $172.5 million adjustment to our net deferred tax assets was a provisional amount as defined in the SEC's Staff Accounting Bulletin No. 118 ("SAB 118"), issued in December 2017 to address complexities in completing the calculations resulting from the Tax Reform Act. Although we were able to make a reasonable estimate of the impact of the Tax Reform Act based on the information available, we have not analyzed the calculations in sufficient detail to complete the accounting process, including the analysis of the calculations of life insurance tax reserves and future taxable income used to estimate the deferred tax valuation allowance. SAB 118 provides guidance on accounting for the effects of the Tax Reform Act when our accounting process is incomplete but we are able to determine a reasonable estimate. A final determination is required to be made within a measurement period not to extend beyond one year from the enactment date of the Tax Reform Act. We continue to analyze our estimate of the impact of the Tax Reform Act and expect the process to be completed in the fourth quarter of 2018.
A reconciliation of the U.S. statutory corporate tax rate to the estimated annual effective rate, before discrete items, reflected in the consolidated statement of operations is as follows:
Three months ended | |||||
March 31, | |||||
2018 | 2017 | ||||
U.S. statutory corporate rate | 21.0 | % | 35.0 | % | |
Non-taxable income and nondeductible benefits, net | .2 | (1.1 | ) | ||
State taxes | .8 | 1.7 | |||
Estimated annual effective tax rate | 22.0 | % | 35.6 | % | |
The components of the Company's income tax assets and liabilities are summarized below (dollars in millions):
March 31, 2018 | December 31, 2017 | ||||||
Deferred tax assets: | |||||||
Net federal operating loss carryforwards | $ | 484.2 | $ | 489.6 | |||
Net state operating loss carryforwards | 9.8 | 9.3 | |||||
Investments | .1 | 4.3 | |||||
Insurance liabilities | 402.4 | 415.8 | |||||
Other | 44.3 | 48.9 | |||||
Gross deferred tax assets | 940.8 | 967.9 | |||||
Deferred tax liabilities: | |||||||
Present value of future profits and deferred acquisition costs | (160.6 | ) | (165.4 | ) | |||
Accumulated other comprehensive income | (248.1 | ) | (337.2 | ) | |||
Gross deferred tax liabilities | (408.7 | ) | (502.6 | ) | |||
Net deferred tax assets before valuation allowance | 532.1 | 465.3 | |||||
Valuation allowance | (89.1 | ) | (89.1 | ) | |||
Net deferred tax assets | 443.0 | 376.2 | |||||
Current income taxes prepaid (accrued) | 7.4 | (9.3 | ) | ||||
Income tax assets, net | $ | 450.4 | $ | 366.9 | |||
22
CNO FINANCIAL GROUP, INC. AND SUBSIDIARIES
Notes to Consolidated Financial Statements
(unaudited)
___________________
Our income tax expense includes deferred income taxes arising from temporary differences between the financial reporting and tax bases of assets and liabilities and NOLs. Deferred tax assets and liabilities are measured using enacted tax rates expected to apply in the years in which temporary differences are expected to be recovered or paid. The effect of a change in tax rates on deferred tax assets and liabilities is recognized in earnings in the period when the changes are enacted.
A reduction of the net carrying amount of deferred tax assets by establishing a valuation allowance is required if, based on the available evidence, it is more likely than not that such assets will not be realized. In assessing the need for a valuation allowance, all available evidence, both positive and negative, shall be considered to determine whether, based on the weight of that evidence, a valuation allowance for deferred tax assets is needed. This assessment requires significant judgment and considers, among other matters, the nature, frequency and severity of current and cumulative losses, forecasts of future profitability, the duration of carryforward periods, our experience with operating loss and tax credit carryforwards expiring unused, and tax planning strategies. We evaluate the need to establish a valuation allowance for our deferred income tax assets on an ongoing basis. The realization of our deferred tax assets depends upon generating sufficient future taxable income of the appropriate type during the periods in which our temporary differences become deductible and before our NOLs expire.
Based on our assessment, it appears more likely than not that $443.0 million of our net deferred tax assets of $532.1 million will be realized through future taxable earnings. Accordingly, we have established a deferred tax valuation allowance of $89.1 million at March 31, 2018 ($77.4 million of which relates to our net federal operating loss carryforwards and $11.7 million relates to state operating loss carryforwards). We will continue to assess the need for a valuation allowance in the future. If future results are less than projected, an increase to the valuation allowance may be required to reduce the deferred tax asset, which could have a material impact on our results of operations in the period in which it is recorded.
We use a deferred tax valuation model to assess the need for a valuation allowance. Our model is adjusted to reflect changes in our projections of future taxable income including changes resulting from the Tax Reform Act, investment strategies, the impact of the sale or reinsurance of business and the recapture of business previously ceded. Our estimates of future taxable income are based on evidence we consider to be objective and verifiable.
Our projection of future taxable income for purposes of determining the valuation allowance is based on our adjusted average annual taxable income which is assumed to increase by 3 percent for the next five years, and level taxable income is assumed thereafter. In the projections used for our analysis, our adjusted average taxable income of approximately $345 million consisted of $85 million of non-life taxable income and $260 million of life taxable income.
Recovery of our deferred tax asset is dependent on achieving the level of future taxable income projected in our deferred tax valuation model and failure to do so could result in an increase in the valuation allowance in a future period. Any future increase in the valuation allowance may result in additional income tax expense and reduce shareholders' equity, and such an increase could have a significant impact upon our earnings in the future.
The Code limits the extent to which losses realized by a non-life entity (or entities) may offset income from a life insurance company (or companies) to the lesser of: (i) 35 percent of the income of the life insurance company; or (ii) 35 percent of the total loss of the non-life entities (including NOLs of the non-life entities). There is no similar limitation on the extent to which losses realized by a life insurance entity (or entities) may offset income from a non-life entity (or entities). This limitation is the primary reason a valuation allowance for NOLs is required.
Section 382 of the Code imposes limitations on a corporation's ability to use its NOLs when the company undergoes a 50 percent ownership change over a three year period. Future transactions and the timing of such transactions could cause an ownership change for Section 382 income tax purposes. Such transactions may include, but are not limited to, additional repurchases under our securities repurchase program, issuances of common stock and acquisitions or sales of shares of CNO stock by certain holders of our shares, including persons who have held, currently hold or may accumulate in the future five percent or more of our outstanding common stock for their own account. Many of these transactions are beyond our control. If an additional ownership change were to occur for purposes of Section 382, we would be required to calculate an annual restriction on the use of our NOLs to offset future taxable income. The annual restriction would be calculated based upon the value of CNO's equity at the time of such ownership change, multiplied by a federal long-term tax exempt rate (2.18 percent at March 31, 2018), and the annual restriction could limit our ability to use a substantial portion of our NOLs to offset future taxable income. We regularly monitor ownership change (as calculated for purposes of Section 382) and, as of March 31,
23
CNO FINANCIAL GROUP, INC. AND SUBSIDIARIES
Notes to Consolidated Financial Statements
(unaudited)
___________________
2018, we were below the 50 percent ownership change level that would trigger further impairment of our ability to utilize our NOLs.
As of March 31, 2018, we had $2.3 billion of federal NOLs (all of which were non-life NOLs). The following table summarizes the expiration dates of our loss carryforwards (dollars in millions):
Net operating loss | ||||
Year of expiration | carryforwards | |||
2023 | $ | 1,719.1 | ||
2025 | 85.2 | |||
2026 | 149.9 | |||
2027 | 10.8 | |||
2028 | 80.3 | |||
2029 | 213.2 | |||
2030 | .3 | |||
2031 | .2 | |||
2032 | 44.4 | |||
2033 | .6 | |||
2034 | .9 | |||
2035 | .8 | |||
Total federal NOLs | $ | 2,305.7 | ||
We also had deferred tax assets related to NOLs for state income taxes of $9.8 million and $9.3 million at March 31, 2018 and December 31, 2017, respectively. The related state NOLs are available to offset future state taxable income in certain states through 2025.
All of the life NOLs were utilized by December 31, 2016. Accordingly, we began making estimated federal tax payments equal to the prescribed federal tax rate applied to 65 percent of our life insurance company taxable income due to the limitations on the extent to which we can use non-life NOLs to offset life insurance company taxable income. Under current law, we will continue to pay tax on 65 percent of our life insurance company taxable income until all non-life NOLs are utilized or expire.
The Internal Revenue Service ("IRS") is conducting an examination of 2013 through 2014. In connection with this exam, we have agreed to extend the statute of limitation for 2013 and 2014 through December 31, 2018. The Company’s various state income tax returns are generally open for tax years beginning in 2014, based on individual state statutes of limitation. Generally, for tax years which generate NOLs, capital losses or tax credit carryforwards, the statute remains open until the expiration of the statute of limitations for the tax year in which such carryforwards are utilized. The outcome of the tax audit cannot be predicted with certainty. If the Company’s tax audit is not resolved in a manner consistent with management’s expectations, the Company may be required to adjust its provision for income taxes.
24
CNO FINANCIAL GROUP, INC. AND SUBSIDIARIES
Notes to Consolidated Financial Statements
(unaudited)
___________________
NOTES PAYABLE - DIRECT CORPORATE OBLIGATIONS
The following notes payable were direct corporate obligations of the Company as of March 31, 2018 and December 31, 2017 (dollars in millions):
March 31, 2018 | December 31, 2017 | ||||||
4.500% Senior Notes due May 2020 | $ | 325.0 | $ | 325.0 | |||
5.250% Senior Notes due May 2025 | 500.0 | 500.0 | |||||
Revolving Credit Agreement (as defined below) | 100.0 | 100.0 | |||||
Unamortized debt issue costs | (9.9 | ) | (10.4 | ) | |||
Direct corporate obligations | $ | 915.1 | $ | 914.6 | |||
Revolving Credit Agreement
On May 19, 2015, the Company entered into a $150.0 million four-year unsecured revolving credit agreement with KeyBank National Association, as administrative agent (the "Agent"), and the lenders from time to time party thereto. On May 19, 2015, the Company made an initial drawing of $100.0 million under the Revolving Credit Agreement, resulting in $50.0 million available for additional borrowings. On October 13, 2017, the Company entered into an amendment and restatement agreement (the "Amendment Agreement") with respect to its revolving credit agreement (as amended by the Amendment Agreement, the "Revolving Credit Agreement"). The Amendment Agreement, among other things, increased the total commitments available under the revolving credit facility from $150.0 million to $250.0 million, increased the aggregate amount of additional incremental loans the Company may incur from $50.0 million to $100.0 million and extended the maturity date of the revolving credit facility from May 19, 2019 to the earlier of October 13, 2022 and the date that is six months prior to the maturity date of the 2020 Notes, which is November 30, 2019.
The interest rates with respect to loans under the Revolving Credit Agreement are based on, at the Company's option, a floating base rate (defined as a per annum rate equal to the highest of: (i) the federal funds rate plus 0.50%; (ii) the "prime rate" of the Agent; and (iii) the eurodollar rate for a one-month interest period plus an applicable margin based on the Company's unsecured debt rating), or a eurodollar rate plus an applicable margin based on the Company's unsecured debt rating. The margins under the Revolving Credit Agreement range from 1.375% to 2.125%, in the case of loans at the eurodollar rate, and 0.375% to 1.125%, in the case of loans at the base rate. At March 31, 2018, the interest rate on the amounts outstanding under the Revolving Credit Agreement was 3.75 percent. In addition, the daily average undrawn portion of the Revolving Credit Agreement accrues a commitment fee payable quarterly in arrears. The applicable margin for, and the commitment fee applicable to, the Revolving Credit Agreement, will be adjusted from time to time pursuant to a ratings based pricing grid.
The Revolving Credit Agreement requires the Company to maintain (each as calculated in accordance with the Revolving Credit Agreement): (i) a debt to total capitalization ratio of not more than 35.0 percent (such ratio was 20.1 percent at March 31, 2018); (ii) an aggregate ratio of total adjusted capital to company action level risk-based capital for the Company's insurance subsidiaries of not less than 250 percent (such ratio was estimated to be 427 percent at March 31, 2018); and (iii) a minimum consolidated net worth of not less than the sum of (x) $2,674 million plus (y) 50.0% of the net equity proceeds received by the Company from the issuance and sale of equity interests in the Company (the Company's consolidated net worth was $3,722.9 million at March 31, 2018 compared to the minimum requirement of $2,685.7 million).
25
CNO FINANCIAL GROUP, INC. AND SUBSIDIARIES
Notes to Consolidated Financial Statements
(unaudited)
___________________
Scheduled Repayment of our Direct Corporate Obligations
The scheduled repayment of our direct corporate obligations was as follows at March 31, 2018 (dollars in millions):
Year ending March 31, | |||
2019 | $ | — | |
2020 | 100.0 | ||
2021 | 325.0 | ||
2022 | — | ||
2023 | — | ||
Thereafter | 500.0 | ||
$ | 925.0 | ||
INVESTMENT BORROWINGS
Three of the Company's insurance subsidiaries (Washington National Insurance Company ("Washington National"), Bankers Life and Casualty Company ("Bankers Life") and Colonial Penn Life Insurance Company ("Colonial Penn")) are members of the Federal Home Loan Bank ("FHLB"). As members of the FHLB, our insurance subsidiaries have the ability to borrow on a collateralized basis from the FHLB. We are required to hold certain minimum amounts of FHLB common stock as a condition of membership in the FHLB, and additional amounts based on the amount of the borrowings. New guidance effective January 1, 2018, requiring equity investments to be measured at fair value (as described in the note entitled "Recently Issued Accounting Standards - Adopted Accounting Standards") do not apply to FHLB common stock and prohibit such investments from being classified as equity securities subject to the new guidance. Accordingly, we have classified our investment in the FHLB common stock as other invested assets at March 31, 2018. In order to conform to the current presentation, the prior period investment in the FHLB common stock has been reclassified to other invested assets. At March 31, 2018, the carrying value of the FHLB common stock was $71.2 million. As of March 31, 2018, collateralized borrowings from the FHLB totaled $1.6 billion and the proceeds were used to purchase fixed maturity securities. The borrowings are classified as investment borrowings in the accompanying consolidated balance sheet. The borrowings are collateralized by investments with an estimated fair value of $2.1 billion at March 31, 2018, which are maintained in a custodial account for the benefit of the FHLB. Substantially all of such investments are classified as fixed maturities, available for sale, in our consolidated balance sheet.
26
CNO FINANCIAL GROUP, INC. AND SUBSIDIARIES
Notes to Consolidated Financial Statements
(unaudited)
___________________
The following summarizes the terms of the borrowings from the FHLB by our insurance subsidiaries (dollars in millions):
Amount | Maturity | Interest rate at | ||||
borrowed | date | March 31, 2018 | ||||
$ | 50.0 | January 2019 | Variable rate – 2.142% | |||
50.0 | February 2019 | Variable rate – 1.940% | ||||
100.0 | March 2019 | Variable rate – 2.288% | ||||
21.8 | July 2019 | Variable rate – 2.331% | ||||
15.0 | October 2019 | Variable rate – 2.273% | ||||
50.0 | May 2020 | Variable rate – 2.297% | ||||
21.8 | June 2020 | Fixed rate – 1.960% | ||||
25.0 | September 2020 | Variable rate – 2.911% | ||||
100.0 | September 2020 | Variable rate – 2.532% | ||||
50.0 | September 2020 | Variable rate – 2.537% | ||||
75.0 | September 2020 | Variable rate – 2.422% | ||||
100.0 | October 2020 | Variable rate – 1.806% | ||||
50.0 | December 2020 | Variable rate – 2.386% | ||||
100.0 | July 2021 | Variable rate – 2.270% | ||||
100.0 | July 2021 | Variable rate – 2.240% | ||||
28.2 | August 2021 | Fixed rate – 2.550% | ||||
57.7 | August 2021 | Variable rate - 2.317% | ||||
125.0 | August 2021 | Variable rate – 2.352% | ||||
50.0 | September 2021 | Variable rate – 2.484% | ||||
22.0 | May 2022 | Variable rate – 2.334% | ||||
100.0 | May 2022 | Variable rate – 2.317% | ||||
10.0 | June 2022 | Variable rate – 2.671% | ||||
50.0 | July 2022 | Variable rate – 2.075% | ||||
50.0 | July 2022 | Variable rate – 2.121% | ||||
50.0 | July 2022 | Variable rate – 2.140% | ||||
50.0 | August 2022 | Variable rate – 2.183% | ||||
50.0 | December 2022 | Variable rate – 2.306 | ||||
50.0 | December 2022 | Variable rate – 2.306 | ||||
24.5 | March 2023 | Fixed rate – 2.160% | ||||
20.5 | June 2025 | Fixed rate – 2.940% | ||||
$ | 1,646.5 | |||||
The variable rate borrowings are pre-payable on each interest reset date without penalty. The fixed rate borrowings are pre-payable subject to payment of a yield maintenance fee based on prevailing market interest rates. At March 31, 2018, the aggregate yield maintenance fee to prepay all fixed rate borrowings was $1.2 million.
Interest expense of $8.5 million and $5.7 million in the first three months of 2018 and 2017, respectively, was recognized related to total borrowings from the FHLB.
27
CNO FINANCIAL GROUP, INC. AND SUBSIDIARIES
Notes to Consolidated Financial Statements
(unaudited)
___________________
CHANGES IN COMMON STOCK
Changes in the number of shares of common stock outstanding were as follows (shares in thousands):
Balance, December 31, 2017 | 166,858 | ||
Stock options exercised | 123 | (a) | |
Restricted and performance stock vested | 373 | (b) | |
Balance, March 31, 2018 | 167,354 | ||
____________________
(a) | Such amount was reduced by 69 thousand shares which were tendered to the Company for the payment of the exercise price and required federal and state tax withholdings. |
(b) | Such amount was reduced by 200 thousand shares which were tendered to the Company for the payment of required federal and state tax withholdings owed on the vesting of restricted and performance stock. |
In the first three months of 2018, dividends declared on common stock totaled $15.3 million ($0.09 per common share).
SALES INDUCEMENTS
Certain of our annuity products offer sales inducements to contract holders in the form of enhanced crediting rates or bonus payments in the initial period of the contract. Certain of our life insurance products offer persistency bonuses credited to the contract holder's balance after the policy has been outstanding for a specified period of time. These enhanced rates and persistency bonuses are considered sales inducements in accordance with GAAP. Such amounts are deferred and amortized in the same manner as deferred acquisition costs. Sales inducements deferred totaled $.5 million and $.5 million during the three months ended March 31, 2018 and 2017, respectively. Amounts amortized totaled $2.7 million and $2.1 million during the three months ended March 31, 2018 and 2017, respectively. The unamortized balance of deferred sales inducements was $40.3 million and $42.5 million at March 31, 2018 and December 31, 2017, respectively.
OUT-OF-PERIOD ADJUSTMENTS
In the first quarter of 2018, we recorded the net effect of out-of-period adjustments related to the calculation of certain insurance liabilities which increased insurance policy benefits by $2.5 million (of which, $1.4 million related to long-term care reserves in the Bankers Life segment and $1.1 million related to a closed block of payout annuities in the Colonial Penn segment), decreased tax expense by $.5 million and decreased our net income by $2.0 million (or 1 cent per diluted share). We evaluated these adjustments taking into account both qualitative and quantitative factors and considered the impact of these adjustments in relation to each period, as well as the periods in which they originated. The impact of recognizing these adjustments in prior years was not significant to any individual period. Management believes these adjustments are immaterial to the consolidated financial statements and all previously issued financial statements.
RECENTLY ISSUED ACCOUNTING STANDARDS
Pending Accounting Standards
In February 2016, the Financial Accounting Standards Board (the "FASB") issued authoritative guidance related to accounting for leases, requiring lessees to report most leases on their balance sheets, regardless of whether the lease is classified as a finance lease or an operating lease. For lessees, the initial lease liability is equal to the present value of future lease payments, and a corresponding asset, adjusted for certain items, is also recorded. Expense recognition for lessees will remain similar to current accounting requirements for capital and operating leases. The accounting applied by a lessor is largely unchanged from that applied under previous GAAP. In transition, lessees and lessors are required to recognize and measure leases at the beginning of the earliest period presented using a modified retrospective approach. The guidance will be effective for the Company for fiscal years beginning after December 15, 2018, including interim periods within those fiscal years. Early adoption is permitted. The Company has not yet determined the expected impact of adoption of this guidance on its consolidated financial position, results of operations or cash flows.
28
CNO FINANCIAL GROUP, INC. AND SUBSIDIARIES
Notes to Consolidated Financial Statements
(unaudited)
___________________
In June 2016, the FASB issued authoritative guidance related to the measurement of credit losses on financial instruments. The new guidance replaces the incurred loss impairment methodology with a methodology that reflects expected credit losses and requires consideration of a broader range of reasonable and supportable information to form credit loss estimates. The guidance will be effective for the Company for fiscal years beginning in 2020, including interim periods within the fiscal year. Early adoption is permitted as of the fiscal years beginning after December 15, 2018, including interim periods within those fiscal years. The Company has not yet determined the expected impact of adoption of this guidance on its consolidated financial position, results of operations or cash flows.
In January 2017, the FASB issued authoritative guidance that removes Step 2 of the goodwill impairment test under current guidance, which requires a hypothetical purchase price allocation. The new guidance requires an impairment charge to be recognized for the amount by which the carrying amount exceeds the reported unit's fair value. Upon adoption, the guidance is to be applied prospectively. The guidance will be effective for the Company on January 1, 2020, with early adoption permitted. The adoption of this guidance is not expected to have a material impact on the Company's consolidated financial position, results of operations or cash flows.
In March 2017, the FASB issued authoritative guidance related to the premium amortization on purchased callable debt securities. The guidance shortens the amortization period for certain callable debt securities held at a premium. Specifically, the new guidance requires the premium to be amortized to the earliest call date. The guidance does not require an accounting change for securities held at a discount; the discount continues to be amortized to maturity. The guidance will be effective for the Company for fiscal years, and interim periods within those fiscal years, beginning after December 15, 2018. Early adoption is permitted, including adoption in an interim period. If an entity early adopts the guidance in an interim period, any adjustments should be reflected as of the beginning of the fiscal year that includes that interim period. The guidance should be applied on a modified retrospective basis through a cumulative-effect adjustment directly to retained earnings as of the beginning of the period of adoption. The Company has not yet determined the expected impact of adoption of this guidance on our consolidated financial position, results of operations or cash flows.
In August 2017, the FASB issued authoritative guidance related to derivatives and hedging. The new guidance expands and refines hedge accounting for both nonfinancial and financial risk components and aligns the recognition and presentation of the effects of the hedging instruments and the hedged item in the financial statements. The new guidance also includes certain targeted improvements to ease the application of current guidance related to the assessment of hedge effectiveness. The guidance will be effective for the Company for fiscal years beginning after December 15, 2018, and interim periods within those fiscal years. Early adoption is permitted, including adoption in an interim period. The Company has not yet determined the expected impact of adoption of this guidance on its consolidated financial position, results of operations or cash flows.
Adopted Accounting Standards
In May 2014, the FASB issued authoritative guidance for recognizing revenue from contracts with customers. Certain contracts with customers are specifically excluded from this guidance, including insurance contracts. The core principle of the new guidance is that an entity should recognize revenue when it transfers promised goods or services in an amount that reflects the consideration to which the entity expects to be entitled in exchange for those goods or services. The guidance also requires additional disclosures about the nature, amount, timing and uncertainty of revenue and cash flows arising from contracts with customers. The guidance was effective for the Company on January 1, 2018. The adoption of this new guidance impacts the timing of certain revenues and expenses between quarters of a calendar year for various distribution and marketing agreements with other insurance companies pursuant to which Bankers Life's career agents distribute third party products including prescription drug and Medicare Advantage plans. The annual fee income earned during a calendar year will not change, but the amount recognized during each quarterly period will vary based on the sales of such products in each period. Furthermore, we are recognizing distribution expenses in the same period that the associated fee revenue is earned. Periods prior to the January 1, 2018 adoption date were not restated to reflect the new guidance. The impact of adoption was as follows (dollars in millions):
29
CNO FINANCIAL GROUP, INC. AND SUBSIDIARIES
Notes to Consolidated Financial Statements
(unaudited)
___________________
Three months ended March 31, 2018 | ||||||||||||
Impact of | Amounts prior | |||||||||||
As reported | adoption | to adoption | ||||||||||
Fee revenue | $ | 15.8 | $ | 7.3 | $ | 8.5 | ||||||
Distribution expense (included in other operating costs and expenses) | 11.5 | 8.8 | 2.7 | |||||||||
Impact on pre-tax income | $ | 4.3 | $ | (1.5 | ) | $ | 5.8 | |||||
In January 2016, the FASB issued authoritative guidance related to the recognition and measurement of financial assets and financial liabilities which made targeted improvements to GAAP as follows:
(i) | Require equity investments (except those accounted for under the equity method of accounting or those that result in consolidation of the investee) to be measured at fair value with changes in fair value recognized in net income. However, an entity may choose to measure equity investments that do not have readily determinable fair values at cost minus impairment, if any, plus or minus changes resulting from observable price changes in orderly transactions for the identical or a similar investment of the same issuer. |
(ii) | Simplify the impairment assessment of equity investments without readily determinable fair values by requiring a qualitative assessment to identify impairment. When a qualitative assessment indicates that impairment exists, an entity is required to measure the investment at fair value. |
(iii) | Eliminate the requirement for public business entities to disclose the method(s) and significant assumptions used to estimate the fair value that is required to be disclosed for financial instruments measured at amortized cost on the balance sheet. |
(iv) | Require public business entities to use the exit price notion when measuring the fair value of financial instruments for disclosure purposes. |
(v) | Require an entity to present separately in other comprehensive income the portion of the total change in the fair value of a liability resulting from a change in the instrument-specific credit risk when the entity has elected to measure the liability at fair value in accordance with the fair value option for financial instruments. |
(vi) | Require separate presentation of financial assets and financial liabilities by measurement category and form of financial asset (that is, securities or loans and receivables) on the balance sheet or the accompanying notes to the financial statements. |
(vii) | Clarify that an entity should evaluate the need for a valuation allowance on a deferred tax asset related to available-for-sale securities in combination with the entity's other deferred tax assets. |
The guidance was effective for the Company on January 1, 2018. Accordingly, the Company recorded a cumulative effect adjustment to the balance sheet as of January 1, 2018, related to certain equity investments that are measured at fair value. The impact of adoption was as follows (dollars in millions):
January 1, 2018 | |||||||||||
Amounts prior to effect of adoption of authoritative guidance | Effect of adoption of authoritative guidance | As adjusted | |||||||||
Accumulated other comprehensive income | $ | 1,212.1 | $ | (16.3 | ) | $ | 1,195.8 | ||||
Retained earnings | 560.4 | 16.3 | 576.7 | ||||||||
Total shareholders' equity | 4,847.5 | — | 4,847.5 | ||||||||
In August 2016, the FASB issued authoritative guidance related to how certain cash receipts and cash payments are presented and classified in the statement of cash flows. The guidance addresses eight specific cash flow issues including debt prepayment or debt extinguishment costs, proceeds from the settlement of corporate-owned life insurance policies ("COLI"), distributions received from equity method investees, and others. The guidance was effective for the Company on January 1, 2018. The adoption of this guidance resulted in reclassifications to certain cash receipts and payments within our consolidated
30
CNO FINANCIAL GROUP, INC. AND SUBSIDIARIES
Notes to Consolidated Financial Statements
(unaudited)
___________________
statement of cash flows, but had no impact on our consolidated financial position, results of operations or cash flows. Periods prior to the January 1, 2018 adoption date have been restated to reflect the new guidance.
In November 2016, the FASB issued authoritative guidance to address the diversity in practice that currently exists regarding the classification and presentation of changes in restricted cash on the statement of cash flows. The new guidance requires that a statement of cash flows explain the change during the period in the total of cash, cash equivalents and amounts generally described as restricted cash or restricted cash equivalents. Therefore, amounts generally described as restricted cash and restricted cash equivalents should be included with cash and cash equivalents when reconciling the beginning-of-period and end-of-period total amounts shown on the statement of cash flows. Entities are also required to disclose information about the nature of their restricted cash and restricted cash equivalents. Additionally, if cash, cash equivalents, restricted cash and restricted cash equivalents are presented in more than one line item in the statement of financial position, entities will be required to present a reconciliation, either on the face of the statement of cash flows or disclosed in the notes, of the totals in the statement of cash flows to the related line item captions in the statement of financial position. The guidance was effective for the Company on January 1, 2018. The adoption of this guidance impacted the presentation of our consolidated statement of cash flows and related cash flow disclosures, but did not have an impact on our consolidated financial position, results of operations or cash flows. Periods prior to the January 1, 2018 adoption date have been restated to reflect the new guidance.
The impact of adopting the cash flow guidance described above was as follows (dollars in millions):
Three months ended | |||||||||||||||||||
March 31, 2017 | |||||||||||||||||||
Amounts prior to effect of adoption of authoritative guidance | Restricted cash | COLI death benefits | Distributions received from equity method investments | As adjusted | |||||||||||||||
Cash flows from operating activities: | |||||||||||||||||||
Net investment income | $ | 289.7 | $ | — | $ | — | $ | 5.6 | $ | 295.3 | |||||||||
Other operating costs | (203.6 | ) | — | (3.2 | ) | — | (206.8 | ) | |||||||||||
Net cash flow from operating activities | 141.0 | — | (3.2 | ) | 5.6 | 143.4 | |||||||||||||
Cash flows from investing activities: | |||||||||||||||||||
Sales of investments | 403.0 | — | — | (5.6 | ) | 397.4 | |||||||||||||
Change in cash and cash equivalents held by variable interest entities | (165.2 | ) | 165.2 | — | — | — | |||||||||||||
Other | (12.1 | ) | — | 3.2 | — | (8.9 | ) | ||||||||||||
Net cash provided (used) by investing activities | (55.8 | ) | 165.2 | 3.2 | (5.6 | ) | 107.0 | ||||||||||||
Net increase in cash and cash equivalents | 51.3 | 165.2 | — | — | 216.5 | ||||||||||||||
Cash and cash equivalents - unrestricted and held by variable interest entities, beginning of period | 478.9 | 189.3 | — | — | 668.2 | ||||||||||||||
Cash and cash equivalents - unrestricted and held by variable interest entities, end of period | 530.2 | 354.5 | — | — | 884.7 | ||||||||||||||
In May 2017, the FASB issued authoritative guidance related to which changes to the terms or conditions of a share-based award require an entity to apply modification accounting. The guidance was effective for the Company for fiscal years beginning after December 15, 2017. Early adoption was permitted, including adoption in an interim period. The guidance is to be applied prospectively to an award modified on or after the adoption date. The adoption of this guidance did not have a material impact to the Company's consolidated financial position, results of operations or cash flows.
31
CNO FINANCIAL GROUP, INC. AND SUBSIDIARIES
Notes to Consolidated Financial Statements
(unaudited)
___________________
LITIGATION AND OTHER LEGAL PROCEEDINGS
Legal Proceedings
The Company and its subsidiaries are involved in various legal actions in the normal course of business, in which claims for compensatory and punitive damages are asserted, some for substantial amounts. We recognize an estimated loss from these loss contingencies when we believe it is probable that a loss has been incurred and the amount of the loss can be reasonably estimated. Some of the pending matters have been filed as purported class actions and some actions have been filed in certain jurisdictions that permit punitive damage awards that are disproportionate to the actual damages incurred. The amounts sought in certain of these actions are often large or indeterminate and the ultimate outcome of certain actions is difficult to predict. In the event of an adverse outcome in one or more of these matters, there is a possibility that the ultimate liability may be in excess of the liabilities we have established and could have a material adverse effect on our business, financial condition, results of operations and cash flows. In addition, the resolution of pending or future litigation may involve modifications to the terms of outstanding insurance policies or could impact the timing and amount of rate increases, which could adversely affect the future profitability of the related insurance policies. Based upon information presently available, and in light of legal, factual and other defenses available to the Company and its subsidiaries, the Company does not believe that it is probable that the ultimate liability from either pending or threatened legal actions, after consideration of existing loss provisions, will have a material adverse effect on the Company's consolidated financial condition, operating results or cash flows. However, given the inherent difficulty in predicting the outcome of legal proceedings, there exists the possibility that such legal actions could have a material adverse effect on the Company's consolidated financial condition, operating results or cash flows.
In addition to the inherent difficulty of predicting litigation outcomes, particularly those that will be decided by a jury, some matters purport to seek substantial or an unspecified amount of damages for unsubstantiated conduct spanning several years based on complex legal theories and damages models. The alleged damages typically are indeterminate or not factually supported in the complaint, and, in any event, the Company's experience indicates that monetary demands for damages often bear little relation to the ultimate loss. In some cases, plaintiffs are seeking to certify classes in the litigation and class certification either has been denied or is pending and we have filed oppositions to class certification or sought to decertify a prior class certification. In addition, for many of these cases: (i) there is uncertainty as to the outcome of pending appeals or motions; (ii) there are significant factual issues to be resolved; and/or (iii) there are novel legal issues presented. Accordingly, the Company cannot reasonably estimate the possible loss or range of loss in excess of amounts accrued, if any, or predict the timing of the eventual resolution of these matters. The Company reviews these matters on an ongoing basis. When assessing reasonably possible and probable outcomes, the Company bases its assessment on the expected ultimate outcome following all appeals.
On September 29, 2016, Washington National and Bankers Conseco Life Insurance Company ("BCLIC") commenced an arbitration proceeding seeking compensatory, consequential and punitive damages against Beechwood Re Ltd. ("BRe") based upon BRe’s incurable material breaches of the long-term care reinsurance agreements, conversion, fraud, and breaches of fiduciary duties and the obligation to deal honestly and in good faith. BRe filed a counterclaim against Washington National and BCLIC in the arbitration alleging damages relating to the reinsurance agreements and their termination. In addition, on September 29, 2016, a complaint was filed by BCLIC and Washington National in the United States District Court for the Southern District of New York, Bankers Conseco Life Insurance Company and Washington National Insurance Company v. Moshe M. Feuer, Scott Taylor and David Levy, Case No. 16-cv-7646, alleging, among other claims, fraud/fraudulent concealment, and violation of the Racketeer Influenced and Corrupt Organizations Act. These allegations relate to the long-term care reinsurance agreements between BRe and Washington National and BCLIC, respectively, and emanate from the undisclosed relationships between and among the defendants (who were the principal owners and officers of BRe) and Platinum Partners, LP and its affiliates. On April 27, 2017, an amended complaint was filed adding Beechwood Capital Group, LLC as a defendant. On March 13, 2018, the District Court granted the motion that had been filed by Feuer, Taylor and Levy to compel arbitration of Washington National's and BCLIC's claims and the litigation is now stayed pending the outcome of the arbitration. Washington National and BCLIC intend to vigorously pursue their claims for damages and other remedies in the arbitration and the litigation described above.
By public notice dated July 26, 2017, the Cayman Islands Monetary Authority advised that, effective July 25, 2017, two individuals (the "Controllers") had been appointed pursuant to Section 24(2)(h) of the Cayman Islands Insurance Law to assume control of the affairs of BRe. According to the public notice, effective with their appointment, the Controllers assumed immediate control of the affairs of BRe and have all the powers necessary to administer the affairs of BRe including power to
32
CNO FINANCIAL GROUP, INC. AND SUBSIDIARIES
Notes to Consolidated Financial Statements
(unaudited)
___________________
terminate its insurance business. The Controllers are responsible for assessing the financial position of BRe and submitting a report to the Cayman Islands Monetary Authority by a date to be specified. We are in the process of assessing the potential impact of this action on the proceedings described in the foregoing paragraph.
Regulatory Examinations and Fines
Insurance companies face significant risks related to regulatory investigations and actions. Regulatory investigations generally result from matters related to sales or underwriting practices, payment of contingent or other sales commissions, claim payments and procedures, product design, product disclosure, additional premium charges for premiums paid on a periodic basis, denial or delay of benefits, charging excessive or impermissible fees on products, procedures related to canceling policies, changing the way cost of insurance charges are calculated for certain life insurance products or recommending unsuitable products to customers. We are, in the ordinary course of our business, subject to various examinations, inquiries and information requests from state, federal and other authorities. The ultimate outcome of these regulatory actions (including the costs of complying with information requests and policy reviews) cannot be predicted with certainty. In the event of an unfavorable outcome in one or more of these matters, the ultimate liability may be in excess of liabilities we have established and we could suffer significant reputational harm as a result of these matters, which could also have a material adverse effect on our business, financial condition, results of operations or cash flows.
In August 2011, we were notified of an examination to be done on behalf of a number of states for the purpose of determining compliance with unclaimed property laws by the Company and its subsidiaries. Such examination has included inquiries related to the use of data available on the U.S. Social Security Administration's Death Master File to identify instances where benefits under life insurance policies, annuities and retained asset accounts are payable. We are continuing to provide information to the examiners in response to their requests. A total of 38 states and the District of Columbia are currently participating in this examination.
33
CNO FINANCIAL GROUP, INC. AND SUBSIDIARIES
Notes to Consolidated Financial Statements
(unaudited)
___________________
CONSOLIDATED STATEMENT OF CASH FLOWS
The following reconciles net income to net cash from operating activities (dollars in millions):
Three months ended | |||||||
March 31, | |||||||
2018 | 2017 | ||||||
Cash flows from operating activities: | |||||||
Net income | $ | 84.3 | $ | 62.3 | |||
Adjustments to reconcile net income to net cash from operating activities: | |||||||
Amortization and depreciation | 78.7 | 70.0 | |||||
Income taxes | 1.7 | 32.9 | |||||
Insurance liabilities | 25.5 | 131.6 | |||||
Accrual and amortization of investment income | (43.1 | ) | (91.9 | ) | |||
Deferral of policy acquisition costs | (60.2 | ) | (63.2 | ) | |||
Net realized investment (gains) losses | 15.2 | (7.9 | ) | ||||
Other | (29.9 | ) | 9.6 | ||||
Net cash from operating activities | $ | 72.2 | $ | 143.4 | |||
Other non-cash items not reflected in the investing and financing activities sections of the consolidated statement of cash flows (dollars in millions):
Three months ended | |||||||
March 31, | |||||||
2018 | 2017 | ||||||
Stock options, restricted stock and performance units | $ | 6.8 | $ | 6.3 | |||
34
CNO FINANCIAL GROUP, INC. AND SUBSIDIARIES
Notes to Consolidated Financial Statements
(unaudited)
___________________
INVESTMENTS IN VARIABLE INTEREST ENTITIES
We have concluded that we are the primary beneficiary with respect to certain VIEs, which are consolidated in our financial statements. In consolidating the VIEs, we consistently use the financial information most recently distributed to investors in the VIE.
All of the VIEs are collateralized loan trusts that were established to issue securities to finance the purchase of corporate loans and other permitted investments. The assets held by the trusts are legally isolated and not available to the Company. The liabilities of the VIEs are expected to be satisfied from the cash flows generated by the underlying loans held by the trusts, not from the assets of the Company. The Company has no financial obligation to the VIEs beyond its investment in each VIE.
Certain of our insurance subsidiaries are noteholders of the VIEs. Another subsidiary of the Company is the investment manager for the VIEs. As such, it has the power to direct the most significant activities of the VIEs which materially impacts the economic performance of the VIEs.
The following tables provide supplemental information about the assets and liabilities of the VIEs which have been consolidated in accordance with authoritative guidance (dollars in millions):
March 31, 2018 | |||||||||||
VIEs | Eliminations | Net effect on consolidated balance sheet | |||||||||
Assets: | |||||||||||
Investments held by variable interest entities | $ | 1,583.9 | $ | — | $ | 1,583.9 | |||||
Notes receivable of VIEs held by insurance subsidiaries | — | (150.5 | ) | (150.5 | ) | ||||||
Cash and cash equivalents held by variable interest entities | 115.6 | — | 115.6 | ||||||||
Accrued investment income | 2.8 | (.1 | ) | 2.7 | |||||||
Income tax assets, net | — | — | — | ||||||||
Other assets | 10.3 | (1.6 | ) | 8.7 | |||||||
Total assets | $ | 1,712.6 | $ | (152.2 | ) | $ | 1,560.4 | ||||
Liabilities: | |||||||||||
Other liabilities | $ | 154.2 | $ | (4.3 | ) | $ | 149.9 | ||||
Borrowings related to variable interest entities | 1,410.5 | — | 1,410.5 | ||||||||
Notes payable of VIEs held by insurance subsidiaries | 162.6 | (162.6 | ) | — | |||||||
Total liabilities | $ | 1,727.3 | $ | (166.9 | ) | $ | 1,560.4 | ||||
35
CNO FINANCIAL GROUP, INC. AND SUBSIDIARIES
Notes to Consolidated Financial Statements
(unaudited)
___________________
December 31, 2017 | |||||||||||
VIEs | Eliminations | Net effect on consolidated balance sheet | |||||||||
Assets: | |||||||||||
Investments held by variable interest entities | $ | 1,526.9 | $ | — | $ | 1,526.9 | |||||
Notes receivable of VIEs held by insurance subsidiaries | — | (155.5 | ) | (155.5 | ) | ||||||
Cash and cash equivalents held by variable interest entities | 178.9 | — | 178.9 | ||||||||
Accrued investment income | 2.6 | (.1 | ) | 2.5 | |||||||
Income tax assets, net | .7 | — | .7 | ||||||||
Other assets | 10.0 | (1.5 | ) | 8.5 | |||||||
Total assets | $ | 1,719.1 | $ | (157.1 | ) | $ | 1,562.0 | ||||
Liabilities: | |||||||||||
Other liabilities | $ | 158.3 | $ | (4.4 | ) | $ | 153.9 | ||||
Borrowings related to variable interest entities | 1,410.7 | — | 1,410.7 | ||||||||
Notes payable of VIEs held by insurance subsidiaries | 167.6 | (167.6 | ) | — | |||||||
Total liabilities | $ | 1,736.6 | $ | (172.0 | ) | $ | 1,564.6 | ||||
The investment portfolios held by the VIEs are primarily comprised of commercial bank loans to corporate obligors which are almost entirely rated below-investment grade. At March 31, 2018, such loans had an amortized cost of $1,581.9 million; gross unrealized gains of $8.8 million; gross unrealized losses of $6.8 million; and an estimated fair value of $1,583.9 million.
The following table sets forth the amortized cost and estimated fair value of the investments held by the VIEs at March 31, 2018, by contractual maturity. Actual maturities will differ from contractual maturities because borrowers may have the right to call or prepay obligations with or without penalties.
Amortized cost | Estimated fair value | ||||||
(Dollars in millions) | |||||||
Due in one year or less | $ | 4.2 | $ | 4.2 | |||
Due after one year through five years | 521.0 | 520.5 | |||||
Due after five years through ten years | 1,056.7 | 1,059.2 | |||||
Total | $ | 1,581.9 | $ | 1,583.9 | |||
During the first three months of 2018, the VIEs recognized net realized investment gains of nil from the sales of fixed maturities. During the first three months of 2017, the VIEs recognized net realized investment gains of $2.1 million.
At March 31, 2018, there were no investments held by the VIEs that were in default.
During the first three months of 2018, $10.8 million of investments held by VIEs were sold which resulted in gross investment losses (before income taxes) of $.1 million. During the first three months of 2017, $20.4 million of investments held by the VIEs were sold which resulted in gross investment losses (before income taxes) of $.1 million.
At March 31, 2018, the VIEs held: (i) investments with a fair value of $399.2 million and gross unrealized losses of $4.8 million that had been in an unrealized loss position for less than twelve months; and (ii) investments with a fair value of $41.4 million and gross unrealized losses of $2.0 million that had been in an unrealized loss position for twelve months or greater.
36
CNO FINANCIAL GROUP, INC. AND SUBSIDIARIES
Notes to Consolidated Financial Statements
(unaudited)
___________________
At December 31, 2017, the VIEs held: (i) investments with a fair value of $445.4 million and gross unrealized losses of $4.9 million that had been in an unrealized loss position for less than twelve months; and (ii) investments with a fair value of $28.4 million and gross unrealized losses of $1.7 million that had been in an unrealized loss position for twelve months or greater.
The investments held by the VIEs are evaluated for other-than-temporary declines in fair value in a manner that is consistent with the Company's fixed maturities, available for sale.
In addition, the Company, in the normal course of business, makes passive investments in structured securities issued by VIEs for which the Company is not the investment manager. These structured securities include asset-backed securities, collateralized debt obligations, commercial mortgage-backed securities, residential mortgage-backed securities and collateralized mortgage obligations. Our maximum exposure to loss on these securities is limited to our cost basis in the investment. We have determined that we are not the primary beneficiary of these structured securities due to the relative size of our investment in comparison to the total principal amount of the individual structured securities and the level of credit subordination which reduces our obligation to absorb gains or losses.
At March 31, 2018, we held investments in various limited partnerships and hedge funds, in which we are not the primary beneficiary, totaling $500.0 million (classified as other invested assets). At March 31, 2018, we had unfunded commitments to these partnerships and hedge funds totaling $275.5 million. Our maximum exposure to loss on these investments is limited to the amount of our investment.
37
CNO FINANCIAL GROUP, INC. AND SUBSIDIARIES
Notes to Consolidated Financial Statements
(unaudited)
___________________
FAIR VALUE MEASUREMENTS
Fair value is the price that would be received to sell an asset or paid to transfer a liability in an orderly transaction between market participants at the measurement date and, therefore, represents an exit price, not an entry price. We carry certain assets and liabilities at fair value on a recurring basis, including fixed maturities, equity securities, trading securities, investments held by VIEs, derivatives, separate account assets and embedded derivatives. We carry our company-owned life insurance policy, which is invested in a series of mutual funds, at its cash surrender value which approximates fair value. In addition, we disclose fair value for certain financial instruments, including mortgage loans, policy loans, cash and cash equivalents, insurance liabilities for interest-sensitive products, investment borrowings, notes payable and borrowings related to VIEs.
The degree of judgment utilized in measuring the fair value of financial instruments is largely dependent on the level to which pricing is based on observable inputs. Observable inputs reflect market data obtained from independent sources, while unobservable inputs reflect our view of market assumptions in the absence of observable market information. Financial instruments with readily available active quoted prices would be considered to have fair values based on the highest level of observable inputs, and little judgment would be utilized in measuring fair value. Financial instruments that rarely trade would often have fair value based on a lower level of observable inputs, and more judgment would be utilized in measuring fair value.
Valuation Hierarchy
There is a three-level hierarchy for valuing assets or liabilities at fair value based on whether inputs are observable or unobservable.
• | Level 1 – includes assets and liabilities valued using inputs that are unadjusted quoted prices in active markets for identical assets or liabilities. Our Level 1 assets primarily include cash and cash equivalents and exchange-traded securities. |
• | Level 2 – includes assets and liabilities valued using inputs that are quoted prices for similar assets in an active market, quoted prices for identical or similar assets in a market that is not active, observable inputs, or observable inputs that can be corroborated by market data. Level 2 assets and liabilities include those financial instruments that are valued by independent pricing services using models or other valuation methodologies. These models consider various inputs such as credit rating, maturity, corporate credit spreads, reported trades and other inputs that are observable or derived from observable information in the marketplace or are supported by transactions executed in the marketplace. Financial assets in this category primarily include: certain publicly registered and privately placed corporate fixed maturity securities; certain government or agency securities; certain mortgage and asset-backed securities; certain equity securities; most investments held by our consolidated VIEs; certain mutual fund investments; most short-term investments; and non-exchange-traded derivatives such as call options. Financial liabilities in this category include investment borrowings, notes payable and borrowings related to VIEs. |
• | Level 3 – includes assets and liabilities valued using unobservable inputs that are used in model-based valuations that contain management assumptions. Level 3 assets and liabilities include those financial instruments whose fair value is estimated based on broker/dealer quotes, pricing services or internally developed models or methodologies utilizing significant inputs not based on, or corroborated by, readily available market information. Financial assets in this category include certain corporate securities (primarily certain below-investment grade privately placed securities), certain structured securities, mortgage loans, and other less liquid securities. Financial liabilities in this category include our insurance liabilities for interest-sensitive products, which includes embedded derivatives (including embedded derivatives related to our fixed index annuity products and to a modified coinsurance arrangement) since their values include significant unobservable inputs including actuarial assumptions. |
At each reporting date, we classify assets and liabilities into the three input levels based on the lowest level of input that is significant to the measurement of fair value for each asset and liability reported at fair value. This classification is impacted by a number of factors, including the type of financial instrument, whether the financial instrument is new to the market and not yet established, the characteristics specific to the transaction and overall market conditions. Our assessment of the significance of a particular input to the fair value measurement and the ultimate classification of each asset and liability requires judgment and is subject to change from period to period based on the observability of the valuation inputs. Any transfers between levels
38
CNO FINANCIAL GROUP, INC. AND SUBSIDIARIES
Notes to Consolidated Financial Statements
(unaudited)
___________________
are reported as having occurred at the beginning of the period. There were no transfers between Level 1 and Level 2 in both the first three months of 2018 and 2017.
The vast majority of our fixed maturity and equity securities, including those held in trading portfolios and those held by consolidated VIEs, short-term and separate account assets use Level 2 inputs for the determination of fair value. These fair values are obtained primarily from independent pricing services, which use Level 2 inputs for the determination of fair value. Our Level 2 assets are valued as follows:
•Fixed maturities available for sale, equity securities and trading securities
Corporate securities are generally priced using market and income approaches. Inputs generally consist of trades of identical or similar securities, quoted prices in inactive markets, issuer rating, benchmark yields, maturity, and credit spreads.
U.S. Treasuries and obligations of U.S. Government corporations and agencies are generally priced using the market approach. Inputs generally consist of trades of identical or similar securities, quoted prices in inactive markets and maturity.
States and political subdivisions are generally priced using the market approach. Inputs generally consist of trades of identical or similar securities, quoted prices in inactive markets, new issuances and credit spreads.
Asset-backed securities, collateralized debt obligations, commercial mortgage-backed securities, mortgage pass-through securities and collateralized mortgage obligations are generally priced using market and income approaches. Inputs generally consist of quoted prices in inactive markets, spreads on actively traded securities, expected prepayments, expected default rates, expected recovery rates, and issue specific information including, but not limited to, collateral type, seniority and vintage.
Equity securities (primarily comprised of non-redeemable preferred stock) are generally priced using the market approach. Inputs generally consist of trades of identical or similar securities, quoted prices in inactive markets, issuer rating, benchmark yields, maturity, and credit spreads.
• | Investments held by VIEs |
Corporate securities are generally priced using market and income approaches using pricing vendors. Inputs generally consist of issuer rating, benchmark yields, maturity, and credit spreads.
• | Other invested assets - derivatives |
The fair value measurements for derivative instruments, including embedded derivatives requiring bifurcation, are determined based on the consideration of several inputs including closing exchange or over-the-counter market price quotes; time value and volatility factors underlying options; market interest rates; and non-performance risk.
Third party pricing services normally derive security prices through recently reported trades for identical or similar securities making adjustments through the reporting date based upon available market observable information. If there are no recently reported trades, the third party pricing services may use matrix or model processes to develop a security price where future cash flow expectations are discounted at an estimated risk-adjusted market rate. The number of prices obtained for a given security is dependent on the Company's analysis of such prices as further described below.
As the Company is responsible for the determination of fair value, we have control processes designed to ensure that the fair values received from third-party pricing sources are reasonable and the valuation techniques and assumptions used appear reasonable and consistent with prevailing market conditions. Additionally, when inputs are provided by third-party pricing sources, we have controls in place to review those inputs for reasonableness. As part of these controls, we perform monthly quantitative and qualitative analysis on the prices received from third parties to determine whether the prices are reasonable estimates of fair value. The Company's analysis includes: (i) a review of the methodology used by third party pricing services;
39
CNO FINANCIAL GROUP, INC. AND SUBSIDIARIES
Notes to Consolidated Financial Statements
(unaudited)
___________________
(ii) where available, a comparison of multiple pricing services' valuations for the same security; (iii) a review of month to month price fluctuations; (iv) a review to ensure valuations are not unreasonably dated; and (v) back testing to compare actual purchase and sale transactions with valuations received from third parties. As a result of such procedures, the Company may conclude a particular price received from a third party is not reflective of current market conditions. In those instances, we may request additional pricing quotes or apply internally developed valuations. However, the number of such instances is insignificant and the aggregate change in value of such investments is not materially different from the original prices received.
The categorization of the fair value measurements of our investments priced by independent pricing services was based upon the Company's judgment of the inputs or methodologies used by the independent pricing services to value different asset classes. Such inputs typically include: benchmark yields, reported trades, broker dealer quotes, issuer spreads, benchmark securities, bids, offers and other relevant data. The Company categorizes such fair value measurements based upon asset classes and the underlying observable or unobservable inputs used to value such investments.
For securities that are not priced by pricing services and may not be reliably priced using pricing models, we obtain broker quotes. These broker quotes are non-binding and represent an exit price, but assumptions used to establish the fair value may not be observable and therefore represent Level 3 inputs. Approximately 30 percent of our Level 3 fixed maturity securities were valued using unadjusted broker quotes or broker-provided valuation inputs. The remaining Level 3 fixed maturity investments do not have readily determinable market prices and/or observable inputs. For these securities, we use internally developed valuations. Key assumptions used to determine fair value for these securities may include risk premiums, projected performance of underlying collateral and other factors involving significant assumptions which may not be reflective of an active market. For certain investments, we use a matrix or model process to develop a security price where future cash flow expectations are discounted at an estimated market rate. The pricing matrix incorporates term interest rates as well as a spread level based on the issuer's credit rating, other factors relating to the issuer, and the security's maturity. In some instances issuer-specific spread adjustments, which can be positive or negative, are made based upon internal analysis of security specifics such as liquidity, deal size, and time to maturity.
For certain embedded derivatives, we use actuarial assumptions in the determination of fair value which we consider to be Level 3 inputs.
40
CNO FINANCIAL GROUP, INC. AND SUBSIDIARIES
Notes to Consolidated Financial Statements
(unaudited)
___________________
The categorization of fair value measurements, by input level, for our financial instruments carried at fair value on a recurring basis at March 31, 2018 is as follows (dollars in millions):
Quoted prices in active markets for identical assets or liabilities (Level 1) | Significant other observable inputs (Level 2) | Significant unobservable inputs (Level 3) | Total | ||||||||||||
Assets: | |||||||||||||||
Fixed maturities, available for sale: | |||||||||||||||
Corporate securities | $ | — | $ | 14,525.2 | $ | 200.1 | $ | 14,725.3 | |||||||
United States Treasury securities and obligations of United States government corporations and agencies | — | 173.1 | — | 173.1 | |||||||||||
States and political subdivisions | — | 2,046.3 | — | 2,046.3 | |||||||||||
Debt securities issued by foreign governments | — | 73.9 | 3.8 | 77.7 | |||||||||||
Asset-backed securities | — | 2,866.2 | 17.6 | 2,883.8 | |||||||||||
Collateralized debt obligations | — | 349.2 | 15.3 | 364.5 | |||||||||||
Commercial mortgage-backed securities | — | 1,401.9 | — | 1,401.9 | |||||||||||
Mortgage pass-through securities | — | 1.8 | — | 1.8 | |||||||||||
Collateralized mortgage obligations | — | 701.1 | — | 701.1 | |||||||||||
Total fixed maturities, available for sale | — | 22,138.7 | 236.8 | 22,375.5 | |||||||||||
Equity securities - corporate securities | 335.0 | 142.3 | 21.4 | 498.7 | |||||||||||
Trading securities: | |||||||||||||||
Corporate securities | — | 22.2 | — | 22.2 | |||||||||||
United States Treasury securities and obligations of United States government corporations and agencies | — | .5 | — | .5 | |||||||||||
Asset-backed securities | — | 94.9 | — | 94.9 | |||||||||||
Collateralized debt obligations | — | 2.7 | — | 2.7 | |||||||||||
Commercial mortgage-backed securities | — | 100.0 | — | 100.0 | |||||||||||
Collateralized mortgage obligations | — | 67.0 | — | 67.0 | |||||||||||
Equity securities | 2.3 | — | — | 2.3 | |||||||||||
Total trading securities | 2.3 | 287.3 | — | 289.6 | |||||||||||
Investments held by variable interest entities - corporate securities | — | 1,583.9 | — | 1,583.9 | |||||||||||
Other invested assets - derivatives | — | 141.5 | — | 141.5 | |||||||||||
Assets held in separate accounts | — | 4.7 | — | 4.7 | |||||||||||
Total assets carried at fair value by category | $ | 337.3 | $ | 24,298.4 | $ | 258.2 | $ | 24,893.9 | |||||||
Liabilities: | |||||||||||||||
Future policy benefits - embedded derivatives associated with fixed index annuity products | $ | — | $ | — | $ | 1,315.4 | $ | 1,315.4 | |||||||
41
CNO FINANCIAL GROUP, INC. AND SUBSIDIARIES
Notes to Consolidated Financial Statements
(unaudited)
___________________
The categorization of fair value measurements, by input level, for our financial instruments carried at fair value on a recurring basis at December 31, 2017 is as follows (dollars in millions):
Quoted prices in active markets for identical assets or liabilities (Level 1) | Significant other observable inputs (Level 2) | Significant unobservable inputs (Level 3) | Total | ||||||||||||
Assets: | |||||||||||||||
Fixed maturities, available for sale: | |||||||||||||||
Corporate securities | $ | — | $ | 14,728.0 | $ | 230.4 | $ | 14,958.4 | |||||||
United States Treasury securities and obligations of United States government corporations and agencies | — | 177.7 | — | 177.7 | |||||||||||
States and political subdivisions | — | 2,056.3 | — | 2,056.3 | |||||||||||
Debt securities issued by foreign governments | — | 79.2 | 3.9 | 83.1 | |||||||||||
Asset-backed securities | — | 3,230.2 | 24.2 | 3,254.4 | |||||||||||
Collateralized debt obligations | — | 259.4 | — | 259.4 | |||||||||||
Commercial mortgage-backed securities | — | 1,377.5 | — | 1,377.5 | |||||||||||
Mortgage pass-through securities | — | 2.0 | — | 2.0 | |||||||||||
Collateralized mortgage obligations | — | 742.1 | — | 742.1 | |||||||||||
Total fixed maturities, available for sale | — | 22,652.4 | 258.5 | 22,910.9 | |||||||||||
Equity securities - corporate securities | 287.8 | 131.6 | 21.2 | 440.6 | |||||||||||
Trading securities: | |||||||||||||||
Corporate securities | — | 21.6 | — | 21.6 | |||||||||||
United States Treasury securities and obligations of United States government corporations and agencies | — | .5 | — | .5 | |||||||||||
Asset-backed securities | — | 95.8 | — | 95.8 | |||||||||||
Collateralized debt obligations | — | 2.7 | — | 2.7 | |||||||||||
Commercial mortgage-backed securities | — | 92.5 | — | 92.5 | |||||||||||
Collateralized mortgage obligations | — | 68.7 | — | 68.7 | |||||||||||
Equity securities | 2.8 | — | — | 2.8 | |||||||||||
Total trading securities | 2.8 | 281.8 | — | 284.6 | |||||||||||
Investments held by variable interest entities - corporate securities | — | 1,522.0 | 4.9 | 1,526.9 | |||||||||||
Other invested assets - derivatives | — | 170.2 | — | 170.2 | |||||||||||
Assets held in separate accounts | — | 5.0 | — | 5.0 | |||||||||||
Total assets carried at fair value by category | $ | 290.6 | $ | 24,763.0 | $ | 284.6 | $ | 25,338.2 | |||||||
Liabilities: | |||||||||||||||
Future policy benefits - embedded derivatives associated with fixed index annuity products | $ | — | $ | — | $ | 1,334.8 | $ | 1,334.8 | |||||||
42
CNO FINANCIAL GROUP, INC. AND SUBSIDIARIES
Notes to Consolidated Financial Statements
(unaudited)
___________________
The fair value measurements for our financial instruments disclosed at fair value on a recurring basis are as follows (dollars in millions):
March 31, 2018 | |||||||||||||||||||
Quoted prices in active markets for identical assets or liabilities (Level 1) | Significant other observable inputs (Level 2) | Significant unobservable inputs (Level 3) | Total estimated fair value | Total carrying amount | |||||||||||||||
Assets: | |||||||||||||||||||
Mortgage loans | $ | — | $ | — | $ | 1,611.3 | $ | 1,611.3 | $ | 1,601.2 | |||||||||
Policy loans | — | — | 116.0 | 116.0 | 116.0 | ||||||||||||||
Other invested assets: | |||||||||||||||||||
Company-owned life insurance | — | 181.0 | — | 181.0 | 181.0 | ||||||||||||||
Cash and cash equivalents: | |||||||||||||||||||
Unrestricted | 610.7 | .1 | — | 610.8 | 610.8 | ||||||||||||||
Held by variable interest entities | 115.6 | — | — | 115.6 | 115.6 | ||||||||||||||
Liabilities: | |||||||||||||||||||
Policyholder account balances | — | — | 11,254.5 | 11,254.5 | 11,254.5 | ||||||||||||||
Investment borrowings | — | 1,647.7 | — | 1,647.7 | 1,646.5 | ||||||||||||||
Borrowings related to variable interest entities | — | 1,433.9 | — | 1,433.9 | 1,410.5 | ||||||||||||||
Notes payable – direct corporate obligations | — | 928.9 | — | 928.9 | 915.1 | ||||||||||||||
December 31, 2017 | |||||||||||||||||||
Quoted prices in active markets for identical assets or liabilities (Level 1) | Significant other observable inputs (Level 2) | Significant unobservable inputs (Level 3) | Total estimated fair value | Total carrying amount | |||||||||||||||
Assets: | |||||||||||||||||||
Mortgage loans | $ | — | $ | — | $ | 1,677.3 | $ | 1,677.3 | $ | 1,650.6 | |||||||||
Policy loans | — | — | 116.0 | 116.0 | 116.0 | ||||||||||||||
Other invested assets: | |||||||||||||||||||
Company-owned life insurance | — | 182.3 | — | 182.3 | 182.3 | ||||||||||||||
Cash and cash equivalents: | |||||||||||||||||||
Unrestricted | 578.4 | — | — | 578.4 | 578.4 | ||||||||||||||
Held by variable interest entities | 178.9 | — | — | 178.9 | 178.9 | ||||||||||||||
Liabilities: | |||||||||||||||||||
Policyholder account balances | — | — | 11,220.7 | 11,220.7 | 11,220.7 | ||||||||||||||
Investment borrowings | — | 1,648.8 | — | 1,648.8 | 1,646.7 | ||||||||||||||
Borrowings related to variable interest entities | — | 1,432.9 | — | 1,432.9 | 1,410.7 | ||||||||||||||
Notes payable – direct corporate obligations | — | 962.3 | — | 962.3 | 914.6 | ||||||||||||||
43
CNO FINANCIAL GROUP, INC. AND SUBSIDIARIES
Notes to Consolidated Financial Statements
(unaudited)
___________________
The following table presents additional information about assets and liabilities measured at fair value on a recurring basis and for which we have utilized significant unobservable (Level 3) inputs to determine fair value for the three months ended March 31, 2018 (dollars in millions):
March 31, 2018 | ||||||||||||||||||||||||||||||||
Beginning balance as of December 31, 2017 | Purchases, sales, issuances and settlements, net (b) | Total realized and unrealized gains (losses) included in net income | Total realized and unrealized gains (losses) included in accumulated other comprehensive income (loss) | Transfers into Level 3 (a) | Transfers out of Level 3 (a) | Ending balance as of March 31, 2018 | Amount of total gains (losses) for the three months ended March 31, 2018 included in our net income relating to assets and liabilities still held as of the reporting date | |||||||||||||||||||||||||
Assets: | ||||||||||||||||||||||||||||||||
Fixed maturities, available for sale: | ||||||||||||||||||||||||||||||||
Corporate securities | $ | 230.4 | $ | 6.2 | $ | 1.2 | $ | (2.4 | ) | $ | — | $ | (35.3 | ) | $ | 200.1 | $ | — | ||||||||||||||
Debt securities issued by foreign governments | 3.9 | — | — | (.1 | ) | — | — | 3.8 | — | |||||||||||||||||||||||
Asset-backed securities | 24.2 | (6.1 | ) | — | (.5 | ) | — | — | 17.6 | — | ||||||||||||||||||||||
Collateralized debt obligations | — | 15.3 | — | — | — | — | 15.3 | — | ||||||||||||||||||||||||
Commercial mortgage-backed securities | — | — | — | — | — | — | — | — | ||||||||||||||||||||||||
Total fixed maturities, available for sale | 258.5 | 15.4 | 1.2 | (3.0 | ) | — | (35.3 | ) | 236.8 | — | ||||||||||||||||||||||
Equity securities - corporate securities | 21.2 | — | .2 | — | — | — | 21.4 | — | ||||||||||||||||||||||||
Investments held by variable interest entities - corporate securities | 4.9 | — | — | — | — | (4.9 | ) | — | — | |||||||||||||||||||||||
Liabilities: | ||||||||||||||||||||||||||||||||
Future policy benefits - embedded derivatives associated with fixed index annuity products | (1,334.8 | ) | (17.6 | ) | 37.0 | — | — | — | (1,315.4 | ) | 37.0 | |||||||||||||||||||||
44
CNO FINANCIAL GROUP, INC. AND SUBSIDIARIES
Notes to Consolidated Financial Statements
(unaudited)
___________________
_________
(a) | Transfers into Level 3 are the result of unobservable inputs utilized within valuation methodologies for assets that were previously valued using observable inputs. Transfers out of Level 3 are due to the use of observable inputs in valuation methodologies as well as the utilization of pricing service information for certain assets that the Company is able to validate. |
(b) | Purchases, sales, issuances and settlements, net, represent the activity that occurred during the period that results in a change of the asset or liability but does not represent changes in fair value for the instruments held at the beginning of the period. Such activity primarily consists of purchases and sales of fixed maturity and equity securities and changes to embedded derivative instruments related to insurance products resulting from the issuance of new contracts, or changes to existing contracts. The following summarizes such activity for the three months ended March 31, 2018 (dollars in millions): |
Purchases | Sales | Issuances | Settlements | Purchases, sales, issuances and settlements, net | |||||||||||||||
Assets: | |||||||||||||||||||
Fixed maturities, available for sale: | |||||||||||||||||||
Corporate securities | $ | 11.1 | $ | (4.9 | ) | $ | — | $ | — | $ | 6.2 | ||||||||
Asset-backed securities | 5.0 | (11.1 | ) | — | — | (6.1 | ) | ||||||||||||
Collateralized debt obligations | 15.3 | — | — | — | 15.3 | ||||||||||||||
Total fixed maturities, available for sale | 31.4 | (16.0 | ) | — | — | 15.4 | |||||||||||||
Liabilities: | |||||||||||||||||||
Future policy benefits - embedded derivatives associated with fixed index annuity products | (39.2 | ) | 3.7 | (2.2 | ) | 20.1 | (17.6 | ) | |||||||||||
45
CNO FINANCIAL GROUP, INC. AND SUBSIDIARIES
Notes to Consolidated Financial Statements
(unaudited)
___________________
The following table presents additional information about assets and liabilities measured at fair value on a recurring basis and for which we have utilized significant unobservable (Level 3) inputs to determine fair value for the three months ended March 31, 2017 (dollars in millions):
March 31, 2017 | |||||||||||||||||||||||||||||||
Beginning balance as of December 31, 2016 | Purchases, sales, issuances and settlements, net (b) | Total realized and unrealized gains (losses) included in net income | Total realized and unrealized gains (losses) included in accumulated other comprehensive income (loss) | Transfers into Level 3 (a) | Transfers out of Level 3 (a) | Ending balance as of March 31, 2017 | Amount of total gains (losses) for the three months ended March 31, 2017 included in our net income relating to assets and liabilities still held as of the reporting date | ||||||||||||||||||||||||
Assets: | |||||||||||||||||||||||||||||||
Fixed maturities, available for sale: | |||||||||||||||||||||||||||||||
Corporate securities | $ | 258.5 | $ | 4.2 | $ | .6 | $ | 8.0 | $ | 17.5 | $ | — | $ | 288.8 | $ | (3.2 | ) | ||||||||||||||
Debt securities issued by foreign governments | 3.9 | — | — | — | — | — | 3.9 | — | |||||||||||||||||||||||
Asset-backed securities | 60.4 | 9.9 | — | .4 | — | (3.5 | ) | 67.2 | — | ||||||||||||||||||||||
Collateralized debt obligations | 5.4 | 9.0 | — | — | — | (2.9 | ) | 11.5 | — | ||||||||||||||||||||||
Commercial mortgage-backed securities | 32.0 | (.1 | ) | — | — | — | (17.0 | ) | 14.9 | — | |||||||||||||||||||||
Total fixed maturities, available for sale | 360.2 | 23.0 | .6 | 8.4 | 17.5 | (23.4 | ) | 386.3 | (3.2 | ) | |||||||||||||||||||||
Equity securities - corporate securities | 25.2 | — | — | (.1 | ) | — | (.8 | ) | 24.3 | — | |||||||||||||||||||||
Liabilities: | |||||||||||||||||||||||||||||||
Future policy benefits - embedded derivatives associated with fixed index annuity products | (1,092.3 | ) | (69.2 | ) | 2.3 | — | — | — | (1,159.2 | ) | 2.3 | ||||||||||||||||||||
46
CNO FINANCIAL GROUP, INC. AND SUBSIDIARIES
Notes to Consolidated Financial Statements
(unaudited)
___________________
____________
(a) | Transfers into Level 3 are the result of unobservable inputs utilized within valuation methodologies for assets that were previously valued using observable inputs. Transfers out of Level 3 are due to the use of observable inputs in valuation methodologies as well as the utilization of pricing service information for certain assets that the Company is able to validate. |
(b) | Purchases, sales, issuances and settlements, net, represent the activity that occurred during the period that results in a change of the asset or liability but does not represent changes in fair value for the instruments held at the beginning of the period. Such activity primarily consists of purchases and sales of fixed maturity and equity securities and changes to embedded derivative instruments related to insurance products resulting from the issuance of new contracts, or changes to existing contracts. The following summarizes such activity for the three months ended March 31, 2017 (dollars in millions): |
Purchases | Sales | Issuances | Settlements | Purchases, sales, issuances and settlements, net | |||||||||||||||
Assets: | |||||||||||||||||||
Fixed maturities, available for sale: | |||||||||||||||||||
Corporate securities | $ | 23.2 | $ | (19.0 | ) | $ | — | $ | — | $ | 4.2 | ||||||||
Asset-backed securities | 12.0 | (2.1 | ) | — | — | 9.9 | |||||||||||||
Collateralized debt obligations | 9.0 | — | — | — | 9.0 | ||||||||||||||
Commercial mortgage-backed securities | — | (.1 | ) | — | — | (.1 | ) | ||||||||||||
Total fixed maturities, available for sale | 44.2 | (21.2 | ) | — | — | 23.0 | |||||||||||||
Liabilities: | |||||||||||||||||||
Future policy benefits - embedded derivatives associated with fixed index annuity products | (43.3 | ) | 1.3 | (43.1 | ) | 15.9 | (69.2 | ) | |||||||||||
At March 31, 2018, 58 percent of our Level 3 fixed maturities, available for sale, were investment grade and 85 percent of our Level 3 fixed maturities, available for sale, consisted of corporate securities.
Realized and unrealized investment gains and losses presented in the preceding tables represent gains and losses during the time the applicable financial instruments were classified as Level 3.
Realized and unrealized gains (losses) on Level 3 assets are primarily reported in either net investment income for policyholder and other special-purpose portfolios, net realized investment gains (losses) or insurance policy benefits within the consolidated statement of operations or accumulated other comprehensive income within shareholders' equity based on the appropriate accounting treatment for the instrument.
The amount presented for gains (losses) included in our net loss for assets and liabilities still held as of the reporting date primarily represents impairments for fixed maturities, available for sale, changes in fair value of trading securities and certain derivatives and changes in fair value of embedded derivative instruments included in liabilities for insurance products that exist as of the reporting date.
47
CNO FINANCIAL GROUP, INC. AND SUBSIDIARIES
Notes to Consolidated Financial Statements
(unaudited)
___________________
The following table provides additional information about the significant unobservable (Level 3) inputs developed internally by the Company to determine fair value for certain assets and liabilities carried at fair value at March 31, 2018 (dollars in millions):
Fair value at March 31, 2018 | Valuation techniques | Unobservable inputs | Range (weighted average) | ||||||
Assets: | |||||||||
Corporate securities (a) | $ | 146.7 | Discounted cash flow analysis | Discount margins | 1.35% - 93.32% (7.69%) | ||||
Corporate securities (b) | .4 | Recovery method | Percent of recovery expected | 0% - 5% (5%) | |||||
Asset-backed securities (c) | 12.5 | Discounted cash flow analysis | Discount margins | 1.97% - 2.03% (2.03%) | |||||
Equity securities (d) | 1.2 | Market comparables | EBITDA multiples | 1.1X | |||||
Equity securities (e) | 20.2 | Recovery method | Percent of recovery expected | 59.1% | |||||
Other assets categorized as Level 3 (f) | 77.2 | Unadjusted third-party price source | Not applicable | Not applicable | |||||
Total | 258.2 | ||||||||
Liabilities: | |||||||||
Future policy benefits (g) | 1,315.4 | Discounted projected embedded derivatives | Projected portfolio yields | 5.15% - 5.61% (5.60%) | |||||
Discount rates | 1.13% - 2.69% (2.30%) | ||||||||
Surrender rates | 1.20% - 46.40% (12.30%) | ||||||||
________________________________
(a) | Corporate securities - The significant unobservable input used in the fair value measurement of our corporate securities is discount margin added to a riskless market yield. Significant increases (decreases) in discount margin in isolation would result in a significantly lower (higher) fair value measurement. |
(b) | Corporate securities - The significant unobservable input used in the fair value measurement of these corporate securities is percentage of recovery expected. Significant increases (decreases) in percentage of recovery expected in isolation would result in a significantly higher (lower) fair value measurement. |
(c) | Asset-backed securities - The significant unobservable input used in the fair value measurement of these asset-backed securities is discount margin added to a riskless market yield. Significant increases (decreases) in discount margin in isolation would result in a significantly lower (higher) fair value measurement. |
(d) | Equity securities - The significant unobservable input used in the fair value measurement of these equity securities is multiples of earnings before interest, taxes, depreciation and amortization ("EBITDA"). Generally, increases (decreases) in the EBITDA multiples would result in higher (lower) fair value measurements. |
(e) | Equity securities - The significant unobservable input used in the fair value measurement of these equity securities is percentage of recovery expected. Significant increases (decreases) in percentage of recovery expected in isolation would result in a significantly higher (lower) fair value measurement. |
(f) | Other assets categorized as Level 3 - For these assets, there were no adjustments to quoted market prices obtained from third-party pricing sources. |
(g) | Future policy benefits - The significant unobservable inputs used in the fair value measurement of our embedded derivatives associated with fixed index annuity products are projected portfolio yields, discount rates and surrender rates. Increases (decreases) in projected portfolio yields in isolation would lead to a higher (lower) fair value measurement. The discount rate is based on the Treasury rate adjusted by a margin. Increases (decreases) in the discount rates would lead to a lower (higher) fair value measurement. Assumed surrender rates are used to project how long the contracts remain in force. Generally, the longer the contracts are assumed to be in force the higher the fair value of the embedded derivative. |
48
CNO FINANCIAL GROUP, INC. AND SUBSIDIARIES
Notes to Consolidated Financial Statements
(unaudited)
___________________
The following table provides additional information about the significant unobservable (Level 3) inputs developed internally by the Company to determine fair value for certain assets and liabilities carried at fair value at December 31, 2017 (dollars in millions):
Fair value at December 31, 2017 | Valuation techniques | Unobservable inputs | Range (weighted average) | ||||||
Assets: | |||||||||
Corporate securities (a) | $ | 149.2 | Discounted cash flow analysis | Discount margins | 1.45% - 71.29% (6.96%) | ||||
Corporate securities (b) | 2.8 | Recovery method | Percent of recovery expected | 0% - 21.73% (18.42%) | |||||
Asset-backed securities (c) | 24.2 | Discounted cash flow analysis | Discount margins | 1.80% - 3.71% (2.67%) | |||||
Equity securities (d) | 1.1 | Market comparables | EBITDA multiples | 1.1X | |||||
Equity securities (e) | 20.1 | Recovery method | Percent of recovery expected | 59.1% | |||||
Other assets categorized as Level 3 (f) | 87.2 | Unadjusted third-party price source | Not applicable | Not applicable | |||||
Total | 284.6 | ||||||||
Liabilities: | |||||||||
Future policy benefits (g) | 1,334.8 | Discounted projected embedded derivatives | Projected portfolio yields | 5.15% - 5.61% (5.60%) | |||||
Discount rates | 0.92% - 2.51% (2.00%) | ||||||||
Surrender rates | 1.20% - 46.40% (12.30%) | ||||||||
________________________________
(a) | Corporate securities - The significant unobservable input used in the fair value measurement of our corporate securities is discount margin added to a riskless market yield. Significant increases (decreases) in discount margin in isolation would result in a significantly lower (higher) fair value measurement. |
(b) | Corporate securities - The significant unobservable input used in the fair value measurement of these corporate securities is percentage of recovery expected. Significant increases (decreases) in percentage of recovery expected in isolation would result in a significantly higher (lower) fair value measurement. |
(c) | Asset-backed securities - The significant unobservable input used in the fair value measurement of these asset-backed securities is discount margin added to a riskless market yield. Significant increases (decreases) in discount margin in isolation would result in a significantly lower (higher) fair value measurement. |
(d) | Equity securities - The significant unobservable input used in the fair value measurement of these equity securities is EBITDA multiples. Generally, increases (decreases) in EBITDA multiples would result in higher (lower) fair value measurements. |
(e) | Equity securities - The significant unobservable input used in the fair value measurement of these equity securities is percentage of recovery expected. Significant increases (decreases) in percentage of recovery expected in isolation would result in a significantly higher (lower) fair value measurement. |
(f) | Other assets categorized as Level 3 - For these assets, there were no adjustments to quoted market prices obtained from third-party pricing sources. |
(g) | Future policy benefits - The significant unobservable inputs used in the fair value measurement of our embedded derivatives associated with fixed index annuity products are projected portfolio yields, discount rates and surrender rates. Increases (decreases) in projected portfolio yields in isolation would lead to a higher (lower) fair value measurement. The discount rate is based on the Treasury rate adjusted by a margin. Increases (decreases) in the discount rates would lead to a lower (higher) fair value measurement. Assumed surrender rates are used to project how long the contracts remain in force. Generally, the longer the contracts are assumed to be in force the higher the fair value of the embedded derivative. |
49
CNO FINANCIAL GROUP, INC. AND SUBSIDIARIES
___________________
ITEM 2. | MANAGEMENT'S DISCUSSION AND ANALYSIS OF CONSOLIDATED FINANCIAL CONDITION AND RESULTS OF OPERATIONS. |
In this section, we review the consolidated financial condition of CNO at March 31, 2018, and its consolidated results of operations for the three months ended March 31, 2018 and 2017, and, where appropriate, factors that may affect future financial performance. Please read this discussion in conjunction with the accompanying consolidated financial statements and notes.
CAUTIONARY STATEMENT REGARDING FORWARD-LOOKING STATEMENTS
Our statements, trend analyses and other information contained in this report and elsewhere (such as in filings by CNO with the SEC, press releases, presentations by CNO or its management or oral statements) relative to markets for CNO's products and trends in CNO's operations or financial results, as well as other statements, contain forward-looking statements within the meaning of the federal securities laws and the Private Securities Litigation Reform Act of 1995. Forward-looking statements typically are identified by the use of terms such as "anticipate," "believe," "plan," "estimate," "expect," "project," "intend," "may," "will," "would," "contemplate," "possible," "attempt," "seek," "should," "could," "goal," "target," "on track," "comfortable with," "optimistic," "guidance," "outlook" and similar words, although some forward-looking statements are expressed differently. You should consider statements that contain these words carefully because they describe our expectations, plans, strategies and goals and our beliefs concerning future business conditions, our results of operations, financial position, and our business outlook or they state other "forward-looking" information based on currently available information. The "Risk Factors" section of our 2017 Annual Report on Form 10-K provides examples of risks, uncertainties and events that could cause our actual results to differ materially from the expectations expressed in our forward-looking statements. Assumptions and other important factors that could cause our actual results to differ materially from those anticipated in our forward-looking statements include, among other things:
• | changes in or sustained low interest rates causing reductions in investment income, the margins of our fixed annuity and life insurance businesses, and sales of, and demand for, our products; |
• | expectations of lower future investment earnings may cause us to accelerate amortization, write down the balance of insurance acquisition costs or establish additional liabilities for insurance products; |
• | general economic, market and political conditions and uncertainties, including the performance and fluctuations of the financial markets which may affect the value of our investments as well as our ability to raise capital or refinance existing indebtedness and the cost of doing so; |
• | the ultimate outcome of lawsuits filed against us and other legal and regulatory proceedings to which we are subject; |
• | our ability to make anticipated changes to certain non-guaranteed elements of our life insurance products; |
• | our ability to obtain adequate and timely rate increases on our health products, including our long-term care business; |
• | the receipt of any required regulatory approvals for dividend and surplus debenture interest payments from our insurance subsidiaries; |
• | mortality, morbidity, the increased cost and usage of health care services, persistency, the adequacy of our previous reserve estimates and other factors which may affect the profitability of our insurance products; |
• | changes in our assumptions related to deferred acquisition costs or the present value of future profits; |
• | the recoverability of our deferred tax assets and the effect of potential ownership changes and tax rate changes on their value; |
• | changes to our estimates of the impact of comprehensive federal tax legislation related to the Tax Reform Act; |
• | our assumption that the positions we take on our tax return filings will not be successfully challenged by the IRS; |
50
CNO FINANCIAL GROUP, INC. AND SUBSIDIARIES
___________________
• | changes in accounting principles and the interpretation thereof; |
• | our ability to continue to satisfy the financial ratio and balance requirements and other covenants of our debt agreements; |
• | our ability to achieve anticipated expense reductions and levels of operational efficiencies including improvements in claims adjudication and continued automation and rationalization of operating systems; |
• | performance and valuation of our investments, including the impact of realized losses (including other-than-temporary impairment charges); |
• | our ability to identify products and markets in which we can compete effectively against competitors with greater market share, higher ratings, greater financial resources and stronger brand recognition; |
• | our ability to generate sufficient liquidity to meet our debt service obligations and other cash needs; |
• | changes in capital deployment opportunities; |
• | our ability to maintain effective controls over financial reporting; |
• | our ability to continue to recruit and retain productive agents and distribution partners; |
• | customer response to new products, distribution channels and marketing initiatives; |
• | our ability to achieve additional upgrades of the financial strength ratings of CNO and our insurance company subsidiaries as well as the impact of our ratings on our business, our ability to access capital, and the cost of capital; |
• | regulatory changes or actions, including: those relating to regulation of the financial affairs of our insurance companies, such as the calculation of risk-based capital and minimum capital requirements, and payment of dividends and surplus debenture interest to us; regulation of the sale, underwriting and pricing of products; and health care regulation affecting health insurance products; |
• | changes in the Federal income tax laws and regulations which may affect or eliminate the relative tax advantages of some of our products or affect the value of our deferred tax assets; |
• | availability and effectiveness of reinsurance arrangements, as well as the impact of any defaults or failure of reinsurers to perform; |
• | the amount we may need to pay to a reinsurer and the earnings charge we may incur in connection with a long-term care reinsurance transaction; |
• | the performance of third party service providers and potential difficulties arising from outsourcing arrangements; |
• | the growth rate of sales, collected premiums, annuity deposits and assets; |
• | interruption in telecommunication, information technology or other operational systems or failure to maintain the security, confidentiality or privacy of sensitive data on such systems; |
• | events of terrorism, cyber attacks, natural disasters or other catastrophic events, including losses from a disease pandemic; |
• | ineffectiveness of risk management policies and procedures in identifying, monitoring and managing risks; and |
• | the risk factors or uncertainties listed from time to time in our filings with the SEC. |
Other factors and assumptions not identified above are also relevant to the forward-looking statements, and if they prove incorrect, could also cause actual results to differ materially from those projected.
51
CNO FINANCIAL GROUP, INC. AND SUBSIDIARIES
___________________
All written or oral forward-looking statements attributable to us are expressly qualified in their entirety by the foregoing cautionary statement. Our forward-looking statements speak only as of the date made. We assume no obligation to update or to publicly announce the results of any revisions to any of the forward-looking statements to reflect actual results, future events or developments, changes in assumptions or changes in other factors affecting the forward-looking statements.
The reporting of risk-based capital ("RBC") measures is not intended for the purpose of ranking any insurance company or for use in connection with any marketing, advertising or promotional activities.
OVERVIEW
We are a holding company for a group of insurance companies operating throughout the United States that develop, market and administer health insurance, annuity, individual life insurance and other insurance products. We focus on serving the senior and middle-income markets, which we believe are attractive, underserved, high growth markets. We sell our products through three distribution channels: career agents, independent producers (some of whom sell one or more of our product lines exclusively) and direct marketing.
The Company’s insurance segments are described below:
• | Bankers Life, which markets and distributes Medicare supplement insurance, interest-sensitive life insurance, traditional life insurance, fixed annuities and long-term care insurance products to the middle-income senior market through a dedicated field force of career agents, financial and investment advisors, and sales managers supported by a network of community-based sales offices. The Bankers Life segment includes primarily the business of Bankers Life. Bankers Life also has various distribution and marketing agreements with other insurance companies to use Bankers Life's career agents to distribute Medicare Advantage and prescription drug plan products in exchange for a fee. |
• | Washington National, which markets and distributes supplemental health (including specified disease, accident and hospital indemnity insurance products) and life insurance to middle-income consumers at home and at the worksite. These products are marketed through Performance Matters Associates, Inc. ("PMA") and through independent marketing organizations and insurance agencies including worksite marketing. The products being marketed are underwritten by Washington National. This segment's business also includes certain closed blocks of annuities and Medicare supplement policies which are no longer being actively marketed by this segment and were primarily issued or acquired by Washington National. |
• | Colonial Penn, which markets primarily graded benefit and simplified issue life insurance directly to customers in the senior middle-income market through television advertising, direct mail, the internet and telemarketing. The Colonial Penn segment includes primarily the business of Colonial Penn. |
• | Long-term care in run-off consists of the long-term care business that was recaptured due to the termination of certain reinsurance agreements effective September 30, 2016. This business is not actively marketed and was issued or acquired by Washington National and BCLIC. |
52
CNO FINANCIAL GROUP, INC. AND SUBSIDIARIES
___________________
The following summarizes our earnings for the three months ending March 31, 2018 and 2017 (dollars in millions, except per share data):
Three months ended | |||||||
March 31, | |||||||
2018 | 2017 | ||||||
Adjusted EBIT (a non-GAAP measure) (a): | |||||||
Bankers Life | $ | 89.5 | $ | 89.7 | |||
Washington National | 34.3 | 23.5 | |||||
Colonial Penn | (1.5 | ) | (.3 | ) | |||
Long-term care in run-off | — | .4 | |||||
Adjusted EBIT from business segments | 122.3 | 113.3 | |||||
Corporate operations, excluding corporate interest expense | (15.5 | ) | (8.9 | ) | |||
Adjusted EBIT | 106.8 | 104.4 | |||||
Corporate interest expense | (11.9 | ) | (11.5 | ) | |||
Operating earnings before taxes | 94.9 | 92.9 | |||||
Tax expense on operating income | 21.0 | 33.1 | |||||
Net operating income (a) | 73.9 | 59.8 | |||||
Net realized investment gains (losses) (net of related amortization) | (15.2 | ) | 7.9 | ||||
Fair value changes in embedded derivative liabilities (net of related amortization) | 25.1 | (4.4 | ) | ||||
Other | 3.3 | .3 | |||||
Non-operating income before taxes | 13.2 | 3.8 | |||||
Income tax expense on non-operating income | 2.8 | 1.3 | |||||
Net non-operating income | 10.4 | 2.5 | |||||
Net income | $ | 84.3 | $ | 62.3 | |||
Per diluted share: | |||||||
Net operating income | $ | .44 | $ | .34 | |||
Net realized investment gains (losses) (net of related amortization and taxes) | (.07 | ) | .03 | ||||
Fair value changes in embedded derivative liabilities (net of related amortization and taxes) | .12 | (.01 | ) | ||||
Other | .01 | — | |||||
Net income | $ | .50 | $ | .36 | |||
53
CNO FINANCIAL GROUP, INC. AND SUBSIDIARIES
___________________
____________
(a) | Management believes that an analysis of net operating income provides a clearer comparison of the operating results of the Company from period to period because it excludes: (i) net realized investment gains or losses, net of related amortization; (ii) fair value changes due to fluctuations in the interest rates used to discount embedded derivative liabilities related to our fixed index annuities, net of related amortization; (iii) fair value changes related to the agent deferred compensation plan; and (iv) other non-operating items consisting primarily of earnings attributable to variable interest entities. Net realized investment gains or losses include: (i) gains or losses on the sales of investments; (ii) other-than-temporary impairments recognized through net income; (iii) changes in fair value of certain fixed maturity investments with embedded derivatives; and (iv) changes in the fair value of equity securities. Adjusted EBIT is presented as net operating income excluding corporate interest expense and income tax expense. The table above reconciles the non-GAAP measures to the corresponding GAAP measure. |
In addition, management uses these non-GAAP financial measures in its budgeting process, financial analysis of segment performance and in assessing the allocation of resources. We believe these non-GAAP financial measures enhance an investor’s understanding of our financial performance and allows them to make more informed judgments about the Company as a whole. These measures also highlight operating trends that might not otherwise be apparent. However, Adjusted EBIT and net operating income are not measurements of financial performance under GAAP and should not be considered as alternatives to cash flow from operating activities, as measures of liquidity, or as alternatives to net income as measures of our operating performance or any other measures of performance derived in accordance with GAAP. In addition, Adjusted EBIT and net operating income should not be construed as an inference that our future results will be unaffected by unusual or non-recurring items. Adjusted EBIT and net operating income have limitations as analytical tools, and you should not consider such measures either in isolation or as substitutes for analyzing our results as reported under GAAP. Our definitions and calculation of Adjusted EBIT and net operating income are not necessarily comparable to other similarly titled measures used by other companies due to different methods of calculation.
CRITICAL ACCOUNTING POLICIES
Refer to "Critical Accounting Policies" in our 2017 Annual Report on Form 10-K for information on our other accounting policies that we consider critical in preparing our consolidated financial statements.
54
CNO FINANCIAL GROUP, INC. AND SUBSIDIARIES
___________________
RESULTS OF OPERATIONS
The following tables and narratives summarize the operating results of our segments (dollars in millions):
Three months ended | |||||||
March 31, | |||||||
2018 | 2017 | ||||||
Pre-tax operating earnings (a non-GAAP measure) (a): | |||||||
Bankers Life | $ | 89.5 | $ | 89.7 | |||
Washington National | 34.3 | 23.5 | |||||
Colonial Penn | (1.5 | ) | (.3 | ) | |||
Long-term care in run-off | — | .4 | |||||
Corporate operations | (27.4 | ) | (20.4 | ) | |||
94.9 | 92.9 | ||||||
Net realized investment gains (losses), net of related amortization: | |||||||
Bankers Life | (6.7 | ) | 1.7 | ||||
Washington National | (4.6 | ) | 2.0 | ||||
Colonial Penn | (.4 | ) | (.1 | ) | |||
Long-term care in run-off | .6 | (.3 | ) | ||||
Corporate operations | (4.1 | ) | 4.6 | ||||
(15.2 | ) | 7.9 | |||||
Fair value changes in embedded derivative liabilities, net of related amortization: | |||||||
Bankers Life | 24.8 | (4.4 | ) | ||||
Washington National | .3 | — | |||||
25.1 | (4.4 | ) | |||||
Earnings attributable to VIEs: | |||||||
Corporate operations | 3.3 | .3 | |||||
Income (loss) before income taxes: | |||||||
Bankers Life | 107.6 | 87.0 | |||||
Washington National | 30.0 | 25.5 | |||||
Colonial Penn | (1.9 | ) | (.4 | ) | |||
Long-term care in run-off | .6 | .1 | |||||
Corporate operations | (28.2 | ) | (15.5 | ) | |||
Income before income taxes | $ | 108.1 | $ | 96.7 | |||
55
CNO FINANCIAL GROUP, INC. AND SUBSIDIARIES
___________________
____________________
(a) | These non-GAAP measures as presented in the above table and in the following segment financial data and discussions of segment results exclude net realized investment gains (losses), fair value changes in embedded derivative liabilities, net of related amortization, fair value changes related to the agent deferred compensation plan and earnings attributable to VIEs and before income taxes. These are considered non-GAAP financial measures. A non-GAAP measure is a numerical measure of a company's performance, financial position, or cash flows that excludes or includes amounts that are normally excluded or included in the most directly comparable measure calculated and presented in accordance with GAAP. |
These non-GAAP financial measures of "pre-tax operating earnings" differ from "income (loss) before income taxes" as presented in our consolidated statement of operations prepared in accordance with GAAP due to the exclusion of realized investment gains (losses), fair value changes in embedded derivative liabilities, net of related amortization, fair value changes related to the agent deferred compensation plan and earnings attributable to VIEs. We measure segment performance excluding these items because we believe that this performance measure is a better indicator of the ongoing businesses and trends in our business. Our primary investment focus is on investment income to support our liabilities for insurance products as opposed to the generation of realized investment gains (losses), and a long-term focus is necessary to maintain profitability over the life of the business. Realized investment gains (losses), fair value changes in embedded derivative liabilities, fair value changes related to the agent deferred compensation plan and earnings attributable to VIEs depend on market conditions and do not necessarily relate to decisions regarding the underlying business of our segments. However, "pre-tax operating earnings" does not replace "income (loss) before income taxes" as a measure of overall profitability.
We may experience realized investment gains (losses), which may affect future earnings levels since our underlying business is long-term in nature and we need to earn the assumed interest rates on the investments backing our liabilities for insurance products to maintain the profitability of our business. In addition, management uses this non-GAAP financial measure in its budgeting process, financial analysis of segment performance and in assessing the allocation of resources. We believe these non-GAAP financial measures enhance an investor's understanding of our financial performance and allows them to make more informed judgments about the Company as a whole. These measures also highlight operating trends that might not otherwise be apparent. The table above reconciles the non-GAAP measure to the corresponding GAAP measure.
General: CNO is the top tier holding company for a group of insurance companies operating throughout the United States that develop, market and administer health insurance, annuity, individual life insurance and other insurance products. We distribute these products through our Bankers Life segment, which utilizes a career agency force, through our Washington National segment, which utilizes independent producers and through our Colonial Penn segment, which utilizes direct response marketing. In the fourth quarter of 2016, we began reporting as an additional business segment, the long-term care block that was recaptured in September 2016.
56
CNO FINANCIAL GROUP, INC. AND SUBSIDIARIES
___________________
Bankers Life (dollars in millions)
Three months ended | |||||||
March 31, | |||||||
2018 | 2017 | ||||||
Premium collections: | |||||||
Annuities | $ | 251.4 | $ | 257.5 | |||
Medicare supplement and other supplemental health | 305.9 | 316.0 | |||||
Life | 115.2 | 114.3 | |||||
Total collections | $ | 672.5 | $ | 687.8 | |||
Average liabilities for insurance products: | |||||||
Fixed index annuities | $ | 5,564.6 | $ | 4,871.4 | |||
Fixed interest annuities | 2,713.7 | 3,012.3 | |||||
SPIAs and supplemental contracts: | |||||||
Mortality based | 152.4 | 164.9 | |||||
Deposit based | 144.9 | 151.6 | |||||
Health: | |||||||
Long-term care | 5,056.1 | 4,866.1 | |||||
Medicare supplement | 324.6 | 343.4 | |||||
Other health | 58.8 | 54.1 | |||||
Life: | |||||||
Interest sensitive | 808.5 | 757.3 | |||||
Non-interest sensitive | 1,134.7 | 1,062.2 | |||||
Total average liabilities for insurance products, net of reinsurance ceded | $ | 15,958.3 | $ | 15,283.3 | |||
Revenues: | |||||||
Insurance policy income | $ | 410.7 | $ | 419.1 | |||
Net investment income: | |||||||
General account invested assets | 243.1 | 231.1 | |||||
Fixed index products | (5.2 | ) | 41.8 | ||||
Fee revenue and other income | 19.6 | 10.6 | |||||
Total revenues | 668.2 | 702.6 | |||||
Expenses: | |||||||
Insurance policy benefits | 373.7 | 367.6 | |||||
Amounts added to policyholder account balances: | |||||||
Cost of interest credited to policyholders | 24.9 | 26.5 | |||||
Cost of options to fund index credits, net of forfeitures | 17.1 | 14.9 | |||||
Market value changes credited to policyholders | (4.6 | ) | 42.2 | ||||
Amortization related to operations | 47.0 | 46.3 | |||||
Interest expense on investment borrowings | 6.1 | 4.2 | |||||
Other operating costs and expenses | 114.5 | 111.2 | |||||
Total benefits and expenses | 578.7 | 612.9 | |||||
Income before net realized investment gains (losses), net of related amortization, and fair value changes in embedded derivative liabilities, net of related amortization, and income taxes | 89.5 | 89.7 | |||||
Net realized investment gains (losses) | (6.7 | ) | 1.7 | ||||
Amortization related to net realized investment gains (losses) | — | — | |||||
Net realized investment gains (losses), net of related amortization | (6.7 | ) | 1.7 | ||||
Insurance policy benefits - fair value changes in embedded derivative liabilities | 30.1 | (5.4 | ) | ||||
Amortization related to fair value changes in embedded derivative liabilities | (5.3 | ) | 1.0 | ||||
Fair value changes in embedded derivative liabilities, net of related amortization | 24.8 | (4.4 | ) | ||||
Income before income taxes | $ | 107.6 | $ | 87.0 | |||
57
CNO FINANCIAL GROUP, INC. AND SUBSIDIARIES
___________________
Three months ended | |||||||
March 31, | |||||||
2018 | 2017 | ||||||
Health benefit ratios: | |||||||
All health lines: | |||||||
Insurance policy benefits | $ | 287.3 | $ | 290.5 | |||
Benefit ratio (a) | 95.1 | % | 93.2 | % | |||
Medicare supplement: | |||||||
Insurance policy benefits | $ | 141.2 | $ | 137.2 | |||
Benefit ratio (a) | 73.3 | % | 70.0 | % | |||
Long-term care: | |||||||
Insurance policy benefits | $ | 146.1 | $ | 153.3 | |||
Benefit ratio (a) | 133.4 | % | 132.6 | % | |||
Interest-adjusted benefit ratio (b) | 70.2 | % | 72.5 | % | |||
______________
(a) | We calculate benefit ratios by dividing the related product's insurance policy benefits by insurance policy income. |
(b) | We calculate the interest-adjusted benefit ratio (a non-GAAP measure) for Bankers Life's long-term care products by dividing such product's insurance policy benefits less the imputed interest income on the accumulated assets backing the insurance liabilities by policy income. These are considered non-GAAP financial measures. A non-GAAP measure is a numerical measure of a company's performance, financial position, or cash flows that excludes or includes amounts that are normally excluded or included in the most directly comparable measure calculated and presented in accordance with GAAP. |
These non-GAAP financial measures of "interest-adjusted benefit ratios" differ from "benefit ratios" due to the deduction of imputed interest income on the accumulated assets backing the insurance liabilities from the product's insurance policy benefits used to determine the ratio. Interest income is an important factor in measuring the performance of health products that are expected to be inforce for a longer duration of time, are not subject to unilateral changes in provisions (such as non-cancelable or guaranteed renewable contracts) and require the performance of various functions and services (including insurance protection) for an extended period of time. The net cash flows from long-term care products generally cause an accumulation of amounts in the early years of a policy (accounted for as reserve increases) that will be paid out as benefits in later policy years (accounted for as reserve decreases). Accordingly, as the policies age, the benefit ratio will typically increase, but the increase in benefits will be partially offset by the imputed interest income earned on the accumulated assets. The interest-adjusted benefit ratio reflects the effects of such interest income offset (which is equal to the tabular interest on the related insurance liabilities). Since interest income is an important factor in measuring the performance of this product, management believes a benefit ratio that includes the effect of interest income is useful in analyzing product performance. We utilize the interest-adjusted benefit ratio in measuring segment performance because we believe that this performance measure is a better indicator of the ongoing businesses and trends in the business. However, the "interest-adjusted benefit ratio" does not replace the "benefit ratio" as a measure of current period benefits to current period insurance policy income. Accordingly, management reviews both "benefit ratios" and "interest-adjusted benefit ratios" when analyzing the financial results attributable to these products. The imputed investment income earned on the accumulated assets backing Bankers Life's long-term care reserves was $69.2 million and $69.5 million in the three months ended March 31, 2018 and 2017, respectively.
Total premium collections were $672.5 million in the first quarter of 2018, down 2.2 percent from 2017. See "Premium Collections" for further analysis of Bankers Life's premium collections.
Average liabilities for insurance products, net of reinsurance ceded were $16.0 billion in the first quarter of 2018, up 4.4 percent from 2017. Such average liabilities for long-term care products were increased by $148.6 million and $1.2 million in the first quarters of 2018 and 2017, respectively, to reflect the premium deficiencies that would exist if unrealized gains on the assets backing such products had been realized and the proceeds from the sales of such assets were invested at then current yields. Such increase is reflected as a reduction of accumulated other comprehensive income. Excluding the impact of the
58
CNO FINANCIAL GROUP, INC. AND SUBSIDIARIES
___________________
aforementioned item, the increase in average liabilities for insurance products was primarily due to new sales and the amounts added to policyholder account balances on interest-sensitive products.
Insurance policy income is comprised of premiums earned on policies which provide mortality or morbidity coverage and fees and other charges assessed on other policies.
Net investment income on general account invested assets (which excludes income on policyholder portfolios) was $243.1 million in the first quarter of 2018, up 5.2 percent from 2017. In the three months ended March 31, 2018, net investment income reflects $8.4 million of higher investment income from alternative investments (reflecting higher returns and a higher average alternative investment balance) compared to the 2017 period. Such increases reflect higher returns from credit, private equity, and equity related strategies and a larger average alternative investment portfolio in the 2018 period. Prepayment income (including call premiums) was $3.5 million and $.5 million in the first quarters of 2018 and 2017, respectively.
Net investment income related to fixed index products represents the change in the estimated fair value of options which are purchased in an effort to offset or hedge certain potential benefits accruing to the policyholders of our fixed index products. Our fixed index products are designed so that investment income spread is expected to be more than adequate to cover the cost of the options and other costs related to these policies. Net investment income (loss) related to fixed index products was $(5.2) million and $41.8 million in the first quarters of 2018 and 2017, respectively. Such amounts were substantially offset by the corresponding charge (credit) to amounts added to policyholder account balances - market value changes credited to policyholders. Such income and related charges fluctuate based on the value of options embedded in the segment's fixed index annuity policyholder account balances subject to this benefit and to the performance of the index to which the returns on such products are linked.
Fee revenue and other income was $19.6 million and $10.6 million in the first quarters of 2018 and 2017, respectively. The increase in the 2018 period is primarily due to the adoption of the new revenue recognition guidance which was effective January 1, 2018. The new guidance accelerated the recognition of fee revenue related to various distribution and marketing agreements pursuant to which Bankers Life's career agents distribute third party products including prescription drug and Medicare Advantage plans. The annual fee income earned during a calendar year will not change, but the amount recognized during each quarterly period will vary based on the sales of such products. Fee revenue earned under such agreements was $15.8 million in the first quarter of 2018 (of which, $7.3 million was recognized pursuant to the new guidance) compared to $7.2 million in the first quarter of 2017.
Insurance policy benefits fluctuated as a result of the factors summarized below for benefit ratios. Benefit ratios are calculated by dividing the related insurance product’s insurance policy benefits by insurance policy income.
The Medicare supplement business consists of both individual and group policies. Government regulations generally require us to attain and maintain a ratio of total benefits incurred to total premiums earned (excluding changes in policy benefit reserves), after three years from the original issuance of the policy and over the lifetime of the policy, of not less than 65 percent on individual products and not less than 75 percent on group products, as determined in accordance with statutory accounting principles. Since the insurance product liabilities we establish for Medicare supplement business are subject to significant estimates, the ultimate claim liability we incur for a particular period is likely to be different than our initial estimate. Our benefit ratios were 73.3 percent and 70.0 percent in the first quarters of 2018 and 2017, respectively. The benefit ratio in the 2018 period reflected lower margins due to the implementation of the Medicare crossover claims process and favorable claim experience in the first quarter of 2017. The Medicare crossover process is a claims payment platform that provides for straight through processing of provider claims. As expected, this new process increased the reporting of smaller claims, resulting in a higher benefit ratio in the first qurter of 2018. Implementation of this process is expected to increase efficiency, improve payment accuracy and increase customer satisfaction over time. We continue to expect the Medicare supplement benefit ratio to be in the range of 71 percent to 74 percent during the remainder of 2018.
The net cash flows from our long-term care products generally cause an accumulation of amounts in the early years of a policy (accounted for as reserve increases) which will be paid out as benefits in later policy years (accounted for as reserve decreases). Accordingly, as the policies age, the benefit ratio typically increases, but the increase in reserves is partially offset by investment income earned on the accumulated assets. The benefit ratio on our long-term care business in the Bankers Life segment was 133.4 percent and 132.6 percent in the first quarters of 2018 and 2017, respectively. The interest-adjusted benefit
59
CNO FINANCIAL GROUP, INC. AND SUBSIDIARIES
___________________
ratio on this business was 70.2 percent and 72.5 percent in the first quarters of 2018 and 2017, respectively. The interest-adjusted benefit ratio in the first quarters of 2018 and 2017, was favorably impacted by reserve releases of $2.6 million and $2.0 million, respectively, related to policyholder decisions to surrender or reduce coverage following rate increases. The interest-adjusted benefit ratio in the three months ended March 31, 2018 and 2017, excluding the favorable reserve releases related to rate increases was 72.6 percent and 74.2 percent, respectively. The interest-adjusted benefit ratio in the first quarter of 2018 reflected favorable claim experience. We continue to expect the long-term care interest-adjusted benefit ratio to be in the range of 75 percent to 80 percent during the remainder of 2018.
Amounts added to policyholder account balances - cost of interest credited to policyholders were $24.9 million and $26.5 million in the first quarters of 2018 and 2017, respectively. The weighted average crediting rate for these products was 2.8 percent in both the first quarters of 2018 and 2017. The average liabilities of the fixed interest annuity block were $2.7 billion and $3.0 billion in the first three months of 2018 and 2017, respectively. The decrease in the liabilities related to these annuities reflects the lower sales of these products in the current low interest rate environment and consumer preference for fixed index products.
Amounts added to policyholder account balances for fixed index products represent a guaranteed minimum rate of return and a higher potential return that is based on a percentage (the "participation rate") of the amount of increase in the value of a particular index, such as the S&P 500 Index, over a specified period. Such amounts include our cost to fund the annual index credits, net of policies that are canceled prior to their anniversary date (classified as cost of options to fund index credits, net of forfeitures). Market value changes in the underlying indices during a specified period of time are classified as market value changes credited to policyholders. Such market value changes are generally offset by the net investment income related to fixed index products discussed above.
Amortization related to operations includes amortization of deferred acquisition costs and the present value of future profits. Deferred acquisition costs and the present value of future profits are collectively referred to as "insurance acquisition costs". Insurance acquisition costs are generally amortized either: (i) in relation to the estimated gross profits for interest-sensitive life and annuity products; or (ii) in relation to actual and expected premium revenue for other products. In addition, for interest-sensitive life and annuity products, we are required to adjust the total amortization recorded to date through the statement of operations if actual experience or other evidence suggests that earlier estimates of future gross profits should be revised. Accordingly, amortization for interest-sensitive life and annuity products is dependent on the profits realized during the period and on our expectation of future profits. For other products, we amortize insurance acquisition costs in relation to actual and expected premium revenue, and amortization is only adjusted if expected premium revenue changes or if we determine the balance of these costs is not recoverable from future profits. Bankers Life’s amortization expense was $47.0 million and $46.3 million in the first quarters of 2018 and 2017, respectively.
Interest expense on investment borrowings represents interest expense on collateralized borrowings as further described in the note to the consolidated financial statements entitled "Investment Borrowings". The increase in interest expense in the 2018 period is primarily due to higher interest rates on the variable rate investment borrowings.
60
CNO FINANCIAL GROUP, INC. AND SUBSIDIARIES
___________________
Other operating costs and expenses in our Bankers Life segment were $114.5 million in the first quarter of 2018, up 3.0 percent from 2017. In order to be consistent with the additional fee revenue recognized in the first quarter of 2018 pursuant to the new guidance described above under fee revenue and other income, we recognized additional distribution expense of $8.8 million (included in other operating expenses) related to the sales of such third party products. Such distribution expenses in the 2017 period were amortized using a method that was different than the method of recognizing revenues. The annual distribution expense incurred during the calendar year will not change as a result of the adoption of the new guidance, but the amount recognized each quarterly period will correspond directly with the fee revenue recognized. Such expenses in the first quarter of 2017 include $3.5 million for estimated future state guaranty association assessments, net of premium tax offsets, related to the liquidation of Penn Treaty Network America Insurance Company ("Penn Treaty"). Other operating costs and expenses include the following (dollars in millions):
Three months ended | |||||||
March 31, | |||||||
2018 | 2017 | ||||||
Commission expense and agent manager benefits | $ | 17.5 | $ | 18.3 | |||
Other operating expenses | 97.0 | 92.9 | |||||
Total | $ | 114.5 | $ | 111.2 | |||
Net realized investment gains (losses) fluctuate from period to period. During the first three months of 2018, we recognized net realized investment losses of $6.7 million, which were comprised of: (i) $.2 million of net losses from the sales of investments; (ii) a $6.4 million unfavorable change in the fair value of equity securities; and (iii) the decrease in fair value of certain fixed maturity investments with embedded derivatives of $.1 million. During the first three months of 2017, we recognized net realized investment gains of $1.7 million, which were comprised of: (i) $.4 million of net losses from the sales of investments; and (ii) the increase in fair value of certain fixed maturity investments with embedded derivatives of $2.1 million.
Amortization related to net realized investment gains (losses) is the increase or decrease in the amortization of insurance acquisition costs which results from realized investment gains or losses. When we sell securities which back our interest-sensitive life and annuity products at a gain (loss) and reinvest the proceeds at a different yield, we increase (reduce) the amortization of insurance acquisition costs in order to reflect the change in estimated gross profits due to the gains (losses) realized and the resulting effect on estimated future yields. Sales of fixed maturity investments resulted in no change in the amortization of insurance acquisition costs in both the first quarters of 2018 and 2017.
Insurance policy benefits - fair value changes in embedded derivative liabilities represents fair value changes due to fluctuations in the interest rates used to discount embedded derivative liabilities related to our fixed index annuities.
Amortization related to fair value changes in embedded derivative liabilities is the increase or decrease in the amortization of insurance acquisition costs which results from changes in interest rates used to discount embedded derivative liabilities related to our fixed index annuities.
61
CNO FINANCIAL GROUP, INC. AND SUBSIDIARIES
___________________
Washington National (dollars in millions)
Three months ended | |||||||
March 31, | |||||||
2018 | 2017 | ||||||
Premium collections: | |||||||
Supplemental health and other health | $ | 155.7 | $ | 150.6 | |||
Medicare supplement | 12.5 | 14.4 | |||||
Life | 7.6 | 7.9 | |||||
Annuity | .4 | .2 | |||||
Total collections | $ | 176.2 | $ | 173.1 | |||
Average liabilities for insurance products: | |||||||
Fixed index annuities | $ | 295.4 | $ | 326.1 | |||
Fixed interest annuities | 93.8 | 100.8 | |||||
SPIAs and supplemental contracts: | |||||||
Mortality based | 226.9 | 233.5 | |||||
Deposit based | 269.8 | 271.9 | |||||
Separate Accounts | 4.8 | 4.6 | |||||
Health: | |||||||
Supplemental health | 2,814.7 | 2,680.2 | |||||
Medicare supplement | 22.1 | 26.9 | |||||
Other health | 12.5 | 13.8 | |||||
Life: | |||||||
Interest sensitive | 149.5 | 149.2 | |||||
Non-interest sensitive | 174.4 | 175.3 | |||||
Total average liabilities for insurance products, net of reinsurance ceded | $ | 4,063.9 | $ | 3,982.3 | |||
Revenues: | |||||||
Insurance policy income | $ | 171.0 | $ | 167.1 | |||
Net investment income: | |||||||
General account invested assets | 65.4 | 63.4 | |||||
Fixed index products | (.4 | ) | 2.6 | ||||
Trading account income (loss) related to policyholder accounts | .4 | 1.4 | |||||
Fee revenue and other income | .2 | .3 | |||||
Total revenues | 236.6 | 234.8 | |||||
Expenses: | |||||||
Insurance policy benefits | 134.1 | 137.8 | |||||
Amounts added to policyholder account balances: | |||||||
Cost of interest credited to policyholders | 3.1 | 3.3 | |||||
Cost of options to fund index credits, net of forfeitures | .9 | 1.0 | |||||
Market value changes credited to policyholders | (.4 | ) | 4.6 | ||||
Amortization related to operations | 14.5 | 14.3 | |||||
Interest expense on investment borrowings | 2.1 | 1.3 | |||||
Other operating costs and expenses | 48.0 | 49.0 | |||||
Total benefits and expenses | 202.3 | 211.3 | |||||
Income before net realized investment gains (losses) and fair value changes in embedded derivative liabilities, net of related amortization, and income taxes | 34.3 | 23.5 | |||||
Net realized investment gains (losses) | (4.6 | ) | 2.0 | ||||
Amortization related to net realized investment gains (losses) | — | — | |||||
Net realized investment gains (losses), net of related amortization | (4.6 | ) | 2.0 | ||||
Insurance policy benefits - fair value changes in embedded derivative liabilities | .8 | (.1 | ) | ||||
Amortization related to fair value changes in embedded derivative liabilities | (.5 | ) | .1 | ||||
Fair value changes in embedded derivative liabilities, net of related amortization | .3 | — | |||||
Income before income taxes | $ | 30.0 | $ | 25.5 | |||
62
CNO FINANCIAL GROUP, INC. AND SUBSIDIARIES
___________________
Three months ended | |||||||
March 31, | |||||||
2018 | 2017 | ||||||
Health benefit ratios: | |||||||
Supplemental health and other: | |||||||
Insurance policy benefits | $ | 118.5 | $ | 123.2 | |||
Benefit ratio (a) | 78.3 | % | 84.6 | % | |||
Interest-adjusted benefit ratio (b) | 54.4 | % | 60.6 | % | |||
Medicare supplement: | |||||||
Insurance policy benefits | $ | 8.4 | $ | 9.5 | |||
Benefit ratio (a) | 66.5 | % | 66.8 | % | |||
_________________
(a) | We calculate benefit ratios by dividing the related product’s insurance policy benefits by insurance policy income. |
(b) | We calculate the interest-adjusted benefit ratio (a non-GAAP measure) for Washington National's supplemental health products by dividing such product’s insurance policy benefits less the imputed interest income on the accumulated assets backing the insurance liabilities by policy income. These are considered non-GAAP financial measures. A non-GAAP measure is a numerical measure of a company's performance, financial position, or cash flows that excludes or includes amounts that are normally excluded or included in the most directly comparable measure calculated and presented in accordance with GAAP. |
These non-GAAP financial measures of "interest-adjusted benefit ratios" differ from "benefit ratios" due to the deduction of imputed interest income on the accumulated assets backing the insurance liabilities from the product’s insurance policy benefits used to determine the ratio. Interest income is an important factor in measuring the performance of health products that are expected to be inforce for a longer duration of time, are not subject to unilateral changes in provisions (such as non-cancelable or guaranteed renewable contracts) and require the performance of various functions and services (including insurance protection) for an extended period of time. The net cash flows from supplemental health products generally cause an accumulation of amounts in the early years of a policy (accounted for as reserve increases) that will be paid out as benefits in later policy years (accounted for as reserve decreases). Accordingly, as the policies age, the benefit ratio will typically increase, but the increase in benefits will be partially offset by the imputed interest income earned on the accumulated assets. The interest-adjusted benefit ratio reflects the effects of such interest income offset (which is equal to the tabular interest on the related insurance liabilities). Since interest income is an important factor in measuring the performance of these products, management believes a benefit ratio that includes the effect of interest income is useful in analyzing product performance. We utilize the interest-adjusted benefit ratio in measuring segment performance because we believe that this performance measure is a better indicator of the ongoing businesses and trends in the business. However, the "interest-adjusted benefit ratio" does not replace the "benefit ratio" as a measure of current period benefits to current period insurance policy income. Accordingly, management reviews both "benefit ratios" and "interest-adjusted benefit ratios" when analyzing the financial results attributable to these products. The imputed investment income earned on the accumulated assets backing the supplemental health reserves was $36.2 million and $34.9 million in the three months ended March 31, 2018 and 2017, respectively.
Total premium collections were $176.2 million in the first quarter of 2018, up 1.8 percent from 2017 driven by sales and persistency of the segment's supplemental health block; partially offset by lower Medicare supplement collected premiums due to the run-off of this block of business. This segment no longer markets Medicare supplement products and no longer actively pursues sales of annuity products. See "Premium Collections" for further analysis of fluctuations in premiums collected by product.
Average liabilities for insurance products, net of reinsurance ceded were $4.1 billion in the first quarter of 2018, up 2.0 percent from 2017, reflecting an increase in the supplemental health block; partially offset by the run-off of the annuity blocks.
Insurance policy income is comprised of premiums earned on traditional insurance policies which provide mortality or morbidity coverage and fees and other charges assessed on other policies. Such income has increased in recent periods as
63
CNO FINANCIAL GROUP, INC. AND SUBSIDIARIES
___________________
supplemental health premiums have increased consistent with sales; partially offset by the decrease in Medicare supplement premiums.
Net investment income on general account invested assets (which excludes income on policyholder portfolios) was $65.4 million in the first quarter of 2018, up 3.2 percent from 2017. Prepayment income (including call premiums) was $.7 million and $.2 million in the first quarters of 2018 and 2017, respectively.
Net investment income related to fixed index products represents the change in the estimated fair value of options which are purchased in an effort to offset or hedge certain potential benefits accruing to the policyholders of our fixed index products. Our fixed index products are designed so that investment income spread is expected to be more than adequate to cover the cost of the options and other costs related to these policies. Net investment income (loss) related to fixed index products was $(.4) million and $2.6 million in the first quarters of 2018 and 2017, respectively. Such amounts were substantially offset by the corresponding charge to amounts added to policyholder account balances - market value changes credited to policyholders. Such income and related charges fluctuate based on the value of options embedded in the segment's fixed index annuity policyholder account balances subject to this benefit and to the performance of the index to which the returns on such products are linked.
Trading account income related to policyholder accounts represents the income on investments backing the market strategies of certain annuity products which provide for different rates of cash value growth based on the experience of a particular market strategy. The income on our trading account securities is designed to substantially offset certain amounts included in insurance policy benefits related to the aforementioned annuity products.
Insurance policy benefits fluctuated as a result of the factors summarized below. Benefit ratios are calculated by dividing the related insurance product's insurance policy benefits by insurance policy income.
Washington National's supplemental health products (including specified disease, accident and hospital indemnity products) generally provide fixed or limited benefits. For example, payments under cancer insurance policies are generally made directly to, or at the direction of, the policyholder following diagnosis of, or treatment for, a covered type of cancer. Approximately three-fourths of our supplemental health policies inforce (based on policy count) are sold with return of premium or cash value riders. The return of premium rider generally provides that after a policy has been inforce for a specified number of years or upon the policyholder reaching a specified age, we will pay to the policyholder, or a beneficiary under the policy, the aggregate amount of all premiums paid under the policy, without interest, less the aggregate amount of all claims incurred under the policy. The cash value rider is similar to the return of premium rider, but also provides for payment of a graded portion of the return of premium benefit if the policy terminates before the return of premium benefit is earned. Accordingly, the net cash flows from these products generally result in the accumulation of amounts in the early years of a policy (reflected in our earnings as reserve increases) which will be paid out as benefits in later policy years (reflected in our earnings as reserve decreases which offset the recording of benefit payments). As the policies age, the benefit ratio will typically increase, but the increase in benefits will be partially offset by investment income earned on the accumulated assets. The benefit ratio will fluctuate depending on the claim experience during the year.
Insurance margins (insurance policy income less insurance policy benefits) on supplemental health products were $32.8 million and $22.4 million in the first quarters of 2018 and 2017, respectively. The increase in margins on this block of business reflects favorable claims and favorable development of prior-period claim reserves in the first quarter of 2018. The interest-adjusted benefit ratio on this supplemental health business was 54.4 percent and 60.6 percent in the first quarters of 2018 and 2017, respectively. We continue to expect the supplemental health interest-adjusted benefit ratio to be in the range of 58 percent to 61 percent during the remainder of 2018.
Washington National's Medicare supplement business primarily consists of individual policies. The insurance product liabilities we establish for our Medicare supplement business are subject to significant estimates and the ultimate claim liability we incur for a particular period is likely to be different than our initial estimate. Governmental regulations generally require us to attain and maintain a ratio of total benefits incurred to total premiums earned (excluding changes in policy benefit reserves), after three years from the original issuance of the policy and over the lifetime of the policy, of not less than 65 percent on these products, as determined in accordance with statutory accounting principles. Insurance margins (insurance policy income less insurance policy benefits) on these products were $4.2 million and $4.8 million in the first quarters of 2018 and 2017, respectively. Such decrease reflects the run-off of this block of business.
64
CNO FINANCIAL GROUP, INC. AND SUBSIDIARIES
___________________
Amounts added to policyholder account balances - cost of interest credited to policyholders were $3.1 million and $3.3 million in the first quarters of 2018 and 2017, respectively.
Amounts added to policyholder account balances for fixed index products represent a guaranteed minimum rate of return and a higher potential return that is based on a percentage (the "participation rate") of the amount of increase in the value of a particular index, such as the S&P 500 Index, over a specified period. Such amounts include our cost to fund the annual index credits, net of policies that are canceled prior to their anniversary date (classified as cost of options to fund index credits, net of forfeitures). Market value changes in the underlying indices during a specified period of time are classified as market value changes credited to policyholders. Such market value changes are generally offset by the net investment income related to fixed index products discussed above.
Amortization related to operations includes amortization of insurance acquisition costs. Insurance acquisition costs are generally amortized in relation to actual and expected premium revenue, and amortization is only adjusted if expected premium revenue changes or if we determine the balance of these costs is not recoverable from future profits. Such amounts were generally consistent with the related premium revenue. A revision to our current assumptions could result in increases or decreases to amortization expense in future periods. Washington National's amortization expense was $14.5 million and $14.3 million in the first quarters of 2018 and 2017, respectively.
Interest expense on investment borrowings represents interest expense on collateralized borrowings as further described in the note to the consolidated financial statements entitled "Investment Borrowings". The increase in interest expense in the 2018 period is due to higher interest rates on the variable rate investment borrowings.
Other operating costs and expenses were $48.0 million and $49.0 million in the first quarters of 2018 and 2017, respectively. Such expenses in the first quarter of 2017 include $1.3 million for estimated future state guaranty association assessments, net of premium tax offsets, related to the liquidation of Penn Treaty. Other operating costs and expenses also include commission expense of $17.8 million and $17.1 million in the first quarters of 2018 and 2017, respectively.
Net realized investment gains (losses) fluctuate each period. During the first three months of 2018, we recognized net realized investment losses of $4.6 million, which were comprised of: (i) $.1 million of net losses from the sales of investments; (ii) a $1.7 million unfavorable change in the fair value of equity securities; (iii) the decrease in fair value of certain fixed maturity investments with embedded derivatives of $.1 million; and (iv) the decrease in fair value of embedded derivatives related to a modified coinsurance agreement of $2.7 million. During the first three months of 2017, we recognized net realized investment gains of $2.0 million, which were comprised of: (i) $.8 million of net gains from the sales of investments; (ii) the increase in fair value of certain fixed maturity investments with embedded derivatives of $.5 million; and (iii) the increase in fair value of embedded derivatives related to a modified coinsurance agreement of $.7 million.
Amortization related to net realized investment gains (losses) is the increase or decrease in the amortization of insurance acquisition costs which results from realized investment gains or losses. When we sell securities which back our interest-sensitive life and annuity products at a gain (loss) and reinvest the proceeds at a different yield (or when we have the intent to sell the impaired investments before an anticipated recovery in value occurs), we increase (reduce) the amortization of insurance acquisition costs in order to reflect the change in estimated gross profits due to the gains (losses) realized and the resulting effect on estimated future yields. Sales of fixed maturity investments resulted in no change in the amortization of insurance acquisition costs in both the first three months of 2018 and 2017.
Insurance policy benefits - fair value changes in embedded derivative liabilities represents fair value changes due to fluctuations in the interest rates used to discount embedded derivative liabilities related to our fixed index annuities.
Amortization related to fair value changes in embedded derivative liabilities is the increase or decrease in the amortization of insurance acquisition costs which results from changes in interest rates used to discount embedded derivative liabilities related to our fixed index annuities.
65
CNO FINANCIAL GROUP, INC. AND SUBSIDIARIES
___________________
Colonial Penn (dollars in millions)
Three months ended | |||||||
March 31, | |||||||
2018 | 2017 | ||||||
Premium collections: | |||||||
Life | $ | 74.8 | $ | 74.0 | |||
Supplemental health | .5 | .5 | |||||
Total collections | $ | 75.3 | $ | 74.5 | |||
Average liabilities for insurance products: | |||||||
SPIAs - mortality based | $ | 71.8 | $ | 72.6 | |||
Health: | |||||||
Medicare supplement | 5.3 | 6.0 | |||||
Other health | 3.9 | 4.1 | |||||
Life: | |||||||
Interest sensitive | 15.2 | 15.8 | |||||
Non-interest sensitive | 732.7 | 708.0 | |||||
Total average liabilities for insurance products, net of reinsurance ceded | $ | 828.9 | $ | 806.5 | |||
Revenues: | |||||||
Insurance policy income | $ | 74.1 | $ | 73.0 | |||
Net investment income on general account invested assets | 11.0 | 10.9 | |||||
Fee revenue and other income | .5 | .2 | |||||
Total revenues | 85.6 | 84.1 | |||||
Expenses: | |||||||
Insurance policy benefits | 56.5 | 52.6 | |||||
Amounts added to annuity and interest-sensitive life product account balances | .2 | .1 | |||||
Amortization related to operations | 4.6 | 4.0 | |||||
Interest expense on investment borrowings | .3 | .2 | |||||
Other operating costs and expenses | 25.5 | 27.5 | |||||
Total benefits and expenses | 87.1 | 84.4 | |||||
Loss before net realized investment losses and income taxes | (1.5 | ) | (.3 | ) | |||
Net realized investment losses | (.4 | ) | (.1 | ) | |||
Loss before income taxes | $ | (1.9 | ) | $ | (.4 | ) | |
This segment's results are significantly impacted by the accounting standard related to deferred acquisition costs. We are not able to defer most of Colonial Penn's direct response advertising costs although such costs generate predictable sales and future in-force profits. We plan to continue to invest in this segment's business, including the development of new products and markets. The amount of our investment in new business during a particular period will have a significant impact on this segment's results. We continue to expect this segment to report earnings (before net realized investment gains (losses) and income taxes) in the remainder of 2018 in the range of $10 million to $20 million.
Total premium collections were $75.3 million in the first quarter of 2018, up 1.1 percent from 2017. The increase was driven by recent sales activity and steady persistency. See "Premium Collections" for further analysis of Colonial Penn's premium collections.
66
CNO FINANCIAL GROUP, INC. AND SUBSIDIARIES
___________________
Average liabilities for insurance products, net of reinsurance ceded have increased as a result of growth in the core graded benefit and simplified issue life insurance block in this segment.
Insurance policy income is comprised of premiums earned on policies which provide mortality or morbidity coverage and fees and other charges assessed on other policies. The increase in such income reflects the growth in the block of graded benefit and simplified issue life insurance business.
Net investment income on general account invested assets in the 2018 period was comparable to the corresponding period in 2017.
Insurance policy benefits in the first quarter of 2018, as compared to the first quarter of 2017, reflect: (i) $2 million of unfavorable mortality experience in the life block; and (ii) a $1.1 million out-of-period adjustment which increased reserves on a closed block of payout annuities.
Amortization related to operations includes amortization of insurance acquisition costs. Insurance acquisition costs in the Colonial Penn segment are amortized in relation to actual and expected premium revenue, and amortization is only adjusted if expected premium revenue changes or if we determine the balance of these costs is not recoverable from future profits. Such amounts were generally consistent with the related premium revenue and gross profits for such periods and the assumptions we made when we established the present value of future profits. A revision to our current assumptions could result in increases or decreases to amortization expense in future periods.
Other operating costs and expenses in our Colonial Penn segment fluctuate primarily due to changes in the marketing expenses incurred to generate new business. Marketing expenses were lower in the 2018 period as compared to the corresponding period in 2017. The demand and cost of television advertising appropriate for Colonial Penn's campaigns has fluctuated widely in certain periods. We are disciplined with our marketing expenditures and will increase or decrease our advertising spend depending on prices. In addition, lower than anticipated telesales agent counts resulted in the need for a lower number of leads from television advertising, which was partially responsible for our decision to lower planned spending. We are actively training and recruiting new telesales agents and expect the effect of the lower counts to be isolated to the first half of 2018.
Net realized investment gains (losses) fluctuated each period. During the first three months of 2018, we recognized net realized investment losses of $.4 million, which were comprised of: (i) $.3 million of net losses from the sales of investments; and (ii) the decrease in fair value of certain fixed maturity investments with embedded derivatives of $.1 million. During the first three months of 2017, we recognized net realized investment losses of $.1 million, which were comprised of: (i) $.2 million of net losses from the sales of investments; and (ii) the increase in fair value of certain fixed maturity investments with embedded derivatives of $.1 million.
Management believes that an analysis of Adjusted EBIT for Colonial Penn, separated between in-force and new business, provides increased clarity for this segment as the vast majority of the costs to generate new business in this segment are not deferrable and Adjusted EBIT will fluctuate based on management's decisions on how much marketing costs to incur in each period. Adjusted EBIT from new business includes pre-tax revenues and expenses associated with new sales of our insurance products during the first year after the sale is completed. Adjusted EBIT from in-force business includes all pre-tax revenues and expenses associated with sales of insurance products that were completed more than one year before the end of the reporting period. The allocation of certain revenues and expenses between new and in-force business is based on estimates, which we believe are reasonable.
67
CNO FINANCIAL GROUP, INC. AND SUBSIDIARIES
___________________
Recognizing the accounting standard that requires us to expense certain direct response advertising costs (rather than deferring such costs as deferred acquisition costs), the amount of our investment in new business in the Colonial Penn segment during a particular period will have a significant impact on the segment results. The following summarizes our earnings, separated between in-force and new business for Colonial Penn (dollars in millions):
Three months ended | |||||||
March 31, | |||||||
2018 | 2017 | ||||||
Adjusted EBIT from In-Force Business | |||||||
Revenues: | |||||||
Insurance policy income | $ | 62.5 | $ | 59.6 | |||
Net investment income and other | 11.5 | 11.1 | |||||
Total revenues | 74.0 | 70.7 | |||||
Benefits and expenses: | |||||||
Insurance policy benefits | 49.7 | 44.6 | |||||
Amortization | 4.4 | 3.8 | |||||
Other expenses | 8.8 | 8.2 | |||||
Total benefits and expenses | 62.9 | 56.6 | |||||
Adjusted EBIT from In-Force Business | $ | 11.1 | $ | 14.1 | |||
Adjusted EBIT from New Business | |||||||
Revenues: | |||||||
Insurance policy income | $ | 11.6 | $ | 13.4 | |||
Net investment income and other | — | — | |||||
Total revenues | 11.6 | 13.4 | |||||
Benefits and expenses: | |||||||
Insurance policy benefits | 7.0 | 8.1 | |||||
Amortization | .2 | .2 | |||||
Other expenses | 17.0 | 19.5 | |||||
Total benefits and expenses | 24.2 | 27.8 | |||||
Adjusted EBIT from New Business | $ | (12.6 | ) | $ | (14.4 | ) | |
Adjusted EBIT from In-Force and New Business | |||||||
Revenues: | |||||||
Insurance policy income | $ | 74.1 | $ | 73.0 | |||
Net investment income and other | 11.5 | 11.1 | |||||
Total revenues | 85.6 | 84.1 | |||||
Benefits and expenses: | |||||||
Insurance policy benefits | 56.7 | 52.7 | |||||
Amortization | 4.6 | 4.0 | |||||
Other expenses | 25.8 | 27.7 | |||||
Total benefits and expenses | 87.1 | 84.4 | |||||
Adjusted EBIT from In-Force and New Business | $ | (1.5 | ) | $ | (.3 | ) | |
The Adjusted EBIT from in-force business in the Colonial Penn segment decreased in the first quarter of 2018, as compared to the same period in 2017, reflecting: (i) $2 million of unfavorable mortality experience in the life block; and (ii) a $1.1 million out-of-period adjustment which increased reserves on a closed block of payout annuities. The Adjusted EBIT from new business in the Colonial Penn segment in the 2018 period primarily reflects lower marketing costs. The vast
68
CNO FINANCIAL GROUP, INC. AND SUBSIDIARIES
___________________
majority of the costs to generate new business in this segment are not deferrable and Adjusted EBIT will fluctuate based on management's decisions on how much marketing costs to incur in each period.
Long-term care in run-off (dollars in millions)
In September 2016, we terminated certain reinsurance agreements and recaptured the ceded business. The long-term care in run-off segment is comprised of the long-term care business that was recaptured.
Three months ended | |||||||
March 31, | |||||||
2018 | 2017 | ||||||
Premium collections: | |||||||
Long-term care (all renewal) | $ | 4.1 | $ | 4.6 | |||
Average liabilities for insurance products: | |||||||
Average liabilities for long-term care products | $ | 562.3 | $ | 560.7 | |||
Revenues: | |||||||
Insurance policy income | $ | 4.1 | $ | 4.6 | |||
Net investment income on general account invested assets | 8.4 | 9.7 | |||||
Total revenues | 12.5 | 14.3 | |||||
Expenses: | |||||||
Insurance policy benefits | 12.0 | 13.2 | |||||
Other operating costs and expenses | .5 | .7 | |||||
Total benefits and expenses | 12.5 | 13.9 | |||||
Income (loss) before net realized investment gains (losses) and income taxes | — | .4 | |||||
Net realized investment gains (losses) | .6 | (.3 | ) | ||||
Income before income taxes | $ | .6 | $ | .1 | |||
Three months ended | |||||||
March 31, | |||||||
2018 | 2017 | ||||||
Health benefit ratios: | |||||||
Long-term care: | |||||||
Insurance policy benefits | $ | 12.0 | $ | 13.2 | |||
Benefit ratio (a) | 293.1 | % | 286.5 | % | |||
Interest-adjusted benefit ratio (b) | 117.9 | % | 128.1 | % | |||
_______________
(a) | We calculate benefit ratios by dividing the related product's insurance policy benefits by insurance policy income. |
(b) | We calculate the interest-adjusted benefit ratio (a non-GAAP measure) for long-term care products in this segment by dividing such product's insurance policy benefits less the imputed interest income on the accumulated assets backing the insurance liabilities by policy income. These are considered non-GAAP financial measures. A non-GAAP measure is a numerical measure of a company's performance, financial position, or cash flows that excludes or includes amounts that are normally excluded or included in the most directly comparable measure calculated and presented in accordance with GAAP. |
These non-GAAP financial measures of "interest-adjusted benefit ratios" differ from "benefit ratios" due to the deduction of imputed interest income on the accumulated assets backing the insurance liabilities from the product's insurance policy benefits used to determine the ratio. Interest income is an important factor in measuring the performance of health
69
CNO FINANCIAL GROUP, INC. AND SUBSIDIARIES
___________________
products that are expected to be inforce for a longer duration of time, are not subject to unilateral changes in provisions (such as non-cancelable or guaranteed renewable contracts) and require the performance of various functions and services (including insurance protection) for an extended period of time. The net cash flows from long-term care products generally cause an accumulation of amounts in the early years of a policy (accounted for as reserve increases) that will be paid out as benefits in later policy years (accounted for as reserve decreases). Accordingly, as the policies age, the benefit ratio will typically increase, but the increase in benefits will be partially offset by the imputed interest income earned on the accumulated assets. The interest-adjusted benefit ratio reflects the effects of such interest income offset (which is equal to the tabular interest on the related insurance liabilities). Since interest income is an important factor in measuring the performance of these products, management believes a benefit ratio that includes the effect of interest income is useful in analyzing product performance. We utilize the interest-adjusted benefit ratio in measuring segment performance because we believe that this performance measure is a better indicator of the ongoing businesses and trends in the business. However, the "interest-adjusted benefit ratio" does not replace the "benefit ratio" as a measure of current period benefits to current period insurance policy income. Accordingly, management reviews both "benefit ratios" and "interest-adjusted benefit ratios" when analyzing the financial results attributable to these products. The imputed investment income earned on the accumulated assets backing the long-term care reserves was $7.2 million and $7.3 million in the three months ended March 31, 2018 and 2017, respectively.
Average liabilities for long-term care products were increased by $20.5 million and $7.0 million in the three months ended March 31, 2018 and 2017, respectively, to reflect the premium deficiencies that would exist if unrealized gains on the assets backing such products had been realized and the proceeds from the sales of such assets were invested at then current yields. Such increase is reflected as a reduction of accumulated other comprehensive income.
Insurance policy benefits were $12.0 million and $13.2 million in the first quarters of 2018 and 2017, respectively. The interest-adjusted benefit ratio for this long-term care block was 117.9 percent and 128.1 percent in the first quarters of 2018 and 2017, respectively. Our 2017 comprehensive actuarial review of this block reflected relatively low margins. Accordingly, this segment's results can be volatile from period to period. This block of business is particularly sensitive to changes in assumptions.
Net realized investment gains (losses) fluctuated each period. During the first three months of 2018, we recognized net realized investment gains of $.6 million, which were comprised of: (i) $1.1 million of net gains from the sales of investments; (ii) a $.3 million unfavorable change in the fair value of equity securities; and (iii) the decrease in fair value of certain fixed maturity investments with embedded derivatives of $.2 million. During the first three months of 2017, we recognized net realized investment losses of $.3 million, which were comprised of: (i) $8.1 million of net gains from the sales of investments; and (ii) $8.4 million of writedowns of investments for other than temporary declines in fair value recognized through net income.
70
CNO FINANCIAL GROUP, INC. AND SUBSIDIARIES
___________________
Corporate Operations (dollars in millions)
Three months ended | |||||||
March 31, | |||||||
2018 | 2017 | ||||||
Corporate operations: | |||||||
Interest expense on corporate debt | $ | (11.9 | ) | $ | (11.5 | ) | |
Net investment income (loss): | |||||||
General investment portfolio | 2.2 | .9 | |||||
Other special-purpose portfolios: | |||||||
COLI | (3.1 | ) | 6.4 | ||||
Investments held in a rabbi trust | (.2 | ) | .8 | ||||
Other trading account activities | 2.3 | 2.3 | |||||
Fee revenue and other income | 1.8 | 2.4 | |||||
Other operating costs and expenses | (18.5 | ) | (21.7 | ) | |||
Loss before net realized investment gains (losses), earnings attributable to VIEs, fair value changes related to agent deferred compensation plan and income taxes | (27.4 | ) | (20.4 | ) | |||
Net realized investment gains (losses) | (4.1 | ) | 4.6 | ||||
Earnings attributable to VIEs | 3.3 | .3 | |||||
Loss before income taxes | $ | (28.2 | ) | $ | (15.5 | ) | |
Interest expense on corporate debt was $11.9 million and $11.5 million in the first three months of 2018 and 2017, respectively. Our average corporate debt outstanding was $925.0 million in both the first three months of 2018 and 2017. The average interest rate on our debt was 4.8 percent and 4.7 percent in the first three months of 2018 and 2017, respectively.
Net investment income on general investment portfolio fluctuates based on the amount and type of invested assets in the corporate operations segment.
Net investment income on other special-purpose portfolios includes the income (loss) from: (i) investments related to deferred compensation plans held in a rabbi trust (which is offset by amounts included in other operating costs and expenses as the investment results are allocated to participants' account balances); (ii) trading account activities; and (iii) income (loss) from COLI equal to the difference between the return on these investments (representing the change in value of the underlying investments) and our overall portfolio yield. COLI is utilized as an investment vehicle to fund Bankers Life's agent deferred compensation plan. For segment reporting, the Bankers Life segment is allocated a return on these investments equivalent to the yield on the Company’s overall portfolio, with any difference in the actual COLI return allocated to the Corporate operations segment. In the first quarter of 2017, we recognized a death benefit, net of cash surrender value, of $2.0 million related to the COLI, which was recognized as net investment income from COLI.
Fee revenue and other income includes the fees our wholly-owned investment advisor earns for managing portfolios of commercial bank loans for investment trusts. These trusts are consolidated as VIEs in our consolidated financial statements, but the fees are reflected as revenues and the fee expense is reflected in the earnings attributable to VIEs.
Other operating costs and expenses include general corporate expenses, net of amounts charged to subsidiaries for services provided by the corporate operations. These amounts fluctuate as a result of expenses such as legal and consulting costs which often vary from period to period and were lower in 2018 as compared to the 2017 period.
Net realized investment gains (losses) often fluctuate each period. During the first three months of 2018, net realized investment losses in this segment were comprised of a $4.1 million unfavorable change in the fair value of equity securities (none of which were losses recognized by the VIEs). During the first three months of 2017, net realized investment gains in
71
CNO FINANCIAL GROUP, INC. AND SUBSIDIARIES
___________________
this segment were $4.6 million (including $2.1 million of gains recognized by the VIEs and $2.5 million of net gains on other investment sales).
Earnings attributable to VIEs include the earnings in certain VIEs that we are required to consolidate, net of affiliated amounts. Such earnings are not indicative of, and are unrelated to, the Company's underlying fundamentals.
PREMIUM COLLECTIONS
In accordance with GAAP, insurance policy income in our consolidated statement of operations consists of premiums earned for traditional insurance policies that have life contingencies or morbidity features. For annuity and interest-sensitive life contracts, premiums collected are not reported as revenues, but as deposits to insurance liabilities. We recognize revenues for these products over time in the form of investment income and surrender or other charges.
Our insurance segments sell products through three primary distribution channels - career agents (our Bankers Life segment), direct marketing (our Colonial Penn segment) and independent producers (our Washington National segment). Our career agency force in the Bankers Life segment sells primarily Medicare supplement and long-term care insurance policies, life insurance and annuities. These agents visit the customer's home, which permits one-on-one contact with potential policyholders and promotes strong personal relationships with existing policyholders. Our direct marketing distribution channel in the Colonial Penn segment is engaged primarily in the sale of graded benefit life and simplified issue life insurance policies which are sold directly to the policyholder. Our Washington National segment sells primarily supplemental health and life insurance. These products are marketed through PMA, a wholly-owned subsidiary that specializes in marketing and distributing health products, and through independent marketing organizations and insurance agencies, including worksite marketing.
Agents, insurance brokers and marketing companies who market our products and prospective purchasers of our products use the financial strength ratings of our insurance subsidiaries as an important factor in determining whether to market or purchase. Ratings have the most impact on our sales of supplemental health and life products to consumers at the worksite. The current financial strength ratings of our primary insurance subsidiaries from Moody's Investor Services, Inc. ("Moody's"), Fitch Ratings ("Fitch"), S&P and A.M. Best Company ("A.M. Best") are "Baa1", "BBB+", "BBB+" and "A-", respectively. For a description of these ratings and additional information on our ratings, see "Financial Strength Ratings of our Insurance Subsidiaries".
We set premium rates on our health insurance policies based on facts and circumstances known at the time we issue the policies using assumptions about numerous variables, including the actuarial probability of a policyholder incurring a claim, the probable size of the claim, and the interest rate earned on our investment of premiums. We also consider historical claims information, industry statistics, the rates of our competitors and other factors. If our actual claims experience is less favorable than we anticipated and we are unable to raise our premium rates, our financial results may be adversely affected. We generally cannot raise our health insurance premiums in any state until we obtain the approval of the state insurance regulator. We review the adequacy of our premium rates regularly and file for rate increases on our products when we believe such rates are too low. It is likely that we will not be able to obtain approval for all requested premium rate increases. If such requests are denied in one or more states, our net income may decrease. If such requests are approved, increased premium rates may reduce the volume of our new sales and may cause existing policyholders to lapse their policies. If the healthier policyholders allow their policies to lapse, this would reduce our premium income and profitability in the future.
72
CNO FINANCIAL GROUP, INC. AND SUBSIDIARIES
___________________
Total premium collections were $928.1 million in the first quarter of 2018, down 1.3 percent from 2017. First year collected premiums were $331.1 million in the first quarter of 2018, down 4.1 percent from 2017. Total premiums collected are summarized as follows (dollars in millions):
Three months ended | |||||||
March 31, | |||||||
2018 | 2017 | ||||||
First year: | |||||||
Bankers Life | $ | 299.5 | $ | 311.1 | |||
Washington National | 19.7 | 20.5 | |||||
Colonial Penn | 11.9 | 13.7 | |||||
Total first year | 331.1 | 345.3 | |||||
Renewal: | |||||||
Bankers Life | 373.0 | 376.7 | |||||
Washington National | 156.5 | 152.6 | |||||
Colonial Penn | 63.4 | 60.8 | |||||
Long-term care in run-off | 4.1 | 4.6 | |||||
Total renewal | 597.0 | 594.7 | |||||
Total premiums collected | $ | 928.1 | $ | 940.0 | |||
73
CNO FINANCIAL GROUP, INC. AND SUBSIDIARIES
___________________
Total premium collections by segment were as follows:
Bankers Life (dollars in millions)
Three months ended | |||||||
March 31, | |||||||
2018 | 2017 | ||||||
Premiums collected by product: | |||||||
Annuities: | |||||||
Fixed index (first-year) | $ | 235.4 | $ | 235.3 | |||
Other fixed interest (first-year) | 14.5 | 20.6 | |||||
Other fixed interest (renewal) | 1.5 | 1.6 | |||||
Subtotal - other fixed interest annuities | 16.0 | 22.2 | |||||
Total annuities | 251.4 | 257.5 | |||||
Health: | |||||||
Medicare supplement (first-year) | 15.4 | 17.5 | |||||
Medicare supplement (renewal) | 172.9 | 174.2 | |||||
Subtotal - Medicare supplement | 188.3 | 191.7 | |||||
Long-term care (first-year) | 3.7 | 4.2 | |||||
Long-term care (renewal) | 106.6 | 112.8 | |||||
Subtotal - long-term care | 110.3 | 117.0 | |||||
Supplemental health (first-year) | 1.1 | 1.4 | |||||
Supplemental health (renewal) | 4.7 | 4.3 | |||||
Subtotal – supplemental health | 5.8 | 5.7 | |||||
Other health (first-year) | .2 | .2 | |||||
Other health (renewal) | 1.3 | 1.4 | |||||
Subtotal - other health | 1.5 | 1.6 | |||||
Total health | 305.9 | 316.0 | |||||
Life insurance: | |||||||
Traditional (first-year) | 18.5 | 20.2 | |||||
Traditional (renewal) | 55.7 | 54.1 | |||||
Subtotal - traditional | 74.2 | 74.3 | |||||
Interest-sensitive (first-year) | 10.7 | 11.7 | |||||
Interest-sensitive (renewal) | 30.3 | 28.3 | |||||
Subtotal - interest-sensitive | 41.0 | 40.0 | |||||
Total life insurance | 115.2 | 114.3 | |||||
Collections on insurance products: | |||||||
Total first-year premium collections on insurance products | 299.5 | 311.1 | |||||
Total renewal premium collections on insurance products | 373.0 | 376.7 | |||||
Total collections on insurance products | $ | 672.5 | $ | 687.8 | |||
Annuities in this segment include fixed index and other fixed interest annuities sold to the senior market. Annuity collections in this segment decreased 2.4 percent, to $251.4 million, in the first quarter of 2018, as compared to the same period in 2017. Premium collections from our fixed index products in 2018 were comparable to the same period in 2017. Premium
74
CNO FINANCIAL GROUP, INC. AND SUBSIDIARIES
___________________
collections from our other fixed interest products decreased in 2018 due to lower sales of these products in the current low interest rate environment and consumer preference for fixed index products.
Health products include Medicare supplement, long-term care and other insurance products. Our profits on health policies depend on the overall level of sales, the length of time the business remains inforce, investment yields, claims experience and expense management.
Collected premiums on Medicare supplement policies in the Bankers Life segment decreased 1.8 percent, to $188.3 million, in the first quarter of 2018, as compared to the same period in 2017.
Premiums collected on Bankers Life's long-term care policies decreased 5.7 percent, to $110.3 million, in the first quarter of 2018, as compared to the same period in 2017. Such decrease reflects the run-off of this business and a continuing shift in the mix of new business to shorter duration long-term care sales, which have lower premiums per policy.
Life products in this segment include traditional and interest-sensitive life products. Life premiums collected in this segment in the 2018 period were slightly higher than the comparable period in 2017, reflecting stable persistency; partially offset by lower first-year premiums.
75
CNO FINANCIAL GROUP, INC. AND SUBSIDIARIES
___________________
Washington National (dollars in millions)
Three months ended | |||||||
March 31, | |||||||
2018 | 2017 | ||||||
Premiums collected by product: | |||||||
Health: | |||||||
Medicare supplement (renewal) | $ | 12.5 | $ | 14.4 | |||
Supplemental health (first-year) | 18.3 | 19.0 | |||||
Supplemental health (renewal) | 136.9 | 131.1 | |||||
Subtotal – supplemental health | 155.2 | 150.1 | |||||
Other health (first-year) | .1 | .1 | |||||
Other health (renewal) | .4 | .4 | |||||
Subtotal - other health | .5 | .5 | |||||
Total health | 168.2 | 165.0 | |||||
Life insurance: | |||||||
Traditional (first-year) | .1 | .2 | |||||
Traditional (renewal) | 2.5 | 2.6 | |||||
Subtotal - traditional | 2.6 | 2.8 | |||||
Interest-sensitive (first-year) | 1.2 | 1.2 | |||||
Interest-sensitive (renewal) | 3.8 | 3.9 | |||||
Subtotal - interest-sensitive | 5.0 | 5.1 | |||||
Total life insurance | 7.6 | 7.9 | |||||
Annuities: | |||||||
Fixed index (renewal) | .3 | .2 | |||||
Other fixed interest (renewal) | .1 | — | |||||
Total annuities | .4 | .2 | |||||
Collections on insurance products: | |||||||
Total first-year premium collections on insurance products | 19.7 | 20.5 | |||||
Total renewal premium collections on insurance products | 156.5 | 152.6 | |||||
Total collections on insurance products | $ | 176.2 | $ | 173.1 | |||
Health products in the Washington National segment include Medicare supplement, supplemental health and other insurance products. Our profits on health policies depend on the overall level of sales, the length of time the business remains inforce, investment yields, claim experience and expense management.
Collected premiums on Medicare supplement policies in the Washington National segment decreased in the 2018 period due to the run-off of this block of business.
Premiums collected on supplemental health products (including specified disease, accident and hospital indemnity insurance products) increased 3.4 percent, to $155.2 million, in the first quarter of 2018, as compared to the same period in 2017. Such increase is due to new sales in recent periods and persistency.
Overall, excluding premiums from the Washington National Medicare supplement and annuity blocks which are in run-off, collected premiums were up 3.0 percent, to $163.3 million, in the first quarter of 2018, as compared to the same period in 2017, driven by sales in recent periods and persistency.
Life premiums collected in the Washington National segment decreased 3.8 percent, to $7.6 million, in the first quarter of 2018, as compared to the same period in 2017.
76
CNO FINANCIAL GROUP, INC. AND SUBSIDIARIES
___________________
Annuities in this segment include fixed index and other fixed interest annuities. We are no longer actively pursuing sales of annuity products in this segment.
Colonial Penn (dollars in millions)
Three months ended | |||||||
March 31, | |||||||
2018 | 2017 | ||||||
Premiums collected by product: | |||||||
Life insurance: | |||||||
Traditional (first-year) | $ | 11.9 | $ | 13.7 | |||
Traditional (renewal) | 62.9 | 60.2 | |||||
Subtotal - traditional | 74.8 | 73.9 | |||||
Interest-sensitive (all renewal) | — | .1 | |||||
Total life insurance | 74.8 | 74.0 | |||||
Health (all renewal): | |||||||
Medicare supplement | .4 | .5 | |||||
Other health | .1 | — | |||||
Total health | .5 | .5 | |||||
Collections on insurance products: | |||||||
Total first-year premium collections on insurance products | 11.9 | 13.7 | |||||
Total renewal premium collections on insurance products | 63.4 | 60.8 | |||||
Total collections on insurance products | $ | 75.3 | $ | 74.5 | |||
Life products in this segment are sold primarily to the senior market. Life premiums collected in this segment increased 1.1 percent, to $74.8 million, in the first quarter of 2018, as compared to the same period in 2017. Premiums collected reflect both recent sales activity and steady persistency.
Health products include Medicare supplement and other insurance products. Our profits on health policies depend on the overall level of sales, the length of time the business remains in-force, investment yields, claims experience and expense management. We do not currently market these products through this segment.
Long-term care in run-off (dollars in millions)
Three months ended | |||||||
March 31, | |||||||
2018 | 2017 | ||||||
Premiums collected by product: | |||||||
Health: | |||||||
Long-term care (renewal) | $ | 4.1 | $ | 4.6 | |||
The Long-term care in run-off segment only includes the premiums collected from the long-term care block that was recaptured in September 2016.
77
CNO FINANCIAL GROUP, INC. AND SUBSIDIARIES
___________________
LIQUIDITY AND CAPITAL RESOURCES
Our capital structure as of March 31, 2018 and December 31, 2017 was as follows (dollars in millions):
March 31, 2018 | December 31, 2017 | ||||||
Total capital: | |||||||
Corporate notes payable | $ | 915.1 | $ | 914.6 | |||
Shareholders’ equity: | |||||||
Common stock | 1.6 | 1.7 | |||||
Additional paid-in capital | 3,075.6 | 3,073.3 | |||||
Accumulated other comprehensive income | 894.3 | 1,212.1 | |||||
Retained earnings | 645.7 | 560.4 | |||||
Total shareholders’ equity | 4,617.2 | 4,847.5 | |||||
Total capital | $ | 5,532.3 | $ | 5,762.1 | |||
The following table summarizes certain financial ratios as of and for the three months ended March 31, 2018 and as of and for the year ended December 31, 2017:
March 31, 2018 | December 31, 2017 | ||||||
Book value per common share | $ | 27.59 | $ | 29.05 | |||
Book value per common share, excluding accumulated other comprehensive income (a) | 22.25 | 21.79 | |||||
Ratio of earnings to fixed charges | 2.71X | 2.94X | |||||
Debt to total capital ratios: | |||||||
Corporate debt to total capital | 16.5 | % | 15.9 | % | |||
Corporate debt to total capital, excluding accumulated other comprehensive income (a) | 19.7 | % | 20.1 | % | |||
_____________________
(a) | This non-GAAP measure differs from the corresponding GAAP measure presented immediately above, because accumulated other comprehensive income has been excluded from the value of capital used to determine this measure. Management believes this non-GAAP measure is useful because it removes the volatility that arises from changes in accumulated other comprehensive income. Such volatility is often caused by changes in the estimated fair value of our investment portfolio resulting from changes in general market interest rates rather than the business decisions made by management. However, this measure does not replace the corresponding GAAP measure. |
Liquidity for Insurance Operations
Our insurance companies generally receive adequate cash flows from premium collections and investment income to meet their obligations. Life insurance, long-term care insurance and annuity liabilities are generally long-term in nature. Life and annuity policyholders may, however, withdraw funds or surrender their policies, subject to any applicable penalty provisions; there are generally no withdrawal or surrender benefits for long-term care insurance. We actively manage the relationship between the duration of our invested assets and the estimated duration of benefit payments arising from contract liabilities.
Three of the Company's insurance subsidiaries (Washington National, Bankers Life and Colonial Penn) are members of the FHLB. As members of the FHLB, our insurance subsidiaries have the ability to borrow on a collateralized basis from the FHLB. We are required to hold certain minimum amounts of FHLB common stock as a condition of membership in the FHLB, and additional amounts based on the amount of the borrowings. At March 31, 2018, the carrying value of the FHLB common stock was $71.2 million. As of March 31, 2018, collateralized borrowings from the FHLB totaled $1.6 billion and the proceeds were used to purchase fixed maturity securities. The borrowings are classified as investment borrowings in the accompanying
78
CNO FINANCIAL GROUP, INC. AND SUBSIDIARIES
___________________
consolidated balance sheet. The borrowings are collateralized by investments with an estimated fair value of $2.1 billion at March 31, 2018, which are maintained in custodial accounts for the benefit of the FHLB.
The following summarizes the terms of the borrowings from the FHLB by our insurance subsidiaries (dollars in millions):
Amount | Maturity | Interest rate at | ||||
borrowed | date | March 31, 2018 | ||||
$ | 50.0 | January 2019 | Variable rate – 2.142% | |||
50.0 | February 2019 | Variable rate – 1.940% | ||||
100.0 | March 2019 | Variable rate – 2.288% | ||||
21.8 | July 2019 | Variable rate – 2.331% | ||||
15.0 | October 2019 | Variable rate – 2.273% | ||||
50.0 | May 2020 | Variable rate – 2.297% | ||||
21.8 | June 2020 | Fixed rate – 1.960% | ||||
25.0 | September 2020 | Variable rate – 2.911% | ||||
100.0 | September 2020 | Variable rate – 2.532% | ||||
50.0 | September 2020 | Variable rate – 2.537% | ||||
75.0 | September 2020 | Variable rate – 2.422% | ||||
100.0 | October 2020 | Variable rate – 1.806% | ||||
50.0 | December 2020 | Variable rate – 2.386% | ||||
100.0 | July 2021 | Variable rate – 2.270% | ||||
100.0 | July 2021 | Variable rate – 2.240% | ||||
28.2 | August 2021 | Fixed rate – 2.550% | ||||
57.7 | August 2021 | Variable rate - 2.317% | ||||
125.0 | August 2021 | Variable rate – 2.352% | ||||
50.0 | September 2021 | Variable rate – 2.484% | ||||
22.0 | May 2022 | Variable rate – 2.334% | ||||
100.0 | May 2022 | Variable rate – 2.317% | ||||
10.0 | June 2022 | Variable rate – 2.671% | ||||
50.0 | July 2022 | Variable rate – 2.075% | ||||
50.0 | July 2022 | Variable rate – 2.121% | ||||
50.0 | July 2022 | Variable rate – 2.140% | ||||
50.0 | August 2022 | Variable rate – 2.183% | ||||
50.0 | December 2022 | Variable rate – 2.306 | ||||
50.0 | December 2022 | Variable rate – 2.306 | ||||
24.5 | March 2023 | Fixed rate – 2.160% | ||||
20.5 | June 2025 | Fixed rate – 2.940% | ||||
$ | 1,646.5 | |||||
State laws generally give state insurance regulatory agencies broad authority to protect policyholders in their jurisdictions. Regulators have used this authority in the past to restrict the ability of our insurance subsidiaries to pay any dividends or other amounts without prior approval. We cannot be assured that the regulators will not seek to assert greater supervision and control over our insurance subsidiaries' businesses and financial affairs.
79
CNO FINANCIAL GROUP, INC. AND SUBSIDIARIES
___________________
Our estimated consolidated statutory RBC ratio of 427 percent at March 31, 2018, reflects the impact of the following in the first quarter of 2018: (i) estimated consolidated statutory operating earnings of $52 million; (ii) the payment of insurance company dividends to the holding company of $20.0 million; and (iii) the effect of a tactical shift in our allocations toward investments which had higher capital requirements (decreasing the RBC ratio by approximately 20 percentage points during the first three months of 2018). The investments with higher capital requirements included several preferred stock and high yield exchange-traded funds which offered attractive relative values to other investment classes. These investments are highly liquid, allowing the Company to sell them over a short period of time if desired. Our objective is to maintain an RBC ratio in the range of 425 percent to 450 percent. Statutory earnings will often fluctuate on a quarterly basis due to the application of statutory accounting principles. In April 2018, the National Association of Insurance Commissioners (the "NAIC") Life Risk-Based Capital Working Group proposed that the new 21 percent corporate tax rate in the RBC calculation should not reduce the ratios due to the non-economic impact of this change. Their proposal would leave formulas for the 2018 RBC calculations relatively unchanged. For 2019 and beyond, the group proposes to make structural changes to the RBC calculation. These new factors would be formulated to negate the negative impact of the tax rate change.
Our insurance subsidiaries transfer exposure to certain risk to others through reinsurance arrangements. When we obtain reinsurance, we are still liable for those transferred risks in the event the reinsurer defaults on its obligations. The failure, insolvency, inability or unwillingness of one or more of the Company's reinsurers to perform in accordance with the terms of its reinsurance agreement could negatively impact our earnings or financial position and our consolidated statutory RBC ratio.
Financial Strength Ratings of our Insurance Subsidiaries
Financial strength ratings provided by Moody's, Fitch, S&P and A.M. Best are the rating agency's opinions of the ability of our insurance subsidiaries to pay policyholder claims and obligations when due.
On November 21, 2017, Moody's affirmed the financial strength ratings of "Baa1" of our primary insurance subsidiaries and the outlook for these ratings is stable. Moody’s financial strength ratings range from "Aaa" to "C". These ratings may be supplemented with numbers "1", "2", or "3" to show relative standing within a category. In Moody's view, an insurer rated "Baa" offers adequate financial security, however, certain protective elements may be lacking or may be characteristically unreliable over any great length of time. Moody's has twenty-one possible ratings. There are seven ratings above the "Baa1" rating of our primary insurance subsidiaries and thirteen ratings that are below that rating.
On August 15, 2017, Fitch affirmed its "BBB+" financial strength ratings of our primary insurance subsidiaries. The outlook for these ratings is stable. A "BBB" rating, in Fitch's opinion, indicates that there is currently a low expectation of ceased or interrupted payments. The capacity to meet policyholder and contract obligations on a timely basis is considered adequate, but adverse changes in circumstances and economic conditions are more likely to impact this capacity. Fitch ratings for the industry range from "AAA Exceptionally Strong" to "C Distressed" and some companies are not rated. Pluses and minuses show the relative standing within a category. Fitch has nineteen possible ratings. There are seven ratings above the "BBB+" rating of our primary insurance subsidiaries and eleven ratings that are below that rating.
On June 23, 2017, S&P affirmed the financial strength ratings of "BBB+" of our primary insurance subsidiaries and revised the outlook for these ratings to stable from negative. S&P financial strength ratings range from "AAA" to "R" and some companies are not rated. An insurer rated "BBB" or higher is regarded as having financial security characteristics that outweigh any vulnerabilities, and is highly likely to have the ability to meet financial commitments. An insurer rated "BBB", in S&P's opinion, has good financial security characteristics, but is more likely to be affected by adverse business conditions than are higher-rated insurers. Pluses and minuses show the relative standing within a category. S&P has twenty-one possible ratings. There are seven ratings above the "BBB+" rating of our primary insurance subsidiaries and thirteen ratings that are below that rating.
On February 8, 2017, A.M. Best affirmed the financial strength ratings of "A-" of our primary insurance subsidiaries and the outlook for these ratings is stable. The "A-" rating is assigned to companies that have an excellent ability, in A.M. Best's opinion, to meet their ongoing obligations to policyholders. A.M. Best ratings for the industry currently range from "A++ (Superior)" to "F (In Liquidation)" and some companies are not rated. An "A++" rating indicates a superior ability to meet ongoing obligations to policyholders. A.M. Best has sixteen possible ratings. There are three ratings above the "A-" rating of our primary insurance subsidiaries and twelve ratings that are below that rating.
80
CNO FINANCIAL GROUP, INC. AND SUBSIDIARIES
___________________
Rating agencies have increased the frequency and scope of their credit reviews and requested additional information from the companies that they rate, including us. They may also adjust upward the capital and other requirements employed in the rating agency models for maintenance of certain ratings levels. We cannot predict what actions rating agencies may take, or what actions we may take in response. Accordingly, downgrades and outlook revisions related to us or the life insurance industry may occur in the future at any time and without notice by any rating agency. These could increase policy surrenders and withdrawals, adversely affect relationships with our distribution channels, reduce new sales, reduce our ability to borrow and increase our future borrowing costs.
Liquidity of the Holding Companies
Availability and Sources and Uses of Holding Company Liquidity; Limitations on Ability of Insurance Subsidiaries to Make Dividend and Surplus Debenture Interest Payments to the Holding Companies; Limitations on Holding Company Activities
At March 31, 2018, CNO, CDOC, Inc. ("CDOC", our wholly owned subsidiary and the immediate parent of Washington National and Conseco Life Insurance Company of Texas ("CLTX")) and our other non-insurance subsidiaries held: (i) unrestricted cash and cash equivalents of $357.6 million; and (ii) fixed income investments of $20.3 million. CNO and CDOC are holding companies with no business operations of their own; they depend on their operating subsidiaries for cash to make principal and interest payments on debt, and to pay administrative expenses and income taxes. CNO and CDOC receive cash from insurance subsidiaries, consisting of dividends and distributions, interest payments on surplus debentures and tax-sharing payments, as well as cash from non-insurance subsidiaries consisting of dividends, distributions, loans and advances. The principal non-insurance subsidiaries that provide cash to CNO and CDOC are 40|86 Advisors, Inc. ("40|86 Advisors"), which receives fees from the insurance subsidiaries for investment services, and CNO Services, LLC which receives fees from the insurance subsidiaries for providing administrative services. The agreements between our insurance subsidiaries and CNO Services, LLC and 40|86 Advisors, respectively, were previously approved by the domestic insurance regulator for each insurance company, and any payments thereunder do not require further regulatory approval.
The following summarizes the current ownership structure of CNO’s primary subsidiaries:
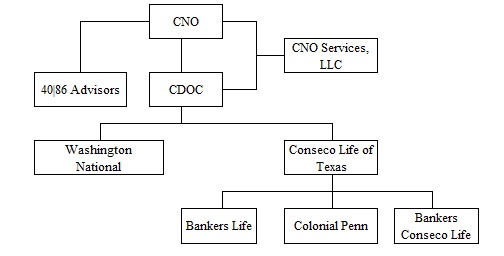
The ability of our insurance subsidiaries to pay dividends is subject to state insurance department regulations and is based on the financial statements of our insurance subsidiaries prepared in accordance with statutory accounting practices prescribed or permitted by regulatory authorities, which differ from GAAP. These regulations generally permit dividends to be paid from statutory earned surplus of the insurance company without regulatory approval for any 12-month period in amounts equal to the greater of (or in some states, the lesser of): (i) statutory net gain from operations or net income for the prior year; or (ii) 10 percent of statutory capital and surplus as of the end of the preceding year. However, as each of the immediate insurance subsidiaries of CDOC has significant negative earned surplus, any dividend payments from the insurance subsidiaries require the prior approval of the director or commissioner of the applicable state insurance department. In the first three months of 2018, our insurance subsidiaries paid dividends to CDOC totaling $20.0 million. We expect to receive regulatory approval for future dividends from our subsidiaries, but there can be no assurance that such payments will be approved or that the financial condition of our insurance subsidiaries will not change, making future approvals less likely.
81
CNO FINANCIAL GROUP, INC. AND SUBSIDIARIES
___________________
CDOC holds surplus debentures from CLTX with an aggregate principal amount of $749.6 million. Interest payments on those surplus debentures do not require additional approval provided the RBC ratio of CLTX exceeds 100 percent (but do require prior written notice to the Texas state insurance department). The estimated RBC ratio of CLTX was 368 percent at March 31, 2018. CDOC also holds a surplus debenture from Colonial Penn with a principal balance of $160.0 million. Interest payments on that surplus debenture require prior approval by the Pennsylvania state insurance department. Dividends and other payments from our non-insurance subsidiaries, including 40|86 Advisors and CNO Services, LLC, to CNO or CDOC do not require approval by any regulatory authority or other third party. However, insurance regulators may prohibit payments by our insurance subsidiaries to parent companies if they determine that such payments could be adverse to our policyholders or contractholders.
The insurance subsidiaries of CDOC receive funds to pay dividends primarily from: (i) the earnings of their direct businesses; (ii) tax sharing payments received from subsidiaries (if applicable); and (iii) with respect to CLTX, dividends received from subsidiaries. At March 31, 2018, the subsidiaries of CLTX had earned surplus (deficit) as summarized below (dollars in millions):
Subsidiaries of CLTX | Earned surplus (deficit) | Additional information | ||||
Bankers Life | $ | 607.1 | (a) | |||
Colonial Penn | (308.8 | ) | (b) | |||
____________________
(a) | Bankers Life paid no dividends to CLTX in the first three months of 2018. |
(b) | The deficit is primarily due to transactions which occurred several years ago, including a tax planning transaction and the fee paid to recapture a block of business previously ceded to an unaffiliated insurer. |
A significant deterioration in the financial condition, earnings or cash flow of the material subsidiaries of CNO or CDOC for any reason could hinder such subsidiaries' ability to pay cash dividends or other disbursements to CNO and/or CDOC, which, in turn, could limit CNO's ability to meet debt service requirements and satisfy other financial obligations. In addition, we may choose to retain capital in our insurance subsidiaries or to contribute additional capital to our insurance subsidiaries to maintain or strengthen their surplus or fund a long-term care reinsurance transaction, and these decisions could limit the amount available at our top tier insurance subsidiaries to pay dividends to the holding companies.
Under its common share repurchase program, the Company has remaining repurchase authority of $385.6 million as of March 31, 2018. There were no common stock repurchases in the first three months of 2018. CNO continues to expect free cash flow generation of approximately $300 million per year. The Company is committed to deploying 100 percent of its free cash flow into investments to accelerate profitable growth, funding potential long-term care risk reduction transactions, common stock dividends and share repurchases. The amount and timing of the securities repurchases (if any) will be based on business and market conditions and other factors including, but not limited to, the current price of our common stock, opportunities to invest in our business, acquisition transactions or ceding commissions related to reinsurance transactions.
In the first three months of 2018, dividends declared on common stock totaled $15.3 million ($0.09 per common share).
We have previously disclosed that our strategic priorities include a reduction of our relative long-term care exposure. To achieve this goal, it is likely that we will need to transfer the risks of a portion of this business through one or more reinsurance transactions. The comprehensive, nursing home and home health care long-term care business written before 2003 has negative margins. In order to meaningfully reduce the risk associated with our long-term care block, a substantial ceding commission would be paid by the Company to transfer long-term care risk through reinsurance. Such a reduction of our long-term care exposure would result in the recognition of a loss. Due to our current tax position, it is likely that a portion of the tax benefit recognized on the loss would not be realized and we may be required to increase our valuation allowance for deferred tax assets. Although we believe reducing our exposure to the risk of long-term care business would benefit the Company in the long term, such a transaction could initially adversely impact certain aspects of our financial position, results of operations and/or cash flow.
82
CNO FINANCIAL GROUP, INC. AND SUBSIDIARIES
___________________
On November 21, 2017, Moody's affirmed our issuer credit and senior unsecured debt ratings of "Ba1" and the outlook for these ratings is stable. In Moody's view, obligations rated "Ba" are judged to have speculative elements and are subject to substantial credit risk. A rating is supplemented with numerical modifiers "1", "2" or "3" to show the relative standing within a category. Moody's has a total of 21 possible ratings ranging from "Aaa" to "C". There are ten ratings above CNO's "Ba1" rating and ten ratings that are below its rating.
On August 15, 2017, Fitch affirmed its “BB+” rating on our issuer credit and senior unsecured debt. The outlook for these ratings is stable. In Fitch's view, an obligation rated "BB" indicates an elevated vulnerability to default risk, particularly in the event of adverse changes in business or economic conditions over time; however, business or financial flexibility exists which supports the servicing of financial commitments. Pluses and minuses show the relative standing within a category. Fitch has a total of 21 possible ratings ranging from "AAA" to "D". There are ten ratings above CNO's "BB+" rating and ten ratings that are below its rating.
On June 23, 2017, S&P affirmed our issuer credit and unsecured debt ratings of "BB+" and revised the outlook for these ratings to stable from negative. In S&P's view, an obligation rated "BB" is less vulnerable to nonpayment than other speculative issues; however, it faces major ongoing uncertainties or exposure to adverse business, financial or economic conditions which could lead to the obligor's inadequate capacity to meet its financial commitment on the obligation. Pluses and minuses show the relative standing within a category. S&P has a total of 22 possible ratings ranging from "AAA (Extremely Strong)" to "D (Payment Default)". There are ten ratings above CNO's "BB+" rating and eleven ratings that are below its rating.
On February 8, 2017, A.M. Best affirmed our issuer credit and senior unsecured debt ratings of "bbb-" and the outlook for these ratings is stable. In A.M. Best's view, a company rated "bbb-" has an adequate ability to meet the terms of its obligations; however, the issuer is more susceptible to changes in economic or other conditions. Pluses and minuses show the relative standing within a category. A.M. Best has a total of 22 possible ratings ranging from "aaa (Exceptional)" to "d (In default)". There are nine ratings above CNO's "bbb-" rating and twelve ratings that are below its rating.
We believe that the existing cash available to the holding company, the cash flows to be generated from operations and other transactions will be sufficient to allow us to meet our debt service obligations, pay corporate expenses and satisfy other financial obligations. However, our cash flow is affected by a variety of factors, many of which are outside of our control, including insurance regulatory issues, competition, financial markets and other general business conditions. We cannot provide assurance that we will possess sufficient income and liquidity to meet all of our debt service requirements and other holding company obligations.
83
CNO FINANCIAL GROUP, INC. AND SUBSIDIARIES
___________________
INVESTMENTS
At March 31, 2018, the amortized cost, gross unrealized gains and losses and estimated fair value of fixed maturities, available for sale, were as follows (dollars in millions):
Amortized cost | Gross unrealized gains | Gross unrealized losses | Estimated fair value | ||||||||||||
Investment grade (a): | |||||||||||||||
Corporate securities | $ | 12,615.4 | $ | 1,180.2 | $ | (76.3 | ) | $ | 13,719.3 | ||||||
United States Treasury securities and obligations of United States government corporations and agencies | 149.4 | 24.0 | (.3 | ) | 173.1 | ||||||||||
States and political subdivisions | 1,841.7 | 203.3 | (1.6 | ) | 2,043.4 | ||||||||||
Debt securities issued by foreign governments | 78.0 | 1.4 | (1.7 | ) | 77.7 | ||||||||||
Asset-backed securities | 1,400.1 | 29.1 | (6.6 | ) | 1,422.6 | ||||||||||
Collateralized debt obligations | 350.3 | 1.7 | (.2 | ) | 351.8 | ||||||||||
Commercial mortgage-backed securities | 1,346.9 | 20.4 | (16.3 | ) | 1,351.0 | ||||||||||
Mortgage pass-through securities | 1.7 | .1 | — | 1.8 | |||||||||||
Collateralized mortgage obligations | 305.5 | 19.6 | (1.6 | ) | 323.5 | ||||||||||
Total investment grade fixed maturities, available for sale | 18,089.0 | 1,479.8 | (104.6 | ) | 19,464.2 | ||||||||||
Below-investment grade (a) (b): | |||||||||||||||
Corporate securities | 1,014.1 | 15.9 | (24.0 | ) | 1,006.0 | ||||||||||
States and political subdivisions | 2.0 | .9 | — | 2.9 | |||||||||||
Asset-backed securities | 1,325.5 | 136.8 | (1.1 | ) | 1,461.2 | ||||||||||
Collateralized debt obligations | 12.7 | — | — | 12.7 | |||||||||||
Commercial mortgage-backed securities | 51.1 | .3 | (.5 | ) | 50.9 | ||||||||||
Collateralized mortgage obligations | 326.5 | 51.1 | — | 377.6 | |||||||||||
Total below-investment grade fixed maturities, available for sale | 2,731.9 | 205.0 | (25.6 | ) | 2,911.3 | ||||||||||
Total fixed maturities, available for sale | $ | 20,820.9 | $ | 1,684.8 | $ | (130.2 | ) | $ | 22,375.5 | ||||||
_______________
(a) | Investment ratings are assigned the second lowest rating by Nationally Recognized Statistical Rating Organizations ("NRSROs") (Moody's, S&P or Fitch), or if not rated by such firms, the rating assigned by the NAIC. NAIC designations of "1" or "2" include fixed maturities generally rated investment grade (rated "Baa3" or higher by Moody's or rated "BBB-" or higher by S&P and Fitch). NAIC designations of "3" through "6" are referred to as below-investment grade (which generally are rated "Ba1" or lower by Moody's or rated "BB+" or lower by S&P and Fitch). References to investment grade or below-investment grade throughout our consolidated financial statements are determined as described above. |
(b) | Certain structured securities rated below-investment grade by NRSROs may be assigned a NAIC 1 or NAIC 2 designation based on the cost basis of the security relative to estimated recoverable amounts as determined by the NAIC. Refer to the table below for a summary of our fixed maturity securities, available for sale, by NAIC designations. |
84
CNO FINANCIAL GROUP, INC. AND SUBSIDIARIES
___________________
The NAIC evaluates the fixed maturity investments of insurers for regulatory and capital assessment purposes and assigns securities to one of six credit quality categories called NAIC designations, which are used by insurers when preparing their annual statements based on statutory accounting principles. The NAIC designations are generally similar to the credit quality designations of the NRSROs for marketable fixed maturity securities, except for certain structured securities. However, certain structured securities rated below investment grade by the NRSROs can be assigned NAIC 1 or NAIC 2 designations depending on the cost basis of the holding relative to estimated recoverable amounts as determined by the NAIC. The following summarizes the NAIC designations and NRSRO equivalent ratings:
NAIC Designation | NRSRO Equivalent Rating | |
1 | AAA/AA/A | |
2 | BBB | |
3 | BB | |
4 | B | |
5 | CCC and lower | |
6 | In or near default | |
A summary of our fixed maturity securities, available for sale, by NAIC designations (or for fixed maturity securities held by non-regulated entities, based on NRSRO ratings) as of March 31, 2018 is as follows (dollars in millions):
NAIC designation | Amortized cost | Estimated fair value | Percentage of total estimated fair value | ||||||||
1 | $ | 9,529.3 | $ | 10,430.6 | 46.6 | % | |||||
2 | 10,065.4 | 10,726.7 | 48.0 | ||||||||
Total NAIC 1 and 2 (investment grade) | 19,594.7 | 21,157.3 | 94.6 | ||||||||
3 | 901.0 | 899.9 | 4.0 | ||||||||
4 | 274.4 | 266.3 | 1.2 | ||||||||
5 | 42.7 | 42.8 | .2 | ||||||||
6 | 8.1 | 9.2 | — | ||||||||
Total NAIC 3, 4, 5 and 6 (below-investment grade) | 1,226.2 | 1,218.2 | 5.4 | ||||||||
$ | 20,820.9 | $ | 22,375.5 | 100.0 | % | ||||||
85
CNO FINANCIAL GROUP, INC. AND SUBSIDIARIES
___________________
Concentration of Fixed Maturity Securities, Available for Sale
The following table summarizes the carrying values and gross unrealized losses of our fixed maturity securities, available for sale, by category as of March 31, 2018 (dollars in millions):
Carrying value | Percent of fixed maturities | Gross unrealized losses | Percent of gross unrealized losses | ||||||||||
Asset-backed securities | $ | 2,883.8 | 12.9 | % | $ | 7.7 | 5.9 | % | |||||
States and political subdivisions | 2,046.3 | 9.2 | 1.6 | 1.2 | |||||||||
Insurance | 1,822.3 | 8.1 | 6.0 | 4.6 | |||||||||
Utilities | 1,658.5 | 7.4 | 2.7 | 2.1 | |||||||||
Energy | 1,491.5 | 6.7 | 15.4 | 11.8 | |||||||||
Commercial mortgage-backed securities | 1,401.9 | 6.3 | 16.8 | 12.9 | |||||||||
Banks | 1,237.5 | 5.5 | 6.0 | 4.6 | |||||||||
Healthcare/pharmaceuticals | 1,228.6 | 5.5 | 5.1 | 3.9 | |||||||||
Food/beverage | 1,009.8 | 4.5 | 4.4 | 3.4 | |||||||||
Collateralized mortgage obligations | 701.1 | 3.1 | 1.6 | 1.3 | |||||||||
Cable/media | 606.0 | 2.7 | 14.2 | 10.9 | |||||||||
Capital goods | 577.5 | 2.6 | .2 | .2 | |||||||||
Transportation | 562.9 | 2.5 | 1.8 | 1.4 | |||||||||
Chemicals | 545.2 | 2.4 | 6.5 | 5.0 | |||||||||
Real estate/REITs | 536.2 | 2.4 | 1.6 | 1.2 | |||||||||
Telecom | 485.0 | 2.2 | 1.6 | 1.2 | |||||||||
Technology | 424.9 | 1.9 | 3.7 | 2.8 | |||||||||
Brokerage | 396.4 | 1.8 | 4.4 | 3.4 | |||||||||
Collateralized debt obligations | 364.5 | 1.6 | .2 | .1 | |||||||||
Autos | 306.0 | 1.4 | 4.4 | 3.4 | |||||||||
Building materials | 295.1 | 1.3 | 10.3 | 7.9 | |||||||||
Aerospace/defense | 269.9 | 1.2 | .2 | .2 | |||||||||
Retail | 218.0 | 1.0 | 2.6 | 2.0 | |||||||||
Other | 1,306.6 | 5.8 | 11.2 | 8.6 | |||||||||
Total fixed maturities, available for sale | $ | 22,375.5 | 100.0 | % | $ | 130.2 | 100.0 | % | |||||
Below-Investment Grade Securities
At March 31, 2018, the amortized cost of the Company's below-investment grade fixed maturity securities was $2,731.9 million, or 13 percent of the Company's fixed maturity portfolio. The estimated fair value of the below-investment grade portfolio was $2,911.3 million, or 107 percent of the amortized cost.
Below-investment grade corporate debt securities typically have different characteristics than investment grade corporate debt securities. Based on historical performance, probability of default by the borrower is significantly greater for below-investment grade corporate debt securities and in many cases severity of loss is relatively greater as such securities are generally unsecured and often subordinated to other indebtedness of the issuer. Also, issuers of below-investment grade corporate debt securities frequently have higher levels of debt relative to investment-grade issuers, hence, all other things being equal, are generally more sensitive to adverse economic conditions. The Company attempts to reduce the overall risk related to its investment in below-investment grade securities, as in all investments, through careful credit analysis, strict investment policy guidelines, and diversification by issuer and/or guarantor and by industry.
86
CNO FINANCIAL GROUP, INC. AND SUBSIDIARIES
___________________
Net Realized Investment Gains (Losses)
The following table sets forth the net realized investment gains (losses) for the periods indicated (dollars in millions):
Three months ended | |||||||
March 31, | |||||||
2018 | 2017 | ||||||
Fixed maturity securities, available for sale: | |||||||
Gross realized gains on sale | $ | 8.2 | $ | 7.0 | |||
Gross realized losses on sale | (7.7 | ) | (2.7 | ) | |||
Impairment losses recognized | — | (3.2 | ) | ||||
Net realized investment gains from fixed maturities | .5 | 1.1 | |||||
Equity securities | — | 1.9 | |||||
Change in fair value of equity securities (a) | (12.5 | ) | — | ||||
Mortgage loans | — | 1.0 | |||||
Impairments of other investments | — | (5.2 | ) | ||||
Other (a) | (3.2 | ) | 9.1 | ||||
Net realized investment gains (losses) | $ | (15.2 | ) | $ | 7.9 | ||
_________________
(a) | Changes in the estimated fair value of trading securities that we have elected the fair value option and equity securities (and are still held as of the end of the respective periods) were $(8.9) million and $3.0 million for the three months ended March 31, 2018 and 2017, respectively. |
During the first three months of 2018, we recognized net realized investment losses of $15.2 million, which were comprised of: (i) $.5 million of net gains from the sales of investments; (ii) a $12.5 million unfavorable change in the fair value of equity securities; (iii) the decrease in fair value of certain fixed maturity investments with embedded derivatives of $.5 million; and (iv) the decrease in fair value of embedded derivatives related to a modified coinsurance agreement of $2.7 million.
During the first three months of 2017, we recognized net realized investment gains of $7.9 million, which were comprised of: (i) $12.9 million of net gains from the sales of investments; (ii) the increase in fair value of certain fixed maturity investments with embedded derivatives of $2.7 million; (iii) the increase in fair value of embedded derivatives related to a modified coinsurance agreement of $.7 million; and (iv) $8.4 million of writedowns of investments for other than temporary declines in fair value recognized through net income.
At March 31, 2018, there was one fixed maturity investments in default with an amortized cost and carrying value of $.5 million and $.4 million, respectively.
During the first three months of 2018, the $7.7 million of gross realized losses on sales of $444.3 million of fixed maturity securities, available for sale included: (i) $3.7 million related to various corporate securities; (ii) $2.0 million related to commercial mortgage-backed securities; and (iii) $2.0 million related to various other investments. Securities are generally sold at a loss following unforeseen issuer-specific events or conditions or shifts in perceived relative values. These reasons include but are not limited to: (i) changes in the investment environment; (ii) expectation that the market value could deteriorate; (iii) our desire to reduce our exposure to an asset class, an issuer or an industry; (iv) prospective or actual changes in credit quality; or (v) changes in expected portfolio cash flows.
During the first three months of 2017, the $2.7 million of gross realized losses on sales of $95.3 million of fixed maturity securities, available for sale, included: (i) $1.5 million related to various corporate securities; (ii) $.9 million related to commercial mortgage-backed securities; and (iii) $.3 million related to various other investments.
87
CNO FINANCIAL GROUP, INC. AND SUBSIDIARIES
___________________
Our fixed maturity investments are generally purchased in the context of various long-term strategies, including funding insurance liabilities, so we do not generally seek to generate short-term realized gains through the purchase and sale of such securities. In certain circumstances, including those in which securities are selling at prices which exceed our view of their underlying economic value, or when it is possible to reinvest the proceeds to better meet our long-term asset-liability objectives, we may sell certain securities.
There were no impairment losses recognized in the first three months of 2018.
There were no investments sold at a loss during the first three months of 2018 which had been continuously in an unrealized loss position exceeding 20 percent of the amortized cost basis prior to the sale.
We regularly evaluate all of our investments with unrealized losses for possible impairment. Our assessment of whether unrealized losses are "other than temporary" requires significant judgment. Factors considered include: (i) the extent to which fair value is less than the cost basis; (ii) the length of time that the fair value has been less than cost; (iii) whether the unrealized loss is event driven, credit-driven or a result of changes in market interest rates or risk premium; (iv) the near-term prospects for specific events, developments or circumstances likely to affect the value of the investment; (v) the investment's rating and whether the investment is investment-grade and/or has been downgraded since its purchase; (vi) whether the issuer is current on all payments in accordance with the contractual terms of the investment and is expected to meet all of its obligations under the terms of the investment; (vii) whether we intend to sell the investment or it is more likely than not that circumstances will require us to sell the investment before recovery occurs; (viii) the underlying current and prospective asset and enterprise values of the issuer and the extent to which the recoverability of the carrying value of our investment may be affected by changes in such values; (ix) projections of, and unfavorable changes in, cash flows on structured securities including mortgage-backed and asset-backed securities; (x) our best estimate of the value of any collateral; and (xi) other objective and subjective factors.
Future events may occur, or additional information may become available, which may necessitate future realized losses in our portfolio. Significant losses could have a material adverse effect on our consolidated financial statements in future periods.
The following table sets forth the amortized cost and estimated fair value of those fixed maturities, available for sale, with unrealized losses at March 31, 2018, by contractual maturity. Actual maturities will differ from contractual maturities because borrowers may have the right to call or prepay obligations with or without penalties. Structured securities frequently include provisions for periodic principal payments and permit periodic unscheduled payments.
Amortized cost | Estimated fair value | ||||||
(Dollars in millions) | |||||||
Due in one year or less | $ | 25.9 | $ | 25.8 | |||
Due after one year through five years | 175.5 | 172.8 | |||||
Due after five years through ten years | 666.2 | 648.5 | |||||
Due after ten years | 2,284.2 | 2,200.8 | |||||
Subtotal | 3,151.8 | 3,047.9 | |||||
Structured securities | 1,299.0 | 1,272.7 | |||||
Total | $ | 4,450.8 | $ | 4,320.6 | |||
88
CNO FINANCIAL GROUP, INC. AND SUBSIDIARIES
___________________
The following summarizes the investments in our portfolio rated below-investment grade which have been continuously in an unrealized loss position exceeding 20 percent of the cost basis for the period indicated as of March 31, 2018 (dollars in millions):
Number of issuers | Cost basis | Unrealized loss | Estimated fair value | ||||||||||
Less than 6 months | 1 | $ | 9.2 | $ | (2.1 | ) | $ | 7.1 | |||||
$ | 9.2 | $ | (2.1 | ) | $ | 7.1 | |||||||
The following table summarizes the gross unrealized losses of our fixed maturity securities, available for sale, by category and ratings category as of March 31, 2018 (dollars in millions):
Investment grade | Below-investment grade | ||||||||||||||||||
AAA/AA/A | BBB | BB | B+ and below | Total gross unrealized losses | |||||||||||||||
Commercial mortgage-backed securities | $ | 15.9 | $ | .4 | $ | .5 | $ | — | $ | 16.8 | |||||||||
Energy | 1.8 | 9.5 | .3 | 3.8 | 15.4 | ||||||||||||||
Cable/media | .3 | 10.9 | 1.8 | 1.2 | 14.2 | ||||||||||||||
Building materials | — | 9.6 | .7 | — | 10.3 | ||||||||||||||
Asset-backed securities | 4.2 | 2.4 | .5 | .6 | 7.7 | ||||||||||||||
Chemicals | .2 | 2.6 | 3.7 | — | 6.5 | ||||||||||||||
Insurance | 1.2 | 4.8 | — | — | 6.0 | ||||||||||||||
Banks | .7 | 5.2 | .1 | — | 6.0 | ||||||||||||||
Healthcare/pharmaceuticals | — | 3.6 | .3 | 1.2 | 5.1 | ||||||||||||||
Autos | — | 3.6 | .7 | .1 | 4.4 | ||||||||||||||
Brokerage | .2 | 3.8 | — | .4 | 4.4 | ||||||||||||||
Food/beverage | — | 3.6 | .2 | .6 | 4.4 | ||||||||||||||
Technology | — | 2.8 | .7 | .2 | 3.7 | ||||||||||||||
Business services | — | — | 3.3 | — | 3.3 | ||||||||||||||
Utilities | .7 | 1.7 | — | .3 | 2.7 | ||||||||||||||
Retail | — | 1.7 | — | .9 | 2.6 | ||||||||||||||
Other | 5.5 | 7.7 | 1.4 | 2.1 | 16.7 | ||||||||||||||
Total fixed maturities, available for sale | $ | 30.7 | $ | 73.9 | $ | 14.2 | $ | 11.4 | $ | 130.2 | |||||||||
Our investment strategy is to maximize, over a sustained period and within acceptable parameters of quality and risk, investment income and total investment return through active strategic asset allocation and investment management. Accordingly, we may sell securities at a gain or a loss to enhance the projected total return of the portfolio as market opportunities change, to reflect changing perceptions of risk, or to better match certain characteristics of our investment portfolio with the corresponding characteristics of our insurance liabilities.
89
CNO FINANCIAL GROUP, INC. AND SUBSIDIARIES
___________________
The following table summarizes the gross unrealized losses and fair values of our investments with unrealized losses that are not deemed to be other-than-temporarily impaired, aggregated by investment category and length of time that such securities have been in a continuous unrealized loss position, at March 31, 2018 (dollars in millions):
Less than 12 months | 12 months or greater | Total | ||||||||||||||||||||||
Description of securities | Fair value | Unrealized losses | Fair value | Unrealized losses | Fair value | Unrealized losses | ||||||||||||||||||
United States Treasury securities and obligations of United States government corporations and agencies | $ | 18.4 | $ | (.3 | ) | $ | 12.6 | $ | — | $ | 31.0 | $ | (.3 | ) | ||||||||||
States and political subdivisions | 61.8 | (1.2 | ) | 14.5 | (.3 | ) | 76.3 | (1.5 | ) | |||||||||||||||
Debt securities issued by foreign governments | 39.4 | (1.6 | ) | 8.0 | (.2 | ) | 47.4 | (1.8 | ) | |||||||||||||||
Corporate securities | 2,594.2 | (70.8 | ) | 299.0 | (29.5 | ) | 2,893.2 | (100.3 | ) | |||||||||||||||
Asset-backed securities | 539.5 | (5.4 | ) | 67.9 | (2.3 | ) | 607.4 | (7.7 | ) | |||||||||||||||
Collateralized debt obligations | 74.4 | (.2 | ) | — | — | 74.4 | (.2 | ) | ||||||||||||||||
Commercial mortgage-backed securities | 310.4 | (4.4 | ) | 201.0 | (12.4 | ) | 511.4 | (16.8 | ) | |||||||||||||||
Mortgage pass-through securities | .1 | — | — | — | .1 | — | ||||||||||||||||||
Collateralized mortgage obligations | 77.0 | (1.6 | ) | 2.4 | — | 79.4 | (1.6 | ) | ||||||||||||||||
Total fixed maturities, available for sale | $ | 3,715.2 | $ | (85.5 | ) | $ | 605.4 | $ | (44.7 | ) | $ | 4,320.6 | $ | (130.2 | ) | |||||||||
Based on management's current assessment of investments with unrealized losses at March 31, 2018, the Company believes the issuers of the securities will continue to meet their obligations. While we do not have the intent to sell securities with unrealized losses and it is not more likely than not that we will be required to sell securities with unrealized losses prior to their anticipated recovery, our intent on an individual security may change, based upon market or other unforeseen developments. In such instances, if a loss is recognized from a sale subsequent to a balance sheet date due to these unexpected developments, the loss is recognized in the period in which we had the intent to sell the security before its anticipated recovery.
Structured Securities
At March 31, 2018, fixed maturity investments included structured securities with an estimated fair value of $5.4 billion (or 24 percent of all fixed maturity securities). The yield characteristics of structured securities generally differ in some respects from those of traditional corporate fixed-income securities or government securities. For example, interest and principal payments on structured securities may occur more frequently, often monthly. In many instances, we are subject to variability in the amount and timing of principal and interest payments. For example, in many cases, partial prepayments may occur at the option of the issuer and prepayment rates are influenced by a number of factors that cannot be predicted with certainty, including: the relative sensitivity of prepayments on the underlying assets backing the security to changes in interest rates and asset values; the availability of alternative financing; a variety of economic, geographic and other factors; the timing, pace and proceeds of liquidations of defaulted collateral; and various security-specific structural considerations (for example, the repayment priority of a given security in a securitization structure). In addition, the total amount of payments for non-agency structured securities may be affected by changes to cumulative default rates or loss severities of the related collateral.
90
CNO FINANCIAL GROUP, INC. AND SUBSIDIARIES
___________________
The following table sets forth the par value, amortized cost and estimated fair value of structured securities, summarized by interest rates on the underlying collateral, at March 31, 2018 (dollars in millions):
Par value | Amortized cost | Estimated fair value | |||||||||
Below 4 percent | $ | 1,920.9 | $ | 1,766.2 | $ | 1,826.0 | |||||
4 percent – 5 percent | 1,701.1 | 1,563.4 | 1,633.3 | ||||||||
5 percent – 6 percent | 1,356.5 | 1,228.4 | 1,309.9 | ||||||||
6 percent – 7 percent | 255.2 | 230.2 | 244.5 | ||||||||
7 percent – 8 percent | 80.7 | 81.3 | 88.8 | ||||||||
8 percent and above | 251.3 | 250.8 | 250.6 | ||||||||
Total structured securities | $ | 5,565.7 | $ | 5,120.3 | $ | 5,353.1 | |||||
The amortized cost and estimated fair value of structured securities at March 31, 2018, summarized by type of security, were as follows (dollars in millions):
Estimated fair value | ||||||||||
Type | Amortized cost | Amount | Percent of fixed maturities | |||||||
Pass-throughs, sequential and equivalent securities | $ | 529.6 | $ | 586.0 | 2.6 | % | ||||
Planned amortization classes, target amortization classes and accretion-directed bonds | 87.1 | 99.5 | .4 | |||||||
Commercial mortgage-backed securities | 1,398.0 | 1,401.9 | 6.3 | |||||||
Asset-backed securities | 2,725.6 | 2,883.8 | 12.9 | |||||||
Collateralized debt obligations | 363.0 | 364.5 | 1.6 | |||||||
Other | 17.0 | 17.4 | .1 | |||||||
Total structured securities | $ | 5,120.3 | $ | 5,353.1 | 23.9 | % | ||||
Pass-throughs, sequentials and equivalent securities have unique prepayment variability characteristics. Pass-through securities typically return principal to the holders based on cash payments from the underlying mortgage obligations. Sequential securities return principal to tranche holders in a detailed hierarchy. Planned amortization classes, targeted amortization classes and accretion-directed bonds adhere to fixed schedules of principal payments as long as the underlying mortgage loans experience prepayments within certain estimated ranges. In most circumstances, changes in prepayment rates are first absorbed by support or companion classes insulating the timing of receipt of cash flows from the consequences of both faster prepayments (average life shortening) and slower prepayments (average life extension).
Commercial mortgage-backed securities are secured by commercial real estate mortgages, generally income producing properties that are managed for profit. Property types include multi-family dwellings including apartments, retail centers, hotels, restaurants, hospitals, nursing homes, warehouses, and office buildings. While most commercial mortgage-backed securities have call protection features whereby underlying borrowers may not prepay their mortgages for stated periods of time without incurring prepayment penalties, recoveries on defaulted collateral may result in involuntary prepayments.
91
CNO FINANCIAL GROUP, INC. AND SUBSIDIARIES
___________________
Mortgage Loans
The following table provides the carrying value and estimated fair value of our outstanding commercial mortgage loans and the underlying collateral as of March 31, 2018 (dollars in millions):
Estimated fair value | |||||||||||
Loan-to-value ratio (a) | Carrying value | Mortgage loans | Collateral | ||||||||
Less than 60% | $ | 979.4 | $ | 991.3 | $ | 2,535.5 | |||||
60% to 70% | 322.8 | 319.9 | 498.9 | ||||||||
Greater than 70% to 80% | 144.7 | 146.4 | 196.4 | ||||||||
Greater than 80% to 90% | 39.2 | 38.9 | 47.2 | ||||||||
Greater than 90% | 38.4 | 39.0 | 40.4 | ||||||||
Total | $ | 1,524.5 | $ | 1,535.5 | $ | 3,318.4 | |||||
________________
(a) | Loan-to-value ratios are calculated as the ratio of: (i) the carrying value of the commercial mortgage loans; to (ii) the estimated fair value of the underlying collateral. |
At March 31, 2018, we held residential mortgage loan investments with a carrying value of $76.7 million and a fair value of $75.8 million.
INVESTMENTS IN VARIABLE INTEREST ENTITIES
The following table provides supplemental information about the revenues and expenses of the VIEs which have been consolidated in accordance with authoritative guidance, after giving effect to the elimination of our investment in the VIEs and investment management fees earned by a subsidiary of the Company (dollars in millions):
Three months ended | |||||||
March 31, | |||||||
2018 | 2017 | ||||||
Revenues: | |||||||
Net investment income – policyholder and other special-purpose portfolios | $ | 19.0 | $ | 19.9 | |||
Fee revenue and other income | 1.7 | 1.6 | |||||
Total revenues | 20.7 | 21.5 | |||||
Expenses: | |||||||
Interest expense | 13.2 | 13.6 | |||||
Other operating expenses | .6 | .3 | |||||
Total expenses | 13.8 | 13.9 | |||||
Income before net realized investment losses and income taxes | 6.9 | 7.6 | |||||
Net realized investment gains | — | 2.1 | |||||
Income before income taxes | $ | 6.9 | $ | 9.7 | |||
During the first three months of 2018, the VIEs recognized net realized investment gains of nil from the sales of fixed maturities. During the first three months of 2017, the VIEs recognized net realized investment gains of $2.1 million.
92
CNO FINANCIAL GROUP, INC. AND SUBSIDIARIES
___________________
Supplemental Information on Investments Held by VIEs
The following table summarizes the carrying values of the investments held by the VIEs by category as of March 31, 2018 (dollars in millions):
Carrying value | Percent of fixed maturities | Gross unrealized losses | Percent of gross unrealized losses | ||||||||||
Healthcare/pharmaceuticals | $ | 198.3 | 12.5 | % | $ | .4 | 5.1 | % | |||||
Technology | 170.8 | 10.8 | .2 | 3.0 | |||||||||
Cable/media | 158.1 | 10.0 | .8 | 12.1 | |||||||||
Food/beverage | 111.3 | 7.0 | 1.4 | 20.1 | |||||||||
Consumer products | 86.1 | 5.4 | .5 | 7.1 | |||||||||
Capital goods | 80.8 | 5.1 | .3 | 4.2 | |||||||||
Aerospace/defense | 80.0 | 5.1 | .1 | 1.4 | |||||||||
Paper | 75.5 | 4.8 | .4 | 5.8 | |||||||||
Building materials | 67.3 | 4.2 | .1 | 1.0 | |||||||||
Retail | 57.4 | 3.6 | 2.0 | 29.5 | |||||||||
Chemicals | 49.7 | 3.1 | .1 | 1.8 | |||||||||
Entertainment/hotels | 33.8 | 2.1 | .1 | .8 | |||||||||
Business services | 20.0 | 1.3 | .1 | 1.2 | |||||||||
Other | 394.8 | 25.0 | .3 | 6.9 | |||||||||
Total | $ | 1,583.9 | 100.0 | % | $ | 6.8 | 100.0 | % | |||||
The following table sets forth the amortized cost and estimated fair value of those investments held by the VIEs with unrealized losses at March 31, 2018, by contractual maturity. Actual maturities will differ from contractual maturities because borrowers may have the right to call or prepay obligations with or without penalties.
Amortized cost | Estimated fair value | ||||||
(Dollars in millions) | |||||||
Due in one year or less | $ | .2 | $ | .2 | |||
Due after one year through five years | 163.1 | 158.8 | |||||
Due after five years through ten years | 284.1 | 281.6 | |||||
Total | $ | 447.4 | $ | 440.6 | |||
There were no investments sold at a loss during the first three months of 2018 which had been continuously in an unrealized loss position exceeding 20 percent of the amortized cost basis prior to the sale.
There were no investments in our portfolio rated below-investment grade which had been continuously in an unrealized loss position exceeding 20 percent of the cost basis.
NEW ACCOUNTING STANDARDS
See "Recently Issued Accounting Standards" in the notes to consolidated financial statements for a discussion of recently issued accounting standards.
93
CNO FINANCIAL GROUP, INC. AND SUBSIDIARIES
___________________
ITEM 3. QUANTITATIVE AND QUALITATIVE DISCLOSURES ABOUT MARKET RISK.
Our market risks, and the ways we manage them, are summarized in "Management's Discussion and Analysis of Financial Condition and Results of Operations", included in our Annual Report on Form 10-K for the year ended December 31, 2017. There have been no material changes in the first three months of 2018 to such risks or our management of such risks.
ITEM 4. CONTROLS AND PROCEDURES.
Evaluation of Disclosure Controls and Procedures. CNO's management, under the supervision and with the participation of the Chief Executive Officer and the Chief Financial Officer, evaluated the effectiveness of CNO's disclosure controls and procedures (as defined in Rules 13a-15(e) and 15d-15(e) under the Securities Exchange Act of 1934, as amended). Based on its evaluation, the Chief Executive Officer and Chief Financial Officer concluded that, as of March 31, 2018, CNO's disclosure controls and procedures were effective to ensure that information required to be disclosed by CNO in reports that it files or submits under the Securities Exchange Act of 1934 is recorded, processed, summarized and reported within the time periods specified in the SEC's rules and forms. Disclosure controls and procedures are also designed to reasonably assure that such information is accumulated and communicated to our management, including our Chief Executive Officer and Chief Financial Officer, as appropriate, to allow timely decisions regarding required disclosure.
Changes to Internal Control Over Financial Reporting. There were no changes in the Company's internal control over financial reporting (as defined in Rule 13a-15(f) under the Securities Exchange Act of 1934) during the three months ended March 31, 2018, that have materially affected, or are reasonably likely to materially affect, our internal control over financial reporting.
94
CNO FINANCIAL GROUP, INC. AND SUBSIDIARIES
___________________
PART II - OTHER INFORMATION
ITEM 1. LEGAL PROCEEDINGS.
Information required for Part II, Item 1 is incorporated by reference to the discussion under the heading "Litigation and Other Legal Proceedings" in the footnotes to our consolidated financial statements included in Part I, Item 1 of this Form 10-Q.
ITEM 1A. RISK FACTORS.
CNO and its businesses are subject to a number of risks including general business and financial risk factors. Any or all of such factors could have a material adverse effect on the business, financial condition or results of operations of CNO. Refer to "Risk Factors" in our Annual Report on Form 10-K for the year ended December 31, 2017, for further discussion of such risk factors. There have been no material changes from such previously disclosed risk factors.
ITEM 2. UNREGISTERED SALES OF EQUITY SECURITIES AND USE OF PROCEEDS.
Issuer Purchases of Equity Securities
Period (in 2018) | Total number of shares (or units) | Average price paid per share (or unit) | Total number of shares (or units) purchased as part of publicly announced plans or programs | Maximum number (or approximate dollar value) of shares (or units) that may yet be purchased under the plans or programs (a) | ||||||||||
(dollars in millions) | ||||||||||||||
January 1 through January 31 | — | $ | — | — | $ | 385.6 | ||||||||
February 1 through February 28 | 230,512 | 23.29 | — | 385.6 | ||||||||||
March 1 through March 31 | 38,383 | 21.31 | — | 385.6 | ||||||||||
Total | 268,895 | 23.01 | — | 385.6 | ||||||||||
_________________
(a) | In May 2011, the Company announced a securities repurchase program of up to $100.0 million. In February 2012, June 2012, December 2012, December 2013, November 2014, November 2015 and May 2017, the Company's Board of Directors approved, in aggregate, an additional $1,900.0 million to repurchase the Company's outstanding securities. |
95
CNO FINANCIAL GROUP, INC. AND SUBSIDIARIES
___________________
ITEM 6. EXHIBITS.
12.1 | |
31.1 | |
31.2 | |
32.1 | |
32.2 | |
101.INS | XBRL Instance Document. |
101.SCH | XBRL Taxonomy Extension Schema Document. |
101.CAL | XBRL Taxonomy Extension Calculation Linkbase Document. |
101.DEF | XBRL Taxonomy Extension Definition Linkbase Document. |
101.LAB | XBRL Taxonomy Extension Label Linkbase Document. |
101.PRE | XBRL Taxonomy Extension Presentation Linkbase Document. |
96
SIGNATURE
Pursuant to the requirements of the Securities Exchange Act of 1934, the Registrant has duly caused this report to be signed on its behalf by the undersigned thereunto duly authorized.
CNO FINANCIAL GROUP, INC.
Dated: May 2, 2018
By: | /s/ John R. Kline | |
John R. Kline | ||
Senior Vice President and Chief Accounting Officer | ||
(authorized officer and principal accounting officer) | ||
97