Attached files
| file | filename |
|---|---|
| EX-99.2 - EXHIBIT 99.2 - SEACOAST BANKING CORP OF FLORIDA | tv492744_ex99-2.htm |
| EX-99.1 - EXHIBIT 99.1 - SEACOAST BANKING CORP OF FLORIDA | tv492744_ex99-1.htm |
| 8-K - FORM 8-K - SEACOAST BANKING CORP OF FLORIDA | tv492744_8k.htm |
Exhibit 99.3

Q1 - 2018 Earnings Presentation Contact: (email) Chuck.Shaffer@SeacoastBank.com (phone) 772.221.7003 (web) www.SeacoastBanking.com

Cautionary Notice Regarding Forward - Looking Statements 2 This press release contains "forward - looking statements" within the meaning, and protections, of Section 27 A of the Securities Act of 1933 and Section 21 E of the Securities Exchange Act of 1934 , including, without limitation, statements about future financial and operating results, cost savings, enhanced revenues, economic and seasonal conditions in our markets, and improvements to reported earnings that may be realized from cost controls, tax law changes, and for integration of banks that we have acquired, or expect to acquire, as well as statements with respect to Seacoast's objectives, strategic plans, including Vision 2020 , expectations and intentions and other statements that are not historical facts . Actual results may differ from those set forth in the forward - looking statements . Forward - looking statements include statements with respect to our beliefs, plans, objectives, goals, expectations, anticipations, estimates and intentions, and involve known and unknown risks, uncertainties and other factors, which may be beyond our control, and which may cause the actual results, performance or achievements of Seacoast to be materially different from future results, performance or achievements expressed or implied by such forward - looking statements . You should not expect us to update any forward - looking statements . You can identify these forward - looking statements through our use of words such as “may,” “will,” “anticipate,” “assume,” “should,” “support”, “indicate,” “would,” “believe,” “contemplate,” “expect,” “estimate,” “continue,” “further”, “point to,” “project,” “could,” “intend” or other similar words and expressions of the future . These forward - looking statements may not be realized due to a variety of factors, including, without limitation : the effects of future economic and market conditions, including seasonality ; governmental monetary and fiscal policies, as well as legislative, tax and regulatory changes ; changes in accounting policies, rules and practices ; the risks of changes in interest rates on the level and composition of deposits, loan demand, liquidity and the values of loan collateral, securities, and interest sensitive assets and liabilities ; interest rate risks, sensitivities and the shape of the yield curve ; the effects of competition from other commercial banks, thrifts, mortgage banking firms, consumer finance companies, credit unions, securities brokerage firms, insurance companies, money market and other mutual funds and other financial institutions operating in our market areas and elsewhere, including institutions operating regionally, nationally and internationally, together with such competitors offering banking products and services by mail, telephone, computer and the Internet ; and the failure of assumptions underlying the establishment of reserves for possible loan losses . The risks of mergers and acquisitions, include, without limitation : unexpected transaction costs, including the costs of integrating operations ; the risks that the businesses will not be integrated successfully or that such integration may be more difficult, time - consuming or costly than expected ; the potential failure to fully or timely realize expected revenues and revenue synergies, including as the result of revenues following the merger being lower than expected ; the risk of deposit and customer attrition ; any changes in deposit mix ; unexpected operating and other costs, which may differ or change from expectations ; the risks of customer and employee loss and business disruption, including, without limitation, as the result of difficulties in maintaining relationships with employees ; increased competitive pressures and solicitations of customers by competitors ; as well as the difficulties and risks inherent with entering new markets . All written or oral forward - looking statements attributable to us are expressly qualified in their entirety by this cautionary notice, including, without limitation, those risks and uncertainties described in our annual report on Form 10 - K for the year ended December 31 , 2017 under “Special Cautionary Notice Regarding Forward - Looking Statements” and “Risk Factors”, and otherwise in our SEC reports and filings . Such reports are available upon request from the Company, or from the Securities and Exchange Commission, including through the SEC’s Internet website at http : //www . sec . gov .

• $5.9 billion in assets operating in the nation’s third most - populous state • Strong and growing presence in four of Florida’s most attractive MSAs ‒ #1 Florida based bank in the Orlando MSA ‒ Growing share in West Palm Beach ‒ #2 share in Port St Lucie MSA ‒ Growing presence in Tampa MSA • Investing in digital transformation, innovative business banking delivery • Growth - oriented culture, engaged associate base, strong customer advocacy • Active board with diverse range of experience and expertise • Market Cap: $1.2 billion (3/31/18) Valuable Florida Bank Franchise With Balanced Growth Strategy, Benefitting from Attractive Geography, Investments in Digital Transformation and Commercial Loan Platform, and Strategic Acquisitions 3 Seacoast Bank [NASDAQ: SBCF ] Orlando MSA West Palm Beach, Ft Lauderdale MSA Port St Lucie MSA Tampa MSA Seacoast Customer Map

4 Seacoast’s Differentiated Strategy Experienced Board & Management Team Comprehensive Customer Servicing Model Track Record of Value - Creating Acquisitions Expanding Analytical & Digital Capabilities Well - Positioned to Benefit From Florida Market Focused on Controls

5 1Q 2018 Highlights With a growing presence in Florida’s most attractive markets, Seacoast is one of Florida’s top - performing banking franchises. • Earnings per share totaled $0.38 on a GAAP basis, and $0.40 per share on an adjusted basis 1 . • Net income increased 127 % YoY to $18.0 million, while net revenue increased 29 % YoY to $ 62.1 million. Adjusted net income 1 increased 88 % YoY to $19.3 million, and adjusted revenue 1 increased 29% YoY or $14.1 million. • The first quarter ended with 1.38% Adjusted Return on Tangible Assets 1 and 14.8% Adjusted Return on Average Tangible Common Equity 1 . • Net interest margin expanded 9 basis points. • During the current quarter, deposits grew by 11% on an annualized basis. Demand deposits grew 25% on an annualized basis. • Record quarter for consumer and small business originations, totaling $98 million. • Fourth quarter acquisitions of NorthStar Banking Corporation and Palm Beach Community Bank are fully integrated and cost outs complete. 1 Non - GAAP measure, see “Explanation of Certain Unaudited Non - GAAP Financial Measures ”

6 ($ in thousands) • Net interest income 1 totaled $49.9 million, up $1.5 million or 3% from the prior quarter and $11.5 million or 30% from the prior year quarter. • Net interest margin was 3.80% in the current quarter compared to 3.71% in the prior quarter and 3.63% in the first quarter of 2017. • The impact of purchased loan accretion on total net interest margin represented 20 basis points in the current quarter, versus 22 in prior quarter and 23 in the first quarter of 2017. 1 Calculated on a fully taxable equivalent basis using amortized cost . Net Interest Income and Margin $38,377 $44,320 $45,903 $48,402 $49,853 3.63% 3.84% 3.74% 3.71% 3.80% $10,000 $15,000 $20,000 $25,000 $30,000 $35,000 $40,000 $45,000 $50,000 Q1-17 Q2-17 Q3-17 Q4-17 Q1-18 Net Interest Income Net Interest Margin

7 $2,422 $2,435 $2,626 $2,566 $2,672 $2,494 $2,671 $2,582 $2,836 $2,942 $1,257 $1,268 $1,318 $1,214 $1,380 $1,552 $1,272 $2,138 $1,487 $1,402 $1,447 $2,064 $1,981 $2,174 $2,946 $757 $836 $1,100 $1,056 $0 $1,000 $2,000 $3,000 $4,000 $5,000 $6,000 $7,000 $8,000 $9,000 $10,000 $11,000 $12,000 $13,000 Q1-17 Q2-17 Q3-17 Q4-17 Q1-18 BOLI Other Income Mortgage Banking Fees Wealth Management Fees Interchange Income Service Charges 2 $9,905 • Adjusted noninterest income 1 totaled $12.4 million, an increase of approximately $1.0 million or 9% compared to the prior quarter. • Increases in deposit service charges and interchange income reflect the success of our efforts to deepen engagement with our customers. • Wealth Management fees, which include trust and brokerage activity, increased 14% from prior quarter, the result of growth of $ 120 million in assets under management over the prior 12 months. • Other income increased over the prior quarter by $0.7 million, primarily related to gains on the sale of SBA loans. Additionally Marine Finance Fees increased by $0.3 million. $10,467 $11,481 $11,377 $12,398 $733 Adjusted Noninterest Income 1 1 Non - GAAP measure, see “Explanation of Certain Unaudited Non - GAAP Financial Measures” 2 Other income includes gains on sale of SBA loans, marine finance fees, swap related income and other fees related to customer ac tivity. ($ in thousands)

8 $16,389 $18,225 $18,097 $15,774 $18,274 $3,267 $3,108 $3,211 $3,216 $3,643 $4,625 $4,750 $4,500 $4,939 $5,225 $6,641 $7,746 $6,998 $7,475 $8,563 $0 $5,000 $10,000 $15,000 $20,000 $25,000 $30,000 $35,000 $40,000 Q1-17 Q2-17 Q3-17 Q4-17 Q1-18 Other Expense Occupancy / Telephone Data Processing Cost Salaries and Benefits 2 $35,705 $30,922 $33,829 $32,806 $31,404 • As a percentage of average tangible assets, adjusted noninterest expense in the current quarter was 2.55% compared to 2.24% for the prior quarter and 2.71% for the first quarter of 2017. • Higher salaries and benefits in the current quarter reflect the return of incentive accruals and of seasonal 401(k) and payroll tax expense, and the full impact of the two acquisitions completed in the fourth quarter of 2017, in line with prior guidance. • Increases in data processing, occupancy/telephone and other expense are the result of the full impact of the two acquisitions completed in the fourth quarter of 2017, in line with prior guidance . 1 Non - GAAP measure, see “Explanation of Certain Unaudited Non - GAAP Financial Measures ” 2 Other expense includes legal and professional fees, marketing expenses and other expenses associated with ongoing business op era tions. Adjusted Noninterest Expense 1 ($ in thousands)
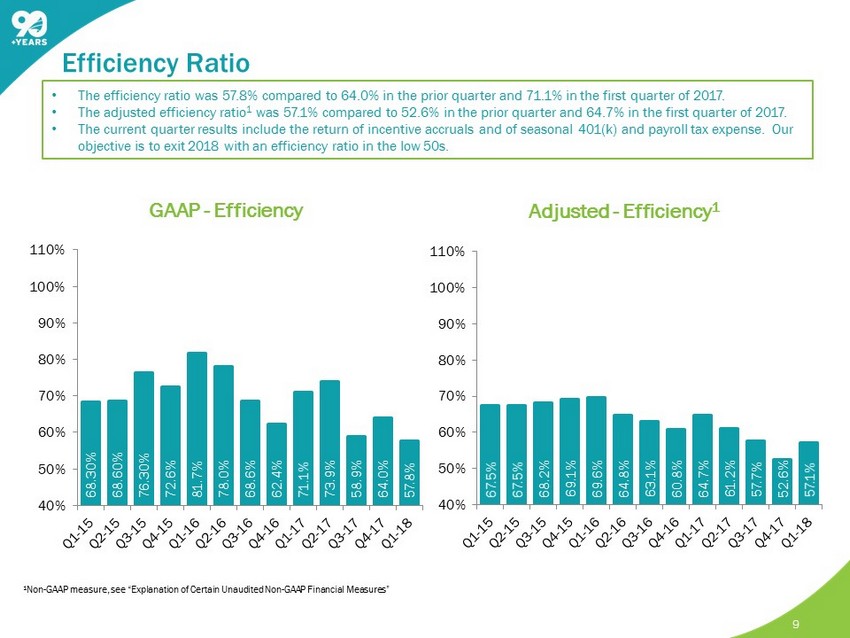
9 68.30% 68.60% 76.30% 72.6% 81.7% 78.0% 68.6% 62.4% 71.1% 73.9% 58.9% 64.0% 57.8% 40% 50% 60% 70% 80% 90% 100% 110% GAAP - Efficiency 67.5% 67.5% 68.2% 69.1% 69.6% 64.8% 63.1% 60.8% 64.7% 61.2% 57.7% 52.6% 57.1% 40% 50% 60% 70% 80% 90% 100% 110% Adjusted - Efficiency 1 1 Non - GAAP measure, see “Explanation of Certain Unaudited Non - GAAP Financial Measures ” • The efficiency ratio was 57.8% compared to 64.0% in the prior quarter and 71.1% in the first quarter of 2017. • The adjusted efficiency ratio 1 was 57.1% compared to 52.6% in the prior quarter and 64.7% in the first quarter of 2017. • The current quarter results include the return of incentive accruals and of seasonal 401(k) and payroll tax expense. Our objective is to exit 2018 with an efficiency ratio in the low 50s. Efficiency Ratio

10 Total Loans Outstanding (in millions) • First quarter loans totaled $3.9 billion, an increase of $923 million or 31% from year - ago levels. Adjusting for acquisitions, loans grew $265 million or 9% year over year. • Pipelines were $123 million in commercial, $71 million in mortgage, and $50 million in consumer and small business at March 31, 2018, all up from year end 2017. • The increase in yield on loan outstandings quarter over quarter reflects the positive impact of increases in benchmark interest rates and higher add - on rates for new loan production. • Purchased loan accretion was 27 basis points in Q1 2018 versus 31 basis points in the prior quarter, and 34 basis points in the first quarter of 2017. $2,974 $3,330 $3,385 $3,817 $3,897 4.44% 4.69% 4.70% 4.66% 4.74% 4.10% 4.33% 4.42% 4.35% 4.47% $0 $500 $1,000 $1,500 $2,000 $2,500 $3,000 $3,500 Q1-17 Q2-17 Q3-17 Q4-17 Q1-18 Loans Reported Yield Yield Excluding Accretion on Acquired Loans Loan Growth Momentum Continues, Supported by a Strong Florida Economy, and Prudent Guardrails (Yields presented above do not reflect FTE adjustments)

11 • Total deposits increased 3% from the prior quarter, and 28% from the first quarter of 2017. On an annualized basis deposits grew 11% quarter over quarter, and demand deposits grew 25% quarter over quarter. • Transaction accounts represent 53% of total deposits, and have increased 20% year over year. • Brokered time deposits totaled $184 million at the end of the first quarter , compared to $217 million at the end of the prior quarter. • Cost of deposits remains attractive at 0.33%, up 4 basis points from the prior quarter, and up 19 basis points from the first quarter of 2017. $2,096 $2,243 $2,220 $2,451 $2,503 $1,185 $1,238 $1,250 $1,366 $1,474 $398 $494 $643 $776 $743 $0 $500 $1,000 $1,500 $2,000 $2,500 $3,000 $3,500 $4,000 $4,500 $5,000 Q1-17 Q2-17 Q3-17 Q4-17 Q1-18 Transaction Accounts Savings and Money Market Time Deposits Deposit Balances (in millions) $4,720 $3,679 $3,975 $4,113 53% $4,593 The Deposit Franchise Continues to Perform Well and Serves as a Source of Earnings Strength

12 Net Charge - offs Nonperforming Loans ALLL $24,562 $26,000 $26,232 $27,122 $28,118 0.95% 0.95% 0.91% 0.90% 0.90% 0.83% 0.78% 0.77% 0.71% 0.72% 1Q 17 2Q 17 3Q 17 4Q 17 1Q 18 ALLL ALLL Ratio - Non-Acquired ALLL Ratio - Total Non - Acquired ALLL to Nonperforming $93 ($101) $279 $1,336 $1 0.01% - 0.01% 0.03% 0.14% 0.00% 1Q 17 2Q 17 3Q 17 4Q 17 1Q 18 NCO NCO / Loans $10,557 $10,541 $10,877 $12,569 $12,628 $6,428 $6,632 $3,498 $6,955 $6,711 0.57% 0.52% 0.42% 0.51% 0.50% 1Q 17 2Q 17 3Q 17 4Q 17 1Q 18 NPL - Non-Acquired NPL - Acquired Total NPL Ratio Credit Quality ($ in thousands) $24,487 $25,809 $25,822 $26,363 $27,541 231.95% 244.84% 237.40% 209.75% 218.10% 1Q 17 2Q 17 3Q 17 4Q 17 1Q 18 ALLL Non-Acquired ALLL to Nonperforming Non-Acquired Ratio

Maintaining Strong Capital to Support Balanced Growth Opportunities 13 Tangible Book Value / Book Value Per Share $10.41 $10.55 $10.95 $11.15 $11.39 $12.34 $13.29 $13.66 $14.70 $14.94 1Q 17 2Q 17 3Q 17 4Q 17 1Q 18 Tangible Book Value Per Share Book Value Per Share 10.7% 11.2% 12.8% 13.5% 14.8% 1Q 17 2Q 17 3Q 17 4Q 17 1Q 18 Adjusted Return on Tangible Common Equity 1 14.9% 14.5% 14.8% 14.2% 15.0% 14.2% 13.8% 14.1% 13.6% 14.4% 1Q 17 2Q 17 3Q 17 4Q 17 1Q 18 Total Risk Based Capital Tier 1 Ratio Total Risk Based and Tier 1 Capital Tangible Common Equity / Tangible Assets 9.0% 8.9% 9.1% 9.3% 9.3% 1Q 17 2Q 17 3Q 17 4Q 17 1Q 18 1 Non - GAAP measure, see “Explanation of Certain Unaudited Non - GAAP Financial Measures.”

Reiterating Vision 2020 Objectives 14 • The Company is on track to achieve its Vision 2020 objectives. • The enactment of the Tax Cuts and Jobs Act of 2017 is expected to enhance the Company’s ability to achieve these objectives. • Over time, we will continue to update our targets as greater clarity of the impact of tax reform materializes. Vision 2020 Targets Return on Tangible Assets 1.30%+ Return on Tangible Common Equity 16%+ Efficiency Ratio Below 50%
Investor Presentation Charles M. Shaffer Executive Vice President Chief Financial Officer (772) 221 - 7003 Chuck.Shaffer@seacoastbank.com INVESTOR RELATIONS www.SeacoastBanking.com NASDAQ: SBCF 15 15 Contact Details: Seacoast Banking Corporation of Florida

16

This presentation contains financial information determined by methods other than Generally Accepted Accounting Principles (“GAAP”) . The financial highlights provide reconciliations between GAAP net income and adjusted net income, GAAP income and adjusted pretax, preprovision income . Management uses these non - GAAP financial measures in its analysis of the Company’s performance and believes these presentations provide useful supplemental information, and a clearer understanding of the Company’s performance . The Company believes the non - GAAP measures enhance investors’ understanding of the Company’s business and performance and if not provided would be requested by the investor community . These measures are also useful in understanding performance trends and facilitate comparisons with the performance of other financial institutions . The limitations associated with operating measures are the risk that persons might disagree as to the appropriateness of items comprising these measures and that different companies might calculate these measures differently . The Company provides reconciliations between GAAP and these non - GAAP measures . These disclosures should not be considered an alternative to GAAP . Explanation of Certain Unaudited Non - GAAP Financial Measures 17

( Q1 17 – Q1 18) GAAP to Non - GAAP Reconciliation 18 (Dollars in thousands except per share data) First Quarter: 2018 Fourth Quarter: 2017 Third Quarter: 2017Second Quarter: 2017 First Quarter: 2017 Net income (loss) 18,027 13,047 14,216 7,676 7,926 Gain on sale of VISA Stock 0 (15,153) 47 (21) 0 Securities (gains)/losses, net 102 (112) 47 (21) 0 Total Adjustments to Revenue 102 (15,265) 47 (21) 0 Merger related charges 470 6,817 491 5,081 533 Amortization of intangibles 989 963 839 839 719 Business continuity expenses - Hurricane Irma 0 0 352 0 0 Branch reductions and other expense initiatives 0 0 (127) 1,876 2,572 Total Adjustments to Noninterest Expense 1,459 7,780 1,555 7,796 3,824 Tax impact of adjustments (538) 3,147 (673) (2,786) (1,480) Effect of change in corporate tax rate 248 8,552 0 0 0 Adjusted Net Income 19,298 17,261 15,145 12,665 10,270 Earnings per diluted share, as reported 0.38 0.28 0.32 0.18 0.20 Adjusted earnings per diluted share 0.40 0.37 0.35 0.29 0.26 Average shares outstanding (000) 47,688 46,473 43,792 43,556 39,499 Revenue 62,058 74,868 57,183 54,644 48,070 Total Adjustments to Revenue 102 (15,265) 47 (21) 0 Adjusted Revenue 62,160 59,603 57,230 54,623 48,070 Noninterest Expense 37,164 39,184 34,361 41,625 34,746 Total Adjustments to Noninterest Expense 1,459 7,780 1,555 7,796 3,824 Adjusted Noninterest Expense 35,705 31,404 32,806 33,829 30,922 Foreclosed property expense and net (gain)/loss on sale 192 (7) (296) 297 (293) Net Adjusted Noninterest Expense 35,513 31,411 33,102 33,532 31,215

GAAP to Non - GAAP Reconciliation ( Q1 17 – Q1 18) 19 (Dollars in thousands) First Quarter: 2018 Fourth Quarter: 2017 Third Quarter: 2017Second Quarter: 2017 First Quarter: 2017 Adjusted Revenue 62,160 59,603 57,230 54,623 48,070 Impact of FTE adjustment 91 174 154 164 211 Adjusted Revenue on a fully taxable equivalent basis 62,251 59,777 57,384 54,787 48,281 Adjusted Efficiency Ratio 57.1% 52.6% 57.7% 61.2% 64.7% Average Assets 5,851,688 5,716,230 5,316,119 5,082,002 4,699,745 Less average goodwill and intangible assets (167,136) (149,432) (118,364) (114,563) (78,878) Average Tangible Assets 5,684,552 5,566,798 5,197,755 4,967,439 4,620,867 Return on Average Assets (ROA) 1.25% 0.91% 1.06% 0.61% 0.68% Impact of removing average intangible assets and related amortization 0.09% 0.06% 0.06% 0.05% 0.06% Return on Tangible Average Assets (ROTA) 1.34% 0.97% 1.12% 0.66% 0.74% Impact of other adjustments for Adjusted Net Income 0.04% 0.26% 0.04% 0.36% 0.16% Adjusted Return on Average Tangible Assets 1.38% 1.23% 1.16% 1.02% 0.90% Average Shareholders' Equity 695,240 657,100 587,919 567,448 466,847 Less average goodwill and intangible assets (167,136) (149,432) (118,364) (114,563) (78,878) Average Tangible Equity 528,104 507,668 469,555 452,885 387,969 Return on Average Shareholders' Equity 10.5% 7.9% 9.6% 5.4% 6.9% Impact of removing average intangible assets and related amortization 3.9% 2.8% 2.9% 1.9% 1.9% Return on Average Tangible Common Equity (ROTCE) 14.4% 10.7% 12.5% 7.3% 8.8% Impact of other adjustments for Adjusted Net Income 0.4% 2.8% 0.3% 3.9% 1.9% Adjusted Return on Average Tangible Common Equity 14.8% 13.5% 12.8% 11.2% 10.7%