Attached files
| file | filename |
|---|---|
| 8-K - 8-K - PLANTRONICS INC /CA/ | q4fy18earningsrelease8-k.htm |

PRESS RELEASE
INVESTOR CONTACT: Will Zelver Manager, Investor Relations & External Reporting (831) 420-3168 | MEDIA CONTACT: George Gutierrez Sr. Director, Global Communications & Content Strategy (831) 458-7537 |
Plantronics Announces Fourth Quarter and Fiscal Year 2018 Financial Results
Company Accomplishes Operating Profit Goals and Achieves Record Enterprise Revenue for the Year
SANTA CRUZ, Calif., - May 1, 2018 - Plantronics, Inc. (NYSE: PLT) today announced fourth quarter and Fiscal Year 2018 financial results. Highlights of the fourth quarter include the following (comparisons are against the fourth quarter Fiscal Year 2017):
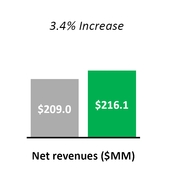
• | Net revenues were $216.1 million, an increase of 3.4% compared with $209.0 million, and above our guidance range of $205 million to $215 million |
• | GAAP gross margin was 52.8% compared with 51.5% |
◦ | Non-GAAP gross margin was 53.2% compared with 51.9% |
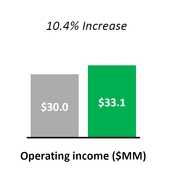
• | GAAP operating income was $33.1 million compared with $30.0 million |
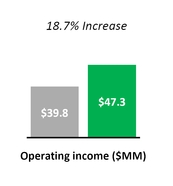
◦ | Non-GAAP operating income was $47.3 million compared with $39.8 million |
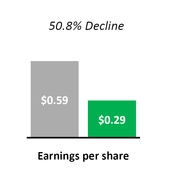
• | GAAP diluted earnings per share ("EPS") was $0.29 compared with $0.59, primarily driven by an adjustment to the provisional tax charge resulting from the Tax Cuts and Jobs Act of 2017 |
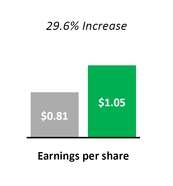
◦ | Non-GAAP diluted EPS was $1.05 compared with $0.81, and above our guidance range of $0.75 to $0.85 |
Year-over-year GAAP Results
Year-over-year Non-GAAP Results
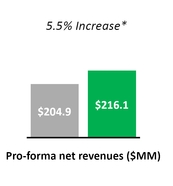

*Prior year quarter has been adjusted to exclude approximately $4 million of revenues from our Clarity brand, which we divested in the first quarter of Fiscal Year 2018.
1
A reconciliation between our GAAP and non-GAAP results is provided in the tables at the end of this press release.
“Our fourth quarter was a strong finish to our fiscal year, reflecting solid execution on our strategy to transform our business and capitalize on evolving trends in the market,” stated Joe Burton, President and Chief Executive Officer. “Additionally, the closing of the acquisition of Polycom will accelerate and expand our strategic vision and enable us to offer a broad portfolio of solutions to our customers while allowing them to choose the platforms and systems that work best for their environment."
"We achieved record Enterprise revenue in Fiscal Year 2018 and met our profitability goals," stated Pam Strayer, Senior Vice President and Chief Financial Officer. "We aim to continue driving improvements to the top and bottom line in Fiscal Year 2019, excluding costs associated with the Polycom acquisition.”
Financial Highlights for the Fourth Quarter and Fiscal Year 2018
Revenue
Total net revenues for the fourth quarter of Fiscal Year 2018 were $216.1 million, up 3.4% or $7.2 million compared to the fourth quarter last year. Enterprise net revenues of $164.6 million were up 2.3%, or $3.7 million, driven by growth in our UC revenues which were partially offset by a decline in non-UC headset revenues. Consumer net revenues were $51.6 million, up 7.2%, or $3.5 million, primarily driven by higher gaming product revenues and partially offset by the divestiture of our Clarity business.
Total net revenues for Fiscal Year 2018 of $856.9 million were down 2.8%, or $24.3 million, compared to Fiscal Year 2017. Enterprise net revenues of $649.7 million were up 3.4%, or $21.1 million, driven by growth in UC revenues and partially offset by declines in non-UC headset revenues. Consumer net revenues were $207.2 million, a decrease of 18.0%, or $45.4 million driven by lower stereo Bluetooth revenues, the divestiture of our Clarity business, and the continued decline of the mono Bluetooth market, partially offset by increased gaming product revenues.
Operating Income
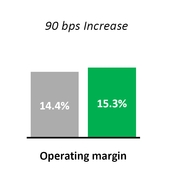
GAAP operating income for the fourth quarter was $33.1 million, an increase of 10.4%, or $3.1 million from the prior year quarter. As a percentage of revenues, GAAP operating income for the fourth quarter was 15.3%, compared to 14.4% in the prior year quarter. GAAP operating income for Fiscal Year 2018 was $123.5 million, a decrease of 1.3%, or $1.6 million. As a percentage of revenues, GAAP operating income for Fiscal Year 2018 was 14.4%, a slight increase from the prior year.
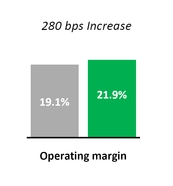
Non-GAAP operating income for the fourth quarter was $47.3 million, an increase of 18.7%, or $7.5 million. As a percentage of revenue, non-GAAP operating income for the fourth quarter was 21.9%, compared to 19.1% in the prior year quarter. Non-GAAP operating income for Fiscal Year 2018 was $168.4 million, an increase of 4.2%, or $6.9 million. As a percentage of revenues, non-GAAP operating income was 19.6% in Fiscal Year 2018, compared with 18.3% in the prior year.
Improvements to both GAAP and non-GAAP operating margins for the fourth quarter and full fiscal year were primarily due to product cost reductions and the favorable impacts of currency fluctuations. On a GAAP basis, acquisition fees offset by savings from lower variable compensation expenses, restructuring actions in prior periods and early in the current year, and cost control initiatives led to increased and flat operating expenses in the quarter and full year, respectively. On a non-GAAP basis, these cost savings drove declines in operating expenses in both the quarter and full year.
Earnings Per Share
GAAP diluted EPS for the fourth quarter was $0.29, down $0.30 and 50.8% compared to the prior year quarter. GAAP diluted loss per share for Fiscal Year 2018 was $0.03, a decline of $2.54 and 101.2%. GAAP net income in both periods was negatively impacted by provisional tax charges recorded as a result of the Tax Cuts and Jobs Act of 2017.
Non-GAAP diluted EPS for the fourth quarter was $1.05, up $0.24 and 29.6% compared to the prior year quarter. Non-GAAP diluted EPS for Fiscal Year 2018 was $3.55, up $0.38 and 12.0% from the prior year.
In Fiscal Year 2018, we repurchased 1.1 million shares of our common stock for $52.9 million.
2
Balance Sheet and Cash Flow Highlights
We finished the fourth quarter of Fiscal Year 2018 with $660 million in cash and investments and generated $40 million in cash flow from operations during the quarter, a decrease of $11 million from the prior year quarter.
Of the $660 million in cash and investments at the end of the fourth quarter of Fiscal Year 2018, $116 million was held domestically.
Capital expenditures for the fourth quarter and Fiscal Year 2018 were $3.1 million and $12.5 million, or 1.4% and 1.5% of revenues, respectively.
Plantronics Announces Quarterly Dividend of $0.15
We are also announcing that we have declared a quarterly dividend of $0.15 per common share, to be paid on June 8, 2018, to all shareholders of record as of the close of business on May 18, 2018.
Debt Financing
In connection with the Company’s previously announced acquisition of Polycom, Inc., the Company intends to fund the acquisition in part by obtaining $1.375 billion in new, fully committed debt financing consisting of a secured term loan facility and a secured revolving credit facility. The Company has outstanding notes that are unsecured. Although under certain circumstances the Company is obligated to provide security for those notes, the Company does not expect that obligation to apply.
Business Outlook
The following statements are based on our current expectations, and many of these statements are forward-looking. Actual results are subject to a variety of risks and uncertainties and may differ materially from our expectations.
We currently expect the following range of financial results for the first quarter of Fiscal Year 2019 (all amounts assuming currency rates remain stable):
• | Net revenues of $205 million to $215 million; |
• | GAAP operating income of $17 million to $23 million; |
• | Non-GAAP operating income of $34 million to $40 million, excluding the impact of $10 million from stock-based compensation and $7 million from acquisition related costs. |
• | Assuming approximately 34 million diluted average weighted shares outstanding: |
• | GAAP diluted EPS of $0.29 to $0.41; |
• | Non-GAAP diluted EPS of $0.66 to $0.78 |
• | Cost of stock-based compensation, Polycom acquisition related costs, tax reform costs, effect of participating securities, and GAAP only related tax charges to be approximately $0.37 per diluted share. |
Please see our updated Investor Presentation available on our corporate website at investor.plantronics.com.
We have a “book and ship” business model whereby we fulfill the majority of orders received within 48 hours of receipt of those orders. However, our backlog is occasionally subject to cancellation or rescheduling by our customers on short notice with little or no penalty. Therefore, there is a lack of meaningful correlation between backlog at the end of a fiscal period and net revenues in a succeeding fiscal period.
Our business is inherently difficult to forecast, particularly with continuing uncertainty in regional economic conditions and currency fluctuations, and there can be no assurance that expectations of incoming orders over the balance of the current quarter will materialize.
3
Conference Call and Prepared Remarks
Plantronics is providing an earnings overview in combination with its press release. The overview is offered to provide shareholders and analysts with additional time and detail for analyzing results in advance of our quarterly conference call. The overview will be available in the Investor Relations section of our corporate website at investor.plantronics.com along with this press release. A reconciliation between our GAAP and non-GAAP results is provided in the tables at the end of this press release.
We have scheduled a conference call to discuss fourth quarter and Fiscal Year 2018 financial results. The conference call will take place today, May 1, 2018 at 2:00 PM (Pacific Time). All interested investors and potential investors in our stock are invited to participate. To listen to the call, please dial in five to ten minutes prior to the scheduled starting time and refer to the “Plantronics Conference Call.” The dial-in from North America is (888) 301-8736 and the international dial-in is (706) 634-7260.
The conference call will also be simultaneously webcast in the Investor Relations section of our website. A replay of the call with the conference ID #55437191 will be available until July 30, 2018 at (855) 859-2056 for callers from North America and at (404) 537-3406 for all other callers.
Use of Non-GAAP Financial Information
To supplement our condensed consolidated financial statements presented on a GAAP basis, we use non-GAAP measures of operating results, including non-GAAP operating income, non-GAAP net income and non-GAAP diluted EPS which exclude certain non-cash expenses and charges that are included in the most directly comparable GAAP measure. These non-cash charges and expenses include stock-based compensation related to stock options, restricted stock and employee stock purchases made under our employee stock purchase plan, acquisition related expenses, purchase accounting amortization, restructuring and other related charges and credits, asset impairments, executive transition charges, and the impact of participating securities, all net of any associated tax impact. We also exclude tax benefits from the release of tax reserves, discrete tax adjustments including transfer pricing, tax deduction and tax credit adjustments, and the impact of tax law changes. We exclude these expenses from our non-GAAP measures primarily because management does not believe they are part of our target operating model. We believe that the use of non-GAAP financial measures provides meaningful supplemental information regarding our performance and liquidity and helps investors compare actual results with our long-term target operating model goals. We believe that both management and investors benefit from referring to these non-GAAP financial measures in assessing our performance and when planning, forecasting and analyzing future periods; however, non-GAAP financial measures are not meant to be considered in isolation or as a substitute for, or superior to, gross margin, operating income, operating margin, net income or EPS prepared in accordance with GAAP.
Safe Harbor
This release contains forward-looking statements within the meaning of Section 27A of the Securities Act of 1933, as amended, and Section 21E of the Securities Exchange Act of 1934, as amended, including statements relating to: (i) our expectations regarding the benefits of the acquisition of Polycom, its associated costs, and our financing of the acquisition, and the impact of that financing on our currently existing outstanding debt; (ii) our expectations regarding financial performance improvements in Fiscal Year 2019, including those related to Enterprise products; (iii) estimates of GAAP and non-GAAP financial results for the first quarter of Fiscal Year 2019, including net revenues, operating income and diluted EPS; (iv) our estimates of stock-based compensation, as well as the impact of non-cash expenses on non-GAAP operating income and diluted EPS for the first quarter of Fiscal Year 2019; and (v) our estimate of weighted average shares outstanding for the first quarter of Fiscal Year 2019, in addition to other matters discussed in this press release that are not purely historical data. We do not assume any obligation to update or revise any such forward-looking statements, whether as the result of new developments or otherwise.
Forward-looking statements involve risks and uncertainties that may cause actual results to differ materially from those contemplated by such statements. Among the factors that could cause actual results to differ materially from those contemplated are:
• | Micro and macro-economic conditions in our domestic and international markets; |
• | our ability to realize and achieve positive financial results projected to arise in the Enterprise market from UC adoption could be adversely affected by a variety of factors including the following: (i) as UC becomes more widely adopted, the risk that competitors will offer solutions that will effectively commoditize our headsets which, in turn, will reduce the sales prices for our headsets; (ii) our plans are dependent upon adoption of our UC solution by major platform providers and strategic partners such as Microsoft Corporation, Cisco Systems, Inc., Avaya, Inc., Alcatel-Lucent, and Huawei, and our influence over such providers with respect to the functionality of their platforms or their product offerings, their rate of deployment, and their willingness to integrate their platforms and product offerings with our solutions is limited; (iii) delays or limitations on our ability to timely introduce solutions that are cost effective, feature-rich, stable, and |
4
attractive to our customers within forecasted development budgets; (iv) our successful implementation and execution of new and different processes involving the design, development, and manufacturing of complex electronic systems composed of hardware, firmware, and software that works seamlessly and continuously in a wide variety of environments and with multiple devices; (v) failure of UC solutions generally, or our solutions in particular, to be adopted with the breadth and speed we anticipate (vi) our sales model and expertise must successfully evolve to support complex integration of hardware and software with UC infrastructure consistent with changing customer purchasing expectations; (vii) as UC becomes more widely adopted we anticipate that competition for market share will increase, particularly given that some competitors may have superior technical and economic resources; (vii) (viii) sales cycles for more complex UC deployments are longer as compared to our traditional Enterprise products; (ix) our inability to timely and cost-effectively adapt to changing business requirements may impact our profitability in this market and our overall margins; and (x) our failure to expand our technical support capabilities to support the complex and proprietary platforms in which our UC products are and will be integrated;
• | regarding the Polycom acquisition: (i) we may be unable to integrate Polycom's business within our own in a timely and cost-efficient manner or do so without adversely impacting operations, including new product launches; (ii) expected synergies or operating efficiencies may fail to materialize in whole or part or may not occur within expected time-frames; (iii) the acquisition may adversely impact ours or Polycom's relationships with respective customers, suppliers and strategic partners and their operating results and businesses generally (including the diversion of management time on transaction-related issues); (iv) each company may be unable to retain and hire all or a portion of their respective key personnel; (v) legal and regulatory enforcement matters that are pending at Polycom may adversely impact the results of the combined company; (vi) financing that we obtain to consummate the acquisition is not on anticipated terms or is not available at all, which is magnified by the absence of a financing condition for the transaction; (vii) our increased leverage as a result of the transaction will be substantially greater than prior to the acquisition which may pose risks, including reduced flexibility to make changes in our operations in response to business or economic conditions, increased borrowing costs, as well as penalties or costs should we fail to comply with terms of the financial agreements such as debt ratios and financial and operation performance targets; (viii) negative effects on the market price of our common stock as a result of the transaction, particularly in light of the issuance of our stock in the transaction; (ix) our financial reporting including those resulting from the adoption of new accounting pronouncements and associated system implementations in the context of the transaction, our ability to forecast financial results of the combined company and that we may be unable to successfully integrate our reporting system causing an adverse impact to our ability to make timely and accurate filings with the SEC and other domestic and foreign governmental agencies; (x) the potential impact of the transaction on our future tax rate and payments based on the consolidation global entity and our ability to quickly integrate foreign operations; (xi) the challenges of integrating the supply chains of the two companies; and (xii) the potential that our due diligence did not uncover risks and potential liabilities of Polycom; |
• | failure to match production to demand given long lead times and the difficulty of forecasting unit volumes and acquiring the component parts and materials to meet demand without having excess inventory or incurring cancellation charges; |
• | volatility in prices from our suppliers, including our manufacturers located in China, have in the past and could in the future negatively affect our profitability and/or market share; |
• | fluctuations in foreign exchange rates; |
• | with respect to our stock repurchase program, prevailing stock market conditions generally, and the price of our stock specifically; |
• | the bankruptcy or financial weakness of distributors or key customers, or the bankruptcy of or reduction in capacity of our key suppliers; |
• | additional risk factors including: interruption in the supply of sole-sourced critical components, continuity of component supply at costs consistent with our plans, and the inherent risks of our substantial foreign operations; and |
• | seasonality in one or more of our product categories. |
For more information concerning these and other possible risks, please refer to our Annual Report on Form 10-K filed with the Securities and Exchange Commission on May 10, 2017 and other filings with the Securities and Exchange Commission, as well as recent press releases. The Securities and Exchange Commission filings can be accessed over the Internet at http://www.sec.gov/edgar/searchedgar/companysearch.html.
Financial Summaries
The following related charts are provided:
• |
• |
• |
5
About Plantronics
Plantronics is an audio pioneer and a global leader in the communications industry. We create intelligent and adaptive solutions that support our customers’ most important needs: experiencing and facilitating simple and clear communications while enjoying distraction-free environments. Our solutions are used worldwide by consumers and businesses alike, and are an optimal choice for open office environments. From Unified Communications and customer service ecosystems, to data analytics and Bluetooth headsets, Plantronics delivers high-quality communications solutions that our customers count on today, while relentlessly innovating on behalf of their future. For more information visit plantronics.com.
Plantronics is a registered trademark of Plantronics, Inc. The Bluetooth name and the Bluetooth trademarks are owned by Bluetooth SIG, Inc. and are used by Plantronics, Inc. under license. All other trademarks are the property of their respective owners.
PLANTRONICS, INC. / 345 Encinal Street / P.O. Box 1802 / Santa Cruz, California 95060
831-426-6060 / Fax 831-426-6098
6
PLANTRONICS, INC. | |||||||||||||||||
SUMMARY CONDENSED CONSOLIDATED FINANCIAL STATEMENTS | |||||||||||||||||
($ in thousands, except per share data) | |||||||||||||||||
UNAUDITED CONSOLIDATED STATEMENTS OF OPERATIONS | |||||||||||||||||
Three Months Ended | Twelve Months Ended | ||||||||||||||||
March 31, | March 31, | ||||||||||||||||
2017 | 2018 | 2017 | 2018 | ||||||||||||||
Net revenues | $ | 208,954 | $ | 216,143 | $ | 881,176 | $ | 856,903 | |||||||||
Cost of revenues | 101,283 | 102,068 | 439,806 | 417,788 | |||||||||||||
Gross profit | 107,671 | 114,075 | 441,370 | 439,115 | |||||||||||||
Gross profit % | 51.5 | % | 52.8 | % | 50.1 | % | 51.2 | % | |||||||||
Research, development, and engineering | 22,202 | 21,791 | 88,318 | 84,193 | |||||||||||||
Selling, general, and administrative | 54,249 | 59,265 | 223,830 | 229,390 | |||||||||||||
(Gain) loss, net from litigation settlements | (32 | ) | (125 | ) | 4,255 | (420 | ) | ||||||||||
Restructuring and other related charges (credits) | 1,241 | 13 | (109 | ) | 2,451 | ||||||||||||
Total operating expenses | 77,660 | 80,944 | 316,294 | 315,614 | |||||||||||||
Operating income | 30,011 | 33,131 | 125,076 | 123,501 | |||||||||||||
Operating income % | 14.4 | % | 15.3 | % | 14.2 | % | 14.4 | % | |||||||||
Interest expense | (7,363 | ) | (7,393 | ) | (29,230 | ) | (29,297 | ) | |||||||||
Other non-operating income, net | 1,700 | 793 | 5,819 | 6,023 | |||||||||||||
Income before income taxes | 24,348 | 26,531 | 101,665 | 100,227 | |||||||||||||
Income tax expense | 4,831 | 16,677 | 19,066 | 101,096 | |||||||||||||
Net income (loss) | $ | 19,517 | $ | 9,854 | $ | 82,599 | $ | (869 | ) | ||||||||
% of net revenues | 9.3 | % | 4.6 | % | 9.4 | % | (0.1 | )% | |||||||||
Earnings per common share: | |||||||||||||||||
Basic | $ | 0.60 | $ | 0.30 | $ | 2.56 | $ | (0.03 | ) | ||||||||
Diluted | $ | 0.59 | $ | 0.29 | $ | 2.51 | $ | (0.03 | ) | ||||||||
Shares used in computing earnings per common share: | |||||||||||||||||
Basic | 32,334 | 32,231 | 32,279 | 32,345 | |||||||||||||
Diluted | 33,056 | 32,924 | 32,963 | 32,345 | |||||||||||||
Effective tax rate | 19.8 | % | 62.9 | % | 18.8 | % | 100.9 | % | |||||||||
7
PLANTRONICS, INC. | |||||||||
SUMMARY CONDENSED CONSOLIDATED FINANCIAL STATEMENTS | |||||||||
($ in thousands) | |||||||||
UNAUDITED CONSOLIDATED BALANCE SHEETS | |||||||||
March 31, | March 31, | ||||||||
2017 | 2018 | ||||||||
ASSETS | |||||||||
Cash and cash equivalents | $ | 301,970 | $ | 390,661 | |||||
Short-term investments | 178,179 | 269,313 | |||||||
Total cash, cash equivalents, and short-term investments | 480,149 | 659,974 | |||||||
Accounts receivable, net | 141,177 | 152,888 | |||||||
Inventory, net | 55,456 | 68,276 | |||||||
Other current assets | 22,195 | 18,588 | |||||||
Total current assets | 698,977 | 899,726 | |||||||
Long-term investments | 127,176 | — | |||||||
Property, plant, and equipment, net | 150,307 | 142,129 | |||||||
Goodwill and purchased intangibles, net | 15,577 | 15,498 | |||||||
Deferred tax assets | 23,242 | 17,873 | |||||||
Other assets | $ | 1,880 | $ | 1,661 | |||||
Total assets | $ | 1,017,159 | $ | 1,076,887 | |||||
LIABILITIES AND STOCKHOLDERS' EQUITY | |||||||||
Accounts payable | $ | 42,885 | $ | 45,417 | |||||
Accrued liabilities | 74,285 | 80,097 | |||||||
Total current liabilities | 117,170 | 125,514 | |||||||
Long-term debt, net of issuance costs | 491,059 | 492,509 | |||||||
Long-term income taxes payable | 11,729 | 87,328 | |||||||
Other long-term liabilities | 15,045 | 18,566 | |||||||
Total liabilities | 635,003 | 723,917 | |||||||
Stockholders' equity | 382,156 | 352,970 | |||||||
Total liabilities and stockholders' equity | $ | 1,017,159 | $ | 1,076,887 | |||||
8
PLANTRONICS, INC. | |||||||||||||||||
SUMMARY CONDENSED CONSOLIDATED FINANCIAL STATEMENTS | |||||||||||||||||
($ in thousands, except per share data) | |||||||||||||||||
UNAUDITED CONSOLIDATED STATEMENTS OF CASH FLOWS | |||||||||||||||||
Three Months Ended | Twelve Months Ended | ||||||||||||||||
March 31, | March 31, | ||||||||||||||||
2017 | 2018 | 2017 | 2018 | ||||||||||||||
Cash flows from operating activities | |||||||||||||||||
Net Income | $ | 19,517 | $ | 9,854 | $ | 82,599 | $ | (869 | ) | ||||||||
Adjustments to reconcile net income to net cash provided by operating activities: | |||||||||||||||||
Depreciation and amortization | 5,353 | 5,284 | 20,977 | 21,178 | |||||||||||||
Amortization of debt issuance cost | 363 | 363 | 1,450 | 1,450 | |||||||||||||
Stock-based compensation | 8,534 | 7,912 | 33,539 | 33,959 | |||||||||||||
Deferred income taxes | 96 | (3,026 | ) | (657 | ) | 7,464 | |||||||||||
Provision for excess and obsolete inventories | 668 | 1,443 | 1,960 | 3,456 | |||||||||||||
Restructuring charges (credits) | 1,241 | (32 | ) | (109 | ) | 2,406 | |||||||||||
Cash payments for restructuring charges | (208 | ) | (31 | ) | (4,001 | ) | (2,942 | ) | |||||||||
Other operating activities | (280 | ) | 340 | 353 | (305 | ) | |||||||||||
Changes in assets and liabilities: | |||||||||||||||||
Accounts receivable, net | (446 | ) | (9,085 | ) | (13,894 | ) | (12,238 | ) | |||||||||
Inventory, net | 2,199 | (3,732 | ) | (3,791 | ) | (13,309 | ) | ||||||||||
Current and other assets | 3,488 | 586 | 1,142 | (2,480 | ) | ||||||||||||
Accounts payable | 751 | 101 | 4,377 | 2,884 | |||||||||||||
Accrued liabilities | 9,908 | 11,576 | 16,099 | (4,119 | ) | ||||||||||||
Income taxes | 484 | 18,226 | (657 | ) | 84,613 | ||||||||||||
Cash provided by operating activities | 51,668 | 39,779 | 139,387 | 121,148 | |||||||||||||
Cash flows from investing activities | |||||||||||||||||
Proceeds from sale of investments | 13,435 | 143,164 | 157,066 | 197,575 | |||||||||||||
Proceeds from maturities of investments | 46,839 | 64,674 | 144,092 | 211,663 | |||||||||||||
Purchase of investments | (52,943 | ) | (140,441 | ) | (300,434 | ) | (373,281 | ) | |||||||||
Capital expenditures | (3,573 | ) | (3,065 | ) | (23,176 | ) | (12,468 | ) | |||||||||
Cash provided by (used for) investing activities | 3,758 | 64,332 | (22,452 | ) | 23,489 | ||||||||||||
Cash flows from financing activities | |||||||||||||||||
Repurchase of common stock | — | (33 | ) | (34,236 | ) | (52,948 | ) | ||||||||||
Employees' tax withheld and paid for restricted stock and restricted stock units | (292 | ) | (243 | ) | (9,736 | ) | (11,429 | ) | |||||||||
Proceeds from issuances under stock-based compensation plans | 8,686 | 10,481 | 15,202 | 23,927 | |||||||||||||
Proceeds from revolving line of credit | — | — | — | 8,000 | |||||||||||||
Repayments of revolving line of credit | — | — | — | (8,000 | ) | ||||||||||||
Payment of cash dividends | (5,012 | ) | (4,988 | ) | (19,959 | ) | (19,996 | ) | |||||||||
Other financing activities | — | — | 761 | — | |||||||||||||
Cash used for financing activities | 3,382 | 5,217 | (47,968 | ) | (60,446 | ) | |||||||||||
Effect of exchange rate changes on cash and cash equivalents | 701 | 1,040 | (2,263 | ) | 4,500 | ||||||||||||
Net increase in cash and cash equivalents | 59,509 | 110,368 | 66,704 | 88,691 | |||||||||||||
Cash and cash equivalents at beginning of period | 242,461 | 280,293 | 235,266 | 301,970 | |||||||||||||
Cash and cash equivalents at end of period | $ | 301,970 | $ | 390,661 | $ | 301,970 | $ | 390,661 | |||||||||
9
PLANTRONICS, INC. | ||||||||||||||||
UNAUDITED RECONCILIATIONS OF GAAP MEASURES TO NON-GAAP MEASURES | ||||||||||||||||
($ in thousands, except per share data) | ||||||||||||||||
UNAUDITED CONSOLIDATED STATEMENTS OF OPERATIONS DATA | ||||||||||||||||
Three Months Ended | Twelve Months Ended | |||||||||||||||
March 31, | March 31, | |||||||||||||||
2017 | 2018 | 2017 | 2018 | |||||||||||||
GAAP Gross profit | $ | 107,671 | $ | 114,075 | $ | 441,370 | $ | 439,115 | ||||||||
Stock-based compensation | 830 | 913 | 3,244 | 3,622 | ||||||||||||
Loss on sale of assets | — | — | — | 899 | ||||||||||||
Impairment of indirect tax asset | — | — | — | 686 | ||||||||||||
Non-GAAP Gross profit | $ | 108,501 | $ | 114,988 | $ | 444,614 | $ | 444,322 | ||||||||
Non-GAAP Gross profit % | 51.9 | % | 53.2 | % | 50.5 | % | 51.9 | % | ||||||||
GAAP Research, development, and engineering | $ | 22,202 | $ | 21,791 | $ | 88,318 | $ | 84,193 | ||||||||
Stock-based compensation | (1,953 | ) | (1,913 | ) | (8,616 | ) | (8,071 | ) | ||||||||
Purchase accounting amortization | (63 | ) | — | (250 | ) | (80 | ) | |||||||||
Non-GAAP Research, development, and engineering | $ | 20,186 | $ | 19,878 | $ | 79,452 | $ | 76,042 | ||||||||
GAAP Selling, general, and administrative | $ | 54,249 | $ | 59,265 | $ | 223,830 | $ | 229,390 | ||||||||
Stock-based compensation | (5,751 | ) | (5,086 | ) | (21,679 | ) | (22,266 | ) | ||||||||
Acquisition related fees | — | (6,252 | ) | — | (6,252 | ) | ||||||||||
Executive transition costs | — | — | (2,759 | ) | (549 | ) | ||||||||||
Non-GAAP Selling, general, and administrative | $ | 48,498 | $ | 47,927 | $ | 199,392 | $ | 200,323 | ||||||||
GAAP Operating expenses | $ | 77,660 | $ | 80,944 | $ | 316,294 | $ | 315,614 | ||||||||
Stock-based compensation | (7,704 | ) | (6,999 | ) | (30,295 | ) | (30,337 | ) | ||||||||
Acquisition related fees | — | (6,252 | ) | — | (6,252 | ) | ||||||||||
Executive transition costs | — | — | (2,759 | ) | (549 | ) | ||||||||||
Restructuring and other related (charges) credits | (1,241 | ) | (13 | ) | 109 | (2,451 | ) | |||||||||
Purchase accounting amortization | (63 | ) | — | (250 | ) | (80 | ) | |||||||||
Non-GAAP Operating expenses | $ | 68,652 | $ | 67,680 | $ | 283,099 | $ | 275,945 | ||||||||
10
PLANTRONICS, INC. | ||||||||||||||||||||
UNAUDITED RECONCILIATIONS OF GAAP MEASURES TO NON-GAAP MEASURES | ||||||||||||||||||||
($ in thousands, except per share data) | ||||||||||||||||||||
UNAUDITED CONSOLIDATED STATEMENTS OF OPERATIONS DATA (CONTINUED) | ||||||||||||||||||||
Three Months Ended | Twelve Months Ended | |||||||||||||||||||
March 31, | March 31, | |||||||||||||||||||
2017 | 2018 | 2017 | 2018 | |||||||||||||||||
GAAP Operating income | $ | 30,011 | $ | 33,131 | $ | 125,076 | $ | 123,501 | ||||||||||||
Stock-based compensation | 8,534 | 7,912 | 33,539 | 33,959 | ||||||||||||||||
Acquisition related fees | — | 6,252 | — | 6,252 | ||||||||||||||||
Restructuring and other related charges (credits) | 1,241 | 13 | (109 | ) | 2,451 | |||||||||||||||
Loss on sale of assets | — | — | — | 899 | ||||||||||||||||
Impairment of indirect tax asset | — | — | — | 686 | ||||||||||||||||
Executive transition costs | — | — | 2,759 | 549 | ||||||||||||||||
Purchase accounting amortization | 63 | — | 250 | 80 | ||||||||||||||||
Non-GAAP Operating income | $ | 39,849 | $ | 47,308 | $ | 161,515 | $ | 168,377 | ||||||||||||
GAAP Net income | $ | 19,517 | $ | 9,854 | $ | 82,599 | $ | (869 | ) | |||||||||||
Stock-based compensation | 8,534 | 7,912 | 33,539 | 33,959 | ||||||||||||||||
Acquisition related fees | — | 6,252 | — | 6,252 | ||||||||||||||||
Executive transition costs | — | — | 2,759 | 549 | ||||||||||||||||
Restructuring and other related charges (credits) | 1,241 | 13 | (109 | ) | 2,451 | |||||||||||||||
Loss on sale of assets | — | — | — | 899 | ||||||||||||||||
Impairment of indirect tax asset | — | — | — | 686 | ||||||||||||||||
Purchase accounting amortization | 63 | — | 250 | 80 | ||||||||||||||||
Income tax effect of above items | (2,202 | ) | (2,572 | ) | (11,806 | ) | (9,016 | ) | ||||||||||||
Income tax effect of unusual tax items | (479 | ) | (1 | ) | 13,142 | (2 | ) | (2,620 | ) | (1 | ) | 82,080 | (3 | ) | ||||||
Non-GAAP Net income | $ | 26,674 | $ | 34,601 | $ | 104,612 | $ | 117,071 | ||||||||||||
GAAP Diluted earnings per common share | $ | 0.59 | $ | 0.29 | $ | 2.51 | $ | (0.03 | ) | |||||||||||
Stock-based compensation | 0.26 | 0.24 | 1.02 | 1.03 | ||||||||||||||||
Acquisition related fees | — | 0.19 | — | 0.19 | ||||||||||||||||
Executive transition costs | — | — | 0.08 | 0.02 | ||||||||||||||||
Restructuring and other related charges (credits) | 0.04 | — | — | 0.07 | ||||||||||||||||
Loss on sale of assets | — | — | — | 0.03 | ||||||||||||||||
Impairment of indirect tax asset | — | — | — | 0.02 | ||||||||||||||||
Income tax effect | (0.08 | ) | 0.32 | (0.44 | ) | 2.22 | ||||||||||||||
Effect of participating securities | — | 0.01 | — | — | ||||||||||||||||
Non-GAAP Diluted earnings per common share | $ | 0.81 | $ | 1.05 | $ | 3.17 | $ | 3.55 | ||||||||||||
Shares used in diluted earnings per common share calculation: | ||||||||||||||||||||
GAAP | 33,056 | 32,924 | 32,963 | 32,345 | ||||||||||||||||
Non-GAAP | 33,056 | 32,924 | 32,963 | 32,976 | ||||||||||||||||
(1) | Excluded amounts represent tax benefits from the release of tax reserves and impact of tax law changes. |
(2) | Excluded amounts represent $13.0 million due to change in tax law and the release of tax reserves. |
(3) | Excluded amounts represent $89.4 million due to change in tax law, immaterial tax benefits resulting from the correction of an immaterial error in the first quarter of fiscal year 2018, and the release of tax reserves. |
11
Summary of Unaudited Reconciliations of GAAP Measures to Non-GAAP Measures and other Unaudited GAAP Data | |||||||||||||||||||||||||||||||||
($ in thousands, except per share data) | |||||||||||||||||||||||||||||||||
Q117 | Q217 | Q317 | Q417 | Q118 | Q218 | Q318 | Q418 | ||||||||||||||||||||||||||
GAAP Gross profit | $ | 113,073 | $ | 110,446 | $ | 110,180 | $ | 107,671 | $ | 103,283 | $ | 107,632 | $ | 114,125 | $ | 114,075 | |||||||||||||||||
Stock-based compensation | 842 | 778 | 794 | 830 | 902 | 890 | 917 | 913 | |||||||||||||||||||||||||
Loss on sale of assets | — | — | — | — | 899 | — | — | — | |||||||||||||||||||||||||
Impairment of indirect tax asset | — | — | — | — | 686 | — | — | — | |||||||||||||||||||||||||
Non-GAAP Gross profit | $ | 113,915 | $ | 111,224 | $ | 110,974 | $ | 108,501 | $ | 105,770 | $ | 108,522 | $ | 115,042 | $ | 114,988 | |||||||||||||||||
Non-GAAP Gross profit % | 51.1 | % | 51.4 | % | 47.6 | % | 51.9 | % | 51.9 | % | 51.6 | % | 50.8 | % | 53.2 | % | |||||||||||||||||
GAAP Operating expenses | $ | 81,822 | $ | 78,490 | $ | 78,322 | $ | 77,660 | $ | 79,843 | $ | 77,473 | $ | 77,354 | $ | 80,944 | |||||||||||||||||
Stock-based compensation | (7,571 | ) | (7,125 | ) | (7,895 | ) | (7,704 | ) | (8,354 | ) | (7,872 | ) | (7,112 | ) | (6,999 | ) | |||||||||||||||||
Acquisition related fees | — | — | — | — | — | — | — | (6,252 | ) | ||||||||||||||||||||||||
Restructuring and other related (charges) credits | 1,048 | 415 | (113 | ) | (1,241 | ) | (2,573 | ) | 51 | 84 | (13 | ) | |||||||||||||||||||||
Executive transition costs | — | (2,759 | ) | — | — | — | (549 | ) | — | — | |||||||||||||||||||||||
Purchase accounting amortization | (62 | ) | (63 | ) | (62 | ) | (63 | ) | (63 | ) | (17 | ) | — | — | |||||||||||||||||||
Non-GAAP Operating expenses | $ | 75,237 | $ | 68,958 | $ | 70,252 | $ | 68,652 | $ | 68,853 | $ | 69,086 | $ | 70,326 | $ | 67,680 | |||||||||||||||||
GAAP Operating income | $ | 31,251 | $ | 31,956 | $ | 31,858 | $ | 30,011 | $ | 23,440 | $ | 30,159 | $ | 36,771 | $ | 33,131 | |||||||||||||||||
Stock-based compensation | 8,413 | 7,903 | 8,689 | 8,534 | 9,256 | 8,762 | 8,029 | 7,912 | |||||||||||||||||||||||||
Acquisition related fees | — | — | — | — | — | — | — | 6,252 | |||||||||||||||||||||||||
Restructuring and other related charges (credits) | (1,048 | ) | (415 | ) | 113 | 1,241 | 2,573 | (51 | ) | (84 | ) | 13 | |||||||||||||||||||||
Loss on sale of assets | — | — | — | — | 899 | — | — | — | |||||||||||||||||||||||||
Impairment of indirect tax asset | — | — | — | — | 686 | — | — | — | |||||||||||||||||||||||||
Executive transition costs | — | 2,759 | — | — | — | 549 | — | — | |||||||||||||||||||||||||
Purchase accounting amortization | 62 | 63 | 62 | 63 | 63 | 17 | — | — | |||||||||||||||||||||||||
Non-GAAP Operating income | $ | 38,678 | $ | 42,266 | $ | 40,722 | $ | 39,849 | $ | 36,917 | $ | 39,436 | $ | 44,716 | $ | 47,308 | |||||||||||||||||
Non-GAAP Operating income % | 17.3 | % | 19.6 | % | 17.5 | % | 19.1 | % | 18.1 | % | 18.8 | % | 19.7 | % | 21.9 | % | |||||||||||||||||
GAAP Income before income taxes | $ | 26,315 | $ | 26,039 | $ | 24,963 | $ | 24,348 | $ | 17,051 | $ | 24,725 | $ | 31,920 | $ | 26,531 | |||||||||||||||||
Stock-based compensation | 8,413 | 7,903 | 8,689 | 8,534 | 9,256 | 8,762 | 8,029 | 7,912 | |||||||||||||||||||||||||
Acquisition related fees | — | — | — | — | — | — | — | 6,252 | |||||||||||||||||||||||||
Restructuring and other related charges (credits) | (1,048 | ) | (415 | ) | 113 | 1,241 | 2,573 | (51 | ) | (84 | ) | 13 | |||||||||||||||||||||
Loss on sale of assets | — | — | — | — | 899 | — | — | — | |||||||||||||||||||||||||
Impairment of indirect tax asset | — | — | — | — | 686 | — | — | — | |||||||||||||||||||||||||
Executive transition costs | — | 2,759 | — | — | — | 549 | — | — | |||||||||||||||||||||||||
Purchase accounting amortization | 62 | 63 | 62 | 63 | 63 | 17 | — | — | |||||||||||||||||||||||||
Non-GAAP Income before income taxes | $ | 33,742 | $ | 36,349 | $ | 33,827 | $ | 34,186 | $ | 30,528 | $ | 34,002 | $ | 39,865 | $ | 40,708 | |||||||||||||||||
GAAP Income tax expense (benefit) | $ | 5,928 | $ | 5,565 | $ | 2,742 | $ | 4,831 | $ | (1,777 | ) | $ | 4,772 | $ | 81,424 | 16,677 | |||||||||||||||||
Income tax effect of above items | 2,753 | 3,839 | 3,012 | 2,202 | 5,445 | 3,066 | (2,067 | ) | $ | 2,572 | |||||||||||||||||||||||
Income tax effect of unusual tax items | 86 | 53 | 2,002 | 479 | 3,661 | — | (72,599 | ) | (13,142 | ) | |||||||||||||||||||||||
Non-GAAP Income tax expense | $ | 8,767 | $ | 9,457 | $ | 7,756 | $ | 7,512 | $ | 7,329 | $ | 7,838 | $ | 6,758 | $ | 6,107 | |||||||||||||||||
Non-GAAP Income tax expense as a % of Non-GAAP Income before income taxes | 26.0 | % | 26.0 | % | 22.9 | % | 22.0 | % | 24.0 | % | 23.1 | % | 17.0 | % | 15.0 | % | |||||||||||||||||
12
Summary of Unaudited Reconciliations of GAAP Measures to Non-GAAP Measures and other Unaudited GAAP Data (Continued) | |||||||||||||||||||||||||||||||||
($ in thousands, except per share data) | |||||||||||||||||||||||||||||||||
Q117 | Q217 | Q317 | Q417 | Q118 | Q218 | Q318 | Q418 | ||||||||||||||||||||||||||
GAAP Net income | $ | 20,387 | $ | 20,474 | $ | 22,221 | $ | 19,517 | $ | 18,828 | $ | 19,953 | $ | (49,504 | ) | $ | 9,854 | ||||||||||||||||
Stock-based compensation | 8,413 | 7,903 | 8,689 | 8,534 | 9,256 | 8,762 | 8,029 | 7,912 | |||||||||||||||||||||||||
Restructuring and other related charges (credits) | (1,048 | ) | (415 | ) | 113 | 1,241 | 2,573 | (51 | ) | (84 | ) | 13 | |||||||||||||||||||||
Acquisition related fees | — | — | — | — | — | — | — | 6,252 | |||||||||||||||||||||||||
Loss on sale of assets | — | — | — | — | 899 | — | — | — | |||||||||||||||||||||||||
Impairment of indirect tax asset | — | — | — | — | 686 | — | — | — | |||||||||||||||||||||||||
Executive transition costs | — | 2,759 | — | — | — | 549 | — | — | |||||||||||||||||||||||||
Purchase accounting amortization | 62 | 63 | 62 | 63 | 63 | 17 | — | — | |||||||||||||||||||||||||
Income tax effect of above items | (2,753 | ) | (3,839 | ) | (3,012 | ) | (2,202 | ) | (5,445 | ) | (3,066 | ) | 2,067 | (2,572 | ) | ||||||||||||||||||
Income tax effect of unusual tax items | (86 | ) | (53 | ) | (2,002 | ) | (479 | ) | (3,661 | ) | — | 72,599 | 13,142 | ||||||||||||||||||||
Non-GAAP Net income | $ | 24,975 | $ | 26,892 | $ | 26,071 | $ | 26,674 | $ | 23,199 | $ | 26,164 | $ | 33,107 | $ | 34,601 | |||||||||||||||||
GAAP Diluted earnings per common share | $ | 0.62 | $ | 0.63 | $ | 0.68 | $ | 0.59 | $ | 0.57 | $ | 0.59 | $ | (1.54 | ) | $ | 0.29 | ||||||||||||||||
Stock-based compensation | 0.26 | 0.24 | 0.26 | 0.26 | 0.28 | 0.27 | 0.25 | 0.24 | |||||||||||||||||||||||||
Acquisition related fees | — | — | — | — | — | — | — | 0.19 | |||||||||||||||||||||||||
Restructuring and other related charges (credits) | (0.03 | ) | (0.01 | ) | — | 0.04 | 0.08 | — | — | — | |||||||||||||||||||||||
Loss on sale of assets | — | — | — | — | 0.03 | — | — | — | |||||||||||||||||||||||||
Impairment of indirect tax asset | — | — | — | — | 0.02 | — | — | — | |||||||||||||||||||||||||
Executive transition costs | — | 0.08 | — | — | — | 0.02 | — | — | |||||||||||||||||||||||||
Income tax effect | (0.09 | ) | (0.12 | ) | (0.15 | ) | (0.08 | ) | (0.28 | ) | (0.10 | ) | 2.29 | 0.32 | |||||||||||||||||||
Effect of participating securities | — | — | — | — | — | 0.02 | — | 0.01 | |||||||||||||||||||||||||
Effect of anti-dilutive securities | $ | — | $ | — | $ | — | $ | — | $ | — | $ | — | $ | 0.02 | $ | — | |||||||||||||||||
Non-GAAP Diluted earnings per common share | $ | 0.76 | $ | 0.82 | $ | 0.79 | $ | 0.81 | $ | 0.70 | $ | 0.80 | $ | 1.02 | $ | 1.05 | |||||||||||||||||
Shares used in diluted earnings per common share calculation: | |||||||||||||||||||||||||||||||||
GAAP | 32,818 | 32,726 | 32,826 | 33,056 | 33,211 | 32,809 | 32,075 | 32,924 | |||||||||||||||||||||||||
Non-GAAP | 32,818 | 32,726 | 32,826 | 33,056 | 33,211 | 32,809 | 32,496 | 32,924 | |||||||||||||||||||||||||
13
Summary of other Unaudited GAAP Data | |||||||||||||||||||||||||||||||||
($ in thousands) | Q117 | Q217 | Q317 | Q417 | Q118 | Q218 | Q318 | Q418 | |||||||||||||||||||||||||
Net revenues from unaffiliated customers: | |||||||||||||||||||||||||||||||||
Enterprise | $ | 155,897 | $ | 154,542 | $ | 157,345 | $ | 160,870 | $ | 154,605 | $ | 162,907 | $ | 167,640 | $ | 164,587 | |||||||||||||||||
Consumer | 67,209 | 61,641 | 75,588 | 48,084 | 49,321 | 47,393 | 58,894 | 51,556 | |||||||||||||||||||||||||
Total net revenues | $ | 223,106 | $ | 216,183 | $ | 232,933 | $ | 208,954 | $ | 203,926 | $ | 210,300 | $ | 226,534 | $ | 216,143 | |||||||||||||||||
Net revenues by geographic area from unaffiliated customers: | |||||||||||||||||||||||||||||||||
Domestic | $ | 128,238 | $ | 119,062 | $ | 123,719 | $ | 111,196 | $ | 108,810 | $ | 111,095 | $ | 106,455 | $ | 107,692 | |||||||||||||||||
International | 94,868 | 97,121 | 109,214 | 97,758 | 95,116 | 99,205 | 120,079 | 108,451 | |||||||||||||||||||||||||
Total net revenues | $ | 223,106 | $ | 216,183 | $ | 232,933 | $ | 208,954 | $ | 203,926 | $ | 210,300 | $ | 226,534 | $ | 216,143 | |||||||||||||||||
Balance Sheet accounts and metrics: | |||||||||||||||||||||||||||||||||
Accounts receivable, net | $ | 133,155 | $ | 136,779 | $ | 141,297 | $ | 141,177 | $ | 134,833 | $ | 139,683 | $ | 143,919 | $ | 152,888 | |||||||||||||||||
Days sales outstanding (DSO) | 54 | 57 | 55 | 61 | 60 | 60 | 57 | 64 | |||||||||||||||||||||||||
Inventory, net | $ | 53,912 | $ | 52,686 | $ | 58,026 | $ | 55,456 | $ | 57,571 | $ | 60,999 | $ | 64,574 | $ | 68,276 | |||||||||||||||||
Inventory turns | 8.2 | 8.0 | 8.5 | 7.3 | 7.0 | 6.7 | 7.0 | 6.0 | |||||||||||||||||||||||||
14