Attached files
| file | filename |
|---|---|
| EX-99.1 - EXHIBIT 99.1 - QUAKER CHEMICAL CORP | tv492584_ex99-1.htm |
| 8-K - FORM 8-K - QUAKER CHEMICAL CORP | tv492584_8k.htm |
Exhibit 99.2

1 First Quarter 2018 Results Investor Conference Call May 1, 2018 Quaker Chemical Corporation

Risks and Uncertainties Statement Regulation G The attached charts include C ompany information that does not conform to generally accepted accounting principles ( “GAAP”). Management believes that an analysis of this data is meaningful to investors because it provides insight with respect to ongoing operating results of the Company and allows investors to better evaluate the financial results of the Company. These measures should not be viewed as an alternative to GAAP measures of performance. Furthermore, these measures may not be consis tent with similar measures provided by other companies. This data should be read in conjunction with the Company’s most recent annual report filed on form 10-K as well as the first quarter earnings news release dated April 30, 2018 which has been furnish ed to the Securities and Exchange Commission (“SEC”) on Form 8-K and the Company’s Form 10-Q for the period ended March 31, 2018, which has been filed with the SEC. Forward-Looking Statements This presentation contains "forward-looking statements" within the meaning of Section 27A of the Securities Act of 1933 and Section 21E of the Securities Exchange Act of 1934. These forward-looking statements are subject to certain risks and uncertainties that could cause actual results to differ materially from those projected in such statements. A major risk is that demand for the Company's products and services is largely derived from the demand for its customers' products, which subjects the Company to uncertainties related to downturns in a customer's business and unanticipated customer production shutdowns. Other major risks and uncertainties include, but are not limited to, significant increases in raw material costs, customer financial stability, worldwide economic and political condi tions, foreign currency fluctuations, significant changes in applicable tax rates and regulations, future terrorist attacks and other acts of violence. Other factors, including those related to the previously announced pending Houghton combination (“the Combination”), could also adversely affect us including, but not limited to: the risk that a required regulatory approval will not be obtained or is subject to conditions that are not anticipated or acceptable to us; the potential that regulatory authorities may require that we make divestitures in connection with the Combination of a greater amount than we anticipated, which would result in a smaller than anticipated combined business; the risk that a closing condition to the Combination may not be satisfied in a timely manner; risks associated with the financing of the Combination; the occurrence of any event, change or other circumstance that could give rise to the termination of the share purchase agreement; potential adverse effects on Quaker Chemical’s business, properties or operations caused by the implementation of the Combination; Quaker Chemical’s ability to promptly, efficiently and effectively integrate the operations of Houghton and Quaker Chemical; risks related to each company’s distraction from ongoing business operations due to the Combination; and, the outcome of any legal proceedings that may be instituted against the companies related to the Combination. Therefore, we caution you not to place undue reliance on our forward-looking statements. For more information regarding these risks and uncertainties as well as certain additional risks that we face, you should refer to the Risk Factors detailed in Item 1A of our Form 10-K for the year ended December 31, 2017 as well as the proxy statement the Company filed on July 31, 2017 and in our quarterly and other reports filed from time to time with the SEC. We do not intend to, and we disclaim any duty or obligation to, update or revise any forward- looking statements to reflect new information or future events or for any other reason. This discussion is provided as permitted by the Private Securities Litigation Reform Act of 1995.

Speakers Michael F. Barry Chairman of the Board, Chief Executive Officer & President Mary Dean Hall Vice President, Chief Financial Officer & Treasurer Robert T. Traub Vice President, General Counsel & Corporate Secretary Chart #1
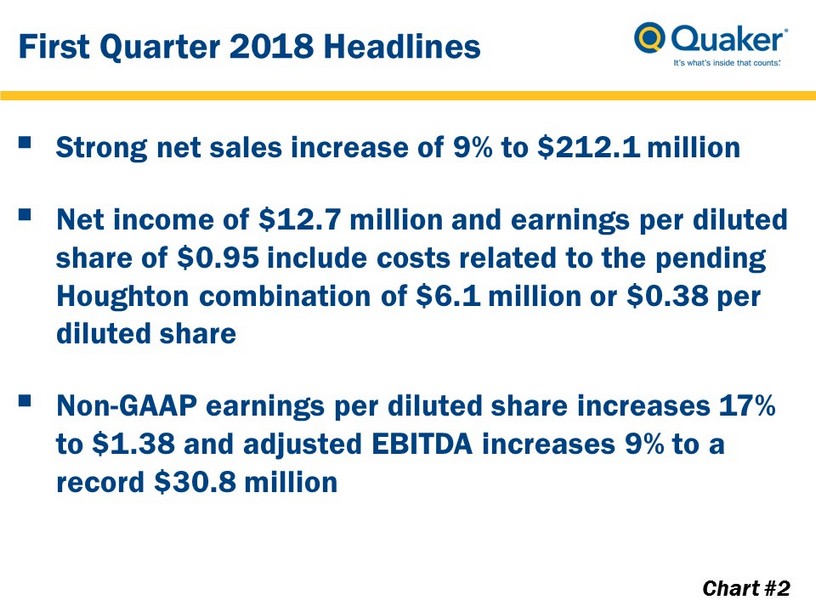
First Quarter 2018 Headlines ▪ Strong net sales increase of 9% to $212.1 million ▪ Net income of $12.7 million and earnings per diluted share of $0.95 include costs related to the pending Houghton combination of $6.1 million or $0.38 per diluted share ▪ Non - GAAP earnings per diluted share increases 17% to $1.38 and adjusted EBITDA increases 9% to a record $30.8 million Chart #2

Chairman Comments ▪ First Quarter 2018 x Solid operating performance drives a 9% increase in adjusted EBITDA and, coupled with a lower effective tax rate, results in a 17% increase in non - GAAP earnings per diluted share x Net sales increase of 9% to $212.1 million driven by volume, selling price and product mix as well as foreign exchange x Sequential gross margin improvement compared to Q4’17 due to previous price increases despite higher raw material costs in the current quarter x Market share gains continue to be evident in the current quarter’s global volumes although somewhat masked by an atypical sales pattern in EMEA during the prior year quarter ▪ 2018 Outlook x Expect market share gains and modest growth in our global end markets as well as gross margin to trend upward over the new next few quarters and be around 36% in 2018 x Still awaiting regulatory approvals in the U.S. and Europe but generally in agreement with the regulatory authorities regarding remedies; consistent with our original expectations x Currently expect closing of the Houghton combination will occur over the next few months Chart #3 Overall, we remain confident in our future and expect 2018 to be another good year for both the current Quaker business and the combined new company post - closing

▪ Solid operating performance drove a 9% increase in adjusted EBITDA to a quarterly record of $30.8 million and a 17% increase in non - GAAP earnings per diluted share to $1.38 ▪ Net sales increase of 9% to $212.1 million driven by a 1% increase in volume, a 2% increase in selling price and product mix and a positive impact from foreign currency translation of 6% ▪ Gross profit increased 6% due to the increase in net sales, partially offset by a lower gross margin of 35.6% in Q1’18 compared to 36.4% in Q1’17, primarily due to higher raw material costs and changes in the mix of certain products sold ▪ Continued discipline in managing SG&A contributed to Q1’18 adjusted EBITDA margin of 14.5%, consistent with Q1’17 despite a lower gross margin quarter - over - quarter ▪ Houghton combination - related costs (including interest) totaled $6.1 million or $0.38 per diluted share in Q1’18 and $9.1 million or $0.69 per diluted share in Q1’17 ▪ Effective tax rates (“ETR”) of 29.8% and 50.8% in Q1’18 and Q1’17, respectively, include the impact of certain non - deductible Houghton combination - related expenses; ETR without this impact would be approximately 26% and 28% for Q1’18 and Q1’17, respectively ▪ Foreign currency translation positively impacted Q1’18 earnings by approximately 5% or $0.07 per diluted share ▪ Lower Q1’18 net operating cash flow of $2.7 million compared to $8.3 million in Q1’17 driven by higher cash invested in working capital primarily as a result of increased net sales Financial Highlights First Quarter of 2018 Chart #4
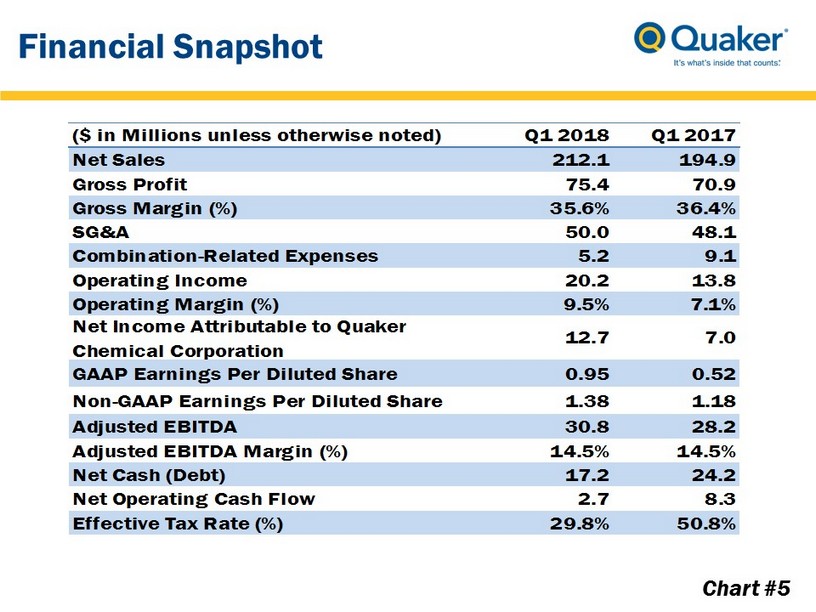
Chart #5 Financial Snapshot ($ in Millions unless otherwise noted) Q1 2018 Q1 2017 Net Sales 212.1 194.9 Gross Profit 75.4 70.9 Gross Margin (%) 35.6% 36.4% SG&A 50.0 48.1 Combination-Related Expenses 5.2 9.1 Operating Income 20.2 13.8 Operating Margin (%) 9.5% 7.1% Net Income Attributable to Quaker Chemical Corporation 12.7 7.0 GAAP Earnings Per Diluted Share 0.95 0.52 Non-GAAP Earnings Per Diluted Share 1.38 1.18 Adjusted EBITDA 30.8 28.2 Adjusted EBITDA Margin (%) 14.5% 14.5% Net Cash (Debt) 17.2 24.2 Net Operating Cash Flow 2.7 8.3 Effective Tax Rate (%) 29.8% 50.8%
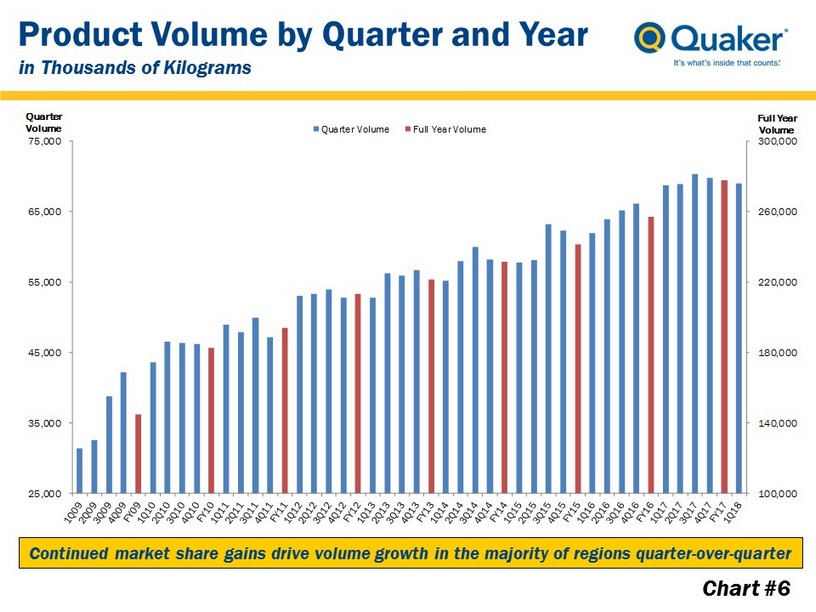
Chart #6 Continued market share gains drive volume growth in the majority of regions quarter - over - quarter Product Volume by Quarter and Year in Thousands of Kilograms 100,000 140,000 180,000 220,000 260,000 300,000 25,000 35,000 45,000 55,000 65,000 75,000 Full Year Volume Quarter Volume Quarter Volume Full Year Volume
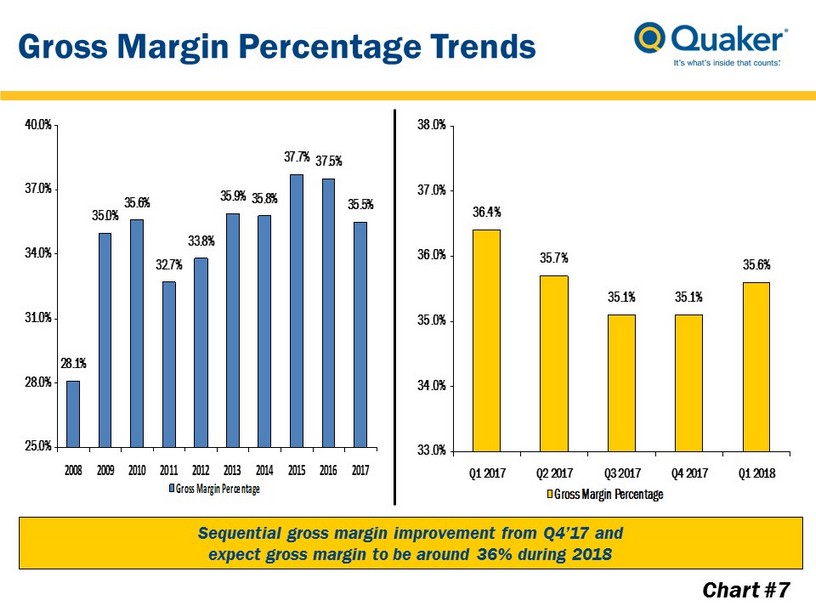
28.1% 35.0% 35.6% 32.7% 33.8% 35.9% 35.8% 37.7% 37.5% 35.5% 25.0% 28.0% 31.0% 34.0% 37.0% 40.0% 2008 2009 2010 2011 2012 2013 2014 2015 2016 2017 Gross Margin Percentage 36.4% 35.7% 35.1% 35.1% 35.6% 33.0% 34.0% 35.0% 36.0% 37.0% 38.0% Q1 2017 Q2 2017 Q3 2017 Q4 2017 Q1 2018 Gross Margin Percentage Chart #7 Sequential gross margin improvement from Q4’17 and expect gross margin to be around 36% during 2018 Gross Margin Percentage Trends
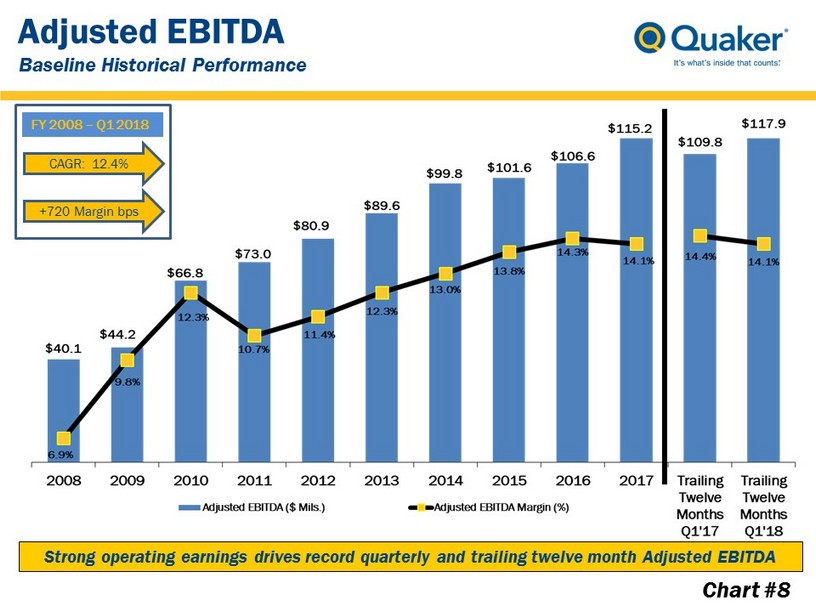
FY 2008 – Q1 2018 CAGR: 12.4% +720 Margin bps Adjusted EBITDA Baseline Historical Performance Strong operating earnings drives record quarterly and trailing twelve month Adjusted EBITDA Chart #8

-$120 -$80 -$40 $0 $40 $80 $120 2008 2009 2010 2011 2012 2013 2014 2015 2016 2017 Q1 2018 $ Millions Cash ST/LT Debt Net Cash (Debt) Chart #9 Continued solid cash flow generation and strong balance sheet Balance Sheet Cash and Debt

APPENDIX
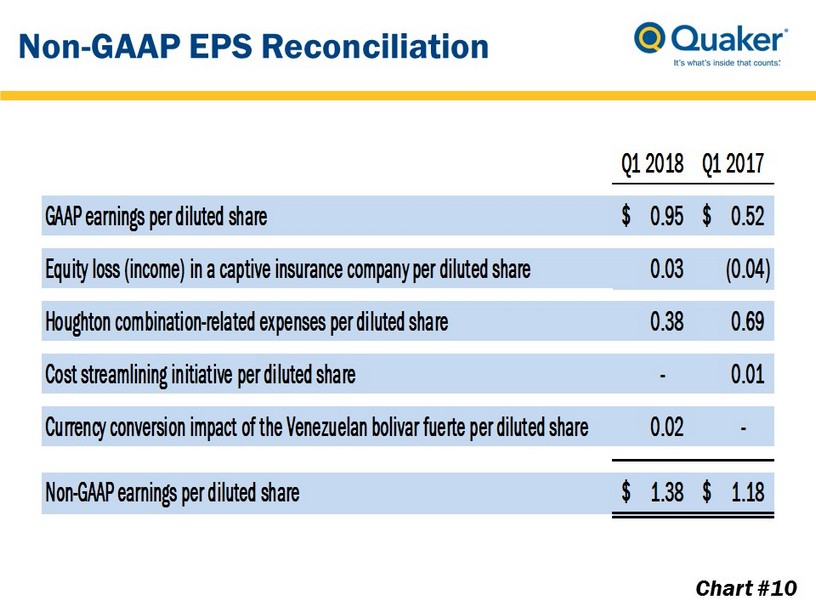
Chart #10 Non - GAAP EPS Reconciliation Q1 2018 Q1 2017 GAAP earnings per diluted share 0.95$ 0.52$ Equity loss (income) in a captive insurance company per diluted share 0.03 (0.04) Houghton combination-related expenses per diluted share 0.38 0.69 Cost streamlining initiative per diluted share - 0.01 Currency conversion impact of the Venezuelan bolivar fuerte per diluted share 0.02 - Non-GAAP earnings per diluted share 1.38$ 1.18$

Chart #11 TTM Adjusted EBITDA Reconciliation I = G + H H G = F - D F E = C + D D C = B - A B A ($ in thousands unless otherwise noted) Trailing Twelve Months Q1 2018 YTD Q1 2018 Last Nine Months 2017 FY 2017 Trailing Twelve Months Q1 2017 YTD Q1 2017 Last Nine Months 2016 FY 2016 YTD Q1 2016 Net income 26,018$ 12,732$ 13,286$ 20,278$ 55,449$ 6,992$ 48,457$ 61,403$ 12,946$ Depreciation 12,635 3,194 9,441 12,598 12,557 3,157 9,400 12,557 3,157 Amortization 7,448 1,853 5,595 7,368 7,005 1,773 5,232 7,009 1,777 Interest expense 4,928 1,692 3,236 3,892 2,804 656 2,148 2,889 741 Taxes on income before equity in net income of associated companies 40,344 5,556 34,788 41,653 23,786 6,865 16,921 23,226 6,305 Equity (income) loss in a captive insurance company (1,583) 372 (1,955) (2,547) (2,228) (592) (1,636) (1,688) (52) Restructuring credit - - - - (439) - (439) (439) - Houghton combination-related expenses 26,072 5,209 20,863 29,938 10,606 9,075 1,531 1,531 - U.S. pension plan settlement charge 1,860 - 1,860 1,860 - - - - - Loss on disposal of held-for-sale asset 125 - 125 125 - - - - - Insurance insolvency recovery (600) - (600) (600) - - - - - Cost streamlining initiative - - - 286 286 286 - - - Currency conversion impacts of the Venezuelan bolivar fuerte 606 218 388 388 - - - 88 88 Adjusted EBITDA 117,853$ 30,826$ 87,027$ 115,239$ 109,826$ 28,212$ 81,614$ 106,576$ 24,962$ Adjusted EBITDA Margin (%) 14.1% 14.5% 13.9% 14.1% 14.4% 14.5% 14.4% 14.3% 14.0%
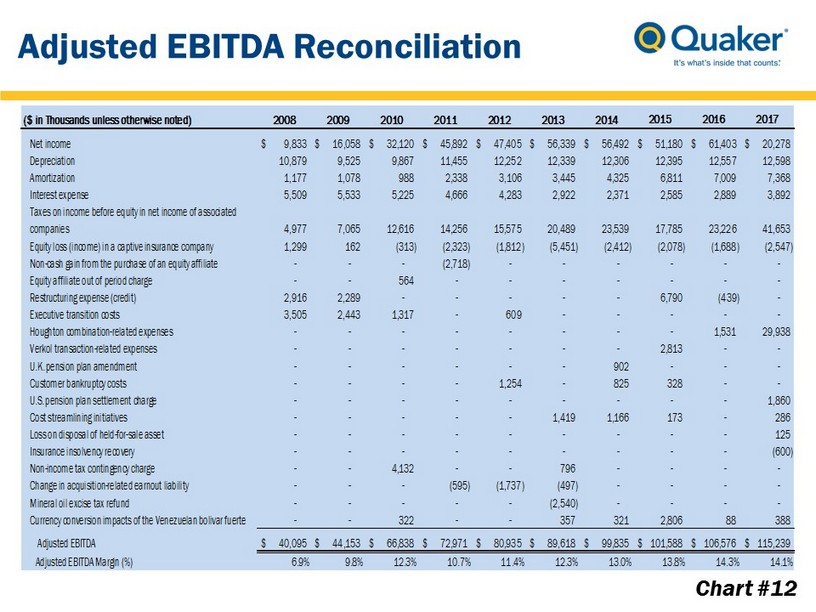
Chart #12 Adjusted EBITDA Reconciliation ($ in Thousands unless otherwise noted) 2008 2009 2010 2011 2012 2013 2014 2015 2016 2017 Net income 9,833$ 16,058$ 32,120$ 45,892$ 47,405$ 56,339$ 56,492$ 51,180$ 61,403$ 20,278$ Depreciation 10,879 9,525 9,867 11,455 12,252 12,339 12,306 12,395 12,557 12,598 Amortization 1,177 1,078 988 2,338 3,106 3,445 4,325 6,811 7,009 7,368 Interest expense 5,509 5,533 5,225 4,666 4,283 2,922 2,371 2,585 2,889 3,892 Taxes on income before equity in net income of associated companies 4,977 7,065 12,616 14,256 15,575 20,489 23,539 17,785 23,226 41,653 Equity loss (income) in a captive insurance company 1,299 162 (313) (2,323) (1,812) (5,451) (2,412) (2,078) (1,688) (2,547) Non-cash gain from the purchase of an equity affiliate - - - (2,718) - - - - - - Equity affiliate out of period charge - - 564 - - - - - - - Restructuring expense (credit) 2,916 2,289 - - - - - 6,790 (439) - Executive transition costs 3,505 2,443 1,317 - 609 - - - - - Houghton combination-related expenses - - - - - - - - 1,531 29,938 Verkol transaction-related expenses - - - - - - - 2,813 - - U.K. pension plan amendment - - - - - - 902 - - - Customer bankruptcy costs - - - - 1,254 - 825 328 - - U.S. pension plan settlement charge - - - - - - - - - 1,860 Cost streamlining initiatives - - - - - 1,419 1,166 173 - 286 Loss on disposal of held-for-sale asset - - - - - - - - - 125 Insurance insolvency recovery - - - - - - - - - (600) Non-income tax contingency charge - - 4,132 - - 796 - - - - Change in acquisition-related earnout liability - - - (595) (1,737) (497) - - - - Mineral oil excise tax refund - - - - - (2,540) - - - - Currency conversion impacts of the Venezuelan bolivar fuerte - - 322 - - 357 321 2,806 88 388 Adjusted EBITDA 40,095$ 44,153$ 66,838$ 72,971$ 80,935$ 89,618$ 99,835$ 101,588$ 106,576$ 115,239$ Adjusted EBITDA Margin (%) 6.9% 9.8% 12.3% 10.7% 11.4% 12.3% 13.0% 13.8% 14.3% 14.1%