Attached files
| file | filename |
|---|---|
| EX-24.1 - EXHIBIT 24.1 - Ingersoll Rand Inc. | s002023x3_ex24-1.htm |
| EX-23.2 - EXHIBIT 23.2 - Ingersoll Rand Inc. | s002023x3_ex23-2.htm |
| EX-5.1 - EXHIBIT 5.1 - Ingersoll Rand Inc. | s002023x3_ex5-1.htm |
| EX-1.1 - EXHIBIT 1.1 - Ingersoll Rand Inc. | s002023x3_ex1-1.htm |
As filed with the Securities and Exchange Commission on April 30, 2018
Registration No. 333-
UNITED STATES
SECURITIES AND EXCHANGE COMMISSION
Washington, D.C. 20549
FORM S-1
REGISTRATION STATEMENT
UNDER
THE SECURITIES ACT OF 1933
Gardner Denver Holdings, Inc.
(Exact name of registrant as specified in its charter)
|
Delaware
(State or other jurisdiction of incorporation or organization) |
3560
(Primary Standard Industrial Classification Code Number) |
46-2393770
(I.R.S. Employer Identification Number) |
222 East Erie Street, Suite 500
Milwaukee, Wisconsin 53202
Telephone: 414-212-4700
(Address, including zip code, and telephone number, including area code, of registrant’s principal executive offices)
Andrew Schiesl, Esq.
General Counsel
222 East Erie Street, Suite 500
Milwaukee, Wisconsin 53202
Telephone: 414-212-4700
(Name, address, including zip code, and telephone number, including area code, of agent for service)
With copies to:
|
Richard Fenyes, Esq.
Simpson Thacher & Bartlett LLP 425 Lexington Avenue New York, New York 10017-3954 (212) 455-2000 |
Marc Jaffe, Esq.
Ian Schuman, Esq. Peter Sluka, Esq. Latham & Watkins LLP 885 Third Avenue New York, New York 10022-4834 (212) 906-1200 |
Approximate date of commencement of proposed sale to the public: As soon as practicable after this Registration Statement is declared effective.
If any of the securities being registered on this Form are to be offered on a delayed or continuous basis pursuant to Rule 415 under the Securities Act of 1933, check the following box: o
If this Form is filed to register additional securities for an offering pursuant to Rule 462(b) under the Securities Act, please check the following box and list the Securities Act registration statement number of the earlier effective registration statement for the same offering. o
If this Form is a post-effective amendment filed pursuant to Rule 462(c) under the Securities Act, check the following box and list the Securities Act registration statement number of the earlier effective registration statement for the same offering. o
If this Form is a post-effective amendment filed pursuant to Rule 462(d) under the Securities Act, check the following box and list the Securities Act registration statement number of the earlier effective registration statement for the same offering. o
Indicate by check mark whether the registrant is a large accelerated filer, an accelerated filer, a non-accelerated filer, a smaller reporting company, or an emerging growth company. See the definitions of “large accelerated filer,” “accelerated filer,” “smaller reporting company” and “emerging growth company” in Rule 12b-2 of the Exchange Act.
|
Large accelerated filer
|
o
|
Accelerated filer
|
o
|
|
Non-accelerated filer
|
☒ (Do not check if a smaller reporting company)
|
Smaller reporting company
|
o
|
|
|
|
Emerging growth company
|
o
|
If an emerging growth company, indicate by check mark if the registrant has elected not to use the extended transition period for complying with any new or revised financial accounting standards provided pursuant to Section 7(a)(2)(B) of the Securities Act. o
CALCULATION OF REGISTRATION FEE
|
Title Of Each Class Of
Securities To Be Registered |
Amount to be Registered(1)
|
Proposed Maximum Aggregate Offering Price Per Share(2)
|
Proposed Maximum Aggregate Offering Price(1)(2)
|
Amount of Registration Fee
|
||||||||
|
Common Stock, par value $0.01 per share
|
|
25,404,956
|
|
$
|
31.29
|
|
$
|
794,984,569.80
|
|
$
|
98,975.58
|
|
| (1) | Includes 3,313,690 shares of common stock subject to the underwriters’ option to purchase additional shares of common stock. See “Underwriting.” |
| (2) | Estimated solely for the purpose of determining the amount of the registration fee in accordance with Rule 457(c) under the Securities Act of 1933, as amended. The proposed maximum offering price per share and proposed maximum aggregate offering price are based on the average high and low prices of the Registrant’s common stock on April 27, 2018 as reported on the New York Stock Exchange. |
The Registrant hereby amends this Registration Statement on such date or dates as may be necessary to delay its effective date until the Registrant shall file a further amendment which specifically states that this Registration Statement shall thereafter become effective in accordance with Section 8(a) of the Securities Act of 1933, as amended, or until the Registration Statement shall become effective on such date as the Securities and Exchange Commission, acting pursuant to said Section 8(a), may determine.
The information in this preliminary prospectus is not complete and may be changed. These securities may not be sold until the registration statement filed with the Securities and Exchange Commission is effective. This preliminary prospectus is not an offer to sell these securities and it is not soliciting an offer to buy these securities in any jurisdiction where the offer or sale is not permitted.
Subject to Completion, dated April 30, 2018
PRELIMINARY PROSPECTUS
22,091,266 Shares
![]()
Gardner Denver Holdings, Inc.
Common Stock
The selling stockholders named in this prospectus are offering 22,091,266 shares of common stock of Gardner Denver Holdings, Inc. We will not receive any proceeds from the sale of our common stock by the selling stockholders.
Our common stock is listed on the New York Stock Exchange (“NYSE”) under the symbol “GDI.” On April 27, 2018, the closing sales price of our common stock as reported on the NYSE was $31.84 per share.
To the extent the underwriters sell more than 22,091,266 shares of common stock, the underwriters have the option to purchase up to an additional 3,313,690 shares from investment funds affiliated with Kohlberg Kravis Roberts & Co. L.P. at the public offering price less the underwriting discounts and commissions within 30 days of the date of this prospectus. We will not receive any proceeds from the sale of our common stock pursuant to any exercise of the underwriters’ option to purchase additional shares.
Investing in our common stock involves risk. See “Risk Factors” beginning on page 18 to read about factors you should consider before buying shares of our common stock.
Neither the Securities and Exchange Commission (the “SEC”), nor any state securities commission has approved or disapproved of these securities or passed upon the adequacy or accuracy of this prospectus. Any representation to the contrary is a criminal offense.
|
|
Per Share
|
Total
|
||||
|
Public offering price
|
$
|
|
|
$
|
|
|
|
Underwriting discounts and commissions
|
$
|
|
|
$
|
|
|
|
Proceeds, before expenses, to the selling stockholders(1)
|
$
|
|
|
$
|
|
|
| (1) | See “Underwriting (Conflicts of Interest)” for additional information regarding underwriting compensation. |
The underwriters expect to deliver the shares against payment in New York, New York on or about , 2018.
Joint Book-Running Managers
|
Goldman Sachs & Co. LLC
|
Citigroup
|
KKR
|
Prospectus dated , 2018.
Neither we, the selling stockholders nor the underwriters have authorized anyone to provide you with information different from that contained or incorporated by reference in this prospectus, any amendment or supplement to this prospectus or any free writing prospectus prepared by us or on our behalf. Neither we nor the underwriters take any responsibility for, or can provide any assurance as to the reliability of, any information other than the information contained or incorporated by reference in this prospectus, any amendment or supplement to this prospectus or any free writing prospectus prepared by us or on our behalf. We, the selling stockholders and the underwriters are offering to sell, and seeking offers to buy, shares of our common stock only in jurisdictions where offers and sales are permitted. The information included and incorporated by reference in this prospectus is accurate only as of the date of this prospectus, regardless of the time of delivery of this prospectus or any sale of shares of our common stock.
Table of Contents
|
|
|
||
|
|
|
||
|
|
|
||
|
|
|
||
|
|
|
||
|
|
|
||
|
|
|
||
|
|
|
||
|
|
|
||
|
|
|
||
|
|
|
||
|
|
|
||
|
|
|
||
|
|
|
||
|
|
|
||
|
|
|
||
|
|
|
||
|
|
|
||
|
|
|
||
|
|
|
||
|
|
|
i
MARKET, RANKING AND OTHER INDUSTRY DATA
In addition to the industry, market and competitive position data referenced throughout this prospectus and the documents incorporated by reference herein that are prepared from our own internal estimates relying on our management’s knowledge and experience in the markets in which we operate and our research, some market data and other statistical information used throughout this prospectus and the documents incorporated by reference herein are based in part upon information provided by independent research and advisory firms, none of which have been commissioned by us, but for certain of which we have paid a subscription fee. Third-party industry publications, studies and surveys generally state that they have been obtained from sources believed to be reliable, although they do not guarantee the accuracy or completeness of such information. Our management’s knowledge and experience, in turn, are based on information obtained from our customers, distributors, suppliers, trade and business organizations and other contacts in the markets we operate. We are responsible for all of the disclosure included and incorporated by reference in this prospectus and while we believe that each of the publications, studies and surveys used throughout this prospectus and the documents incorporated by reference herein are prepared by reputable sources, neither we nor the underwriters have independently verified market and industry data from third-party sources. While we believe our internal company research and estimates are reliable, such research and estimates have not been verified by any independent source. In addition, assumptions and estimates of our and our industry’s future performance are necessarily subject to a high degree of uncertainty and risk due to a variety of factors, including those described in “Risk Factors.” These and other factors could cause our future performance to differ materially from our assumptions and estimates. See “Special Note Regarding Forward-Looking Statements.”
TRADEMARKS, SERVICE MARKS AND TRADE NAMES
This prospectus contains some of our trademarks, trade names and service marks, including, among others, CompAir, Elmo Rietschle, Emco Wheaton, Gardner Denver, Nash, Robuschi and Thomas. Each one of these trademarks, trade names or service marks is either (i) our registered trademark, (ii) a trademark for which we have a pending application or (iii) a trade name or service mark for which we claim common law rights. All other trademarks, trade names or service marks of any other company appearing in this prospectus belong to their respective owners. Solely for convenience, the trademarks, service marks and trade names referred to in this prospectus are presented without the TM, SM and ® symbols, but such references are not intended to indicate, in any way, that we will not assert, to the fullest extent under applicable law, our rights or the rights of the applicable licensors to these trademarks, service marks and trade names.
Unless otherwise indicated or the context otherwise requires, the financial statements and other data included and incorporated by reference in this prospectus reflect the consolidated business and operations of Gardner Denver Holdings, Inc. and its consolidated subsidiaries, including Gardner Denver, Inc., its principal operating subsidiary. Unless the context otherwise requires, all references herein to “Gardner Denver,” the “Company,” “we,” “our” or “us” refer to Gardner Denver Holdings, Inc. and its consolidated subsidiaries. References in this prospectus to the “Sponsor” or “KKR & Co.” are to Kohlberg Kravis Roberts & Co. L.P. and certain of its affiliates.
All references to years in this prospectus, unless otherwise noted, refer to our fiscal years, which end on December 31.
Amounts in this prospectus are presented in U.S. dollars rounded to the nearest million, unless otherwise noted. Amounts in our consolidated financial statements incorporated by reference in this prospectus are presented in U.S. dollars rounded to the nearest thousand, unless otherwise noted. Accordingly, numerical figures shown as totals in various tables may not be arithmetic aggregations of the figures that precede them. The accounting policies set out in the audited consolidated financial statements incorporated by reference in this prospectus have been consistently applied to all periods presented.
ii
This summary highlights certain significant aspects of our business and this offering. This is a summary of information contained elsewhere in this prospectus, is not complete and does not contain all of the information that you should consider before making your investment decision. You should carefully read the entire prospectus and the documents incorporated by reference herein, including the information presented under the sections entitled “Risk Factors” and “Special Note Regarding Forward-Looking Statements” and the consolidated financial statements and the notes thereto incorporated by reference in this prospectus, before making an investment decision. This summary contains forward-looking statements that involve risks and uncertainties.
Our Company
We are a leading global provider of mission-critical flow control and compression equipment and associated aftermarket parts, consumables and services, which we sell across multiple attractive end-markets within the industrial, energy and medical industries. We manufacture one of the broadest and most complete ranges of compressor, pump, vacuum and blower products in our markets, which, combined with our global geographic footprint and application expertise, allows us to provide differentiated product and service offerings to our customers. Our products are sold under a collection of premier, market-leading brands, including Gardner Denver, CompAir, Nash, Emco Wheaton, Robuschi, Elmo Rietschle and Thomas, which we believe are globally recognized in their respective end-markets and known for product quality, reliability, efficiency and superior customer service. These attributes, along with over 155 years of engineering heritage, generate strong brand loyalty for our products and foster long-standing customer relationships, which we believe have resulted in leading market positions within each of our operating segments. We have sales in more than 175 countries and our diverse customer base utilizes our products across a wide array of end-markets that have favorable near- and long-term growth prospects, including industrial manufacturing, energy (with particular exposure to the North American upstream land-based market), transportation, medical and laboratory sciences, food and beverage packaging and chemical processing. For the year ended December 31, 2017, we generated revenue of $2,375.4 million, net income of $18.5 million and Adjusted EBITDA of $561.5 million. For a reconciliation of net income to Adjusted EBITDA, see Note (1) under “—Summary Historical Consolidated Financial and Other Data.”
Our products and services are critical to the processes and systems in which they are utilized, which are often complex and function in harsh conditions where the cost of failure or downtime is high. However, our products and services typically represent only a small portion of the costs of the overall system. As a result, our customers place a high value on our application expertise, product reliability and the responsiveness of our service. We support our customers globally with 39 key manufacturing facilities, more than 30 complementary service and repair centers across six continents and approximately 6,600 employees worldwide as of March 31, 2018.
The process-critical nature of our product applications, coupled with the standard wear and tear replacement cycles associated with the usage of our products, generates opportunities to support customers with our broad portfolio of aftermarket parts, consumables and services. Customers place a high value on minimizing any time their operations are offline. As a result, the availability of replacement parts and our repair and support services are key components of our value proposition, and our large installed base of products provides a recurring revenue stream through our aftermarket parts, consumables and services offerings. Our aftermarket revenue is significant, representing 41% of total revenue and approximately 45% of our combined Industrials and Energy segments’ revenue in 2017.
We were acquired by an affiliate of our Sponsor on July 30, 2013 (the “KKR Transaction”) and have undergone a significant transformation since that date. From 2014 to 2016, our transformation significantly improved our underlying operating performance, enabling us to achieve Segment Adjusted EBITDA margins in excess of 20% across all segments in 2016, notwithstanding the decline in our revenues from $2,570 million to $1,939 million, which was driven by the significant downturn in the upstream energy market and currency volatility during that period. We continued to expand margins in 2017, achieving Segment Adjusted EBITDA margins in excess of 21% in each of our segments. Our senior leadership team, led by our CEO Vicente Reynal, has been reconstituted and expanded, which we believe brought together deep expertise from leading global industrial organizations. In addition, 45% of our top 100 business managers, including the senior management team, have joined since the KKR Transaction, which we believe added significant new levels of talent to our leadership team. As part of our transformation, we also reorganized our Company into three business segments
1
because of the unique sales drivers and market characteristics of each. Together, our Industrials, Energy and Medical segments create a diverse portfolio with exposure to highly attractive end-markets, significant aftermarket revenues, upside from an upstream energy recovery and positive secular trends across all segments.
|
|
Industrials Segment
|
Energy Segment
|
Medical Segment
|
|
2017 Segment Revenue
|
$1,130.7 million
|
$1,014.5 million
|
$230.2 million
|
|
2017 Segment Adjusted EBITDA
|
$242.7 million
|
$296.1 million
|
$62.4 million
|
|
2017 Segment Adjusted EBITDA margin
|
21.5%
|
29.2%
|
27.1%
|
| • | Industrials (47% of 2017 total revenue): We design, manufacture, market and service one of the broadest portfolios of air compression, vacuum and blower products, including associated aftermarket parts, consumables and services, across a wide array of technologies and applications for use in diverse end-markets. We believe our ability to support custom industrial application needs from nearly full vacuum to approximately 7,000 pounds per square inch (psi) pressure levels makes us a partner of choice for many of our long-standing customers. Our large installed base also provides for a significant stream of recurring aftermarket revenue, which often cumulatively exceeds the original cost of the product. |
| • | Energy (43% of 2017 total revenue): We design, manufacture, market and service a diverse range of positive displacement pumps, including drilling pumps and hydraulic fracturing pumps (“frac pumps”), liquid ring vacuum pumps, compressors and integrated systems, engineered fluid loading and transfer equipment and associated aftermarket parts, consumables and services. The highly engineered products offered by our Energy segment serve customers across upstream, midstream and downstream energy markets, as well as petrochemical processing, transportation and general industrial sectors. Many of the products in our Energy segment are highly aftermarket-intensive in nature, with some applications, such as certain products we sell into upstream energy, for which the cumulative aftermarket revenue stream can be multiples of the cost of the original pump. |
| • | Medical (10% of 2017 total revenue): We design, manufacture and market a broad range of highly specialized gas, liquid and precision syringe pumps that are specified by medical equipment suppliers and integrated into their final equipment for use in applications such as oxygen therapy, blood dialysis, patient monitoring, laboratory sterilization and wound treatment, among others. We offer a comprehensive product portfolio across a breadth of technologies to address the medical and laboratory sciences pump and fluid handling industry, as well as a range of end-use vacuum products for laboratory science applications, and we recently expanded into liquid pumps and automated liquid handling components and systems. |
Our business is diversified across geographic regions, end-markets and type of product specification:
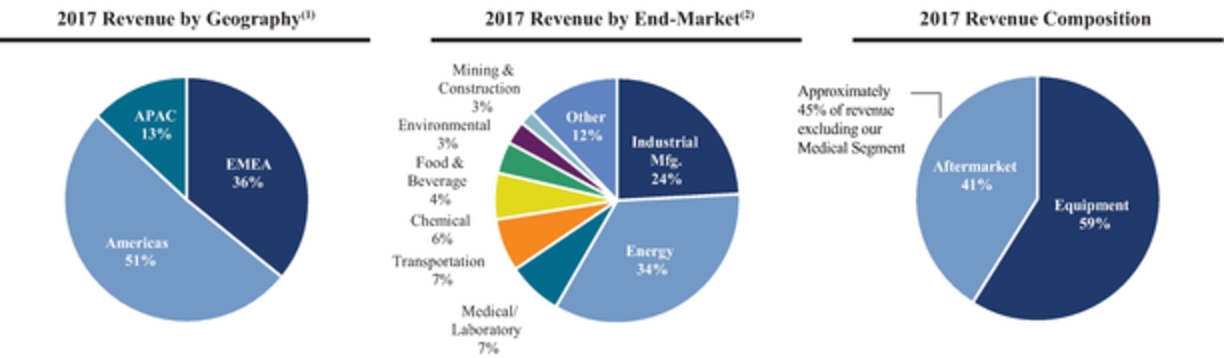
| (1) | Our geographic regions are grouped into North and South America (the “Americas”); Europe, Middle East and Africa (“EMEA”); and Asia Pacific (“APAC”). |
| (2) | The classification of end-markets for sales made through independent distributors (rather than through direct sales to end-users) is based on an assessment of the distribution channels through which such sales are made. |
Our top priority since the completion of the KKR Transaction has been the transformation of our business, which we have driven by investing in our corporate and business leadership team, expanding our commercial
2
reach, improving our operational capabilities and creating a performance-oriented organization. As a result, we significantly improved our underlying operating performance and, we believe, have laid the foundation for ongoing value creation. Some examples of the improvement achieved from 2014 to 2016 include:
| • | growing our Energy and Medical Segment Revenue by mid-single digit growth rates, excluding in each case the impact of the significant downturn in the upstream energy market and currency volatility; |
| • | growing Segment Adjusted EBITDA and meaningfully expanding Segment Adjusted EBITDA margins each year across all of our segments, excluding the impact of the significant downturn in the upstream energy market and currency volatility; |
| • | strengthening our customer service and connectivity by transitioning our sales team and realigning our product engineering and marketing teams in our Industrials segment into an integrated, global product and customer management structure; |
| • | transforming our upstream energy offering from being predominantly a pump manufacturer into a full service solutions provider that offers high quality, locally accessible aftermarket support; and |
| • | expanding our Industrials segment aftermarket revenues as a percentage of Industrials Segment Revenue from approximately 33% in 2014 to 35% in 2016. |
We believe the establishment and continued execution of our operational and strategic growth initiatives have positioned our Company for substantial revenue and Adjusted EBITDA growth with continued potential to expand margins. In 2017, we built upon this foundation, with 22.5% year-over-year revenue growth, net income of $18.5 million (compared to a $31.3 million net loss in 2016) and, Adjusted EBITDA of $561.5 million, an increase of 40.1% over the prior year, and Adjusted EBITDA margin of 23.6%, an increase of 290 basis points over the prior year.
Our Industries and Products
We operate in the global markets for flow control and air compression products for the industrial, energy and medical industries. Our highly engineered products and proprietary technologies are focused on serving specialized applications within these attractive and growing industries.
Industrials
Our Industrials segment designs, manufactures, markets and services a broad range of air compression, vacuum and blower products across a wide array of technologies and applications. Compression products are used to create varying levels of pressure in order to power machinery, industrial tools, material handling systems and automated equipment. Vacuum products create a range of pressures below atmospheric levels that are critical to many industrial and manufacturing processes such as drying, packaging, forming and aeration. Blower products are utilized to convey high volumes of air and gas at various flow rates and at low pressures, facilitating processes such as waste water aeration, biogas upgrading and conveying, pneumatic transport and dehydration.
Almost every manufacturing and industrial facility, and many service and process industry applications, use air compression, vacuum and blower products in a variety of process-critical applications. Within each of our compression, vacuum and blower product categories, we offer one of the broadest ranges of technologies in the market. The breadth and depth of our product offering creates incremental business opportunities by allowing us to cross-sell our full product portfolio and uniquely address customers’ needs in one complete solution.
|
Compression Technologies
|
Vacuum Technologies
|
Blower Technologies
|
|
• Rotary Screw
|
• Liquid Ring
|
• Rotary Lobe
|
|
• Reciprocating Piston
|
• Claw
|
• Screw
|
|
• Scroll
|
• Screw
|
• Claw & Vane
|
|
• Rotary Vane
|
• Rotary Vane
|
• Turbo
|
|
• Centrifugal
|
• Side Channel
|
• Side Channel & Radial
|
We continue to build on our strong competitive positions across our Industrials product categories. According to Frost & Sullivan, we currently maintain a top three position in the global industrial air compressor market, which is estimated to be a $13.2 billion industry. Furthermore, our management believes that we hold a leading position in our addressable portion of the global markets for vacuum products and blower products.
3
The mission-critical nature of our industrial products across manufacturing processes drives a demand environment and outlook that are highly correlated with global and regional industrial production, capacity utilization and long-term GDP growth. In the United States and Europe, we are poised to continue benefiting from expected growth in real GDP according to the International Monetary Fund (the “IMF”), along with an expected rebound in industrial production activity in 2017 and 2018 according to the U.S. Energy Information Administration (the “EIA”). In APAC, despite recent deceleration, GDP growth remains robust, and we believe that we are well-positioned to benefit from future growth in the region, which is estimated by the IMF to be a multiple of anticipated growth in the Americas and EMEA through 2018.
Furthermore, key industry trends that we believe will drive continued growth for our Industrials business are: (i) continuing customer desire for innovation and new technologies; (ii) increasing demand for service and monitoring; (iii) growing focus on comprehensive solutions and total life cycle cost; (iv) rising need for adaptability of products to accommodate new applications; and (v) increasing customer expectations for product reliability combined with superior customer service, quick aftermarket support and regular maintenance to reduce downtime.
Energy
Our Energy segment is one of the largest suppliers of equipment and associated aftermarket parts, consumables and services for the energy market applications that we serve, spanning upstream (petroleum exploration and production), midstream (transport, storage and wholesale marketing of petroleum products), downstream (refining, marketing and distribution of petroleum products) and petrochemical end-markets. The high cost of failure in these applications makes quality and reliability key purchase criteria for end-users and drives demand for our highly engineered and differentiated products.
Upstream
Our sales to upstream energy end-markets consist of positive displacement pumps, fluid ends and other aftermarket parts, consumables and services that are used in oil and gas drilling, hydraulic fracturing and well servicing applications. We believe we are exposed to some of the highest growth market drivers in the context of the current upstream energy recovery, particularly in the North American land-based market. First, a significant number of frac pumps were put into service during 2011 and 2012, the replacement of which, we believe, has been deferred beyond typical useful lives due to the recent downturn in upstream energy. We believe that this wave of needed replacements, coupled with widespread deferred maintenance on installed frac pumps, will drive demand in the near-term and over the next several years independent of the current upstream energy recovery, and will provide an additional tailwind of growth in the context of the recovery.
Furthermore, secular industry trends are driving increased demand for and utilization of newer, fit-for-purpose equipment that is highly engineered for demanding applications, and are increasing the frequency of replacement, refurbishment and upgrade cycles of pumping equipment. As a result of an improvement in crude oil prices and the threshold oil and gas prices at which wells are profitable to drill, an increased number of drilling rigs reentered the market in 2016 and 2017, which we expect to continue to drive growth. In turn, the associated usage of aftermarket parts and consumables used in drilling and hydraulic fracturing activity is also increasing. The number of wells drilled is growing at a faster rate than active rig count, with each active rig drilling more unconventional wells per unit of time than previously experienced. In addition, each unconventional well, on average, is being drilled with longer lateral well sections, or laterals, and more hydraulic fracturing stages per lateral length. Greater volumes of proppant (particles, such as sand, treated sand or ceramic materials, which operators mix with fluid to hold fissures open during the hydraulic fracturing process) are being used per length of lateral. As a result, multiple industry trends are independently driving demand for frac pumps and frequently replaced aftermarket parts, notably fluid ends, and associated consumables, resulting in a growth profile that is exposed to, but also meaningfully more robust than, underlying growth in active rig count.
Midstream and Downstream
Sales to midstream and downstream energy end-markets consist of liquid ring vacuum pumps and compressors and integrated systems, engineered fluid loading and transfer equipment and associated aftermarket parts and services. We focus on two basic types of midstream and downstream energy equipment: fluid transfer equipment and liquid ring vacuum pumps and compressors, which are employed in the midstream and downstream markets, respectively.
4
According to Petrochemical Update, North American downstream industry capital expenditures are expected to reach $17.3 billion in 2018, with the maintenance capital expenditure portion for U.S. refineries estimated to increase 39% in 2018 to a total of $1.3 billion. These large investments in midstream and downstream energy end-markets are expected to drive sales of our equipment and future sales of aftermarket parts and services as these facilities age. Further, deferred maintenance of downstream energy infrastructure is expected to drive increased future sales of our replacement products and aftermarket parts and services. Our midstream and downstream products are positioned to capitalize on these large and secularly growing applications, which provide relatively stable demand with attractive, long-term growth potential above GDP.
Petrochemical
Sales to petrochemical end-markets consist of vacuum and compression process systems, both of which are used in harsh, continuous-duty applications.
Demand for our petrochemical industry products correlates with growth in the development of new petrochemical plants as well as activity levels therein, which drive demand for aftermarket parts and services on our market-leading installed base of equipment. According to the American Chemistry Council, U.S. chemical industry capital spending is expected to grow at a 6.2% compound annual growth rate (“CAGR”) from 2017 to 2019. Advancements in the development of unconventional oil and natural gas resources in North America over the past decade have resulted in the abundant availability of locally-sourced natural gas as feedstock for petrochemical plants in North America, supporting long-term growth. In addition, new petrochemical plants are becoming larger and more complex, driving increased demand for more equipment.
Key trends for the Energy segment end-markets include:
|
Upstream
|
Midstream and Downstream
|
Petrochemical
|
|
• Drilled but uncompleted well counts are increasing (82% increase from December 2013 to December 2017)(1)
• Greater percentage of higher-specification drilling rigs (84% in 2017 vs. 53% in 2010)(2) • More wells drilled per rig per year, with increasing lateral lengths per well • Growth in (and increasing profitability of) hydraulic fracturing activity • Increased hydraulic fracturing intensity (4.1 frac stages per 1,000 ft. expected in 2018 vs. 3.2 in 2014)(3) • Greater volume of proppant used per length of lateral |
• Increased production (22% rise in U.S.
oil and gas production from December 2013 to October 2017) • Increased transportation of hydrocarbons • Deferred maintenance capital expenditures • Inclusion in initial specifications and increased size of projects • Increased environmental regulations creating higher cost of spillage and other environmental exposures • Petroleum products export growth |
• Increased production (U.S. chemical
capital spending expected to reach $48 billion by 2022 – more than double 2010 spending)(4) • Inclusion in initial specifications and increased size of projects • Abundant availability of locally-sourced oil and natural gas as feedstock, due to increased domestic U.S. production |
| (1) | U.S. Energy Information Administration, January 2018 |
| (2) | Baker Hughes, Inc., January 19, 2018 |
| (3) | Spears & Associates, Inc., June 2017 |
| (4) | American Chemistry Council, December 2017 |
Medical
The Medical segment designs, manufactures and markets a broad range of flow control products for the durable medical equipment, laboratory vacuum and automated liquid handling end-markets. Key technologies include gas, liquid and precision syringe pumps and compressors and automated liquid handling systems. We have established a history of innovation that enables us to work closely with our customers to create highly customized flow control solutions for their unique applications. These products are mission-critical in the ultimate device in which they are deployed and remain a key component over the entire life cycle of the end products. The regulated market structure and nature of long-tenured customer relationships enables us to have a highly visible, recurring revenue stream from key customers.
We are one of the largest product suppliers in the medical markets we serve. Based on internal estimates, the durable medical equipment pump market represents approximately a $1.2 billion opportunity globally and can
5
be divided into two primary sub-markets: gas pumps and liquid pumps. We estimate the size of the global gas pump market to be approximately $700 million and we estimate the liquid pump market to be a $450 million market globally. Liquid pumps transfer and meter both neutral and chemically aggressive fluids. Further, we believe that overall demand for flow control products and services in the medical space will benefit from attractive secular growth trends, including: (i) aging demographics requiring greater access to medical care; (ii) growth in emerging economies with increased awareness of medical services and greater availability of treatment options; (iii) rising investment in health solutions and safety infrastructures driving demand for medical pump products; (iv) stronger demand for higher healthcare efficiency requiring premium and high performance systems; and (v) increasing demand for durable medical equipment providing significant opportunity for pump products to be incorporated into new applications.
Our Business Transformation from Operational Execution and Strategic Investment
Our top priorities since the KKR Transaction have been creating a performance-driven organization and ensuring superior execution of our operating initiatives in order to transform our business and realize step-change improvements in our commercial and operational capabilities, financial characteristics and performance, pace of innovation and customer service. To support our business transformation, significant investment was dedicated to transformation initiatives across the Company’s three segments, primarily directed toward funding the Company’s growth strategies, further implementation of operational process efficiency actions and permanently reducing operating costs through structural reorganization changes.
Within the Industrials segment, we created an integrated salesforce and established a centralized demand generation team that allows us to maximize revenues across brands, customer accounts and geographies. We also strengthened our customer connectivity by realigning our product engineering and marketing teams into a single global product management structure, and have increased innovation via our new product management process. Furthermore, we significantly increased our profitability by optimizing our footprint and achieving structural cost reductions from back office and administrative areas.
Within the Energy segment, we transformed our upstream energy offering from being predominantly a pump manufacturer into a full-service solutions provider that offers high quality and locally accessible aftermarket support throughout the life cycle of our products. We invested significantly in our sales personnel, marketing strategy, supply chain and manufacturing capabilities, which will allow us to serve our customers better with greater profitability. In particular, we nearly doubled our sales personnel for upstream energy markets since 2012 and increased our service center footprint by 160%, which now covers approximately 85% of U.S. land-based activity. As a result, we believe that we will be even better positioned to capture market share and grow revenues and Segment Adjusted EBITDA independent of the current upstream energy recovery, while positioning ourselves to realize significantly increased sales, profitability and customer responsiveness in the context of the recovery.
The Medical segment was established as a standalone and strategic business in 2013 to accelerate growth, profitability and focused innovation. We upgraded our salesforce and enhanced demand generation efforts to better serve our customers and capture new business, including our recent expansion into automated liquid handling components and systems. Additionally, we also expanded the segment profitability by improving our global sourcing and supply chain strategies and optimizing our global footprint.
The significant operational improvements resulting from the execution of our business transformation initiatives have strengthened performance within each of our segments. We believe the establishment and continued execution of our operational and strategic growth initiatives has positioned our Company for substantial future revenue and Adjusted EBITDA growth, as well as margin expansion.
Our Competitive Strengths
Market Leadership with Strong Brand Portfolio and Reputation Built over 155 Years
With a deep heritage of more than 155 years of leading engineering and application expertise, we believe our portfolio of highly engineered products and proprietary technologies is among the most trusted and recognized in the industry. Our product portfolio is sold under more than 20 well-respected brands, most notably Gardner Denver, CompAir, Nash, Emco Wheaton, Robuschi, Elmo Rietschle and Thomas. By utilizing a multi-brand go-to-market strategy, we leverage each specific brand’s market position in well-defined market
6
segments or geographies. We believe each brand’s reputation for superior quality, reliability, efficiency and responsiveness, along with the often application-critical nature of our products within our customers’ operations, enhances our competitive position in the marketplace and is difficult to replicate given the length of time over which these brand reputations have developed. The strength of our brand portfolio is demonstrated by our leading global market share positions. We believe we have leading market positions within each of our operating segments.
Comprehensive Portfolio of Highly Engineered, Innovative and Application-Critical Equipment
We design, manufacture, market and service a broad array of application-critical flow control and compression equipment for customers seeking targeted solutions for specialized end-markets. Our products typically are part of large, complex systems and represent mission-critical components in the context of the broader systems in which they are utilized. In addition, our products often operate in harsh environments and specialized, precision applications such as in regulated end-markets, where customers require products capable of reliable performance in complex processes. Furthermore, while our products typically represent a low relative cost in the context of the broader applications in which they are employed, the high cost of failure in these applications makes quality and reliability key purchase criteria for end-users and drives demand for highly engineered and differentiated products. As a result, our customers value our product offerings on the basis of superior quality, reliability, efficiency and advanced technology. In addition, we believe the fact that we offer one of the broadest ranges of compressor, pump, vacuum and blower products in our markets allows us to provide differentiated product and service offerings to our customers, and creates incremental business opportunities by enabling us to cross-sell our full product portfolio. Finally, our product engineering teams are continuously enhancing our existing products and developing new applications to strengthen relationships with our growing base of customers that require advanced solutions.
Installed Base and Growing Aftermarket Platform Drives Highly Profitable Recurring Revenues
Our large installed base of products in our Industrials and Energy segments drives demand for recurring aftermarket revenue streams. Due to the critical applications in which our products are used and the high cost of failure or equipment downtime for our customers, we benefit from a consistent and time-sensitive demand for our portfolio of aftermarket parts, as well as service and repair capabilities. In the Industrials segment for example, on average, the life expectancy of a compressor is between 10 and 12 years. However, a customer typically services the compressor at regular intervals, starting within the first two years of purchase and continuing throughout the life of the product. The cumulative aftermarket revenue generated by a compressor over the product’s life cycle will typically exceed its original cost. In the Energy segment, for example, fluid ends, which are key aftermarket parts used in hydraulic fracturing operations, represent approximately 30% of the original cost of the pump and need to be replaced approximately four times per year on each operating pump (depending on the basin and operating nature of the hydraulic fracturing fleet). Other aftermarket parts, such as plungers, and consumables, such as valves, seats and packing, are replaced on even shorter time frames, creating aftermarket opportunities which, in aggregate, are often multiples of the cost of the original pump. Aftermarket sales in 2017 represented approximately 45% of our aggregate Industrials and Energy segments’ revenue.
Diversified Business with Attractive End-markets
Our revenue and earnings are diversified by product, geography, end-market and customer. In addition, we are well-positioned to benefit from secular trends in large, attractive developed economies and fast-growing emerging markets. We believe that our balanced revenue base across end-markets and exposure to early-, mid- and late-cycle growth drivers, along with the specialty nature of the applications on which we focus, enables us to reduce volatility in earnings across economic cycles. Many of our customers operate in attractive end-markets that benefit from secular trends including: (i) continued developed and emerging market growth and infrastructure build; (ii) accelerating land-based U.S. energy activity; (iii) efficiency driven upgrades of industrial systems; (iv) increasing demand for healthcare; (v) increasing complexity of oil and gas extraction; (vi) demand for improved water quality and access; and (vii) heightened environmental regulations. Our value-added services over the life cycle of our products reinforce our customer relationships and position our business for continued growth.
Expertise, Footprint and Expanded Product Portfolio to Capture Recovery in Upstream Energy
Our Energy business manufactures pumps and associated aftermarket parts and consumables used in oil and gas drilling, hydraulic fracturing and well servicing applications. Furthermore, our upstream energy service
7
network now covers approximately 85% of active U.S. land drilling activity as a result of our investment in a 160% increase in our service and repair facility locations since 2012. Even during the recent upstream energy industry downturn, when many of our competitors were closing facilities and cutting back investments, we continued investing in our capabilities within the energy markets. As a result of our investments, as well as our estimated leading global frac pump market position based on new unit sales in the last four years, we believe that we are even better positioned to capture market share and grow revenues and Segment Adjusted EBITDA independent of the upstream energy cycle, while positioning ourselves to realize significantly increased sales, profitability and customer responsiveness in the context of the current upstream energy recovery.
Highly Attractive Financial Profile
We participate in markets with attractive near- and long-term growth trends, and our business generates strong Adjusted EBITDA margins. For the year ended December 31, 2017, each of our segments had Segment Adjusted EBITDA margins above 21%: 21.5% in our Industrials segment, 29.2% in our Energy segment and 27.1% in our Medical segment. The power of our financial profile is evidenced by the Company maintaining approximately the same Adjusted EBITDA margins from 2014 to 2016, despite significant headwinds from external market factors, including the oil and gas depression and foreign exchange. Our financial profile and cash flow generation are further enhanced by our low capital requirements, as demonstrated by our capital expenditures averaging approximately 3% of revenues over the last three years. Our margin profile and low capital intensity have resulted in strong and stable free cash flows that we believe will enable us to continue to reduce our indebtedness, deploy our capital to fund strategic initiatives to drive innovation and organic growth opportunities and finance value-enhancing acquisitions. We believe that our financial profile reflects a strong and attractive business with potential for significant earnings growth over time.
Strength of Our Diverse, Long-Standing Customer Relationships
We serve a large number of well-established blue-chip customers who are globally recognized in the industries in which they operate, as well as regional and local customers, across a wide array of end-markets. In 2017, no single customer represented more than 4% of our total revenues, and our top 10 customers have been with the Company for an average of 20 years, highlighting the strength of our customer relationships. We are known for product quality, reliability, efficiency and superior customer service. These attributes, along with over 155 years of engineering heritage, generate strong brand loyalty for our products and foster long-standing customer relationships.
Strategically Positioned Global Manufacturing Footprint
We have one of the most extensive manufacturing and service networks in the industry with 39 key manufacturing facilities and an expansive network of more than 30 complementary service and repair centers across six continents as of March 31, 2018. We believe our extensive manufacturing and service footprint is a competitive advantage that allows us to source new business, provide superior customer service and more efficiently develop new products to serve our customers’ needs. Our expansive global footprint also allows us to optimize our manufacturing cost structure, by combining local manufacturing assets with the capability to leverage our footprint in lower cost geographies. We believe our worldwide presence enables us to provide timely and responsive support to our customers, many of whom operate internationally, and to capitalize on growth opportunities in both developed and emerging markets. Because of the critical nature of the applications in which our products are used, expedient response times are important to capturing and retaining our customers’ business.
Proven Strategy to Drive Operational Excellence
Our top priorities since the KKR Transaction have been creating a performance-driven culture and ensuring superior execution of our operating initiatives in order to transform our business and realize step-change improvements in our commercial and operational capabilities, financial characteristics and performance, pace of innovation and customer service. The implementation of our operational excellence initiatives has significantly improved our performance. We view operational excellence as a holistic approach to continuous improvement that spans our entire organization from manufacturing to sales and marketing to customer service. We believe this approach will drive strong revenue and earnings growth.
8
Highly Experienced Management Team with Track Record of Success
We invested in attracting a high-caliber senior management team with an average of 25 years of experience in relevant industries. In addition, 45% of our top 100 business managers, including the senior management team, have joined the Company since the KKR Transaction, which we believe added a significant new level of talent to our leadership team. We believe our current management team comprises individuals with the extensive operational, financial and managerial experience needed to effectively navigate the key opportunities and challenges facing our business today and has been responsible for developing and executing our business transformation. Our management team has a demonstrated track record of growth via operational improvements and strategic growth initiatives, and we believe that we have a strong, deep bench of talented leaders who are well-positioned to continue driving the Company towards profitable growth and margin expansion.
Our Growth Strategies
We intend to continue to drive shareholder value through the pursuit of best-in-class financial performance, consistent improvement in profitability and our ability to develop and retain world-class talent. Across all three of our segments, our comprehensive strategy to drive strong revenue and earnings growth is centered on five primary objectives: (i) enhancing commercial leadership by expanding our sales and service presence, adding product line adjacencies and accelerating our innovation funnel; (ii) driving aftermarket sales penetration of our large installed base; (iii) further improving our competitive position with our customers through salesforce effectiveness programs; (iv) executing our operational excellence initiatives to streamline our cost structure and support margin expansion, including through manufacturing footprint optimization, administrative expense efficiency and strategic sourcing; and (v) pursuing acquisitions focused on bolstering our product offerings and/or geographic or market presence. Specifically, we intend to focus on four primary growth strategies.
Accelerate Industrials Growth through Salesforce Effectiveness and Innovation and Drive Continued Margin Expansions by Focusing on Operational Excellence
Our salesforce effectiveness initiatives continue to support our ability to be increasingly responsive to our customers and cross-sell our comprehensive portfolio of market-leading products and services into existing and new applications. In addition, our demand generation platform allows for increased connectivity with our customer base, as we are utilizing integrated technology to develop more actionable leads for our salesforce. Over time, we expect these efforts to enhance product awareness and generate new customer wins. We also expect to expand our market share by growing in key emerging markets, specifically Asia, the Middle East and South America, which were previously underserved regions for the Industrials segment. In addition, the redesigned approach to product management within the Industrials segment is resulting in a greater pace of innovation leading to a growing pipeline of new products that we expect to commercialize over the coming years. Supplementing our commercial and innovation efforts is a focus on continued margin expansion. We are building upon our global operational excellence programs with a distinct focus on simplifying the way we conduct business. We believe we have significant potential for near- and long-term revenue and earnings growth and margin expansion through the continued execution of these initiatives.
Capitalize on Transformative Investments in Our Energy Segment and Benefit from a Recovery in Key Energy Markets
We optimized our Energy segment footprint and business model to sustain profitability while enhancing the upside of our earnings capacity in an upstream energy recovery. As a result of our substantial investment in the capabilities of our upstream energy business, we believe that we significantly increased our addressable market and overall earnings capacity relative to like-for-like activity levels in the 2014 and prior time period. Independent of the current upstream energy recovery, we believe that we are poised to capture favorable trends including pent-up demand for repairs and new parts due to deferred maintenance during the downturn, a significant wave of replacement demand from pumps installed over five years ago and share gain due to our enhanced presence and new product capabilities. In the context of the upstream energy recovery, we believe that these factors will contribute to driving even more growth upside than from the activity growth alone, and that we will generate substantially more revenue and profitability given our increased earnings capacity and operational improvements, such as the expansion of our service network. In the midstream, downstream and process industries, we believe our business will benefit from attractive long-term secular trends, including the increased global movement of hydrocarbons and other liquid commodities and expanded capacity of process industries.
9
Accelerate Growth and Enhance Market Share and Industry Presence of Our Medical Segment
We strategically invested in our Medical segment in order to expand sales and profitability. We believe a combination of our enhanced sales force, improved demand creation and recently implemented CRM platform, combined with our global manufacturing and sales footprint, will continue to position our Company to expand market share. Building on our strength in gas pump applications, we recently expanded into the liquid pump and automated liquid handling markets to gain share in sizable markets that were previously unaddressed by us. We view this space as an attractive adjacency to our existing strategy and one in which we are able to capture share in line with current operations in the gas pump market, building momentum and scale for our Medical business.
Pursue Complementary Acquisitions
In addition to our organic initiatives for each of our segments, we plan to pursue select strategic acquisition opportunities as part of our growth strategy. Our markets are fragmented and there is opportunity for continued consolidation within our industrial, energy and medical markets. Based on management estimates, approximately half of each such market consists of smaller players who maintain less than 5% market share. We have consistently employed a disciplined approach to acquisitions focused on opportunities that (i) strengthen our existing portfolio through the addition of new technologies, (ii) allow us to establish new flow control platforms in attractive markets, (iii) enhance our aftermarket offerings, (iv) grow our presence in strategic geographies, such as select emerging markets and/or (v) provide opportunity to realize synergies while expanding or strengthening our capabilities.
Risks Related to Our Business and this Offering
Investing in our common stock involves substantial risk, and our ability to successfully operate our business is subject to numerous risks. Risk factors related to our business include the following:
| • | We have exposure to the risks associated with instability in the global economy and financial markets, which may negatively impact our revenues, liquidity, suppliers and customers. |
| • | More than half of our sales and operations are in non-U.S. jurisdictions and we are subject to the economic, political, regulatory and other risks of international operations. |
| • | Our revenues and operating results, especially in the Energy segment, depend on the level of activity in the energy industry, which is significantly affected by volatile oil and gas prices. |
| • | Our results of operations are subject to exchange rate and other currency risks. A significant movement in exchange rates could adversely impact our results of operations and cash flows. |
| • | Potential governmental regulations restricting the use, and increased public attention to and litigation regarding the impacts, of hydraulic fracturing or other processes on which it relies could reduce demand for our products. |
| • | We face competition in the markets we serve, which could materially and adversely affect our operating results. |
| • | Large or rapid increases in the cost of raw materials and component parts, substantial decreases in their availability, or our dependence on particular suppliers of raw materials and component parts could materially and adversely affect our operating results. |
| • | Our operating results could be adversely affected by a loss or reduction of business with key customers or consolidation or the vertical integration of our customer base. |
| • | Our ongoing and expected restructuring plans and other cost savings initiatives may not be as effective as we anticipate, and we may fail to realize the cost savings and increased efficiencies that we expect to result from these actions. Our operating results could be negatively affected by our inability to effectively implement such restructuring plans and other cost savings initiatives. |
| • | Our success depends on our executive management and other key personnel. |
| • | If we are unable to develop new products and technologies, our competitive position may be impaired, which could materially and adversely affect our sales and market share. |
10
Any of the factors set forth under “Risk Factors” may limit our ability to successfully execute our business strategy. You should carefully consider all of the information set forth in this prospectus and the documents incorporated by reference herein and, in particular, should evaluate the specific factors set forth under “Risk Factors” in deciding whether to invest in our common stock.
Corporate History and Information
On July 30, 2013, we were acquired by an affiliate of the Sponsor, pursuant to an agreement and plan of merger among Gardner Denver Holdings, Inc. (formerly known as Renaissance Parent Corp.), Renaissance Acquisition Corp. and Gardner Denver, Inc. Total cash consideration payable in connection with the KKR Transaction was approximately $3.8 billion. Gardner Denver Holdings, Inc. was incorporated in Delaware on March 1, 2013 by affiliates of the Sponsor.
Our principal executive offices are located at 222 East Erie Street, Milwaukee, Wisconsin 53202, Suite 500. The telephone number of our principal executive offices is (414) 212-4700. Our Internet address is www.gardnerdenver.com. Information on our web site is not incorporated by reference into this prospectus and does not constitute part of this prospectus.
About Our Sponsor
Founded in 1976 and led by Henry Kravis and George Roberts, KKR & Co. is a leading investment firm with $168.5 billion in assets under management as of December 31, 2017. With offices around the world, KKR & Co. manages assets through a variety of investment funds and accounts covering multiple asset classes. KKR & Co. seeks to create value by bringing operational expertise to its portfolio companies and through active oversight and monitoring of its investments. KKR & Co. complements its investment expertise and strengthens interactions with investors through its client relationships and capital markets platforms. KKR & Co. has been an active investor in the U.S. industrials sector since 2010, having acquired Capsugel, Capital Safety, Gardner Denver, The Crosby Group and CHI Overhead Doors for an aggregate purchase price of approximately $9.1 billion and total equity capital invested of approximately $3.6 billion. KKR & Co. L.P. is publicly traded on The New York Stock Exchange (NYSE: KKR). Investment funds associated with our Sponsor currently beneficially own approximately 61.4% of our common stock and will own approximately 50.3% of our common stock after the completion of this offering (48.6% if the underwriters exercise their option to purchase additional shares in full).
11
The Offering
Unless we indicate otherwise or the context otherwise requires, this prospectus reflects and assumes no exercise by the underwriters of their option to purchase 3,313,690 additional shares of our common stock.
Additionally, the number of shares of our common stock to be outstanding after this offering is based on the number of shares of our common stock outstanding as of March 31, 2018 and excludes: 11,515,460 shares of common stock issuable upon the exercise of options outstanding as of March 31, 2018 at a weighted average
12
exercise price of $9.65 per share; 842,730 shares of common stock that may be issued upon the exercise of stock appreciation rights (“SARs”) outstanding as of March 31, 2018 at a weighted average strike price of $8.65 per share, although we currently expect 143,327 SARs to be settled in shares and all other SARs to be settled in cash; and 4,483,739 shares of common stock issuable upon the settlement of deferred stock units (“DSUs”) to be settled in shares, in each case granted under our 2013 Stock Incentive Plan (the “2013 Stock Incentive Plan”). Also excluded are 765,578 shares of common stock issuable upon the exercise of options outstanding as of March 31, 2018 at a weighted average exercise price of $32.06 per share and 337,316 shares of common stock issuable upon the vesting of restricted stock units (“RSUs”) to be settled in shares, in each case granted under our 2017 Omnibus Incentive Plan (the “2017 Stock Incentive Plan”). There is a remainder of 7,913,462 shares of common stock reserved for issuance under our 2017 Omnibus Incentive Plan (the “2017 Stock Incentive Plan”). These grant amounts will be translated into a number of shares of restricted stock and stock options by taking such dollar amount and dividing it by the per share or per option “fair value” that will be used for reporting the compensation expense associated with the grant under applicable accounting guidance, which “fair value” will be based in part on the per share closing price of our common stock on the NYSE on the date of grant. See “Item 11. Executive Compensation—Compensation Discussion and Analysis” in our Annual Report on Form 10-K incorporated by reference in this prospectus for more information.
13
Summary Historical Consolidated Financial and Other Data
Set forth below is our summary historical consolidated financial and other data as of the dates and for the periods indicated. The summary historical financial data as of December 31, 2017 and 2016 and for the years ended December 31, 2017, 2016 and 2015 have been derived from our audited consolidated financial statements and related notes thereto incorporated by reference in this prospectus. The summary historical consolidated financial data as of March 31, 2018 and for each of the three months ended March 31, 2018 and March 31, 2017 have been derived from our unaudited condensed consolidated financial statements and related notes thereto incorporated by reference in this prospectus, which have been prepared on the same basis as our audited consolidated financial statements. The results of operations for any period are not necessarily indicative of the results to be expected for any future period. See “Risk Factors” and the notes to our consolidated financial statements incorporated by reference in this prospectus.
The summary historical consolidated financial and other data should be read in conjunction with, and are qualified by reference to, “Selected Historical Consolidated Financial Data” and “Management’s Discussion and Analysis of Financial Condition and Results of Operations” contained in our Annual Report and in our Quarterly Report and our consolidated financial statements and related notes thereto incorporated by reference in this prospectus.
|
|
For the Three Months Ended
March 31, |
Year Ended December 31,
|
|||||||||||||
|
|
|||||||||||||||
|
(in millions, except per share amounts)
|
2018
|
2017
|
2017
|
2016
|
2015
|
||||||||||
|
Consolidated Statements of Operations:
|
|
|
|
|
|
|
|
|
|
|
|
|
|
|
|
|
Revenues
|
$
|
619.6
|
|
$
|
481.7
|
|
$
|
2,375.4
|
|
$
|
1,939.4
|
|
$
|
2,126.9
|
|
|
Cost of sales
|
|
387.7
|
|
|
307.1
|
|
|
1,477.5
|
|
|
1,222.7
|
|
|
1,347.8
|
|
|
Gross profit
|
|
231.9
|
|
|
174.6
|
|
|
897.9
|
|
|
716.7
|
|
|
779.1
|
|
|
Selling and administrative expenses(1)
|
|
106.9
|
|
|
102.3
|
|
|
446.6
|
|
|
414.3
|
|
|
427.0
|
|
|
Amortization of intangible assets
|
|
30.9
|
|
|
27.6
|
|
|
118.9
|
|
|
124.2
|
|
|
115.4
|
|
|
Impairment of goodwill
|
|
—
|
|
|
—
|
|
|
—
|
|
|
—
|
|
|
343.3
|
|
|
Impairment of other intangible assets
|
|
—
|
|
|
—
|
|
|
1.6
|
|
|
25.3
|
|
|
78.1
|
|
|
Other operating expense, net
|
|
4.3
|
|
|
7.9
|
|
|
222.1
|
|
|
48.6
|
|
|
20.7
|
|
|
Operating income (loss)
|
|
89.8
|
|
|
36.8
|
|
|
108.7
|
|
|
104.3
|
|
|
(205.4
|
)
|
|
Interest expense
|
|
26.0
|
|
|
45.9
|
|
|
140.7
|
|
|
170.3
|
|
|
162.9
|
|
|
Loss on extinguishment of debt
|
|
—
|
|
|
—
|
|
|
84.5
|
|
|
—
|
|
|
—
|
|
|
Other income, net(1)
|
|
(2.0
|
)
|
|
(0.5
|
)
|
|
(3.8
|
)
|
|
(2.8
|
)
|
|
(1.6
|
)
|
|
Income (loss) before income taxes
|
|
65.8
|
|
|
(8.6
|
)
|
|
(112.7
|
)
|
|
(63.2
|
)
|
|
(366.7
|
)
|
|
Provision (benefit) for income taxes
|
|
23.4
|
|
|
(1.6
|
)
|
|
(131.2
|
)
|
|
(31.9
|
)
|
|
(14.7
|
)
|
|
Net income (loss)
|
|
42.4
|
|
|
(7.0
|
)
|
|
18.5
|
|
|
(31.3
|
)
|
|
(352.0
|
)
|
|
Less: Net income (loss) attributable to noncontrolling interests
|
|
—
|
|
|
0.1
|
|
|
0.1
|
|
|
5.3
|
|
|
(0.8
|
)
|
|
Net income (loss) attributable to Gardner Denver Holdings, Inc.
|
$
|
42.4
|
|
$
|
(7.1
|
)
|
$
|
18.4
|
|
$
|
(36.6
|
)
|
$
|
(351.2
|
)
|
|
Basic earnings (loss) per share
|
$
|
0.21
|
|
$
|
(0.05
|
)
|
$
|
0.10
|
|
$
|
(0.25
|
)
|
$
|
(2.35
|
)
|
|
Diluted earnings (loss) per share
|
$
|
0.20
|
|
$
|
(0.05
|
)
|
$
|
0.10
|
|
$
|
(0.25
|
)
|
$
|
(2.35
|
)
|
|
|
|
|
|
|
|
|
|
|
|
|
|
|
|
|
|
|
Weighted average shares outstanding:
|
|
|
|
|
|
|
|
|
|
|
|
|
|
|
|
|
Basic
|
|
201.6
|
|
|
148.5
|
|
|
182.2
|
|
|
149.2
|
|
|
149.6
|
|
|
Diluted
|
|
209.9
|
|
|
148.5
|
|
|
188.4
|
|
|
149.2
|
|
|
149.6
|
|
|
|
|
|
|
|
|
|
|
|
|
|
|
|
|
|
|
|
Statement of Cash Flow Data:
|
|
|
|
|
|
|
|
|
|
|
|
|
|
|
|
|
Cash flows – operating activities
|
$
|
60.2
|
|
$
|
(2.6
|
)
|
$
|
200.5
|
|
$
|
165.6
|
|
$
|
172.1
|
|
|
Cash flows – investing activities
|
|
(102.0
|
)
|
|
(16.6
|
)
|
|
(60.8
|
)
|
|
(82.1
|
)
|
|
(84.0
|
)
|
|
Cash flows – financing activities
|
|
(8.2
|
)
|
|
(13.3
|
)
|
|
(17.4
|
)
|
|
(43.0
|
)
|
|
(35.0
|
)
|
|
|
|
|
|
|
|
|
|
|
|
|
|
|
|
|
|
|
Balance Sheet Data (at period end):
|
|
|
|
|
|
|
|
|
|
|
|
|
|
|
|
|
Cash and cash equivalents
|
$
|
353.8
|
|
|
|
|
$
|
393.3
|
|
$
|
255.8
|
|
$
|
228.3
|
|
|
Total assets
|
|
4,775.4
|
|
|
|
|
|
4,621.2
|
|
|
4,316.0
|
|
|
4,462.0
|
|
|
Total liabilities
|
|
3,207.7
|
|
|
|
|
|
3,144.4
|
|
|
4,044.2
|
|
|
4,056.5
|
|
|
Total stockholders’ equity
|
|
1,567.7
|
|
|
|
|
|
1,476.8
|
|
|
271.8
|
|
|
405.5
|
|
|
|
|
|
|
|
|
|
|
|
|
|
|
|
|
|
|
|
Other Financial Data
|
|
|
|
|
|
|
|
|
|
|
|
|
|
|
|
|
Adjusted EBITDA(2)
|
$
|
148.2
|
|
$
|
92.1
|
|
$
|
561.5
|
|
$
|
400.7
|
|
$
|
418.9
|
|
|
Adjusted Net Income(2)
|
|
80.7
|
|
|
20.1
|
|
|
249.3
|
|
|
133.6
|
|
|
128.1
|
|
|
Capital expenditures
|
|
10.1
|
|
|
16.4
|
|
|
56.8
|
|
|
74.4
|
|
|
71.0
|
|
|
Free Cash Flow(2)
|
|
50.1
|
|
|
(19.0
|
)
|
|
143.7
|
|
|
91.2
|
|
|
101.1
|
|
14
| (1) | In the first quarter of fiscal year 2018, the Company adopted the provisions of ASU 2017-07, Compensation — Retirement Benefits (Topic 715): Improving the Presentation of Net Periodic Pension Cost and Net periodic Postretirement Benefit Cost (“ASU 2017-07”). The following table summarizes the impacts of the retrospective adoption of ASU 2017-07 on the Company’s consolidated financial statements incorporated by reference in this prospectus. |
|
|
Year Ended December 31,
|
||||||||
|
(in millions)
|
2017
|
2016
|
2015
|
||||||
|
Selling and administrative expenses, as reported
|
$
|
446.6
|
|
$
|
414.3
|
|
$
|
427.0
|
|
|
Adjustments
|
|
(0.4
|
)
|
|
0.8
|
|
|
4.0
|
|
|
Selling and administrative expenses, as adjusted
|
$
|
446.2
|
|
$
|
415.1
|
|
$
|
431.0
|
|
|
|
Year Ended December 31,
|
||||||||
|
(in millions)
|
2017
|
2016
|
2015
|
||||||
|
Other income, net, as reported
|
$
|
(3.8
|
)
|
$
|
(2.8
|
)
|
$
|
(1.6
|
)
|
|
Adjustments
|
|
0.4
|
|
|
(0.8
|
)
|
|
(4.0
|
)
|
|
Other income, net, as adjusted
|
$
|
(3.4
|
)
|
$
|
(3.6
|
)
|
$
|
(5.6
|
)
|
| (2) | We report our financial results in accordance with generally accepted accounting principles in the United States (“GAAP”). To supplement this information, we also use the following measures in this prospectus: “Adjusted EBITDA,” “Adjusted Net Income” and “Free Cash Flow.” Management believes that Adjusted EBITDA and Adjusted Net Income are helpful supplemental measures to assist us and investors in evaluating our operating results as they exclude certain items whose fluctuation from period to period do not necessarily correspond to changes in the operations of our business. Adjusted EBITDA represents net (loss) income before interest, taxes, depreciation and amortization, as further adjusted to exclude certain non-cash, non-recurring and other adjustment items. We believe that the adjustments applied in presenting Adjusted EBITDA are appropriate to provide additional information to investors about certain material non-cash items and about non-recurring items that we do not expect to continue at the same level in the future. Adjusted Net Income is defined as net income (loss) including interest, depreciation and amortization of non-acquisition related intangible assets and excluding other items used to calculate Adjusted EBITDA and further adjusted for the tax effect of these exclusions. |
We use Free Cash Flow to review the liquidity of our operations. We measure Free Cash Flow as cash flows from operating activities less capital expenditures. We believe Free Cash Flow is a useful supplemental financial measure for us and investors in assessing our ability to pursue business opportunities and investments and to service our debt. Free Cash Flow is not a measure of our liquidity under GAAP and should not be considered as an alternative to cash flows from operating activities.
As a result, we and our board of directors regularly use these measures as tools in evaluating our operating and financial performance and in establishing discretionary annual compensation. Such measures are provided in addition to, and should not be considered to be a substitute for, or superior to, the comparable measure under GAAP. In addition, we believe that Adjusted EBITDA, Adjusted Net Income and Free Cash Flow are frequently used by investors, analysts and other interested parties in the evaluation of issuers, many of which also present Adjusted EBITDA, Adjusted Net Income and Free Cash Flow when reporting their results in an effort to facilitate an understanding of their operating and financial results and liquidity. Other companies in our industry may calculate Adjusted EBITDA, Adjusted Net Income and Free Cash Flow differently from us, limiting their usefulness as comparative measures.
Adjusted EBITDA, Adjusted Net Income and Free Cash Flow should not be considered as alternatives to net income (loss) or other performance measures calculated in accordance with GAAP, or as alternatives to cash flow from operating activities as a measure of our liquidity. Adjusted EBITDA, Adjusted Net Income and Free Cash Flow have limitations as analytical tools, and you should not consider such measures either in isolation or as substitutes for analyzing our results as reported under GAAP.
15
Set forth below are the reconciliations of net income (loss) to Adjusted EBITDA and Adjusted Net Income and cash flows from operating activities to Free Cash Flow.
|
|
For the Three Months Ended
March 31, |
Year Ended December 31,
|
|||||||||||||
|
(in millions)
|
2018
|
2017
|
2017
|
2016
|
2015
|
||||||||||
|
Net income (loss)
|
$
|
42.4
|
|
$
|
(7.0
|
)
|
$
|
18.5
|
|
$
|
(31.3
|
)
|
$
|
(352.0
|
)
|
|
Plus:
|
|
|
|
|
|
|
|
|
|
||||||
|
Interest expense
|
|
26.0
|
|
|
45.9
|
|
|
140.7
|
|
|
170.3
|
|
|
162.9
|
|
|
Provision (benefit) for income taxes
|
|
23.4
|
|
|
(1.6
|
)
|
|
(131.2
|
)
|
|
(31.9
|
)
|
|
(14.7
|
)
|
|
Depreciation expense
|
|
14.1
|
|
|
12.1
|
|
|
54.9
|
|
|
48.5
|
|
|
47.6
|
|
|
Amortization expense(a)
|
|
30.9
|
|
|
27.6
|
|
|
118.9
|
|
|
124.2
|
|
|
115.4
|
|
|
Impairment of goodwill and other intangible assets(b)
|
|
—
|
|
|
—
|
|
|
1.6
|
|
|
25.3
|
|
|
421.4
|
|
|
Sponsor fees and expenses(c)
|
|
—
|
|
|
1.1
|
|
|
17.3
|
|
|
4.8
|
|
|
4.6
|
|
|
Restructuring and related business transformation costs(d)
|
|
4.5
|
|
|
8.6
|
|
|
24.7
|
|
|
78.7
|
|
|
31.4
|
|
|
Acquisition related expenses and non-cash charges(e)
|
|
4.6
|
|
|
0.7
|
|
|
4.1
|
|
|
4.3
|
|
|
4.8
|
|
|
Environmental remediation loss reserve(f)
|
|
—
|
|
|
1.0
|
|
|
0.9
|
|
|
5.6
|
|
|
—
|
|
|
Expenses related to public stock offerings(g)
|
|
1.4
|
|
|
1.3
|
|
|
4.1
|
|
|
—
|
|
|
—
|
|
|
Establish public company financial reporting compliance(h)
|
|
0.8
|
|
|
1.3
|
|
|
8.1
|
|
|
0.2
|
|
|
—
|
|
|
Stock-based compensation(i)
|
|
2.7
|
|
|
—
|
|
|
194.2
|
|
|
—
|
|
|
—
|
|
|
Loss on extinguishment of debt(j)
|
|
—
|
|
|
—
|
|
|
84.5
|
|
|
—
|
|
|
—
|
|
|
Foreign currency transaction losses (gains), net
|
|
2.6
|
|
|
0.6
|
|
|
9.3
|
|
|
(5.9
|
)
|
|
1.1
|
|
|
Shareholder litigation settlement recoveries(k)
|
|
(4.5
|
)
|
|
—
|
|
|
—
|
|
|
—
|
|
|
—
|
|
|
Other adjustments(l)
|
|
(0.7
|
)
|
|
0.5
|
|
|
10.9
|
|
|
7.9
|
|
|
(3.6
|
)
|
|
Adjusted EBITDA
|
$
|
148.2
|
|
$
|
92.1
|
|
$
|
561.5
|
|
$
|
400.7
|
|
$
|
418.9
|
|
|
Minus:
|
|
|
|
|
|
|
|
|
|
|
|
|
|
|
|
|
Interest expense
|
$
|
26.0
|
|
$
|
45.9
|
|
|
140.7
|
|
|
170.3
|
|
|
162.9
|
|
|
Income tax provision, as adjusted(m)
|
|
24.5
|
|
|
12.2
|
|
|
105.4
|
|
|
34.7
|
|
|
71.9
|
|
|
Depreciation expense
|
|
14.1
|
|
|
12.1
|
|
|
54.9
|
|
|
48.5
|
|
|
47.6
|
|
|
Amortization of non-acquisition related intangible assets
|
|
2.9
|
|
|
1.8
|
|
|
11.2
|
|
|
13.6
|
|
|
8.4
|
|
|
Adjusted Net Income
|
$
|
80.7
|
|
$
|
20.1
|
|
$
|
249.3
|
|
$
|
133.6
|
|
$
|
128.1
|
|
|
Free Cash Flow
|
|
|
|
|
|
|
|
|
|
|
|
|
|
|
|
|
Cash flows – operating activities
|
$
|
60.2
|
|
$
|
(2.6
|
)
|
$
|
200.5
|
|
$
|
165.6
|
|
$
|
172.1
|
|
|
Minus:
|
|
|
|
|
|
|
|
|
|
|
|
|
|
|
|
|
Capital expenditures
|
|
10.1
|
|
|
16.4
|
|
|
56.8
|
|
|
74.4
|
|
|
71.0
|
|
|
Free Cash Flow
|
$
|
50.1
|
|
$
|
(19.0
|
)
|
$
|
143.7
|
|
$
|
91.2
|
|
$
|
101.1
|
|
| (a) | Represents $28.0 million, $25.8 million, $107.7 million, $110.6 million and $107.0 million of amortization of intangible assets arising from the KKR Transaction and other acquisitions (customer relationships and trademarks) and $2.9 million, $1.8 million, $11.2 million, $13.6 million and $8.4 million of amortization of non-acquisition related intangible assets, in each case for the three months ended March 31, 2018, the three months ended March 31, 2017 and the years ended 2017, 2016 and 2015, respectively. |
| (b) | Represents non-cash charges for impairment of goodwill and other intangible assets. |
| (c) | Represents management fees paid to our Sponsor pursuant to a monitoring agreement, which was terminated on May 17, 2017. See “Certain Relationships and Related Party Transactions—Arrangements with Our Sponsor—Monitoring Agreement.” |
| (d) | Restructuring and related business transformation costs consist of the following: |
|
|
For the Three Months Ended
March 31, |
Year Ended December 31,
|
|||||||||||||
|
(in millions)
|
2018
|
2017
|
2017
|
2016
|
2015
|
||||||||||
|
Restructuring charges
|
$
|
—
|
|
$
|
1.7
|
|
$
|
5.3
|
|
$
|
32.9
|
|
$
|
4.7
|
|
|
Severance, sign-on, relocation and executive search costs
|
|
2.0
|
|
|
1.0
|
|
|
3.5
|
|
|
22.4
|
|
|
18.4
|
|
|
Facility reorganization, relocation and other costs
|
|
0.6
|
|
|
1.1
|
|
|
5.3
|
|
|
8.7
|
|
|
1.6
|
|
|
Information technology infrastructure transformation
|
|
—
|
|
|
0.7
|
|
|
5.2
|
|
|
2.3
|
|
|
—
|
|
|
(Gains) losses on asset and business disposals
|
|
(1.2
|
)
|
|
3.0
|
|
|
0.8
|
|
|
0.1
|
|
|
(4.5
|
)
|
|
Consultant and other advisor fees
|
|
2.6
|
|
|
0.4
|
|
|
1.7
|
|
|
9.7
|
|
|
10.1
|
|
|
Other, net
|
|
0.5
|
|
|
0.7
|
|
|
2.9
|
|
|
2.6
|
|
|
1.1
|
|
|
Total restructuring and related business transformation costs
|
$
|
4.5
|
|
$
|
8.6
|
|
$
|
24.7
|
|
$
|
78.7
|
|
$
|
31.4
|
|
16
| (e) | Represents costs associated with successful and/or abandoned acquisitions, including third-party expenses, post-closure integration costs and non-cash charges and credits arising from fair value purchase accounting adjustments. |
| (f) | Represents estimated environmental remediation costs and losses relating to a former production facility. |
| (g) | Represents certain expenses related to the Company’s initial public offering and subsequent secondary offerings. |
| (h) | Represents third party expenses to comply with the requirements of Sarbanes-Oxley in 2018 and the accelerated adoption of the new revenue recognition standard (ASC 606 - Revenue from Contracts with Customers) in the first quarter of 2018, one year ahead of the required adoption date for a private company. These expenses were previously included in “Expenses related to initial public offering” and prior periods have been restated to conform to current period presentation. |
| (i) | For the three months ended March 31, 2018, represents stock-based compensation expense recognized of $3.4 million reduced by a $0.7 million decrease in the accrual for employer taxes related to DSUs granted to employees at the date of the initial public offering. For the year ended December 31, 2017, represents stock-based compensation expense recognized for stock options outstanding ($77.6 million), DSUs granted to employees at the date of the initial public offering ($97.4 million) under the 2013 Stock Incentive Plan and employer taxes related to DSUs granted to employees at the date of the initial public offering ($19.2 million). Prior to the Company’s initial public offering, which occurred in May 2017, no stock compensation was recorded because the Company’s repurchase rights created an implicit service period. |
| (j) | Represents losses on extinguishment of debt recognized on the redemption of the senior notes and pay down of a portion of the Original Dollar Term Loan Facility with proceeds from the initial public offering in May 2017 ($50.4 million) and in connection with the refinancing of the Original Dollar Term Loan Facility and Original Euro Term Loan Facility in August 2017 ($34.1 million). |
| (k) | Represents an insurance recovery of the Company’s shareholder litigation settlement in 2014. |
| (l) | Includes (i) non-cash impact of net LIFO reserve adjustments, (ii) effects of amortization of prior service costs and amortization of gains in pension and other postemployment benefits (OPEB) expense, (iii) certain legal and compliance costs and (iv) other miscellaneous adjustments. |
| (m) | Represents our income tax provision adjusted for the tax effect of pre-tax items excluded from Adjusted Net Income and the removal of the applicable discrete tax items. The tax effect of pre-tax items excluded from Adjusted Net Income is computed using the statutory tax rate related to the jurisdiction that was impacted by the adjustment after taking into account the impact of permanent differences and valuation allowances. Discrete tax items include changes in tax laws or rates, changes in uncertain tax positions relating to prior years and changes in valuation allowances. All impacts relating to the U.S. Tax Act have been included as an adjustment in the table below. |
Income tax provisions, as adjusted for each of the periods presented below consists of the following:
|
|
For the Three Months Ended
March 31, |
Year Ended December 31,
|
|||||||||||||
|
(in millions)
|
2018
|
2017
|
2017
|
2016
|
2015
|
||||||||||
|
Provision (benefit) for income taxes
|
$
|
23.4
|
|
$
|
(1.6
|
)
|
$
|
(131.2
|
)
|
$
|
(31.9
|
)
|
$
|
(14.7
|
)
|
|
Tax impact of pre-tax income adjustments
|
|
8.9
|
|
|
12.8
|
|
|
139.3
|
|
|
71.8
|
|
|
76.7
|
|
|
Tax law change
|
|
(7.9
|
)
|
|
—
|
|
|
95.3
|
|
|
—
|
|
|
—
|
|
|
Discrete tax items
|
|
0.1
|
|
|
1.0
|
|
|
2.0
|
|
|
(5.2
|
)
|
|
9.9
|
|
|
Income tax provision, as adjusted
|
$
|
24.5
|
|
$
|
12.2
|
|
$
|
105.4
|
|
$
|
34.7
|
|
$
|
71.9
|
|
17
An investment in our common stock involves risk. You should carefully consider the following risks as well as the other information included and incorporated by reference in this prospectus, including “Selected Historical Consolidated Financial Data” and “Management’s Discussion and Analysis of Financial Condition and Results of Operations” contained in our Annual Report and in our Quarterly Report and our consolidated financial statements and related notes thereto incorporated by reference in this prospectus, before investing in our common stock. Any of the following risks could materially and adversely affect our business, financial condition or results of operations. The selected risks described below, however, are not the only risks facing us. Additional risks and uncertainties not currently known to us or those we currently view to be immaterial may also materially and adversely affect our business, financial condition or results of operations. In such a case, the trading price of the common stock could decline and you may lose all or part of your investment.
Risks Related to Our Business
We have exposure to the risks associated with instability in the global economy and financial markets, which may negatively impact our revenues, liquidity, suppliers and customers.
Our financial performance depends, in large part, on conditions in the markets we serve and on the general condition of the global economy, which impacts these markets. Any sustained weakness in demand for our products and services resulting from a contraction or uncertainty in the global economy could adversely impact our revenues and profitability.
In addition, we believe that many of our suppliers and customers access global credit markets to provide liquidity, and in some cases, utilize external financing to purchase products or finance operations. If our customers are unable to access credit markets or lack liquidity, it may impact customer demand for our products and services.
Furthermore, our products are sold in many industries, some of which are cyclical and may experience periodic contractions. For example, weakness in upstream energy activity in North America significantly impacted our business in 2015 and 2016. Cyclical weakness in the industries that we serve could adversely affect demand for our products and affect our profitability and financial performance.
More than half of our sales and operations are in non-U.S. jurisdictions and we are subject to the economic, political, regulatory and other risks of international operations.
For the year ended December 31, 2017, approximately 56% of our revenues were from customers in countries outside of the United States. We have manufacturing facilities in Germany, the United Kingdom, China, Finland, Italy, India and other countries. We intend to continue to expand our international operations to the extent that suitable opportunities become available. Non-U.S. operations and United States export sales could be adversely affected as a result of: political or economic instability in certain countries; differences in foreign laws, including increased difficulties in protecting intellectual property and uncertainty in enforcement of contract rights; credit risks; currency fluctuations, in particular, changes in currency exchange rates between the U.S. dollar, Euro, British Pound and the Chinese Renminbi; exchange controls; changes in tariff restrictions; significant changes in import/export trade restrictions; royalty and tax increases; nationalization of private enterprises; civil unrest and protests, strikes, acts of terrorism, war or other armed conflict; shipping products during times of crisis or war; and other factors inherent in foreign operations.
In addition, our expansion into new countries may require significant resources and the efforts and attention of our management and other personnel, which will divert resources from our existing business operations. As we expand our business globally, our success will depend, in large part, on our ability to anticipate and effectively manage these risks associated with our international operations.
Our revenues and operating results, especially in the Energy segment, depend on the level of activity in the energy industry, which is significantly affected by volatile oil and gas prices.
Demand for certain products of our Energy segment, particularly in the upstream energy market, depends on the level of activity in oil and gas exploration, development and production, and is primarily tied to the number of working and available drilling rigs, number of wells those rigs drill annually, the amount of hydraulic fracturing horsepower required on average to fracture each well and, ultimately, oil and natural gas prices overall.
18
The energy market is volatile as the worldwide demand for oil and natural gas fluctuates. Generally, when worldwide demand or our customers’ expectations of future prices for these commodities are depressed, the demand for our products used in drilling and recovery applications is reduced. Other factors, including availability of quality drilling prospects, exploration success, relative production costs and political and regulatory environments are also expected to affect the demand for our products. Worldwide military, political and economic events have in the past contributed to oil and gas price volatility and are likely to do so in the future. Accordingly, our operating results for any particular period are not necessarily indicative of the operating results for any future period as the markets for our products have historically experienced volatility. In particular, orders in the Energy segment have historically corresponded to demand for oil and gas and petrochemical products and have been influenced by prices and inventory levels for oil and natural gas, rig count, number of wells those rigs drill annually, the amount of hydraulic fracturing horsepower required on average to fracture each well and other economic factors which we cannot reasonably predict. The Energy segment generated approximately 39% and 43% of our consolidated revenues for the three months ended March 31, 2018 and for the year ended December 31, 2017, respectively.
Our results of operations are subject to exchange rate and other currency risks. A significant movement in exchange rates could adversely impact our results of operations and cash flows.
We conduct our business in many different currencies. A significant portion of our revenue, approximately 52% for the year ended December 31, 2017, is denominated in currencies other than the U.S. dollar. Accordingly, currency exchange rates, and in particular unfavorable movement in the exchange rates between U.S. dollars and Euros, British Pounds and Chinese Renminbi, affect our operating results. The effects of exchange rate fluctuations on our future operating results are unpredictable because of the number of currencies in which we do business and the potential volatility of exchange rates. We are also subject to the risks of currency controls and devaluations. Although historically not significant, if currency controls were enacted in countries where the Company generates significant cash balances, these controls may limit our ability to convert currencies into U.S. dollars or other currencies, as needed, or to pay dividends or make other payments from funds held by subsidiaries in the countries imposing such controls, which could adversely affect our liquidity. Currency devaluations could also negatively affect our operating margins and cash flows.
Potential governmental regulations restricting the use, and increased public attention to and litigation regarding the impacts, of hydraulic fracturing or other processes on which it relies could reduce demand for our products.
Oil and natural gas extracted from unconventional sources, such as shale, tight sands and coal bed methane, frequently requires hydraulic fracturing. Recent initiatives to study, regulate or otherwise restrict hydraulic fracturing and processes on which it relies, such as water disposal, as well as litigation over hydraulic fracturing impacts, could adversely affect some of our customers and their demand for our products, which could have a material adverse effect on our business, results of operations and financial condition.
For example, although hydraulic fracturing currently is generally exempt from regulation under the U.S. Safe Drinking Water Act’s (“SDWA”) Underground Injection Control program and is typically regulated by state oil and natural gas commissions or similar agencies, several federal agencies have asserted regulatory authority over certain aspects of the process. These include, among others, a number of regulations issued and other steps taken by the U.S. Environmental Protection Agency (“EPA”) over the last five years, including its New Source Performance Standards issued in 2012, its June 2016 rules establishing new emissions standards for methane and additional standards for volatile organic compounds from certain new, modified and reconstructed equipment and processes in the oil and natural gas source category, and its June 2016 rule prohibiting the discharge of wastewater from onshore unconventional oil and natural gas extraction facilities to publicly owned wastewater treatment plants; and the federal Bureau of Land Management (“BLM”) rule in March 2015 that established new or more stringent standards relating to hydraulic fracturing on federal and American Indian lands (which was the subject of litigation and which the BLM rescinded in December 2017). While the newly appointed EPA administrator and the Trump administration more generally have indicated their interest in scaling back or rescinding regulations that inhibit the development of the U.S. oil and gas industry, it is difficult to predict the extent to which such policies will be implemented or the outcome of any litigation challenging such implementation, such as the suit the State of California’s attorney general filed in January 2018 challenging the BLM’s rescission of its March 2015 rule referred to above.
19
Moreover, some states and local governments have adopted, and other governmental entities are considering adopting, regulations that could impose more stringent requirements on hydraulic fracturing operations. For example, Texas, Colorado and North Dakota among others have adopted regulations that impose new or more stringent permitting, disclosure, disposal and well construction requirements on hydraulic fracturing operations. States could also elect to prohibit high volume hydraulic fracturing altogether, following the approach taken by the State of New York in 2015. Local land use restrictions, such as city ordinances, may restrict drilling in general and hydraulic fracturing in particular. Some state and federal regulatory agencies have also recently focused on a connection between the operation of injection wells used for oil and natural gas waste disposal and seismic activity. Similar concerns have been raised that hydraulic fracturing may also contribute to seismic activity. In March 2016, the United States Geological Survey identified six states with the most significant hazards from induced seismicity, including Oklahoma, Kansas, Texas, Colorado, New Mexico and Arkansas. In light of these concerns, some state regulatory agencies have modified their regulations or issued orders to address induced seismicity. For example, in December 2016, the Oklahoma Corporation Commission’s Oil and Gas Conservation Division (the “OCC Division”) and the Oklahoma Geologic Survey released well completion seismicity guidance, which requires operators to take certain prescriptive actions, including mitigation, following anomalous seismic activity within 1.25 miles of hydraulic fracturing operations; and in February 2017, the OCC Division issued an order limiting future increases in the volume of oil and natural gas wastewater injected into the ground in an effort to reduce earthquakes in the state. Ongoing lawsuits have also alleged that disposal well operations have caused damage to neighboring properties or otherwise violated state and federal rules regulating waste disposal. Increased regulation and attention given to induced seismicity could lead to greater opposition to, and litigation concerning, oil and natural gas activities utilizing hydraulic fracturing or injection wells for waste disposal. The adoption of more stringent regulations regarding hydraulic fracturing and the outcome of litigation over hydraulic fracturing could adversely affect some of our customers and their demand for our products, which could have a material adverse effect on our business, results of operations and financial condition.
We face competition in the markets we serve, which could materially and adversely affect our operating results.
We actively compete with many companies producing similar products. Depending on the particular product and application, we experience competition based on a number of factors, including price, quality, performance and availability. We compete against many companies, including divisions of larger companies with greater financial resources than we possess. As a result, these competitors may be both domestically and internationally better able to withstand a change in conditions within the markets in which we compete and throughout the global economy as a whole.
In addition, our ability to compete effectively depends on how successfully we anticipate and respond to various competitive factors, including new competitors entering our markets, new products and services that may be introduced by competitors, changes in customer preferences, pricing pressures and new government regulations. If we are unable to anticipate our competitors’ development of new products and services, identify customer needs and preferences on a timely basis, or successfully introduce new products and services or modify existing products and service offerings in response to such competitive factors, we could lose customers to competitors. If we cannot compete successfully, our sales and operating results could be materially and adversely affected.
Large or rapid increases in the cost of raw materials and component parts, substantial decreases in their availability or our dependence on particular suppliers of raw materials and component parts could materially and adversely affect our operating results.
Our primary raw materials, directly and indirectly, are cast iron, aluminum and steel. We also purchase a large number of motors and, therefore, also have exposure to changes in the price of copper, which is a primary component of motors. We have long-term contracts with only a few suppliers of key components. Consequently, we are vulnerable to fluctuations in prices and availability of such raw materials. Factors such as supply and demand, freight costs and transportation availability, inventory levels of brokers and dealers, the level of imports and general economic conditions may affect the price and availability of raw materials. In addition, we use single sources of supply for certain iron castings, motors and other select engineered components that are critical in the
20
manufacturing of our products. From time to time in recent years, we have experienced disruptions to our supply deliveries for raw materials and component parts and may experience further supply disruptions. Any such disruption could have a material adverse effect on our ability to timely meet our commitments to customers and, therefore, our operating results.
Our operating results could be adversely affected by a loss or reduction of business with key customers or consolidation or the vertical integration of our customer base.
We derive revenue from certain key customers, in particular with respect to our oilfield service products and services. The loss or reduction of significant contracts with any of these key customers could result in a material decrease of our future profitability and cash flows. In addition, the consolidation or vertical integration of key customers may result in the loss of certain customer contracts or impact demand or competition for our products. Any changes in such customers’ purchasing practices, or decline in such customers’ financial condition, may have a material adverse impact on our business, results of operations and financial condition. Some of our customers are significantly larger than we are, have greater financial and other resources and also have the ability to purchase products from our competitors. As a result of their size and position in the marketplace, some of our customers have significant purchasing leverage and could cause us to materially reduce the price of our products, which could have a material adverse effect on our revenue and profitability. In addition, in the petroleum product market, lost sales may be difficult to replace due to the relative concentration of the customer base. We are unable to predict what effect consolidation in our customers’ industries may have on prices, capital spending by customers, selling strategies, competitive position, our ability to retain customers or our ability to negotiate favorable agreements with customers.
The loss of, or disruption in, our distribution network could have a negative impact on our abilities to ship products, meet customer demand and otherwise operate our business.
We sell a significant portion of our products through independent distributors and sales representatives. We rely in large part on the orderly operation of this distribution network, which depends on adherence to shipping schedules and effective management. We conduct all of our shipping through independent third parties. Although we believe that our receiving, shipping and distribution process is efficient and well-positioned to support our operations and strategic plans, we cannot provide assurance that we have anticipated all issues or that events beyond our control, such as natural disasters or other catastrophic events, labor disagreements, acquisition of distributors by a competitor, consolidation within our distributor network or shipping problems, will not disrupt our distribution network. If complications arise within a segment of our distribution network, the remaining network may not be able to support the resulting additional distribution demands. Any of these disruptions or complications could negatively impact our revenues and costs.
Our ongoing and expected restructuring plans and other cost savings initiatives may not be as effective as we anticipate, and we may fail to realize the cost savings and increased efficiencies that we expect to result from these actions. Our operating results could be negatively affected by our inability to effectively implement such restructuring plans and other cost savings initiatives.
We continually seek ways to simplify or improve processes, eliminate excess capacity and reduce costs in all areas of our operations, which from time to time includes restructuring activities. We have implemented significant restructuring activities across our global manufacturing, sales and distribution footprint, which include workforce reductions and facility consolidations. From 2015 to 2017, we incurred restructuring charges of approximately $42.9 million across our segments in connection with these initiatives. Costs of future initiatives may be material and the savings associated with them are subject to a variety of risks, including our inability to effectively eliminate duplicative back office overhead and overlapping sales personnel, rationalize manufacturing capacity, synchronize information technology systems, consolidate warehousing and distribution facilities and shift production to more economical facilities. As a result, the contemplated costs to effect these initiatives may materially exceed estimates. The initiatives we are contemplating may require consultation with various employees, labor representatives or regulators, and such consultations may influence the timing, costs and extent of expected savings and may result in the loss of skilled employees in connection with the initiatives.
Although we have considered the impact of local regulations, negotiations with employee representatives and the related costs associated with our restructuring activities, factors beyond the control of management may affect the timing of these projects and therefore affect when savings will be achieved under the plans. There can
21
be no assurance that we will be able to successfully implement these cost savings initiatives in the time frames contemplated (or at all) or that we will realize the projected benefits of these and other restructuring and cost savings initiatives. If we are unable to implement our cost savings initiatives, our business may be adversely affected. Moreover, our continued implementation of cost savings initiatives may have a material adverse effect on our business, results of operations and financial condition.
In addition, as we consolidate facilities and relocate manufacturing processes to lower-cost regions, our success will depend on our ability to continue to meet customer demand and maintain a high level of quality throughout the transition. Failure to adequately meet customer demand or maintain a high level or quality could have a material adverse effect on our business, results of operations and financial condition.
Our success depends on our executive management and other key personnel.
Our future success depends to a significant degree on the skills, experience and efforts of our executive management and other key personnel, many of whom have joined the Company since the KKR Transaction, and their ability to provide us with uninterrupted leadership and direction. The failure to retain our executive officers and other key personnel or a failure to provide adequate succession plans could have an adverse impact. The availability of highly qualified talent is limited, and the competition for talent is robust. However, we provide long-term equity incentives and certain other benefits for our executive officers which provide incentives for them to make a long-term commitment to us. Our future success will also depend on our ability to have adequate succession plans in place and to attract, retain and develop qualified personnel. A failure to efficiently replace executive management members and other key personnel and to attract, retain and develop new qualified personnel could have an adverse effect on our operations and implementation of our strategic plan.
Credit and counterparty risks could harm our business.
The financial condition of our customers could affect our ability to market our products or collect receivables. In addition, financial difficulties faced by our customers as a result of an adverse economic event or other market factors may lead to cancellation or delay of orders. Our customers may suffer financial difficulties that make them unable to pay for a product or solution when payments become due, or they may decide not to pay us, either as a matter of corporate decision-making or in response to changes in local laws and regulations. Although historically not material, we cannot be certain that, in the future, expenses or losses for uncollectible amounts will not have a material adverse effect on our revenues, earnings and cash flows.
If we are unable to develop new products and technologies, our competitive position may be impaired, which could materially and adversely affect our sales and market share.
The markets in which we operate are characterized by changing technologies and introductions of new products and services. Our ability to develop new products based on technological innovation can affect our competitive position and often requires the investment of significant resources. Difficulties or delays in research, development or production of new products and technologies, or failure to gain market acceptance of new products and technologies, may significantly reduce future revenues and materially and adversely affect our competitive position. We cannot assure you that we will have sufficient resources to continue to make the investment required to maintain or increase our market share or that our investments will be successful. If we do not compete successfully, our business, financial condition, results of operations and cash flows could be materially adversely affected.
Cost overruns, delays, penalties or liquidated damages could negatively impact our results, particularly with respect to fixed-price contracts for custom engineered products.
A portion of our revenues and earnings is generated through fixed-price contracts for custom engineered products. Certain of these contracts provide for penalties or liquidated damages for failure to timely perform our obligations under the contract, or require that we, at our expense, correct and remedy to the satisfaction of the other party certain defects. Because substantially all of our custom engineered product contracts are at a fixed price, we face the risk that cost overruns, delays, penalties or liquidated damages may exceed, erode or eliminate our expected profit margin, or cause us to record a loss on our projects.
22
The risk of non-compliance with U.S. and foreign laws and regulations applicable to our international operations could have a significant impact on our results of operations, financial condition or strategic objectives.
Our global operations subject us to regulation by U.S. federal and state laws and multiple foreign laws, regulations and policies, which could result in conflicting legal requirements. These laws and regulations are complex, change frequently, have become more stringent over time and increase our cost of doing business.
These laws and regulations include import and export control, environmental, health and safety regulations, data privacy requirements, international labor laws and work councils and anti-corruption and bribery laws such as the U.S. Foreign Corrupt Practices Act, the U.K. Bribery Act, the U.N. Convention Against Bribery and local laws prohibiting corrupt payments to government officials.
We are subject to the risk that we, our employees, our affiliated entities, contractors, agents or their respective officers, directors, employees and agents may take actions determined to be in violation of any of these laws, for which we might be held responsible, particularly as we expand our operations geographically through organic growth and acquisitions. An actual or alleged violation could result in substantial fines, sanctions, civil or criminal penalties, debarment from government contracts, curtailment of operations in certain jurisdictions, competitive or reputational harm, litigation or regulatory action and other consequences that might adversely affect our results of operations, financial condition or strategic objectives.
U.S. federal income tax reform could adversely affect us.
On December 22, 2017, the U.S. government enacted comprehensive tax legislation commonly referred to as the Tax Cuts and Jobs Act (“Tax Act”). The Tax Act makes broad and complex changes to the U.S. tax code that will affect 2017, including, but not limited to, (1) requiring a one-time transition tax on certain unrepatriated earnings of foreign subsidiaries that is payable over eight years and (2) bonus depreciation that will allow for full expensing of qualified property.
The Tax Act also establishes new tax laws that will affect 2018, including, but not limited to, (1) reduction of the U.S. federal corporate tax rate; (2) elimination of the corporate alternative minimum tax; (3) the creation of the base erosion anti-abuse tax, a new minimum tax; (4) a general elimination of U.S. federal income taxes on dividends from foreign subsidiaries; (5) a new provision designed to tax global intangible low-taxed income, which allows for the possibility of using foreign tax credits (“FTC”) and a deduction of up to 50% to offset the income tax liability (subject to some limitations); (6) a new limitation on deductible interest expense; (7) the repeal of the domestic production activity deduction; (8) limitations on the deductibility of certain executive compensation; (9) limitations on the use of FTCs to reduce the U.S. income tax liability; and (10) limitations on net operating losses generated after December 31, 2017, to 80% of taxable income.
The SEC staff issued SAB 118, which provides guidance on accounting for the tax effects of the Tax Act. SAB 118 provides a measurement period that should not extend beyond one year from the Tax Act enactment date for companies to complete the accounting under ASC 740. In accordance with SAB 118, a company must reflect the income tax effects of those aspects of the Tax Act for which the accounting under ASC 740 is complete. To the extent that a company’s accounting for certain income tax effects of the Tax Act is incomplete but it is able to determine a reasonable estimate, it must record a provisional estimate in the financial statements. If a company cannot determine a provisional estimate to be included in the financial statements, it should continue to apply ASC 740 on the basis of the provisions of the tax laws that were in effect immediately before the enactment of the Tax Act.
In connection with our initial analysis of the impact of the Tax Act, we have recorded a discrete net tax benefit of $95.3 million in the period ending December 31, 2017. This net expense benefit primarily consists of (1) a net expense benefit for the corporate rate reduction of $89.6 million, (2) a net expense for the transition tax of $63.3 million and (3) a corresponding reduction of the repatriation liability under APB 23 of $69.0 million.
For various reasons we have not completed our accounting for the income tax effects of certain elements of the Tax Act. If we were able to make reasonable estimates of the effects of elements for which our analysis is not yet complete, we recorded provisional adjustments, as described above. If we were not yet able to make reasonable estimates of the impact of certain elements, we have not recorded any adjustments related to those elements and have continued accounting for them in accordance with ASC 740 on the basis of the tax laws in effect before the Tax Act. As we complete our accounting of the income tax effects of the Tax Act, we anticipate
23
that we may record additional charges or benefits at such time as prescribed by ASC 740 and SAB 118, and as further information becomes available regarding the Tax Act, we may make further adjustments to the provisions that have been recorded in our financial statements. We also continue to examine the impact this tax reform legislation may have on our business.
The future impacts of the Tax Act on holders of our common shares are uncertain and could in certain instances be adverse. We urge our stockholders to consult with their legal and tax advisors with respect to any such legislation and the potential tax consequences of investing in our common stock.
A significant portion of our assets consists of goodwill and other intangible assets, the value of which may be reduced if we determine that those assets are impaired.
As a result of the KKR Transaction, we applied the acquisition method of accounting and established a new basis of accounting on July 30, 2013. Goodwill is recorded as the difference, if any, between the aggregate consideration paid for an acquisition and the fair value of the tangible and identifiable intangible assets acquired, liabilities assumed and any non-controlling interest. Intangible assets, including goodwill, are assigned to our reporting units based upon their fair value at the time of acquisition. In accordance with GAAP, goodwill and indefinite-lived intangible assets are evaluated for impairment annually, or more frequently if circumstances indicate impairment may have occurred. In 2017, we recorded an impairment charge related to other intangible assets of $1.6 million primarily within the Industrials segment. In 2016, we recorded an impairment charge related to other intangible assets of $25.3 million primarily within the Industrials segment. In 2015, we recorded a goodwill impairment charge of $343.3 million within the Energy segment and recorded impairment charges related to other intangible assets of $78.1 million within our Industrials, Energy and Medical segments. As of March 31, 2018, the net carrying value of goodwill and other intangible assets, net represented $2,757.5 million, or 58%, of our total assets. A future impairment, if any, could have a material adverse effect to our consolidated financial position or results of operations. See Note 8 “Goodwill and Other Intangible Assets” to our audited consolidated financial statements and Note 5 “Goodwill and Other Intangible Assets” to our unaudited condensed consolidated financial statements incorporated by reference in this prospectus for additional information related to impairment testing for goodwill and other intangible assets and the associated charges taken.
Our business could suffer if we experience employee work stoppages, union and work council campaigns or other labor difficulties.
As of March 31, 2018, we had approximately 6,600 employees of which approximately 2,050 were located in the United States. Of those employees located outside of the United States, a significant portion are represented by works councils and labor unions, and of those employees located in the United States, approximately 200 are represented by labor unions. Although we believe that our relations with employees are satisfactory and have not experienced any material work stoppages, work stoppages have occurred, and may in the future occur, and we may not be successful in negotiating new collective bargaining agreements. In addition, negotiations with our union employees may (1) result in significant increases in our cost of labor, (2) divert management’s attention away from operating our business or (3) break down and result in the disruption of our operations. The occurrence of any of the preceding conditions could impair our ability to manufacture our products and result in increased costs and/or decreased operating results.
We are a defendant in certain asbestos and silica-related personal injury lawsuits, which could adversely affect our financial condition.
We have been named as a defendant in many asbestos and silica-related personal injury lawsuits. The plaintiffs in these suits allege exposure to asbestos or silica from multiple sources, and typically we are one of approximately 25 or more named defendants. We believe that, given our financial reserves and anticipated insurance recoveries, the pending and potential future lawsuits are not likely to have a material adverse effect on our consolidated financial position, results of operations or liquidity. However, future developments, including, without limitation, potential insolvencies of insurance companies or other defendants, an adverse determination in the Adams County Case (discussed below), or other inability to collect from our historical insurers or indemnitors, could cause a different outcome. In addition, even if any damages payable by us in any individual lawsuit are not material, the aggregate damages and related defense costs could be material and could materially
24
adversely affect our financial condition if we were to receive an adverse judgment in a number of these lawsuits. Accordingly, the resolution of pending or future lawsuits may have a material adverse effect on our consolidated financial position, results of operations or liquidity. See “Business—Legal Proceedings—Asbestos and Silica-Related Litigation.”
Acquisitions and integrating such acquisitions create certain risks and may affect our operating results.
We have acquired businesses in the past and may continue to acquire businesses or assets in the future. The acquisition and integration of businesses or assets involves a number of risks. The core risks are valuation (negotiating a fair price for the business), integration (managing the process of integrating the acquired company’s people, products, technology and other assets to extract the value and synergies projected to be realized in connection with the acquisition), regulation (obtaining necessary regulatory or other government approvals that may be necessary to complete acquisitions) and diligence (identifying undisclosed or unknown liabilities or restrictions that will be assumed in the acquisition).
In addition, acquisitions outside of the United States often involve additional or increased risks including, for example:
| • | managing geographically separated organizations, systems and facilities; |
| • | integrating personnel with diverse business backgrounds and organizational cultures; |
| • | complying with non-U.S. regulatory requirements; |
| • | fluctuations in currency exchange rates; |
| • | enforcement of intellectual property rights in some non-U.S. countries; |
| • | difficulty entering new non-U.S. markets due to, among other things, consumer acceptance and business knowledge of these new markets; and |
| • | general economic and political conditions. |
The process of integrating operations could cause an interruption of, or loss of momentum in, the activities of one or more of our combined businesses and the possible loss of key personnel. The diversion of management’s attention and any delays or difficulties encountered in connection with acquisitions and the integration of an acquired company’s operations could have an adverse effect on our business, results of operations, financial condition or prospects.
A natural disaster, catastrophe or other event could result in severe property damage, which could adversely affect our operations.
Some of our operations involve risks of, among other things, property damage, which could curtail our operations. For example, disruptions in operations or damage to a manufacturing plant could reduce our ability to produce products and satisfy customer demand. If one of more of our manufacturing facilities are damaged by severe weather or any other disaster, accident, catastrophe or event, our operations could be significantly interrupted. Similar interruptions could result from damage to production or other facilities that provide supplies or other raw materials to our plants or other stoppages arising from factors beyond our control. These interruptions might involve significant damage to, among other things, property, and repairs might take from a week or less for a minor incident to many months for a major interruption.
Information systems failure may disrupt our business and result in financial loss and liability to our customers.
Our business is highly dependent on financial, accounting and other data-processing systems and other communications and information systems, including our enterprise resource planning tools. We process a large number of transactions on a daily basis and rely upon the proper functioning of computer systems. If any of these systems fail, whether caused by fire, other natural disaster, power or telecommunications failure, acts of cyber terrorism or war or otherwise, or they do not function correctly, we could suffer financial loss, business disruption, liability to our customers, regulatory intervention or damage to our reputation. If our systems are unable to accommodate an increasing volume of transactions, our ability to grow could be limited. Although we have backup systems, procedures and capabilities in place, they may also fail or be inadequate. Further, to the
25
extent that we may have customer information in our databases, any unauthorized disclosure of, or access to, such information could result in claims under data protection laws and regulations. If any of these risks materialize, our reputation and our ability to conduct our business may be materially adversely affected.
The nature of our products creates the possibility of significant product liability and warranty claims, which could harm our business.
Customers use some of our products in potentially hazardous applications that can cause injury or loss of life and damage to property, equipment or the environment. In addition, our products are integral to the production process for some end-users and any failure of our products could result in a suspension of operations. Although we maintain quality controls and procedures, we cannot be certain that our products will be completely free from defects. We maintain amounts and types of insurance coverage that we believe are currently adequate and consistent with normal industry practice for a company of our relative size, and we limit our liability by contract wherever possible. However, we cannot guarantee that insurance will be available or adequate to cover all liabilities incurred. We also may not be able to maintain insurance in the future at levels we believe are necessary and at rates we consider reasonable. We may be named as a defendant in product liability or other lawsuits asserting potentially large claims if an accident occurs at a location where our equipment and services have been or are being used.
Environmental compliance costs and liabilities could adversely affect our financial condition.
Our operations and properties are subject to increasingly stringent domestic and foreign laws and regulations relating to environmental protection, including laws and regulations governing air emissions, water discharges, waste management and workplace safety. Under such laws and regulations, we can be subject to substantial fines and sanctions for violations and be required to install costly pollution control equipment or put into effect operational changes to limit pollution emissions or decrease the likelihood of accidental hazardous substance releases.
We use and generate hazardous substances and waste in our manufacturing operations. In addition, many of our current and former properties are, or have been, used for industrial purposes. We have been identified as a potentially responsible party with respect to several sites designated for cleanup under U.S. federal “Superfund” or similar state laws that may impose joint and several liability for cleanup of certain waste sites and for related natural resource damages. An accrued liability on our balance sheet reflects costs that are probable and estimable for our projected financial obligations relating to these matters. If we have underestimated our remaining financial obligations, we may face greater exposure that could have an adverse effect on our financial condition, results of operations or liquidity.
We have experienced, and expect to continue to experience, operating costs to comply with environmental laws and regulations. In addition, new laws and regulations, stricter enforcement of existing laws and regulations, the discovery of previously unknown contamination or the imposition of new cleanup requirements could require us to incur costs or become the basis for new or increased liabilities that could have a material adverse effect on our business, financial condition, results of operations or liquidity.
Third parties may infringe upon our intellectual property or may claim we have infringed their intellectual property, and we may expend significant resources enforcing or defending our rights or suffer competitive injury.
Our success depends in part on the creation, maintenance and protection of our proprietary technology and intellectual property rights. We rely on a combination of patents, trademarks, trade secrets, copyrights, confidentiality provisions, contractual restrictions and licensing arrangements to establish and protect our proprietary rights. Our nondisclosure agreements and confidentiality agreements may not effectively prevent disclosure of our proprietary information, technologies and processes, and may not provide an adequate remedy in the event of breach of such agreements or unauthorized disclosure of such information, and if a competitor lawfully obtains or independently develops our trade secrets, we would have no right to prevent such competitor from using such technology or information to compete with us, either of which could harm our competitive position. Our applications for patent and trademark protection may not be granted, or the claims or scope of such issued patents or registered trademarks may not be sufficiently broad to protect our products. In addition, effective patent, copyright, trademark and trade secret protection may be unavailable or limited for some of our
26
trademarks and patents in some foreign countries. We may be required to spend significant resources to monitor and police our intellectual property rights, and we cannot guarantee that such efforts will be successful in preventing infringement or misappropriation. If we fail to successfully enforce these intellectual property rights, our competitive position could suffer, which could harm our operating results.
Although we make a significant effort to avoid infringing known proprietary rights of third parties, the steps we take to prevent misappropriation, infringement or other violation of the intellectual property of others may not be successful and from time to time we may receive notice that a third party believes that our products may be infringing certain patents, trademarks or other proprietary rights of such third party. Responding to and defending such claims, regardless of their merit, can be costly and time-consuming, can divert management’s attention and other resources, and we may not prevail. Depending on the resolution of such claims, we may be barred from using a specific technology or other rights, may be required to redesign or re-engineer a product which may require significant resources, may be required to enter into licensing arrangements from the third party claiming infringement (which may not be available on commercially reasonable terms, or at all), or may become liable for significant damages.
If any of the foregoing occurs, our ability to compete could be affected or our business, financial condition and results of operations may be materially adversely affected.
We face risks associated with our pension and other postretirement benefit obligations.
We have both funded and unfunded pension and other postretirement benefit plans worldwide. As of December 31, 2017, our projected benefit obligations under our pension and other postretirement benefit plans exceeded the fair value of plan assets by an aggregate of approximately $97.2 million (“unfunded status”), compared to $124.4 million as of December 31, 2016. Estimates for the amount and timing of the future funding obligations of these benefit plans are based on various assumptions. These assumptions include discount rates, rates of compensation increases, expected long-term rates of return on plan assets and expected healthcare cost trend rates. If our assumptions prove incorrect, our funding obligations may increase, which may have a material adverse effect on our financial results.
We have invested the plan assets of our funded benefit plans in various equity and debt securities. A deterioration in the value of plan assets could cause the unfunded status of these benefit plans to increase, thereby increasing our obligation to make additional contributions to these plans. An obligation to make contributions to our benefit plans could reduce the cash available for working capital and other corporate uses, and may have an adverse impact on our operations, financial condition and liquidity.
Risks Related to Our Indebtedness
Our substantial indebtedness could have important adverse consequences and adversely affect our financial condition.
We have a significant amount of indebtedness. As of March 31, 2018, we had total indebtedness of $2,055.1 million, and we had availability under our revolving credit facility (the “Revolving Credit Facility”) and our receivables financing facility (the “Receivables Financing Agreement”) of $352.6 million and $72.3 million, respectively.
Our high level of debt could have important consequences, including: making it more difficult for us to satisfy our obligations with respect to our debt; limiting our ability to obtain additional financing to fund future working capital, capital expenditures, investments or acquisitions, or other general corporate requirements; requiring a substantial portion of our cash flows to be dedicated to debt service payments instead of other purposes, thereby reducing the amount of cash flows available for working capital, capital expenditures, investments or acquisitions and other general corporate purposes; increasing our vulnerability to adverse changes in general economic, industry and competitive conditions; exposing us to the risk of increased interest rates as certain of our borrowings, including borrowings under our senior secured credit facilities (the “Senior Secured Credit Facilities”), are at variable rates of interest; limiting our flexibility in planning for and reacting to changes in the industries in which we compete; placing us at a disadvantage compared to other, less leveraged competitors; increasing our cost of borrowing; and hampering our ability to execute on our growth strategy.
27
We may not be able to generate sufficient cash to service all of our indebtedness, and may be forced to take other actions to satisfy our obligations under our indebtedness, which may not be successful.
Our ability to make scheduled payments on, or refinance, our debt obligations depends on our financial condition and operating performance, which are subject to prevailing economic, industry and competitive conditions and to certain financial, business, legislative, regulatory and other factors beyond our control (as well as and including those factors discussed under “—Risks Related to Our Business” above). We may be unable to maintain a level of cash flow from operating activities sufficient to permit us to pay the principal, premium, if any, and interest on our indebtedness.
If our cash flow and capital resources are insufficient to fund our debt service obligations, we could face substantial liquidity problems and could be forced to reduce or delay investments and capital expenditures or to dispose of material assets or operations, seek additional debt or equity capital, or restructure or refinance our indebtedness. We may not be able to implement any such alternative measures on commercially reasonable terms or at all and, even if successful, those alternative actions may not allow us to meet our scheduled debt service obligations.
If we cannot make scheduled payments on our debt, we will be in default and the lenders under the Revolving Credit Facility could terminate their commitments to loan money, and our secured lenders (including the lenders under the Senior Secured Credit Facilities) could foreclose against the assets securing their borrowings and we could be forced into bankruptcy or liquidation.
Despite our level of indebtedness, we and our subsidiaries may still be able to incur substantially more debt, including off-balance sheet financing, contractual obligations and general and commercial liabilities. This could further exacerbate the risks to our financial condition described above.
We and our subsidiaries may be able to incur significant additional indebtedness in the future, including off-balance sheet financings, contractual obligations and general and commercial liabilities. Although the credit agreement governing the Senior Secured Credit Facilities and the indenture governing the Senior Notes contain restrictions on the incurrence of additional indebtedness, these restrictions are subject to a number of qualifications and exceptions, and the additional indebtedness incurred in compliance with these restrictions could be substantial. In addition, we can increase the borrowing availability under the Senior Secured Credit Facilities by up to $250 million in the form of additional commitments under the Revolving Credit Facility and/or incremental term loans plus an additional amount so long as we do not exceed a specified senior secured leverage ratio. We also can incur additional secured indebtedness under our term loan facilities (the “Term Loan Facilities”) if certain specified conditions are met under the credit agreement governing the Term Loan Facilities. If new debt is added to our current debt levels, the related risks that we now face could intensify.
The terms of the credit agreement governing the Senior Secured Credit Facilities may restrict our current and future operations, particularly our ability to respond to changes or to take certain actions.
The credit agreement governing the Senior Secured Credit Facilities contains a number of restrictive covenants that impose significant operating and financial restrictions on us and may limit our ability to engage in acts that may be in our best interest, including restrictions on our ability to: incur additional indebtedness and guarantee indebtedness; pay dividends, make other distributions in respect of, or repurchase or redeem capital stock; prepay, redeem or repurchase certain debt; make loans, investments and other restricted payments; sell or otherwise dispose of assets; incur liens; enter into transactions with affiliates; enter into agreements restricting our subsidiaries’ ability to pay dividends; consolidate, merge or sell all or substantially all of our assets; make needed capital expenditures; make strategic acquisitions, investments or enter into joint ventures; plan for or react to market conditions or otherwise execute our business strategies; and engage in business activities, including future opportunities, that may be in our interest.
A breach of the covenants under the credit agreement governing the Senior Secured Credit Facilities could result in an event of default under the applicable indebtedness. Such a default may allow the creditors to accelerate the related debt principal and/or related interest payments and may result in the acceleration of any other debt to which a cross-acceleration or cross-default provision applies. In addition, an event of default under the credit agreement governing our Senior Secured Credit Facilities would permit the lenders under our Revolving Credit Facility to terminate all commitments to extend further credit under that facility. Furthermore, if we were unable to repay the amounts due and payable under our Senior Secured Credit Facilities, those
28
lenders could proceed against the collateral granted to them to secure that indebtedness. In the event our lenders or noteholders accelerate the repayment of our borrowings and/or interest, we and our subsidiaries may not have sufficient assets to repay that indebtedness.
Our variable rate indebtedness subjects us to interest rate risk, which could cause our debt service obligations to increase significantly.
Borrowings under our Senior Secured Credit Facilities and our Receivables Financing Agreement are at variable rates of interest and expose us to interest rate risk. If interest rates increase, our debt service obligations on the variable rate indebtedness will increase even though the amount borrowed will remain the same, and our net income and cash flows, including cash available for servicing our indebtedness, will correspondingly decrease.
We utilize derivative financial instruments to reduce our exposure to market risks from changes in interest rates on our variable rate indebtedness and we will be exposed to risks related to counterparty credit worthiness or non-performance of these instruments.
We have entered into pay-fixed interest rate swaps instruments to limit our exposure to changes in variable interest rates. Such instruments will result in economic losses should interest rates not rise above the pay-fixed interest rate in the derivative contracts. We will be exposed to credit-related losses which could impact the results of operations in the event of fluctuations in the fair value of the interest rate swaps due to a change in the credit worthiness or non-performance by the counterparties to the interest rate swaps. See Note 16 “Hedging Activities, Derivative Instruments and Credit Risk” to our audited consolidated financial statements and Note 11 “Hedging Activities and Fair Value Measurements” to our unaudited condensed consolidated financial statements incorporated by reference in this prospectus.
If the financial institutions that are part of the syndicate of our Revolving Credit Facility fail to extend credit under our facility or reduce the borrowing base under our Revolving Credit Facility, our liquidity and results of operations may be adversely affected.
We have access to capital through our Revolving Credit Facility, which is part of our Senior Secured Credit Facilities. Each financial institution which is part of the syndicate for our Revolving Credit Facility is responsible on a several, but not joint, basis for providing a portion of the loans to be made under our facility. If any participant or group of participants with a significant portion of the commitments in our Revolving Credit Facility fails to satisfy its or their respective obligations to extend credit under the facility and we are unable to find a replacement for such participant or participants on a timely basis (if at all), our liquidity may be adversely affected.
Risks Related to Our Common Stock and this Offering
Our Sponsor will continue to have significant influence over us after this offering, including control over decisions that require the approval of stockholders, which could limit your ability to influence the outcome of matters submitted to stockholders for a vote.
Upon the completion of this offering, affiliates of our Sponsor will own approximately 50.3% of the outstanding shares of our common stock (or 48.6% if the underwriters exercise their option to purchase additional shares in full). As long as affiliates of our Sponsor own or control a significant amount of our outstanding voting power, our Sponsor and its affiliates have the ability to exercise substantial control over all corporate actions requiring stockholder approval, irrespective of how our other stockholders may vote, including:
| • | the election and removal of directors and the size of our board of directors; |
| • | any amendment of our articles of incorporation or bylaws; or |
| • | the approval of mergers and other significant corporate transactions, including a sale of substantially all of our assets. |
Moreover, ownership of our shares by affiliates of our Sponsor may also adversely affect the trading price for our common stock to the extent investors perceive disadvantages in owning shares of a company with a controlling shareholder. In addition, our Sponsor is in the business of making investments in companies and may, from time to time, acquire interests in businesses that directly or indirectly compete with our business, as well as
29
businesses that are significant existing or potential customers. Our Sponsor may acquire or seek to acquire assets that we seek to acquire and, as a result, those acquisition opportunities may not be available to us or may be more expensive for us to pursue, and as a result, the interests of our Sponsor may not coincide with the interests of our other stockholders.
We are a “controlled company” within the meaning of the NYSE rules and, as a result, we qualify for, and continue to rely on, exemptions from certain corporate governance requirements. If we continue to be a “controlled company” after completion of this offering, you will not have the same protections afforded to stockholders of companies that are subject to such requirements.
After completion of this offering, affiliates of our Sponsor may continue to control a majority of the voting power of our outstanding common stock. As a result, we may continue to be a “controlled company” within the meaning of the corporate governance standards of the NYSE. Under these rules, a company of which more than 50% of the voting power for the election of directors is held by an individual, group or another company is a “controlled company” and may elect not to comply with certain corporate governance requirements, including the requirements that, within one year of the date of the listing of our common stock:
| • | we have a board of directors that is composed of a majority of “independent directors,” as defined under the rules of such exchange; |
| • | we have a compensation committee that is composed entirely of independent directors with a written charter addressing the committee’s purpose and responsibilities; and |
| • | we have a nominating and corporate governance committee that is comprised entirely of independent directors with a written charter addressing the committee’s purpose and responsibilities. |
We utilize certain of these exemptions. As a result, we do not have a majority of independent directors on our board of directors or our compensation committee. Accordingly, if we continue to qualify as a “controlled company” after this offering, you will not have the same protections afforded to stockholders of companies that are subject to all of the corporate governance requirements of the NYSE.
After the completion of this offering, however, affiliates of our Sponsor may cease to hold more than 50% of our common stock. As a result, we may no longer be a “controlled company” within the meaning of the NYSE corporate governance standards. The NYSE corporate governance standards require that we appoint a majority of independent directors to our board of directors within one year of the date we no longer qualify as a “controlled company.” The NYSE corporate governance standards also require that we have a compensation committee and a nominating and corporate governance committee, each with at least one independent director, on the date that we no longer qualify as a “controlled company,” a compensation committee and a nominating and corporate governance committee, each with at least a majority of independent directors within 90 days of such date, and fully independent committees within one year of such date. Should we cease to qualify as a “controlled company” after the completion of this offering, our board of directors intends to take all action necessary to comply with the applicable NYSE listing rules within the specified transition periods.
Provisions of our corporate governance documents and Delaware law could make any change in our board of directors or in control of our Company more difficult.
Our amended and restated certificate of incorporation, our amended and restated bylaws and Delaware law contain provisions, such as provisions authorizing, without a vote of stockholders, the issuance of one or more series of preferred stock, that could make it difficult or expensive for a third party to pursue a tender offer, change in control or takeover attempt that is opposed by our management and board of directors even if such a transaction would be beneficial to our stockholders. We also have a staggered board of directors that could make it more difficult for stockholders to change the composition of our board of directors in any one year. These anti-takeover provisions could substantially impede the ability of public stockholders to change our management or board of directors, even if the third party’s offer may be considered beneficial by many of our stockholders. As a result, our stockholders may be limited in their ability to obtain a premium for their shares.
Our operating results and share price may be volatile, and the market price of our common stock after this offering may drop below the price you pay.
Our quarterly operating results are likely to vary from time to time subject to various factors. In addition, securities markets worldwide have experienced, and are likely to continue to experience, significant price and volume fluctuations. This market volatility, as well as general economic, market or political conditions, could
30
subject the market price of our shares to wide price fluctuations regardless of our operating performance. You may not be able to resell your shares at or above the offering price, or at all. Our operating results and the trading price of our shares may fluctuate in response to various factors, including:
| • | market conditions in the broader stock market; |
| • | actual or anticipated fluctuations in our quarterly financial and operating results; |
| • | introduction of new products or services by us or our competitors; |
| • | the public’s reaction to our press releases, our other public announcements and our filings with the SEC; |
| • | changes in, or failure to meet, earnings estimates or recommendations by research analysts who track our common stock or the stock of other companies in our industries; |
| • | strategic actions by us, our customers or our competitors, such as acquisitions or restructurings; |
| • | changes in accounting standards, policies, guidance, interpretations or principles; |
| • | issuance of new or changed securities analysts’ reports or recommendations or termination of coverage of our common stock by securities analysts; |
| • | guidance, if any, that we provide to the public, any changes in this guidance, or our failure to meet this guidance; |
| • | sales, or anticipated sales, of large blocks of our stock; |
| • | the granting or exercise of employee stock options; |
| • | volume of trading in our common stock; |
| • | additions or departures of key personnel; |
| • | regulatory or political developments; |
| • | litigation and governmental investigations; |
| • | changing economic conditions; |
| • | defaults on our indebtedness; and |
| • | exchange rate fluctuations. |
These and other factors, many of which are beyond our control, may cause our operating results and the market price and demand for our shares to fluctuate substantially. While we believe that operating results for any particular quarter are not necessarily a meaningful indication of future results, fluctuations in our quarterly operating results could limit or prevent investors from readily selling their shares and may otherwise negatively affect the market price and liquidity of our shares. In addition, in the past, when the market price of a stock has been volatile, holders of that stock have sometimes instituted securities class action litigation against the company that issued the stock. If any of our stockholders brought a lawsuit against us, we could incur substantial costs defending the lawsuit. Such a lawsuit could also divert the time and attention of our management from our business, which could significantly harm our profitability and reputation.
A significant portion of our total outstanding shares are restricted from immediate resale but may be sold into the market in the near future. This could cause the market price of our common stock to drop significantly, even if our business is doing well.
Sales of a substantial number of shares of our common stock in the public market could occur at any time. After this offering, we will have 197,226,113 outstanding shares of common stock based on the number of shares outstanding as of March 31, 2018. This includes shares that the selling stockholders are selling in this offering, which may be resold in the public market immediately, and assumes no exercises of outstanding options or SARs or settlement of DSUs. Approximately of the shares that are not being sold in this offering will be subject to a 90-day lock-up period provided under agreements executed in connection with this offering. Under certain circumstances, these shares will, however, be able to be resold after the expiration of the lock-up agreements and other restrictions on transfer as described in the “Shares Eligible for Future Sale” section of this prospectus.
31
Affiliates of our Sponsor have demand registration rights and they and certain of our stockholders have “piggyback” registration rights with respect to future registered offerings of our common stock. See “Certain Relationships and Related Person Transactions” for more detail. Affiliates of our Sponsor and other stockholders, who collectively are expected to own 50.3% of our common stock after this offering, may sell shares of our common stock after the expiration of the 90-day lock-up period. These sales, or the perception in the market that the holders of a large number of shares intend to sell shares, could reduce the market price of our common stock. We have also registered all shares of common stock that we may issue under our equity compensation plans. These shares can be freely sold in the public market upon issuance, subject to the lock-up agreements described in the “Underwriting (Conflicts of Interest)” section of this prospectus. As restrictions on resale end, the market price of our stock could decline if the holders of currently restricted shares sell them or are perceived by the market as intending to sell them.
Because we have no current plans to pay cash dividends on our common stock following this offering, you may not receive any return on investment unless you sell your common stock for a price greater than that which you paid for it.
We do not anticipate paying any cash dividends on our common stock following this offering. Any future determination to pay dividends will be at the discretion of our board of directors and will depend on, among other things, our results of operations, cash requirements, financial condition, contractual restrictions contained in current or future financing instruments and other factors that our board of directors deem relevant. Additionally, our ability to pay dividends is limited by restrictions on the ability of our operating subsidiaries to make distributions, including restrictions under the terms of the agreements governing our debt. Therefore, any return on investment in our common stock is solely dependent upon the appreciation of the price of our common stock on the open market, which may not occur. See “Dividend Policy” for more detail.
Because a significant portion of our operations is conducted through our subsidiaries, we are largely dependent on our receipt of distributions or other payments from our subsidiaries for cash to fund all of our operations and expenses, including to make future dividend payments, if any.
A significant portion of our operations is conducted through our subsidiaries. As a result, our ability to service our debt or to make future dividend payments or other distributions, if any, is largely dependent on the earnings of our subsidiaries and the payment of those earnings to us in the form of dividends, loans or advances and through repayment of loans or advances from us. Payments to us by our subsidiaries will be contingent upon our subsidiaries’ earnings and other business considerations and may be subject to statutory or contractual restrictions. We do not currently expect to declare or pay dividends and other distributions on our common stock for the foreseeable future; however, to the extent that we determine in the future to pay dividends or other distributions on our common stock, the credit agreement governing our Senior Secured Credit Facilities significantly restricts the ability of our subsidiaries to pay dividends or otherwise transfer assets to us. Further, there may be significant tax and other legal restrictions on the ability of non-U.S. subsidiaries or associates to remit money to us.
If securities or industry analysts do not publish research or reports about our business, if they adversely change their recommendations regarding our shares or if our results of operations do not meet their expectations, our share price and trading volume could decline.
The trading market for our shares is influenced by the research and reports that industry or securities analysts publish about us or our business. We do not have any control over these analysts. If one or more of these analysts cease coverage of our Company or fail to publish reports on us regularly, we could lose visibility in the financial markets, which in turn could cause our share price or trading volume to decline. Moreover, if one or more of the analysts who cover us downgrade our stock, or if our results of operations do not meet their expectations, our share price could decline.
Maintaining our financial controls and the requirements of being a public company may strain our resources, divert management’s attention, affect our ability to attract and retain qualified members of our board of directors and any failure to maintain financial controls could result in our financial statements becoming unreliable.
As a publicly traded company, we are required to comply with new and changing laws, regulations and standards relating to corporate governance and public disclosure, including the Dodd-Frank Wall Street Reform and Consumer Protection Act and the rules and regulations promulgated and to be promulgated thereunder, as
32
well as under the Sarbanes Oxley Act, and the rules and regulations of the SEC, and the NYSE, which have caused us to incur significant legal, accounting and other expenses that we were not required to incur as a private company and have made some activities more difficult, time-consuming or costly. For example, the Exchange Act requires us, among other things, to file annual, quarterly and current reports with respect to our business and operating results. Being a public company and being subject to new rules and regulations will make it more expensive for us to obtain director and officer liability insurance, and we may be required to accept reduced coverage or incur substantially higher costs to obtain coverage. These factors may therefore strain our resources, divert management’s attention and affect our ability to attract and retain qualified members of our board of directors.
Furthermore, establishing the corporate infrastructure demanded of a public company may divert management’s attention from implementing our growth strategy, which could prevent us from improving our business, results of operations and financial condition. We have made, and will continue to make, changes to our internal controls and procedures for financial reporting and accounting systems to meet our reporting obligations as a publicly traded company. However, the measures we take may not be sufficient to satisfy our obligations as a publicly traded company.
Pursuant to Section 404 of the Sarbanes-Oxley Act of 2002 and related rules and regulations, our management is required to report on the effectiveness of our internal control over financial reporting. Our independent registered public accounting firm will be required to attest to the effectiveness of our internal control over financial reporting in the second annual report we file with the SEC following completion of our initial public offering. We will continue to test our internal controls in connection with the Section 404 requirements and could, as part of that documentation and testing, identify material weaknesses, significant deficiencies or other areas for further attention or improvement.
Any failure to maintain the adequacy of internal control over financial reporting, or any consequent inability to produce accurate financial statements on a timely basis, could increase our operating costs and could materially impair our ability to operate our business. Moreover, effective internal controls are necessary for us to produce reliable financial reports and are important to assist in detecting fraud. As a result, our failure to satisfy the requirements of Section 404 on a timely basis could result in the loss of investor confidence in the reliability of our financial statements, which in turn could cause the market value of our common stock to decline.
Our amended and restated certificate of incorporation designates the Court of Chancery of the State of Delaware as the sole and exclusive forum for certain litigation that may be initiated by our stockholders, which could limit our stockholders’ ability to obtain a favorable judicial forum for disputes with us or our directors, officers or stockholders.
Our amended and restated certificate of incorporation provides that unless we consent to the selection of an alternative forum, the Court of Chancery of the State of Delaware shall, to the fullest extent permitted by law, be the sole and exclusive forum for any (i) derivative action or proceeding brought on behalf of our Company, (ii) action asserting a claim of breach of a fiduciary duty owed by any director or officer of our Company to the Company or the Company’s stockholders, creditors or other constituents, (iii) action asserting a claim against the Company or any director or officer of the Company arising pursuant to any provision of the General Corporation Law of the State of Delaware (the “DGCL”) or our amended and restated certificate of incorporation or our amended and restated bylaws, or (iv) action asserting a claim against the Company or any director or officer of the Company governed by the internal affairs doctrine; provided, that, if and only if the Court of Chancery of the State of Delaware dismisses any such action for lack of subject matter jurisdiction, such action may be brought in another state court sitting in the State of Delaware. Any person or entity purchasing or otherwise acquiring any interest in shares of capital stock of our Company shall be deemed to have notice of and consented to the forum provisions in our amended and restated certificate of incorporation. The choice of forum provision in our amended and restated certificate of incorporation may limit our stockholders’ ability to obtain a favorable judicial forum for disputes with us or any of our directors, officers, other employees, agents or stockholders, which may discourage lawsuits with respect to such claims. Alternatively, if a court were to find the choice of forum provision contained in our amended and restated certificate of incorporation to be inapplicable or unenforceable in an action, we may incur additional costs associated with resolving such action in other jurisdictions, which could materially and adversely affect our business, financial position, results of operations or cash flows.
33
Our amended and restated certificate of incorporation includes provisions limiting the personal liability of our directors for breaches of fiduciary duty under the DGCL.
Our amended and restated certificate of incorporation contains provisions permitted under the action asserting a claim arising under DGCL relating to the liability of directors. These provisions eliminate a director’s personal liability to the fullest extent permitted by the DGCL for monetary damages resulting from a breach of fiduciary duty, subject to certain circumstances
The principal effect of the limitation on liability provision is that a stockholder will be unable to prosecute an action for monetary damages against a director unless the stockholder can demonstrate a basis for liability for which indemnification is not available under the DGCL. These provisions, however, should not limit or eliminate our rights or any stockholder’s rights to seek non-monetary relief, such as an injunction or rescission, in the event of a breach of a director’s fiduciary duty. These provisions do not alter a director’s liability under federal securities laws. The inclusion of this provision in our amended and restated certificate of incorporation may discourage or deter stockholders or management from bringing a lawsuit against directors for a breach of their fiduciary duties, even though such an action, if successful, might otherwise have benefited us and our stockholders.
34
SPECIAL NOTE REGARDING FORWARD-LOOKING STATEMENTS
Certain matters we discuss in this prospectus may constitute forward-looking statements. You can identify forward-looking statements because they contain words such as “believes,” “expects,” “may,” “will,” “should,” “seeks,” “intends,” “plans,” “estimates,” “anticipates,” “could,” “target,” “projects,” “contemplates,” “believes,” “estimates,” “potential,” “continue” or similar expressions which concern our strategy, plans, projections or intentions. Examples of forward-looking statements include, but are not limited to, all statements we make relating to revenue, Adjusted EBITDA, Free Cash Flow, earnings, margins, growth rates and other financial results for future periods, as well as business strategy, prospective products, capital expenditures, research and development costs and future investments, timing and likelihood of success, plans and objectives of management for future operations and future results of current and anticipated products. By their nature, forward-looking statements: speak only as of the date they are made; are not statements of historical fact or guarantees of future performance; and are subject to risks, uncertainties, assumptions or changes in circumstances that are difficult to predict or quantify. Our expectations, beliefs and projections are expressed in good faith and we believe there is a reasonable basis for them. However, there can be no assurance that management’s expectations, beliefs and projections will result or be achieved and actual results may vary materially from what is expressed in or indicated by the forward-looking statements. All forward-looking statements in this prospectus apply only as of the date made and are expressly qualified in their entirety by the cautionary statements included in this prospectus. We undertake no obligation to publicly update or revise any forward-looking statements to reflect subsequent events or circumstances.
There are a number of risks, uncertainties and other important factors that could cause our actual results to differ materially from the forward-looking statements contained in this prospectus. Such risks, uncertainties and other important factors include, among others, the risks, uncertainties and factors set forth under “Risk Factors” and “Management’s Discussion and Analysis of Financial Condition and Results of Operations” contained in our Annual Report and in our Quarterly Report incorporated by reference in this prospectus. Moreover, we operate in an evolving environment. New risk factors and uncertainties may emerge from time to time, and it is not possible for management to predict all risk factors and uncertainties.
35
The selling stockholders will receive all of the net proceeds from the sale of shares of our common stock offered pursuant to this prospectus. We will not receive any proceeds from the sale of shares being sold in this offering, including from any exercise by the underwriters of their option to purchase additional shares. The selling stockholders will bear the underwriting commissions and discounts, if any, attributable to their sale of our common stock, and we will bear the remaining expenses. See “Principal and Selling Stockholders.”
36
We do not intend to pay cash dividends on our common stock in the foreseeable future. We may, in the future, decide to pay dividends on our common stock. Any future determination to pay dividends will be at the discretion of our board of directors and will depend on, among other things, our results of operations, cash requirements, financial condition, contractual restrictions contained in current or future financing instruments and other factors that our board of directors deem relevant. Additionally, our ability to pay dividends is limited by restrictions on the ability of our operating subsidiaries to make distributions, including restrictions under the terms of the agreements governing our debt. See “Item 7. Management’s Discussion and Analysis of Financial Condition and Results of Operations” in our Annual Report incorporated by reference in this prospectus for a description of the restrictions on our ability to pay dividends. We did not declare or pay dividends to the holders of our common stock in the years ended December 31, 2016 and 2017.
37
Our common stock began trading publicly on the NYSE under the symbol “GDI” as of May 12, 2017. Prior to that time, there was no public market for our common stock. As of March 31, 2018, there were 217 holders of record of our common stock. This stockholder figure does not include a substantially greater number of holders whose shares are held of record by banks, brokers, and other financial institutions. The following table sets forth the high and low intra-day sale prices per share for our common stock as reported on the NYSE for the period indicated:
|
|
Stock Price
|
|||||
|
|
High
|
Low
|
||||
|
Fiscal Year Ended December 31, 2017:
|
|
|
|
|
|
|
|
Second Quarter ended June 30, 2017
|
$
|
24.55
|
|
$
|
19.91
|
|
|
Third Quarter ended September 30, 2017
|
$
|
27.65
|
|
$
|
20.55
|
|
|
Fourth Quarter ended December 31, 2017
|
$
|
34.63
|
|
$
|
26.10
|
|
|
Fiscal Year Ended December 31, 2018:
|
|
|
|
|
|
|
|
First Quarter ended March 31, 2018
|
$
|
38.00
|
|
$
|
29.93
|
|
|
Second Quarter ended June 30, 2018 (through April 27, 2018)
|
$
|
33.16
|
|
$
|
28.97
|
|
The closing sale price of our common stock, as reported by the NYSE, on April 27, 2018, was $31.84. American Stock Transfer & Trust Company, LLC is the transfer agent and registrar for our common stock.
38
SELECTED HISTORICAL CONSOLIDATED FINANCIAL DATA
Set forth below is our selected historical consolidated financial data as of the dates and for the periods indicated. The selected historical consolidated financial data as of March 31, 2018 and for each of the three months ended March 31, 2018 and March 31, 2017 have been derived from our unaudited condensed consolidated financial statements and related notes thereto incorporated by reference in this prospectus, which have been prepared on the same basis as our audited consolidated financial statements. The selected historical consolidated financial data as of December 31, 2017 and 2016 and for the fiscal years ended December 31, 2017, 2016 and 2015 have been derived from our audited consolidated financial statements and related notes thereto incorporated by reference in this prospectus. The selected historical consolidated financial data as of December 31, 2015 and 2014, for the fiscal year ended December 31, 2014 and for the period from July 30, 2013 through December 31, 2013 have been derived from our consolidated financial statements and related notes thereto not included or incorporated by reference in this prospectus. The selected historical consolidated financial data as of July 29, 2013 and for the period from January 1, 2013 through July 29, 2013 have been derived from the consolidated financial statements and related notes thereto of Gardner Denver, Inc., our “accounting predecessor,” not included or incorporated by reference in this prospectus.
Selected historical consolidated financial data are presented for two periods: Predecessor and Successor, which relate to the period preceding the KKR Transaction and the period succeeding the KKR Transaction, respectively. The Company refers to the operations of our accounting predecessor and its subsidiaries for the Predecessor period and the operations of Gardner Denver Holdings, Inc. (formerly known as Renaissance Parent Corp.) and subsidiaries for the Successor periods. The Successor and Predecessor financial statements are not comparable as a result of the application of acquisition accounting and changes in the Company’s capital structure resulting from the KKR Transaction.
The selected historical consolidated financial data set forth below should be read in conjunction with, and are qualified by reference to “Management’s Discussion and Analysis of Financial Condition and Results of Operations” contained in our Annual Report and in our Quarterly Report and our consolidated financial statements and related notes thereto incorporated by reference in this prospectus.
|
|
For the Three Months Ended
|
Successor
|
Predecessor
|
|||||||||||||||||||||
|
|
March 31,
|
Year Ended December 31,
|
July 30, 2013 –
December 31, 2013 |
January 1, 2013 –
July 29, 2013 |
||||||||||||||||||||
|
(in millions, except per share amounts)
|
2018
|
2017
|
2017
|
2016
|
2015
|
2014
|
||||||||||||||||||
|
Consolidated Statements of Operations:
|
|
|
|
|
|
|
|
|
|
|
|
|
|
|
|
|
|
|
|
|
|
|
|
|
|
Revenues
|
$
|
619.6
|
|
$
|
481.7
|
|
$
|
2,375.4
|
|
$
|
1,939.4
|
|
$
|
2,126.9
|
|
$
|
2,570.0
|
|
$
|
978.4
|
|
$
|
1,231.6
|
|
|
Cost of sales
|
|
387.7
|
|
|
307.1
|
|
|
1,477.5
|
|
|
1,222.7
|
|
|
1,347.8
|
|
|
1,633.2
|
|
|
666.5
|
|
|
799.5
|
|
|
Gross profit
|
|
231.9
|
|
|
174.6
|
|
|
897.9
|
|
|
716.7
|
|
|
779.1
|
|
|
936.8
|
|
|
311.9
|
|
|
432.1
|
|
|
Selling and administrative expenses(1)
|
|
106.9
|
|
|
102.3
|
|
|
446.6
|
|
|
414.3
|
|
|
427.0
|
|
|
476.0
|
|
|
193.7
|
|
|
263.8
|
|
|
Amortization of intangible assets
|
|
30.9
|
|
|
27.6
|
|
|
118.9
|
|
|
124.2
|
|
|
115.4
|
|
|
113.3
|
|
|
111.9
|
|
|
9.9
|
|
|
Impairment of goodwill
|
|
—
|
|
|
—
|
|
|
—
|
|
|
—
|
|
|
343.3
|
|
|
220.6
|
|
|
—
|
|
|
—
|
|
|
Impairment of other intangible assets
|
|
—
|
|
|
—
|
|
|
1.6
|
|
|
25.3
|
|
|
78.1
|
|
|
14.4
|
|
|
—
|
|
|
—
|
|
|
Other operating expense, net
|
|
4.3
|
|
|
7.9
|
|
|
222.1
|
|
|
48.6
|
|
|
20.7
|
|
|
64.3
|
|
|
76.9
|
|
|
46.5
|
|
|
Operating income (loss)
|
|
89.8
|
|
|
36.8
|
|
|
108.7
|
|
|
104.3
|
|
|
(205.4
|
)
|
|
48.2
|
|
|
(70.6
|
)
|
|
111.9
|
|
|
Interest expense
|
|
26.0
|
|
|
45.9
|
|
|
140.7
|
|
|
170.3
|
|
|
162.9
|
|
|
164.4
|
|
|
65.4
|
|
|
6.6
|
|
|
Loss on extinguishment of debt
|
|
—
|
|
|
—
|
|
|
84.5
|
|
|
—
|
|
|
—
|
|
|
—
|
|
|
—
|
|
|
—
|
|
|
Other income, net(1)
|
|
(2.0
|
)
|
|
(0.5
|
)
|
|
(3.8
|
)
|
|
(2.8
|
)
|
|
(1.6
|
)
|
|
(3.3
|
)
|
|
(2.1
|
)
|
|
(2.0
|
)
|
|
Income (loss) before income taxes
|
|
65.8
|
|
|
(8.6
|
)
|
|
(112.7
|
)
|
|
(63.2
|
)
|
|
(366.7
|
)
|
|
(112.9
|
)
|
|
(133.9
|
)
|
|
107.3
|
|
|
Provision (benefit) for income taxes
|
|
23.4
|
|
|
(1.6
|
)
|
|
(131.2
|
)
|
|
(31.9
|
)
|
|
(14.7
|
)
|
|
23.0
|
|
|
(59.4
|
)
|
|
35.4
|
|
|
Net income (loss)
|
|
42.4
|
|
|
(7.0
|
)
|
|
18.5
|
|
|
(31.3
|
)
|
|
(352.0
|
)
|
|
(135.9
|
)
|
|
(74.5
|
)
|
|
71.9
|
|
|
Less: Net income (loss) attributable to noncontrolling interests
|
|
—
|
|
|
0.1
|
|
|
0.1
|
|
|
5.3
|
|
|
(0.8
|
)
|
|
(0.9
|
)
|
|
(1.1
|
)
|
|
0.7
|
|
|
Net income (loss) attributable to Gardner Denver Holdings, Inc.
|
$
|
42.4
|
|
$
|
(7.1
|
)
|
$
|
18.4
|
|
$
|
(36.6
|
)
|
$
|
(351.2
|
)
|
$
|
(135.0
|
)
|
$
|
(73.4
|
)
|
$
|
71.2
|
|
|
Basic earnings (loss) per share
|
$
|
0.21
|
|
$
|
(0.05
|
)
|
$
|
0.10
|
|
$
|
(0.25
|
)
|
$
|
(2.35
|
)
|
$
|
(0.91
|
)
|
|
|
|
|
|
|
|
Diluted earnings (loss) per share
|
$
|
0.20
|
|
$
|
(0.05
|
)
|
$
|
0.10
|
|
$
|
(0.25
|
)
|
$
|
(2.35
|
)
|
$
|
(0.91
|
)
|
|
|
|
|
|
|
39
|
|
For the Three Months Ended
|
Successor
|
Predecessor
|
|||||||||||||||||||||
|
|
March 31,
|
Year Ended December 31,
|
July 30, 2013 –
December 31, 2013 |
January 1, 2013 –
July 29, 2013 |
||||||||||||||||||||
|
(in millions)
|
2018
|
2017
|
2017
|
2016
|
2015
|
2014
|
||||||||||||||||||
|
Weighted average shares outstanding:
|
|
|
|
|
|
|
|
|
|
|
|
|
|
|
|
|
|
|
|
|
|
|
|
|
|
Basic
|
|
201.6
|
|
|
148.5
|
|
|
182.2
|
|
|
149.2
|
|
|
149.6
|
|
|
148.9
|
|
|
|
|
|
|
|
|
Diluted
|
|
209.9
|
|
|
148.5
|
|
|
188.4
|
|
|
149.2
|
|
|
149.6
|
|
|
148.9
|
|
|
|
|
|
|
|
|
Statement of Cash Flow Data:
|
|
|
|
|
|
|
|
|
|
|
|
|
|
|
|
|
|
|
|
|
|
|
|
|
|
Cash flows – operating activities
|
$
|
60.2
|
|
$
|
(2.6
|
)
|
$
|
200.5
|
|
$
|
165.6
|
|
$
|
172.1
|
|
$
|
141.8
|
|
$
|
(15.2
|
)
|
$
|
77.4
|
|
|
Cash flows – investing activities
|
|
(102.0
|
)
|
|
(16.6
|
)
|
|
(60.8
|
)
|
|
(82.1
|
)
|
|
(84.0
|
)
|
|
(155.4
|
)
|
|
(3,806.7
|
)
|
|
(15.1
|
)
|
|
Cash flows – financing activities
|
|
(8.2
|
)
|
|
(13.3
|
)
|
|
(17.4
|
)
|
|
(43.0
|
)
|
|
(35.0
|
)
|
|
(3.7
|
)
|
|
3,929.5
|
|
|
(205.0
|
)
|
|
|
|
|
|
|
|
|
|
|
|
|
|
|
|
|
|
|
|
|
|
|
|
|
|
|
|
Balance Sheet Data (at period end):
|
|
|
|
|
|
|
|
|
|
|
|
|
|
|
|
|
|
|
|
|
|
|
|
|
|
Cash and cash equivalents
|
$
|
353.8
|
|
|
|
|
$
|
393.3
|
|
$
|
255.8
|
|
$
|
228.3
|
|
$
|
184.2
|
|
$
|
218.7
|
|
$
|
107.4
|
|
|
Total assets
|
|
4,775.4
|
|
|
|
|
|
4,621.2
|
|
|
4,316.0
|
|
|
4,462.0
|
|
|
5,107.1
|
|
|
5,420.7
|
|
|
2,376.4
|
|
|
Total liabilities
|
|
3,207.7
|
|
|
|
|
|
3,144.4
|
|
|
4,044.2
|
|
|
4,056.5
|
|
|
4,218.5
|
|
|
4,226.4
|
|
|
847.3
|
|
|
Total stockholders’ equity
|
|
1,567.7
|
|
|
|
|
|
1,476.8
|
|
|
271.8
|
|
|
405.5
|
|
|
888.6
|
|
|
1,194.3
|
|
|
1,529.1
|
|
|
|
|
|
|
|
|
|
|
|
|
|
|
|
|
|
|
|
|
|
|
|
|
|
|
|
|
Other financial Data:
|
|
|
|
|
|
|
|
|
|
|
|
|
|
|
|
|
|
|
|
|
|
|
|
|
|
Adjusted EBITDA(2)
|
$
|
148.2
|
|
$
|
92.1
|
|
$
|
561.5
|
|
$
|
400.7
|
|
$
|
418.9
|
|
|
|
|
|
|
|
|
|
|
|
Adjusted Net Income(2)
|
|
80.7
|
|
|
20.1
|
|
|
249.3
|
|
|
133.6
|
|
|
128.1
|
|
|
|
|
|
|
|
|
|
|
|
Capital expenditures
|
|
10.1
|
|
|
16.4
|
|
|
56.8
|
|
|
74.4
|
|
|
71.0
|
|
|
|
|
|
|
|
|
|
|
|
Free Cash Flow(2)
|
|
50.1
|
|
|
(19.0
|
)
|
|
143.7
|
|
|
91.2
|
|
|
101.1
|
|
|
|
|
|
|
|
|
|
|
| (1) | In the first quarter of fiscal year 2018, the Company adopted the provisions of ASU 2017-07, Compensation — Retirement Benefits (Topic 715): Improving the Presentation of Net Periodic Pension Cost and Net periodic Postretirement Benefit Cost (“ASU 2017-07”). The following table summarizes the impacts of the retrospective adoption of ASU 2017-07 on the Company’s consolidated financial statements incorporated by reference in this prospectus. |
|
|
Year Ended December 31,
|
||||||||
|
(in millions)
|
2017
|
2016
|
2015
|
||||||
|
Selling and administrative expenses, as reported
|
$
|
446.6
|
|
$
|
414.3
|
|
$
|
427.0
|
|
|
Adjustments
|
|
(0.4
|
)
|
|
0.8
|
|
|
4.0
|
|
|
Selling and administrative expenses, as adjusted
|
$
|
446.2
|
|
$
|
415.1
|
|
$
|
431.0
|
|
|
|
Year Ended December 31,
|
||||||||
|
(in millions)
|
2017
|
2016
|
2015
|
||||||
|
Other income, net, as reported
|
$
|
(3.8
|
)
|
$
|
(2.8
|
)
|
$
|
(1.6
|
)
|
|
Adjustments
|
|
0.4
|
|
|
(0.8
|
)
|
|
(4.0
|
)
|
|
Other income, net, as adjusted
|
$
|
(3.4
|
)
|
$
|
(3.6
|
)
|
$
|
(5.6
|
)
|
| (2) | We report our financial results in accordance with GAAP. To supplement this information, we also use the following measures in this prospectus: “Adjusted EBITDA,” “Adjusted Net Income” and “Free Cash Flow.” Management believes that Adjusted EBITDA and Adjusted Net Income are helpful supplemental measures to assist us and investors in evaluating our operating results as they exclude certain items whose fluctuation from period to period do not necessarily correspond to changes in the operations of our business. Adjusted EBITDA represents net (loss) income before interest, taxes, depreciation and amortization, as further adjusted to exclude certain non-cash, non-recurring and other adjustment items. We believe that the adjustments applied in presenting Adjusted EBITDA are appropriate to provide additional information to investors about certain material non-cash items and about non-recurring items that we do not expect to continue at the same level in the future. Adjusted Net Income is defined as net income (loss) including interest, depreciation and amortization of non-acquisition related intangible assets and excluding other items used to calculate Adjusted EBITDA and further adjusted for the tax effect of these exclusions. |
We use Free Cash Flow to review the liquidity of our operations. We measure Free Cash Flow as cash flows from operating activities less capital expenditures. We believe Free Cash Flow is a useful supplemental financial measure for us and investors in assessing our ability to pursue business opportunities and investments and to service our debt. Free Cash Flow is not a measure of our liquidity under GAAP and should not be considered as an alternative to cash flows from operating activities.
As a result, we and our board of directors regularly use these measures as tools in evaluating our operating and financial performance and in establishing discretionary annual compensation. Such measures are provided in addition to, and should not be considered to be a substitute for, or superior to, the comparable measure under GAAP. In addition, we believe that Adjusted EBITDA, Adjusted Net Income and Free Cash Flow are frequently used by investors, analysts and other interested parties in the evaluation of issuers, many of which also present Adjusted EBITDA, Adjusted Net Income and Free Cash Flow when reporting their results in an effort to facilitate an understanding of their operating and financial results and liquidity.
40
Adjusted EBITDA, Adjusted Net Income and Free Cash Flow should not be considered as alternatives to net income (loss) or other performance measures calculated in accordance with GAAP, or as alternatives to cash flow from operating activities as a measure of our liquidity. Adjusted EBITDA, Adjusted Net Income and Free Cash Flow have limitations as analytical tools, and you should not consider such measures either in isolation or as substitutes for analyzing our results as reported under GAAP.
Set forth below are the reconciliations of net income (loss) to Adjusted EBITDA and Adjusted Net Income and cash flows from operating activities to Free Cash Flow.
|
|
For the Three Months Ended
March 31, |
Year Ended December 31,
|
|||||||||||||
|
(in millions)
|
2018
|
2017
|
2017
|
2016
|
2015
|
||||||||||
|
Net income (loss)
|
$
|
42.4
|
|
$
|
(7.0
|
)
|
$
|
18.5
|
|
$
|
(31.3
|
)
|
$
|
(352.0
|
)
|
|
Plus:
|
|
|
|
|
|
|
|
|
|
|
|
|
|
|
|
|
Interest expense
|
|
26.0
|
|
|
45.9
|
|
|
140.7
|
|
|
170.3
|
|
|
162.9
|
|
|
Provision (benefit) for income taxes
|
|
23.4
|
|
|
(1.6
|
)
|
|
(131.2
|
)
|
|
(31.9
|
)
|
|
(14.7
|
)
|
|
Depreciation expense
|
|
14.1
|
|
|
12.1
|
|
|
54.9
|
|
|
48.5
|
|
|
47.6
|
|
|
Amortization expense(a)
|
|
30.9
|
|
|
27.6
|
|
|
118.9
|
|
|
124.2
|
|
|
115.4
|
|
|
Impairment of goodwill and other intangible assets(b)
|
|
—
|
|
|
—
|
|
|
1.6
|
|
|
25.3
|
|
|
421.4
|
|
|
Sponsor fees and expenses(c)
|
|
—
|
|
|
1.1
|
|
|
17.3
|
|
|
4.8
|
|
|
4.6
|
|
|
Restructuring and related business transformation costs(d)
|
|
4.5
|
|
|
8.6
|
|
|
24.7
|
|
|
78.7
|
|
|
31.4
|
|
|
Acquisition related expenses and non-cash charges(e)
|
|
4.6
|
|
|
0.7
|
|
|
4.1
|
|
|
4.3
|
|
|
4.8
|
|
|
Environmental remediation loss reserve(f)
|
|
—
|
|
|
1.0
|
|
|
0.9
|
|
|
5.6
|
|
|
—
|
|
|
Expenses related to public stock offerings(g)
|
|
1.4
|
|
|
1.3
|
|
|
4.1
|
|
|
—
|
|
|
—
|
|
|
Establish public company financial reporting compliance(h)
|
|
0.8
|
|
|
1.3
|
|
|
8.1
|
|
|
0.2
|
|
|
—
|
|
|
Stock-based compensation(i)
|
|
2.7
|
|
|
—
|
|
|
194.2
|
|
|
—
|
|
|
—
|
|
|
Loss on extinguishment of debt(j)
|
|
—
|
|
|
—
|
|
|
84.5
|
|
|
—
|
|
|
—
|
|
|
Foreign currency transaction losses (gains), net
|
|
2.6
|
|
|
0.6
|
|
|
9.3
|
|
|
(5.9
|
)
|
|
1.1
|
|
|
Shareholder litigation settlement recoveries(k)
|
|
(4.5
|
)
|
|
—
|
|
|
—
|
|
|
—
|
|
|
—
|
|
|
Other adjustments(l)
|
|
(0.7
|
)
|
|
0.5
|
|
|
10.9
|
|
|
7.9
|
|
|
(3.6
|
)
|
|
Adjusted EBITDA
|
$
|
148.2
|
|
$
|
92.1
|
|
$
|
561.5
|
|
$
|
400.7
|
|
$
|
418.9
|
|
|
Minus:
|
|
|
|
|
|
|
|
|
|
|
|
|
|
|
|
|
Interest expense
|
$
|
26.0
|
|
$
|
45.9
|
|
|
140.7
|
|
|
170.3
|
|
|
162.9
|
|
|
Income tax provision, as adjusted(m)
|
|
24.5
|
|
|
12.2
|
|
|
105.4
|
|
|
34.7
|
|
|
71.9
|
|
|
Depreciation expense
|
|
14.1
|
|
|
12.1
|
|
|
54.9
|
|
|
48.5
|
|
|
47.6
|
|
|
Amortization of non-acquisition related intangible assets
|
|
2.9
|
|
|
1.8
|
|
|
11.2
|
|
|
13.6
|
|
|
8.4
|
|
|
Adjusted Net Income
|
$
|
80.7
|
|
$
|
20.1
|
|
$
|
249.3
|
|
$
|
133.6
|
|
$
|
128.1
|
|
|
Free Cash Flow
|
|
|
|
|
|
|
|
|
|
|
|
|
|
|
|
|
Cash flows – operating activities
|
$
|
60.2
|
|
$
|
(2.6
|
)
|
$
|
200.5
|
|
$
|
165.6
|
|
$
|
172.1
|
|
|
Minus:
|
|
|
|
|
|
|
|
|
|
|
|
|
|
|
|
|
Capital expenditures
|
|
10.1
|
|
|
16.4
|
|
|
56.8
|
|
|
74.4
|
|
|
71.0
|
|
|
Free Cash Flow
|
$
|
50.1
|
|
$
|
(19.0
|
)
|
$
|
143.7
|
|
$
|
91.2
|
|
$
|
101.1
|
|
| (a) | Represents $28.0 million, $25.8 million, $107.7 million, $110.6 million and $107.0 million of amortization of intangible assets arising from the KKR Transaction and other acquisitions (customer relationships and trademarks) and $2.9 million, $1.8 million, $11.2 million, $13.6 million and $8.4 million of amortization of non-acquisition related intangible assets, in each case for the three months ended March 31, 2018, the three months ended March 31, 2017 and the years ended 2017, 2016 and 2015, respectively. |
| (b) | Represents non-cash charges for impairment of goodwill and other intangible assets. |
| (c) | Represents management fees paid to our Sponsor pursuant to a monitoring agreement, which was terminated on May 17, 2017. See “Certain Relationships and Related Party Transactions—Arrangements with Our Sponsor—Monitoring Agreement.” |
41
| (d) | Restructuring and related business transformation costs consist of the following: |
|
|
For the Three Months Ended
March 31, |
Year Ended December 31,
|
|||||||||||||
|
(in millions)
|
2018
|
2017
|
2017
|
2016
|
2015
|
||||||||||
|
Restructuring charges
|
$
|
—
|
|
$
|
1.7
|
|
$
|
5.3
|
|
$
|
32.9
|
|
$
|
4.7
|
|
|
Severance, sign-on, relocation and executive search costs
|
|
2.0
|
|
|
1.0
|
|
|
3.5
|
|
|
22.4
|
|
|
18.4
|
|
|
Facility reorganization, relocation and other costs
|
|
0.6
|
|
|
1.1
|
|
|
5.3
|
|
|
8.7
|
|
|
1.6
|
|
|
Information technology infrastructure transformation
|
|
—
|
|
|
0.7
|
|
|
5.2
|
|
|
2.3
|
|
|
—
|
|
|
(Gains) losses on asset and business disposals
|
|
(1.2
|
)
|
|
3.0
|
|
|
0.8
|
|
|
0.1
|
|
|
(4.5
|
)
|
|
Consultant and other advisor fees
|
|
2.6
|
|
|
0.4
|
|
|
1.7
|
|
|
9.7
|
|
|
10.1
|
|
|
Other, net
|
|
0.5
|
|
|
0.7
|
|
|
2.9
|
|
|
2.6
|
|
|
1.1
|
|
|
Total restructuring and related business transformation costs
|
$
|
4.5
|
|
$
|
8.6
|
|
$
|
24.7
|
|
$
|
78.7
|
|
$
|
31.4
|
|
| (e) | Represents costs associated with successful and/or abandoned acquisitions, including third-party expenses, post-closure integration costs and non-cash charges and credits arising from fair value purchase accounting adjustments. |
| (f) | Represents estimated environmental remediation costs and losses relating to a former production facility. |
| (g) | Represents certain expenses related to the Company’s initial public offering and subsequent secondary offerings. |
| (h) | Represents third party expenses to comply with the requirements of Sarbanes-Oxley in 2018 and the accelerated adoption of the new revenue recognition standard (ASC 606 - Revenue from Contracts with Customers) in the first quarter of 2018, one year ahead of the adoption date for a private company. These expenses were previously included in “Expenses related to initial public offering” and prior periods have been restated to conform to current period presentation. |
| (i) | For the three months ended March 31, 2018, represents stock-based compensation expense recognized of $3.4 million reduced by a $0.7 million decrease in the accrual for employer taxes related to DSUs granted to employees at the date of the initial public offering. For the year ended December 31, 2017, represents stock-based compensation expense recognized for stock options outstanding ($77.6 million), DSUs granted to employees at the date of the initial public offering ($97.4 million) under the 2013 Stock Incentive Plan and employer taxes related to DSUs granted to employees at the date of the initial public offering ($19.2 million). Prior to the Company’s initial public offering, which occurred in May 2017, no stock compensation was recorded because the Company’s repurchase rights created an implicit service period. |
| (j) | Represents losses on extinguishment of debt recognized on the redemption of the senior notes and a portion of Original Dollar Term Loan Facility with proceeds from the initial public offering in May 2017 ($50.4 million) and in connection with the refinancing of the Original Dollar Term Loan Facility and Original Euro Term Loan Facility in August 2017 ($34.1 million). |
| (k) | Represents an insurance recovery of the Company’s shareholder litigation settlement in 2014. |
| (l) | Includes (i) non-cash impact of net LIFO reserve adjustments, (ii) effects of amortization of prior service costs and amortization of gains in pension and other postemployment benefits (OPEB) expense, (iii) certain legal and compliance costs and (iv) other miscellaneous adjustments. |
| (m) | Represents our income tax provision adjusted for the tax effect of pre-tax items excluded from Adjusted Net Income and the removal of the applicable discrete tax items. The tax effect of pre-tax items excluded from Adjusted Net Income is computed using the statutory tax rate related to the jurisdiction that was impacted by the adjustment after taking into account the impact of permanent differences and valuation allowances. Discrete tax items include changes in tax laws or rates, changes in uncertain tax positions relating to prior years and changes in valuation allowances. All impacts relating to the U.S. Tax Act have been included as an adjustment in the table below. |
Income tax provision, as adjusted for each of the periods presented below consists of the following:
|
|
For the Three Months Ended
March 31, |
Year Ended December 31,
|
|||||||||||||
|
(in millions)
|
2018
|
2017
|
2017
|
2016
|
2015
|
||||||||||
|
Provision (benefit) for income taxes
|
$
|
23.4
|
|
$
|
(1.6
|
)
|
$
|
(131.2
|
)
|
$
|
(31.9
|
)
|
$
|
(14.7
|
)
|
|
Tax impact of pre-tax income adjustments
|
|
8.9
|
|
|
12.8
|
|
|
139.3
|
|
|
71.8
|
|
|
76.7
|
|
|
Tax law change
|
|
(7.9
|
)
|
|
—
|
|
|
95.3
|
|
|
—
|
|
|
—
|
|
|
Discrete tax items
|
|
0.1
|
|
|
1.0
|
|
|
2.0
|
|
|
(5.2
|
)
|
|
9.9
|
|
|
Income tax provision, as adjusted
|
$
|
24.5
|
|
$
|
12.2
|
|
$
|
105.4
|
|
$
|
34.7
|
|
$
|
71.9
|
|
42
Our Company
We are a leading global provider of mission-critical flow control and compression equipment and associated aftermarket parts, consumables and services, which we sell across multiple attractive end-markets within the industrial, energy and medical industries. We manufacture one of the broadest and most complete ranges of compressor, pump, vacuum and blower products in our markets, which, combined with our global geographic footprint and application expertise, allows us to provide differentiated product and service offerings to our customers. Our products are sold under a collection of premier, market-leading brands, including Gardner Denver, CompAir, Nash, Emco Wheaton, Robuschi, Elmo Rietschle and Thomas, which we believe are globally recognized in their respective end-markets and known for product quality, reliability, efficiency and superior customer service. These attributes, along with over 155 years of engineering heritage, generate strong brand loyalty for our products and foster long-standing customer relationships, which we believe have resulted in leading market positions within each of our operating segments. We have sales in more than 175 countries and our diverse customer base utilizes our products across a wide array of end-markets that have favorable near- and long-term growth prospects, including industrial manufacturing, energy (with particular exposure to the North American upstream land-based market), transportation, medical and laboratory sciences, food and beverage packaging and chemical processing.
Our products and services are critical to the processes and systems in which they are utilized, which are often complex and function in harsh conditions where the cost of failure or downtime is high. However, our products typically represent only a small portion of the costs of the overall systems or functions that they support. As a result, our customers place a high value on our application expertise, product reliability and the responsiveness of our service. To support our customers and market presence, we maintain significant global scale with 39 key manufacturing facilities, more than 30 complementary service and repair centers across six continents and approximately 6,600 employees worldwide as of March 31, 2018.
The process-critical nature of our product applications, coupled with the standard wear and tear replacement cycles associated with the usage of our products, generates opportunities to support customers with our broad portfolio of aftermarket parts, consumables and services. Customers place a high value on minimizing any time their operations are offline. As a result, the availability of replacement parts, consumables and our repair and support services are key components of our value proposition. Our large installed base of products provides a recurring revenue stream through our aftermarket parts, consumables and services offerings. As a result, our aftermarket revenue is significant, representing 41% of total Company revenue and approximately 45% of our combined Industrials and Energy segments’ revenue in 2017.
Our top priority since the completion of the KKR Transaction has been the transformation of our business, which we have driven by investing in our corporate and business leadership team, expanding our commercial reach, improving our operational capabilities and creating a performance-driven organization. We focused heavily on adding executive talent to our Company. Led by our CEO, Vicente Reynal, our senior leadership team was significantly reconstituted and expanded, which we believe brought together deep expertise from leading global industrial organizations. With the senior leadership team in place, our focus turned to driving strong revenue and earnings growth centered on five primary objectives: (i) enhancing commercial leadership by expanding our sales and service presence, adding product line adjacencies and accelerating our innovation funnel; (ii) driving aftermarket sales penetration of our large installed base; (iii) further improving our competitive position with our customers through salesforce effectiveness programs; (iv) executing our operational excellence initiatives to streamline our cost structure and support margin expansion, including through manufacturing footprint optimization, administrative expense efficiency and strategic sourcing; and (v) pursuing acquisitions focused on bolstering our product offerings and/or geographic or market presence. These initiatives have significantly improved our underlying operating performance since the KKR Transaction and we believe they have laid the foundation for ongoing value creation. Some examples of the improvement achieved from 2014 to 2016 include:
| • | growing our Energy and Medical Segment Revenue by mid-single digit growth rates, excluding in each case the impact of the significant downturn in the upstream energy market and currency volatility; |
| • | growing Segment Adjusted EBITDA and meaningfully expanding Segment Adjusted EBITDA margins each year across all of our segments, excluding the impact of the significant downturn in the upstream energy market and currency volatility; |
43
| • | strengthening our customer service and connectivity by transitioning our sales team and realigning our product engineering and marketing teams in our Industrials segment into an integrated, global product and customer management structure; |
| • | transforming our upstream energy offering from being predominantly a pump manufacturer into a full service solutions provider that offers high quality, locally accessible aftermarket support, with our upstream energy service network expanding coverage by 160% since 2012 to now cover approximately 85% of all current North American land drilling activity; and |
| • | expanding our Industrials segment aftermarket revenues as a percentage of Industrials Segment Revenue from approximately 33% in 2014 to 35% in 2016. |
We believe the establishment and continued execution of our operational and strategic growth initiatives have positioned our Company for substantial revenue and Adjusted EBITDA growth with continued potential to expand margins. In 2017, we built upon this foundation, with 22.5% year-over-year revenue growth, net income of $18.5 million (compared to a $31.3 million net loss in 2016) and, Adjusted EBITDA of $561.5 million, an increase of 40.1% over the prior year, and Adjusted EBITDA margin of 23.6%, an increase of 290 basis points over the prior year.
In 2017, the Company generated approximately $2.4 billion of revenue. The following charts depict our 2017 revenues by geographic region, business segment, end-market and product specification:

| (1) | Our geographic regions are grouped into the Americas; EMEA; and APAC. Americas represented 36%, 71% and 37% of our Industrial, Energy and Medical segment revenues, respectively. EMEA represented 50%, 19% and 44% of our Industrial, Energy and Medical segment revenues, respectively. APAC represented 14%, 10% and 19% of our Industrial, Energy and Medical segment revenues, respectively. |
| (2) | The classification of end-markets for sales made through independent distributors (rather than through direct sales to end-users) is based on an assessment of the distribution channels through which such sales are made. |
44
As part of our business transformation, we reorganized our Company into three business segments because of the unique sales drivers and market characteristics of each. Our Industrials segment has strong aftermarket revenues and a growth profile that is driven predominantly by industrial production and GDP growth across both developed and emerging markets, as well as by customer demand for energy efficiency, a lower total cost of ownership and improved functionality. Our Energy segment also benefits from strong aftermarket revenues, but has growth characteristics that are driven by upstream, midstream and downstream energy dynamics and, as such, is well-positioned to capitalize on a recovery in the upstream market. Finally, our Medical segment growth is driven by medical equipment and laboratory end-markets, which experience different dynamics than our Industrials and Energy segments, but which demand products that share the same mission-critical flow control attributes. Together, our Industrials, Energy and Medical segments create a diverse portfolio with exposure to highly attractive end-markets, significant aftermarket revenues, upside from an upstream energy recovery and positive secular trends across all segments.
An overview of select financial metrics and key product categories for each of our segments follows:
|
|
Industrials Segment
|
Energy Segment
|
Medical Segment
|
|
2017 Segment Revenue
|
$1,130.7 million
|
$1,014.5 million
|
$230.2 million
|
|
2017 Segment Adjusted EBITDA
|
$242.7 million
|
$296.1 million
|
$62.4 million
|
|
2017 Segment Adjusted EBITDA margin
|
21.5%
|
29.2%
|
27.1%
|
|
|
|
|
|
|
Key Product Categories
|
• Compressors
• Vacuum Products • Blower Products |
• Drilling, Frac and
Well Servicing Pumps • Liquid Ring Pumps and Compressors • Engineered Loading Systems |
• Compressors
• Vacuum Products • Liquid Pumps |
| • | Industrials: We design, manufacture, market and service a broad range of air compression, vacuum and blower products, including associated aftermarket parts, consumables and services, across a wide array of technologies and applications for use in diverse end-markets. Compressors are used to increase the pressure of air or gas, vacuum products are used to remove air or gas in order to reduce the pressure below atmospheric levels, and blower products are used to produce a high volume of air or gas at low pressure. Almost every manufacturing and industrial facility, and many service and process industry applications, use air compression, vacuum and blower products in a variety of process-critical applications such as the operation of industrial air tools, vacuum packaging of food products and aeration of waste water, among others. |
We offer one of the broadest portfolios of compression, vacuum and blower technology in our markets which we believe, alongside our geographic footprint, allows us to provide differentiated service to our customers globally and maintain leading positions in many of our end-markets. Our compression products cover the full range of technologies, including rotary screw, reciprocating piston, scroll, rotary vane and centrifugal compressors. Our vacuum products and blowers also cover the full technology spectrum; vacuum technologies include side channel, liquid ring, claw vacuum, screw and rotary vane vacuum pumps among others, while blower technologies include rotary lobe blowers, screw, claw and vane, turbo, side channel and radial blowers. We believe our ability to support custom industrial application needs from nearly full vacuum to approximately 7,000 pounds per square inch (psi) pressure levels makes us a partner of choice for many of our long-standing customers. The breadth and depth of our product offering creates incremental business opportunities by allowing us to cross-sell our full product portfolio and uniquely address customers’ needs in one complete solution.
We sell our industrial products through an integrated network of direct sales representatives and independent distributors, which is strategically tailored to meet the dynamics of each target geography or end-market. Our large installed base also provides for a significant stream of recurring aftermarket revenue. For example, on average, the useful life of a compressor is between 10 and 12 years. However, a customer typically services the compressor at regular intervals, starting within the first two years of purchase and continuing throughout the life of the product. The cumulative aftermarket revenue generated by a compressor over the product’s life cycle will typically exceed its original cost.
45
Industrial air compressors represent the largest market in which we compete in our Industrials segment and is a product category for which we believe there is significant potential to drive increased sales of our aftermarket parts, consumables and services. We use our direct salesforce and strong distributor relationships, the majority of which are exclusive to our business for the products that we sell through them, to sell our broad portfolio of aftermarket parts, consumables and services. Within our Industrials segment, we primarily sell through the Gardner Denver, CompAir, Elmo Rietschle and Robuschi brands, as well as other leading brand names.
| • | Energy: We design, manufacture, market and service a diverse range of positive displacement pumps, liquid ring vacuum pumps, compressors and integrated systems, engineered fluid loading and transfer equipment and associated aftermarket parts, consumables and services. The highly engineered products offered by our Energy segment serve customers across upstream, midstream and downstream energy markets, as well as petrochemical processing, transportation and general industrial sectors. We are one of the largest suppliers of equipment and associated aftermarket parts, consumables and services for the energy market applications that we serve. |
Our positive displacement pumps are fit-for-purpose to meet the demands and challenges of modern unconventional drilling and hydraulic fracturing activity, particularly in the major basins and shale plays in the North American land market. Our positive displacement pump offering includes mission-critical oil and gas drilling pumps, frac pumps and well servicing pumps, in addition to sales of associated consumables used in the operation of our pumps and aftermarket parts, consumables and services. The products we sell into upstream energy applications are highly aftermarket-intensive, and so we support these products in the field with one of the industry’s most comprehensive service networks, which encompasses locations across all major basins and shale plays in the North American land market. This North American land-based service network is critical to serving our customers and, by supporting them in the field, to generating demand for new original equipment sales. For example, fluid ends are key aftermarket parts used in hydraulic fracturing operations that represent approximately 30% of the original cost of the pump and need to be replaced approximately four times per year on each operating pump (depending on the basin and operating nature of the hydraulic fracturing fleet). Other aftermarket parts, such as plungers, and consumables, such as valves, seats and packing, are replaced on even shorter time frames, creating aftermarket opportunities which in aggregate are often multiples of the cost of the original pump.
Our liquid ring vacuum pumps and compressors are highly engineered products specifically designed for continuous duty in harsh environments to serve a wide range of applications, including oil and gas refining and processing, mining, chemical processing, petrochemical and industrial applications. Our liquid ring technology utilizes a service liquid to evacuate or compress gas by forming a rotating ring of liquid that acts like a piston to deliver an uninterrupted flow of gas without pulsation. In addition, our engineered fluid loading and transfer equipment and systems ensure the safe and efficient transportation and transfer of petroleum products as well as certain other liquid commodity products to serve a wide range of industries. Similar to our positive displacement pumps business, we complement these products with a broad array of aftermarket parts, service and repair capabilities by leveraging our global network of manufacturing and service locations to meet the diverse needs of our customers. Within our Energy segment, we primarily sell through the Gardner Denver, Nash and Emco Wheaton brands, as well as other leading brand names.
| • | Medical: We design, manufacture and market a broad range of highly specialized gas, liquid and precision syringe pumps and compressors that are specified by medical and laboratory equipment suppliers and integrated into their final equipment for use in applications, such as oxygen therapy, blood dialysis, patient monitoring, laboratory sterilization and wound treatment, among others. We offer a comprehensive product portfolio across a breadth of technologies to address the medical and laboratory sciences pump and fluid handling industry, as well as a range of end-use vacuum products for laboratory science applications, and we recently expanded into liquid pumps and automated liquid handling components and systems. Our product performance, quality and long-term reliability are often mission-critical in healthcare applications. We are one of the largest product suppliers in the medical markets we serve and have long-standing customer relationships with industry-leading medical and |
46
laboratory equipment providers. Additionally, many of our Medical segment gas and liquid pumps are also used in other technology applications beyond the medical and laboratory sciences. Within our Medical segment, we primarily sell through the Thomas brand, as well as other leading brand names.
Our Industries and Products
We operate in the global markets for flow control and air compression products for the industrial, energy and medical industries. Our highly engineered products and proprietary technologies are focused on serving specialized applications within these attractive and growing industries.
Industrials
Our Industrials segment designs, manufactures, markets and services a broad range of air compression, vacuum and blower products across a wide array of technologies. Compression, vacuum and blower products are used in a wide spectrum of applications in nearly all manufacturing and industrial facilities and many service and process industries in a variety of end-markets, including infrastructure, construction, transportation, food and beverage packaging and chemical processing.
Compression Products
Sales to industrial end-markets include industrial air compression products, as well as associated aftermarket parts, consumables and services. Industrial air compressors compress air to create pressure to power machinery, industrial tools, material handling systems and automated equipment. Compressed air is also used in applications as diversified as snow making and fish farming, on high-speed trains and in hospitals. Compressors can be either stationary or portable, depending on the requirements of the application or customer. Because compressed air is utilized as a core component in manufacturing operations in nearly every manufacturing plant, it is often referred to as the “fourth utility” (in addition to electricity, gas and water). The global industrial air compressor market is an estimated $13.2 billion industry, and according to Frost & Sullivan, we currently maintain a top three position in this market.
We focus on five basic types of air compression technologies: rotary screw, reciprocating piston, scroll, rotary vane and centrifugal compressors. Rotary screw compressors are a newer technology than reciprocating compressors and exhibit better suitability for continuous processes due to a more compact size, less maintenance and better noise profile. We believe our reciprocating piston compressors provide one of the broadest ranges of pressures in the market and are supported by increasing demand across wide-ranging attractive end-markets. Scroll compressors are most commonly seen where less oil-free air is needed, and is most commonly used in medical and food applications where the need for pure, clean and precise air is of great importance. Rotary vane compressors feature high efficiency, compact compression technology and can be found throughout all sectors of industry, including automotive, food and beverage, energy and manufacturing with specialist solutions within transit, gas and snow making. Centrifugal compressors are most effective when in applications that demand larger quantities of oil-free air and are utilized across a wide range of industries.
Vacuum Products
Industrial vacuum products are integral to manufacturing processes in applications for packaging, pneumatic conveying, drying, holding / lifting, distillation, evacuation, forming / pressing, removal and coating. Within each of these processes are a multitude of sub-applications. As an example of one such end-process, within packaging, a vacuum will be used on blister packaging, foil handling, labeling, carton erection, stacking and palletizing (placing, stacking or transporting goods on pallets), as well as central vacuum supply for entire packaging departments. Management believes that we hold a leading position in our addressable portion of the global vacuum products market.
We focus on five basic types of vacuum technologies: side channel, liquid ring, claw vacuum, screw and rotary vane vacuum pumps. Side channel vacuum pumps are used for conveying gases and gas-air mixtures in a variety of applications, including laser printers, packaging, soil treatment, textiles and food and beverage products. Liquid ring vacuum pumps are used for extreme conditions, which prevail in humid and wet processes across ceramics, environmental, medical and plastics applications. Claw vacuum pumps efficiently and economically generate contact-free vacuum for chemical, environmental and packaging applications. Screw
47
vacuum pumps are a dry running technology used to reduce the carbon footprint and life cycle costs in drying and packaging applications. Rotary vane vacuum pumps are used for vacuum and combined pressure and vacuum applications in the environmental, woodworking, packaging and food and beverage end-markets.
Blower Products
Blower products are used for conveying high volumes of air and gas at various flow rates and at low pressures, and are utilized in a broad range of industrial and environmental applications, including waste water aeration, biogas upgrading and conveying, pneumatic transport and dehydrating applications for food and beverage, cement, pharmaceutical, petrochemical and mobile industrial applications. We also design, manufacture, market and service frac sand blowers within our Industrials segment. In many cases, blowers are a core component for the operation of the entire end-users’ systems. Management believes that we hold a leading position in our addressable portion of the global blower products market.
We focus on several key technologies within blower products: rotary lobe, screw, claw and vane, turbo, side channel and radial blowers. Rotary lobe blowers, screw blowers and claw and vane blowers are positive displacement technologies that have the ability to consistently move the same volume of gas or air and vary the volume flow according to the speed of the machine itself enabling it to adapt the flow condition in a flexible manner despite pressure in the system. Turbo blowers and side channel and radial blowers are dynamic technologies that have the ability to accelerate gas or air through an impeller and transform their kinetic energy at the discharge with some limitation on flexibility.
Key Trends, Regional Macro Drivers and Outlook
Key trends for the Industrials segment include:
| • | Increased Innovation – Continuing customer desire for innovation and new technologies, such as remote monitoring, dry running technology and, generally, improvements in noise reduction, energy efficiency and savings, energy recovery and reduced CO2 emissions; |
| • | Product Monitoring – Increasing demand for service and monitoring of compressed air installations; |
| • | Value Placed on Total Cost – Growing focus on comprehensive solutions and total life cycle cost; |
| • | Desire for Product Adaptability – Rising need for adaptability of products to accommodate new applications for compressed air, compressed gas and vacuum; and |
| • | Maximized Product Uptime – Increasing customer expectations for product reliability combined with superior customer service, quick aftermarket support and regular maintenance to reduce downtime. |
The mission-critical nature of our industrial products across manufacturing processes drives a demand environment and outlook that are highly correlated with global and regional industrial production, capacity utilization and long-term GDP growth supported by the additional factors described above. In the United States and Europe, we are poised to continue benefiting from expected growth in real GDP according to the IMF, along with an expected continued rebound in industrial production activity in 2018 according to the EIA. In APAC, despite the recent deceleration, GDP growth remains robust and we believe we are well-positioned to benefit from the expected GDP growth, which is estimated by the IMF to be a multiple of anticipated growth in the Americas and EMEA through 2018.
48
The charts below highlight the expectations for global GDP growth and U.S. industrial production according to the IMF’s World Economic Outlook database as of October 2017, the IMF’s World Economic Outlook Update as of January 2018 and the EIA as of January 2018. We expect the U.S. industrial market to continue to accelerate in 2018 from a challenging 2015 and 2016.
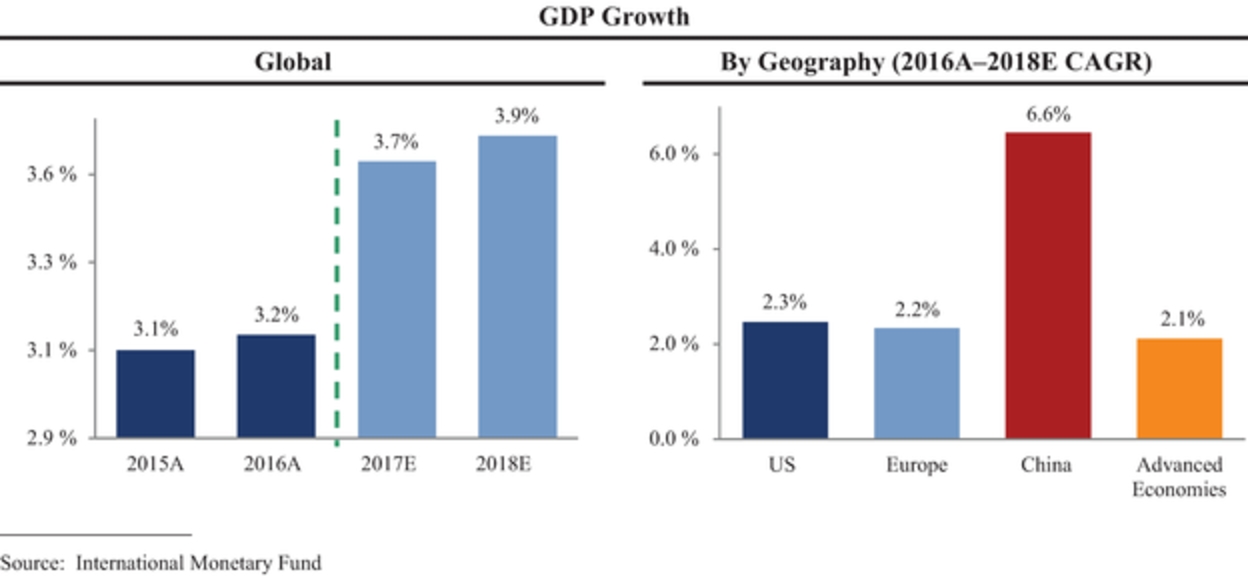

Competition
The industrial end-markets we serve are competitive, with an increasing focus on product quality, performance, energy efficiency, customer service and local presence. Although there are several large manufacturers of compression, vacuum and blower products, the marketplace for these products remains highly fragmented due to the wide variety of product technologies, applications and selling channels. Our principal competitors in sales of compression, vacuum and blower products in our Industrials segment include Atlas Copco AB, Ingersoll-Rand PLC, Colfax Corp., Flowserve Corporation, IDEX Corporation, Accudyne and Kaeser Compressors, Inc.
Energy
Our Energy segment designs, manufactures, markets and services a diverse range of positive displacement pumps, liquid ring vacuum pumps, compressors and integrated systems, engineered fluid loading and transfer equipment and associated aftermarket parts, consumables and services for a number of attractive, growing market
49
sectors with energy exposure, spanning upstream, midstream, downstream and petrochemical applications. The high cost of failure in these applications makes quality and reliability key purchase criteria for end-users and drives demand for our highly engineered and differentiated products.
Upstream
Through the manufacture and aftermarket service of pumps and manufacture of associated aftermarket parts and consumables used in drilling, hydraulic fracturing and well servicing applications, our Energy segment is well-positioned to capitalize on an upstream recovery, particularly in the North American land-based market, where our customers include market-leading hydraulic fracturing (also known as pressure pumping) and contract drilling service companies, as well as certain other types of well service companies. Sales to upstream energy end-markets consist of positive displacement pumps and associated aftermarket parts, most notably fluid ends, as well as consumables and services.
| • | Positive displacement pumps in the upstream energy end-market primarily move fluid to assist in drilling, hydraulic fracturing and well servicing applications. The majority of positive displacement pumps we sell are frac pumps, which experience significant service intensity during use in the field and, as such, typically have useful life spans of approximately four to six years before needing to be replaced. During that useful life, such pumps will need to receive intermittent repairs as well as major overhauls. In addition, we also sell positive displacement pumps that are used in drilling and well servicing applications. Spears & Associates, Inc. estimates that we have the second largest market share in the global frac pump market based on installed base, and management estimates that we have the largest market share based on new unit sales in the last four years. |
| • | Fluid ends are a key component of positive displacement pumps that generate the pumping action, along with other parts, such as plungers, and consumables, such as valves, seats and packing, which pressurizes the fluid, in the case of drilling or well servicing applications, or fluid and proppant mixture, in the case of hydraulic fracturing, and propels such fluid or mixture out of the pump and into a series of flow lines that distribute the fluid or mixture into the well. Fluid ends are incorporated in original equipment pumps, and due to the highly corrosive nature of the fluids and the abrasive nature of the proppants used in hydraulic fracturing operations, need to be frequently replaced. Specifically, fluid ends used in hydraulic fracturing operations represent approximately 30% of the original cost of the pump and need to be replaced approximately four times per year on each operating pump, depending on the basin and the operating nature of the hydraulic fracturing fleet. As such, fluid ends, other aftermarket parts and consumables represent a significant source of aftermarket product sales. |
The level of profitability at which new wells can be drilled is a primary driver of drilling and completions activities, including hydraulic fracturing. Thus, demand for our Energy and Industrials products exposed to the upstream energy industry is driven by the prices of crude oil and natural gas, and the intensity and activity levels of drilling and hydraulic fracturing. Importantly, according to Oil & Gas Financial Journal, the threshold oil price at which wells are profitable to drill has significantly decreased by an average across all U.S. shale plays of 47% from 2014 to 2016. As a result of this improvement in well profitability and the crude oil price improvement since the low points observed during the first half of 2016, an increased number of drilling rigs have reentered the market. However, it is important to note that while the crude oil price level has a meaningful impact on the level of activity in our upstream energy applications, the growth in demand for our products into such applications is significantly heightened by numerous other market dynamics and drivers (detailed below). We believe that these additional market dynamics result in our exposure to the upstream energy industry being among the most attractive in the present environment.
We believe we are exposed to some of the highest growth market drivers in the context of an upstream energy recovery. Secular industry trends are driving increased demand for and utilization of newer, fit-for-purpose equipment with innovations that increase productivity and are increasing the frequency of replacement, refurbishment and upgrade cycles of pumping equipment and associated consumable products used in drilling and hydraulic fracturing activity. The number of wells drilled is growing at a faster rate than active rig count with each active rig drilling more unconventional wells per unit of time than previously experienced. Further, each unconventional well, on average, is being drilled with longer laterals and more hydraulic fracturing stages per well. Moreover, this quickly growing demand for hydraulic fracturing horsepower, in conjunction with the usage of more volume of abrasive proppant per well, is resulting in accelerated wear and tear on frac pumps
50
and associated aftermarket parts and consumables. As a result, there are multiple drivers of growth in frac pumps and associated aftermarket parts, including fluid ends, consumables and services that are incremental to active rig count, creating a growth profile that is leveraged to, but meaningfully accelerated relative to, the active rig count.
Key trends include:
| • | Deferred Capital Expenditures and Frac Pump Replacement Cycle – During the broader industry downturn, many companies have deferred capital expenditures on maintenance and replacement of capital equipment, including pumps used in hydraulic fracturing and drilling applications. According to Spears & Associates, Inc., a large and growing percentage of the installed base of hydraulic fracturing is more than five years old and so may be operating beyond useful life according to industry best practices and safety standards, particularly in light of maintenance deferral that is likely to have reduced useful lives of components. Much of this capital equipment will require aftermarket parts, service or replacement before being safely put back into service. |
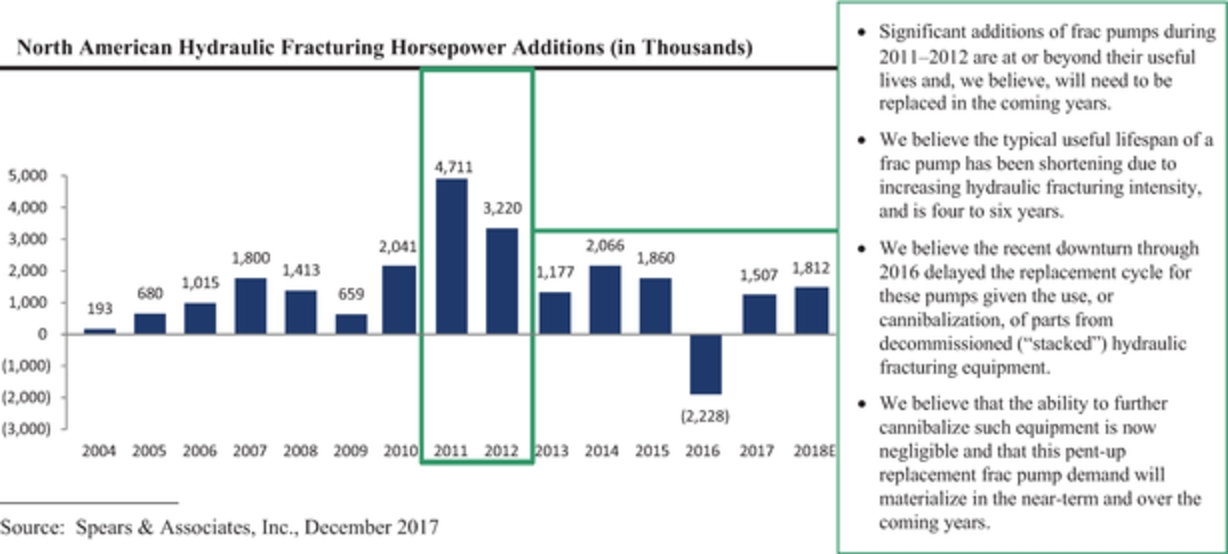
| • | Greater Percentage of Higher-Specification Drilling Rigs – Land-based drilling activity is trending towards using higher-specification drilling rigs that are more efficient in drilling shale oil and gas wells than older drilling rigs. Higher-specification drilling rigs are required for horizontal drilling operations, which increased to 84% of the active U.S. land-based drilling fleet in 2017 up from 53% in 2010. Higher-specification rigs that typically command higher day rates and utilization often have three to four drilling pumps per rig, as compared to two for older and less efficient drilling rigs, and the pumps used are often specified at higher flow pressures, which results in greater technical requirements. This trend is favorable for our premium-positioned drilling pumps, both in terms of volume from new rigs as well as upgrades to higher capability drilling pumps and fluid ends on existing rigs. |
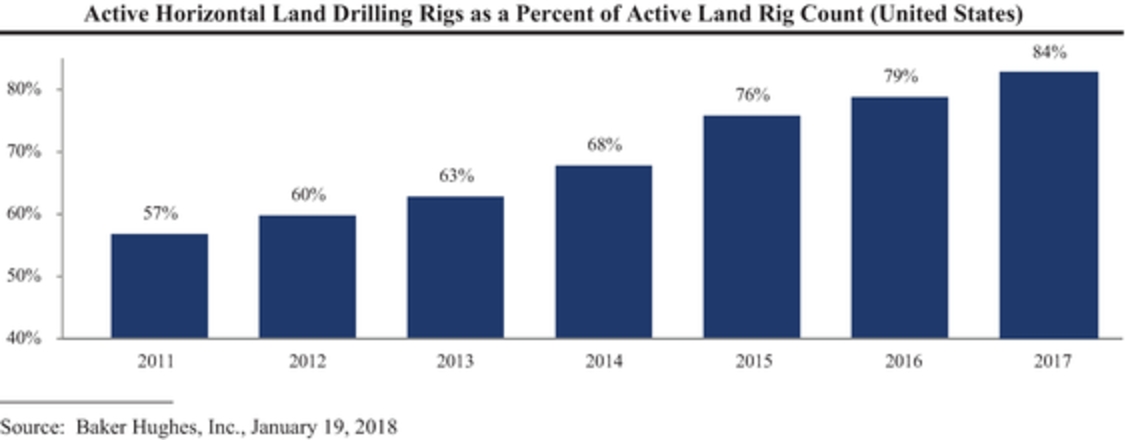
51
| • | Growth in U.S. Land Rig Count Compared to the Rest of the World – Land rig count in the United States has increased 137% from 384 rigs in May 2016 to 911 rigs in December 2017 compared to a relatively flat rig count growth in the rest of the world over this same time period. This trend is expected to continue, as Spears & Associates, Inc. projects the U.S. land rig count to grow 12% from the fourth quarter of 2017 to the fourth quarter of 2018, compared to 2.5% for the rest of the world (excluding Canada) over this same time period. This trend is expected to benefit our upstream energy product lines. |
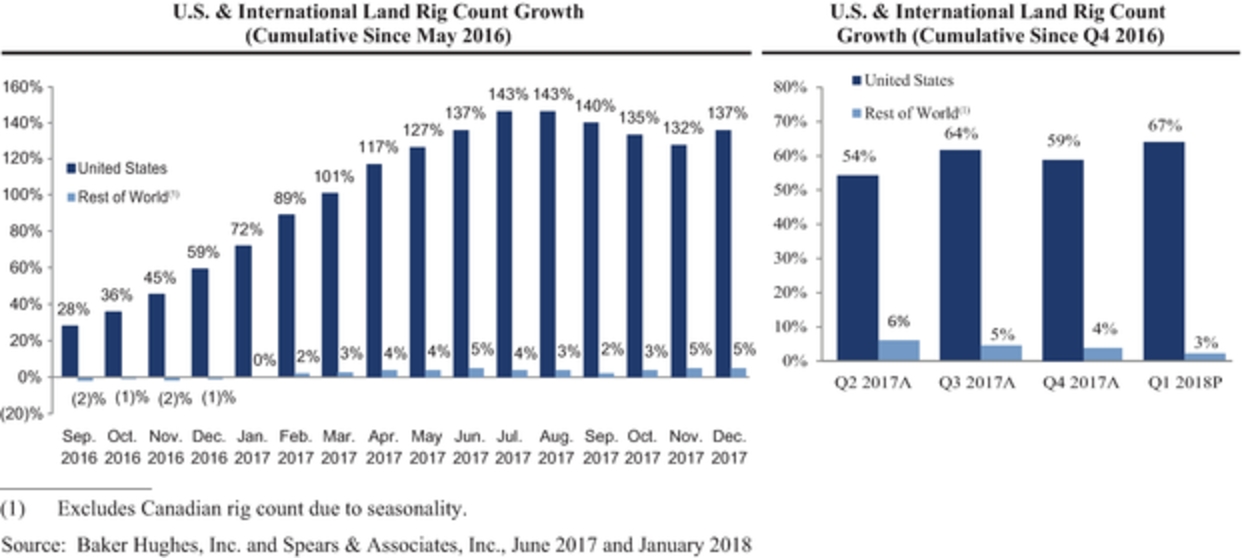
| • | More Wells Drilled Per Rig Per Year — Higher-specification drilling rigs are capable of pad drilling operations, which have become more prevalent in North American drilling activity, enabling the operator to drill more wells per rig per year than older rigs. As a result, the active rig count in today’s environment and going forward in an upstream energy recovery combined with the growing use of higher specification rigs corresponds to more wells per rig being drilled than during 2014 or before. This trend is favorable for our frac pump and associated aftermarket parts and consumables business, as an average single active rig is now expected to generate more demand for hydraulic fracturing, as each unconventional well needs to be fractured. The result of these improved techniques and technologies have reduced the average days required to drill a well, which according to Coras Research, LLC, has dropped from 28 days in 2014 to 20 days in 2016. |
| • | Increasing Count of Drilled but Uncompleted Wells (DUCs) – Due to more efficient drilling techniques and technologies, such as pad drilling, more wells are being drilled per active rig than before. In addition, these wells are being drilled at a faster pace than they can be completed, which is causing a growth in DUCs. As of the end of December 2017, there were over 7,400 DUCs in the U.S. market, an increase of 82% from December 2013. We believe that this increasing count of DUCs is a favorable trend for our business, as it provides a backlog of wells that will need to be completed and fractured in the future, which will require frac pumps and associated aftermarket parts, consumables, and services. |
52
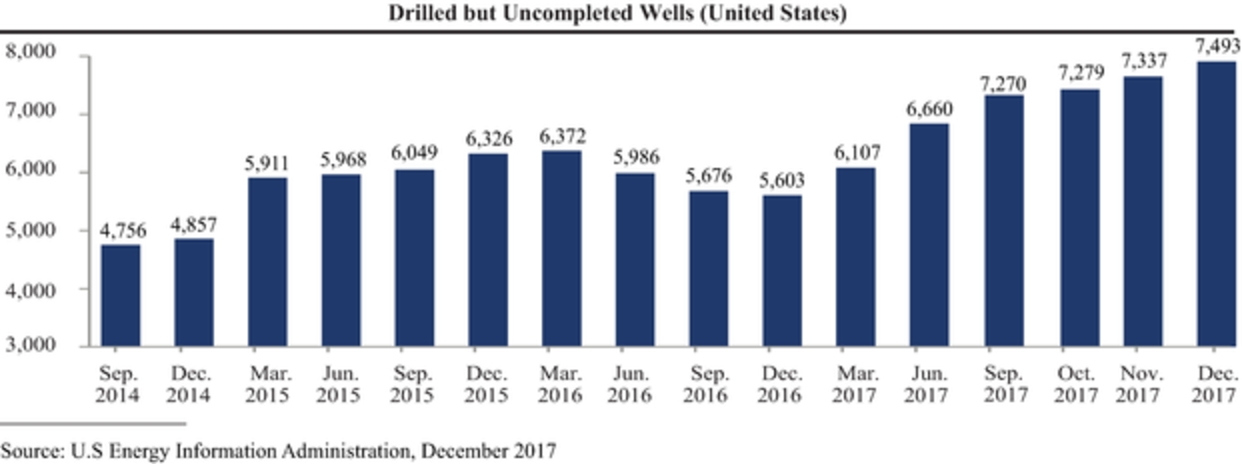
| • | Growth in Hydraulic Fracturing – Hydraulic fracturing is a mission-critical service required for the continued development of shale resources in North America and internationally. The hydraulic fracturing sector is expected to have the highest growth rates of any subsector within the energy services and equipment space. According to Rystad Energy’s January 2018 DCube, the North American onshore stimulation sector, which includes hydraulic fracturing, is estimated to increase 19% from 2016 through 2020. Further, demand for hydraulic fracturing horsepower, which is a measure of frac pump demand, is expected to increase more than 96% from the fourth quarter of 2016 to the fourth quarter of 2018, driving increased demand for our premium equipment and associated aftermarket parts, consumables and services. |

| • | Increasing Lateral Lengths – Horizontal lateral lengths increased from 2014 to 2016 and are expected to continue increasing through 2018. This trend is driving demand for higher pressure-rated fluid pumping equipment and consumable products used during hydraulic fracturing operations and is resulting in even more usage and wear and tear on the frac pump, thus reducing useful life and driving demand for aftermarket parts, consumables and services. |
| • | Increasing Hydraulic Fracturing Intensity – Increasing number of hydraulic fracturing stages per foot per well drilled requires higher pressure-rated fluid pumping equipment and consumable products and also results in usage and wear and tear on the frac pump, further reducing useful life and driving additional demand for aftermarket parts, consumables and services. |
| • | Increasing Volume of Proppant Used – Increasing volume of proppant (e.g., frac sand) used per hydraulic fracturing stage results in increased volume of fluid to convey proppant through the wellbore, |
53
which requires higher pressure-rated fluid pumping equipment, and given that proppant is abrasive material, this further reduces the equipment’s useful life and drives additional demand for aftermarket parts, consumables and services, which is incremental to the drivers described above.
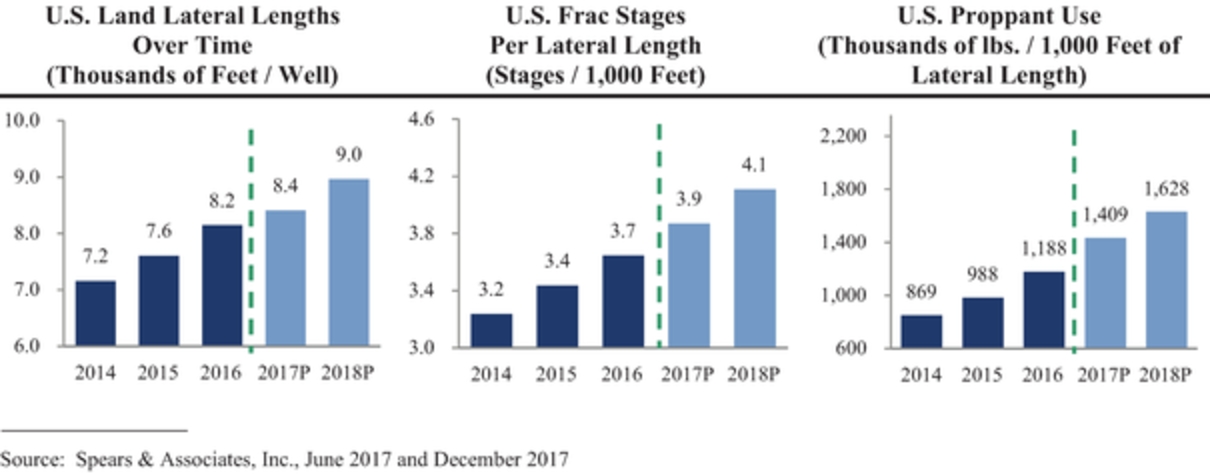
| • | Increasing End Customer Requirements – We believe end customers are demanding redundancy on mission-critical components to improve operational efficiency. In addition, we believe end customers are demanding higher standards on preventative maintenance and safety. This trend is causing upstream energy producers to drive customers of these products to use premium equipment and associated aftermarket parts, consumables and services. |
Midstream and Downstream
Sales to midstream and downstream energy end-markets consist of liquid ring vacuum pumps and compressors and integrated systems, engineered fluid loading and transfer equipment and associated aftermarket parts and services. According to Petrochemical Update, North American downstream industry capital expenditures are expected to reach $17.3 billion in 2018, with the maintenance capital expenditure portion for U.S. refineries estimated to increase 39% in 2018 to a total of $1.3 billion. These large investments in midstream and downstream energy end-markets are expected to drive sales of our equipment and future sales in aftermarket parts and services as these facilities age. Further, deferred maintenance of downstream energy infrastructure is expected to drive increased future sales in our replacement products and aftermarket parts and services. Our downstream energy business contributes a larger share of revenue and profitability than our midstream energy business.
We focus on two basic types of midstream and downstream energy equipment: fluid transfer equipment and liquid ring vacuum pumps and compressors, which are employed in the midstream and downstream markets, respectively.
| • | Fluid transfer equipment, including fluid loading systems, tank truck and fleet fueling products and couplers: Fluid loading systems are used in the transfer and loading of hydrocarbons and certain other liquid commodity products in marine and land applications. Tank truck and fleet fueling products allow for safe transfer of liquid products without spillage or contamination while safeguarding the operator and the environment. Operators use Dry-Break® technology couplers and adapters to provide a secure connection for the transfer of liquid products without spillage or contamination while safeguarding the operator and the environment. |
| • | Liquid ring vacuum pumps and compressors: Liquid ring vacuum pumps and compressors are designed for continuous duty in harsh environments, including vapor and flare gas recovery equipment (which recovers and compresses certain polluting gases to transmit them for further processing), primarily in downstream applications. The liquid ring technology utilizes a service liquid, typically water, oil or fuel, to evacuate or compress gas by forming a rotating ring of liquid that follows the contour of the body of the pump or compressor and acts like a piston to deliver an uninterrupted flow of gas without pulsation. |
54
Our midstream and downstream products are positioned to capitalize on large and secularly growing applications, which provide relatively stable demand with attractive, long-term growth supported by the following trends which support growth in addition to overall economic growth.
Key trends include:
| • | Increasing Production – Increased U.S. oil and gas production, which has risen by 22% from December 2013 to October 2017, has driven an increased demand for U.S. refined product production. U.S. oil and gas production is expected to continue to grow at a 3.6% CAGR from 2017 to 2021. |
| • | Increasing Transportation of Hydrocarbons – Transportation of crude oil and natural gas, both domestically and internationally, has increased and is projected to continue to increase due to crude oil production and global refined product imbalances. International and domestic movement of hydrocarbons drives demand for our fluid loading systems and tank truck and fleet fueling equipment. |
| • | Deferred Maintenance Capital Expenditures – In 2015 and 2016, the combination of increased demand for refined products and depressed crude oil prices resulted in attractive profitability for U.S. refiners and deferral of routine and periodic turnaround maintenance. We expect the resumption of ongoing maintenance of refineries and other downstream infrastructure to drive steady product sales and growing aftermarket support as the downstream industry maintains and upgrades its facilities. |
| • | Inclusion in Initial Specifications and Increased Size of Projects – Midstream and downstream projects have long lead times, and operators often include our products in the initial specifications for the design and construction of these facilities. As facilities become larger and more complex, more of our products are required. |
| • | Increasing Environmental Regulations – Environmental regulations and sensitivities are becoming more stringent within the global midstream and downstream industries, creating high costs and penalties for spills, leakage and other environmental exposure, including vapor and flare gas. This trend is favorable for our marine and land liquid product loading systems, tank truck and fleet fueling equipment, our highly engineered coupler products and vapor and flare gas recovery equipment. |
| • | Petroleum Products Export Growth – Robust domestic U.S. natural gas production and the U.S. government’s passage of regulations in 2015 to remove a legacy ban on petroleum exports have spurred construction of export facilities to meet new demand. |
Petrochemical
Our Energy segment is positioned to capitalize on the large and growing petrochemical industry. Sales to petrochemical end-markets consist of vacuum and compression process systems, both of which are used in harsh, continuous-duty applications. According to the American Chemistry Council, U.S. chemical industry capital spending reached $31.9 billion in 2016 and is expected to grow at a 6.2% CAGR from 2017 to 2019. Further, the American Chemistry Council forecasts the annual U.S. capital spending by the chemical industry to reach $48 billion by 2022, more than double the level of spending in 2010.
Demand for our petrochemical industry products correlates with growth in the development of new petrochemical plants as well as activity levels therein, which drive demand for aftermarket parts and services on our market-leading installed base of equipment. Attractive secular trends in the petrochemical market provide additional sources of growth. Advancements in the development of unconventional natural gas resources in North America over the past decade have resulted in the abundant availability of locally-sourced natural gas as feedstock for petrochemical plants in North America, supporting long-term growth. In addition, new petrochemical plants are becoming larger, driving increased demand for more equipment within larger systems.
Competition
Across our product lines exposed to the energy industry, the competitive landscape is specific to the end-markets served. Our principal competitor for drilling pumps is National Oilwell Varco Inc., and for frac pumps is The Weir Group plc. Within upstream energy, we additionally compete with certain smaller, regional manufacturers of pumps and aftermarket parts, although these are not direct competitors for most of our products. Our principal competitors in sales of fluid transfer equipment include Dover Corporation, SVT GmbH and TechnipFMC plc. Our principal competitors in the sale of liquid ring pumps and compressors are Flowserve Corporation and Busch-Holding GmbH.
55
Medical
The Medical segment designs, manufactures and markets a broad range of flow control products for the durable medical equipment, laboratory vacuum and automated liquid handling end-markets. Key technologies include gas, liquid and precision syringe pumps and automated liquid handling systems.
Based on internal estimates, the durable medical equipment pump market represents approximately a $1.2 billion opportunity globally and can be divided into two primary sub-markets: gas pumps and liquid pumps. In both markets, energy efficiency, ultra-low vibration, reduced noise levels and compactness as compared to flow rate are key application considerations. Customers are mainly medium and large durable medical equipment manufacturers who integrate our products into their devices for a wide range of applications, such as aspirators, blood analyzers, blood pressure monitors, compression therapy, dental carts, dialysis machines, gas monitors and ventilators. Gas pumps transfer and compress gases and generate vacuum to enable precise flow conditions. We estimate the size of the global gas pump market to be approximately $700 million. Building on our strength in gas pump applications, we recently expanded into the liquid pump and automated liquid handling markets to gain share in sizable markets that were previously unaddressed by us. We estimate the liquid pump market to be a $450 million market globally. Our liquid pump products are primarily used to meter and transfer both neutral and chemically aggressive fluids. We view this space as an attractive adjacency to our existing strategy and one in which we are able to capture share in line with current operations in the gas pump market, building momentum and scale for our Medical business. We believe both gas and liquid pump markets present attractive long-term growth profiles based on strong secular trends.
Our products are also used in the laboratory vacuum equipment space which includes end-use chemically resistant devices used in research and commercial laboratories which is a highly attractive niche market. In addition, we recently expanded into the automated liquid handling end-market, which includes syringe pumps, systems and accessories that are integrated into large scale automated liquid handling systems primarily for clinical, pharmaceutical and environmental analyses.
Customers in the durable medical pump end-market and the automated liquid handling end-market develop and manufacture equipment used in a highly regulated environment requiring highly specialized technologies. As a result, relationships with customers are built based on a supplier’s long-term reputation and expertise and deep involvement throughout a product’s evolution, from concept to long-term commercialization. Customers value suppliers that can provide global research and development, regulatory and manufacturing support, as well as sales footprint and expertise to foster close relationships with key decision makers at their company. Combined with the long product life cycle in the regulated medical device space, these factors create a strong, recurring base of business. As a leading pump manufacturer in these markets, we have established a history of innovation that enables us to work closely with our customers to create highly customized flow control solutions for their unique applications. These products are mission-critical in the ultimate device in which they are deployed and remain a key component over the entire life cycle of the end products. The regulated market structure and nature of long-tenured customer relationships enables pump manufacturers to have a highly visible, recurring revenue stream from key customers.
Key Trends, Regional Macro Drivers and Outlook
We believe that overall demand for flow control products and services in the medical space will benefit from overall economic growth and attractive secular growth trends, including:
| • | Aging Demographics Requiring Greater Access to Medical Care – More than 20% of the U.S. population is expected to be over the age of 65 by 2030, compared to approximately 15% of the population today; furthermore, the 65 and older demographic is projected to grow at three to four times the rate of the U.S. population as a whole over the next 25 years. |
| • | Growth in Emerging Economies – Economic growth in emerging economies and rising per capita income levels support modernization of healthcare systems, increased awareness of medical services and greater availability of treatment options. |
| • | Increasing Demand for Healthcare – Increased investment in health solutions and safety infrastructures drives demand for medical pump products; annual healthcare spend per capita in the U.S. is projected to grow at a 4.7% CAGR from 2015 through 2025, according to the U.S. Department of Health and Human Services. |
56
| • | Focus on Healthcare Efficiency – Increased demand for higher healthcare efficiency requires premium and high performance systems. |
| • | Medical Equipment Innovation – Increasing demand for durable medical equipment provides significant opportunity for pump products to be incorporated into new applications; annual healthcare equipment spend per capita in the United States is projected to grow at a 4.7% CAGR from 2015 through 2025, according to the U.S. Department of Health and Human Services. |
Competition
Competition in the medical pump market is primarily based on product quality and performance, as most products must be qualified by the customer for a particular use. Further, there is an increasing demand for more efficient healthcare solutions, which is driving the adoption of premium and high performance systems. Our primary competitors in medical pumps include IDEX Corporation, Watson-Marlow, Inc., KNF Neuberger, Inc. and Thermo Fisher Scientific, as well as other regional and local manufacturers.
Our Business Transformation from Operational Execution and Strategic Investment
Our top priorities since the KKR Transaction have been creating a performance-driven organization and ensuring superior execution of our operating initiatives in order to transform our business and realize step-change improvements in our commercial and operational capabilities, financial characteristics and performance, pace of innovation and customer service. We have focused on adding executive talent as well as building out the core strategic functions underneath them. Led by our CEO, Vicente Reynal, the senior management team has been significantly reconstituted and expanded, which we believe brought together deep expertise from leading global industrial organizations. For example, 45% of our top 100 business managers, including the senior management team, have joined the Company since the KKR Transaction, which we believe added a significant new level of talent to our leadership team. To support our business transformation, significant investment was dedicated to transformational initiatives across the Company’s three segments, primarily directed toward funding the Company’s growth strategies, further implementation of operational process efficiency actions and permanently reducing operating costs through structural reorganization changes.
With the senior leadership team in place, we have focused on driving strong revenue and earnings growth centered on five primary objectives: (i) enhancing commercial leadership by expanding our sales and service presence, adding product line adjacencies and accelerating our innovation funnel; (ii) driving aftermarket sales penetration of our large installed base; (iii) further improving our competitive position with our customers through salesforce effectiveness programs; (iv) executing our operational excellence initiatives to streamline our cost structure and support margin expansion, including through manufacturing footprint optimization, administrative expense efficiency and strategic sourcing; and (v) pursuing acquisitions focused on bolstering our product offerings and/or geographic or market presence. These initiatives have improved our underlying operating performance since the KKR Transaction and we believe they have laid the foundation for ongoing value creation.
Within the Industrials segment, we transitioned our sales team, which had previously been organized around individual brands, into an integrated salesforce that provides complete solutions to our customers by selling our entire portfolio of market-leading brands. In addition, we strengthened our customer connectivity by realigning our product engineering and marketing teams into a single global product management structure. This team is now able to directly access customer feedback, recognize the unmet needs of the market and then translate this critical information into customer-centric innovation that can be leveraged globally. Our new product management process spurred accelerated innovation cycles and has led to the development of several next-generation products, such as the two-stage Dryclon oil-free compressor (which compresses and cools air in two stages, eliminating the need to use oil to absorb the heat generated when compressing air) and our Mechanical Vapor Recovery (MVR) system. We also established a centralized demand generation team that provides integrated tools and technology solutions for our local marketing teams to capture more end-user contacts, develop and execute targeted campaigns and generate more actionable leads for our sales teams. In addition, we executed on our European profitability plan by optimizing our footprint to enhance our flexibility and responsiveness to customer needs. Finally, within this segment, we achieved structural cost reductions by centralizing and streamlining back office, processing, fulfillment and information technology operations in order to simplify the business and accelerate strategic decision-making, continuing to execute direct sourcing programs
57
from low-cost countries, divesting non-core or underperforming assets, strengthening our operational and supply chain infrastructure and implementing lean initiatives. These improvements strengthened our customer service and connectivity by transitioning our sales team and realigning our product engineering and marketing teams into an integrated, global product and customer management structure.
Within the Energy segment, we transformed our upstream energy offering from being predominantly a pump manufacturer into a full-service solutions provider that offers high quality and locally accessible aftermarket support throughout the life cycle of our products. Even during the recent upstream energy industry downturn, when many of our competitors and customers were closing facilities and cutting back investments, we continued investing in our capabilities within the energy markets. As a result, we believe that we are even better positioned to capture market share and grow revenues and Segment Adjusted EBITDA independent of the upstream energy cycle, while positioning ourselves to realize significantly increased sales, profitability and customer responsiveness in the context of the current upstream energy recovery. We nearly doubled our sales personnel for upstream energy markets since 2012 to increase customer interaction and enhance market penetration, and we optimized our supply chain with tactical insourcing and outsourcing initiatives. We also developed a solutions-focused sales approach with dedicated applications engineering to support our salesforce efforts within each of our product lines. This hands-on approach to product marketing and sales helps our customers understand how our products and solutions can address complex needs and drive ongoing efficiency in the variety of energy and other process-related end-markets within which they operate. We believe that this specialized technical sales approach will help us better capture differentiated high-margin solutions for our customers and capitalize on market opportunities. In addition, we made significant investments in manufacturing capacity expansion and operational efficiency gains, implementing manufacturing best practices and advanced robotic automation within key manufacturing facilities that have the potential to be high-volume in mid-cycle or higher environments due to the consumable nature of the products manufactured. These one-time investments position us to harvest meaningful recurring cost savings, improve on-time delivery and provide significant operating leverage and flow-through of sales into earnings in a market recovery.
We invested in establishing a leading aftermarket presence that now covers the vast majority of North American land-based oil and gas basins. For example, in November 2015, we opened a state-of-the-art, dedicated repair center in Odessa, Texas, to service the Permian Basin, the most active oil and gas region in the United States. Before we opened this facility, we did not have a regional aftermarket presence in the Permian Basin, which now accounts for 43% of U.S. drilling activity, according to Baker Hughes, Inc. To further capitalize on this investment in our aftermarket footprint, we organically engineered, designed and brought to market premium new aftermarket parts which are frequently replaced in the field, such as state-of-the-art fluid ends with enhanced durability and performance, plungers, as well as innovative valves, seats and packing, which are consumable products used during the operation of our pumps. These high-frequency products are often procured by customers as-needed in regional service centers, allowing us to further partner with our customers throughout the life cycle of their equipment. Our aftermarket products and service centers can also address customers’ needs regardless of the brand of the pump, enabling market share gains on aftermarket parts and catalyzing competitive conversions on the eventual pump replacement. Our regional aftermarket presence helps to expand our addressable market and overall installed base as customers prioritize support in the field as a deciding factor when choosing an original equipment manufacturer (“OEM”) for new products due to the significant wear and tear on the equipment and meaningful aftermarket parts and consumables requirements during operation.
The Medical segment was established as a standalone and strategic business in 2013 to accelerate growth, profitability and focused innovation. We upgraded our salesforce with deeper technical expertise, which further strengthened our customer relationships with industry-leading durable medical equipment providers. We also enhanced and centralized demand generation efforts to provide our sales force access to more actionable leads. Our upgraded salesforce, combined with our global manufacturing and sales footprint, has delivered sales and profitable growth in gas, liquid and precision syringe pumps for medical and laboratory markets. We recently expanded into liquid pumps and automated liquid handling components and systems, which provide new opportunities for future growth in highly complementary products to our existing Medical segment product offerings. Finally, we also expanded the segment profitability by improving our global sourcing and supply chain strategies, investing in lower cost manufacturing and optimizing our global footprint.
58
In addition, we have introduced a company-wide procurement organization to leverage our scale and generate strategic sourcing savings. This group both spans our segments at a corporate level and is embedded within them in purchasing roles, and seeks to optimize and reduce our costs in both direct and indirect spend categories. This procurement function has achieved success in reducing our costs and continues to progress through new categories of spend with a long runway for incremental future spend reductions.
The significant operational improvements resulting from the execution of our business transformation initiatives have strengthened performance within each of our segments. Given the recent (i) significant downturn in the upstream energy markets and (ii) volatility in the effects of changes in foreign currencies relative to the U.S. dollar, we believe that it is helpful for us and investors to evaluate the performance of our segments excluding these factors. Excluding these two items, Segment Revenue was stable and Segment Adjusted EBITDA demonstrated strong growth, resulting in margin improvements in each of our three segments, as illustrated in the table below.
|
|
Industrials Segment
|
Energy Segment
|
Medical Segment
|
||||||||||||||||||||||||
|
(in millions)
|
2014
|
2015
|
2016
|
2014
|
2015
|
2016
|
2014
|
2015
|
2016
|
||||||||||||||||||
|
Segment revenues(1)
|
$
|
1,306.1
|
|
$
|
1,149.7
|
|
$
|
1,082.4
|
|
$
|
1,045.0
|
|
$
|
753.5
|
|
$
|
628.4
|
|
$
|
218.9
|
|
$
|
223.7
|
|
$
|
228.7
|
|
|
Upstream energy(2)(4)
|
|
(63.2
|
)
|
|
(44.2
|
)
|
|
(22.3
|
)
|
|
(604.0
|
)
|
|
(318.1
|
)
|
|
(193.2
|
)
|
|
—
|
|
|
—
|
|
|
—
|
|
|
Foreign currency impact(3)(4)
|
|
(139.0
|
)
|
|
(23.3
|
)
|
|
—
|
|
|
(43.3
|
)
|
|
(7.4
|
)
|
|
—
|
|
|
(17.4
|
)
|
|
(0.1
|
)
|
|
—
|
|
|
|
$
|
1,103.9
|
|
$
|
1,082.2
|
|
$
|
1,060.1
|
|
$
|
397.7
|
|
$
|
428.0
|
|
$
|
435.2
|
|
$
|
201.5
|
|
$
|
223.6
|
|
$
|
228.7
|
|
|
|
|
|
|
|
|
|
|
|
|
|
|
|
|
|
|
|
|
|
|
|
|
|
|
|
|
|
|
|
Segment Adjusted EBITDA(1)
|
$
|
223.2
|
|
$
|
197.6
|
|
$
|
217.6
|
|
$
|
309.1
|
|
$
|
186.8
|
|
$
|
143.8
|
|
$
|
52.5
|
|
$
|
59.5
|
|
$
|
61.9
|
|
|
Upstream energy(2)(4)
|
|
(35.6
|
)
|
|
(24.4
|
)
|
|
(12.7
|
)
|
|
(221.9
|
)
|
|
(86.8
|
)
|
|
(36.9
|
)
|
|
—
|
|
|
—
|
|
|
—
|
|
|
Foreign currency impact(3)(4)
|
|
(23.3
|
)
|
|
(2.6
|
)
|
|
—
|
|
|
(9.6
|
)
|
|
(2.2
|
)
|
|
—
|
|
|
(5.0
|
)
|
|
(0.1
|
)
|
|
—
|
|
|
|
$
|
164.3
|
|
$
|
170.6
|
|
$
|
204.9
|
|
$
|
77.6
|
|
$
|
97.8
|
|
$
|
106.9
|
|
$
|
47.5
|
|
$
|
59.4
|
|
$
|
61.9
|
|
| (1) | As reported Segment Revenues and Segment Adjusted EBITDA. See “Item 7. Management’s Discussion and Analysis—Results of Operations—Segment Results” of the Annual Report incorporated by reference in this prospectus. |
| (2) | Represents the amount of Segment Revenue and Segment Adjusted EBITDA for Industrials and Energy segment products and services with exposure to upstream energy markets. Our Medical segment does not have exposure to upstream energy markets. See “Item 7. Management’s Discussion and Analysis—Factors Affecting the Comparability of our Results of Operations—Variability within Upstream Energy Markets” of the Annual Report incorporated by reference in this prospectus for a description of our Industrials and Energy segment products and services exposed to upstream energy markets. |
| (3) | Represents the impact of translating 2014 and 2015 Segment Revenues and Segment Adjusted EBITDA into a Constant Currency for 2014, 2015 and 2016, using the average foreign currency exchange rates in 2016. |
| (4) | Amounts adjusted for the impact of upstream energy markets and the impacts of foreign currency changes are non-GAAP financial measures should be considered in addition to, not as a substitute for measures prepared in accordance with GAAP. The following discussion of our results of operations should be read in conjunction with the information provided in Note (2) under “Summary—Summary Historical Consolidated Financial and Other Data.” See “Item 7. Management’s Discussion and Analysis of Financial Condition and Results of Operations—Factors Affecting the Comparability of Results of Operations” of the Annual Report incorporated by reference in this prospectus. |
From 2014 to 2016, as we implemented our business operational transformation and strategic investment plan:
| • | our Energy and Medical segments experienced mid-single digit revenue growth, excluding in each case the impact of the recent significant downturn in the upstream energy market and currency volatility; |
| • | we grew Segment Adjusted EBITDA and expanded Segment Adjusted EBITDA margins, each year across all of our segments, excluding the impact of the recent significant downturn in the upstream energy market and currency volatility with our Industrials segment’s margin expanding by approximately 440 basis points, our Energy segment’s margin expanding by approximately 500 basis points and our Medical segment’s margin expanding by approximately 350 basis points; and |
| • | we successfully reduced corporate expenses not allocated to our segments from $47.3 million in 2014 to $25.0 million in 2015 and $22.7 million in 2016, a decrease of approximately 52% compared to 2014. |
We believe the establishment and continued execution of our operational and strategic growth initiatives has positioned our Company for substantial revenue and Adjusted EBITDA growth with continued potential to expand margins. In 2017, we built upon this foundation, with 22.5% year-over-year revenue growth, net income
59
of $18.5 million (compared to a $31.3 million net loss in 2016), Adjusted EBITDA of $561.5 million, an increase of 40.1% over the prior year, and Adjusted EBITDA margin of 23.6%, an increase of 290 basis points over the prior year.
Our Competitive Strengths
Market Leadership with Strong Brand Portfolio and Reputation Built over 155 Years
With a deep heritage of more than 155 years of leading engineering and application expertise, we believe our portfolio of highly engineered products and proprietary technologies is among the most trusted and recognized in the industry. We are a globally recognized leading provider of air compression, vacuum and blower products; drilling and frac pumps; liquid ring vacuum pumps and compressors; liquid and dry bulk transfer equipment; gas, liquid and precision compressors and syringe pumps and associated aftermarket parts, consumables and services. By utilizing a multi-brand go-to-market strategy, we leverage each specific brand’s market position in well-defined market segments or geographies. Our product portfolio consists of more than 20 well-respected brands, most notably Gardner Denver, CompAir, Nash, Emco Wheaton, Robuschi, Elmo Rietschle and Thomas. Collectively, our brands provide a comprehensive product offering that is well-positioned in global end-markets with favorable near- and long-term growth prospects, including industrial manufacturing, energy, transportation, medical and laboratory sciences, food and beverage packaging and chemical processing. We believe each brand’s reputation for superior quality, reliability, efficiency and responsiveness, along with the often application critical nature of our products within our customers’ operations, enhances our competitive position in the marketplace and is difficult to replicate given the length of time over which these brands have developed their reputation.
The strength of our brand portfolio is demonstrated by our leading global market share positions. We believe we have leading market positions within each of our operating segments. According to Frost & Sullivan, our Industrials segment has a #3 market share in the approximately $13.2 billion global industrial air compressor market and we believe, based on internal estimates, that we are the market share leader (#1) in the global industrial vacuum and pump market ($6 billion industry; $2.5 billion addressable market) and a leading global provider in the global blowers markets ($2 billion addressable market). In addition, in our Energy segment, Spears & Associates, Inc. estimates that we have the second largest market share in the global frac pump market based on installed base, and management estimates that we have the largest market share based on new unit sales in the last four years. We believe our notable momentum in this space will continue, benefiting our overall share of the global frac pump market. We believe, based on management estimates, that we have a number three market share position in the engineered fluid transfer equipment market. Finally, our Medical segment is a leader in the highly engineered air and gas pumps components market and one of the largest providers of parts used for the manufacture of oxygen concentrators globally. We believe the leading market positions described above represent a substantial majority of our revenue and provide us with a solid foundation for future growth.
Comprehensive Portfolio of Highly Engineered, Innovative and Application-Critical Equipment
We design, manufacture, market and service a broad array of application-critical flow control and compression equipment for customers seeking targeted solutions for specialized end-markets. Our products
60
typically are part of large, complex systems and represent mission-critical components in the context of the broader systems in which they are utilized. In addition, our products often operate in harsh environments and specialized, precision applications such as in regulated end-markets, where customers require products capable of reliable performance in complex processes. Furthermore, while our products typically represent a low relative cost in the context of the broader applications in which they are employed, the high cost of failure in these applications makes quality and reliability key purchase criteria for end-users and drives demand for highly engineered and differentiated products. As a result, our customers value our product offerings on the basis of superior quality, reliability, efficiency and advanced technology. Further, our customer-centric approach to product development is focused on developing energy efficient and reliable solutions that reduce the total life cycle cost of our customers’ equipment. These high performing products create customer loyalty helping us to retain existing business and capture additional business opportunities.
We believe the fact that we offer one of the broadest and most complete ranges of compressor, pump, vacuum and blower products in our markets is a competitive advantage, allowing us to provide differentiated product and service offerings to our customers. We believe our ability to support custom application needs from nearly full vacuum to 40,000 pounds per square inch (psi) pressure levels makes us a partner of choice for many of our long-standing customers. Finally, the breadth and depth of our product offering creates incremental business opportunities by allowing us to cross-sell our full product portfolio and uniquely address customers’ needs in one complete solution.
A continuous emphasis on product innovation allows us to develop highly configured solutions tailored to our customers’ specific needs. As a strategic priority, we continue to invest in refining our existing products and developing new innovative equipment and product offerings. Our demonstrated track record of product development has resulted in bringing new products to market, adapting existing applications to meet unmet customer needs in existing and adjacent categories and enhancing existing product categories to replace products currently in use. Our product development expertise allows us to focus on developing new solutions that enhance and expand product quality and reliability, improve energy efficiency, reduce noise levels, reduce size and/or weight, lower life cycle costs for our customers and maintain compliance with changing environmental regulations. Additionally, our focus on product development creates an established base of proprietary components and institutional knowledge that supports our aftermarket business. For example:
| • | Within our Industrials segment, we responded to our customers’ growing need for energy efficiency, noise reduction and contaminant-free operating environments by developing our two-stage Dryclon oil-free air compressor, which has a best-in-class footprint, lower noise level and up to 4% improvement in efficiency. |
| • | Within our Energy segment, we recently introduced the Thunder Series pump for the hydraulic fracturing market. The Thunder pump utilizes a state-of-the-art power end (which generates the pressure to facilitate fracturing) design and stainless steel fluid end construction that provides the user with more power and increased durability while reducing operating costs. |
| • | Within our Medical segment, we are developing a series of liquid pumps, as well as entering the automated liquid handling segment of the market. Our Medical segment has previously not operated within this market, and our equipment will be designed for continuous and smooth flow for chemically aggressive liquids in targeted applications within the medical, laboratory and life sciences. |
Our product engineering teams are continuously enhancing our existing products and developing new applications to strengthen relationships with our growing base of customers that require advanced solutions. We believe our customer-centric approach to product development and robust innovation creates a sustainable competitive advantage.
Installed Base and Growing Aftermarket Platform Drives Highly Profitable Recurring Revenues
Our large installed base of products in our Industrials and Energy segments drives demand for recurring aftermarket revenue streams. Due to the critical applications in which our products are used and the high cost of failure or equipment downtime for our customers, we benefit from a consistent and time-sensitive demand for our portfolio of aftermarket parts, as well as service and repair capabilities. We invested significant resources to continue to develop our aftermarket platform with a focus on continuous improvement and innovation in our aftermarket product offerings, as well as increased presence to service our customer base in the field. In the
61
Industrials segment, we leverage both our direct salesforce and strong distributor relationships, the majority of whom are exclusive to our business for the products that we sell through them, to sell our broad portfolio of aftermarket parts, consumables and services. In the Energy segment, we have a strong global footprint to service our installed base, and we invested substantially in our presence to be closer to our customer base in the field where they need us most. For example, in our upstream energy business, we invested in our strategic network of service and repair facilities, expanding the number of locations by 160% since 2012. We now have presence in every major land-based basin in North America and have coverage of approximately 85% of all active North American land rigs as of December 2017 and expect to have coverage of approximately 85% of all new North American land rigs in 2018. In addition, we continued to invest in aftermarket product innovation and organically developed such aftermarket product offerings as enhanced durability fluid ends, plungers, and innovative consumables, such as valves seats and packing. This opens attractive market adjacencies for us to pursue organically with disruptive, premium products, while also lowering our cost base for our original equipment as many of these parts are featured in the original machinery in addition to being sold in the aftermarket. Aftermarket support is also a key decision factor for many of our customers when choosing OEM products given the significant wear and tear and aftermarket part needs in the field. Overall, aftermarket sales contributed approximately 41% of our total revenue in 2017. We believe our aftermarket platform provides the opportunity to leverage our existing installed base to increase our aftermarket business and provides us with significant growth potential.
|
Example Maintenance Schedule for Compressor with 10 to 12 Year Overall Life Expectancy
(Assumes 4,000 Hours of Operation / Year) |
|
|
•
|
Year 0–2: maintenance only. Typically oil filter, separator, air filter and lubricant changes
|
|
•
|
Year 3–5: maintenance in line with years 0–2 and replacement of wear items such as valves, gaskets and hoses
|
|
•
|
Year 6–8: maintenance in line with years 0–5 plus usually one more larger scale item
|
|
•
|
Year 9–11: maintenance in line with years 0–8 plus likely another potential large item
|
|
•
|
Year 12+: likely all the major package components have been replaced by this point
|
|
✔
|
Cumulative aftermarket revenue received over the product’s life cycle will typically exceed its original cost
|
|
Example Maintenance Schedule for an Upstream Hydraulic Fracturing Pump
with 4 to 6 Year Overall Life Expectancy |
|
|
•
|
Year 0–1: replacement of fluid ends (approximately four times / year) and associated consumables (at least weekly)
|
|
•
|
Years 1–3: replacement of fluid ends (approximately four times / year) and associated consumables (at least weekly), plus likely repair and maintenance work
|
|
•
|
Years 3–6: replacement of fluid ends (approximately four times / year) and associated consumables (at least weekly), plus likely significant repair, maintenance and potentially overhaul work
|
|
✔
|
Cumulative aftermarket revenue received over the product’s life cycle will typically represent a multiple of its original cost
|
|
Example Maintenance Schedule for a Downstream Liquid Ring Pump
with 20+ Year Life Expectancy |
|
|
•
|
Years 0–2: inspection services performed
|
|
•
|
Year 3: replacement parts likely needed
|
|
•
|
Year 4: inspection services performed
|
|
•
|
Year 5: inspection services performed plus replacement parts likely needed
|
|
•
|
Year 6: replacement parts likely needed
|
|
•
|
Year 7: complete overhaul likely required
|
|
✔
|
Cumulative aftermarket revenue received over the product’s life cycle will likely amount to nearly two times its original cost
|
Source: Management estimates
62
Diversified Business with Attractive End-markets
Our revenue and earnings are diversified by product, geography, end-market and customer. In addition, we are well-positioned to benefit from secular trends in large, attractive developed economies and fast-growing emerging markets. We believe that our balanced revenue base across end-markets and exposure to early-, mid- and late-cycle growth drivers, along with the specialty nature of the applications on which we focus, enables us to reduce volatility in earnings across economic cycles, mitigate the impact of a downturn in any single market and capitalize on opportunities in an upturn. Many of our customers operate in attractive end-markets that benefit from secular trends including: (i) continued developed and emerging market growth and infrastructure build; (ii) accelerating land-based U.S. energy activity; (iii) efficiency-driven upgrades of industrial systems; (iv) increasing demand for healthcare; (v) increasing complexity of oil and gas extraction; (vi) demand for improved water quality and access; and (vii) heightened environmental regulations. In addition, our growing aftermarket parts, consumables and services business generates recurring revenue through the sale of parts and consumables, which enable us to mitigate earnings volatility across economic cycles. Our value-added services over the life cycle of our products reinforce our customer relationships and position our business for continued growth.
Expertise, Footprint and Expanded Product Portfolio to Capture Recovery in Upstream Energy
In the upstream market, our Energy business manufactures pumps and associated aftermarket parts and consumables used in oil and gas drilling, hydraulic fracturing, and well servicing applications, and its service network now covers approximately 85% of all active North American land rigs following a 160% increase in our service and repair facility locations for upstream energy since 2012. Even during the recent upstream energy industry downturn, when many of our competitors and customers were closing facilities and cutting back investments, we continued investing in our capabilities within the energy markets. Our new locations are strategically located in many of the most active oil and gas basins, such that we have coverage of approximately 85% of all active North American land rigs as of December 2017 and expect to have coverage of approximately 85% of all new North American land rigs in 2018, based on Spears & Associates, Inc. estimates. In addition, to our expanded footprint, we invested to expand our product portfolio into highly recurring aftermarket parts and consumables, which gives us more high sales frequency products to sell through our expanded customer service network and also lowers our cost to manufacture our pumps given all of these aftermarket and consumable products are also included in the original pump. Furthermore, we have leveraged these new investments to create a holistic sales and customer service framework that allows us to provide full lifetime support and coverage for our customers. As a result of this investment, as well as our estimated leading global frac pump market position based on new unit sales in the last four years, we believe that we are even better positioned to capture market share and grow revenues and Segment Adjusted EBITDA independent of the upstream energy cycle, while positioning ourselves to realize significantly increased sales, profitability and customer responsiveness in the context of the current upstream energy recovery.
Highly Attractive Financial Profile
We participate in markets with attractive near- and long-term growth trends, and our business generates strong Adjusted EBITDA margins. For the year ended December 31, 2017, each of our segments had Segment Adjusted EBITDA margins above 21%: 21.5% in our Industrials segment, 29.2% in our Energy segment and 27.1% in our Medical segment. We seek to maintain and continue to improve our margins through a commitment to operational excellence initiatives and continued cost discipline. The power of our financial profile is evidenced by the Company maintaining approximately the same Adjusted EBITDA margins from 2014 to 2016, despite significant headwinds from external market factors, including the oil and gas depression and foreign exchange. Our financial profile and cash flow generation are further enhanced by our low capital requirements, as demonstrated by our capital expenditures averaging approximately 3% of revenues over the last three years. Our margin profile and low capital intensity have resulted in strong and stable free cash flows that we believe will enable us to continue to reduce our indebtedness, deploy our capital to fund strategic initiatives to drive innovation and organic growth opportunities and finance value-enhancing acquisitions. We believe that our financial profile reflects a strong and attractive business with potential for significant earnings growth over time.
Strength of Our Diverse, Long-Standing Customer Relationships
We serve a large number of well-established blue-chip customers who are globally recognized in the industries in which they operate, as well as regional and local customers, across a wide array of end-markets.
63
Our customers serve diverse industries spanning industrial manufacturing, energy, transportation, medical and laboratory sciences, food and beverage packaging and chemical processing, among many others. In 2017, no single customer represented more than 4% of our total revenues, and our top 10 customers have been with the Company for an average of 20 years, highlighting the strength of our customer relationships. We have further diversified our customer base with sales initiatives targeting new customer relationships in new and existing end-markets. As a result of these efforts, we have more than 100,000 distinct customers in more than 175 countries today.
We serve our customer base via a geographically tailored go-to-market strategy in which we deploy our salesforce to engage directly with end-use customers, while fulfilling sales either directly or through a network of independent distributors globally depending on the product category and the unique requirements of a particular geography. Our coordinated sales and marketing strategy allows us to maintain a global go-to-market strategy, while preserving a localized presence that ensures a targeted approach to key customer partnerships.
Strategically Positioned Global Manufacturing Footprint
We have one of the most extensive manufacturing and service networks in the industry with 39 key manufacturing facilities and an expansive network of more than 30 complementary service and repair centers across six continents as of March 31, 2018. We believe our extensive manufacturing and service footprint is a competitive advantage that allows us to source new business, provide superior customer service and more efficiently develop new products to serve our customers’ needs. For example, we recently added two facilities in India, which supplement our established facilities in China and Brazil and will help drive and support increased sales in these key end-markets. Our expansive global footprint also allows us to optimize our manufacturing cost structure, by combining local manufacturing assets with the capability to leverage our footprint in lower cost geographies. We believe our worldwide presence enables us to provide timely and responsive support to our customers, many of whom operate internationally, and to capitalize on growth opportunities in both developed and emerging markets. Because of the critical nature of the applications in which our products are used, expedient response times are important to capturing and retaining our customers’ business.
Proven Strategy to Drive Operational Excellence
Our top priorities since the KKR Transaction have been creating a performance-driven culture and ensuring superior execution of our operating initiatives in order to transform our business and realize step-change improvements in our commercial and operational capabilities, financial characteristics and performance, pace of innovation and customer service. We view operational excellence as a holistic approach to continuous improvement that spans our entire organization from manufacturing to sales and marketing to customer service. Select examples of recent operational successes include: (i) the institution of a sophisticated, best-in-class marketing process intended to facilitate additional market share capture; (ii) the accelerated adoption of Lean Manufacturing principles across our manufacturing facilities and throughout our supply chain; (iii) the execution of our shared support service program, which includes consolidated back office accounting and administrative support in the Americas and Europe; and (iv) the implementation of our accelerated new product development program, which delivered unique innovation opportunities across each of our segments while reducing the time to develop new products. We believe this approach will drive strong revenue and earnings growth.
Highly Experienced Management Team with Track Record of Success
We invested in attracting a high-caliber senior management team with an average of 25 years of experience in relevant industries. In addition, 45% of our top 100 business managers, including the senior management team, have joined the Company since the KKR Transaction, which we believe added a significant new level of talent to our leadership team. We believe our current management team comprises individuals with the extensive operational, financial and managerial experience needed to effectively navigate the key opportunities and challenges facing our business today and has been responsible for developing and executing our business transformation. Our management team has a demonstrated track record of growth via operational improvements and strategic growth initiatives, and we believe that we have a strong, deep bench of talented leaders who are well-positioned to continue driving the Company towards profitable growth and margin expansion.
64
Our Growth Strategies
We intend to continue to drive shareholder value through the pursuit of best-in-class financial performance, consistent improvement in profitability and our ability to develop and retain world-class talent. Across all three of our segments, our comprehensive strategy to drive strong revenue and earnings growth is centered on five primary objectives:
| i. | enhancing commercial leadership by expanding our sales and service presence, adding product line adjacencies and accelerating our innovation funnel; |
| ii. | driving aftermarket sales penetration of our large installed base; |
| iii. | further improving our competitive position with our customers through salesforce effectiveness programs; |
| iv. | executing our operational excellence initiatives to streamline our cost structure and support margin expansion, including through manufacturing footprint optimization, administrative expense efficiency and strategic sourcing; and |
| v. | pursuing acquisitions focused on bolstering our product offerings and/or geographic or market presence. |
Specifically, we intend to focus on: (1) driving Industrials growth through salesforce effectiveness and innovation and continued margin expansion by focusing on operational excellence, (2) capitalizing on the transformative investments made in our energy footprint and capabilities and benefiting from a recovery in upstream energy markets, (3) accelerating our Medical segment’s growth and enhancing our market share and industry presence through our expanded product portfolio and (4) pursuing complementary acquisitions.
Accelerate Industrials Growth through Salesforce Effectiveness and Innovation and Drive Continued Margin Expansion by Focusing on Operation Excellence
Through the addition of considerable senior level talent and the successful implementation of the key elements of our revenue and earnings growth strategy, we transformed our Industrials segment into a higher-growth, higher-margin business and are well-positioned to accelerate the growth profile of this segment. Our salesforce effectiveness initiatives continue to support our ability to be increasingly responsive to our customers and cross-sell our comprehensive portfolio of market-leading products and services into existing and new applications. By leveraging the broad portfolio of compressor, vacuum and blower technologies available to our customers, we transitioned our commercial team from a product focus to a solutions mindset. In addition, our demand generation platform allows for increased connectivity with our customer base as we are utilizing integrated technology to develop more actionable leads for our salesforce. Over time, we expect these efforts to enhance our product awareness and generate new customer wins. We also expect to expand our market share by growing in key emerging markets, specifically Asia, the Middle East and South America. These areas were previously underserved regions for the Industrials segment. However, with our global manufacturing footprint and recent investments in enhancing our local sales coverage, we expect to significantly grow our presence in these emerging markets and expand our installed base of products.
In addition, we overhauled the Industrials segment’s approach to product management, resulting in a greater pace of innovation and enhanced connectivity to customer needs. Specifically, we introduced a global product management organization to integrate product management and marketing with engineering, creating a global organization focused on hastening the pace of innovation and developing a growing pipeline of new products that we expect to commercialize over the coming years. For example, our first-to-market two-stage Dryclon oil-free air compressor, with a best-in-class footprint, lower noise level and up to 4% improvement in efficiency, was successfully developed from concept to customer trials in less than eight months. With these improvements in innovation and enhanced market focus, we also expect to be able to increase our aftermarket penetration of our large installed base of compression, vacuum and blower products.
Supplementing our commercial and innovation efforts is a significant runway for continued margin expansion. We are building upon our global operational excellence programs with a distinct focus on simplifying the way we conduct business. In addition, we have initiatives underway focused on efficiencies within our manufacturing footprint, such as lean and productivity enhancements, material savings from procurement
65
programs, continuous product enhancement via value engineering and general structural cost reductions. We believe we have significant potential for near- and long-term revenue, earnings and margin expansion by continuing our commercial and operational transformation.
Capitalize on Transformative Investments in Our Energy Segment and Benefit from a Recovery in Key Energy Markets
We optimized our Energy segment footprint and business model to sustain profitability while preserving the upside of our earnings capacity in an upstream energy recovery. As a result of our substantial investment in the capabilities of our upstream energy business, we believe that we significantly increased our addressable market and overall earnings capacity relative to like-for-like activity levels in the 2014 and prior time period. Independent of an upstream energy recovery, we believe that we are poised to capture favorable trends including pent-up demand for repairs and new parts due to deferred maintenance during the downturn, a significant wave of replacement demand from pumps installed over five years ago and share gain due to our enhanced presence and new product capabilities. In the context of the current upstream energy recovery, we believe that these factors will contribute to driving even more growth upside than from the activity growth alone. Recent trends driving revenue growth and margin expansion in our upstream energy business include:
| • | A significant frac pump replacement cycle stemming from the aging fleet currently in service. During the recent downturn, many operators delayed the replacement of frac pumps put into service over the last five or more years, and as a result, a significant number of frac pumps are operating well beyond their useful lives per industry best practices and safety standards, which tends to be approximately four to six years. According to Spears & Associates, Inc., approximately 36% of frac pumps currently in the field were installed during 2011 and 2012. |
| • | Deferred maintenance and the now limited ability of customers to cannibalize equipment from decommissioned or “stacked” fleets are driving a growing need for fleet refurbishment, investment in aftermarket parts and service and complete pump replacement. |
| • | Market demand is increasing for newer, fit-for-purpose equipment with higher specifications. Specifically, we expect continued improvements in demand for higher pressure-rated frac and drilling pumps and consumable products due to increased horizontal footage drilled, fracturing stages and volume of abrasive proppant used. |
The current recovery in upstream energy activity levels has generated substantial revenue growth and profitability given our increased earnings capacity and operational improvements, such as the expansion of the service network. We invested throughout the downturn by expanding our aftermarket service presence in the major basins and shale plays in the North American land market, upgrading our advanced manufacturing capabilities to drive customer responsiveness and organically innovating new aftermarket and consumable product lines. Through these investments in commercial and operational capabilities as well as strategic add-on acquisitions, our earnings capacity is much larger today than it was during 2014 at similar activity levels. As illustrated in the chart below, our upstream energy orders experienced accelerating growth on a year-over-year basis with 226% growth in 2017 compared to 2016. We believe that this performance is indicative of a recovery in our upstream energy markets.
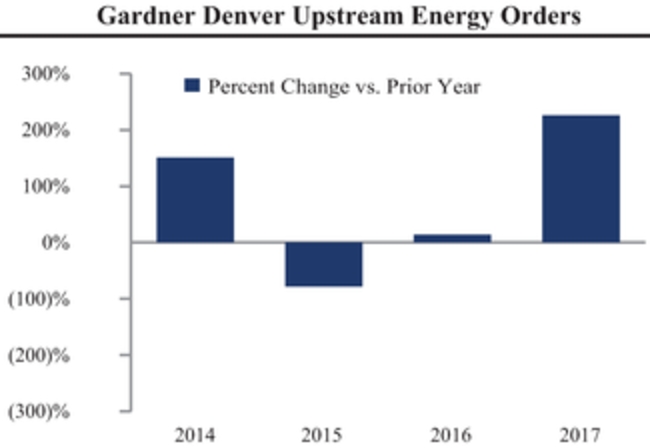
66
In the midstream, downstream and process industries, we believe our business will benefit from attractive long-term secular trends, including the increased global movement of hydrocarbons and other liquid commodities and expanded capacity of process industries. We are focused on capitalizing on our significant installed base of pumps in process industries to drive greater market share of aftermarket sales and service, while continuing to grow new equipment and systems sales.
Accelerate Growth and Enhance Market Share and Industry Presence of Our Medical Segment
We strategically invested in our Medical segment in order to expand sales and profitability. We believe a combination of our enhanced sales force, improved demand creation and recently implemented CRM platform, combined with our global manufacturing and sales footprint, will continue to position our Company to expand market share.
Building on our strength in gas pump applications, we recently expanded into the liquid pump and automated liquid handling markets to gain share in sizable markets that were previously unaddressed by us. We estimate the liquid pump market to be a $450 million market globally. Our liquid pump products are primarily used to meter and transfer both neutral and chemically aggressive fluids. We view this space as an attractive adjacency to our existing strategy and one in which we are able to capture share in line with current operations in the gas pump market, building momentum and scale for our Medical business.
We also intend to further expand our comprehensive medical, laboratory and life sciences product portfolio into attractive market adjacencies and key, higher-growth emerging markets as well as enhancing our presence into new mature markets, including the United States, China and Japan. Finally, we remain focused on executing specific initiatives to maximize profitability by improving our global sourcing and supply chain strategies and optimizing our global production facilities footprint.
Pursue Complementary Acquisitions
In addition to our organic initiatives for each of our segments, we plan to pursue select strategic acquisition opportunities as part of our growth strategy. Our markets are fragmented and there is opportunity for continued consolidation within our industrial, energy and medical markets. Based on management estimates, approximately half of each such market consists of smaller players who maintain less than 5% market share.
We have consistently employed a disciplined approach to acquisitions focused on opportunities that (i) strengthen our existing portfolio through the addition of new technologies, (ii) allow us to establish new flow control platforms in attractive markets, (iii) enhance our aftermarket offerings, (iv) grow our presence in strategic geographies, such as select emerging markets and/or (v) provide opportunity to realize synergies while expanding or strengthening our capabilities.
We have a strong track record of successfully identifying and executing on attractive acquisitions. The addition of top talent to our team has enabled us to dedicate additional personnel and resources to the creation of a robust, disciplined and sophisticated approach to business development which has allowed us to develop a differentiated process for the identification and diligence of potential targets. In addition, over the last three years we focused on developing successful integration processes for acquisitions, which allows us to extract significant cost and revenue synergies. We intend to continue to be strategic and diligent in our acquisition strategy, and maintain an active funnel of opportunities at each of our segments.
Customers and Customer Service
We consider superior customer service to be one of our primary pillars of future success and view it as being built upon a foundation of critical application expertise, an industry leading range of compressor, pump, vacuum and blower products, a global manufacturing and sales presence and a long-standing reputation for quality and reliability. Intense customer focus is at the center of our vision of becoming the industry’s first choice for innovative and application-critical flow control and compression equipment, services and solutions. We strive to collaborate with our customers and become an essential part of their engineering process by drawing on our deep industry and application engineering experience to develop best-in-class products that are critical to the processes and systems in which they operate.
We have established strong and long-standing customer relationships with numerous industry leaders. We sell our products directly to end-use customers and to certain OEMs, and indirectly through independent
67
distributors and sales representatives. Our Energy and Medical products are primarily sold directly to end-use customers and OEMs, while approximately half of our Industrials sales in 2017 were fulfilled through independent distributors and sales representatives.
We use a direct sales force to serve end-use customers and OEMs because these customers typically require higher levels of technical assistance, more coordinated shipment scheduling and more complex product service than customers that purchase through distributors. We have distribution centers and warehouses that stock parts, accessories and certain products to provide adequate and timely availability. In addition, we provide direct aftermarket support through our service and remanufacturing facilities in the United States, Germany, Finland, France, Spain, the United Kingdom, China and Australia.
In addition to our direct sales force, we are also committed to developing and supporting our global network of over 1,000 distributors and representatives who we believe provide us with a competitive advantage in the markets and industries we serve. These distributors maintain an inventory of complete units and parts and provide aftermarket services to end-users. While most distributors provide a broad range of products from different suppliers, we view our distributors as exclusive at the product category level (e.g. compressor, vacuum and blower). For example, a distributor may exclusively carry our compressor technologies, and also source additional components of the broader industrial system in which those products operate from other suppliers. Our service personnel and product engineers provide the distributors’ service representatives with technical assistance and field training, particularly with respect to installation and repair of equipment. We also provide our distributors with sales and product literature, advertising and sales promotions, order-entry and tracking systems and an annual restocking program. Furthermore, we participate in major trade shows and directly market our offerings to generate sales leads and support the distributors’ sales personnel.
Our customer base is diverse, and we did not have any customers that individually provided more than 4% of 2017 consolidated revenues.
68
Research and Development
Our R&D expenditures focus on developing new products and new product applications to, among other things, enhance and expand existing product capabilities and performance, improve efficiency, reduce size, weight and noise levels, increase application flexibility and maintain compliance with changing regulatory requirements.
For the years ended December 31, 2017, 2016 and 2015, we spent approximately $26 million, $22 million and $26 million, respectively, on research activities relating to the development of new products and new product applications. All such expenditures were funded by us and were expensed as incurred.
Patents, Trademarks and Other Intellectual Property
We rely on a combination of intellectual property rights, including patents, trademarks, copyrights, trade secrets and contractual provisions to protect our intellectual property. While in the aggregate our more than 570 patents and our trademarks are of considerable importance to the manufacture and marketing of many of our products, we believe that the success of our business depends more on the technical competence, creativity and marketing abilities of our employees than on any individual patent or trademark, and therefore we do not consider any single patent or trademark, group of patents or trademarks, copyright or trade secret to be material to our business as a whole, except for the Gardner Denver trademark. We have registered our trademarks in the countries we deem necessary or in our best interest. We also rely upon trade secret protection for our confidential and proprietary information and techniques, and we routinely enter into confidentiality agreements with our employees as well as our suppliers and other third parties receiving such information.
Pursuant to trademark license agreements, Cooper Industries has exclusive rights to use the Gardner Denver trademark for certain power tools and their components, meaning that we are prevented from using our mark in connection with those products.
Raw Materials and Suppliers
We purchase a wide variety of raw materials to manufacture our products. Our most significant commodity exposures are to cast iron, aluminum and steel. Additionally, we purchase a large number of motors and, therefore, are also exposed to changes in the price of copper, which is a primary component of motors. Most of our raw materials are generally available from a number of suppliers. We have a limited number of long-term contracts with some suppliers of key components, but we believe that our sources of raw materials and components are reliable and adequate for our needs. We use single sources of supply for certain castings, motors and other select engineered components. A disruption in deliveries from a given supplier could therefore have an adverse effect on our ability to meet commitments to our customers. Nevertheless, we believe that we have appropriately balanced this risk against the cost of maintaining a greater number of suppliers. Moreover, we have sought, and will continue to seek, cost reductions in purchases of materials and supplies by consolidating purchases and pursuing alternate sources of supply.
Employees
As of March 31, 2018, we had approximately 6,600 employees of which approximately 2,050 are located in the United States. Of those employees located outside of the United States, a significant portion are represented by works councils and labor unions, and of those employees located in the United States, approximately 200 are represented by labor unions. We believe that our current relations with employees are satisfactory.
69
Significant Properties
Our corporate headquarters is a leased facility located at 222 East Erie Street, Milwaukee, Wisconsin 53202. The number of significant properties used by each of our segments is summarized by segment, type and geographic location in the tables below:
|
|
Type of Significant Property
|
|||||||||||
|
|
Manufacturing
|
Warehouse
|
Other
|
Total
|
||||||||
|
Industrials
|
|
|
|
|
|
|
|
|
|
|
|
|
|
Americas
|
5
|
1
|
0
|
6
|
||||||||
|
EMEA
|
10
|
1
|
15
|
26
|
||||||||
|
APAC
|
1
|
1
|
8
|
10
|
||||||||
|
Industrials Total
|
16
|
3
|
23
|
42
|
||||||||
|
|
|
|
|
|
||||||||
|
Energy
|
|
|
|
|
||||||||
|
Americas
|
8
|
2
|
9
|
19
|
||||||||
|
EMEA
|
5
|
0
|
2
|
7
|
||||||||
|
APAC
|
2
|
0
|
2
|
4
|
||||||||
|
Energy Total
|
15
|
2
|
13
|
30
|
||||||||
|
|
|
|
|
|
||||||||
|
Medical
|
|
|
|
|
||||||||
|
Americas
|
3
|
0
|
0
|
3
|
||||||||
|
EMEA
|
4
|
0
|
1
|
5
|
||||||||
|
APAC
|
1
|
0
|
0
|
1
|
||||||||
|
Medical Total
|
8
|
0
|
1
|
9
|
||||||||
|
|
|
|
|
|
||||||||
|
Total (All Segments)
|
|
|
|
|
||||||||
|
Americas
|
16
|
3
|
9
|
28
|
||||||||
|
EMEA
|
19
|
1
|
18
|
38
|
||||||||
|
APAC
|
4
|
1
|
10
|
15
|
||||||||
|
Company Total(1)
|
39
|
5
|
37
|
81
|
||||||||
| (1) | Two facilities are shared between our segments and each is counted once, in the Industrials segment, to avoid double counting. |
We believe that our properties, taken as a whole, are in good operating condition and are suitable for our business operations.
Environmental Matters
We are subject to numerous federal, state, local and foreign laws and regulations relating to the storage, handling, emission and disposal of materials and discharge of materials into the environment. We believe that our existing environmental control procedures are adequate and we have no current plans for substantial capital expenditures in this area. We have an environmental policy that confirms our commitment to a clean environment and compliance with environmental laws. We have an active environmental management program aimed at complying with existing environmental regulations and reducing the generation of pollutants in the manufacturing processes. We are also subject to laws concerning the cleanup of hazardous substances and wastes, such as the U.S. federal “Superfund” and similar state laws that impose liability for cleanup of certain waste sites and for related natural resource damages. We have been identified as a potentially responsible party with respect to several sites designated for cleanup under the “Superfund” or similar state laws. See “—Legal Proceedings—Environmental Liabilities.”
Legal Proceedings
We are a party to various legal proceedings, lawsuits and administrative actions, which are of an ordinary or routine nature for a company of our size and in our sector. We believe that such proceedings, lawsuits and
70
administrative actions will not materially adversely affect our operations, financial condition, liquidity or competitive position. A more detailed discussion of certain of these proceedings, lawsuits and administrative actions is set forth below.
Asbestos and Silica-Related Litigation
We have been named as a defendant in many asbestos-related and silica-related personal injury lawsuits. The plaintiffs in these suits allege exposure to asbestos or silica from multiple sources and typically we are one of approximately 25 or more named defendants. Our predecessors sometimes manufactured, distributed and/or sold products allegedly at issue in these pending asbestos and silica-related lawsuits (the “Products”). However, neither we nor our predecessors ever mined, manufactured, mixed, produced or distributed asbestos fiber or silica sand, the materials that allegedly caused the injury underlying the lawsuits. Moreover, the asbestos-containing components of the Products, if any, were enclosed within the subject Products.
Although we have never mined, manufactured, mixed, produced or distributed asbestos fiber or silica, many of the companies that did engage in such activities or produced such products are no longer in operation. This has led to law firms seeking potential alternative companies to name in lawsuits where there has been an asbestos or silica related injury. However, in our opinion, based on our experience to date, the substantial majority of the plaintiffs have not suffered an injury for which we bear responsibility.
We believe that the pending and future asbestos and silica-related lawsuits are not likely to, in the aggregate, have a material adverse effect on its consolidated financial position, results of operations or liquidity, based on: our anticipated insurance and indemnification rights to address the risks of such matters; the limited potential asbestos exposure from the Products described above; our opinion, based on our experience to date, that the vast majority of plaintiffs are not impaired with a disease attributable to alleged exposure to asbestos or silica from or relating to the Products or for which we otherwise bear responsibility; various potential defenses available to us with respect to such matters; and our prior disposition of comparable matters. However, inherent uncertainties of litigation and future developments, including, without limitation, potential insolvencies of insurance companies or other defendants, an adverse determination in the Adams County Case (discussed below), or other inability to collect from our historical insurers or indemnitors, could cause a different outcome. While the outcome of legal proceedings is inherently uncertain, based on presently known facts, experience and circumstances, we believe that the amounts accrued on the Company’s balance sheet are adequate and that the liabilities arising from the asbestos and silica-related personal injury lawsuits will not have a material adverse effect on the Company’s consolidated financial position, results of operations or liquidity. We have accrued liabilities and other liabilities on our consolidated balance sheet to include a total litigation reserve of $102.8 million and $105.6 million as of March 31, 2018 and December 31, 2017, respectively, with respect to potential liability arising from our asbestos-related litigation. Asbestos-related defense costs are excluded from the asbestos claims liability and are recorded separately as an operating expense as services are incurred. We currently expect to continue to incur significant asbestos-related defense costs. In the event of unexpected future developments, it is possible that the ultimate resolution of these matters may be material to the Company’s consolidated financial position, results of operation or liquidity, and defense costs may be material. However, at this time, based on presently available information, we view this possibility as remote.
We have entered into a series of agreements with certain of the Company’s or the Company’s predecessors’ legacy insurers and certain potential indemnitors to secure insurance coverage and/or reimbursement for the costs associated with the asbestos and silica-related lawsuits filed against us. We have also pursued litigation against certain insurers or indemnitors where necessary. We have an insurance recovery receivable for probable asbestos related recoveries of approximately $96.4 mllion and $100.4 million as of March 31, 2018 and December 31, 2017, respectively, which is included in other assets on our consolidated balance sheet. During the three month period ended March 31, 2018, we received asbestos related insurance recoveries of $9.6 million, of which $4.0 million related to the recovery of indemnity payments, and was recorded as a reduction of the insurance recovery receivable in other assets on our consolidated balance sheet, and $5.6 million related to the reimbursement of previously expensed legal defense costs, and was recorded as a reduction of selling and administrative expenses in the consolidated statements of operations.
The largest such recent action, Gardner Denver, Inc. v. Certain Underwriters at Lloyd’s, London, et al., was filed on July 9, 2010, in the Eighth Judicial Circuit, Adams County, Illinois, as case number 10-L-48 (the “Adams County Case”). In the lawsuit, we seek, among other things, to require certain excess insurer defendants
71
to honor their insurance policy obligations to us, including payment in whole or in part of the costs associated with the asbestos-related lawsuits filed against us. In October 2011, we reached a settlement with one of the insurer defendants, which had issued both primary and excess policies, for approximately the amount of such defendant’s policies which were subject to the lawsuit. Since then, the case has been proceeding through the discovery and motions process with the remaining insurer defendants. On January 29, 2016, we prevailed on the first phase of that discovery and motions process (“Phase I”). Specifically, the Court in the Adams County Case ruled that we have rights under all of the policies in the case, subject to their terms and conditions, even though the policies were sold to our former owners rather than to the Company itself. On June 9, 2016, the Court denied a motion by several of the insurers who sought permission to appeal the Phase I ruling now rather than waiting until the end of the whole case as is normally required. The case has now begun proceeding through the discovery and motions process regarding the remaining issues in dispute.
A majority of our expected future recoveries of the costs associated with the asbestos-related lawsuits are the subject of the Adams County Case.
The amounts we recorded for asbestos-related liabilities and insurance recoveries are based on currently available information and assumptions that we believe are reasonable based on our evaluation of relevant factors with input from a third party actuarial expert. Our actual liabilities or insurance recoveries could be higher or lower than those recorded if actual results vary significantly from the assumptions. There are a number of key variables and assumptions including the number and type of new claims to be filed each year, the resolution or outcome of these claims, the average cost of resolution of each new claim, the amount of insurance available, allocation methodologies, the contractual terms with each insurer with whom we have reached settlements, the resolution of coverage issues with other excess insurance carriers with whom we have not yet achieved settlements and the solvency risk with respect to our insurance carriers. Other factors that may affect our future liability include uncertainties surrounding the litigation process from jurisdiction to jurisdiction and from case to case, legal rulings that may be made by state and federal courts and the passage of state or federal legislation. We make the necessary adjustments for our asbestos liability and corresponding insurance recoveries on an annual basis unless facts or circumstances warrant assessment as of an interim date.
Environmental Liabilities
We have been identified as a potentially responsible party (“PRP”) with respect to several sites designated for cleanup under U.S. federal “Superfund” or similar state laws that impose liability for cleanup of certain waste sites and for related natural resource damages. Persons potentially liable for such costs and damages generally include the site owner or operator and persons that disposed or arranged for the disposal of hazardous substances found at those sites. Although these laws impose joint and several liability on PRPs, in application, the PRPs typically allocate the investigation and cleanup costs based upon the volume of waste contributed by each PRP. Based on currently available information, our Company was only a small contributor to these waste sites, and we have, or are attempting to negotiate, de minimis settlements for our cleanup. The cleanup of the remaining sites is substantially complete and our future obligations entail a share of the sites’ ongoing operating and maintenance expense. We are also addressing four on-site cleanups for which we are the primary responsible party. Three of these cleanup sites are in the operation and maintenance stage and one is in the implementation stage.
We have an accrued liability on our consolidated balance sheet of $7.3 million and $7.5 million as of March 31, 2018 and December 31, 2017, respectively, to the extent costs are known or can be reasonably estimated for our remaining financial obligations for the environmental matters discussed above and which does not anticipate that any of these matters will result in material additional costs beyond amounts accrued. Based upon consideration of currently available information, we do not anticipate any material adverse effect on our results of operations, financial condition, liquidity or competitive position as a result of compliance with federal, state, local or foreign environmental laws or regulations, or cleanup costs relating to these matters.
72
Executive Officers and Directors
Below is a list of our executive officers and directors and their respective ages and a brief account of the business experience of each of them.
|
Name
|
Age
|
Position
|
|
Vicente Reynal
|
43
|
Director and Chief Executive Officer
|
|
Philip T. Herndon
|
52
|
Vice President and Chief Financial Officer
|
|
Andrew Schiesl
|
46
|
Vice President, General Counsel, Chief Compliance Officer and Secretary
|
|
Mark R. Sweeney
|
56
|
Vice President, Chief Accounting Officer and Corporate Controller
|
|
Neil D. Snyder
|
45
|
Senior Vice President, Strategy, Business Development and Planning
|
|
Kimberly J. Rubottom
|
54
|
Vice President, Human Resources
|
|
Enrique Miñarro Viseras
|
40
|
Vice President and General Manager, Industrials Group EMEA
|
|
Peter M. Stavros
|
43
|
Director, Chairman of the Board
|
|
Brandon F. Brahm
|
33
|
Director
|
|
William P. Donnelly
|
56
|
Director
|
|
John Humphrey
|
52
|
Director
|
|
William E. Kassling
|
74
|
Director
|
|
Michael V. Marn
|
65
|
Director
|
|
Nickolas Vande Steeg
|
75
|
Director
|
|
Joshua T. Weisenbeck
|
36
|
Director
|
Vicente Reynal has served as our Chief Executive Officer since January 2016, and has also been a member of our board of directors since February 2017 and a member of the board of Gardner Denver, Inc. since January 2016. Mr. Reynal is responsible for leading the Company and driving its overall growth and profitability as a global supplier of innovative and application-critical flow control products, services and solutions. Mr. Reynal joined Gardner Denver in May 2015 as the President of our Industrials segment. Before joining Gardner Denver, Mr. Reynal spent 11 years at Danaher Corporation, a designer and manufacturer of professional, medical, industrial and commercial products and services, where he most recently served as the Group President of Dental Technologies from December 2013 to May 2015, leading the KaVo Kerr Group. Mr. Reynal also held various other executive positions at Danaher Corporation, including as the President of the Ormco business from October 2011 to December 2013, President of the Pelton & Crane, KaVo business from 2007 to 2011 and Vice President of Global Operations for the Danaher Motion Platform from 2004 to 2007. Prior to joining Danaher, Mr. Reynal served in various operational and executive roles at Thermo Fisher Scientific and AlliedSignal Corp. (which merged with Honeywell, Inc. to become Honeywell International, Inc. in 1999). Mr. Reynal holds a Bachelor of Science degree in Mechanical Engineering from Georgia Institute of Technology and Master of Science degrees in both Mechanical Engineering and Technology & Policy from Massachusetts Institute of Technology.
Philip T. (“Todd”) Herndon has served as our Chief Financial Officer since October 2016. Mr. Herndon joined Gardner Denver in January 2016 as Chief Financial Officer of our Industrials segment. Mr. Herndon is responsible for leading the Company’s financial and accounting operations, information technology on a global basis and global pricing excellence. Prior to joining Gardner Denver, Mr. Herndon served as the Chief Financial Officer of Capital Safety, Inc., the nation’s top producer of fall safety equipment, from November 2012 to August 2015. Prior to joining Capital Safety, Mr. Herndon was Vice President of Finance for Sealed Air Corporation, a packaging manufacturer, from 2011 to 2012. From 2007 to 2011, Mr. Herndon was Vice President of Business Development and Corporate Controller at Diversey, Inc. Prior to 2007, Mr. Herndon held various financial and general management roles within Diversey, Inc. Mr. Herndon graduated from the Indiana University with a Bachelor of Business Administration and holds a Master of Business from Marquette University.
Andrew Schiesl has served as our Vice President, General Counsel, Chief Compliance Officer and Secretary since joining Gardner Denver in December 2013. Mr. Schiesl is responsible for leading the Company’s legal, compliance, governance and risk management functions and has global oversight for human resource and compensation matters. Mr. Schiesl served as Vice President and General Counsel of Quad/Graphics, Inc., a commercial printing business, from 2003 until he joined Gardner Denver. Prior to Quad/Graphics, he was Senior Counsel at Harley-Davidson, Inc., after beginning his career practicing law with Foley & Lardner LLP in
73
Milwaukee. Mr. Schiesl received a bachelor’s degree in Political Science and History from the University of Wisconsin-Milwaukee and graduated from the University of Pennsylvania School of Law. He holds a Master of Business Administration from the Kellogg School of Management at Northwestern University.
Mark R. Sweeney has served as our Chief Accounting Officer since January 2017. Mr. Sweeney joined Gardner Denver as Corporate Controller in May 2014 and is responsible for controllership, accounting, financial reporting, financial systems and global shared-services for the Company. Prior to joining Gardner Denver, Mr. Sweeney served as Senior Vice President and Chief Accounting Officer of J.C. Penney Company from September 2012 to September 2013. Prior to J.C. Penney, Mr. Sweeney served as Vice President and Operational Controller at General Electric from 2008 to 2012 and held multiple finance positions with increasing responsibility in General Electric’s Energy Division from 1997 through 2008. Mr. Sweeney graduated from the University of Missouri-Columbia with a degree in Accountancy.
Neil D. Snyder has served as our Senior Vice President in charge of Strategy, Business Development and Planning since January 2017. Mr. Snyder joined Gardner Denver in March 2016 as Vice President Strategy & Planning, Industrials segment. Prior to joining Gardner Denver, Mr. Snyder served as Vice President, Head of Financial Planning and Analysis from June 2012 to January 2016 and President, Europe, Middle East and Africa from September 2013 to May 2014 for Capital Safety Inc. the global top producer of fall safety equipment. Previously, Mr. Snyder held various executive roles of increasing responsibility at United Technologies Corporation from 2007 to 2012 and Hewlett-Packard Company from 2002 to 2006. Mr. Snyder began his career at Ernst & Young LLP. Mr. Snyder holds a Bachelor of Science in Accounting from the University of Southern California and a Master of Business Administration from the Kellogg School of Management at Northwestern University.
Kimberly J. Rubottom has served as our Vice President of Human Resources since January 2015. Ms. Rubottom joined Gardner Denver in January 2014 as Vice President, Industrials segment focusing on Organization Management & Strategy. Prior to joining Gardner Denver, Ms. Rubottom served most recently as Underground Hard Rock Drilling Global Product Manager for Caterpillar Inc. from July 2011 to December 2013. Ms. Rubottom previously held multiple roles with increasing responsibility in Human Resources, Corporate Control, Business Management and Operations/Lean Management at Caterpillar Inc., Bucyrus International, Inc. and DBT GmbH from 1999 through 2011. Ms. Rubottom earned a Bachelor of Business Administration, Accounting and Finance from Clarion University of Pennsylvania.
Enrique Miñarro Viseras has served as our Vice President and General Manager, Industrials segment EMEA Region since joining Gardner Denver in May 2016. Mr. Miñarro Viseras is responsible for leading all Industrials segment operations including sales, service and manufacturing within Europe and India. Prior to Gardner Denver, Mr. Miñarro Viseras had an extensive fifteen year career at Emerson Network Power and Emerson Industrial Automation, most recently serving as the Managing Director, Emerson Network Power from May 2015 to April 2016. Prior to Managing Director, Mr. Miñarro Viseras held the position of President, Control Techniques for Emerson Industrial Automation from July 2012 to April 2015. Mr. Miñarro Viseras holds a degree in Industrial Engineering from Universidad Politécnica of Valencia, Spain, a Master of Business Administration and a Master of Engineering and Management from Cranfield University, United Kingdom and a Doctorate in Engineering.
Peter M. Stavros has been a member of our board of directors since July 2013. Mr. Stavros joined KKR & Co. in 2005 and is a Member of KKR & Co. and head of its Industrials investment team. He also became a member of KKR & Co.’s Americas Investment Committee in September 2013 and KKR & Co.’s Healthcare Growth Investment Committee in 2016. Prior to taking over responsibility for the Industrials sector in 2010, Mr. Stavros was a member of KKR & Co.’s Healthcare investment team. During that time, he was actively involved with the investment in HCA and, since assuming responsibility for the Industrials sector, has been actively involved with the investments in Capsugel, Capital Safety, Gardner Denver, The Crosby Group and CHI Overhead Doors. Prior to joining KKR & Co., Mr. Stavros was with GTCR Golder Rauner from 2002 to 2005, where he was involved in the execution of numerous investments in the health care sector. He holds a Bachelor of Science in Chemistry, magna cum laude, from Duke University and a Master of Business Administration with high distinction, Baker Scholar, from Harvard Business School.
Brandon F. Brahm has been a member of our board of directors since July 2013. Mr. Brahm has been a member of the Industrials team at KKR & Co. since 2010. He has been actively involved with the investments in
74
Capital Safety, Gardner Denver and The Crosby Group. In addition, he serves on the board of directors of The Crosby Group and was formerly a director of Capital Safety. Prior to joining KKR & Co., he was with Goldman Sachs in New York, where he was involved in a variety of merger, acquisition, financing and other corporate advisory transactions in the financial institutions group. He holds a Bachelor of Science in Finance from the Leonard N. Stern School of Business at New York University.
William P. Donnelly has been a member of our board of directors since May 2017. Mr. Donnelly joined Mettler-Toledo International Inc. in 1997 and since 2014 has been Executive Vice President responsible for finance, investor relations, supply chain and information technology. From 1997 to 2002 and from 2004 to 2014, Mr. Donnelly served as Mettler-Toledo’s Chief Financial Officer. From 2002 to 2004, he served as division head of Mettler-Toledo’s product inspection and certain lab businesses. From 1993 to 1997, Mr. Donnelly served in various senior financial roles, including Chief Financial Officer, of Elsag Bailey Process Automation, NV and prior to that, he was an auditor with PricewaterhouseCoopers LLP from 1983 to 1993. Mr. Donnelly serves on the Executive Committee of John Carroll University’s Board of Trustees. Mr. Donnelly received a Bachelor of Science in Business Administration from John Carroll University.
John Humphrey has been a member of our Board since February 2018. In 2017, Mr. Humphrey retired from Roper Technologies, a company that designs and develops software and engineered products and solutions for healthcare, transportation, food, energy, water, education and other niche markets worldwide. At Roper, he served from 2011 to 2017, as Executive Vice President and Chief Financial Officer, and from 2006 to 2011, as Vice President and Chief Financial Officer. Prior to joining Roper, Mr. Humphrey spent 12 years with Honeywell International, Inc. and its predecessor company, AlliedSignal, in a variety of financial leadership positions. Mr. Humphrey’s earlier career included six years with Detroit Diesel Corporation, a manufacturer of heavy-duty engines, in a variety of engineering and manufacturing management positions. He is a member of the Board of Advisors of the Elon University Love School of Business. Mr. Humphrey received a B.S. in Industrial Engineering from Purdue University and an M.B.A. from the University of Michigan.
William E. Kassling has been a member of our board of directors since February 2017 and a member of the board of Gardner Denver, Inc. since August 2013. He has served as Lead Director of Wabtec Corporation, a manufacturer of braking equipment and other parts for locomotives, freight cars and passenger rail cars, since 2013. Mr. Kassling also previously served as President and Chief Executive Officer of Wabtec Corporation from 1990 until 2001 and 2004 to 2006, and served as Chairman from 2009 to 2013. Before leading a management group in the purchase of Wabtec Corporation from American Standard in 1990, Mr. Kassling spent six years overseeing its operations as American Standard’s Vice President, Group Executive, Railway Products Group. Prior to that, between 1978 and 1984, he served American Standard Incorporated first as Vice President, Strategic Planning and Development and later as Vice President, Group Executive and Building Specialties Group. In addition to Wabtec Corporation, Mr. Kassling is a board member of The Crosby Group, Pacific Design Technologies, the Pittsburgh Penguins and the Texas Rangers and served as a board member of Parker Hannifin Corporation from 2001 to 2015. He is also a member of the advisory board of the University of Pittsburgh Cancer Institute. Mr. Kassling holds a Master of Business Administration from the University of Chicago and a Bachelor of Science degree in Industrial Management from Purdue University.
Michael V. Marn has been a member of our board of directors since February 2017 and a member of the board of Gardner Denver, Inc. since August 2013. Mr. Marn has served as an Industry Advisor in KKR & Co.’s Industrials team, specializing in industrial marketing since 2010. From 1977 until his retirement in 2010, he was a Partner at McKinsey & Company. As a leader in McKinsey’s worldwide marketing practice, Mike focused primarily on business-to-business clients, and split his time between assisting clients and leading research and development efforts. He also served as the Chairman of the American Red Cross Northeast Ohio Region. Mr. Marn holds a Bachelor of Arts from Hiram College and a Masters in Management Science from Case Western Reserve University.
Nickolas Vande Steeg has been a member of our board of directors since February 2017 and a member of the board of Gardner Denver, Inc. since August 2013. He served for 34 years at Parker Hannifin Corporation, a global supplier of innovative engineered products, in positions of increasing responsibility culminating as President, Chief Operating Officer and Board Member from 2004 to 2007. Mr. Vande Steeg currently serves on the board of Trimble, Inc. since 2006 and is a trustee of an APU/ UC University, board member of several non-profits, and a minority partner in a Major League Baseball team. He is also a director and partial owner of
75
Pacific Design Technologies, an Aerospace thermal management supplier, since 2015. He obtained a Bachelor of Science in Industrial Technology from the University of California and a Master of Business Administration with highest honors from Pepperdine University. Mr. Vande Steeg was awarded the Shingo Lean Leadership Management Award in 2006.
Joshua T. Weisenbeck has been a member of our board of directors since July 2013. Mr. Weisenbeck has been a member of the Industrials team at KKR & Co. since 2008. He has been actively involved with the investments in Gardner Denver, Capsugel and Capital Safety, in addition to having portfolio company responsibility for BrightView. In addition, he serves on the board of directors of Capsugel and BrightView and was formerly a director of Capital Safety. Prior to joining KKR & Co., Mr. Weisenbeck was with Onex Corporation from 2006 to 2008, focusing on Industrials private equity transactions, including Onex’s investment in Allison Transmission. Prior to Onex, he worked for Lazard Freres & Co. in its Power & Energy group from 2004 to 2006, where he was involved in a number of merger and acquisition transactions. He holds a Bachelor of Arts with honors, magna cum laude, from Williams College.
Composition of our Board of Directors
Background and Experience of Directors
When considering whether directors and nominees have the experience, qualifications, attributes or skills, taken as a whole, to enable our board of directors to satisfy its oversight responsibilities effectively in light of our business and structure, the board of directors focused primarily on each person’s background and experience as reflected in the information discussed in each of the directors’ individual biographies set forth above. We believe that our directors provide an appropriate mix of experience and skills relevant to the size and nature of our business. Once appointed, directors serve until they resign or are removed by the stockholders.
In particular, the members of our board of directors considered the following important characteristics: (i) Vicente Reynal, our Chief Executive Officer, has 22 years of experience in corporate strategy, new product development, general management processes and operations leadership with companies in the industrial, energy and medical industries, (ii) Peter M. Stavros, Joshua T. Weisenbeck and Brandon F. Brahm are representatives appointed by affiliates of our Sponsor, our principal stockholder, and have significant financial, investment and operational experience from their involvement in our Sponsor’s investment in numerous portfolio companies and have played active roles in overseeing those businesses, (iii) William E. Kassling has many years of experience at manufacturing companies, including experience as chief executive officer and chairman of the board of a publicly held company, (iv) Michael V. Marn has many years of experience as senior partner at a consulting company and has been involved in our Sponsor’s investments in industrial companies, (v) Nickolas Vande Steeg has many years of experience as president, chief operating officer and board member of a publicly held engineered products company, (vi) William P. Donnelly has many years of experience as the chief financial officer of a publicly held company and (vii) John Humphrey has many years of experience at manufacturing companies, including experience as the chief financial officer and as a board member of a publicly held company.
Director Independence
Our board of directors has affirmatively determined that each of Messrs. Kassling, Vande Steeg, Donnelly and Humphrey qualifies as an “independent” director in accordance with the listing requirements of the NYSE. After completion of this offering, we will remain a “controlled company” within the meaning of the corporate governance standards of the NYSE. Under these rules, a company of which more than 50% of the voting power for the election of directors is held by an individual, group or another company is a “controlled company.” Affiliates of our Sponsor hold more than 50% of our common stock. Accordingly, we may elect not to comply with certain corporate governance requirements, including the requirements that, within one year of the date of the listing of our common stock:
| • | we have a board of directors that is composed of a majority of “independent directors,” as defined under the rules of such exchange; |
| • | we have a compensation committee that is composed entirely of independent directors with a written charter addressing the committee’s purpose and responsibilities; and |
| • | We have a nominating and corporate governance committee that is composed entirely of independent directors with a written charter addressing the committee’s purpose and responsibilities. |
76
After we cease to be a “controlled company,” we will be required to comply with the above-referenced requirements, subject to the transition periods for companies that cease to qualify as controlled companies.
We currently utilize certain of these exemptions. As a result, we will not have a majority of independent directors on our board of directors, will have no independent directors on our compensation committee and will have no nominating and corporate governance committee.
Classified Board of Directors
In accordance with our amended and restated certificate of incorporation, our board of directors is divided into three classes with staggered, three-year terms. At each annual meeting of stockholders, the successors to directors whose terms then expire will be elected to serve from the time of election and qualification until the third annual meeting following election. Our directors are currently divided among the three classes as follows:
| • | the Class I directors consist of Messrs. Stavros, Kassling and Marn, and their terms will expire at the annual meeting of stockholders to be held in 2018; |
| • | the Class II directors consist of Messrs. Reynal, Weisenbeck and Humphrey, and their terms will expire at the annual meeting of stockholders to be held in 2019; |
| • | the Class III directors consist of Messrs. Brahm, Donnelly and Vande Steeg, and their terms will expire at the annual meeting of stockholders to be held in 2020. |
Our amended and restated certificate of incorporation provide that the authorized number of directors may be changed only by resolution of the board of directors. Any additional directorships resulting from an increase in the number of directors will be distributed among the three classes so that, as nearly as possible, each class will consist of one-third of the directors. The division of our board of directors into three classes with staggered three-year terms may delay or prevent a change of our management or a change in control of our Company.
Leadership Structure of our Board of Directors
Our amended and restated bylaws provide our board of directors with flexibility to combine or separate the positions of Chairman of the Board and Chief Executive Officer in accordance with its determination that utilizing one or the other structure would be in the best interests of our Company. Peter M. Stavros serves as Chairman of the Board. Vicente Reynal, our Chief Executive Officer, also serves as a director.
Our board of directors has concluded that our current leadership structure is appropriate at this time. However, our board of directors will continue to periodically review our leadership structure and may make such changes in the future as it deems appropriate.
Role of Board in Risk Oversight
Our Chief Executive Officer and other executive officers will regularly report to the non-executive directors and the audit committee to ensure effective and efficient oversight of our activities and to assist in proper risk management and the ongoing evaluation of management controls. Internal audit will report functionally and administratively to our Chief Financial Officer and directly to the audit committee. We believe that the leadership structure of our board of directors provides appropriate risk oversight of our activities given the controlling interests held by affiliates of our Sponsor.
Committees of our Board of Directors
Our audit committee and compensation committee each operate under a charter that has been approved by our board of directors. Copies of each committee’s charter are posted on our website, www.gardnerdenver.com.
Audit Committee
Our audit committee consists of Mr. Donnelly (as chairman), Mr. Kassling and Mr. Humphrey. Messrs. Donnelly, Kassling and Humphrey each qualify as an independent director under NYSE corporate governance standards and the independence requirements of Rule 10A-3 of the Exchange Act. Our board of directors has determined that Messrs. Donnelly and Humphrey qualify as an “audit committee financial expert” as such term is defined in Item 407(d)(5) of Regulation S-K.
77
The purpose of the audit committee is to prepare the audit committee report required by the SEC to be included in our proxy statement and to assist our board of directors in overseeing and monitoring (1) the quality and integrity of our financial statements, (2) our independent registered public accounting firm’s qualifications and independence and (3) the performance of our independent registered public accounting firm.
Compensation Committee
Our compensation committee consists of Mr. Vande Steeg, Mr. Stavros (as chairman) and Mr. Weisenbeck. The purpose of the compensation committee is to assist our board of directors in discharging its responsibilities relating to (1) setting our compensation program and compensation of our executive officers and directors, (2) monitoring our incentive and equity-based compensation plans and (3) preparing the compensation committee report required to be included in our proxy statement under the rules and regulations of the SEC.
Code of Business Conduct and Ethics
We have adopted a written code of ethics that applies to our directors, officers and employees, including our principal executive officer, principal financial officer, principal accounting officer or controller or persons performing similar functions. Our code of ethics sets forth our policies and expectations on a number of topics, including conflicts of interest, corporate opportunities, confidentiality, compliance with laws (including insider trading laws), use of our assets and business conduct and fair dealing. This code satisfies the requirements for a “code of ethics” as such term is defined in Item 406 of Regulation S-K. A current copy of the code is posted on our website, www.gardnerdenver.com. In addition, all disclosures that are required by law or the listing standards of the NYSE concerning any amendments to, or waivers from, any provision of the code are posted on our website. The reference to our website address does not constitute incorporation by reference of the information contained at or available through our website, and you should not consider it to be a part of this prospectus.
78
CERTAIN RELATIONSHIPS AND RELATED PARTY TRANSACTIONS
Arrangements with Our Executive Officers, Directors and Advisors
We have entered into letter agreements with certain members of management, including each of our executive officers, and our directors and certain advisors, pursuant to which such individuals agreed to invest in our stock and/or through the purchase of our shares with cash. In addition, our board of directors granted options to purchase shares of our common stock to certain members of management and key employees, including to our executive officers. In connection with the grants of new options described above, the participating members of our management, including our executive officers, were required to enter into a Management Stockholder’s Agreement as well as a stock option agreement, as applicable.
Below is a brief summary of the principal terms of the Management Stockholder’s Agreements, the Director Stockholder’s Agreements and the Advisor Stockholder’s Agreements, which are qualified in their entirety by reference to the agreements themselves, forms of which are filed as exhibits to the registration statement of which this prospectus is a part.
Management, Director and Advisor Stockholder’s Agreements
The Management Stockholder’s Agreements impose significant restrictions on transfers of shares of our common stock. Generally, shares held by our management are nontransferable by any means at any time prior to the earlier of (i) the occurrence of a Change in Control (as defined in the Management Stockholder’s Agreements) or (ii) the later to occur of (a) the fifth anniversary of the execution of the applicable Management Stockholder’s Agreement or (b) the consummation of an Initial Public Offering (as defined in the Management Stockholder’s Agreements). These transfer restrictions are subject to certain exceptions, including transfers approved by our board of directors; transfers upon the death or Disability (as defined in the Management Stockholder’s Agreements) of the holder; transfers to immediate family members or estate planning vehicles, provided such transferees become party to the applicable Management Stockholder’s Agreement; or repurchases of such shares by the Company.
Additionally, management stockholders have limited “piggyback” registration rights with respect to certain registered offerings conducted by the Company. The maximum number of shares of common stock which a management stockholder may register is generally proportionate with the percentage of common stock being sold by certain affiliates of our Sponsor (relative to their holdings thereof). The Management Stockholder’s Agreements also contain certain lock-up provisions in the event that any shares are offered to the public pursuant to an effective registration statement under the Securities Act of 1933, as amended (the “Securities Act”).
The Director Stockholder’s Agreements and Advisor Stockholder’s Agreements are substantially similar to the Management Stockholder’s Agreements. In addition to certain exceptions to transfer restrictions related to piggyback rights available to Management Stockholders, the Director and Advisor Stockholder’s Agreements further provide that in lieu of piggyback registration rights in connection with a public offering in which such piggyback rights would otherwise be available, the board of directors may waive transfer restrictions with respect to the number of shares that would have been subject to such piggyback rights.
Arrangements with Our Sponsor
Stockholders Agreement
In connection with our initial public offering, we entered into a stockholders agreement with certain affiliates of our Sponsor. This agreement grants affiliates of our Sponsor the right to nominate to our board of directors a number of designees equal to: (i) at least a majority of the total number of directors comprising our board of directors at such time as long as affiliates of our Sponsor beneficially own at least 50% of the shares of our common stock entitled to vote generally in the election of our directors; (ii) at least 40% of the total number of directors comprising our board of directors at such time as long as affiliates of our Sponsor beneficially own at least 40% but less than 50% of the shares of our common stock entitled to vote generally in the election of our directors; (iii) at least 30% of the total number of directors comprising our board of directors at such time as long as affiliates of our Sponsor beneficially own at least 30% but less than 40% of the shares of our common stock entitled to vote generally in the election of our directors; (iv) at least 20% of the total number of directors comprising our board of directors at such time as long as affiliates of our Sponsor beneficially own at least
79
20% but less 30% of the shares of our common stock entitled to vote generally in the election of our directors; and (v) at least 10% of the total number of directors comprising our board of directors at such time as long as affiliates of our Sponsor beneficially own at least 5% but less than 20% of the shares of our common stock entitled to vote generally in the election of our directors. For purposes of calculating the number of directors that affiliates of our Sponsor are entitled to nominate pursuant to the formula outlined above, any fractional amounts would be rounded up to the nearest whole number and the calculation would be made on a pro forma basis, taking into account any increase in the size of our board of directors (e.g., one and one quarter (11∕4) directors shall equate to two directors). In addition, in the event a vacancy on the board of directors is created by the death, disability, retirement or resignation of a Sponsor director designee, affiliates of our Sponsor shall, to the fullest extent permitted by law, have the right to have the vacancy filled by a new Sponsor director-designee. In addition, the stockholders agreement grants to our Sponsor special governance rights, for as long as our Sponsor maintains ownership of at least 30% of our outstanding common stock, including rights of approval over certain corporate and other transactions such as mergers or other transactions involving a change in control and certain rights regarding the appointment of our chief executive officer.
Registration Rights Agreement
In connection with the KKR Transaction, certain affiliates of our Sponsor entered into a registration rights agreement with us. In connection with the completion of our initial public offering, we and our Sponsor entered into an amended and restated registration rights agreement. The amended and restated registration rights agreement grants such affiliates of our Sponsor the right to cause us to register shares of our common stock held by it under the Securities Act and, if requested, to use our reasonable best efforts (if we are not eligible to use an automatic shelf registration statement at the time of filing) to maintain a shelf registration statement effective with respect to such shares. Certain affiliates of our Sponsor are also entitled to participate on a pro rata basis in any registration of our common stock under the Securities Act that we may undertake. The amended and restated registration rights agreement also provides that we will pay certain expenses relating to such registrations and indemnify certain affiliates of our Sponsor and members of management participating in any offering against certain liabilities, which may arise under the Securities Act, the Exchange Act, any state securities law or any rule or regulation thereunder applicable to us.
Monitoring Agreement
In connection with the KKR Transaction, we entered into a monitoring agreement with our Sponsor pursuant to which our Sponsor provided various management and advisory services to us and our direct and indirect divisions, subsidiaries, parent entities and controlled affiliates and received fees and reimbursements of related out-of-pocket expenses. We paid management fees of $1.1 million, $17.3 million, $4.8 million and $4.6 million to our Sponsor for the three months ended March 31, 2017 and each of the years ended December 31, 2017, 2016 and 2015, respectively. In May 2017, the monitoring agreement was terminated in accordance with its terms and we paid a termination fee of approximately $16.2 million.
Indemnification Agreement
In connection with entering into the monitoring agreement, we also entered into a separate indemnification agreement with our Sponsor and certain of its affiliates, which provides customary exculpation and indemnification provisions in favor of our Sponsor and such affiliates in connection with the services provided to us under the monitoring, transaction fee and syndication fee agreements.
Relationship with KKR Capstone Americas LLC
We have utilized and may continue to utilize KKR Capstone Americas LLC and/or its affiliates (“KKR Capstone”), a consulting company that works exclusively with our Sponsor’s portfolio companies, for consulting services, and have paid to KKR Capstone related fees and expenses. KKR Capstone is not a subsidiary or affiliate of our Sponsor. KKR Capstone operates under several consulting agreements with KKR & Co. and uses the “KKR” name under license from KKR & Co.
Relationship with KKR Credit
Since 2014, investment funds or accounts managed or advised by the global credit business of our Sponsor (“KKR Credit”) were participating lenders under our existing credit agreements and holders of notes issued by
80
us, and as of March 31, 2018, had received in aggregate principal payments of approximately $0.65 million and interest payments of approximately $4.35 million. As of March 31, 2018, investment funds or accounts managed or advised by KKR Credit held a position in the debt of the Company.
Financing Arrangements with Related Parties
In May 2017, KKR Capital Markets LLC, an affiliate of our Sponsor, acted as an underwriter in connection with the initial public offering of the Company’s stock and received underwriter discounts and commissions of approximately $8.9 million. In August 2017, KKR Capital Markets LLC received $1.5 million for services rendered in connection with a debt refinancing transaction. In November 2017, KKR Capital Markets LLC acted as an underwriter in connection with an offering of Company’s stock by certain selling shareholders, and earned underwriter discounts and commissions of approximately $3.5 million.
Policies and Procedures for Related Person Transactions
Our board of directors has adopted a written statement of policy regarding transactions with related persons, which we refer to as our “related person transaction policy.” Our related person transaction policy requires that (a) any “related person transaction” (defined as any transaction that is anticipated would be reportable by us under Item 404(a) of Regulation S-K in which we were or are to be a participant and the amount involved exceeds $120,000 and in which any related person had or will have a direct or indirect material interest) be approved or ratified by an approving body comprised of the disinterested members of our board of directors or any committee of the board of directors (provided that a majority of the members of the board of directors or such committee, respectively, are disinterested) and (b) any employment relationship or transaction involving an executive officer and any related compensation be approved by the Compensation Committee of the board of directors or recommended by the Compensation Committee to the board of directors for its approval. In connection with the review and approval or ratification of a related person transaction:
| • | management must disclose to the committee or disinterested directors, as applicable, the name of the related person and the basis on which the person is a related person, the material terms of the related person transaction, including the approximate dollar value of the amount involved in the transaction, and all the material facts as to the related person’s direct or indirect interest in, or relationship to, the related person transaction; |
| • | management must advise the committee or disinterested directors, as applicable, as to whether the related person transaction complies with the terms of our agreements governing our material outstanding indebtedness that limit or restrict our ability to enter into a related person transaction; |
| • | management must advise the committee or disinterested directors, as applicable, as to whether the related person transaction will be required to be disclosed in our applicable filings under the Securities Act or the Exchange Act, and related rules, and, to the extent required to be disclosed, management must ensure that the related person transaction is disclosed in accordance with such Acts and related rules; and |
| • | management must advise the committee or disinterested directors, as applicable, as to whether the related person transaction constitutes a “personal loan” for purposes of Section 402 of the Sarbanes-Oxley Act of 2002. |
In addition, the related person transaction policy provides that the committee or disinterested directors, as applicable, in connection with any approval or ratification of a related person transaction involving a non-employee director or director nominee, should consider whether such transaction would compromise the director or director nominee’s status as an “independent,” “outside,” or “non-employee” director, as applicable, under the rules and regulations of the SEC, the NYSE and the Internal Revenue Code.
81
PRINCIPAL AND SELLING STOCKHOLDERS
The following table sets forth information with respect to the beneficial ownership of our common stock, as of March 31, 2018 by:
| • | each person known by us to beneficially own more than 5% of our common stock; |
| • | each of our directors and director nominees; |
| • | each of our named executive officers; and |
| • | all of our executive officers, directors and director nominees as a group. |
A person is a “beneficial owner” of a security if that person has or shares voting or investment power over the security or if that person has the right to acquire beneficial ownership within 60 days. Unless otherwise noted, these persons may be contacted at our executive offices and, to our knowledge, have sole voting and investment power over the shares listed. Percentage computations are based on 197,226,113 shares of our common stock outstanding as of March 31, 2018. As of March 31, 2018, there were 217 holders of record of our common stock.
Except as otherwise indicated in the footnotes below, the address of each beneficial owner is c/o Gardner Denver Holdings, Inc., 222 East Erie Street, Suite 500, Milwaukee, Wisconsin 53202.
|
|
|
|
Shares to be Sold in this Offering
|
Shares Beneficially Owned After the Offering
|
||||
|
|
Shares Beneficially Owned
Prior to the Offering |
Assuming No
Exerciseof the Underwriters’ Option |
Assuming Full
Exerciseof the Underwriters’ Option |
Assuming No
Exerciseof the Underwriters’ Option |
Assuming Full
Exerciseof the Underwriters’ Option |
|||
|
Name of Beneficial Owner
|
Number(2)
|
Percentage
|
Number
|
Number
|
Number
|
Percentage
|
Number
|
Percentage
|
|
5% Stockholders:
|
|
|
|
|
|
|
|
|
|
Investment funds affiliated with our Sponsor(1)
|
121,157,473
|
61.4%
|
22,000,000
|
25,313,690
|
99,157,473
|
50.3%
|
95,843,783
|
48.6%
|
|
Named Executive Officers and Directors
|
|
|
|
|
|
|
|
|
|
Vicente Reynal
|
1,280,024
|
*
|
—
|
—
|
1,280,024
|
*
|
1,280,024
|
*
|
|
Philip T. Herndon
|
538,304
|
*
|
—
|
—
|
538,304
|
*
|
538,304
|
*
|
|
Andrew Schiesl
|
352,317
|
*
|
—
|
—
|
352,317
|
*
|
352,317
|
*
|
|
Neil D. Snyder
|
222,723
|
*
|
—
|
—
|
222,723
|
*
|
222,723
|
*
|
|
Enrique Miñarro Viseras
|
60,076
|
*
|
—
|
—
|
60,076
|
*
|
60,076
|
*
|
|
Peter M. Stavros(3)
|
—
|
—
|
—
|
—
|
—
|
—
|
—
|
—
|
|
Brandon F. Brahm(3)
|
—
|
—
|
—
|
—
|
—
|
—
|
—
|
—
|
|
William P. Donnelly
|
11,199
|
*
|
—
|
—
|
11,199
|
*
|
11,199
|
*
|
|
William E. Kassling
|
376,004
|
*
|
—
|
—
|
376,004
|
*
|
376,004
|
*
|
|
Michael V. Marn
|
46,026
|
*
|
—
|
—
|
46,026
|
*
|
46,026
|
*
|
|
Nickolas Vande Steeg
|
222,921
|
*
|
—
|
—
|
222,921
|
*
|
222,921
|
*
|
|
Joshua T. Weisenbeck(3)
|
—
|
—
|
—
|
—
|
—
|
—
|
—
|
—
|
|
John Humphrey
|
—
|
—
|
—
|
—
|
—
|
—
|
—
|
—
|
|
All directors and executive officers as a group (15 persons)
|
3,850,549
|
2.0%
|
—
|
—
|
3,850,549
|
2.0%
|
3,850,549
|
2.0%
|
|
Other selling stockholders representing less than 1% of owners of our common stock as a group
|
706,216
|
*
|
91,266
|
91,266
|
614,950
|
*
|
614,950
|
*
|
| * | Less than one percent. |
| (1) | Includes 121,157,473 shares directly owned by KKR Renaissance Aggregator L.P. KKR Renaissance Aggregator GP LLC, as the general partner of KKR Renaissance Aggregator L.P., KKR North America Fund XI L.P., as the sole member of KKR Renaissance Aggregator GP LLC, KKR Associates North America XI L.P., as the general partner of KKR North America Fund XI L.P., KKR North America XI Limited, as the general partner of KKR Associates North America XI L.P., KKR Fund Holdings L.P., as the sole shareholder of KKR North America XI Limited, KKR Fund Holdings GP Limited, as a general partner of KKR Fund Holdings L.P., KKR Group Holdings L.P., as the sole shareholder of KKR Fund Holdings GP Limited and a general partner of KKR Fund Holdings L.P., KKR Group Limited, as the general partner of KKR Group Holdings L.P., KKR & Co. L.P., as the sole shareholder of KKR |
82
Group Limited, KKR Management LLC, as the general partner of KKR & Co. L.P., and Messrs. Henry R. Kravis and George R. Roberts, as the designated members of KKR Management LLC may be deemed to be the beneficial owners having shared voting and investment power with respect to the shares described in this footnote. The principal business address of each of the entities and persons identified in this paragraph, except Mr. Roberts, is c/o Kohlberg Kravis Roberts & Co. L.P., 9 West 57th Street, Suite 4200, New York, NY 10019. The principal business address for Mr. Roberts is c/o Kohlberg Kravis Roberts & Co. L.P., 2800 Sand Hill Road, Suite 200, Menlo Park, CA 94025.
| (2) | The number of shares reported includes shares covered by options that are exercisable within 60 days as follows: Mr. Reynal, 1,047,998; Mr. Herndon, 368,736; Mr. Schiesl, 352,317; Mr. Bennet, 428,081; Mr. Miñarro Viseras, 54,428; Mr. Kassling, 46,026; Mr. Marn, 46,026; Mr, Vande Steeg, 46,026; all directors and executive officers as a group, 2,847,655; and all other selling stockholders representing less than 1% of owners of our common stock as a group, 636,463. |
| (3) | The principal business address of each of Messrs. Stavros, Weisenbeck and Brahm is c/o Kohlberg Kravis Roberts & Co. L.P., 9 West 57th Street, New York, New York 10019. |
83
SHARES ELIGIBLE FOR FUTURE SALE
Future sales of substantial amounts of common stock in the public market, or the perception that such sales may occur, could adversely affect the market price of our common stock.
As of March 31, 2018, we had 197,226,113 shares of common stock outstanding. All shares sold in this offering will be freely tradable without restriction or further registration under the Securities Act, except for any shares purchased by our “affiliates,” as that term is defined in Rule 144 under the Securities Act, whose sales would be subject to the Rule 144 resale restrictions described below, other than the holding period requirement.
102,339,847 shares of common stock will be “restricted securities,” as that term is defined in Rule 144 under the Securities Act. These restricted securities are eligible for public sale only if they are registered under the Securities Act or if they qualify for an exemption from registration under Rules 144 or 701 under the Securities Act, which are summarized below.
In addition, of the 17,944,823 shares of our common stock that will be subject to stock options, SARs and DSUs outstanding immediately following this offering, assuming no exercise of options or SARs after March 31, 2018, options to purchase 8,414,203 shares of common stock and 118,274 SARs that we expect to be settled in shares were vested as of March 31, 2018 and, upon exercise, these shares will be eligible for sale subject to the lock-up agreements described below and Rules 144 and 701 under the Securities Act. The 102,339,847 shares of common stock held by our Sponsor, certain of our directors and officers and other management stockholders after this offering will be “restricted” securities under the meaning of Rule 144 and may not be sold in the absence of registration under the Securities Act, unless an exemption from registration is available, including the exemptions pursuant to Rule 144 and Rule 701 under the Securities Act. In addition, to the extent such other existing stockholders are otherwise permitted to sell their shares, they may not reduce their relative ownership of our shares at a faster rate than our Sponsor’s reduction of its relative ownership. Furthermore, 7,913,462 shares of common stock have been authorized and reserved for issuance in relation to potential future awards under the 2017 Stock Incentive Plan.
Lock-Up Agreements
We, our officers, directors and the selling stockholders have agreed, subject to specified exceptions, not to directly or indirectly:
| • | sell, offer, contract or grant any option to sell (including any short sale), transfer, establish an open “put equivalent position” within the meaning of Rule 16a-l(h) under the Exchange Act, or |
| • | otherwise dispose of any shares of common stock, options or warrants to acquire shares of common stock, or securities exchangeable or exercisable for or convertible into shares of common stock currently or hereafter owned either of record or beneficially, or |
| • | publicly announce an intention to do any of the foregoing for a period of 90 days after the date of this prospectus without the prior written consent of Goldman Sachs & Co. LLC and Citigroup Global Markets Inc. |
This restriction terminates after the close of trading of the common stock on and including the 90th day after the date of this prospectus. Goldman Sachs & Co. LLC and Citigroup Global Markets Inc. may, in their sole discretion and at any time or from time to time before the termination of the 90-day period release all or any portion of the securities subject to lock-up agreements. There are no existing agreements between the underwriters and any of our shareholders who will execute a lock-up agreement, providing consent to the sale of shares prior to the expiration of the lock-up period.
84
Rule 144
Affiliate resales of restricted securities
In general, a person who is an affiliate of ours, or who was an affiliate at any time during the 90 days before a sale, who has beneficially owned shares of our common stock for at least six months would be entitled to sell in “broker’s transactions” or certain “riskless principal transactions” or to market makers, a number of shares within any three month period that does not exceed the greater of:
| • | 1% of the number of shares of our common stock then outstanding, which will equal approximately 1.9 million shares immediately after this offering; or |
| • | the average weekly trading volume in our common stock on the NYSE during the four calendar weeks preceding the filing of a notice on Form 144 with respect to such sale. |
Affiliate resales under Rule 144 are also subject to the availability of current public information about us. In addition, if the number of shares being sold under Rule 144 by an affiliate during any three month period exceeds 5,000 shares or has an aggregate sale price in excess of $50,000, the seller must file a notice on Form 144 with the SEC and the NYSE concurrently with either the placing of a sale order with the broker or the execution directly with a market maker.
Non-affiliate resales of restricted securities
In general, a person who is not an affiliate of ours at the time of sale, and has not been an affiliate at any time during the three months preceding a sale, and who has beneficially owned shares of our common stock for at least six months but less than a year, is entitled to sell such shares subject only to the availability of current public information about us. If such person has held our shares for at least one year, such person can resell under Rule 144(b)(1) without regard to any Rule 144 restrictions, including the 90-day public company requirement and the current public information requirement.
Non-affiliate resales are not subject to the manner of sale, volume limitation or notice filing provisions of Rule 144.
Rule 701
In general, under Rule 701, any of an issuer’s employees, directors, officers, consultants or advisors who purchases shares from the issuer in connection with a compensatory stock or option plan or other written agreement before the effective date of a registration statement under the Securities Act is entitled to sell such shares 90 days after such effective date in reliance on Rule 144. An affiliate of the issuer can resell shares in reliance on Rule 144 without having to comply with the holding period requirement, and non-affiliates of the issuer can resell shares in reliance on Rule 144 without having to comply with the current public information and holding period requirements.
The Securities and Exchange Commission has indicated that Rule 701 will apply to typical stock options granted by an issuer before it becomes subject to the reporting requirements of the Exchange Act, along with the shares acquired upon exercise of such options, including exercises after an issuer becomes subject to the reporting requirements of the Exchange Act.
Equity Plans
We have filed a registration statement on Form S-8 under the Securities Act to register common stock issued or reserved for issuance under the 2013 Stock Incentive Plan and the 2017 Stock Incentive Plan. Such Form S-8 registration statement automatically became effective upon filing. Accordingly, shares registered under such registration statement are available for sale in the open market, unless such shares are subject to Rule 144 limitations applicable to affiliates, vesting restrictions on transfer under the management stockholder’s agreement, or the lock-up restrictions described below.
85
Registration Rights
Holders of 102,339,847 shares of common stock or their transferees will be entitled to various rights with respect to the registration of these shares under the Securities Act.
Registration of these shares under the Securities Act would result in these shares becoming fully tradable without restriction under the Securities Act immediately upon the effectiveness of the registration, except for shares purchased by affiliates. See “Certain Relationships and Related Person Transactions—Registration Rights Agreement” for additional information. Shares covered by a registration statement will be eligible for sale in the public market upon the expiration or release from the terms of the lock-up agreement.
Management, Director and Advisor Stockholder’s Agreements
Our Management, Director and Advisor Stockholder’s Agreements impose significant restrictions on transfers of shares of common stock. Generally, shares held by our management, directors and certain advisors are nontransferable by any means at any time prior to the earlier of (i) the occurrence of a Change in Control (as defined in the Management, Director and Advisor Stockholder’s Agreements) or (ii) the later to occur of (a) the fifth anniversary of the execution of the applicable Management, Director and Advisor Stockholder’s Agreement, which was executed in most cases on the date of the first equity award, or (b) the consummation of an Initial Public Offering (as defined in the Management, Director and Advisor Stockholder’s Agreements), except as described in “Certain Relationships and Related Party Transactions—Arrangements with Our Executive Officers—Management, Director and Advisor Stockholder’s Agreement.” Exceptions include management, director and advisor stockholders’ limited “piggyback” registration rights with respect to certain registered offerings we conduct. The maximum number of shares of common stock which a management, director or advisor stockholder may register is generally proportionate with the percentage of common stock being sold by certain affiliates of our Sponsor (relative to their holdings thereof).
86
CERTAIN UNITED STATES FEDERAL INCOME AND ESTATE TAX CONSEQUENCES TO
NON-U.S. HOLDERS
The following is a summary of certain U.S. federal income and estate tax consequences to a non-U.S. holder (as defined below) of the purchase, ownership and disposition of our common stock sold pursuant to this offering. Except where noted, this summary deals only with common stock that is held as a capital asset.
A “non-U.S. holder” means a beneficial owner of our common stock (other than an entity treated as a partnership for U.S. federal income tax purposes) that is not for U.S. federal income tax purposes any of the following:
| • | an individual citizen or resident of the United States; |
| • | a corporation (or any other entity treated as a corporation for U.S. federal income tax purposes) created or organized in or under the laws of the United States, any state thereof or the District of Columbia; |
| • | an estate the income of which is subject to U.S. federal income taxation regardless of its source; or |
| • | a trust if it (1) is subject to the primary supervision of a court within the United States and one or more United States persons have the authority to control all substantial decisions of the trust or (2) has a valid election in effect under applicable U.S. Treasury regulations to be treated as a United States person. |
This summary is based upon provisions of the Internal Revenue Code of 1986, as amended (the “Code”), and U.S. Treasury regulations, administrative rulings and judicial decisions as of the date hereof. Those authorities may be changed, perhaps retroactively, so as to result in U.S. federal income and estate tax consequences different from those summarized below. This summary does not address all aspects of U.S. federal income and estate taxes, such as the Medicare contribution tax on net investment income, and does not deal with foreign, state, local or other tax considerations that may be relevant to non-U.S. holders in light of their particular circumstances. In addition, it does not represent a detailed description of the U.S. federal income tax consequences applicable to you if you are subject to special treatment under the U.S. federal income tax laws (including if you are a U.S. expatriate, “controlled foreign corporation,” “passive foreign investment company,” or a partnership or other pass-through entity for U.S. federal income tax purposes). We cannot assure you that a change in law will not alter significantly the tax considerations that we describe in this summary.
If an entity treated as a partnership for U.S. federal income tax purposes holds our common stock, the tax treatment of a partner will generally depend upon the status of the partner and the activities of the partnership. If you are a partner of a partnership holding our common stock, you should consult your tax advisors.
If you are considering the purchase of our common stock, you should consult your own tax advisors concerning the particular U.S. federal income and estate tax consequences to you of the purchase, ownership or disposition of our common stock, as well as the consequences to you arising under other U.S. federal tax laws and the laws of any other taxing jurisdiction.
Dividends
In the event that we make a distribution of cash or other property (other than certain pro rata distributions of our common stock) in respect of our common stock, the distribution generally will be treated as a dividend for U.S. federal income tax purposes to the extent it is paid from our current or accumulated earnings and profits, as determined under U.S. federal income tax principles. Amounts not treated as dividends for U.S. federal income tax purposes will constitute a return of capital and will first be applied against and reduce a non-U.S. holder’s adjusted tax basis in the common stock, but not below zero. Any remaining excess will be treated as capital gain subject to the rules discussed below under “—Gain on Disposition of Common Stock.”
Dividends paid to a non-U.S. holder of our common stock generally will be subject to withholding of U.S. federal income tax at a 30% rate or such lower rate as may be specified by an applicable income tax treaty. However, dividends that are effectively connected with the conduct of a trade or business by the non-U.S. holder within the United States (and, if required by an applicable income tax treaty, are attributable to a U.S. permanent establishment of the non-U.S. holder) are not subject to withholding, provided certain certification and disclosure requirements are satisfied. Instead, such dividends are subject to U.S. federal income tax on a net income basis
87
in the same manner as if the non-U.S. holder were a United States person as defined under the Code. Any such effectively connected dividends received by a foreign corporation may be subject to an additional “branch profits tax” at a 30% rate or such lower rate as may be specified by an applicable income tax treaty.
A non-U.S. holder of our common stock who wishes to claim the benefit of an applicable income tax treaty rate and avoid backup withholding, as discussed below, for dividends will be required (a) to provide the applicable withholding agent with a properly executed Internal Revenue Service (“IRS”) Form W-8BEN or Form W-8BEN-E (or other applicable form) and certify under penalty of perjury that such holder is not a United States person as defined under the Code and is eligible for treaty benefits or (b) if our common stock is held through certain foreign intermediaries, to satisfy the relevant certification requirements of applicable U.S. Treasury regulations. Special certification and other requirements apply to certain non-U.S. holders that are pass-through entities rather than corporations or individuals.
A non-U.S. holder of our common stock eligible for a reduced rate of U.S. federal withholding tax pursuant to an income tax treaty may obtain a refund of any excess amounts withheld by timely filing an appropriate claim for refund with the IRS.
Gain on Disposition of Common Stock
Subject to the discussion of backup withholding and FATCA below, any gain realized by a non-U.S. holder on the sale, exchange, or other taxable disposition of our common stock generally will not be subject to U.S. federal income tax unless:
| • | the gain is effectively connected with a trade or business of the non-U.S. holder in the United States (and, if required by an applicable income tax treaty, is attributable to a U.S. permanent establishment of the non-U.S. holder); |
| • | the non-U.S. holder is an individual who is present in the United States for 183 days or more in the taxable year of that disposition, and certain other conditions are met; or |
| • | we are or have been a “United States real property holding corporation” for U.S. federal income tax purposes and certain other conditions are met. |
A non-U.S. holder described in the first bullet point immediately above will be subject to tax on the net gain derived from the sale or other disposition under regular graduated U.S. federal income tax rates applicable to such holder as if it were a United States person as defined under the Code. In addition, if a non-U.S. holder described in the first bullet point immediately above is a corporation for U.S. federal income tax purposes, it may be subject to the branch profits tax equal to 30% of its effectively connected earnings and profits or at such lower rate as may be specified by an applicable income tax treaty.
An individual non-U.S. holder described in the second bullet point immediately above will be subject to a flat 30% (or such lower rate as may be specified by an applicable income tax treaty) tax on the gain derived from the sale or other disposition, which gain may be offset by U.S. source capital losses, even though the individual is not considered a resident of the United States.
We believe we are not and do not anticipate becoming a “United States real property holding corporation” for U.S. federal income tax purposes.
Federal Estate Tax
Common stock held by an individual non-U.S. holder at the time of death will be included in such holder’s gross estate for U.S. federal estate tax purposes, unless an applicable estate tax treaty provides otherwise.
Information Reporting and Backup Withholding
Information reporting generally will apply to the amount of dividends paid to each non-U.S. holder and any tax withheld with respect to such dividends, regardless of whether withholding was required. Copies of the information returns reporting such dividends and withholding may also be made available to the tax authorities in the country in which the non-U.S. holder resides under the provisions of an applicable income tax treaty.
88
A non-U.S. holder will be subject to backup withholding for dividends paid to such holder unless such holder certifies under penalty of perjury that it is a non-U.S. holder (and the payor does not have actual knowledge or reason to know that such holder is a United States person as defined under the Code), or such holder otherwise establishes an exemption.
Information reporting and, depending on the circumstances, backup withholding will apply to the proceeds of a sale or other disposition of our common stock made within the United States or conducted through certain United States-related financial intermediaries, unless the beneficial owner certifies under penalty of perjury that it is a non-U.S. holder (and the payor does not have actual knowledge or reason to know that the beneficial owner is a United States person as defined under the Code), or such owner otherwise establishes an exemption.
Backup withholding is not an additional tax. Any amounts withheld under the backup withholding rules may be allowed as a refund or a credit against a non-U.S. holder’s U.S. federal income tax liability provided the required information is timely furnished to the IRS.
Additional Withholding Requirements
Under Sections 1471 through 1474 of the Code (such Sections commonly referred to as “FATCA”), a 30% U.S. federal withholding tax may apply to any dividends paid on our common stock, and, for a disposition of our common stock occurring after December 31, 2018, the gross proceeds from such disposition, in each case paid to (i) a “foreign financial institution” (as specifically defined in the Code) that does not provide sufficient documentation, typically on IRS Form W-8BEN-E, evidencing either (x) an exemption from FATCA or (y) its compliance (or deemed compliance) with FATCA (which may alternatively be in the form of compliance with an intergovernmental agreement with the United States) in a manner that avoids withholding, or (ii) a “non-financial foreign entity” (as specifically defined in the Code) that does not provide sufficient documentation, typically on IRS Form W-8BEN-E, evidencing either (x) an exemption from FATCA or (y) adequate information regarding certain substantial U.S. beneficial owners of such entity (if any). If a dividend payment is both subject to withholding under FATCA and subject to the withholding tax discussed above under “—Dividends,” the withholding under FATCA may be credited against, and therefore reduce, such other withholding tax. You should consult your own tax advisor regarding these requirements and whether they may be relevant to your ownership and disposition of our common stock.
89
UNDERWRITING (CONFLICTS OF INTEREST)
We, the selling stockholders and the underwriters named below have entered into an underwriting agreement with respect to the shares being offered. Subject to certain conditions, each underwriter has severally agreed to purchase the number of shares indicated in the following table. Goldman Sachs & Co. LLC and Citigroup Global Markets Inc. are the representatives of the underwriters.
|
Underwriters
|
Number of Shares
|
||
|
Goldman Sachs & Co. LLC
|
|
|
|
|
Citigroup Global Markets Inc.
|
|
|
|
|
KKR Capital Markets LLC
|
|
|
|
|
Total
|
|
|
|
The underwriters are committed to take and pay for all of the shares being offered, if any are taken, other than the shares covered by the option described below unless and until this option is exercised.
The underwriters have an option to buy up to an additional 3,313,690 shares from investment funds affiliated with our Sponsor to cover sales by the underwriters of a greater number of shares than the total number set forth in the table above. They may exercise that option for 30 days. If any shares are purchased pursuant to this option, the underwriters will severally purchase shares in approximately the same proportion as set forth in the table above. Sales of shares made outside of the United States may be made by affiliates of the underwriters.
The following table shows the per share and total underwriting discounts and commissions to be paid to the underwriters by the selling stockholders. Such amounts are shown assuming both no exercise and full exercise of the underwriters’ option to purchase additional 3,313,690 shares.
|
Paid by the selling stockholders
|
No Exercise
|
Full Exercise
|
|
Per share
|
$
|
$
|
|
Total
|
$
|
$
|
Shares sold by the underwriters to the public will be offered at the public offering price set forth on the cover of this prospectus. Any shares sold by the underwriters to securities dealers may be sold at a discount of up to $ per share from the public offering price. After the initial offering of the shares, the representatives may change the offering price and the other selling terms. The offering of the shares by the underwriters is subject to receipt and acceptance and subject to the underwriters’ right to reject any order in whole or in part.
The Company and its officers, directors and the selling stockholders will agree with the underwriters, subject to certain exceptions, not to dispose of or hedge any of their common stock or securities convertible into or exchangeable for shares of common stock during the period from the date of this prospectus continuing through the date 90 days after the date of this prospectus, except with the prior written consent of the representatives. This agreement does not apply to any existing employee benefit plans. See “Shares Eligible for Future Sale” for a discussion of certain transfer restrictions.
Our common stock is listed on the NYSE under the symbol “GDI”.
In connection with the offering, the underwriters may purchase and sell shares of common stock in the open market. These transactions may include short sales, stabilizing transactions and purchases to cover positions created by short sales. Short sales involve the sale by the underwriters of a greater number of shares than they are required to purchase in the offering, and a short position represents the amount of such sales that have not been covered by subsequent purchases. A “covered short position” is a short position that is not greater than the amount of additional shares for which the underwriters’ option described above may be exercised. The underwriters may cover any covered short position by either exercising their option to purchase additional shares or purchasing shares in the open market. In determining the source of shares to cover the covered short position, the underwriters will consider, among other things, the price of shares available for purchase in the open market as compared to the price at which they may purchase additional shares pursuant to the option described above. “Naked” short sales are any short sales that create a short position greater than the amount of additional shares for which the option described above may be exercised. The underwriters must cover any such naked short position by purchasing shares in the open market. A naked short position is more likely to be created if the
90
underwriters are concerned that there may be downward pressure on the price of the common stock in the open market after pricing that could adversely affect investors who purchase in the offering. Stabilizing transactions consist of various bids for or purchases of common stock made by the underwriters in the open market prior to the completion of the offering.
The underwriters may also impose a penalty bid. This occurs when a particular underwriter repays to the underwriters a portion of the underwriting discount received by it because the representatives have repurchased shares sold by or for the account of such underwriter in stabilizing or short covering transactions.
Purchases to cover a short position and stabilizing transactions, as well as other purchases by the underwriters for their own accounts, may have the effect of preventing or retarding a decline in the market price of our stock, and together with the imposition of the penalty bid, may stabilize, maintain or otherwise affect the market price of the common stock. As a result, the price of the common stock may be higher than the price that otherwise might exist in the open market. The underwriters are not required to engage in these activities and may end any of these activities at any time. These transactions may be effected on the NYSE, in the over-the-counter market or otherwise.
We estimate that our share of the total expenses of the offering, excluding underwriting discounts and commissions, will be approximately $1.1 million. We have also agreed to reimburse the underwriters for certain of their expenses in an amount up to $45,000.
We and the selling stockholders have agreed to indemnify the several underwriters against certain liabilities, including liabilities under the Securities Act.
The underwriters and their respective affiliates are full service financial institutions engaged in various activities, which may include sales and trading, commercial and investment banking, advisory, investment management, investment research, principal investment, hedging, market making, brokerage and other financial and non-financial activities and services. Certain of the underwriters and their respective affiliates have provided, and may in the future provide, a variety of these services to the issuer and to persons and entities with relationships with the issuer, for which they received or will receive customary fees and expenses.
In the ordinary course of their various business activities, the underwriters and their respective affiliates, officers, directors and employees may purchase, sell or hold a broad array of investments and actively trade securities, derivatives, loans, commodities, currencies, credit default swaps and other financial instruments for their own account and for the accounts of their customers, and such investment and trading activities may involve or relate to assets, securities and/or instruments of the issuer (directly, as collateral securing other obligations or otherwise) and/or persons and entities with relationships with the issuer. The underwriters and their respective affiliates may also communicate independent investment recommendations, market color or trading ideas and/or publish or express independent research views in respect of such assets, securities or instruments and may at any time hold, or recommend to clients that they should acquire, long and/or short positions in such assets, securities and instruments.
Conflicts of Interest
Affiliates of our Sponsor beneficially own in excess of 10% of our issued and outstanding common stock. In addition, certain affiliates of our Sponsor are selling stockholders in this offering. Because KKR Capital Markets LLC, an affiliate of our Sponsor, is an underwriter, this offering is being made in compliance with the requirements of FINRA Rule 5121. In accordance with that rule, no “qualified independent underwriter” is required, because a bona fide public market exists in the shares, as that term is defined in Rule 5121. KKR Capital Markets LLC will not confirm sales of the securities to any account over which it exercises discretionary authority without the specific written approval of the account holder.
Notice to Prospective Investors in the European Economic Area
In relation to each Member State of the European Economic Area which has implemented the Prospectus Directive (each, a Relevant Member State), an offer of shares to the public may not be made in that Relevant Member State, except that an offer of shares to the public may be made at any time under the following exemptions under the Prospectus Directive, if they have been implemented in that Relevant Member State:
| (a) | to any legal entity which is a qualified investor as defined in the Prospectus Directive; |
91
| (b) | to fewer than 100 or, if the Relevant Member State has implemented the relevant provisions of the 2010 Amending Directive, 150, natural or legal persons (other than qualified investors as defined in the Prospectus Directive) subject to obtaining the prior consent of the representatives for any such offer; |
| (c) | in any other circumstances falling within Article 3(2) of the Prospectus Directive. |
provided that no such offer of shares shall result in a requirement for the publication of a prospectus pursuant to Article 3 of the Prospectus Directive or any measure implementing the Prospectus Directive in a Relevant Member State and each person who initially acquires any shares or to whom an offer is made will be deemed to have represented, warranted and agreed to and with the underwriters that it is a qualified investor within the meaning of the law in that Relevant Member State implementing Article 2(1)(e) of the Prospectus Directive.
For the purposes of this provision, the expression an “offer of shares to the public” in relation to any shares in any Relevant Member State means the communication in any form and by any means of sufficient information on the terms of the offer and the shares to be offered so as to enable an investor to decide to purchase or subscribe the shares, as the same may be varied in that Relevant Member State by any measure implementing the Prospectus Directive in that Relevant Member State, the expression Prospectus Directive means Directive 2003/71/EC (and amendments thereto, including the 2010 PD Amending Directive, to the extent implemented in the Relevant Member State) and includes any relevant implementing measure in each Relevant Member State.
In the case of any shares being offered to a financial intermediary as that term is used in Article 3(2) of the Prospectus Directive, such financial intermediary will also be deemed to have represented, acknowledged and agreed that the shares acquired by it in the offer have not been acquired on a non-discretionary basis on behalf of, nor have they been acquired with a view to their offer or resale to, persons in circumstances which may give rise to an offer of shares to the public other than their offer or resale in a Relevant Member State to qualified investors as so defined or in circumstances in which the prior consent of the underwriters has been obtained to each such proposed offer or resale.
Notice to Prospective Investors in the United Kingdom
In the United Kingdom, this prospectus is only addressed to and directed as qualified investors who are (i) investment professionals falling within Article 19(5) of the Financial Services and Markets Act 2000 (Financial Promotion) Order 2005 (the Order); or (ii) high net worth entities and other persons to whom it may lawfully be communicated, falling within Article 49(2)(a) to (d) of the Order (all such persons together being referred to as “relevant persons”). Any investment or investment activity to which this prospectus relates is available only to relevant persons and will only be engaged with relevant persons. Any person who is not a relevant person should not act or rely on this prospectus or any of its contents.
Notice to Prospective Investors in Hong Kong
The shares may not be offered or sold by means of any document other than (i) in circumstances which do not constitute an offer to the public within the meaning of the Companies Ordinance (Cap.32, Laws of Hong Kong), or (ii) to “professional investors” within the meaning of the Securities and Futures Ordinance (Cap.571, Laws of Hong Kong) and any rules made thereunder, or (iii) in other circumstances which do not result in the document being a “prospectus” within the meaning of the Companies Ordinance (Cap.32, Laws of Hong Kong), and no advertisement, invitation or document relating to the shares may be issued or may be in the possession of any person for the purpose of issue (in each case whether in Hong Kong or elsewhere), which is directed at, or the contents of which are likely to be accessed or read by, the public in Hong Kong (except if permitted to do so under the laws of Hong Kong) other than with respect to shares which are or are intended to be disposed of only to persons outside Hong Kong or only to “professional investors” within the meaning of the Securities and Futures Ordinance (Cap. 571, Laws of Hong Kong) and any rules made thereunder.
Notice to Prospective Investors in Singapore
This prospectus has not been registered as a prospectus with the Monetary Authority of Singapore. Accordingly, this prospectus and any other document or material in connection with the offer or sale, or invitation for subscription or purchase, of the shares may not be circulated or distributed, nor may the shares be offered or sold, or be made the subject of an invitation for subscription or purchase, whether directly or indirectly, to persons in Singapore other than (i) to an institutional investor (as defined under Section 4A of the
92
Securities and Futures Act, Chapter 289 of Singapore (the “SFA”)) under Section 274 of the SFA, (ii) to a relevant person (as defined in Section 275(2) of the SFA) pursuant to Section 275(1) of the SFA, or any person pursuant to Section 275(1A) of the SFA, and in accordance with the conditions specified in Section 275 of the SFA or (iii) otherwise pursuant to, and in accordance with the conditions of, any other applicable provision of the SFA, in each case subject to conditions set forth in the SFA.
Where the shares are subscribed or purchased under Section 275 of the SFA by a relevant person which is a corporation (which is not an accredited investor (as defined in Section 4A of the SFA)) the sole business of which is to hold investments and the entire share capital of which is owned by one or more individuals, each of whom is an accredited investor, the securities (as defined in Section 239(1) of the SFA) of that corporation shall not be transferable for 6 months after that corporation has acquired the shares under Section 275 of the SFA except: (1) to an institutional investor under Section 274 of the SFA or to a relevant person (as defined in Section 275(2) of the SFA), (2) where such transfer arises from an offer in that corporation’s securities pursuant to Section 275(1A) of the SFA, (3) where no consideration is or will be given for the transfer, (4) where the transfer is by operation of law, (5) as specified in Section 276(7) of the SFA, or (6) as specified in Regulation 32 of the Securities and Futures (Offers of Investments) (Shares and Debentures) Regulations 2005 of Singapore (“Regulation 32”).
Where the shares are subscribed or purchased under Section 275 of the SFA by a relevant person which is a trust (where the trustee is not an accredited investor (as defined in Section 4A of the SFA)) whose sole purpose is to hold investments and each beneficiary of the trust is an accredited investor, the beneficiaries’ rights and interest (howsoever described) in that trust shall not be transferable for 6 months after that trust has acquired the shares under Section 275 of the SFA except: (1) to an institutional investor under Section 274 of the SFA or to a relevant person (as defined in Section 275(2) of the SFA), (2) where such transfer arises from an offer that is made on terms that such rights or interest are acquired at a consideration of not less than S$200,000 (or its equivalent in a foreign currency) for each transaction (whether such amount is to be paid for in cash or by exchange of securities or other assets), (3) where no consideration is or will be given for the transfer, (4) where the transfer is by operation of law, (5) as specified in Section 276(7) of the SFA, or (6) as specified in Regulation 32.
Notice to Prospective Investors in Japan
The shares have not been and will not be registered under the Financial Instruments and Exchange Law of Japan (the Financial Instruments and Exchange Law) and each underwriter has agreed that it will not offer or sell any shares, directly or indirectly, in Japan or to, or for the benefit of, any resident of Japan (which term as used herein means any person resident in Japan, including any corporation or other entity organized under the laws of Japan), or to others for re-offering or resale, directly or indirectly, in Japan or to a resident of Japan, except pursuant to an exemption from the registration requirements of, and otherwise in compliance with, the Financial Instruments and Exchange Law and any other applicable laws, regulations and ministerial guidelines of Japan.
Notice to Prospective Investors in Canada
The shares may be sold in Canada only to purchasers purchasing, or deemed to be purchasing, as principals that are accredited investors, as defined in National Instrument 45-106 Prospectus Exemptions or subsection 73.3(1) of the Securities Act (Ontario), and are permitted clients, as defined in National Instrument 31-103 Registration Requirements, Exemptions and Ongoing Registrant Obligations. Any resale of the shares must be made in accordance with an exemption from, or in a transaction not subject to, the prospectus requirements of applicable securities laws.
Securities legislation in certain provinces or territories of Canada may provide a purchaser with remedies for rescission or damages if this prospectus (including any amendment thereto) contains a misrepresentation, provided that the remedies for rescission or damages are exercised by the purchaser within the time limit prescribed by the securities legislation of the purchaser’s province or territory. The purchaser should refer to any applicable provisions of the securities legislation of the purchaser’s province or territory for particulars of these rights or consult with a legal advisor.
Pursuant to section 3A.3 of National Instrument 33-105 Underwriting Conflicts (NI 33-105), the underwriters are not required to comply with the disclosure requirements of NI 33-105 regarding underwriter conflicts of interest in connection with this offering.
93
The validity of the shares of common stock offered by this prospectus will be passed upon for us by Simpson Thacher & Bartlett LLP, New York, New York. Certain legal matters in connection with the offering will be passed upon for the underwriters by Latham & Watkins LLP, New York, New York.
Certain partners of Simpson Thacher & Bartlett LLP, members of their respective families, related persons and others have an indirect interest, through limited partnerships that are investors in funds affiliated with our Sponsor, in less than 1% of our common stock.
The consolidated financial statements incorporated in this Prospectus by reference from the Company’s Annual Report on Form 10-K for the year ended December 31, 2017, have been audited by Deloitte & Touche LLP, an independent registered public accounting firm, as stated in their report, which is incorporated herein by reference. Such consolidated financial statements have been so incorporated in reliance upon the report of such firm given upon their authority as experts in accounting and auditing.
WHERE YOU CAN FIND MORE INFORMATION
We have filed with the SEC a registration statement on Form S-1 under the Securities Act with respect to the shares of common stock offered hereby. This prospectus, which constitutes a part of the registration statement, does not contain all of the information set forth in the registration statement or the exhibits and schedules filed therewith. For further information about us and the common stock offered hereby, we refer you to the registration statement and the exhibits and schedules filed thereto. Statements contained in this prospectus regarding the contents of any contract or any other document that is filed as an exhibit to the registration statement are not necessarily complete, and each such statement is qualified in all respects by reference to the full text of such contract or other document filed as an exhibit to the registration statement.
We file annual, quarterly and current reports, proxy statements, and other information with the SEC pursuant to the Exchange Act. Our filings with the SEC, including the filings that are incorporated by reference to this prospectus, are available to the public on the SEC’s website at www.sec.gov. Those filings are also available to the public on, or accessible through, our website at www.gardnerdenver.com. The information contained on or accessible through our corporate website or any other website that we may maintain is not incorporated by reference herein and is not part of this prospectus or the registration statement of which this prospectus is a part. You may read also and copy, at SEC prescribed rates, any document we file with the SEC, including the registration statement (and its exhibits) of which this prospectus is a part, at the SEC’s Public Reference Room, 100 F Street, N.E., Room 1580, Washington, D.C. 20549. You may obtain information on the operation of the public reference rooms by calling the SEC at 1-800-SEC-0330.
The rules of the SEC allow us to incorporate information into this prospectus by reference. This means that we are disclosing important information to you by referring to other documents. The information incorporated by reference is considered to be part of this prospectus, except for any information superseded by information contained directly in this prospectus. We incorporate by reference the documents listed below (other than any portions thereof, which under the Securities Exchange Act of 1934, as amended (the “Exchange Act”), and applicable SEC rules, are not deemed “filed” under the Exchange Act):
| • | Gardner Denver’s Annual Report on Form 10-K for the year ended December 31, 2017 (the “Annual Report”) filed on February 16, 2018; |
| • | Gardner Denver’s Quarterly Report on Form 10-Q for the quarter ended March 31, 2018 (the “Quarterly Report”) filed on April 27, 2018; |
| • | Gardner Denver’s Current Reports on Form 8-K filed on January 8, 2018 (Item 5.02 only) and February 13, 2018 (Item 5.02 only); and |
| • | the description of Gardner Denver’s common stock contained in the Registration Statement on Form 8-A filed on May 12, 2017, including any amendments or reports filed for the purposes of updating such description. |
94
If we have incorporated by reference any statement or information in this prospectus and we subsequently modify that statement or information with information contained in this prospectus, the statement or information previously incorporated in this prospectus is also modified or superseded in the same manner.
We will provide without charge to each person, including any beneficial owner, to whom a copy of this prospectus is delivered, upon written or oral request of such person, a copy of any or all of the documents referred to above which have been incorporated by reference in this prospectus. You should direct requests for those documents to Gardner Denver Holdings, Inc., 222 East Erie Street, Suite 500, Milwaukee, Wisconsin 53202, Attention: Investor Relations (telephone: (414) 212-4700).
95
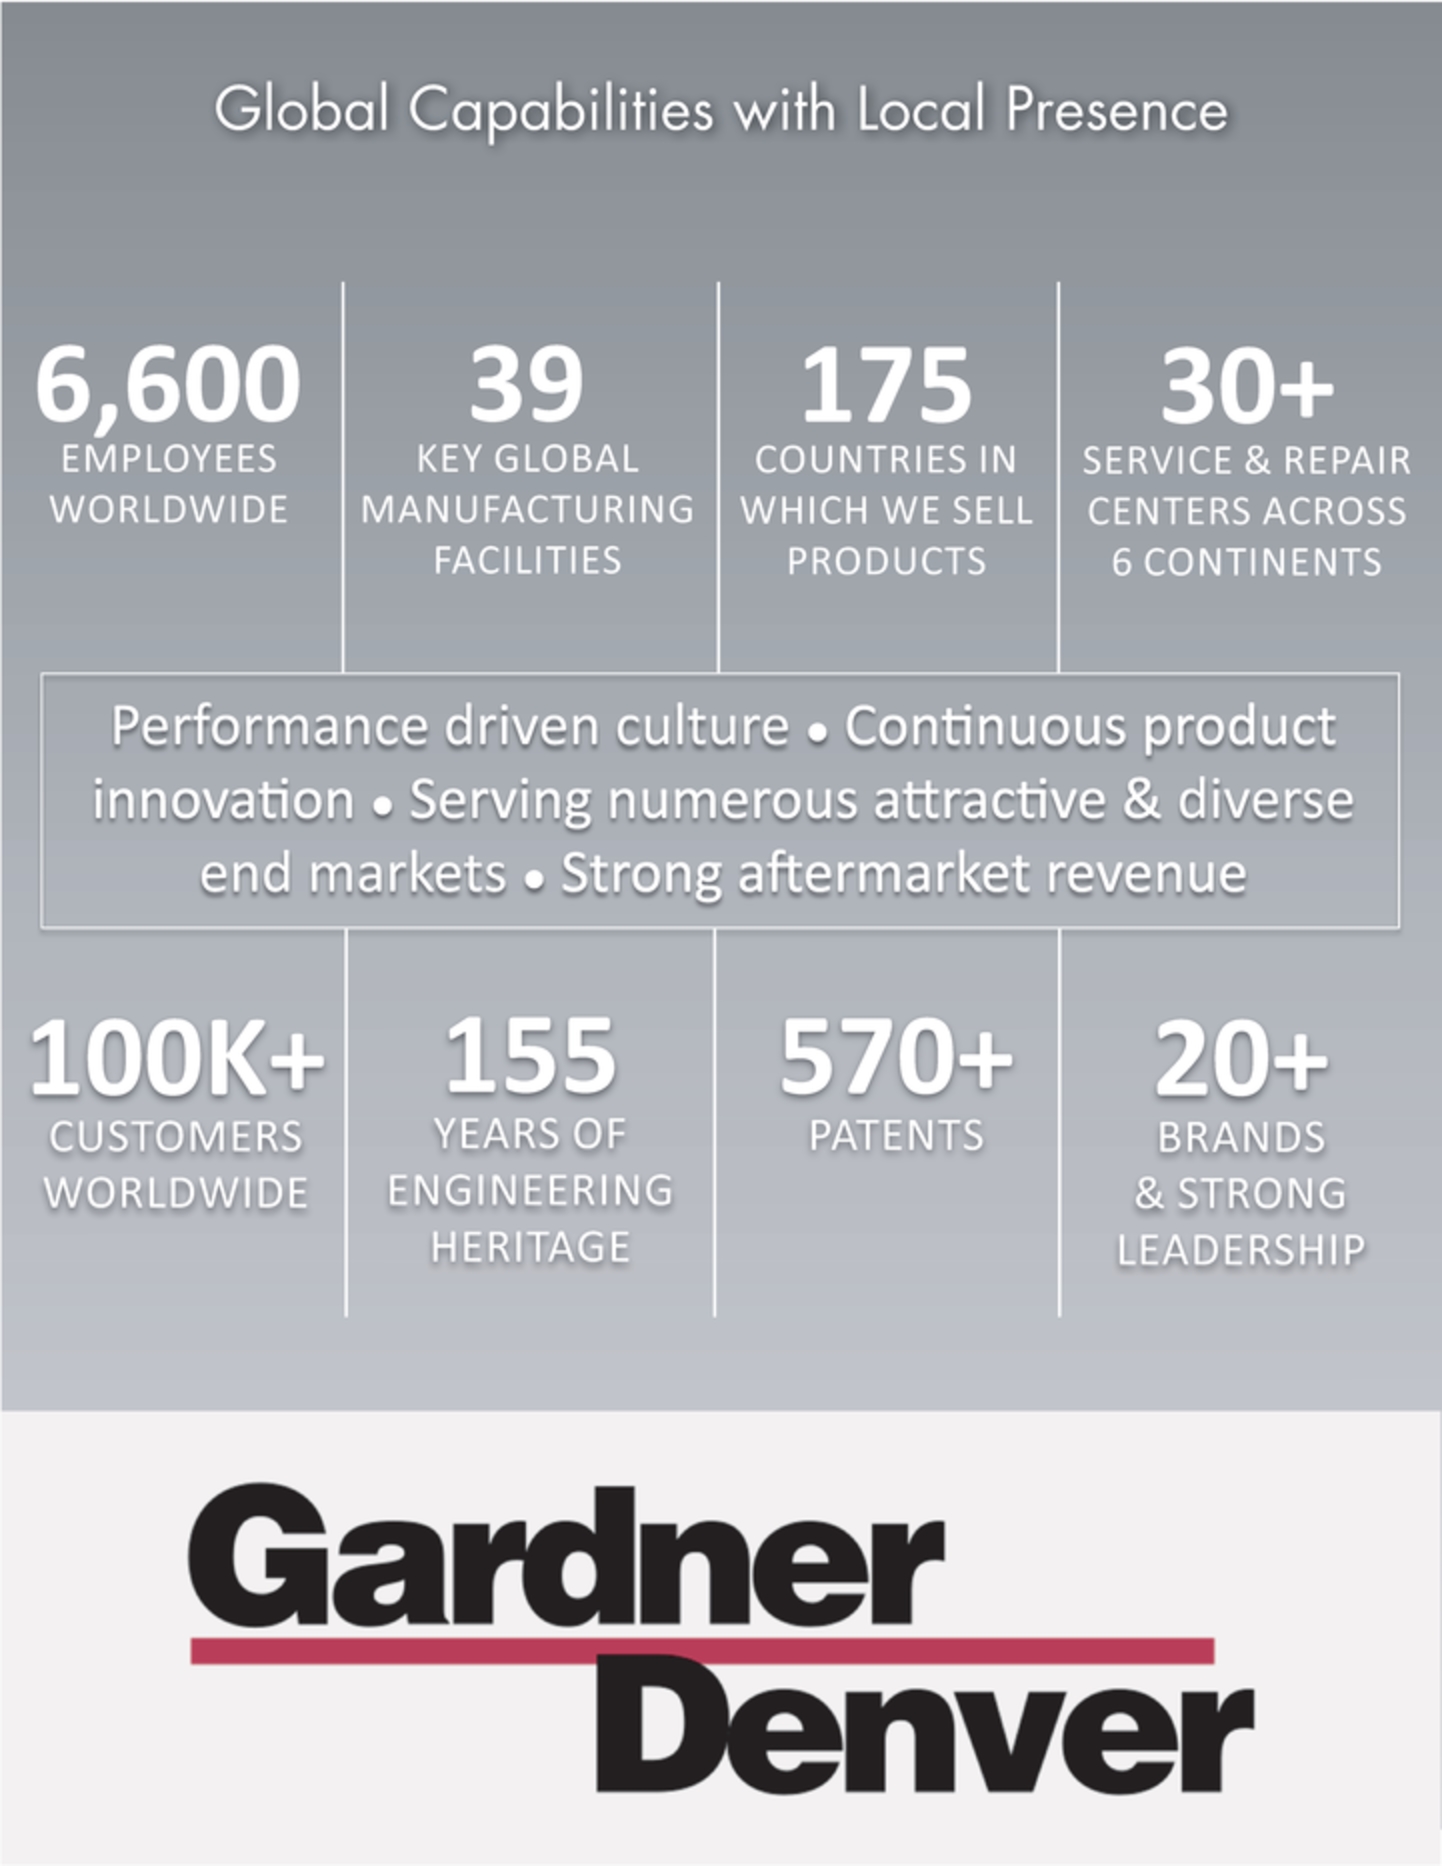
22,091,266 Shares
![]()
Gardner Denver Holdings, Inc.
Common Stock
Prospectus
Joint Book-Running Managers
|
Goldman Sachs & Co. LLC
|
Citigroup
|
KKR
|
, 2018
PART II
INFORMATION NOT REQUIRED IN PROSPECTUS
Item 13. Other Expenses of Issuance and Distribution.
The following table sets forth the expenses payable by the Registrant expected to be incurred in connection with the issuance and distribution of common stock being registered hereby (other than underwriting discounts and commissions). All of such expenses are estimates, except for the SEC registration fee and the Financial Industry Regulatory Authority (“FINRA”) filing fee.
|
SEC registration fee
|
$
|
98,976
|
|
|
FINRA filing fee
|
|
119,748
|
|
|
Printing fees and expenses
|
|
95,000
|
|
|
Legal fees and expenses
|
|
500,000
|
|
|
Blue sky fees and expenses
|
|
45,000
|
|
|
Registrar and transfer agent fees
|
|
10,000
|
|
|
Accounting fees and expenses
|
|
225,000
|
|
|
Miscellaneous expenses
|
|
—
|
|
|
Total
|
$
|
1,093,723
|
|
Item 14. Indemnification of Directors and Officers.
Section 102(b)(7) of the Delaware General Corporation Law (the “DGCL”) allows a corporation to provide in its certificate of incorporation that a director of the corporation will not be personally liable to the corporation or its stockholders for monetary damages for breach of fiduciary duty as a director, except where the director breached the duty of loyalty, failed to act in good faith, engaged in intentional misconduct or knowingly violated a law, authorized the payment of a dividend or approved a stock repurchase in violation of Delaware corporate law or obtained an improper personal benefit. Our amended and restated certificate of incorporation provides for this limitation of liability. We have entered into indemnification agreements with our directors that provide for us to indemnify them to the fullest extent permitted by Delaware law.
Section 145 of the DGCL, or Section 145, provides, among other things, that a Delaware corporation may indemnify any person who was, is or is threatened to be made, party to any threatened, pending or completed action, suit or proceeding, whether civil, criminal, administrative or investigative (other than an action by or in the right of such corporation), by reason of the fact that such person is or was an officer, director, employee or agent of such corporation or is or was serving at the request of such corporation as a director, officer, employee or agent of another corporation or enterprise. The indemnity may include expenses (including attorneys’ fees), judgments, fines and amounts paid in settlement actually and reasonably incurred by such person in connection with such action, suit or proceeding, provided such person acted in good faith and in a manner he or she reasonably believed to be in or not opposed to the corporation’s best interests and, with respect to any criminal action or proceeding, had no reasonable cause to believe that his or her conduct was unlawful. A Delaware corporation may indemnify any persons who were or are a party to any threatened, pending or completed action or suit by or in the right of the corporation by reason of the fact that such person is or was a director, officer, employee or agent of another corporation or enterprise. The indemnity may include expenses (including attorneys’ fees) actually and reasonably incurred by such person in connection with the defense or settlement of such action or suit, provided such person acted in good faith and in a manner he or she reasonably believed to be in or not opposed to the corporation’s best interests, provided further that no indemnification is permitted without judicial approval if the officer, director, employee or agent is adjudged to be liable to the corporation. Where an officer or director is successful on the merits or otherwise in the defense of any action referred to above, the corporation must indemnify him or her against the expenses (including attorneys’ fees) which such officer or director has actually and reasonably incurred.
Section 145 further authorizes a corporation to purchase and maintain insurance on behalf of any person who is or was a director, officer, employee or agent of the corporation or is or was serving at the request of the corporation as a director, officer, employee or agent of another corporation or enterprise, against any liability
II-1
asserted against such person and incurred by such person in any such capacity, or arising out of his or her status as such, whether or not the corporation would otherwise have the power to indemnify such person under Section 145.
Our amended and restated bylaws provide that we must indemnify, and advance expenses to, our directors and officers to the full extent authorized by the DGCL.
The indemnification rights set forth above shall not be exclusive of any other right which an indemnified person may have or hereafter acquire under any statute, provision of our amended and restated certificate of incorporation, our amended and restated bylaws, agreement, vote of stockholders or disinterested directors or otherwise. Notwithstanding the foregoing, we shall not be obligated to indemnify a director or officer in respect of a proceeding (or part thereof) instituted by such director or officer, unless such proceeding (or part thereof) has been authorized by the board of directors pursuant to the applicable procedure outlined in the amended and restated bylaws.
Section 174 of the DGCL provides, among other things, that a director, who willfully or negligently approves of an unlawful payment of dividends or an unlawful stock purchase or redemption, may be held jointly and severally liable for such actions. A director who was either absent when the unlawful actions were approved or dissented at the time may avoid liability by causing his or her dissent to such actions to be entered in the books containing the minutes of the meetings of the board of directors at the time such action occurred or immediately after such absent director receives notice of the unlawful acts.
We maintain standard policies of insurance that provide coverage (1) to our directors and officers against loss rising from claims made by reason of breach of duty or other wrongful act and (2) to us with respect to indemnification payments that we may make to such directors and officers.
The underwriting agreement provides for indemnification by the underwriters of us and our officers and directors, and by us of the underwriters, for certain liabilities arising under the Securities Act or otherwise in connection with this offering.
Item 15. Recent Sales of Unregistered Securities.
Within the past three years, the Registrant has granted or issued the following securities of the Registrant which were not registered under the Securities Act.
The following reflects the 1.6331-for-one reverse split of the Registrant’s common stock, which occurred on April 27, 2017.
On May 7, 2015, the Registrant sold an aggregate of 379,457 shares of common stock at a price of $10.61 per share to certain employees in connection with services provided by such parties.
On October 1, 2015, the Registrant sold an aggregate of 13,234 shares of common stock at a price of $10.61 per share to certain employees in connection with services provided by such parties.
On May 10, 2016, the Registrant sold an aggregate of 276,768 shares of common stock at a price of $10.61 per share to certain employees in connection with services provided by such parties.
On December 1, 2016, the Registrant sold an aggregate of 28,025 shares of common stock at a price of $11.43 per share to certain employees in connection with services provided by such parties.
The issuances of stock described in this Item 15 were issued pursuant to written compensatory plans or arrangements with our employees, and directors, in reliance on the exemption from the registration requirements of the Securities Act provided by Rule 701 promulgated under the Securities Act or the exemption set forth in Section 4(a)(2) under the Securities Act and Regulation D promulgated thereunder relative to transactions by an issuer not involving any public offering, to the extent an exemption from such registration was required.
All of the foregoing securities are deemed restricted securities for purposes of the Securities Act. All certificates representing the issued shares of capital stock described in this Item 15 included appropriate legends setting forth that the securities have not been registered and the applicable restrictions on transfer.
Item 16. Exhibits and Financial Statement Schedules.
| (a) | Exhibits. See the Exhibit Index below, which is incorporated by reference as if fully set forth herein. |
II-2
EXHIBIT INDEX
|
Exhibit Number
|
Exhibit Description
|
|
Form of Underwriting Agreement by and among Gardner Denver Holdings, Inc. and the underwriters named therein
|
|
|
Second Amended and Restated Certificate of Incorporation of Gardner Denver Holdings, Inc. (incorporated by reference to Exhibit 3.1 to the Registrant’s Current Report on Form 8-K filed on May 17, 2017 (File no. 001-38095))
|
|
|
Amended and Restated Bylaws of Gardner Denver Holdings, Inc. (incorporated by reference to Exhibit 3.2 to the Registrant’s Current Report on Form 8-K filed on May 17, 2017 (File no. 001-38095))
|
|
|
Form of Common Stock Certificate (incorporated by reference to Exhibit 4.1 to Amendment No. 4 to the Registrant’s Registration Statement on Form S-1 filed on May 3, 2017 (File no. 333-216320))
|
|
|
Amended and Restated Registration Rights Agreement, dated as of May 17, 2017, by and among KKR Renaissance Aggregator L.P.; KKR Renaissance Aggregator GP LLC; Gardner Denver Holdings, Inc. and each of the other parties thereto (incorporated by reference to Exhibit 4.2 to the Registrant’s Current Report on Form 8-K filed on May 17, 2017 (File no. 001-38095))
|
|
|
Opinion of Simpson Thacher & Bartlett LLP
|
|
|
2013 Stock Incentive Plan for Key Employees of Gardner Denver Holdings, Inc. (formerly known as Renaissance Parent Corp.) and its Subsidiaries (incorporated by reference to Exhibit 10.1 to the Registrant’s Registration Statement on Form S-1 filed on February 28, 2017 (File no. 333-216320))
|
|
|
Senior Secured Credit Agreement, dated as of July 30, 2013, among Renaissance Acquisition Corp., the foreign borrowers described therein, Gardner Denver Holdings, Inc. (formerly known as Renaissance Parent Corp.), UBS AG, Stamford Branch, as administrative agent, and other agents and lenders party thereto (incorporated by reference to Exhibit 10.2 to the Registrant’s Registration Statement on Form S-1 filed on February 28, 2017 (File no. 333-216320))
|
|
|
Amendment No. 1 to the Senior Secured Credit Agreement, dated as of March 4, 2016, among Gardner Denver Holdings, Inc. (formerly known as Renaissance Parent Corp.), Gardner Denver, Inc., GD German Holdings II GmbH (as successor in interest to Gardner Denver Holdings GmbH & Co. KG), GD First (UK) Limited, UBS AG, Stamford Branch, as administrative agent, and other agents and lenders party thereto (incorporated by reference to Exhibit 10.3 to the Registrant’s Registration Statement on Form S-1 filed on February 28, 2017 (File no. 333-216320))
|
|
|
Amendment No. 2 to the Credit Agreement, dated as of August 17, 2017, among Gardner Denver Holdings, Inc., Gardner Denver, Inc., GD German Holdings II GmbH, GD First (UK) Limited, UBS AG, Stamford Branch, as administrative agent, and the other parties and lenders party thereto (incorporated by reference to Exhibit 10.1 to the Registrant’s Current Report on Form 8-K filed on August 18, 2017 (File no. 001-38095))
|
|
|
Pledge Agreement, dated as of July 30, 2013, among Gardner Denver Holdings, Inc. (formerly known as Renaissance Parent Corp.), Renaissance Acquisition Corp., the subsidiary pledgors identified therein and UBS AG, Stamford Branch, as collateral agent (incorporated by reference to Exhibit 10.4 to the Registrant’s Registration Statement on Form S-1 filed on February 28, 2017 (File no. 333-216320))
|
|
|
Security Agreement, dated as of July 30, 2013, among Gardner Denver Holdings, Inc. (formerly known as Renaissance Parent Corp.), Renaissance Acquisition Corp., the subsidiary grantors identified therein and UBS AG, Stamford Branch, as collateral agent (incorporated by reference to Exhibit 10.5 to the Registrant’s Registration Statement on Form S-1 filed on February 28, 2017 (File no. 333-216320))
|
II-3
|
Exhibit Number
|
Exhibit Description
|
|
Guarantee Agreement, dated as of July 30, 2013, among Gardner Denver Holdings, Inc. (formerly known as Renaissance Parent Corp.), the subsidiary guarantors identified therein and UBS AG, Stamford Branch, as administrative agent and collateral agent (incorporated by reference to Exhibit 10.6 to the Registrant’s Registration Statement on Form S-1 filed on February 28, 2017 (File no. 333-216320))
|
|
|
Receivables Financing Agreement, dated as of May 17, 2016, by and among Gardner Denver Finance II LLC, Gardner Denver, Inc., as initial servicer, the various lenders and LC participants from time to time party thereto, PNC Bank, National Association, as LC bank and administrative agent, and PNC Capital Markets LLC, as structuring agent. (incorporated by reference to Exhibit 10.7 to the Registrant’s Registration Statement on Form S-1 filed on February 28, 2017 (File no. 333-216320))
|
|
|
Monitoring Agreement, dated as of July 30, 2013, by and between Gardner Denver Holdings, Inc. (formerly known as Renaissance Parent Corp.) and Kohlberg Kravis Roberts & Co. L.P. (incorporated by reference to Exhibit 10.8 to Amendment No. 1 to the Registrant’s Registration Statement on Form S-1 filed on April 4, 2017 (File no. 333-216320))
|
|
|
First Amendment, dated as of June 9, 2014, to the Monitoring Agreement, dated as of July 30, 2013, by and between Garner Denver Holdings, Inc. (formerly known as Renaissance Parent Corp.) and Kohlberg Kravis Roberts & Co. L.P. (incorporated by reference to Exhibit 10.9 to Amendment No. 1 to the Registrant’s Registration Statement on Form S-1 filed on April 4, 2017 (File no. 333-216320))
|
|
|
Indemnification Agreement, dated as of July 30, 2013, by and among KKR Renaissance Aggregator L.P.; KKR Renaissance Aggregator GP LLC; Gardner Denver Holdings, Inc. (formerly known as Renaissance Parent Corp.); Gardner Denver, Inc. and Kohlberg Kravis Roberts & Co. L.P. (incorporated by reference to Exhibit 10.10 to the Registrant’s Registration Statement on Form S-1 filed on February 28, 2017 (File no. 333-216320))
|
|
|
Transaction Fee Letter, dated as of July 30, 2013, by and between Kohlberg Kravis Roberts & Co. L.P. and Gardner Denver Holdings, Inc. (formerly known as Renaissance Parent Corp.) (incorporated by reference to Exhibit 10.11 to the Registrant’s Registration Statement on Form S-1 filed on February 28, 2017 (File no. 333-216320))
|
|
|
Stockholders Agreement, dated as of May 17, 2017, between Gardner Denver Holdings, Inc. and KKR Renaissance Aggregator L.P. (incorporated by reference to Exhibit 4.1 to the Registrant’s Current Report on Form 8-K filed on May 17, 2017 (File no. 001-38095))
|
|
|
Form of Management Stockholder’s Agreement (incorporated by reference to Exhibit 10.13 to the Registrant’s Registration Statement on Form S-1 filed on February 28, 2017 (File no. 333-216320))
|
|
|
Form of Director Stockholder’s Agreement (incorporated by reference to Exhibit 10.14 to the Registrant’s Registration Statement on Form S-1 filed on February 28, 2017 (File no. 333-216320))
|
|
|
Form of Advisor Stockholder’s Agreement (incorporated by reference to Exhibit 10.15 to the Registrant’s Registration Statement on Form S-1 filed on February 28, 2017 (File no. 333-216320))
|
|
|
Form of Director Stock Option Agreement under the 2013 Stock Incentive Plan for Key Employees of Gardner Denver Holdings, Inc. (formerly known as Renaissance Parent Corp.) and its Subsidiaries (incorporated by reference to Exhibit 10.16 to the Registrant’s Registration Statement on Form S-1 filed on February 28, 2017 (File no. 333-216320))
|
|
|
Form of Management Stock Option Agreement (December 2013) under the 2013 Stock Incentive Plan for Key Employees of Gardner Denver Holdings, Inc. (formerly known as Renaissance Parent Corp.) and its Subsidiaries (incorporated by reference to Exhibit 10.17 to the Registrant’s Registration Statement on Form S-1 filed on February 28, 2017 (File no. 333-216320))
|
II-4
|
Exhibit Number
|
Exhibit Description
|
|
Form of Management Stock Option Agreement (May 2015) under the 2013 Stock Incentive Plan for Key Employees of Gardner Denver Holdings, Inc. (formerly known as Renaissance Parent Corp.) and its Subsidiaries (incorporated by reference to Exhibit 10.18 to the Registrant’s Registration Statement on Form S-1 filed on February 28, 2017 (File no. 333-216320))
|
|
|
Form of Management Stock Option Agreement (May 2016, 3 year vesting) under the 2013 Stock Incentive Plan for Key Employees of Gardner Denver Holdings, Inc. (formerly known as Renaissance Parent Corp.) and its Subsidiaries (incorporated by reference to Exhibit 10.19 to the Registrant’s Registration Statement on Form S-1 filed on February 28, 2017 (File no. 333-216320))
|
|
|
Form of Management Stock Option Agreement (May 2016, 5 year vesting) under the 2013 Stock Incentive Plan for Key Employees of Gardner Denver Holdings, Inc. (formerly known as Renaissance Parent Corp.) and its Subsidiaries (incorporated by reference to Exhibit 10.20 to the Registrant’s Registration Statement on Form S-1 filed on February 28, 2017 (File no. 333-216320))
|
|
|
Form of Management Stock Option Agreement (December 2016) under the 2013 Stock Incentive Plan for Key Employees of Gardner Denver Holdings, Inc. (formerly known as Renaissance Parent Corp.) and its Subsidiaries (incorporated by reference to Exhibit 10.21 to the Registrant’s Registration Statement on Form S-1 filed on February 28, 2017 (File no. 333-216320))
|
|
|
Form of Amendment to Stock Option Agreement or Stock Appreciation Right Agreement under the 2013 Stock Incentive Plan for Key Employees of Gardner Denver Holdings, Inc. (formerly known as Renaissance Parent Corp.) and its Subsidiaries (incorporated by reference to Exhibit 10.22 to the Registrant’s Registration Statement on Form S-1 filed on February 28, 2017 (File no. 333-216320))
|
|
|
Stock Option Agreement, dated as of March 7, 2014, between under the 2013 Stock Incentive Plan for Key Employees of Gardner Denver Holdings, Inc. (formerly known as Renaissance Parent Corp.) between Gardner Denver Holdings, Inc. (formerly known as Renaissance Parent Corp.) and Andrew Schiesl (incorporated by reference to Exhibit 10.23 to the Registrant’s Registration Statement on Form S-1 filed on February 28, 2017 (File no. 333-216320))
|
|
|
Form of Sale Participation Agreement (incorporated by reference to Exhibit 10.24 to the Registrant’s Registration Statement on Form S-1 filed on February 28, 2017 (File no. 333-216320))
|
|
|
Offer Letter, dated April 17, 2015, between Vicente Reynal and Gardner Denver, Inc. (incorporated by reference to Exhibit 10.25 to the Registrant’s Registration Statement on Form S-1 filed on February 28, 2017 (File no. 333-216320))
|
|
|
Offer Letter, dated November 19, 2015, between Vicente Reynal and Gardner Denver, Inc. (incorporated by reference to Exhibit 10.26 to the Registrant’s Registration Statement on Form S-1 filed on February 28, 2017 (File no. 333-216320))
|
|
|
Offer Letter, dated November 18, 2015, between Todd Herndon and Gardner Denver, Inc. (incorporated by reference to Exhibit 10.27 to the Registrant’s Registration Statement on Form S-1 filed on February 28, 2017 (File no. 333-216320))
|
|
|
Offer Letter, dated September 2, 2016, between Todd Herndon and Gardner Denver, Inc. (incorporated by reference to Exhibit 10.28 to the Registrant’s Registration Statement on Form S-1 filed on February 28, 2017 (File no. 333-216320))
|
|
|
Offer Letter, dated June 9, 2013, between Gardner Denver Holdings, Inc. (formerly known as Renaissance Parent Corp.) and Patrick Bennett (incorporated by reference to Exhibit 10.29 to the Registrant’s Registration Statement on Form S-1 filed on February 28, 2017 (File no. 333-216320))
|
|
|
Letter Agreement, dated August 15, 2013, between Patrick Bennett and Gardner Denver Holdings, Inc. (formerly known as Renaissance Parent Corp.)(incorporated by reference to Exhibit 10.30 to the Registrant’s Registration Statement on Form S-1 filed on February 28, 2017 (File no. 333-216320))
|
II-5
|
Exhibit Number
|
Exhibit Description
|
|
Offer Letter, dated November 25, 2013, between Gardner Denver, Inc. and Andy Schiesl (incorporated by reference to Exhibit 10.31 to the Registrant’s Registration Statement on Form S-1 filed on February 28, 2017 (File no. 333-216320))
|
|
|
Employment Contract, dated April 29, 2016, between Gardner Denver Deutschland GmbH and Enrique Mifiarro Viseras (incorporated by reference to Exhibit 10.32 to the Registrant’s Registration Statement on Form S-1 filed on February 28, 2017 (File no. 333-216320))
|
|
|
Offer Letter, dated March 16, 2016, between Gardner Denver Deutschland GmbH and Enrique Mifiarro Viseras (incorporated by reference to Exhibit 10.33 to the Registrant’s Registration Statement on Form S-1 filed on February 28, 2017 (File no. 333-216320))
|
|
|
Separation and Release Agreement, dated September 21, 2016, between Gardner Denver, Inc. and Jeff Likosar (incorporated by reference to Exhibit 10.34 to the Registrant’s Registration Statement on Form S-1 filed on February 28, 2017 (File no. 333-216320))
|
|
|
Separation and Release Agreement, dated October 6, 2016, between Gardner Denver, Inc. and Saeid Rahimian (incorporated by reference to Exhibit 10.35 to the Registrant’s Registration Statement on Form S-1 filed on February 28, 2017 (File no. 333-216320))
|
|
|
2017 Omnibus Incentive Plan (incorporated by reference to Exhibit 10.2 to the Registrant’s Current Report on Form 8-K filed on May 17, 2017 (File no. 001-38095))
|
|
|
Monitoring Fee Termination Agreement, dated as of May 17, 2017, between Gardner Denver Holdings, Inc. Kohlberg Kravis Roberts & Co. L.P. (incorporated by reference to Exhibit 10.1 to the Registrant’s Current Report on Form 8-K filed on May 17, 2017 (File no. 001-38095))
|
|
|
Subsidiaries of Gardner Denver Holdings, Inc. (incorporated by reference to Exhibit 21.1 to the Registrant’s Registration Statement on Form S-1 filed on February 28, 2017 (File no. 333-216320))
|
|
|
Consent of Simpson Thacher & Bartlett LLP (included in Exhibit 5.1)
|
|
|
Consent of Deloitte & Touche LLP
|
|
|
Power of Attorney
|
| * | Filed as an Exhibit hereto. |
| † | Identifies exhibits that consist of a management contract or compensatory plan or arrangement. |
| (b) | Financial Statement Schedules. |
The following Financial Statement Schedule is included herein:
Schedule I — Condensed Financial Information of Gardner Denver Holdings, Inc. (incorporated by reference to the Company’s Annual Report)
Item 17. Undertakings.
| (1) | The Registrant hereby undertakes to deliver or cause to be delivered with the prospectus, to each person to whom the prospectus is sent or given, the latest annual report to security holders that is incorporated by reference in the prospectus and furnished pursuant to and meeting the requirements of Rule 14a-3 or Rule 14c-3 under the Securities Exchange Act of 1934; and, where interim financial information required to be presented by Article 3 of Regulation S-X are not set forth in the prospectus, to deliver, or cause to be delivered to each person to whom the prospectus is sent or given, the latest quarterly report that is specifically incorporated by reference in the prospectus to provide such interim financial information. |
| (2) | Insofar as indemnification for liabilities arising under the Securities Act may be permitted to directors, officers and controlling persons of the Registrant pursuant to the foregoing provisions, or otherwise, the Registrant has been advised that in the opinion of the Securities and Exchange Commission such indemnification is against public policy as expressed in the Securities Act and is, therefore, unenforceable. In the event that a claim for indemnification against such liabilities (other than the payment by the Registrant of expenses incurred or paid by a director, officer or controlling person of the Registrant in the successful defense of any action, suit or proceeding) is asserted by such director, officer or controlling person in connection with the securities being registered, the Registrant will, |
II-6
unless in the opinion of its counsel the matter has been settled by controlling precedent, submit to a court of appropriate jurisdiction the question of whether such indemnification by it is against public policy as expressed in the Securities Act and will be governed by the final adjudication of such issue.
| (3) | The Registrant hereby undertakes that: |
| (A) | For purposes of determining any liability under the Securities Act, the information omitted from the form of prospectus filed as part of this registration statement in reliance upon Rule 430A and contained in a form of prospectus filed by the Registrant pursuant to Rule 424(b)(1) or (4) or 497(h) under the Securities Act shall be deemed to be part of this registration statement as of the time it was declared effective. |
| (B) | For the purpose of determining any liability under the Securities Act, each post-effective amendment that contains a form of prospectus shall be deemed to be a new registration statement relating to the securities offered therein, and the offering of such securities at that time shall be deemed to be the initial bona fide offering thereof. |
II-7
SIGNATURES
Pursuant to the requirements of the Securities Act of 1933, as amended, the Registrant has duly caused this Registration Statement to be signed on its behalf by the undersigned, thereunto duly authorized, in the City of Milwaukee, Wisconsin, on April 30, 2018.
|
|
Gardner Denver Holdings, Inc.
|
|
|
|
|
|
|
|
By:
|
/s/ Vicente Reynal
|
|
|
|
Name: Vicente Reynal
|
|
|
|
Title: Chief Executive Officer
|
Pursuant to the requirements of the Securities Act, this registration statement has been signed by the following person in the capacities indicated on April 30, 2018:
|
Signature
|
Capacity
|
|
|
|
|
/s/ Vicente Reynal
|
Chief Financial Officer and Director
(principal executive officer) |
|
Vicente Reynal
|
|
|
|
|
|
/s/ Philip T. Herndon
|
Vice President and Chief Financial Officer
(principal financial officer) |
|
Philip T. Herndon
|
|
|
|
|
|
/s/ Mark R. Sweeney
|
Vice President, Chief Accounting Officer and
Corporate Controller (principal accounting officer) |
|
Mark R. Sweeney
|
|
|
|
|
|
*
|
Director
|
|
Peter Stavros
|
|
|
|
|
|
*
|
Director
|
|
Brandon F. Brahm
|
|
|
|
|
|
*
|
Director
|
|
William P. Donnelly
|
|
|
|
|
|
*
|
Director
|
|
John Humphrey
|
|
|
|
|
|
*
|
Director
|
|
William E. Kassling
|
|
|
|
|
|
*
|
Director
|
|
Michael V. Marn
|
|
|
|
|
|
*
|
Director
|
|
Nickolas Vande Steeg
|
|
|
|
|
|
*
|
Director
|
|
Joshua T. Weisenbeck
|
|
*
|
/s/ Vicente Reynal
|
|
|
|
Vicente Reynal, Attorney-in-Fact
|
|
II-8