Attached files
| file | filename |
|---|---|
| EX-31.4 - EXHIBIT 31.4 - ALASKA COMMUNICATIONS SYSTEMS GROUP INC | ex_111791.htm |
| EX-31.3 - EXHIBIT 31.3 - ALASKA COMMUNICATIONS SYSTEMS GROUP INC | ex_111790.htm |
UNITED STATES
SECURITIES AND EXCHANGE COMMISSION
Washington, D.C. 20549
Form 10-K/A
Amendment No. 1
(Mark One)
☒ ANNUAL REPORT PURSUANT TO SECTION 13 OR 15(d) OF THE SECURITIES EXCHANGE ACT OF 1934
For the fiscal year ended December 31, 2017
or
☐ TRANSITION REPORT PURSUANT TO SECTION 13 OR 15(d) OF THE SECURITIES EXCHANGE ACT OF 1934
For the transition period from ____________ to ___________
Commission File Number 000-28167
Alaska Communications Systems Group, Inc.
(Exact name of registrant as specified in its charter)
|
Delaware |
|
52-2126573 |
|
(State or other jurisdiction of incorporation or organization) |
|
(I.R.S. Employer Identification No.) |
|
600 Telephone Avenue Anchorage, Alaska |
|
99503-6091 |
|
(Address of principal executive offices) |
|
(Zip Code) |
Registrant’s telephone number, including area code: (907) 297-3000
Securities registered pursuant to Section 12(b) of the Act:
|
Title of each class |
Name of each exchange on which registered |
|
|
Common Stock, Par Value $.01 per Share |
|
The Nasdaq Stock Market LLC |
Securities registered pursuant to Section 12(g) of the Act:
None
Indicate by check mark if the registrant is a well-known seasoned issuer, as defined in Rule 405 of the Securities Act. Yes ☐ No ☒
Indicate by check mark if the registrant is not required to file reports pursuant to Section 13 or Section 15(d) of the Act. Yes ☐ No ☒
Indicate by check mark whether the registrant (1) has filed all reports required to be filed by Section 13 or 15(d) of the Securities Exchange Act of 1934 during the preceding 12 months (or for such shorter period that the registrant was required to file such reports), and (2) has been subject to such filing requirements for the past 90 days. Yes ☒ No ☐
Indicate by check mark whether the registrant has submitted electronically and posted on its corporate Website, if any, every Interactive Data File required to be submitted and posted pursuant to Rule 405 of Regulation S-T (§232.405 of this chapter) during the preceding 12 months (or for such shorter period that the registrant was required to submit and post such files). Yes ☒ No ☐
Indicate by check mark if disclosure of delinquent filers pursuant to Item 405 of Regulation S-K (§229.405 of this chapter) is not contained herein, and will not be contained, to the best of registrant’s knowledge, in definitive proxy or information statements incorporated by reference in Part III of this Form 10-K or any amendment to this Form 10-K. ☒
Indicate by check mark whether the registrant is a large accelerated filer, an accelerated filer, a non-accelerated filer, a smaller reporting company, or an emerging growth company. See the definitions of “large accelerated filer,” “accelerated filer,” “smaller reporting company” and "emerging growth company" in Rule 12b-2 of the Exchange Act. (Check one):
|
Large accelerated filer ☐ |
Accelerated filer ☒ |
|
Smaller reporting company ☐ |
|
Non-accelerated filer ☐ |
(Do not check if a smaller reporting company) |
Emerging growth company ☐ |
|
If an emerging growth company, indicate by check mark if the registrant has elected not to use the extended transition period for complying with any new or revised financial accounting standards provided pursuant to Section 13(a) of the Exchange Act. ☐
Indicate by check mark whether the registrant is a shell company (as defined in Rule 12b-2 of the Act). Yes ☐ No ☒
The aggregate market value of the shares of all classes of voting stock of the registrant held by non-affiliates of the registrant on June 30, 2017 was approximately $109 million computed upon the basis of the closing sales price of the Common Stock on that date. For purposes of this computation, shares held by directors (and shares held by any entities in which they serve as officers) and officers of the registrant have been excluded. Such exclusion is not intended, nor shall it be deemed, to be an admission that such persons are affiliates of the registrant.
As of April 25, 2018, there were outstanding 53,110,320 shares of Common Stock, $.01 par value, of the registrant.
DOCUMENTS INCORPORATED BY REFERENCE
None.
ALASKA COMMUNICATIONS SYSTEMS GROUP, INC.
AMENDMENT NO. 1 TO ANNUAL REPORT ON FORM 10-K/A
FOR THE YEAR ENDED DECEMBER 31, 2017
|
3 |
|
|
|
|
|
4 |
|
|
|
|
|
15 |
|
|
|
|
|
Item 10. Directors, Executive Officers and Corporate Governance |
17 |
|
22 |
|
|
47 |
|
|
Item 13. Certain Relationships and Related Transactions, and Director Independence |
49 |
|
50 |
|
|
|
|
|
51 |
|
|
|
|
|
56 |
Alaska Communications Systems Group, Inc. and its consolidated subsidiaries (“we,” “our,” “us,” the “Company” or “Alaska Communications”) is filing this Amendment No. 1 on Form 10-K/A for the year ended December 31, 2017 (“Amendment”) to amend our Form 10-K for the year ended December 31, 2017, filed with the Securities and Exchange Commission (the “SEC”) on March 16, 2018 (the “Original Form 10-K”). We are filing this Amendment to (i) present in Part I, Item 1A, a revised risk factor, as described in Item 503(c) of Regulation S-K, that is applicable to the Company; (ii) present the information required by Part II (Item 5) of Form 10-K that was previously omitted from the Original Form 10-K; and (iii) present the information required by Part III of Form 10-K that was previously omitted from the Original Form 10-K in reliance on General Instruction G(3) to Form 10-K. The Company is hereby amending the Original Form 10-K as follows:
|
● |
On the cover page, to (i) delete the reference in the Original Form 10-K to the incorporation by reference of the Company’s proxy statement for its 2018 annual stockholders’ meeting and (ii) update the date as of which the number of outstanding shares of the Company’s common stock is being provided; |
|
● |
To present in Part I, Item 1A, a revised risk factor, as described in Item 503(c) of Regulation S-K, that is applicable to the Company, under the heading “Actions of Activist Stockholders;” |
|
● |
To present the information required by Part II (Item 5) and Part III of Form 10-K, which information was originally expected to be incorporated by reference to our definitive proxy statement to be delivered to our stockholders in connection with our 2018 annual meeting of stockholders; and |
|
● |
In Part IV, to amend and restate Item 15(b) and Exhibits 31.3 and 31.4 in their entirety to contain the currently dated certifications from the Company’s principal executive officer and principal financial officer pursuant to Section 302 of the Sarbanes-Oxley Act of 2002. The certifications of the Company’s principal executive officer and principal financial officer are attached to this Amendment as Exhibits 31.3 and 31.4. Because no financial statements have been included in this Amendment and this Amendment does not contain or amend any disclosure with respect to Items 307 and 308 of Regulation S-K, paragraphs 3, 4 and 5 of the certifications have been omitted. The Exhibit Index has also been amended and restated in its entirety to include the certifications as exhibits. |
Except as described above, no other changes have been made to the Original Form 10-K. This Amendment does not otherwise update information in the Original Form 10-K to reflect facts or events occurring subsequent to the filing date of the Original Form 10-K. This Amendment should be read in conjunction with the Original Form 10-K and with any of our filings made with the SEC subsequent to filing of the Original Form 10-K.
We face a variety of risks that may affect our business, financial condition and results of operations, some of which are beyond our control. The risks described below are not the only ones we face and should be considered in addition to the other cautionary statements and risks described elsewhere and the other information contained in this report and in our other filings with the SEC, including our subsequent reports on Forms 10-Q and 8-K. Additional risks and uncertainties not known to us or that we currently deem immaterial may also affect our business. If any of these known or unknown risks or uncertainties actually occurs, our business, financial condition and results of operations could be seriously harmed.
Risks Relating to Our Industry
Competition
The telecommunications industry in Alaska is competitive and creates pressure on our pricing and customer retention efforts.
Strong competitors make it more difficult for us to attract and retain customers, which could result in lower revenue, cash flow from operating activities and Adjusted Free Cash Flow.
Our principal facilities-based competitor for voice and broadband services is GCI, who is also the dominant cable television provider in Alaska. In the business and wholesale market, GCI holds a dominant position through its extensive fiber optic, microwave and satellite based middle mile network as well as its undersea fiber cable network, where it owns and operates two of the four existing undersea fiber optic cables connecting Alaska to the contiguous states. In the consumer market, GCI bundles its cable video services with voice, broadband and mobile wireless services. We do not offer video service and mobile wireless, and thus, are unable to offer competing bundles.
GCI continues to expand its statewide reach, including through its Terra Southwest project which is funded with federal subsidies, consisting of grants from the USDA Rural Utilities Service and federal low-interest loans. This subsidy gives GCI a substantial competitive advantage in the markets served by Terra Southwest, and GCI receives substantial additional funding for services offered over this facility from the federal E-Rate and Rural Health Care universal service support mechanisms. GCI has indicated it intends to replicate this government subsidized model in other markets in Alaska, which will create monopoly-type conditions in these markets which are subject to minimal regulatory oversight.
With a long history of operating in Alaska, AT&T has a terrestrial long-haul network in Alaska where the focus is on serving certain national customers. AT&T’s primary focus in Alaska is providing wireless services.
As we compete more extensively in the managed IT services business, we are likely to face new competition, both local and national. An example of this new competition is World Wide Technologies, a large equipment value add reseller. More recently we have seen a smaller Rural Local Exchange Carrier (RLEC), Matanuska Telephone Association (MTA), that operates predominantly in the Wasilla and Palmer communities north of Anchorage, acquire a data center and IT services provider called AlasConnect. With this acquisition, we now see MTA as a competitor for managed IT services particularly in our Anchorage and Fairbanks markets. There are many smaller firms that compete for IT business in Alaska. We believe that competition for managed IT services is fragmented in Alaska with no clear or dominant provider.
Our Cost Structure
We may not be able to maintain our cost structure which would create risk to our ability to generate bottom-line growth.
Subsequent to the Wireless Sale, wind-down of our wireless operations and positioning the Company as a more focused broadband and managed IT services company, we commenced a plan to generate synergies and achieve cost reductions. This plan was substantially implemented during the third and fourth quarters of 2015 and resulting benefits were realized during fiscal year 2016 and 2017. We have also recently implemented additional cost savings initiatives. Maintaining these cost reductions is a critical factor impacting our generation of cash flow from operating activities. If we fail to maintain these cost reductions, our financial condition will be impacted.
Technological Advancements and Changes in Telecommunications Standards
If we do not adapt to rapid technological advancements and changes in telecommunications standards, our ability to compete could be strained, and as a result, we would lose customers.
Our success will likely depend on our ability to adapt and fund the rapid technological changes in our industry. Our failure to adopt a new technology or our choice of one technology over another may have an adverse effect on our ability to compete or meet the demands of our customers. Technological changes could, among other things, reduce the barriers to entry facing our competitors providing local service in our service areas. The pace of technology change and our ability to deploy new technologies may be constrained by insufficient capital and/or the need to generate sufficient cash to make interest payments on our debt.
New products and services may arise out of technological developments and our inability to keep pace with these developments may reduce the attractiveness of our services. Some of our competitors may have greater resources to respond to changing technology than we do. If we fail to adapt successfully to technological changes or fail to obtain access to new technologies, we could lose customers and be unable to attract new customers and/or sell new services to our existing customers. We may be unable to successfully deliver new products and services, and we may not generate anticipated revenues from such products or services.
To be competitive we need to maintain an on-going investment program to continuously upgrade our access network. We define the access network as the connection from the end user location – either a home or a business – to the first aggregation point in the network. The connection can be copper or fiber and the aggregation point is typically a central office or remote serving node. The access network determines the speeds we are able to deliver to our end customer. We may not be able to maintain the level of investment needed for long term competitiveness in offering broadband speeds to all segments of our market.
As we seek to grow as the leading Cloud Enabler for businesses in Alaska, we will have to partner with various IT technology and cloud services providers. Technology trends and developments in this area can be far more disruptive and tend to change in shorter cycles compared to telecommunications technologies. Our ability to invest in the training, certifications, and skills required to develop these partnerships will be important in determining our success in this area of managed IT services.
Our limited access to middle mile infrastructure limits our ability to compete in certain geographic and customer segments in Alaska.
We define middle mile as the connection between the first aggregation point into a local community and the interconnection point to the internet or switch which connects the community to the outside world. These are typically high capacity connections and can span hundreds of miles in the case of Alaska. It is unlikely that we will have the capital needed for middle mile investments, and GCI controls significant elements of the middle mile network in Alaska, and through its government funded programs is creating monopoly conditions in certain areas of the state. This limits our ability to compete in certain markets.
Risks Relating to Our Debt
Our debt could adversely affect our financial health, financing options and liquidity position, and our ability to service debt is, in part, dependent on maintaining the synergies achieved following the Wireless Sale. Due to uncertainty in the capital markets, we may be unable to retire or refinance our long-term debt when it becomes due, or if we are able to refinance it, we may not be able to do so with attractive interest rates or terms.
2017 Senior Credit Facility
On March 13, 2017, we entered into a senior credit facility consisting of a Term A-1 Facility of $120.0 million, a Term A-2 Facility of $60.0 million and a Revolving Facility of $15.0 million (together the “2017 Senior Credit Facility” or “Agreement”). On March 28, 2017, the Company utilized proceeds from the 2017 Senior Credit Facility and cash on hand to repay, in full, the outstanding principal balance and accrued interest of its 2015 Senior Credit Facilities. Principal payments under the 2015 Senior Credit Facility were due in 2017 and 2018. Proceeds from the 2017 Senior Credit Facility were also utilized to fund the tender offer and settlement of the Company’s 6.25% Convertible Notes in the principle amount of $94.0 million.
Principal payments on the Term A-1 Facility are $1,500 thousand per quarter beginning in the fourth quarter of 2017 through the first quarter of 2020, $2,250 thousand per quarter beginning in the second quarter of 2020 through the first quarter of 2021, and $4,000 thousand per quarter beginning in the second quarter of 2021 through the fourth quarter of 2021. The remaining outstanding principal balance is due on March 13, 2022. Principal payments on the Term A-2 Facility are $150 thousand per quarter beginning in the fourth quarter of 2017 through the first quarter of 2021 and $600 thousand per quarter beginning in the second quarter of 2021 through the fourth quarter of 2022. The remaining outstanding principal balance is due on March 13, 2023.
The 2017 Senior Credit Facility also requires that we perform against certain financial covenants.
Our debt also exposes us to adverse changes in interest rates. As a component of our cash flow hedging strategy and as required under the terms of the 2017 Senior Credit Facility, we hold a pay-fixed, receive-floating interest rate swap in the notional amount of $90.0 million at 6.49425%, inclusive of a 5.0% LIBOR spread, through June 2019.
6.25% Convertible Notes due 2018
The remaining principle amount of the 6.25% Convertible Notes due in 2018 of $10.0 million will purchased or settled with restricted cash designated for this purpose. Our ability to complete the repurchase depends on meeting certain liquidity requirements specified in our 2017 Senior Credit Facility. If we are unable to meet those liquidity requirements or obtain a waiver from our lenders, we may be in default of our obligations under the notes and our credit facility.
Continuing global, national, and state fiscal insecurity, as well as uncertainty regarding our future performance adds refinancing risk to the Company.
We are also subject to credit risk related to our counterparties on the swaps and to interest rate fluctuations on interest generated by our debt in excess of the notional term loans referenced above. For more specific information related to our exposure to changes in interest rates and our use of interest rate swaps, please see “Item 7A, Quantitative and Qualitative Disclosures About Market Risk” in the Original Form 10-K.
Risks Related to our Business
Rural Health Care Universal Service Support Program
We may not receive some of the subsidies for Rural Health Care for which our customers have applied and amounts previously received may be challenged by the FCC.
Beginning with the 2016 Funding Year (July 1, 2016 – June 30, 2017), and again for Funding Year 2017 (July 1, 2017 – June 30, 2018), demand for support under the Rural Health Care Universal Service Support Program has exceeded the available budget. On March 15, 2018, USAC announced that demand for rural health care support had exceeded the programs’ annual cap in Funding Year 2017, which began July 1, 2017 and ends on June 30, 2018, and that successful applicants would receive 85% of the funding for which they would otherwise be eligible. These budget constraints could reduce the affordability of our services to rural health care providers, and potentially reduce demand for our services from these customers in the future.
The budget constraints have also prompted the Universal Service Administrative Company (“USAC”), which administers the program, to engage in substantially more rigorous reviews of rural health care support, raising compliance costs and delaying issuance of support payments. In connection with that review, the Company has received certain inquiries and requests for information from USAC and from the FCC Enforcement Bureau.
This rising uncertainty and unpredictability in the Rural Health Care program negatively impacted the Company’s revenue in 2017, and may have a negative impact on future revenue and demand for our services from rural healthcare providers.
Also, we may be subject to further investigation for the Company’s compliance with FCC and USAC rules, regulations, and practices for prior periods. Such investigations of other companies have resulted in refunding certain previously awarded funds, as well as fines and penalties.
Access and High Cost Support Revenue
Revenues from access charges will continue to decline and revenue from various regulated support mechanisms is subject to rule changes at the FCC and the RCA.
We received approximately 2.2% and 2.5% of our operating revenues for the years ended December 31, 2017 and 2016, respectively, from access charges. The amount of revenue that we receive from these access charges is calculated in accordance with requirements set by the FCC and the RCA. Any change in these requirements may reduce our revenues and earnings. Access charges have consistently decreased in past years and we expect this trend to continue due to declines in voice usage and migration to VoIP services which do not generate access revenue for us.
Interstate switched access has been on a phase-out schedule for several years, and according to the schedule set forth by the FCC, it reached its final phase in July 2017 and will be reduced to zero on July 1, 2018. Interstate switched access is currently a relatively small component of all access revenue, and modest declines are anticipated at this time for other components of interstate access revenue. Traditional intrastate access revenues have already been reduced, replaced in part by COLR support. The RCA has commenced a proceeding that could impact COLR support in the future, and while it is impossible to predict the state commission’s future decisions, there is a risk that revenue will be reduced.
Furthermore, the FCC has actively reviewed new mechanisms for inter-carrier compensation that will eliminate certain access charges entirely. Elimination of access charges would have a material adverse effect on our revenue and earnings. Similarly, the RCA has adopted regulations modifying intrastate access charges that may reduce our revenue.
As discussed in “Regulations,” the FCC released its order for CAF II on October 31, 2016. As a result, we currently expect our high cost support revenue to be relatively unchanged for the next eight years. Substantial changes are expected to be enacted by the FCC regarding our future high cost loop support funding and obligations thereunder. It is difficult to predict the future growth in this source of revenue as well as the future obligations that we will be required to accept that are tied to this funding.
Regulations
New governmental regulations may impose obligations on us to upgrade our existing technology or adopt new technology that may require additional capital and we may not be able to comply in a timely manner with these new regulations.
Some of our markets are regulated and we cannot predict the extent to which the government will impose new unfunded mandates on us. Such mandates have included those related to emergency location, emergency “E-911” calling, law enforcement assistance and local number portability. Each of these government mandates has imposed new requirements for capital that we could not have predicted with any precision. Along with these obligations, the FCC has imposed deadlines for compliance with these mandates. We may not be able to provide services that comply with these or other regulatory mandates. Further, we cannot predict whether other mandates from the FCC or other regulatory authorities will occur in the future or the demands they may place on our capital expenditures. For more information on our regulatory environment and the risks it presents to us, see “Item 1, Business – Regulation” in the Original Form 10-K.
There is a risk that FCC Orders will materially impact our revenue.
The 2011 Transformation Order established a new framework for high cost universal service support that replaced existing support mechanisms that provide support to carriers, like us, that serve high-cost areas with new CAF support mechanisms and service obligations that are focused on broadband Internet access services. We recognized $19.7 million in federal high cost universal service payment revenues to support our wireline operations in high cost areas in each of the twelve months ended December 31, 2017 and 2016. The FCC released its CAF Phase II order on October 31, 2016.
In addition, the FCC has imposed strict new compliance requirements governing enrollment of low-income subscribers in the FCC’s Lifeline program, which provides carriers like us with USF support to reduce the cost of wireline and wireless services to low-income consumers. For the twelve months ended December 31, 2017, we recognized wireline lifeline revenue of $0.3 million. Over the same period the number of wireline lifeline customers we served decreased from 1,131 to 934. We expect the amount of Lifeline USF support we receive in connection with our wireline customers to continue to decrease, because we expect that it will be more difficult for low-income consumers to qualify for Lifeline, and to remain enrolled in Lifeline, than it was under the former rules.
Economic Conditions
The successful operation and growth of our businesses depends on economic conditions in Alaska which may deteriorate due to reductions in crude oil prices and other factors.
The vast majority of our customers and operations are located in Alaska. Due to our geographical concentration, the successful operation and growth of our businesses depends on economic conditions in Alaska. The Alaska economy, in turn, depends upon many factors, including:
|
● |
the strength of the natural resources industries, particularly oil production and prices of crude oil; |
|
● |
the strength of the Alaska tourism industry; |
|
● |
the level of government and military spending; and |
|
● |
the continued growth of service industries. |
The population of Alaska, which declined marginally in 2017, is approximately 740,000 with Anchorage, Fairbanks and Juneau serving as the primary population and economic centers in the state.
It is estimated that one-third of Alaska’s economy is dependent on federal spending, one-third on natural resources, in particular the production of crude oil, and the remaining one-third on drivers such as tourism, mining, timber, seafood, international air cargo and miscellaneous support services.
Alaska’s economy is dependent on investment by oil companies, and state tax revenues correlate with the price of oil as the State assesses a tax based on the retail price of oil that transits the pipeline from the North Slope. The price of crude oil dropped substantially during 2014 through 2016, and began to rebound in 2017. Economists currently expect oil prices to increase marginally in 2018 and slowly trend up in the near term. The decline in the price of crude oil has impacted the state in two ways:
|
1. |
Resource based companies reduced their level of spending in the state, and in particular the North Slope, through reducing their operating costs. |
|
|
2. |
The State of Alaska budget, which represents approximately 15% of the states total economy, is incurring deficits, but had budgetary reserves that were available through 2017. Proposals to address these deficits include spending reductions, utilization of earnings from the state’s permanent fund and additional revenues, including selected income taxes. Reduced spending by the State has had a dampening effect on overall economic activity in the state. |
Economists anticipate that slowly increasing oil prices and growing industry optimism bode well for continued new development and increased activity on the North Slope in 2018, supporting an increase in the volume of oil moving through the pipeline and the generation of revenue for the state government.
Economists believe the Alaskan economy entered a moderate recession beginning in the second half of 2015. They are currently projecting that this recession will continue into 2018. Employment levels in the state declined approximately 1.3% in 2017 (compared with a 2.3% decline in 2016) driven by declines in the oil and gas industry, construction, and Federal and state government, offset by increases in health care and local government. The negative effects of the recession have been mitigated by diversity in the Alaskan economy, including growth in the health care and tourism industries. However, economists believe that, without a long-term solution to the state budget deficit, a full economic recovery may remain elusive.
Our terrestrial fiber network on the North Slope of Alaska (described below) which allows us to provide broadband solutions to the oil and gas sector may be negatively impacted by declining crude oil prices in the near term. Additionally, overall macro impacts from a sustained lower price of crude oil, if maintained over time, will ultimately impact our growth in the future.
North Slope Fiber Optic Network
Our joint venture with Quintillion Holdings, LLC established, in part, to provide broadband solutions to the North Slope of Alaska may not prove to be as successful as currently anticipated.
During the second quarter of 2015, we acquired a fiber optic network on the North Slope of Alaska and entered into a joint venture with Quintillion to operate and expand the network. This network enables commercially-available, high-speed connectivity where only high-cost microwave and satellite communications were previously available. The success of this joint venture is dependent, in part, on the utilization of the network by other telecom carriers.
Quintillion has invested in a submarine network with landing stations in several northwest Alaska communities, including a terrestrial route from the North Slope to Fairbanks. The network became operational in late 2017. We have acquired capacity on this system and expect to deliver service to customers in this area beginning in 2018. Delays in acquiring customers and providing those customers with service could negatively impact our investment in the joint venture and our financial results.
Erosion of Access Lines
We provide services to many customers over access lines, and if we continue to lose access lines, our revenues, earnings and cash flow from operating activities may decrease.
Our business generates revenue by delivering voice and data services over access lines. We have experienced net access line loss over the past few years and the rate of loss has been accelerating. During the years ended December 31, 2017 and 2016 our business access line erosion was 2,278 and 2,621, respectively, while over the same period our consumer access line erosion was 4,156 and 4,265 respectively. We expect to continue to experience net access line loss in our markets, affecting our revenues, earnings and cash flow from operating activities.
Network / E-911 Failure
A failure of our network could cause significant delays or interruptions of service, which could cause us to lose customers.
To be successful, we will need to continue to provide our customers reliable service over our network. Our network and infrastructure are constantly at risk of physical damage as a result of human, natural or other factors. These factors may include pandemics, acts of terrorism, sabotage, natural disasters, power surges or outages, software defects, contractor or vendor failures, labor disputes and other disruptions that may be beyond our control. Should we experience a prolonged system failure or a significant service interruption, our customers may choose a different provider and our reputation may be damaged. Further, we may not have adequate insurance coverage, which would result in unexpected expense. Notably, similar to other undersea fiber optic cable operators, we do not carry insurance that would cover the cost of repair of our undersea cables and, thus, we would bear the full cost of any necessary repairs.
A failure of enhanced emergency calling services associated with our network may harm our business.
We provide E-911 service to our customers where such service is available. We also contract from time to time with municipalities to upgrade their dispatch capabilities such that those facilities become capable of receiving our transmission of a 911 caller’s location information and telephone number. If the emergency call center is unable to process such information, the caller is provided only basic 911 services. In these instances, the emergency caller may be required to verbally advise the operator of such caller’s location at the time of the call. Any inability of the dispatchers to automatically recognize the caller’s location or telephone number, whether or not it occurs as a result of our network operations, may cause us to incur liability or cause our reputation or financial results to suffer.
Actions of Activist Stockholders
Actions of activist stockholders against us could be disruptive and costly and the possibility that activist stockholders may wage proxy contests or seek representation on, or control of, our Board could cause uncertainty about the strategic direction of our business.
Stockholders with uncertain agendas may from time to time engage in proxy solicitations, advance stockholder proposals or board nominations or otherwise attempt to effect changes, assert influence or acquire some level of control over us.
On February 9, 2018, TAR Holdings LLC, a New Jersey limited liability company of which Karen S. Singer is the sole member (“TAR Holdings”), submitted to the Company a purported notice of nominations (the “Singer Purported Nominating Notice”) to notify the Company that it intends to nominate three candidates for election to our six-member Board at our 2018 Annual Meeting of Stockholders (the “2018 Annual Meeting”). On April 25, 2018, the Alaska Communications Board, acting upon the recommendation of our Board’s Nominating and Corporate Governance Committee, unanimously determined, in consultation with its legal advisors, that the Singer Purported Nominating Notice did not comply with our Amended and Restated Bylaws (the “Bylaws”) in numerous material respects and that, accordingly, TAR Holdings had not submitted to Alaska Communications a timely and proper advance notice of nominations in compliance with the Bylaws. On April 26, 2018, the Company’s Corporate Secretary sent TAR Holdings a letter, which the Company publicly filed as an exhibit to a Current Report on Form 8-K and DEFA14A filed on the same date, informing TAR Holdings of such determination and that, if TAR Holdings attempted to nominate its purported proposed candidates for election to our Board at the 2018 Annual Meeting, then, pursuant to the Bylaws, such purported proposed candidates would be disregarded and any ballots cast for such purported proposed candidates would be void. The April 26, 2018 letter further indicated that, notwithstanding the Board’s determination that the Singer Purported Nominating Notice was not submitted in compliance with the Bylaws, the Company remained interested in continuing to discuss a settlement with TAR Holdings that contemplated adding to the Board two new independent directors recommended by TAR Holdings. Notwithstanding the Board’s determination that TAR Holdings has not submitted to the Company a timely and proper advance notice of nominations in compliance with the Bylaws, it is possible that TAR Holdings may seek to challenge such determination, including, but not limited to, through litigation, and/or still seek to send to the Company’s stockholders proxy solicitation materials such as an opposition proxy statement and proxy card or voting instruction form.
According to Amendment No. 8 to the Schedule 13D filed with the SEC on April 30, 2018 by Ms. Singer and TAR Holdings (collectively, the “Singer 13D Group”), the Singer 13D Group beneficially owns in the aggregate approximately 5.03% of our outstanding common stock.
Our Board and management team strive to maintain constructive, ongoing communications with all of the Company’s stockholders, including the Singer 13D Group, and welcomes our stockholders’ views and opinions with the goal of enhancing value for all stockholders, including any suggestions stockholders may have for enhancing the depth and breadth of our Board. However, an activist campaign such as the one intended by the Singer 13D Group to replace three members of our six-member Board could have an adverse effect on us because:
|
● |
Responding to such actions by activist stockholders can disrupt our operations, are costly and time-consuming, and divert the attention of our Board and senior management team away from the pursuit of business strategies, which could adversely affect our results of operations and financial condition; |
|
● |
Perceived uncertainties as to our future direction as a result of changes to the composition of our Board may lead to the perception of a change in the direction of the business, instability or lack of continuity which may be exploited by our competitors, cause concern to our current or potential clients, may result in the loss of potential business opportunities and make it more difficult to attract and retain qualified personnel and business partners; |
|
● |
These types of actions could cause significant fluctuations in our stock price based on temporary or speculative market perceptions or other factors that do not necessarily reflect the underlying fundamentals and prospects of our business; and |
|
● |
If individuals are elected to our Board with the objective of furthering a specific agenda, it may adversely affect our ability to effectively implement our business strategy and create additional value for our stockholders. |
Employees
We depend on the availability of personnel with the requisite level of technical expertise in the telecommunications industry.
Our ability to develop and maintain our networks and execute our business plan is dependent on the availability of technical engineering, IT, service delivery and monitoring, product development, sales, management, finance and other key personnel within our geographic location.
Labor costs and the terms of our principal collective bargaining agreement can negatively impact our ability to remain competitive, which could cause our financial performance to suffer.
Labor costs are a significant component of our expenses and, as of December 31, 2017, approximately 54% of our workforce is represented by the IBEW. The Master Collective Bargaining Agreement (“CBA”) between the Company and the IBEW, which was ratified on December 8, 2017 and is effective through December 31, 2023, governs the terms and conditions of employment for all IBEW represented employees working for the Company in the state of Alaska and has significant economic impacts on the Company as it relates to wage and benefit costs and work rules that affect our ability to provide superior service to our customers. We believe our labor costs are higher than our competitors who employ a non-unionized workforce because we are required by the CBA to contribute to the IBEW Health and Welfare Trust and the Alaska Electrical Pension Fund (“AEPF”) for benefit programs, including defined benefit pension plans and health benefit plans, that are not reflective of the competitive marketplace. Furthermore, work rules under the existing agreement limit our ability to efficiently manage our workforce and make the incremental cost of work performed outside normal work hours high. In addition, we may make strategic and operational decisions that require the consent of the IBEW. While we believe our relationship with the IBEW is constructive, and although the IBEW generally has provided necessary consents, the IBEW may not provide consent when we need it, it may require additional wages, benefits or other consideration be paid in return for its consent, or it may call for a work stoppage against the Company. The Company considered relations with the IBEW to be stable in 2017; however, any deterioration in the relationship with the IBEW would have a negative impact on the Company’s operations.
Vendors
We rely on a limited number of key suppliers and vendors for timely supply of equipment and services for our network infrastructure and customer support services. If these suppliers or vendors experience problems or favor our competitors, we could fail to obtain the equipment and services we require to operate our business successfully.
We depend on a limited number of suppliers and vendors for equipment and services for our network and certain customer services. If suppliers of our equipment or providers of services on which we rely experience financial difficulties, service or billing interruptions, patent litigation or other problems, subscriber growth and our operating results could suffer.
Suppliers that use proprietary technology, effectively lock us into one or a few suppliers for key network components. Other suppliers require us to maintain exclusive relationships under a contract. As a result, we have become reliant upon a limited number of suppliers of network equipment. In the event it becomes necessary to seek alternative suppliers and vendors, we may be unable to obtain satisfactory replacement suppliers or vendors on economically attractive terms on a timely basis, or at all, which could increase costs and may cause disruption in service.
Networks, Monitoring Centers and Data Hosting Facilities
Maintaining the Company’s networks, around the clock monitoring centers and data hosting facilities requires significant capital expenditures, and our inability or failure to maintain and upgrade our networks and data centers would have a material impact on our market share and ability to generate revenue.
The Company currently operates an extensive network that includes monitoring and hosting facilities. To provide contractual levels of service to our customers and remain competitive, we must expend significant amounts of capital. In many cases, we must rely on outside vendors whose performance and costs may not be sufficiently within our control.
Information Technology Systems
A failure of back-office IT systems could adversely affect the Company’s results of operations and financial condition.
The efficient operation of the Company’s business depends on back-office IT systems. The Company relies on back-office IT systems, including certain systems provided by third party vendors, to effectively manage customer billing, business data, communications, supply chain, order entry and fulfillment and other business processes. Some of these systems are no longer supported under maintenance agreements from the underlying vendor. A failure of the Company’s IT systems, or the IT systems provided by third party vendors, to perform as anticipated could disrupt the Company’s business and result in a failure to collect accounts receivable, transaction errors, processing inefficiencies, and the loss of sales and customers, causing the Company’s reputation and results of operations to suffer. In addition, IT systems may be vulnerable to damage or interruption from circumstances beyond the Company’s control, including fire, natural disasters, systems failures, security breaches and viruses. Any such damage or interruption could have a material adverse effect on our business, operating results, margins and financial condition.
Undersea Fiber Optic Cable Systems
If failures occur in our undersea fiber optic cable systems, our ability to immediately restore our service may be limited.
Our undersea fiber optic cable systems carry a large portion of our traffic to and from the contiguous lower 48 states. If a failure occurs and we are not able to secure alternative facilities, some of the communications services we offer to our customers could be interrupted, which could have a material adverse effect on our business, financial position, results of operations or liquidity.
Managed IT Services
Our expansion into managed IT services may not be achieved as planned which could impact our ability to grow revenue.
We are expanding our business to provide more managed IT services along with our traditional telecom services. The delivery of professional services is not without risk, and it is possible that we may fail to execute on one or more managed IT service projects exposing the company to legal claims and reputational risk.
Intellectual Property
Third parties may claim that the Company is infringing upon their intellectual property, and the Company could suffer significant litigation or licensing expenses or be prevented from selling products.
Although the Company does not believe that any of its products or services infringe upon the valid intellectual property rights of third parties, the Company may be unaware of intellectual property rights of others that may cover some of its technology, products or services. Any litigation growing out of third party patents or other intellectual property claims could be costly and time consuming and could divert the Company’s management and key personnel from its business operations. The complexity of the technology involved and the uncertainty of intellectual property litigation increase these risks. Resolution of claims of intellectual property infringement might also require the Company to enter into costly license agreements. Likewise, the Company may not be able to obtain license agreements on acceptable terms. The Company also may be subject to significant damages or injunctions against development and sale of certain of its products. Further, the Company often relies on licenses of third party intellectual property for its businesses. The Company cannot ensure these licenses will be available in the future on favorable terms or at all. If any of these risks materialize, it could have a material adverse effect on our business, operating results, margins and financial condition.
Security Breaches
A failure in or breach of our operational or security systems or infrastructure, or those of third parties, could disrupt our businesses, result in the disclosure of confidential information or damage our reputation. Any such failure also could have a significant adverse effect on our cash flows, financial condition, and results of operations.
Our operations rely on the secure processing, storage and transmission of confidential and other information in our computer systems and networks. Although we take protective measures and endeavor to modify them as circumstances warrant, the security of our computer systems, software and networks may be vulnerable to breaches, unauthorized access, misuse, computer viruses or other malicious code and other events that could have a security impact. Additionally, breaches of security may occur through intentional or unintentional acts by those having authorized or unauthorized access to confidential or other information. If one or more such events occur, this potentially could jeopardize our information or our customers’ information processed and stored in, and transmitted through, our computer systems and networks. We may be required to expend significant additional resources to modify our protective measures or to investigate and remediate vulnerabilities or other exposures arising from operational and security risks, and we may be subject to litigation and financial losses that are either not insured against or not fully covered through any insurance maintained by us.
With regard to the physical infrastructure that supports our operations, we have taken measures to implement backup systems and other safeguards, but our ability to conduct business may be adversely affected by any disruption to that infrastructure. Such disruptions could involve electrical, communications, internet, transportation or other services used by us or third parties with whom we conduct business. The costs associated with such disruptions, including any loss of business, could have a significant adverse effect on our results of operations or financial condition.
Any of these operational and security risks could lead to significant and negative consequences, including reputational harm as well as loss of customers and business opportunities, which in turn could have a significant adverse effect on our businesses, financial condition and results of operations.
Cyber-attacks may damage our networks or breach customer and other proprietary data, leading to service disruption, harm to reputation, loss of customers, and litigation over privacy violations.
All industries that rely on technology in customer interactions are increasingly at risk for cyber-attacks. A cyber-attack could be levied against our network, causing disruption of operations and service, requiring implementation of greater network security measures, and resulting in lost revenue due to lost service. A cyber-attack could also be targeted to infiltrate customer proprietary and other data, breaching customer privacy, resulting in misuse of customer information and other data, and possibly leading to litigation over privacy breaches and causing harm to the Company’s reputation. In the event of a cyber-attack, Company insiders could utilize their knowledge of such an attack in trading the Company’s publicly traded shares. We rely on a variety of procedures to guard against cyber-attacks, and to take appropriate actions in the event of a cyber-attack, but the frequency of threats from these attacks is growing globally and the risk to us is also growing.
Pension Plans
We may incur substantial and unexpected liabilities arising out of our pension plans.
Our pension plans could result in substantial liabilities on our balance sheet. These plans and activities have and will generate substantial cash requirements for us and these requirements may increase beyond our expectations in future years based on changing market conditions. The difference between projected plan obligations and assets, or the funded status of the plans, is a significant factor in determining the net periodic benefit costs of our pension plans and the ongoing funding requirements of those plans. Changes in interest rates, mortality rates, health care costs, early retirement rates, investment returns and the market value of plan assets can affect the funded status of our defined benefit pension and cause volatility in the net periodic benefit cost and future funding requirements of the plans. In the future, we may be required to make additional contributions to our defined benefit plan. Plan liabilities may impair our liquidity, have an unfavorable impact on our ability to obtain financing and place us at a competitive disadvantage compared to some of our competitors who do not have such liabilities and cash requirements.
Our most significant pension plan is the AEPF in which we participate on behalf of substantially all of our employees. The AEPF is a multi-employer pension plan to which we make fixed, per employee, contributions through our collective bargaining agreement with the IBEW, which covers our IBEW represented workforce, and a special agreement, which covers most of our non-represented workforce. Because our contribution requirements are fixed, we cannot easily adjust our annual plan contributions to address our own financial circumstances. Currently, this plan is not fully funded, which means we may be subject to increased contribution obligations, penalties, and ultimately, we could incur a contingent withdrawal liability should we choose to withdraw from the AEPF for economic reasons. Our contingent withdrawal liability is an amount based on our pro-rata share among AEPF participants of the value of the funding shortfall. This contingent liability becomes due and payable by us if we terminate our participation in the AEPF. Moreover, if another participant in the AEPF goes bankrupt, we would become liable for a pro-rata share of the bankrupt participant’s vested, but unpaid, liability for accrued benefits for that participant’s employees. This could result in a substantial unexpected contribution requirement and making such a contribution could have a material adverse effect on our cash position and other financial results. These sources of potential liability are difficult to predict.
Given the complexity of pension-related matters we may not, in every instance, be in full compliance with applicable requirements.
Key Members of Senior Management
We depend on key members of our senior management team; our performance could be adversely impacted if they depart and we cannot find suitable replacements.
Our success depends largely on the skills, experience and performance of key members of our senior management team as well as our ability to attract and retain other highly qualified management and technical personnel. There is competition for qualified personnel in our industry and we may not be able to attract and retain the personnel necessary for the development of our business. Our remote location also presents a challenge to us in attracting new talent. If we lose one or more of our key employees, our ability to successfully implement our business plan could be materially adversely affected. We do not maintain any “key person” insurance on any of our personnel.
Future Acquisitions
Future acquisitions could result in operating and financial difficulties.
Our future growth may depend, in part, on acquisitions. To the extent that we grow through acquisitions, we will face the operational and financial risks that commonly accompany that strategy. We would also face operational risks, such as failing to assimilate the operations and personnel of the acquired businesses, disrupting their ongoing businesses, increasing the complexity of our business, and impairing management resources and management’s relationships with employees and customers as a result of changes in their ownership and management. Further, the evaluation and negotiation of potential acquisitions, as well as the integration of an acquired business, may divert management time and other resources. Some acquisitions may not be successful and their performance may result in the impairment of their carrying value.
Volatility Risks Related to our Common Stock
Continued volatility in the price of our common stock could negatively affect us and our stockholders.
The trading price of our common stock has been impacted by factors, many of which are beyond our control, including actual or anticipated variations in quarterly financial results, changes in financial expectations by securities analysts and announcements by our current and future competitors of significant acquisitions, strategic partnerships, joint ventures or capital commitments. In addition, our financial results in the future may be below the expectations of securities analysts and investors. Broad market and industry factors could also negatively affect the price of our common stock regardless of our operating performance. Future volatility in our stock price could materially adversely affect the trading market and prices for our common stock as well as our ability to issue additional securities or to secure additional financing.
Declines in our Market Capitalization or Share Price
Declines in our market capitalization or share price may affect our ability to access the capital markets.
Our ability to issue convertible notes is, in part, a function of our share price and market capitalization, as is our ability to be listed on a national stock exchange. To the extent either declines substantially, our ability to access the capital markets may be impaired.
Location Specific Risk
We operate in remote areas subject to geologic instability and other natural events which could negatively impact our operations.
Many of our operations are located in areas that are prone to earthquakes, fires, and other natural disturbances. Many of these areas have limited emergency response assets and may be difficult to reach in an emergency situation. Should an event occur, it could be weeks or longer before remediation efforts could be implemented, if they could be implemented at all. The scope and risk of such an event occurring is difficult to gauge.
Internal Control Over Financial Reporting
Our internal control over financial reporting may not be effective, which could cause our financial reporting to be unreliable.
Because of its inherent limitations, and irrespective of the existence of material weaknesses, our internal control over financial reporting may not prevent or detect all misstatements. Also, projections of any evaluation of effectiveness to future periods are subject to the risk that such controls may become inadequate because of changes in conditions, or the degree of compliance with policies and procedures may deteriorate. Any of these circumstances could cause our financial reporting to be unreliable.
|
Market for Registrant’s Common Equity, Related Stockholder Matters and Issuer Purchases of Equity Securities |
Our common stock is traded on the Nasdaq Global Select Market under the symbol ‘ALSK.’ The following table presents, for the periods indicated, the high and low sales prices of our common stock as reported by Nasdaq.
|
2017 Quarters |
High |
Low |
2016 Quarters |
High |
Low |
||||||||||||
|
4th |
$ | 2.91 | $ | 2.04 |
4th |
$ | 1.80 | $ | 1.49 | ||||||||
|
3rd |
$ | 2.48 | $ | 2.02 |
3rd |
$ | 1.85 | $ | 1.64 | ||||||||
|
2nd |
$ | 2.61 | $ | 1.76 |
2nd |
$ | 1.97 | $ | 1.64 | ||||||||
|
1st |
$ | 1.96 | $ | 1.60 |
1st |
$ | 1.90 | $ | 1.30 | ||||||||
As of April 25, 2018, there were 53,110,320 shares of our common stock issued and outstanding and approximately 342 record holders of our common stock. Because brokers and other institutions hold many of our shares of existing common stock on behalf of stockholders, we are unable to estimate the total number of stockholders represented by these record holders.
Dividends
In the fourth quarter of 2012, our Board of Directors suspended the quarterly dividend paid to stockholders. The dividend suspension was required in connection with the amendment to our 2010 Senior Credit Facility as part of the AWN transaction. Under the terms of our 2017 Senior Credit Facility, payment of cash dividends on our common stock is not permitted until such time that the Company’s Net Total Leverage Ratio is not more than 2.75 to 1.00 and certain other liquidity measures are met. See “Item 7, Management’s Discussion and Analysis of Financial Condition and Results of Operations” in the Original Form 10-K.
Our Net Total Leverage Ratio was higher than 2.75 at December 31, 2017.
Our ability to re-institute dividend payments in the future will depend on future competitive market and economic conditions and financial, business, regulatory and other factors, many of which are beyond our control.
Additional factors that may affect our future dividend policy include:
|
● |
our reliance on dividends, interest and other payments, advances and transfer of funds from our subsidiaries to meet our debt service and pay dividends, if any; |
|
● |
reductions in the availability of cash due to changes in our operating earnings, working capital requirements and anticipated cash needs; |
|
● |
the discretion of our Board of Directors; and |
|
● |
restrictions under Delaware law. |
Notably, nothing requires us to declare or pay dividends. Our stockholders have no contractual or other legal right to dividends.
See “Item 1A, Risk Factors—Volatility Risks Related to our Common Stock.”
Securities Authorized for Issuance under Equity Compensation Plans
The information set forth in this Report under “Item 12, Security Ownership of Certain Beneficial Owners and Management and Related Stockholder Matters—Securities Authorized for Issuance under Equity Compensation Plans” is incorporated herein by reference.
Common Stock Performance Graph
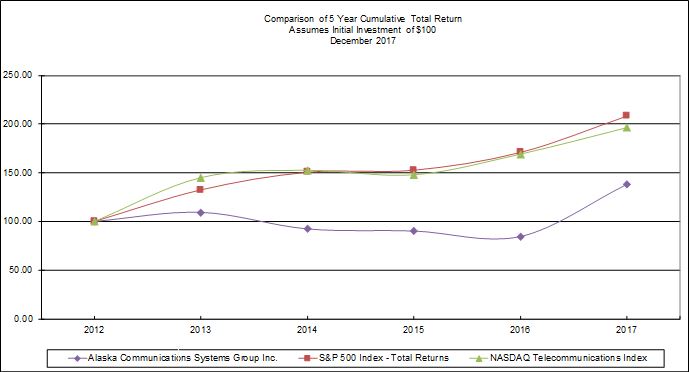
The following line graph compares the cumulative total stockholder return on our common stock from December 31, 2012 through December 31, 2017 with the cumulative total return of the S&P 500, and the cumulative total return of the Nasdaq Telecommunications Index. The graph assumes an initial investment of $100 in our common stock and in each of the S&P 500, and Nasdaq Telecommunications indices on December 31, 2012, and assumes that dividends, if any, were reinvested.
|
2012 |
2013 |
2014 |
2015 |
2016 |
2017 |
||||||||||||||||||||
|
Alaska Communications Systems Group Inc. |
Cum $ |
100.00 | 109.28 | 92.27 | 90.21 | 84.54 | 138.14 | ||||||||||||||||||
|
S&P 500 Index - Total Returns |
Cum $ |
100.00 | 132.39 | 150.51 | 152.59 | 170.84 | 208.14 | ||||||||||||||||||
|
NASDAQ Telecommunications Index |
Cum $ |
100.00 | 145.01 | 152.49 | 147.88 | 169.11 | 196.34 | ||||||||||||||||||
|
DIRECTORS, EXECUTIVE OFFICERS AND CORPORATE GOVERNANCE |
Board of Directors
|
Edward (Ned) J. Hayes, Jr. Chairman of the Board of Directors Age: 63 Director Since: 2006 Elected Chairman April 2011 Alaska Communications Committees • Audit |
Skills, Qualifications and Factors |
Mr. Hayes is currently a private investor in, and consultant to, the high-tech industry. In January of 2015, he announced his retirement as Senior Vice President and Chief Financial Officer (“CFO”) of Aviat Networks, Inc. (Nasdaq: AVNW) a leading company in wireless transmission and networking solutions for the mobile and non-mobile markets. He joined Aviat Networks in October of 2011 after serving as the CFO of Pillar Data Systems, Inc., a privately held enterprise data storage company. Prior to joining Pillar, Mr. Hayes served as Executive Vice President and CFO of Quantum Corporation (NYSE: QTM), a global leader in data back-up, recovery and archive storage. He joined Quantum after serving as President and Chief Executive Officer (“CEO”) of DirecTV Broadband, Inc. Prior to DirecTV Broadband, Mr. Hayes served as Executive Vice President and CFO at Telocity, Inc. (Nasdaq: TLCT), and Financial Vice President and CFO in two of Lucent Technologies’ divisions, including the $20 billion global service provider business. He has also held senior financial management positions at other multinational companies such as Unisys Corporation (NYSE: UIS), Asea Brown Boveri (ABB), and Credit Suisse First Boston. Mr. Hayes is a Board Leadership Fellow with the National Association of Corporate Directors (“NACD”). He has previously served as an independent director and chair of the audit committee of New Wave Research, Inc. and as an independent director and chair of the audit committee of NPTest, Inc. Mr. Hayes has served as an advisor to the President and CEO of Super Micro Computer, Inc. (Nasdaq: SMCI) after having served the company as an independent director and chair of the audit committee. Mr. Hayes conducted his graduate studies in accounting and finance at New York University’s Stern Graduate School of Business and received his undergraduate degree in Philosophy from Colgate University in New York.
|
Margaret L. Brown Director Age: 68 Director Since: 2012 Alaska Communications Committees • Compensation and Personnel • Nominating and Corporate Governance |
Skills, Qualifications and Factors |
Ms. Brown held the position of president and CEO of CIRI, an Alaska Native Regional Corporation, from 2005 to 2013. In her position as CEO, Ms. Brown led the corporation through significant growth by diversifying its interests across several industries, including real estate, energy and infrastructure, hospitality, oil field support and construction, and environmental services. During her more than 35 years at CIRI Ms. Brown also held several management positions within CIRI. Ms. Brown worked with state and federal agencies, as well as the U.S. Congress, to help implement the Cook Inlet Land Exchange, widely considered one of the largest land exchanges in the nation’s history. Ms. Brown currently serves on the boards of the CIRI, Student Conservation Association and the National Museum of the American Indian. Ms. Brown is a member of an advisory board for Alaska Airlines. Her leadership in Alaska has been recognized with the Alaska Journal of Commerce’s Business Person of the Year in 2013, an Athena Award in 2012, the fDi Magazine business personality of the year award in 2008, and the Alaska Business Hall of Fame laureate honor in 2009. Ms. Brown holds a BS degree in biology from the University of Oregon and a MBA degree in business administration from the University of Colorado. She is also a Board Leadership Fellow with the NACD. Ms. Brown is a lifelong Alaskan of Yup’ik descent and was raised in Takotna, a small village in central Alaska.
|
David W. Karp Director Age: 51 Director Since: 2011 Alaska Communications Committees • Compensation and Personnel • Nominating and Corporate Governance (Chair) |
Skills, Qualifications and Factors • experience as the CEO of a business expanding into the contiguous 48 states; |
Mr. Karp is the president and CEO of Northern Aviation Services, Inc., an Anchorage based company that manages Northern Air Cargo, Aloha Air Cargo, and various other aviation related businesses. The company operates a fleet of Boeing 737 aircraft within the states of Alaska and Hawaii, the contiguous U.S. states, Canada and Mexico. Mr. Karp previously served as the Vice President and Chief Operating Officer of Anchorage-based Hawaiian Vacations. Prior to that, Mr. Karp served as the executive director of the Alaska Tourism Marketing Council, overseeing the cooperative tourism marketing efforts between the State of Alaska and over 1000 private sector tourism businesses. Mr. Karp also serves as a member of the board of directors for Anchorage based Northrim Bankcorp, Inc. (Nasdaq: NRIM). He serves as the board chairman of the National Air Carriers Association, is a member of the Board of Trustees for the Alaska Aviation Museum, a board member of the Anchorage Economic Development Corporation and is involved in multiple nonprofit organizations in the community. Mr. Karp is a graduate of the University of Oregon, and he completed the Owner President Manager Program at the Harvard School of Business in March 2011. Mr. Karp is also a Board Leadership Fellow with the NACD.
|
Peter D. Ley Director Age: 58 Director Since: 2008 Alaska Communications Committees • Audit (Chair) • Nominating and Corporate Governance |
Skills, Qualifications and Factors |
Mr. Ley is currently a private investor. In June 2015, he retired from the position of CFO of Hargray Holdings, LLC, a provider of cable television and telecommunications services serving the coastal regions of South Carolina and Georgia. He held this position from 2012 to 2015. Prior to joining Hargray, Mr. Ley served as CFO of Connexion Technologies, an operator of residential communications networks for gated communities and high-rise towers. In April of 2012, Connexion filed for voluntary reorganization under Chapter 11 of the U.S. Bankruptcy Code. Prior to joining Connexion in November 2007, Mr. Ley served for seven years as a managing director at Bank of America Securities, responsible for managing client relationships with the U.S. telecommunications industry. Prior to joining Bank of America, he served as CFO of Pennsylvania-based Commonwealth Telephone Enterprises, Inc. Mr. Ley has also served as an investment banker at Dominick & Dominick, Furman Selz, Robert Fleming, Morgan Grenfell and Salomon Brothers. Mr. Ley holds an MBA from Harvard University in Massachusetts and a BA from Dartmouth College in New Hampshire.
|
Brian A. Ross Director Age: 60 Director Since: 2011 Alaska Communications Committees • Audit • Compensation and Personnel (Chair) |
Skills, Qualifications and Factors |
Mr. Ross is both the Principal of Mid-Market Growth Partners, which assist clients to align their strategic objectives with operating performance, and an Advisor with The Center for Business Transition at RSM, LLP. The Center for Business Transition helps owners plan to successfully transition their businesses. Previously, Mr. Ross served as President and CEO of KnowledgeWorks, an educational non-profit that provides innovative teaching pedagogies, and as the Chief Operating Officer (“COO”) and CFO as part of his 13-year-tenure at Cincinnati Bell. He is also a member of the board of Otelco, Inc. (Nasdaq: OTEL), a telecommunications firm with rural properties. Mr. Ross served as a member of the board of directors of Healthwarehouse.com (OTCQB: HEWA), a national, on-line pharmacy from September 2015 to March 2016, and as a member of the board of Journal Media Group, Inc. (formerly NYSE: JMG), from its inception in April 2015 to its sale to Gannett in April 2016. Mr. Ross holds a BA in economics, mathematics and statistics from Miami University as well as an MA in statistics from the University of California.
|
Anand Vadapalli President and Chief Executive Officer Age: 53 Director Since: 2011 |
Skills, Qualifications and Factors |
Mr. Vadapalli was appointed by the Board, effective February 1, 2011, to serve as President and CEO of the Company. Prior to that, Mr. Vadapalli served as Executive Vice President and COO of the Company beginning October 26, 2009, with responsibility for all operational facets of our business, including network operations, technology, sales and service. Mr. Vadapalli served as our Executive Vice President, Operations and Technology, from December 2008 until October 2009 and previously was our Senior Vice President, Network & Information Technology beginning in August 2006, when he joined the Company. Before joining us, Mr. Vadapalli had most recently served as Vice President of Information Technology at Valor Telecom since February 2004. Prior to Valor, from January 2003 to February 2004, he served as Executive Vice President and Chief Information Officer at Network Telephone Corporation, and from January 1996 through January 2003, he served in various positions at Broadwing / Cincinnati Bell, including as Vice President, Information Technology. Mr. Vadapalli holds a Bachelor of Engineering in Mechanical Engineering from Osmania University in Hyderabad, India as well as a Post Graduate Diploma in Management from the Indian Institute of Management in Calcutta, India. He currently serves as a member of the board of directors of Premera Blue Cross. In addition, Mr. Vadapalli is an active participant in industry associations, and currently chairs the Board of USTelecom Association.
Executive Officers
The table below sets forth certain information as of April 25, 2018 about those persons currently serving as executive officers of the Company. Biographical information on Anand Vadapalli, our President and CEO, is included above in the section “Board of Directors.”
|
Name |
Age |
Title |
|
Anand Vadapalli |
53 |
President and Chief Executive Officer |
|
Laurie M. Butcher |
55 |
Senior Vice President, Finance |
|
William H. Bishop |
52 |
Senior Vice President, Business Market |
|
Randy M. Ritter |
58 |
Senior Vice President, Shared Services |
|
Leonard A. Steinberg |
64 |
Senior Vice President, Legal, Regulatory & Government Affairs and Corporate Secretary |
Laurie M. Butcher serves as our Senior Vice President, Finance, leading the Company’s revenue, treasury and finance departments. Ms. Butcher joined Alaska Communications in 1997, and has served in several leadership roles, most recently as Vice President, Finance and Controller, before taking her current role in November of 2015. She is responsible for accounting, budgeting, and forecasting for Alaska Communications, in addition to leading strategy for free cash flow growth and EBITDA margin expansion. Ms. Butcher brings more than 28 years of finance expertise to Alaska Communications, including roles in public accounting at PricewaterhouseCoopers and Deloitte & Touche and as controller for Teamsters Local 959. Ms. Butcher serves as a management trustee for the Alaska Electrical Trust Pension Fund and is on the board of directors for the United Way of Anchorage. A lifelong Alaskan, she holds a BBA degree in accounting from the University of Alaska and is a licensed Certified Public Accountant.
William H. Bishop serves as our Senior Vice President, Business Market. He joined Alaska Communications in August of 2004, and has served in several leadership roles for both consumer and business sales and operations. Mr. Bishop provides executive level leadership to IT services, business sales, product and marketing to provide a consistent, quality customer experience. Mr. Bishop has over 25 years of experience in telecommunications and business leadership including positions at AT&T and McCaw Communications as well as at a federal government logistic contracting company. He serves on the board of directors for the Alaska State Chamber of Commerce and as chairman of the board for Alaska Business Week. Mr. Bishop holds a BS degree in Natural Sciences from the University of Alaska Anchorage and is completing his MBA in Strategic Leadership at Alaska Pacific University.
Randy M. Ritter serves as our Senior Vice President, Shared Services. Mr. Ritter joined Alaska Communications in September of 2013 to lead our growth in managed IT services and now oversees network strategy and planning, engineering, service activation, network management, field services and capital project management to provide a great customer service experience for Alaska businesses and consumers. He brings more than 20 years of telecommunications experience to the Company and previously served as Vice President, Product Management at Sprint, Vice President, Product Marketing at Sprint-Nextel, Senior Vice President, Sales and Marketing at One Communications and Chief Operating Officer at MacroSolve, Inc. His expertise and strong track record in building teams and defining, launching and growing telecommunications and IT services brings great value to our customers, employees and stockholders. Mr. Ritter holds a BS degree in accounting from the University of South Alabama. He is also a Certified Public Accountant (inactive) and a Chartered Global Management Accountant.
Leonard A. Steinberg serves as our Senior Vice President, Legal, Regulatory and Government Affairs and Corporate Secretary. Mr. Steinberg is responsible for the Company’s legal affairs, corporate governance, regulatory compliance and risk management functions. He also serves as the Company’s Chief Ethics Officer. He previously served as our Vice President, General Counsel and Corporate Secretary from 2001 through 2011 after joining us as a senior attorney in June 2000. From 1998 to 2000, Mr. Steinberg used his expertise in regulatory and administrative law to represent telecommunications and energy clients at Brena, Bell & Clarkson, P.C., an Anchorage, Alaska law firm. Prior to that, Mr. Steinberg was a partner in the firm of Hosie, Wes, Sacks & Brelsford with offices in Anchorage, Alaska and San Francisco, California. Mr. Steinberg practiced in the firm’s Anchorage office from 1996 to 1998 and in the firm’s San Francisco office from 1988 to 1996 where he primarily represented large clients in oil and gas royalty and tax disputes. Mr. Steinberg holds a JD degree from the University of California’s Hastings College of Law, an MPA from Harvard University’s Kennedy School of Government, an MBA from the University of California Berkeley’s Haas School of Business, and a BA degree from the University of California at Santa Cruz.
Section 16(a) Beneficial Ownership Reporting Compliance
Federal securities laws require executive officers, directors, and owners of more than 10% of our common stock to file reports (Forms 3, 4 and 5) with the SEC and any stock exchange or trading system on which our securities are listed. These reports relate to the number of shares of our common stock that each such person owns and any change in their ownership. Based solely on our review of Forms 3, 4 and 5 filed with the SEC, we believe that all persons required to file such forms have done so in a timely manner during 2017.
Corporate Governance
The Board is committed to strong corporate governance and believes it supports our success and helps us build long-term stockholder value. We have adopted a Code of Ethics that applies to all employees, including the CEO and President, the Senior Vice President of Finance, and directors. We have also adopted Corporate Governance Principles and Guidelines, that in conjunction with our Bylaws and charters of the committees of the Board form the framework of our corporate governance. The Board periodically reviews these governance documents as well as the rules, regulations and listing standards, and best practices suggested by recognized governance authorities. Our Corporate Governance documents are all available on our website at www.alsk.com under Corporate Governance. We will post amendments to, or waivers from, the provisions, if any exist, applicable to our directors and executives on the same website. You can also obtain a printed copy of our Code of Ethics, Corporate Governance Principles and Guidelines and committee charters at no charge by sending inquiries to investors@acsalaska.com or Investor Relations, 600 Telephone Avenue, Anchorage, Alaska 99503.
The Board conducts a self-evaluation of its performance annually that includes a review of the Board’s composition, responsibilities, leadership, committee structure, processes and effectiveness. Each committee of the Board conducts a similar self-evaluation with respect to that committee. The Board has a standing Audit Committee, which consists of Mr. Ley (Chair), Mr. Hayes and Mr. Ross. The Board had determined that Mr. Ley, Mr. Hayes and Mr. Ross each qualify as “audit committee financial experts” as defined under the Securities Exchange Act of 1934, as amended.
|
EXECUTIVE COMPENSATION |
Compensation Discussion and Analysis
Message From The Compensation Committee
In 2017 we implemented a number compensation plan design changes with the purpose of strengthening our overall plan design and more closely aligning it to stockholder returns. These modifications supplement many of the strong governance practices such as alignment to our strategic plan, performance compensation clawbacks, minimum equity holding requirements, and double-trigger mechanism for change of control accelerated awards previously incorporated into our plan design.
As noted in our 2017 Proxy Statement, we introduced changes we were considering for our 2017 compensation program in response to stockholder concerns expressed following our 2016 Say-on-Pay vote. We delayed making grants under our 2017 long-term incentive plan to further consider the perspective of our stockholders and to incorporate the input of our new director who was recommended to our Board by one of our larger stockholders. As we reviewed the results of our Say-on-Pay vote in 2017, it was clear that additional changes were needed. Following the 2017 Annual Meeting, we engaged in extensive discussions with stockholders in 2017 and 2018 to discuss stockholder concerns as reflected in our 2017 Say-on-Pay results and stockholder input into potential compensation design approaches to address those concerns. Between the summer of 2017 and spring of 2018, we contacted 20 stockholders representing approximately 40% of our shares outstanding. Of those we contacted, we met with stockholders representing approximately 27% of shares outstanding. The Chairman of our Board, CEO, and/or the Chairman of our Compensation and Personnel Committee participated in each of our stockholder meetings. Our stockholders raised a few common themes in our meetings, including the following:
|
• |
A perception that the Company’s CEO receives too much compensation relative to peers |
|
• |
A perception that the Company is granting too much equity at low share prices, which dilutes stockholders and rewards executives with underpriced stock |
|
• |
A perception that Net Promoter Score® (NPS)1 is an inappropriate metric for the Company’s long-term incentive plan |
|
• |
A perception that the existing executive incentive plans do not sufficiently incentivize management to seek strategic alternatives for the Company during a period of consolidation within the telecommunications industry |
To address the views expressed by our stockholders in both 2017 and 2018, we made substantive changes to the 2017 compensation program described in the following chart. In addition, one of our largest stockholders signed a non-disclosure agreement in order to give significant feedback on executive compensation during a number of meetings with our Compensation Committee Chair, Brian A. Ross, and our Chief Executive Officer, Anand Vadapalli. These meetings involved approximately six hours in direct meeting time, including two visits to the stockholder’s location by Mr. Ross. More detail on our stockholder engagement can be found on page 27.
1 NPS, a measure of customer satisfaction, is determined through customer satisfaction surveys, conducted and reported by a third-party vendor, that ask business customers, on a scale from zero to ten, how likely they are to recommend Alaska Communications to a friend or colleague. For more information on NPS, see Non-GAAP Financial Measures and Performance Metrics on page 36.
A summary of the changes we made to improve our executive compensation program in 2017 and how we believe these changes address concerns expressed by stockholders follows:
|
Change |
Reason for Change |
|||
|
We reduced the restricted stock unit (“RSU”) awards granted by 9% by valuing these awards at a premium price. For example, Mr. Vadapalli’s target RSU award was $625,050 and the fair market value of our shares on the date of grant was $2.28. If we used the actual fair market value, we would have granted Mr. Vadapalli 274,146 shares. However, we used a premium $2.50 per share price in determining the number of shares underlying the RSU award, which resulted in granting Mr. Vadapalli 250,020 shares. |
• •
• |
Reduces stockholder dilution. Requires an increase in stock price to earn the target long-term incentive award value. Reduces the target compensation awarded to our CEO and other NEOs relative to 2016. |
||
|
Provided for vesting at the end of the full multi-year performance period for Performance Share Unit (“PSU”) awards that would extend the performance period from the current one-year periods. |
• |
Extends the performance period to provide a longer-term incentive and better align long-term incentive payout with long-term value creation. |
||
| • | Adds additional retention incentive. | |||
|
Replaced Adjusted Operating Cash Flow with Adjusted Free Cash Flow Per Share as a metric for 50% of long-term PSU awards. |
• |
We believe that cash flow growth is a significant determinant of long-term stockholder value creation. The updated metric additionally incentivizes management to make capital allocation decisions that maximize long-term stockholder value. |
||
|
Included relative Total Stockholder Return as a metric for 50% of long-term PSU awards and set the target above median performance for the Russell 2000 Index constituents. |
•
|
Aligns management compensation more closely with stockholder returns. |
||
| • | Recognizes the perceived low share price by requiring the Company to perform above median relative to the Russell 2000 Index constituents for NEOs to vest at target. | |||
|
Increased the minimum threshold for payout of annual cash incentives from 75% of the Adjusted EBITDA target to 90%. |
• |
Increases the threshold to receive payment of annual cash awards. |
||
|
Discontinued the use of Net Promoter Score as an incentive compensation measure for our long-term incentive program. |
• |
Although we compete on customer service as a differentiator, we made this change in direct response to stockholder feedback and will consider, in the future, other ways to incentivize employee behavior based on customer service outcomes. |
||
|
Modified the individual NEO performance metric in our annual cash incentive plan to be multiplicative rather than an additive factor to the company financial performance. |
• |
This requires company financial performance to be preeminent to an individual’s performance and restricts payout for individual performance if the company does not achieve its annual financial goals. |
||
Additionally, as our stockholders will note, our CEO’s compensation for 2017 is significantly lower than 2016 levels. This reduction reflects both a) the subsequent influence of the significant deleveraging accomplished by the sale of wireless operations in early 2015 and b) the inconsistent year-to-year affects upon reported compensation in the Summary Compensation Table related to the changing from cash to equity awards. As we expected, 2017 compensation levels reflect compensation more directly tied to the operational performance of the company.
We appreciate your ongoing engagement, feedback and support. Please contact us through Alaska Communications Investor Relations, Attention: Compensation Committee, 600 Telephone Ave. MS 65, Anchorage, AK 99507 or by email – investors@acsalaska.com.
|
Brian A. Ross |
|
Margaret L. Brown |
|
David W. Karp |
|
(Committee Chair) |
|
(Committee Member) |
|
(Committee Member) |
The focus of this Compensation Discussion and Analysis, or CD&A, is on our compensation philosophies and programs for our Named Executive Officers, or NEOs, and the positions they held in 2017.
For 2017, the following executive officers are NEOs:
|
NAME |
|
TITLE |
|
|
Anand Vadapalli |
|
President and Chief Executive Officer |
|
|
Laurie M. Butcher |
|
Senior Vice President, Finance |
|
|
William H. Bishop |
|
Senior Vice President, Business Market |
|
|
Randy M. Ritter |
|
Senior Vice President, Shared Services |
|
|
Leonard A. Steinberg |
|
Senior Vice President, Legal, Regulatory & Government Affairs and Corporate Secretary |
This CD&A is organized into five sections:
|
• |
Executive Summary |
|
• |
Stockholder Input on Executive Compensation |
|
• |
Executive Compensation Program Philosophy and Objectives |
|
• |
2017 Executive Compensation Program Elements |
|
• |
Compensation Governance |
Executive Summary
Over the past three years, we have evolved from a wireline and wireless telecommunications provider to a fiber based broadband and managed IT services provider focused primarily on business and wholesale customers in and out of the state of Alaska. We also provide telecommunications services to businesses and consumers throughout the state.
We design our executive incentive compensation plans to align with both our strategic goals and with our stockholders. We believe that success in executing on our strategic and operating goals will lay the foundation for us to deliver consistent, long-term value to our stockholders. In this context, the annual incentive plan for 2017 included two financial metrics, Total Revenue and Adjusted EBITDA. These metrics focus our NEOs on delivering current period profitability while concurrently growing our top-line revenue for continued, future profitability growth. Our long-term incentive program has historically provided for awards that vest in three subsequent years. The awards we granted in 2015 and 2016 each included tranches that partially vested based on 2017 performance. Each of these long-term incentive awards included two metrics, Adjusted Operating Cash Flow and Net Promoter Score. The cash flow metric reflects our fundamental belief that cash flow drives stockholder value and also provides internally generated funds for investment as we transition to a fiber broadband and managed IT provider and to enhance stockholder value. Although for 2017 we have eliminated Net Promoter Score as a metric in the long-term plan in response to stockholder feedback, it was included in the 2015 and 2016 plan design to focus our NEOs on our customer experiences because we believe that a positive experience by our customers will differentiate us from competitors in our market.
The long-term incentive plan established in 2017 includes PSUs based 50/50 on measures of relative Total Stockholder Return and Adjusted Free Cash Flow per Share. As noted in our introductory message, we have included Total Stockholder Return to more closely align executive compensation with actual stockholder returns and thus to our stockholders. We also believe that including Adjusted Free Cash Flow per Share as a metric improves the linkage to stockholder value creation by encouraging cash flow generation through efficient allocation of capital. Awards under this plan will vest, if earned, in 2020 based on performance over the entire period.
The following charts show how we performed on the metrics we used for incentive compensation for 2017 performance. For purposes of comparison, the charts show how we performed with respect to each of these metrics in 2015 and 2016 as well.
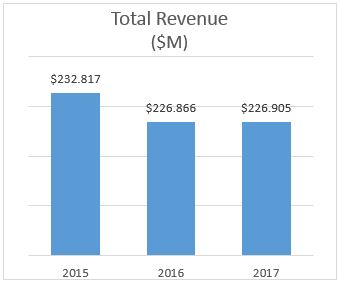 |
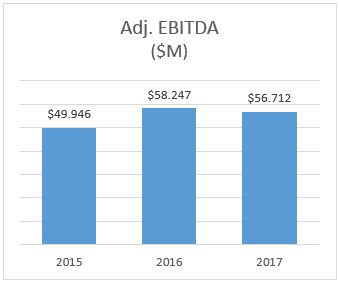 |
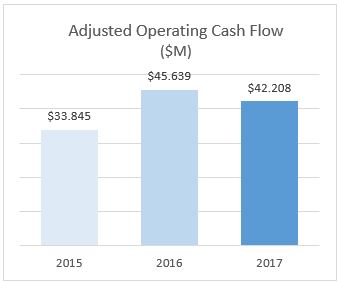 |
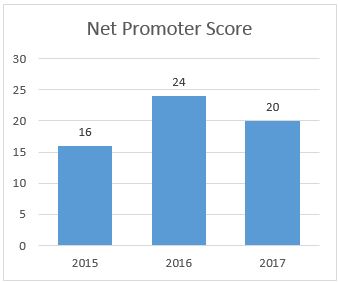 |
2017 Incentive Compensation
There were no annual cash incentive awards paid to NEOs based on 2017 performance. Although achievement was just above the minimum payout level for each of these performance measures, which would have resulted in a Company performance factor of just over 60%, the projected payout under that result would have resulted in pushing Adjusted EBITDA below the threshold for an annual incentive compensation payout. Based on December 31, 2017 results, a small amount would have been available for some reduced payouts, however the Compensation Committee exercised its negative discretion to eliminate any annual incentive compensation payouts based on 2017 performance. This decision to eliminate annual incentive compensation was triggered by the announcement by the Universal Service Administrative Company to further reduce funding levels for services we provide to rural healthcare providers.
Total Revenue and Adjusted EBITDA performance under our annual incentive plan are reflected in the chart below. While our broadband revenue performance has seen continued growth, Total Revenue performance was impacted primarily by lower funding levels for the rural health care program and declines in revenue related to voice services, equipment sales and regulatory revenue. Adjusted EBITDA was also impacted by higher network support costs and a charge of $2.6 million associated with the rural health care program.
|
Category |
|
Weight |
|
Performance Measures |
|
Target ($M) |
|
Achievement ($M) |
|
Annual Incentive |
|
50% |
|
Adjusted EBITDA |
|
$63.000 |
|
$56.712 |
|
|
50% |
|
Total Revenue |
|
$241.000 |
|
$226.905 |
The long-term incentive awards granted in 2015 partially vested. Only 1/3 of those awards for 2017 performance based on NPS exceeded the goal at the maximum payment level. Our performance related to AOCF did not meet the minimum level for vesting of PSUs tied to this performance measure. In addition to the previously noted items that affected Adjusted EBITDA performance, AOCF performance was impacted by an increase in cash interest expense triggered by our refinancing in 2017.
The long-term incentive awards granted in 2016 also partially vested with respect to 1/3 of those awards based on NPS performance. The goal for AOCF was the same for this grant and the 2015 grant, and our underperformance is explained above. The Compensation Committee increased the NPS goal under the 2016 grant relative to the 2015 grant, increasing the rigor, and our performance was below target.
|
Category |
|
Weight |
|
Performance Measures |
|
Target ($M) |
|
Achievement |
|
Long-Term Incentive |
|
67% |
|
AOCF |
|
$54.900 |
|
$42.208 |
| 2015 Grants |
|
33% |
|
NPS |
|
15 |
|
20 |
|
|
|
|
|
|
|
|
|
|
|
Long-Term Incentive |
|
67% |
|
AOCF |
|
$54.900 |
|
$42.208 |
| 2016 Grants |
|
33% |
|
NPS |
|
22 |
|
20 |
For more information about our business, please see the sections “Business” and “Management’s Discussion and Analysis of Financial Condition and Results of Operations” in our Annual Report on Form 10-K for the year ended December 31, 2017.
2017 Plan Highlights
Consistent with the Company’s compensation philosophy, described in more detail beginning on page 28, the Compensation Committee made the following compensation decisions in 2017:
|
• |
Base salaries. Base salary levels for 2017 remained consistent with prior years for our NEOs other than Mr. Ritter, who received a 6% increase based on his leadership in creating improved governance process over our capital budget and savings in costs and Mr. Bishop who received a 10% increase because of the strong sales results and reflecting his increased responsibility and demonstrated leadership of the strategically important business and wholesale market segment. |
|
• |
Annual Incentive Awards. While target levels remained unchanged, we increased the minimum threshold for payout from 75% to 90% of the Adjusted EBITDA goal. |
|
• |
Long-Term Performance Incentive Awards. The Compensation Committee established performance metrics based on cash flow and relative Total Stockholder Return (“TSR”) for long-term performance stock unit awards reflecting strategic goals for the Company and further aligning incentive compensation with the return to our stockholders. These awards will vest if earned in 2020 based on performance over the entire period. |
|
• |
Long-Term Retention Incentive Awards. The Compensation Committee determined the number of restricted stock unit awards to grant to each NEO using a share price above market to reduce dilution, preserve shares in the Incentive Award Plan, and further link executives’ incentive compensation with increased stockholder returns. |
Compensation Governance Practices
Among other items described in the CD&A, we believe the following key features help ensure our compensation practices are consistent with good governance standards.
|
What We Do |
|
What We Don’t Do |
||||
| • | Multiple Performance Metrics for Both Short-Term and Long-Term Incentives | • | Guaranteed or Non-Performance-Based Bonuses or Salary Increases | |||
| • | Stock Ownership Requirements for all NEOs | • | Single Trigger Change in Control Benefits | |||
| • | Independent Compensation Consultant | • | Special Executive Retirement or Benefit Packages | |||
| • | Compensation Risk Review | • | Hedging or Pledging of Company Stock | |||
| • |
Limited Perquisites |
|
• |
Tax Gross-ups |
||
| • | Incentive Compensation “Clawback” Reimbursement | |||||
Stockholder Input on Executive Compensation
Our Company’s 2017 “Say-on-Pay” Vote
At our 2017 Annual Meeting, we conducted our annual non-binding advisory “Say-on-Pay” vote. A majority of our stockholders, or 66.1% of votes cast (excluding broker non-votes and abstentions), supported our proposal to approve our 2016 executive compensation program.
Consistent with the stockholders’ advisory vote at the 2017 Annual Meeting, the Board determined that advisory votes on the Company’s executive compensation would continue to be held annually.
Stockholder Engagement
Although a primary focus for this past year has been related to feedback on compensation plan design and addressing our Say-on-Pay vote results, we engage in dialogue with stockholders because we believe that fostering long-term relationships with stockholders is an important objective. Our engagement team is comprised of senior leaders and three independent members of the Board, Edward J. Hayes, Board Chair Brian A. Ross, Compensation Committee Chair, and David W. Karp, Nominating and Corporate Governance Committee Chair, as well as our President and Chief Executive Officer, Anand Vadapalli. As discussed above on page 22, “Message from the Compensation Committee,” our engagement team participated in extensive discussion with certain of our stockholders following the 2017 Annual Meeting to discuss the Company’s business strategy, governance and compensation practices, and enacted changes to our 2017 compensation program to address stockholder concerns expressed in these discussions.
In addition to individual stockholder engagement, quarterly, we participate in industry conferences and conduct conference calls both telephonically and online to discuss financial results with stockholders. In 2017, we met with investors around the country, inside and outside Alaska, in Arizona, Illinois, Missouri, Virginia and New York. Our website at www.alsk.com provides contact information so stockholders can call, write or email us with questions.
In the first quarter of 2018, we engaged in 20 meetings with ten different stockholders either in person or by telephone. We will continue to seek opportunities for discussions with our stockholders on executive compensation and other matters of importance to the Company and our stockholders. We will also continue to participate in investor conferences, and will remain open for stockholders who wish to reach out to us.
Executive Compensation Program Philosophy and Objectives
The qualities, abilities, and commitment of our NEOs are significant contributing factors to the proper leadership of our Company and the driving force for the success of the Company’s strategic plan. The Compensation Committee believes that our compensation program is balanced and reasonable, and helps us achieve the objectives we have identified in the table below.
|
Objective |
|
Features of Compensation Program Aligned to Objective |
|
|
Attract and Retain Top Caliber Executives |
|
Base salaries, benefits packages, and award opportunities are designed to position us to compete effectively for executive talent and recognize the unique characteristics and challenges of our location in Alaska. |
|
|
Pay for Performance |
|
Our program emphasizes at-risk incentive award opportunities, both annual and long-term, tied to financial and market objectives. |
|
|
Stockholder Alignment |
|
We align the long-term financial interests of our NEOs and stockholders through performance share units and restricted stock units with multi-year vesting periods. Pursuant to stock ownership guidelines, NEOs own significant amounts of our stock throughout the term of their employment. |
Compensation Committee Oversight of the Executive Compensation Program
The Compensation Committee is responsible for overseeing the development and administration of our compensation and benefits policies and programs. The Compensation Committee devotes substantial time and attention throughout the year to executive compensation matters to ensure that our program aligns with our fundamental objectives. The Compensation Committee works with the Board as a whole to support the strategic plan they have established for the Company through the executive compensation program structure and goals.
The Compensation Committee is made up of three independent directors who are responsible for the review and approval of all aspects of our executive compensation program. The Compensation Committee’s responsibilities include oversight and review of the base salary, annual and long-term incentives, and benefit programs for the Company’s executive officers, including:
|
• |
Determination, review and approval of the Company’s incentive compensation plan goals and objectives; |
|
• |
Evaluation of individual performance results in light of the goals and objectives; |
|
• |
Evaluation of the competitiveness of individual total compensation packages; and |
|
• |
Approval of changes to and the payment of total compensation packages. |
The Compensation Committee considers the recommendation of the CEO in determining the compensation, individual performance goals and objectives for the executive officers who report directly to him. The CEO provides his assessment of each NEO’s responsibilities, performance and the performance of each NEO’s area of oversight. The Compensation Committee has the ultimate authority to approve or modify management’s recommended compensation packages. The Compensation Committee recommends the compensation package for our President and CEO for approval by all independent members of our Board.
Role of the Compensation Consultant. The Compensation Committee has the sole authority to select, retain and terminate compensation consultants as well as the sole authority to direct any compensation consultant’s work and approve fees. The Compensation Consultant advises the Compensation Committee in connection with its review of executive and director compensation matters, including the level of total compensation packages provided to executive officers. Korn Ferry Hay Group (Korn Ferry) has been the Compensation Committee’s independent executive compensation consulting firm since 2016. The compensation consultant attended meetings of the Compensation Committee, as requested, and communicated with the Compensation Committee Chair between meetings; however, the Compensation Committee makes all decisions regarding the compensation of our executives.
In connection with its engagement of Korn Ferry, the Compensation Committee considered various factors related to the independence of Korn Ferry as required by SEC regulations and Nasdaq rules. After reviewing these factors, the Compensation Committee determined that its engagement of Korn Ferry did not present any conflicts of interest that prevented Korn Ferry from providing compensation advice to the Compensation Committee.
Korn Ferry provides various executive compensation services to the Compensation Committee including advising the Compensation Committee on the principal aspects of our executive compensation program design and evolving trends as well as providing market information and analysis regarding the competitiveness of our program design and our award values in relationship to the Company’s performance. Total fees paid to Korn Ferry in 2017 in connection with its services for the Compensation Committee were $76,000; Korn Ferry did not receive any other compensation from the Company in 2017.
In benchmarking compensation paid to our NEOs and directors, the Compensation Committee worked with Korn Ferry in 2016 to develop two separate peer groups to determine the best market approaches to compensation. The primary peer group reviewed by Korn Ferry focused on companies within our industry -- including managed IT companies to reflect our focus on expanding in this business segment -- that fell within a specific range of the Company’s revenues and market capitalization while creating a balanced peer group in terms of profitability (Operating Income, Net Income, EBITDA, EBITDA Margin), cash flow, balance sheet assets (Total Assets, Total Debt) and market performance (3-Year TSR). The primary peer group was used to benchmark the amount of compensation paid to our NEOs and non-employee directors and the mix of pay for our NEOs for purposes of reviewing 2017 compensation decisions. The primary peer group included the following companies:
|
LICT Corp. |
|
Otelco, Inc. |
|
|
Hawaiian Telcom, Inc. |
|
General Communication, Inc. |
|
|
Broadview Networks, Inc. |
|
Internap Corp. |
|
|
Lumos Networks Corp. |
|
Limelight Networks, Inc. |
|
|
GTT, LLC |
|
NCI, Inc. |
|
|
Intelliquent, Inc. |
|
Ooma, Inc. |
|
|
ShoreTel, Inc. |
|
Fusion Telecommunications International, Inc. |
There has been significant consolidation in our industry and this impacted the peer group that the Compensation Committee approved in 2016. As a result of these changes, the Compensation Committee intends to revise this peer group in 2018. The following primary peers have been acquired or are expected to be acquired:
|
• |
Broadview Networks – Acquired by Windstream Holdings – July 2017 |
|
• |
General Communication – Expected to be acquired by Liberty Ventures – Q1 2018 |
|
• |
Hawaiian Telcom – Expected to be acquired by Cincinnati Bell – Q3 2018 |
|
• |
Intelliquent – Acquired by private equity firm, GTCR – February 2017 |
|
• |
Lumos Networks – Acquired by EQT Infrastructure – November 2017 |
|
• |
NCI – Acquired by private equity firm, HIG – August 2017 |
|
• |
ShoreTel – Acquired by Mitel – September 2017 |
In evaluating market incentive plan designs, the Compensation Committee worked with Korn Ferry to identify companies that have similar business models to the Company and/or that have similar capital allocation strategies to the Company. This secondary peer group includes telecommunications companies that do not emphasize wireless communications, but instead focus on and/or are expanding their managed IT/cloud offerings (primarily business to business) and do not pay dividends. The Compensation Committee did not use this secondary peer group to benchmark compensation levels, but rather reviewed the incentive plan structures. The Compensation Committee’s goal was to obtain data on short-term incentive and long-term incentive compensation practices to provide a data point as the Compensation Committee evaluated incentive plan design.
This secondary peer group was approved by the Compensation Committee in 2016 and included the following companies:
|
Windstream Holdings, Inc. |
|
LICT Corp. |
|
|
Frontier Communications Corp. |
|
Zayo Group Holdings, Inc. |
|
|
Cincinnati Bell Inc. |
|
Broadview Networks, Inc. |
|
|
General Communication Inc. |
|
Lumos Networks Corp. |
|
|
FairPoint Communications, Inc. |
|
Datalink |
|
|
Consolidated Communications Holdings, Inc. |
|
EarthLink Holdings Corp. |
|
|
Hawaiian Telcom, Inc. |
|
|
As with the primary peer group, the secondary peer group was impacted by consolidations subsequent to the Compensation Committee approving the peer group in 2016 and the Compensation Committee will be reconsidering its composition as well in 2018.The following secondary peers have been acquired in addition to those noted above:
|
• |
Datalink - Acquired by Insight Enterprises - January 2017 |
|
• |
EarthLink Holdings - Acquired by Windstream Holdings - February 2017 |
|
• |
FairPoint Communications - Acquired by Consolidated Communications - July 2017 |
2017 Executive Compensation Program Elements
The Compensation Committee chose a mix of cash and equity compensation for executive officers based on long-term value drivers of Company performance over one-year and multi-year periods, and also based on individual performance. Our executive compensation program is designed to reinforce the link between the interests of our executive officers and our stockholders. The table below provides a summary for each element of compensation for the 2017 program.
|
Elements |
Compensation Mix |
Key Characteristics |
Overview |
||
|
CEO |
Other NEOs (Average) |
||||
|
FIXED |
Base Salary |
21% |
40% |
Fixed compensation delivered in cash; Reviewed annually, and adjusted if and when appropriate. |
Base salaries are generally set based on the following factors: ● Nature and responsibility of position ● Qualifications, experience and expertise ● Competitiveness of the market ● Potential to drive Company success ● Individual performance and evaluation of peer group compensation ● Internal parity with peers in similar reporting structure and scope of responsibility |
|
VARIABLE |
Annual Cash Incentive (Performance Based) |
21% |
24% |
Annual performance-based opportunity delivered in cash. Based on Company performance and individual performance. |
● The target level of annual cash incentives for our NEOs was 60% of base salary except for our CEO, whose target is set at 100% of base salary. ● Metrics:
● Minimum threshold for any payout - 90% of Adjusted EBITDA goal. |
|
Performance Stock Units (Performance Based) |
29% |
18% |
Multi-year performance-based opportunity delivered in shares. Based on Company performance measured by financial and market goals. |
These long-term incentive awards are tied to Company performance through two measures. ● Adjusted Free Cash Flow per Share ● Relative TSR ● Cliff vesting if earned at the end of the performance period, 12/31/2019 Company must achieve threshold cumulative Adjusted EBITDA target for PSU awards to vest |
|
|
Restricted Stock Units (Time Based) |
29% |
18% |
Multi-year time-based opportunity delivered in shares. |
These long-term awards granted in 2017 vest ratably over three years beginning in 2018 generally, if the NEO remains continuously employed with the Company. The conversion price set by the Compensation Committee was above the then-current trading price. |
|
Annual Salary and Incentive Compensation
Base Salaries
Base salaries are set to compensate our NEOs fairly for the responsibility of the positions they hold. The following table shows base salary levels for each NEO for 2017 and 2016. As discussed elsewhere in this CD&A, for 2018, NEO base salaries were reduced as part of broader efforts to reduce cost structures and improve profitability.
|
Base Salary |
||||||||||||
|
(Annualized Rate) |
||||||||||||
|
Named Executive Officer |
2017 |
2016 |
% Change |
|||||||||
|
Anand Vadapalli |
$450,000 | $450,000 | 0% | |||||||||
|
Laurie M. Butcher |
$240,000 | $240,000 | 0% | |||||||||
|
William H. Bishop (1) |
$265,000 | $240,000 | 10% | |||||||||
|
Randy M. Ritter (2) |
$265,000 | $250,000 | 6% | |||||||||
|
Leonard A. Steinberg |
$288,000 | $288,000 | 0% | |||||||||
|
(1) |
Mr. Bishop received an increase in his base salary in 2017 because of the overall growth in business sales and reflecting his leadership of the strategically important business and wholesale market segment. |
|
(2) |
Mr. Ritter received an increase in his base salary in 2017 based on his leadership in creating an improved governance process over our capital budget and the realization of cost saving. |
Annual Cash Incentive Awards
The target level of annual cash incentives, as a percentage of base salary, for our NEOs has remained the same for several years and did not change in 2017. The annual cash incentive awards were based on Adjusted EBITDA and Total Revenue. The Compensation Committee believes the Adjusted EBITDA goal is an indicator of the Company’s overall success because it measures the effects of management’s actions at the current level of capital investments, capital structure, and intangible assets, which management cannot easily change in the short-term. The Total Revenue goal was selected because of its importance in generating future Adjusted EBITDA, and because it supports our belief in the market opportunity for business broadband as a key component of revenue. For information on how these metrics are calculated, see “Non-GAAP Financial Measures and Performance Metrics” on page 36.
Payout for annual cash incentive compensation under the program depends on reaching a minimum threshold of not less than 90% of the 2017 Adjusted EBITDA goal and may not exceed 150% of the annual target amounts.
For all NEOs, the annual incentive award calculation is as follows:
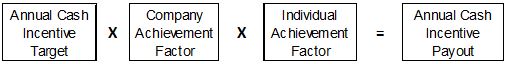
The following table includes the annual cash incentive metrics, and goals for the company performance portion of the awards ($ in Millions):
|
Performance Metrics/Weight |
Min - 50% Payout |
100 % Payout |
Max - 150% Payout |
Actual 2017 Performance |
Achievement Percentage |
|
90% of Goal |
100% of goal |
110% of goal |
|||
|
Adjusted EBITDA 50% |
$56.700 |
$63.000 |
$69.300 |
$56.712 |
50.1% |
|
Total Revenue 50% |
$216.900 |
$241.000 |
$265.100 |
$226.905 |
70.76% |
Performance Determination. The Company’s actual results for 2017 compared to the preset goals resulted in a Company achievement factor of 60.43%. The projected payout under that result would have resulted in pushing Adjusted EBITDA below the threshold for an annual incentive compensation payout. Based on December 31, 2017 results, a small amount would have been available for some reduced payouts, however the Compensation Committee exercised its negative discretion to eliminate any annual incentive compensation payouts based on 2017 performance. This decision to eliminate annual incentive compensation was triggered by the announcement by the Universal Service Administrative Company to further reduce funding levels for services we provide to rural healthcare providers.
Long-Term Incentive Compensation
The Compensation Committee finalized the long-term incentive compensation plan in the second half of 2017. Our long-term incentive compensation awards for 2017 were split between PSUs (52%) and RSUs (48%) as the result of lowering the target level of RSU awards relative to 2016 by using a premium $2.50 per share price to calculate the number of shares underlying the RSU award and not $2.28 per share, the actual fair market value of our shares on the date of grant, while maintaining the same target level of PSU awards relative to 2016.
|
2017 Long-Term Incentive Plan |
||||||||
|
Target Awards in Units |
||||||||
|
Named Executive Officer |
PSU (1) |
RSU |
||||||
|
Anand Vadapalli |
274,146 | 250,021 | ||||||
|
Laurie M. Butcher |
42,105 | 38,400 | ||||||
|
William H. Bishop |
46,491 | 42,400 | ||||||
|
Randy M. Ritter |
48,816 | 44,520 | ||||||
|
Leonard A. Steinberg |
63,158 | 57,600 | ||||||
|
(1) |
Units shown include awards approved by the Compensation Committee, but not granted in accordance with FASB ASC 718, and therefore excluded from the Summary Compensation Table, Grants of Plan Based Awards, and Outstanding Equity Awards tables. The number of units included here that are not included in the tables are as follows: Anand Vadapalli – 137,073, Laurie Butcher – 21,053, William Bishop – 23,246, Randy Ritter – 24,408, and Leonard Steinberg – 31,579. |
Performance Stock Units Granted in 2017
Long-term incentive awards granted in the form of PSUs in 2017 will vest, if earned, following the full performance period, July 1, 2017 to December 31, 2019, based on Company performance based on Adjusted Free Cash Flow per Share (50%) and relative TSR (50%). The Compensation Committee believes that having a multi-year performance period increases executive focus on our long-term business objectives and better aligns the interests of our executives with those of our stockholders. To better ensure that incentive plan awards are paid consistent with company operating performance, no level of long-term PSUs will vest unless a threshold level of $120,960,000 of cumulative Adjusted EBITDA is achieved for the period July 1, 2017 to December 31, 2019.
The Adjusted Free Cash Flow per Share measure is calculated as Adjusted Free Cash Flow divided by the weighted average shares outstanding on a fully diluted basis. For the initial period, July 1, 2017 to December 31, 2017, the Compensation Committee established a prorated goal for Adjusted Free Cash Flow per Share of $0.18. 2018 and 2019 performance goals will be set in the respective year, and goals and results will be averaged over the three periods (July 1, 2017 to December 31, 2017 prorated, and full years in 2018 and 2019) to determine achievement and vesting through the end of 2019. These PSU awards are not shown in the Summary Compensation Table, Grants of Plan Based Awards table, and the Outstanding Equity Awards table for 2017 because under FASB ASC 718, these awards will not be considered granted until final goals are established in 2019. The entire value of these PSU awards will appear in proxy tables for 2019 when final goals will be established by the Compensation Committee.
Relative TSR is measured against the Russell 2000 Index as constituted at the beginning of the performance period. We selected relative TSR as a metric for long-term executive compensation to directly address stockholder concerns about the alignment of pay and performance as measured by our stock price. To align management’s compensation with the Company’s stockholders and incentivize increasing stock price the Compensation Committee established a challenging target goal for the TSR metric, requiring the Company to achieve 60th percentile relative to the companies in the Russell 2000 Index to receive a target award.
For more information on these metrics, see “Non-GAAP Financial Measures and Performance Metrics” on page 36.
The following table shows the performance goals selected for long-term incentive compensation for the performance period, July 1, 2017 to December 31, 2019:
|
Performance Measure |
Weight |
Min - 50% Vesting |
Target 100 % Vesting |
Max - 150% Vesting |
|
Relative TSR |
50% |
40% |
60% |
80% |
|
Adj. Free Cash Flow/Share |
50% |
90% of Target |
TBD (1) |
110% of Target |
|
(1) |
The Adjusted Free Cash Flow per Share target for the second half of 2017 has been prorated and is set at $0.18. For the annual periods of 2018 and 2019 the targets will be set in those years. Targets and results will be averaged over the three periods to determine achievement and vesting in 2020. |
As shown in the preceding table, there is an incrementally lower vesting for achievement below goal and vesting is linear up to a maximum of 150% vesting for overachievement.
In establishing the PSU goals in 2017, the Compensation Committee delayed final approval of the grants until September 2017 pending input from our stockholders following our 2017 annual meeting and this resulted in a delay in our annual grants beyond the date that our Compensation Committee traditionally approves those grants. The Compensation Committee determined it was important to consider stockholder input as well as allowing time for our new director to provide input before approving PSU awards given the results of the Company’s say on pay votes in its 2016 and 2017 annual meetings.
Restricted Stock Units Granted in 2017
To provide a balance between long-term performance incentives and retention incentives, our NEOs were granted time-vested RSUs. However, the Compensation Committee added a premium to the stock price on the date of grant to arrive at a $2.50 per share price to calculate the number of shares awarded for the RSUs granted. This action by the Compensation Committee resulted in a reduction in the number of RSUs granted to NEOs in 2017 even though most salaries and the percentage of salary granted as RSUs remained the same as in 2016. For example, Mr. Vadapalli’s target RSU award was $625,050 and the fair market value of our shares on the date of grant was $2.28. If we used the actual fair market value, we would have granted Mr. Vadapalli 274,146 shares. However, we used a premium $2.50 per share price in determining the number of shares underlying the RSU award, which resulted in granting Mr. Vadapalli 250,020 shares. We used this same approach in granting RSUs to all eligible participants. The Compensation Committee also delayed final approval of RSU grants pending input from our stockholders following our 2017 annual meeting.
While RSUs are generally not considered specifically performance-based, the value of all RSU awards vary depending on our stock price performance as driven by the performance of our business and executive team. The RSUs vest annually in equal installments over the three years beginning in 2018, generally as long as the NEO remains continuously employed with the Company.
Long-Term Incentive Awards under Prior Year Grants
The Compensation Committee granted long-term PSU awards in 2016 and 2015 based on two performance measures – two-thirds of the awards based on Adjusted Operating Cash Flow (AOCF) (1) and one-third on customer satisfaction measured through Net Promoter Score® (NPS) (2). We believe that higher levels of customer satisfaction enhance our stockholder value and aligns with our strategic goals to increase our top-line revenue and free cash flow however, in response to shareholder concerns around the lack of industry benchmarks, we did not use this measure in the long-term incentive plan for 2017.
The 2016 awards provide for vesting, if earned, in three equal annual installments, with the vesting of each installment subject to the Company’s attainment of the Adjusted Operating Cash Flow and NPS goals set by the Compensation Committee. For these awards, achievement is combined to determine vesting. Achievement in excess of 100% of the combined achievement of both goals for each performance period, if earned, will be paid in cash. No vesting or payout occurs for actual achievement levels below the minimum (50%) for each goal. Vesting or payout is measured on a linear scale based on performance between the minimum and the maximum levels.
|
(1) |
Adjusted Operating Cash Flow for purposes of incentive compensation, is calculated as annual Adjusted EBITDA less cash interest expense. For more information on this metric, see “Non-GAAP Financial Measures and Performance Metrics” on page 36. |
|
(2) |
NPS is determined through customer satisfaction surveys, conducted and reported by a third-party vendor, that ask business customers, on a scale from zero to ten, how likely they are to recommend Alaska Communications to a friend or colleague. |
2016 award goals and actual performance for the 2017 performance year were as follows ($ in millions):
|
Performance Measure |
Weight |
50% Vesting Minimum |
100% Vesting Target |
150% Vesting/Payout Maximum |
Actual 2017 Performance |
|
AOCF |
67% |
$49.410 |
$54.900 |
$60.390 |
$42.208 |
|
NPS |
33% |
19 |
22 |
27 |
20 |
As shown above, our Adjusted Operating Cash Flow result was below the minimum threshold for vesting and the NPS result was below target. The result was a combined vesting at 22% of target for this award for 2017 performance.
For the 2015 awards, achievement is determined individually for each performance measure. Achievement in excess of 100% of either goal for each performance period, if earned, will be paid in cash. No vesting or payout occurs for actual achievement levels below the minimum (50%) for each goal. Vesting or payout is measured on a linear scale based on performance between the minimum and the maximum levels.
2015 award goals and actual performance for the 2017 performance year were as follows ($ in millions):
|
Performance Measure |
Weight |
50% Vesting Minimum |
100% Vesting Target |
150% Vesting/Payout Maximum |
Actual 2017 Performance |
|
AOCF |
67% |
$49.410 |
$54.900 |
$60.390 |
$42.208 |
|
NPS |
33% |
13 |
15 |
17 |
20 |
As shown above, our Adjusted Operating Cash Flow result was below the minimum threshold and resulted in no vesting for that component of the award, while our NPS result was above the maximum goal resulting in vesting and payout at the maximum level for the NPS component of the award (vesting of 100% of target for this component in shares and an additional 50% cash award payout).
Other NEO Benefits, Perquisites and Severance
Our NEOs participate in the broad-based benefit and welfare plans that are generally available to the Company’s employees. There are no special or supplemental retirement benefits provided to our NEOs under our executive compensation program.
Severance and other benefits are explained in detail beginning on page 41.
Compensation Governance
What We Do:
Multiple Performance Metrics for Both Short-term and Long-term Incentives. We mitigate compensation-related risk in a number of ways, including by using multiple performance measures across the short and long-term incentive plans.
Minimum Stock Ownership Requirements for all NEOs. We have adopted minimum stock ownership requirements for our NEOs because we believe that management will more effectively pursue the long-term interests of our stockholders if they are stockholders themselves. The Compensation Committee reviews our stock ownership requirements and makes changes, as needed, to bring our policy in line with evolving market practice. Our policy requires each NEO other than the CEO to accumulate and hold shares of our common stock having a value of at least one-and-a-half times the NEO’s annual base salary. The CEO is expected to hold shares of common stock equal to at least three times his base salary. Each of our NEOs has five years from his or her appointment to the position to achieve the prescribed ownership levels. All our NEOs either are in full compliance with this requirement or have more time under the policy to reach the requirement.
Independent Compensation Consultant. The Compensation Committee has retained Korn Ferry to advise on our executive compensation programs. Aside from the services to the Compensation Committee, Korn Ferry performs no other services for us.
Compensation Risk Review. The Compensation Committee, with support and advice from its independent consultant, reviews the risk and reward structure of executive compensation plans, policies and practices to confirm that there are no compensation-related risks that are reasonably likely to have a material adverse effect on the business.
Limited Perquisites. We provide the following perquisites to NEOs: automobile allowance, travel and housing costs to NEOs who live outside of Alaska, and moving expenses. We do not provide any tax gross-ups with respect to perquisites.
Deductibility of Executive Compensation
The Compensation Committee considers the tax and accounting treatment associated with cash and equity awards it makes, although these considerations are not the overriding factor the Compensation Committee uses in making its decisions. Section 162(m) of the Internal Revenue Code places a limit of $1 million on the compensation that the Company may deduct in any one year with respect to each of its most highly compensated executive officers, unless certain conditions are met. There is an exception to the $1 million limitation for performance-based compensation meeting certain requirements and the Compensation Committee intended for certain awards granted in 2017 to meet this exception. With the exception of certain grandfathered awards made pursuant to written binding contracts in effect on November 2, 2017, comprehensive tax reform eliminated the performance-based compensation exception effective January 1, 2018.
Incentive Compensation “Clawback” Reimbursement
Our incentive award plan and award agreements provide that awards under the plan are subject to applicable clawback laws, rules or regulations. Additionally, our Officer Severance Policy includes a clawback provision. This provides that any compensation paid that is subject to recovery under any law, government regulation or stock exchange listing requirement will be subject to repayment to the Company.
What We Don’t Do:
Guaranteed or Non-Performance-Based Bonuses or Salary Increases. None of our NEOs has an employment arrangement or other contractual right, other than the long-term incentive awards as described above, guaranteeing any cash incentive or other annual or multi-year bonus payments or any salary increases. All cash incentive awards are earned based solely on the Company’s performance and individual NEO’s performance successes. Base salary increases are at the discretion of the Compensation Committee.
Single Trigger Change in Control Benefits. Change in control severance provisions apply to Mr. Vadapalli through the terms of his individual employment agreement, and to our other NEOs through the Company’s Officer Severance Policy that is expressly applicable to our NEOs. The primary purpose of these change in control protections is to align executive and stockholder interests by enabling our NEOs to assess possible corporate transactions without regard to the effect such transactions could have on their employment with the Company. In seeking to adhere to best compensation practices, the change in control provisions currently applicable to all our NEOs avoid excessive payments or “single triggers” for receipt of severance benefits in the event of a change in control. Double triggers are required for receipt of any change in control benefits. There are no excise tax gross-ups included in severance arrangements. The Compensation Committee set the amount of change in control benefits provided for our executives at amounts that the Compensation Committee believes are reasonable in the event of the occurrence of the circumstances specified. The specific change in control severance provisions applicable to each NEO are discussed in more detail following the executive compensation tables under the heading: “Employment Arrangements and Potential Payments upon Termination or Change in Control.”
Special Executive Retirement or Benefit Packages. Our NEOs participate in the broad-based retirement and benefit programs that are generally available to the Company’s employees. There are no special or supplemental retirement benefits provided to our NEOs under our executive compensation program.
Hedging or Pledging of Company Stock. We have a policy prohibiting all employees, including the NEOs and members of our Board, from engaging in any hedging transactions with respect to our equity securities held by them or pledging Company securities as collateral.
Tax Gross-ups. We do not provide tax gross-ups to any of our NEOs and the Compensation Committee does not plan to include tax gross-ups in any future employment arrangements.
Non-GAAP Financial Measures and Performance Metrics
Information on how we calculate the following metrics:
|
● |
Adjusted EBITDA is a non-GAAP measure and our measurement of Adjusted EBITDA may differ from other companies. Adjusted EBITDA eliminates the effects of period to period changes in costs that are not directly attributable to the underlying performance of the company’s business operations and is used by management and the Board to evaluate current operating financial performance. For a reconciliation of Adjusted EBITDA to the GAAP measure of net income, please refer to our Annual Report on Form 10-K for the year ended December 31, 2017. |
|
● |
Adjusted Free Cash Flow is a non-GAAP liquidity measure calculated as Adjusted EBITDA, less recurring operating cash requirements. For more detail on Adjusted Free Cash flow and a reconciliation of Adjusted Free Cash Flow to the GAAP measure of net cash provided by operating activities, please refer to our Annual Report on Form 10-K for the year ended December 31, 2017. |
|
● |
Adjusted Free Cash Flow per share is a non-GAAP measure and is calculated as Adjusted Free Cash Flow divided by the weighted average shares outstanding on a fully diluted basis. |
|
● |
Adjusted Operating Cash Flow: for the purposes of incentive compensation, is calculated as annual Adjusted EBITDA less cash interest expense. (In Thousands) |
|
Adjusted EBITDA |
$ | 56,712 | ||
|
Less cash interest expense |
(14,504 | ) | ||
|
Adjusted operating cash flow |
$ | 42,208 |
|
● |
Net Promoter Score (“NPS”): is a measure of customer satisfaction determined through customer satisfaction surveys that ask business customers, on a scale of zero to ten, how likely they are to recommend Alaska Communications to a friend or colleague. Business NPS is calculated using responses from enterprise and small and medium business customers equally weighted. We use a third-party vendor to conduct the surveys and report customer responses. |
|
● |
Total Revenue: as reported in our Annual Report on Form 10-K for the year ended December 31, 2017 includes business and wholesale revenue, consumer revenue, and access and high cost support revenues totaling $226.905 million. |
Executive Compensation Tables
In this section, we provide tabular and narrative information regarding the compensation paid to our NEOs for the years ended December 31, 2017, 2016, and 2015, except 2015 and 2016 information for Mr. Bishop is not provided because he was not an NEO in either of those years.
Summary Compensation Table
|
Name and Principal |
|
Salary |
Bonus |
Stock Awards |
Non-Equity Incentive Plan Compensation |
Change in Pension Value |
All Other Compensation |
Total |
||||||||||||||||||||||
|
Position |
Year |
($) |
($)(1) |
($)(2) |
($)(3) |
($)(4) |
($)(5) |
($) |
||||||||||||||||||||||
|
Anand Vadapalli |
2017 |
450,002 | - | 881,204 | 34,726 | 7,899 | 74,947 | 1,448,778 | ||||||||||||||||||||||
|
President and Chief Executive Officer |
2016 |
450,002 | - | 1,541,052 | 745,097 | 7,347 | 86,983 | 2,830,481 | ||||||||||||||||||||||
|
2015 |
467,310 | - | 972,299 | 1,562,819 | 15,721 | 80,803 | 3,098,952 | |||||||||||||||||||||||
|
Laurie M. Butcher |
2017 |
240,001 | - | 135,342 | 3,142 | 38,510 | - | 416,995 | ||||||||||||||||||||||
|
Senior Vice President, Finance |
2016 |
240,001 | 14,356 | 218,068 | 134,631 | 35,996 | - | 643,052 | ||||||||||||||||||||||
|
2015 |
197,630 | 32,730 | 116,667 | 123,784 | 32,659 | - | 503,470 | |||||||||||||||||||||||
|
Randy M. Ritter |
2017 |
257,501 | - | 156,912 | 5,834 | 15,335 | 12,145 | 447,727 | ||||||||||||||||||||||
|
Senior Vice President, Shared Services |
2016 |
250,001 | - | 258,877 | 191,804 | 17,966 | 10,905 | 729,553 | ||||||||||||||||||||||
|
2015 |
259,617 | - | 163,332 | 218,773 | 15,684 | 27,525 | 684,931 | |||||||||||||||||||||||
|
Leonard A. Steinberg |
2017 |
288,001 | - | 203,012 | 8,000 | 6,356 | - | 505,369 | ||||||||||||||||||||||
|
Senior Vice President, Legal, Regulatory & |
2016 |
288,001 | - | 355,030 | 231,477 | 8,347 | - | 882,855 | ||||||||||||||||||||||
| Government Affairs and Corporate Secretary |
2015 |
299,078 | - | 224,000 | 382,666 | 9,141 | 10,281 | 925,166 | ||||||||||||||||||||||
|
William H. Bishop (6) |
2017 |
251,736 | - | 149,440 | 3,851 | 19,939 | - | 424,966 | ||||||||||||||||||||||
|
Senior Vice President, Business Market |
||||||||||||||||||||||||||||||
|
(1) |
The amounts for Ms. Butcher in 2016 and 2015 include a fixed retention cash amount payable to her under her former position as a vice president; the final payment under the agreement was made in 2016. |
|
(2) |
Amounts reported for 2017 represent the grant date fair value of RSU and PSU awards considered to be granted in 2017, as determined in accordance with FASB ASC 718, excluding the effect of forfeitures. For 2017, the amounts shown include (i) RSU awards that were granted in 2017; (ii) one-half of the PSU awards approved by the Compensation Committee in 2017, representing the portion with respect to which the relative TSR performance goals established in 2017 and expected to vest, if earned, in 2020. For the PSU awards, the amount is based on the probable outcome, which reflects target vesting of the awards. Refer to the Grants of Plan-Based Awards Table that follows. The value of these awards at grant date, assuming the highest level of performance conditions will be achieved is as follows: |
|
Anand Vadapalli |
$ | 466,735 | ||
|
Laurie M. Butcher |
$ | 71,687 | ||
|
Randy M. Ritter |
$ | 83,109 | ||
|
Leonard A Steinberg |
$ | 107,528 | ||
|
William H. Bishop |
$ | 79,153 |
Assumptions used in calculating these amounts are included in Note 16 to our audited financial statements included in the Original Form 10-K, which was filed with the SEC on March 16, 2018.
PSU awards approved by the Compensation Committee in 2017 representing the portion based on Adjusted Free Cash Flow per Share are not included in this table because performance goals were not established in 2017 and therefore in accordance with FASB ASC 718, are not considered to be granted for accounting purposes. Those awards are based on a percentage of base salary for each NEO as follows:
|
Anand Vadapalli |
69.45 | % | ||
|
Laurie M. Butcher |
20 | % | ||
|
Randy M. Ritter |
21 | % | ||
|
Leonard A Steinberg |
25 | % | ||
|
William H. Bishop |
20 | % |
|
(3) |
Amounts represent the amount earned for 2017 in relation to the cash-based portion of PSU awards granted in 2015, based on 2017 performance goals previously set by the Compensation Committee, based on attainment of better than target level. Amounts reported for each year are based on performance in that year, even if paid subsequent to year end. This column contains the annual cash incentive if applicable, however none was paid for 2017 performance. |
|
(4) |
Amounts are based on vested benefits under the Alaska Electrical Pension Plan (“AEPP”), a multi-employer defined benefit plan. The Company does not administer the AEPP, and the amounts provided are estimates based on the calculations of a third-party actuary retained by the Company. See the description of the pension benefits on page 41 for further details. |
|
(5) |
Mr. Vadapalli received apartment rental payments of $23,880, travel reimbursement of $16,567 for travel to the company headquarters in Anchorage from his principal residence outside of Alaska, a 401K matching contribution of $24,000, and an automobile allowance of $10,500 in 2017. Mr. Ritter received an automobile allowance of $9,600 and reimbursement for travel to and from his remote worksite of $2,545 in 2017. |
|
(6) |
Mr. Bishop did not become an NEO until 2017, therefore, in accordance with SEC rules, his compensation information is presented for 2017 only. |
2017 Grants of Plan-Based Awards Table
The following table sets forth information concerning plan-based awards granted to our NEOs during the year ended December 31, 2017. Actual future payouts of non-equity incentive plan awards may vary from the estimates set forth below.
|
Estimated Future Payouts Under Non-Equity Incentive Plan Awards |
Estimated Future Payouts Under Equity Incentive Plan Awards |
All Other Stock Awards: Number of |
Grant Date Fair Value of Stock and |
|||||||||||||||||||||||||||||||||
| Shares of | Option | |||||||||||||||||||||||||||||||||||
| Name |
Grant Date |
Threshold ($) |
Target ($) |
Maximum ($) |
Threshold (#) |
Target (#) |
Maximum (#) |
Stock or Units (#) |
Awards ($) (4) |
|||||||||||||||||||||||||||
|
Anand |
- | 225,000 | 450,000 | 675,000 | (1) | - | - | - | - | - | ||||||||||||||||||||||||||
| Vadapalli |
9/28/2017 |
- | - | - | 68,537 | 137,073 | (2) | 205,610 | - | 311,156 | ||||||||||||||||||||||||||
|
9/28/2017 |
- | - | - | - | - | - | 250,021 | (3) | 570,048 | |||||||||||||||||||||||||||
|
Laurie M. |
- | 72,000 | 144,000 | 216,000 | (1) | - | - | - | - | - | ||||||||||||||||||||||||||
| Butcher |
9/28/2017 |
- | - | - | 10,527 | 21,053 | (2) | 31,580 | - | 47,790 | ||||||||||||||||||||||||||
|
9/28/2017 |
- | - | - | - | - | - | 38,400 | (3) | 87,552 | |||||||||||||||||||||||||||
|
Randy M. |
- | 79,500 | 159,000 | 238,500 | (1) | - | - | - | - | - | ||||||||||||||||||||||||||
| Ritter |
9/28/2017 |
- | - | - | 12,204 | 24,408 | (2) | 36,612 | - | 55,406 | ||||||||||||||||||||||||||
|
9/28/2017 |
- | - | - | - | - | - | 44,520 | (3) | 101,506 | |||||||||||||||||||||||||||
|
Leonard A. |
- | 86,400 | 172,800 | 259,200 | (1) | - | - | - | - | - | ||||||||||||||||||||||||||
| Steinberg |
9/28/2017 |
- | - | - | 15,790 | 31,579 | (2) | 47,369 | - | 71,684 | ||||||||||||||||||||||||||
|
9/28/2017 |
- | - | - | - | - | - | 57,600 | (3) | 131,328 | |||||||||||||||||||||||||||
|
William H. |
- | 79,500 | 159,000 | 238,500 | (1) | - | - | - | - | - | ||||||||||||||||||||||||||
| Bishop |
9/28/2017 |
- | - | - | 11,623 | 23,246 | (2) | 34,869 | - | 52,768 | ||||||||||||||||||||||||||
|
9/28/2017 |
- | - | - | - | - | - | 42,400 | (3) | 96,672 | |||||||||||||||||||||||||||
|
(1) |
Target cash incentive award amounts represent amounts payable under our annual cash incentive program and applicable compensation plans for performance in 2017 for each of our NEOs. Under the program, the actual incentive payments are based on the Company’s performance relative to the performance goal, as adjusted by individual performance and pro-rated for actual time served in the position. Actual awards could be as low as 0% payout. |
|
(2) |
Amounts represent the 2017 grant of PSUs with respect to achievement of an initial performance condition for Adjusted EBITDA and the applicable performance goals for relative TSR that were established in 2017. These PSU grants are eligible to vest in 2020 based on achievement of performance goals. PSU awards approved by the Compensation Committee in 2017 representing the portion based on Adjusted Free Cash Flow per Share are not included in this table because performance goals were not established in 2017 and, therefore, in accordance with FASB ASC 718, those PSUs are not considered to be granted for accounting purposes. |
|
(3) |
Amounts represent the 2017 grant of RSUs that are subject to a three-year, time-based vesting schedule. |
|
| (4) | Amount represents the grant date fair value determined in accordance with FASB ASC 718, excluding the effect of forfeitures. Assumptions used in the calculation of these amounts are included in Note 16 to our audited financial statements including in our Annual Report on Form 10-K for the year ended December 31, 2017, which was filed with the SEC on March 16, 2018. |
2017 Outstanding Equity Awards at Fiscal Year-End Table
The following table provides information regarding unvested RSUs and PSUs held by our NEOs as of December 31, 2017. Our NEOs did not hold any stock option awards as of December 31, 2017.
|
Stock Awards |
||||||||||||||||
| Name |
Number of Shares or Units of Stock That Have Not Vested (#) |
Market Value of Shares or Units of Stock That Have Not Vested ($)(1) |
Equity Incentive Plan Awards: Number of Unearned Shares, Units or Other Rights That Have Not Vested (#) |
Equity Incentive Plan Awards: Market or Payout Value of Unearned Shares, Units or Other Rights That Have Not Vested ($)(1) |
||||||||||||
|
Anand Vadapalli |
123,284 | (2) | 330,401 | - | - | |||||||||||
| 235,424 | (3) | 630,936 | - | - | ||||||||||||
| 250,021 | (4) | 670,056 | - | - | ||||||||||||
| - | - | 123,286 | (5) | 330,406 | ||||||||||||
| - | - | 235,424 | (6) | 630,936 | ||||||||||||
| - | - | 137,073 | (7) | 367,356 | ||||||||||||
|
Laurie M. Butcher |
8,555 | (2) | 22,927 | - | - | |||||||||||
| 2,492 | (2) | 6,679 | - | - | ||||||||||||
| 36,158 | (3) | 96,903 | - | - | ||||||||||||
| 38,400 | (4) | 102,912 | - | - | ||||||||||||
| - | - | 8,555 | (5) | 22,927 | ||||||||||||
| - | - | 2,494 | (5) | 6,684 | ||||||||||||
| - | - | 36,158 | (6) | 96,903 | ||||||||||||
| - | - | 21,053 | (7) | 56,422 | ||||||||||||
|
Randy M. Ritter |
20,710 | (2) | 55,503 | - | - | |||||||||||
| 39,548 | (3) | 105,989 | - | - | ||||||||||||
| 44,520 | (4) | 119,314 | - | - | ||||||||||||
| - | - | 20,712 | (5) | 55,508 | ||||||||||||
| - | - | 39,548 | (6) | 105,989 | ||||||||||||
| - | - | 24,408 | (7) | 65,413 | ||||||||||||
|
Leonard A. Steinberg |
27,513 | (2) | 73,735 | - | - | |||||||||||
| 52,538 | (3) | 140,802 | - | - | ||||||||||||
| 55,794 | (4) | 149,528 | - | - | ||||||||||||
| - | - | 28,403 | (5) | 76,120 | ||||||||||||
| - | - | 54,238 | (6) | 145,358 | ||||||||||||
| - | - | 31,579 | (7) | 84,632 | ||||||||||||
|
William H. Bishop |
8,496 | (2) | 22,769 | - | - | |||||||||||
| 2,789 | (2) | 7,475 | - | - | ||||||||||||
| 36,158 | (3) | 96,903 | - | - | ||||||||||||
| 42,400 | (4) | 113,632 | - | - | ||||||||||||
| - | - | 8,497 | (5) | 22,772 | ||||||||||||
| - | - | 2,792 | (5) | 7,483 | ||||||||||||
| - | - | 36,158 | (6) | 96,903 | ||||||||||||
| - | - | 23,246 | (7) | 62,299 | ||||||||||||
|
(1) |
The Market Value as of December 29, 2017 (last trading day of 2017) was calculated using $2.68 which was the closing price per share of our common stock as reported on the Nasdaq Global Market on that date. |
|
(2) |
Represents RSUs which vested in full in the first quarter of 2018. |
|
(3) |
Represents RSUs, of which 50% vested on March 1, 2018 and the remaining 50% will vest on March 1, 2019, generally subject to continued employment. |
|
(4) |
Represents RSUs granted in 2017 of which 33% vested on March 1, 2018 and the remaining 67% will vest in substantially equal portions on the first Company business date in March of 2019 and 2020, generally subject to continued employment. |
|
(5) |
Represents PSUs that were outstanding as of December 31, 2017 and 33% of which vested in full in March of 2018, upon the Compensation Committee’s determination that we achieved one of the previously established Company performance goals. The remaining 67%, which did not vest. were forfeited upon the Compensation Committee’s determination that we did not achieve the minimum goal for vesting. |
|
(6) |
Represents PSUs scheduled to vest in two substantially equal annual installments. The Compensation Committee determined that the Company’s achievement of the 2017 performance goals for this grant was sufficient for approximately 22% of the portion of the PSUs relating to 2017 performance to vest in March of 2018. The remaining 50% to be based on 2018 Company performance are subject to vest on or before March 31, 2019, based on achievement of Company performance goals established by the Compensation Committee in March 2016. |
|
(7) |
Represents PSUs scheduled to vest in 2020. A portion of these PSUs are based on achievement of Company performance goals previously established by the Compensation Committee for relative TSR. Applicable performance goals for the remainder of the PSUs based on Adjusted Free Cash Flow per share were not established by the Compensation Committee in 2017 and therefore, under FASB ASC 718, have not met the grant date criteria to be included in this table. |
2017 Option Exercises and Stock Vested Table
The following table sets forth information regarding the vesting of RSUs and PSUs and the value realized on vesting by each of our NEOs during the year ended December 31, 2017. None of our NEOs held any outstanding stock options in 2017.
|
Stock Awards |
||||||||
|
Name |
Number of Shares Acquired on Vesting (#) (1) |
Value Realized on Vesting ($) (2) |
||||||
|
Anand Vadapalli |
583,188 | 1,006,398 | ||||||
|
Laurie M. Butcher |
63,345 | 110,577 | ||||||
|
Randy M. Ritter |
97,968 | 169,062 | ||||||
|
Leonard A. Steinberg |
133,625 | 231,863 | ||||||
|
William H. Bishop |
64,930 | 113,412 | ||||||
|
(1) |
Represents the gross number of shares vested, although the Company nets a portion of these vested shares to cover the executive’s applicable withholding tax obligations due upon vesting. In addition, share amounts are net of performance-based shares forfeited due to not meeting the minimum or target performance thresholds under the respective PSU award agreement. |
|
(2) |
The value realized on vesting is based on the gross number of shares vested multiplied by the closing price of our common stock as reported on the Nasdaq Global Market on the respective vesting dates. |
2017 Pension Benefits Table
The following table provides information on the AEPP in which the NEOs participate, including the years of credited service, and an estimated present value of accumulated benefits as of December 31, 2017.
|
Name |
Plan Name (1) |
Number of Years Credited Service (#) |
Present Value of Accumulated Benefit ($) (2) |
Payments During Last Fiscal Year ($) |
||||||||||
|
Anand Vadapalli |
AEPP |
9.00 | 113,218 | - | ||||||||||
|
Laurie M. Butcher |
AEPP |
22.00 | 384,931 | - | ||||||||||
|
Randy M. Ritter |
AEPP |
4.00 | 61,555 | - | ||||||||||
|
Leonard A. Steinberg |
AEPP |
18.00 | 330,286 | - | ||||||||||
|
William H. Bishop |
AEPP |
13.00 | 159,540 | - | ||||||||||
|
(1) |
The AEPP is a non-contributory, multi-employer, defined benefit pension plan administered by a board of trustees. The Company makes contributions on behalf of employees in accordance with schedules based on wage rates and job classifications. We do not include the present value of accumulated benefits under the AEPP in our audited financial statements because, as a multi-employer defined benefit plan, the accumulated benefits and plan assets are not determined for, or allocated separately to, the individual employers. |
|
(2) |
Calculated using an interest rate of 7.5%, mortality rate assumptions from the RP-2000 Mortality Table projected 8 years from the valuation date, applies after the assumed retirement date, and a normal retirement date age of 58. The amounts shown on the table are estimates provided by a third-party actuary retained by the Company. Vested participants will receive a monthly benefit upon retirement, payable for life, based on the contributions made on the participant’s behalf. |
Employment Arrangements and Potential Payments upon Termination or Change in Control
The following pages provide individual compensation narrative for each of our NEOs.
Anand Vadapalli
We entered into an Amended and Restated Employment Agreement with Anand Vadapalli, our President and CEO, effective August 5, 2015 (“Agreement”). In 2017, the Agreement was amended to extend the employment period through June 30, 2019. The Agreement provides for successive, automatic extensions for one-year periods thereafter unless notice of an intention to terminate the Agreement is provided by either party at least 180 days before the end of the then-current term. No change was made to annual base salary of $450,000 for 2017, however in 2018 the Agreement was further amended to reduce Mr. Vadapalli’s annual base salary to $414,000. Mr. Vadapalli is eligible for target annual cash incentive compensation of not less than his base salary, with the actual amount to be determined each year based on achievement of annual performance objectives set by the Compensation Committee. Mr. Vadapalli is also eligible to receive long-term incentive compensation in the form of time-vested RSUs, PSUs or other equity based awards, or a combination of equity and performance-based cash awards other than the annual cash incentives. To align the interests of Mr. Vadapalli with those of our stockholders, the annual long-term awards will be guided by the principle that these awards are not less than twice the value of his annual base salary. However, the specific quantity and type of long-term awards will be determined annually by the Compensation Committee on the terms and schedule approved by the Board, based on accomplishment of performance objectives set by the Board and subject to the terms of an individual grant award agreement.
The Agreement provides for reimbursement of reasonable travel expenses between Mr. Vadapalli’s residence outside the state of Alaska and the Company headquarters or other appropriate business location. Mr. Vadapalli is also reimbursed for reasonable living expenses, up to $2,500 per month, while Mr. Vadapalli is working away from his principal residence outside the state of Alaska. The Agreement includes a monthly automobile allowance, which is generally available to all Company officers.
Mr. Vadapalli’s Agreement provides that in the event of termination by the Company “without cause” or resignation by Mr. Vadapalli for “good reason,” as those terms are defined in his Agreement, Mr. Vadapalli is entitled to receive post-termination benefits as follows: (i) a cash payment equal to the sum of his base salary plus his target annual cash incentive; (ii) any unpaid cash incentive payment for the last full year of his employment, plus a prorated cash incentive payment for the last partial year of his employment; (iii) time-vested cash or stock-based awards will continue to vest in accordance with their scheduled vesting periods and performance-based awards will continue to vest subject to satisfaction of the applicable performance conditions; (iv) monthly payments for up to one year equal to COBRA health insurance premiums in certain circumstances; and (v) reimbursement for relocation expenses up to $50,000 and reimbursement for realtor commissions on the sale of his residence up to $50,000, subject to certain conditions.
In the event Mr. Vadapalli’s employment is terminated by the Company “without cause” or he resigns for “good reason” in connection with a change in control of the Company, severance payments include: (i) a cash payment equal to two times the sum of his base salary plus his target annual cash bonus; (ii) any unpaid cash incentive payment for the last full year of his employment, plus a prorated cash incentive payment for the last partial year of his employment; (iii) accelerated vesting of all unvested equity awards; (iv) monthly payments equal to COBRA health insurance payments for up to 18 months, plus another 6 months at the average rate paid for the prior 18 months under certain circumstances; and (v) reimbursement for relocation expenses up to $50,000 and reimbursement for realtor commissions on the sale of his residence up to $50,000, subject to certain conditions.
Should Mr. Vadapalli’s employment terminate due to death or disability, as such terms are defined in his Agreement, Mr. Vadapalli, or his estate, would be eligible to receive: (i) his base salary prorated to the date of death or cessation of active work due to disability; (ii) any unpaid cash incentive payment for the last full year of his employment, plus a prorated cash incentive payment for the last partial year of his employment; and (iii) for awards granted in or after 2013, time-vested awards will accelerate and vest upon termination and performance-based awards will continue to vest subject to satisfaction of the applicable performance conditions.
Mr. Vadapalli is subject to customary non-competition and non-solicitation restrictive covenants during his employment with the Company and for a period of two years and one year, respectively, thereafter. The following table sets forth the payments and benefits Mr. Vadapalli would have received, assuming a termination of his employment in the following scenarios on December 31, 2017.
|
Name |
Benefit |
Termination Without Cause or for Good Reason |
Death or Disability |
Termination without Cause or for Good Reason In Connection with Change in Control |
(7) | |||||||||
|
Anand Vadapalli |
Severance |
|||||||||||||
|
Base Salary Component |
$ | 900,000 | $ | - | $ | 1,800,000 | ||||||||
|
Annual Incentive Component |
- | - | - | |||||||||||
|
Long-Term Performance Cash |
34,726 | (1) | 34,726 | (1) | - | (2) | ||||||||
|
Accelerated Vesting of Equity |
2,861,113 | (3) | 2,861,113 | (3) | 3,327,448 | (4) | ||||||||
|
Other Benefits |
122,185 | (5) | - | 144,370 | (6) | |||||||||
|
Total |
$ | 3,918,024 | $ | 2,895,839 | $ | 5,271,818 | ||||||||
|
(1) |
Includes long-term performance cash awards that would be payable based on overachievement of Company goals for 2017. |
|
| (2) | No long-term performance cash award would be payable in a termination in connection with a change in control based on target, as defined in Mr. Vadapalli’s Agreement. |
|
(3) |
Includes RSU and PSU awards estimated to be payable pursuant to the terms of Mr. Vadapalli’s Agreement on December 31, 2017. The amount was calculated using the estimated total number of units multiplied by the closing price on December 29, 2017 (last trading day of 2017) of $2.68 per share of our common stock as reported on the Nasdaq Global Market. The actual amount payable under these awards can be determined only at the time the award would be paid. |
|
(4) |
Includes RSU and PSU awards estimated be payable in connection with a change in control pursuant to the terms of Mr. Vadapalli’s Agreement on December 31, 2017. The amount was calculated using 100% of the total number of unvested units, assuming the achievement of performance goals would have been unknown, multiplied by the closing price on December 29, 2017 (last trading day of 2017) of $2.68 per share of our common stock as reported on the Nasdaq Global Market. The actual amount payable under these awards can be determined only at the time the award would be paid. |
|
(5) |
Assumes COBRA health insurance coverage is reimbursed for the 12-month period following termination, reimbursement of up to $50,000 each for realtor commission and relocation costs within the contiguous United States are paid. |
|
(6) |
Assumes COBRA health insurance coverage is reimbursed for the maximum period of 24-months following termination, and reimbursement of $50,000 each for realtor commission and relocation costs within the contiguous United States are paid. |
|
(7) |
Upon a change in control, payments (or portions thereof) to Mr. Vadapalli determined to constitute an “excess parachute payment” may be reduced to the maximum amount that would be tax deductible by the Company pursuant to Sections 280G and 4999 of the Code. Upon a hypothetical December 31, 2017, change in control, this amount would have been reduced to reflect the maximum amount that would be tax deductible by the Company pursuant to Sections 280G and 4999 of the Code. Based upon our internal review of the estimated payment amounts, we believe that no payments to Mr. Vadapalli would have been subject to reduction under Sections 280G and 4999 of the code. |
Other NEOs
Laurie M. Butcher
Ms. Butcher serves as our Senior Vice President, Finance. Her 2017 compensation included an annual base salary of $240,000 and a target annual cash incentive of $144,000. Ms. Butcher is also eligible to receive annual long-term compensation consisting of awards of equity and performance cash with a total grant value equal to approximately 80% of her base salary.
Randy M. Ritter
Mr. Ritter serves as our Senior Vice President, Shared Services. His 2017 compensation included an annual base salary of $265,000 and a target annual cash incentive of $159,000. Mr. Ritter is also eligible to receive annual long-term incentive compensation consisting of awards of equity and performance cash with a total grant value of approximately 84% of his base salary.
Leonard A. Steinberg
Mr. Steinberg serves as our Senior Vice President, Legal, Regulatory and Government Affairs and Corporate Secretary. His 2017 compensation included an annual base salary of $288,000 and a target annual cash incentive of $172,800. Mr. Steinberg is eligible to receive annual long-term incentive compensation consisting of awards of equity and performance cash, with a total grant value of approximately 100% of his base salary.
William H. Bishop
Mr. Bishop serves as our Senior Vice President, Business Market. His 2017 compensation included an annual base salary of $265,000 and a target annual cash incentive of $159,000. Mr. Bishop is also eligible to receive annual long-term incentive compensation consisting of awards of equity and performance cash with a total grant value of approximately 80% of his base salary.
The NEOs are also eligible to receive other benefits including paid time off, participation in the Company’s health and welfare plans, 401(k) retirement investment plan, employee stock purchase plan and pension plan that are generally available to substantially all of our employees.
Severance and Other Benefits for our NEOs, other than the CEO
Upon a termination by the Company “without cause” or resignation by the NEO for “good reason,” our NEOs are entitled to post-termination severance pay and benefits in accordance with the Company’s Officer Severance Policy. The Officer Severance Policy provides severance pay and benefits to officers of the Company in the event the officer is terminated “without cause” or resigns for “good reason,” as those terms are defined in the policy. Severance pay and benefits includes a cash payment of 1.6 times the NEO’s annual base salary and reimbursement for federal COBRA health insurance coverage for the NEO and the NEO’s family for up to one year, if the NEO’s employment is terminated by the Company “without cause” or the NEO resigns for “good reason.” In the event the NEOs employment is terminated by the Company “without cause” or the NEO resigns for “good reason” in connection with a change in control of the Company, severance pay and benefits include a cash payment of two times the NEO’s annual base salary, reimbursement for federal COBRA health insurance coverage for the NEO and the NEO’s family for up to one year under certain circumstances, and accelerated vesting or pay out of all unvested long-term incentive awards, whether equity or cash, held by the NEO at the time of termination of the NEO’s employment. The receipt of severance pay and benefits by the NEO is subject to compliance with customary non-competition and non-solicitation covenants during the period that the NEO is entitled to receive such benefits.
In the event of the death or disability of the NEO while employed by the Company, the NEO or the NEO’s estate would be eligible to receive a prorated annual cash incentive payment. For awards made pursuant to the 2015, 2016 and 2017 PSU award agreements, following a termination of employment due to death or disability, outstanding unvested PSUs awarded shall continue to remain eligible to vest based on the achievement of the applicable performance target as if the NEO had remained employed over the applicable performance vesting period. Additionally, under the RSU award agreements for 2015, 2016 and 2017, RSUs awarded shall be accelerated and vest after termination of employment due to normal retirement, death or disability.
The following table sets forth the payments and benefits our NEOs, other than Mr. Vadapalli, would have received, assuming a termination of employment in the following scenarios on December 31, 2017.
|
Name |
Benefit |
Termination Without Cause or for Good Reason |
Death or Disability |
Termination without Cause or for Good Reason In Connection with Change in Control |
||||||||||
|
Laurie M. Butcher |
Severance |
|||||||||||||
|
Base Salary Component |
$ | 384,000 | $ | - | $ | 480,000 | ||||||||
|
Annual Incentive Component |
- | - | - | |||||||||||
|
Long-Term Performance Cash |
3,142 | (1) | 3,142 | (1) | - | (1) | ||||||||
|
Accelerated Vesting of Equity |
- | 411,247 | (2) | 468,778 | (3) | |||||||||
|
Other Benefits |
22,500 | (4) | - | 22,500 | (4) | |||||||||
|
Total |
$ | 409,642 | $ | 414,389 | $ | 971,278 | ||||||||
|
Randy M. Ritter |
Severance |
|||||||||||||
|
Base Salary Component |
$ | 424,000 | $ | - | $ | 530,000 | ||||||||
|
Annual Incentive Component |
- | - | - | |||||||||||
|
Long-Term Performance Cash |
5,834 | (1) | 5,834 | (1) | - | (1) | ||||||||
|
Accelerated Vesting of Equity |
- | 494,788 | (2) | 573,129 | (3) | |||||||||
|
Other Benefits |
22,185 | (4) | - | 22,185 | (4) | |||||||||
|
Total |
$ | 452,019 | $ | 500,622 | $ | 1,125,314 | ||||||||
|
Leonard A. Steinberg |
Severance |
|||||||||||||
|
Base Salary Component |
$ | 460,800 | $ | - | $ | 576,000 | ||||||||
|
Annual Incentive Component |
- | - | - | |||||||||||
|
Long-Term Performance Cash |
8,000 | (1) | 8,000 | (1) | - | (1) | ||||||||
|
Accelerated Vesting of Equity |
647,373 | 647,373 | (2) | 754,806 | (3) | |||||||||
|
Other Benefits |
22,500 | (4) | - | 22,500 | (4) | |||||||||
|
Total |
$ | 1,138,673 | $ | 655,373 | $ | 1,353,306 | ||||||||
|
William H. Bishop |
Severance |
|||||||||||||
|
Base Salary Component |
$ | 424,000 | $ | - | $ | 530,000 | ||||||||
|
Annual Incentive Component |
- | - | - | |||||||||||
|
Long-Term Performance Cash |
3,851 | (1) | 3,851 | (1) | - | (1) | ||||||||
|
Accelerated Vesting of Equity |
- | 434,571 | (2) | 492,533 | (3) | |||||||||
|
Other Benefits |
7,395 | (4) | - | 7,395 | (4) | |||||||||
|
Total |
$ | 435,246 | $ | 438,422 | $ | 1,029,928 | ||||||||
|
(1) |
Includes long-term performance cash awards that would be payable based on overachievement of Company goals for 2017, except in the case of a Termination in connection with Change in Control, based on performance at target without overachievement. |
|
(2) |
Includes RSU and PSU awards estimated to be payable pursuant to the terms of the Officer Severance Policy on December 31, 2017. The amount was calculated using the estimated total number of units multiplied by the closing price on December 31, 2017 (last trading day of 2017) of $2.68 per share of our common stock as reported on the Nasdaq Global Market. The actual amount payable under these awards can be determined only at the time the award would be paid. |
|
(3) |
Includes RSU and PSU awards estimated to be payable in connection with a change in control pursuant to the terms of the Officer Severance Policy on December 31, 2017. The amount was calculated using the 100% of the total number of unvested units, assuming the achievement of performance goals would have been unknown, multiplied by the closing price on December 29, 2017 (last trading day of 2017) of $2.68 per share of our common stock as reported on the Nasdaq Global Market. The actual amount payable under these awards can be determined only at the time the award would be paid. |
|
(4) |
Assumes COBRA health insurance coverage is reimbursed for the 12-month period following termination. |
Director Compensation
The compensation program for independent directors did not change from 2016 and was designed with an intent to fairly compensate directors for work performed for the Company while aligning directors’ interests with the long-term interests of our stockholders. The following table sets forth the aggregate dollar amount of all fees earned or paid to our independent directors for services in 2017 and includes annual retainer fees, committee membership and chairmanship fees. During 2017, Anand Vadapalli, our President and Chief Executive Officer, did not receive any compensation in connection with his service as a director. The compensation that we paid to Mr. Vadapalli as an employee is discussed in “Compensation Discussion and Analysis” above.
|
Name |
Year |
Fees Earned or Paid in Cash (1) ($) |
Stock Awards(2) ($) |
Total ($) |
||||||||||
|
Edward (Ned) J. Hayes, Jr. |
2017 |
100,007 | 79,993 | 180,000 | ||||||||||
|
Margaret L. Brown |
2017 |
42,500 | 50,000 | 92,500 | ||||||||||
|
David W. Karp |
2017 |
47,500 | 50,000 | 97,500 | ||||||||||
|
Peter D. Ley |
2017 |
60,000 | 50,000 | 110,000 | ||||||||||
|
Shawn F. O'Donnell (3) |
2017 |
21,252 | 24,998 | 46,250 | ||||||||||
|
Brian A. Ross |
2017 |
60,000 | 50,000 | 110,000 | ||||||||||
| (1) | Stock awards are rounded down to a whole share when issued and any residual partial share amounts are paid in cash. | |
|
(2) |
The amounts in this column reflect the grant date fair value of the stock awards, computed in accordance with Financial Accounting Standards Board (“FASB”) ASC Topic 718 (“FASB ASC 718”), based on our stock price on the grant date. All awards are vested upon grant and there are no outstanding unvested stock awards. |
|
(3) |
Mr. O’Donnell was appointed to the Board on August 1, 2017, and received pro-rata compensation as a non-employee director during fiscal year 2017. On January 8, 2018, Mr. O’Donnell resigned from the Board and all committees of the Board effective immediately. |
Under our Board approved Non-Employee Director Compensation and Reimbursement Policy (the “Director Compensation Policy”), which governed compensation for our non-employee directors for 2017, we provided compensation to our independent directors consisting of annual cash and equity retainers that were payable in quarterly installments, as shown in the table below. Prior to the beginning of each calendar year, independent directors may elect to receive all or a portion of their cash retainer in common stock or equivalents. Except for deferred stock, all non-employee director stock and cash compensation is paid in equal quarterly installments for each quarter or partial quarter of service, without proration, within 30 days of the close of the calendar quarter.
|
Type of Fee |
Fees |
|
Annual Board Cash Retainer:
● Board Chair
● Audit Committee Members
● Other Independent Directors |
$100,000
$45,000
$42,500
|
|
Annual shares or equivalents:
● Board Chair
● Other Independent Directors |
Based on grant date closing price
$80,000
$50,000
|
|
Additional Annual Cash Retainer:
● Audit and Compensation Committee Chairs
● Nominating Committee Chair |
$15,000
$5,000
|
Our independent directors are also reimbursed for reasonable out-of-pocket expenses incurred for serving as directors.
Our Board has adopted minimum share ownership requirements for directors because we believe the Board will more effectively pursue the long-term interests of stockholders if the directors are stockholders themselves.
Our Non-Employee Director Compensation and Reimbursement Policy requires each non-employee director to accumulate and hold common stock or common stock equivalents issued by the Company equal to at least three times his or her annual cash retainer. Each non-employee director must comply with the policy by the fifth anniversary of the director’s continuous service to our Board. All of our directors are in full compliance with the holding requirement.
Compensation and Personnel Committee Report
The Compensation Committee has overall responsibility for decisions relating to all compensation plans, policies, and benefit programs as they affect the CEO and other NEOs. The Compensation Committee has reviewed and discussed the information appearing above under the heading “Compensation Discussion and Analysis” with management and, based on that review and discussion, has recommended to the Board that the “Compensation Discussion and Analysis” section be included in this Amendment.
| Submitted by, | |
| Brian A. Ross, Chair | |
| Margaret L. Brown | |
| David W. Karp |
Compensation and Personnel Committee Interlocks and Insider Participation
None of the members of our Compensation Committee are or have been an officer or employee of the Company or have had any relationship with us requiring disclosure pursuant to Item 404 of Regulation S-K. No member of the Compensation Committee is an executive officer of another entity for which any of our executives serve as a compensation committee member. In addition, none of our executive officers served as a director for a company that employs, as an executive officer, any of our directors.
Analysis of Risk in Compensation Practices
Consistent with the SEC’s disclosure requirements, the Company has assessed our compensation programs for all employees. We have concluded that our compensation policies and practices do not create risks that are reasonably likely to have a material adverse effect on the Company. The Compensation Committee monitors our compensation programs on an annual basis and expects to make modifications as necessary to address any changes in the Company’s business or risk profile.
Pay Ratio
As required by Section 953(b) of the Dodd-Frank Wall Street Reform and Consumer Protection Act, and Item 402(u) of Regulation S-K, we are providing the following information about the relationship of the annual total compensation of our employees and the annual total compensation of Anand Vadapalli, our Chief Executive Officer and President (our “CEO”).
For 2017, our last completed fiscal year:
|
■ |
The median of the annual total compensation of all employees of our company (other than our CEO) was $98,065; and |
|
■ |
The annual total compensation of our CEO, as reported in the Summary Compensation Table included elsewhere in this Proxy Statement, was $1,448,778. |
Based on this information, for 2017 the estimated ratio of the annual total compensation of our CEO to the median of the annual total compensation of all employees was 14.77 to 1.
To identify the median of the annual total compensation of all our employees, as well as to determine the annual total compensation of our median employee and our CEO, we took the following steps:
|
1. |
We determined that as of December 31, 2017, our employee population consisted of approximately 585 individuals, with all of these individuals located in the United States (as reported in Item 1, Business, in the Original Form 10-K). This population consisted of our full-time, part-time, and temporary employees. |
|
a. |
We selected December 31, 2017, which is within the last three months of 2017, as the date upon which we would identify the “median employee” because it enabled us to make such identification in a reasonably efficient and economical manner. |
|
2. |
To identify the “median employee” from our employee population, we compared the amount of salary, wages, and incentive compensation of our employees as reflected in our payroll records as reported to the Internal Revenue Service on Form W-2 for 2017. |
|
3. |
We identified our median employee using this compensation measure, which was consistently applied to all our employees included in the calculation. Since all our employees are located in the United States, as is our CEO, we did not make any cost-of-living adjustments in identifying the “median employee.” The median employee’s payroll records, as reported to the Internal Revenue Service on Form W-2 for 2017, was $91,428. |
|
4. |
The median employee participates in the Alaska Electrical Pension Plan, a multi-employer defined benefit plan. We do not administer this defined benefit plan, and the amount included for the change in pension value is an estimate based on the calculations of a third-party actuary (estimated for the employee at $6,637). This amount, added to the median employee’s payroll records, as reported to the Internal Service on Form 2017, to produce total annual compensation for that employee as calculated in accordance with Item 402(c)(2)(x) of Regulation S-K, summed $98,065. |
|
5. |
With respect to the annual total compensation of our CEO, we used the amount reported in the “Total” column of our 2017 Summary Compensation Table included in this Proxy Statement and incorporated by reference under Item 11 of Part III of our Annual Report. |
|
SECURITY OWNERSHIP OF CERTAIN BENEFICIAL OWNERS AND MANAGEMENT AND RELATED STOCKHOLDER MATTERS |
Equity Compensation Plan Information
Securities Authorized for Issuance under Equity Compensation Plans
The following table sets forth information relating to our equity compensation plans as of December 31, 2017.
|
Equity Compensation Plans |
Number of securities to be issued upon exercise of outstanding options, warrants and rights (a) (1) |
Weighted-average exercise price of outstanding options, warrants and rights (b) (1) |
Number of securities remaining available for future issuance under equity compensation plans (excluding securities reflected in column (a)) (c) |
|||||||||
|
Approved by security holders |
3,022,430 | $ | - | 1,035,414 | (2) | |||||||
|
(1) |
Outstanding rights are restricted stock units and performance stock units without any exercise price. |
|
(2) |
As of December 31, 2017, the number of shares remaining for issuance under equity compensation plans included 539,210 shares under the Alaska Communications Systems Group, Inc. 2011 Incentive Award Plan, as amended, and 496,204 under the Company’s 2012 Employee Stock Purchas Plan. |
Security Ownership of Certain Beneficial Owners and Management
The following table provides information about beneficial owners of more than five percent of the Company’s common stock outstanding as of April 25, 2018.
|
Name and Address |
Amount and nature of beneficial ownership |
Percent of class |
||||||
|
Aegis Financial Corporation 6862 Elm Street, Suite 830, McLean, VA 22101-3838 |
2,847,386 | (1) | 5.4% | |||||
|
Karen Singer |
2,639,984 | (2) | 5.0% | |||||
|
(1) |
Based solely on a Schedule 13D/A filed with the SEC on February 9, 2018 by Aegis Financial Corporation. The Schedule 13D/A indicates that Aegis Financial Corporation has shared dispositive power and shared voting power with Scott L. Barbee with respect to 2,847,386 shares. |
|
(2) |
Based solely on a Schedule 13D/A filed with the SEC on April 30, 2018 by Karen Singer and TAR Holdings LLC. The Schedule 13D/A indicates that Karen Singer has sole dispositive power and sole voting power with respect to 2,639,984 shares, and shared dispositive power and shared voting power with respect to none of the shares, and that TAR Holdings LLC has sole dispositive power and sole voting power with respect to 2,639,984 shares and shared dispositive power and shared voting power with respect to none of the shares. |
The following table sets forth the number of shares of the Company’s common stock beneficially owned as of April 25, 2018, by our current directors; NEOs; and all the directors and executive officers as a group.
Beneficial ownership is determined in accordance with Rule 13d-3 of the Exchange Act. Each person has sole voting and investment power with respect to the shares indicated except as otherwise stated in the footnotes to the table.
|
Class-Common Stock |
|||||||||||||||||||||
|
Name of beneficial owner |
Shares owned |
Other beneficial ownership |
Acquirable within 60 days |
Total |
Percent of class (3) |
||||||||||||||||
|
Directors: |
|||||||||||||||||||||
|
Edward (Ned) J. Hayes, Jr. |
275,419 | - | - | 275,419 | * | ||||||||||||||||
|
Margaret L. Brown |
- | 147,816 | (1) | - | 147,816 | * | |||||||||||||||
|
David W. Karp |
1,000 | 158,977 | (1) | - | 159,977 | * | |||||||||||||||
|
Peter D. Ley |
31,340 | 159,704 | (1) | - | 191,044 | * | |||||||||||||||
|
Brian A. Ross |
133,330 | 29,553 | (1) | - | 162,883 | * | |||||||||||||||
|
Anand Vadapalli |
1,556,472 | - | - | 1,556,472 | 2.93% | ||||||||||||||||
|
Named Executive Officers: |
|||||||||||||||||||||
|
Laurie M. Butcher |
175,427 | - | - | 175,427 | * | ||||||||||||||||
|
Randy M. Ritter |
180,001 | - | - | 180,001 | * | ||||||||||||||||
|
Leonard A. Steinberg |
562,087 | - | 63,466 | (2) | 625,553 | 1.18% | |||||||||||||||
|
William H. Bishop |
166,790 | - | - | 166,790 | * | ||||||||||||||||
|
(1) |
Includes deferred units and equivalents awarded as non-employee director compensation, which have been deferred until the director’s retirement from the Board. |
|
(2) |
Includes unvested restricted stock units (“RSUs”) that are subject to acceleration and vesting upon Mr. Steinberg’s retirement from the Company. |
|
(3) |
An asterisk indicates beneficial ownership of less than 1%, based on the number of shares outstanding as of April 25, 2018. |
|
Shares owned |
Other beneficial ownership |
Acquirable within 60 days |
Total |
Percent of class |
||||||||||||||||
|
Total directors & executive officers as a group (11 persons) |
3,081,866 | 496,050 | 63,466 | 3,641,382 | 6.86 | % | ||||||||||||||
|
CERTAIN RELATIONSHIPS AND RELATED TRANSACTIONS, AND DIRECTOR INDEPENDENCE |
The Board has adopted a written Conflicts of Interest and Related Party Transaction Approval Policy, which is available at www.alsk.com. A “related party” is defined under the applicable SEC rule and includes our directors, executive officers, beneficial owners of 5% or more of our common stock and each of their immediate family members. A transaction involving a related party and the Company or its subsidiary that individually or taken together with other related transactions exceeds, or is reasonably likely to exceed, $120,000 is subject to review.
Under the written policy, our Nominating Committee generally is responsible for reviewing, approving or ratifying any related party transaction covered by SEC rules. The Nominating Committee will consider all the relevant facts and circumstances in determining whether to approve or ratify such a transaction, including:
|
● |
whether the terms of the transaction are fair to the Company and would apply on the same basis if the transaction did not involve a related party; |
|
● |
whether there are any compelling business reasons for the Company to enter into the transaction; |
|
● |
whether the transaction would impair the independence of an otherwise independent director or nominee for director; |
|
● |
whether the Company was notified about the transaction before its commencement and if not, why pre-approval was not sought and whether subsequent ratification would be detrimental to the Company; and |
|
● |
whether the transaction would present an improper conflict of interest for any director, nominee for director or executive officer of the Company. |
The Nominating Committee will approve or ratify only those transactions that are, in the Nominating Committee’s judgment, appropriate or desirable under the circumstances. There have been no related party transactions since the beginning of the 2017 fiscal year, nor are there any such transactions proposed.
Board Independence
|
● |
All members of our Board, other than Mr. Vadapalli, our President and Chief Executive Officer, satisfy the independence requirements of the SEC and Nasdaq rules. |
|
● |
Mr. Hayes, our presiding director and Board Chair, is an independent director. |
|
● |
All members of the Audit, Compensation and Personnel, and Nominating and Corporate Governance Committees are independent directors. |
|
● |
Directors are required by our Corporate Governance Principles and Guidelines to immediately tender a resignation in the event of a conflict of interest or change of circumstances that would interfere with their fiduciary duties owed to the Company and our stockholders. |
|
PRINCIPAL ACCOUNTANT FEES AND SERVICES |
The following table summarizes the fees billed to us by Moss Adams LLP for services rendered in connection with the audit of our consolidated financial statements for the fiscal years ended December 31, 2016 and 2017, respectively:
|
2017 (2) |
2016 |
|||||||
|
Audit Fees (1) |
$ | 709,398 | $ | 475,559 | ||||
|
Audit Related Fees |
- | - | ||||||
|
Tax Fees |
- | - | ||||||
|
All Other Fees |
- | - | ||||||
|
Total |
$ | 709,398 | $ | 475,559 | ||||
|
(1) |
This category includes the audit of our annual financial statements, the review of the condensed financial statements included in our Quarterly Reports on Form 10-Q, reviews and assessment of our internal control over financial reporting, services for SEC filings, and accounting consultations on matters reflected in the financial statements. |
|
(2) |
Fees in 2017 included incremental charges associated with the Company’s adoption of ASC 606, Revenue from Contracts with Customers, and other items. |
Audit Committee Pre-Approval Policies and Procedures
The Audit Committee is responsible for appointing, setting compensation for and overseeing the work of the independent auditors. The Audit Committee has established a policy requiring pre-approval of all audit and permissible non-audit services provided by the Independent Auditor. Before the Independent Auditor is engaged by the Company or its subsidiaries to render audit or non-audit services, the Audit Committee pre-approves the engagement. Audit Committee pre-approval of audit and non-audit services will not be required if the engagement for the services is entered into pursuant to pre-approval policies and procedures established by the Audit Committee regarding the Company’s engagement of the Independent Auditor, provided the policies and procedures are detailed as to the particular service, the Audit Committee is informed of each service provided and such policies and procedures do not include delegation of the Audit Committee’s responsibilities under the Exchange Act to the Company’s management. The Audit Committee may delegate authority to grant pre-approvals to one or more of its designated members provided such approvals are presented to the full Audit Committee at a subsequent meeting. If the Audit Committee elects to establish pre-approval policies and procedures regarding non-audit services, the Audit Committee must be informed of each non-audit service provided by the Independent Auditor. Audit Committee pre-approval of non-audit services (other than review and attest services) will not be required if such services fall within available exceptions established by the SEC.
|
EXHIBITS AND FINANCIAL STATEMENT SCHEDULES |
(a) Consolidated Financial Statements and Schedules
Incorporated by reference from pages F-1 through F-48 of the Original Form 10-K.
(b) Exhibits
The exhibits required to be filed as part of this Form 10-K/A are listed in the exhibit index below.
(c) Financial Statement Schedules
None.
Exhibits
The following is a list of exhibits required by Item 601 of Regulation S-K filed as part of this Form 10-K/A. For exhibits that previously have been filed, the Registrant incorporates those exhibits herein by reference. The exhibit index below includes the Form Type and Filing Date of the previous filing and the location of the exhibit in the previous filing which is being incorporated by reference herein. Documents which are incorporated by reference to filings by parties other than the Registrant are identified in footnotes to this exhibit index.
EXHIBIT INDEX
|
Exhibit No. |
Exhibit |
|
Where Located |
|
2.1** |
|
Exhibit 2.1 to Form 8-K (filed April 7, 2008) |
|
|
|
|
|
|
|
2.2 |
|
Exhibit 2.1 to Form 8-K (filed August 6, 2012) |
|
|
|
|
|
|
|
2.3 |
|
Exhibit 2.1 to Form 8-K (filed October 2, 2012) |
|
|
|
|
|
|
|
3.1 |
Amended and Restated Certificate of Incorporation of the Registrant. |
|
Exhibit 3.1 to Form S-1/A File No. 333-888753 (filed November 17,1999) |
|
3.2 |
Amended and Restated By-Laws of Alaska Communications Systems Group, Inc. |
|
Exhibit 3.1 to Form 8-K (filed December 22, 2017) |
|
|
|
|
|
|
3.3 |
|
Exhibit 3.1 to Form 8-K (filed January 9, 2018) |
|
|
|
|
|
|
|
4.1 |
|
Exhibit 4.1 to Form S-1/A File No. 333-888753 (filed November 17, 1999) |
|
|
4.2 |
|
Exhibit 4.1 to Form 8-K (filed May 11, 2011) |
|
|
|
|
|
|
|
4.3 |
|
Exhibit 4.1 to Form 8-K (filed January 9, 2018) |
|
|
|
|
|
|
|
10.1* |
Alaska Communications Systems Group, Inc. 1999 Stock Incentive Plan. |
|
Exhibit 10.8 to Form S-1/A File No. 333-888753 (filed November 17, 1999) |
|
|
|
|
|
|
10.2* |
|
Exhibit 10.1 to Form 10-Q (filed August 3, 2007) |
|
|
|
|
|
|
|
10.3* |
|
Exhibit 99.1 to Form 8-K/A (filed June 12, 2008) |
|
|
|
|
|
|
|
10.4* |
Amendment to Alaska Communications Systems Group, Inc. 1999 Stock Incentive Plan. |
|
Exhibit 10.5 to Form 10-K (filed March 9, 2010) |
|
|
|
|
|
|
10.5* |
Alaska Communications Systems Group, Inc. 1999 Non-Employee Director Compensation Plan. |
|
Exhibit 10.9 to Form S-1/A File No. 333-888753 (filed November 17, 1999) |
|
|
|
|
|
|
10.6* |
Amendment to Alaska Communications Systems Group, Inc. 1999 Non-Employee Director Compensation Plan. |
|
Exhibit 10.7 to Form 10-K (filed March 9, 2010) |
|
|
|
|
|
|
10.7* |
Alaska Communications Systems Group, Inc. 1999 Employee Stock Purchase Plan. |
|
Exhibit 10.10 to Form S-1/A File No. 333-888753 (filed November 17, 1999) |
|
|
|
|
|
|
10.8* |
Alaska Communications Systems Group, Inc. 2012 Employee Stock Purchase Plan. |
|
Appendix A to Schedule 14A (filed April 25, 2012) |
|
10.9* |
Amendment to Alaska Communications Systems Group, Inc. 1999 Employee Stock Purchase Plan. |
|
Exhibit 10.9 to Form 10-K (filed March 9, 2010) |
|
|
|
|
|
|
10.10 |
|
Exhibit 10.1 to Form 8-K (filed March 5, 2018) |
|
|
|
|
|
|
|
10.11 |
|
Exhibit 10.2 to Form 8-K (filed April 14, 2008) |
|
|
|
|
|
|
|
10.12 |
|
Exhibit 10.3 to Form 8-K (filed April 14, 2008) |
|
|
10.13 |
|
Exhibit 10.1 to Form 8-K (filed October 26, 2010) |
|
|
|
|
|
|
|
10.14 |
|
Exhibit 10.4 to Form 10-Q (filed November 5, 2012) |
|
|
|
|
|
|
|
10.15 |
|
Exhibit 10.1 to Form 8-K (filed May 11, 2011) |
|
|
|
|
|
|
|
10.16* |
Alaska Communications Systems Group, Inc. 2011 Incentive Award Plan Restricted Stock Unit Agreement. |
|
Exhibit 10.1 to Form 8-K (filed July 8, 2011) |
|
|
|
|
|
|
10.17* |
|
Exhibit 10.2 to Form 8-K (filed July 8, 2011) |
|
|
|
|
|
|
|
10.18* |
Alaska Communications Systems Group, Inc. Post-Employment Stock Incentive Award Vesting Policy. |
|
Exhibit 10.3 to Form 8-K (filed July 8, 2011) |
|
|
|
|
|
|
10.19* |
Employment Arrangement between the Company and Leonard Steinberg. |
|
Exhibit 10.1 to Form 8-K (filed January 26, 2012) |
|
|
|
|
|
|
10.20* |
|
Exhibit 10.31 to Form 10-K (filed March 1, 2013) |
|
|
|
|
|
|
|
10.21* |
The Alaska Communications Systems Group, Inc. Amended and Restated 2011 Incentive Award Plan. |
|
Exhibit 99.1 to Form S-8 File No. 333-199923 (Filed Nov 6, 2014) |
|
10.22 |
|
Exhibit 10.2 to Form 8-K (filed March 5, 2015) |
|
|
|
|
|
|
|
10.23 |
|
Exhibit 10.1 to Form 8-K (filed March 5, 2015) |
|
|
|
|
|
|
|
10.24* |
|
Exhibit 10.1 to Form 8-K (filed August 7, 2015) |
|
|
|
|
|
|
|
10.25* |
Employment arrangement between Alaska Communications Systems Group, Inc. and Laurie Butcher. |
|
Exhibit 10.1 to Form 8-K (filed November 5, 2015) |
|
10.26* |
The Alaska Communications Systems Group, Inc. 2015 Officer Severance Policy. |
|
Exhibit 10.2 to Form 8-K (filed November 5, 2015) |
|
|
|
|
|
|
10.27 |
|
Exhibit 10.1 to Form 8-K (filed November 5, 2015) |
|
|
|
|
|
|
|
10.28 |
|
Exhibit 10.2 to Form 8-K (filed November 5, 2015) |
|
|
|
|
|
|
|
10.29* |
|
Exhibit 10.1 to Form 10-Q (filed May 9, 2016) |
|
|
|
|
|
|
|
10.30 |
|
Exhibit 10.1 to Form 8-K (filed March 15, 2017) |
|
|
|
|
|
|
|
10.31* |
|
Exhibit 10.1 to Form 8-K (filed April 17, 2017) |
|
|
|
|
|
|
|
10.32* |
|
Exhibit 10.2 to Form 8-K (filed April 17, 2017) |
|
|
|
|
|
|
|
10.33* |
|
Exhibit 10.1 to Form 8-K (filed October 6, 2017) |
|
|
|
|
|
|
|
10.34* |
|
Exhibit 10.1 to Form 8-K (filed December 22, 2017) |
|
|
|
|
|
|
|
16.1 |
Letter from KPMG LLP to the Securities and Exchange Commission dated April 4, 2016. |
|
Exhibit 16.1 to Form 8-K (filed April 5, 2016) |
|
21.1 |
|
Exhibit 21.1 to Form 10-K (filed March 16, 2018) |
|
|
|
|
|
|
|
23.1 |
|
Exhibit 23.1 to Form 10-K (filed March 16, 2018) |
|
|
|
|
|
|
|
23.2 |
|
Exhibit 23.2 to Form 10-K (filed March 16, 2018) |
|
|
|
|
|
|
|
31.1 |
|
Exhibit 31.1 to Form 10-K (filed March 16, 2018) |
|
|
|
|
|
|
|
31.2 |
|
Exhibit 31.2 to Form 10-K (filed March 16, 2018) |
|
|
31.3 |
Filed herewith |
||
|
31.4 |
Filed herewith |
||
|
32.1 |
|
Exhibit 32.1 to Form 10-K (filed March 16, 2018) |
|
|
|
|
|
|
|
32.2 |
|
Exhibit 32.2 to Form 10-K (filed March 16, 2018) |
|
|
|
|
|
|
|
101.INS |
XBRL Instance Document |
|
Exhibit 101.INS to Form 10-K (filed March 16, 2018) |
|
|
|
|
|
|
101.SCH |
XBRL Taxonomy Extension Schema Document |
|
Exhibit 101.SCH to Form 10-K (filed March 16, 2018) |
|
|
|
|
|
|
101.CAL |
XBRL Taxonomy Extension Calculation Linkbase Document |
|
Exhibit 101.CAL to Form 10-K (filed March 16, 2018) |
|
|
|
|
|
|
101.DEF |
XBRL Taxonomy Extension Definition Linkbase Document |
|
Exhibit 101.DEF to Form 10-K (filed March 16, 2018) |
|
101.LAB |
XBRL Taxonomy Extension Label Linkbase Document |
|
Exhibit 101.LAB to Form 10-K (filed March 16, 2018) |
|
|
|
|
|
|
101.PRE |
XBRL Taxonomy Extension Presentation Linkbase Document |
|
Exhibit 101.PRE to Form 10-K (filed March 16, 2018) |
* Indicates a management contract or compensatory plan or arrangement.
** Confidential treatment of certain portions of this exhibit has been granted pursuant to a request for confidential treatment filed with the Securities and Exchange Commission. Omitted portions have been filed separately with the Commission.
Pursuant to the requirements of Section 13 or 15(d) of the Securities Exchange Act of 1934, the Registrant has duly caused this report to be signed on its behalf by the undersigned, thereunto duly authorized.
|
|
|
Alaska Communications Systems Group, Inc. |
||
|
|
|
|||
|
|
|
By: |
/s/ |
Anand Vadapalli |
|
|
|
|
|
Anand Vadapalli |
|
|
|
|
|
President and Chief Executive Officer |
Date: April 30, 2018
56