Attached files
| file | filename |
|---|---|
| EX-99.1 - EX-99.1 - Altra Industrial Motion Corp. | aimc-ex991_7.htm |
| 8-K - 8-K - Altra Industrial Motion Corp. | aimc-8k_20180427.htm |
First Quarter 2018 Results The Power Brands in Power Transmissions Exhibit 99.2
Live Webcast April 27, 2018 at 10:00 AM ET 877-407-8293 Domestic 201-689-8349 International Webcast at www.altramotion.com Replay Through May 11, 2018 877-660-6853 Domestic 201-612-7415 International Conference ID: # 13678537 www.altramotion.com Q1 2018 Conference Call Details
SEC Disclosure Rules Additional Information This communication does not constitute an offer to buy, or a solicitation of an offer to sell, any securities of Fortive Corporation (“Fortive”), Stevens Holding Company, Inc. (“Newco”) or Altra Industrial Motion Corp. (“Altra”). In connection with Altra’s proposed combination with the Fortive A&S business (“Fortive A&S”), Altra and Newco will file registration statements with the SEC registering shares of Altra common stock and Newco common stock. Altra’s registration statement will also include a prospectus relating to the proposed transaction, and Altra will also file a proxy statement relating to the proposed transaction. Fortive stockholders are urged to read the prospectus that will be included in the registration statements and any other relevant documents when they become available, and Altra stockholders are urged to read the proxy statement and any other relevant documents when they become available, because they will contain important information about Altra, Newco and the proposed transaction. The proxy statement, prospectuses and other documents relating to the proposed transaction (when they become available) can also be obtained free of charge from the SEC’s website at www.sec.gov. The proxy statement, prospectuses and other documents (when they become available) can also be obtained free of charge from Fortive upon written request to Fortive Corporation, Investor Relations, 6920 Seaway Blvd., Everett, WA 98203, or by calling (425) 446-5000 or upon written request to Altra Industrial Motion Corp., Investor Relations, 300 Granite St., Suite 201, Braintree, MA 02184, or by calling (781) 917-0527. Participants in the Solicitation This communication is not a solicitation of a proxy from any security holder of Altra. However, Fortive, Altra and certain of their respective directors and executive officers may be deemed to be participants in the solicitation of proxies from stockholders of Altra in connection with the proposed transaction under the rules of the SEC. Information about the directors and executive officers of Fortive may be found in its Annual Report on Form 10-K filed with the SEC on February 28, 2018 and its definitive proxy statement relating to its 2017 Annual Meeting filed with the SEC on April 17, 2017. Information about the directors and executive officers of Altra may be found in its Annual Report on Form 10-K filed with the SEC on February 23, 2018 and its definitive proxy statement relating to its 2018 Annual Meeting filed with the SEC on March 23, 2018.
Safe Harbor Statement Cautionary Statement Regarding Forward Looking Statements: All statements, other than statements of historical fact included in this release are forward-looking statements, as that term is defined in the Private Securities Litigation Reform Act of 1995. These statements include, but are not limited to, any statement that may predict, forecast, indicate or imply future results, performance, achievements or events. Forward-looking statements can generally be identified by phrases such as "believes," "expects," "potential," "continues," "may," "should," "seeks," "predicts," "anticipates," "intends," "projects," "estimates," "plans," "could," "designed", "should be," and other similar expressions that denote expectations of future or conditional events rather than statements of fact. Forward-looking statements also may relate to strategies, plans and objectives for, and potential results of, future operations, financial results, financial condition, business prospects, growth strategy and liquidity, and are based upon financial data, market assumptions and management's current business plans and beliefs or current estimates of future results or trends available only as of the time the statements are made, which may become out of date or incomplete. Forward-looking statements are inherently uncertain, and investors must recognize that events could differ significantly from our expectations. These statements include, but may not be limited to, our expectation of the improvements in the industrial economy, the statements under “Business Outlook,” our expectations regarding economic conditions, our expectations regarding our tax rate, or expectations regarding our acquisition of Fortive’s A&S Platform, and the Company’s guidance for full year 2018. In addition to the risks and uncertainties noted in this release, there are certain factors that could cause actual results to differ materially from those anticipated by some of the statements made. These include: (1) competitive pressures, (2) changes in economic conditions in the United States and abroad and the cyclical nature of our markets, (3) loss of distributors, (4) the ability to develop new products and respond to customer needs, (5) risks associated with international operations, including currency risks, (6) accuracy of estimated forecasts of OEM customers and the impact of the current global economic environment on our customers, (7) risks associated with a disruption to our supply chain, (8) fluctuations in the costs of raw materials used in our products, (9) product liability claims, (10) work stoppages and other labor issues, (11) changes in employment, environmental, tax and other laws and changes in the enforcement of laws, (12) loss of key management and other personnel, (13) risks associated with compliance with environmental laws, (14) the ability to successfully execute, manage and integrate key acquisitions and mergers, (15) failure to obtain or protect intellectual property rights, (16) risks associated with impairment of goodwill or intangibles assets, (17) failure of operating equipment or information technology infrastructure, (18) risks associated with our debt leverage and operating covenants under our debt instruments, (19) risks associated with restrictions contained in our Credit Facility, (20) risks associated with compliance with tax laws, (21) risks associated with the global recession and volatility and disruption in the global financial markets, (22) risks associated with implementation of our ERP system, (23) risks associated with the Svendborg and Stromag acquisitions and integration and other acquisitions, (24) risks associated with certain minimum purchase agreements we have with suppliers, (25) risks associated with our exposure to variable interest rates and foreign currency exchange rates, (26) risks associated with interest rate swap contracts, (27) risks associated with our exposure to renewable energy markets, (28) risks related to regulations regarding conflict minerals, (29) risks related to restructuring and plant consolidations, (30) risks related to our pending acquisition of Fortive A&S, including (a) the possibility that the conditions to the consummation of the proposed transaction will not be satisfied, (b) failure to obtain, delays in obtaining or adverse conditions related to obtaining stockholder or regulatory approvals, (c) the ability to obtain the anticipated tax treatment of the proposed transaction and related proposed transactions, (d) risks relating to any unforeseen changes to or the effects on liabilities, future capital expenditures, revenue, expenses, synergies, indebtedness, financial condition, losses and future prospects, (e) the possibility that we may be unable to achieve expected synergies and operating efficiencies in connection with the proposed transaction within the expected time-frames or at all and to successfully integrate Fortive A&S, (f) expected or targeted future financial and operating performance and results, (g) operating costs, customer loss and business disruption (including, without limitation, difficulties in maintain relationships with employees, customers, clients or suppliers) being greater than expected following the proposed transaction, (h) failure to consummate or delay in consummating the proposed transaction for other reasons, (i) our ability to retain key executives and employees, (j) slowdowns or downturns in economic conditions generally and in the markets Fortive A&S’s businesses participate specifically, (k) slowdowns or downturns in the industrial economy, (l) lower than expected investments and capital expenditures in equipment that utilizes components produced by us or Fortive A&S, (m) lower than expected demand for our or Fortive A&S’s repair and replacement businesses, (n) our relationships with strategic partners, (o) the presence of competitors with greater financial resources than us and their strategic response to our products, (p) our ability to offset increased commodity and labor costs with increased prices, (q) our ability to successfully integrate the merged assets and the associated technology and achieve operational efficiencies, and (r) the integration of Fortive A&S being more difficult, time-consuming or costly than expected, and (31) other risks, uncertainties and other factors described in the Company's quarterly reports on Form 10-Q and annual reports on Form 10-K and in the Company's other filings with the U.S. Securities and Exchange Commission (SEC) or in materials incorporated therein by reference. Except as required by applicable law, Altra Industrial Motion Corp. does not intend to, update or alter its forward looking statements, whether as a result of new information, future events or otherwise.
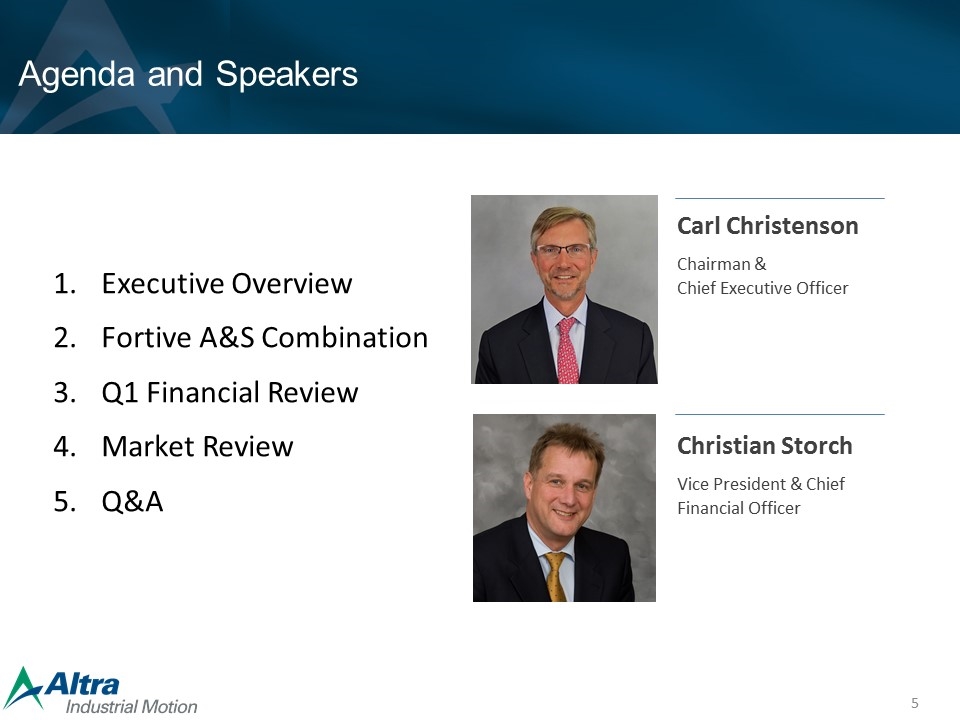
Executive Overview Fortive A&S Combination Q1 Financial Review Market Review Q&A Agenda and Speakers Carl Christenson Chairman & Chief Executive Officer Christian Storch Vice President & Chief Financial Officer
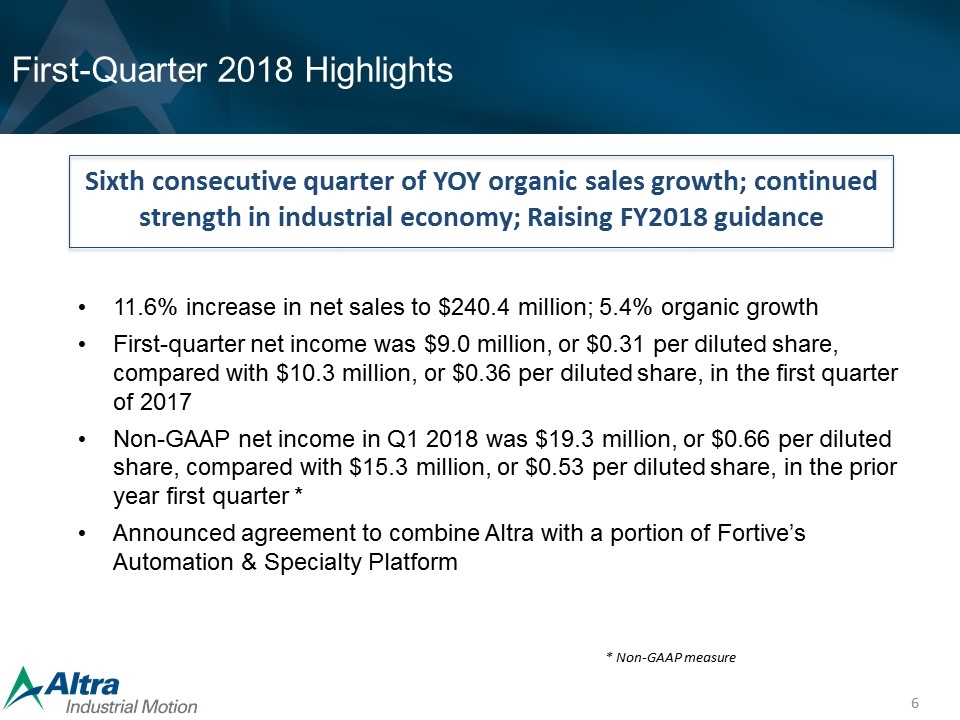
Sixth consecutive quarter of YOY organic sales growth; continued strength in industrial economy; Raising FY2018 guidance 11.6% increase in net sales to $240.4 million; 5.4% organic growth First-quarter net income was $9.0 million, or $0.31 per diluted share, compared with $10.3 million, or $0.36 per diluted share, in the first quarter of 2017 Non-GAAP net income in Q1 2018 was $19.3 million, or $0.66 per diluted share, compared with $15.3 million, or $0.53 per diluted share, in the prior year first quarter * Announced agreement to combine Altra with a portion of Fortive’s Automation & Specialty Platform First-Quarter 2018 Highlights * Non-GAAP measure
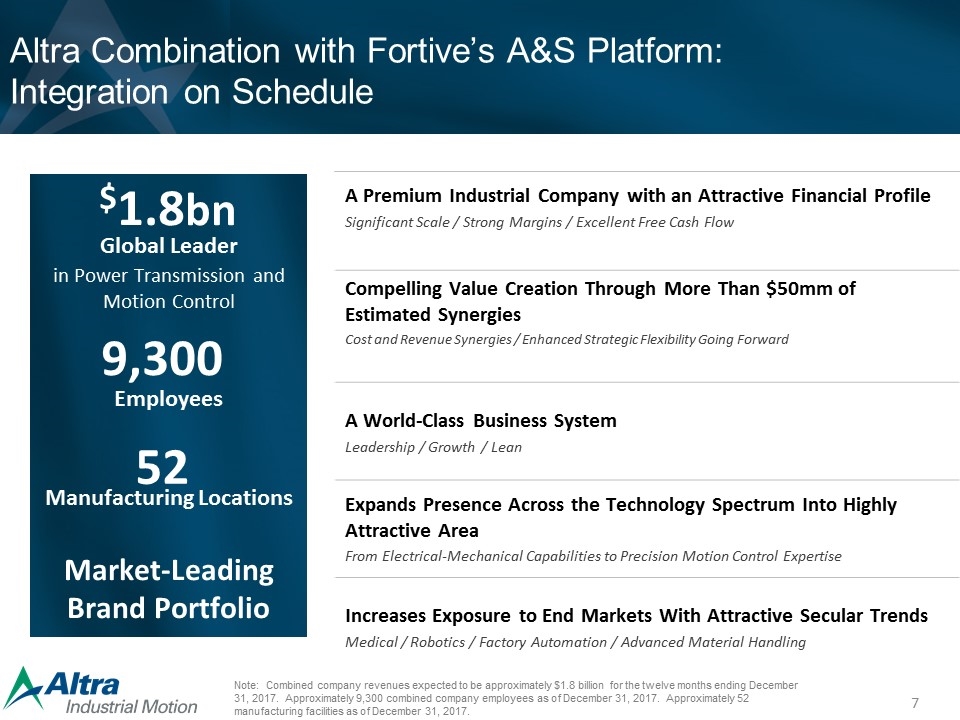
Altra Combination with Fortive’s A&S Platform: Integration on Schedule A Premium Industrial Company with an Attractive Financial Profile Significant Scale / Strong Margins / Excellent Free Cash Flow Compelling Value Creation Through More Than $50mm of Estimated Synergies Cost and Revenue Synergies / Enhanced Strategic Flexibility Going Forward A World-Class Business System Leadership / Growth / Lean Expands Presence Across the Technology Spectrum Into Highly Attractive Area From Electrical-Mechanical Capabilities to Precision Motion Control Expertise Increases Exposure to End Markets With Attractive Secular Trends Medical / Robotics / Factory Automation / Advanced Material Handling Note: Combined company revenues expected to be approximately $1.8 billion for the twelve months ending December 31, 2017. Approximately 9,300 combined company employees as of December 31, 2017. Approximately 52 manufacturing facilities as of December 31, 2017. Market-Leading Brand Portfolio $1.8bn Employees 9,300 Global Leader in Power Transmission and Motion Control 52 Manufacturing Locations
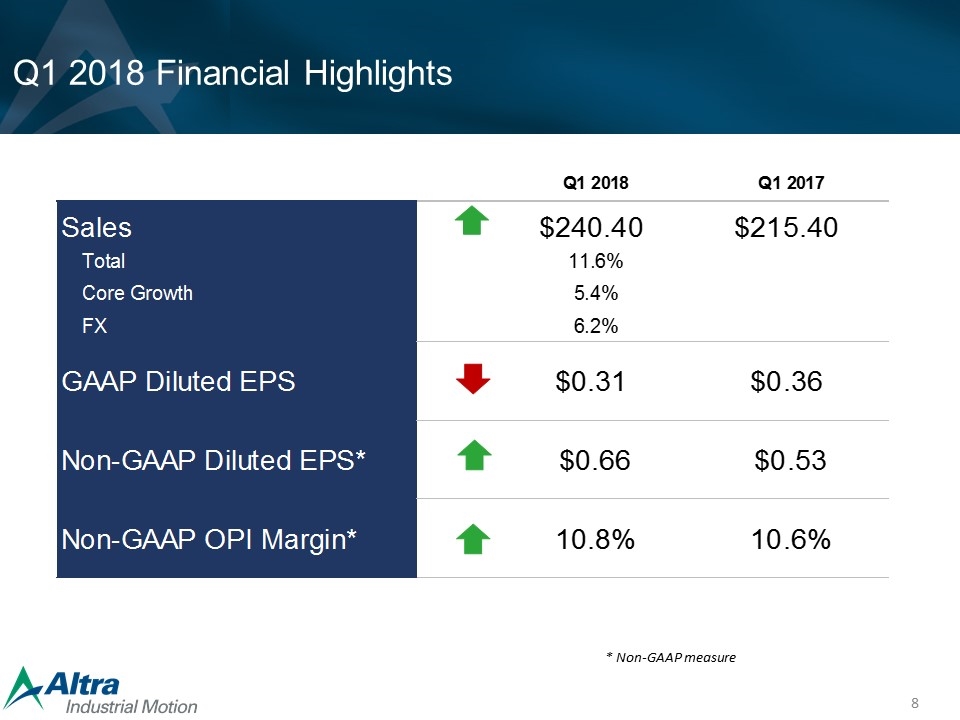
Q1 2018 Financial Highlights * Non-GAAP measure Sales Total Core Growth FX GAAP Diluted EPS Non-GAAP Diluted EPS* Non-GAAP OPI Margin* Q1 2018 Q1 2017 $240.40 $215.40 11.6% 5.4% 6.2% $0.31 $0.36 $0.66 $0.53 10.8% 10.6%
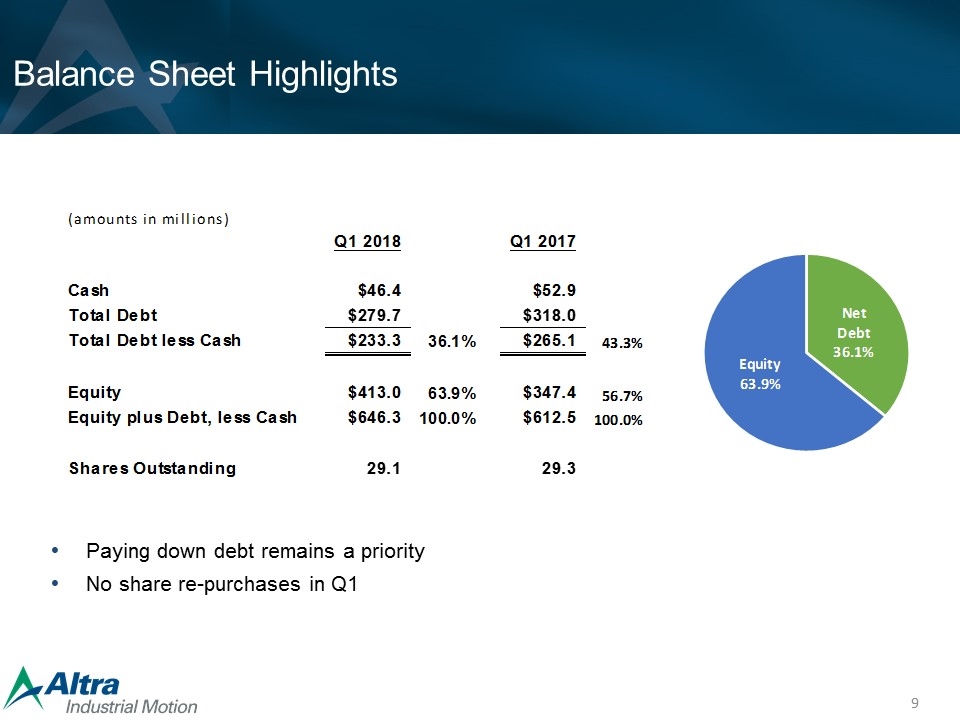
Balance Sheet Highlights Paying down debt remains a priority No share re-purchases in Q1 (amounts in millions) Q1 2018 Q1 2017 Cash$46.4 $52.9 Total Debt$279.7 $318.0 Total Debt less Cash$233.3 36.1% $265.1 43.3% Equity$413.0 63.9% $347.4 56.7% Equity plus Debt, less Cash$646.3 100.0% $612.5 100.0% Shares Outstanding 29.1 29.3 Net Debt 36.1% Equity 63.9%
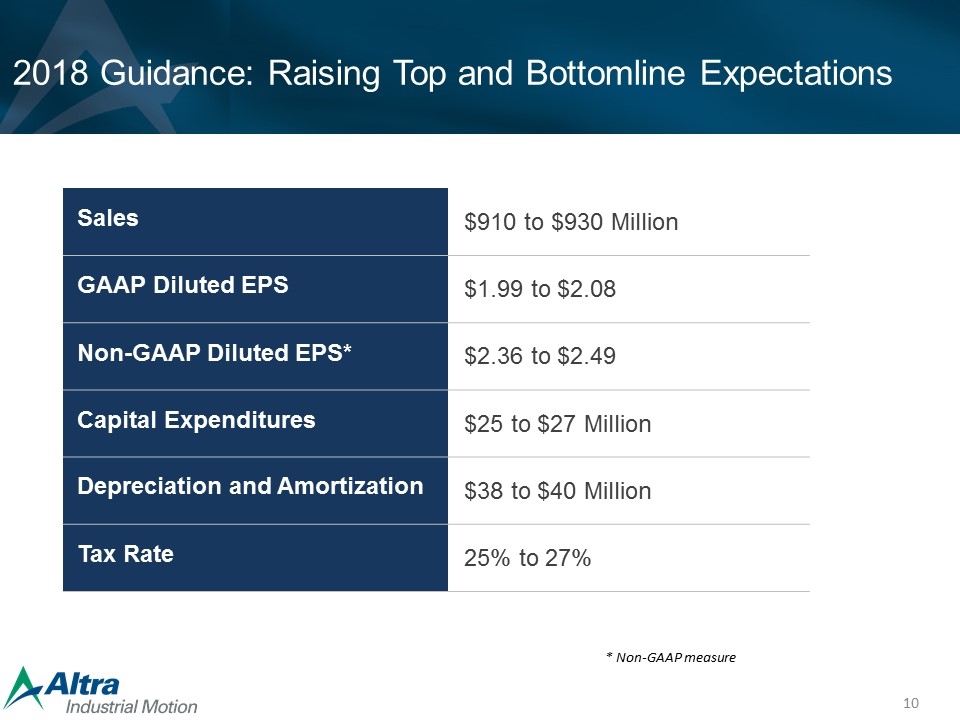
2018 Guidance: Raising Top and Bottomline Expectations Sales $910 to $930 Million GAAP Diluted EPS $1.99 to $2.08 Non-GAAP Diluted EPS* $2.36 to $2.49 Capital Expenditures $25 to $27 Million Depreciation and Amortization $38 to $40 Million Tax Rate 25% to 27% * Non-GAAP measure
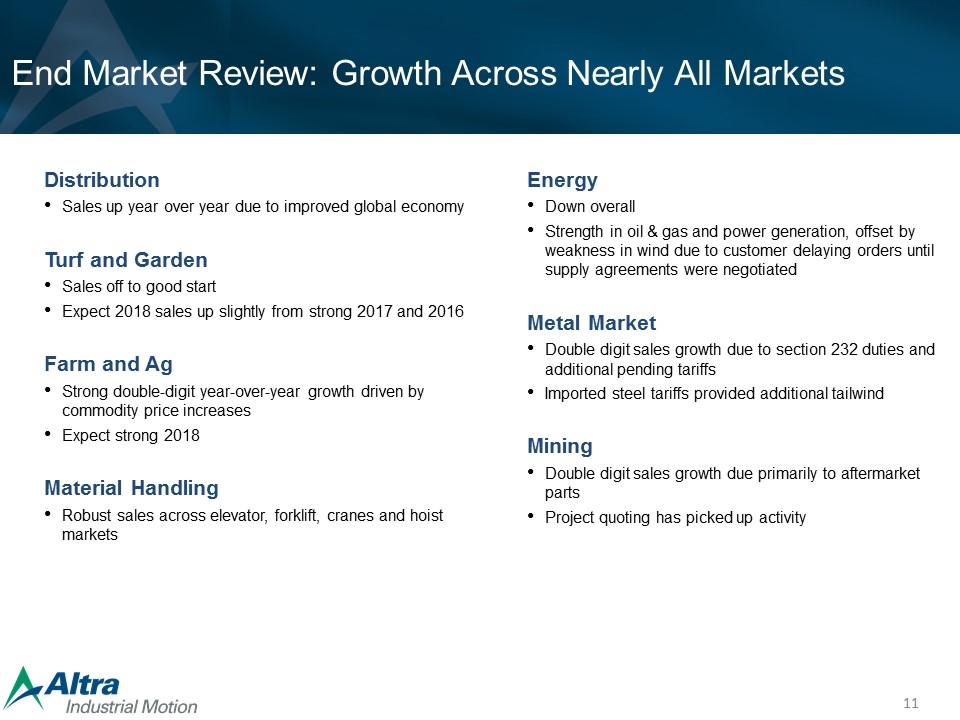
End Market Review: Growth Across Nearly All Markets Distribution Sales up year over year due to improved global economy Turf and Garden Sales off to good start Expect 2018 sales up slightly from strong 2017 and 2016 Farm and Ag Strong double-digit year-over-year growth driven by commodity price increases Expect strong 2018 Material Handling Robust sales across elevator, forklift, cranes and hoist markets Energy Down overall Strength in oil & gas and power generation, offset by weakness in wind due to customer delaying orders until supply agreements were negotiated Metal Market Double digit sales growth due to section 232 duties and additional pending tariffs Imported steel tariffs provided additional tailwind Mining Double digit sales growth due primarily to aftermarket parts Project quoting has picked up activity
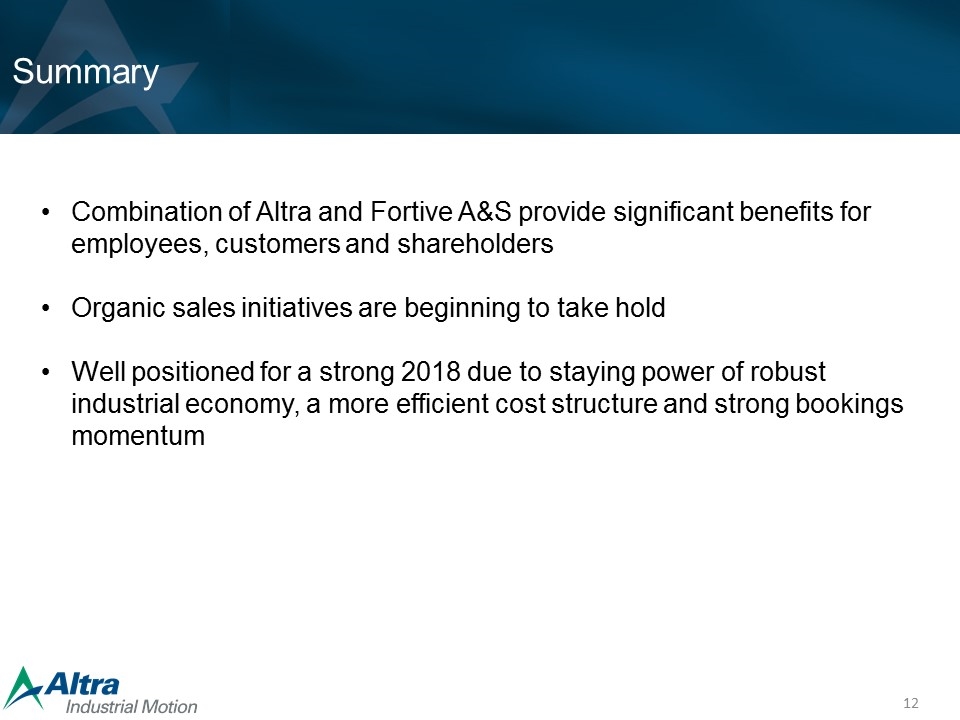
Summary Combination of Altra and Fortive A&S provide significant benefits for employees, customers and shareholders Organic sales initiatives are beginning to take hold Well positioned for a strong 2018 due to staying power of robust industrial economy, a more efficient cost structure and strong bookings momentum
Discussion of Non-GAAP Measures * As used in this release and the accompanying slides posted on the Company's website, non-GAAP diluted earnings per share, non-GAAP income from operations and non-GAAP net income are each calculated using either net income or income from operations that excludes acquisition related costs, restructuring costs, and other income or charges that management does not consider to be directly related to the Company's core operating performance. Non-GAAP gross profit calculated using gross profit that excludes income or charges that management does not consider to be directly related to the Company’s core operating performance. Non-GAAP diluted earnings per share is calculated by dividing non-GAAP net income by GAAP weighted average shares outstanding (diluted). Non-GAAP free cash flow is calculated by deducting purchases of property, plant and equipment from net cash flows from operating activities. Non-GAAP operating working capital is calculated by deducting accounts payable from net trade receivables plus inventories. Altra believes that the presentation of non-GAAP net income, non-GAAP income from operations, non-GAAP gross profit, non-GAAP diluted earnings per share, non-GAAP free cash flow and non-GAAP operating working capital provides important supplemental information to management and investors regarding financial and business trends relating to the Company's financial condition and results of operations.
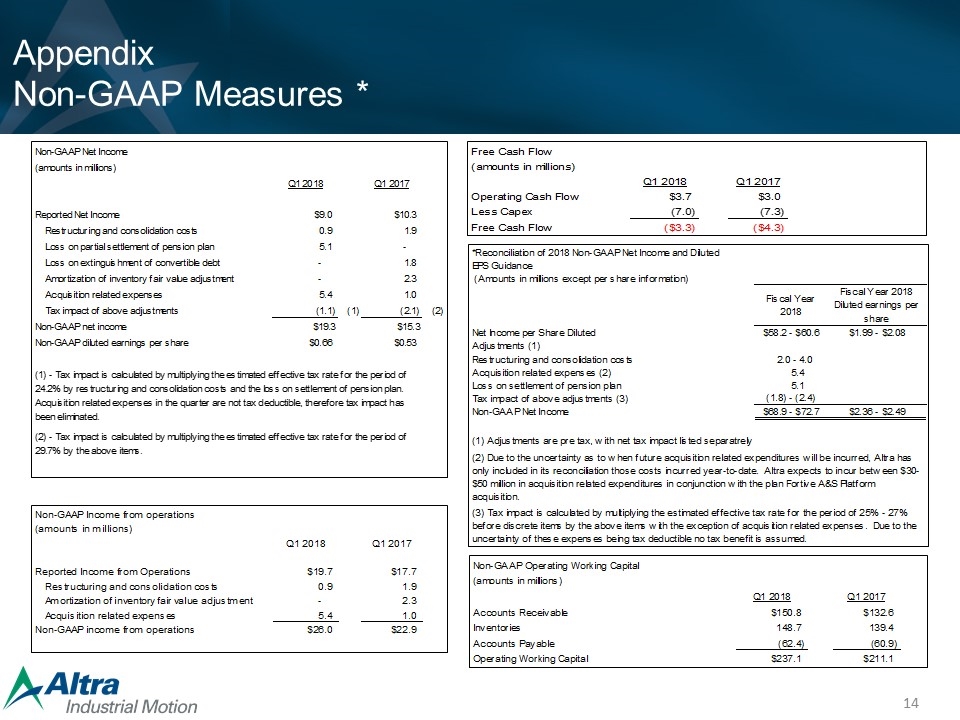
Appendix Non-GAAP Measures * Non-GAAP Income from operations ( amounts in millions) Q1 2017 Q1 2016 Reported Income from Operations $17.7 $15.0 Restructuring and consolidation costs 1.9 1.6 Amortization of inventory fair value adjustment 2.3 - Acquisition related expenses 1.0 Non-GAAP income from operations $22.9 $16.5 Free Cash Flow (amounts in millions) Q1 2017 Q1 2016 Operating Cash Flow $3.0 $6.1 Less Capex (7.3) (5.7) Free Cash Flow ($4.3) $0.4 Non-GAAP Diluted EPS Guidance (amounts in millions) Projected Fiscal Year 2016 Net Income per share Diluted $1.7 - $1.80 Restructuring and consolidation costs 0.06 Acquisition related expenses 0.03 Amortization of inventory fair value adjustment 0.06 Loss on extinguishment of convertible debt 0.04 Tax impact of anove adjustments** (0.06) Non-GAAP Diluted EPS Guidance $1.83 - $ 1.93 ** Tax impact is calculated by multiplying the effect tax rate for the period of 31% Non-GAAP Net Income (amounts in millions) Q1 2018 Q1 2017 Reported Net Income$9.0 $10.3 Restructuring and consolidation costs 0.9 1.9 Loss on partial settlement of pension plan 5.1 Loss on extinguishment of convertible debt - 1.8 Amortization of inventory fair value adjustment - 2.3 Acquisition related expenses 5.4 1.0 Tax impact of above adjustments (1.1) (1) (2.1) (2) Non-GAAP net income$19.3 $15.3 Non-GAAP diluted earnings per share$0.66 $0.53 (1) - Tax impact is calculated by multiplying the estimated effective tax rate for the period of 24.2% by restructuring and consolidation costs and the loss on settlement of pension plan. Acquisition related expenses in the quarter are not tax deductible, therefore tax impact has been eliminated.(2) - Tax impact is calculated by multiplying the estimated effective tax rate for the period of 29.7% by the above items. Non-GAAP Income from operations (amounts in millions) Q1 2018 Q1 2017 Reported Income from Operations$19.7 $17.7 Restructuring and consolidation costs 0.9 1.9 Amortization of inventory fair value adjustment - 2.3 Acquisition related expenses 5.4 1.0 Non-GAAP income from operations$26.0 $22.9 Free Cash Flow (amounts in millions) Q1 2018 Q1 2017 Operating Cash Flow$3.7 $3.0 Less Capex (7.0) (7.3) Free Cash Flow($3.3) ($4.3) *Reconciliation of 2018 Non-GAAP Net Income and Diluted EPS Guidance (Amounts in millions except per share information) Fiscal Year 2018Fiscal Year 2018 Diluted earnings per share Net Income per Share Diluted $58.2 - $60.6$1.99 - $2.08 Adjustments (1) Restructuring and consolidation costs 2.0 - 4.0 Acquisition related expenses (2) 5.4 Loss on settlement of pension plan 5.1 Tax impact of above adjustments (3) (1.8) - (2.4) Non-GAAP Net Income $68.9 - $72.7$2.36 - $2.49 (1) Adjustments are pre tax, with net tax impact listed separatrely (2) Due to the uncertainty as to when future acquisition related expenditures will be incurred, Altra has only included in its reconciliation those costs incurred year-to-date. Altra expects to incur between $30-$50 million in acquisition related expenditures in conjunction with the plan Fortive A&S Platform acquisition.(3) Tax impact is calculated by multiplying the estimated effective tax rate for the period of 25% - 27% before discrete items by the above items with the exception of acquisition related expenses. Due to the uncertainty of these expenses being tax deductible no tax benefit is assumed. Non-GAAP Operating Working Capital (amounts in millions) Q1 2018 Q1 2017 Accounts Receivable$150.8 $132.6 Inventories 148.7 139.4 Accounts Payable (62.4) (60.9) Operating Working Capital$237.1 $211.1 Non-GAAP Income from operations (amounts in millions) Q1 2018 Q1 2017 Reported Income from Operations $19.7 $17.7 Restructuring and consolidation costs 0.9 1.9 Amortization of inventory fair value adjustment 0 2.2999999999999998 Acquisition related expenses 5.4 1 Non-GAAP income from operations $26 $22.9 *Reconciliation of 2018 Non-GAAP Net Income and Diluted EPS Guidance (Amounts in millions except per share information) Fiscal Year 2018 Fiscal Year 2018 Diluted earnings per share Net Income per Share Diluted $58.2 - $60.6 $1.99 - $2.08 Adjustments (1) Restructuring and consolidation costs 2.0 - 4.0 Acquisition related expenses (2) 5.4 Loss on settlement of pension plan 5.0999999999999996 Tax impact of above adjustments (3) (1.8) - (2.4) Non-GAAP Net Income $68.9 - $72.7 $2.36 - $2.49 (1) Adjustments are pre tax, with net tax impact listed separatrely (2) Due to the uncertainty as to when future acquisition related expenditures will be incurred, Altra has only included in its reconciliation those costs incurred year-to-date. Altra expects to incur between $30-$50 million in acquisition related expenditures in conjunction with the plan Fortive A&S Platform acquisition. (3) Tax impact is calculated by multiplying the estimated effective tax rate for the period of 25% - 27% before discrete items by the above items with the exception of acquisition related expenses. Due to the uncertainty of these expenses being tax deductible no tax benefit is assumed.
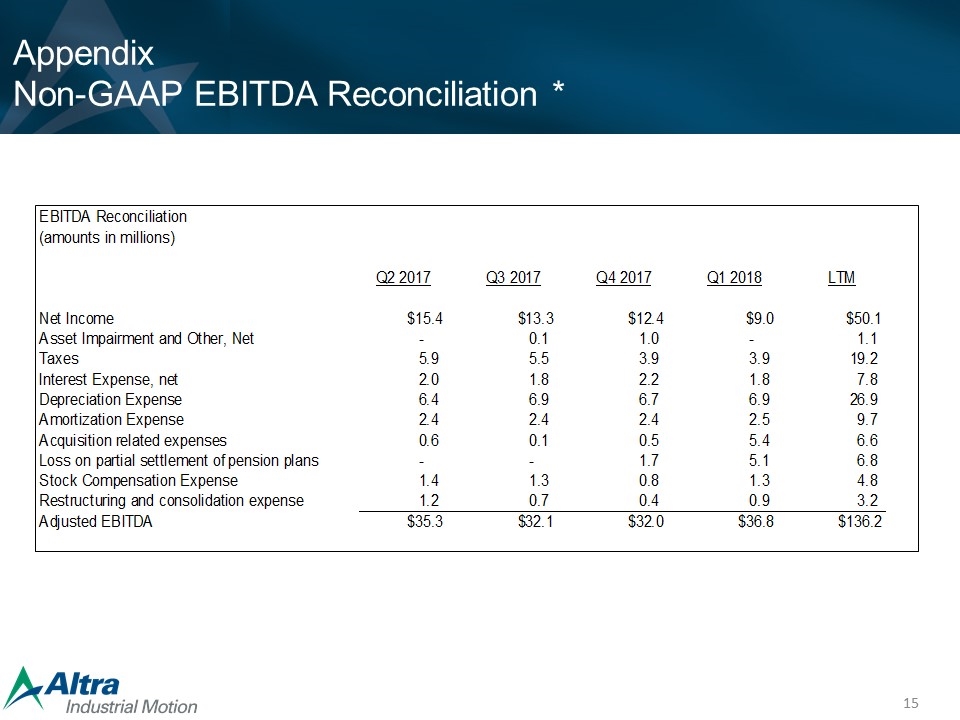
Appendix Non-GAAP EBITDA Reconciliation * EBITDA Reconciliation (amounts in millions) Q2 2017 Q3 2017 Q4 2017 Q1 2018 LTM Net Income$15.4 $13.3 $12.4 $9.0 $50.1 Asset Impairment and Other, Net - 0.1 1.0- 1.1 Taxes 5.9 5.5 3.9 3.9 19.2 Interest Expense, net 2.0 1.8 2.2 1.8 7.8 Depreciation Expense 6.4 6.9 6.7 6.9 26.9 Amortization Expense 2.4 2.4 2.4 2.5 9.7 Acquisition related expenses 0.6 0.1 0.5 5.4 6.6 Loss on partial settlement of pension plans - - 1.7 5.1 6.8 Stock Compensation Expense 1.4 1.3 0.8 1.3 4.8 Restructuring and consolidation expense 1.2 0.7 0.4 0.9 3.2 Adjusted EBITDA $35.3 $32.1 $32.0 $36.8 $136.2
