Attached files
| file | filename |
|---|---|
| 8-K - 8-K - Verisk Analytics, Inc. | a8kform04242018.htm |
Exhibit 99.1
Verisk Announces Operating Segment Change Effective for the Quarter Ended March 31, 2018
JERSEY CITY, N.J., April 26, 2018 - Verisk (Nasdaq:VRSK), a leading data analytics provider, has updated its operating segments, which will be reflected in its first-quarter 2018 earnings announcement on May 1.
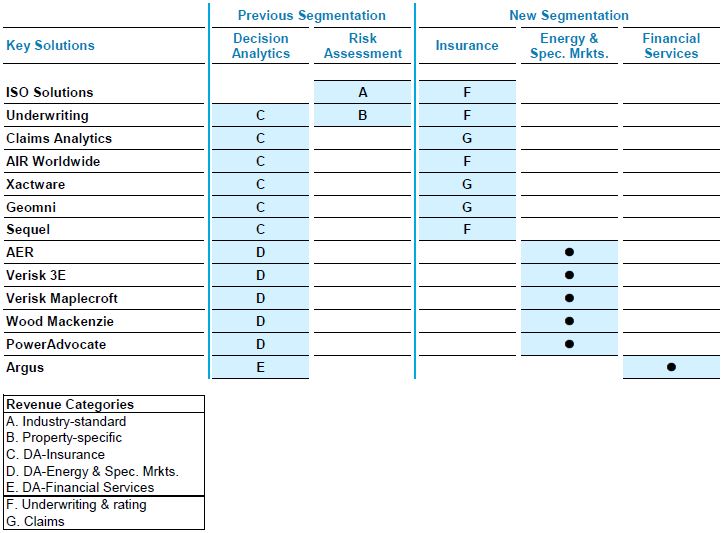
Verisk previously reported results based on its two operating segments, Decision Analytics and Risk Assessment. During the first quarter of 2018, the chief operating decision maker changed how he makes operating decisions, assesses the performance of the business, and allocates resources in a manner that caused its operating segments to change. Consequently, effective for the first quarter of 2018, the operating segments of Verisk are based on three vertical markets it serves: Insurance, Energy and Specialized Markets, and Financial Services.
Insurance includes underwriting & rating, claims analytics, catastrophe modeling, repair cost estimating, and aerial imagery and remote sensing solutions.
Energy and Specialized Markets includes its energy business, environmental health and safety services, and weather risk solutions.
Financial Services includes the financial services and retail analytics solutions.
To assist in the analysis of the Company’s new reportable segment structure, attached to this press release are the unaudited operating results for each of the four quarters and full year of 2017 and 2016 and full year of 2015 recast to reflect the new operating segments. Such information will also be available on the Company’s Current Report on Form 8-K to be furnished to the U.S. Securities and Exchange Commission. Also attached to this press release is an exhibit that details the mapping of the Company’s business units under the old and new operating segments.
Verisk’s management team will host a teleconference on tomorrow, April 27, 2018, at 10:00 a.m. EDT (7:00 a.m. PDT, 3:00 p.m. BST) to discuss the new operating segments. The discussion will be available through dial-in number 1-877-755-3792 for U.S./Canada participants or 512-961-6560 for international participants.
About Verisk
Verisk (Nasdaq:VRSK) is a leading data analytics provider serving customers in insurance, energy and specialized markets, and financial services. Using advanced technologies to collect and analyze billions of records, Verisk draws on unique data assets and deep domain expertise to provide first-to-market innovations that are integrated into customer workflows. Verisk offers predictive analytics and decision support solutions to customers in rating, underwriting, claims, catastrophe and weather risk, global risk analytics, natural resources intelligence, economic forecasting, and many other fields. Around the world, Verisk helps customers protect people, property, and financial assets.
Headquartered in Jersey City, N.J., Verisk operates in 30 countries and is a member of Standard & Poor’s S&P 500® Index. In 2017, Forbes magazine named Verisk to its America’s Best Mid-Size Employers list and to its World’s Most Innovative Companies list. Verisk is one of only seven companies to appear on both lists. For more information, please visit www.verisk.com.
1
Contact:
Investor Relations
Lee Shavel
Chief Financial Officer
Verisk
201-469-2073
IR@verisk.com
Media
Rich Tauberman
MWWPR (for Verisk)
202-600-4546
rtauberman@mww.com
2
VERISK ANALYTICS, INC.
SEGMENT REPORTING STRUCTURE
3
VERISK ANALYTICS, INC.
HISTORICAL FINANCIAL RESULTS FROM CONTINUING OPERATIONS (UNAUDITED)
For the Years Ended December 31, 2017, 2016 and 2015
Q1 2017 | Q2 2017 | Q3 2017 | Q4 2017 | FY 2017 | Q1 2016 | Q2 2016 | Q3 2016 | Q4 2016 | FY 2016 | FY 2015 | |||||||||||||||||||||||||||||||||
(In millions) | |||||||||||||||||||||||||||||||||||||||||||
Revenues: | |||||||||||||||||||||||||||||||||||||||||||
Insurance | $ | 366.9 | $ | 382.4 | $ | 396.0 | $ | 405.3 | $ | 1,550.6 | $ | 350.2 | $ | 355.3 | $ | 354.0 | $ | 359.6 | $ | 1,419.1 | $ | 1,330.6 | |||||||||||||||||||||
Energy and Specialized Markets | 106.3 | 110.3 | 111.4 | 116.6 | 444.6 | 112.9 | 111.1 | 109.1 | 109.7 | 442.8 | 308.8 | ||||||||||||||||||||||||||||||||
Financial Services | 29.4 | 30.5 | 41.7 | 48.4 | 150.0 | 29.6 | 31.9 | 35.0 | 36.8 | 133.3 | 121.3 | ||||||||||||||||||||||||||||||||
Revenues | $ | 502.6 | $ | 523.2 | $ | 549.1 | $ | 570.3 | $ | 2,145.2 | $ | 492.7 | $ | 498.3 | $ | 498.1 | $ | 506.1 | $ | 1,995.2 | $ | 1,760.7 | |||||||||||||||||||||
Adjusted EBITDA: | |||||||||||||||||||||||||||||||||||||||||||
Insurance | $ | 203.8 | $ | 210.5 | $ | 221.4 | $ | 220.1 | $ | 855.8 | $ | 199.9 | $ | 196.7 | $ | 200.1 | $ | 199.8 | $ | 796.5 | $ | 762.5 | |||||||||||||||||||||
Energy and Specialized Markets | 31.7 | 34.1 | 33.3 | 34.5 | 133.6 | 38.7 | 36.3 | 37.0 | 41.3 | 153.3 | 103.8 | ||||||||||||||||||||||||||||||||
Financial Services | 10.2 | 9.5 | 17.6 | 21.1 | 58.4 | 9.8 | 12.1 | 16.2 | 16.8 | 54.9 | 47.6 | ||||||||||||||||||||||||||||||||
Adjusted EBITDA | 245.7 | 254.1 | 272.3 | 275.7 | 1,047.8 | 248.4 | 245.1 | 253.3 | 257.9 | 1,004.7 | 913.9 | ||||||||||||||||||||||||||||||||
Non-recurring items | — | — | — | — | — | — | — | (0.6 | ) | (18.8 | ) | (19.4 | ) | 58.6 | |||||||||||||||||||||||||||||
Depreciation and amortization of fixed assets | (33.8 | ) | (31.8 | ) | (33.8 | ) | (36.2 | ) | (135.6 | ) | (31.9 | ) | (29.3 | ) | (29.5 | ) | (28.4 | ) | (119.1 | ) | (96.6 | ) | |||||||||||||||||||||
Amortization of intangible assets | (22.3 | ) | (23.9 | ) | (27.5 | ) | (28.1 | ) | (101.8 | ) | (23.9 | ) | (23.8 | ) | (22.7 | ) | (22.1 | ) | (92.5 | ) | (70.4 | ) | |||||||||||||||||||||
Interest expense | (28.4 | ) | (28.5 | ) | (30.3 | ) | (32.2 | ) | (119.4 | ) | (32.0 | ) | (31.5 | ) | (28.1 | ) | (28.4 | ) | (120.0 | ) | (121.4 | ) | |||||||||||||||||||||
Provision for income taxes | (52.4 | ) | (48.9 | ) | (60.0 | ) | 25.4 | (135.9 | ) | (50.9 | ) | (53.8 | ) | (44.8 | ) | (52.7 | ) | (202.2 | ) | (196.6 | ) | ||||||||||||||||||||||
Income from continuing operations | $ | 108.8 | $ | 121.0 | $ | 120.7 | $ | 204.6 | $ | 555.1 | $ | 109.7 | $ | 106.7 | $ | 127.6 | $ | 107.5 | $ | 451.5 | $ | 487.5 | |||||||||||||||||||||
Adjusted EBITDA margin: | |||||||||||||||||||||||||||||||||||||||||||
Insurance | 55.6 | % | 55.0 | % | 55.9 | % | 54.3 | % | 55.2 | % | 57.1 | % | 55.4 | % | 56.6 | % | 55.5 | % | 56.1 | % | 57.3 | % | |||||||||||||||||||||
Energy and Specialized Markets | 29.8 | % | 30.9 | % | 29.8 | % | 29.6 | % | 30.0 | % | 34.3 | % | 32.7 | % | 33.9 | % | 37.7 | % | 34.6 | % | 33.6 | % | |||||||||||||||||||||
Financial Services | 34.6 | % | 31.3 | % | 42.4 | % | 43.5 | % | 39.0 | % | 33.0 | % | 37.8 | % | 46.3 | % | 45.8 | % | 41.1 | % | 39.3 | % | |||||||||||||||||||||
Total adjusted EBITDA margin | 48.9 | % | 48.6 | % | 49.6 | % | 48.3 | % | 48.8 | % | 50.4 | % | 49.2 | % | 50.9 | % | 50.9 | % | 50.4 | % | 51.9 | % | |||||||||||||||||||||
Adjusted organic EBITDA margin: | |||||||||||||||||||||||||||||||||||||||||||
Insurance | 56.2 | % | 56.1 | % | 58.0 | % | 55.8 | % | 56.5 | % | 57.1 | % | 55.4 | % | 56.6 | % | 55.8 | % | 56.2 | % | 57.3 | % | |||||||||||||||||||||
Energy and Specialized Markets | 30.6 | % | 31.2 | % | 31.1 | % | 30.1 | % | 30.7 | % | 20.5 | % | 15.5 | % | 35.0 | % | 38.8 | % | 33.4 | % | 23.5 | % | |||||||||||||||||||||
Financial Services | 35.5 | % | 35.3 | % | 47.9 | % | 48.6 | % | 42.5 | % | 33.0 | % | 37.8 | % | 46.3 | % | 45.8 | % | 41.2 | % | 39.3 | % | |||||||||||||||||||||
Total adjusted organic EBITDA margin | 49.7 | % | 49.8 | % | 51.9 | % | 49.8 | % | 50.3 | % | 53.2 | % | 51.8 | % | 51.3 | % | 51.6 | % | 51.9 | % | 53.9 | % | |||||||||||||||||||||
Income from continuing operations margin | 21.7 | % | 23.1 | % | 22.0 | % | 35.9 | % | 25.9 | % | 22.3 | % | 21.4 | % | 25.6 | % | 21.2 | % | 22.6 | % | 27.7 | % | |||||||||||||||||||||
4
VERISK ANALYTICS, INC.
HISTORICAL FINANCIAL RESULTS FROM CONTINUING OPERATIONS (UNAUDITED) (Continued)
For the Years Ended December 31, 2017 and 2016
Q1 2017 | Q2 2017 | Q3 2017 | Q4 2017 | FY 2017 | Q1 2016 | Q2 2016 | Q3 2016 | Q4 2016 | FY 2016 | ||||||||||||||||||||||||||||||
Revenue growth: | |||||||||||||||||||||||||||||||||||||||
Insurance | 4.8 | % | 7.6 | % | 11.9 | % | 12.7 | % | 9.3 | % | 8.2 | % | 5.8 | % | 6.3 | % | 6.3 | % | 6.6 | % | |||||||||||||||||||
Energy and Specialized Markets | (5.9 | )% | (0.7 | )% | 2.1 | % | 6.3 | % | 0.4 | % | 361.9 | % | 70.4 | % | (0.1 | )% | (0.3 | )% | 43.4 | % | |||||||||||||||||||
Financial Services | (0.5 | )% | (4.5 | )% | 19.0 | % | 31.7 | % | 12.5 | % | (18.4 | )% | 15.9 | % | 23.9 | % | 25.9 | % | 9.9 | % | |||||||||||||||||||
Total revenue growth | 2.0 | % | 5.0 | % | 10.2 | % | 12.7 | % | 7.5 | % | 28.2 | % | 16.3 | % | 5.9 | % | 6.0 | % | 13.3 | % | |||||||||||||||||||
Organic revenue growth: | |||||||||||||||||||||||||||||||||||||||
Insurance | 4.1 | % | 6.3 | % | 9.3 | % | 9.1 | % | 7.2 | % | 8.2 | % | 5.7 | % | 6.2 | % | 5.9 | % | 6.5 | % | |||||||||||||||||||
Energy and Specialized Markets | (8.4 | )% | (5.4 | )% | 0.2 | % | 5.2 | % | (2.2 | )% | (3.6 | )% | (9.6 | )% | (4.9 | )% | (5.5 | )% | (5.5 | )% | |||||||||||||||||||
Financial Services | (0.5 | )% | (9.7 | )% | (2.4 | )% | 0.1 | % | (3.0 | )% | (18.4 | )% | 15.9 | % | 23.9 | % | 25.9 | % | 9.9 | % | |||||||||||||||||||
Total organic revenue growth | 0.9 | % | 2.6 | % | 6.5 | % | 7.6 | % | 4.5 | % | 5.0 | % | 5.4 | % | 4.7 | % | 4.5 | % | 4.9 | % | |||||||||||||||||||
Organic constant currency revenue growth: | |||||||||||||||||||||||||||||||||||||||
Insurance | 4.1 | % | 6.4 | % | 9.3 | % | 9.1 | % | 7.2 | % | 8.2 | % | 5.7 | % | 6.2 | % | 5.9 | % | 6.5 | % | |||||||||||||||||||
Energy and Specialized Markets | (2.1 | )% | 0.6 | % | 2.2 | % | 4.7 | % | 1.4 | % | (2.7 | )% | (9.2 | )% | 1.4 | % | 1.4 | % | — | % | |||||||||||||||||||
Financial Services | (0.2 | )% | (9.4 | )% | (2.4 | )% | (0.1 | )% | (2.9 | )% | (18.2 | )% | 16.3 | % | 24.3 | % | 26.1 | % | 10.2 | % | |||||||||||||||||||
Total organic constant currency revenue growth | 2.5 | % | 4.1 | % | 7.0 | % | 7.4 | % | 5.3 | % | 5.1 | % | 5.5 | % | 6.2 | % | 6.2 | % | 5.8 | % | |||||||||||||||||||
Adjusted EBITDA growth: | |||||||||||||||||||||||||||||||||||||||
Insurance | 2.0 | % | 7.0 | % | 10.6 | % | 10.3 | % | 7.5 | % | 13.6 | % | 3.9 | % | (1.6 | )% | 3.1 | % | 4.4 | % | |||||||||||||||||||
Energy and Specialized Markets | (18.2 | )% | (6.1 | )% | (10.3 | )% | (16.4 | )% | (12.9 | )% | 570.2 | % | 92.9 | % | (10.6 | )% | 9.5 | % | 47.9 | % | |||||||||||||||||||
Financial Services | 4.4 | % | (20.9 | )% | 8.8 | % | 24.9 | % | 6.4 | % | (47.1 | )% | 23.6 | % | 63.1 | % | 78.4 | % | 15.2 | % | |||||||||||||||||||
Total adjusted EBITDA growth | (1.1 | )% | 3.7 | % | 7.5 | % | 6.9 | % | 4.3 | % | 24.0 | % | 12.4 | % | (0.6 | )% | 7.0 | % | 9.9 | % | |||||||||||||||||||
Organic adjusted EBITDA growth: | |||||||||||||||||||||||||||||||||||||||
Insurance | 2.5 | % | 7.5 | % | 12.1 | % | 9.1 | % | 7.8 | % | 13.6 | % | 3.8 | % | (1.7 | )% | 3.3 | % | 4.5 | % | |||||||||||||||||||
Energy and Specialized Markets | (18.3 | )% | (9.8 | )% | (11.1 | )% | (15.9 | )% | (13.9 | )% | (16.3 | )% | (45.1 | )% | (12.2 | )% | 2.8 | % | (8.5 | )% | |||||||||||||||||||
Financial Services | 6.9 | % | (15.7 | )% | 1.0 | % | 6.2 | % | — | % | (47.1 | )% | 23.6 | % | 63.1 | % | 78.4 | % | 15.2 | % | |||||||||||||||||||
Total organic adjusted EBITDA growth | (0.6 | )% | 3.8 | % | 7.9 | % | 4.9 | % | 4.0 | % | 7.1 | % | 3.2 | % | (0.8 | )% | 6.1 | % | 3.7 | % | |||||||||||||||||||
Organic constant currency adjusted EBITDA growth: | |||||||||||||||||||||||||||||||||||||||
Insurance | 2.7 | % | 7.2 | % | 11.9 | % | 9.2 | % | 7.8 | % | 13.4 | % | 4.1 | % | (1.6 | )% | 3.2 | % | 4.5 | % | |||||||||||||||||||
Energy and Specialized Markets | (8.0 | )% | 0.5 | % | (8.6 | )% | (7.8 | )% | (6.2 | )% | (19.9 | )% | (46.9 | )% | 5.5 | % | 8.9 | % | 1.2 | % | |||||||||||||||||||
Financial Services | 5.0 | % | (17.8 | )% | 0.3 | % | 4.2 | % | (1.7 | )% | (46.9 | )% | 27.8 | % | 61.1 | % | 79.1 | % | 16.0 | % | |||||||||||||||||||
Total organic constant currency adjusted EBITDA growth | 1.3 | % | 5.0 | % | 8.2 | % | 6.3 | % | 5.2 | % | 6.8 | % | 3.6 | % | 2.0 | % | 7.1 | % | 4.8 | % | |||||||||||||||||||
5