Attached files
| file | filename |
|---|---|
| EX-31.1 - EXHIBIT 31.1 - Verisk Analytics, Inc. | ex31110k-q42016.htm |
| EX-31.2 - EXHIBIT 31.2 - Verisk Analytics, Inc. | ex31210k-q42016.htm |
| EX-23.1 - EXHIBIT 23.1 - Verisk Analytics, Inc. | ex23110k-q42016.htm |
| EX-32.1 - EXHIBIT 32.1 - Verisk Analytics, Inc. | ex32110k-q42016.htm |
| EX-21.1 - EXHIBIT 21.1 - Verisk Analytics, Inc. | ex21110k-q42016.htm |
UNITED STATES
SECURITIES AND EXCHANGE COMMISSION
Washington, D.C. 20549
FORM 10-K
☑ | ANNUAL REPORT PURSUANT TO SECTION 13 OR 15(d) OF THE SECURITIES EXCHANGE ACT OF 1934 |
For the fiscal year ended December 31, 2016
or
☐ | TRANSITION REPORT PURSUANT TO SECTION 13 OR 15(d) OF THE SECURITIES EXCHANGE ACT OF 1934 |
For the transition period from to
Commission file number 001-34480
VERISK ANALYTICS, INC.
(Exact name of registrant as specified in its charter)
Delaware | 26-2994223 | |
(State or other jurisdiction of incorporation or organization) | (I.R.S. Employer Identification No.) | |
545 Washington Boulevard Jersey City, NJ | 07310-1686 | |
(Address of principal executive offices) | (Zip Code) | |
(201) 469-2000
(Registrant’s telephone number, including area code)
Securities registered pursuant to Section 12(b) of the Act:
Title of each class | Name of each exchange on which registered | |
Common Stock $.001 par value | NASDAQ Global Select Market | |
Securities registered pursuant to Section 12(g) of the Act: None
Indicate by check mark if the registrant is a well-known seasoned issuer, as defined in Rule 405 of the Securities Act. ☑ Yes ☐ No
Indicate by check mark if the registrant is not required to file reports pursuant to Section 13 or Section 15(d) of the Act. ☐ Yes ☑ No
Indicate by check mark whether the registrant (1) has filed all reports required to be filed by Section 13 or 15(d) of the Securities Exchange Act of 1934 during the preceding 12 months (or for such shorter period that the registrant was required to file such reports), and (2) has been subject to such filing requirements for the past 90 days. ☑ Yes ☐ No
Indicate by check mark whether the registrant has submitted electronically and posted on its corporate Web site, if any, every Interactive Data File required to be submitted and posted pursuant to Rule 405 of Regulation S-T (§ 232.405 of this chapter) during the preceding 12 months (or for such shorter period that the registrant was required to submit and post such files). ☑ Yes ☐ No
Indicate by check mark if disclosure of delinquent filers pursuant to Item 405 of Regulation S-K (§ 229.405 of this chapter) is not contained herein, and will not be contained, to the best of registrant’s knowledge, in definitive proxy or information statements incorporated by reference in Part III of this Form 10-K or any amendment to this Form 10-K. ☐
Indicate by check mark whether the registrant is a large accelerated filer, an accelerated filer, a non-accelerated filer, or a smaller reporting company. See the definitions of “large accelerated filer,” “accelerated filer” and “smaller reporting company” in Rule 12b-2 of the Exchange Act.
☑ Large accelerated filer | ☐ Accelerated filer | ☐ Non-accelerated filer | ☐ Smaller reporting company | |||
(Do not check if a smaller reporting company) | ||||||
Indicate by check mark whether the registrant is a shell company (as defined in Rule 12b-2 of the Act). ☐ Yes ☑ No
As of June 30, 2016, the last business day of the registrant’s most recently completed second fiscal quarter, the aggregate market value of the registrant’s common stock held by non-affiliates of the registrant was $12,787,681,387 based on the closing price reported on the NASDAQ Global Select Market on such date.
As of February 17, 2017, there were 166,341,316 shares outstanding of the registrant's Common Stock, par value $.001.
DOCUMENTS INCORPORATED BY REFERENCE
Certain information required by Part III of this annual report on Form 10-K is incorporated by reference to our definitive Proxy Statement for our 2017 Annual Meeting of Stockholders, which will be filed with the Securities and Exchange Commission not later than 120 days after December 31, 2016.
1
INDEX
Page | |||
PART I | |||
Item 1. | |||
Item 1A. | |||
Item 1B. | |||
Item 2. | |||
Item 3. | |||
Item 4. | |||
PART II | |||
Item 5. | |||
Item 6. | |||
Item 7. | |||
Item 7A. | |||
Item 8. | |||
Item 9. | |||
Item 9A. | |||
Item 9B. | |||
PART III | |||
Item 10. | |||
Item 11. | |||
Item 12. | |||
Item 13. | |||
Item 14. | |||
PART IV | |||
Item 15. | |||
Item 16. | |||
Exhibit 10.16 | |||
Exhibit 10.17 | |||
Exhibit 21.1 | |||
Exhibit 23.1 | |||
Exhibit 31.1 | |||
Exhibit 31.2 | |||
Exhibit 32.1 | |||
2
Unless the context otherwise indicates or requires, as used in this annual report on Form 10-K, references to “we,” “us,” “our” or the “Company” refer to Verisk Analytics, Inc. and its subsidiaries.
In this annual report on Form 10-K, all dollar amounts are expressed in millions, unless indicated otherwise.
SPECIAL NOTE REGARDING FORWARD-LOOKING STATEMENTS
Verisk Analytics, Inc., or Verisk, has made statements under the captions “Business,” “Risk Factors,” “Management’s Discussion and Analysis of Financial Condition and Results of Operations,” and in other sections of this annual report on Form 10-K that are forward-looking statements. In some cases, you can identify these statements by forward-looking words such as “may,” “might,” “will,” “should,” “expects,” “plans,” “anticipates,” “believes,” “estimates,” “predicts,” “potential,” or “continue,” the negative of these terms and other comparable terminology. These forward-looking statements, which are subject to risks, uncertainties and assumptions about us, may include projections of our future financial performance, our anticipated growth strategies and anticipated trends in our business. These statements are only predictions based on our current expectations and projections about future events. There are important factors that could cause our actual results, level of activity, performance or achievements to differ materially from the results, level of activity, performance or achievements expressed or implied by the forward-looking statements, including those factors discussed under the caption entitled “Risk Factors.” You should specifically consider the numerous risks outlined under “Risk Factors.”
Although we believe the expectations reflected in the forward-looking statements are reasonable, we cannot guarantee future results, level of activity, performance or achievements. Moreover, neither we nor any other person assumes responsibility for the accuracy and completeness of any of these forward-looking statements. We are under no duty to update any of these forward-looking statements after the date of this annual report on Form 10-K to conform our prior statements to actual results or revised expectations.
3
PART I
Item 1. | Business |
Our Company
Verisk Analytics is a leading data analytics provider serving customers in insurance, natural resources and financial services. Using advanced technologies to collect and analyze billions of records, we draw on unique data assets and deep domain expertise to provide innovations that may be integrated into customer workflows. We offer predictive analytics and decision support solutions to customers in rating, underwriting, claims, catastrophe and weather risk, natural resources intelligence, economic forecasting, and many other fields. In the United States, or U.S., and around the world, we help customers protect people, property, and financial assets.
Our customers use our solutions to make better decisions about risk and opportunities with greater efficiency and discipline. We refer to these products and services as solutions due to the integration among our services and the flexibility that enables our customers to purchase components or a comprehensive package. These solutions take various forms, including data, expert insight, statistical models and tailored analytics all designed to allow our customers to make more logical decisions. We believe our solutions for analyzing risk positively impact our customers’ revenues and help them better manage their costs. In 2016, our customers included all of the top 100 property and casualty, or P&C, insurance providers in the U.S. for the lines of P&C services we offer, and 28 of the top 30 credit card issuers in North America, the United Kingdom and Australia, as well as 8 of the top 10 global energy providers around the world. We also work with a wide range of companies, governments and institutions across the energy, and metals and mining value chains. We believe that our commitment to our customers and the embedded nature of our solutions serve to strengthen and extend our relationships.
We believe that Verisk is uniquely positioned because of the set of distinctives or competitive advantages we cultivate and continue to expand. Our existing businesses, in addition to new product innovations, integrate the following four singular qualities into the foundation of our strategy.
Our Distinctives
•Unique Data Assets - Data is at the core of what we do. We use our proprietary data assets to develop predictive analytics and transformative models for our customers.
•Deep Domain Expertise - We have specialized and in-depth knowledge in a number of defined vertical markets, including insurance, healthcare, energy, financial services, and risk management. We understand that different verticals require different approaches, and our deep domain expertise adds value to our analytics in the markets we serve.
•Steady Stream of First-to-Market Innovations - We move quickly to be the first to market with new solutions. Typically, the marketplace assumes that those that are first to market are superior to the competition and better positioned to succeed.
•Deep Integration into Customer Workflows - By embedding our solutions into customer workflows, we help our customers better manage risk and optimize their bottom line. We achieve this goal by remaining closely connected to our customers at all times and serving their distinct needs.
We offer our solutions and services primarily through annual subscriptions or long-term agreements, which are typically pre-paid and represented over 80% of our revenues in 2016. For the year ended December 31, 2016, we had revenues of $1,995.2 million and net income of $591.2 million. For the five year period ended December 31, 2016, our revenues and net income grew at a compound annual growth rate, or CAGR, of 13.9% and 15.8%, respectively.
Our History
We trace our history to 1971, when Insurance Services Office, Inc., or ISO, started operations as a not-for-profit advisory and rating organization providing services to the U.S. P&C insurance industry. ISO was formed as an association of insurance companies to gather statistical data and other information from insurers and report to regulators, as required by law. ISO’s original functions also included developing programs to help insurers define and manage insurance products and providing information to help insurers determine their own independent premium rates. Insurers used and continue to use our offerings primarily in their product development, underwriting and rating functions.
Over the past two decades, we have transformed our business beyond its original functions by deepening and broadening our data assets, developing a set of integrated risk management solutions and services and addressing new markets.
4
Our expansion into analytics began when we acquired the American Insurance Services Group, or AISG, and certain operations and assets of the National Insurance Crime Bureau in 1997 and 1998, respectively. Those organizations brought to the company large databases of insurance claims, as well as expertise in detecting and preventing claims fraud. To further expand our business, in 2002, we acquired AIR Worldwide, or AIR, the technological leader in catastrophe modeling. In 2006, to bolster our position in the insurance claims field we acquired Xactware, a leading supplier of estimation software for professionals involved in building repair and reconstruction. In 2012, we acquired Argus Information & Advisory Services, LLC, or Argus, to expand our global presence providing information, competitive benchmarking, analytics, and customized services to financial institutions in the payments space. In 2015, we acquired Wood Mackenzie Limited, or Wood Mackenzie, to advance our strategy to expand internationally and position us in the global energy market.
Those acquisitions have added scale, geographic reach, highly skilled workforces, and a wide array of new capabilities to support our customers. They have helped to make us a leading provider of information and decision analytics for customers involved in the business of risk in the U.S. and selectively around the world.
On May 23, 2008, in contemplation of our initial public offering, or IPO, ISO formed Verisk Analytics, Inc., or Verisk, a Delaware corporation, to be the holding company for our business. Verisk was initially formed as a wholly-owned subsidiary of ISO. On October 6, 2009, in connection with our IPO, the Company effected a reorganization whereby ISO became a wholly-owned subsidiary of Verisk. Verisk common stock began trading on the NASDAQ Global Select Market on October 7, 2009, under the symbol “VRSK.”
Segments
We organize our business in two segments: Risk Assessment and Decision Analytics. See “Management’s Discussion and Analysis of Financial Condition and Results of Operations” in Part II of this annual report for additional information regarding our segments. See Note 18 of our consolidated financial statements included in this annual report on Form 10-K for further information.
Risk Assessment Segment
Our Risk Assessment segment serves our P&C insurance customers and focuses on prediction of loss, selection and pricing of risk, and compliance with their reporting requirements in each U.S. state in which they operate. Our customers include most of the P&C insurance providers in the U.S. In recent years we have expanded our offerings to also serve certain non-U.S. markets.
Industry-Standard Insurance Programs
We are the recognized leader in the U.S. for industry-standard insurance programs that help P&C insurers define coverages and issue policies. We provide policy language, prospective loss costs, policy writing rules, and a variety of other solutions for 26 lines of insurance. Our policy language, prospective loss cost information and policy writing rules can serve as integrated turnkey insurance programs for our customers. Insurance companies need to ensure that their policy language, rules, and rates comply with all applicable legal and regulatory requirements. Insurers must also make sure their policies remain competitive by promptly changing coverages in response to changes in statutes or case law. To meet their needs, we process approximately 2,400 regulatory filings and interface with state regulators in all 50 states plus the District of Columbia, Guam, Puerto Rico and the Virgin Islands each year to ensure smooth implementation of our rules and forms. When insurers choose to develop their own alternative programs, our industry-standard insurance programs also help regulators ensure that such insurers’ policies meet basic coverage requirements.
Standardized coverage language, which has been tested in litigation and tailored to reflect judicial interpretation, helps to ensure consistent treatment of claimants. As a result, our industry-standard language also simplifies claim settlements and can reduce the occurrence of costly litigation, because our language causes the meaning of coverage terminology to become established and known. Our policy language includes standard coverage language, endorsements and policy writing support language that assist our customers in understanding the risks they assume and the coverages they offer. With these policy programs, insurers also benefit from economies of scale. We have more than 120 specialized lawyers and insurance experts reviewing changes in each state’s insurance rules and regulations, including an average of more than 16,500 legislative bills, 6,100 regulatory actions and 2,000 court cases per year, to make any required changes to our policy language and rating information.
To cover the wide variety of risks in the marketplace, we offer a broad range of policy programs. For example, in the homeowners line of insurance, we maintain policy language and rules for 6 basic coverages, 289 national endorsements, and 601 state-specific endorsements.
5
The P&C insurance industry is heavily regulated in the U.S. P&C insurers are required to collect statistical data about their premiums and losses and to report that data to regulators in every state in which they operate. Our statistical agent services have enabled P&C insurers to meet those regulatory requirements for more than 45 years. We aggregate the data, and as a licensed or appointed “statistical agent” in all 50 states, Puerto Rico, and the District of Columbia, we report those statistics to insurance regulators. We are able to capture significant economies of scale given the level of penetration of this service within the U.S. P&C insurance industry.
To provide our customers and the regulators the information they require, we maintain one of the largest private databases in the world. Over the past four decades, we have developed core expertise in acquiring, processing, managing, and operating large and comprehensive databases that are the foundation of our Risk Assessment segment. We use our proprietary technology to assemble, organize and update vast amounts of detailed information submitted by our customers. We supplement this data with publicly available information.
Each year, P&C insurers send us approximately 3.5 billion detailed individual records of insurance transactions, such as insurance premiums collected or losses incurred. We maintain a database of more than 20.0 billion statistical records, including approximately 8.2 billion commercial lines records and approximately 11.8 billion personal lines records. We collect unit transaction detail of each premium and loss record, which enhances the validity, reliability and accuracy of our data sets and our actuarial analyses. Our proprietary quality process includes more than 2,800 separate checks to ensure that the data meets our high standards of quality.
We provide actuarial services to help our customers analyze and price their risks. Using our large database of premium and loss data, our actuaries are able to perform sophisticated analyses using our predictive models and analytic methods to help our P&C insurance customers with pricing, loss reserving, and marketing. We distribute a number of actuarial solutions and offer flexible services to meet our customers’ needs. In addition, our actuarial consultants provide customized services for our customers that include assisting them with the development of independent insurance programs, analysis of their own underwriting experience, development of classification systems and rating plans, and a wide variety of other business decisions. We also supply information to a wide variety of customers in other markets including reinsurance and government agencies.
We project customers' future losses and loss expenses using a broad set of data. Those projections tend to be more reliable than if our customers used their own data exclusively. We make a number of actuarial adjustments before the data is used to estimate future costs. Our customers can use our estimates of future costs in making independent decisions about the prices charged for their policies. For most P&C insurers, in most lines of business, we believe our estimates of future costs are an essential input to rating decisions. Our actuarial products and services are also used to create the analytics underlying our industry-standard insurance programs described above.
By building on our insurance industry expertise and recent acquisitions, we have expanded our solution set to serve customers in certain non-U.S. markets.
Property-Specific Rating and Underwriting Information
We gather information on individual properties and communities so that insurers can use our information to evaluate and price personal and commercial property insurance, as well as business owners, or BOP, commercial auto and general liability insurance, and workers compensation coverages. Our property-specific rating and underwriting information allow our customers to understand, quantify, underwrite, mitigate, and avoid potential loss to commercial properties. Our ProMetrix operating platform contains business and risk information on 26 million entities, loss costs and other vital information on more than 3.7 million commercial buildings in the U.S. and also holds information on more than 6.5 million individual businesses occupying those buildings. We have a staff of approximately 600 field representatives strategically located around the U.S. who observe and report on conditions at commercial and residential properties, evaluate community fire-protection capabilities and assess the effectiveness of municipal building-code enforcement. Each year, our field staff visits over 285,000 commercial properties to collect information on new buildings and verify building attributes.
We also provide proprietary analytic measures for individual communities to mitigate losses from important perils. Nearly every property insurer in the U.S. uses our evaluations of community firefighting capabilities to help determine premiums for fire insurance throughout the country. We provide field-verified and validated data on the fire protection services for approximately 46,000 fire response jurisdictions. We also offer services to evaluate the effectiveness of community enforcement of building codes and the efforts of communities to mitigate damage from flooding. Further, we provide information on the insurance rating territories, premium taxes, crime risk, and hazards of windstorm, earthquake, wildfire, and other perils. To supplement our data on specific commercial properties and individual communities, we have assembled, from a variety of internal and select third-party sources, information on hazards related to geographic locations representing every postal address in the U.S. Insurers use this information for policy quoting and analyzing risk concentration in geographical
6
areas. We also make our data and analytics available to commercial real estate lenders to allow them to better understand risks associated with properties they lend against.
We have begun to expand our footprint of data and solutions to include both U.S. and international markets.
Decision Analytics Segment
In the Decision Analytics segment, we develop predictive models to forecast scenarios and produce both standard and customized analytics that help our customers better manage their businesses, including predicting loss, selecting and pricing risk, detecting fraud before and after a loss event, and quantifying losses. Our businesses in this segment are categorized by the primary vertical end market for their services.
Our solutions are built on unique data sets which are dynamic and updated based on new data and events. Our analytic methods and proprietary data sets combined with our deep industry expertise, provide us with a significant competitive advantage.
Insurance
Our insurance solutions provide our customers analytics in the areas of fraud detection, catastrophe modeling, loss estimation, and underwriting, including emerging areas of interest within these categories.
We are a leading provider of fraud-detection tools for the P&C insurance industry. Our anti-fraud solutions improve our customers’ profitability by both predicting the likelihood that fraud is occurring and detecting suspicious activity after it has occurred. When a claim is submitted, our system searches our database and returns information about other claims filed by the same individuals or businesses (either as claimants or insurers), that helps our customers determine if fraud has occurred. The system searches for matches in identifying informational fields, such as name, address, Social Security number, vehicle identification number, driver’s license number, tax identification number, or other parties to the loss. Our system also includes advanced name and address searching to perform intelligent searches and improve the overall quality of the matches. Information from match reports speeds payment of meritorious claims while providing a defense against fraud and can lead to denial of a claim, negotiation of a reduced award, or further investigation by the insurer or law enforcement.
We have a comprehensive system used by claims adjusters and investigations professionals to process claims and fight fraud. Claims databases are one of the key tools in the fight against insurance fraud. The benefits of a single all-claims database include improved efficiency in reporting data and searching for information, enhanced capabilities for detecting suspicious claims and superior information for investigating fraudulent claims, suspicious individuals, and possible fraud rings. Our database contains information on approximately 1.1 billion claims and is the world’s largest database of P&C claims information used for claims and investigations. Insurers and other participants submit new claims more than 200,000 a day on average across all categories of the U.S. P&C insurance industry.
We also provide an expert scoring system that helps distinguish between suspicious and meritorious claims, and products that use link analysis technology to help visualize and fight insurance fraud.
We are also a leader in and pioneered the field of probabilistic catastrophe modeling used by insurers, reinsurers and financial institutions to manage their catastrophe risk. Our models of global natural hazards, which form the basis of our solutions, enable companies to identify, quantify and plan for the financial consequences of catastrophic events. We have developed models, covering natural hazards, including hurricanes, earthquakes, winter storms, tornadoes, hailstorms, and floods, for potential loss events in more than 100 countries, as well as pandemics worldwide. We have also developed and introduced a probabilistic terrorism model capable of quantifying the risk in the U.S. from this emerging threat, which supports pricing and underwriting decisions down to the level of an individual policy. Our newest model also addresses cyber losses.
We also provide data, analytics and networking products for professionals involved in estimating all phases of building repair and reconstruction. We provide solutions for every phase of a building’s life, including:
• | quantifying the ultimate cost of repair or reconstruction of damaged or destroyed buildings, |
• | aiding in the settlement of insurance claims, |
• | tracking the process of repair or reconstruction and facilitating communication among insurers, adjusters, contractors, and policyholders. |
To help our customers estimate repair costs, we provide a solution that assists contractors and insurance adjusters in estimating repairs using a patented plan-sketching program. The program allows our customers to sketch floor plans, roof plans
7
and wall-framing plans and automatically calculates material and labor quantities for the construction of walls, floors, footings, and roofs.
We also offer our customers access to wholesale and retail price lists, which include structural repair and restoration pricing for 468 separate economic areas in North America. We revise this information monthly, and, in the aftermath of a major disaster, we can update the price lists as often as weekly to reflect rapid price changes. Our structural repair and cleaning database contains approximately 21,000 unit-cost line items. For each line item such as smoke cleaning, water extraction and hazardous cleanup, we report time and material pricing, including labor, labor productivity rates (for new construction and restoration), labor burden and overhead, material costs, and equipment costs. We improve our reported pricing data by several methods including direct market surveys and an analysis of the actual claims experiences of our customers. We estimate that about 80% of insurance repair contractors and service providers in the U.S. and Canada with computerized estimating systems use our building and repair pricing data. Use of such a large percentage of the industry’s claims data leads to accurate reporting of pricing information, which we believe is unmatched in the industry.
Our estimates allow our customers to set loss reserves, deploy field adjusters and verify internal company estimates. Our estimates also keep insurers, their customers, regulators, and other interested parties informed about the total costs of disasters. We also provide our customers access to daily reports on severe weather and catastrophes and we maintain a database of information on catastrophe losses in the U.S. dating back to 1950.
We also are a leading provider of solutions for the personal underwriting markets, including homeowners and auto lines. We build and maintain widely used, industry-standard tools that assist insurers in underwriting and rating, i.e., measuring and selecting risks and pricing coverage appropriately to ensure fairness to the consumer and a reasonable return for the insurer. Our solutions apply advanced predictive analytics to our deep reservoir of data and information to quickly and precisely gauge the degree and cost of risk.
Our solutions span a wide range of property/casualty insurance, encompassing personal and commercial lines of coverage that protect private residences, private and commercial vehicles, and businesses.
We continually pursue new solutions that help our customers to keep abreast of changing markets and technology. For example, we provide tools and platforms to help insurers, their customers, and providers of products and services to leverage the growing “Internet of Things.” This technology connects devices, vehicles, and homes to the Internet and generates valuable data to underwrite, rate, and manage risk while enriching customer relationships. By ingesting, storing, and normalizing this data, Verisk makes it accessible for users to extract business insights at a significantly lower cost and logistical burden than they could achieve on their own.
Financial Services
We focus on providing competitive benchmarking, scoring solutions, analytics, and customized services to financial services institutions in the Americas, Europe, the Middle East, Africa and Asia-Pacific. We work with our customers to evaluate current market and audience selection. We measure the effectiveness of campaigns across the various media and the impact of multi-channel campaigns. We also maintain the most comprehensive depersonalized direct observation consortium data sets for the payments industry. We leverage our consortium data and provide proprietary solutions and information that enable customers to achieve higher profitability and growth through enhanced marketing and risk management decisions. We have deployed unique technology to manage vast data sets efficiently and manage vast amount of payments data. We offer services and a suite of solutions to a customer base that includes credit and debit card issuers, retail banks and other consumer financial services providers, payment processors, insurance companies, and other industry stakeholders.
Our professionals have substantive industry knowledge about providing solutions to the financial services sector. We are known for our unique ability to blend the highly technical, data-centered aspects of our projects with expert communication and business knowledge. Our solutions enhance our customers’ ability to manage their businesses' profitably and position them better to handle present day challenges (competitive, regulatory, and economic). Specifically, we use comprehensive transaction, risk, behavioral, and bureau-sourced account data to assist customers in making better business decisions through analysis and analytical solutions. We maintain a comprehensive and granular direct observation financial services industry database for credit card, debit card, and deposit transactions.
Energy and Specialized Markets
We are a leading provider of data analytics for the global energy, chemicals, and metals and mining industries. We provide research and consulting services focusing on exploration strategies and screening, asset development and acquisition, commodity markets, and corporate analysis. We offer consultancy in the areas of business environment, business improvement, business strategies, commercial advisory, and transaction support. We deliver analysis and advice on assets, companies,
8
governments, and markets. We provide comprehensive and integrated coverage and analysis of relevant commodities across the interconnected global energy sectors. We have gathered proprietary information, insight and analysis on thousands of oil and gas fields, mines, refineries and other assets, as well as detailed assessments of the market fundamentals across each value chain. Our experts analyze the data and work directly with customers to address their business challenges. Our growing customer base includes international and national energy companies, as well as chemicals, and metals and mining companies, financial institutions and governments. We work with a range of diverse teams, from strategy and policy makers, business developers and market analysts to corporate finance, risk teams and investors.
We help businesses and governments better anticipate and manage climate and weather-related risks. We prepare certain agencies and companies to anticipate, manage, react to and profit from climate and weather-related risk. We serve our customers by providing state-of-the-art research, development and analysis delivered in reports, databases and software solutions. We are dedicated to the advancement of scientific understanding of the atmospheric, climate and weather, ocean, and planetary sciences. Through research conducted by our in-house scientific staff, and often in collaboration with world-renowned scientists at academic and other research institutions, we have developed analytical tools to help measure and observe environmental properties and translate those measurements into actionable information.
We also offer a comprehensive suite of data and information services that enable improved compliance with global Environmental Health and Safety, or EH&S, requirements related to the safe manufacturing, distribution, transportation, usage, and disposal of chemicals and products. From the supply chain or solutions life cycle, we deliver a program specific to the EH&S compliance information and management needs of our customers. Our full solutions life cycle and cross-supply chain approach provides a single, integrated solution for managing customers' EH&S capabilities, which results in improved processes, and reduced cost, risk, and liability.
Our Growth Strategy
Over the past five years, we have grown our revenues at a CAGR of 13.9% through the successful execution of our business plan. Those results reflect strong organic revenue growth, new product development, and acquisitions. We have made, and continue to make, investments in people, data sets, analytic solutions, technology, and complementary businesses. The key components of our strategy include the following:
Increase Solution Penetration with Customers. We expect to expand the application of our solutions in customers’ internal processes. Building on our deep knowledge of, and embedded position in, various industries, we expect to sell more solutions to existing customers tailored to individual market segments. By increasing the breadth and relevance of our offerings, we believe that we can strengthen our relationships with customers and increase our value to their decision making in critical ways. We have opportunities to expand solution penetration to our insurance, energy and financial services customers.
Develop New, Proprietary Data Sets and Predictive Analytics. We work with our customers to understand their evolving needs. We plan to create new solutions by enriching our mix of proprietary data sets, analytic solutions and effective decision support across the markets we serve. We constantly seek to add new data sets that can further leverage our analytic methods, technology platforms and intellectual capital.
Leverage Our Intellectual Capital to Expand into Adjacent Markets and New Customer Sectors. Our organization is built on more than four decades of intellectual property in risk management. We believe we can continue to expand the use of our intellectual capital profitably and apply our analytic methods in new markets where significant opportunities for long-term growth exist. We also continue to pursue growth through targeted international expansion. We have already demonstrated the effectiveness of this strategy with our expansion into non insurance financial services.
Pursue Strategic Acquisitions that Complement Our Leadership Positions. We will continue to expand our data and analytics capabilities across industries. While we expect this will occur primarily through organic growth, we have and will continue to acquire assets and businesses that strengthen our value proposition to customers. We have developed an internal capability to source, evaluate and integrate acquisitions that have created value for shareholders.
Our Customers
Risk Assessment Customers
The customers in our Risk Assessment segment for the lines of P&C services we offer include the top 100 P&C insurance providers in the U.S., as well as insurers in international markets. A substantial majority of P&C insurance providers in the U.S. use our statistical agent services to report to regulators, and the majority of insurers and reinsurers in the U.S. use
9
our actuarial services and industry-standard insurance programs. In addition, certain agencies of the federal government as well as county and state governmental agencies and organizations use our solutions to help satisfy government needs for risk assessment and emergency response information.
Decision Analytics Customers
In the Decision Analytics segment, we provide our P&C insurance solutions to the majority of the P&C insurers in the U.S. Specifically, our claims database serves thousands of customers, representing more than 90% of the P&C insurance industry by premium volume, 27 state workers’ compensation insurance funds, more than 500 self-insurers, more than 400 third-party administrators, several state fraud bureaus, and many law-enforcement agencies involved in the investigation and prosecution of insurance fraud. We estimate that about 80% of insurance repair contractors and service providers in the U.S. and Canada with computerized estimating systems use our building and repair pricing data. Our customers included 28 of the top 30 credit card issuers in North America, the United Kingdom and Australia, as well as 8 of the top 10 global energy providers around the world. We also work with a wide range of companies, governments and institutions across the energy, and metals and mining value chains.
Our Competitors
We believe no single competitor currently offers the same scope of services and market coverage we provide. The breadth of markets we serve exposes us to a broad range of competitors as described below. Businesses that we acquire may introduce us to additional competitors.
Risk Assessment Competitors
Our Risk Assessment segment operates primarily in the U.S. P&C insurance industry, where we enjoy a leading market presence. We have a number of competitors in specific lines or services.
We encounter competition from a number of sources, including insurers that develop internal technology and actuarial methods for proprietary insurance programs. Competitors also include other statistical agents, including the National Independent Statistical Service, the Independent Statistical Service, Inc. and other advisory organizations, that provide underwriting rules, prospective loss costs, and coverage language, such as the American Association of Insurance Services, Inc. and Mutual Services Organization. However, we believe none of our competitors have the breadth or depth of data we have.
Competitors for our property-specific rating and underwriting information are primarily limited to a number of regional providers of commercial property inspections and surveys, including Overland Solutions, Inc. and Regional Reporting, Inc. We also compete with a variety of organizations that offer consulting services, primarily specialty technology and consulting firms. In addition, a customer may use its own internal resources rather than engage an outside firm for these services. Our competitors also include information technology product and services vendors, management and strategy consulting firms, such as Deloitte Consulting LLP, and smaller specialized information technology and analytical services firms, including Pinnacle Consulting and EMB, a unit of Willis Towers Watson.
Decision Analytics Competitors
In the P&C insurance claims market and catastrophe modeling market, certain products are offered by a number of companies, including Risk Management Solutions (catastrophe modeling), CoreLogic (property replacement value), LexisNexis® Risk Solutions (loss histories and motor vehicle records for personal lines underwriting), Solera Holdings, Inc. (personal automobile underwriting), and Symbility. We believe that our P&C insurance industry expertise, combined with our ability to offer multiple applications, services and integrated solutions to individual customers are competitive strengths. In the natural resources commercial intelligence market, certain products are offered by a number of companies, including IHS Markit (natural resources), Rystad Energy (upstream), Global Data PLC (upstream), PIRA Energy Group (oil and gas markets), and CRU Group (metals). We believe that our global integrated value chain knowledge and insight, bottom-up proprietary data, and long-term trusted relationships enhance our competitive position in relationship to those companies.
10
Development of New Solutions
We take a market-focused team approach to developing our solutions. Our operating units are responsible for developing, reviewing and enhancing our various products and services. Our data management and production team designs and manages our processes and systems for market data procurement, proprietary data production, and quality control. Our Joint Development Environment, or JDE, and Enterprise Data Management, or EDM, teams support our efforts to create new information and products from available data and explore new methods of collecting data. EDM is focused on understanding and documenting business-unit and corporate data assets and data issues, sharing and combining data assets across the enterprise, creating an enterprise data strategy, facilitating research and product development, and promoting cross-enterprise communication. Our Verisk Innovative Analytics, or VIA, team is a corporate center of excellence for analytical methods in applying modeling techniques to predict risk outcomes.
Our software development teams build the technology used in many of our solutions. As part of our product-development process, we continually solicit feedback from our customers on the value of our products and services and the market’s needs. We have established an extensive system of customer advisory panels, that meet regularly throughout the year to help us respond effectively to the needs of our markets. In addition, we use frequent sales calls, executive visits, user group meetings, and other industry forums to gather information to match our product development efforts with the needs of the market. We also use a variety of market research techniques to enhance our understanding of our customers and the markets in which they operate.
We add to our offerings through an active acquisition program. Since 2012, we have acquired 15 businesses, which have allowed us to enter new markets, offer new solutions and enhance the value of existing services with additional proprietary sources of data.
When we find it advantageous, we augment our proprietary data sources and systems by forming alliances with other leading information providers and technology companies and integrating their product offerings into our offerings. This approach gives our customers the opportunity to obtain the information they need from a single source and more easily integrate the information into their workflows.
Sales, Marketing and Customer Support
We sell our solutions and services primarily through direct interaction with our customers. We employ a three-tier sales structure that includes salespeople, technical consultants and sales support. As of December 31, 2016, we had a sales force of 295 people in our continuing operations. Within the company, several areas have sales teams that specialize in specific products and services. Those specialized sales teams sell specific, highly technical solution sets to targeted markets in coordination with account management.
To provide account management to our largest customers in the insurance, financial and energy markets, we segment our customers into three groups. Tier One or “Global/National” Accounts, is comprised of our largest customers. Tier Two, or “Strategic” Accounts, represent both large and middle-market customer groups. Tier Three is comprised of small and specialized companies that may represent one line of business or may be regionally focused. In Tier One and Tier Two segments, we have sales teams organized by the following specialities: Rating, Underwriting, Claims, Catastrophe Risk, and Energy. In the Tier Three segment, we assign a sales generalist with overall account management responsibility. Our tiered approach has proven to be a successful sales model and approach to building customer relationships. Our senior executives regularly engage with the senior management of our customers to ensure customer satisfaction and strategic alignment and to support mutual innovation partnership opportunities.
Sales people participate in both customer-service and sales activities. They provide direct support, interacting frequently with assigned customers to assure a satisfactory experience using our services. Salespeople primarily seek out new sales opportunities and work with the various sales teams to coordinate sales activities and provide the best solutions for our customers. We believe our salespeople’s product knowledge, skills to develop relationships of trust, and local presence differentiate us from our competition. Technical consultants are subject-matter experts and work with salespeople on specific opportunities for their assigned products and segments. Both salespeople and technical consultants have responsibility for identifying new sales opportunities. A team approach and a common customer relationship management system allow for effective coordination among the groups.
Sources of Our Data
The data we use to perform our analytics and power our solutions are sourced through six different kinds of data arrangements. First, we gather data from our customers within agreements that also permit our customers to use the solutions
11
created from their data. Those agreements remain in effect unless the data contributor chooses to opt. It is very rare that contributors elect not to continue providing us data. Second, we have agreements with data contributors in which we specify the particular uses of their data and provide their required levels of privacy, protection of data and where necessary, de-identification of data. The agreements represent no cost to us, generally feature a specified period of time for the data contributions, and required renewal. Third, we “mine” data found inside the transactions supported by our solutions; as an example, we use the claims settlement data generated inside our repair cost estimating solution to improve the cost factors used in our models. Again, those arrangements represent no cost to us, and we obtain the consent of our customers to make use of their data in this way. Fourth, we source data generally at no cost from public sources, including federal, state, and local governments. Fifth, we gather data about the physical characteristics of commercial properties through the direct observation of our field staff members, who also perform property surveys at the request of, and facilitated by, property insurers. Lastly, we purchase data from data aggregators under contracts that reflect prevailing market pricing for the data elements purchased, including county tax assessor records, descriptions of hazards such as flood plains and professional licenses. We are the owners of the derivative solutions we create using the data we collect.
Information Technology
Technology
Our information technology systems and the more recent adoption of cloud computing are fundamental to our success. They are used for the storage, processing, access, and delivery of the data that forms the foundation of our business and the development and delivery of the solutions we provide to our customers. Much of the technology we use and provide to our customers is developed, maintained, and supported by approximately 25% of our employee population. We generally own, or have secured ongoing rights to use for the purposes of our business, all the customer-facing applications, that are material to our operations. We support and implement a mix of technologies, and focus on implementing the most efficient technology for any given business requirement or task.
Data Centers
We have two primary data centers in Somerset, New Jersey and Lehi, Utah, creating redundancy and back-up capabilities. In addition, we have data centers dedicated to certain business units located in other states.
Disaster Recovery
We are committed to a framework for business continuity management and carry out annual reviews of the state of preparedness of each business unit. All of our critical databases, systems and contracted customer services are also regularly recovered. We also have documented disaster recovery plans in place for each of our major data centers and each of our solutions. The data center in Somerset, New Jersey is the recovery site for the Lehi, Utah data center and vice versa.
Security
We have adopted a wide range of measures to ensure the security of our IT infrastructure and data. Security measures generally cover the following key areas: physical security, logical security of the perimeter, network security such as firewalls, logical access to the operating systems, deployment of virus detection software, and appropriate policies and procedures relating to removable media such as laptops. All laptops are encrypted, and media leaving our premises and sent to third-party storage facilities are also encrypted. Our commitment to security has earned from CyberTrust Security Certification (an industry leader in information security certification) since 2002.
Intellectual Property
We own a significant number of intellectual property rights, including copyrights, trademarks, trade secrets, and patents. Specifically, our policy language, insurance manuals, software, and databases are protected by both registered and common law copyrights, and the licensing of those materials to our customers for their use represents a large portion of our revenue. We also own in excess of 500 trademarks in the U.S. and foreign countries, including the names of our products and services and our logos and tag lines, many of which are registered. We believe many of our trademarks, trade names, service marks, and logos to be of material importance to our business as they assist our customers in identifying our products and services and the quality that stands behind them. We consider our intellectual property to be proprietary, and we rely on a combination of statutory (for example, copyright, trademark, trade secret, and patent) and contractual safeguards in a comprehensive intellectual property enforcement program to protect them wherever they are used.
We also own several software method and processing patents and have several pending patent applications in the U.S. that complement our products. The patents and patent applications include claims, that pertain to technology, including a patent
12
for our ISO Claims Outcome Advisor® software and our Xactware Sketch® product. We believe the protection of our proprietary technology is important to our success and we will continue to seek to protect those intellectual property assets for which we have expended substantial research and development capital and that are material to our business.
To maintain control of our intellectual property, we enter into license agreements with our customers, granting each customer a license to use our products and services, including our software and databases. This helps to maintain the integrity of our proprietary intellectual property and to protect the embedded information and technology contained in our solutions. As a general practice, employees, contractors and other parties with access to our proprietary information sign agreements that prohibit the unauthorized use or disclosure of our proprietary rights, information and technology.
Employees
As of December 31, 2016, we employed 6,148 full-time and 166 part-time employees in our continuing operations. None of our employees are represented by unions. We consider our relationship with our employees to be good and have not experienced interruptions of operations due to labor disagreements.
Our employees include more than 200 actuarial professionals, including 39 Fellows and 35 Associates of the Casualty Actuarial Society, as well as 149 Chartered Property Casualty Underwriters, 23 Certified and 23 Associate Insurance Data Managers, and more than 900 professionals with advanced degrees, including PhDs in mathematics and statistical modeling who review both the data and the models.
Regulation
Because our business involves the distribution of certain personal, public, and non-public data to businesses and governmental entities that make eligibility, service, and marketing decisions based on such data, certain of our solutions and services are subject to regulation under federal, state, and local laws in the U.S. and, to a lesser extent, in foreign countries. Examples of such regulation include the Fair Credit Reporting Act, which regulates the use of consumer credit report information; the Gramm-Leach-Bliley Act, which regulates the use of non public personal financial information held by financial institutions and applies indirectly to companies that provide services to financial institutions; the Drivers Privacy Protection Act, which prohibits the public disclosure, use or resale by any state’s department of motor vehicles of personal information about an individual that was obtained by the department in connection with a motor vehicle record, except for a “permissible purpose”, and various other federal, state and local laws and regulations.
Those laws generally restrict the use and disclosure of personal information and provide consumers certain rights to know the manner in which their personal information is being used, to challenge the accuracy of such information and/or to prevent the use and disclosure of such information. In certain instances, the laws also impose requirements for safeguarding personal information through the issuance of data security standards or guidelines. Certain state laws impose similar privacy obligations, as well as obligations to provide notification of security breaches in certain circumstances.
We are also licensed as a rating, rate service, advisory, or statistical organization under state insurance codes in all 50 states, Puerto Rico, Guam, the U.S. Virgin Islands, and the District of Columbia. As such an advisory organization, we provide statistical, actuarial, policy language development, and related products and services to property/casualty insurers, including advisory prospective loss costs, other prospective cost information, manual rules, and policy language. We also serve as an officially designated statistical agent of state insurance regulators to collect policy writing and loss statistics of individual insurers and compile that information into reports used by the regulators.
Many of our products, services and operations as well as insurers' use of our services are subject to state rather than federal regulation by virtue of the McCarran-Ferguson Act. As a result, many of our operations and products are subject to review and/or approval by state regulators. Furthermore, our operations involving licensed advisory organization activities are subject to periodic examinations conducted by state regulators, and our operations and products are subject to state antitrust and trade practice statutes within or outside state insurance codes, which are typically enforced by state attorneys general and/or insurance regulators.
13
Available Information
We maintain an Investor Relations website on the Internet at investor.verisk.com. We make available free of charge on or through this website, our annual, quarterly, and current reports and any amendments to those reports as soon as reasonably practicable following the time they are electronically filed with or furnished to the U.S. Securities and Exchange Commission, or SEC. For access to the filings, click the “SEC Filings" link on the “Financial Information” tab on our Investor Relations homepage. Verisk trades on the NASDAQ Global Market in the Nasdaq Global Select Market segment under the ticker symbol “VRSK.” Our stock was first publicly traded on October 7, 2009.
The public may read and copy any materials filed by Verisk with the SEC at the SEC’s Public Reference Room at 100 F Street, NE, Room 1580, Washington, DC 20549. The public may obtain information on the operation of the Public Reference Room by calling the SEC at 1-800-SEC-0330. The SEC maintains an Internet site (www.sec.gov) that contains reports, proxy and information statements and other information regarding issuers that file electronically with the SEC.
14
Item 1A. | Risk Factors |
You should carefully consider the following risks and all of the other information set forth in this annual report on Form 10-K before deciding to invest in any of our securities. If any of the following risks actually occurs, our business, financial condition or results of operations would likely suffer. In such case, the trading price of our securities, including our common stock, could decline due to any of these risks, and you may lose all or part of your investment.
We could lose our access to data from external sources, which could prevent us from providing our solutions.
We depend upon data from external sources, including data received from customers and various government, and public record services, for information used in our databases. In general, we do not own the information in these databases, and the participating organizations could discontinue contributing information to the databases. Our data sources could withdraw or increase the price for their data for a variety of reasons, and we could also become subject to legislative, judicial, or contractual restrictions on the use of such data, in particular if such data is not collected by the third parties in a way that allows us to legally use and/or process the data. In addition, some of our customers are significant stockholders of our company. Specifically, a portion of common stock is owned by insurers who are also our customers. If our customers’ percentage of ownership of our common stock decreases in the future, there can be no assurance that our customers will continue to provide data to the same extent or on the same terms. If a substantial number of data sources, or certain key sources, were to withdraw or be unable to provide their data, or if we were to lose access to data due to government regulation or if the collection of data became uneconomical, our ability to provide solutions to our customers could be impacted, which could materially adversely affect our business, reputation, financial condition, operating results, and cash flows.
Agreements with our data suppliers are short-term agreements. Some suppliers are also competitors, which may make us vulnerable to unpredictable price increases and may cause some suppliers not to renew certain agreements. Our competitors could also enter into exclusive contracts with our data sources. If our competitors enter into such exclusive contracts, we may be precluded from receiving certain data from these suppliers or restricted in our use of such data, which would give our competitors an advantage. Such a termination or exclusive contracts could have a material adverse effect on our business, financial position, and operating results if we were unable to arrange for substitute data sources.
Fraudulent or unpermitted data access and other security or privacy breaches may negatively impact our business and harm our reputation.
Security breaches in our facilities, computer networks, and databases may cause harm to our business and reputation and result in a loss of customers. Our systems may be vulnerable to physical break-ins, computer viruses, attacks by hackers and similar disruptive problems. Third-party contractors also may experience security breaches involving the storage and transmission of proprietary information. If users gain improper access to our databases, they may be able to steal, publish, delete or modify confidential third-party information that is stored or transmitted on our networks.
In addition, customers’, employees’ or other’s misuse of and/or gaining unpermitted access to or failure to properly secure our information or services could cause harm to our business and reputation and result in loss of customers. Any such misappropriation and/or misuse of or failure to properly secure our information could result in us, among other things, being in breach of certain data protection and related legislation.
A security or privacy breach may affect us in the following ways:
• | deterring customers from using our solutions; |
• | deterring data suppliers from supplying data to us; |
• | harming our reputation; |
• | exposing us to liability; |
• | increasing operating expenses to correct problems caused by the breach; |
• | affecting our ability to meet customers’ expectations; and/or |
• | causing inquiry from governmental authorities. |
Incidents in which consumer data has been fraudulently or improperly acquired or viewed, or any other security or privacy breaches, may occur and could go undetected. The number of potentially affected consumers identified by any future incidents is obviously unknown. Any such incident could materially adversely affect our business, reputation, financial condition, operating results and cash flows.
15
We derive a substantial portion of our revenues from U.S. P&C primary insurers. If there is a downturn in the U.S. insurance industry or that industry does not continue to accept our solutions, our revenues will decline.
Revenues derived from solutions we provide to U.S. P&C primary insurers account for a substantial portion of our total revenues. During the year ended December 31, 2016, approximately 48.9% of our revenue was derived from solutions provided to U.S. P&C primary insurers. Also, invoices for certain of our solutions are linked in part to premiums in the U.S. P&C insurance market, which may rise or fall in any given year due to loss experience and capital capacity and other factors in the insurance industry that are beyond our control. In addition, our revenues will decline if the insurance industry does not continue to accept our solutions.
Factors that might affect the acceptance of these solutions by P&C primary insurers include the following:
• | changes in the business analytics industry, |
• | changes in technology, |
• | our inability to obtain or use state fee schedule or claims data in our insurance solutions, |
• | saturation of market demand, |
• | loss of key customers, |
• | industry consolidation, and |
• | failure to execute our customer-focused selling approach. |
A downturn in the insurance industry, pricing pressure or lower acceptance of our solutions by the insurance industry could result in a decline in revenues from that industry and have a material adverse effect on our financial condition, results of operations and cash flows.
Acquisitions could result in operating difficulties, dilution and other harmful consequences, and we may not be successful in achieving growth through acquisitions.
Our long-term business strategy includes growth through acquisitions. Future acquisitions may not be completed on acceptable terms and acquired assets, data or businesses may not be successfully integrated into our operations, and we may ultimately divest unsuccessful investments. Any acquisitions or investments will be accompanied by the risks commonly encountered in the acquisitions of businesses. Such risks include, among other things:
• | failing to implement or remediate controls, procedures and policies appropriate for a larger public company at acquired companies that prior to the acquisition lacked such controls, procedures and policies, |
• | paying more than fair market value for an acquired company or assets, |
• | failing to integrate the operations and personnel of the acquired businesses in an efficient, timely manner, |
• | assuming potential liabilities of an acquired company, |
• | managing the potential disruption to our ongoing business, |
• | distracting management focus from our core businesses, |
• | failing to retain management at the acquired company, |
• | difficulty in acquiring suitable businesses, including challenges in predicting the value an acquisition will ultimately contribute to our business, |
• | possibility of overpaying for acquisitions, particularly those with significant intangible assets that derive value using novel tools and/or are involved in niche markets, |
• | impairing relationships with employees, customers, and strategic partners, |
• | incurring expenses associated with the amortization of intangible assets particularly for intellectual property and other intangible assets, |
• | incurring expenses associated with an impairment of all or a portion of goodwill and other intangible assets due to changes in market conditions, weak economies in certain competitive markets, or the failure of certain acquisitions to realize expected benefits, and |
• | diluting the share value and voting power of existing stockholders. |
The anticipated benefits of many of our acquisitions may not materialize. Future acquisitions or dispositions could result in the incurrence of debt, contingent liabilities or amortization expenses, or write-offs of goodwill and other intangible assets, any of which could harm our financial condition.
16
We typically fund our acquisitions through our debt facilities. Although we have capacity under committed facilities, those may not be sufficient. Therefore, future acquisitions may require us to obtain additional financing through debt or equity, which may not be available on favorable terms or at all and could result in dilution.
In addition, to the extent we cannot identify or consummate, on terms acceptable to us, acquisitions that are complementary or otherwise attractive to our business, we may experience difficulty in achieving future growth.
There may be consolidation in our end customer market, which could reduce the use of our services.
Mergers or consolidations among our customers could reduce the number of our customers and potential customers. This could adversely affect our revenues even if these events do not reduce the aggregate number of customers or the activities of the consolidated entities. If our customers merge with or are acquired by other entities that are not our customers, or that use fewer of our services, they may discontinue or reduce their use of our services. The adverse effects of consolidation will be greater in sectors that we are particularly dependent upon, for example, in the P&C insurance sector. Any of these developments could materially adversely affect our business, financial condition, operating results, and cash flows.
If we are unable to develop successful new solutions or if we experience defects, failures and delays associated with the introduction of new solutions, our business could suffer serious harm.
Our growth and success depends upon our ability to develop and sell new solutions. If we are unable to develop new solutions, or if we are not successful in introducing and/or obtaining regulatory approval or acceptance for new solutions, or products we develop face sufficient pricing pressure to make them unattractive to pursue, we may not be able to grow our business, or growth may occur more slowly than we anticipate. In addition, significant undetected errors or delays in new solutions may affect market acceptance of our solutions and could harm our business, financial condition or results of operations. In the past, we have experienced delays while developing and introducing new solutions, primarily due to difficulties in developing models, acquiring data and adapting to particular operating environments. Errors or defects in our solutions that are significant, or are perceived to be significant, could result in rejection of our solutions, damage to our reputation, loss of revenues, diversion of development resources, an increase in product liability claims, and increases in service and support costs and warranty claims.
We will continue to rely upon proprietary technology rights, and if we are unable to protect them, our business could be harmed.
Our success depends, in part, upon our intellectual property rights. To date, we have relied primarily on a combination of copyright, patent, trade secret, and trademark laws and nondisclosure and other contractual restrictions on copying and distribution to protect our proprietary technology. This protection of our proprietary technology is limited, and our proprietary technology could be used by others without our consent. In addition, patents may not be issued with respect to our pending or future patent applications, and our patents may not be upheld as valid or may not prevent the development of competitive products. Businesses we acquire also often involve intellectual property portfolios, which increase the challenges we face in protecting our strategic advantage. Any disclosure, loss, invalidity of, or failure to protect our intellectual property could negatively impact our competitive position, and ultimately, our business. Our protection of our intellectual property rights in the U.S. or abroad may not be adequate and others, including our competitors, may use our proprietary technology without our consent. Furthermore, litigation may be necessary to enforce our intellectual property rights, to protect our trade secrets, or to determine the validity and scope of the proprietary rights of others. Such litigation could result in substantial costs and diversion of resources and could harm our business, financial condition, results of operations, and cash flows.
We could face claims for intellectual property infringement, which if successful could restrict us from using and providing our technologies and solutions to our customers.
There has been substantial litigation and other proceedings, particularly in the U.S., regarding patent and other intellectual property rights in the information technology industry. There is a risk that we are infringing, or may in the future infringe, the intellectual property rights of third parties. We monitor third-party patents and patent applications that may be relevant to our technologies and solutions and we carry out freedom to operate analysis where we deem appropriate. However, such monitoring and analysis has not been, and is unlikely in the future to be, comprehensive, and it may not be possible to detect all potentially relevant patents and patent applications. Since the patent application process can take several years to complete, there may be currently pending applications, unknown to us, that may later result in issued patents that cover our products and technologies. As a result, we may infringe existing and future third-party patents of which we are not aware. As we expand our operations there is a higher risk that such activity could infringe the intellectual property rights of third parties.
Third-party intellectual property infringement claims and any resultant litigation against us or our technology partners or providers, could subject us to liability for damages, restrict us from using and providing our technologies and solutions or
17
operating our business generally, or require changes to be made to our technologies and solutions. Even if we prevail, litigation is time consuming and expensive to defend and would result in the diversion of management’s time and attention.
If a successful claim of infringement is brought against us and we fail to develop non-infringing technologies and solutions or to obtain licenses on a timely and cost effective basis, this could materially adversely affect our business, reputation, financial condition, operating results, and cash flows.
Regulatory developments could negatively impact our business.
Because personal, public and non-public information is stored in some of our databases, we are vulnerable to government regulation and adverse publicity concerning the use of our data. We provide many types of data and services that already are subject to regulation under the Fair Credit Reporting Act, Gramm-Leach-Bliley Act, Driver’s Privacy Protection Act, the European Union’s Data Protection Directive, the Dodd Frank Wall Street Reform and Consumer Protection Act and to a lesser extent, various other federal, state, and local laws and regulations. These laws and regulations are designed to protect the privacy of the public and to prevent the misuse of personal information in the marketplace. However, many consumer advocates, privacy advocates, and government regulators believe that the existing laws and regulations do not adequately protect privacy. They have become increasingly concerned with the use of personal information, particularly social security numbers, department of motor vehicle data and dates of birth. As a result, they are lobbying for further restrictions on the dissemination or commercial use of personal information to the public and private sectors. Similar initiatives are under way in other countries in which we do business or from which we source data. In addition, on October 6, 2015 the Court of Justice of the European Union, or E.U., invalidated the Safe Harbor provisions used by the Company and numerous other U.S. businesses to comply with E.U.’s Data Protection Directive 95/46/EC. The Company has implemented various measures to comply with the Data Protection Directive, however, there can be no assurances that such methods will not be invalidated as well. If the Company is unable to comply with the transfer mechanisms adopted pursuant to the Data Protection Directive, it will impede the ability to conduct business between the U.S. and the E.U. which could have a material adverse effect on our business, financial position, results of operations or cash flows.
The following legal and regulatory developments also could have a material adverse effect on our business, financial position, results of operations or cash flows:
• | amendment, enactment, or interpretation of laws and regulations which restrict the access and use of personal information and reduce the supply of data available to customers; |
• | changes in cultural and consumer attitudes to favor further restrictions on information collection and sharing, which may lead to regulations that prevent full utilization of our solutions; |
• | failure of our solutions to comply with current laws and regulations; and |
• | failure of our solutions to adapt to changes in the regulatory environment in an efficient, cost-effective manner. |
We typically face a long selling cycle to secure new contracts that require significant resource commitments, which result in a long lead time before we receive revenues from new relationships.
We typically face a long selling cycle to secure a new contract and there is generally a long preparation period in order to commence providing the services. We typically incur significant business development expenses during the selling cycle and we may not succeed in winning a new customer’s business, in which case we receive no revenues and may receive no reimbursement for such expenses. Even if we succeed in developing a relationship with a potential new customer, we may not be successful in obtaining contractual commitments after the selling cycle or in maintaining contractual commitments after the implementation cycle, which may have a material adverse effect on our business, results of operations and financial condition.
We may lose key business assets, through the loss of data center capacity or the interruption of telecommunications links, the internet, or power sources, which could significantly impede our ability to do business.
Our operations depend on our ability, as well as that of third-party service providers to whom we have outsourced several critical functions, to protect data centers and related technology against damage from hardware failure, fire, flood, power loss, telecommunications failure, impacts of terrorism, breaches in security (such as the actions of computer hackers), natural disasters, or other disasters. Certain of our facilities are located in areas that could be impacted by coastal flooding, earthquakes or other disasters. The online services we provide are dependent on links to telecommunications providers. In addition, we generate a significant amount of our revenues through telesales centers and websites that we utilize in the acquisition of new customers, fulfillment of solutions and services and responding to customer inquiries. We may not have sufficient redundant operations to cover a loss or failure in all of these areas in a timely manner. Certain of our customer contracts provide that our online servers may not be unavailable for specified periods of time. Any damage to our data centers, failure of our telecommunications links or inability to access these telesales centers or websites could cause interruptions in operations that materially adversely affect our ability to meet customers’ requirements, resulting in decreased revenue, operating income and earnings per share.
18
We are subject to competition in many of the markets in which we operate and we may not be able to compete effectively.
Some markets in which we operate or which we believe may provide growth opportunities for us are highly competitive, and are expected to remain highly competitive. We compete on the basis of quality, customer service, product and service selection, and pricing. Our competitive position in various market segments depends upon the relative strength of competitors in the segment and the resources devoted to competing in that segment. Due to their size, certain competitors may be able to allocate greater resources to a particular market segment than we can. As a result, these competitors may be in a better position to anticipate and respond to changing customer preferences, emerging technologies and market trends. In addition, new competitors and alliances may emerge to take market share away, and as we enter into new lines of business, due to acquisition or otherwise, we face competition from new players with different competitive dynamics. We may be unable to maintain our competitive position in our market segments, especially against larger competitors. We may also invest further to upgrade our systems in order to compete. If we fail to successfully compete, our business, financial position and results of operations may be adversely affected.
To the extent the availability of free or relatively inexpensive information increases, the demand for some of our solutions may decrease.
Public sources of free or relatively inexpensive information have become increasingly available recently, particularly through the Internet, and this trend is expected to continue. Governmental agencies in particular have increased the amount of information to which they provide free public access. Public sources of free or relatively inexpensive information may reduce the demand for our solutions. To the extent that customers choose not to obtain solutions from us and instead rely on information obtained at little or no cost from these public sources, our business and results of operations may be adversely affected.
Our financial position may be impacted by audit examinations or changes in tax laws or tax rulings.
Our existing corporate structure and tax positions have been implemented in a manner in which we believe is compliant with current prevailing tax laws. However, changes in existing tax laws or rulings, including Federal, State and International, could have a significant impact on our effective tax rate, cash tax positions and deferred tax assets and liabilities. Audit examinations with an adverse outcome could have a negative effect in the jurisdictions in which we operate. Furthermore, the Organization for Economic Co-operation and Development (OECD) released its Base Erosion and Profit Shifting (BEPS) action plans which may also lead to future tax reform that could affect our results. In addition, our tax positions are impacted by fluctuations in our earnings and financial results in the various countries in which we do business.
Our senior leadership team is critical to our continued success and the loss of such personnel could harm our business.
Our future success substantially depends on the continued service and performance of the members of our senior leadership team. These personnel possess business and technical capabilities that are difficult to replace.
However, as a general practice we do not enter into employee contracts with the members of our senior management operating team, except for certain limited situations. If we lose key members of our senior management operating team, we may not be able to effectively manage our current operations or meet ongoing and future business challenges, and this may have a material adverse effect on our business, results of operations and financial condition.
We may fail to attract and retain enough qualified employees to support our operations, which could have an adverse effect on our ability to expand our business and service our customers.
Our business relies on large numbers of skilled employees and our success depends on our ability to attract, train and retain a sufficient number of qualified employees. If our attrition rate increases, our operating efficiency and productivity may decrease. We compete for employees not only with other companies in our industry, but also with companies in other industries, such as software services, engineering services and financial services companies, and there is a limited pool of employees who have the skills and training needed to do our work.
If our business continues to grow, the number of people we will need to hire will increase. We will also need to increase our hiring if we are not able to maintain our attrition rate through our current recruiting and retention policies. Increased competition for employees could have an adverse effect on our ability to expand our business and service our customers, as well as cause us to incur greater personnel expenses and training costs.
19
We are subject to antitrust, consumer protection and other litigation, and may in the future become further subject to such litigation; an adverse outcome in such litigation could have a material adverse effect on our financial condition, revenues and profitability.
We participate in businesses (particularly insurance-related businesses and services) that are subject to substantial litigation, including antitrust and consumer protection litigation. In addition, our insurance specialists are in the business of providing advice on standard contract terms, which if challenged could expose us to substantial reputational harm and possible liability. We are subject to the provisions of a 1995 settlement agreement in an antitrust lawsuit brought by various state Attorneys General and private plaintiffs, which imposes certain constraints with respect to insurer involvement in our governance and business. We currently are defending against putative class action lawsuits in which it is alleged that certain of our subsidiaries unlawfully have conspired with insurers with respect to their payment of insurance claims. See “Item 3. Legal Proceedings.” Our failure to successfully defend or settle such litigation could result in liability that, to the extent not covered by our insurance, could have a material adverse effect on our financial condition, revenues and profitability. Given the nature of our business, we may be subject to similar litigation in the future. Even if the direct financial impact of such litigation is not material, settlements or judgments arising out of such litigation could include further restrictions on our ability to conduct business, including potentially the elimination of entire lines of business, which could increase our cost of doing business and limit our prospects for future growth.
General economic, political and market forces and dislocations beyond our control could reduce demand for our solutions and harm our business.
The demand for our solutions may be impacted by domestic and international factors that are beyond our control, including macroeconomic, political and market conditions, the availability of short-term and long-term funding and capital, the level and volatility of interest rates, currency exchange rates, and inflation. Any one or more of these factors may contribute to reduced activity and prices in the securities markets generally and could result in a reduction in demand for our solutions, which could have an adverse effect on our results of operations and financial condition. A significant additional decline in the value of assets for which risk is transferred in market transactions could have an adverse impact on the demand for our solutions.
We incurred substantial additional indebtedness in connection with the acquisition of Wood Mackenzie.
In order to finance acquisitions, which are an important part of our long term growth strategy , we may incur substantial additional indebtedness and such increased leverage could adversely affect our business. In particular, the increased leverage could increase our vulnerability to sustained, adverse macroeconomic weakness, limit our ability to obtain further financing and limit our ability to pursue other operational and strategic opportunities. The increased leverage, potential lack of access to financing and increased expenses could have a material adverse effect on our financial condition, results of operations and cash flows.
General economic uncertainties, including downward trends in the energy industry, could reduce demand by Wood Mackenzie’s customers for its products and services.
Demand for Wood Mackenzie’s products and services may be negatively influenced by general economic uncertainties, particularly any downward trends in the energy industry. Many factors could negatively affect the revenues, profits and discretionary spending of Wood Mackenzie’s customers. Such factors include commodity prices (in particular, oil and coal), the state of the local economy, interest rates, currency exchange rates, political uncertainty or restrictions and regulations, the availability of industry resources, and other matters. A downturn or perceived downturn in the economy, particularly the energy industry, could add pricing pressure, delay subscription renewals or lead to more challenging or protracted fee negotiations or generally lower acceptance of our solutions by Wood Mackenzie’s customers, which could cause a decline in our revenues and have a material adverse effect on our financial condition, results of operations and cash flows.
Our operations are subject to additional risks inherent in international operations.
Wood Mackenzie is based in the United Kingdom, or U.K., and conducts its principal operations outside the U.S. As a result, the percentage of our revenues generated outside of the U.S. has increased materially. Conducting extensive international operations subjects us to risks that are inherent in international operations, including challenges posed by different pricing environments and different forms of competition; lack of familiarity and burdens of complying with foreign laws, legal standards, regulatory requirements, tariffs and other barriers; unexpected changes in regulatory requirements, taxes, trade laws, tariffs, export quotas, custom duties, or other trade restrictions; differing technology standards; difficulties in collecting accounts receivable; difficulties in managing and staffing international operations; varying expectations as to employee standards; potentially adverse tax consequences, including possible restrictions on the repatriation of earnings; and reduced or
20
varied protection for intellectual property rights in some countries. Moreover, international operations could be interrupted and negatively affected by economic changes, geopolitical regional conflicts, terrorist activity, political unrest, civil strife, acts of war, and other economic or political uncertainties. All of these risks could result in increased costs or decreased revenues, either of which could have a material adverse effect on our financial condition, results of operations and cash flows.
We are subject to the increased risk of exchange rate fluctuations.
The revenues and costs of Wood Mackenzie are primarily denominated in pound sterling. As a result of the Acquisition, we face greater exposure to movements in currency exchange rates, which may cause our revenue and operating results to differ materially from expectations. Our operating results could be negatively affected depending on the amount of revenue and expense denominated in foreign currencies. As exchange rates vary, revenue, cost of revenue, operating expenses, and other operating results, when remeasured in U.S. dollars, may differ materially from expectations. Although we may apply certain strategies to mitigate foreign currency risk, these strategies may not eliminate our exposure to foreign exchange rate fluctuations and would involve costs and risks of their own, such as ongoing management time and expertise, external costs to implement the strategies and potential accounting implications.
Economic and political instability and potential unfavorable changes in laws and regulations resulting from the U.K.’s exit from the E.U. could adversely affect our financial condition, results of operations and cash flows.
The results of the referendum on June 23, 2016 in the U.K., to exit the E.U., which is commonly referred to as “Brexit,” and to potentially significantly change the U.K.’s relationship with the E.U. and the laws and regulations impacting business conducted between the U.K. and E.U. countries could disrupt the overall stability of the E.U. given the diverse economic and political circumstances of individual E.U. countries and negatively impact our European operations. An immediate consequence of the Brexit vote was an adverse impact to global markets, including currency markets which experienced a sharp drop in the value of the British pound. Longer term, Brexit will require negotiations regarding the future terms of the U.K.’s relationship with the E.U., which could result in the U.K. losing access to certain aspects of the single E.U. market and the global trade deals negotiated by the E.U. on behalf of its members. The Brexit vote and the perceptions as to the impact of the withdrawal of the U.K. may adversely affect business activity, political stability and economic conditions in the U.K., the E.U. and elsewhere, the impact of which could have an adverse effect our financial condition, results of operations and cash flows.
If there are substantial sales of our common stock, our stock price could decline.
The market price of our common stock could decline as a result of sales of a large number of shares of our common stock in the market, or the perception that these sales could occur. These sales, or the possibility that these sales may occur, also might make it more difficult for us to sell equity securities in the future at a time and at a price that we deem attractive. As of December 31, 2016, our ten largest shareholders owned 39.6% of our common stock, including 5.1% of our common stock owned by our Employee Stock Ownership Plan or ESOP. Such stockholders are able to sell their common stock in the public market from time to time without registration, and subject to limitations on the timing, amount and method of those sales imposed by securities laws. If any of these stockholders were to sell a large number of their common stock, the market price of our common stock could decline significantly. In addition, the perception in the public markets that sales by them might occur could also adversely affect the market price of our common stock.
Pursuant to our equity incentive plans, options to purchase approximately 8,666,698 shares of common stock were outstanding as of February 17, 2017. We filed a registration statement under the Securities Act, which covers the shares available for issuance under our equity incentive plans (including for such outstanding options) as well as shares held for resale by our existing stockholders that were previously issued under our equity incentive plans. Such further issuance and resale of our common stock could cause the price of our common stock to decline.
Also, in the future, we may issue our securities in connection with investments and acquisitions. The amount of our common stock issued in connection with an investment or acquisition could constitute a material portion of our then outstanding common stock.
Our capital structure, level of indebtedness and the terms of anti-takeover provisions under Delaware law and in our amended and restated certificate of incorporation and bylaws could diminish the value of our common stock and could make a merger, tender offer or proxy contest difficult or could impede an attempt to replace or remove our directors.
We are a Delaware corporation and the anti-takeover provisions of the Delaware General Corporation Law may discourage, delay or prevent a change in control by prohibiting us from engaging in a business combination with an interested stockholder for a period of three years after the person becomes an interested stockholder, even if a change of control would be
21
beneficial to our existing stockholders. In addition, our certificate of incorporation and bylaws may discourage, delay or prevent a change in our management or control over us that stockholders may consider favorable or make it more difficult for stockholders to replace directors even if stockholders consider it beneficial to do so. Our certificate of incorporation and bylaws:
• | authorize the issuance of “blank check” preferred stock that could be issued by our board of directors to increase the number of outstanding shares to thwart a takeover attempt, |
• | prohibit cumulative voting in the election of directors, which would otherwise allow holders of less than a majority of the stock to elect some directors, |
• | require that vacancies on the board of directors, including newly-created directorships, be filled only by a majority vote of directors then in office, |
• | limit who may call special meetings of stockholders, |
• | prohibit stockholder action by written consent, requiring all stockholder actions to be taken at a meeting of the stockholders, and |
• | establish advance notice requirements for nominating candidates for election to the board of directors or for proposing matters that can be acted upon by stockholders at stockholder meetings. |
In addition, Section 203 of the Delaware General Corporation Law may inhibit potential acquisition bids for us. As a public company, we are subject to Section 203, which regulates corporate acquisitions and limits the ability of a holder of 15.0% or more of our stock from acquiring the rest of our stock. Under Delaware law, a corporation may opt out of the anti-takeover provisions, but we do not intend to do so.
These provisions may prevent a stockholder from receiving the benefit from any premium over the market price of our common stock offered by a bidder in a potential takeover. Even in the absence of an attempt to effect a change in management or a takeover attempt, these provisions may adversely affect the prevailing market price of our common stock if they are viewed as discouraging takeover attempts in the future.
Item 1B. | Unresolved Staff Comments |
Not Applicable.
Item 2. | Properties |
Our headquarters are in Jersey City, New Jersey. As of December 31, 2016, our principal offices consisted of the following properties:
Location | Square Feet | Lease Expiration Date | |
Jersey City, New Jersey | 352,765 | December 31, 2033 | |
Lehi, Utah | 200,000 | January 31, 2024 | |
Boston, Massachusetts | 69,806 | November 30, 2020 | |
White Plains, New York | 63,461 | September 29, 2021 | |
Houston, Texas | 56,584 | April 30, 2023 | |
We also lease offices in 16 states in the U.S., and offices outside the U.S. to support our international operations in Argentina, Australia, Bahrain, Brazil, Canada, China, Denmark, Germany, India, Indonesia, Ireland, Israel, Japan, Kazakhstan, Malaysia, Mexico, Nepal, Nigeria, Russia, Singapore, South Africa, South Korea, Spain, Thailand, the United Arab Emirates and the U.K.
We believe that our properties are in good operating condition and adequately serve our current business operations. We also anticipate that suitable additional or alternative space, including those under lease options, will be available at commercially reasonable terms for future expansion.
22
Item 3. | Legal Proceedings |
We are party to legal proceedings with respect to a variety of matters in the ordinary course of business, including those matters described below. With respect to the ongoing matters, we are unable, at the present time, to determine the ultimate resolution of or provide a reasonable estimate of the range of possible loss attributable to these matters or the impact they may have on our results of operations, financial position or cash flows. This is primarily because the matters are generally in early stages and discovery has either not commenced or been completed. Although we believe we have strong defenses and intend to vigorously defend these matters, we could in the future incur judgments or enter into settlements of claims that could have a material adverse effect on our results of operations, financial position or cash flows.
Intellicorp Records, Inc. Litigation
On September 9, 2015, we were served with a nationwide putative class action complaint filed in the Court of Common Pleas, Cuyahoga County in Ohio naming our subsidiary Intellicorp Records, Inc. (“Intellicorp.”) titled Sherri Legrand v. Intellicorp Records, Inc. and The Cato Corporation et al. Defendants removed the case to the United States District Court for the Northern District of Ohio on October 8, 2015. Plaintiffs filed their First Amended Class Action Complaint on November 5, 2015 (“Amended Complaint”), which like the prior complaint claims violations of the Fair Credit Reporting Act ("FCRA") and alleges two putative class claims against Intellicorp, namely (i) a section 1681k(a) claim on behalf of all individuals who were the subjects of consumer reports furnished by Intellicorp which contained public record information in the “Government Sanctions” section of the report on or after September 4, 2013 and continuing through the date the class list is prepared and (ii) a section 1681e(b) claim on behalf of all individuals who were the subjects of consumer reports furnished by Intellicorp which contained public record information in the “Government Sanctions” section of the report where the address or social security number of the subject of the report do not match the social security number or address contained in the government database on or after September 4, 2013 and continuing through the date the class list is prepared. Count I of the Amended Complaint alleges that defendant Cato violated the FCRA by procuring consumer reports on the plaintiff and other class members without making the stand-alone disclosure required by FCRA section 1681b(b)(2)(A)(i). Counts II and III allege that Intellicorp violated the FCRA section 1681e (b) by failing to follow reasonable procedures to assure maximum accuracy of the adverse information included in its consumer reports and FCRA section 1681k (a) by failing to maintain strict procedures to assure that the public record information reported which was likely to have an adverse effect on the consumer was complete and up to date, respectively. The Amended Complaint alleges that defendants acted willfully and seeks statutory damages for the classes in an amount not less than one hundred dollars and not more than one thousand dollars per violation, punitive damages, equitable relief, costs and attorney’s fees.
At this time, it is not possible to determine the ultimate resolution of, or estimate the liability related to this matter.
On February 1, 2016, we were served with a nationwide putative class action complaint filed in the United States District Court for the Eastern District of North Carolina naming Intellicorp. The complaint titled Frank DiSalvo v. Intellicorp Records, Inc. claims violations of the FCRA and alleges a section 1681b(b)(1) claim on behalf of all individuals residing in the United States who were the subjects of consumer reports furnished by Intellicorp for employment purposes within the period prescribed by the FCRA, 15 U.S.C. Section 1681p without first obtaining from the user of the report a certification that such user had complied with the obligations under Section 1681b(b)(2) as to the subject of the consumer report. The class complaint alleges that Intellicorp violated the FCRA section 1681b(b)(1) by failing to obtain the required specific certification from its customers to whom Intellicorp furnished consumer reports as to each consumer report provided before providing the specific consumer report that was the subject of the certification. The complaint alleges that the violations were willful or in the alternative negligent and seeks statutory damages for the class in an amount not less than one hundred dollars and not more than one thousand dollars per violation, punitive damages, equitable relief, costs and attorney’s fees. On April 18, 2016, the parties filed a joint motion to stay all proceedings pending the resolution of the United States Supreme Court’s decision in Spokeo v. Robins, No. 13-1339. After Spokeo was decided on May 16, 2016, plaintiffs voluntarily dismissed their federal court complaint and filed a virtually identical complaint in Ohio State court on May 27, 2016. Defendants removed that complaint to the United States District Court for the Northern District of Ohio on July 1, 2016, which on defendant’s motion dismissed the complaint for failure to allege Article III standing and remanded the case to Ohio state court on September 27, 2016. The parties agreed to resolve this matter for a non-material amount in the Settlement Agreement and Release executed on November 30, 2016.
Xactware Solutions, Inc. Patent Litigation
On October 8, 2015, we were served with a summons and complaint in an action titled Eagle View Technologies, Inc. and Pictometry International Group, Inc. v. Xactware Solutions, Inc. and Verisk Analytics, Inc. filed in the United States District Court for the District of New Jersey. The complaint alleges that our Roof InSight, Property InSight and Aerial Sketch products
23
infringe seven patents owned by Eagle View and Pictometry namely, Patent Nos. 436, 840, 152, 880, 770, 732 and 454 (collectively the “Patents-in-Suit”) On November 30, 2015, plaintiffs filed a First Amended Complaint (“First Amended Complaint”) adding Patent Nos. 376 and 737 to the Patents in Suit. The First Amended Complaint seeks an entry of judgment by the Court that defendants have and continue to directly infringe and/or indirectly infringe, by way of inducement the Patents in Suit, permanent injunctive relief, damages, costs and attorney’s fees.
At this time, it is not possible to determine the ultimate resolution of, or estimate the liability related to this matter.
Interthinx, Inc. Litigation
On April 20, 2015, we were served with a putative class action titled John Weber v. Interthinx, Inc. and Verisk Analytics, Inc. The plaintiff, a former employee of our former subsidiary Interthinx, Inc. in Missouri, filed the class action complaint in the United States District Court for the Eastern District of Missouri on behalf of all review appraisers and individuals holding comparable positions with different titles who were employed by Interthinx for the last three years nationwide and who were not paid overtime wages. The class complaint claims that the review appraiser employees were misclassified as exempt employees and, as a result, were denied certain wages and benefits that would have been received if they were properly classified as non-exempt employees. It pleads a Collective Action under section 216(b) of the Fair Labor Standards Act for unpaid overtime and seeks overtime wages, liquidated damages, declaratory relief, interest, costs and attorneys’ fees. On March 11, 2014, we sold 100 percent of the stock of Interthinx, Inc. The parties agreed to resolve this matter with our contribution of a non-material amount in the Class Action Settlement Agreement executed on November 8, 2016. The hearing for the preliminary approval of the settlement is scheduled for February 21, 2017.
Insurance Services Office, Inc. Litigation
On August 1, 2014, we were served with an Amended Complaint filed in the United States District Court for the District of Colorado titled Snyder, et. al. v. ACORD Corp., et al. The action is brought by nineteen individual plaintiffs, on their own behalf and on behalf of a putative class, against more than 120 defendants, including us and ISO. Except for us, ISO and the defendant Acord Corporation, which provides standard forms to assist in insurance transactions, most of the other defendants are property and casualty insurance companies that plaintiffs claim conspired to underpay property damage claims. Plaintiffs claim that we and ISO, along with all of the other defendants, violated state and federal antitrust and racketeering laws as well as state common law. On September 8, 2014, the Court entered an Order striking the Amended Complaint and granting leave to the plaintiffs to file a new complaint. On October 13, 2014, plaintiffs filed their Second Amended Complaint, which was re-filed by plaintiffs to correct errors as the Third Amended Complaint. The Third Amended Complaint similarly alleges that the defendants conspired to underpay property damage claims, but does not specifically allege what role we or ISO played in the alleged conspiracy. It claims that we and ISO, along with all of the other defendants, violated state and federal antitrust and racketeering laws as well as state common law, and seeks all available relief including, injunctive, statutory, actual and punitive damages as well as attorneys’ fees. On January 15, 2016, the Court granted defendants’ motions to dismiss all claims asserted in the Third Amended Complaint. Plaintiffs filed a motion for reconsideration of this dismissal on February 16, 2016. The Court granted defendants’ motion to strike the motion for reconsideration on March 2, 2016 and gave plaintiffs leave to file another motion for reconsideration in accordance with the rules which plaintiffs filed on March 11, 2016 and, which was denied by the Court on April 25, 2016. On April 1, 2016, plaintiffs also filed a Notice of Appeal of the Court’s January 15, 2016 Order, which dismissed all claims in the Third Amended Complaint. Plaintiffs also filed an appeal of the Court’s denial of the motion for reconsideration, which the Court of Appeals for the 10th Circuit consolidated with the appeal of the Court’s January 15, 2016 dismissal. Appellants filed their brief in support of the consolidated appeal on July 21, 2016 and Appellees filed their brief in response on September 21, 2016.
At this time, it is not possible to determine the ultimate resolution of, or estimate the liability related to this matter.
On February 19, 2016, we were served with a notice of a summons and complaint filed on January 29, 2016 against ISO in the U.S. District Court for the District of Connecticut titled Halloran et al. v. Harleysville Preferred Insurance Co. et al. As alleged in the First Amended Complaint, the putative class action is brought by four policyholders on behalf of a class of similarly situated policyholders in eastern Connecticut who allege that their homeowner’s insurance carriers have denied or will deny their claims for damage to their homes caused by defective concrete. The lawsuit alleges a breach of contract claim against certain insurers and seeks declaratory relief as to more than 100 other insurers. It also alleges that ISO as the drafter of the standardized policy language at issue violated the Connecticut Unfair Trade Practices ("CUTPA") and the Connecticut Unfair Insurance Practices Act ("CUIPA"). The plaintiffs ask that the Court certify a class of persons similarly situated and seek relief in the form of the cost for the replacement of their concrete foundations and a declaratory judgment that all of the defendant insurance carriers are obligated to provide coverage for claims resulting from the defective concrete as well as, attorneys’ fees, costs and interest.
24
On March 17, 2016 plaintiffs filed their first amended complaint asserting federal jurisdiction under the Class Action Fairness Act, adding a number of insurer defendants and amending their damages claim to include punitive damages. After defendants indicated that they would be filing motions to dismiss the first amended complaint at a Rule 16 Conference on April 12, 2016, the Court gave plaintiffs until May 6, 2016 to move for leave to file a second amended complaint. On May 6, 2016, plaintiffs filed a Motion to amend the first amended complaint with a proposed second amended complaint, which did not name ISO or us as a defendant. No opposition was filed to the motion to amend, which was granted on October 4, 2016. Instead of filing a second amended complaint, plaintiffs, in a joint motion for the modification of the case schedule filed on October 13, 2016, expressed their intention to move for leave to file a third amended complaint in order to drop certain additional defendants and to add other named plaintiffs. Plaintiffs’ motion for leave to file a third amended complaint which does not name us as a defendant is pending before the District Court.
At this time, it is not possible to determine the ultimate resolution of, or estimate the liability related to this matter.
Item 4. | Mine Safety Disclosures |
Not Applicable.
25
PART II
Item 5. | Market for Registrant’s Common Equity, Related Stockholder Matters and Issuer Purchases of Equity Securities |
Market Information
Verisk trades under the ticker symbol “VRSK” on the NASDAQ Global Select Market. Our common stock was first publicly traded on October 7, 2009. As of February 17, 2017, the closing price of our common stock was $84.90 per share, as reported by the NASDAQ Global Select Market. As of February 17, 2017, there were approximately 40 stockholders of record. We believe the number of beneficial owners is substantially greater than the number of record holders, because a large portion of common stock is held in “street name” by brokers.
We have not paid or declared any cash dividends on our common stock during the two most recent fiscal years and we currently do not intend to pay dividends on our common stock. We have a publicly announced share repurchase plan and repurchased a total of 50,636,328 shares since our IPO through December 31, 2016. As of December 31, 2016, we had 377,087,266 shares of treasury stock.
The following table shows the quarterly range of the closing high and low per share trading prices for our common stock as reported by the NASDAQ Global Select Market for the years ending December 31:
2016 | 2015 | |||||||||||||||
High | Low | High | Low | |||||||||||||
Fourth Quarter | $ | 84.15 | $ | 79.36 | $ | 81.50 | $ | 69.03 | ||||||||
Third Quarter | $ | 85.75 | $ | 79.43 | $ | 78.60 | $ | 70.77 | ||||||||
Second Quarter | $ | 81.08 | $ | 76.00 | $ | 76.85 | $ | 71.53 | ||||||||
First Quarter | $ | 79.92 | $ | 65.95 | $ | 72.27 | $ | 62.70 | ||||||||
26
Performance Graph
The graph below compares the cumulative total stockholder return on $100 invested in our common stock, with the cumulative total return (assuming reinvestment of dividends) on $100 invested in the S&P 500 Index and an aggregate of peer issuers in the information industry. The peer issuers used for this graph are Equifax Inc., Factset Research Systems Inc., IHS Markit, MSCI Inc., Moody’s Corporation, S&P Global, and Nielsen Holdings plc. Each peer issuer was weighted according to its respective market capitalization on December 31, 2011.
COMPARISON OF CUMULATIVE TOTAL RETURN
Assumes $100 Invested on December 31, 2011
Assumes Dividend Reinvested
Fiscal Year Ended December 31, 2016
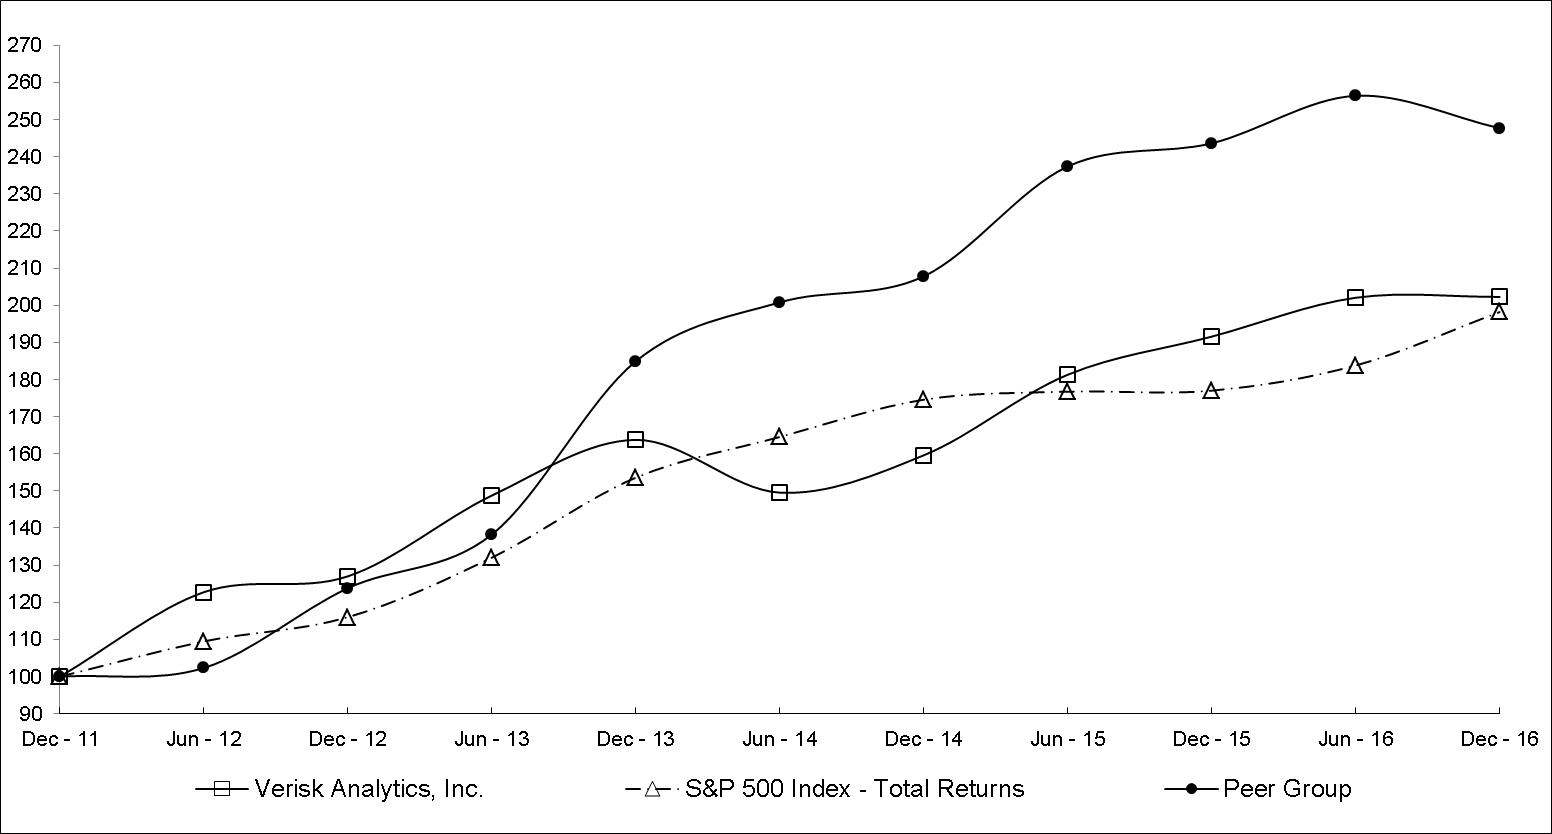
Recent Sales of Unregistered Securities
There were no unregistered sales of equity securities by the Company during 2016.
Issuer Purchases of Equity Securities
Our board of directors has authorized a share repurchase program, or Repurchase Program, since May 2010, up to $2.8 billion, including an additional authorization of $500.0 million announced on December 8, 2016. As of December 31, 2016, $636.0 million remains available for share repurchases. Under the Repurchase Program, we may repurchase stock in the market or as otherwise determined by us. These authorizations have no expiration dates and may be suspended or terminated at any time. Our shares repurchased for the quarter ended December 31, 2016 are set forth below:
Period | Total Number of Shares Purchased | Average Price Paid per Share | Total Number of Shares Purchased as Part of Publicly Announced Plans or Programs | Approximate Dollar Value of Shares that May Yet Be Purchased Under the Plans or Programs | |||||||||
(in millions) | |||||||||||||
October 1, 2016 through October 31, 2016 | 964,938 | $ | 80.53 | 964,938 | $ | 201.8 | |||||||
November 1, 2016 through November 30, 2016 | 431,960 | $ | 82.51 | 431,960 | $ | 166.2 | |||||||
December 1, 2016 through December 31, 2016 | 366,836 | $ | 82.26 | 366,836 | $ | 636.0 | |||||||
1,763,734 | 1,763,734 | ||||||||||||
27
Item 6. | Selected Financial Data |
The following selected historical financial data should be read in conjunction with, and are qualified by reference to, Item 7. “Management’s Discussion and Analysis of Financial Condition and Results of Operations” and the consolidated financial statements and notes thereto included elsewhere in this annual report on Form 10-K. The consolidated statement of operations data for the years ended December 31, 2016, 2015 and 2014 and the consolidated balance sheet data as of December 31, 2016 and 2015 are derived from the audited consolidated financial statements included elsewhere in this annual report on Form 10-K. The consolidated statement of operations data for the years ended December 31, 2013 and 2012 and the consolidated balance sheet data as of December 31, 2014, 2013 and 2012 are derived from consolidated financial statements that are not included in this annual report on Form 10-K. Results for the year ended December 31, 2016 are not necessarily indicative of results that may be expected in any other future period.
Between January 1, 2012 and December 31, 2016, we acquired 15 businesses (most notably Wood Mackenzie on May 19, 2015), which may affect the comparability of our consolidated financial statements. Our consolidated financial statements have been retroactively adjusted in all periods presented to give recognition to the discontinued operations of our heathcare business and mortgage services business. The following table sets forth our statement of operations for the years ended December 31:
28
2016 | 2015 | 2014 | 2013 | 2012 | |||||||||||||||
(In millions, except for share and per share data) | |||||||||||||||||||
Revenues: | |||||||||||||||||||
Decision Analytics | $ | 1,270.9 | $ | 1,072.5 | $ | 780.5 | $ | 705.9 | $ | 605.4 | |||||||||
Risk Assessment | 724.3 | 688.2 | 650.6 | 618.3 | 579.5 | ||||||||||||||
Revenues | 1,995.2 | 1,760.7 | 1,431.1 | 1,324.2 | 1,184.9 | ||||||||||||||
Expenses: | |||||||||||||||||||
Cost of revenues (exclusive of items shown separately below) | 714.4 | 612.0 | 516.0 | 472.5 | 411.5 | ||||||||||||||
Selling, general and administrative | 301.6 | 278.3 | 187.3 | 186.8 | 183.8 | ||||||||||||||
Depreciation and amortization of fixed assets | 119.1 | 96.6 | 65.4 | 49.2 | 36.7 | ||||||||||||||
Amortization of intangible assets | 92.5 | 70.4 | 30.1 | 36.2 | 29.1 | ||||||||||||||
Total expenses | 1,227.6 | 1,057.3 | 798.8 | 744.7 | 661.1 | ||||||||||||||
Operating income | 767.6 | 703.4 | 632.3 | 579.5 | 523.8 | ||||||||||||||
Other income (expense): | |||||||||||||||||||
Investment income and others, net | 6.1 | 16.9 | 0.2 | 0.3 | 0.1 | ||||||||||||||
Gain on derivative instruments | — | 85.2 | — | — | — | ||||||||||||||
Interest expense | (120.0 | ) | (121.4 | ) | (70.0 | ) | (76.1 | ) | (72.5 | ) | |||||||||
Total other expense, net | (113.9 | ) | (19.3 | ) | (69.8 | ) | (75.8 | ) | (72.4 | ) | |||||||||
Income before income taxes from continuing operations | 653.7 | 684.1 | 562.5 | 503.7 | 451.4 | ||||||||||||||
Provision for income taxes | (202.2 | ) | (196.6 | ) | (208.5 | ) | (184.8 | ) | (162.7 | ) | |||||||||
Income from continuing operations | 451.5 | 487.5 | 354.0 | 318.9 | 288.7 | ||||||||||||||
Income from discontinued operations, net of tax (1) | 139.7 | 20.1 | 46.0 | 29.5 | 40.4 | ||||||||||||||
Net income | $ | 591.2 | $ | 507.6 | $ | 400.0 | $ | 348.4 | $ | 329.1 | |||||||||
Basic net income per share | |||||||||||||||||||
Income from continuing operations | $ | 2.68 | $ | 2.95 | $ | 2.14 | $ | 1.90 | $ | 1.74 | |||||||||
Income from discontinued operations | 0.83 | 0.12 | 0.27 | 0.17 | 0.24 | ||||||||||||||
Basic net income per share | $ | 3.51 | $ | 3.07 | $ | 2.41 | $ | 2.07 | $ | 1.98 | |||||||||
Diluted net income per share | |||||||||||||||||||
Income from continuing operations | $ | 2.64 | $ | 2.89 | $ | 2.10 | $ | 1.85 | $ | 1.68 | |||||||||
Income from discontinued operations | 0.81 | 0.12 | 0.27 | 0.17 | 0.24 | ||||||||||||||
Diluted net income per share | $ | 3.45 | $ | 3.01 | $ | 2.37 | $ | 2.02 | $ | 1.92 | |||||||||
Weighted average shares outstanding: | |||||||||||||||||||
Basic | 168,248,304 | 165,090,380 | 165,823,803 | 168,031,412 | 165,890,258 | ||||||||||||||
Diluted | 171,171,572 | 168,451,343 | 169,132,423 | 172,276,360 | 171,709,518 | ||||||||||||||
29
The financial operating data below sets forth the information we believe is useful for investors in evaluating our overall financial performance for the years ended December 31:
2016 | 2015 | 2014 | 2013 | 2012 | |||||||||||||||
(In millions) | |||||||||||||||||||
Other data: | |||||||||||||||||||
EBITDA (2): | |||||||||||||||||||
Decision Analytics EBITDA | $ | 835.8 | $ | 647.7 | $ | 489.8 | $ | 413.4 | $ | 379.6 | |||||||||
Risk Assessment EBITDA | 415.5 | 406.5 | 368.8 | 346.9 | 316.3 | ||||||||||||||
EBITDA | $ | 1,251.3 | $ | 1,054.2 | $ | 858.6 | $ | 760.3 | $ | 695.9 | |||||||||
The following is a reconciliation of net income to EBITDA: | |||||||||||||||||||
Net income | $ | 591.2 | $ | 507.6 | $ | 400.0 | $ | 348.4 | $ | 329.1 | |||||||||
Depreciation and amortization of fixed and intangible assets from continuing operations | 211.6 | 167.0 | 95.5 | 85.4 | 65.8 | ||||||||||||||
Interest expense from continuing operations | 120.0 | 121.4 | 70.0 | 76.1 | 72.5 | ||||||||||||||
Provision for income taxes from continuing operations | 202.2 | 196.6 | 208.5 | 184.8 | 162.7 | ||||||||||||||
Depreciation, amortization, interest and provision for income taxes from discontinued operations | 126.3 | 61.6 | 84.6 | 65.6 | 65.8 | ||||||||||||||
EBITDA | $ | 1,251.3 | $ | 1,054.2 | $ | 858.6 | $ | 760.3 | $ | 695.9 | |||||||||
The following table sets forth our consolidated balance sheet data as of the years ended December 31:
2016 | 2015 | 2014 | 2013 | 2012 | |||||||||||||||
(In millions) | |||||||||||||||||||
Balance Sheet Data: | |||||||||||||||||||
Cash and cash equivalents | $ | 135.1 | $ | 138.3 | $ | 39.3 | $ | 165.8 | $ | 89.8 | |||||||||
Total assets | $ | 4,631.2 | $ | 5,593.7 | $ | 2,335.1 | $ | 2,492.8 | $ | 2,347.3 | |||||||||
Total debt (3) | $ | 2,387.0 | $ | 3,145.7 | $ | 1,426.7 | $ | 1,264.2 | $ | 1,448.4 | |||||||||
Stockholders’ equity (4) | $ | 1,332.4 | $ | 1,372.0 | $ | 211.0 | $ | 547.6 | $ | 255.6 | |||||||||
(1) | On June 1, 2016 and March 11, 2014, we sold our healthcare business and mortgage services business, respectively. Results of operations for the healthcare and mortgage services businesses are reported as discontinued operations for the year ended December 31, 2016 and for all prior periods presented. As necessary, the amounts have been retroactively adjusted in all periods presented to give recognition to the discontinued operations. See Note 10 of our consolidated financial statements included in this annual report on Form 10-K. |
(2) | EBITDA is the financial measure that management uses to evaluate the performance of our segments. “EBITDA” is defined as net income before interest expense, provision for income taxes, and depreciation and amortization of fixed and intangible assets. Because EBITDA is calculated from net income, this presentation includes EBITDA from discontinued operations of our healthcare business and mortgage services business. In addition, references to EBITDA margin, which is computed as EBITDA divided by revenues from continuing and discontinued operations. See Note 18 of our consolidated financial statements included in this annual report on Form 10-K. |
Although EBITDA is a non-GAAP financial measure, EBITDA is frequently used by securities analysts, lenders and others in their evaluation of companies, EBITDA has limitations as an analytical tool, and should not be considered in isolation, or as a substitute for an analysis of our results of operations or cash flow from operating activities reported under GAAP. Management uses EBITDA in conjunction with traditional GAAP operating performance measures as part of its overall assessment of company performance. Some of these limitations are:
30
• | EBITDA does not reflect our cash expenditures, or future requirements for capital expenditures or contractual commitments. |
▪ | EBITDA does not reflect changes in, or cash requirements for, our working capital needs. |
▪ | Although depreciation and amortization are non-cash charges, the assets being depreciated and amortized often will have to be replaced in the future and EBITDA does not reflect any cash requirements for such replacements. |
▪ | Other companies in our industry may calculate EBITDA differently than we do, limiting its usefulness as a comparative measure. |
(3) | Includes capital lease obligations. |
(4) | Subsequent to our corporate reorganization on October 6, 2009, share repurchases are recorded as treasury stock within stockholders’ equity, as we intend to reissue shares from treasury stock in the future. For the years ended December 31, 2016 and 2015, we repurchased $333.3 million and $120.5 million, respectively, of treasury stock. |
Item 7. | Management’s Discussion and Analysis of Financial Condition and Results of Operations |
The following discussion should be read in conjunction with our historical financial statements and the related notes included elsewhere in this annual report on Form 10-K, as well as the discussion under “Selected Consolidated Financial Data.” This discussion contains forward-looking statements that involve risks and uncertainties. Our actual results may differ materially from those discussed in or implied by any of the forward-looking statements as a result of various factors, including but not limited to those listed under “Risk Factors” and “Special Note Regarding Forward-Looking Statements.”
We enable our customers to make better decisions about risk, investments, and operations with greater precision, efficiency, and discipline. We also help customers across the globe protect and grow the value of people, property and financial assets. We provide value to our customers by supplying proprietary data that, combined with our analytic methods, creates embedded decision support solutions. We are one of the largest aggregators and providers of data pertaining to U.S. property and casualty, or P&C, insurance risks. We offer predictive analytics and decision support solutions to customers in rating, underwriting, claims, catastrophe and weather risk, global risk analytics, natural resources intelligence, and many other fields. Refer to Item 1. Business for further discussion.
Our customers use our solutions to make better decisions with greater efficiency and discipline. We refer to these products and services as “solutions” due to the integration among our products and the flexibility that enables our customers to purchase components or the comprehensive package of products. These solutions take various forms, including data, statistical models or tailored analytics, all designed to allow our customers to make more logical decisions. We believe our solutions for analyzing risk positively impact our customers’ revenues and help them better manage their costs.
We organize our business in two segments: Risk Assessment and Decision Analytics. Our Risk Assessment segment provides statistical, actuarial and underwriting data for the U.S. P&C insurance industry. Our Risk Assessment segment revenues represented 36.3% and 39.1% of our revenues for the years ended December 31, 2016 and 2015, respectively. Our Decision Analytics segment provides solutions to our customer in insurance, energy and specialized markets, and financial services. Our Decision Analytics segment revenues represented approximately 63.7% and 60.9% of our revenues for the years ended December 31, 2016 and 2015, respectively.
On June 1, 2016 and March 11, 2014, we sold our healthcare business, Verisk Health, and mortgage services business, Interthinx, respectively. Results of operations for the healthcare and mortgage services businesses are reported as discontinued operations for the year ended December 31, 2016 and for all prior periods presented. See Note 10 of our consolidated financial statements included in this annual report on Form 10-K. As necessary, the amounts have been retroactively adjusted in all periods presented to give recognition to the discontinued operations.
31
Executive Summary
Key Performance Metrics
We believe our business’s ability to grow recurring revenue and generate positive cash flow is the key indicator of the successful execution of our business strategy. We use year-over-year revenue and EBITDA growth as metrics to measure our performance. EBITDA and EBITDA margin are non-GAAP financial measures (see Note 2 within Item 6. Selected Financial Data section of Management’s Discussion and Analysis of Financial Condition and Results of Operations). The respective GAAP financial measures are net income and net income margin.
Revenue growth. We use year-over-year revenue growth as a key performance metric. We assess revenue growth based on our ability to generate increased revenue through increased sales to existing customers, sales to new customers, sales of new or expanded solutions to existing and new customers, and strategic acquisitions of new businesses.
EBITDA growth. We use EBITDA growth as a proxy for the cash generated by the business. EBITDA growth serves as a measure of our ability to balance the size of revenue growth with cost management and investing for future growth.
EBITDA margin. We use EBITDA margin as a metric to assess segment performance and scalability of our business. We assess EBITDA margin based on our ability to increase revenues while controlling expense growth.
Revenues
We earn revenues through subscriptions, long-term agreements and on a transactional basis, recurring and non-recurring. Subscriptions for our solutions are generally paid in advance of rendering services either quarterly or in full upon commencement of the subscription period, which is usually for one year and automatically renewed each year. As a result, the timing of our cash flows generally precedes our recognition of revenues and income and our cash flow from operations tends to be higher in the first quarter as we receive subscription payments. Examples of these arrangements include subscriptions that allow our customers to access our standardized coverage language, our claims fraud database or our actuarial services throughout the subscription period. In general, we experience minimal revenue seasonality within the business. Our long-term agreements are generally for periods of three to five years. We recognize revenue from subscriptions ratably over the term of the subscription and most long-term agreements are recognized ratably over the term of the agreement.
Certain of our solutions are also paid for by our customers on a transactional basis. For example, we have solutions that allow our customers to obtain property-specific rating and underwriting information to price a policy on a commercial building, or compare a P&C insurance, medical or workers’ compensation claim with information in our databases. We also provide advisory services, which help our customers get more value out of our analytics and their subscriptions. For the years ended December 31, 2016 and 2015, 16.5% and 17.2% of our revenues were derived from providing transactional recurring and non-recurring solutions, respectively. We earn these revenues as our solutions are delivered or services performed. In general, they are billed monthly at the end of each month.
For the the years ended December 31, 2016 and 2015, 92.0% and 90.1% of the revenues in our Risk Assessment segment were derived from subscriptions and long-term agreements for our solutions, respectively. Our customers in this segment include most of the P&C insurance providers in the U.S. For the years ended December 31, 2016 and 2015, 78.6% and 78.1% of the revenues in our Decision Analytics segment were derived from subscriptions and long-term agreements for our solutions, respectively.
Principal Operating Costs and Expenses
Personnel expenses are a major component of both our cost of revenues and selling, general and administrative expenses. Personnel expenses, which represented 47.7% and 46.5% of our total expenses for the years ended December 31, 2016 and 2015, respectively, include salaries, benefits, incentive compensation, equity compensation costs, sales commissions, employment taxes, recruiting costs, and outsourced temporary agency costs.
We allocate personnel expenses between two categories, cost of revenues and selling, general and administrative costs, based on the actual costs associated with each employee. We categorize employees who maintain our solutions as cost of revenues, and all other personnel, including executive managers, sales people, marketing, business development, finance, legal, human resources, and administrative services, as selling, general and administrative expenses. A significant portion of our other operating costs, such as facilities and communications, are either captured within cost of revenues or selling, general and administrative expense based on the nature of the work being performed.
While we expect to grow our headcount over time to take advantage of our market opportunities, we believe that the economies of scale in our operating model will allow us to grow our personnel expenses at a lower rate than revenues.
32
Historically, our EBITDA margin has improved because we have been able to increase revenues without a proportionate corresponding increase in expenses. However, part of our corporate strategy is to invest in new solutions, which may offset margin expansion.
Cost of Revenues. Our cost of revenues consists primarily of personnel expenses. Cost of revenues also includes the expenses associated with the acquisition and verification of data, the maintenance of our existing solutions and the development and enhancement of our next-generation solutions. Our cost of revenues excludes depreciation and amortization.
Selling, General and Administrative Expense. Our selling, general and administrative expense also consists primarily of personnel costs. A portion of the other operating costs such as facilities, insurance and communications are allocated to selling, general and administrative costs based on the nature of the work being performed by the employee. Our selling, general and administrative expenses excludes depreciation and amortization.
Trends Affecting Our Business
We serve customers in three primary vertical markets: P&C insurance, energy, and financial services. The industry trends in each of those markets can affect our business.
A significant change in P&C insurers’ profitability could affect the demand for our solutions. For insurers, the keys to profitability include investment income and premium growth. Investment income remains under pressure as a result of low interest rates. Growth in P&C insurers’ direct written premiums is cyclical, with total industry premium growth receding from a peak of 14.8% in 2002 to a trough of negative 3.1% in 2009 and subsequently recovering to 4.4% in 2012, 4.3% in 2013, 4.4% in 2014 and 3.7% in 2015. Based on our experience, insurers more closely scrutinize their spending in periods of more challenging growth. In recent years, we have signed multi-year contracts with certain customers, and pricing is fixed at the beginning of each multi-year period; pricing for other customers is still linked to prior years' premiums.
Trends in catastrophe and non-catastrophe weather losses can have an effect on our customers’ profitability, and therefore, their appetite for buying analytics to help them manage their risks. Any increase or decrease in frequency or severity of weather events over time could lead to an increased or decreased demand for our catastrophe modeling, catastrophe loss information, and repair cost solutions. Likewise, any structural changes in the reinsurance and related brokerage industry from the recent influx of alternative capital or newer technologies could affect demand for our products. We also have a portion of our revenue related to the number of claims processed due to losses, which can be impacted by seasonal storm activity. The need by our customers to fight insurance fraud - both in claims and at policy inception - could lead to increased demand for our underwriting and claims solutions.
Trends in the energy, chemicals, and metals and mining sectors and activity in financial markets can influence our revenues. Movements of commodity prices affect the profitability of our customers, which include energy, chemicals, and metals and mining companies, while stock markets and mergers and acquisitions, or M&A, are some of the principal drivers affecting our financial institution customers. Among the trends influencing commodity prices are supply and demand factors, regulatory requirements, fiscal impacts, regional market structures, and geopolitical risks. Following the Organization of the Petroleum Exporting Countries, or OPEC, meeting in November 2016, oil prices have begun to recover indicating an uplift across the energy sector. After a prolonged slump in the metals and mining sector, there are emerging signs of optimism in the copper, aluminum and lithium markets among others. M&A activity is also beginning to improve with high profile asset sales from Shell, Total, and BP among others. In addition, we have seen some large investments being made, notably the Glencore and Qatar deal with Rosneft, and the separate GE-Baker Hughes proposed transaction. Furthermore, Wood Mackenzie expects final investment decisions in the oil and gas sector to significantly increase in 2017, albeit from recent lows. However, volatility in commodity prices means uncertainty for our customers, which can impact their demand for our data and services. Notwithstanding the unsettled view of the U.S. leadership towards the Paris global accord on climate change, over the longer term Wood Mackenzie expects a period of change in the energy mix. The ongoing incentivizing of growth in renewable energy and other low carbon technologies around the world will help drive this, while fossil fuels are expected to remain a core part of energy demand for the foreseeable future. We will continue to evolve our offerings to meet the needs of our customers in an increasingly complex market.
Market trends continue to influence our financial services vertical in important ways. Most notable among the recent trends affecting the vertical includes a significant increase in the number of alternative lenders and alternative payment instruments in the market. We are adapting our offerings to address the needs of alternative lenders, backed by our deep expertise and datasets covering the performance of customers across a full range of credit histories. As well, our unique ability to analyze the customer adoption rates of new alternative payment instruments from our syndicated study datasets is enabling us to serve as the “go to” solution for the industry’s analytic needs in the space. A strengthening of the U.S. dollar relative to the currencies of our international customers and a softening of the global economy is putting an even greater level of
33
downward pressure on our revenues from such customers. However, we are also observing a growing appetite for our expense-focused solutions and regulatory-focused solutions among those customers. Lastly, we are seeing a greater number of companies entering the media effectiveness space, which encourages potential competitors to challenge our position in this space. We stand confident of our position at this stage, given the unique nature and strength of our partnerships coupled by the comprehensiveness of our data, particularly as it relates to seeing the full wallet spend of a consumer.
Description of Acquisitions
We acquired twelve businesses since January 1, 2014. These acquisitions affect the comparability of our consolidated results of operations between periods.
On November 23, 2016, we acquired the net assets of IntelliStance, LLC, or MarketStance, a provider of market intelligence data and analytics to the property/casualty insurance market. MarketStance has become part of ISO within the Risk Assessment segment. MarketStance has built a proprietary analytics model to provide actionable insights on customer's profitability and that enhances our offerings. See Note 9 to our consolidated financial statements included in this annual report on Form 10-K for further discussions.
On November 11, 2016, we acquired 100 percent of the stock of The GeoInformation Group Limited, or GeoInformation, a provider of geographic data solutions. GeoInformation offers mapping services and geospatial data and analytic solutions to companies and public sector organizations. GeoInformation's resources complement the risk management and predictive analytics capabilities internationally within the Risk Assessment segment. See Note 9 to our consolidated financial statements included in this annual report on Form 10-K for further discussions.
On October 20, 2016, we acquired 100 percent of the stock of Analyze Re, Inc., or Analyze Re, a software analytics provider for the reinsurance and insurance industries. Analyze Re has become part of our insurance vertical within the Decision Analytics segment and enables us to provide our customers with additional real-time pricing, exposure management, and enterprise portfolio roll-up capabilities. See Note 9 to our consolidated financial statements included in this annual report on Form 10-K for further discussions.
On August 19, 2016, we acquired the net assets of data and subscriptions business of Quest Offshore Resources, Inc, or Quest Offshore, which supplies market intelligence to the offshore oil and gas sector. The data and subscriptions business has become part of Wood Mackenzie within the Decision Analytics segment and complements its existing upstream analysis expertise. See Note 9 to our consolidated financial statements included in this annual report on Form 10-K for further discussions.
On July 26, 2016,we acquired 100 percent of the stock of Greentech Media, Inc., or Greentech Media, an information services provider for the electricity and renewables sector. Greentech Media has become part of Wood Mackenzie within the Decision Analytics segment and enables Wood Mackenzie to provide its customers with market intelligence across several categories, including solar generation, energy storage, and smart grids that react to changes in supply and demand. See Note 9 to our consolidated financial statements included in this annual report on Form 10-K for further discussions.
On April 14, 2016, we acquired 100 percent of the stock of Risk Intelligence Ireland Limited, or RII, a provider of fraud detection, compliance, risk control, and process automation services to the Irish insurance industry. RII enhances the ability of the Company's Risk Assessment segment to serve the international insurance market. See Note 9 to our consolidated financial statements included in this annual report on Form 10-K for further discussions.
On November 20, 2015, we acquired 100 percent of the stock of The PCI Group, or PCI. PCI is a consortium of five specialist companies that offer integrated data and subscriptions research in the chemicals, fibers, films, and plastics sectors. PCI has become part of Wood Mackenzie, and continues to provide services to enhance Wood Mackenzie's chemicals capabilities in the Decision Analytics segment. See Note 9 to our consolidated financial statements included in this annual report on Form 10-K for the final purchase price allocations.
On November 6, 2015, we acquired 100 percent of the stock of Infield Systems Limited, or Infield. Infield is a provider of business intelligence, analysis, and research to the oil, gas, and associated marine industries. Infield has become part of Wood Mackenzie and continues to provide services to enhance Wood Mackenzie's upstream and supply chain capabilities in the Decision Analytics segment. See Note 9 to our consolidated financial statements included in this annual report on Form 10-K for the final purchase price allocations.
34
On May 19, 2015, we acquired 100 percent of the stock of Wood Mackenzie. Wood Mackenzie is a global provider of data analytics and commercial intelligence for the energy, chemicals, metals and mining verticals. This acquisition advances our strategy to expand internationally and positions ourselves in the global energy market. Wood Mackenzie is included in the energy and specialized markets vertical, formerly named the specialized markets vertical, of the Decision Analytics segment. See Note 9 to our consolidated financial statements included in this annual report on Form 10-K for the final purchase price allocations.
On December 8, 2014, we acquired 100 percent of the stock of Maplecroft. Using a proprietary data aggregation and analytical approach, Maplecroft enables its customers to assess, monitor, and forecast a growing range of worldwide risks, including geopolitical and societal risks. Within our Decision Analytics segment, this acquisition positions us as a provider of value chain optimization tools, providing comprehensive quantitative risk analytics and platforms by which customers can visualize, quantify, mitigate, and manage their risk. Maplecroft is headquartered in Bath, England. See Note 9 to our consolidated financial statements included in this annual report on Form 10-K for further discussions.
On October 31, 2014, we acquired the net assets of Dart Consulting Limited, or Dart. Dart is a provider of benchmarking and advisory solutions to financial services institutions in Australia, New Zealand, and other key Asia-Pacific markets. As part of our Decision Analytics segment, Dart provides benchmarking solutions and professional services critical to financial services institutions in the management of lending and payment portfolios.
On January 29, 2014, we acquired the net assets of Inovatus, LLC, or Inovatus. The assets primarily consisted of software and are embedded in our existing models focusing on reducing fraud and premium leakage for personal auto insurance carriers. The technology is included in our Decision Analytics segment as part of its solutions to leverage data and analytics to help insurance companies improve results.
Description of Discontinued Operations
On June 1, 2016, we sold our healthcare business, Verisk Health, for a price of $714.6 million. On March 11, 2014, we sold our mortgage services business, Interthinx, for a price of $151.2 million. Results of operations for the healthcare and mortgage services businesses are reported as discontinued operations for the year ended December 31, 2016 and for all prior periods presented. See Note 10 to our consolidated financial statements included in this annual report on Form 10-K.
Year Ended December 31, 2016 Compared to Year Ended December 31, 2015
Consolidated Results of Continuing Operations
Revenues
Revenues were $1,995.2 million for the year ended December 31, 2016 compared to $1,760.7 million for the year ended December 31, 2015, an increase of $234.5 million or 13.3%. Excluding revenues of $151.0 million from Wood Mackenzie (for the first and second quarters), Infield, PCI, RII, Greentech Media, Quest Offshore, Analyze Re, GeoInformation, and MarketStance, collectively referred to as our recent acquisitions, our revenue growth was $83.5 million or 4.9%. Revenues within our Decision Analytics segment, excluding our recent acquisitions of Wood Mackenzie (for the first and second quarters), Infield, PCI, Greentech Media, Quest Offshore and Analyze Re, increased by $49.3 million or 4.8%. Revenue growth within Decision Analytics was primarily driven by our financial services and insurance categories. Revenues in our Risk Assessment segment, excluding our recent acquisitions of RII, GeoInformation and MarketStance, increased by $34.2 million or 5.0%. Both categories, industry-standard insurance programs and property-specific rating and underwriting information, within Risk Assessment contributed to its revenue growth. Refer to the Results of Continuing Operations by Segment within this section for further information regarding our revenues.
Cost of Revenues
Cost of revenues was $714.4 million for the year ended December 31, 2016 compared to $612.0 million for the year ended December 31, 2015, an increase of $102.4 million or 16.7%. Our recent acquisitions accounted for an increase of $56.1 million in cost of revenues, primarily related to salaries and employee benefits. Excluding the impact of our recent acquisitions, our cost of revenues increased $46.3 million or 7.8%. The increase was primarily due to increases in salaries and employee benefits cost of $27.2 million and an ESOP charge of $14.5 million. Other increases include information technology expense of $5.3 million and data costs and data processing fees of $0.9 million. These increases were offset by a decrease in other operating costs of $1.6 million.
35
Selling, General and Administrative Expenses
Selling, general and administrative expenses, or SGA, were $301.6 million for the year ended December 31, 2016 compared to $278.3 million for the year ended December 31, 2015, an increase of $23.3 million or 8.3%. Our recent acquisitions accounted for an increase of $12.2 million in SGA, primarily related to salaries and employee benefits. Excluding the impact of our recent acquisitions, SGA increased $11.1 million or 4.5%. The increase was primarily due to increases in salaries and employee benefits of $5.6 million, an ESOP charge of $4.3 million, and professional consulting fees of $3.0 million. These increases were offset by a decrease in information technology expense of $0.9 million and other general and administrative of $0.9 million.
Depreciation and Amortization of Fixed Assets
Depreciation and amortization of fixed assets was $119.1 million for the year ended December 31, 2016 compared to $96.6 million for the year ended December 31, 2015, an increase of $22.5 million or 23.2%. The increase in depreciation and amortization of fixed assets includes depreciation and amortization related to our recent acquisitions of $11.3 million. The remaining increase primarily relates to hardware and software development costs placed into production to support data capacity expansion and revenue growth.
Amortization of Intangible Assets
Amortization of intangible assets was $92.5 million for the year ended December 31, 2016 compared to $70.4 million for the year ended December 31, 2015, an increase of $22.1 million or 31.2%. The increase in amortization of intangible assets was primarily related to our recent acquisitions of $20.1 million.
Investment Income and Others, Net
Investment income and others, net was a gain of $6.1 million for the year ended December 31, 2016 compared to $16.9 million for the year ended December 31, 2015, a decrease of $10.8 million. The decrease was primarily related to a gain of $15.6 million in connection with the exercise and payout of common stock warrants for the year ended December 31, 2015. This decrease was partially offset by increases attributable to interest income of $6.5 million generated from the subordinated promissory note related to the divestiture of our healthcare business.
Gain on Derivative Instruments
Gain on derivative instruments decreased $85.2 million or 100% due to a one-time foreign currency hedge gain realized in 2015 relating to the acquisition of Wood Mackenzie, which did not recur in 2016.
Interest Expense
Interest expense was $120.0 million for the year ended December 31, 2016 compared to $121.4 million for the year ended December 31, 2015, a decrease of $1.4 million or 1.1%. The decrease is primarily due to the net payments of our credit facility of $770.0 million mostly funded by the net proceeds from the divestiture of our healthcare business.
Provision for Income Taxes
The provision for income taxes was $202.2 million for the year ended December 31, 2016 compared to $196.6 million for the year ended December 31, 2015, an increase of $5.6 million or 2.8%. The effective tax rate was 30.9% for the year ended December 31, 2016 compared to 28.7% for the year ended December 31, 2015.
Net Income
The net income margin for our consolidated results, including discontinued operations, was 28.1% for the year ended December 31, 2016 compared to 24.5% for the year ended December 31, 2015. Our net income margin for the year ended December 31, 2016 was positively impacted by the discontinued operations, including the gain on sale of our healthcare business of 5.5% and lowered by an ESOP charge of 0.6%. Our net income margin for the year ended December 31, 2015 was lowered by the discontinued operations of 3.2% and positively impacted by the derivative gain and the transaction costs related to the Wood Mackenzie acquisition and the gain on the exercise and payout of the common stock warrants of 3.2%.
EBITDA
The EBITDA margin for our consolidated results, including discontinued operations, was 59.4% for the year ended December 31, 2016 compared to 51.0% for the year ended December 31, 2015. Our EBITDA margin for the year ended December 31, 2016 was positively impacted by the discontinued operations, including the gain on sale of our healthcare
36
business, of 10.0%, which was partially offset by the impacts from an ESOP charge of 0.9%. Our EBITDA margin for the year ended December 31, 2015 was lowered by the discontinued operations of 4.2% and positively impacted by the derivative gain and the transaction costs related to the Wood Mackenzie acquisition and the warrant exercise of 3.6%.
Results of Continuing Operations by Segment
Decision Analytics
Revenues
Revenues for our Decision Analytics segment were $1,270.9 million for the year ended December 31, 2016 compared to $1,072.5 million for the year ended December 31, 2015, an increase of $198.4 million or 18.5% . Excluding revenues of $149.1 million from Wood Mackenzie (for the first and second quarters) and our recent acquisitions of Infield, PCI, Greentech Media, Quest Offshore, and Analyze Re, Decision Analytics revenues increased $49.3 million or 4.8%.
Our revenue by category for the periods presented is set forth below for the years ended December 31:
2016 | 2015 | Percentage Change | ||||||||
(In millions) | ||||||||||
Insurance | $ | 699.8 | $ | 647.2 | 8.1 | % | ||||
Energy and specialized markets | 442.8 | 308.8 | 43.4 | % | ||||||
Financial services | 128.3 | 116.5 | 10.1 | % | ||||||
Total Decision Analytics | $ | 1,270.9 | $ | 1,072.5 | 18.5 | % | ||||
Our insurance revenue increased $52.6 million or 8.1%. Excluding revenues of $0.5 million from our recent acquisition, our insurance revenue increased $52.1 million or 8.1%. The increase was primarily due to an increase within our loss quantification solutions, underwriting solutions, insurance anti-fraud claims revenue, and catastrophe modeling services.
Our energy and specialized markets revenue increased $134.0 million or 43.4%. Excluding revenues of $148.6 million from Wood Mackenzie (for the first and second quarters) and our recent acquisitions of Infield, PCI, Greentech Media, and Quest Offshore, our energy and specialized markets revenue decreased $14.6 million or 5.5% due to the continuing end-market and currency headwinds affecting the energy business and declines in our environmental health and safety services.
Our financial services revenue increased $11.8 million or 10.1%, primarily due to the continued demand for our media effectiveness services and analytic solutions.
Cost of Revenues
Cost of revenues for our Decision Analytics segment was $490.7 million for the year ended December 31, 2016 compared to $412.0 million for the year ended December 31, 2015, an increase of $78.7 million or 19.1%. Our recent acquisitions within the Decision Analytics segment represented an increase of $54.8 million in cost of revenues, which was primarily related to salaries and employee benefits. Excluding the impact of our recent acquisitions, our cost of revenues increased $23.9 million or 6.1%. The increase was primarily due to increases in salaries and employee benefits of $16.9 million, an ESOP charge of $6.2 million, and information technology expense of $4.2 million. These increases were offset by decreases in data costs and data processing fees of $0.2 million and other operating costs of $3.2 million.
Selling, General and Administrative Expenses
Selling, general and administrative expenses for our Decision Analytics segment were $214.9 million for the year ended December 31, 2016 compared to $196.5 million for the year ended December 31, 2015, an increase of $18.4 million or 9.4%. Our recent acquisitions within the Decision Analytics segment, accounted for an increase of $11.5 million in SGA, which was primarily related to salaries and employee benefits. Excluding costs associated with our recent acquisitions, SGA increased $6.9 million or 4.2%. The increase was primarily due to increases in salaries and employee benefits of $6.8 million, an ESOP charge of $1.9 million, and professional consulting fees of $1.4 million. These increases were offset by decreases in information technology expense of $1.3 million and other general expenses of $1.9 million.
37
EBITDA
The EBITDA margin for our Decision Analytics segment, including our discontinued operations, was 60.4% for the year ended December 31, 2016 and 46.9% for the year ended December 31, 2015. Our EBITDA margin for the year ended December 31, 2016 was positively impacted by the discontinued operations, including the gain on sale of our healthcare business, of 15.6%, which was partially offset by the impact from an ESOP charge of 0.6%. The non-recurring derivative gain, net of transaction costs related to the Wood Mackenzie acquisition and the warrant exercise and payout, positively impacted our EBITDA margin by 5.4%, which was offset by the impact from the discontinued operations of 5.9% for year ended December 31, 2015.
Risk Assessment
Revenues
Revenues for our Risk Assessment segment were $724.3 million for the year ended December 31, 2016 compared to $688.2 million for the year ended December 31, 2015, an increase of $36.1 million or 5.2%. Excluding revenues of $1.9 million from our recent acquisitions of RII, GeoInformation and MarketStance, revenues for our Risk Assessment increased $34.2 million or 5.0% for the year ended December 31, 2016. Revenue growth within this segment primarily resulted from an increase in prices derived from continued enhancements to the content of the solutions within our industry-standard insurance programs as well as selling expanded solutions to existing customers.
Our revenue by category for the periods presented is set forth below for the years ended December 31:
2016 | 2015 | Percentage Change | ||||||||
(In millions) | ||||||||||
Industry-standard insurance programs | $ | 554.1 | $ | 524.6 | 5.6 | % | ||||
Property-specific rating and underwriting information | 170.2 | 163.6 | 4.0 | % | ||||||
Total Risk Assessment | $ | 724.3 | $ | 688.2 | 5.2 | % | ||||
Cost of Revenues
Cost of revenues for our Risk Assessment segment was $223.7 million for the year ended December 31, 2016 compared to $200.0 million for the year ended December 31, 2015, an increase of $23.7 million or 11.9%. Our recent acquisitions within this segment represented an increase of $1.3 million in cost of revenues, which was primarily related to salaries and employee benefits. Excluding the impact of our recent acquisitions, our cost of revenues increased $22.4 million or 11.2% The increase was primarily due to increases in salaries and employee benefit costs of $10.3 million, an ESOP charge of $8.3 million, data costs and data processing fees of $1.1 million, information technology expense of $1.1 million, and other operating costs of $1.6 million.
Selling, General and Administrative Expenses
Selling, general and administrative expenses for our Risk Assessment segment were $86.7 million for the year ended December 31, 2016 compared to $81.8 million for the year ended December 31, 2015, an increase of $4.9 million or 5.9%. Our recent acquisitions within this segment, accounted for an increase of $0.7 million in SGA, which was primarily related to salaries and employee benefits. Excluding costs associated with our recent acquisitions, SGA increased $4.2 million or 5.1%. The increase was primarily due to an ESOP charge of $2.4 million, increases in professional consulting costs of $1.6 million, information technology expenses of $0.4 million, and other general expense of $1.0 million. These increases were offset by a decrease in salaries and employee benefit costs of $1.2 million.
EBITDA
The EBITDA margin for our Risk Assessment segment was 57.4% for the year ended December 31, 2016 compared to 59.1% for the year ended December 31, 2015. The margin for the year ended December 31, 2016 was negatively impacted by an ESOP charge of 1.5%.
38
Year Ended December 31, 2015 Compared to Year Ended December 31, 2014
Consolidated Results of Continuing Operations
Revenues
Revenues were $1,760.7 million for the year ended December 31, 2015 compared to $1,431.1 million for the year ended December 31, 2014, an increase of $329.6 million or 23.0%. In December 2014, we acquired Maplecroft and in 2015, we acquired Wood Mackenzie, Infield, and PCI, all within our Decision Analytics segment; these comprise our recent acquisitions. These recent acquisitions provided an increase of $219.6 million in revenues for the year ended December 31, 2015. Excluding recent acquisitions, revenues increased $110.0 million or 7.7%. Revenue growth within Decision Analytics was primarily driven by our insurance and financial services categories. Both categories, industry-standard insurance programs and property-specific rating and underwriting information, within Risk Assessment contributed to its revenue growth. Refer to the Results of Continuing Operations by Segment within this section for further information regarding our revenues.
Cost of Revenues
Cost of revenues was $612.0 million for the year ended December 31, 2015 compared to $516.0 million for the year ended December 31, 2014, an increase of $96.0 million or 18.6%. Our recent acquisitions within the Decision Analytics segment accounted for an increase of $82.4 million in cost of revenues, of which $6.0 million were non-recurring equity compensation associated with the Wood Mackenzie acquisition and the remaining amount was primarily related to salaries and employee benefits. Excluding the impact of our recent acquisitions, our cost of revenues increased $13.6 million or 2.6%. The increase was primarily due to increases in salaries and employee benefits cost of $5.9 million. Other increases include data costs and data processing fees of $2.4 million, rent expense of $2.2 million, travel expense of $2.0 million, and other operating costs of $1.5 million. These increases were offset by a decrease in information technology expense of $0.4 million.
Selling, General and Administrative Expenses
Selling, general and administrative expenses, or SGA, were $278.3 million for the year ended December 31, 2015 compared to $187.3 million for the year ended December 31, 2014, an increase of $91.0 million or 48.7%. Our recent acquisitions accounted for an increase of $83.7 million in SGA, of which $20.7 million were non-recurring transaction costs associated with the Wood Mackenzie acquisition and the remaining amount was primarily related to salaries and employee benefits, rent expense and professional consulting fees. Excluding the impact of our recent acquisitions, SGA increased $7.3 million or 4.0%. The increase was primarily due to increases in salaries and employee benefits of $7.7 million, information technology expense of $1.1 million, rent expense of $1.1 million, travel expense of $0.7 million and other general and administrative of $0.3 million. These increases were offset by a decrease in professional consulting fees of $3.6 million.
Depreciation and Amortization of Fixed Assets
Depreciation and amortization of fixed assets was $96.6 million for the year ended December 31, 2015 compared to $65.4 million for the year ended December 31, 2014, an increase of $31.2 million or 47.7%. The increase in depreciation and amortization of fixed assets includes depreciation of furniture and equipment, software, computer hardware and related equipment, and depreciation and amortization related to our recent acquisitions of $9.7 million.
Amortization of Intangible Assets
Amortization of intangible assets was $70.4 million for the year ended December 31, 2015 compared to $30.1 million for the year ended December 31, 2014, an increase of $40.3 million or 134.5%. The increase was primarily related to intangible assets associated with our recent acquisitions of $44.0 million. Excluding recent acquisitions, the amortization of intangible assets decreased $3.7 million associated with assets from prior acquisitions that have been fully amortized.
Investment Income and Others, Net
Investment income and others, net was a gain of $16.9 million for the year ended December 31, 2015 compared to a gain of $0.2 million for the year ended December 31, 2014, an increase of $16.7 million. The increase was primarily related to a gain of $15.6 million in connection with the exercise and payout of common stock warrants. The remaining increase was mostly attributable to a net gain on foreign currencies.
39
Gain on Derivative instruments
Gain on derivative instruments was $85.2 million for the year ended December 31, 2015 resulting from the execution of a nonrecurring foreign currency hedging strategy in connection with the acquisition of Wood Mackenzie within our Decision Analytics segment. There was no gain on derivative instruments for the year ended December 31, 2014.
Interest Expense
Interest expense was $121.4 million for the year ended December 31, 2015 compared to $70.0 million for the year ended December 31, 2014, an increase of $51.4 million or 73.3%. The increase is primarily due to the interest on the additional debt incurred in connection with the acquisition of Wood Mackenzie as well as the bridge financing arrangement.
Provision for Income Taxes
The provision for income taxes was $196.6 million for the year ended December 31, 2015 compared to $208.5 million for the year ended December 31, 2014, a decrease of $11.9 million or 5.7%. The effective tax rate was 28.7% for the year ended December 31, 2015 compared to 37.1% for the year ended December 31, 2014.
Net Income
The net income margin for our consolidated results, including discontinued operations, was 24.5% for the year ended December 31, 2015 compared to 22.8% for the year ended December 31, 2014. The non-recurring derivative gain offset by the transaction costs related to the Wood Mackenzie acquisition and the warrant exercise and payout positively impacted our net income margin by 3.2%, which was offset by the impact from the discontinued operations of 3.2% for year ended December 31, 2015. The discontinued operations, including the gain on the sale of our mortgage services business decreased our margin by 1.9% for the year ended December 31, 2014.
EBITDA
The EBITDA margin for our consolidated results, including discontinued operations, was 51.0% for the year ended December 31, 2015 compared to 48.8% for the year ended December 31, 2014. The non-recurring derivative gain, offset by the transaction costs related to the Wood Mackenzie acquisition and the warrant exercise and payout, positively impacted our EBITDA margin by 3.6%, which was offset by the impact from the discontinued operations of 4.2% for year ended December 31, 2015. The discontinued operations, including the gain on the sale of our mortgage services business, decreased our margin by 2.1% for the year ended December 31, 2014.
Results of Continuing Operations by Segment
Decision Analytics
Revenues
Revenues for our Decision Analytics segment were $1,072.5 million for the year ended December 31, 2015 compared to $780.5 million for the year ended December 31, 2014, an increase of $292.0 million or 37.4%. Our recent acquisitions accounted for an increase of $219.6 million in revenues for the year ended December 31, 2015. Excluding recent acquisitions, our Decision Analytics revenue increased $72.4 million or 9.3%.
Our revenue by category for the periods presented is set forth below for the years ended December 31:
2015 | 2014 | Percentage Change | ||||||||
(In millions) | ||||||||||
Insurance | $ | 647.2 | $ | 598.8 | 8.1 | % | ||||
Energy and specialized markets | 308.8 | 84.9 | 263.6 | % | ||||||
Financial services | 116.5 | 96.8 | 20.5 | % | ||||||
Total Decision Analytics | $ | 1,072.5 | $ | 780.5 | 37.4 | % | ||||
Our insurance revenue increased $48.4 million or 8.1% primarily due to an increase within our loss quantification solutions, insurance anti-fraud claims revenue, underwriting solutions, and catastrophe modeling services.
40
Our energy and specialized markets revenue increased $223.9 million or 263.6%, primarily due to the recent acquisitions. Excluding the recent acquisitions' revenue of $219.6 million, our specialized markets revenue increased $4.3 million or 5.1%, primarily due to growth in our environmental health and safety services and weather risk solutions, and was partially offset by lower activity related to government contracts.
Our financial services revenue increased $19.7 million or 20.5%, primarily due to a media effectiveness project revenue that occurred in the first quarter and the continued demand for our analytic solutions and services.
Cost of Revenues
Cost of revenues for our Decision Analytics segment was $412.0 million for the year ended December 31, 2015 compared to $307.8 million for the year ended December 31, 2014, an increase of $104.2 million or 33.8%. Our recent acquisitions within the Decision Analytics segment, accounted for an increase of $82.4 million in cost of revenues of which $6.0 million were non-recurring equity compensation associated with the Wood Mackenzie acquisition and the remaining amount was primarily related to salaries and employee benefits. Excluding the impact of our recent acquisitions, our cost of revenues increased by $21.8 million or 7.1%. This increase is primarily due to increases in salary and employee benefits of $14.7 million, rent expense of $2.4 million, data costs and data processing fees of $1.4 million, travel expense of $1.1 million, and other operating costs of $2.3 million. These increases were offset by a decrease in information technology expense of $0.1 million.
Selling, General and Administrative Expenses
Selling, general and administrative expenses for our Decision Analytics segment were $196.5 million for the year ended December 31, 2015 compared to $113.5 million for the year ended December 31, 2014, an increase of $83.0 million or 73.3%. Our recent acquisitions within the Decision Analytics segment accounted for an increase of $83.7 million in SGA of which $20.7 million were non-recurring transaction costs associated with the Wood Mackenzie acquisition and the remaining amount was primarily related to salaries and employee benefits. Excluding costs associated with our recent acquisitions, SGA decreased $0.7 million or 0.5%. The decrease was primarily due to a decrease in professional fees of $3.2 million. This decrease was offset by increases in salary and employee benefits of $1.1 million, information technology expense of $0.6 million, travel expense of $0.4 million, rent expense of $0.2 million, and other general expenses of $0.2 million.
EBITDA
The EBITDA margin for our Decision Analytics segment including our discontinued operations, was 46.9% for the year ended December 31, 2015 and 44.2% for the year ended December 31, 2014. The non-recurring derivative gain, net of transaction costs related to the Wood Mackenzie acquisition and the warrant exercise and payout, positively impacted our EBITDA margin by 5.4%, which was offset by the impact from the discontinued operations of 5.9% for year ended December 31, 2015. The discontinued operations, including the gain on sale of the mortgage services business, decreased our margin by 1.8% for the year ended December 31, 2014.
Risk Assessment
Revenues
Revenues for our Risk Assessment segment were $688.2 million for the year ended December 31, 2015 compared to $650.6 million for the year ended December 31, 2014 , an increase of $37.6 million or 5.8% . The overall increase within this segment primarily resulted from an increase in prices derived from continued enhancements to the content of our industry-standard insurance programs’ solutions as well as selling expanded solutions to existing customers.
Our revenue by category for the periods presented is set forth below for the years ended December 31:
2015 | 2014 | Percentage Change | ||||||||
(In millions) | ||||||||||
Industry-standard insurance programs | $ | 524.6 | $ | 495.0 | 6.0 | % | ||||
Property-specific rating and underwriting information | 163.6 | 155.6 | 5.1 | % | ||||||
Total Risk Assessment | $ | 688.2 | $ | 650.6 | 5.8 | % | ||||
41
Cost of Revenues
Cost of revenues for our Risk Assessment segment was $200.0 million for the year ended December 31, 2015 compared to $208.2 million for the year ended December 31, 2014, a decrease of $8.2 million or 4.0% . The decrease was primarily due to a decrease in salaries and employee benefits costs of $8.8 million related to a slight reduction in headcount that occurred in the fourth quarter of 2014. Other decreases were related to information technology expenses of $0.3 million, rent expense of $0.2 million, and other operating costs of $0.8 million. These decreases were offset by increases in data costs and data processing fees of $1.0 million and travel expenses of $0.9 million.
Selling, General and Administrative Expenses
Selling, general and administrative expenses for our Risk Assessment segment were $81.8 million for the year ended December 31, 2015 compared to $73.8 million for the year ended December 31, 2014 , an increase of $8.0 million or 10.8% . The increase was primarily due to increases in salaries and employee benefits of $6.6 million, rent expense of $0.9 million, information technology expense of $0.5 million, travel expense of $0.3 million and other general expenses of $0.1 million. These increases were offset by a decrease in professional consulting fees of $0.4 million.
EBITDA
The EBITDA margin for our Risk Assessment segment was 59.1% for the year ended December 31, 2015 compared to 56.7% for the year ended December 31, 2014. The increase in margin is primarily attributed to operating leverage in the segment as well as cost efficiencies.
Quarterly Results of Operations
The following table sets forth our quarterly unaudited consolidated statement of operations data for each of the eight quarters in the period ended December 31, 2016. In management’s opinion, the quarterly data has been prepared on the same basis as the audited consolidated financial statements included in this annual report on Form 10-K, and reflects all necessary adjustments for a fair presentation of this data. The results of historical periods are not necessarily indicative of the results of operations for a full year or any future period.
For the Quarters Ended | |||||||||||||||
March 31, | June 30, | September 30, | December 31, | Full Year | |||||||||||
2016 | 2016 | ||||||||||||||
(in millions, except for per share data) | |||||||||||||||
Statement of operations data: | |||||||||||||||
Revenues | $ | 492.7 | $ | 498.3 | $ | 498.1 | $ | 506.1 | $ | 1,995.2 | |||||
Operating income | $ | 192.6 | $ | 191.1 | $ | 198.4 | $ | 185.5 | $ | 767.6 | |||||
Income from continuing operations | $ | 109.7 | $ | 106.7 | $ | 127.6 | $ | 107.5 | $ | 451.5 | |||||
Income from discontinued operations | $ | (17.1 | ) | $ | 155.0 | $ | — | $ | 1.8 | $ | 139.7 | ||||
Net income | $ | 92.6 | $ | 261.7 | $ | 127.6 | $ | 109.3 | $ | 591.2 | |||||
Basic net income per share: | $ | 0.55 | $ | 1.56 | $ | 0.76 | $ | 0.65 | $ | 3.51 | |||||
Diluted net income per share: | $ | 0.54 | $ | 1.53 | $ | 0.74 | $ | 0.64 | $ | 3.46 | |||||
For the Quarters Ended | |||||||||||||||
March 31, | June 30, | September 30, | December 31, | Full Year | |||||||||||
2015 | 2015 | ||||||||||||||
(in millions, except for per share data) | |||||||||||||||
Statement of operations data: | |||||||||||||||
Revenues | $ | 384.3 | $ | 428.6 | $ | 470.4 | $ | 477.4 | $ | 1,760.7 | |||||
Operating income | $ | 174.0 | $ | 146.0 | $ | 197.2 | $ | 186.2 | $ | 703.4 | |||||
Income from continuing operations | $ | 96.4 | $ | 158.9 | $ | 124.2 | $ | 108.0 | $ | 487.5 | |||||
Income from discontinued operations | $ | 2.3 | $ | 4.4 | $ | 7.6 | $ | 5.8 | $ | 20.1 | |||||
Net income | $ | 98.7 | $ | 163.3 | $ | 131.8 | $ | 113.8 | $ | 507.6 | |||||
Basic net income per share: | $ | 0.62 | $ | 0.99 | $ | 0.78 | $ | 0.67 | $ | 3.07 | |||||
Diluted net income per share: | $ | 0.61 | $ | 0.97 | $ | 0.77 | $ | 0.66 | $ | 3.01 | |||||
42
Liquidity and Capital Resources
As of December 31, 2016 and 2015, we had cash and cash equivalents and available-for-sale securities of $138.5 million and $141.9 million, respectively. Subscriptions for our solutions are billed and generally paid in advance of rendering services either quarterly or in full upon commencement of the subscription period, which is usually for one year. Subscriptions are automatically renewed at the beginning of each calendar year. We have historically generated significant cash flows from operations. As a result of this factor, as well as the availability of funds under our syndicated revolving credit facility, we believe we will have sufficient cash to meet our working capital and capital expenditure needs, and to fuel our future growth plans.
We have historically managed the business with a working capital deficit due to the fact that, as described above, we offer our solutions and services primarily through annual subscriptions or long-term contracts, which are generally prepaid quarterly or annually in advance of the services being rendered. When cash is received for prepayment of invoices, we record an asset (cash and cash equivalents) on our balance sheet with the offset recorded as a current liability (deferred revenues). This current liability is deferred revenue that does not require a direct cash outflow since our customers have prepaid and are obligated to purchase the services. In most businesses, growth in revenue typically leads to an increase in the accounts receivable balance causing a use of cash as a company grows. Unlike these businesses, our cash position is favorably affected by revenue growth, which results in a source of cash due to our customers prepaying for most of our services.
Our consolidated capital expenditures as a percentage of consolidated revenues for the years ended December 31, 2016 and 2015, were 7.4% and 8.0%, respectively. We estimate our capital expenditures for 2017 will be approximately $160.0 million, which primarily consists of expenditures on our technology infrastructure and our continuing investments in developing and enhancing our solutions. Expenditures related to developing and enhancing our solutions are predominately related to internal-use software and are capitalized in accordance with ASC 350-40, “Accounting for Costs of Computer Software Developed or Obtained for Internal Use.” We also capitalize amounts in accordance with ASC 985-20, “Software to be Sold, Leased or Otherwise Marketed.”
We have also historically used a portion of our cash for repurchases of our common stock from our stockholders. For the years ended December 31, 2016, 2015 and 2014, we repurchased $326.8 million, $20.4 million and $778.5 million, respectively, of our common stock.
Financing and Financing Capacity
We had total debt, excluding capital lease obligations, the discounts and debt issuance costs on our senior notes and our committed senior unsecured Syndicated Revolving Credit Facility, or the Credit Facility, of $2,400.0 million and $3,170.0 million at December 31, 2016 and 2015, respectively. The debt at December 31, 2016 primarily consists of senior notes issued in 2015, 2012 and 2011 and borrowings outstanding under the Credit Facility described below. Interest on the senior notes is payable semi-annually each year. The discount and debt issuance costs were recorded as "Long-term debt" in the accompanying consolidated balance sheets, and will be amortized to "Interest expense" in the accompanying consolidated statements of operations within this Form 10-K over the life of the respective senior note. The indenture governing the senior notes restricts our ability to, among other things, create certain liens, enter into sale/leaseback transactions and consolidate with, sell, lease, convey, or otherwise transfer all or substantially all of our assets, or merge with or into, any other person or entity. As of December 31, 2016, we had senior notes with an aggregate principal amount of $2,300.0 million outstanding, and we were in compliance with our debt covenants.
We have a credit facility with Bank of America N.A., JP Morgan Chase, N.A., Sun Trust Bank, Wells Fargo Bank, N.A., Citizens Bank, N.A., Morgan Stanley, N.A., HSBC Bank USA, N.A., Royal Bank of Canada, BNP Paribas, TD Bank, N.A., The Northern Trust Company, and Capital One N.A. On May 26, 2016, we entered into the Second Amendment to the Credit Facility, which reduced the borrowing capacity from $1,750.00 million to $1,500.0 million and amended the pricing grid.
43
The Credit Facility may be used for general corporate purposes, including working capital needs and capital expenditures, acquisitions and the share repurchase program, or the Repurchase Program. The Credit Facility contains certain financial and other covenants that, among other things, impose certain restrictions on indebtedness, liens, investments, and capital expenditures. These covenants also place restrictions on mergers, asset sales, sale/leaseback transactions, payments between us and our subsidiaries, and certain transactions with affiliates. The financial covenants require that, at the end of any fiscal quarter, we have a consolidated interest coverage ratio of at least 3.0 to 1.0 and that we maintain, during any period of four fiscal quarters, a consolidated funded debt leverage ratio of 3.5 to 1.0. We were in compliance with all covenants under the Credit Facility as of December 31, 2016. Interest on borrowings under the Credit Facility is payable at an interest rate of LIBOR plus 1.125% to 1.625%, depending upon the consolidated funded debt leverage ratio. During the year ended December 31, 2016, we had borrowings of $140.0 million and repayments of $910.0 million under the credit facility. As of December 31, 2016 and 2015, we had outstanding borrowings under the Credit Facility of $100.0 million and $870.0 million, respectively. In January and February 2017, we repaid a total of $70.0 million of the $100.0 million outstanding borrowings at December 31, 2016 under the Credit Facility.
On March 10, 2015, in connection with our agreement to acquire Wood Mackenzie, we entered into a commitment letter for a $2,300.0 million 364-day bridge financing arrangement with Bank of America N.A. and Morgan Stanley Bank N.A. acting as joint lead arrangers. This financing arrangement was only to be utilized in the event we did not complete the debt and equity offerings relating to its acquisition of Wood Mackenzie by a certain date, and was terminated upon the closing of the acquisition. See Note 9 to our consolidated financial statements included in this annual report on Form 10-K. We paid fees associated with this financing arrangement of $9.1 million. Due to the completion of the debt and equity offerings, this arrangement was terminated and the full $9.1 million of fees were recorded to "Interest expense" for the year ended December 31, 2015.
Cash Flow
The following table summarizes our cash flow data for the years ended December 31:
2016 | 2015 | 2014 | |||||||||
(In millions) | |||||||||||
Net cash provided by operating activities | $ | 546.1 | $ | 623.7 | $ | 489.4 | |||||
Net cash provided by (used in) investing activities | $ | 493.2 | $ | (3,006.3 | ) | $ | (35.5 | ) | |||
Net cash (used in) provided by financing activities | $ | (1,032.8 | ) | $ | 2,481.0 | $ | (579.1 | ) | |||
Operating Activities
Net cash provided by operating activities decreased to $546.1 million for the year ended December 31, 2016 compared to $623.7 million for the year ended December 31, 2015. The decrease of $77.6 million in net cash provided by operating activities was primarily due to the additional income tax payments of $99.9 million related to the gain on the sale of our healthcare business and a one time cash funding of our ESOP plan of $18.8 million, partially offset by an increase in cash receipts from customers driven by an increase in revenues and operating profit as well as additional operating cash flow from the acquisition of Wood Mackenzie in May 2015.
Net cash provided by operating activities increased to $623.7 million for the year ended December 31, 2015 compared to $489.4 million for the year ended December 31, 2014. The increase in net cash provided by operating activities was primarily due to an increase in cash receipts from customers driven by an increase in revenues and operating profit and additional operating cash flow from Wood Mackenzie, partially offset by acquisition fees related to the acquisition of Wood Mackenzie and interest payments on our senior notes that were issued in May 2015.
Investing Activities
Net cash provided by investing activities of $493.2 million for the year ended December 31, 2016 was primarily related to proceeds from the sale our healthcare business of $714.6 million, partially offset by capital expenditures of $156.5 million and acquisitions including escrow payments of $74.1 million.
Net cash used in investing activities of $3,006.3 million for the year ended December 31, 2015 was primarily due to acquisitions including escrow payments of $2,856.4 million, which includes the acquisition of Wood Mackenzie, net of a gain on derivative instruments and capital expenditures of $166.1 million.
44
Net cash used in investing activities of $35.5 million for the year ended December 31, 2014 was primarily related to capital expenditures of $146.8 million and acquisitions of $35.2 million, partially offset by proceeds from the sale our mortgage business of $151.2 million.
Financing Activities
Net cash used in financing activities of $1,032.8 million for the year ended December 31, 2016 was primarily related to a $770.0 million repayments of borrowings under our Credit Facilities and share repurchases of $326.8 million, partially offset by proceeds from stock option exercises and other option-related items of $69.4 million.
Net cash provided by financing activities of $2,481.0 million for the year ended December 31, 2015 was primarily related to the net proceeds from the debt and equity offerings of $1,244.0 million and $720.8 million, respectively, and other borrowings from our old and new credit facilities of 830.0 million and proceeds from stock option exercises and other option-related items of $76.5 million, partially offset by repayments of short-term and long-term debt of $340.0 million, and repurchases of common stock $20.4 million.
Net cash used in financing activities of $579.1 million for the year ended December 31, 2014 was primarily related to the repurchase of common stock of $778.5 million, partially offset by proceeds from stock option exercises and other stock option related items of $45.6 million and borrowing from our old credit facility of $160.0 million.
Contractual Obligations
The following table summarizes our contractual obligations at December 31, 2016 and the future periods in which such obligations are expected to be settled in cash:
Payments Due by Period | |||||||||||||||||||
Total | Less than 1 year | 2-3 years | 4-5 years | More than 5 years | |||||||||||||||
(In millions) | |||||||||||||||||||
Contractual obligations | |||||||||||||||||||
Long-term debt, current portion of long-term debt and interest | $ | 3,425.4 | $ | 108.0 | $ | 466.0 | $ | 642.1 | $ | 2,209.3 | |||||||||
Operating leases | 359.8 | 40.5 | 65.4 | 64.4 | 189.5 | ||||||||||||||
Pension and postretirement plans (1) | 35.8 | 2.7 | 5.1 | 4.4 | 23.6 | ||||||||||||||
Capital lease obligations | 14.5 | 7.1 | 7.2 | 0.2 | — | ||||||||||||||
Other long-term liabilities (2) | 1.7 | 0.5 | 0.6 | 0.1 | 0.5 | ||||||||||||||
Total (3) | $ | 3,837.2 | $ | 158.8 | $ | 544.3 | $ | 711.2 | $ | 2,422.9 | |||||||||
(1) | Our funding policy is to contribute at least equal to the minimum legal funding requirement. |
(2) | Other long-term liabilities consist of our employee-related deferred compensation plan. We also have a deferred compensation plan for our Board of Directors; however, based on past performance and the uncertainty of the dollar amounts to be paid, if any, we have excluded such amounts from the above table. |
(3) | Unrecognized tax benefits of approximately $16.8 million have been recorded as liabilities in accordance with ASC 740, which have been omitted from the table above, and we are uncertain as to if or when such amounts may be settled, with the exception of those amounts subject to a statute of limitation. Related to the unrecognized tax benefits, we also have recorded a liability for potential penalties and interest of $3.4 million. |
Off-Balance Sheet Arrangements
We have no off-balance sheet arrangements.
Critical Accounting Policies and Estimates
Our management’s discussion and analysis of financial condition and results of operations are based on our consolidated financial statements, which have been prepared in accordance with accounting principles generally accepted in the United States. The preparation of these financial statements require management to make estimates and judgments that affect reported amounts of assets and liabilities and related disclosures of contingent assets and liabilities at the dates of the financial statements and revenue and expenses during the reporting periods. These estimates are based on historical experience and on
45
other assumptions that are believed to be reasonable under the circumstances. On an ongoing basis, management evaluates its estimates, including those related to revenue recognition, goodwill and intangible assets, pension and other post retirement benefits, stock based compensation, and income taxes. Actual results may differ from these assumptions or conditions.
Revenue Recognition
The Company’s revenues are primarily derived from sales of services and revenue is recognized as services are performed and information is delivered to our customers. Revenue is recognized when persuasive evidence of an arrangement exists, delivery has occurred or services have been rendered, fees and/or price are fixed or determinable, and collectability is reasonably assured. Revenues for subscription services are recognized ratably over the subscription term, usually one year. Revenues from transaction-based fees are recognized as information is delivered to customers, assuming all other revenue recognition criteria are met.
The Company also has term-based software licenses where the only remaining undelivered element is post-contract customer support, or PCS, including unspecified upgrade rights on a when-and-if available basis. The Company recognizes revenue for these licenses ratably over the duration of the license term. The PCS associated with these arrangements is coterminous with the duration of the license term. The Company also provides hosting or software solutions that provide continuous access to information and include PCS and recognizes revenue ratably over the duration of the license term. In addition, the determination of certain of our services revenues requires the use of estimates, principally related to transaction volumes in instances where these volumes are reported to us by our customers on a monthly basis in arrears. In these instances, we estimate transaction volumes based on average actual volumes reported by our customers in the past. Differences between our estimates and actual final volumes reported are recorded in the period in which actual volumes are reported. We have not experienced significant variances between our estimates of these services revenues reported to us by our customers and actual reported volumes in the past.
We invoice our customers in annual, quarterly, or monthly installments. Amounts billed and collected in advance are recorded as deferred revenues on the balance sheet and are recognized as the services are performed and revenue recognition criteria are met.
Stock-Based Compensation
The fair value of equity awards is measured on the date of grant using a Black-Scholes option-pricing model, which requires the use of several estimates, including expected term, expected risk-free interest rate, expected volatility, and expected dividend yield.
Stock-based compensation cost is measured at the grant date, based on the fair value of the awards granted, and is recognized as expense over the requisite service period. Option grants and restricted stock awards are generally expensed ratably over the four-year vesting period. We follow the substantive vesting period approach for awards granted after January 1, 2005, which requires that stock-based compensation expense be recognized over the period from the date of grant to the date when the award is no longer contingent on the employee providing additional service.
We estimate expected forfeitures of equity awards at the date of grant and recognize compensation expense only for those awards expected to vest. The forfeiture assumption is ultimately adjusted to the actual forfeiture rate.
Goodwill and Intangibles
Goodwill represents the excess of acquisition costs over the fair value of tangible net assets and identifiable intangible assets of the businesses acquired. Goodwill and intangible assets deemed to have indefinite lives are not amortized. Intangible assets determined to have definite lives are amortized over their useful lives. Goodwill and intangible assets with indefinite lives are subject to impairment testing annually as of June 30, or whenever events or changes in circumstances indicate that the carrying amount may not be fully recoverable, using the guidance and criteria described in the accounting standard for Goodwill and Other Intangible Assets. This testing compares carrying values to fair values and, when appropriate, the carrying value of these assets is reduced to fair value.
As of December 31, 2016, we had goodwill and net intangible assets of $3,588.9 million, which represents 77.5% of our total assets. During 2016, we performed an impairment test as of June 30, 2016 and confirmed that no impairment charge was necessary. There are many assumptions and estimates used that directly impact the results of impairment testing, including an estimate of future expected revenues, earnings and cash flows, useful lives and discount rates applied to such expected cash flows in order to estimate fair value. We have the ability to influence the outcome and ultimate results based on the assumptions and estimates we choose for determining the fair value of our reporting units. To mitigate undue influence, we set criteria and benchmarks that are reviewed and approved by various levels of management and reviewed by other independent parties. The
46
determination of whether or not goodwill or indefinite-lived acquired intangible assets have become impaired involves a significant level of judgment in the assumptions and estimates underlying the approach used to determine the value of our reporting units. Changes in our strategy or market conditions could significantly impact these judgments and require an impairment to be recorded to intangible assets and goodwill. There have been no goodwill impairment indicators subsequent to the impairment test performed as of June 30, 2016. For the year ended December 31, 2016, there were no impairment indicators related to our intangible assets.
Pension and Postretirement
We account for our pension and postretirement benefit plans in accordance with the accounting standard for Employers’ Accounting for Defined Benefit Pension and Other Postretirement Plans. This standard requires that employers recognize on a prospective basis the funded status of their defined benefit pension and other postretirement benefit plans on their consolidated balance sheets and recognize as a component of other comprehensive loss, net of tax, the gains or losses and prior service costs or credits that arise during the period but are not recognized as components of net periodic benefit (credit) cost.
Certain assumptions are used in the determination of our annual net period benefit (credit) cost and the disclosure of the funded status of these plans. The principal assumptions concern the discount rate used to measure the projected benefit obligation and the expected return on plan assets. We revise these assumptions based on an annual evaluation of long-term trends and market conditions that may have an impact on the cost of providing retirement benefits.
In determining the discount rate, we utilize quoted rates from long-term bond indices, and changes in long-term bond rates over the past year, cash flow models and other data sources we consider reasonable based upon the life expectancy and mortality rate of eligible employees. As part of our evaluation, we calculate the approximate average yields on securities that were selected to match our separate projected cash flows for both the pension and postretirement plans. Our separate benefit plan cash flows are input into actuarial models that include data for corporate bonds rated AA or better at the measurement date. The output from the actuarial models are assessed against the prior year’s discount rate and quoted rates for long-term bond indices. For our pension plans at December 31, 2016, we determined this rate to be 3.99%, a decrease of 0.74% from the 4.73% rate used at December 31, 2015. Our postretirement rate is 3.25% at December 31, 2016 and 2015.
The expected return on plan assets is determined by taking into consideration our analysis of our actual historical investment returns to a broader long-term forecast adjusted based on our target investment allocation, and the current economic environment. Our pension asset investment guidelines target an investment portfolio allocation of 40.00% debt securities and 60.00% equity securities. As of December 31, 2016, the pension plan assets were allocated 37.80% debt, 61.60% equity securities and 0.60% other. The VEBA Plan target allocation is 100% debt. We have used our target investment allocation to derive the expected return as we believe this allocation will be retained on an ongoing basis that will be commensurate with the projected cash flows of the plan. The expected return for each investment category within our target investment allocation is developed using average historical rates of return for each targeted investment category, considering the projected cash flow of the qualified pension plan and postretirement plan. The difference between this expected return and the actual return on plan assets is generally deferred and recognized over subsequent periods through future net periodic benefit (credits) costs. We believe these considerations provide the basis for reasonable assumptions with respect to the expected long-term rate of return on plan assets.
The measurement date used to determine the benefit obligation and plan assets is December 31. The future benefit payments for the postretirement plan are net of the federal medical subsidy. As a result of the Patient Protection and Affordable Care Act and the Health Care and Education Reconciliation Act of 2010, the tax treatment of federal subsidies paid to sponsors of retiree health benefit plans that provide prescription drug benefits that are at least actuarially equivalent to the corresponding benefits provided under Medicare Part D was effectively changed. This legislative change reduces future tax benefits of the coverage we provided to participants in the postretirement plan. We are required to account for this change in the period during which the law is enacted.
47
A one percent change in discount rate and future rate of return on plan assets would have the following effects:
Pension | Postretirement | ||||||||||||||||||||||||||||||
1% Decrease | 1% Increase | 1% Decrease | 1% Increase | ||||||||||||||||||||||||||||
Benefit (Credit) Cost | Projected Benefit Obligation | Benefit Cost (Credit) | Projected Benefit Obligation | Benefit Cost | Projected Benefit Obligation | Benefit (Credit) | Projected Benefit Obligation | ||||||||||||||||||||||||
(In millions) | |||||||||||||||||||||||||||||||
Discount Rate | $ | (0.5 | ) | $ | 48.1 | $ | 0.2 | $ | (40.3 | ) | $ | — | $ | 0.9 | $ | — | $ | (0.8 | ) | ||||||||||||
Expected Rate of Return on Assets | $ | 4.2 | $ | — | $ | (4.2 | ) | $ | — | $ | 0.1 | $ | — | $ | (0.1 | ) | $ | — | |||||||||||||
Income Taxes
In projecting future taxable income, we develop assumptions including the amount of future state, federal and foreign pretax operating income, the reversal of temporary differences, and the implementation of feasible and prudent tax planning strategies. These assumptions require significant judgment about the forecasts of future taxable income and are consistent with the plans and estimates we use to manage the underlying businesses. The calculation of our tax liabilities also involves dealing with uncertainties in the application and evolution of complex tax laws and regulations in other jurisdictions.
We account for uncertain tax positions in accordance with Accounting for Uncertainty in Income Taxes — an interpretation of ASC 740, which addresses the determination of whether tax benefits claimed or expected to be claimed on a tax return should be recorded in the financial statements. Under this interpretation, we may recognize the tax benefit from an uncertain tax position only if it is more likely than not that the tax position will be sustained upon examination by the taxing authorities, based on the technical merits of the position.
We recognize and adjust our liabilities when our judgment changes as a result of the evaluation of new information not previously available. Due to the complexity of some of these uncertainties, the ultimate resolution may result in a payment that is materially different from our current estimate of the tax liabilities. These differences will be reflected as increases or decreases to income tax expense in the period in which they are determined.
We estimate unrecognized tax positions of $0.8 million that may be recognized by December 31, 2017, due to expiration of statutes of limitations and resolution of audits with taxing authorities, net of additional uncertain tax positions.
As of December 31, 2016, we have gross federal, state, and foreign income tax net operating loss carryforwards of $142.5 million, which will expire at various dates from 2017 through 2036. Such net operating loss carryforwards expire as follows:
(In millions) | |||
2017 - 2024 | $ | 1.1 | |
2025 - 2029 | 0.8 | ||
2030 - 2036 | 140.6 | ||
$ | 142.5 | ||
The net deferred income tax liability of $306.6 million consists primarily of timing differences involving depreciation and amortization.
Recent Accounting Pronouncements
For a discussion of recent accounting pronouncements, refer to Note 2(s) to the audited consolidated financial statements included elsewhere in this annual report on Form 10-K.
48
Item 7A. | Quantitative and Qualitative Disclosures about Market Risk |
Interest Rate Risk
We are exposed to market risk from fluctuations in interest rates. At December 31, 2016, we had borrowings outstanding under our credit facility of $100.0 million, which bear interest at variable rates based on LIBOR plus 1.125% to 1.625%, depending on certain ratios defined in the credit agreement. A change in interest rates on variable rate debt impacts our pre-tax income and cash flows, but does not impact the fair value of the instruments. Based on our overall interest rate exposure at December 31, 2016, a one percent change in interest rate would result in a change in annual pre-tax interest expense of approximately $1.0 million based on our current borrowing levels.
Foreign Currency Risk
Our foreign-based businesses and results of operations are exposed to movements in the U.S. dollar to British pounds and other foreign currency exchange rates. A portion of our revenue is denominated in British pounds and other foreign currencies. If the U.S. dollar strengthens against British pounds and other foreign currencies, our revenues reported in U.S. dollars would decline. With regard to operating expense, our primary exposure to foreign currency exchange risk relates to operating expense incurred in British pounds and other foreign currencies. If British pounds and other foreign currencies strengthen, costs reported in U.S. dollars will increase. Movements in the U.S. dollar to British pounds and other foreign currency exchange rates did not have a material effect on our revenue for the year ended December 31, 2016. A hypothetical ten percent change in average exchange rates versus the U.S. dollar would not have resulted in a material change to our earnings.
Item 8. | Financial Statements and Supplementary Data |
The information required by this Item is set forth on pages 54 through 102 of this annual report on Form 10-K.
Item 9. | Changes in and Disagreements with Accountants on Accounting and Financial Disclosure |
None.
Item 9A. | Controls and Procedures |
Evaluation of Disclosure Controls and Procedures
We are required to maintain disclosure controls and procedures (as that term is defined in Rules 13a-15(e) under the Securities Exchange Act of 1934, as amended (the “Exchange Act”)) that are designed to ensure that information required to be disclosed in our reports under the Exchange Act is recorded, processed, summarized, and reported within the time periods specified in the Securities and Exchange Commission’s rules and forms, and that such information is accumulated and communicated to our management, including our Chief Executive Officer and Chief Financial Officer, as appropriate, to allow timely decisions regarding required disclosures. Any controls and procedures, no matter how well designed and operated, can provide only reasonable assurance of achieving the desired control objectives at the reasonable assurance level.
Our management, with the participation of the Chief Executive Officer and Chief Financial Officer, has evaluated the effectiveness of the Company’s disclosure controls and procedures (as defined in Exchange Act Rules 13a-15(e) and 15d-15(e)) as of the end of the period covered by this annual report on Form 10-K for the Company and our subsidiaries other than Greentech Media, Inc., which was acquired on July 26, 2016, Analyze Re, Inc., which was acquired on October 20, 2016, and the GeoInformation Group Limited, which was acquired on November 11,2016. Management excluded from its assessment the internal control over financial reporting of these acquisitions and collectively represents approximately 0.2% of total assets and 0.3% of revenues as of and for the year ended December 31, 2016. Based upon the foregoing assessments, our Chief Executive Officer and Chief Financial Officer have concluded that, as of December 31, 2016, our disclosure controls and procedures were effective at the reasonable assurance level.
Management’s Report on Internal Control Over Financial Reporting
Management’s Report on Internal Control Over Financial Reporting as of December 31, 2016 is set forth in Item 8. Financial Statement and Supplementary Data.
49
Attestation Report of the Registered Public Accounting Firm
The Report of Independent Registered Public Accounting Firm on Internal Control Over Financial Reporting as of December 31, 2016 is set forth in Item 8. Financial Statement and Supplementary Data.
Changes in Internal Control Over Financial Reporting
We are in the process of integrating Greentech Media, Analyze Re and GeoInformation (which we acquired in July 2016, October 2016 and November 2016, respectively) into our overall internal control over financial reporting process. Other than this ongoing integration, there have been no changes in our internal control over financial reporting identified in connection with the evaluation of such internal control that occurred during the fourth quarter of 2016 that have materially affected, or are reasonably likely to materially affect, our internal control over financial reporting.
Item 9B. | Other Information |
None.
50
PART III
Item 10. | Directors, Executive Officers and Corporate Governance |
The information required to be furnished by this Item 10. is incorporated herein by reference to our Notice of Annual Meeting of Stockholders and Proxy Statement to be filed within 120 days of December 31, 2016 (the “Proxy Statement”).
Item 11. | Executive Compensation |
The information required to be furnished by this Item 11. is incorporated herein by reference to our Proxy Statement.
Item 12. | Security Ownership of Certain Beneficial Owners and Management and Related Stockholder Matters |
The information required to be furnished by this Item 12. is incorporated herein by reference to our Proxy Statement.
Item 13. | Certain Relationships and Related Transactions and Director Independence |
The information required to be furnished by this Item 13. is incorporated herein by reference to our Proxy Statement.
Item 14. | Principal Accounting Fees and Services |
The information required to be furnished by this Item 14. is incorporated herein by reference to our Proxy Statement.
51
PART IV
Item 15. | Exhibits and Financial Statement Schedule |
(a) The following documents are filed as part of this report.
(1) | Financial Statements. See Index to Financial Statements and Schedules in Part II, Item 8. on this Form 10-K. |
(2) | Financial Statement Schedule. See Schedule II. Valuation and Qualifying Accounts and Reserves. |
(3) | Exhibits. See Index to Exhibits in this annual report on Form 10-K. |
Item 16. | Form 10-K Summary |
None.
52
Item 8. Consolidated Financial Statements and Supplementary Data
Index to Consolidated Financial Statements and Schedule
Verisk Analytics, Inc. Consolidated Financial Statements as of December 31, 2016 and 2015 and for the Years Ended December 31, 2016, 2015 and 2014. | |
Financial Statements Schedule | |
53
MANAGEMENT’S REPORT ON INTERNAL CONTROLS OVER FINANCIAL REPORTING
Our management is responsible for establishing and maintaining adequate internal control over financial reporting as defined in Rules 13a-15(f) and 15d-15(f) under the Exchange Act. Our internal control over financial reporting is a process designed to provide reasonable assurance regarding the reliability of financial reporting and the preparation of the financial statements for external purposes in accordance with U.S. generally accepted accounting principles. Because of its inherent limitations, a system of internal control over financial reporting can provide only reasonable assurance and may not prevent or detect misstatements. Also, projections of any evaluation of effectiveness to future periods are subject to the risk that internal controls may become inadequate because of changes in conditions, or that the degree of compliance with the policies or procedures may deteriorate.
Under the supervision and with the participation of our management, including our principal executive officer and principal financial officer, we conducted an evaluation of the effectiveness of our internal control over financial reporting based on the framework set forth in Internal Control — Integrated Framework issued by the Committee of Sponsoring Organizations of the Treadway Commission in 2013.
Based on this assessment, management concluded that our internal control over financial reporting was effective at December 31, 2016.
Management excluded from its assessment the internal control over financial reporting at Greentech Media, Inc., which was acquired on July 26, 2016, Analyze Re, Inc., which was acquired on October 20, 2016, and the GeoInformation Group Limited, which was acquired on November 11, 2016. The excluded financial statements of these acquisitions constitute approximately 0.2% of total assets and 0.3% of revenues collectively included within our consolidated financial statements as of and for the year ended December 31, 2016. Due to the timing of the acquisitions, management did not assess the effectivness of internal control over financial reporting for these acquisitions.
Deloitte & Touche LLP, the independent registered public accounting firm that audited the consolidated financial statements included in this annual report on Form 10-K has also audited the effectiveness of our internal control over financial reporting as of December 31, 2016, as stated in their report which is included herein.
54
REPORT OF INDEPENDENT REGISTERED PUBLIC ACCOUNTING FIRM
To the Board of Directors and Stockholders of
Verisk Analytics, Inc.
Jersey City, New Jersey
We have audited the internal control over financial reporting of Verisk Analytics, Inc. and subsidiaries (the "Company") as of December 31, 2016, based on criteria established in Internal Control - Integrated Framework (2013) issued by the Committee of Sponsoring Organizations of the Treadway Commission. As described in Management’s Report on Internal Controls over Financial Reporting, management excluded from its assessment the internal control over financial reporting at Greentech Media, Inc., which was acquired on July 26, 2016, Analyze Re, Inc., which was acquired on October 20, 2016, and the GeoInformation Group Limited, which was acquired on November 11,2016. The financial statements of these acquisitions constitute 0.2% of total assets and 0.3% of revenues collectively of the consolidated financial statements of the Company as of and for the year ended December 31, 2016. Accordingly, our audit did not include the internal control over financial reporting at Greentech Media, Inc., Analyze Re, Inc. or the GeoInformation Group Limited. The Company’s management is responsible for maintaining effective internal control over financial reporting and for its assessment of the effectiveness of internal control over financial reporting, included in the accompanying Management’s Report on Internal Controls over Financial Reporting. Our responsibility is to express an opinion on the Company’s internal control over financial reporting based on our audit.
We conducted our audit in accordance with the standards of the Public Company Accounting Oversight Board (United States). Those standards require that we plan and perform the audit to obtain reasonable assurance about whether effective internal control over financial reporting was maintained in all material respects. Our audit included obtaining an understanding of internal control over financial reporting, assessing the risk that a material weakness exists, testing and evaluating the design and operating effectiveness of internal control based on the assessed risk, and performing such other procedures as we considered necessary in the circumstances. We believe that our audit provides a reasonable basis for our opinion.
A company’s internal control over financial reporting is a process designed by, or under the supervision of, the company’s principal executive and principal financial officers, or persons performing similar functions, and effected by the company’s board of directors, management, and other personnel to provide reasonable assurance regarding the reliability of financial reporting and the preparation of financial statements for external purposes in accordance with generally accepted accounting principles. A company’s internal control over financial reporting includes those policies and procedures that (1) pertain to the maintenance of records that, in reasonable detail, accurately and fairly reflect the transactions and dispositions of the assets of the company; (2) provide reasonable assurance that transactions are recorded as necessary to permit preparation of financial statements in accordance with generally accepted accounting principles, and that receipts and expenditures of the company are being made only in accordance with authorizations of management and directors of the company; and (3) provide reasonable assurance regarding prevention or timely detection of unauthorized acquisition, use, or disposition of the company's assets that could have a material effect on the financial statements.
Because of the inherent limitations of internal control over financial reporting, including the possibility of collusion or improper management override of controls, material misstatements due to error or fraud may not be prevented or detected on a timely basis. Also, projections of any evaluation of the effectiveness of the internal control over financial reporting to future periods are subject to the risk that the controls may become inadequate because of changes in conditions, or that the degree of compliance with the policies or procedures may deteriorate.
In our opinion, the Company maintained, in all material respects, effective internal control over financial reporting as of December 31, 2016, based on the criteria established in Internal Control - Integrated Framework (2013) issued by the Committee of Sponsoring Organizations of the Treadway Commission.
We have also audited, in accordance with the standards of the Public Company Accounting Oversight Board (United States), the consolidated financial statements and financial statement schedule as of and for the year ended December 31, 2016 of the Company and our report dated February 21, 2017 expressed an unqualified opinion on those financial statements and financial statement schedule.
/s/ Deloitte & Touche LLP
Parsippany, New Jersey
February 21, 2017
55
REPORT OF INDEPENDENT REGISTERED PUBLIC ACCOUNTING FIRM
To the Board of Directors and Stockholders of
Verisk Analytics, Inc.
Jersey City, New Jersey
We have audited the accompanying consolidated balance sheets of Verisk Analytics, Inc. and subsidiaries (the "Company") as of December 31, 2016 and 2015, and the related consolidated statements of operations, comprehensive income, changes in stockholders’ equity, and cash flows for each of the three years in the period ended December 31, 2016. Our audits also included the financial statement schedule listed in the Index at Item 15. These financial statements and financial statement schedule are the responsibility of the Company's management. Our responsibility is to express an opinion on the financial statements and financial statement schedule based on our audits.
We conducted our audits in accordance with the standards of the Public Company Accounting Oversight Board (United States). Those standards require that we plan and perform the audit to obtain reasonable assurance about whether the financial statements are free of material misstatement. An audit includes examining, on a test basis, evidence supporting the amounts and disclosures in the financial statements. An audit also includes assessing the accounting principles used and significant estimates made by management, as well as evaluating the overall financial statement presentation. We believe that our audits provide a reasonable basis for our opinion.
In our opinion, such consolidated financial statements present fairly, in all material respects, the financial position of Verisk Analytics, Inc. and subsidiaries as of December 31, 2016 and 2015, and the results of their operations and their cash flows for each of the three years in the period ended December 31, 2016, in conformity with accounting principles generally accepted in the United States of America. Also, in our opinion, such financial statement schedule, when considered in relation to the basic consolidated financial statements taken as a whole, presents fairly, in all material respects, the information set forth therein.
We have also audited, in accordance with the standards of the Public Company Accounting Oversight Board (United States), the Company’s internal control over financial reporting as of December 31, 2016, based on the criteria established in Internal Control ---- Integrated Framework (2013) issued by the Committee of Sponsoring Organizations of the Treadway Commission and our report dated February 21, 2017 expressed an unqualified opinion on the Company’s internal control over financial reporting.
/s/ Deloitte & Touche LLP
Parsippany, New Jersey
February 21, 2017
56
VERISK ANALYTICS, INC
CONSOLIDATED BALANCE SHEETS
As of December 31, 2016 and 2015
2016 | 2015 | ||||||
(In millions, except for share and per share data) | |||||||
ASSETS | |||||||
Current assets: | |||||||
Cash and cash equivalents | $ | 135.1 | $ | 138.3 | |||
Available-for-sale securities | 3.4 | 3.6 | |||||
Accounts receivable, net | 263.9 | 251.0 | |||||
Prepaid expenses | 28.9 | 34.1 | |||||
Income taxes receivable | 49.3 | 48.6 | |||||
Other current assets | 20.3 | 52.9 | |||||
Current assets held-for-sale | — | 76.1 | |||||
Total current assets | 500.9 | 604.6 | |||||
Noncurrent assets: | |||||||
Fixed assets, net | 380.3 | 350.3 | |||||
Intangible assets, net | 1,010.8 | 1,245.1 | |||||
Goodwill | 2,578.1 | 2,753.0 | |||||
Pension assets | 19.6 | 32.9 | |||||
Deferred income tax assets | 15.6 | — | |||||
Other assets | 125.9 | 25.9 | |||||
Noncurrent assets held-for-sale | — | 581.9 | |||||
Total assets | $ | 4,631.2 | $ | 5,593.7 | |||
LIABILITIES AND STOCKHOLDERS’ EQUITY | |||||||
Current liabilities: | |||||||
Accounts payable and accrued liabilities | $ | 183.1 | $ | 222.1 | |||
Short-term debt and current portion of long-term debt | 106.8 | 874.8 | |||||
Pension and postretirement benefits, current | 0.9 | 1.8 | |||||
Deferred revenues | 330.8 | 340.9 | |||||
Current liabilities held-for-sale | — | 39.7 | |||||
Total current liabilities | 621.6 | 1,479.3 | |||||
Noncurrent liabilities: | |||||||
Long-term debt | 2,280.2 | 2,270.9 | |||||
Pension benefits | 12.6 | 12.9 | |||||
Postretirement benefits | 1.7 | 2.0 | |||||
Deferred income tax liabilities | 322.2 | 329.2 | |||||
Other liabilities | 60.5 | 58.4 | |||||
Noncurrent liabilities held-for-sale | — | 69.0 | |||||
Total liabilities | 3,298.8 | 4,221.7 | |||||
Commitments and contingencies | |||||||
Stockholders’ equity: | |||||||
Verisk common stock, $.001 par value; 2,000,000,000 shares authorized; 544,003,038 shares issued and 166,915,772 and 169,424,981 shares outstanding, respectively | 0.1 | 0.1 | |||||
Additional paid-in capital | 2,121.6 | 2,023.4 | |||||
Treasury stock, at cost, 377,087,266 and 374,578,057 shares, respectively | (2,891.4 | ) | (2,571.2 | ) | |||
Retained earnings | 2,752.9 | 2,161.7 | |||||
Accumulated other comprehensive losses | (650.8 | ) | (242.0 | ) | |||
Total stockholders’ equity | 1,332.4 | 1,372.0 | |||||
Total liabilities and stockholders’ equity | $ | 4,631.2 | $ | 5,593.7 | |||
The accompanying notes are an integral part of these consolidated financial statements.
57
VERISK ANALYTICS, INC.
CONSOLIDATED STATEMENTS OF OPERATIONS
For The Years Ended December 31, 2016, 2015 and 2014
2016 | 2015 | 2014 | |||||||||
(In millions, except for share and per share data) | |||||||||||
Revenues | $ | 1,995.2 | $ | 1,760.7 | $ | 1,431.1 | |||||
Expenses: | |||||||||||
Cost of revenues (exclusive of items shown separately below) | 714.4 | 612.0 | 516.0 | ||||||||
Selling, general and administrative | 301.6 | 278.3 | 187.3 | ||||||||
Depreciation and amortization of fixed assets | 119.1 | 96.6 | 65.4 | ||||||||
Amortization of intangible assets | 92.5 | 70.4 | 30.1 | ||||||||
Total expenses | 1,227.6 | 1,057.3 | 798.8 | ||||||||
Operating income | 767.6 | 703.4 | 632.3 | ||||||||
Other income (expense): | |||||||||||
Investment income and others, net | 6.1 | 16.9 | 0.2 | ||||||||
Gain on derivative instruments | — | 85.2 | — | ||||||||
Interest expense | (120.0 | ) | (121.4 | ) | (70.0 | ) | |||||
Total other expense, net | (113.9 | ) | (19.3 | ) | (69.8 | ) | |||||
Income before income taxes | 653.7 | 684.1 | 562.5 | ||||||||
Provision for income taxes | (202.2 | ) | (196.6 | ) | (208.5 | ) | |||||
Income from continuing operations | 451.5 | 487.5 | 354.0 | ||||||||
Discontinued operations: | |||||||||||
Income from discontinued operations (Note 10) | 253.0 | 33.4 | 82.6 | ||||||||
Provision for income taxes from discontinued operations | (113.3 | ) | (13.3 | ) | (36.6 | ) | |||||
Income from discontinued operations | 139.7 | 20.1 | 46.0 | ||||||||
Net income | $ | 591.2 | $ | 507.6 | $ | 400.0 | |||||
Basic net income per share: | |||||||||||
Income from continuing operations | $ | 2.68 | $ | 2.95 | $ | 2.14 | |||||
Income from discontinued operations | 0.83 | 0.12 | 0.27 | ||||||||
Basic net income per share | $ | 3.51 | $ | 3.07 | $ | 2.41 | |||||
Diluted net income per share: | |||||||||||
Income from continuing operations | $ | 2.64 | $ | 2.89 | $ | 2.10 | |||||
Income from discontinued operations | 0.81 | 0.12 | 0.27 | ||||||||
Diluted net income per share | $ | 3.45 | $ | 3.01 | $ | 2.37 | |||||
Weighted average shares outstanding: | |||||||||||
Basic | 168,248,304 | 165,090,380 | 165,823,803 | ||||||||
Diluted | 171,171,572 | 168,451,343 | 169,132,423 | ||||||||
The accompanying notes are an integral part of these consolidated financial statements.
58
VERISK ANALYTICS, INC.
CONSOLIDATED STATEMENTS OF COMPREHENSIVE INCOME
For The Years Ended December 31, 2016, 2015 and 2014
2016 | 2015 | 2014 | |||||||||
(In millions) | |||||||||||
Net income | $ | 591.2 | $ | 507.6 | $ | 400.0 | |||||
Other comprehensive income (loss), net of tax: | |||||||||||
Foreign currency translation adjustment | (395.6 | ) | (162.7 | ) | (1.3 | ) | |||||
Unrealized holding gain on available-for-sale securities | 0.3 | 0.1 | — | ||||||||
Pension and postretirement adjustment | (13.5 | ) | 1.1 | (35.7 | ) | ||||||
Total other comprehensive loss | (408.8 | ) | (161.5 | ) | (37.0 | ) | |||||
Comprehensive income | $ | 182.4 | $ | 346.1 | $ | 363.0 | |||||
The accompanying notes are an integral part of these consolidated financial statements.
59
VERISK ANALYTICS, INC.
CONSOLIDATED STATEMENTS OF CHANGES IN STOCKHOLDERS’ EQUITY
For The Years Ended December 31, 2016, 2015 and 2014
Unearned KSOP Contributions | Additional Paid-in Capital | Treasury Stock | Retained Earnings | Accumulated Other Comprehensive Losses | Total Stockholders’ Equity | |||||||||||||||||||||||||
Common Stock Issued | Par Value | |||||||||||||||||||||||||||||
(In millions, except for share data) | ||||||||||||||||||||||||||||||
Balance, January 1, 2014 | 544,003,038 | $ | 0.1 | $ | (0.3 | ) | $ | 1,202.1 | $ | (1,864.9 | ) | $ | 1,254.1 | $ | (43.5 | ) | $ | 547.6 | ||||||||||||
Net income | — | — | — | — | — | 400.0 | — | 400.0 | ||||||||||||||||||||||
Other comprehensive income | — | — | — | — | — | — | (37.0 | ) | (37.0 | ) | ||||||||||||||||||||
Treasury stock acquired (10,802,087 shares) | — | — | — | (100.0 | ) | (675.4 | ) | — | — | (775.4 | ) | |||||||||||||||||||
KSOP shares earned | — | — | 0.1 | 15.2 | — | — | — | 15.3 | ||||||||||||||||||||||
Stock options exercised, including tax benefit of $15.4 (1,091,746 shares reissued from treasury stock) | — | — | — | 34.0 | 5.8 | — | — | 39.8 | ||||||||||||||||||||||
Restricted stock lapsed, including tax benefit of $0.5 (134,713 shares reissued from treasury stock) | — | — | — | (0.2 | ) | 0.7 | — | — | 0.5 | |||||||||||||||||||||
Employee stock purchase plan (26,953 shares reissued from treasury stock) | — | — | — | 1.4 | 0.1 | — | — | 1.5 | ||||||||||||||||||||||
Stock based compensation | — | — | — | 20.0 | — | — | — | 20.0 | ||||||||||||||||||||||
Net share settlement from restricted stock awards (27,159 shares withheld for tax settlement) | — | — | — | (1.6 | ) | — | — | — | (1.6 | ) | ||||||||||||||||||||
Other stock issuances (3,975 shares reissued from treasury stock) | — | — | — | 0.3 | — | — | — | 0.3 | ||||||||||||||||||||||
Balance, December 31, 2014 | 544,003,038 | 0.1 | (0.2 | ) | 1,171.2 | (2,533.7 | ) | 1,654.1 | (80.5 | ) | 211.0 | |||||||||||||||||||
Net income | — | — | — | — | — | 507.6 | — | 507.6 | ||||||||||||||||||||||
Other comprehensive loss | — | — | — | — | — | — | (161.5 | ) | (161.5 | ) | ||||||||||||||||||||
Treasury stock acquired (1,088,474 shares) | — | — | — | 100.0 | (120.5 | ) | — | — | (20.5 | ) | ||||||||||||||||||||
KSOP shares earned (47,686 shares reissued from treasury stock) | — | — | 0.2 | 13.6 | 0.3 | — | — | 14.1 | ||||||||||||||||||||||
Shares issued from equity offering (10,604,000 reissued from treasury stock) | — | — | — | 651.3 | 69.6 | — | — | 720.9 | ||||||||||||||||||||||
Stock options exercised, including tax benefit of $28.0 (1,739,847 shares reissued from treasury stock) | — | — | — | 57.5 | 11.7 | — | — | 69.2 | ||||||||||||||||||||||
Restricted stock lapsed, including tax benefit of $1.2 (177,252 shares reissued from treasury stock) | — | — | — | 0.1 | 1.2 | — | — | 1.3 | ||||||||||||||||||||||
Employee stock purchase plan (25,599 shares reissued from treasury stock) | — | — | — | 1.6 | 0.2 | — | — | 1.8 | ||||||||||||||||||||||
Stock based compensation | — | — | — | 30.1 | — | — | — | 30.1 | ||||||||||||||||||||||
Net share settlement from restricted stock awards (32,882 shares withheld for tax settlement) | — | — | — | (2.4 | ) | — | — | — | (2.4 | ) | ||||||||||||||||||||
Other stock issuances (5,844 shares reissued from treasury stock) | — | — | — | 0.4 | — | — | — | 0.4 | ||||||||||||||||||||||
Balance, December 31, 2015 | 544,003,038 | 0.1 | — | 2,023.4 | (2,571.2 | ) | 2,161.7 | (242.0 | ) | 1,372.0 | ||||||||||||||||||||
Net income | — | — | — | — | — | 591.2 | — | 591.2 | ||||||||||||||||||||||
Other comprehensive loss | — | — | — | — | — | — | (408.8 | ) | (408.8 | ) | ||||||||||||||||||||
Treasury stock acquired (4,325,548 shares) | — | — | — | — | (333.3 | ) | — | — | (333.3 | ) | ||||||||||||||||||||
KSOP shares earned (181,198 shares reissued from treasury stock) | — | — | — | 13.2 | 1.3 | — | — | 14.5 | ||||||||||||||||||||||
Stock options exercised, including tax benefit of $22.1 (1,409,803 shares reissued from treasury stock) | — | — | — | 56.2 | 10.2 | — | — | 66.4 | ||||||||||||||||||||||
Restricted stock lapsed, including tax benefit of $1.2 (169,365 shares reissued from treasury stock) | — | — | — | — | 1.2 | — | — | 1.2 | ||||||||||||||||||||||
Employee stock purchase plan (29,867 shares reissued from treasury stock) | — | — | — | 2.1 | 0.2 | — | — | 2.3 | ||||||||||||||||||||||
Stock based compensation | — | — | — | 29.9 | — | — | — | 29.9 | ||||||||||||||||||||||
Net share settlement from restricted stock awards (38,250 shares withheld for tax settlement) | — | — | — | (3.1 | ) | — | — | — | (3.1 | ) | ||||||||||||||||||||
Other stock issuances (26,106 shares reissued from treasury stock) | — | — | — | (0.1 | ) | 0.2 | — | — | 0.1 | |||||||||||||||||||||
Balance, December 31, 2016 | 544,003,038 | $ | 0.1 | $ | — | $ | 2,121.6 | $ | (2,891.4 | ) | $ | 2,752.9 | $ | (650.8 | ) | $ | 1,332.4 | |||||||||||||
The accompanying notes are an integral part of these consolidated financial statements.
60
VERISK ANALYTICS, INC.
CONSOLIDATED STATEMENTS OF CASH FLOWS
For The Years Ended December 31, 2016, 2015 and 2014
2016 | 2015 | 2014 | |||||||||
(In millions) | |||||||||||
Cash flows from operating activities: | |||||||||||
Net income | $ | 591.2 | $ | 507.6 | $ | 400.0 | |||||
Adjustments to reconcile net income to net cash provided by operating activities: | |||||||||||
Depreciation and amortization of fixed assets | 126.2 | 120.6 | 86.5 | ||||||||
Amortization of intangible assets | 98.4 | 94.8 | 57.0 | ||||||||
Amortization of debt issuance costs and original issue discount | 5.0 | 12.9 | 2.6 | ||||||||
Provision for doubtful accounts | 2.4 | 1.3 | 1.8 | ||||||||
KSOP compensation expense | 14.5 | 14.1 | 15.3 | ||||||||
Stock based compensation | 30.0 | 30.5 | 20.3 | ||||||||
Gain on derivative instruments | — | (85.2 | ) | — | |||||||
Gain on sale of subsidiary | (265.9 | ) | — | (65.4 | ) | ||||||
Realized loss (gain) on securities, net | 0.5 | 0.2 | (0.3 | ) | |||||||
Gain on sale of non-controlling equity investments in non-public companies | (1.5 | ) | — | — | |||||||
Gain on exercise of common stock warrants | — | (15.6 | ) | — | |||||||
Deferred income taxes | 14.8 | (4.1 | ) | 24.6 | |||||||
Loss on disposal of fixed assets | 1.0 | 0.4 | 1.0 | ||||||||
Excess tax benefits from exercised stock options | (31.4 | ) | (40.1 | ) | (22.6 | ) | |||||
Loss on extinguishment of convertible note | — | 0.5 | — | ||||||||
Changes in assets and liabilities, net of effects from acquisitions: | |||||||||||
Accounts receivable | (5.7 | ) | (14.6 | ) | (54.5 | ) | |||||
Prepaid expenses and other assets | (16.6 | ) | 12.0 | (9.6 | ) | ||||||
Income taxes | 8.7 | 51.6 | 13.7 | ||||||||
Accounts payable and accrued liabilities | (2.6 | ) | (8.8 | ) | 12.7 | ||||||
Deferred revenues | (8.2 | ) | (43.5 | ) | 22.1 | ||||||
Pension and postretirement benefits | (9.9 | ) | (13.7 | ) | (14.8 | ) | |||||
Other liabilities | (4.8 | ) | 2.8 | (1.0 | ) | ||||||
Net cash provided by operating activities | 546.1 | 623.7 | 489.4 | ||||||||
Cash flows from investing activities: | |||||||||||
Acquisitions, net of cash acquired of $2.1 million, $41.4 million and $0.3 million, respectively | (67.7 | ) | (2,858.2 | ) | (35.2 | ) | |||||
Purchase of non-controlling equity investments in non-public companies | — | (0.1 | ) | (5.0 | ) | ||||||
Sale of non-controlling equity investments in non-public companies | 8.5 | — | — | ||||||||
Proceeds from sale of subsidiary | 714.6 | — | 151.2 | ||||||||
Proceeds from extinguishment of convertible note | — | 0.4 | — | ||||||||
Escrow funding associated with acquisitions | (6.4 | ) | (83.4 | ) | — | ||||||
Proceeds from the settlement of derivative instruments | — | 85.2 | — | ||||||||
Capital expenditures | (156.5 | ) | (166.1 | ) | (146.8 | ) | |||||
Purchases of available-for-sale securities | (0.3 | ) | (0.2 | ) | (0.2 | ) | |||||
Proceeds from sales and maturities of available-for-sale securities | 0.5 | 0.4 | 0.5 | ||||||||
Cash received from the exercise of common stock warrants | — | 15.6 | — | ||||||||
Other investing activities, net | 0.5 | 0.1 | — | ||||||||
Net cash provided by (used in) investing activities | 493.2 | (3,006.3 | ) | (35.5 | ) | ||||||
The accompanying notes are an integral part of these consolidated financial statements.
61
VERISK ANALYTICS, INC.
CONSOLIDATED STATEMENTS OF CASH FLOWS (Continued)
For The Years Ended December 31, 2016, 2015 and 2014
2016 | 2015 | 2014 | |||||||||
(In millions) | |||||||||||
Cash flows from financing activities: | |||||||||||
Proceeds from issuance of long-term debt, net of original issue discount | — | 1,244.0 | — | ||||||||
Repayments of current portion of long-term debt | — | (170.0 | ) | — | |||||||
Repayments of long-term debt | — | (50.0 | ) | — | |||||||
Proceeds from issuance of short-term debt with original maturities greater than three months | — | 830.0 | — | ||||||||
Repayment of short-term debt with original maturities greater than three months | — | (15.0 | ) | — | |||||||
(Repayments) proceeds from short-term debt, net | (770.0 | ) | (105.0 | ) | 160.0 | ||||||
Payment of debt issuance costs | (0.5 | ) | (23.9 | ) | (0.5 | ) | |||||
Repurchases of common stock | (326.8 | ) | (20.4 | ) | (778.5 | ) | |||||
Net share settlement of taxes from restricted stock awards | (3.1 | ) | (2.4 | ) | (1.6 | ) | |||||
Excess tax benefits from exercised stock options | 31.4 | 40.1 | 22.6 | ||||||||
Proceeds from stock options exercised | 41.1 | 38.8 | 24.6 | ||||||||
Proceeds from issuance of stock as part of a public offering | — | 720.8 | — | ||||||||
Other financing activities, net | (4.9 | ) | (6.0 | ) | (5.7 | ) | |||||
Net cash (used in) provided by financing activities | (1,032.8 | ) | 2,481.0 | (579.1 | ) | ||||||
Effect of exchange rate changes | (9.7 | ) | 0.6 | (1.3 | ) | ||||||
(Decrease) increase in cash and cash equivalents | (3.2 | ) | 99.0 | (126.5 | ) | ||||||
Cash and cash equivalents, beginning of period | 138.3 | 39.3 | 165.8 | ||||||||
Cash and cash equivalents, end of period | $ | 135.1 | $ | 138.3 | $ | 39.3 | |||||
Supplemental disclosures: | |||||||||||
Taxes paid | $ | 289.2 | $ | 158.5 | $ | 205.5 | |||||
Interest paid | $ | 116.6 | $ | 106.1 | $ | 67.2 | |||||
Non-cash investing and financing activities: | |||||||||||
Repurchases of common stock included in accounts payable and accrued liabilities | $ | 6.5 | $ | — | $ | — | |||||
Promissory note received for sale of discontinued operations | $ | 82.9 | $ | — | $ | — | |||||
Equity interest received for sale of discontinued operations | $ | 8.4 | $ | — | $ | — | |||||
Deferred tax liability established on the date of acquisitions | $ | 4.7 | $ | 213.0 | $ | 2.7 | |||||
Tenant improvement allowance | $ | 0.1 | $ | 1.6 | $ | 9.1 | |||||
Capital lease obligations | $ | 11.7 | $ | 1.7 | $ | 6.0 | |||||
Capital expenditures included in accounts payable and accrued liabilities | $ | 1.9 | $ | 2.8 | $ | 0.1 | |||||
The accompanying notes are an integral part of these consolidated financial statements.
62
VERISK ANALYTICS, INC.
NOTES TO CONSOLIDATED FINANCIAL STATEMENTS
(Amounts in millions, except for share and per share data, unless otherwise stated)
1. Organization:
Verisk Analytics, Inc. and its consolidated subsidiaries (“Verisk” or the “Company”) enable risk-bearing businesses to better understand and manage their risks. The Company provides its customers proprietary data that, combined with analytic methods, create embedded decision support solutions. The Company is one of the largest aggregators and providers of data pertaining to property and casualty (“P&C”) insurance risks in the United States of America (“U.S.”). The Company offers predictive analytics and decision support solutions to customers in rating, underwriting, claims, catastrophe and weather risk, global risk analytics, natural resources intelligence, economic forecasting, and many other fields.
Verisk was established to serve as the parent holding company of Insurance Services Office, Inc. (“ISO”) upon completion of the initial public offering (“IPO”), which occurred on October 9, 2009. ISO was formed in 1971 as an advisory and rating organization for the P&C insurance industry to provide statistical and actuarial services, to develop insurance programs and to assist insurance companies in meeting state regulatory requirements. For over the past decade, the Company broadened its data assets, entered new markets, placed a greater emphasis on analytics, and pursued strategic acquisitions. Verisk trades under the ticker symbol “VRSK” on the NASDAQ Global Select Market.
2. Basis of Presentation and Summary of Significant Accounting Policies:
The accompanying consolidated financial statements have been prepared on the basis of accounting principles generally accepted in the United States of America (“U.S. GAAP”). The preparation of financial statements in conformity with these accounting principles requires management to make estimates and assumptions that affect the reported amounts of assets and liabilities and disclosure of contingent assets and liabilities at the date of the financial statements and the reported amounts of revenues and expenses during the reporting periods. Significant estimates include acquisition purchase price allocations, the fair value of goodwill, the realization of deferred tax assets, acquisition related liabilities, fair value of stock based compensation for stock options granted, and assets and liabilities for pension and postretirement benefits. Actual results may ultimately differ from those estimates.
As of March 31, 2016 and December 31, 2013, the Company's healthcare and mortgage services business qualified as assets held-for-sale, respectively. The healthcare business was sold on June 1, 2016. The mortgage services business was sold on March 11, 2014. The results of operations for the Company's healthcare and mortgage services businesses are reported as discontinued operations for the years ended December 31, 2016, 2015 and 2014 (See Note 10).
As of December 31, 2016, the Company simplified the presentation of its consolidated financial statements. Amounts, except for share and per share data, are presented in millions.
Significant accounting policies include the following:
(a) Intercompany Accounts and Transactions
The consolidated financial statements include the accounts of Verisk. All intercompany accounts and transactions have been eliminated.
(b) Revenue Recognition
The following describes the Company’s primary types of revenues and the applicable revenue recognition policies. The Company’s revenues are primarily derived from the sales of services and revenue is recognized as services are performed and information is delivered to customers. Revenue is recognized when persuasive evidence of an arrangement exists, delivery has occurred or services have been rendered, fees and/or price is fixed or determinable, and collectability is reasonably assured. Revenue is recognized net of applicable sales tax withholdings.
Industry-Standard Insurance Programs
Industry-standard insurance programs, statistical agent and data services and actuarial services are sold to participating insurance company customers under annual agreements covering a calendar year where the price is determined at the inception of the agreement. In accordance with Accounting Standards Codification (“ASC”) 605, Revenue Recognition, the Company recognizes revenue ratably over the term of these annual agreements, as services are performed and continuous access to information is provided over the entire term of the agreements.
63
Property-Specific Rating and Underwriting Information
The Company provides property-specific rating information through reports issued for specific commercial properties, for which revenue is recognized when the report is delivered to the customer, provided that all other revenue recognition criteria are met.
In addition, the Company provides hosting or software solutions that provide continuous access to information about the properties being insured and underwriting information in the form of standard policy forms to be used by customers. As the customer has a contractual right to take possession of the software without significant penalty, revenues from these arrangements are recognized ratably over the contract period from the time when the customer had access to the solution in accordance with ASC 985-605, Software Revenue Recognition (“ASC 985-605”). The Company recognizes software license revenue when the arrangement does not require significant production, customization or modification of the software and the following criteria are met: persuasive evidence of an agreement exists, delivery has occurred, fees are fixed or determinable, and collections are probable. These software arrangements include post-contract customer support (“PCS”). The Company recognizes software license revenue ratably over the duration of the annual license term as vendor specific objective evidence (“VSOE”) of PCS, the only remaining undelivered element, cannot be established in accordance with ASC 985-605. The PCS associated with these arrangements is coterminous with the duration of the license term.
Insurance
Insurance services primarily consist of term-based software licenses. These software arrangements include PCS, which includes unspecified upgrades on a when-and-if available basis. The Company recognizes software license revenue ratably over the duration of the annual license term as VSOE of PCS, the only remaining undelivered element, cannot be established in accordance with ASC 985-605. The PCS associated with these arrangements is coterminous with the duration of the license term. In certain instances, the customers are billed for access on a monthly basis for the term-based software licenses and the Company recognizes revenue accordingly.
There are also services within insurance, which are comprised of transaction-based fees recognized as information is delivered to customers, provided that all other revenue recognition criteria have been met.
Financial Services
Financial services include various types of services to customers. The Company primarily recognizes revenue ratably for these services over the term of the agreements, as services are performed and continuous service is provided over the entire term of the agreements. In addition, there are certain services which are comprised of transaction-based fees; in these instances, revenue is recognized as information is delivered to customers, provided that all other revenue recognition criteria have been met.
Energy and Specialized Markets
The Company provides hosting solutions that give continuous access to research information such as data analytics and commercial intelligence for the energy, chemicals, metals and mining verticals. For the hosting arrangements, whereby the customer does not have the right to take possession of the software, which include PCS throughout the hosting term, revenues from these multiple element arrangements are recognized in accordance with ASC 605-25, Revenue recognition — Multiple element arrangements ("ASC 605-25"). The Company recognizes revenue ratably over the duration of the license term, since the contractual elements do not have stand alone value. Specialized markets consist of term-based software licenses. These software arrangements include PCS, which includes unspecified upgrades on a when-and-if available basis. The Company recognizes software license revenue ratably over the duration of the annual license term as VSOE of PCS, the only remaining undelivered element, cannot be established in accordance with ASC 985-605. The PCS associated with these arrangements is coterminous with the duration of the license term. In certain instances, the customers are billed for access on a monthly basis for the term-based software licenses and the Company recognizes revenue accordingly. In addition, specialized markets are comprised of transaction-based fees recognized as information is delivered to customers, provided that all other revenue recognition criteria have been met.
The Company services long-term contract arrangements with certain customers. For these arrangements, revenue is recognized in accordance with ASC 605-35, Revenue Recognition — Construction-Type and Production-Type Contracts (“ASC 605-35”), using the percentage-of-completion method, which requires the use of estimates. In such instances, management is required to estimate the input measures, based on hours incurred to date compared to
64
total estimated hours of the project, with consideration also given to output measures, such as contract milestones, when applicable. Adjustments to estimates are made in the period in which the facts requiring such revisions become known. Accordingly, recognized revenues and profits are subject to revisions as the contract progresses to completion. The Company considers the contract substantially complete when there is compliance with all performance specifications and there are no remaining costs or potential risk.
There are also services within energy and specialized markets, which are comprised of transaction-based fees recognized as information is delivered to customers, provided that all other revenue recognition criteria have been met.
(c) Deferred Revenues
The Company invoices its customers in annual, quarterly, monthly, or milestone installments. Amounts billed and collected in advance of earnings are recorded as “Deferred revenues” in the accompanying consolidated balance sheets and are recognized as the services are performed and the applicable revenue recognition criteria are met.
(d) Fixed Assets and Finite-lived Intangible Assets
Property and equipment, internal-use software and finite-lived intangibles are stated at cost less accumulated depreciation and amortization, which are computed on a straight-line basis over their estimated useful lives. Leasehold improvements are amortized over the shorter of the useful life of the asset or the lease term.
The Company’s internal software development costs primarily relate to internal-use software. Such costs are capitalized in the application development stage in accordance with ASC 350-40, Internal-use Software. The Company also capitalizes software development costs upon the establishment of technological feasibility for a product in accordance with ASC 985-20, Software to be Sold, Leased, or Marketed (“ASC 985-20”). Software development costs are amortized on a straight-line basis over a three-year period, which management believes represents the useful life of these capitalized costs.
In accordance with ASC 360, Property, Plant & Equipment, whenever events or changes in circumstances indicate that the carrying amount of long-lived assets and finite-lived intangible assets may not be recoverable, the Company reviews its long-lived assets and finite-lived intangible assets for impairment by first comparing the carrying value of the assets to the sum of the undiscounted cash flows expected to result from the use and eventual disposition of the assets. If the carrying value exceeds the sum of the assets’ undiscounted cash flows, the Company estimates and recognizes an impairment loss by taking the difference between the carrying value and fair value of the assets.
(e) Capital and Operating Leases
The Company leases various property, plant and equipment. Leased property is accounted for under ASC 840, Leases (“ASC 840”). Accordingly, leased property that meets certain criteria is capitalized and the present value of the related lease payments is recorded as a liability. Amortization of assets accounted for as capital leases is computed utilizing the straight-line method over the shorter of the remaining lease term or the estimated useful life (principally three to four years for computer equipment and automobiles).
All other leases are accounted for as operating leases. Rent expense for operating leases, which may have rent escalation provisions or rent holidays, is recorded on a straight-line basis over the non-cancelable lease period in accordance with ASC 840. The initial lease term generally includes the build-out period, where no rent payments are typically due under the terms of the lease. The difference between rent expensed and rent paid is recorded as deferred rent. Construction allowances received from landlords are recorded as a deferred rent credit and amortized to rent expense over the term of the lease.
(f) Investments
The Company’s investments at December 31, 2016 and 2015 included registered investment companies and equity investments in non-public companies. The Company accounts for short-term investments in accordance with ASC 320, Investments-Debt and Equity Securities (“ASC 320”).
There were no investments classified as trading securities at December 31, 2016 or 2015. All investments with readily determinable market values are classified as available-for-sale. While these investments are not held with the specific intention to sell them, they may be sold to support the Company’s investment strategies. All available-for-sale investments are carried at fair value. The cost of all available-for-sale investments sold is based on the specific
65
identification method, with the exception of mutual fund-based investments, which is based on the weighted average cost method. Dividend income is accrued on the ex-dividend date.
The Company reviews its investment portfolio when individual holdings have experienced a decline in fair value below their respective cost. The Company considers a number of factors in the evaluation of whether a decline in value is other-than-temporary, including: (a) the financial condition and near-term prospects of the issuer, (b) the Company’s ability and intent to retain the investment for a period of time sufficient to allow for an anticipated recovery in value, and (c) the period and degree to which the market value has been below cost. Where the decline is deemed to be other-than-temporary, a charge is recorded to “Investment income and others, net” in the accompanying consolidated statements of operations, and a new cost basis is established for the investment.
The Company’s equity investments in non-public companies are included in “Other assets” in the accompanying consolidated balance sheets. Those securities are carried at cost, as the Company owns less than 20% of the stock and does not otherwise have the ability to exercise significant influence. These securities are written down to their estimated realizable value when management considers there is an other-than-temporary decline in value based on financial information received and the business prospects of the entity.
(g) Fair Value of Financial and Non-financial Instruments
The Company follows the provisions of ASC 820-10, Fair Value Measurements (“ASC 820-10”), which defines fair value, establishes a framework for measuring fair value under U.S. GAAP and expands fair value measurement disclosures. The Company follows the provisions of ASC 820-10 for its financial assets and liabilities recognized or disclosed at fair value on a recurring basis. The Company follows the provisions of ASC 820-10 for its non-financial assets and liabilities recognized or disclosed at fair value.
(h) Accounts Receivable and Allowance for Doubtful Accounts
Accounts receivable is generally recorded at the invoiced amount. The allowance for doubtful accounts is estimated based on an analysis of the aging of the accounts receivable, historical write-offs, customer payment patterns, individual customer creditworthiness, current economic trends, and/or establishment of specific reserves for customers in adverse financial condition. The Company assesses the adequacy of the allowance for doubtful accounts on a quarterly basis.
(i) Foreign Currency
The Company has determined local currencies are the functional currencies of the foreign operations. The assets and liabilities of foreign subsidiaries are translated at the period-end rate of exchange and statement of operations items are translated at the average rates prevailing during the year. The resulting translation adjustment is recorded as a component of “Accumulated other comprehensive losses” in the accompanying consolidated statements of changes in stockholders’ equity.
(j) Stock Based Compensation
The Company follows ASC 718, Stock Compensation (“ASC 718”). Under ASC 718, stock based compensation cost is measured at the grant date, based on the fair value of the awards granted, and is recognized as expense over the requisite service period.
Other equity awards, including restricted stock, are valued at the closing price of the Company’s common stock on the grant date. Restricted stock generally has a service vesting period of four years and the Company recognizes the expense ratably over this service vesting period.
The Company estimates expected forfeitures of equity awards at the date of grant and recognizes compensation expense only for those awards expected to vest. The forfeiture assumption is ultimately adjusted to the actual forfeiture rate. Changes in the forfeiture assumptions may impact the total amount of expense ultimately recognized, as well as the timing of expense recognized over the requisite service period.
The payment of taxes related to the vesting is recorded as a reduction to additional paid-in-capital. This transaction is reflected within "Net share settlement of restricted stock awards" within cash flows from financing activities in the accompanying consolidated statements of cash flows.
66
Excess tax benefit from exercised stock options is recorded as an increase to additional-paid-in capital and a corresponding reduction in taxes payable. This tax benefit is calculated as the excess of the intrinsic value of options exercised in excess of compensation recognized for financial reporting purposes. The amount of the tax benefit that has been realized, as a result of those excess tax benefits, is presented as a financing cash inflow within the accompanying consolidated statements of cash flows.
(k) Research and Development Costs
Research and development costs, which are primarily related to personnel and related overhead costs incurred in developing new services for customers, are expensed as incurred. Such costs were $27.4 million, $20.6 million and $25.6 million for the years ended December 31, 2016, 2015 and 2014, respectively, and were included in the accompanying consolidated statements of operations.
(l) Advertising Costs
Advertising costs, which are primarily associated with promoting the Company’s brand, names and solutions provided, are expensed as incurred. Such costs were $6.5 million, $5.9 million and $4.6 million for the years ended December 31, 2016, 2015 and 2014, respectively.
(m) Income Taxes
The Company accounts for income taxes under the asset and liability method under ASC 740, Income Taxes (“ASC 740”), which requires the recognition of deferred tax assets and liabilities for the expected future tax consequences of events that have been included in the financial statements. Under this method, deferred tax assets and liabilities are determined based on the differences between the financial statements and tax basis of assets and liabilities using enacted tax rates in effect for the year in which the differences are expected to reverse. The effect of a change in tax rates on deferred tax assets and liabilities is recognized in income in the period that includes the enactment date.
Deferred tax assets are recorded to the extent these assets are more likely than not to be realized. In making such determination, the Company considers all available positive and negative evidence, including future reversals of existing taxable temporary differences, projected future taxable income, tax planning strategies and recent financial operations. Valuation allowances are recognized to reduce deferred tax assets if it is determined to be more likely than not that all or some of the potential deferred tax assets will not be realized.
The Company follows ASC 740-10, Income Taxes (“ASC 740-10”), which clarifies the accounting for uncertainty in income taxes recognized in the financial statements. ASC 740-10 provides that a tax benefit from an uncertain tax position may be recognized based on the technical merits when it is more likely than not that the position will be sustained upon examination, including resolutions of any related appeals or litigation processes. Income tax positions must meet a more likely than not recognition threshold in accordance with ASC 740-10. This standard also provides guidance on measurement, derecognition, classification, interest and penalties, accounting in interim periods, disclosure, and transition.
The Company recognizes interest and penalties related to unrecognized tax benefits within the income tax expense line in the accompanying consolidated statements of operations. Accrued interest and penalties are included within “Other liabilities” on the accompanying consolidated balance sheets.
(n) Earnings Per Share
Basic and diluted earnings per share (“EPS”) are determined in accordance with ASC 260, Earnings per Share, which specifies the computation, presentation and disclosure requirements for EPS. Basic EPS excludes all dilutive common stock equivalents. It is based upon the weighted average number of common shares outstanding during the period. Diluted EPS, as calculated using the treasury stock method, reflects the potential dilution that would occur if the Company’s dilutive outstanding stock options and stock awards were issued.
(o) Pension and Postretirement Benefits
The Company accounts for its pension and postretirement benefits under ASC 715, Compensation — Retirement Benefits (“ASC 715”). ASC 715 requires the recognition of the funded status of a benefit plan in the balance sheet, the recognition in other comprehensive income (loss) of gains or losses and prior service costs or credits arising during the period, but which are not included as components of periodic benefit cost, and the measurement of
67
defined benefit plan assets and obligations as of the balance sheet date. The Company utilizes a valuation date of December 31.
(p) Product Warranty Obligations
The Company provides warranty coverage for certain of its solutions. The Company recognizes a product warranty obligation when claims are probable and can be reasonably estimated. As of December 31, 2016 and 2015, product warranty obligations were not material.
In the ordinary course of business, the Company enters into numerous agreements that contain standard indemnities whereby the Company indemnifies another party for breaches of confidentiality, infringement of intellectual property or gross negligence. Such indemnifications are primarily granted under licensing of computer software. Most agreements contain provisions to limit the maximum potential amount of future payments that the Company could be required to make under these indemnifications; however, the Company is not able to develop an estimate of the maximum potential amount of future payments to be made under these indemnifications as the triggering events are not subject to predictability.
(q) Loss Contingencies
The Company accrues for costs relating to litigation, claims and other contingent matters when such liabilities become probable and reasonably estimable. Such estimates are based on management’s judgment. Actual amounts paid may differ from amounts estimated, and such differences will be charged to operations in the period in which the final determination of the liability is made.
(r) Goodwill
Goodwill represents the excess of acquisition costs over the fair value of tangible net assets and identifiable intangible assets of the businesses acquired. Goodwill and intangible assets deemed to have indefinite lives are not amortized. Intangible assets determined to have finite lives are amortized over their useful lives. Goodwill and intangible assets with indefinite lives are subject to impairment testing annually as of June 30 or whenever events or changes in circumstances indicate that the carrying amount may not be fully recoverable. The Company completed the required annual impairment test as of June 30, 2016, which resulted in no impairment of goodwill in 2016. This test compares the carrying value of each reporting unit to its fair value. If the fair value of the reporting unit exceeds the carrying value of the net assets, including goodwill assigned to that reporting unit, goodwill is not impaired. If the carrying value of the reporting unit’s net assets, including goodwill, exceeds the fair value of the reporting unit, then the Company will determine the implied fair value of the reporting unit’s goodwill. If the carrying value of a reporting unit’s goodwill exceeds its implied fair value, then an impairment loss is recorded for the difference between the carrying amount and the implied fair value of the goodwill.
(s) Recent Accounting Pronouncements
In April 2015, the Financial Accounting Standard Board ("FASB") issued Accounting Standards Update ("ASU") 2015-03, Simplifying the Presentation of Debt Issuance Costs ("ASU No. 2015-03"). The amendments in this update require that debt issuance costs related to a recognized debt liability be presented in the balance sheet as a direct deduction from the carrying amount of that debt liability, consistent with debt discounts. The Company adopted the guidance on January 1, 2016 and as a result, debt issuance costs of $22.3 million were reclassified from "Other assets" to "Long-term debt" on the Company's condensed consolidated balance sheet as of December 31, 2015.
In August 2015, the FASB issued ASU 2015-14, Revenue from Contracts with Customers - Deferral of the Effective Date ("ASU No. 2015-14"). The amendments in this update defer the effective date of ASU No. 2014-09, Revenue from Contracts with Customers, for all entities by one year. Public business entities will apply the guidance in ASU No. 2015-14 for annual reporting periods beginning after December 15, 2017. The Company is currently evaluating ASU No. 2015-14 and has not determined the impact this standard may have on its financial statements nor decided upon the method of adoption. The Company is still finalizing the analysis to quantify the adoption impact of the provisions of the new standard, but the Company does not expect it to have a significant impact on its consolidated financial position and results of operations. Based on the evaluation of the current contracts and revenue streams, most will be recorded consistently under the current and new standard. The Company believes that the Company is following an appropriate timeline to allow for proper recognition, presentation and disclosure upon adoption effective the beginning of fiscal 2018.
68
In February 2016, the FASB issued ASU No. 2016-02, Leases ("ASU No. 2016-02"). This ASU amends the existing accounting considerations and treatments for leases through the creation of Topic 842, Leases, to increase transparency and comparability among organizations by requiring the recognition of lease assets and lease liabilities on the balance sheet and disclosing key information about lease arrangements. The amendments in ASU No. 2016-02 are effective for fiscal years beginning after December 15, 2018, including interim periods within those fiscal years. Early application of the amendments is permitted for all entities. The Company has decided not to early adopt ASU No. 2016-02 and is currently evaluating the impact the amendments may have on its consolidated financial statements.
In March 2016, the FASB issued ASU No. 2016-08, Principal Versus Agent Considerations (“ASU No. 2016-08”). The amendments to this update are intended to improve the operability and understandability of the implementation guidance on principal versus agent considerations. The amendments in ASU No. 2016-08 are effective for annual reporting periods beginning after December 15, 2017, including interim reporting periods within that reporting period. Earlier application is permitted only as of annual reporting periods beginning after December 15, 2016, including interim reporting periods within that reporting period. The Company is currently evaluating ASU No. 2016-08 and has not determined the impact this standard may have on its consolidated financial statements nor decided upon the method of adoption.
In March 2016, the FASB issued ASU No. 2016-09, Improvements to Employee Share-Based Payment Accounting (“ASU No. 2016-09”). The objective of this update is to simplify several aspects of the accounting for share-based payment transactions, including the income tax consequences, classification of awards as either equity or liabilities, and classification on the statement of cash flows. The amendments in ASU No. 2016-09 are effective for annual periods beginning after December 15, 2016, and interim periods within those annual periods. Early adoption is permitted for any entity in any interim or annual period. The Company has not elected to early adopt. The adoption of ASU No. 2016-09 is not expected to have a material impact on the Company’s consolidated financial statements.
In April 2016, the FASB issued ASU No. 2016-10, Identifying Performance Obligations and Licensing (“ASU No. 2016-10”). The amendments in this update clarify the following two aspects of Accounting Standards Codification ("ASC") 606 ("ASC 606"), Revenue From Contracts With Customers: identifying performance obligations and the licensing implementation guidance, while retaining the related principles for those areas. The amendments in ASU No. 2016-10 are effective for annual reporting periods beginning after December 15, 2017, including interim reporting periods within that reporting period. Earlier application is permitted only as of annual reporting periods beginning after December 15, 2016, including interim reporting periods within that reporting period. The Company has not elected to early adopt. The Company is currently evaluating ASU No. 2016-10 and has not determined the impact this standard may have on its consolidated financial statements nor decided upon the method of adoption.
In May 2016, the FASB issued ASU No. 2016-12, Narrow-Scope Improvements and Practical Expedients ("ASU No. 2016-12"). ASU No. 2016-12 does not change the core principle of the guidance in ASC 606. Rather, this update affects only the narrow scope improvements to the guidance on collectability, noncash consideration, and completed contracts at transition. The effective date and transition requirements for ASU 2016-12 are the same as the effective date and transition requirements for ASC 606. The adoption of ASU No. 2016-12 is not expected to have a material impact on the Company’s consolidated financial statements.
In August 2016, the FASB issued ASU No. 2016-15, Classification of Certain Cash Receipts and Cash Payments ("ASU No. 2016-15"). The amendments in this update provide guidance on various specific cash flow issues to reduce diversity in the practice of how certain transactions are classified in the statement of cash flows. ASU No. 2016-15 is effective for fiscal years beginning after December 15, 2017, and interim periods within those fiscal years. Early adoption is permitted. The Company has not elected to early adopt. The Company is currently evaluating ASU No. 2016-15 and has not yet determined the impact these amendments may have on its consolidated financial statements.
In January 2017, the FASB issued ASU No. 2017-01, Clarifying the Definition of a Business ("ASU No. 2017-01"). Under the amendments in this update, an acquisition would have to include an input and a substantive process that together significantly contribute to the ability to create outputs to be considered a business. In acquisitions where outputs are not present, FASB has developed more stringent criteria for sets without outputs. ASU No. 2017-01 is effective for annual periods beginning after December 15, 2017, including interim periods within those periods. The amendments in this update should be applied prospectively on or after the effective date. No disclosures are required at transition. The Company will evaluate the impact of ASU No. 2017-01 for the future acquisitions subsequent to the effective date.
69
In January 2017, the FASB issued ASU No. 2017-04, Simplifying the Test for Goodwill Impairment ("ASU No. 2017-04"). The guidance eliminates Step 2 of the goodwill impairment test, which requires a hypothetical purchase price allocation. A goodwill impairment will now be the amount by which a reporting unit’s carrying value exceeds its fair value, not to exceed the carrying amount of goodwill. The same one-step impairment test will be applied to goodwill at all reporting units, even those with zero or negative carrying amounts. Entities will be required to disclose the amount of goodwill at reporting units with zero or negative carrying amounts. ASU 2017-04 is effective for its annual or any interim goodwill impairment tests in fiscal years beginning after December 15, 2019. Early adoption is permitted for interim or annual goodwill impairment tests performed on testing dates after January 1, 2017. The Company is currently evaluating ASU No. 2017-04 and has not yet determined the impact these amendments may have on its consolidated financial statements.
3. Concentration of Credit Risk:
Financial instruments that potentially expose the Company to credit risk consist primarily of cash and cash equivalents, available for sale securities and accounts receivable, which are generally not collateralized. The Company maintains its cash and cash equivalents in higher credit quality financial institutions in order to limit the amount of credit exposure. The total domestic cash balances are insured by the Federal Deposit Insurance Corporation (“FDIC”) to a maximum amount of $250.0 thousand per bank at December 31, 2016 and 2015. At December 31, 2016 and 2015, the Company had cash balances on deposit that exceeded the balance insured by the FDIC limit by approximately $61.0 million and $85.0 million with four and six banks, respectively. At December 31, 2016 and 2015, the Company also had cash on deposit with foreign banks of approximately $73.1 million and $52.1 million, respectively.
The Company considers the concentration of credit risk associated with its trade accounts receivable to be commercially reasonable and believes that such concentration does not result in the significant risk of near-term severe adverse impacts. The Company’s top fifty customers represent approximately 29.9% of revenues for 2016, 40.8% for 2015 and 49.0% for 2014 with no individual customer accounting for more than 2.0% of revenues during the year ended December 31, 2016, 2.3% for 2015 and 2.9% for 2014. No individual customer comprised more than 3.3% and 3.2% of accounts receivable at December 31, 2016 and 2015, respectively.
4. Cash and Cash Equivalents:
Cash and cash equivalents consist of cash in banks, commercial paper, money-market funds, and other liquid instruments with original maturities of 90 days or less at the time of purchase.
5. Accounts Receivable:
Accounts receivable consisted of the following at December 31:
2016 | 2015 | ||||||
Billed receivables | $ | 216.4 | $ | 216.0 | |||
Unbilled receivables | 50.9 | 37.6 | |||||
Total receivables | 267.3 | 253.6 | |||||
Less allowance for doubtful accounts | (3.4 | ) | (2.6 | ) | |||
Accounts receivable, net | $ | 263.9 | $ | 251.0 | |||
6. Investments:
Available-for-sale securities consisted of the following:
Adjusted Cost | Gross Unrealized Gain | Fair Value | |||||||||
December 31, 2016 | |||||||||||
Registered investment companies | $ | 2.9 | $ | 0.5 | $ | 3.4 | |||||
December 31, 2015 | |||||||||||
Registered investment companies | $ | 3.6 | $ | — | $ | 3.6 | |||||
70
In addition to the available-for-sale securities above, the Company has equity investments in non-public companies in which the Company acquired non-controlling interests and for which no readily determinable market value exists. These securities were accounted for under the cost method in accordance with ASC 323-10-25, The Equity Method of Accounting for Investments in Common Stock. At December 31, 2016 and 2015, the carrying value of such securities was $9.9 million and $8.5 million, respectively, and has been included in “Other assets” in the accompanying consolidated balance sheets.
Realized gain on securities, net, including write downs related to other-than-temporary impairments of available-for-sale securities and other assets, has been included in "Investment income and others, net" in the accompanying consolidated statements of operations. Realized gain on securities, net, was as follows for the years ended December 31:
2016 | 2015 | 2014 | |||||||||
Gross realized gain on sale of securities | $ | 1.9 | $ | 15.7 | $ | 0.3 | |||||
Other-than-temporary impairment of securities | (0.4 | ) | (0.3 | ) | — | ||||||
Realized gain on securities, net | $ | 1.5 | $ | 15.4 | $ | 0.3 | |||||
7. Fair Value Measurements:
Certain assets and liabilities of the Company are reported at fair value in the accompanying consolidated balance sheets. Such assets and liabilities include amounts for both financial and non-financial instruments. To increase consistency and comparability of assets and liabilities recorded at fair value, ASC 820-10 establishes a three-level fair value hierarchy to prioritize the inputs to valuation techniques used to measure fair value. ASC 820-10 requires disclosures detailing the extent to which companies’ measure assets and liabilities at fair value, the methods and assumptions used to measure fair value and the effect of fair value measurements on earnings. In accordance with ASC 820-10, the Company applied the following fair value hierarchy:
Level 1 — Assets or liabilities for which the identical item is traded on an active exchange, such as publicly-traded instruments.
Level 2 — Assets and liabilities valued based on observable market data for similar instruments.
Level 3 — Assets or liabilities for which significant valuation assumptions are not readily observable in the market; instruments valued based on the best available data, some of which is internally-developed, and considers risk premiums that a market participant would require.
The following table provides information for such assets and liabilities as of December 31, 2016 and 2015. The fair values of cash and cash equivalents, accounts receivable, securities accounted for under ASC 323-10-25, accounts payable and accrued liabilities, and short-term debt approximate their carrying amounts because of the short-term nature of these instruments.
The following table summarizes fair value measurements by level for cash equivalents and registered investment companies that were measured at fair value on a recurring basis:
Quoted Prices in Active Markets for Identical Assets (Level 1) | ||||
December 31, 2016 | ||||
Registered investment companies (1) | $ | 3.4 | ||
December 31, 2015 | ||||
Registered investment companies (1) | $ | 3.6 | ||
(1) Registered investment companies are classified as available-for-sale securities and are valued using quoted prices in active
markets multiplied by the number of shares owned.
71
The Company has not elected to carry its long-term debt at fair value. The carrying value of the long-term debt represents amortized cost less unamortized discount and debt issuance costs. The Company assesses the fair value of its long-term debt based on reported market prices if available, and if not, an estimate of interest rates available to the Company for debt with similar features, the Company’s current credit rating and spreads applicable to the Company. The following table summarizes the carrying value and estimated fair value of the long-term debt as of December 31, 2016 and 2015 respectively:
Fair Value Hierarchy | 2016 | 2015 | |||||||||||||||
Carrying Value | Estimated Fair Value | Carrying Value | Estimated Fair Value | ||||||||||||||
Financial instrument not carried at fair value: | |||||||||||||||||
Subordinated promissory note receivable | Level 2 | $ | 84.1 | $ | 76.8 | $ | — | $ | — | ||||||||
Long-term debt excluding capitalized leases | Level 2 | $ | 2,277.3 | $ | 2,402.6 | $ | 2,274.2 | $ | 2,328.1 | ||||||||
8. Fixed Assets
The following is a summary of fixed assets:
Useful Life | Cost | Accumulated Depreciation and Amortization | Net | ||||||||||
December 31, 2016 | |||||||||||||
Furniture and office equipment | 3-10 years | $ | 238.8 | $ | (162.5 | ) | $ | 76.3 | |||||
Leasehold improvements | Lease term | 66.5 | (32.3 | ) | 34.2 | ||||||||
Purchased software | 3 years | 122.8 | (90.9 | ) | 31.9 | ||||||||
Software development costs | 3-7 years | 404.7 | (169.8 | ) | 234.9 | ||||||||
Leased equipment | 3-4 years | 32.8 | (29.8 | ) | 3.0 | ||||||||
Total fixed assets | $ | 865.6 | $ | (485.3 | ) | $ | 380.3 | ||||||
December 31, 2015 | |||||||||||||
Furniture and office equipment | 3-10 years | $ | 211.9 | $ | (138.0 | ) | $ | 73.9 | |||||
Leasehold improvements | Lease term | 66.9 | (27.6 | ) | 39.3 | ||||||||
Purchased software | 3 years | 108.4 | (83.0 | ) | 25.4 | ||||||||
Software development costs | 3-7 years | 332.6 | (124.9 | ) | 207.7 | ||||||||
Leased equipment | 3-4 years | 32.5 | (28.5 | ) | 4.0 | ||||||||
Total fixed assets | $ | 752.3 | $ | (402.0 | ) | $ | 350.3 | ||||||
Depreciation and amortization of fixed assets for the years ended December 31, 2016, 2015 and 2014 were $119.1 million, $96.6 million and $65.4 million, of which $43.6 million, $22.3 million and $11.8 million related to amortization of internal-use software development costs, respectively. Amortization expense related to development of software for sale in accordance with ASC 985-20 was $9.2 million, $9.2 million and $4.5 million for the years ended December 31, 2016, 2015 and 2014, respectively. The Company had unamortized software development costs that had been capitalized in accordance with ASC 985-20 of $25.6 million, $12.7 million and $12.2 million as of December 31, 2016, 2015 and 2014, respectively. Leased equipment includes amounts held under capital leases for automobiles, computer software and computer equipment.
9. Acquisitions
2016 Acquisitions
On November 23, 2016, the Company acquired the net assets of IntelliStance, LLC ("MarketStance"), a provider of market intelligence data and analytics to the property/casualty insurance market, for a net cash purchase price of $8.6 million, of which $0.7 million represents indemnity escrows. MarketStance is within the Company's Risk Assessment segment. MarketStance has built a proprietary analytics model to provide actionable insights on customer's profitability and that enhances the Company's offerings. The preliminary purchase price allocation of the acquisition is combined in the table below.
On November 11, 2016, the Company acquired 100 percent of the stock of The GeoInformation Group Limited ("GeoInformation"), a provider of geographic data solutions, for a net cash purchase price of $6.3 million, of which $0.3
72
million represents indemnity escrows. GeoInformation offers mapping services and geospatial data and analytic solutions to companies and public sector organizations. GeoInformation's resources complement the Company's risk management and predictive analytics capabilities internationally within the Risk Assessment segment. The preliminary purchase price allocation of the acquisition is combined in the table below.
On October 20, 2016, the Company acquired 100 percent of the stock of Analyze Re, Inc. ("Analyze Re"), a software analytics provider for the reinsurance and insurance industries, for a net cash purchase price of $9.5 million, of which $1.0 million represents indemnity escrows. Analyze Re has become part of of the Company's Decision Analytics segment and enables the Company to provide its customers with additional real-time pricing, exposure management, and enterprise portfolio roll-up capabilities. The preliminary purchase price allocation of the acquisition is combined in the table below.
On August 19, 2016, the Company acquired the data and subscriptions business of Quest Offshore Resources, Inc. ("Quest Offshore"), which supplies market intelligence to the offshore oil and gas sector, for a net cash purchase price of $7.2 million, including a holdback of $0.8 million. The data and subscriptions business has become part of Wood Mackenzie Limited ("Wood Mackenzie") within the Decision Analytics segment and complements its existing upstream analysis expertise. The preliminary purchase price allocation of the acquisition is combined in the table below.
On July 26, 2016, the Company acquired 100 percent of the stock of Greentech Media, Inc. (“Greentech Media”), an information services provider for the electricity and renewables sector, for a net cash purchase price of $36.0 million, of which $4.4 million represents indemnity escrows. Greentech Media has become part of Wood Mackenzie within the Decision Analytics segment and enables Wood Mackenzie to provide its customers with market intelligence across several categories, including solar generation, energy storage, and smart grids that react to changes in supply and demand. The preliminary purchase price allocation of the acquisition is combined in the table below.
On April 14, 2016, the Company acquired 100 percent of the stock of Risk Intelligence Ireland Limited ("RII"), a provider of fraud detection, compliance, risk control, and process automation services to the Irish insurance industry, for a net cash purchase price of $6.2 million. RII enhances the ability of the Company's Risk Assessment segment to serve the international insurance market. The preliminary purchase price allocation of the acquisition is combined in the table below.
The preliminary allocations of the purchase price of these acquisitions are subject to revisions as additional information is obtained about the facts and circumstances that existed as of each acquisition date. The revisions may have an impact on the consolidated financial statements. The allocations of the purchase price will be finalized once all information is obtained, but not to exceed one year from the acquisition date. The primary areas of the purchase price allocation that are not yet finalized relate to fixed assets and operating leases, income and non-income taxes, deferred revenues, the valuation of intangible assets acquired, and residual goodwill. The preliminary amounts assigned to intangible assets by type for these acquisitions were based upon the Company's valuation model and historical experiences with entities with similar business characteristics.
The goodwill associated with the stock purchases of GeoInformation, Analyze Re, Greentech Media and RII is not deductible for tax purposes; whereas the goodwill associated with the asset purchases of MarketStance and Quest Offshore is deductible for tax purposes. For the year ended December 31, 2016, the Company incurred transaction costs related to these acquisitions of $1.6 million, which are included within "Selling, general and administrative" expenses in the accompanying consolidated statements of operations.
73
The combined preliminary purchase price allocations of the 2016 acquisitions resulted in the following:
Total | |||
Cash and cash equivalents | $ | 2.1 | |
Accounts receivable | 2.3 | ||
Current assets | 0.2 | ||
Fixed assets | 0.2 | ||
Intangible assets | 27.1 | ||
Goodwill | 60.0 | ||
Other assets | 6.8 | ||
Total assets acquired | 98.7 | ||
Current liabilities | 2.0 | ||
Deferred revenues | 8.0 | ||
Deferred income taxes, net | 4.7 | ||
Other liabilities | 8.1 | ||
Total liabilities assumed | 22.8 | ||
Net assets acquired | 75.9 | ||
Less: Cash acquired | 2.1 | ||
Net cash purchase price | $ | 73.8 | |
2015 Acquisitions
On May 19, 2015, the Company acquired 100 percent of the stock of Wood Mackenzie for a net cash purchase price of $2,889.6 million, including $78.7 million of an indemnity escrow, which the Company financed through a combination of debt and equity offerings, borrowings under the Company's Credit Facility, and cash on hand. Due to the fact that a portion of the purchase price was funded in pounds sterling and the remainder in U.S. dollars, the Company entered into a foreign currency hedging instrument to purchase pounds sterling. The Company recorded a gain on the hedge of $85.2 million within "Gain on derivative instruments" in the accompanying consolidated statements of operations. The proceeds from the gain were utilized to partially fund the acquisition of Wood Mackenzie. Wood Mackenzie is a global provider of data analytics and commercial intelligence for the energy, chemicals, metals and mining verticals. This acquisition advances the Company’s strategy to expand internationally and positions the Company in the global energy market. Wood Mackenzie is included in the energy and specialized markets vertical, formerly named the specialized markets vertical, of the Decision Analytics segment.
On November 6, 2015, the Company acquired 100 percent of the stock of Infield Systems Limited ("Infield"). Infield is a provider of business intelligence, analysis, and research to the oil, gas, and associated marine industries. Infield has become part of Wood Mackenzie and continues to provide services to enhance Wood Mackenzie's upstream and supply chain capabilities in the Decision Analytics segment. The Company paid a net cash purchase price of $14.1 million after a working capital adjustment of $0.3 million. The final purchase price allocation of the acquisition is presented as “Others” in the table below.
On November 20, 2015, the Company acquired 100 percent of the stock of The PCI Group ("PCI"). PCI is a consortium of five specialist companies that offer integrated data and subscriptions research in the chemicals, fibers, films, and plastics sectors. PCI has become part of Wood Mackenzie and continues to provide services to enhance Wood Mackenzie's chemicals capabilities in the Decision Analytics segment. The Company paid a net cash purchase price of $36.8 million after a working capital adjustment of $0.6 million. The final purchase price allocation of the acquisition is presented as “Others” in the table below.
74
The final purchase price allocations of the acquisitions resulted in the following:
Wood Mackenzie | Others | Total | |||||||||
Cash and cash equivalents | $ | 35.4 | $ | 6.0 | $ | 41.4 | |||||
Accounts receivable | 80.3 | 2.0 | 82.3 | ||||||||
Current assets | 97.4 | 0.2 | 97.6 | ||||||||
Fixed assets | 71.9 | 0.3 | 72.2 | ||||||||
Intangible assets | 1,112.0 | 17.2 | 1,129.2 | ||||||||
Goodwill | 2,002.4 | 40.7 | 2,043.1 | ||||||||
Other assets | 2.0 | 5.0 | 7.0 | ||||||||
Total assets acquired | 3,401.4 | 71.4 | 3,472.8 | ||||||||
Current liabilities | 122.0 | 4.1 | 126.1 | ||||||||
Deferred revenues | 142.5 | 2.8 | 145.3 | ||||||||
Deferred income taxes, net | 204.3 | 2.9 | 207.2 | ||||||||
Other liabilities | 7.6 | 4.7 | 12.3 | ||||||||
Total liabilities assumed | 476.4 | 14.5 | 490.9 | ||||||||
Net assets acquired | 2,925.0 | 56.9 | 2,981.9 | ||||||||
Less: Cash acquired | 35.4 | 6.0 | 41.4 | ||||||||
Net cash purchase price | $ | 2,889.6 | $ | 50.9 | $ | 2,940.5 | |||||
The Company determined the fair values of the assets and liabilities of Wood Mackenzie, Infield and PCI with the assistance of valuations performed by third party specialists, discounted cash flow analysis and estimates made by management. The final amounts assigned to intangible assets by type for the acquisitions are summarized in the table below:
Weighted Average Useful Life | Total | |||||
Technology-based | 7 years | $ | 112.0 | |||
Marketing-related | 20 years | 234.1 | ||||
Customer-related | 14 years | 284.4 | ||||
Database-related | 20 years | 498.6 | ||||
Total intangible assets | $ | 1,129.1 | ||||
The impacts of finalization of the purchase accounting for Wood Mackenzie, Infield and PCI during the measurement periods in accordance with ASC 805 were not material to the accompanying consolidated statements of operations for the years ended December 31, 2016 and 2015. The goodwill associated with the stock purchases of PCI, Infield and Wood Mackenzie is not deductible for tax purposes. For the year ended December 31, 2015, the Company incurred transaction costs related to these acquisitions of $27.6 million included within "Selling, general and administrative" expenses and $13.3 million included within "Interest expense" in the accompanying consolidated statements of operations. Refer to Note 11. Goodwill and Intangible Assets for further discussion.
2014 Acquisition
On December 8, 2014, the Company acquired 100% of the stock of Maplecroft.Net Limited (“Maplecroft”), a provider of global risk analytics and advisory services, for a net cash purchase price of $30.1 million, which includes $2.7 million of indemnity escrows held by the seller. Using a proprietary data aggregation and analytical approach, Maplecroft enables its customers to assess, monitor, and forecast a growing range of worldwide risks, including geopolitical and societal risks. Within the Company's Decision Analytics segment, this acquisition establishes the Company's position as a provider of value chain optimization tools, providing comprehensive quantitative risk analytics and platforms by which customers can visualize, quantify, mitigate, and manage risk. Maplecroft became part of Wood Mackenzie in 2015.
The impact of finalization of the purchase accounting for Maplecroft during the measurement period in accordance with ASC 805 was not material to the accompanying consolidated statements of operations for the years ended December 31,
75
2015 and 2014. The goodwill associated with the stock purchase of Maplecroft is not deductible for tax purposes. For the year ended December 31, 2014, the Company incurred transaction costs related to this acquisition of $0.3 million included within “Selling, general and administrative” expenses in the accompanying consolidated statements of operations. Refer to Note 11. Goodwill and Intangible Assets for further discussion.
Acquisition Escrows
Pursuant to the related acquisition agreements, the Company has funded various escrow accounts to satisfy pre-acquisition indemnity and tax claims arising subsequent to the acquisition dates, as well as a portion of the contingent payments. During the year ended December 31, 2016, the Company released $38.0 million of indemnity escrows, of which $37.0 million related to the Wood Mackenzie acquisition. During the year ended December 31, 2015, the Company released $5.1 million and $37.0 million of indemnity escrows related to the MediConnect Global, Inc. acquisition and the Wood Mackenzie acquisition, respectively. At December 31, 2016 and 2015, the current portion of the escrows amounted to $4.1 million and $38.7 million, and the noncurrent portion of the escrows amounted to $6.3 million and $4.6 million, respectively. The current and noncurrent portions of the escrows have been included in “Other current assets” and "Other assets" in the accompanying consolidated balance sheets, respectively.
10. Discontinued Operations:
2016 Discontinued Operation
On June 1, 2016, the Company sold 100 percent of the stock of its healthcare business, Verisk Health ("Verisk Health"), in exchange for a purchase price that consisted of $714.6 million of cash consideration after a working capital adjustment of $5.4 million, a subordinated promissory note with a face value of $100.0 million and an eight year maturity (the "Note"), and other contingent consideration (collectively, the "Sale"). Results of operations for the healthcare business are reported as a discontinued operation for the year ended December 31, 2016 and for all prior periods presented.
The Note has a stated interest rate of 9.0% per annum, increasing to 11.0% per annum at the earlier of specified refinancings or acquisitions, or the fourth anniversary of the closing of the Sale. Interest shall accrue from the closing date and on each anniversary of the Sale until the Note is paid in full on the unpaid principal amount of the Note outstanding at the interest rate in effect (computed on the basis of a 360-day year of twelve 30-day months). On each anniversary of the Sale, accrued interest shall be paid in kind by adding the amount of such accrued interest to the outstanding principal amount of the Note. The issuer of the Note may, at its option at any time prior to the maturity date, prepay any, or all, of the principal amount of the Note, plus accrued but unpaid interest as of the elected prepayment date, without any premium or penalty. There is a mandatory prepayment of the Note as a result of (i) the proceeds of a specified dividend recapitalization received by the issuer, (ii) the consummation of a change of control of the issuer, or (iii) the sale, transfer or other disposition by the parent of the issuer of more than 10.0% of the capital stock of the issuer. As of December 31, 2016, the Company had a receivable of $84.1 million outstanding under the Note. The fair value of the Note is based on management estimates with the assistance of valuations performed by third party specialists, discounted cash flow analysis based on current market conditions and assumptions that the Note would be paid in full at maturity, including accrued interest, with no prepayment election.
The Company also received a 10.0% non-participating interest in the issuer's stock, the exercise value of which will be contingent on the parent of the issuer realizing a specified rate of return on its investment. As of December 31, 2016, the Company had an equity investment of $8.4 million related to such interest accounted for in accordance with ASC 323-10-25. The value of the equity investment is based on management estimates with the assistance of valuations performed by third party specialists. Refer to Note 6. Investments for further discussion.
2014 Discontinued Operation
On March 11, 2014, the Company sold 100 percent of the stock of the Company’s mortgage services business, Interthinx, in exchange for a purchase price of $151.2 million. The cash received was adjusted subsequent to close to reflect final balances of certain working capital accounts and other closing adjustments. The Company recognized income from discontinued operations, net of tax, of $29.2 million during 2014. Results of operations for the mortgage services business are reported as a discontinued operation for the year ended December 31, 2014.
76
The healthcare and mortgage services businesses met the criteria for being reported as discontinued operations and have been segregated from continuing operations. The following table summarizes the results from discontinued operations for the years ended December 31:
2016 | 2015 | 2014 | |||||||||
Revenues from discontinued operations | $ | 112.3 | $ | 307.3 | $ | 327.1 | |||||
Expenses: | |||||||||||
Cost of revenues (exclusive of items shown separately below) | 75.9 | 191.3 | 219.6 | ||||||||
Selling, general and administrative | 36.5 | 34.3 | 42.3 | ||||||||
Depreciation and amortization of fixed assets | 7.1 | 24.0 | 21.1 | ||||||||
Amortization of intangibles assets | 5.9 | 24.4 | 26.9 | ||||||||
Total expenses | 125.4 | 274.0 | 309.9 | ||||||||
Operating income | (13.1 | ) | 33.3 | 17.2 | |||||||
Other income (expense): | |||||||||||
Gain on sale | 265.9 | — | 65.4 | ||||||||
Investment income and others, net | 0.2 | 0.1 | — | ||||||||
Total other income | 266.1 | 0.1 | 65.4 | ||||||||
Income from discontinued operations before income taxes | 253.0 | 33.4 | 82.6 | ||||||||
Provision for income taxes (including tax on the gain of $111.8 million for 2016 and $27.3 million for 2014) | (113.3 | ) | (13.3 | ) | (36.6 | ) | |||||
Income from discontinued operations, net of tax | $ | 139.7 | $ | 20.1 | $ | 46.0 | |||||
The following table summarizes the assets held-for-sale and the liabilities held-for-sale for the healthcare business as of December 31:
2016 | 2015 | ||||||
Accounts receivable, net of allowance for doubtful accounts of $0 and $2.4 million | $ | — | $ | 69.2 | |||
Prepaid expenses | — | 6.6 | |||||
Income taxes receivable | — | 0.3 | |||||
Total current assets held-for-sale | $ | — | $ | 76.1 | |||
Fixed assets, net | $ | — | $ | 67.8 | |||
Intangible assets, net | — | 131.7 | |||||
Goodwill | — | 381.8 | |||||
Other assets | — | 0.6 | |||||
Total noncurrent assets held-for-sale | $ | — | $ | 581.9 | |||
Accounts payable and accrued liabilities | $ | — | $ | 23.6 | |||
Deferred revenues | — | 16.1 | |||||
Total current liabilities held-for-sale | $ | — | $ | 39.7 | |||
Deferred income taxes, net | $ | — | $ | 67.3 | |||
Other liabilities | — | 1.7 | |||||
Total noncurrent liabilities held-for-sale | $ | — | $ | 69.0 | |||
Net cash provided by operating activities and net cash used in investing activities from the healthcare business for the years ended December 31 are presented below:
2016 | 2015 | 2014 | |||||||||
Net cash provided by operating activities | $ | 21.4 | $ | 73.2 | $ | 21.6 | |||||
Net cash used in investing activities | $ | (10.6 | ) | $ | (27.4 | ) | $ | (26.0 | ) | ||
77
The Company has also entered into a transitional service agreement ("TSA") with the buyer of Verisk Health. Under the TSA, the Company provides various services for terms generally up to twelve months from the acquisition date and receives a level of cost reimbursement from the buyer.
11. Goodwill and Intangible Assets:
The Company completed the required annual impairment test as of June 30, 2016, 2015 and 2014, which resulted in no impairment of goodwill. Based on the results of the impairment assessment as of June 30, 2016, the Company determined that the fair value of its reporting units exceeded their respective carrying value. There were no goodwill impairment indicators after the date of the last annual impairment test.
The following is a summary of the change in goodwill from December 31, 2014 through December 31, 2016, both in total and as allocated to the Company’s operating segments:
Risk Assessment | Decision Analytics | Total | |||||||||
Goodwill at December 31, 2014 (1) | $ | 55.5 | $ | 1,151.6 | $ | 1,207.1 | |||||
Acquisitions | — | 2,030.3 | 2,030.3 | ||||||||
Purchase accounting reclassifications | — | 1.6 | 1.6 | ||||||||
Discontinued operations of Verisk Health (Note 10) | — | (381.8 | ) | (381.8 | ) | ||||||
Foreign currency translation adjustment | — | (104.2 | ) | (104.2 | ) | ||||||
Goodwill at December 31, 2015 (1) | 55.5 | 2,697.5 | 2,753.0 | ||||||||
Current year acquisitions | 16.2 | 43.8 | 60.0 | ||||||||
Purchase accounting reclassifications | — | 12.8 | 12.8 | ||||||||
Foreign currency translation adjustment | (0.4 | ) | (247.3 | ) | (247.7 | ) | |||||
Goodwill at December 31, 2016 (1) | $ | 71.3 | $ | 2,506.8 | $ | 2,578.1 | |||||
(1) | These balances are net of accumulated impairment charges of $3.2 million that occurred prior to December 31, 2014. |
The Company’s intangible assets and related accumulated amortization consisted of the following:
Weighted Average Useful Life | Cost | Accumulated Amortization | Net | ||||||||||
December 31, 2016 | |||||||||||||
Technology-based | 7 years | $ | 310.9 | $ | (196.6 | ) | $ | 114.3 | |||||
Marketing-related | 17 years | 227.5 | (47.5 | ) | 180.0 | ||||||||
Contract-based | 6 years | 5.0 | (5.0 | ) | — | ||||||||
Customer-related | 14 years | 483.1 | (128.5 | ) | 354.6 | ||||||||
Database-based | 20 years | 393.9 | (32.0 | ) | 361.9 | ||||||||
Total intangible assets | $ | 1,420.4 | $ | (409.6 | ) | $ | 1,010.8 | ||||||
December 31, 2015 | |||||||||||||
Technology-based | 8 years | $ | 327.8 | $ | (175.8 | ) | $ | 152.0 | |||||
Marketing-related | 16 years | 259.2 | (37.8 | ) | 221.4 | ||||||||
Contract-based | 6 years | 5.0 | (5.0 | ) | — | ||||||||
Customer-related | 13 years | 512.6 | (96.5 | ) | 416.1 | ||||||||
Database-based | 20 years | 470.4 | (14.8 | ) | 455.6 | ||||||||
Total intangible assets | $ | 1,575.0 | $ | (329.9 | ) | $ | 1,245.1 | ||||||
78
Amortization expense related to intangible assets for the years ended December 31, 2016, 2015 and 2014, was approximately $92.5 million, $70.4 million, and $30.1 million, respectively. Estimated amortization expense in future periods through 2022 and thereafter for intangible assets subject to amortization is as follows:
Year | Amount | ||
2017 | $ | 88.1 | |
2018 | 88.0 | ||
2019 | 87.2 | ||
2020 | 85.7 | ||
2021 | 75.4 | ||
2022 and thereafter | 586.4 | ||
Total | $ | 1,010.8 | |
12. Income Taxes:
Domestic and foreign income from continuing operations before income taxes was as follows:
2016 | 2015 | 2014 | |||||||||
U.S. | $ | 626.6 | $ | 573.3 | $ | 557.0 | |||||
Foreign | 27.1 | 110.8 | 5.5 | ||||||||
Total income from continuing operations | $ | 653.7 | $ | 684.1 | $ | 562.5 | |||||
The components of the provision for income taxes from continuing operations for the years ended December 31 were as follows:
2016 | 2015 | 2014 | |||||||||
Current: | |||||||||||
Federal | $ | 171.7 | $ | 168.8 | $ | 158.1 | |||||
State and local | 24.0 | 23.9 | 24.4 | ||||||||
Foreign | 3.6 | 3.3 | 1.5 | ||||||||
Total current provision for income taxes | 199.3 | 196.0 | 184.0 | ||||||||
Deferred: | |||||||||||
Federal | 29.4 | 23.4 | 28.7 | ||||||||
State and local | 4.9 | 1.4 | (4.0 | ) | |||||||
Foreign | (31.4 | ) | (24.2 | ) | (0.2 | ) | |||||
Total deferred provision for income taxes | 2.9 | 0.6 | 24.5 | ||||||||
Provision for income taxes | $ | 202.2 | $ | 196.6 | $ | 208.5 | |||||
The reconciliation between the Company’s effective tax rate on income from continuing operations and the statutory tax rate is as follows for the years ended December 31:
2016 | 2015 | 2014 | ||||||
Federal statutory rate | 35.0 | % | 35.0 | % | 35.0 | % | ||
State and local taxes, net of federal tax benefit | 2.7 | % | 2.6 | % | 2.5 | % | ||
Foreign tax differentials | (4.7 | )% | (6.8 | )% | (0.1 | )% | ||
UK legislative change | (1.0 | )% | (2.1 | )% | — | % | ||
Other | (1.1 | )% | — | % | (0.3 | )% | ||
Effective tax rate for continuing operations | 30.9 | % | 28.7 | % | 37.1 | % | ||
79
The increase in the effective tax rate in 2016 compared to 2015 was primarily due to non-recurring tax benefits related to the Wood Mackenzie acquisition in 2015.
The tax effects of significant items comprising the Company’s deferred tax assets as of December 31 are as follows:
2016 | 2015 | ||||||
Deferred income tax asset: | |||||||
Employee wages, pension and other benefits | $ | 30.1 | $ | 25.7 | |||
Deferred rent | 6.3 | 6.5 | |||||
Net operating loss carryover | 24.3 | 1.9 | |||||
State tax adjustments | 3.2 | 4.3 | |||||
Capital and other unrealized losses | 3.5 | 3.4 | |||||
Other | 9.1 | 10.1 | |||||
Total | 76.5 | 51.9 | |||||
Less valuation allowance | (8.1 | ) | (0.9 | ) | |||
Deferred income tax asset | 68.4 | 51.0 | |||||
Deferred income tax liability: | |||||||
Fixed assets and intangible assets | (355.2 | ) | (375.4 | ) | |||
Other | (19.8 | ) | (4.8 | ) | |||
Deferred income tax liability | (375.0 | ) | (380.2 | ) | |||
Deferred income tax liability, net | $ | (306.6 | ) | $ | (329.2 | ) | |
The net deferred income liability of $306.6 million consists primarily of timing differences involving depreciation and amortization.
The ultimate realization of the deferred tax assets depends on the Company’s ability to generate sufficient taxable income in the future. The Company has provided for a valuation allowance against the deferred tax assets associated with the net operating losses of certain subsidiaries. The Company’s net operating loss carryforwards expire as follows:
Years | Amount | ||
2017-2024 | $ | 1.1 | |
2025-2029 | 0.8 | ||
2030-2036 | 140.6 | ||
Total | $ | 142.5 | |
A valuation allowance has been established based on the Company’s evaluation of the likelihood of utilizing these benefits before they expire. The Company has determined that the generation of future taxable income from certain subsidiaries to fully realize the deferred tax assets is uncertain. Other than these items, the Company has determined, based on the Company’s historical operating performance, that taxable income of the Company will more likely than not be sufficient to fully realize the deferred tax assets.
It is the practice of the Company to permanently reinvest the undistributed earnings of its foreign subsidiaries in those operations. As of December 31, 2016, the Company has not made a provision for U.S. or additional foreign withholdings taxes on approximately $22.5 million of the unremitted earnings. Generally, such amounts become subject to U.S. taxation upon the remittance of dividends and under certain other circumstances. It is not practicable to estimate the amount of deferred tax liability related to investments in these foreign subsidiaries. The Company does not rely on these unremitted earnings as a source of funds for its domestic business as it expects to have sufficient cash flow in the U.S. to fund its U.S. operational and strategic needs.
The Company follows ASC No. 740-10, which prescribes a comprehensive model for the financial statement recognition, measurement, presentation and disclosure of uncertain tax positions taken or expected to be taken in income tax returns. For each tax position, the Company must determine whether it is more likely than not that the position will be sustained upon examination based on the technical merits of the position, including resolution of any related appeals or litigation. A tax
80
position that meets the more likely than not recognition threshold is then measured to determine the amount of benefit to recognize within the financial statements. No benefits may be recognized for tax positions that do not meet the more likely than not threshold. A reconciliation of the beginning and ending amount of unrecognized tax benefit is as follows:
2016 | 2015 | 2014 | |||||||||
Unrecognized tax benefit at January 1 | $ | 14.5 | $ | 10.6 | $ | 9.5 | |||||
Gross increase in tax positions in prior period | 2.5 | 7.1 | 2.7 | ||||||||
Gross decrease in tax positions in prior period | (0.4 | ) | (2.6 | ) | — | ||||||
Gross increase in tax positions in current period | 6.4 | — | — | ||||||||
Settlements | (5.3 | ) | (0.3 | ) | — | ||||||
Lapse of statute of limitations | (0.9 | ) | (0.3 | ) | (1.6 | ) | |||||
Unrecognized tax benefit at December 31 | $ | 16.8 | $ | 14.5 | $ | 10.6 | |||||
Of the total unrecognized tax benefits at December 31, 2016, 2015 and 2014, $13.8 million, $11.4 million and $5.8 million, respectively, represent the amounts that, if recognized, would have a favorable effect on the Company’s effective tax rate in any future periods.
The total gross amount of accrued interest and penalties at December 31, 2016, 2015 and 2014 was $3.4 million, $2.8 million and $2.8 million, respectively. The Company’s practice is to recognize interest and penalties associated with income taxes as a component of “Provision for income taxes” in the accompanying consolidated statements of operations.
The Company does not expect a significant increase in unrecognized benefits related to federal, foreign, or state tax exposures within the coming year. In addition, the Company believes that it is reasonably possible that approximately $0.8 million of its currently remaining unrecognized tax positions, each of which is individually insignificant, may be recognized by the end of 2017 as a result of a combination of audit settlements and lapses of statute of limitations, net of additional uncertain tax positions.
The Company is subject to tax in the U.S. and in various state and foreign jurisdictions. The Company joined by its domestic subsidiaries, files a consolidated income tax return for the Federal income tax purposes. With few exceptions, none of which are material to the Company’s consolidated financial statements at December 31, 2016, the Company is no longer subject to U.S. federal, state, and local or non-US income tax examinations by tax authorities for tax years before 2012. The Internal Revenue Service is conducting an audit of Wood Mackenzie, Inc. for the period January 1, 2014 through May 19, 2015. In New Jersey, the Company is being audited for the years ended December 31, 2011 through 2014 with a statute extension until September 30, 2017. The Company is also under audit in New York for the years ended December 31, 2010 through 2012 with a statute extension until August 25, 2017. The Company is also under audit in Illinois for the year ended December 31, 2014. The Company is also under audit in New York City for the years ended December 31, 2011 through 2013 with a statute extension until January 13, 2018. The Company does not expect that the results of these examinations will have a material effect on its financial position, results of operations or cash flow.
13. Composition of Certain Financial Statement Captions:
The following table presents the components of “Other current assets” and “Accounts payable and accrued liabilities” as of December 31:
2016 | 2015 | ||||||
Other current assets: | |||||||
Acquisition related escrows | $ | 4.1 | $ | 38.7 | |||
Other current assets | 16.2 | 14.2 | |||||
Total other current assets | $ | 20.3 | $ | 52.9 | |||
Accounts payable and accrued liabilities: | |||||||
Accrued salaries, benefits and other related costs | $ | 88.6 | $ | 90.2 | |||
Escrow liabilities | 4.1 | 38.6 | |||||
Trade accounts payable and other accrued expenses | 90.4 | 93.3 | |||||
Total accounts payable and accrued liabilities | $ | 183.1 | $ | 222.1 | |||
81
14. Debt:
The following table presents short-term and long-term debt by issuance as of December 31:
Issuance Date | Maturity Date | 2016 | 2015 | ||||||||
Short-term debt and current portion of long-term debt: | |||||||||||
Syndicated revolving credit facility | Various | Various | $ | 100.0 | $ | 870.0 | |||||
Capital lease obligations | Various | Various | 6.8 | 4.8 | |||||||
Short-term debt and current portion of long-term debt | 106.8 | 874.8 | |||||||||
Long-term debt: | |||||||||||
Senior notes: | |||||||||||
4.000% senior notes, less unamortized discount and debt issuance costs of $10.4 million and $11.6 million, respectively | 5/15/2015 | 6/15/2025 | 889.6 | 888.4 | |||||||
5.500% senior notes, less unamortized discount and debt issuance costs of $5.0 million and $5.2 million, respectively | 5/15/2015 | 6/15/2045 | 345.0 | 344.8 | |||||||
4.125% senior notes, less unamortized discount and debt issuance costs of $3.5 million and $4.1 million, respectively | 9/12/2012 | 9/12/2022 | 346.5 | 345.9 | |||||||
4.875% senior notes, less unamortized discount and debt issuance costs of $1.4 million and $2.0 million, respectively | 12/8/2011 | 1/15/2019 | 248.6 | 248.0 | |||||||
5.80% senior notes, less unamortized discount and debt issuance costs of $2.4 million and $2.9 million, respectively | 4/6/2011 | 5/1/2021 | 447.6 | 447.1 | |||||||
Capital lease obligations | Various | Various | 7.1 | 2.3 | |||||||
Syndicated revolving credit facility debt issuance costs | (4.2 | ) | (5.6 | ) | |||||||
Long-term debt | 2,280.2 | 2,270.9 | |||||||||
Total debt | $ | 2,387.0 | $ | 3,145.7 | |||||||
Accrued interest associated with the Company’s outstanding debt obligations was $17.0 million and $18.6 million as of December 31, 2016 and 2015, respectively, and included in “Accounts payable and accrued liabilities” within the accompanying consolidated balance sheets. Interest expense associated with the Company’s outstanding debt obligations was $120.0 million, $121.4 million and $70.0 million for the years ended December 31, 2016, 2015 and 2014, respectively.
Senior Notes
As of December 31, 2016 and 2015, the Company had senior notes with an aggregate principal amount of $2,300.0 million outstanding. Interest on senior notes is payable semiannually. The discount and debt issuance costs were recorded in "Long-term debt" in the accompanying consolidated balance sheets and these costs will be amortized to "Interest expense" in the accompanying consolidated statements of operations over the life of the respective senior note. The indenture governing senior notes restricts the Company's ability to, among other things, create certain liens, enter into sale/leaseback transactions and consolidate with, sell, lease, convey or otherwise transfer all or substantially all of the Company's assets, or merge with or into, any other person or entity. As of December 31, 2016 and 2015, the Company was in compliance with the financial debt covenants governing the senior notes.
Syndicated Revolving Credit Facility
The Company has a committed senior unsecured Syndicated Revolving Credit Facility (the "Credit Facility") with Bank of America N.A., JP Morgan Chase, N.A., Sun Trust Bank, Wells Fargo Bank N.A., Citizens Bank, N.A., Morgan Stanley, N.A., HSBC Bank USA, N.A., Royal Bank of Canada, BNP Paribas, TD Bank, N.A., The Northern Trust Company, and Capital One N.A. On May 26, 2016, the Company entered into the Second Amendment to the Credit Facility, which reduced the borrowing capacity from $1,750.0 million to $1,500.0 million and amended the pricing grid.
82
The Credit Facility may be used for general corporate purposes, including working capital needs and capital expenditures, acquisitions and the share repurchase program (the "Repurchase Program"). The Credit Facility contains certain financial and other covenants that, among other things, impose certain restrictions on indebtedness, liens, investments, and capital expenditures. These covenants also place restrictions on mergers, asset sales, sale/leaseback transactions, payments between the Company and its subsidiaries, and certain transactions with affiliates. The financial covenants require that, at the end of any fiscal quarter, the Company has a consolidated interest coverage ratio of at least 3.0 to 1.0 and that it maintains, during any period of four fiscal quarters, a consolidated funded debt leverage ratio of 3.5 to 1.0. The Company was in compliance with all financial and other covenants under the Credit Facility as of December 31, 2016. Interest on borrowings under the Credit Facility is payable at an interest rate of LIBOR plus 1.125% to 1.625%, depending upon the consolidated funded debt leverage ratio. A commitment fee on any unused balance is payable periodically and may range from 12.50 to 25.00 basis points based upon the consolidated funded debt leverage ratio. As of December 31, 2016 and 2015, the Company had outstanding borrowings under the Credit Facility of $100.0 million and $870.0 million, respectively. In January and February 2017, the Company repaid a total of $70.0 million of the $100.0 million outstanding borrowings at December 31, 2016 under the Credit Facility.
Private Placements
As of December 31, 2015, the Company had no outstanding private placement debt. The Company prepaid this debt and the contractual costs for the prepayment was $4.8 million, which was recorded to "Interest expense" in the accompanying consolidated statements of operations for the year ended December 31, 2015.
Bridge Financing
On March 10, 2015, in connection with the Company's acquisition of Wood Mackenzie, the Company entered into a commitment letter for a $2,300.0 million 364-day bridge financing arrangement with Bank of America N.A. and Morgan Stanley Bank N.A. acting as joint lead arrangers. This financing arrangement was terminated upon the closing of the acquisition. The Company paid fees associated with this financing arrangement of $9.1 million. Due to the completion of the debt and equity offerings, this arrangement was terminated and the full $9.1 million of fees were recorded to "Interest expense" in the accompanying consolidated statements of operations for the year ended December 31, 2015.
The Company was in compliance with all financial covenants at December 31, 2016 and 2015.
Debt Maturities
The following table reflects the Company’s debt maturities:
Year | Amount | ||
2017 | $ | 106.8 | |
2018 | 6.2 | ||
2019 | 250.7 | ||
2020 | 0.2 | ||
2021 | 450.0 | ||
2022 and thereafter | 1,600.0 | ||
Total | $ | 2,413.9 | |
15. Stockholders’ Equity:
The Company has 2,000,000,000 shares of authorized common stock as of December 31, 2016 and 2015. The common shares have rights to any dividend declared by the board of directors, subject to any preferential or other rights of any outstanding preferred stock, and voting rights to elect all fourteen members of the board of directors.
The Company has 80,000,000 shares of authorized preferred stock, par value $0.001 per share. The preferred shares have preferential rights over the common shares with respect to dividends and net distribution upon liquidation. The Company did not issue any preferred shares as of December 31, 2016.
83
Share Repurchase Program
Since May 2010, the Company has authorized repurchases of up to $2,800.0 million of its common stock through its Repurchase Program, including the additional authorization of $500.0 million announced on December 8, 2016. Since the introduction of share repurchase as a feature of the Company's capital management strategies in 2010, the Company has repurchased shares with an aggregate value of $2,164.0 million. As of December 31, 2016, the Company had $636.0 million available to repurchase shares. The Company has no obligation to repurchase stock under this program and intends to use this authorization as a means of offsetting dilution from the issuance of shares under the ISO 401(k) Savings and Employee Stock Ownership Plan ("KSOP"), the Verisk 2013 Equity Incentive Plan (the "2013 Incentive Plan"), the Verisk 2009 Equity Incentive Plan (the “2009 Incentive Plan”), and the ISO 1996 Incentive Plan (the “1996 Incentive Plan”), while providing flexibility to repurchase additional shares if warranted. This authorization has no expiration date and may be increased, reduced, suspended, or terminated at any time. Shares that are repurchased under the Repurchase Program will be recorded as treasury stock and will be available for future issuance.
In December 2014, the Company entered into an accelerated share repurchase program ("ASR") to repurchase shares of its common stock for an aggregate purchase price of $500.0 million. Upon payment of the aggregate purchase price in December 2014, the Company received an initial delivery of 6,372,472 shares of the Company's common stock. Upon final settlement of the ASR agreement in June 2015, the Company received an additional 809,021shares of the Company's common stock. These repurchases of 7,181,493 shares resulted in a reduction of the outstanding shares used to calculate the weighted average common shares outstanding for basic and diluted earnings per share ("EPS").
During the years ended December 31, 2016 and 2015, the Company repurchased 4,325,548 and 279,453 shares of common stock as part of the Repurchase Program at a weighted average price of $77.06 and $73.20 per share, respectively. The Company utilized cash from operations and borrowings from its Credit Facility to fund these repurchases.
Treasury Stock
As of December 31, 2016, the Company’s treasury stock consisted of 377,087,266 shares of common stock. During the years ended December 31, 2016 and 2015, the Company reissued 1,816,339 and 12,600,228 shares of common stock, under the 2013 Incentive Plan, 2009 Incentive Plan and the 1996 Incentive Plan, from the treasury shares at a weighted average price of $7.23 and $6.59 per share, respectively.
Earnings Per Share
The following is a reconciliation of the numerators and denominators of the basic and diluted EPS computations for the years ended December 31:
2016 | 2015 | 2014 | |||||||||
(In millions, except for share and per share data) | |||||||||||
Numerator used in basic and diluted EPS: | |||||||||||
Income from continuing operations | $ | 451.5 | $ | 487.5 | $ | 354.0 | |||||
Income from discontinued operations | 139.7 | 20.1 | 46.0 | ||||||||
Net income | $ | 591.2 | $ | 507.6 | $ | 400.0 | |||||
Denominator: | |||||||||||
Weighted average number of common shares used in basic EPS | 168,248,304 | 165,090,380 | 165,823,803 | ||||||||
Effect of dilutive shares: | |||||||||||
Potential common stock issuable from stock options and stock awards | 2,923,268 | 3,360,963 | 3,308,620 | ||||||||
Weighted average number of common shares and dilutive potential common shares used in diluted EPS | 171,171,572 | 168,451,343 | 169,132,423 | ||||||||
The potential shares of common stock that were excluded from diluted EPS were 1,724,338, 1,221,301 and 1,633,670 at December 31, 2016, 2015 and 2014, respectively, because the effect of including those potential shares was anti-dilutive.
84
Accumulated Other Comprehensive Losses
The following is a summary of accumulated other comprehensive losses as of December 31:
2016 | 2015 | ||||||
Foreign currency translation adjustment | $ | (561.4 | ) | $ | (165.8 | ) | |
Unrealized gains on available-for-sale securities, net of tax | 0.3 | — | |||||
Pension and postretirement adjustment, net of tax | (89.7 | ) | (76.2 | ) | |||
Accumulated other comprehensive losses | $ | (650.8 | ) | $ | (242.0 | ) | |
85
The before tax and after tax amounts of other comprehensive loss for the years ended December 31, 2016, 2015 and 2014 are summarized below:
Before Tax | Tax Benefit (Expense) | After Tax | |||||||||
December 31, 2016 | |||||||||||
Foreign currency translation adjustment | $ | (395.6 | ) | $ | — | $ | (395.6 | ) | |||
Unrealized holding gain on available-for-sale securities before reclassifications | 0.5 | (0.2 | ) | 0.3 | |||||||
Amount reclassified from accumulated other comprehensive losses (1) | — | — | — | ||||||||
Unrealized holding gain on available-for-sale securities | 0.5 | (0.2 | ) | 0.3 | |||||||
Pension and postretirement adjustment before reclassifications | (18.1 | ) | 6.8 | (11.3 | ) | ||||||
Amortization of net actuarial loss and prior service benefit reclassified from accumulated other comprehensive losses (2) | (3.6 | ) | 1.4 | (2.2 | ) | ||||||
Pension and postretirement adjustment | (21.7 | ) | 8.2 | (13.5 | ) | ||||||
Total other comprehensive loss | $ | (416.8 | ) | $ | 8.0 | $ | (408.8 | ) | |||
December 31, 2015 | |||||||||||
Foreign currency translation adjustment | $ | (162.7 | ) | $ | — | $ | (162.7 | ) | |||
Unrealized holding gain on available-for-sale securities before reclassifications | 0.4 | (0.2 | ) | 0.2 | |||||||
Amount reclassified from accumulated other comprehensive losses (1) | (0.2 | ) | 0.1 | (0.1 | ) | ||||||
Unrealized holding gain on available-for-sale securities | 0.2 | (0.1 | ) | 0.1 | |||||||
Pension and postretirement adjustment before reclassifications | 5.3 | (2.2 | ) | 3.1 | |||||||
Amortization of net actuarial loss and prior service benefit reclassified from accumulated other comprehensive losses (2) | (3.3 | ) | 1.3 | (2.0 | ) | ||||||
Pension and postretirement adjustment | 2.0 | (0.9 | ) | 1.1 | |||||||
Total other comprehensive loss | $ | (160.5 | ) | $ | (1.0 | ) | $ | (161.5 | ) | ||
December 31, 2014 | |||||||||||
Foreign currency translation adjustment | $ | (1.3 | ) | $ | — | $ | (1.3 | ) | |||
Unrealized holding loss on available-for-sale securities before reclassifications | (0.3 | ) | 0.1 | (0.2 | ) | ||||||
Amount reclassified from accumulated other comprehensive losses (1) | 0.3 | (0.1 | ) | 0.2 | |||||||
Unrealized holding loss on available-for-sale securities | — | — | — | ||||||||
Pension and postretirement adjustment before reclassifications | (56.6 | ) | 21.6 | (35.0 | ) | ||||||
Amortization of net actuarial loss and prior service benefit reclassified from accumulated other comprehensive losses (2) | (1.2 | ) | 0.5 | (0.7 | ) | ||||||
Pension and postretirement adjustment | (57.8 | ) | 22.1 | (35.7 | ) | ||||||
Total other comprehensive loss | $ | (59.1 | ) | $ | 22.1 | $ | (37.0 | ) | |||
86
(1) This accumulated other comprehensive losses component, before tax, is included under “Investment income and others, net” in the accompanying consolidated statements of operations.
(2) This accumulated other comprehensive losses component, before tax, is included under “Cost of revenues” and “Selling, general and administrative” in the accompanying consolidated statements of operations. This component is also included in the computation of net periodic benefit (credit) cost (see Note 17 Pension and Postretirement Benefits for additional details).
16. Compensation Plans:
KSOP
The Company has established the KSOP for the benefit of eligible employees in the U.S. and Puerto Rico. The KSOP includes both an employee savings component and an employee stock ownership component. The purpose of the combined plan is to enable the Company’s employees to participate in a tax-deferred savings arrangement under Internal Revenue Service Code Sections 401(a) and 401(k) (the “Code”), and to provide employee equity participation in the Company through the employee stock ownership plan (“ESOP”) accounts.
Under the KSOP, eligible employees may make pre-tax and after-tax cash contributions as a percentage of their compensation, subject to certain limitations under the applicable provisions of the Code. The maximum pre-tax contribution that can be made to the 401(k) account as determined under the provisions of Code Section 401(g) is eighteen thousand dollars for 2016, 2015 and 2014. Certain eligible participants (age 50 and older) may contribute an additional six thousand dollars on a pre-tax basis for 2016, 2015 and 2014. After-tax contributions are limited to 10% of a participant’s compensation. The quarterly matching contributions are primarily equal to 75% of the first 6% of the participant’s contribution.
The Company established the ESOP component as a funding vehicle for the KSOP. The common shares acquired by the KSOP were pledged as collateral under an intercompany loan agreement ("ESOP loan") between the KSOP and Company. The Company accounted for its ESOP in accordance with ASC 718-40, Employee Stock Ownership Plans (“ASC 718-40”) and ASC 480-10, Distinguishing Liabilities from Equity (“ASC 480-10”). As of December 31, 2015, the KSOP no longer had any outstanding ESOP loan balance with the Company. For the years ended December 31, 2015 and 2014, the Company instructed the KSOP to release 145,007 and 249,591 shares of common stock at a weighted average per price of $72.06 and $61.25 to fund the quarterly matching contributions, respectively. Upon maturity of the ESOP loan, the Company issued common stock under the KSOP from the Company's treasury shares to fund the 401(k) matching contributions. For the years ended December 31, 2016 and 2015, the Company issued 181,198 and 47,686 shares of common stock at a weighted average per price of $79.97 and $77.51 to fund the quarterly matching contributions, respectively. The Company also contributed a total of $18.8 million of cash to the KSOP for the year ended December 31, 2016.
In 2005, the Company established the ISO Profit Sharing Plan (the “Profit Sharing Plan”), a defined contribution plan, to replace the qualified pension plan for all eligible employees hired on or after March 1, 2005. The Profit Sharing Plan is a component of the KSOP. Eligible employees participated in the Profit Sharing Plan if they completed 1,000 hours of service each plan year and were employed on December 31 of that year. The Company can make a discretionary contribution to the Profit Sharing Plan based on the annual performance of the Company. Participants vest once they have completed four years and 1,000 hours of service. For the years ended December 31, 2016, 2015 and 2014, there were no profit sharing contributions.
At December 31, 2016, 2015 and 2014, the fair value of Verisk common stock was $81.17, $76.88, and $64.05 per share, respectively. KSOP compensation expense including the discontinued operations for 2016, 2015 and 2014 was approximately $14.5 million, $14.1 million and $15.3 million, respectively.
Equity Compensation Plans
All of the Company’s outstanding stock options and restricted stock are covered under the 2013 Incentive Plan, 2009 Incentive Plan or the 1996 Incentive Plan. Awards under the 2013 Incentive Plan may include one or more of the following types: (i) stock options (both nonqualified and incentive stock options), (ii) stock appreciation rights, (iii) restricted stock, (iv) restricted stock units, (v) performance awards, (vi) other share-based awards, and (vii) cash. Employees, directors and consultants are eligible for awards under the 2013 Incentive Plan. The Company issued common stock under these plans from the Company's treasury shares. The number of shares of common stock available for issuance under the 2013 Incentive Plan is 15,700,000 and such amount shall be reduced on a 1-for-1 basis for every share issued that is subject to an option or stock appreciation right and on a 2.5-for-1 basis for every share issued that is subject to an award other than an option or stock appreciation right. Shares that were subject to an award under the 2013 Incentive Plan that become forfeited, expired or otherwise terminated shall again be available for issuance under the 2013 Incentive Plan on a 1-for-1 basis if the shares were subject to options or stock appreciation rights, and on an 2.5-for-1 basis if the shares were subject to awards other than options
87
or stock appreciation rights. As of December 31, 2016, there were 8,691,044 shares of common stock reserved and available for future issuance. Cash received from stock option exercises including the discontinued operations for the years ended December 31, 2016, 2015 and 2014 was $41.1 million, $38.8 million and $24.6 million, respectively.
The Company has granted equity awards to key employees and directors. The nonqualified stock options have an exercise price equal to the closing price of the Company’s common stock on the grant date, with a ten-year contractual term. The fair value of the restricted stock is determined using the closing price of the Company's common stock on the grant date. The restricted stock is not assignable or transferable until it becomes vested. The Company recognizes the expense of the equity awards over the vesting period. A summary of the equity awards granted for the year ended December 31, 2016 is presented below.
Grant Date | Service Vesting Period | Stock Options | Restricted Stock | Common Stock | |||||||
April 1, 2016 | Four-year graded vesting | 1,219,096 | 244,244 | — | |||||||
April 1, 2016 | Not applicable | — | — | 567 | |||||||
April 4, 2016 | Four-year graded vesting | 2,212 | 415 | — | |||||||
April 18, 2016 | Four-year graded vesting | 1,266 | 239 | — | |||||||
April 25, 2016 | Three-year graded vesting | 3,344 | 946 | — | |||||||
May 2, 2016 | Four-year graded vesting | 12,931 | 2,438 | — | |||||||
May 3, 2016 | Four-year graded vesting | 3,379 | 632 | — | |||||||
June 6, 2016 | Four-year graded vesting | 4,029 | 751 | — | |||||||
July 1, 2016 | Immediate vesting on grant date | 26,417 | 1,112 | — | |||||||
July 1, 2016 | One-year graded vesting | 51,381 | 9,856 | — | |||||||
July 1, 2016 | Not applicable | — | — | 2,471 | |||||||
July 1, 2016 | Four-year graded vesting | 2,539 | 463 | — | |||||||
August 17, 2016 | One-year graded vesting | 8,094 | 1,546 | — | |||||||
October 3, 2016 | Four-year graded vesting | 30,228 | 5,583 | — | |||||||
November 3, 2016 | Three-year graded vesting | — | 24,716 | — | |||||||
1,364,916 | 292,941 | 3,038 | |||||||||
The fair value of the stock options granted was estimated on the date of grant using a Black-Scholes option valuation model that uses the weighted-average assumptions noted in the following table during the years ended December 31:
2016 | 2015 | 2014 | |||||||||
Option pricing model | Black-Scholes | Black-Scholes | Black-Scholes | ||||||||
Expected volatility | 20.26 | % | 19.51 | % | 20.53 | % | |||||
Risk-free interest rate | 1.14 | % | 1.29 | % | 1.48 | % | |||||
Expected term in years | 4.5 | 4.5 | 4.4 | ||||||||
Dividend yield | — | % | — | % | — | % | |||||
Weighted average grant date fair value per stock option | $ | 15.33 | $ | 13.58 | $ | 11.86 | |||||
The expected term for the stock options granted for a majority of the awards granted was estimated based on studies of historical experience and projected exercise behavior. However, for certain awards granted, for which no historical exercise pattern exists, the expected term was estimated using the simplified method. The risk-free interest rate is based on the yield of U.S. Treasury zero coupon securities with a maturity equal to the expected term of the equity award. The volatility factor is calculated using historical daily closing prices over the most recent period that is commensurate with the expected term of the stock option awards. The volatility factor for stock options granted prior to 2014 was based on the average volatility of the Company's peers as the Company did not have a history of stock price sufficient to cover the expected term of those awards. The volatility factor for stock options granted in 2014 and 2015 was based on the volatility of the Company's stock. The expected dividend yield was based on the Company’s expected annual dividend rate on the date of grant.
88
A summary of options outstanding under the Incentive Plan and the Option Plan and changes during the three years then ended is presented below:
Number of Options | Weighted Average Exercise Price Per Share | Aggregate Intrinsic Value | |||||||||
(In millions, except for share and per share data) | |||||||||||
Outstanding at January 1, 2014 | 9,235,320 | $ | 26.67 | $ | 360.6 | ||||||
Granted | 1,242,428 | $ | 59.83 | ||||||||
Exercised | (1,091,746 | ) | $ | 22.29 | $ | 43.9 | |||||
Cancelled or expired | (180,312 | ) | $ | 55.23 | |||||||
Outstanding at December 31, 2014 | 9,205,690 | $ | 31.11 | $ | 303.3 | ||||||
Granted | 1,884,262 | $ | 72.20 | ||||||||
Exercised | (1,739,847 | ) | $ | 23.71 | $ | 87.0 | |||||
Cancelled or expired | (232,372 | ) | $ | 64.05 | |||||||
Outstanding at December 31, 2015 | 9,117,733 | $ | 40.17 | $ | 334.7 | ||||||
Granted | 1,364,916 | $ | 80.23 | ||||||||
Exercised | (1,409,803 | ) | $ | 31.47 | $ | 69.3 | |||||
Cancelled or expired | (301,929 | ) | $ | 73.01 | |||||||
Outstanding at December 31, 2016 | 8,770,917 | $ | 46.67 | $ | 302.6 | ||||||
Options exercisable at December 31, 2016 | 6,148,349 | $ | 35.35 | $ | 281.7 | ||||||
Options exercisable at December 31, 2015 | 6,541,229 | $ | 29.81 | $ | 307.9 | ||||||
A summary of the status of the Company’s nonvested options and changes is presented below:
Number of Options | Weighted Average Grant-Date Fair Value Per Share | ||||||
Nonvested balance at January 1, 2014 | 2,066,231 | $ | 12.61 | ||||
Granted | 1,242,428 | $ | 11.86 | ||||
Vested | (1,082,552 | ) | $ | 11.71 | |||
Cancelled or expired | (180,312 | ) | $ | 13.56 | |||
Nonvested balance at December 31, 2014 | 2,045,795 | $ | 12.55 | ||||
Granted | 1,884,262 | $ | 13.58 | ||||
Vested | (1,121,181 | ) | $ | 13.24 | |||
Cancelled or expired | (232,372 | ) | $ | 13.05 | |||
Nonvested balance at December 31, 2015 | 2,576,504 | $ | 12.95 | ||||
Granted | 1,364,916 | $ | 15.33 | ||||
Vested | (1,016,923 | ) | $ | 12.78 | |||
Cancelled or expired | (301,929 | ) | $ | 14.18 | |||
Nonvested balance at December 31, 2016 | 2,622,568 | $ | 14.12 | ||||
Intrinsic value for stock options is calculated based on the exercise price of the underlying awards and the quoted price of Verisk’s common stock as of the reporting date. For the years ended December 31, 2016, 2015 and 2014, the Company recorded excess tax benefit from exercised stock options of $23.3 million, $29.2 million and $15.9 million, respectively. The Company realized $31.4 million, $40.1 million and $22.6 million of tax benefit within the Company’s tax payments through December 31, 2016, 2015 and 2014, respectively. The Company estimates expected forfeitures of equity awards at the date of grant and recognizes compensation expense only for those awards that the Company expects to vest. The forfeiture assumption is ultimately adjusted to the actual forfeiture rate. Changes in the forfeiture assumptions may impact the total amount of
89
expense ultimately recognized over the requisite service period and may impact the timing of expense recognized over the requisite service period. Stock based compensation expense including the discontinued operations for 2016, 2015 and 2014 was $30.0 million, $30.5 million and $20.3 million, respectively.
A summary of the status of the restricted stock awarded under the 2013 Incentive Plan and changes is presented below:
Number of Shares | Weighted Average Grant Date Fair Value Per Share | ||||||
Outstanding at January 1, 2014 | 396,749 | $ | 52.82 | ||||
Granted | 246,003 | $ | 59.86 | ||||
Vested | (163,280 | ) | $ | 49.94 | |||
Forfeited | (37,162 | ) | $ | 55.53 | |||
Outstanding at December 31, 2014 | 442,310 | $ | 56.84 | ||||
Granted | 350,004 | $ | 72.24 | ||||
Vested | (211,265 | ) | $ | 58.64 | |||
Forfeited | (47,281 | ) | $ | 63.10 | |||
Outstanding at December 31, 2015 | 533,768 | $ | 66.25 | ||||
Granted | 292,941 | $ | 80.27 | ||||
Vested | (230,683 | ) | $ | 64.44 | |||
Forfeited | (58,359 | ) | $ | 72.86 | |||
Outstanding at December 31, 2016 | 537,667 | $ | 73.34 | ||||
For the year ended December 31, 2016, certain employees had restricted stock vesting and covered the aggregate statutory minimum tax withholding of $3.1 million through a net settlement of 38,250 shares.
As of December 31, 2016, there was $61.0 million of total unrecognized compensation cost related to nonvested share-based compensation arrangements granted under the 2013 Incentive Plan and the 2009 Incentive Plan. That cost is expected to be recognized over a weighted-average period of 2.59 years. As of December 31, 2016, there were 2,622,568 and 537,667 nonvested stock options and restricted stock, respectively, of which 2,167,870 and 441,811 are expected to vest. The total grant date fair value of options vested during the years ended December 31, 2016, 2015 and 2014 was $14.2 million, $16.8 million and $12.8 million, respectively. The total grant date fair value of restricted stock vested during the year ended December 31, 2016, 2015 and 2014 was $14.4 million, $16.3 million and $9.8 million, respectively.
The Company also offers eligible employees the opportunity to participate in an employee stock purchase plan ("ESPP"). Under the ESPP, participating employees may authorize payroll deductions of up to 20.0% of their regular base salary and up to 50.0% of their short-term incentive compensation, both of which in total may not exceed twenty-five thousand dollars in any calendar year, to purchase shares of the Company’s common stock at a 5.0% discount of its fair market value at the time of purchase. In accordance with ASC 718, the ESPP is noncompensatory as the purchase discount is 5.0% or less from the fair market value, substantially all employees that meet limited employment qualifications may participate, and it incorporates no option features. During the years ended December 31, 2016, 2015 and 2014, the Company issued 29,867, 25,599 and 26,953 shares of common stock at a weighted average discounted price of $76.75, $70.27 and $57.98, respectively.
17. Pension and Postretirement Benefits:
The Company has a frozen qualified defined benefit pension plan for certain of its employees through membership in the Pension Plan for Insurance Organizations (the “Pension Plan”), a multiple-employer trust. Prior to the freeze, the Company applied a cash balance formula to determine future benefits. Under the cash balance formula, each participant has an account, which was credited annually based on salary rates determined by years of service, as well as the interest earned on the previous year-end cash balance. The Company also has a non-qualified frozen supplemental cash balance plan (“SERP”) for certain employees. The SERP is funded from the general assets of the Company. In 2015, the Pension Plan and the SERP had a plan amendment due to the adoption of the updated mortality table.
90
The Pension Plan’s funding policy is to contribute annually at an amount between the minimum funding requirements set forth in the Employee Retirement Income Security Act of 1974 and the maximum amount that can be deducted for federal income tax purposes. The minimum contribution requirement was and is expected to be $0 in 2016 and 2017, respectively. The Company contributed $1.0 million and $0.9 million to the SERP in 2016 and 2015, respectively, and expects to contribute $0.9 million in 2017.
The Company also provides certain healthcare and life insurance benefits for both active and retired employees. The Postretirement Health and Life Insurance Plan (the “Postretirement Plan”), which has been frozen, is contributory, requiring participants to pay a stated percentage of the premium for coverage. The Company expects to contribute $0 to the Postretirement Plan in 2017.
91
The following table sets forth the changes in the benefit obligations and the plan assets, the (funded) unfunded status of the Pension Plan, SERP and Postretirement Plan, and the amounts recognized in the Company’s consolidated balance sheets at December 31:
Pension Plan and SERP | Postretirement Plan | ||||||||||||||
2016 | 2015 | 2016 | 2015 | ||||||||||||
Change in benefit obligation: | |||||||||||||||
Benefit obligation at January 1 | $ | 419.6 | $ | 471.3 | $ | 15.8 | $ | 18.7 | |||||||
Interest cost | 19.3 | 18.1 | 0.4 | 0.5 | |||||||||||
Actuarial loss (gain) | 28.5 | (44.2 | ) | (1.4 | ) | (1.6 | ) | ||||||||
Plan amendments | — | 3.8 | — | — | |||||||||||
Plan participants’ contributions | — | — | 1.9 | 1.9 | |||||||||||
Benefits paid | (29.0 | ) | (29.4 | ) | (4.4 | ) | (4.4 | ) | |||||||
Federal subsidy on benefits paid | — | — | 0.5 | 0.7 | |||||||||||
Benefit obligation at December 31 | $ | 438.4 | $ | 419.6 | $ | 12.8 | $ | 15.8 | |||||||
Accumulated benefit obligation at December 31 | $ | 438.4 | $ | 419.6 | |||||||||||
Change in plan assets: | |||||||||||||||
Fair value of plan assets at January 1 | $ | 438.6 | $ | 475.3 | $ | 13.0 | $ | 15.2 | |||||||
Actual return on plan assets, net of expenses | 33.9 | (8.2 | ) | 0.1 | — | ||||||||||
Employer contributions, net | 1.0 | 0.9 | — | (0.4 | ) | ||||||||||
Plan participants’ contributions | — | — | 1.9 | 1.9 | |||||||||||
Benefits paid | (29.0 | ) | (29.4 | ) | (4.4 | ) | (4.4 | ) | |||||||
Subsidies received | — | — | 0.5 | 0.7 | |||||||||||
Fair value of plan assets at December 31 | $ | 444.5 | $ | 438.6 | $ | 11.1 | $ | 13.0 | |||||||
(Funded) unfunded status at December 31 | $ | (6.1 | ) | $ | (19.0 | ) | $ | 1.7 | $ | 2.8 | |||||
Amounts recognized in the consolidated balance sheets consist of: | |||||||||||||||
Pension assets, noncurrent | $ | (19.6 | ) | $ | (32.9 | ) | $ | — | $ | — | |||||
Pension, SERP and postretirement benefits, current | 0.9 | 1.0 | — | 0.8 | |||||||||||
Pension, SERP and postretirement benefits, noncurrent | 12.6 | 12.9 | 1.7 | 2.0 | |||||||||||
Total Pension, SERP and Postretirement benefits | $ | (6.1 | ) | $ | (19.0 | ) | $ | 1.7 | $ | 2.8 | |||||
The pre-tax components included within accumulated other comprehensive losses as of December 31 are summarized below:
Pension Plan and SERP | Postretirement Plan | ||||||||||||||
2016 | 2015 | 2016 | 2015 | ||||||||||||
Prior service benefit cost (credit) | $ | 3.7 | $ | 3.8 | $ | (0.8 | ) | $ | (0.9 | ) | |||||
Actuarial losses | 139.6 | 116.4 | 5.2 | 6.7 | |||||||||||
Accumulated other comprehensive losses, pretax | $ | 143.3 | $ | 120.2 | $ | 4.4 | $ | 5.8 | |||||||
92
The pre-tax components of net periodic benefit (credit) cost and the amounts recognized in other comprehensive loss are summarized below for the years ended December 31:
Pension Plan and SERP | Postretirement Plan | ||||||||||||||||||||||
2016 | 2015 | 2014 | 2016 | 2015 | 2014 | ||||||||||||||||||
Interest cost | $ | 19.3 | $ | 18.1 | $ | 19.0 | $ | 0.4 | $ | 0.5 | $ | 0.6 | |||||||||||
Expected return on plan assets | (31.7 | ) | (34.4 | ) | (33.9 | ) | (0.5 | ) | (0.6 | ) | (0.8 | ) | |||||||||||
Amortization of prior service cost (credit) reclassified from accumulated other comprehensive losses | 0.1 | — | — | (0.1 | ) | (0.1 | ) | (0.1 | ) | ||||||||||||||
Amortization of net actuarial loss reclassified from accumulated other comprehensive losses | 3.2 | 2.8 | 0.8 | 0.4 | 0.6 | 0.5 | |||||||||||||||||
Net periodic benefit (credit) cost | (9.1 | ) | (13.5 | ) | (14.1 | ) | 0.2 | 0.4 | 0.2 | ||||||||||||||
Amortization of prior service benefit cost (credit) reclassified from accumulated other comprehensive losses | (0.1 | ) | — | — | 0.1 | 0.1 | 0.1 | ||||||||||||||||
Amortization of actuarial loss reclassified from accumulated other comprehensive losses | — | (0.2 | ) | (0.4 | ) | — | — | — | |||||||||||||||
Net loss recognized reclassified from accumulated other comprehensive losses | (3.2 | ) | (2.6 | ) | (0.4 | ) | (0.4 | ) | — | — | |||||||||||||
Plan amendments | — | 3.8 | — | — | — | — | |||||||||||||||||
Actuarial gain (loss) | 26.4 | (1.5 | ) | 59.3 | (1.1 | ) | (1.6 | ) | (0.8 | ) | |||||||||||||
Total recognized in other comprehensive loss | 23.1 | (0.5 | ) | 58.5 | (1.4 | ) | (1.5 | ) | (0.7 | ) | |||||||||||||
Total recognized in net periodic benefit cost (credit) and other comprehensive loss | $ | 14.0 | $ | (14.0 | ) | $ | 44.4 | $ | (1.2 | ) | $ | (1.1 | ) | $ | (0.5 | ) | |||||||
The estimated amounts in accumulated other comprehensive losses that are expected to be recognized as components of net periodic benefit (credit) cost during 2017 are summarized below:
Pension Plan and SERP | Postretirement Plan | Total | |||||||||
Amortization of prior service benefit cost (credit) | $ | 0.2 | $ | (0.1 | ) | $ | 0.1 | ||||
Amortization of net actuarial loss | 4.0 | 0.4 | 4.4 | ||||||||
Total | $ | 4.2 | $ | 0.3 | $ | 4.5 | |||||
The weighted-average assumptions used to determine benefit obligations as of December 31, 2016 and 2015 and net periodic benefit (credit) cost for the years 2016, 2015 and 2014 are provided below:
Pension Plan and SERP | Postretirement Plan | ||||||||||||||||
Weighted-average assumptions used to determine benefit obligations: | 2016 | 2015 | 2016 | 2015 | |||||||||||||
Discount rate | 3.99 | % | 4.73 | % | 3.25 | % | 3.25 | % | |||||||||
Expected return on plan assets | 7.25 | % | 7.50 | % | 3.00 | % | 4.00 | % | |||||||||
Weighted-average assumptions used to determine net periodic benefit (credit) loss: | 2016 | 2015 | 2014 | 2016 | 2015 | 2014 | |||||||||||
Discount rate | 4.73 | % | 3.99 | % | 4.73 | % | 3.25 | % | 3.00 | % | 3.45 | % | |||||
Expected return on plan assets | 7.50 | % | 7.50 | % | 7.50 | % | 4.00 | % | 4.00 | % | 5.00 | % | |||||
93
The following table presents the estimated future benefit payments for the respective plans. The future benefit payments for the Postretirement Plan are net of the federal Medicare subsidy.
Pension Plan and SERP | Postretirement Plan | ||||||||||||||
Gross Benefit Amount | Gross Benefit Amount | Medicare Subsidy Payments | Net Benefit Amount | ||||||||||||
2017 | $ | 31.1 | $ | 2.2 | $ | (0.4 | ) | $ | 1.8 | ||||||
2018 | $ | 30.3 | $ | 2.0 | $ | (0.3 | ) | $ | 1.7 | ||||||
2019 | $ | 30.8 | $ | 1.8 | $ | (0.3 | ) | $ | 1.5 | ||||||
2020 | $ | 29.9 | $ | 1.6 | $ | (0.3 | ) | $ | 1.3 | ||||||
2021 | $ | 30.2 | $ | 1.4 | $ | (0.3 | ) | $ | 1.1 | ||||||
2022-2026 | $ | 141.3 | $ | 5.0 | $ | (0.5 | ) | $ | 4.5 | ||||||
The healthcare cost trend rate for 2016 was 8.50% gradually decreasing to 5.00% in 2024. Assumed healthcare cost trend rates have a significant effect on the amounts reported for the healthcare plan. A 1.00% change in assumed healthcare cost trend rates would have the following effects:
1% Increase | 1% Decrease | ||||||
Effect of total service and interest cost components of net periodic postretirement healthcare benefit cost | $ | — | $ | — | |||
Effect on the healthcare component of the accumulated postretirement benefit obligation | $ | 0.3 | $ | (0.3 | ) | ||
The subsidy from the Medicare Prescription Drug, Improvement and Modernization Act of 2003 reduced the Company’s accumulated postretirement benefit obligation by approximately $2.1 million and $2.5 million as of December 31, 2016 and 2015, and the net periodic benefit cost by approximately $54.0 thousand, $7.0 thousand and $10.0 thousand in fiscal 2016, 2015 and 2014, respectively.
The expected return on the Pension Plan assets as of December 31, 2016 and 2015 was 7.25% and 7.50%, respectively, which was determined by taking into consideration the Company’s analysis of its actual historical investment returns to a broader long-term forecast after adjusting for the target investment allocation and reflecting the current economic environment. The Company’s investment guidelines target investment allocation of 60% equity securities and 40% debt securities. The Pension Plan assets consist primarily of investments in various fixed income and equity funds. Investment guidelines are established with each investment manager. These guidelines provide the parameters within which the investment managers agree to operate, including criteria that determine eligible and ineligible securities, diversification requirements and credit quality standards, where applicable. Investment managers are prohibited from entering into any speculative hedging transactions. The investment objective is to achieve a maximum total return with strong emphasis on preservation of capital in real terms. The domestic equity portion of the total portfolio should range between 40% and 60%. The international equity portion of the total portfolio should range between 10% and 20%. The fixed income portion of the total portfolio should range between 20% and 40%. The asset allocation at December 31, 2016 and 2015, and target allocation for 2017 by asset category are as follows:
Asset Category | Target Allocation | Percentage of Plan Assets | ||||||
2016 | 2015 | |||||||
Equity securities | 60.00 | % | 61.60 | % | 60.00 | % | ||
Debt securities | 40.00 | % | 37.80 | % | 39.60 | % | ||
Other | — | % | 0.60 | % | 0.40 | % | ||
Total | 100.00 | % | 100.00 | % | 100.00 | % | ||
The Company has used the target investment allocation to derive the expected return as the Company believes this allocation will be retained on an ongoing basis that will be commensurate with the projected cash flows of the plan. The expected return for each investment category within the target investment allocation is developed using average historical rates of return for each targeted investment category, considering the projected cash flow of the Pension Plan. The difference between this expected return and the actual return on plan assets is generally deferred and recognized over subsequent periods
94
through future net periodic benefit costs. The Company believes that the use of the average historical rates of returns is consistent with the timing and amounts of expected contributions to the plans and benefit payments to plan participants. These considerations provide the basis for reasonable assumptions with respect to the expected long-term rate of return on plan assets.
The Company also maintains a voluntary employees beneficiary association plan (the “VEBA Plan”) under Section 501(c)(9) of the Internal Revenue Code to fund the Postretirement Plan. The asset allocation for the VEBA Plan at December 31, 2016 and target allocation for 2017 are 100% in debt securities.
There were no transfers among Levels 1, 2 or 3 for the year ended December 31, 2016. For the year ended December 31, 2015, the Company reclassified $142.1 million of Pension Plan assets from Level 2 to Level 1. These assets, primarily consist of mutual funds that were within the pooled separate accounts, were reinvested in a managed equity account. For assets that were transferred between Level 1 and Level 2 during the year, fair values are ascribed as if the assets had been transferred as of the beginning of the year. Refer to Note 7. Fair Value Measurements for further discussion with respect to fair value hierarchy. The following table summarizes the fair value measurements by level of the Pension Plan and Postretirement Plan assets:
Total | Quoted Prices in Active Markets for Identical Assets (Level 1) | Significant Other Observable Inputs (Level 2) | Significant Unobservable Inputs (Level 3) | ||||||||||||
December 31, 2016 | |||||||||||||||
Equity | |||||||||||||||
Managed equity accounts (1) | $ | 210.2 | $ | 210.2 | $ | — | $ | — | |||||||
Equity — pooled separate account (2) | 63.2 | — | 63.2 | — | |||||||||||
Equity — partnerships (3) | 0.2 | — | — | 0.2 | |||||||||||
Debt | |||||||||||||||
Fixed income manager — pooled separate account (2) | 167.9 | — | 167.9 | — | |||||||||||
Fixed income manager — government securities (4) | 11.1 | 11.1 | — | — | |||||||||||
Other | |||||||||||||||
Cash — pooled separate account (2) | 3.0 | — | 3.0 | — | |||||||||||
Total | $ | 455.6 | $ | 221.3 | $ | 234.1 | $ | 0.2 | |||||||
December 31, 2015 | |||||||||||||||
Equity | |||||||||||||||
Managed equity accounts (1) | $ | 215.6 | $ | 215.6 | $ | — | $ | — | |||||||
Equity — pooled separate account (2) | 47.3 | — | 47.3 | — | |||||||||||
Equity — partnerships (3) | 0.2 | — | — | 0.2 | |||||||||||
Debt | |||||||||||||||
Fixed income manager — pooled separate account (2) | 173.7 | — | 173.7 | — | |||||||||||
Fixed income manager — government securities (4) | 13.0 | 13.0 | — | — | |||||||||||
Other | |||||||||||||||
Cash — pooled separate account (2) | 1.8 | — | 1.8 | — | |||||||||||
Total | $ | 451.6 | $ | 228.6 | $ | 222.8 | $ | 0.2 | |||||||
(1) | Valued at the closing price of shares for domestic stocks within the managed equity accounts, and valued at the net asset value (“NAV”) of shares for mutual funds at either the closing price reported in the active market or based on yields currently available on comparable securities of issuers with similar credit ratings for corporate bonds held by the Pension Plan in these managed accounts. |
95
(2) | The pooled separate accounts invest in domestic and foreign stocks, bonds and mutual funds. The fair values of these stocks, bonds and mutual funds are publicly quoted and are used in determining the NAV of the pooled separate account, which is not publicly quoted. |
(3) | Investments for which readily determinable prices do not exist are valued by the General Partner using either the market or income approach. In establishing the estimated fair value of investments, including those without readily determinable values, the General Partner assumes a reasonable period of time for liquidation of the investment, and takes into consideration the financial condition and operating results of the underlying portfolio company, nature of investment, restrictions on marketability, holding period, market conditions, foreign currency exposures, and other factors the General Partner deems appropriate. |
(4) | The fund invested in the U.S. government, its agencies or instrumentalities or securities that are rated AAA by S&P, AAA by Fitch, or Aaa by Moody’s, including but not limited to mortgage securities such as agency and non-agency collateralized mortgage obligations, and other obligations that are secured by mortgages or mortgage backed securities, and valued at the closing price reported in the active market. |
18. Segment Reporting
ASC 280-10, Disclosures About Segments of an Enterprise and Related Information (“ASC 280-10”), establishes standards for reporting information about operating segments. ASC 280-10 requires that a public business enterprise reports financial and descriptive information about its reportable operating segments. Operating segments are components of an enterprise for which separate financial information is available that is evaluated regularly by the chief operating decision maker (“CODM”) in deciding how to allocate resources and in assessing performance. The Company’s President and CEO is identified as the CODM as defined by ASC 280-10. To align with the internal management of the Company’s business operations based on service offerings, the Company is organized into the following two operating segments, which are also the Company’s reportable segments:
Decision Analytics: The Company develops solutions that its customers use to analyze key processes in managing risk. The Company’s combination of algorithms and analytic methods incorporates its proprietary data to generate solutions. In most cases, the Company’s customers integrate the solutions into their models, formulas or underwriting criteria in order to predict potential loss events, ranging from hurricanes and earthquakes to unanticipated healthcare claims. The Company develops catastrophe and extreme event models and offers solutions covering natural and man-made risks, including acts of terrorism. The Company also develops solutions that allow customers to quantify costs after loss events occur. Fraud solutions include data on claim histories, analysis of claims to find emerging patterns of fraud, and identification of suspicious claims in the insurance and healthcare sectors. The Company further leverages predictive models and proprietary data to advise customers to make asset investment and portfolio allocation decisions in the global energy market. On June 1, 2016 and March 11, 2014, the Company sold its healthcare business, Verisk Health, and mortgage services business, Interthinx, respectively. Results of operations for the healthcare and mortgage services business are reported as discontinued operations for the year ended December 31, 2016 and for all prior periods presented. Refer to Note 10 for more information.
Risk Assessment: The Company is the leading provider of statistical, actuarial and underwriting data for the U.S. P&C insurance industry. The Company’s databases include cleansed and standardized records describing premiums and losses in insurance transactions, casualty and property risk attributes for commercial buildings and their occupants and fire suppression capabilities of municipalities. The Company uses this data to create policy language and proprietary risk classifications that are industry standards and to generate prospective loss cost estimates used to price insurance policies.
The two aforementioned operating segments represent the segments for which separate discrete financial information is available and upon which operating results are regularly evaluated by the CODM in order to assess performance and allocate resources. The Company uses EBITDA as the profitability measure for making decisions regarding ongoing operations. EBITDA is net income before interest expense, provision for income taxes, depreciation and amortization of fixed and intangible assets. Operating expenses consist of direct and indirect costs principally related to personnel, facilities, software license fees, consulting, travel, and third-party information services. Indirect costs are generally allocated to the segments using fixed rates established by management based upon estimated expense contribution levels and other assumptions that management considers reasonable. The Company does not allocate interest expense and provision for income taxes, since these items are not considered in evaluating the segment’s overall operating performance. The CODM does not evaluate the financial performance of each segment based on assets or geographical locations. On a geographic basis, revenues from countries outside of the U.S. accounted for 22.6%, 18.2% and 11.2% of the Company's consolidated revenues for the years ended December 31, 2016, 2015 and 2014,
96
respectively. No individual country outside of the U.S. accounted for 10.0% or more of the Company's consolidated revenues for the years ended December 31, 2016, 2015 and 2014.
The following table provides the Company’s revenue and EBITDA by reportable segment for the years ended December 31, as well as a reconciliation to operating income for all periods presented in the accompanying consolidated statements of operations:
2016 | 2015 | 2014 | |||||||||||||||||||||||||||||||||
Decision Analytics | Risk Assessment | Total | Decision Analytics | Risk Assessment | Total | Decision Analytics | Risk Assessment | Total | |||||||||||||||||||||||||||
Revenues | $ | 1,270.9 | $ | 724.3 | $ | 1,995.2 | $ | 1,072.5 | $ | 688.2 | $ | 1,760.7 | $ | 780.5 | $ | 650.6 | $ | 1,431.1 | |||||||||||||||||
Expenses: | |||||||||||||||||||||||||||||||||||
Cost of revenues (exclusive of items shown separately below) | (490.7 | ) | (223.7 | ) | (714.4 | ) | (412.0 | ) | (200.0 | ) | (612.0 | ) | (307.8 | ) | (208.2 | ) | (516.0 | ) | |||||||||||||||||
Selling, general and administrative | (214.9 | ) | (86.7 | ) | (301.6 | ) | (196.5 | ) | (81.8 | ) | (278.3 | ) | (113.5 | ) | (73.8 | ) | (187.3 | ) | |||||||||||||||||
Investment income and others, net | 4.5 | 1.6 | 6.1 | 16.8 | 0.1 | 16.9 | — | 0.2 | 0.2 | ||||||||||||||||||||||||||
EBITDA from discontinued operations | 266.0 | — | 266.0 | 81.7 | — | 81.7 | 130.6 | — | 130.6 | ||||||||||||||||||||||||||
Gain on derivative instruments | — | — | — | 85.2 | — | 85.2 | — | — | — | ||||||||||||||||||||||||||
EBITDA | 835.8 | 415.5 | 1,251.3 | 647.7 | 406.5 | 1,054.2 | 489.8 | 368.8 | 858.6 | ||||||||||||||||||||||||||
Depreciation and amortization of fixed assets | (91.4 | ) | (27.7 | ) | (119.1 | ) | (70.8 | ) | (25.8 | ) | (96.6 | ) | (44.7 | ) | (20.7 | ) | (65.4 | ) | |||||||||||||||||
Amortization of intangible assets | (91.8 | ) | (0.7 | ) | (92.5 | ) | (70.0 | ) | (0.4 | ) | (70.4 | ) | (29.7 | ) | (0.4 | ) | (30.1 | ) | |||||||||||||||||
Investment income and others, net | (4.5 | ) | (1.6 | ) | (6.1 | ) | (16.8 | ) | (0.1 | ) | (16.9 | ) | — | (0.2 | ) | (0.2 | ) | ||||||||||||||||||
EBITDA from discontinued operations | (266.0 | ) | — | (266.0 | ) | (81.7 | ) | — | (81.7 | ) | (130.6 | ) | — | (130.6 | ) | ||||||||||||||||||||
Gain on derivative instruments | — | — | — | (85.2 | ) | — | (85.2 | ) | — | — | — | ||||||||||||||||||||||||
Operating income | $ | 382.1 | $ | 385.5 | 767.6 | $ | 323.2 | $ | 380.2 | 703.4 | $ | 284.8 | $ | 347.5 | 632.3 | ||||||||||||||||||||
Investment income and others, net | 6.1 | 16.9 | 0.2 | ||||||||||||||||||||||||||||||||
Gain on derivative instruments | — | 85.2 | — | ||||||||||||||||||||||||||||||||
Interest expense | (120.0 | ) | (121.4 | ) | (70.0 | ) | |||||||||||||||||||||||||||||
Income from continuing operations before income taxes | $ | 653.7 | $ | 684.1 | $ | 562.5 | |||||||||||||||||||||||||||||
97
Operating segment revenue by type of service is provided below for the years ended December 31:
2016 | 2015 | 2014 | |||||||||
Decision Analytics | |||||||||||
Insurance | $ | 699.8 | $ | 647.2 | $ | 598.8 | |||||
Energy and specialized markets | 442.8 | 308.8 | 84.9 | ||||||||
Financial services | 128.3 | 116.5 | 96.8 | ||||||||
Total Decision Analytics | 1,270.9 | 1,072.5 | 780.5 | ||||||||
Risk Assessment | |||||||||||
Industry-standard insurance programs | 554.1 | 524.6 | 495.0 | ||||||||
Property-specific rating and underwriting information | 170.2 | 163.6 | 155.6 | ||||||||
Total Risk Assessment | 724.3 | 688.2 | 650.6 | ||||||||
Total consolidated revenues | $ | 1,995.2 | $ | 1,760.7 | $ | 1,431.1 | |||||
Long-lived assets by country are provided below as of December 31:
2016 | 2015 | ||||||
Long-lived assets: | |||||||
U.S. | $ | 1,754.0 | $ | 2,178.1 | |||
U.K. | 2,102.5 | 2,799.4 | |||||
Other countries | 273.8 | 11.6 | |||||
Total long-lived assets | $ | 4,130.3 | $ | 4,989.1 | |||
19. Related Parties:
The Company considers its stockholders that own more than 5% of the outstanding stock within the class to be related parties as defined within ASC 850, Related Party Disclosures. The Company had no related parties owning more than 5% of the entire class of stock as of December 31, 2016 and 2015.
In addition, the Company had no revenues from related parties for the years ended December 31, 2016, 2015 and 2014.
20. Commitments and Contingencies:
The Company’s operations are conducted on leased premises. Approximate minimum rentals under long-term noncancelable leases for all leased premises, computer equipment and automobiles are as follows:
Years Ending | Operating Leases | Capital Leases | |||||
2017 | $ | 40.5 | $ | 7.1 | |||
2018 | 32.0 | 6.4 | |||||
2019 | 33.4 | 0.8 | |||||
2020 | 35.5 | 0.2 | |||||
2021 | 28.9 | — | |||||
2022 and thereafter | 189.5 | — | |||||
Net minimum lease payments | $ | 359.8 | 14.5 | ||||
Less amount representing interest | 0.6 | ||||||
Present value of net minimum lease capital payments | $ | 13.9 | |||||
Most of the leases require payment of property taxes and utilities and, in certain cases, contain renewal options. Operating leases consist of office space. Capital leases consist of computer equipment, office equipment, and leased
98
automobiles. Rent expense on operating leases approximated $39.5 million, $37.3 million and $29.1 million in 2016, 2015 and 2014, respectively.
In addition, the Company is a party to legal proceedings with respect to a variety of matters in the ordinary course of business, including the matters described below. With respect to ongoing matters, the Company is unable, at the present time, to determine the ultimate resolution of or provide a reasonable estimate of the range of possible loss attributable to these matters or the impact they may have on the Company’s results of operations, financial position or cash flows. This is primarily because the matters are generally in early stages and discovery has either not commenced or been completed. Although the Company believes it has strong defenses and intends to vigorously defend these matters, the Company could in the future incur judgments or enter into settlements of claims that could have a material adverse effect on its results of operations, financial position or cash flows.
Intellicorp Records, Inc. Litigation
On September 9, 2015, the Company was served with a nationwide putative class action complaint filed in the Court of Common Pleas, Cuyahoga County in Ohio naming the Company’s subsidiary Intellicorp Records, Inc. (“Intellicorp.”) titled Sherri Legrand v. Intellicorp Records, Inc. and The Cato Corporation et al. Defendants removed the case to the United States District Court for the Northern District of Ohio on October 8, 2015. Plaintiffs filed their First Amended Class Action Complaint on November 5, 2015 (“Amended Complaint”), which like the prior complaint claims violations of the Fair Credit Reporting Act ("FCRA") and alleges two putative class claims against Intellicorp, namely (i) a section 1681k(a) claim on behalf of all individuals who were the subjects of consumer reports furnished by Intellicorp which contained public record information in the “Government Sanctions” section of the report on or after September 4, 2013 and continuing through the date the class list is prepared and (ii) a section 1681e(b) claim on behalf of all individuals who were the subjects of consumer reports furnished by Intellicorp which contained public record information in the “Government Sanctions” section of the report where the address or social security number of the subject of the report do not match the social security number or address contained in the government database on or after September 4, 2013 and continuing through the date the class list is prepared. Count I of the Amended Complaint alleges that defendant Cato violated the FCRA by procuring consumer reports on the plaintiff and other class members without making the stand-alone disclosure required by FCRA section 1681b(b)(2)(A)(i). Counts II and III allege that Intellicorp violated the FCRA section 1681e (b) by failing to follow reasonable procedures to assure maximum accuracy of the adverse information included in its consumer reports and FCRA section 1681k (a) by failing to maintain strict procedures to assure that the public record information reported which was likely to have an adverse effect on the consumer was complete and up to date, respectively. The Amended Complaint alleges that defendants acted willfully and seeks statutory damages for the classes in an amount not less than one hundred dollars and not more than one thousand dollars per violation, punitive damages, equitable relief, costs and attorney’s fees.
At this time, it is not possible to determine the ultimate resolution of, or estimate the liability related to this matter.
On February 1, 2016, the Company was served with a nationwide putative class action complaint filed in the United States District Court for the Eastern District of North Carolina naming Intellicorp. The complaint titled Frank DiSalvo v. Intellicorp Records, Inc. claims violations of the FCRA and alleges a section 1681b(b)(1) claim on behalf of all individuals residing in the United States who were the subjects of consumer reports furnished by Intellicorp for employment purposes within the period prescribed by the FCRA, 15 U.S.C. Section 1681p without first obtaining from the user of the report a certification that such user had complied with the obligations under Section 1681b(b)(2) as to the subject of the consumer report. The class complaint alleges that Intellicorp violated the FCRA section 1681b(b)(1) by failing to obtain the required specific certification from its customers to whom Intellicorp furnished consumer reports as to each consumer report provided before providing the specific consumer report that was the subject of the certification. The complaint alleges that the violations were willful or in the alternative negligent and seeks statutory damages for the class in an amount not less than one hundred dollars and not more than one thousand dollars per violation, punitive damages, equitable relief, costs and attorney’s fees. On April 18, 2016, the parties filed a joint motion to stay all proceedings pending the resolution of the United States Supreme Court’s decision in Spokeo v. Robins, No. 13-1339. After Spokeo was decided on May 16, 2016, plaintiffs voluntarily dismissed their federal court complaint and filed a virtually identical complaint in Ohio State court on May 27, 2016. Defendants removed that complaint to the United States District Court for the Northern District of Ohio on July 1, 2016, which on defendant’s motion dismissed the complaint for failure to allege Article III standing and remanded the case to Ohio state court on September 27, 2016. The parties agreed to resolve this matter for a non-material amount in the Settlement Agreement and Release executed on November 30, 2016.
Xactware Solutions, Inc. Patent Litigation
99
On October 8, 2015, the Company was served with a summons and complaint in an action titled Eagle View Technologies, Inc. and Pictometry International Group, Inc. v. Xactware Solutions, Inc. and Verisk Analytics, Inc. filed in the United States District Court for the District of New Jersey. The complaint alleges that the Company’s Roof InSight, Property InSight and Aerial Sketch products infringe seven patents owned by Eagle View and Pictometry namely, Patent Nos. 436, 840, 152, 880, 770, 732 and 454 (collectively the “Patents-in-Suit”) On November 30, 2015, plaintiffs filed a First Amended Complaint (“First Amended Complaint”) adding Patent Nos. 376 and 737 to the Patents in Suit. The First Amended Complaint seeks an entry of judgment by the Court that defendants have and continue to directly infringe and/or indirectly infringe, by way of inducement the Patents in Suit, permanent injunctive relief, damages, costs and attorney’s fees.
At this time, it is not possible to determine the ultimate resolution of, or estimate the liability related to this matter.
Interthinx, Inc. Litigation
On April 20, 2015, the Company was served with a putative class action titled John Weber v. Interthinx, Inc. and Verisk Analytics, Inc. The plaintiff, a former employee of the Company’s former subsidiary Interthinx, Inc. in Missouri, filed the class action complaint in the United States District Court for the Eastern District of Missouri on behalf of all review appraisers and individuals holding comparable positions with different titles who were employed by Interthinx for the last three years nationwide and who were not paid overtime wages. The class complaint claims that the review appraiser employees were misclassified as exempt employees and, as a result, were denied certain wages and benefits that would have been received if they were properly classified as non-exempt employees. It pleads a Collective Action under section 216(b) of the Fair Labor Standards Act for unpaid overtime and seeks overtime wages, liquidated damages, declaratory relief, interest, costs and attorneys’ fees. On March 11, 2014, the Company sold 100 percent of the stock of Interthinx, Inc. The parties agreed to resolve this matter with the Company’s contribution of a non-material amount in the Class Action Settlement Agreement executed on November 8, 2016. The hearing for the preliminary approval of the settlement is scheduled for February 21, 2017.
Insurance Services Office, Inc. Litigation
On August 1, 2014, the Company was served with an Amended Complaint filed in the United States District Court for the District of Colorado titled Snyder, et. al. v. ACORD Corp., et al. The action is brought by nineteen individual plaintiffs, on their own behalf and on behalf of a putative class, against more than 120 defendants, including the Company and ISO. Except for the Company, ISO and the defendant Acord Corporation, which provides standard forms to assist in insurance transactions, most of the other defendants are property and casualty insurance companies that plaintiffs claim conspired to underpay property damage claims. Plaintiffs claim that the Company and ISO, along with all of the other defendants, violated state and federal antitrust and racketeering laws as well as state common law. On September 8, 2014, the Court entered an Order striking the Amended Complaint and granting leave to the plaintiffs to file a new complaint. On October 13, 2014, plaintiffs filed their Second Amended Complaint, which was re-filed by plaintiffs to correct errors as the Third Amended Complaint. The Third Amended Complaint similarly alleges that the defendants conspired to underpay property damage claims, but does not specifically allege what role the Company or ISO played in the alleged conspiracy. It claims that the Company and ISO, along with all of the other defendants, violated state and federal antitrust and racketeering laws as well as state common law, and seeks all available relief including, injunctive, statutory, actual and punitive damages as well as attorneys’ fees. On January 15, 2016, the Court granted defendants’ motions to dismiss all claims asserted in the Third Amended Complaint. Plaintiffs filed a motion for reconsideration of this dismissal on February 16, 2016. The Court granted defendants’ motion to strike the motion for reconsideration on March 2, 2016 and gave plaintiffs leave to file another motion for reconsideration in accordance with the rules which plaintiffs filed on March 11, 2016 and, which was denied by the Court on April 25, 2016. On April 1, 2016, plaintiffs also filed a Notice of Appeal of the Court’s January 15, 2016 Order, which dismissed all claims in the Third Amended Complaint. Plaintiffs also filed an appeal of the Court’s denial of the motion for reconsideration, which the Court of Appeals for the 10th Circuit consolidated with the appeal of the Court’s January 15, 2016 dismissal. Appellants filed their brief in support of the consolidated appeal on July 21, 2016 and Appellees filed their brief in response on September 21, 2016.
At this time, it is not possible to determine the ultimate resolution of, or estimate the liability related to this matter.
On February 19, 2016, the Company was served with a notice of a summons and complaint filed on January 29, 2016 against ISO in the U.S. District Court for the District of Connecticut titled Halloran et al. v. Harleysville Preferred Insurance Co. et al. As alleged in the First Amended Complaint, the putative class action is brought by four policyholders on behalf of a class of similarly situated policyholders in eastern Connecticut who allege that their homeowner’s insurance carriers have denied or will deny their claims for damage to their homes caused by defective concrete. The lawsuit alleges a breach of contract claim against certain insurers and seeks declaratory relief as to more than 100 other insurers. It also alleges that ISO as the drafter of the standardized policy language at issue violated the Connecticut Unfair Trade Practices ("CUTPA") and the Connecticut Unfair Insurance Practices Act ("CUIPA"). The plaintiffs ask that the Court certify a class of persons similarly
100
situated and seek relief in the form of the cost for the replacement of their concrete foundations and a declaratory judgment that all of the defendant insurance carriers are obligated to provide coverage for claims resulting from the defective concrete as well as, attorneys’ fees, costs and interest.
On March 17, 2016 plaintiffs filed their first amended complaint asserting federal jurisdiction under the Class Action Fairness Act, adding a number of insurer defendants and amending their damages claim to include punitive damages. After defendants indicated that they would be filing motions to dismiss the first amended complaint at a Rule 16 Conference on April 12, 2016, the Court gave plaintiffs until May 6, 2016 to move for leave to file a second amended complaint. On May 6, 2016, plaintiffs filed a Motion to amend the first amended complaint with a proposed second amended complaint, which did not name ISO or the Company as a defendant. No opposition was filed to the motion to amend, which was granted on October 4, 2016. Instead of filing a second amended complaint, plaintiffs, in a joint motion for the modification of the case schedule filed on October 13, 2016, expressed their intention to move for leave to file a third amended complaint in order to drop certain additional defendants and to add other named plaintiffs. Plaintiffs’ motion for leave to file a third amended complaint which does not name the Company as a defendant is pending before the District Court.
At this time, it is not possible to determine the ultimate resolution of, or estimate the liability related to this matter.
21. Subsequent Events:
On February 16, 2017, the Company completed the acquisition of Healix International Holdings Limited (“Healix”), a leader in automated medical risk assessment for the travel insurance industry, for a net cash purchase price of $53.8 million, which was funded from the general assets of the Company. The Company used $7.5 million of the net cash purchase price to fund the indemnity escrows. The cash paid will be adjusted subsequent to close to reflect final balances of certain working capital accounts and other closing adjustments. Healix will become part of Risk Assessment segment and expand the Company's offerings for the global insurance industry, providing solutions that are embedded with customer workflows and helping underwrite medical coverage for travelers with greater speed, accuracy and efficiency. Due to the limited time since the acquisition date and limitations on access to Healix information prior to the acquisition date, the initial accounting for the business combination is incomplete at this time. As a result, the Company is unable to provide amounts recognized as of the acquisition date for major classes of assets and liabilities acquired and resulting from the transaction, including the information required for contingencies, intangible assets and goodwill. This information is expected to be included in the quarterly report on Form 10-Q for the three months ending March 31, 2017.
**************
101
Schedule II
Valuation and Qualifying Accounts and Reserves
For the Years Ended December 31, 2016, 2015 and 2014
(In millions)
Description | Balance at Beginning of Year (1) | Charged to Costs and Expenses(2) | Deductions— Write-offs(3) | Balance at End of Year | |||||||||||
Year ended December 31, 2016 | |||||||||||||||
Allowance for doubtful accounts | $ | 2.6 | $ | 2.2 | $ | (1.4 | ) | $ | 3.4 | ||||||
Valuation allowance for income taxes | $ | 0.9 | $ | 7.2 | $ | — | $ | 8.1 | |||||||
Year ended December 31, 2015 | |||||||||||||||
Allowance for doubtful accounts | $ | 3.2 | $ | 0.8 | $ | (1.4 | ) | $ | 2.6 | ||||||
Valuation allowance for income taxes | $ | 0.7 | $ | 0.2 | $ | — | $ | 0.9 | |||||||
Year Ended December 31, 2014 | |||||||||||||||
Allowance for doubtful accounts | $ | 2.7 | $ | 1.3 | $ | (0.8 | ) | $ | 3.2 | ||||||
Valuation allowance for income taxes | $ | 0.7 | $ | — | $ | — | $ | 0.7 | |||||||
(1) | Excludes discontinued operations |
(2) | Primarily additional reserves for bad debts |
(3) | Primarily accounts receivable balances written off, net of recoveries, and the expiration of loss carryforwards |
102
SIGNATURES
Pursuant to the requirements of Section 13 or 15(d) of the Securities Exchange Act of 1934, the registrant has duly caused this report to be signed on its behalf by the undersigned, thereunto duly authorized, on February 21, 2017.
VERISK ANALYTICS, INC. (Registrant) | |
/S/ Scott G. Stephenson | |
Scott G. Stephenson | |
President and Chief Executive Officer | |
Pursuant to the requirements of the Securities Exchange Act of 1934, this report has been signed below by the following persons on behalf of the registrant and in the capacities indicated on February 21, 2017.
Signature | Capacity | |
/S/ SCOTT G. STEPHENSON | President and Chief Executive Officer (principal executive officer and director) | |
Scott G. Stephenson | ||
/S/ EVA F. HUSTON | Senior Vice President and Chief Financial Officer (principal financial officer) | |
Eva F. Huston | ||
/S/ GLENN A. McCONNELL | Senior Vice President and Controller (principal accounting officer) | |
Glenn A. McConnell | ||
/S/ FRANK J. COYNE | Lead Independent Director | |
Frank J. Coyne | ||
/S/ ANNELL BAY | Director | |
Annell R. Bay | ||
/S/ J. HYATT BROWN | Director | |
J. Hyatt Brown | ||
/S/ CHRISTOPHER M. FOSKETT | Director | |
Christopher M. Foskett | ||
/S/ BRUCE E. HANSEN | Director | |
Bruce E. Hansen | ||
/S/ KATHLEEN HOGENSON | Director | |
Kathleen A. Hogenson | ||
/S/ CONSTANTINE P. IORDANOU | Director | |
Constantine P. Iordanou | ||
/S/ JOHN F. LEHMAN, JR. | Director | |
John F. Lehman, Jr. | ||
/S/ SAMUEL G. LISS | Director | |
Samuel G. Liss | ||
/S/ ANDREW G. MILLS | Director | |
Andrew G. Mills | ||
/S/ THOMAS F. MOTAMED | Director | |
Thomas F. Motamed | ||
/S/ THERESE M. VAUGHAN | Director | |
Therese M. Vaughan | ||
/S/ DAVID B. WRIGHT | Director | |
David B. Wright | ||
103
EXHIBIT INDEX
Exhibit Number | Description |
2.1 | Deed, dated as of March 10, 2015, among Verisk Analytics, Inc. and the sellers named therein, incorporated herein by reference to Exhibit 2.1 to the Company's Current Report on Form 8-K, dated March 11, 2015. |
3.1 | Amended and Restated Certificate of Incorporation, incorporated herein by reference to Exhibit 3.1 to the Company’s Current Report on Form 8-K, dated May 29, 2015. |
3.2 | Amended and Restated By-Laws, incorporated herein by reference to Exhibit 3.2 to the Company’s Current Report on Form 8-K, dated May 29, 2015. |
4.1 | Form of Common Stock Certificate, incorporated herein by reference to Exhibit 4.1 to Amendment No. 6 to the Company’s Registration Statement on Form S-1, dated September 21, 2009. |
4.2 | Senior Notes Indenture, dated as of April 6, 2011, among Verisk Analytics, Inc., the guarantors named therein and Wells Fargo Bank, National Association, as Trustee, incorporated herein by reference to Exhibit 4.1 to the Company’s Current Report on Form 8-K, dated April 6, 2011. |
4.3 | First Supplemental Indenture, dated as of April 6, 2011, among Verisk Analytics, Inc., the guarantors named therein and Wells Fargo Bank, National Association, as Trustee, incorporated herein by reference to Exhibit 4.2 to the Company’s Current Report on Form 8-K, dated April 6, 2011. |
4.4 | Second Supplemental Indenture, dated as of December 8, 2011, among Verisk Analytics, Inc., the guarantors named therein and Wells Fargo Bank, National Association, as Trustee, incorporated herein by reference to Exhibit 4.2 to the Company’s Current Report on Form 8-K, dated December 8, 2011. |
4.5 | Third Supplemental Indenture, dated as of September 12, 2012, among Verisk Analytics, Inc., the guarantors named therein and Wells Fargo Bank, National Association, as Trustee, incorporated herein by reference to Exhibit 4.2 to the Company’s Current Report on Form 8-K, dated September 12, 2012. |
4.6 | Fifth Supplemental Indenture, dated as of May 15, 2015, between Verisk Analytics, Inc. and Wells Fargo Bank, National Association, as Trustee, incorporated herein by reference to Exhibit 4.2 to the Company’s Current Report on Form 8-K, dated May 15, 2015. |
10.1 | 401(k) Savings Plan and Employee Stock Ownership Plan, incorporated herein by reference to Exhibit 10.1 to the Company’s Registration Statement on Form S-1, dated August 12, 2008. |
10.2 | Verisk Analytics, Inc. 2009 Equity Incentive Plan, incorporated herein by reference to Exhibit 10.2 to Amendment No. 6 to the Company’s Registration Statement on Form S-1, dated September 21, 2009. |
10.3 | Form of Letter Agreement, incorporated herein by reference to Exhibit 10.3 to Amendment No. 1 to the Company’s Registration Statement on Form S-1, dated October 7, 2008. |
10.4 | Form of Master License Agreement and Participation Supplement, incorporated herein by reference to Exhibit 10.4 to Amendment No. 1 to the Company’s Registration Statement on Form S-1, dated October 7, 2008. |
104
Exhibit Number | Description |
10.5 | Schedule of Master License Agreements Substantially Identical in All Material Respects to the Form of Master License Agreement and Participation Supplement, incorporated herein by reference to Exhibit 10.5 to Amendment No. 2 to the Company’s Registration Statement on Form S-1, dated November 20, 2008. |
10.6 | Form of Change of Control Severance Agreement, incorporated herein by reference to Exhibit 10.8 to Amendment No. 6 to the Company’s Registration Statement on Form S-1, dated September 21, 2009. |
10.7 | Insurance Services Office, Inc. 1996 Incentive Plan and Form of Stock Option Agreement thereunder, incorporated herein by reference to Exhibit 10.9 to Amendment No. 7 to the Company’s Registration Statement on Form S-1, dated September 29, 2009. |
10.8 | Form of Stock Option Award Agreement under the Verisk Analytics, Inc. 2009 Equity Incentive Plan, incorporated herein by reference to Exhibit 10.2 to the Company’s Quarterly Report on Form 10-Q, dated November 16, 2009. |
10.9 | Insurance Services Office, Inc. Supplemental Cash Balance Plan dated January 1, 2009 as amended by the Amendment to the Insurance Services Office, Inc. Supplemental Cash Balance Plan dated February 10, 2012 incorporated by reference to Exhibit 10.13 to the Company's annual report on Form 10-K dated February 25, 2014. |
10.10 | Insurance Services Office, Inc. Supplemental Executive Retirement Savings Plan dated January 1, 2009 incorporated by reference to Exhibit 10.14 to the Company's annual report on Form 10-K dated February 25, 2014. |
10.11 | Verisk Analytics, Inc. 2013 Equity Incentive Plan, incorporated herein by reference to Appendix A to the Company's Proxy Statement on Schedule 14A, dated April 1, 2013. |
10.12 | Form of Stock Option Award Agreement under Verisk Analytics, Inc. 2013 Equity Incentive Plan, incorporated herein by reference to Exhibit 99.2 to Company’s Registration Statement on Form S-8 dated May 15, 2013. |
10.13 | Form of Restricted Stock Award Agreement under Verisk Analytics, Inc. 2013 Equity Incentive Plan, incorporated herein by reference to Exhibit 99.3 to Company’s Registration Statement on Form S-8 dated May 15, 2013. |
10.14 | Second Amended and Restated Credit Agreement dated April 22, 2015 among Verisk Analytics, Inc., as borrower, and the lenders and agents party thereto, incorporated herein by reference to Exhibit 10.1 to the Company’s Current Report on Form 8-K dated April 24, 2015. |
10.15 | First Amendment to Second Amended and Restated Credit Agreement dated July 24, 2015 among Verisk Analytics, Inc., as borrower, and the lenders and agents party thereto, incorporated herein by reference to Exhibit 10.2 to the Company’s quarterly report on Form 10-Q dated July 28, 2015. |
10.16 | Second Amendment to the Second Amended and Restated Credit Agreement dated May 26, 2016 among Verisk Analytics, Inc., as borrower, and the lenders and agents party thereto, incorporated herein by reference to Exhibit 10.1 to the Company’s Current Report on Form 8-K dated May 26, 2016. |
10.17 | Agreement of Purchase and Sale dated April 25, 2016 among Verisk Analytics, Inc., Argus Information and Advisory Services, LLC, Verisk Health, Inc., MediConnect Global, Inc., VCVH Holding Corp., VCVH Holdings LLC, VCVH Intermediate Holding Corp. and VCVH Holding II Corp,. incorporated herein by reference to Exhibit 10.1 to the Company’s Current Report on Form 8-K dated April 28, 2016. |
105
Exhibit Number | Description |
21.1 | Subsidiaries of the Registrant.* |
23.1 | Consent of Deloitte & Touche LLP.* |
31.1 | Certification of the Chief Executive Officer of Verisk Analytics, Inc. pursuant to Rule 13a-14 under the Securities Exchange Act of 1934.* |
31.2 | Certification of the Chief Financial Officer of Verisk Analytics, Inc. pursuant to Rule 13a-14 under the Securities Exchange Act of 1934.* |
32.1 | Certification of the Chief Executive Officer and Chief Financial Officer of Verisk Analytics, Inc. pursuant to 18 U.S.C. Section 1350 as Adopted Pursuant to Section 906 of the Sarbanes-Oxley Act of 2002.* |
101.INS | XBRL Instance Document.* |
101.SCH | XBRL Taxonomy Extension Schema.* |
101.CAL | XBRL Taxonomy Extension Calculation Linkbase.* |
101.DEF | XBRL Taxonomy Definition Linkbase.* |
101.LAB | XBRL Taxonomy Extension Label Linkbase.* |
101.PRE | XBRL Taxonomy Extension Presentation Linkbase.* |
* | Filed herewith. |
106