Attached files
| file | filename |
|---|---|
| 8-K - 8-K - PROVIDENT FINANCIAL SERVICES INC | a8k042618shareholderpresen.htm |
ANNUAL MEETING
OF STOCKHOLDERS
APRIL 26, 2018
RENAISSANCE WOODBRIDGE HOTEL
1
2
FORWARD-LOOKING STATEMENT
Certain statements contained herein are "forward-looking statements" within the meaning of Section
27A of the Securities Act of 1933 and Section 21E of the Securities Exchange Act of 1934. Such
forward-looking statements may be identified by reference to a future period or periods, or by the
use of forward-looking terminology, such as "may," "will," "believe," "expect," "estimate,"
"anticipate," "continue," or similar terms or variations on those terms, or the negative of those terms.
Forward-looking statements are subject to numerous risks and uncertainties, including, but not
limited to, those related to the economic environment, particularly in the market areas in which
Provident Financial Services, Inc. (the “Company”) operates, competitive products and pricing, fiscal
and monetary policies of the U.S. Government, changes in accounting policies and practices that may
be adopted by the regulatory agencies and the accounting standards setters, changes in government
regulations affecting financial institutions, including regulatory fees and capital requirements,
changes in prevailing interest rates, acquisitions and the integration of acquired businesses, credit risk
management, asset-liability management, the financial and securities markets and the availability of
and costs associated with sources of liquidity.
The Company cautions readers not to place undue reliance on any such forward-looking statements,
which speak only as of the date made. The Company also advises readers that the factors listed above
could affect the Company's financial performance and could cause the Company's actual results for
future periods to differ materially from any opinions or statements expressed with respect to future
periods in any current statements. The Company does not have any obligation to update any forward-
looking statements to reflect events or circumstances after the date of this statement.
A detailed discussion of factors that could affect our results is included in our SEC filings, including the
“Risk Factors” section of our Annual Report on Form 10-K for the year ended December 31, 2017.
3
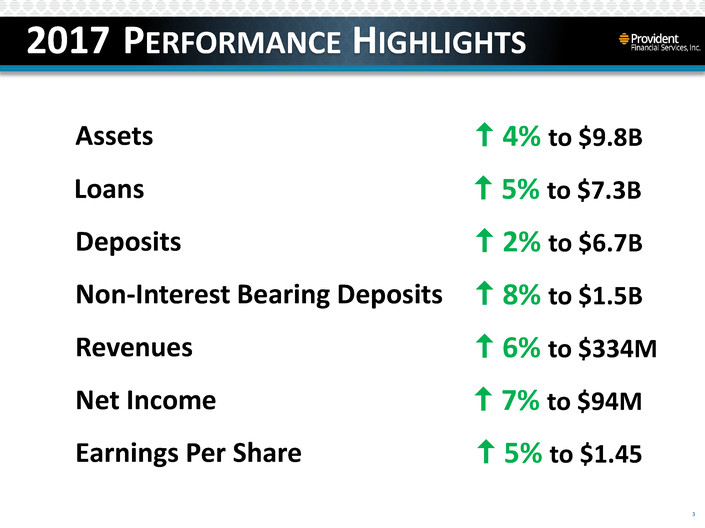
2017 PERFORMANCE HIGHLIGHTS
4% to $9.8BAssets
5% to $7.3BLoans
2% to $6.7BDeposits
8% to $1.5BNon-Interest Bearing Deposits
6% to $334MRevenues
7% to $94MNet Income
5% to $1.45Earnings Per Share
4
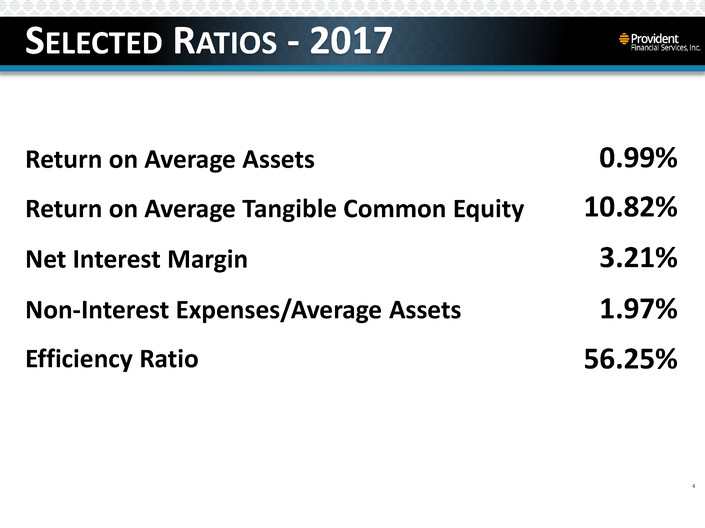
SELECTED RATIOS - 2017
0.99%Return on Average Assets
10.82%Return on Average Tangible Common Equity
3.21%Net Interest Margin
1.97%Non-Interest Expenses/Average Assets
56.25%Efficiency Ratio
5
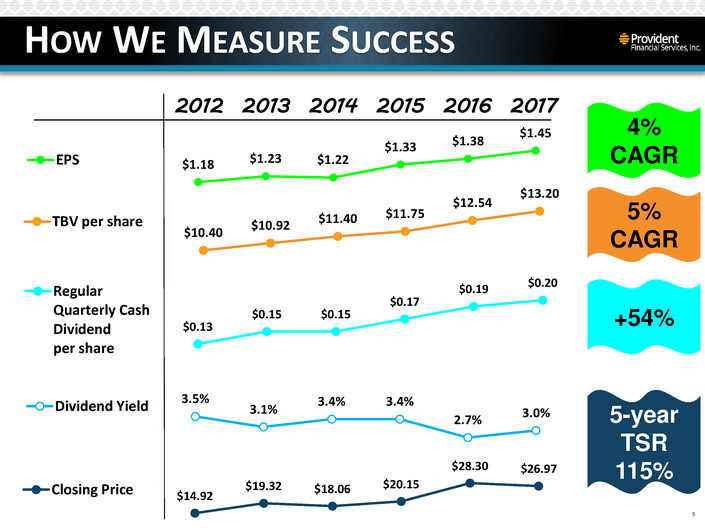
HOW WE MEASURE SUCCESS
$1.18 $1.23 $1.22
$1.33 $1.38
$1.45
EPS
$10.40
$10.92 $11.40
$11.75
$12.54
$13.20
TBV per share
$0.13
$0.15 $0.15
$0.17
$0.19 $0.20Regular
Quarterly Cash
Dividend
per share
3.5%
3.1%
3.4% 3.4%
2.7%
3.0%Dividend Yield
$14.92
$19.32 $18.06 $20.15
$28.30 $26.97
Closing Price
2012 2013 2014 2015 2016 2017
5%
CAGR
+54%
5-year
TSR
115%
4%
CAGR

6
STRATEGIC PLANNING PROCESS UPDATE
Leverage our customer relationships across the Bank’s
lines-of-business
Proactively identify customer needs to retain and grow
profitable relationships
Develop a data analytics capability to enable more fact-
based business decisions
Explore the opportunities afforded by an “Integrated
Banking Model”
NEW 3-YEAR STRATEGIC PLAN
7
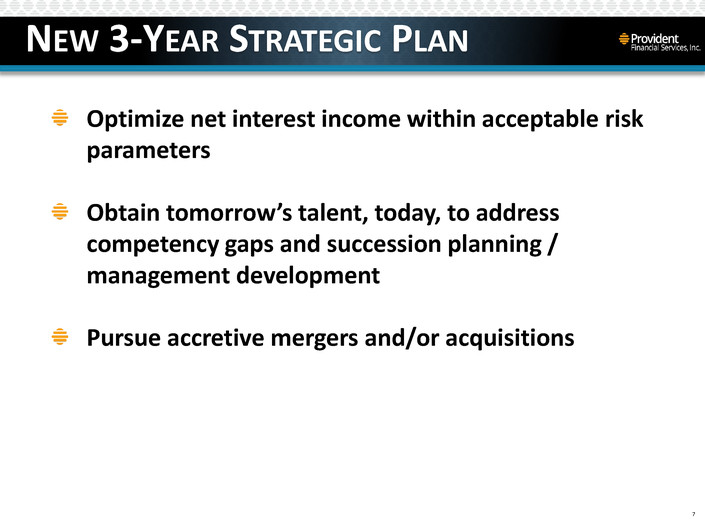
STRATEGIC PLANNING PROCESS UPDATE
Optimize net interest income within acceptable risk
parameters
Obtain tomorrow’s talent, today, to address
competency gaps and succession planning /
management development
Pursue accretive mergers and/or acquisitions
NEW 3-YEAR STRATEGIC PLAN

8
RECONCILIATION OF GAAP TO NON-GAAP FINANCIAL MEASURES
(Dollars in Thousands)
December 31, 2017
Annualized Return on Average Tangible Equity:
Total average stockholders' equity 1,289,973$
Less: total average intangible assets 421,628
Total average tangible stockholders's equity 868,345$
Net income 93,949$
Annualizd return on average tangible equity
(net income/total average stockholders' equity) 10.82%
Efficiency Ratio Calculation:
Net interest income 278,202$
Non-interest income 55,697
Total income 333,899$
Non-interest expense 187,822$
Efficiency ratio (non-interest expense/total income) 56.25%

