Attached files
Table of Contents
UNITED STATES
SECURITIES AND EXCHANGE COMMISSION
Washington, D.C. 20549
FORM 10-K
| x | Annual Report Pursuant to Section 13 or 15(d) of the Securities Exchange Act of 1934 |
For the Fiscal Year Ended December 31, 2009
OR
| ¨ | Transition Report Pursuant to Section 13 or 15(d) of the Securities Exchange Act of 1934 |
For the transition period from to
Commission File No. 1-31566
PROVIDENT FINANCIAL SERVICES, INC.
(Exact Name of Registrant as Specified in its Charter)
| Delaware | 42-1547151 | |
| (State or Other Jurisdiction of Incorporation or Organization) |
(I.R.S. Employer Identification Number) | |
| 830 Bergen Avenue, Jersey City, New Jersey | 07306-4599 | |
| (Address of Principal Executive Offices) | (Zip Code) | |
(201) 333-1000
(Registrant’s Telephone Number)
Securities Registered Pursuant to Section 12(b) of the Act:
| Common Stock, par value $0.01 per share | New York Stock Exchange | |
| (Title of Class) | (Name Of Exchange On Which Registered) |
Securities Registered Pursuant to Section 12(g) of the Act:
None
Indicate by check mark if the Registrant is a well-known seasoned issuer, as defined in Rule 405 of the Securities Act. YES ¨ NO x
Indicate by check mark if the Registrant is not required to file reports pursuant to Section 13 or Section 15(d) of the Act. YES ¨ NO x
Indicate by check mark whether the Registrant: (1) has filed all reports required to be filed by Section 13 or 15(d) of the Securities Exchange Act of 1934 during the preceding twelve months (or for such shorter period that the Registrant was required to file such reports); and (2) has been subject to such filing requirements for the past 90 days. YES x NO ¨
Indicate by check mark whether the registrant has submitted electronically and posted on its corporate Web site, if any, every Interactive Data File required to be submitted and posted pursuant to Rule 405 of Regulation S-T (§ 232.405 of this chapter) during the preceding 12 months (or for such shorter period that the registrant was required to submit and post such files). YES ¨ NO ¨
Indicate by check mark if disclosure of delinquent filers pursuant to Item 405 of Regulation S-K is not contained herein, and will not be contained, to the best of Registrant’s knowledge, in definitive proxy or information statements incorporated by reference in Part III of this Form 10-K or any amendment to this Form 10-K. x
Indicate by check mark whether the Registrant is a large accelerated filer, an accelerated filer, a non-accelerated filer, or a smaller reporting company. See the definitions of “large accelerated filer,” “accelerated filer,” and “smaller reporting company” in Rule 12b-2 of the Exchange Act. (Check one):
Large Accelerated Filer x Accelerated Filer ¨ Non-Accelerated Filer ¨ Smaller Reporting Company ¨
Indicate by check mark whether the Registrant is a shell company (as defined in Rule 12b-2 of the Exchange Act). YES ¨ NO x
As of February 15, 2010, there were 83,209,293 issued and 60,255,133 shares of the Registrant’s Common Stock outstanding, including 431,963 shares held by the First Savings Bank Directors’ Deferred Fee Plan not otherwise considered outstanding under accounting principles generally accepted in the United States of America. The aggregate value of the voting and non-voting common equity held by non-affiliates of the Registrant, based on the closing price of the Common Stock as of June 30, 2009, as quoted by the NYSE, was approximately $524.7 million.
DOCUMENTS INCORPORATED BY REFERENCE
| (1) | Proxy Statement for the 2010 Annual Meeting of Stockholders of the Registrant (Part III). |
Table of Contents
PROVIDENT FINANCIAL SERVICES, INC.
Table of Contents
Forward Looking Statements
Certain statements contained herein are “forward-looking statements” within the meaning of Section 27A of the Securities Act of 1933 and Section 21E of the Securities Exchange Act of 1934. Such forward-looking statements may be identified by reference to a future period or periods, or by the use of forward-looking terminology, such as “may,” “will,” “believe,” “expect,” “estimate,” “anticipate,” “continue,” or similar terms or variations on those terms, or the negative of those terms. Forward-looking statements are subject to numerous risks and uncertainties, including, but not limited to, those related to the economic environment, particularly in the market areas in which Provident Financial Services, Inc. (the “Company”) operates, competitive products and pricing, fiscal and monetary policies of the U.S. Government, changes in government regulations affecting financial institutions, including regulatory fees and capital requirements, changes in prevailing interest rates, acquisitions and the integration of acquired businesses, credit risk management, asset-liability management, the financial and securities markets and the availability of and costs associated with sources of liquidity.
The Company cautions readers not to place undue reliance on any such forward-looking statements, which speak only as of the date made. The Company also advises readers that the factors listed above could affect the Company’s financial performance and could cause the Company’s actual results for future periods to differ materially from any opinions or statements expressed with respect to future periods in any current statements. The Company does not undertake and specifically declines any obligation to publicly release the result of any revisions which may be made to any forward-looking statements to reflect events or circumstances after the date of such statements or to reflect the occurrence of anticipated or unanticipated events.
| Item 1. | Business |
Provident Financial Services, Inc.
The Company is a Delaware corporation which became the holding company for The Provident Bank (the “Bank”) on January 15, 2003, following the completion of the conversion of the Bank to a stock chartered savings bank. On January 15, 2003, the Company issued an aggregate of 59,618,300 shares of its common stock, par value $0.01 per share in a subscription offering and contributed $4.8 million in cash and 1,920,000 shares of its common stock to The Provident Bank Foundation, a charitable foundation established by the Bank. As a result of the conversion and related stock offering, the Company raised $567.2 million in net proceeds, of which $293.2 million was utilized to acquire all of the outstanding common stock of the Bank. The Company owns all of the outstanding common stock of the Bank, and as such, is a bank holding company subject to regulation by the Federal Reserve Board. The Company completed the acquisition of First Sentinel Bancorp, Inc. on July 14, 2004, and completed the acquisition of First Morris Bank & Trust on April 1, 2007.
At December 31, 2009, the Company had total assets of $6.84 billion, net loans of $4.32 billion, total deposits of $4.90 billion, and total stockholders’ equity of $884.6 million. The Company’s mailing address is 830 Bergen Avenue, Jersey City, New Jersey 07306-4599, and the Company’s telephone number is (201) 333-1000.
The Provident Bank
Established in 1839, the Bank is a New Jersey-chartered capital stock savings bank headquartered in Jersey City, New Jersey. The Bank is a community- and customer-oriented bank currently operating 82 full-service branch offices in the New Jersey counties of Hudson, Bergen, Essex, Mercer, Middlesex, Monmouth, Morris, Ocean, Passaic, Somerset and Union, which the Bank considers its primary market area. The Bank emphasizes personal service and customer convenience in serving the financial needs of the individuals, families and businesses residing in its markets. The Bank attracts deposits from the general public and businesses primarily in the areas surrounding its banking offices and uses those funds, together with funds generated from operations and borrowings, to originate commercial real estate loans, residential mortgage loans, commercial business loans and consumer loans. The Bank also invests in mortgage-backed securities and other permissible investments.
1
Table of Contents
The following are highlights of The Provident Bank’s operations:
Diversified Loan Portfolio. To improve asset yields and reduce its exposure to interest rate risk, the Bank diversifies its loan portfolio by originating commercial real estate loans and commercial business loans. These loans generally have adjustable rates or shorter fixed terms and interest rates that are higher than the rates applicable to one- to four-family residential mortgage loans. However, these loans generally have a higher risk of loss than one- to four- family residential mortgage loans.
Asset Quality. As of December 31, 2009, non-performing assets were $90.9 million or 1.33% of total assets, compared to $62.6 million or 0.96% of total assets at December 31, 2008. While the Bank’s non-performing asset levels have been adversely impacted by the troubled residential real estate market and the challenging economic environment, the Bank continues to focus on conservative underwriting criteria and on aggressive collection efforts.
Emphasis on Relationship Banking and Core Deposits. The Bank emphasizes the acquisition and retention of core deposit accounts, such as checking and savings accounts, and expanding customer relationships. Core deposit accounts totaled $3.39 billion at December 31, 2009, representing 69.2% of total deposits, compared with $2.69 billion, or 63.7% of total deposits at December 31, 2008. The Bank also focuses on increasing the number of households and businesses served and the number of bank products per customer.
Non-Interest Income. The Bank’s focus on transaction accounts and expanded products and services has enabled the Bank to generate non-interest income. Fees derived from core deposit accounts are a primary source of non-interest income. The Bank also offers investment products, wealth and asset management services to generate non-interest income. Total non-interest income was $31.5 million for the year ended December 31, 2009, compared with $30.2 million for the year ended December 31, 2008, and fee income was $24.2 million for the year ended December 31, 2009, compared with $23.4 million for the year ended December 31, 2008.
Managing Interest Rate Risk. The Bank manages its exposure to interest rate risk through the origination and retention of adjustable rate and shorter-term loans. In addition, the Bank uses its investments in securities to manage interest rate risk. At December 31, 2009, 45.4% of the Bank’s loan portfolio had a term to maturity of one year or less, or had adjustable interest rates. Moreover, at December 31, 2009, the Bank’s securities portfolio totaled $1.67 billion and had an average expected life of 3.14 years.
Capital Management. The Company paid cash dividends totaling $24.9 million and repurchased 11,000 shares of its common stock at a cost of $119,000 in 2009. The Company curtailed common stock repurchase activity in 2009 to preserve capital in response to the difficult economic environment. The Company and the Bank were “well capitalized” at December 31, 2009 under current regulatory standards.
Available Information. The Company is a public company, and files interim, quarterly and annual reports with the Securities and Exchange Commission (“SEC”). These respective reports are on file and a matter of public record with the SEC and may be read and copied at the SEC’s Public Reference Room at 450 Fifth Street, NW, Washington, DC 20549. The public may obtain information on the operation of the Public Reference Room by calling the SEC at 1-800-SEC-0330. The SEC maintains an Internet site that contains reports, proxy and information statements, and other information regarding issuers that file electronically with the SEC (http://www.sec.gov). All filed SEC reports and interim filings can also be obtained from the Bank’s website, www.providentnj.com, on the “Investor Relations” page, without charge from the Company.
MARKET AREA
The Company and the Bank are headquartered in Jersey City, which is located in Hudson County, New Jersey. At December 31, 2009, the Bank operated a network of 82 full-service banking offices throughout eleven counties in northern and central New Jersey, comprised of 14 offices in Hudson County, 3 in Bergen, 7 in Essex,
2
Table of Contents
1 in Mercer, 23 in Middlesex, 11 in Monmouth, 10 in Morris, 4 in Ocean, 1 in Passaic, 5 in Somerset and 3 in Union Counties. The Bank also maintains a Wealth Management office in Madison, New Jersey, The Provident Loan Center in Woodbridge, New Jersey, and a satellite Loan Production office in Convent Station, New Jersey. The Bank’s lending activities, though concentrated in the communities surrounding its offices, extend predominantly throughout the State of New Jersey.
The Bank’s eleven-county primary market area includes a mix of urban and suburban communities and has a diversified mix of industries including pharmaceutical and other manufacturing companies, network communications, insurance and financial services, and retail. According to the U.S. Census Bureau’s most recent population estimates as of 2008, the Bank’s eleven-county market area has a population of 6.5 million, which was 74.0% of the state’s total population. Because of the diversity of industries in the Bank’s market area and, to a lesser extent, its proximity to the New York City financial markets, the area’s economy can be significantly affected by changes in national and international economies. According to the U.S. Bureau of Labor Statistics, employment trends in New Jersey during 2009 witnessed an increase in the unemployment rate to 10.1% at December 31, 2009, compared to a rate of 7.1% at December 31, 2008.
Within its eleven-county market area, the Bank had an approximate 2.42% share of bank deposits as of June 30, 2009, the latest date for which statistics are available, and an approximate 1.92% deposit share of the New Jersey market statewide.
COMPETITION
The Bank faces intense competition both in originating loans and attracting deposits. The northern and central New Jersey market area has a high concentration of financial institutions, including large money center and regional banks, community banks, credit unions, investment brokerage firms and insurance companies. The Bank faces direct competition for loans from each of these institutions as well as from mortgage companies and other loan origination firms operating in its market area. The Bank’s most direct competition for deposits has come from the several commercial banks and savings banks in the market area, especially large regional banks which have obtained a major share of the available deposit market due in part to acquisitions and consolidations. Many of these banks have substantially greater financial resources than the Bank and offer services that the Bank does not provide. In addition, the Bank faces significant competition for deposits from the mutual fund industry and from investors’ direct purchases of short-term money market securities and other corporate and government securities.
The Bank competes in this environment by maintaining a diversified product line, including mutual funds, annuities and other investment services made available through its investment subsidiary. Relationships with customers are built and maintained through the Bank’s branch network, its deployment of branch and off-site ATMs, and its telephone and web-based banking services.
LENDING ACTIVITIES
The Bank’s takes a balanced approach to its lending activities, originating commercial real estate loans, commercial business loans, fixed-rate and adjustable-rate mortgage loans collateralized by one- to four-family residential real estate and other consumer loans, generally located within its primary market area.
Residential mortgage loans are primarily underwritten to standards that allow the sale of the loans to the secondary markets, primarily to the Federal National Mortgage Association (“FNMA” or “Fannie Mae”) and the Federal Home Loan Mortgage Corporation (“FHLMC” or “Freddie Mac”). To manage interest rate risk, the Bank generally sells the 20-year and 30-year fixed-rate residential mortgages that it originates. The Bank retains a majority of the originated adjustable rate mortgages for its portfolio.
3
Table of Contents
The Bank originates commercial real estate loans that are secured by income-producing properties such as multi-family residences, office buildings, and retail and industrial properties. Generally, these loans have terms of either 5 or 10 years.
The Bank provides construction loans for both single family and condominium projects intended for sale and projects that will be retained as investments by the borrower. During 2008 and 2009, the Bank significantly reduced construction loan originations due to adverse market conditions. The Bank underwrites most construction loans for a term of three years or less. The majority of these loans are underwritten on a floating rate basis. The Bank recognizes that there is higher risk in construction lending than permanent lending. As such, the Bank takes certain precautions to mitigate this risk, including the retention of an outside engineering firm to perform site plan and cost reviews and to review all construction advances made against work in place and a limitation on how and when loan proceeds are advanced. In most cases, for the single family/condominium projects, the Bank limits its exposure against houses or units that are not under contract. Similarly, commercial construction loans usually have commitments for significant pre-leasing, or funds are held back until the leases are finalized.
The Bank originates consumer loans that are secured, in most cases, by a borrower’s assets. Home equity loans and home equity lines of credit that are primarily secured by a second mortgage lien on the borrower’s residence comprise the largest category of the Bank’s consumer loan portfolio. The Bank’s consumer loan portfolio also includes marine loans made on an indirect basis that are secured by a first lien on recreational boats. The marine loans were generated via boat dealers located on the East Coast of the United States. The Bank curtailed its marine lending in 2008 and 2009, and marine loans are currently made only on a direct, limited accommodation basis to existing customers.
Commercial loans are loans to businesses of varying size and type within the Bank’s market. The Bank lends to established businesses, and the loans are generally secured by business assets such as equipment, receivables, inventory, real estate or marketable securities. On a limited basis, the Bank makes unsecured commercial loans. Most commercial lines of credit are made on a floating interest rate basis and most term loans are made on a fixed interest rate basis, usually with terms of five years or less.
Loan Portfolio Composition. Set forth below is selected information concerning the composition of the loan portfolio in dollar amounts and in percentages (after deductions for deferred fees and costs, unearned discounts and premiums and allowances for losses) as of the dates indicated.
| At December 31, | |||||||||||||||||||||||||||||||||||
| 2009 | 2008 | 2007 | 2006 | 2005 | |||||||||||||||||||||||||||||||
| Amount | Percent | Amount | Percent | Amount | Percent | Amount | Percent | Amount | Percent | ||||||||||||||||||||||||||
| (Dollars in thousands) | |||||||||||||||||||||||||||||||||||
| Residential mortgage loans |
$ | 1,491,358 | 34.49 | % | $ | 1,793,123 | 40.03 | % | $ | 1,705,747 | 40.08 | % | $ | 1,623,374 | 43.28 | % | $ | 1,773,288 | 47.83 | % | |||||||||||||||
| Commercial mortgage loans |
1,089,937 | 25.21 | 923,044 | 20.60 | 847,907 | 19.93 | 701,519 | 18.70 | 594,788 | 16.04 | |||||||||||||||||||||||||
| Multi-family mortgage loans |
227,663 | 5.27 | 189,462 | 4.23 | 67,546 | 1.59 | 69,356 | 1.85 | 77,112 | 2.08 | |||||||||||||||||||||||||
| Construction loans |
195,889 | 4.53 | 233,727 | 5.22 | 309,569 | 7.27 | 282,898 | 7.54 | 289,453 | 7.81 | |||||||||||||||||||||||||
| Total mortgage loans |
3,004,847 | 69.50 | 3,139,356 | 70.08 | 2,930,769 | 68.87 | 2,677,147 | 71.37 | 2,734,641 | 73.76 | |||||||||||||||||||||||||
| Commercial loans |
785,818 | 18.18 | 753,173 | 16.81 | 712,062 | 16.73 | 508,785 | 13.43 | 436,285 | 11.77 | |||||||||||||||||||||||||
| Consumer loans |
586,459 | 13.56 | 624,282 | 13.94 | 644,134 | 15.14 | 592,948 | 15.80 | 556,645 | 15.02 | |||||||||||||||||||||||||
| Total other loans |
1,372,277 | 31.74 | 1,377,455 | 30.75 | 1,356,196 | 31.87 | 1,096,734 | 29.23 | 992,930 | 26.79 | |||||||||||||||||||||||||
| Premiums on purchased loans |
8,012 | 0.19 | 10,980 | 0.24 | 9,793 | 0.23 | 11,285 | 0.30 | 13,190 | 0.35 | |||||||||||||||||||||||||
| Unearned discounts |
(266 | ) | (0.01 | ) | (492 | ) | (0.01 | ) | (661 | ) | (0.02 | ) | (875 | ) | (0.02 | ) | (1,110 | ) | (0.03 | ) | |||||||||||||||
| Net deferred costs (fees) |
(676 | ) | (0.02 | ) | (551 | ) | 0.01 | 194 | 0.00 | (627 | ) | (0.02 | ) | (529 | ) | (0.01 | ) | ||||||||||||||||||
| Allowance for loan losses |
(60,744 | ) | (1.40 | ) | (47,712 | ) | (1.07 | ) | (40,782 | ) | (0.95 | ) | (32,434 | ) | (0.86 | ) | (31,980 | ) | (0.86 | ) | |||||||||||||||
| Total loans, net |
$ | 4,323,450 | 100.00 | % | $ | 4,479,036 | 100.00 | % | $ | 4,255,509 | 100.00 | % | $ | 3,751,230 | 100.00 | % | $ | 3,707,142 | 100.00 | % | |||||||||||||||
4
Table of Contents
Loan Maturity Schedule. The following table sets forth certain information as of December 31, 2009, regarding the maturities of loans in the loan portfolio. Demand loans having no stated schedule of repayment and no stated maturity, and overdrafts are reported as due within one year.
| Within One Year |
One Through Three Years |
Three Through Five Years |
Five Through Ten Years |
Ten Through Twenty Years |
Beyond Twenty Years |
Total | |||||||||||||||
| (In thousands) | |||||||||||||||||||||
| Residential mortgage loans |
$ | 759 | $ | 9,427 | $ | 20,613 | $ | 227,100 | $ | 350,582 | $ | 882,877 | $ | 1,491,358 | |||||||
| Commercial mortgage loans |
125,763 | 116,716 | 186,638 | 535,476 | 123,784 | 1,560 | 1,089,937 | ||||||||||||||
| Multi-family mortgage loans |
5,364 | 5,901 | 37,486 | 124,703 | 52,549 | 1,660 | 227,663 | ||||||||||||||
| Construction loans |
155,364 | 39,059 | — | 1,466 | — | — | 195,889 | ||||||||||||||
| Total mortgage loans |
287,250 | 171,103 | 244,737 | 888,745 | 526,915 | 886,097 | 3,004,847 | ||||||||||||||
| Commercial loans |
198,696 | 95,485 | 176,051 | 219,260 | 78,043 | 18,283 | 785,818 | ||||||||||||||
| Consumer loans |
85,273 | 13,861 | 22,945 | 92,437 | 276,379 | 95,564 | 586,459 | ||||||||||||||
| Total loans |
$ | 571,219 | $ | 280,449 | $ | 443,733 | $ | 1,200,442 | $ | 881,337 | $ | 999,944 | $ | 4,377,124 | |||||||
Fixed- and Adjustable-Rate Loan Schedule. The following table sets forth at December 31, 2009, the dollar amount of all fixed-rate and adjustable-rate loans due after December 31, 2010. Adjustable-rate loans are included based on contractual maturities.
| Due After December 31, 2010 | |||||||||
| Fixed | Adjustable | Total | |||||||
| (In thousands) | |||||||||
| Residential mortgage loans |
$ | 851,514 | $ | 639,085 | $ | 1,490,599 | |||
| Commercial mortgage loans |
693,589 | 270,585 | 964,174 | ||||||
| Multi-family mortgage loans |
168,564 | 53,735 | 222,299 | ||||||
| Construction loans |
11,099 | 29,426 | 40,525 | ||||||
| Total mortgage loans |
1,724,766 | 992,831 | 2,717,597 | ||||||
| Commercial loans |
316,572 | 270,550 | 587,122 | ||||||
| Consumer loans |
345,914 | 155,272 | 501,186 | ||||||
| Total loans |
$ | 2,387,252 | $ | 1,418,653 | $ | 3,805,905 | |||
Residential Mortgage Lending. A principal lending activity of the Bank is to originate loans secured by first mortgages on one- to four-family residences in the State of New Jersey. The Bank originates residential mortgages primarily through commissioned mortgage representatives, the internet and its branch offices. The Bank originates both fixed-rate and adjustable-rate mortgages. Residential mortgage lending represents the largest single component of the total loan portfolio. As of December 31, 2009, $1.49 billion or 34.1% of the total portfolio consisted of residential real estate loans. Of the one- to four-family loans at that date, 55.3% were fixed-rate and 44.7% were adjustable-rate loans.
The Bank originates fixed-rate fully amortizing residential mortgage loans, with the principal and interest due each month, that typically have maturities ranging from 10 to 30 years. The Bank also originates fixed-rate residential mortgage loans with maturities of 15, 20 and 30 years that require the payment of principal and interest on a biweekly basis. Fixed-rate jumbo residential mortgage loans (loans over the maximum that one of the government-sponsored agencies will purchase) are originated with maturities of up to 30 years. The Bank has
5
Table of Contents
offered adjustable-rate mortgage loans with a fixed-rate period of 1, 3, 5, 7 or 10 years prior to the first annual interest rate adjustment. In October 2009, the Bank discontinued the origination of one- and three-year adjustable rate mortgage loans. The standard adjustment formula is the one-year constant maturity Treasury rate plus 2 3/4%, adjusting annually with a 2% maximum annual adjustment and a 6% maximum adjustment over the life of the loan.
The Bank does not originate or purchase sub-prime or option ARM loans. On a limited basis, the Company has originated “Alt-A” mortgages in the form of stated income loans with a maximum loan-to-value ratio of 50%. The balance of these “Alt-A” loans at December 31, 2009 was $18.2 million.
Residential loans are primarily underwritten to Freddie Mac and Fannie Mae standards. The Bank’s standard maximum loan to value ratio is 80%. However, working through mortgage insurance companies, the Bank underwrites loans for sale to Freddie Mac or Fannie Mae programs that will finance up to 95% of the value of the residence. Generally all fixed-rate loans with terms of 20 years or more are sold into the secondary market with servicing rights retained. Fixed-rate residential mortgage loans retained in the Bank’s portfolio generally include loans with a term of 15 years or less and biweekly payment residential mortgage loans with a term of 25 years or less. The Bank retains the majority of the originated adjustable-rate mortgages for its portfolio.
Loans are sold without recourse, generally with servicing rights retained by the Bank. The percentage of loans sold into the secondary market will vary depending upon interest rates and the Bank’s strategies for reducing exposure to interest rate risk. In 2009, $98.7 million, or 47.5% of residential real estate loans originated were sold into the secondary market. All of the loans sold in 2009 were long-term, fixed-rate mortgages.
The retention of adjustable-rate mortgages, as opposed to longer-term, fixed-rate residential mortgage loans, helps reduce the Bank’s exposure to interest rate risk. However, adjustable-rate mortgages generally pose credit risks different from the credit risks inherent in fixed-rate loans primarily because as interest rates rise, the underlying debt service payments of the borrowers rise, thereby increasing the potential for default. To minimize this risk, borrowers of one- to four-family, one- and three-year adjustable-rate loans are qualified at the maximum rate which would be in effect after the first interest rate adjustment. The Bank believes that these credit risks, which have not had a material adverse effect on the Bank to date, generally are less onerous than the interest rate risk associated with holding 20- and 30-year fixed-rate loans in its loan portfolio.
For many years, the Bank has offered discounted rates on residential mortgage loans to low- to moderate-income individuals. Loans originated in this category over the last five years have totaled $159.2 million. The Bank also offers a special rate program for first-time homebuyers under which originations have totaled over $22.9 million for the past five years.
Commercial Real Estate Loans. The Bank originates loans secured by mortgages on various commercial income producing properties, including office buildings, retail and industrial properties. Commercial real estate and construction loans were 29.4% of the portfolio at December 31, 2009. A substantial majority of the Bank’s commercial real estate loans are secured by properties located in the State of New Jersey.
The Bank originates commercial real estate loans with adjustable rates and with fixed interest rates for a period that is generally five to ten years or less, which may adjust after the initial period. Typically these loans are written for maturities of ten years or less and have an amortization schedule of 20 or 25 years. As a result, the typical amortization schedule will result in a substantial principal payment upon maturity. The Bank generally underwrites commercial real estate loans to a maximum 75% advance against either the appraised value of the property, or its purchase price (for loans to fund the acquisition of real estate), whichever is less. The Bank generally requires minimum debt service coverage of 1.25 times. There is a potential risk that the borrower may be unable to pay off or refinance the outstanding balance at the loan maturity date. The Bank typically lends to experienced owners or developers who have knowledge and contacts in the commercial real estate market.
Among the reasons for the Bank’s continued emphasis on commercial real estate lending is the desire to invest in assets bearing interest rates that are generally higher than interest rates on residential mortgage loans
6
Table of Contents
and more sensitive to changes in market interest rates. Commercial real estate loans, however, entail significant additional credit risk as compared to one- to four-family residential mortgage loans, as they typically involve larger loan balances concentrated with single borrowers or groups of related borrowers. In addition, the payment experience on commercial real estate loans secured by income-producing properties is typically dependent on the successful operation of the related real estate project and thus may be more significantly impacted by adverse conditions in the real estate market or in the economy generally.
The Bank performs more extensive diligence in underwriting commercial real estate loans than loans secured by owner-occupied one- to four-family residential properties due to the larger loan amounts and the riskier nature of such loans. The Bank attempts to understand and control the risk in several ways, including inspection of all such properties and the review of the overall financial condition of the borrower and guarantors, which may include, for example, the review of the rent rolls and the verification of income. If applicable, a tenant analysis and market analysis are part of the underwriting. For commercial real estate secured loans in excess of $750,000 and for all other commercial real estate loans where it is appropriate, the Bank employs environmental experts to inspect the property and ascertain any potential environmental risks.
The Bank requires a full independent appraisal for commercial real estate. The appraiser must be selected from the Bank’s approved list. The Bank also employs an independent review appraiser to ensure that the appraisal meets the Bank’s standards. The underwriting guidelines generally provide that the loan-to-value ratio shall not exceed 75% of the appraised value and the debt service coverage should be at least 1.25 times. In addition, financial statements are required annually for review. The Bank’s policy also requires that a property inspection of commercial mortgages over $1.0 million be completed at least every 18 months.
The Bank’s largest commercial mortgage loan as of December 31, 2009 was a $24.1 million loan secured by a first mortgage on a 640,000 square foot, multi-tenanted industrial warehouse building located in North Brunswick, New Jersey. The loan has a risk rating of 5 due to the partial vacancy of the property (loans rated 5 are deemed to be of questionable quality and are designated “watch”—see discussion of the Bank’s 9-point risk rating system for loans under “Allowance for Loan Losses” in the “Asset Quality” section) and was performing in accordance with its terms and conditions as of December 31, 2009.
Multi-family Lending. The Bank underwrites loans secured by apartment buildings that have five or more units. The Bank considers multi-family lending a component of the commercial real estate lending portfolio. The underwriting standards and procedures that are used to underwrite commercial real estate loans are used to underwrite multi-family loans.
Construction Loans. The Bank originates commercial construction loans. Commercial construction lending includes both new construction of residential and commercial real estate projects and the reconstruction of existing structures.
The Bank’s commercial construction financing takes two forms: projects for sale (single family/condominiums) and projects that are constructed for investment purposes (rental property). To mitigate the speculative nature of construction loans, the Bank generally requires significant pre-leasing on rental properties and requires that a percentage of the single-family residences or condominiums be under contract to support construction loan advances.
The Bank underwrites most construction loans for a term of three years or less. The majority of the Bank’s construction loans are floating-rate loans with a maximum 75% loan-to-value ratio for the completed project. The Bank employs professional engineering firms to assist in the review of construction cost estimates and make site inspections to determine if the work has been completed prior to the advance of funds for the project.
Construction lending generally involves a greater degree of risk than one- to four-family mortgage lending. Repayment of a construction loan is, to a great degree, dependent upon the successful and timely completion of
7
Table of Contents
the construction of the subject project and the successful marketing of the sale or lease of the project. Construction delays, slower than anticipated absorption or the financial impairment of the builder may negatively affect the borrower’s ability to repay the loan.
For all construction loans, the Bank requires an independent appraisal, which includes information on market rents and/or comparable sales and competing projects. The Bank also attempts to obtain personal guarantees and conducts environmental due diligence as appropriate.
The Bank also employs other means to control the risk of the construction lending process. For single family/condominium financing, the Bank generally requires payment for the release of a unit that exceeds the amount of the loan advance attributable to such unit. On commercial construction projects that the developer maintains for rental, the Bank typically holds back funds for tenant improvements until a lease is executed.
The Bank’s largest construction loan as of December 31, 2009 was a $15.4 million construction loan secured by a 71-unit apartment project located in Nutley, New Jersey. The loan had an outstanding balance of $10.9 million at December 31, 2009. The borrowers are experienced developers in New Jersey and Pennsylvania. The project is 85% complete and leasing is expected to commence in March 2010. The loan has a risk rating of 4 (loans rated 1-4 are deemed to be of “acceptable quality”—see discussion of the Bank’s 9-point risk rating system for loans under “Allowance for Loan Losses” in the “Asset Quality” section) and was performing in accordance with its terms and conditions as of December 31, 2009. Outstanding construction loans decreased to $195.9 million at December 31, 2009, from $233.7 million at December 31, 2008, as the Bank de-emphasized construction lending due to economic conditions.
Commercial Loans. The Bank underwrites commercial loans to corporations, partnerships and other businesses. Commercial loans represented 18.0% of the loan portfolio at December 31, 2009. The majority of the Bank’s commercial loan customers are local businesses with revenues of less than $50.0 million. The Bank offers commercial loans for equipment purchases, lines of credit or letters of credit, as well as real estate loans where the borrower is the primary occupant of the property. Most commercial loans are originated on a floating-rate basis and the majority of fixed-rate commercial term loans are fully amortized over a five-year period.
The Bank also underwrites Small Business Administration (“SBA”) guaranteed loans and guaranteed or assisted loans through various state, county and municipal programs. These governmental guarantees are typically used in cases where the borrower requires additional credit support. The Bank holds “Preferred Lender” status with the SBA, allowing a more streamlined application and approval process.
The underwriting of a commercial loan is based upon a review of the financial statements of the prospective borrower and guarantors. In most cases the Bank obtains a general lien on accounts receivable and inventory, along with the specific collateral such as real estate or equipment, as appropriate.
Commercial business loans generally bear higher interest rates than residential mortgage loans, but they also involve a higher risk of default since their repayment is generally dependent on the cash flow of the borrower’s business. As a result, the availability of funds for the repayment of commercial business loans may be substantially dependent on the success of the business itself and the general economic environment. The Bank’s largest commercial loan was a $38.0 million line of credit to a general contracting company specializing in bridge and highway construction with a risk rating of 3. The line is used primarily for bid bonding and working capital. The Bank expects to sell a participation interest of $10.0 million in the line of credit to another financial institution, which will reduce the Bank’s exposure to $28.0 million. The sale of the participation is expected to close in the first quarter of 2010. As of December 31, 2009, the line of credit had no outstanding balance.
Consumer Loans. The Bank offers a variety of consumer loans to individuals. Consumer loans represented 13.4% of the loan portfolio at December 31, 2009. Home equity loans and home equity lines of credit constituted 83.1% of the consumer loan portfolio as of December 31, 2009. Indirect marine loans comprised 14.6% of the
8
Table of Contents
consumer loan portfolio, and indirect auto loans comprised 0.8% of the consumer loan portfolio at December 31, 2009, respectively. The remainder of the consumer loan portfolio includes personal loans and unsecured lines of credit, automobile loans and recreational vehicle loans, which represent 1.5% of the consumer loan portfolio. Effective September 30, 2007, the Bank ceased purchasing indirect auto loans, and currently the Bank limits its marine lending to direct lending on a limited accommodation basis to existing customers.
Interest rates on home equity loans are fixed for a term not to exceed 20 years and the maximum loan amount is $500,000. A portion of the home equity loan portfolio includes “first lien product loans,” under which the Bank has offered special rates to borrowers who refinance first mortgage loans on the home equity (first lien) basis. The Bank’s home equity lines are made at floating interest rates and the Bank provides lines of credit of up to $500,000. The approved home equity lines and utilization amounts as of December 31, 2009 were $421.7 million and $176.5 million, respectively, representing utilization of 41.9%.
The Bank has purchased marine loans from established dealers and brokers located on the East Coast of the United States, which were underwritten to the Bank’s pre-established underwriting standards. The maximum marine loan is $1.0 million. All marine loans are collateralized by a first lien on the vessel. Originations of marine loans have declined significantly as the Bank curtailed its marine lending in 2008 and 2009. Marine loans are currently made only on a direct, limited accommodation basis to existing customers.
Consumer loans generally entail greater credit risk than residential mortgage loans, particularly in the case of consumer loans that are unsecured or that are secured by assets that tend to depreciate, such as automobiles, boats and recreational vehicles. Collateral repossessed by the Bank from a defaulted consumer loan may not provide an adequate source of repayment of the outstanding loan balance, and the remaining deficiency may warrant further substantial collection efforts against the borrower. In addition, consumer loan collections are dependent upon the borrower’s continued financial stability, and this is more likely to be adversely affected by job loss, divorce, illness or personal bankruptcy. Furthermore, the application of various federal and state laws, including bankruptcy and insolvency laws, may limit the amount which can be recovered on such loans.
Loan Originations, Purchases, and Repayments. The following table sets forth the Bank’s loan origination, purchase and repayment activities for the periods indicated.
| Year Ended December 31, | |||||||||
| 2009 | 2008 | 2007 | |||||||
| (In thousands) | |||||||||
| Originations: |
|||||||||
| Residential mortgage |
$ | 207,578 | $ | 141,318 | $ | 192,141 | |||
| Commercial mortgage |
142,178 | 257,970 | 215,214 | ||||||
| Multi-family mortgage |
50,555 | 41,375 | 18,666 | ||||||
| Construction |
93,000 | 231,786 | 236,128 | ||||||
| Commercial |
512,634 | 473,661 | 421,345 | ||||||
| Consumer |
134,361 | 185,229 | 202,662 | ||||||
| Subtotal of loans originated |
1,140,306 | 1,331,339 | 1,286,156 | ||||||
| Loans purchased |
55,145 | 267,823 | 79,131 | ||||||
| Total loans originated |
1,195,451 | 1,599,162 | 1,365,287 | ||||||
| Loans acquired from First Morris: |
|||||||||
| Residential mortgage |
— | — | 73,913 | ||||||
| Commercial mortgage |
— | — | 28,490 | ||||||
| Multi-family mortgage |
— | — | — | ||||||
| Construction |
— | — | 15,273 | ||||||
| Commercial |
— | — | 158,766 | ||||||
| Consumer |
— | — | 58,867 | ||||||
| Total loans acquired from First Morris |
— | — | 335,309 | ||||||
| Loans sold or securitized |
183,509 | 71,675 | 8,862 | ||||||
9
Table of Contents
| Year Ended December 31, | ||||||||||||
| 2009 | 2008 | 2007 | ||||||||||
| (In thousands) | ||||||||||||
| Repayments: |
||||||||||||
| Residential mortgage |
378,461 | 251,744 | 249,252 | |||||||||
| Commercial mortgage |
65,175 | 117,811 | 128,356 | |||||||||
| Multi-family mortgage |
5,361 | 13,424 | 20,983 | |||||||||
| Construction |
96,507 | 273,393 | 228,267 | |||||||||
| Commercial |
422,644 | 430,079 | 341,635 | |||||||||
| Consumer |
164,364 | 200,261 | 206,399 | |||||||||
| Total repayments |
1,132,512 | 1,286,712 | 1,174,892 | |||||||||
| Total reductions |
1,316,021 | 1,358,387 | 1,183,754 | |||||||||
| Other items, net(1) |
(21,984 | ) | (10,318 | ) | (4,215 | ) | ||||||
| Net (decrease) increase |
$ | (142,554 | ) | $ | 230,457 | $ | 512,627 | |||||
| (1) | Other items include charge-offs, deferred fees and expenses, discounts and premiums. |
Loan Approval Procedures and Authority. The Bank’s Board of Directors approves the Lending Policy on an annual basis as well as on an interim basis as modifications are warranted. The Lending Policy sets the Bank’s lending authority for each type of loan. The Bank’s lending officers are assigned dollar authority limits based upon their experience and expertise. All loan approvals require joint lending authority.
The largest individual lending authority is $5.0 million, which is only available to the Chief Executive Officer and the Chief Lending Officer. Loans in excess of $5.0 million, or which when combined with existing credits of the borrower or related borrowers exceed $5.0 million, are presented to the management Credit Committee. The Credit Committee currently consists of six senior officers including the Chief Executive Officer, the Chief Lending Officer, and the Chief Credit Officer, and requires a majority vote for credit approval. The Credit Committee has a $20.0 million approval authority and the Credit Risk Committee of the Board of Directors of the Bank has approval authority exceeding $20.0 million. All credit approvals by the Credit Risk Committee are reported to the Board of Directors of the Bank.
The Bank has adopted a risk rating system as part of the risk assessment of its loan portfolio. The Bank’s commercial real estate and commercial lending officers are required to assign a risk rating to each loan in their portfolio at origination. When the lender learns of important financial developments, the risk rating is reviewed accordingly. Similarly, the Credit Committee can adjust a risk rating. Quarterly, management’s Credit Risk Management Committee meets to review all loans rated a “watch” or worse. In addition, the Loan Review Department, which is independent of the lending areas and reports to the Chief Credit Officer, validates the risk ratings. The risk ratings play an important role in the establishment of the loan loss provision and to confirm the adequacy of the allowance for loan losses.
Loans to One Borrower. The regulatory limit on total loans to any borrower or attributed to any one borrower is 15% of the Bank’s unimpaired capital and surplus. As of December 31, 2009, the regulatory lending limit was $69.7 million. The Bank’s current internal policy limit on total loans to a borrower or related borrowers that constitute a group exposure is up to $55.0 million for loans with a risk rating of 2 or better, $50.0 million for loans with a risk rating of 3 and $45.0 million for loans with a risk rating of 4. The Bank reviews these group exposures on a quarterly basis. The Bank also sets additional limits on size of loans by loan type.
At December 31, 2009, the Bank’s largest total lending relationship with an individual borrower and its related entities was $60.9 million, consisting of a line of credit and ten separate commercial mortgage loans. One commercial mortgage loan has a risk rating of 4 and the remainder are risk rated 3. The line of credit is partially
10
Table of Contents
secured by an assignment of partnership interests. Eight of the commercial mortgage loans are secured by first mortgages on retail and office buildings in New Jersey. The remaining two commercial mortgage loans are secured by second mortgages on retail buildings in New Jersey. The borrower is an experienced and successful owner and operator of commercial properties. Management has determined that this exception to the internal policy limit is manageable and is mitigated by the borrower’s diverse revenue mix as well as its reputation and proven successful track record. This lending relationship was approved as an exception to the internal policy limits by the Credit Risk Committee of the Board of Directors of the Bank and reported to the Board of Directors of the Bank, and conformed with the regulatory limit applicable to the Bank at the time of loan origination. As of December 31, 2009, all of the loans in this lending relationship were performing in accordance with their respective terms and conditions.
As of December 31, 2009, the Bank had $422.3 million in loans outstanding to its 50 largest borrowers and their related entities.
ASSET QUALITY
General. One of the Bank’s key objectives has been and continues to be to maintain a high level of asset quality. In addition to maintaining sound credit standards for new loan originations, the Bank employs proactive collection and workout processes in dealing with delinquent or problem loans. The Bank actively markets properties that it acquires through foreclosure or otherwise in the loan collection process.
Collection Procedures. In the case of residential mortgage and consumer loans, the collections personnel in the Bank’s Asset Recovery Department are responsible for collection activities from the sixteenth day of delinquency. Collection efforts include automated notices of delinquency, telephone calls, letters and other notices to the delinquent borrower. Foreclosure proceedings and other appropriate collection activities such as repossession of collateral are commenced within at least 90 to 120 days after the loan is delinquent. Periodic inspections of real estate and other collateral are conducted throughout the collection process. The collection procedures for Federal Housing Association (“FHA”) and Veteran’s Administration (“VA”) one- to four- family mortgage loans follow the collection guidelines outlined by those agencies.
Real estate and other assets acquired through foreclosure or in connection with a loan workout are held as foreclosed assets. The Bank carries other real estate owned and other foreclosed assets at the lower of their cost or their fair market value less estimated selling costs. The Bank attempts to sell the property at foreclosure sale or as soon as practical after the foreclosure sale through a proactive marketing effort.
The collection procedures for commercial real estate and commercial loans include sending periodic late notices and letters to a borrower once a loan is past due. The Bank attempts to make direct contact with a borrower once a loan is 16 days past due, usually by telephone. The Chief Lending Officer and Chief Credit Officer review all commercial real estate and commercial loan delinquencies on a weekly basis. Generally, delinquent commercial real estate and commercial loans are transferred to the Asset Recovery Department for further action if the delinquency is not cured within a reasonable period of time, typically 60 to 90 days. The Chief Lending Officer and Chief Credit Officer have the authority to transfer performing commercial real estate or commercial loans to the Asset Recovery Department if, in his opinion, a credit problem exists or is likely to occur.
Loans deemed uncollectible are proposed for charge-off on a monthly basis. The charge-off recommendation is then submitted to Executive Management for approval.
Delinquent Loans and Non-performing Loans and Assets. The Bank’s policies require that the Chief Credit Officer continuously monitor the status of the loan portfolios and report to the Board of Directors on a monthly basis. These reports include information on impaired loans, delinquent loans, criticized and classified assets, and foreclosed assets. An impaired loan is defined as a loan for which it is probable, based on current information,
11
Table of Contents
that the Bank will not collect all amounts due under the contractual terms of the loan agreement. Smaller balance homogeneous loans including residential mortgages and other consumer loans are evaluated collectively for impairment and are excluded from the definition of impaired loans. Impaired loans are individually identified and reviewed to determine that each loan’s carrying value is not in excess of the fair value of the related collateral or the present value of the expected future cash flows. As of December 31, 2009, there were 15 impaired loans totaling $41.1 million.
Interest income stops accruing on loans when interest or principal payments are 90 days in arrears or earlier when the timely collectibility of such interest or principal is doubtful. When the accrual of interest on a loan is stopped, the loan is designated as a non-accrual loan and the outstanding interest previously credited is reversed. A non-accrual loan is returned to accrual status when factors indicating doubtful collection no longer exist and the loan has been brought current.
Federal and state regulations as well as the Bank’s policy require the Bank to utilize an internal risk rating system as a means of reporting problem and potential problem assets. Under this system, the Bank classifies problem and potential problem assets as “substandard,” “doubtful” or “loss” assets. An asset is considered “substandard” if it is inadequately protected by the current net worth and paying capacity of the obligor or of the collateral pledged, if any. “Substandard” assets include those characterized by the “distinct possibility” that the Bank will sustain “some loss” if the deficiencies are not corrected. Assets classified as “doubtful” have all of the weaknesses inherent in those classified “substandard” with the added characteristic that the weaknesses present make “collection or liquidation in full,” on the basis of currently existing facts, conditions, and values, “highly questionable and improbable.” Assets classified as “loss” are those considered “uncollectible” and of such little value that their continuance as assets without the establishment of a specific loss reserve is not warranted. Assets which do not currently expose the Bank to sufficient risk to warrant classification in one of the aforementioned categories, but possess weaknesses, are required to be designated “special mention.”
General valuation allowances represent loss allowances which have been established to recognize the inherent risk associated with lending activities, but which, unlike specific allowances, have not been allocated to particular problem assets. When the Bank classifies one or more assets, or portions thereof, as “substandard” or “doubtful,” the Bank may establish a specific allowance for loan losses in an amount deemed prudent by management. When the Bank classifies one or more assets, or portions thereof, as “loss,” the Bank is required either to establish a specific allowance for losses equal to 100% of the amount of the asset so classified or to charge-off such amount.
The Bank’s determination as to the classification of assets and the amount of the valuation allowances is subject to review by the FDIC and the New Jersey Department of Banking and Insurance, each of which can require the establishment of additional general or specific loss allowances. The FDIC, in conjunction with the other federal banking agencies, issued an interagency policy statement on the allowance for loan and lease losses. The policy statement provides updated guidance for financial institutions on both the responsibilities of the board of directors and management for the maintenance of adequate allowances, and guidance for banking agency examiners to use in determining the adequacy of general valuation allowances. Generally, the policy statement reaffirms that institutions should have effective loan review systems and controls to identify, monitor and address asset quality problems; that loans deemed uncollectible are promptly charged off; and that the institution’s process for determining an adequate level for its valuation allowance is based on a comprehensive, adequately documented, and consistently applied analysis of the institution’s loan and lease portfolio. While management believes that on the basis of information currently available to it, the allowance for loans losses is adequate as of December 31, 2009, actual losses are dependent upon future events and, as such, further additions to the level of allowances for loan losses may become necessary.
Loans are classified in accordance with the risk rating system described above. At December 31, 2009, $84.9 million of loans were classified as “substandard,” which consisted of $28.6 million in residential loans, $25.6 million in commercial and multi-family mortgage loans, $13.4 million in commercial loans, $10.5 million in construction loans and $6.8 million in consumer loans. At that same date, loans classified as “doubtful” totaled
12
Table of Contents
$30.6 million, consisting of $21.5 million in commercial and multi-family mortgage loans, $6.4 million in commercial loans and $2.7 million in construction loans. There were no loans classified as “loss” at December 31, 2009. As of December 31, 2009, $31.3 million of loans were designated “special mention.”
The following table sets forth delinquencies in the loan portfolio as of the dates indicated.
| At December 31, 2009 | At December 31, 2008 | At December 31, 2007 | ||||||||||||||||||||||||||||
| 60-89 Days | 90 Days or More | 60-89 Days | 90 Days or More | 60-89 Days | 90 Days or More | |||||||||||||||||||||||||
| Number of Loans |
Principal Balance of Loans |
Number of Loans |
Principal Balance of Loans |
Number of Loans |
Principal Balance of Loans |
Number of Loans |
Principal Balance of Loans |
Number of Loans |
Principal Balance of Loans |
Number of Loans |
Principal Balance of Loans | |||||||||||||||||||
| (Dollars in thousands) | ||||||||||||||||||||||||||||||
| Residential mortgage loans |
22 | $ | 6,093 | 112 | $ | 28,622 | 28 | $ | 5,786 | 60 | $ | 14,503 | 17 | $ | 4,109 | 27 | $ | 4,228 | ||||||||||||
| Commercial mortgage loans |
1 | 778 | 8 | 14,877 | — | — | 9 | 24,830 | — | — | 10 | 3,452 | ||||||||||||||||||
| Multi-family mortgage loans |
1 | 1,051 | — | — | — | — | — | — | — | — | 1 | 742 | ||||||||||||||||||
| Construction loans |
— | — | — | — | — | — | 2 | 9,403 | — | — | 3 | 375 | ||||||||||||||||||
| Total mortgage loans |
24 | 7,922 | 120 | 43,499 | 28 | 5,786 | 71 | 48,736 | 17 | 4,109 | 41 | 8,797 | ||||||||||||||||||
| Commercial loans |
12 | 3,934 | 61 | 6,675 | 16 | 1,482 | 20 | 4,456 | 11 | 590 | 7 | 498 | ||||||||||||||||||
| Consumer loans |
37 | 2,766 | 86 | 6,765 | 74 | 1,356 | 72 | 5,926 | 59 | 2,270 | 30 | 2,297 | ||||||||||||||||||
| Total loans |
73 | $ | 14,622 | 267 | $ | 56,939 | 118 | $ | 8,624 | 163 | $ | 59,118 | 87 | $ | 6,969 | 78 | $ | 11,592 | ||||||||||||
Non-Accrual Loans and Non-Performing Assets. The following table sets forth information regarding non-accrual loans and other non-performing assets. There were no non-accrual troubled debt restructurings at any of the dates indicated. Loans are generally placed on non-accrual status when they become 90 days or more past due or if they have been identified as presenting uncertainty with respect to the collectibility of interest or principal.
| At December 31, | ||||||||||||||||||||
| 2009 | 2008 | 2007 | 2006 | 2005 | ||||||||||||||||
| (Dollars in thousands) | ||||||||||||||||||||
| Non-accruing loans: |
||||||||||||||||||||
| Residential mortgage loans |
$ | 28,622 | $ | 14,503 | $ | 4,228 | $ | 4,426 | $ | 3,956 | ||||||||||
| Commercial mortgage loans |
23,356 | 24,830 | 21,918 | — | — | |||||||||||||||
| Multi-family mortgage loans |
— | — | 742 | 742 | — | |||||||||||||||
| Construction loans |
13,186 | 9,403 | 375 | 569 | — | |||||||||||||||
| Commercial loans |
12,548 | 4,456 | 5,083 | 234 | 843 | |||||||||||||||
| Consumer loans |
6,765 | 5,926 | 2,298 | 1,304 | 1,206 | |||||||||||||||
| Total non-accruing loans |
84,477 | 59,118 | 34,644 | 7,275 | 6,005 | |||||||||||||||
| Accruing loans delinquent 90 days or more |
— | — | — | 274 | — | |||||||||||||||
| Total non-performing loans |
84,477 | 59,118 | 34,644 | 7,549 | 6,005 | |||||||||||||||
| Foreclosed assets |
6,384 | 3,439 | 1,041 | 528 | 670 | |||||||||||||||
| Total non-performing assets |
$ | 90,861 | $ | 62,557 | $ | 35,685 | $ | 8,077 | $ | 6,675 | ||||||||||
| Total non-performing assets as a percentage of total assets |
1.33 | % | 0.96 | % | 0.56 | % | 0.14 | % | 0.11 | % | ||||||||||
| Total non-performing loans to total loans |
1.93 | % | 1.31 | % | 0.81 | % | 0.20 | % | 0.16 | % | ||||||||||
Non-performing residential mortgage loans increased $14.1 million, to $28.6 million at December 31, 2009, from $14.5 million at December 31, 2008. In addition, non-performing consumer loans increased $838,000, to $6.8 million at December 31, 2009, from $5.9 million at December 31, 2008. The increase in non-performing residential mortgage and consumer loans is attributable to rising unemployment, declining property values and increased personal debt levels.
13
Table of Contents
Non-performing commercial loans increased $8.1 million, to $12.5 million at December 31, 2009, from $4.4 million at December 31, 2008. Non-performing commercial loans at December 31, 2009 consisted of 67 loans. The largest non-performing commercial loan relationship consisted of four loans to a consumer products distributor with total outstanding balances of $4.8 million at December 31, 2009.
Non-performing construction loans increased $3.8 million, to $13.2 million at December 31, 2009, from $9.4 million at December 31, 2008. At December 31, 2009, non-performing construction loans included a $10.5 million senior participation interest in a $283.0 million Shared National Credit. Proceeds from this construction loan facility are being used to convert an existing 35-story, 631,000 square foot office building in New York City into a mixed-use 349-unit residential condominium and 251-room hotel. The project has been impacted by additional costs and a decline in sales activity. While this loan has been classified as non-accrual, the hotel construction is nearing completion and the loan was current as to principal and interest at December 31, 2009. The Company had an unfunded commitment on this loan of an additional $276,000 at December 31, 2009.
Non-performing commercial mortgage loans decreased $1.5 million, to $23.4 million at December 31, 2009, from $24.8 million at December 31, 2008. At December 31, 2009, non-performing commercial mortgage loans consisted primarily of two loans to a single real estate developer. The first is an $11.4 million loan secured by a planned unit development of 203 single family detached townhouse and age restricted units; and the second is a $8.5 million commercial mortgage loan secured by a 184-unit, age restricted townhouse project.
At December 31, 2009, the Company held $6.4 million of foreclosed assets, compared with $3.4 million at December 31, 2008. Foreclosed assets at December 31, 2009 are carried at fair value based on recent appraisals and valuation estimates, less estimated selling costs. Foreclosed assets consisted of $3.1 million of commercial real estate, $2.0 million of residential properties, and $1.3 million of marine vessels at December 31, 2009.
Non-performing assets totaled $90.9 million, or 1.33% of total assets at December 31, 2009, compared to $62.6 million, or 0.96% of total assets at December 31, 2008.
If the non-accrual loans had performed in accordance with their original terms, interest income would have increased by $2.4 million during the year ended December 31, 2009.
Allowance for Loan Losses. The allowance for loan losses is a valuation account that reflects an evaluation of the probable losses in the loan portfolio. The allowance for loan losses is maintained through provisions for loan losses that are charged to income. Charge-offs against the allowance for loan losses are taken on loans where it is determined the collection of loan principal is unlikely. Recoveries made on loans that have been charged-off are credited to the allowance for loan losses.
Management’s evaluation of the adequacy of the allowance for loan losses includes the review of all loans on which the collectibility of principal may not be reasonably assured. For residential mortgage and consumer loans this is determined primarily by delinquency and collateral values. For commercial real estate and commercial loans, an extensive review of financial performance, payment history and collateral values is conducted on a quarterly basis.
As part of its evaluation of the adequacy of the allowance for loan losses, each quarter management prepares a worksheet. This worksheet categorizes the entire loan portfolio by certain risk characteristics such as loan type (residential mortgage, commercial mortgage, construction, commercial, etc.) and loan risk rating. The factors considered in assessing loan risk ratings include the following:
| • | results of the routine loan quality reviews by the Loan Review Department and by outside third parties retained by the Loan Review Department; |
| • | general economic and business conditions affecting key lending areas; |
14
Table of Contents
| • | credit quality trends (including trends in non-performing loans, including anticipated trends based on market conditions); |
| • | collateral values; |
| • | loan volumes and concentrations; |
| • | seasoning of the loan portfolio; |
| • | specific industry conditions within portfolio segments; |
| • | recent loss experience in particular segments of the loan portfolio; and |
| • | duration and breadth of the current business cycle. |
When assigning a risk rating to a loan, management utilizes the Bank’s internal nine-point risk rating system. Loans deemed to be “acceptable quality” are rated 1 through 4, with a rating of 1 established for loans with minimal risk. Loans that are deemed to be of “questionable quality” are rated 5 (watch) or 6 (special mention). Loans with adverse classifications (substandard, doubtful or loss) are rated 7, 8 or 9, respectively. Commercial mortgage, commercial, multi-family and construction loans are rated individually, and each lending officer is responsible for risk rating loans in his or her portfolio. These risk ratings are then reviewed by the department manager and/or the Chief Lending Officer and by the Credit Administration Department. The risk ratings are then confirmed by the Loan Review Department, and for loans requiring Credit Committee approval, are periodically reviewed by the Credit Committee in the credit renewal or approval process.
Each quarter the lending groups prepare individual Credit Risk Management Reports for the Credit Administration Department. These reports review all commercial loans and commercial mortgage loans that have been determined to involve above-average risk (risk rating of 5 or worse). The Credit Risk Management Reports contain the reason for the risk rating assigned to each loan, status of the loan and any current developments. These reports are submitted to a committee chaired by the Credit Administration Officer. Each loan officer reviews the loan and the corresponding Credit Risk Management Report with the committee and the risk rating is evaluated for appropriateness.
Management assigns general valuation allowance (“GVA”) percentages to each risk rating category for use in allocating the allowance for loan losses, giving consideration to historical loss experience by loan type. The appropriateness of these percentages is evaluated by management at least annually. In the second quarter of 2009, management completed its most recent evaluation of the GVA percentages. In that evaluation, the historical “look-back” period for assessing the magnitude of potential losses was shortened from five years to two years in recognition of recent macroeconomic and real estate market conditions, resulting in increases to certain GVA allocation percentages.
The reserve factors applied to each loan risk rating are inherently subjective in nature. Reserve factors are assigned to each of the risk rating categories. This methodology permits adjustments to the allowance for loan losses in the event that, in management’s judgment, significant conditions impacting the credit quality and collectibility of the loan portfolio as of the evaluation date are not otherwise adequately reflected in the analysis.
The provision for loan losses is established after considering the allowance for loan loss worksheet, the amount of the allowance for loan losses in relation to the total loan balance, loan portfolio growth, loan portfolio composition, loan delinquency trends and peer group analysis. As a result of this process, management has established an unallocated portion of the allowance for loan losses. The unallocated portion of the allowance for loan losses is warranted based on factors such as the geographic concentration of the loan portfolio, current economic conditions and the losses inherent in commercial lending, as these types of loans are typically riskier than residential mortgages.
Based on the composition of the loan portfolio, management believes the primary risks inherent in the portfolio are a possible further decline in the economy, prolonged high unemployment levels, a possible further
15
Table of Contents
decline in real estate market values and possible increases in interest rates. Management will continue to review the entire loan portfolio to determine the extent, if any, to which further additional loan loss provisions may be deemed necessary. The allowance for loan losses is maintained at a level that represents management’s best estimate of probable losses related to specifically identified loans as well as probable losses inherent in the remaining loan portfolio. There can be no assurance that the allowance for loan losses will be adequate to cover all losses that may in fact be realized in the future or that additional provisions for loan losses will not be required.
Analysis of the Allowance for Loan Losses. The following table sets forth the analysis of the allowance for loan losses for the periods indicated.
| Year Ended December 31, | ||||||||||||||||||||
| 2009 | 2008 | 2007 | 2006 | 2005 | ||||||||||||||||
| (Dollars in thousands) | ||||||||||||||||||||
| Balance at beginning of period |
$ | 47,712 | $ | 40,782 | $ | 32,434 | $ | 31,980 | $ | 33,766 | ||||||||||
| Charge offs: |
||||||||||||||||||||
| Residential mortgage loans |
2,712 | 20 | 24 | 9 | 18 | |||||||||||||||
| Commercial mortgage loans |
619 | 3,529 | — | — | 22 | |||||||||||||||
| Multi-family mortgage loans |
— | — | — | — | — | |||||||||||||||
| Construction loans |
1,089 | 88 | — | — | — | |||||||||||||||
| Commercial loans |
7,576 | 1,967 | 1,044 | 1,025 | 1,008 | |||||||||||||||
| Consumer loans |
7,624 | 4,821 | 2,127 | 1,800 | 2,986 | |||||||||||||||
| Total |
19,620 | 10,425 | 3,195 | 2,834 | 4,034 | |||||||||||||||
| Recoveries: |
||||||||||||||||||||
| Residential mortgage loans |
19 | 2 | 138 | 158 | 155 | |||||||||||||||
| Commercial mortgage loans |
6 | 480 | 13 | 14 | 93 | |||||||||||||||
| Multi-family mortgage loans |
— | — | — | — | — | |||||||||||||||
| Construction loans |
— | 88 | — | — | — | |||||||||||||||
| Commercial loans |
1,367 | 372 | 622 | 305 | 340 | |||||||||||||||
| Consumer loans |
1,010 | 1,313 | 1,415 | 1,491 | 1,060 | |||||||||||||||
| Total |
2,402 | 2,255 | 2,188 | 1,968 | 1,648 | |||||||||||||||
| Net charge-offs |
17,218 | 8,170 | 1,007 | 866 | 2,386 | |||||||||||||||
| Provision for loan losses |
30,250 | 15,100 | 6,530 | 1,320 | 600 | |||||||||||||||
| Allowance of acquired institution |
— | — | 2,825 | — | — | |||||||||||||||
| Balance at end of period |
$ | 60,744 | $ | 47,712 | $ | 40,782 | $ | 32,434 | $ | 31,980 | ||||||||||
| Ratio of net charge-offs during the period to average loans outstanding during the period |
0.39 | % | 0.19 | % | 0.02 | % | 0.02 | % | 0.07 | % | ||||||||||
| Allowance for loan losses to total loans |
1.39 | % | 1.05 | % | 0.95 | % | 0.86 | % | 0.86 | % | ||||||||||
| Allowance for loan losses to non-performing loans |
71.91 | % | 80.71 | % | 117.72 | % | 429.65 | % | 532.56 | % | ||||||||||
16
Table of Contents
Allocation of Allowance for Loan Losses. The following table sets forth the allocation of the allowance for loan losses by loan category for the periods indicated. This allocation is based on management’s assessment, as of a given point in time, of the risk characteristics of each of the component parts of the total loan portfolio and is subject to changes as and when the risk factors of each such component part change. The allocation is neither indicative of the specific amounts or the loan categories in which future charge-offs may be taken, nor is it an indicator of future loss trends. The allocation of the allowance to each category does not restrict the use of the allowance to absorb losses in any category.
| At December 31, | ||||||||||||||||||||||||||||||
| 2009 | 2008 | 2007 | 2006 | 2005 | ||||||||||||||||||||||||||
| Amount of Allowance for Loan Losses |
Percent of Loans in Each Category to Total Loans |
Amount of Allowance for Loan Losses |
Percent of Loans in Each Category to Total Loans |
Amount of Allowance for Loan Losses |
Percent of Loans in Each Category to Total Loans |
Amount of Allowance for Loan Losses |
Percent of Loans in Each Category to Total Loans |
Amount of Allowance for Loan Losses |
Percent of Loans in Each Category to Total Loans |
|||||||||||||||||||||
| (Dollars in thousands) | ||||||||||||||||||||||||||||||
| Residential mortgage loans |
$ | 5,324 | 34.07 | % | $ | 4,142 | 39.70 | % | $ | 2,882 | 39.79 | % | $ | 2,736 | 43.01 | % | $ | 2,854 | 47.57 | % | ||||||||||
| Commercial mortgage loans |
23,578 | 24.90 | 14,938 | 20.44 | 8,977 | 19.78 | 8,873 | 18.59 | 7,246 | 15.96 | ||||||||||||||||||||
| Multi-family mortgage loans |
2,309 | 5.20 | 973 | 4.19 | 735 | 1.58 | 768 | 1.84 | 773 | 2.07 | ||||||||||||||||||||
| Construction loans |
4,134 | 4.48 | 5,264 | 5.17 | 7,947 | 7.22 | 4,837 | 7.50 | 4,397 | 7.77 | ||||||||||||||||||||
| Commercial loans |
16,572 | 17.95 | 12,697 | 16.68 | 10,841 | 16.61 | 6,311 | 13.35 | 5,676 | 11.70 | ||||||||||||||||||||
| Consumer loans |
5,964 | 13.40 | 6,854 | 13.82 | 6,764 | 15.02 | 6,119 | 15.71 | 5,760 | 14.93 | ||||||||||||||||||||
| Unallocated |
2,863 | — | 2,844 | — | 2,636 | — | 2,790 | — | 5,274 | — | ||||||||||||||||||||
| Total |
$ | 60,744 | 100.00 | % | $ | 47,712 | 100.00 | % | $ | 40,782 | 100.00 | % | $ | 32,434 | 100.00 | % | $ | 31,980 | 100.00 | % | ||||||||||
INVESTMENT ACTIVITIES
General. The Board of Directors annually approves the investment policy for the Bank and the Company. The Chief Financial Officer and the Treasurer are authorized by the Board to implement the investment policy and establish investment strategies. The Chief Executive Officer, Chief Financial Officer, Treasurer and Assistant Treasurer are authorized to make investment decisions consistent with the investment policy. Investment transactions for the Bank are reported to the Board of Directors of the Bank on a monthly basis.
The investment policy is designed to generate a favorable rate of return, consistent with established guidelines for liquidity, safety and diversification, and to complement the lending activities of the Bank. Investment decisions are made in accordance with the policy and are based on credit quality, interest rate risk, balance sheet composition, market expectations, liquidity, income and collateral needs.
The investment policy does not currently permit participation in hedging programs, interest rate swaps, options or futures transactions or the purchase of any securities that are below investment grade.
The investment strategy is to maximize the return on the investment portfolio consistent with guidelines that have been established for liquidity, safety, duration and diversification. The investment strategy also considers the Bank’s and the Company’s interest rate risk position as well as liquidity, loan demand and other factors. Acceptable investment securities include U. S. Treasury and Agency obligations, collateralized mortgage obligations (“CMOs”), corporate debt obligations, municipal bonds, mortgage-backed securities, commercial paper, mutual funds, bankers’ acceptances and Federal funds. Securities purchased for the investment portfolio require a minimum credit rating of “A” by Moody’s or Standard & Poor’s at the time of purchase.
Securities in the investment portfolio are classified as held to maturity, available for sale or held for trading. Securities that are classified as held to maturity are securities that the Bank or the Company has the intent and ability to hold until their contractual maturity date and are reported at cost. Securities that are classified as available for sale are reported at fair value. Available for sale securities include U.S. Treasury and Agency
17
Table of Contents
obligations, U.S. Agency and privately-issued CMOs, corporate debt obligations and equities. Sales of securities may occur from time to time in response to changes in market rates and liquidity needs and to facilitate balance sheet reallocation to effectively manage interest rate risk. At the present time, there are no securities that are classified as held for trading.
The Company conducts a periodic review and evaluation of the securities portfolio to determine if any declines in the fair values of securities are other-than-temporary. If such a decline were deemed other-than-temporary, the Company would measure the total credit-related component of the unrealized loss, and recognize that portion of the loss as a charge to current period earnings. The remaining portion of the unrealized loss would be recognized as an adjustment to accumulated other comprehensive income. The market value of the securities portfolio is significantly affected by changes in interest rates. In general, as interest rates rise, the market value of fixed-rate securities decreases and as interest rates fall, the market value of fixed-rate securities increases. The current turmoil in the credit markets has resulted in a lack of liquidity in the mortgage-backed securities market. Increases in delinquencies and foreclosures have resulted in limited trading activity and significant price declines, regardless of favorable movements in interest rates. The Company evaluates if it has the intent to sell these securities and if it is not more likely than not that the Company would be required to sell the securities before the anticipated recovery.
CMOs are a type of debt security issued by a special-purpose entity that aggregates pools of mortgages and mortgage-related securities and creates different classes of CMO securities with varying maturities and amortization schedules as well as a residual interest with each class possessing different risk characteristics. In contrast to pass-through mortgage-backed securities from which cash flow is received (and prepayment risk is shared) pro rata by all securities holders, the cash flow from the mortgages or mortgage-related securities underlying CMOs is paid in accordance with predetermined priority to investors holding various tranches of such securities or obligations. A particular tranche of CMOs may therefore carry prepayment risk that differs from that of both the underlying collateral and other tranches. Accordingly, CMOs attempt to moderate risks associated with conventional mortgage-related securities resulting from unexpected prepayment activity. In declining interest rate environments, the Bank attempts to purchase CMOs with principal lock-out periods, reducing prepayment risk in the investment portfolio. During rising interest rate periods, the Bank’s strategy is to purchase CMOs that are receiving principal payments that can be reinvested at higher current yields. Investments in CMOs involve a risk that actual prepayments will differ from those estimated in pricing the security, which may result in adjustments to the net yield on such securities. Additionally, the market value of such securities may be adversely affected by changes in the market interest rates. Management believes these securities may represent attractive alternatives relative to other investments due to the wide variety of maturity, repayment and interest rate options available. At December 31, 2009, the Bank held $124.3 million in privately-issued CMO’s in the investment portfolio. The Bank and the Company do not invest in collateralized debt obligations, mortgage-related securities secured by sub-prime loans, or any preferred equity securities.
18
Table of Contents
Amortized Cost and Fair Value of Securities. The following table sets forth certain information regarding the amortized cost and fair values of the Company’s securities as of the dates indicated.
| At December 31, | ||||||||||||||||||
| 2009 | 2008 | 2007 | ||||||||||||||||
| Amortized Cost | Fair Value | Amortized Cost | Fair Value | Amortized Cost | Fair Value | |||||||||||||
| (Dollars in thousands) | ||||||||||||||||||
| Held to Maturity: |
||||||||||||||||||
| Mortgage-backed securities |
$ | 64,197 | $ | 65,553 | $ | 91,435 | $ | 91,109 | $ | 120,254 | $ | 119,894 | ||||||
| FNMA obligations |
500 | 496 | — | — | — | — | ||||||||||||
| FFCB obligations |
500 | 496 | — | — | — | — | ||||||||||||
| State and municipal obligations |
260,455 | 268,286 | 256,049 | 260,514 | 238,237 | 239,805 | ||||||||||||
| Corporate obligations |
9,422 | 9,554 | — | — | — | — | ||||||||||||
| Total held-to-maturity |
$ | 335,074 | $ | 344,385 | $ | 347,484 | $ | 351,623 | $ | 358,491 | $ | 359,699 | ||||||
| Available for Sale: |
||||||||||||||||||
| U.S. Treasury obligations |
$ | — | $ | — | $ | 997 | $ | 1,013 | $ | 3,980 | $ | 4,035 | ||||||
| State and municipal obligations |
12,199 | 12,701 | 17,664 | 18,107 | 20,678 | 20,912 | ||||||||||||
| Mortgage-backed securities |
1,076,467 | 1,084,680 | 692,020 | 689,461 | 646,056 | 645,622 | ||||||||||||
| FHLMC obligations |
10,045 | 10,286 | 20,102 | 20,826 | 32,084 | 32,504 | ||||||||||||
| FNMA obligations |
— | — | — | — | 10,006 | 10,072 | ||||||||||||
| FHLB obligations |
213,906 | 215,565 | 66,249 | 68,546 | 26,000 | 26,119 | ||||||||||||
| FFCB obligations |
— | — | 5,009 | 5,102 | 5,031 | 5,095 | ||||||||||||
| Corporate obligations |
9,567 | 9,931 | 3,558 | 3,345 | 3,977 | 3,984 | ||||||||||||
| Equity securities |
— | — | 14,617 | 13,929 | 22,822 | 21,272 | ||||||||||||
| Total available for sale |
$ | 1,322,184 | $ | 1,333,163 | $ | 820,216 | $ | 820,329 | $ | 770,634 | $ | 769,615 | ||||||
| Average expected life of securities(1) |
3.14 years | 3.42 years | 3.96 years | |||||||||||||||
| (1) | Average expected life is based on prepayment assumptions utilizing prevailing interest rates as of the reporting dates and does not include equity securities. |
The aggregate carrying values and fair values of securities by issuer, where the aggregate book value of such securities exceeds ten percent of stockholders’ equity are as follows (in thousands):
| Carrying Value | Fair Value | |||||
| At December 31, 2009: |
||||||
| FNMA |
$ | 367,596 | $ | 375,476 | ||
| FHLMC |
520,477 | 531,804 | ||||
| FHLB |
213,906 | 215,566 | ||||
| GNMA |
129,734 | 129,460 | ||||
19
Table of Contents
The following table sets forth certain information regarding the carrying value, weighted average yields and contractual maturities of the Company’s debt securities portfolio as of December 31, 2009. No tax equivalent adjustments were made to the weighted average yields. Amounts are shown at amortized cost for held to maturity securities and at fair value for available for sale securities.
| At December 31, 2009 | ||||||||||||||||||||||||||||||
| One Year or Less | More Than One Year to Five Years |
More Than Five Years to Ten Years |
After Ten Years | Total | ||||||||||||||||||||||||||
| Carrying Value |
Weighted Average Yield |
Carrying Value |
Weighted Average Yield |
Carrying Value |
Weighted Average Yield |
Carrying Value |
Weighted Average Yield |
Carrying Value |
Weighted Average Yield(1) |
|||||||||||||||||||||
| (Dollars in thousands) | ||||||||||||||||||||||||||||||
| Held to Maturity: |
||||||||||||||||||||||||||||||
| Mortgage-backed securities |
$ | — | — | % | $ | — | — | % | $ | 31,374 | 4.61 | % | $ | 32,823 | 4.96 | % | $ | 64,197 | 4.79 | % | ||||||||||
| Agency obligations |
— | — | 1,000 | 1.79 | — | — | — | — | 1,000 | 1.79 | ||||||||||||||||||||
| Corporate obligations |
260 | 2.55 | 9,162 | 3.03 | — | — | — | — | 9,422 | 3.02 | ||||||||||||||||||||
| State and municipal obligations |
12,824 | 3.26 | 80,681 | 3.64 | 101,306 | 3.81 | 65,644 | 3.89 | 260,455 | 3.75 | ||||||||||||||||||||
| Total held to maturity |
$ | 13,084 | 3.24 | % | $ | 90,843 | 3.56 | % | $ | 132,680 | 4.00 | % | $ | 98,467 | 4.25 | % | $ | 335,074 | 3.92 | % | ||||||||||
| Available for sale: |
||||||||||||||||||||||||||||||
| State and municipal obligations |
$ | 1,381 | 4.32 | % | $ | 5,029 | 3.63 | % | $ | 6,291 | 4.08 | % | $ | — | — | % | $ | 12,701 | 3.93 | % | ||||||||||
| Mortgage-backed securities |
2,466 | 4.12 | 18,853 | 4.29 | 226,308 | 4.25 | 837,053 | 4.11 | 1,084,680 | 4.14 | ||||||||||||||||||||
| Agency obligations |
169,715 | 1.12 | 56,136 | 2.47 | — | — | — | — | 225,851 | 1.45 | ||||||||||||||||||||
| Corporate obligations |
— | — | 9,931 | 4.32 | — | — | — | — | 9,931 | 4.32 | ||||||||||||||||||||
| Total available for sale |
$ | 173,562 | 1.19 | % | $ | 89,949 | 3.12 | % | $ | 232,599 | 4.25 | % | $ | 837,053 | 4.11 | % | $ | 1,333,163 | 3.69 | % | ||||||||||
| (1) | Yields are not tax equivalent. |
SOURCES OF FUNDS
General. Primary sources of funds consist of principal and interest cash flows received from loans and mortgage-backed securities, contractual maturities on investments, deposits, Federal Home Loan Bank (“FHLB”) advances and proceeds from sales of loans and investments. These sources of funds are used for lending, investing and general corporate purposes, including acquisitions and common stock repurchases.
Deposits. The Bank offers a variety of deposits for retail and business accounts. Deposit products include savings accounts, checking accounts, interest-bearing checking accounts, money market deposit accounts and certificate of deposit accounts at varying interest rates and terms. The Bank also offers IRA and KEOGH accounts. Business customers are offered several checking account and savings plans, cash management services, remote deposit capture services, payroll origination services, escrow account management and business credit cards. The Bank’s customer relationship management strategy focuses on relationship banking for retail and business customers to enhance the customer experience. Deposit activity is influenced by state and local economic conditions, changes in interest rates, internal pricing decisions and competition. Deposits are primarily obtained from the areas surrounding the Bank’s branch locations. To attract and retain deposits, the Bank offers competitive rates, quality customer service and a wide variety of products and services that meet customers’ needs, including online banking. The Bank has no brokered deposits.
20
Table of Contents
Deposit pricing strategy is monitored monthly by the management Asset/Liability Committee. Deposit pricing is set weekly by the Bank’s Treasury Department. When considering deposit pricing, the Bank considers competitive market rates, FHLB advance rates and rates on other sources of funds. Core deposits, defined as savings accounts, interest and non-interest bearing checking accounts and money market deposit accounts represented 69.2% of total deposits at December 31, 2009 and 63.7% of total deposits at December 31, 2008. As of December 31, 2009 and December 31, 2008, time deposits maturing in less than one year amounted to $1.12 billion and $1.17 billion, respectively.
The following table indicates the amount of certificates of deposit by time remaining until maturity as of December 31, 2009.
| Maturity | |||||||||||||||
| 3 Months or Less |
Over 3 to 6 Months |
Over 6 to 12 Months |
Over 12 Months |
Total | |||||||||||
| (In thousands) | |||||||||||||||
| Certificates of deposit of $100,000 or more |
$ | 133,198 | $ | 83,636 | $ | 112,697 | $ | 139,782 | $ | 469,313 | |||||
| Certificates of deposit less than $100,000 |
315,076 | 235,016 | 235,535 | 252,670 | 1,038,297 | ||||||||||
| Total certificates of deposit |
$ | 448,274 | $ | 318,652 | $ | 348,232 | $ | 392,452 | $ | 1,507,610 | |||||
Certificates of Deposit Maturities. The following table sets forth certain information regarding certificates of deposit.
| Period to Maturity from December 31, 2009 | At December 31, | ||||||||||||||||||||||||||
| Less Than One Year |
One to Two Years |
Two to Three Years |
Three to Four Years |
Four to Five Years |
Five Years or More |
2009 | 2008 | 2007 | |||||||||||||||||||
| (In thousands) | |||||||||||||||||||||||||||
| Rate: |
|||||||||||||||||||||||||||
| 0.00 to 0.99% |
$ | 349,194 | $ | 156 | $ | 4 | $ | 1 | $ | 1 | $ | — | $ | 349,356 | $ | 3,226 | $ | 3,779 | |||||||||
| 1.00 to 2.00% |
332,835 | 117,017 | 2,121 | 112 | 143 | 133 | 452,361 | 29,094 | 201 | ||||||||||||||||||
| 2.01 to 3.00% |
168,293 | 14,568 | 24,467 | 55 | 39,439 | — | 246,822 | 782,708 | 14,867 | ||||||||||||||||||
| 3.01 to 4.00% |
203,793 | 15,154 | 2,083 | 23,880 | 47,816 | 3 | 292,729 | 515,531 | 435,883 | ||||||||||||||||||
| 4.01 to 5.00% |
58,534 | 13,704 | 19,322 | 42,211 | 3,294 | 827 | 137,892 | 170,229 | 1,053,351 | ||||||||||||||||||
| 5.01 to 6.00% |
451 | 15,415 | 9,221 | 262 | 25 | — | 25,374 | 28,242 | 127,708 | ||||||||||||||||||
| 6.01 to 7.00% |
2,054 | 758 | 159 | — | — | — | 2,971 | 3,415 | 3,532 | ||||||||||||||||||
| Over 7.01% |
4 | — | 45 | — | 35 | 21 | 105 | 66 | 149 | ||||||||||||||||||
| Total |
$ | 1,115,158 | $ | 176,772 | $ | 57,422 | $ | 66,521 | $ | 90,753 | $ | 984 | $ | 1,507,610 | $ | 1,532,511 | $ | 1,639,470 | |||||||||
Borrowed Funds. At December 31, 2009, the Bank had $999.2 million of borrowed funds. Borrowed funds consist primarily of FHLB advances and repurchase agreements. Repurchase agreements are contracts for the sale of securities owned or borrowed by the Bank, with an agreement to repurchase those securities at an agreed-upon price and date. The Bank uses wholesale repurchase agreements, as well as retail repurchase agreements as an investment vehicle for its commercial sweep checking product. Bank policies limit the use of repurchase agreements to collateral consisting of U.S. Treasury obligations, U.S. government agency obligations or mortgage-related securities.
As a member of the FHLB of New York, the Bank is eligible to obtain advances upon the security of the FHLB common stock owned and certain residential mortgage loans, provided certain standards related to credit-worthiness have been met. FHLB advances are available pursuant to several credit programs, each of which has its own interest rate and range of maturities.
21
Table of Contents
The following table sets forth the maximum month-end balance and average monthly balance of FHLB advances and securities sold under agreements to repurchase for the periods indicated.
| Year Ended December 31, | ||||||||||||
| 2009 | 2008 | 2007 | ||||||||||
| (Dollars in thousands) | ||||||||||||
| Maximum Balance: |
||||||||||||
| FHLB advances |
$ | 532,066 | $ | 650,425 | $ | 522,544 | ||||||
| FHLB line of credit |
75,000 | 106,000 | 96,000 | |||||||||
| Securities sold under agreements to repurchase |
618,034 | 606,749 | 537,315 | |||||||||
| Average Balance: |
||||||||||||
| FHLB advances |
529,303 | 529,859 | 344,087 | |||||||||
| FHLB line of credit |
11,444 | 67,727 | 49,657 | |||||||||
| Securities sold under agreements to repurchase |
515,976 | 565,945 | 439,217 | |||||||||
| Weighted Average Interest Rate: |
||||||||||||
| FHLB advances |
3.98 | % | 3.96 | % | 3.83 | % | ||||||
| FHLB line of credit |
0.55 | 1.84 | 5.33 | |||||||||
| Securities sold under agreements to repurchase |
3.08 | 3.73 | 4.32 | |||||||||
The following table sets forth certain information as to borrowings at the dates indicated.
| At December 31, | ||||||||||||
| 2009 | 2008 | 2007 | ||||||||||
| (Dollars in thousands) | ||||||||||||
| FHLB advances |
$ | 519,947 | $ | 557,277 | $ | 522,544 | ||||||
| FHLB line of credit |
— | 96,000 | 72,000 | |||||||||
| Securities sold under repurchase agreements |
479,286 | 594,404 | 480,560 | |||||||||
| Total borrowed funds |
$ | 999,233 | $ | 1,247,681 | $ | 1,075,104 | ||||||
| Weighted average interest rate of FHLB advances |
3.93 | % | 3.83 | % | 3.92 | % | ||||||
| Weighted average interest rate of FHLB line of credit |
— | % | 0.45 | % | 4.17 | % | ||||||
| Weighted average interest rate of securities sold under agreements to repurchase |
2.87 | % | 3.32 | % | 4.47 | % | ||||||
WEALTH MANAGEMENT SERVICES
The Bank’s Wealth Management Group is a growing provider of asset management services in New Jersey. The services are often introduced to existing clients through the Bank’s extensive branch network and lenders throughout the state. It offers a full range of asset management services to individuals, municipalities, non-profits, corporations and pension funds. These services include investment management, asset allocation, trust and fiduciary services, financial planning, family office services, estate settlement services and custody. The Wealth Management Group focuses on delivering personalized investment strategies based on the client’s risk profile. These strategies are focused on maximizing clients’ investment returns, while minimizing expenses. Most of the fee income generated by the Wealth Management Group is based on assets under administration.
SUBSIDIARY ACTIVITIES
Provident Investment Services, Inc. is a wholly-owned subsidiary of the Bank. It was established as a New Jersey corporation to provide life and health insurance in the State of New Jersey and conducts non-deposit investment product and insurance sales.
Dudley Investment Corporation is a wholly-owned subsidiary of the Bank, which operates as a New Jersey Investment Company. Dudley Investment Corporation owns all of the outstanding common stock of Gregory Investment Corporation.
22
Table of Contents
Gregory Investment Corporation is a wholly-owned subsidiary of Dudley Investment Corporation. Gregory Investment Corporation operates as a Delaware Investment Company. Gregory Investment Corporation owns all of the outstanding common stock of PSB Funding Corporation.
PSB Funding Corporation is a majority-owned subsidiary of Gregory Investment Corporation. It was established as a New Jersey corporation to engage in real estate activities (including the acquisition of mortgage loans from the Bank) that enable it to be taxed as a real estate investment trust for Federal and New Jersey tax purposes.
TPB Realty, LLC, is a wholly-owned subsidiary of the Bank formed to invest in real estate development joint ventures principally targeted at meeting the housing needs of low- and moderate-income communities in the Bank’s market. At December 31, 2009, TPB Realty had total assets of $2.9 million.
Bergen Avenue Realty, LLC, is a wholly-owned subsidiary of the Bank formed to manage and sell real estate acquired through foreclosure. At December 31, 2009, Bergen Avenue Realty had total assets of $2.9 million.
PERSONNEL
As of December 31, 2009, the Company had 863 full-time and 135 part-time employees. None of the Company’s employees were represented by a collective bargaining group. The Company believes its working relationship with its employees is good.
REGULATION
General
As a bank holding company controlling the Bank, the Company is subject to the Bank Holding Company Act of 1956, as amended (“BHCA”), and the rules and regulations of the Federal Reserve Board under the BHCA. The Company is also subject to the provisions of the New Jersey Banking Act of 1948 (the “New Jersey Banking Act”) and the regulations of the Commissioner of the New Jersey Department of Banking and Insurance (“Commissioner”) under the New Jersey Banking Act applicable to bank holding companies. The Company and the Bank are required to file reports with, and otherwise comply with the rules and regulations of the Federal Reserve Board and the Commissioner. The Federal Reserve Board and the Commissioner conduct periodic examinations to assess the Company’s compliance with various regulatory requirements. The Company files certain reports with, and otherwise complies with, the rules and regulations of the SEC under the federal securities laws and the listing requirements of the New York Stock Exchange.
The Bank is a New Jersey chartered savings bank, and its deposit accounts are insured up to applicable limits by the Federal Deposit Insurance Corporation (“FDIC”). The Bank is subject to extensive regulation, examination and supervision by the Commissioner as the issuer of its charter, and by the FDIC as the deposit insurer. The Bank must file reports with the Commissioner and the FDIC concerning its activities and financial condition, and it must obtain regulatory approval prior to entering into certain transactions, such as mergers with, or acquisitions of, other depository institutions and opening or acquiring branch offices. The Commissioner and the FDIC conduct periodic examinations to assess the Bank’s compliance with various regulatory requirements. This regulation and supervision establishes a comprehensive framework of activities in which a savings bank can engage and is intended primarily for the protection of the deposit insurance fund and depositors. The regulatory structure also gives the regulatory authorities extensive discretion in connection with their supervisory and enforcement activities and examination policies, including policies with respect to the classification of assets and the establishment of adequate loan loss reserves for regulatory purposes.
Any change in applicable laws and regulations, whether by the Commissioner, the FDIC, the Federal Reserve Board or through legislation, could have a material adverse impact on the Company and the Bank and their operations and stockholders.
23
Table of Contents
New Jersey Banking Regulation
Activity Powers. The Bank derives its lending, investment and other activity powers primarily from the applicable provisions of the New Jersey Banking Act and its related regulations. Under these laws and regulations, savings banks, including the Bank, generally may, subject to certain limits, invest in:
| (1) | real estate mortgages; |
| (2) | consumer and commercial loans; |
| (3) | specific types of debt securities, including certain corporate debt securities and obligations of federal, state and local governments and agencies; |
| (4) | certain types of corporate equity securities; and |
| (5) | certain other assets. |
A savings bank may also invest pursuant to a “leeway” power that permits investments not otherwise permitted by the New Jersey Banking Act, subject to certain restrictions imposed by the FDIC. “Leeway” investments must comply with a number of limitations on the individual and aggregate amounts of “leeway” investments. A savings bank may also exercise trust powers upon the approval of the Commissioner. New Jersey savings banks may exercise those powers, rights, benefits or privileges authorized for national banks or out-of-state banks or for federal or out-of-state savings banks or savings associations, provided that before exercising any such power, right, benefit or privilege, prior approval by the Commissioner by regulation or by specific authorization is required. The exercise of these lending, investment and activity powers is limited by federal law and the related regulations.
Loans-to-One-Borrower Limitations. With certain specified exceptions, a savings bank may not make loans or extend credit to a single borrower and to entities related to the borrower in an aggregate amount that would exceed 15% of the bank’s capital funds. A savings bank may lend an additional 10% of the bank’s capital funds if secured by collateral meeting the requirements of the New Jersey Banking Act. The Bank currently complies with applicable loans-to-one-borrower limitations.
Dividends. Under the New Jersey Banking Act, a stock savings bank may declare and pay a dividend on its capital stock only to the extent that the payment of the dividend would not impair the capital stock of the savings bank. In addition, a stock savings bank may not pay a dividend unless the savings bank would, after the payment of the dividend, have a surplus of not less than 50% of its capital stock, or the payment of the dividend would not reduce the surplus. Federal law may also limit the amount of dividends that may be paid by a stock savings bank.
Minimum Capital Requirements. Regulations of the Commissioner impose on New Jersey chartered depository institutions, including the Bank, minimum capital requirements similar to those imposed by the FDIC on insured state banks.
Examination and Enforcement. The New Jersey Department of Banking and Insurance may examine the Company and the Bank whenever it deems an examination advisable. The Department examines the Bank at least every two years. The Commissioner may order any savings bank to discontinue any violation of law or unsafe or unsound business practice and may direct any director, officer, attorney or employee of a savings bank engaged in an objectionable activity, after the Commissioner has ordered the activity to be terminated, to show cause at a hearing before the Commissioner why such person should not be removed.
Federal Banking Regulation
Capital Requirements. FDIC regulations require banks to maintain minimum levels of capital. The FDIC regulations define two tiers, or classes, of capital.
24
Table of Contents
Tier 1 capital is comprised of:
| • | common stockholders’ equity, less net unrealized holding losses on available-for-sale equity securities with readily determinable fair values; |
| • | non-cumulative perpetual preferred stock, including any related surplus; and |
| • | minority interests in consolidated subsidiaries minus all intangible assets, other than qualifying servicing rights and any net unrealized loss on marketable equity securities. |
Tier 2 capital is comprised of:
| • | cumulative perpetual preferred stock; |
| • | certain perpetual preferred stock for which the dividend rate may be reset periodically; |
| • | hybrid capital instruments, including mandatorily convertible securities; |
| • | term subordinated debt; |
| • | intermediate term preferred stock; |
| • | allowance for loan losses; and |
| • | up to 45% of pre-tax net unrealized holding gains on available for sale equity securities with readily determinable fair values. |
The allowance for loan losses may be includible in Tier 2 capital up to a maximum of 1.25% of risk-weighted assets. Overall, the amount of Tier 2 capital that may be included in total capital cannot exceed 100% of Tier 1 capital. The FDIC regulations establish a minimum leverage capital requirement for banks in the strongest financial and managerial condition, with a rating of 1 (the highest examination rating of the FDIC for banks) under the Uniform Financial Institutions Rating System that are not anticipating or experiencing significant growth, of not less than a ratio of 3.0% of Tier 1 capital to total assets. For all other banks, the minimum leverage capital requirement is 4.0%, unless a higher leverage capital ratio is warranted by the particular circumstances or risk profile of the bank.
The FDIC regulations also establish a risk-based capital standard. The risk-based capital standard requires the maintenance of a ratio of total capital, which is defined as the sum of Tier 1 capital and Tier 2 capital, to risk-weighted assets of at least 8% and a ratio of Tier 1 capital to risk-weighted assets of at least 4%. In determining the amount of a bank’s risk-weighted assets, all assets, plus certain off balance sheet items, are multiplied by a risk-weight of 0% to 100%, based on the risks the FDIC believes are inherent in the type of asset or item.
The federal banking agencies, including the FDIC, have also adopted regulations to require an assessment of a bank’s exposure to declines in the economic value of a bank’s capital due to changes in interest rates when assessing such bank’s capital adequacy. Under such a risk assessment, examiners will evaluate a bank’s capital for interest rate risk on a case-by-case basis, with consideration of both quantitative and qualitative factors. According to the agencies, applicable considerations include:
| • | the quality of a bank’s interest rate risk management process; |
| • | the overall financial condition of the bank; and |
| • | the level of other risks at the bank for which capital is needed. |
Institutions with significant interest rate risk may be required to maintain additional capital.
25
Table of Contents
The following table shows the Bank’s leverage ratio, Tier 1 risk-based capital ratio, and total risk-based capital ratio, at December 31, 2009:
| As of December 31, 2009 | |||||||||
| Capital | Percent of Assets(1) |
Capital Requirements(1) |
|||||||
| (Dollars in thousands) | |||||||||
| Regulatory Tier 1 leverage capital |
$ | 418,996 | 6.44 | % | 4.00 | % | |||
| Tier 1 risk-based capital |
418,996 | 9.81 | 4.00 | ||||||
| Total risk-based capital |
472,499 | 11.06 | 8.00 | ||||||
| (1) | For purposes of calculating Regulatory Tier 1 leverage capital, assets are based on adjusted total leverage assets. In calculating Tier 1 risk-based capital and total risk-based capital, assets are based on total risk-weighted assets. |
As of December 31, 2009, the Bank was considered “well capitalized” under FDIC guidelines.
Capital Purchase Program. On October 14, 2008, the Capital Purchase Program (“CPP”) was announced by the Treasury Department as part of the Troubled Assets Relief Program, referred to as “TARP”. Pursuant to the CPP, the Treasury proposed to purchase up to $250 billion of senior preferred shares on standardized terms from qualifying financial institutions. The purpose of the CPP is to encourage U.S. financial institutions to build capital to increase the flow of financing to U.S. businesses and consumers and to support the U.S. economy. Under the CPP, an eligible financial institution could apply to the U.S. government to issue senior preferred shares to the Treasury in aggregate amounts between 1% and 3% of the institution’s risk-weighted assets. The Company was eligible to apply for an investment by the Treasury of between $40.1 million and $120.4 million. On November 10, 2008, the Company announced that it would not make application to participate in the CPP, citing the Company’s existing capital base which the Company deems adequate to support its growth plans and to provide a stable base for its ongoing lending operations.
Activity Restrictions on State-Chartered Banks. Federal law and FDIC regulations generally limit the activities and investments of state-chartered FDIC insured banks and their subsidiaries to those permissible for national banks and their subsidiaries, unless such activities and investments are specifically exempted by law or consented to by the FDIC.
Before making a new investment or engaging in a new activity that is not permissible for a national bank or otherwise permissible under federal law or FDIC regulations, an insured bank must seek approval from the FDIC to make such investment or engage in such activity. The FDIC will not approve the activity unless the bank meets its minimum capital requirements and the FDIC determines that the activity does not present a significant risk to the FDIC insurance funds. Certain activities of subsidiaries that are engaged in activities permitted for national banks only through a “financial subsidiary” are subject to additional restrictions.
Federal law permits a state-chartered savings bank to engage, through financial subsidiaries, in any activity in which a national bank may engage through a financial subsidiary and on substantially the same terms and conditions. In general, the law permits a national bank that is well-capitalized and well-managed to conduct, through a financial subsidiary, any activity permitted for a financial holding company other than insurance underwriting, insurance investments, real estate investment or development or merchant banking. The total assets of all such financial subsidiaries may not exceed the lesser of 45% of the bank’s total assets or $50 billion. The bank must have policies and procedures to assess the financial subsidiary’s risk and protect the bank from such risk and potential liability, must not consolidate the financial subsidiary’s assets with the bank’s and must exclude from its own assets and equity all equity investments, including retained earnings, in the financial subsidiary. The Bank currently meets all conditions necessary to establish and engage in permitted activities through financial subsidiaries.
26
Table of Contents
Federal Home Loan Bank System. The Bank is a member of the FHLB system which consists of twelve regional FHLBs, each subject to supervision and regulation by the Federal Housing Finance Board (“FHFB”). The FHLB provides a central credit facility primarily for member institutions. The Bank, as a member of the FHLB of New York, is required to purchase and hold shares of capital stock in that FHLB in an amount as required by that FHLB’s capital plan and minimum capital requirements. The Bank is in compliance with these requirements. The Bank has received dividends on its FHLB stock, although no assurance can be given that these dividends will continue to be paid. For the year ended December 31, 2009, dividends paid by the FHLB to the Bank totaled $1.8 million.
Deposit Insurance. As a member institution of the FDIC, deposit accounts at the Bank are insured generally up to a maximum of $100,000 for each separately insured depositor, and up to a maximum of $250,000 for self-directed retirement accounts. In 2009, however, the FDIC increased the deposit insurance available on all deposit accounts to $250,000, effective until December 31, 2013. Additionally, certain non-interest-bearing transaction accounts maintained with financial institutions participating in the FDIC’s Temporary Liquidity Guarantee Program (“TLG Program”) are fully insured regardless of the dollar amount until June 30, 2010. The FDIC implemented the TLG Program on November 21, 2008.
The Company is participating in the FDIC’s Temporary Account Guarantee (“TAG”) program which is a part of the TLG Program. Under the TAG, funds in non-interest bearing accounts, in interest-bearing transaction accounts with interest rates of 0.50% or less, and in Interest on Lawyers Trust Accounts will have a temporary unlimited guarantee from the FDIC until June 30, 2010. The coverage under the TAG is in addition to and separate from the coverage available under the FDIC’s general deposit insurance rules, which insure accounts up to $250,000. The TLG Program also guaranteed newly issued senior secured debt of banks, thrifts and certain holding companies. The Company had no outstanding debt guaranteed under the TLG program at December 31, 2009.
The FDIC imposes an assessment against financial institutions for deposit insurance. This assessment is based on the risk category of the institution and prior to 2009, ranged from 5 to 43 basis points of the institution’s deposits. On February 27, 2009, the FDIC issued a final rule raising the deposit insurance assessment rates to a range from 12 to 45 basis points. The rule was effective as of April 1, 2009.
On May 22, 2009, the FDIC issued a final rule imposing a 5 basis point special assessment on each insured depository institution’s assets minus Tier 1 capital as of June 30, 2009. The amount of the special assessment for any institution did not exceed 10 basis points times the institution’s assessment base for the second quarter of 2009. The Bank paid this special assessment in the amount of $3.1 million on September 30, 2009.
On November 12, 2009, the FDIC issued a rule that required depository institutions to prepay their estimated quarterly risk-based assessments for the fourth quarter of 2009 and for all of 2010, 2011 and 2012. These assessments were payable on December 30, 2009. The total prepaid assessment of $31.3 million was remitted to the FDIC on that date. Of that amount, $27.4 million was recorded as a prepaid asset as of December 31, 2009. Beginning with the first quarter of 2010, the Company will record an expense for its regular assessment for each quarter, with an offsetting credit to the prepaid asset until it is fully expensed.
The FDIC may terminate the insurance of an institution’s deposits upon a finding that the institution has engaged in unsafe or unsound practices, is in an unsafe or unsound condition to continue operations or has violated any applicable law, regulation, rule, order or condition imposed by the FDIC. Management is not aware of any practice, condition or violation that might lead to termination of the Bank’s deposit insurance.
Enforcement. The FDIC has extensive enforcement authority over insured savings banks, including the Bank. This enforcement authority includes, among other things, the ability to assess civil money penalties, to issue cease and desist orders and to remove directors and officers. In general, these enforcement actions may be initiated in response to violations of law and to unsafe or unsound practices.
27
Table of Contents
Transactions with Affiliates. Transactions between an insured bank, such as the Bank, and any of its affiliates are governed by Sections 23A and 23B of the Federal Reserve Act and its implementing regulations. An affiliate of a bank is any company or entity that controls, is controlled by or is under common control with the bank. A subsidiary of a bank that is not also a depository institution, financial subsidiary or other entity defined by the regulation generally is not treated as an affiliate of the bank for purposes of Sections 23A and 23B.
Section 23A:
| • | limits the extent to which a bank or its subsidiaries may engage in “covered transactions” with any one affiliate to an amount equal to 10% of such bank’s capital stock and retained earnings, and limits all such transactions with all affiliates to an amount equal to 20% of such capital stock and retained earnings; and |
| • | requires that all such transactions be on terms that are consistent with safe and sound banking practices. |
The term “covered transaction” includes the making of loans, purchase of assets, issuance of guarantees and other similar types of transactions. Further, most loans by a bank to any of its affiliates must be secured by collateral in amounts ranging from 100 to 130 percent of the loan amounts. In addition, any covered transaction by a bank with an affiliate and any purchase of assets or services by a bank from an affiliate must be on terms that are substantially the same, or at least as favorable to the bank, as those that would be provided to a non-affiliate.
Prohibitions Against Tying Arrangements. Banks are subject to statutory prohibitions on certain tying arrangements. A depository institution is prohibited, subject to certain exceptions, from extending credit to or offering any other service, or fixing or varying the consideration for such extension of credit or service, on the condition that the customer obtain some additional service from the institution or its affiliates or that the customer not obtain services of a competitor of the institution.
Privacy Standards. FDIC regulations require the Company and the Bank to disclose their privacy policies, including identifying with whom they share “non-public personal information” to customers at the time of establishing the customer relationship and annually thereafter.
The FDIC regulations also require the Company and the Bank to provide their customers with initial and annual notices that accurately reflect their privacy policies and practices. In addition, the Company and the Bank are required to provide their customers with the ability to “opt-out” of having the Company and the Bank share their non-public personal information with unaffiliated third parties before they can disclose such information, subject to certain exceptions.
Community Reinvestment Act and Fair Lending Laws. All FDIC insured institutions have a responsibility under the Community Reinvestment Act and related regulations to help meet the credit needs of their communities, including low- and moderate-income neighborhoods. In connection with its examination of a state chartered savings bank, the FDIC is required to assess the institution’s record of compliance with the Community Reinvestment Act. Among other things, the current Community Reinvestment Act regulations replace the prior process-based assessment factors with a new evaluation system that rates an institution based on its actual performance in meeting community needs. In particular, the current evaluation system focuses on three tests:
| • | a lending test, to evaluate the institution’s record of making loans in its service areas; |
| • | an investment test, to evaluate the institution’s record of investing in community development projects, affordable housing, and programs benefiting low- or moderate-income individuals and businesses; and |
| • | a service test, to evaluate the institution’s delivery of services through its branches, ATMs and other offices. |
28
Table of Contents
An institution’s failure to comply with the provisions of the Community Reinvestment Act could, at a minimum, result in regulatory restrictions on its activities, including, but not limited to, engaging in acquisitions and mergers. The Bank received an “Outstanding” Community Reinvestment Act rating in its most recently completed federal examination, which was conducted by the FDIC as of May 2008.
In addition, the Equal Credit Opportunity Act and the Fair Housing Act prohibit lenders from discriminating in their lending practices on the basis of characteristics specified in those statutes. An institution’s failure to comply with the Equal Credit Opportunity Act and the Fair Housing Act could result in enforcement actions by the FDIC, as well as other federal regulatory agencies and the Department of Justice.
Safety and Soundness Standards. Each federal banking agency, including the FDIC, has adopted guidelines establishing general standards relating to internal controls, information and internal audit systems, loan documentation, credit underwriting, interest rate exposure, asset growth, asset quality, earnings, compensation, fees and benefits. In general, the guidelines require, among other things, appropriate systems and practices to identify and manage the risks and exposures specified in the guidelines. The guidelines prohibit excessive compensation as an unsafe and unsound practice and describe compensation as excessive when the amounts paid are unreasonable or disproportionate to the services performed by an executive officer, employee, director, or principal stockholder.
In addition, FDIC regulations require a bank that is given notice by the FDIC that it is not satisfying any of such safety and soundness standards to submit a compliance plan to the FDIC. If, after being so notified, a bank fails to submit an acceptable compliance plan or fails in any material respect to implement an accepted compliance plan, the FDIC may issue an order directing corrective and other actions of the types to which a significantly undercapitalized institution is subject under the “prompt corrective action” provisions discussed below. If a bank fails to comply with such an order, the FDIC may seek to enforce such an order in judicial proceedings and to impose civil monetary penalties.
Prompt Corrective Action. Federal law requires the FDIC and the other federal banking regulators to promptly resolve the problems of undercapitalized institutions. Federal law also establishes five categories, consisting of “well capitalized,” “adequately capitalized,” “undercapitalized,” “significantly undercapitalized” and “critically undercapitalized.” The FDIC’s regulations define the five capital categories as follows:
An institution will be treated as “well capitalized” if:
| • | its ratio of total capital to risk-weighted assets is at least 10%; |
| • | its ratio of Tier 1 capital to risk-weighted assets is at least 6%; and |
| • | its ratio of Tier 1 capital to total assets is at least 5%, and it is not subject to any order or directive by the FDIC to meet a specific capital level. |
An institution will be treated as “adequately capitalized” if:
| • | its ratio of total capital to risk-weighted assets is at least 8%; or |
| • | its ratio of Tier 1 capital to risk-weighted assets is at least 4%; and |
| • | its ratio of Tier 1 capital to total assets is at least 4% (3% if the bank receives the highest rating under the Uniform Financial Institutions Rating System) and it is not a well-capitalized institution. |
An institution will be treated as “undercapitalized” if:
| • | its total risk-based capital is less than 8%; or |
| • | its Tier 1 risk-based-capital is less than 4%; and |
| • | its leverage ratio is less than 4% (or less than 3% if the institution receives the highest rating under the Uniform Financial Institutions Rating System). |
29
Table of Contents
An institution will be treated as “significantly undercapitalized” if:
| • | its total risk-based capital is less than 6%; |
| • | its Tier 1 capital is less than 3%; or |
| • | its leverage ratio is less than 3%. |
An institution that has a tangible capital to total assets ratio equal to or less than 2% would be deemed “critically undercapitalized.” The FDIC is required, with some exceptions, to appoint a receiver or conservator for an insured state bank if that bank is critically undercapitalized. The FDIC may also appoint a conservator or receiver for an insured state bank on the basis of the institution’s financial condition or upon the occurrence of certain events, including:
| • | insolvency, or when the assets of the bank are less than its liabilities to depositors and others; |
| • | substantial dissipation of assets or earnings through violations of law or unsafe or unsound practices; |
| • | existence of an unsafe or unsound condition to transact business; |
| • | likelihood that the bank will be unable to meet the demands of its depositors or to pay its obligations in the normal course of business; and |
| • | insufficient capital, or the incurring or likely incurring of losses that will substantially deplete all of the institution’s capital with no reasonable prospect of replenishment of capital without federal assistance. |
Regulatory Proposals. Numerous legislative proposals have been released in both houses of the U.S. Congress which would seek, among other things, to change or replace the government agencies that regulate the operations of the Company and/or the Bank. There can be no assurance as to which, if any, of these legislative proposals, or future proposals may ultimately be enacted into law, nor can their impact on the operations of the Company or the Bank be determined with any reasonable degree of certainty.
Loans to a Bank’s Insiders
Federal Regulation. A bank’s loans to its executive officers, directors, any owner of 10% or more of its stock (each, an insider) and any of certain entities affiliated with any such person (an insider’s related interest) are subject to the conditions and limitations imposed by Section 22(h) of the Federal Reserve Act and the Federal Reserve Board’s Regulation O. Under these restrictions, the aggregate amount of the loans to any insider and the insider’s related interests may not exceed the loans-to-one-borrower limit applicable to national banks, which is comparable to the loans-to-one-borrower limit applicable to loans by the Bank. All loans by a bank to all insiders and insiders’ related interests in the aggregate may not exceed the bank’s unimpaired capital and unimpaired surplus. With certain exceptions, loans to an executive officer, other than loans for the education of the officer’s children and certain loans secured by the officer’s residence, may not exceed at any one time the higher of 2.5% of the bank’s unimpaired capital and unimpaired surplus or $25,000, but in no event more than $100,000. Regulation O also requires that any proposed loan to an insider or a related interest of that insider be approved in advance by a majority of the board of directors of the bank, with any interested directors not participating in the voting, if such loan, when aggregated with any existing loans to that insider and the insider’s related interests, would exceed either (1) $500,000; or (2) the greater of $25,000 or 5% of the bank’s unimpaired capital and surplus. Generally, loans to insiders must be made on substantially the same terms as, and follow credit underwriting procedures that are not less stringent than, those that are prevailing at the time for comparable transactions with other persons, and not involve more than the normal risk of payment or present other unfavorable features.
An exception may be made for extensions of credit made pursuant to a benefit or compensation plan of a bank that is widely available to employees of the bank and that does not give any preference to insiders of the bank over other employees of the bank.
30
Table of Contents
In addition, federal law prohibits extensions of credit to a bank’s insiders and their related interests by any other institution that has a correspondent banking relationship with the bank, unless such extension of credit is on substantially the same terms as those prevailing at the time for comparable transactions with other persons and does not involve more than the normal risk of repayment or present other unfavorable features.
The Bank does not, as a matter of policy, make loans to its directors or to their immediate family members and related interests.
New Jersey Regulation. Provisions of the New Jersey Banking Act impose conditions and limitations on the liabilities to a savings bank of its directors and executive officers and of corporations and partnerships controlled by such persons that are comparable in many respects to the conditions and limitations imposed on the loans and extensions of credit to insiders and their related interests under Regulation O, as discussed above. The New Jersey Banking Act also provides that a savings bank that is in compliance with Regulation O is deemed to be in compliance with such provisions of the New Jersey Banking Act.
Federal Reserve System
Under Federal Reserve Board regulations, the Bank is required to maintain non-interest earning reserves against its transaction accounts. The Federal Reserve Board regulations generally require that reserves of 3% must be maintained against aggregate transaction accounts over $10.7 million and up to $55.2 million, subject to adjustment by the Federal Reserve Board, and an initial reserve of $1.0 million plus 10% against that portion of total transaction accounts in excess of up to $55.2 million. The first $10.7 million of otherwise reservable balances, subject to adjustments by the Federal Reserve Board, are exempted from the reserve requirements. The Bank is in compliance with these requirements. Because required reserves must be maintained in the form of either vault cash, a non-interest bearing account at a Federal Reserve Bank or a pass-through account as defined by the Federal Reserve Board, the effect of this reserve requirement is to reduce the Bank’s interest-earning assets.
Internet Banking
Technological developments continue to significantly alter the ways in which financial institutions conduct their business. The growth of the Internet has caused banks to adopt and refine alternative distribution and marketing systems. The federal bank regulatory agencies have conducted seminars and published materials targeted to various aspects of internet banking, and have indicated their intention to reevaluate their regulations to ensure that they encourage banks’ efficiency and competitiveness consistent with safe and sound banking practices. There can be no assurance that the bank regulatory agencies will adopt new regulations that will not materially affect the Bank’s internet operations or restrict any such further operations.
The USA PATRIOT Act
The USA PATRIOT Act was signed into law on October 26, 2001 and was renewed on March 9, 2006. The USA PATRIOT Act gives the federal government powers to address terrorist threats through enhanced domestic security measures, expanded surveillance powers, increased information sharing, and broadened anti-money laundering requirements. By way of amendments to the Bank Secrecy Act, Title III of the USA PATRIOT Act included measures intended to encourage information sharing among bank regulatory agencies and law enforcement bodies. Further, certain provisions of Title III imposed affirmative obligations on a broad range of financial institutions, including banks, thrifts, brokers, dealers, credit unions, money transfer agents and parties registered under the Commodity Exchange Act.
The bank regulatory agencies have increased the regulatory scrutiny of the Bank Secrecy Act and anti-money laundering programs maintained by financial institutions. Significant penalties and fines, as well as other supervisory orders may be imposed on a financial institution for non-compliance with these requirements. In
31
Table of Contents
addition, the federal bank regulatory agencies must consider the effectiveness of financial institutions engaging in a merger transaction in combating money laundering activities. The Bank has adopted policies and procedures which are in compliance with these requirements.
Holding Company Regulation
Federal Regulation. The Company is regulated as a bank holding company, and as such, is subject to examination, regulation and periodic reporting under the Bank Holding Company Act, as administered by the Federal Reserve Board. The Federal Reserve Board has adopted capital adequacy guidelines for bank holding companies on a consolidated basis substantially similar to those of the FDIC for the Bank. As of December 31, 2009, the Company’s total capital and Tier 1 capital ratios exceed these minimum capital requirements.
The following table shows the Company’s leverage ratio, Tier 1 risk-based capital ratio and the total risk-based capital ratio as of December 31, 2009:
| As of December 31, 2009 | |||||||||
| Capital | Percent of Assets(1) |
Capital Requirements(1) |
|||||||
| (Dollars in thousands) | |||||||||
| Regulatory Tier 1 leverage capital |
$ | 520,656 | 7.99 | % | 4.00 | % | |||
| Tier 1 risk-based capital |
520,656 | 12.17 | 4.00 | ||||||
| Total risk-based capital |
574,221 | 13.42 | 8.00 | ||||||
| (1) | For purposes of calculating Regulatory Tier 1 leverage capital, assets are based on adjusted total leverage assets. In calculating Tier 1 risk-based capital and total risk-based capital, assets are based on total risk-weighted assets. |
As of December 31, 2009, the Company was “well capitalized” under Federal Reserve Board guidelines.
Regulations of the Federal Reserve Board provide that a bank holding company must serve as a source of strength to any of its subsidiary banks and must not conduct its activities in an unsafe or unsound manner. Under the prompt corrective action provisions discussed above, a bank holding company parent of an undercapitalized subsidiary bank would be directed to guarantee, within limitations, the capital restoration plan that is required of such an undercapitalized bank. If the undercapitalized bank fails to file an acceptable capital restoration plan or fails to implement an accepted plan, the Federal Reserve Board may prohibit the bank holding company parent of the undercapitalized bank from paying any dividend or making any other form of capital distribution without the prior approval of the Federal Reserve Board.
As a bank holding company, the Company is required to obtain the prior approval of the Federal Reserve Board to acquire all, or substantially all, of the assets of any bank or bank holding company. Prior Federal Reserve Board approval will be required for the Company to acquire direct or indirect ownership or control of any voting securities of any bank or bank holding company if, after giving effect to such acquisition, it would, directly or indirectly, own or control more than 5% of any class of voting shares of such bank or bank holding company.
A bank holding company is required to give the Federal Reserve Board prior written notice of any purchase or redemption of its outstanding equity securities if the gross consideration for the purchase or redemption, when combined with the net consideration paid for all such purchases or redemptions during the preceding 12 months will be equal to 10% or more of the company’s consolidated net worth. The Federal Reserve Board may disapprove such a purchase or redemption if it determines that the proposal would constitute an unsafe and unsound practice, or would violate any law, regulation, Federal Reserve Board order or directive, or any condition imposed by, or written agreement with, the Federal Reserve Board. Such notice and approval is not required for a bank holding company that would be treated as “well capitalized” under applicable regulations of the Federal Reserve Board, is well-managed, and that is not the subject of any unresolved supervisory issues.
32
Table of Contents
In addition, a bank holding company which does not qualify as a financial holding company under applicable federal law is generally prohibited from engaging in, or acquiring direct or indirect control of any company engaged in non-banking activities. One of the principal exceptions to this prohibition is for activities found by the Federal Reserve Board to be so closely related to banking or managing or controlling banks as to be permissible. Some of the principal activities that the Federal Reserve Board has determined by regulation to be so closely related to banking as to be permissible are:
| • | making or servicing loans; |
| • | performing certain data processing services; |
| • | providing discount brokerage services; or acting as fiduciary, investment or financial advisor; |
| • | leasing personal or real property; |
| • | making investments in corporations or projects designed primarily to promote community welfare; and |
| • | acquiring a savings and loan association. |
Bank holding companies that qualify as a financial holding company may engage in activities that are financial in nature or incident to activities which are financial in nature. The Company has not elected to qualify as a financial holding company under federal regulations, although it may seek to do so in the future. Bank holding companies may qualify to become a financial holding company if:
| • | each of its depository institution subsidiaries is “well capitalized”; |
| • | each of its depository institution subsidiaries is “well managed”; |
| • | each of its depository institution subsidiaries has at least a “satisfactory” Community Reinvestment Act rating at its most recent examination; and |
| • | the bank holding company has filed a certification with the Federal Reserve Board that it elects to become a financial holding company. |
Under federal law, depository institutions are liable to the FDIC for losses suffered or anticipated by the FDIC in connection with the default of a commonly controlled depository institution or any assistance provided by the FDIC to such an institution in danger of default. This law would potentially be applicable to the Company if it ever acquired as a separate subsidiary, a depository institution in addition to the Bank.
New Jersey Regulation. Under the New Jersey Banking Act, a company owning or controlling a savings bank is regulated as a bank holding company. The New Jersey Banking Act defines the terms “company” and “bank holding company” as such terms are defined under the BHCA. Each bank holding company controlling a New Jersey chartered bank or savings bank must file certain reports with the Commissioner and is subject to examination by the Commissioner.
Acquisition of Control. Under federal law and under the New Jersey Banking Act, no person may acquire control of the Company or the Bank without first obtaining approval of such acquisition of control from the Federal Reserve Board and the Commissioner.
Federal Securities Laws. The Company’s common stock is registered with the SEC under the Securities Exchange Act of 1934, as amended. The Company is subject to the information, proxy solicitation, insider trading restrictions and other requirements under the Securities Exchange Act of 1934.
American Reinvestment and Recovery Act of 2009
On February 17, 2009, the President signed into law H.R. 1, the American Reinvestment and Recovery Act of 2009 (“ARRA”), widely described as the Stimulus Bill. ARRA is intended to preserve and create jobs,
33
Table of Contents
stimulate investment in infrastructure and assist the unemployed. ARRA also includes new executive compensation standards applicable to financial and other institutions receiving governmental assistance under the Troubled Assets Relief Program (“TARP”), as established by the Emergency Economic Stabilization Act of 2008. The Company did not elect to participate in the TARP program.
Delaware Corporation Law
The Company is incorporated under the laws of the State of Delaware. As a result, the rights of its stockholders are governed by the Delaware General Corporate Law.
TAXATION
Federal Taxation
General. The Company is subject to federal income taxation in the same general manner as other corporations, with some exceptions discussed below. The following discussion of federal taxation is intended only to summarize certain pertinent federal income tax matters and is not a comprehensive description of the tax rules applicable to the Company.
Method of Accounting. For federal income tax purposes, the Company currently reports its income and expenses on the accrual method of accounting and uses a tax year ending December 31 for filing its consolidated federal income tax returns.
Bad Debt Reserves. Prior to the Small Business Protection Act of 1996 (the “1996 Act”), the Bank was permitted to establish a reserve for bad debts and to make annual additions to the reserve. These additions could, within specified formula limits, be deducted in arriving at taxable income. The Bank was required to use the direct charge-off method to compute its bad debt deduction beginning with its 1996 federal income tax return. Savings institutions were required to recapture any excess reserves over those established as of December 31, 1987 (base year reserve).
Taxable Distributions and Recapture. Prior to the 1996 Act, bad debt reserves created prior to January 1, 1988 were subject to recapture into taxable income should the Bank fail to meet certain asset and definitional tests. Federal legislation has eliminated these recapture rules.
Retained earnings at December 31, 2009 included approximately $51.8 million for which no provisions for income tax had been made. This amount represents an allocation of income to bad debt deductions for tax purposes only. Events that would result in taxation of these reserves include failure to qualify as a bank for tax purposes, distributions in complete or partial liquidation, stock redemptions and excess distributions to shareholders. At December 31, 2009, the Bank had an unrecognized tax liability of $21.2 million with respect to this reserve.
Corporate Alternative Minimum Tax. The Internal Revenue Code of 1986, as amended (the “Code”), imposes an alternative minimum tax (AMT) at a rate of 20% on a base of regular taxable income plus certain tax preferences (alternative minimum taxable income or AMTI). The AMT is payable to the extent such AMTI is in excess of an exemption amount and the AMT exceeds the regular income tax. Net operating losses can offset no more than 90% of AMTI. Certain payments of alternative minimum tax may be used as credits against regular tax liabilities in future years. The Company has not been subject to the alternative minimum tax and has no such amounts available as credits for carryover.
Net Operating Loss Carryovers. Under the general rule, a financial institution may carry back net operating losses to the preceding two taxable years and forward to the succeeding 20 taxable years. At December 31, 2009, the Company had no net operating loss carryforwards for federal income tax purposes.
34
Table of Contents
Corporate Dividends-Received Deduction. The Company may exclude from its income 100% of dividends received from the Bank as a member of the same affiliated group of corporations.
State Taxation
New Jersey State Taxation. The Company and the Bank file New Jersey Corporation Business Tax returns. Generally, the income of financial institutions in New Jersey, which is calculated based on federal taxable income subject to certain adjustments, is subject to New Jersey tax. The Company and the Bank are currently subject to the corporate business tax (“CBT”) at 9% of taxable income.
New Jersey tax law does not and has not allowed for a taxpayer to file a tax return on a combined or consolidated basis with another member of the affiliated group where there is common ownership. However, if the taxpayer cannot demonstrate by clear and convincing evidence that the tax filing discloses the true earnings of the taxpayer on its business carried on in the State of New Jersey, the New Jersey Director of the Division of Taxation may, at the director’s discretion, require the taxpayer to file a consolidated return of the entire operations of the affiliated group or controlled group, including its own operations and income.
Delaware State Taxation. As a Delaware holding company not earning income in Delaware, the Company is exempted from Delaware corporate income tax but is required to file annual returns and pay annual fees and a franchise tax to the State of Delaware.
| Item 1A. | Risk Factors. |
In addition to factors discussed in the description of our business and elsewhere in this Annual Report on Form 10-K, the following are risk factors that could adversely affect our future results of operations and our financial condition.
Continued and Sustained Deterioration in the Housing Sector and Related Markets and Prolonged Elevated Unemployment Levels May Adversely Affect Our Business and Financial Results
During 2009, general economic conditions continued to worsen. While we did not invest in sub-prime mortgages and related investments, our lending business is tied, in large part, to the housing market. Declines in home prices, increases in foreclosures and unemployment have adversely impacted the credit performance of real estate related loans, resulting in the write-down of asset values. The continuing housing slump has resulted in reduced demand for the construction of new housing, further declines in home prices, and increased delinquencies on construction, residential and commercial mortgage loans. The ongoing concern about the stability of the financial markets in general has caused many lenders to reduce or cease providing funding to borrowers. These conditions may also cause a further reduction in loan demand, and increases in our non-performing assets, net charge-offs and provisions for loan losses. A worsening of these negative economic conditions could adversely impact our prospects for growth, asset and goodwill valuations and could result in a decrease in our interest income and a material increase in our provision for loan losses.
Our Commercial Real Estate, Multi-Family, and Commercial Loans Expose Us to Increased Lending Risks
Our strategy continues to be to increase our commercial mortgage loans, commercial loans and, to a lesser extent, construction loans. These loans are generally regarded as having a higher risk of default and loss than single-family residential mortgage loans, because repayment of these loans often depends on the successful operation of a business or of the underlying property. In addition, our construction loans, commercial mortgage loans and commercial loans have significantly larger average loan balances compared to our single-family residential mortgage loans. At December 31, 2009, the average loan size for a construction loan was $2.6 million,
35
Table of Contents
for a commercial mortgage loan was $1.9 million, and, for a commercial loan was $384,000, compared to an average loan size of $205,000 for a single-family residential mortgage loan. Also, many of our borrowers of these types of loans have more than one loan outstanding with us. Consequently, any adverse development with respect to one loan or one credit relationship can expose us to a significantly greater risk of loss compared to an adverse development with respect to one single-family residential mortgage loan.
Our Continuing Concentration of Loans in Our Primary Market Area May Increase Our Risk
Our success depends primarily on the general economic conditions in northern and central New Jersey. Unlike some larger banks that are more geographically diversified, we provide banking and financial services to customers primarily in northern and central New Jersey. The local economic conditions in northern and central New Jersey, including an unemployment rate of 10.1% at December 31, 2009, have a significant impact on our construction loans, commercial mortgage loans, commercial loans, and residential mortgage loans, the ability of the borrowers to repay these loans and the value of the collateral securing these loans. A continuing significant decline in general economic conditions caused by inflation, recession, unemployment or other factors beyond our control would impact these local economic conditions and could negatively affect the financial results of our banking operations. Additionally, because we have a significant amount of real estate loans, further declines in real estate values and the continued slump in real estate sales may also have a negative effect on the ability of many of our borrowers to make timely repayments of their loans, which would have an adverse impact on our earnings and overall financial condition.
We target our business development and marketing strategy for loans to serve primarily the banking and financial services needs of small- to medium-sized businesses in northern and central New Jersey. These small- to medium-sized businesses generally have fewer financial resources in terms of capital or borrowing capacity than larger entities. If general economic conditions negatively impact these businesses, our results of operations and financial condition may be adversely affected.
If Our Allowance for Loan Losses is Not Sufficient to Cover Actual Loan Losses, Our Earnings Could Decrease
Our borrowers may not repay their loans according to the terms of the loans, and the collateral securing the payment of these loans may be insufficient to pay any remaining loan balance. We may experience significant loan losses, which could have a material adverse effect on our operating results. We make various assumptions and judgments about the collectibility of our loan portfolio, including the creditworthiness of our borrowers and the value of the real estate and other assets serving as collateral for the repayment of many of our loans. In determining the amount of the allowance for loan losses, we rely on our loan quality reviews, our experience and our evaluation of economic conditions, among other factors. If our assumptions prove to be incorrect, our allowance for loan losses may not be sufficient to cover losses inherent in our loan portfolio, resulting in additions to our allowance. Material additions to our allowance would materially decrease our net income.
Our emphasis on the continued diversification of our loan portfolio through the origination of commercial mortgage loans, commercial loans, and construction loans has been one of the more significant factors we have taken into account in evaluating our allowance for loan losses and provision for loan losses. In the event we were to further increase the amount of such types of loans in our portfolio, we may decide to make additional or increased provisions for loans losses, which could adversely affect our earnings.
In addition, bank regulators periodically review our allowance for loan losses and may require us to increase our provision for loan losses or recognize further loan charge-offs. Any increase in our allowance for loan losses or loan charge-offs as required by these regulatory authorities could have a material adverse effect on our results of operations and financial condition.
36
Table of Contents
We Hold Certain Intangible Assets That Could Be Classified As Impaired in the Future. If These Assets Are Considered to Be Either Partially or Fully Impaired in The Future, Our Earnings Could Decline
We record all assets and liabilities acquired by the Company in purchase acquisitions, including goodwill and other intangible assets, at fair value. At December 31, 2009, goodwill totaling $346.3 million is not amortized but is subject to impairment tests at least annually, or more often if events or circumstances indicate it may be impaired. Other intangible assets are amortized over their estimated useful lives and are subject to impairment tests if events or circumstances indicate a potential inability to realize the carrying amount. The initial recording and subsequent impairment testing of goodwill and other intangible assets requires subjective judgments about the estimates of the fair value of assets acquired.
The goodwill impairment test is performed in two steps. The first step compares the fair value of the reporting unit with its carrying amount, including goodwill. If the fair value of the reporting unit exceeds its carrying amount, goodwill of the reporting unit is considered not impaired. However, if the carrying amount of the reporting unit exceeds its fair value, an additional test must be performed. The second step test compares the implied fair value of the reporting unit’s goodwill with the carrying amount of that goodwill. An impairment loss would be recorded to the extent that the carrying amount of goodwill exceeds its implied value.
Fair value may be determined using market prices, comparison to similar assets, market multiples, discounted cash flow analysis and other factors. Estimated cash flows may extend far into the future and by their nature are difficult to determine over an extended time frame. Factors that may significantly affect the estimates include specific industry or market sector conditions, changes in revenue growth trends, customer behavior, competitive forces, cost structures and changes in discount rates.
It is possible that our future impairment testing could result in an impairment of the value of goodwill or core deposit intangible assets, or both. If we determine impairment exists at a given point in time, our earnings and the book value of the related intangible asset(s) will be reduced by the amount of the impairment. In any event, the results of impairment testing on goodwill and core deposit intangible assets have no impact on our tangible book value or regulatory capital levels.
Continued or Further Declines in the Value of Certain Investment Securities Could Require Write-Downs, Which Would Reduce Our Earnings
Our securities portfolio includes securities that have declined in value due to negative perceptions about the health of the financial sector in general and the lack of liquidity for securities that are real estate related. These securities include private label mortgage-backed securities. A prolonged decline in the value of these securities could result in an other-than-temporary impairment write-down which would reduce our earnings.
Recent Legislative and Regulatory Initiatives May Significantly Affect Our Financial Condition and Results of Operations
The potential exists for additional federal or state laws and regulations regarding capital requirements, lending and funding practices and liquidity standards, and bank regulatory agencies are expected to be more active in responding to concerns and trends identified in examinations, including the expected issuance of many formal enforcement orders. Actions taken to date, as well as potential actions, may not have the beneficial effects that are intended, particularly with respect to the extreme levels of volatility and limited credit availability currently being experienced. In addition, new laws, regulations, and other regulatory changes will increase our Federal Deposit Insurance Corporation insurance premiums and may also increase our costs of regulatory compliance and of doing business, and otherwise affect our operations. New laws, regulations, and other regulatory changes, along with negative developments in the financial industry and the domestic and international credit markets, may significantly affect the markets in which we do business, the markets for and value of our loans and investments, and our ongoing operations, costs and profitability.
37
Table of Contents
Our Expenses Will Increase As A Result Of Increases In FDIC Insurance Premiums
The Federal Deposit Insurance Corporation (“FDIC”) imposes an assessment against financial institutions for deposit insurance. This assessment is based on the risk category of the institution and currently ranges from 12 to 45 basis points of the institution’s deposits. Federal law requires that the designated reserve ratio for the deposit insurance fund be established by the FDIC at 1.15% to 1.50% of estimated insured deposits. If this reserve ratio drops below 1.15% or the FDIC expects that it will do so within six months, the FDIC must, within 90 days, establish and implement a plan to restore the designated reserve ratio to 1.15% of estimated insured deposits within five years (absent extraordinary circumstances).
Continuing bank failures, coupled with deteriorating economic conditions, have significantly reduced the deposit insurance fund’s reserve ratio. In an effort to replenish the FDIC’s insurance fund, the FDIC imposed a special assessment on all insured institutions of five basis points on their June 30, 2009 assets minus their Tier 1 capital, which was paid on September 30, 2009. In November 2009, the FDIC required all insured institutions to prepay all of their estimated insurance assessments for the ensuing three years, on December 30, 2009.
These actions significantly increased our non-interest expense in 2009, and it is likely that our expenses will continue to increase in future years as long as these higher premiums remain in place and in the event further FDIC special assessments are imposed.
Changes in Interest Rates Could Adversely Affect Our Results of Operations and Financial Condition
Our results of operations and financial condition are significantly affected by changes in interest rates. Our results of operations are affected substantially by our net interest income, which is the difference between the interest income earned on our interest-earning assets and the interest expense paid on our interest-bearing liabilities. Changes in interest rates could have an adverse affect on net interest income to the extent our interest-earning assets and interest-bearing liabilities reprice or mature at different times or at different relative interest rates. An increase in interest rates generally would result in a decrease in our average interest rate spread and net interest income, which would have a negative effect on our profitability. In the event of a 300 basis point increase in interest rates, whereby rates ramp up evenly over a twelve-month period, and assuming management took no actions to mitigate the effect of such change, we are projecting that our net interest income would decrease 2.0% or $4.0 million.
Changes in interest rates also affect the value of our interest-earning assets, and in particular our securities portfolio. Generally, the value of securities fluctuates inversely with changes in interest rates. At December 31, 2009, our available for sale securities portfolio totaled $1.33 billion. Unrealized gains and losses on securities available for sale are reported as a separate component of stockholders’ equity. Decreases in the fair value of securities available for sale resulting from increases in interest rates therefore could have an adverse effect on stockholders’ equity.
We are also subject to prepayment and reinvestment risk related to interest rate movements. Changes in interest rates can affect the average life of loans and mortgage related securities. Increases in interest rates can result in reduced prepayments of loans and mortgage related securities, as borrowers retain existing loans to reduce borrowing costs. Under these circumstances, we are subject to reinvestment risk to the extent that such prepayments are not available to reinvest at prevailing market rates at a profitable spread in excess of our funding costs.
We Operate in a Highly Regulated Environment and May be Adversely Affected by Changes in Laws and Regulations
We are subject to extensive regulation, supervision and examination by the New Jersey Department of Banking and Insurance, our chartering authority, and by the Federal Deposit Insurance Corporation, as insurer of our deposits. As a bank holding company, Provident Financial Services, Inc. is subject to regulation and
38
Table of Contents
oversight by the Board of Governors of the Federal Reserve System. Such regulation and supervision govern the activities in which a bank and its holding company may engage and are intended primarily for the protection of the insurance fund and depositors. These regulatory authorities have extensive discretion in connection with their supervisory and enforcement activities, including the requirement for additional capital, the imposition of restrictions on our operations, the classification of our assets and the adequacy of our allowance for loan losses. Any change in such regulation and oversight, whether in the form of regulatory policy, regulations, or legislation, could have a material impact on The Provident Bank, Provident Financial Services, Inc., and our operations.
Strong Competition Within Our Market Area May Limit Our Growth and Profitability
Competition in the banking and financial services industry is intense. In our market area, we compete with commercial banks, savings institutions, mortgage banking firms, credit unions, finance companies, mutual funds, insurance companies, and brokerage and investment banking firms operating locally and elsewhere. In particular, over the past decade, New Jersey has experienced the effects of substantial banking consolidation, and large out-of-state competitors have grown significantly. There are also a number of strong locally-based competitors in our market. Many of these competitors (whether regional or national institutions) have substantially greater resources and lending limits than we do, and may offer certain services or credit criteria that we do not or cannot provide. Our profitability depends upon our continued ability to successfully compete in our market area.
Lack of Consumer Confidence in Financial Institutions May Decrease Our Level of Deposits
Our level of deposits may be affected by lack of consumer confidence in financial institutions, which has caused fewer depositors to be willing to maintain deposits that are not insured by the FDIC. That may cause depositors to withdraw deposits and place them in other institutions or to invest uninsured funds in investments perceived as being more secure, such as securities issued by the United States Treasury. These consumer preferences may cause us to be forced to pay higher interest rates to retain deposits and may constrain liquidity as we seek to meet funding needs caused by reduced deposit levels.
Future Legislative or Regulatory Actions Responding to Perceived Financial and Market Problems Could Impair Our Rights Against Delinquent Borrowers.
There have been legislative and regulatory proposals made that would reduce the amount distressed borrowers may otherwise be contractually obligated to pay under their mortgage loans and limit an institution’s ability to foreclose on mortgage collateral. Were proposals such as these, or other proposals limiting our rights as a creditor, to be implemented, we could experience increased credit losses or increased expense in pursuing our remedies as a creditor.
| Item 1B. | Unresolved Staff Comments |
There are no unresolved comments from the staff of the SEC to report.
| Item 2. | Properties |
Property
At December 31, 2009, the Bank conducted business through 82 full-service branch offices located in Hudson, Bergen, Essex, Mercer, Middlesex, Monmouth, Morris, Ocean, Passaic, Somerset and Union Counties, New Jersey. The aggregate net book value of premises and equipment was $76.3 million at December 31, 2009.
| Item 3. | Legal Proceedings |
The Company is involved in various legal actions and claims arising in the normal course of its business. In the opinion of management, these legal actions and claims are not expected to have a material adverse impact on the Company’s financial condition and results of operations.
| Item 4. | [Reserved] |
39
Table of Contents
| Item 5. | Market For Registrant’s Common Equity and Related Stockholder Matters and Issuer Purchases of Equity Securities. |
The Company’s common stock trades on the New York Stock Exchange (“NYSE”) under the symbol “PFS”. Trading in the Company’s common stock commenced on January 16, 2003.
As of December 31, 2009, there were 83,209,293 shares of the Company’s common stock issued and 59,821,850 shares outstanding and 6,008 stockholders of record.
The table below shows the high and low closing prices reported on the NYSE for the Company’s common stock, as well as, the cash dividends paid per common share during the periods indicated.
| 2009 | 2008 | |||||||||||||||||
| High | Low | Dividend | High | Low | Dividend | |||||||||||||
| First Quarter |
$ | 14.98 | $ | 7.90 | $ | 0.11 | $ | 14.18 | $ | 11.97 | $ | 0.11 | ||||||
| Second Quarter |
12.40 | 9.10 | 0.11 | 16.13 | 13.01 | 0.11 | ||||||||||||
| Third Quarter |
12.51 | 8.80 | 0.11 | 19.50 | 13.08 | 0.11 | ||||||||||||
| Fourth Quarter |
11.22 | 9.85 | 0.11 | 16.47 | 11.09 | 0.11 | ||||||||||||
On January 28, 2010, the Board of Directors declared a quarterly cash dividend of $0.11 per common share, which was paid on February 26, 2010, to common stockholders of record as of the close of business on February 12, 2010. The Company’s Board of Directors intends to review the payment of dividends quarterly and plans to continue to maintain a regular quarterly cash dividend in the future, subject to financial condition, results of operations, tax considerations, industry standards, economic conditions, regulatory restrictions that affect the payment of dividends by the Bank to the Company and other relevant factors.
The Company is subject to the requirements of Delaware law that generally limit dividends to an amount equal to the difference between the amount by which total assets exceed total liabilities and the amount equal to the aggregate par value of the outstanding shares of capital stock. If there is no difference between these amounts, dividends are limited to net income for the current and/or immediately preceding year.
40
Table of Contents
Stock Performance Graph
Set forth below is a stock performance graph comparing (a) the cumulative total return on the Company’s common stock for the period December 31, 2004 through December 31, 2009, (b) the cumulative total return on stocks included in the Russell 2000 Index over such period, and (c) the cumulative total return of the SNL Thrift Index over such period. The SNL Thrift Index, produced by SNL Financial LC, contains all thrift institutions traded on the New York, American and NASDAQ stock exchanges. Cumulative return assumes the reinvestment of dividends and is expressed in dollars based on an assumed investment of $100 on December 31, 2004.
PROVIDENT FINANCIAL SERVICES, INC.
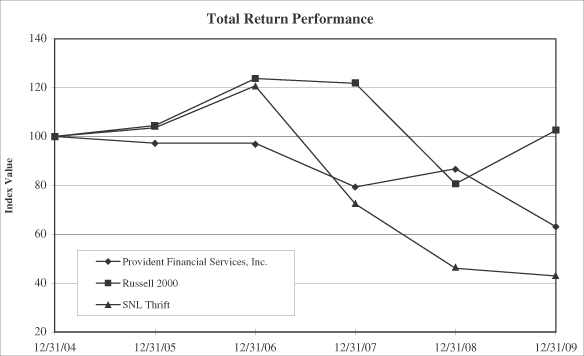
| Period Ending | ||||||||||||
| Index |
12/31/04 | 12/31/05 | 12/31/06 | 12/31/07 | 12/31/08 | 12/31/09 | ||||||
| Provident Financial Services, Inc. |
100.00 | 97.29 | 97.37 | 79.44 | 86.89 | 63.09 | ||||||
| Russell 2000 |
100.00 | 104.55 | 123.76 | 121.82 | 80.66 | 102.58 | ||||||
| SNL Thrift |
100.00 | 103.53 | 120.68 | 72.40 | 46.07 | 42.97 | ||||||
41
Table of Contents
The following table reports information regarding purchases of the Company’s common stock during the fourth quarter of 2009 and the stock repurchase plan approved by the Company’s Board of Directors:
ISSUER PURCHASES OF EQUITY SECURITIES
| Period |
(a) Total Number of Shares Purchased |
(b) Average Price Paid per Share |
(c) Total Number of Shares Purchased as Part of Publicly Announced Plans or Programs (1) |
(d) Maximum Number of Shares that May Yet Be Purchased Under the Plans or Programs (1) | |||||
| October 1, 2009 Through October 31, 2009 |
— | — | — | 2,138,971 | |||||
| November 1, 2009 Through November 30, 2009 |
— | — | — | 2,138,971 | |||||
| December 1, 2009 Through December 31, 2009 |
150 | $ | 10.69 | 150 | 2,138,821 | ||||
| Total |
150 | $ | 10.69 | 150 | |||||
| (1) | On October 24, 2007, the Company’s Board of Directors approved the purchase of up to 3,107,077 shares of its common stock under a seventh general repurchase program which commenced upon completion of the previous repurchase program. The repurchase program has no expiration date. |
| Item 6. | Selected Financial Data |
The summary information presented below at or for each of the periods presented is derived in part from and should be read in conjunction with the consolidated financial statements of the Company presented in Item 8.
| At December 31, | |||||||||||||||
| 2009 | 2008 | 2007 | 2006 | 2005 | |||||||||||
| (In thousands) | |||||||||||||||
| Selected Financial Condition Data: |
|||||||||||||||
| Total assets |
$ | 6,836,172 | $ | 6,548,748 | $ | 6,359,391 | $ | 5,742,964 | $ | 6,052,374 | |||||
| Loans, net(1) |
4,323,450 | 4,479,036 | 4,255,509 | 3,751,230 | 3,707,142 | ||||||||||
| Investment securities held to maturity |
335,074 | 347,484 | 358,491 | 389,656 | 410,914 | ||||||||||
| Securities available for sale |
1,333,163 | 820,329 | 769,615 | 790,894 | 1,082,957 | ||||||||||
| Deposits |
4,899,177 | 4,226,336 | 4,224,820 | 3,826,463 | 3,921,458 | ||||||||||
| Borrowed funds |
999,233 | 1,247,681 | 1,075,104 | 840,990 | 970,108 | ||||||||||
| Stockholders’ equity |
884,555 | 1,018,590 | 1,000,794 | 1,019,156 | 1,076,295 | ||||||||||
| For the Year Ended December 31, | ||||||||||||||||
| 2009 | 2008 | 2007 | 2006 | 2005 | ||||||||||||
| (In thousands) | ||||||||||||||||
| Selected Operations Data: |
||||||||||||||||
| Interest income |
$ | 292,559 | $ | 304,320 | $ | 302,577 | $ | 282,139 | $ | 276,462 | ||||||
| Interest expense |
111,542 | 132,251 | 147,699 | 117,611 | 95,007 | |||||||||||
| Net interest income |
181,017 | 172,069 | 154,878 | 164,528 | 181,455 | |||||||||||
| Provision for loan losses |
30,250 | 15,100 | 6,530 | 1,320 | 600 | |||||||||||
| Net interest income after provision for loan losses |
150,767 | 156,969 | 148,348 | 163,208 | 180,855 | |||||||||||
| Non-interest income |
31,452 | 30,211 | 35,537 | 31,951 | 29,221 | |||||||||||
| Non-interest expense(2) |
297,036 | 130,601 | 133,013 | 118,273 | 124,178 | |||||||||||
| (Loss) income before income tax expense(2) |
(114,817 | ) | 56,579 | 50,872 | 76,886 | 85,898 | ||||||||||
| Income tax expense |
7,007 | 14,937 | 13,492 | 23,201 | 27,399 | |||||||||||
| Net (loss) income(2) |
$ | (121,824 | ) | $ | 41,642 | $ | 37,380 | $ | 53,685 | $ | 58,499 | |||||
| (Loss) Earnings Per Share: |
||||||||||||||||
| Basic (loss) earnings per share(2) |
$ | (2.16 | ) | $ | 0.74 | $ | 0.63 | $ | 0.88 | $ | 0.89 | |||||
| Diluted (loss) earnings per share(2) |
$ | (2.16 | ) | $ | 0.74 | $ | 0.63 | $ | 0.87 | $ | 0.88 | |||||
| (1) | Loans are shown net of allowance for loan losses, deferred fees and unearned discount. |
| (2) | Reflects the impact of a $152.5 million goodwill impairment charge recognized in 2009. |
42
Table of Contents
| At or For the Year Ended December 31, | |||||||||||||||
| 2009 | 2008 | 2007 | 2006 | 2005 | |||||||||||
| Selected Financial and Other Data(1) |
|||||||||||||||
| Performance Ratios: |
|||||||||||||||
| Return on average assets(5) |
(1.83 | )% | 0.65 | % | 0.62 | % | 0.92 | % | 0.94 | % | |||||
| Return on average equity(5) |
(13.33 | )% | 4.12 | 3.63 | 5.17 | 5.32 | |||||||||
| Average net interest rate spread |
2.82 | 2.78 | 2.52 | 2.80 | 3.01 | ||||||||||
| Net interest margin(2) |
3.06 | 3.11 | 2.96 | 3.23 | 3.34 | ||||||||||
| Average interest-earning assets to average interest-bearing liabilities |
1.13 | 1.13 | 1.16 | 1.18 | 1.18 | ||||||||||
| Non-interest income to average total assets |
0.47 | 0.47 | 0.59 | 0.55 | 0.47 | ||||||||||
| Non-interest expenses to average total assets(5) |
4.45 | 2.04 | 2.19 | 2.02 | 2.00 | ||||||||||
| Efficiency ratio(3)(5) |
139.80 | 64.56 | 69.85 | 60.20 | 58.94 | ||||||||||
| Asset Quality Ratios: |
|||||||||||||||
| Non-performing loans to total loans |
1.93 | % | 1.31 | % | 0.81 | % | 0.20 | % | 0.16 | % | |||||
| Non-performing assets to total assets |
1.33 | 0.96 | 0.56 | 0.14 | 0.11 | ||||||||||
| Allowance for loan losses to non-performing loans |
71.91 | 80.71 | 117.72 | 429.65 | 532.56 | ||||||||||
| Allowance for loan losses to total loans |
1.39 | 1.05 | 0.95 | 0.86 | 0.86 | ||||||||||
| Capital Ratios: |
|||||||||||||||
| Leverage capital(4) |
7.99 | % | 8.48 | % | 8.29 | % | 11.21 | % | 11.98 | % | |||||
| Total risk based capital(4) |
12.17 | 13.28 | 12.92 | 15.79 | 18.45 | ||||||||||
| Average equity to average assets |
13.42 | 15.82 | 16.95 | 17.77 | 17.68 | ||||||||||
| Other Data: |
|||||||||||||||
| Number of full-service offices |
82 | 83 | 85 | 75 | 76 | ||||||||||
| Full time equivalent employees |
931 | 954 | 942 | 877 | 892 | ||||||||||
| (1) | Averages presented are daily averages. |
| (2) | Net interest income divided by average interest earning assets. |
| (3) | Represents the ratio of non-interest expense divided by the sum of net interest income and non-interest income. |
| (4) | Leverage capital ratios are presented as a percentage of quarterly average tangible assets. Risk-based capital ratios are presented as a percentage of risk-weighted assets. |
| (5) | Reflects the impact of a $152.5 million goodwill impairment charge recognized in 2009. |
| Efficiency Ratio Calculation: |
12/31/2009 | 12/31/2008 | 12/31/2007 | 12/31/2006 | 12/31/2005 | |||||||||||||||
| Net interest income |
$ | 181,017 | $ | 172,069 | $ | 154,878 | $ | 164,528 | $ | 181,455 | ||||||||||
| Non-interest income |
31,452 | 30,211 | 35,537 | 31,951 | 29,221 | |||||||||||||||
| Total income |
$ | 212,469 | $ | 202,280 | $ | 190,415 | $ | 196,479 | $ | 210,676 | ||||||||||
| Non-interest expense(1) |
$ | 297,036 | $ | 130,601 | $ | 133,013 | $ | 118,273 | $ | 124,178 | ||||||||||
| Expense/income(1) |
139.80 | % | 64.56 | % | 69.85 | % | 60.20 | % | 58.94 | % | ||||||||||
| (1) | Reflects the impact of a $152.5 million goodwill impairment charge recognized in 2009. |
43
Table of Contents
| Item 7. | Management’s Discussion and Analysis of Financial Condition and Results of Operations |
General
On January 15, 2003, the Company became the holding company for the Bank, following the completion of the conversion of the Bank to a stock-chartered bank. The Company issued an aggregate of 59,618,300 shares of its common stock in a subscription offering to eligible depositors. Concurrent with the conversion, the Company contributed an additional 1,920,000 shares of its common stock and $4.8 million in cash to The Provident Bank Foundation, a charitable foundation established by the Bank.
The Company conducts business through its subsidiary, the Bank, a community- and customer-oriented bank currently operating 82 full-service branches in eleven counties throughout northern and central New Jersey.
The Company completed its acquisition of First Morris Bank & Trust (“First Morris”) and the merger of First Morris with and into the Bank, as of April 1, 2007. As a result of the First Morris acquisition, the Company added nine branch locations in Morris County, New Jersey, acquired assets having a fair value of $554.2 million, including $332.5 million of net loans, $138.2 million of investment securities and $60.7 million of cash and cash equivalents, and assumed $509.0 million of deposits.
Strategy
The Bank, established in 1839, is the oldest New Jersey-chartered bank in the state. The Bank offers a full range of retail and commercial loan and deposit products, and emphasizes personal service and convenience.
The Bank’s strategy is to grow profitably through a commitment to credit quality and expanding market share by acquiring, retaining and expanding customer relationships, while carefully managing interest rate risk.
In recent years, the Bank has focused on commercial real estate, multi-family and commercial loans as part of its strategy to diversify the loan portfolio and reduce interest rate risk. These types of loans generally have adjustable rates that initially are higher than residential mortgage loans and generally have a higher rate of risk. The Bank’s credit policy focuses on quality underwriting standards and close monitoring of the loan portfolio. At December 31, 2009, retail loans accounted for 47.5% of the loan portfolio and commercial loans accounted for 52.5%. The Company intends to continue to diversify the loan portfolio and to focus on commercial real estate and commercial and industrial lending relationships.
The Company’s relationship banking strategy focuses on increasing core accounts and expanding relationships through its branch network, online banking and telephone banking touch points. The Company continues to evaluate opportunities to increase market share by expanding within existing and contiguous markets. Core deposits, consisting of all savings and demand deposit accounts, are generally a stable, relatively inexpensive source of funds. At December 31, 2009, core deposits were 69.2% of total deposits.
The Company’s results of operations are primarily dependent upon net interest income, the difference between interest earned on interest-earning assets and the interest paid on interest-bearing liabilities. Changes in interest rates could have an adverse effect on net interest income to the extent the Company’s interest-bearing assets and interest-bearing liabilities reprice or mature at different times or relative interest rates. An increase in interest rates generally would result in a decrease in the Company’s average interest rate spread and net interest income, which could have a negative effect on profitability. The Company generates non-interest income such as income from retail and business account fees, loan servicing fees, loan origination fees, appreciation in the cash surrender value of Bank-owned life insurance, income from loan or securities sales, fees from asset management services and investment product sales and other fees. The Company’s operating expenses consist primarily of compensation and benefits expense, occupancy and equipment expense, data processing expense, the amortization of intangible assets, marketing and advertising expense and other general and administrative expenses. The Company’s results of operations are also affected by general economic conditions, changes in market interest rates, changes in asset quality, actions of regulatory agencies and government policies.
44
Table of Contents
Critical Accounting Policies
The calculation of the allowance for loan losses is a critical accounting policy of the Company. The allowance for loan losses is a valuation account that reflects management’s evaluation of the probable losses in the loan portfolio. The Company maintains the allowance for loan losses through provisions for loan losses that are charged to income. Charge-offs against the allowance for loan losses are taken on loans where management determines that the collection of loan principal is unlikely. Recoveries made on loans that have been charged-off are credited to the allowance for loan losses.
The Company’s evaluation of the adequacy of the allowance for loan losses includes a review of all loans on which the collectibility of principal may not be reasonably assured. For residential mortgage and consumer loans, this is determined primarily by delinquency and collateral values. For commercial real estate and commercial loans, an extensive review of financial performance, payment history and collateral values is conducted on a quarterly basis.
As part of the evaluation of the adequacy of the allowance for loan losses, each quarter management prepares a worksheet. This worksheet categorizes the entire loan portfolio by certain risk characteristics such as loan type (residential mortgage, commercial mortgage, construction, commercial, etc.) and loan risk rating.
When assigning a risk rating to a loan, management utilizes a nine point internal risk rating system. Loans deemed to be “acceptable quality” are rated 1 through 4, with a rating of 1 established for loans with minimal risk. Loans deemed to be of “questionable quality” are rated 5 (watch) or 6 (special mention). Loans with adverse classifications (substandard, doubtful or loss) are rated 7, 8 or 9, respectively. Commercial mortgage, commercial and construction loans are rated individually and each lending officer is responsible for risk rating loans in their portfolio. These risk ratings are then reviewed by the department manager and/or the Chief Lending Officer and the Credit Administration Department. Risk ratings are then confirmed by the Loan Review Department. Loans requiring Credit Committee approval are periodically reviewed by the Credit Committee in the credit renewal or approval process.
Management assigns general valuation allowance (“GVA”) percentages to each risk rating category for use in allocating the allowance for loan losses, giving consideration to historical loss experience by loan type. The appropriateness of these percentages is evaluated by management at least annually. In the second quarter of 2009, management completed its most recent evaluation of the GVA percentages. In that evaluation, the historical “look-back” period for assessing the magnitude of potential losses was shortened from five years to two years in recognition of recent macroeconomic and real estate market conditions, resulting in increases to certain GVA allocation percentages.
Management believes the primary risks inherent in the portfolio are a continued decline in the economy, generally, a continued decline in real estate market values, rising unemployment, increasing vacancy rates in commercial investment properties and possible increases in interest rates. Any one or a combination of these events may adversely affect borrowers’ ability to repay the loans, resulting in increased delinquencies, loan losses and future levels of provisions. Accordingly, the Company has provided for loan losses at the current level to address the current risk in its loan portfolio. Management considers it important to maintain the ratio of the allowance for loan losses to total loans at an acceptable level given current economic conditions, interest rates and the composition of the portfolio.
Although management believes that the Company has established and maintained the allowance for loan losses at appropriate levels, additions may be necessary if future economic and other conditions differ substantially from the current operating environment. Management evaluates its estimates and assumptions on an ongoing basis giving consideration to historical experience and other factors, including the current economic environment, which management believes to be reasonable under the circumstances. Such estimates and assumptions are adjusted when facts and circumstances dictate. Illiquid credit markets, volatile securities markets, and declines in the housing and commercial real estate markets and the economy generally have combined to increase the uncertainty inherent in such estimates and assumptions. As future events and their
45
Table of Contents
effects cannot be determined with precision, actual results could differ significantly from these estimates. Changes in estimates resulting from continuing changes in the economic environment will be reflected in the financial statements in future periods. In addition, various regulatory agencies periodically review the adequacy of the Company’s allowance for loan losses as an integral part of their examination process. Such agencies may require the Company to recognize additions to the allowance or additional write-downs based on their judgments about information available to them at the time of their examination. Although management uses the best information available, the level of the allowance for loan losses remains an estimate that is subject to significant judgment and short-term change.
Additional critical accounting policies relate to judgments about other asset impairments, including goodwill, investment securities and deferred tax assets. Goodwill is evaluated for impairment on an annual basis, or more frequently if events or changes in circumstances indicate potential impairment between annual measurement dates. The Company engages an independent third party to perform an annual analysis during the fourth quarter as of September 30 to test the aggregate balance of goodwill for impairment. The fair value of goodwill is determined in the same manner as goodwill recognized in a business combination and uses standard valuation methodologies. Fair value may be determined using market prices, comparison to similar assets, market multiples, discounted cash flow analysis and other factors. Estimated cash flows may extend far into the future and by their nature are difficult to determine over an extended time frame. Factors that may significantly affect the estimates include specific industry or market sector conditions, changes in revenue growth trends, customer behavior, competitive forces, cost structures and changes in discount rates.
The goodwill impairment analysis is a two-step process to evaluate the potential impairment of the goodwill on the financial statements of the Bank. For this analysis, the Reporting Unit is defined as the Bank, which includes all core and retail banking operations of the Company but excludes the assets, liabilities, equity, earnings and operations held exclusively at the Company level. Four standard valuation methodologies common to valuation in business combination transactions involving financial institutions were used: (1) the Public Market Peers approach based on the trading prices of similar publicly traded companies as measured by standard valuation ratios; (2) the Comparable Transactions approach based on pricing ratios recently paid in the sale or merger of comparable banking franchises; (3) the Control Premium approach based on the Company’s trading price (a proxy for the Bank’s market pricing ratios were it publicly traded) followed by the application of an industry based control premium; and (4) the Discounted Cash Flow (“DCF”) approach where value is estimated based on the present value of projected dividends and a terminal value. These valuation techniques take into account the Bank’s recent operating history, current operating environment and future prospects.
The Public Market Peers approach and the Comparable Transactions approach are based on Level 2 inputs. The Control Premium approach is based on a combination of Level 1 inputs (the quoted price for the Company’s common stock) and Level 2 inputs (an estimated control premium based on comparable transactions). The DCF approach is based on Level 3 inputs including projections of future operations based on assumptions derived from management, the experience of the independent valuation firm that conducted the analysis and information from publicly available sources. All approaches were considered in the final estimate of fair value, with the approaches weighted based upon their applicability based upon the fair value hierarchy. These approaches and the resulting fair value conclusions are consistent with standard valuation techniques used by other market participants in evaluating business combinations for financial institutions.
Significant assumptions made in the estimation of the fair value of the Reporting Unit using the Public Market Peers, Comparable Transactions, and Control Premium approaches included the comparability of the selected regional and national peers, subjective adjustments for variations in franchise value and credit risk versus peers, and adjustments for projected market trends. In addition, assumptions were made in the use of the DCF approach regarding projections of future free cash flow resulting from asset growth, profitability, dividend payouts, and non-cash expenses. All of these assumptions may be affected by a number of factors, including, but not limited to, changes in interest rates, regulation and legislation, and competition. For purposes of the most recent impairment evaluation performed as of September 30, 2009, it was assumed that external factors would remain consistent with the then current environment.
46
Table of Contents
If the fair value of the reporting unit exceeds its carrying amount, goodwill of the reporting unit is considered not impaired. However, if the carrying amount of the reporting unit exceeds its fair value, an additional test must be performed. The second step test compares the implied fair value of the reporting unit’s goodwill with the carrying amount of that goodwill. An impairment loss would be recorded to the extent that the carrying amount of goodwill exceeds its implied fair value.
As reported in the Company’s Annual Report on Form 10-K for the year ended December 31, 2008, the Company performed an annual goodwill impairment test as of September 30, 2008, and a subsequent test as of December 31, 2008. The results of both analyses indicated that goodwill was not impaired. As a result of the continued decline in the first quarter of 2009 in stock prices in the financial services sector and in the Company’s common stock price, the Company initiated a goodwill impairment test as of March 31, 2009. The step one analysis as of March 31, 2009, indicated potential impairment. Upon completion of the second step test, it was determined that the carrying amount of the goodwill exceeded its implied fair value and an impairment charge in the amount of $152.5 million was recognized as of March 31, 2009. The annual goodwill impairment test as of September 30, 2009 was completed in the fourth quarter of 2009, with no further impairment indicated based on the step one analysis. The step one analysis at September 30, 2009 indicated that the fair value of the reporting unit exceeded the carrying value of the reporting unit by 3.6%. At September 30, 2009, the carrying value of goodwill was $346.3 million,
The Company’s available for sale securities portfolio is carried at estimated fair value, with any unrealized gains or losses, net of taxes, reported as accumulated other comprehensive income or loss in stockholders’ equity. Estimated fair values are based on market quotations or matrix pricing as discussed in Note 5 to the audited consolidated financial statements. Securities which the Company has the positive intent and ability to hold to maturity are classified as held to maturity and carried at amortized cost. The Company conducts a periodic review and evaluation of the securities portfolio to determine if any declines in the fair values of securities are other-than-temporary. If such a decline were deemed other-than-temporary, the Company would measure the total credit-related component of the unrealized loss, and recognize that portion of the loss as a charge to current period earnings. The remaining portion of the unrealized loss would be recognized as an adjustment to accumulated other comprehensive income. The market value of the securities portfolio is significantly affected by changes in interest rates. In general, as interest rates rise, the market value of fixed-rate securities decreases and as interest rates fall, the market value of fixed-rate securities increases. The current turmoil in the credit markets resulted in a lack of liquidity in the mortgage-backed securities market. Increases in delinquencies and foreclosures have resulted in limited trading activity and significant price declines, regardless of favorable movements in interest rates. The Company evaluates if it has the intent to sell these securities and if it is not more likely than not that the Company would be required to sell the securities before the anticipated recovery. The Company also had investments in common stock issued by several publicly traded financial institutions, the valuation of which was affected by the institutions’ performance, economic and stock market conditions. The Company does not hold any investments in common stock at December 31, 2009. The Company recognized other-than-temporary securities impairment losses in earnings totaling $2.0 million, $1.4 million and $1.0 million in 2009, 2008 and 2007, respectively.
The determination of whether deferred tax assets will be realizable is predicated on estimates of future taxable income. Such estimates are subject to management’s judgment. A valuation reserve is established when management is unable to conclude that it is more likely than not that it will realize deferred tax assets based on the nature and timing of these items. A valuation reserve of $1.1 million was established in 2009 pertaining primarily to state tax benefits on net operating losses at the Bank and unused capital loss carryforwards. A valuation reserve of $1.7 million that had been established in 2007 pertaining primarily to state tax benefits on net operating losses at the Bank was eliminated in 2008 due to a large dividend payment the Bank received from a subsidiary, which reduced the state net operating losses to zero at December 31, 2008.
47
Table of Contents
Analysis of Net Interest Income
Net interest income represents the difference between income on interest-earning assets and expense on interest-bearing liabilities. Net interest income depends on the relative amounts of interest-earning assets and interest-bearing liabilities and the rates of interest earned on such assets and paid on such liabilities.
Average Balance Sheet. The following table sets forth certain information for the years ended December 31, 2009, 2008 and 2007. For the periods indicated, the total dollar amount of interest income from average interest-earning assets and the resultant yields, as well as the interest expense on average interest-bearing liabilities, is expressed both in dollars and rates. No tax equivalent adjustments were made. Average balances are daily averages.
| For the Year Ended December 31, | |||||||||||||||||||||||||||
| 2009 | 2008 | 2007 | |||||||||||||||||||||||||
| Average Outstanding Balance |
Interest Earned/ Paid |
Average Yield/ Rate |
Average Outstanding Balance |
Interest Earned/ Paid |
Average Yield/ Rate |
Average Outstanding Balance |
Interest Earned/ Paid |
Average Yield/ Rate |
|||||||||||||||||||
| (Dollars in thousands) | |||||||||||||||||||||||||||
| Interest-earning assets: |
|||||||||||||||||||||||||||
| Deposits |
$ | 121,557 | $ | 304 | 0.25 | % | $ | — | $ | — | — | % | $ | — | $ | — | — | % | |||||||||
| Federal funds sold and short-term investments |
25,790 | 37 | 0.14 | 16,238 | 510 | 3.14 | 5,200 | 275 | 5.28 | ||||||||||||||||||
| Investment securities(1) |
339,154 | 13,419 | 3.96 | 354,079 | 14,431 | 4.08 | 373,733 | 15,406 | 4.12 | ||||||||||||||||||
| Securities available for sale |
1,089,032 | 43,338 | 3.98 | 839,226 | 40,158 | 4.79 | 780,836 | 35,794 | 4.58 | ||||||||||||||||||
| Federal Home Loan Bank Stock |
35,918 | 1,848 | 5.15 | 39,424 | 2,432 | 6.17 | 31,470 | 2,313 | 7.35 | ||||||||||||||||||
| Net loans(2) |
4,303,808 | 233,613 | 5.43 | 4,280,478 | 246,789 | 5.77 | 4,036,193 | 248,789 | 6.16 | ||||||||||||||||||
| Total interest-earning assets |
5,915,259 | 292,559 | 4.95 | 5,529,445 | 304,320 | 5.50 | 5,227,432 | 302,577 | 5.79 | ||||||||||||||||||
| Non-interest earning assets |
757,161 | 862,104 | 843,310 | ||||||||||||||||||||||||
| Total assets |
$ | 6,672,420 | $ | 6,391,549 | $ | 6,070,742 | |||||||||||||||||||||
| Interest-bearing liabilities: |
|||||||||||||||||||||||||||
| Savings deposits |
$ | 874,281 | 6,284 | 0.72 | % | $ | 941,057 | 9,915 | 1.05 | % | $ | 1,168,530 | 18,674 | 1.60 | % | ||||||||||||
| Demand deposits |
1,672,379 | 22,710 | 1.36 | 1,215,059 | 23,273 | 1.92 | 849,235 | 21,269 | 2.50 | ||||||||||||||||||
| Time deposits |
1,629,467 | 45,561 | 2.80 | 1,545,794 | 55,699 | 3.60 | 1,659,191 | 72,980 | 4.40 | ||||||||||||||||||
| Borrowed funds |
1,056,723 | 36,987 | 3.50 | 1,163,531 | 43,364 | 3.73 | 832,961 | 34,776 | 4.17 | ||||||||||||||||||
| Total interest-bearing liabilities |
5,232,850 | 111,542 | 2.13 | 4,865,441 | 132,251 | 2.72 | 4,509,917 | 147,699 | 3.27 | ||||||||||||||||||
| Non-interest bearing liabilities |
525,352 | 515,142 | 532,070 | ||||||||||||||||||||||||
| Total liabilities |
5,758,202 | 5,380,583 | 5,041,987 | ||||||||||||||||||||||||
| Stockholders’ equity |
914,218 | 1,010,966 | 1,028,755 | ||||||||||||||||||||||||
| Total liabilities and equity |
$ | 6,672,420 | $ | 6,391,549 | $ | 6,070,742 | |||||||||||||||||||||
| Net interest income |
$ | 181,017 | $ | 172,069 | $ | 154,878 | |||||||||||||||||||||
| Net interest rate spread |
2.82 | % | 2.78 | % | 2.52 | % | |||||||||||||||||||||
| Net interest earning assets |
$ | 682,409 | $ | 664,004 | $ | 717,515 | |||||||||||||||||||||
| Net interest margin(3) |
3.06 | % | 3.11 | % | 2.96 | % | |||||||||||||||||||||
| Ratio of interest-earning assets to total interest-bearing liabilities |
1.13x | 1.14x | 1.16x | ||||||||||||||||||||||||
| (1) | Average outstanding balance amounts are at amortized cost. |
| (2) | Average outstanding balances are net of the allowance for loan losses, deferred loan fees and expenses, and loan premiums and discounts and include non-accrual loans. |
| (3) | Net interest income divided by average interest-earning assets. |
48
Table of Contents
Rate/Volume Analysis. The following table presents the extent to which changes in interest rates and changes in the volume of interest-earning assets and interest-bearing liabilities have affected interest income and interest expense during the periods indicated. Information is provided in each category with respect to: (i) changes attributable to changes in volume (changes in volume multiplied by prior rate); (ii) changes attributable to changes in rate (changes in rate multiplied by prior volume); and (iii) the net change. The changes attributable to the combined impact of volume and rate have been allocated proportionately to the changes due to volume and the changes due to rate.
| Year Ended December 31, | ||||||||||||||||||||||||
| 2009 vs. 2008 | 2008 vs. 2007 | |||||||||||||||||||||||
| Increase/(Decrease) Due to |
Total Increase/ (Decrease) |
Increase/(Decrease) Due to |
Total Increase/ (Decrease) |
|||||||||||||||||||||
| Volume | Rate | Volume | Rate | |||||||||||||||||||||
| (In thousands) | ||||||||||||||||||||||||
| Interest-earning assets: |
||||||||||||||||||||||||
| Deposits, Federal funds sold and short-term investments |
$ | 696 | $ | (865 | ) | $ | (169 | ) | $ | 384 | $ | (149 | ) | $ | 235 | |||||||||
| Investment securities |
(596 | ) | (416 | ) | (1,012 | ) | (823 | ) | (152 | ) | (975 | ) | ||||||||||||
| Securities available for sale |
10,698 | (7,518 | ) | 3,180 | 2,705 | 1,659 | 4,364 | |||||||||||||||||
| Federal Home Loan Bank Stock |
(204 | ) | (380 | ) | (584 | ) | 527 | (408 | ) | 119 | ||||||||||||||
| Loans |
1,342 | (14,518 | ) | (13,176 | ) | 14,619 | (16,619 | ) | (2,000 | ) | ||||||||||||||
| Total interest-earning assets |
11,936 | (23,697 | ) | (11,761 | ) | 17,412 | (15,669 | ) | 1,743 | |||||||||||||||
| Interest-bearing liabilities: |
||||||||||||||||||||||||
| Savings deposits |
(669 | ) | (2,962 | ) | (3,631 | ) | (3,167 | ) | (5,592 | ) | (8,759 | ) | ||||||||||||
| Demand deposits |
7,350 | (7,913 | ) | (563 | ) | 7,705 | (5,701 | ) | 2,004 | |||||||||||||||
| Time deposits |
2,859 | (12,997 | ) | (10,138 | ) | (4,721 | ) | (12,560 | ) | (17,281 | ) | |||||||||||||
| Borrowed funds |
(3,815 | ) | (2,562 | ) | (6,377 | ) | 12,575 | (3,987 | ) | 8,588 | ||||||||||||||
| Total interest-bearing liabilities |
5,725 | (26,434 | ) | (20,709 | ) | 12,392 | (27,840 | ) | (15,448 | ) | ||||||||||||||
| Net interest income |
$ | 6,211 | $ | 2,737 | $ | 8,948 | $ | 5,020 | $ | 12,171 | $ | 17,191 | ||||||||||||
Comparison of Financial Condition at December 31, 2009 and December 31, 2008
Total assets increased $287.4 million, or 4.4%, to $6.84 billion at December 31, 2009, from $6.55 billion at December 31, 2008, due primarily to increases in securities available for sale and cash and cash equivalents, partially offset by decreases in loans and intangible assets.
Cash and cash equivalents increased $55.2 million, to $123.7 million at December 31, 2009, from $68.5 million at December 31, 2008, as a result of deposit inflows and proceeds from loan repayments and loan sales. The Company will continue to deploy these cash balances to fund loan originations, investment purchases and the repayment of maturing borrowings.
Total investments increased $491.9 million, or 40.6%, during the year ended December 31, 2009. The increase included $84.9 million of residential mortgage loan pools that were securitized by the Company in the first quarter of 2009, which are held as securities available for sale. The loan securitization was undertaken to enhance the liquidity and risk-based capital treatment of the underlying loans. Securities purchases for the year ended December 31, 2009 consisted primarily of U.S. Government Agency guaranteed mortgage-backed securities and obligations.
Total loans at December 31, 2009 were $4.38 billion, compared to $4.53 billion at December 31, 2008. For the year ended December 31, 2009, loan originations totaling $1.14 billion and loan purchases of $55.1 million
49
Table of Contents
were more than offset by repayments of $1.32 billion, loan securitizations of $84.9 million and loan sales of $98.7 million. Residential mortgage loans decreased $301.8 million to $1.49 billion at December 31, 2009, compared to $1.79 billion at December 31, 2008. Residential mortgage loan originations totaled $207.6 million and one- to four-family loans purchased totaled $55.1 million for the year ended December 31, 2009. Principal repayments on residential mortgage loans totaled $378.5 million, $84.9 million of conforming one- to four- family 30-year fixed-rate residential mortgage loans were securitized, and residential mortgage loans sold totaled $98.7 million for the year ended December 31, 2009. Construction loans decreased $37.8 million to $195.9 million at December 31, 2009, compared to $233.7 million at December 31, 2008, as a result of significantly reduced originations as the Company de-emphasised construction lending due to adverse market conditions. Consumer loans decreased $37.8 million to $586.5 million at December 31, 2009, compared to $624.3 million at December 31, 2008. Commercial real estate loans increased $166.9 million to $1.09 billion at December 31, 2009, compared to $923.0 million at December 31, 2008. Multi-family loans increased $38.2 million to $227.7 million at December 31, 2009, compared to $189.5 million at December 31, 2008. Commercial loans increased $32.6 million to $785.8 million at December 31, 2009, compared to $753.2 million at December 31, 2008. Retail loans, which consist of one- to four-family residential mortgages and consumer loans, such as fixed-rate home equity loans and lines of credit, totaled $2.08 billion and accounted for 47.5% of the loan portfolio at December 31, 2009, compared to $2.42 billion, or 53.5%, of the portfolio at December 31, 2008. The decrease in retail loans as a percentage of the total loan portfolio was a result of reduced purchase mortgage activity and the sale of longer-term fixed-rate originations as part of the Company’s interest rate risk management process, coupled with growth in the commercial mortgage and commercial loan portfolios. Commercial loans, consisting of commercial real estate, multi-family, construction and commercial loans, totaled $2.30 billion, accounting for 52.5% of the loan portfolio at December 31, 2009, compared to $2.10 billion, or 46.5%, at December 31, 2008.
The Company does not originate or purchase sub-prime or option ARM loans. On a limited basis, the Company has originated “Alt-A” mortgages in the form of stated income loans with a maximum loan-to-value ratio of 50%. The balance of these “Alt-A” loans at December 31, 2009 was $18.2 million. Of this total, 7 loans totaling $3.0 million were 90 days or more delinquent. General valuation reserves of 10%, or $297,000, were allocated to these loans at December 31, 2009.
The Company participates in loans originated by other banks, including participations designated as Shared National Credits (“SNC”). The Company’s gross commitments and outstanding balances as a participant in SNCs were $144.1 million and $109.3 million, respectively, at December 31, 2009. The Company’s participations in SNCs included three loans classified as substandard (rated 7) under the Company’s loan risk rating system with gross commitments of $29.2 million and outstanding balances of $28.9 million, respectively, at December 31, 2009. These adversely classified SNCs are all commercial construction loans on projects located in New York City. All of the Company’s SNC participations were current as to the payment of principal and interest as of December 31, 2009.
The Company had outstanding junior lien mortgages totaling $312.5 million at December 31, 2009. Of this total, 43 loans totaling $3.0 million were 90 days or more delinquent. General valuation reserves of 10%, or $298,000, were allocated to these loans at December 31, 2009.
The Company had outstanding indirect marine loans totaling $85.7 million at December 31, 2009. Of this total, 14 loans totaling $2.2 million were 90 days or more delinquent. General valuation reserves of 20%, or $431,000, were allocated to these loans at December 31, 2009. The Bank curtailed its marine lending in 2008 and 2009, and marine loans are currently made only on a direct, limited accommodation basis to existing customers.
The allowance for loan losses increased $13.0 million to $60.7 million at December 31, 2009, as a result of provisions for loan losses of $30.3 million, partially offset by net charge-offs of $17.2 million during 2009. The increase in the allowance for loan losses was attributable to an increase in non-performing loans, downgrades in credit risk ratings and an increase in commercial loans as a percentage of the loan portfolio to 52.5% at December 31, 2009, from 46.5% at December 31, 2008. Total non-performing loans at December 31, 2009 were
50
Table of Contents
$84.5 million, or 1.93% of total loans, compared with $59.1 million, or 1.31% of total loans at December 31, 2008. At December 31, 2009, impaired loans totaled $41.1 million with related specific reserves of $12.5 million. Within total impaired loans, there were $11.0 million of loans with a weighted average loan-to-value ratio of 95.5% based on current collateral valuations for which no specific reserves were required in accordance with GAAP. At December 31, 2009, the Company’s allowance for loan losses was 1.39% of total loans, compared with 1.05% of total loans at December 31, 2008.
Non-performing residential mortgage loans increased $14.1 million, to $28.6 million at December 31, 2009, from $14.5 million at December 31, 2008. In addition, non-performing consumer loans increased $838,000, to $6.8 million at December 31, 2009, from $5.9 million at December 31, 2008. The Company attributes the increase in non-performing residential mortgage and consumer loans to rising unemployment, declining property values and increased personal debt levels.
Non-performing commercial loans increased $8.1 million, to $12.5 million at December 31, 2009, from $4.4 million at December 31, 2009. Non-performing commercial loans at December 31, 2009 consisted of 67 loans. The largest non-performing commercial loan relationship consisted of four loans to a consumer products distributor with total outstanding balances of $4.8 million at December 31, 2009.
Non-performing construction loans increased $3.8 million, to $13.2 million at December 31, 2009, from $9.4 million at December 31, 2008. At December 31, 2009, non-performing construction loans included a $10.5 million senior participation interest in a $283.0 million SNC. Proceeds from this construction loan facility are being used to convert an existing 35-story, 631,000 square foot office building in New York City into a mixed-use 349-unit residential condominium and 251-room hotel. The project has been impacted by additional costs and a decline in sales activity. While this loan has been classified as non-accrual, the hotel construction is nearing completion and the loan was current as to principal and interest at December 31, 2009. The Company estimates a loan-to-value ratio of approximately 96% at December 31, 2009, and therefore, in accordance with GAAP, no specific reserve has been allocated to this loan. The Company had an unfunded commitment on this loan of an additional $276,000 at December 31, 2009.
Non-performing commercial mortgage loans decreased $1.5 million, to $23.4 million at December 31, 2009, from $24.8 million at December 31, 2008. At December 31, 2009, non-performing commercial mortgage loans consisted primarily of two loans to a single real estate developer. The first is an $11.4 million loan secured by a planned unit development of 203 single family detached townhouse and age restricted units; and the second is a $8.5 million commercial mortgage loan secured by a 184-unit, age restricted townhouse project. At December 31, 2009, these loans were deemed impaired and were allocated $8.7 million of the allowance for loan losses. Management believes that the allowance for loan losses allocated to this credit relationship is appropriate and adequate based on recent appraisals and projections of net realizable value. There is no contractual commitment to advance additional funds to this borrower.
At December 31, 2009, the Company held $6.4 million of foreclosed assets, compared with $3.4 million at December 31, 2008. Foreclosed assets at December 31, 2009 are carried at fair value based on recent appraisals and valuation estimates, less estimated selling costs. Foreclosed assets consisted of $3.1 million of commercial real estate, $2.0 million of residential properties, and $1.3 million of boats at December 31, 2009.
Non-performing assets totaled $90.9 million, or 1.33% of total assets at December 31, 2009, compared to $62.6 million, or 0.96% of total assets at December 31, 2008.
Intangible assets decreased $156.6 million to $358.1 million at December 31, 2009, from $514.7 million at December 31, 2008, primarily due to a $152.5 million goodwill impairment charge recognized in the first quarter of 2009.
Other assets increased $41.8 million to $87.6 million at December 31, 2009, compared to $45.8 million at December 31, 2008. At December 31, 2009, other assets included $27.4 million of prepaid FDIC insurance
51
Table of Contents
premiums. In addition, prepaid pension funding increased $7.7 million at December 31, 2009, compared with December 31, 2008, primarily as a result of a $6.5 million contribution made in December of 2009.
Total deposits increased $672.8 million, or 15.9%, to $4.90 billion at December 31, 2009, from $4.23 billion at December 31, 2008. At December 31, 2009, core deposits represented 69.2% of total deposits, compared with 63.7% at December 31, 2008. Core deposits increased $697.7 million, or 25.9%, to $3.39 billion at December 31, 2009, from $2.69 billion at December 31, 2008. The majority of the core deposit increase was in municipal money market and retail checking deposits. Certificates of deposit decreased $24.9 million, or 1.6%, to $1.51 billion at December 31, 2009, from $1.53 billion at December 31, 2008. The majority of the decrease in certificates of deposit occurred in the 9-month and shorter maturity categories.
Borrowed funds were reduced by $248.4 million, or 19.9%, during the year ended December 31, 2009, to $999.2 million, as the Company deployed excess liquidity arising from the increase in core deposit funding. Borrowed funds represented 14.6% of total assets at December 31, 2009, a reduction from 19.1% at December 31, 2008.
Total stockholders’ equity decreased $134.0 million to $884.6 million at December 31, 2009, from $1.02 billion at December 31, 2008. This decrease was a result of a comprehensive loss of $113.6 million, cash dividends of $24.9 million and common stock repurchases of $119,000, partially offset by the allocation of shares to stock-based compensation plans of $4.6 million.
Comparison of Operating Results for the Years Ended December 31, 2009 and December 31, 2008
General. The Company realized a net loss of $121.8 million for the year ended December 31, 2009, compared to net income of $41.6 million for the year ended December 31, 2008. The basic and diluted loss per share was $2.16 for the year ended December 31, 2009, compared to basic and diluted earnings per share of $0.74 for 2008. The primary reason for the net loss in 2009 was the recognition of a $152.5 million goodwill impairment charge. The goodwill impairment charge was a non-cash accounting adjustment to the Company’s financial statements which did not affect cash flows, liquidity, or tangible capital. As goodwill is excluded from regulatory capital, the impairment charge did not impact the regulatory capital ratios of the Company or its wholly owned subsidiary, The Provident Bank, both of which remain “well-capitalized” under current regulatory requirements.
Earnings and per share data for the year ended December 31, 2009 also reflect an increase in the provision for loan losses due to the following: an increase in non-performing loans; downgrades in credit risk ratings; an increase in commercial loans as a percentage of the total loan portfolio; and the impact of current macroeconomic conditions. The provision for loan losses was $30.3 million for the year ended December 31, 2009, compared with $15.1 million for 2008. In addition, earnings and per share data for the year ended December 31, 2009 were impacted by a special assessment imposed on the banking industry by the FDIC as part of its plan to restore the deposit insurance fund. The cost of this special assessment to the Company was $3.1 million, which resulted in a charge of $1.9 million, net of tax, recognized during the second quarter of 2009.
Net Interest Income. Net interest income increased $8.9 million, or 5.2%, to $181.0 million for 2009, from $172.1 million for 2008. The average interest rate spread increased 4 basis points to 2.82% for 2009, from 2.78% for 2008. The net interest margin decreased 5 basis points to 3.06% for 2009, compared to 3.11% for 2008.
Interest income decreased $11.8 million, or 3.9%, to $292.6 million for 2009, compared to $304.3 million for 2008. The decrease in interest income was primarily attributable to a decrease in the yield on average earning assets, partially offset by an increase in average earning asset balances. The yield on interest-earning assets decreased 55 basis points to 4.95% for 2009, from 5.50% for 2008, with reductions in yields experienced in all earning asset classes. Average interest-earning assets increased $385.8 million, or 7.0%, to $5.92 billion for 2009, compared to $5.53 billion for 2008. The average balance of securities available for sale increased
52
Table of Contents
$249.8 million, or 29.8%, to $1.09 billion for 2009, compared to $839.2 million for 2008. Average deposits, Federal funds sold and short-term investment balances increased $131.1 million, to $147.3 million for 2009, from $16.2 million for 2008. Average outstanding loan balances increased $23.3 million, or 0.5%, to $4.30 billion for 2009 from $4.28 billion for 2008. The average balance of investment securities decreased $14.9 million, or 4.2%, to $339.2 million for 2009, compared to $354.1 million for 2008.
Interest expense decreased $20.7 million, or 15.7%, to $111.5 million for 2009, from $132.3 million for 2008. The decrease in interest expense was attributable to lower short-term interest rates and a reduction in average borrowings, partially offset by an increase in average deposits. The average rate paid on interest-bearing liabilities decreased 59 basis points to 2.13% for 2009, from 2.72% for 2008. The average rate paid on interest-bearing deposits decreased 61 basis points to 1.79% for 2009, from 2.40% for 2008. The average rate paid on borrowings decreased 23 basis points to 3.50% for 2009, from 3.73% for 2008. The average balance of interest-bearing liabilities increased $367.4 million, or 7.6%, to $5.23 billion for 2009, compared to $4.87 billion for 2008. Average interest-bearing deposits increased $474.2 million, or 12.8%, to $4.18 billion for 2009, from $3.70 billion for 2008. Average interest-bearing core deposits increased $390.5 million, or 18.1%, for 2009, compared with 2008, while average time deposits increased $83.7 million, or 5.4%, for 2009, compared with 2008. Average outstanding borrowings decreased $106.8 million, or 9.2%, to $1.06 billion for 2009, compared with $1.16 billion for 2008.
Provision for Loan Losses. Provisions for loan losses are charged to operations in order to maintain the allowance for loan losses at a level management considers necessary to absorb probable credit losses inherent in the loan portfolio. In determining the level of the allowance for loan losses, management considers past and current loss experience, evaluations of real estate collateral, current economic conditions, volume and type of lending, adverse situations that may affect a borrower’s ability to repay the loan and the levels of non-performing and other classified loans. The amount of the allowance is based on estimates and the ultimate losses may vary from such estimates as more information becomes available or subsequent events change. Management assesses the adequacy of the allowance for loan losses on a quarterly basis and makes provisions for loan losses, if necessary, in order to maintain the adequacy of the allowance. The Company’s emphasis on continued diversification of the loan portfolio through the origination of commercial mortgage loans, commercial loans and construction loans has been one of the more significant factors management has considered in evaluating the allowance for loan losses and provision for loan losses. In the event the Company further increases the amount of such types of loans in the portfolio, management may determine that additional or increased provisions for loan losses are necessary, which could adversely affect earnings.
The provision for loan losses was $30.3 million in 2009, compared to $15.1 million in 2008. The increase in the provision for loan losses was attributable to an increase in non-performing loans; downgrades in credit risk ratings; an increase in commercial loans as a percentage of the total loan portfolio to 52.5% at December 31, 2009, from 46.5% at December 31, 2008; and the impact of current macroeconomic conditions. Net charge-offs for 2009 were $17.2 million, compared to $8.2 million for 2008. Total charge-offs for the year ended December 31, 2009 were $19.6 million, compared to $10.4 million for the year ended December 31, 2008. Recoveries for the year ended December 31, 2009 were $2.4 million, compared to $2.3 million for the year ended December 31, 2008. The allowance for loan losses at December 31, 2009 was $60.7 million, or 1.39% of total loans, compared to $47.7 million, or 1.05% of total loans at December 31, 2008. At December 31, 2009, non-performing loans as a percentage of total loans were 1.93%, compared to 1.31% at December 31, 2008. Non-performing assets as a percentage of total assets were 1.33% at December 31, 2009, compared to 0.96% at December 31, 2008. At December 31, 2009, non-performing loans were $84.5 million, compared to $59.1 million at December 31, 2008, and non-performing assets were $90.9 million at December 31, 2009, compared to $62.6 million at December 31, 2008.
Non-Interest Income. For the year ended December 31, 2009, non-interest income totaled $31.5 million, an increase of $1.2 million, or 4.1%, compared to the same period in 2008. Fee income increased $830,000 for the year ended December 31, 2009, compared with 2008, primarily due to an increase in the value of equity fund
53
Table of Contents
holdings. In addition, net gains on securities transactions increased $470,000 for the year ended December 31, 2009, compared with 2008. Other income increased $454,000 for the year ended December 31, 2009, compared with the same period in 2008, primarily due to an increase in gains on loan sales. Income from the appreciation in the cash surrender value of Bank-owned life insurance increased $108,000 for the year ended December 31, 2009, compared with 2008. Partially offsetting these improvements, the Company recognized other-than-temporary impairment charges on securities of $2.0 million during the year ended December 31, 2009, compared with other-than-temporary impairment charges of $1.4 million recognized in 2008.
Non-Interest Expense. Excluding the $152.5 million goodwill impairment charge recorded in the first quarter of 2009, non-interest expense increased $13.9 million, or 10.7%, to $144.5 million for the year ended December 31, 2009, compared to $130.6 million for the year ended December 31, 2008. FDIC insurance expense increased $11.1 million for the year ended December 31, 2009, compared with 2008, as a result of deposit growth, increased premium rates and the FDIC special assessment imposed on the industry as part of its plan to restore the deposit insurance fund. The cost of the FDIC special assessment was $3.1 million. Other operating expenses increased $3.1 million for the year ended December 31, 2009, compared with 2008, due primarily to $1.3 million of charges related to the consolidation and divestiture of premises and costs associated with the dissolution of a real estate development joint venture. Compensation and benefits expense increased $968,000 for the year ended December 31, 2009, compared with 2008, primarily due to a $1.5 million increase in severance costs during the year ended December 31, 2009. Severance included costs associated with the retirements of two senior executives in the third quarter of 2009. These increases were partially offset by a $966,000 decrease in the amortization of intangibles as a result of scheduled reductions in core deposit amortization, and reductions in net occupancy expense totaling $639,000.
Income Tax Expense. For the year ended December 31, 2009, the Company’s income tax expense was $7.0 million, compared with $14.9 million for 2008. The decrease in income tax expense was attributable to lower pre-tax income and a lower effective tax rate. Excluding the impact of the goodwill impairment charge recognized in the first quarter of 2009, which is not tax deductible, the Company’s effective tax rate was 18.6% for the year ended December 31, 2009, compared with 26.4% for the year ended December 31, 2008. The reduction in the effective tax rate was attributable to a larger proportion of the Company’s income being derived from tax-exempt sources.
Comparison of Operating Results for the Years Ended December 31, 2008 and December 31, 2007
General. Net income for the year ended December 31, 2008 was $41.6 million, compared to net income of $37.4 million for the year ended December 31, 2007. Return on average assets for the year ended December 31, 2008 was 0.65%, compared to 0.62% for 2007. Return on average equity was 4.12% for the year ended December 31, 2008, compared to 3.63% for 2007. Basic and diluted earnings per share were $0.74 for the year ended December 31, 2008, compared to basic and diluted earnings per share of $0.63 for 2007. The primary reason for the increase in net income for 2008 compared with 2007 was expansion of the net interest margin as a result of lower funding costs, partially offset by an increase in the provision for loan losses as a result of growth in the loan portfolio, an increase in non-performing loans, an increase in commercial loans as a percentage of the loan portfolio, and ongoing concerns about general economic conditions.
Earnings and per share data for the year ended December 31, 2008 reflected severance costs totaling $503,000, net of tax. In addition, the Company recorded other-than-temporary impairment charges on investments in a debt security issued by Lehman Brothers Holdings, Inc. and the common stock of two publicly-traded financial institutions totaling $869,000, net of tax, in 2008. Results for the year ended December 31, 2008, were also impacted by a $180,000 net after-tax gain recorded in connection with the ownership and mandatory redemption of a portion of the Company’s Class B Visa, Inc. shares as part of Visa’s initial public offering in the first quarter of 2008, and a $175,000 net after-tax gain resulting from the sale of a branch office.
Earnings and per share data for the year ended December 31, 2007 reflected the impact of an executive separation agreement which resulted in a one-time charge of $655,000, net of tax. Earnings and per share data for
54
Table of Contents
the year ended December 31, 2007 also reflected the impact of a securities impairment charge of $1.0 million, net of tax, and losses recognized on sales of securities in connection with portfolio repositioning totaling $632,000, net of tax. Earnings and per share data for the year ended December 31, 2007 further reflected the impact of a voluntary resignation program which resulted in a one-time charge of $2.1 million, net of tax. In addition, earnings and per share data for the year ended December 31, 2007 reflected the impact of a settlement of an insurance claim resulting in a recovery of $3.5 million, net of tax, related to a fraud loss that occurred and was recognized in 2002, the Company’s acquisition of First Morris from April 1, 2007, the date the acquisition was completed, and one-time expenses of $246,000, net of tax, related to the merger and integration of First Morris’ operations.
Net Interest Income. Net interest income increased $17.2 million, or 11.1%, to $172.1 million for 2008, from $154.9 million for 2007. The average interest rate spread increased 26 basis points to 2.78% for 2008, from 2.52% for 2007. The net interest margin increased 15 basis points to 3.11% for 2008, compared to 2.96% for 2007.
Interest income increased $1.7 million, or 0.6%, to $304.3 million for 2008, compared to $302.6 million for 2007. The increase in interest income was primarily attributable to an increase in loan volume, partially offset by a decrease in the yield on average earning assets. Average interest-earning assets increased $302.0 million, or 5.8%, to $5.53 billion for 2008, compared to $5.23 billion for 2007. Average outstanding loan balances increased $244.3 million, or 6.1%, to $4.28 billion for 2008 from $4.04 billion for 2007. The average balance of investment securities decreased $19.7 million, or 5.3%, to $354.1 million for 2008, compared to $373.7 million for 2007. The average balance of securities available for sale increased $58.4 million, or 7.5%, to $839.2 million for 2008, compared to $780.8 million for 2007. Average Federal funds sold and short-term investment balances increased $11.0 million, to $16.2 million for 2008, from $5.2 million for 2007. The yield on interest-earning assets decreased 29 basis points to 5.50% for 2008, from 5.79% for 2007.
Interest expense decreased $15.4 million, or 10.5%, to $132.3 million for 2008, from $147.7 million for 2007. The decrease in interest expense was attributable to lower short-term interest rates and a shift in the deposit mix to lower-costing core deposits. The average balance of interest-bearing liabilities increased $355.5 million, or 7.9%, to $4.87 billion for 2008, compared to $4.51 billion for 2007. The average rate paid on interest-bearing liabilities decreased 55 basis points to 2.72% for 2008, from 3.27% for 2007. Average interest-bearing deposits increased $25.0 million, or 0.7%, to $3.70 billion for 2008, from $3.68 billion for 2007. The average rate paid on interest-bearing deposits decreased 67 basis points to 2.40% for 2008, from 3.07% for 2007. Average interest-bearing core deposits increased $138.4 million, or 6.9%, for 2008, compared with 2007, while average time deposits decreased $113.4 million, or 6.8%, for 2008, compared with 2007. Average outstanding borrowings increased $330.6 million, or 39.7%, to $1.16 billion for 2008, compared with $833.0 million for 2007. The average rate paid on borrowings decreased 44 basis points to 3.73% for 2008, from 4.17% for 2007.
Provision for Loan Losses. The provision for loan losses was $15.1 million in 2008, compared to $6.5 million in 2007. The increase in the provision for loan losses was primarily attributable to growth in the loan portfolio, an increase in non-performing loans, and an increase in commercial loans as a percentage of the loan portfolio to 46.5% at December 31, 2008, from 45.2% at December 31, 2007, as well as uncertainty with respect to general economic conditions. Net charge-offs for 2008 were $8.2 million, compared to $1.0 million for 2007. Total charge-offs for the year ended December 31, 2008 were $10.4 million, compared to $3.2 million for the year ended December 31, 2007. Recoveries for the year ended December 31, 2008 were $2.3 million, compared to $2.2 million for the year ended December 31, 2007. The allowance for loan losses at December 31, 2008 was $47.7 million, or 1.05% of total loans, compared to $40.8 million, or 0.95% of total loans at December 31, 2007. At December 31, 2008, non-performing loans as a percentage of total loans were 1.31%, compared to 0.81% at December 31, 2007. Non-performing assets as a percentage of total assets were 0.96% at December 31, 2008, compared to 0.56% at December 31, 2007. At December 31, 2008, non-performing loans were $59.1 million, compared to $34.6 million at December 31, 2007, and non-performing assets were $62.6 million at December 31, 2008, compared to $35.7 million at December 31, 2007.
55
Table of Contents
Non-Interest Income. For the year ended December 31, 2008, non-interest income totaled $30.2 million, a decrease of $5.3 million, or 15.0%, compared to 2007. In 2007, the Company recorded a non-recurring gain on an insurance settlement of $5.9 million, before taxes, related to the resolution of previously disclosed litigation. In addition, fee income declined $1.1 million, or 4.7% for the year ended December 31, 2008, compared with 2007, due to decreased loan fees, reductions in income on funds underlying outstanding official checks as a result of lower short-term interest rates, and reductions in the market value of equity fund holdings. Partially offsetting these decreases in non-interest income, net losses on securities transactions, including other-than-temporary impairment charges, declined to $482,000 for the year ended December 31, 2008, compared with net losses of $2.0 million for 2007.
Non-Interest Expense. For the year ended December 31, 2008, non-interest expense decreased $2.4 million, or 1.8%, to $130.6 million, compared to $133.0 million for the year ended December 31, 2007. Compensation and benefits expense decreased $4.4 million, as a result of previous staff reductions and lower stock-based compensation costs. The Company incurred $878,000 in pre-tax severance costs during 2008, compared with $4.5 million in severance charges recognized in 2007. Advertising costs decreased $836,000 for the year ended December 31, 2008, compared with 2007, as prior year costs included charges related to the First Morris acquisition. Amortization of intangibles decreased $509,000 for the year ended December 31, 2008, compared with 2007, as a result of scheduled reductions in the amortization of core deposit intangibles. Partially offsetting these decreases, other operating expenses increased $1.9 million for the year ended December 31, 2008, compared with 2007, due to increases in several categories, including an expense of $426,000 associated with the Company’s proportionate share of a litigation reserve established by Visa, as well as increases in attorneys fees and costs associated with foreclosed assets. Net occupancy expense increased $1.4 million for the year ended December 31, 2008, compared with 2007, due in part to the addition of nine branch locations in connection with the acquisition of First Morris.
The Company’s non-interest expense as a percentage of average assets improved to 2.04% for the year ended December 31, 2008, from 2.19% for 2007. The efficiency ratio (non-interest expense divided by the sum of net interest income and non-interest income) improved to 64.56% for the year ended December 31, 2008, from 69.85% for 2007.
Income Tax Expense. Income tax expense increased $1.4 million, to $14.9 million, on income before taxes of $56.6 million resulting in an effective tax rate of 26.4% in 2008, compared to income tax expense of $13.5 million on income before taxes of $50.9 million in 2007, resulting in an effective tax rate of 26.5%.
Liquidity and Capital Resources
Liquidity refers to the Company’s ability to generate adequate amounts of cash to meet financial obligations to its depositors, to fund loans and securities purchases, deposit outflows and operating expenses. Sources of funds include scheduled amortization of loans, loan prepayments, scheduled maturities of investments, cash flows from mortgage-backed securities and the ability to borrow funds from the FHLB of New York and approved broker dealers. The Bank has a $100.0 million overnight line of credit and a $100.0 million one-month overnight repricing line of credit with the FHLB of New York. These lines of credit are subject to annual renewal. As of December 31, 2009, there were no borrowings outstanding against these lines of credit.
Cash flows from loan payments and maturing investment securities are a fairly predictable source of funds. Changes in interest rates, local economic conditions and the competitive marketplace can influence loan prepayments, prepayments on mortgage-backed securities and deposit flows. For each of the years ended December 31, 2009 and 2008, loan repayments totaled $1.13 billion and $1.29 billion, respectively.
One- to four-family residential loans, consumer loans, commercial real estate loans, multi-family loans and commercial and small business loans are the primary investments of the Company. Purchasing securities for the investment portfolio is a secondary use of funds and the investment portfolio is structured to complement and facilitate the Company’s lending activities and ensure adequate liquidity. Loan originations and purchases totaled
56
Table of Contents
$1.20 billion for the year ended December 31, 2009, compared to $1.60 billion for the year ended December 31, 2008. Purchases for the investment portfolio totaled $817.9 million for the year ended December 31, 2009, compared to $255.8 million for the year ended December 31, 2008.
At December 31, 2009, the Bank had outstanding loan commitments to borrowers of $767.9 million, including undisbursed home equity lines and personal credit lines of $250.3 million at December 31, 2009. Total deposits increased $672.8 million for the year ended December 31, 2009. Deposit activity is affected by changes in interest rates, competitive pricing and product offerings in the marketplace, local economic conditions, customer confidence and other factors such as stock market volatility. Certificate of deposit accounts that are scheduled to mature within one year totaled $1.12 billion at December 31, 2009. Based on its current pricing strategy and customer retention experience, the Bank expects to retain a significant share of these accounts. The Bank manages liquidity on a daily basis and expects to have sufficient cash to meet all of its funding requirements.
As of December 31, 2009, the Bank exceeded all minimum regulatory capital requirements. At December 31, 2009, the Bank’s leverage (Tier 1) capital ratio was 6.44%. FDIC regulations require banks to maintain a minimum leverage ratio of Tier 1 capital to adjusted total assets of 4.00%. At December 31, 2009, the Bank’s total risk-based capital ratio was 11.06%. Under current regulations, the minimum required ratio of total capital to risk-weighted assets is 8.00%. A bank is considered to be well-capitalized if it has a leverage (Tier 1) capital ratio of at least 5.00% and a risk-based capital ratio of at least 10.00%.
Off-Balance Sheet and Contractual Obligations
Off-balance sheet and contractual obligations as of December 31, 2009, are summarized below:
| Payments Due by Period | |||||||||||||||
| Total | Less than 1 year |
1-3 years | 3-5 years | More than 5 years | |||||||||||
| (In thousands) | |||||||||||||||
| Off-Balance Sheet: |
|||||||||||||||
| Long-term commitments |
$ | 742,898 | $ | 499,247 | $ | 128,248 | $ | 8,922 | $ | 106,481 | |||||
| Letters of credit |
24,995 | 24,995 | — | — | — | ||||||||||
| Total Off-Balance Sheet |
767,893 | 524,242 | 128,248 | 8,922 | 106,481 | ||||||||||
| Contractual Obligations: |
|||||||||||||||
| Operating leases |
15,113 | 3,247 | 5,239 | 2,623 | 4,004 | ||||||||||
| Certificate of deposits |
1,507,610 | 1,115,158 | 234,193 | 157,274 | 985 | ||||||||||
| Total Contractual Obligations |
1,522,723 | 1,118,405 | 239,432 | 159,897 | 4,989 | ||||||||||
| Total |
$ | 2,290,616 | $ | 1,642,647 | $ | 367,680 | $ | 168,819 | $ | 111,470 | |||||
Off-balance sheet commitments consist of unused commitments to borrowers for term loans, unused lines of credit and outstanding letters of credit. Total off-balance sheet obligations were $767.9 million at December 31, 2009, an increase of $68.3 million, or 9.8%, from $699.6 million at December 31, 2008.
Contractual obligations consist of operating leases and certificate of deposit liabilities. There were no securities purchases that were entered into in December 2009 or 2008 that would have settled in January 2010 or 2009, respectively. Total contractual obligations at December 31, 2009 were $1.52 billion, a decrease of $24.5 million, or 1.6%, compared to $1.55 billion at December 31, 2008. Contractual obligations under operating leases increased $444,000, or 3.0%, to $15.1 million at December 31, 2009, from $14.7 million at December 31, 2008, and certificate of deposit accounts decreased $24.9 million, or 1.6%, to $1.51 billion at December 31, 2009, from $1.53 billion at December 31, 2008.
57
Table of Contents
| Item 7A. | Quantitative and Qualitative Disclosures About Market Risk |
Qualitative Analysis. Interest rate risk is the exposure of a bank’s current and future earnings and capital arising from adverse movements in interest rates. The guidelines of the Company’s interest rate risk policy seek to limit the exposure to changes in interest rates that affect the underlying economic value of assets and liabilities, earnings and capital. To minimize interest rate risk, the Company generally sells all 20- and 30-year fixed-rate mortgage loans at origination. Commercial real estate loans generally have interest rates that reset in five years, and other commercial loans such as construction loans and commercial lines of credit reset with changes in the Prime rate, the Federal funds rate or LIBOR. Investment securities purchases generally have maturities of five years or less, and mortgage-backed securities have weighted average lives initially between three and five years.
The management Asset/Liability Committee meets on a monthly basis to review the impact of interest rate changes on net interest income, net interest margin, net income and economic value of equity. Members of the Asset/Liability Committee include the Chief Executive Officer and Chief Financial Officer, as well as other senior officers from the Bank’s finance, lending, credit and customer management departments. The Asset/Liability Committee reviews a variety of strategies that project changes in asset or liability mix and the impact of those changes on projected net interest income and net income.
The Company’s strategy for liabilities has been to maintain a stable core-funding base by focusing on core deposit account acquisition and increasing products and services per household. Certificate of deposit accounts as a percentage of total deposits were 30.8% at December 31, 2009 compared to 36.3% at December 31, 2008. Certificate of deposit accounts are generally short-term. As of December 31, 2009, 74.0% of all time deposits had maturities of one year or less compared to 76.1% at December 31, 2008. The Company’s ability to retain maturing certificate of deposit accounts is the result of a strategy to remain competitively priced within the marketplace, typically within the upper quartile of rates offered by competitors. The Company’s pricing strategy may vary depending upon funding needs and the Company’s ability to fund operations through alternative sources, primarily by accessing short-term lines of credit with the FHLB during periods of pricing dislocation.
Quantitative Analysis. Current and future sensitivity to changes in interest rates are measured through the use of balance sheet and income simulation models. The analyses capture changes in net interest income using flat rates as a base, a most likely rate forecast and rising and declining interest rate forecasts. Changes in net interest income and net income for the forecast period, generally twelve to twenty-four months, are measured and compared to policy limits for acceptable change. The Company periodically reviews historical deposit repricing activity and makes modifications to certain assumptions used in its income simulation model regarding the interest rate sensitivity of deposits without maturity dates. These modifications are made to more precisely reflect the most likely results under the various interest rate change scenarios. Since it is inherently difficult to predict the sensitivity of interest bearing deposits to changes in interest rates, the changes in net interest income due to changes in interest rates cannot be precisely predicted. There are a variety of reasons that may cause actual results to vary considerably from the predictions presented below which include, but are not limited to, the timing, magnitude, and frequency of changes in interest rates, interest rate spreads, prepayments, and actions taken in response to such changes. Specific assumptions used in the simulation model include:
| • | Parallel yield curve shifts for market rates; |
| • | Current asset and liability spreads to market interest rates are fixed; |
| • | Traditional savings and interest bearing demand accounts move at 10% of the rate ramp in either direction; |
| • | Money Market accounts move at 5% of the rate ramp in either direction; and |
| • | Higher-balance demand deposit tiers and promotional demand accounts move at 50% of the rate ramp in either direction. |
58
Table of Contents
The following table sets forth the results of the twelve month projected net interest income model as of December 31, 2009.
| Change in Interest Rates in Basis Points (Rate Ramp) |
Net Interest Income | |||||||
| Amount ($) | Change ($) | Change (%) | ||||||
| (Dollars in thousands) | ||||||||
| -100 |
201,192 | (5,329 | ) | (2.6 | ) | |||
| Static |
206,521 | — | — | |||||
| +100 |
206,364 | (157 | ) | (0.1 | ) | |||
| +200 |
204,726 | (1,795 | ) | (0.9 | ) | |||
| +300 |
202,478 | (4,043 | ) | (2.0 | ) | |||
The above table indicates that as of December 31, 2009, in the event of a 300 basis point increase in interest rates, whereby rates ramp up evenly over a twelve-month period, the Company would experience a 2.0%, or $4.0 million decrease in net interest income. In the event of a 100 basis point decrease in interest rates, whereby rates ramp down evenly over a twelve-month period, the Company would experience a 2.6%, or $5.3 million decrease in net interest income.
Another measure of interest rate sensitivity is to model changes in economic value of equity through the use of immediate and sustained interest rate shocks. The following table illustrates the economic value of equity model results as of December 31, 2009.
| Change in Interest Rates |
Present Value of Equity | Present Value of Equity as Percent of Present Value of Assets |
|||||||||||
| Dollar Amount |
Dollar Change |
Percent Change |
Present Value Ratio |
Percent Change |
|||||||||
| (Basis Points) | (Dollars in thousands) | ||||||||||||
| -100 |
1,161,980 | 26,686 | 2.4 | 16.2 | 1.7 | ||||||||
| Flat |
1,135,294 | — | — | 15.9 | — | ||||||||
| +100 |
1,063,918 | (71,376 | ) | (6.3 | ) | 15.1 | (5.0 | ) | |||||
| +200 |
986,146 | (149,148 | ) | (13.1 | ) | 14.2 | (10.6 | ) | |||||
| +300 |
889,576 | (245,718 | ) | (21.6 | ) | 13.1 | (18.0 | ) | |||||
The preceding table indicates that as of December 31, 2009, in the event of an immediate and sustained 300 basis point increase in interest rates, the Company would experience a 21.6%, or $245.7 million reduction in the present value of equity. If rates were to decrease 100 basis points, the Company would experience a 2.4%, or $26.7 million increase in the present value of equity.
Certain shortcomings are inherent in the methodologies used in the above interest rate risk measurements. Modeling changes in net interest income requires the making of certain assumptions regarding prepayment and deposit decay rates, which may or may not reflect the manner in which actual yields and costs respond to changes in market interest rates. While management believes such assumptions are reasonable, there can be no assurance that assumed prepayment rates and decay rates will approximate actual future loan prepayment and deposit withdrawal activity. Moreover, the net interest income table presented assumes that the composition of interest sensitive assets and liabilities existing at the beginning of a period remains constant over the period being measured and also assumes that a particular change in interest rates is reflected uniformly across the yield curve regardless of the duration to maturity or repricing of specific assets and liabilities. Accordingly, although the net interest income table provides an indication of the Company’s interest rate risk exposure at a particular point in time, such measurement is not intended to and does not provide a precise forecast of the effect of changes in market interest rates on net interest income and will differ from actual results.
59
Table of Contents
| Item 8. | Financial Statements and Supplementary Data |
The following are included in this item:
| (A) | Report of Independent Registered Public Accounting Firm |
| (B) | Report of Independent Registered Public Accounting Firm on Internal Control Over Financial Reporting |
| (C) | Consolidated Financial Statements: |
| (1) | Consolidated Statements of Financial Condition as of December 31, 2009 and 2008 |
| (2) | Consolidated Statements of Operations for the years ended December 31, 2009, 2008 and 2007 |
| (3) | Consolidated Statements of Changes in Stockholders’ Equity for the years ended December 31, 2009, 2008 and 2007 |
| (4) | Consolidated Statements of Cash Flows for the years ended December 31, 2009, 2008 and 2007 |
| (5) | Notes to Consolidated Financial Statements |
| (D) | Provident Financial Services, Inc., Condensed Financial Statements: |
| (1) | Condensed Statement of Financial Condition as of December 31, 2009 and 2008 |
| (2) | Condensed Statement of Income for the years ended December 31, 2009, 2008 and 2007 |
| (3) | Condensed Statement of Cash Flows for the years ended December 31, 2009, 2008 and 2007 |
The supplementary data required by this Item (selected quarterly financial data) is provided in Note 19 of the Notes to Consolidated Financial Statements.
60
Table of Contents
Report of Independent Registered Public Accounting Firm
The Board of Directors and Stockholders
Provident Financial Services, Inc.:
We have audited the accompanying consolidated statements of financial condition of Provident Financial Services, Inc. and subsidiary (the “Company”) as of December 31, 2009 and 2008, and the related consolidated statements of operations, changes in stockholders’ equity, and cash flows for each of the years in the three-year period ended December 31, 2009. These consolidated financial statements are the responsibility of the Company’s management. Our responsibility is to express an opinion on these consolidated financial statements based on our audits.
We conducted our audits in accordance with the standards of the Public Company Accounting Oversight Board (United States). Those standards require that we plan and perform the audit to obtain reasonable assurance about whether the financial statements are free of material misstatement. An audit includes examining, on a test basis, evidence supporting the amounts and disclosures in the financial statements. An audit also includes assessing the accounting principles used and significant estimates made by management, as well as evaluating the overall financial statement presentation. We believe that our audits provide a reasonable basis for our opinion.
In our opinion, the consolidated financial statements referred to above present fairly, in all material respects, the financial position of Provident Financial Services, Inc. and subsidiary as of December 31, 2009 and 2008, and the results of their operations and their cash flows for each of the years in the three-year period ended December 31, 2009, in conformity with U.S. generally accepted accounting principles.
As discussed in Note 1 to the consolidated financial statements, the Company changed its method of evaluating other-than-temporary impairments of debt securities due to the adoption of new accounting requirements issued by the Financial Accounting Standards Board, as of April 1, 2009.
We also have audited, in accordance with the standards of the Public Company Accounting Oversight Board (United States), Provident Financial Services, Inc.’s internal control over financial reporting as of December 31, 2009, based on criteria established in Internal Control—Integrated Framework issued by the Committee of Sponsoring Organizations of the Treadway Commission (“COSO”), and our report dated March 1, 2010 expressed an unqualified opinion on the effectiveness of the Company’s internal control over financial reporting.
/s/ KPMG LLP
Short Hills, New Jersey
March 1, 2010
61
Table of Contents
Report of Independent Registered Public Accounting Firm
On Internal Control Over Financial Reporting
The Board of Directors and Stockholders
Provident Financial Services, Inc.:
We have audited Provident Financial Services, Inc.’s (the “Company”) internal control over financial reporting as of December 31, 2009, based on criteria established in Internal Control-Integrated Framework issued by the Committee of Sponsoring Organizations of the Treadway Commission (“COSO”). The Company’s management is responsible for maintaining effective internal control over financial reporting and for its assessment of the effectiveness of internal control over financial reporting, included on page 107 of the Annual Report on Form 10-K, Item 9A., Controls and Procedures – Management’s Report on Internal Control Over Financial Reporting. Our responsibility is to express an opinion on the Company’s internal control over financial reporting based on our audit.
We conducted our audit in accordance with the standards of the Public Company Accounting Oversight Board (United States). Those standards require that we plan and perform the audit to obtain reasonable assurance about whether effective internal control over financial reporting was maintained in all material respects. Our audit included obtaining an understanding of internal control over financial reporting, assessing the risk that a material weakness exists and testing and evaluating the design and operating effectiveness of internal control based on the assessed risk. Our audit also included performing such other procedures as we considered necessary in the circumstances. We believe that our audit provides a reasonable basis for our opinion.
A company’s internal control over financial reporting is a process designed to provide reasonable assurance regarding the reliability of financial reporting and the preparation of financial statements for external purposes in accordance with generally accepted accounting principles. A company’s internal control over financial reporting includes those policies and procedures that (1) pertain to the maintenance of records that, in reasonable detail, accurately and fairly reflect the transactions and dispositions of the assets of the company; (2) provide reasonable assurance that transactions are recorded as necessary to permit preparation of financial statements in accordance with generally accepted accounting principles, and that receipts and expenditures of the company are being made only in accordance with authorizations of management and directors of the company; and (3) provide reasonable assurance regarding prevention or timely detection of unauthorized acquisition, use, or disposition of the company’s assets that could have a material effect on the financial statements.
Because of its inherent limitations, internal control over financial reporting may not prevent or detect misstatements. Also, projections of any evaluation of effectiveness to future periods are subject to the risk that controls may become inadequate because of changes in conditions, or that the degree of compliance with the policies or procedures may deteriorate.
In our opinion, Provident Financial Services, Inc. maintained, in all material respects, effective internal control over financial reporting as of December 31, 2009, based on criteria established in Internal Control—Integrated Framework issued by the COSO.
We also have audited, in accordance with the standards of the Public Company Accounting Oversight Board (United States), the consolidated statements of financial condition of Provident Financial Services, Inc. and subsidiary as of December 31, 2009 and 2008, and the related consolidated statements of operations, changes in stockholders’ equity, and cash flows for each of the years in the three-year period ended December 31, 2009, and our report dated March 1, 2010 expressed an unqualified opinion on those consolidated financial statements.
/s/ KPMG LLP
Short Hills, New Jersey
March 1, 2010
62
Table of Contents
PROVIDENT FINANCIAL SERVICES, INC. AND SUBSIDIARY
Consolidated Statements of Financial Condition
December 31, 2009 and 2008
(Dollars in Thousands, except share data)
| December 31, 2009 | December 31, 2008 | |||||||
| ASSETS |
||||||||
| Cash and due from banks |
$ | 120,823 | $ | 66,315 | ||||
| Short-term investments |
2,920 | 2,231 | ||||||
| Total cash and cash equivalents |
123,743 | 68,546 | ||||||
| Investment securities held to maturity (fair value of $344,385 and $351,623 at December 31, 2009 and December 31, 2008, respectively) |
335,074 | 347,484 | ||||||
| Securities available for sale, at fair value |
1,333,163 | 820,329 | ||||||
| Federal Home Loan Bank Stock |
34,276 | 42,833 | ||||||
| Loans |
4,384,194 | 4,526,748 | ||||||
| Less allowance for loan losses |
60,744 | 47,712 | ||||||
| Net loans |
4,323,450 | 4,479,036 | ||||||
| Foreclosed assets, net |
6,384 | 3,439 | ||||||
| Banking premises and equipment, net |
76,280 | 75,750 | ||||||
| Accrued interest receivable |
25,797 | 23,866 | ||||||
| Intangible assets |
358,058 | 514,684 | ||||||
| Bank-owned life insurance |
132,346 | 126,956 | ||||||
| Other assets |
87,601 | 45,825 | ||||||
| Total assets |
$ | 6,836,172 | $ | 6,548,748 | ||||
| LIABILITIES AND STOCKHOLDERS’ EQUITY |
||||||||
| Deposits: |
||||||||
| Demand deposits |
$ | 2,522,732 | $ | 1,821,437 | ||||
| Savings deposits |
868,835 | 872,388 | ||||||
| Certificates of deposit of $100,000 or more |
469,313 | 445,466 | ||||||
| Other time deposits |
1,038,297 | 1,087,045 | ||||||
| Total deposits |
4,899,177 | 4,226,336 | ||||||
| Mortgage escrow deposits |
18,713 | 20,074 | ||||||
| Borrowed funds |
999,233 | 1,247,681 | ||||||
| Other liabilities |
34,494 | 36,067 | ||||||
| Total liabilities |
5,951,617 | 5,530,158 | ||||||
| Stockholders’ Equity: |
||||||||
| Preferred stock, $0.01 par value, 50,000,000 shares authorized, none issued |
— | — | ||||||
| Common stock, $0.01 par value, 200,000,000 shares authorized, 83,209,293 shares issued and 59,821,850 shares outstanding at December 31, 2009; and 83,209,293 shares issued and 59,610,623 shares outstanding at December 31, 2008, respectively |
832 | 832 | ||||||
| Additional paid-in capital |
1,014,856 | 1,013,293 | ||||||
| Retained earnings |
307,751 | 454,444 | ||||||
| Accumulated other comprehensive income (loss) |
7,731 | (485 | ) | |||||
| Treasury stock |
(384,973 | ) | (384,854 | ) | ||||
| Unallocated common stock held by the Employee Stock Ownership Plan |
(61,642 | ) | (64,640 | ) | ||||
| Common stock acquired by the Directors’ Deferred Fee Plan |
(7,575 | ) | (7,667 | ) | ||||
| Deferred compensation—Directors’ Deferred Fee Plan |
7,575 | 7,667 | ||||||
| Total stockholders’ equity |
884,555 | 1,018,590 | ||||||
| Total liabilities and stockholders’ equity |
$ | 6,836,172 | $ | 6,548,748 | ||||
See accompanying notes to consolidated financial statements.
63
Table of Contents
PROVIDENT FINANCIAL SERVICES, INC. AND SUBSIDIARY
Consolidated Statements of Operations
Years ended December 31, 2009, 2008 and 2007
(Dollars in Thousands, except share data)
| Years ended December 31, | ||||||||||||
| 2009 | 2008 | 2007 | ||||||||||
| Interest income: |
||||||||||||
| Real estate secured loans |
$ | 159,094 | $ | 167,063 | $ | 167,506 | ||||||
| Commercial loans |
43,057 | 42,999 | 42,151 | |||||||||
| Consumer loans |
31,462 | 36,727 | 39,132 | |||||||||
| Investment securities |
13,419 | 14,431 | 15,406 | |||||||||
| Securities available for sale and Federal Home Loan Bank stock |
45,186 | 42,590 | 38,107 | |||||||||
| Deposits, Federal funds sold and other short-term investments |
341 | 510 | 275 | |||||||||
| Total interest income |
292,559 | 304,320 | 302,577 | |||||||||
| Interest expense: |
||||||||||||
| Deposits |
74,555 | 88,887 | 112,923 | |||||||||
| Borrowed funds |
36,987 | 43,364 | 34,776 | |||||||||
| Total interest expense |
111,542 | 132,251 | 147,699 | |||||||||
| Net interest income |
181,017 | 172,069 | 154,878 | |||||||||
| Provision for loan losses |
30,250 | 15,100 | 6,530 | |||||||||
| Net interest income after provision for loan losses |
150,767 | 156,969 | 148,348 | |||||||||
| Non-interest income: |
||||||||||||
| Fees |
24,221 | 23,391 | 24,538 | |||||||||
| Gain on insurance settlement |
— | — | 5,947 | |||||||||
| Bank-owned life insurance |
5,390 | 5,282 | 5,403 | |||||||||
| Other-than-temporary impairment losses on securities |
(11,043 | ) | (1,410 | ) | (1,003 | ) | ||||||
| Portion of loss recognized in other comprehensive income (before taxes) |
9,012 | — | — | |||||||||
| Net impairment losses on securities recognized in earnings |
(2,031 | ) | (1,410 | ) | (1,003 | ) | ||||||
| Net gain (loss) on securities transactions |
1,398 | 928 | (984 | ) | ||||||||
| Other income |
2,474 | 2,020 | 1,636 | |||||||||
| Total non-interest income |
31,452 | 30,211 | 35,537 | |||||||||
| Non-interest expense: |
||||||||||||
| Goodwill impairment |
152,502 | — | — | |||||||||
| Compensation and employee benefits |
68,738 | 67,770 | 72,183 | |||||||||
| Net occupancy expense |
20,170 | 20,809 | 19,431 | |||||||||
| FDIC Insurance |
11,778 | 634 | 550 | |||||||||
| Data processing expense |
9,325 | 9,194 | 9,106 | |||||||||
| Amortization of intangibles |
5,111 | 6,077 | 6,586 | |||||||||
| Advertising and promotion expense |
4,291 | 4,106 | 4,942 | |||||||||
| Other operating expenses |
25,121 | 22,011 | 20,215 | |||||||||
| Total non-interest expenses |
297,036 | 130,601 | 133,013 | |||||||||
| (Loss) income before income tax expense |
$ | (114,817 | ) | $ | 56,579 | $ | 50,872 | |||||
| Income tax expense |
7,007 | 14,937 | 13,492 | |||||||||
| Net (loss) income |
$ | (121,824 | ) | $ | 41,642 | $ | 37,380 | |||||
| Basic (loss) earnings per share |
$ | (2.16 | ) | $ | 0.74 | $ | 0.63 | |||||
| Average basic shares outstanding |
56,275,694 | 56,031,273 | 59,067,438 | |||||||||
| Diluted (loss) earnings per share |
$ | (2.16 | ) | $ | 0.74 | $ | 0.63 | |||||
| Average diluted shares outstanding |
56,275,694 | 56,031,318 | 59,067,438 | |||||||||
See accompanying notes to consolidated financial statements.
64
Table of Contents
PROVIDENT FINANCIAL SERVICES, INC. AND SUBSIDIARY
Consolidated Statement of Changes in Stockholders’ Equity for the Years Ended December 31, 2009, 2008 and 2007
(Dollars in Thousands)
| COMMON STOCK |
ADDITIONAL PAID-IN CAPITAL |
RETAINED EARNINGS |
ACCUMULATED OTHER COMPREHENSIVE (LOSS) INCOME |
TREASURY STOCK |
UNALLOCATED ESOP SHARES |
COMMON STOCK ACQUIRED BY DDFP |
DEFERRED COMPENSATION DDFP |
TOTAL STOCKHOLDERS’ EQUITY |
|||||||||||||||||||||||||||
| Balance at December 31, 2006 |
$ | 799 | $ | 937,616 | $ | 424,958 | $ | (7,150 | ) | $ | (266,587 | ) | $ | (70,480 | ) | $ | (13,010 | ) | $ | 13,010 | $ | 1,019,156 | |||||||||||||
| Comprehensive income: |
|||||||||||||||||||||||||||||||||||
| Net income |
— | — | 37,380 | — | — | — | — | — | 37,380 | ||||||||||||||||||||||||||
| Other comprehensive income: |
|||||||||||||||||||||||||||||||||||
| Unrealized holding gain on securities arising during the period (net of tax of $3,403) |
— | — | — | 5,128 | — | — | — | — | 5,128 | ||||||||||||||||||||||||||
| Reclassification adjustment for losses included in net income (net of tax of ($717)) |
— | — | — | 1,270 | — | — | — | — | 1,270 | ||||||||||||||||||||||||||
| Amortization related to post- retirement obligations (net of tax of $3,513) |
— | — | — | 5,087 | — | — | — | — | 5,087 | ||||||||||||||||||||||||||
| Total comprehensive income |
$ | 48,865 | |||||||||||||||||||||||||||||||||
| Common stock issued in connection with the First Morris acquisition |
33 | 61,902 | — | — | — | — | — | — | 61,935 | ||||||||||||||||||||||||||
| Cash dividends paid |
— | — | (24,835 | ) | — | — | — | — | — | (24,835 | ) | ||||||||||||||||||||||||
| Tax contingency reserve reversal |
— | 2,048 | — | — | — | — | — | — | 2,048 | ||||||||||||||||||||||||||
| Distributions from DDFP |
— | (148 | ) | — | — | — | — | 5,251 | (5,251 | ) | (148 | ) | |||||||||||||||||||||||
| Purchases of treasury stock |
— | — | — | — | (116,820 | ) | — | — | — | (116,820 | ) | ||||||||||||||||||||||||
| Allocation of ESOP shares |
— | (137 | ) | — | — | — | 2,891 | — | — | 2,754 | |||||||||||||||||||||||||
| Allocation of SAP shares |
— | 4,594 | — | — | — | — | — | — | 4,594 | ||||||||||||||||||||||||||
| Allocation of stock options |
— | 3,245 | — | — | — | — | — | — | 3,245 | ||||||||||||||||||||||||||
65
Table of Contents
PROVIDENT FINANCIAL SERVICES, INC. AND SUBSIDIARY
Consolidated Statement of Changes in Stockholders’ Equity for the Years Ended December 31, 2009, 2008 and 2007—(Continued)
(Dollars in Thousands)
| COMMON STOCK |
ADDITIONAL PAID-IN CAPITAL |
RETAINED EARNINGS |
ACCUMULATED OTHER COMPREHENSIVE (LOSS) INCOME |
TREASURY STOCK |
UNALLOCATED ESOP SHARES |
COMMON STOCK ACQUIRED BY DDFP |
DEFERRED COMPENSATION DDFP |
TOTAL STOCKHOLDERS’ EQUITY |
|||||||||||||||||||||||||||
| Balance at December 31, 2007 |
$ | 832 | $ | 1,009,120 | $ | 437,503 | $ | 4,335 | $ | (383,407 | ) | $ | (67,589 | ) | $ | (7,759 | ) | $ | 7,759 | $ | 1,000,794 | ||||||||||||||
| Comprehensive income: |
|||||||||||||||||||||||||||||||||||
| Net income |
— | — | 41,642 | — | — | — | — | — | 41,642 | ||||||||||||||||||||||||||
| Other comprehensive income: |
|||||||||||||||||||||||||||||||||||
| Unrealized holding gain on securities arising during the period (net of tax of $240) |
— | — | — | 410 | — | — | — | — | 410 | ||||||||||||||||||||||||||
| Reclassification adjustment for losses included in net income (net of tax of ($192)) |
— | — | — | 290 | — | — | — | — | 290 | ||||||||||||||||||||||||||
| Amortization related to post-retirement obligations (net of tax of ($3,214)) |
— | — | — | (5,520 | ) | — | — | — | — | (5,520 | ) | ||||||||||||||||||||||||
| Total comprehensive income |
$ | 36,822 | |||||||||||||||||||||||||||||||||
| Cash dividends paid |
— | — | (24,701 | ) | — | — | — | — | — | (24,701 | ) | ||||||||||||||||||||||||
| Distributions from DDFP |
— | (3 | ) | — | — | — | — | 92 | (92 | ) | (3 | ) | |||||||||||||||||||||||
| Purchases of treasury stock |
— | — | — | — | (1,447 | ) | — | — | — | (1,447 | ) | ||||||||||||||||||||||||
| Allocation of ESOP shares |
— | (454 | ) | — | — | — | 2,949 | — | — | 2,495 | |||||||||||||||||||||||||
| Allocation of SAP shares |
— | 2,701 | — | — | — | — | — | — | 2,701 | ||||||||||||||||||||||||||
| Allocation of stock options |
— | 1,929 | — | — | — | — | — | — | 1,929 | ||||||||||||||||||||||||||
66
Table of Contents
PROVIDENT FINANCIAL SERVICES, INC. AND SUBSIDIARY
Consolidated Statement of Changes in Stockholders’ Equity for the Years Ended December 31, 2009, 2008 and 2007—(Continued)
(Dollars in Thousands)
| COMMON STOCK |
ADDITIONAL PAID-IN CAPITAL |
RETAINED EARNINGS |
ACCUMULATED OTHER COMPREHENSIVE (LOSS) INCOME |
TREASURY STOCK |
UNALLOCATED ESOP SHARES |
COMMON STOCK ACQUIRED BY DDFP |
DEFERRED COMPENSATION DDFP |
TOTAL STOCKHOLDERS’ EQUITY |
|||||||||||||||||||||||||||
| Balance at December 31, 2008 |
$ | 832 | $ | 1,013,293 | $ | 454,444 | $ | (485 | ) | $ | (384,854 | ) | $ | (64,640 | ) | $ | (7,667 | ) | $ | 7,667 | $ | 1,018,590 | |||||||||||||
| Comprehensive loss: |
|||||||||||||||||||||||||||||||||||
| Net loss |
— | — | (121,824 | ) | — | — | — | — | — | (121,824 | ) | ||||||||||||||||||||||||
| Other comprehensive loss: |
|||||||||||||||||||||||||||||||||||
| Other-than-temporary impairment on debt securities available for sale (net of tax of ($3,681)) |
— | — | — | (5,331 | ) | — | — | — | — | (5,331 | ) | ||||||||||||||||||||||||
| Unrealized holding gain on securities arising during the period (net of tax of $7,912) |
— | — | — | 11,333 | — | — | — | — | 11,333 | ||||||||||||||||||||||||||
| Reclassification adjustment for losses included in net income (net of tax of ($184)) |
— | — | — | 449 | — | — | — | — | 449 | ||||||||||||||||||||||||||
| Amortization related to post- retirement obligations (net of tax of $489) |
— | — | — | 1,765 | — | — | — | — | 1,765 | ||||||||||||||||||||||||||
| Total comprehensive loss |
$ | (113,608 | ) | ||||||||||||||||||||||||||||||||
| Cash dividends paid |
— | — | (24,869 | ) | — | — | — | — | — | (24,869 | ) | ||||||||||||||||||||||||
| Distributions from DDFP |
— | (8 | ) | — | — | — | — | 92 | (92 | ) | (8 | ) | |||||||||||||||||||||||
| Purchases of treasury stock |
— | — | — | — | (119 | ) | — | — | — | (119 | ) | ||||||||||||||||||||||||
| Allocation of ESOP shares |
— | (1,114 | ) | — | — | — | 2,998 | — | — | 1,884 | |||||||||||||||||||||||||
| Allocation of SAP shares |
— | 1,888 | — | — | — | — | — | — | 1,888 | ||||||||||||||||||||||||||
| Allocation of stock options |
— | 797 | — | — | — | — | — | — | 797 | ||||||||||||||||||||||||||
| Balance at December 31, 2009 |
$ | 832 | $ | 1,014,856 | $ | 307,751 | $ | 7,731 | $ | (384,973 | ) | $ | (61,642 | ) | $ | (7,575 | ) | $ | 7,575 | $ | 884,555 | ||||||||||||||
See accompanying notes to consolidated financial statements.
67
Table of Contents
PROVIDENT FINANCIAL SERVICES, INC. AND SUBSIDIARY
Consolidated Statements of Cash Flows
Years Ended December 31, 2009, 2008 and 2007
(Dollars in Thousands)
| Years Ended December 31, | ||||||||||||
| 2009 | 2008 | 2007 | ||||||||||
| Cash flows from operating activities: |
||||||||||||
| Net (loss) income |
$ | (121,824 | ) | $ | 41,642 | $ | 37,380 | |||||
| Adjustments to reconcile net income to net cash provided by operating activities: |
||||||||||||
| Goodwill impairment |
152,502 | — | — | |||||||||
| Depreciation and amortization of intangibles |
12,383 | 13,903 | 14,129 | |||||||||
| Provision for loan losses |
30,250 | 15,100 | 6,530 | |||||||||
| Deferred tax benefit |
(5,375 | ) | (4,767 | ) | (637 | ) | ||||||
| Increase in cash surrender value of Bank-owned Life Insurance |
(5,390 | ) | (5,282 | ) | (5,403 | ) | ||||||
| Net amortization of premiums and discounts on securities |
3,608 | 355 | 909 | |||||||||
| Accretion of net deferred loan fees |
(2,128 | ) | (2,053 | ) | (1,822 | ) | ||||||
| Amortization of premiums on purchased loans |
2,836 | 2,569 | 3,100 | |||||||||
| Net increase in loans originated for sale |
(98,654 | ) | (16,458 | ) | (8,862 | ) | ||||||
| Proceeds from sales of loans originated for sale |
100,574 | 16,502 | 9,019 | |||||||||
| Proceeds from sales of foreclosed assets |
4,017 | 7,260 | 762 | |||||||||
| Allocation of ESOP shares |
1,494 | 2,162 | 2,495 | |||||||||
| Allocation of stock award shares |
1,888 | 2,701 | 4,594 | |||||||||
| Allocation of stock options |
797 | 1,929 | 3,245 | |||||||||
| Net gain on sale of loans |
(1,920 | ) | (44 | ) | (157 | ) | ||||||
| Net (gain) loss on securities available for sale |
(1,398 | ) | (928 | ) | 984 | |||||||
| Impairment charge on securities |
2,031 | 1,410 | 1,003 | |||||||||
| Net gain on sale of premises and equipment |
(181 | ) | (113 | ) | (153 | ) | ||||||
| Net gain on sale of foreclosed assets |
(17 | ) | (1 | ) | — | |||||||
| Contribution to pension plan |
(6,486 | ) | — | — | ||||||||
| (Increase) decrease in accrued interest receivable |
(1,931 | ) | 799 | (680 | ) | |||||||
| (Increase) decrease in other assets |
(41,990 | ) | (9,606 | ) | 8,154 | |||||||
| Decrease in other liabilities |
(1,573 | ) | (4,531 | ) | (4,049 | ) | ||||||
| Net cash provided by operating activities |
23,513 | 62,549 | 70,541 | |||||||||
| Cash flows from investing activities: |
||||||||||||
| Proceeds from maturities, calls and paydowns of investment securities held to maturity |
52,008 | 44,108 | 44,199 | |||||||||
| Purchases of investment securities held to maturity |
(40,034 | ) | (33,482 | ) | (13,261 | ) | ||||||
| Proceeds from sales of securities available for sale |
75,466 | 36,898 | 124,917 | |||||||||
| Proceeds from maturities and paydowns of securities available for sale |
281,509 | 190,630 | 201,932 | |||||||||
| Purchases of securities available for sale |
(777,893 | ) | (222,348 | ) | (159,099 | ) | ||||||
| Cash consideration paid to acquire First Morris, net of cash and cash equivalents received |
— | — | (1,383 | ) | ||||||||
| Purchases of loans |
(55,145 | ) | (267,823 | ) | (79,131 | ) | ||||||
| Net decrease (increase) in loans |
105,350 | (28,234 | ) | (100,736 | ) | |||||||
| Proceeds from sales of premises and equipment |
502 | 2,049 | 328 | |||||||||
| Purchases of premises and equipment, net |
(8,123 | ) | (6,374 | ) | (9,200 | ) | ||||||
| Net cash (used in) provided by investing activities |
(366,360 | ) | (284,576 | ) | 8,566 | |||||||
| Cash flows from financing activities: |
||||||||||||
| Net increase (decrease) in deposits |
672,841 | 1,516 | (110,649 | ) | ||||||||
| (Decrease) increase in mortgage escrow deposits |
(1,361 | ) | 1,999 | 459 | ||||||||
| Purchase of treasury stock |
(119 | ) | (1,447 | ) | (116,820 | ) | ||||||
| Cash dividends paid to stockholders |
(24,869 | ) | (24,701 | ) | (24,835 | ) | ||||||
| Proceeds from long-term borrowings |
106,000 | 410,600 | 435,700 | |||||||||
| Payments on long-term borrowings |
(204,342 | ) | (349,049 | ) | (169,291 | ) | ||||||
| Net (decrease) increase in short-term borrowings |
(150,106 | ) | 111,026 | (45,099 | ) | |||||||
| Net cash provided by (used in) financing activities |
398,044 | 149,944 | (30,535 | ) | ||||||||
| Net increase (decrease) in cash and cash equivalents |
55,197 | (72,083 | ) | 48,572 | ||||||||
| Cash and cash equivalents at beginning of period |
68,546 | 140,629 | 92,057 | |||||||||
| Cash and cash equivalents at end of period |
$ | 123,743 | $ | 68,546 | $ | 140,629 | ||||||
| Cash paid during the period for: |
||||||||||||
| Interest on deposits and borrowings |
$ | 112,970 | $ | 132,875 | $ | 145,341 | ||||||
| Income taxes |
$ | 14,417 | $ | 16,701 | $ | 19,373 | ||||||
| Non cash investing activities: |
||||||||||||
| Transfer of loans receivable to foreclosed assets |
$ | 6,786 | $ | 9,867 | $ | 1,275 | ||||||
| Loan securitizations |
$ | 84,855 | $ | 55,217 | $ | — | ||||||
| Fair value of assets acquired |
$ | — | $ | — | $ | 554,204 | ||||||
| Goodwill and core deposit intangible |
$ | — | $ | — | $ | 97,513 | ||||||
| Liabilities assumed |
$ | — | $ | — | $ | 527,737 | ||||||
| Common stock issued for First Morris acquisition |
$ | — | $ | — | $ | 61,935 | ||||||
See accompanying notes to consolidated financial statements.
68
Table of Contents
PROVIDENT FINANCIAL SERVICES, INC. AND SUBSIDIARY
Notes to Consolidated Financial Statements
December 31, 2009, 2008 and 2007
(1) Summary of Significant Accounting Policies
Principles of Consolidation
The consolidated financial statements include the accounts of Provident Financial Services, Inc. (the “Company”), The Provident Bank (the “Bank”) and their wholly-owned subsidiaries. All intercompany balances and transactions have been eliminated in consolidation.
Business
The Company, through the Bank, provides a full range of banking services to individual and business customers through branch offices in New Jersey. The Bank is subject to competition from other financial institutions and to the regulations of certain federal and state agencies, and undergoes periodic examinations by those regulatory authorities.
Basis of Financial Statement Presentation
The consolidated financial statements of the Company have been prepared in conformity with U.S. generally accepted accounting principles (“GAAP”). In preparing the consolidated financial statements, management is required to make estimates and assumptions about future events. These estimates and the underlying assumptions affect the reported amounts of assets and liabilities and disclosures about contingent assets and liabilities as of the dates of the consolidated statements of financial condition, and revenues and expenses for the periods then ended. Such estimates are used in connection with the determination of the allowance for loan losses, evaluation of goodwill for impairment, evaluation of other-than-temporary impairment on securities, evaluation of the need for valuation allowances on deferred tax assets, and determination of liabilities related to retirement and other post-retirement benefits, among others. These estimates and assumptions are based on management’s best estimates and judgment. Management evaluates its estimates and assumptions on an ongoing basis using historical experience and other factors, including the current economic environment, which management believes to be reasonable under the circumstances. Such estimates and assumptions are adjusted when facts and circumstances dictate. Illiquid credit markets, volatile securities markets, and declines in the housing market and the economy generally have combined to increase the uncertainty inherent in such estimates and assumptions. As future events and their effects cannot be determined with precision, actual results could differ significantly from these estimates. Changes in estimates resulting from continuing changes in the economic environment will be reflected in the financial statements in future periods.
Cash and Cash Equivalents
For purposes of reporting cash flows, cash and cash equivalents include cash and due from banks, Federal funds sold and commercial paper with maturity dates less than 90 days.
Securities
Securities include investment securities held to maturity and securities available for sale. Securities that the Company has the positive intent and ability to hold to maturity are classified as “investment securities held to maturity” and reported at amortized cost. Securities to be held for indefinite periods of time and not intended to be held to maturity are classified as “securities available for sale” and are reported at estimated fair value, with unrealized gains and losses excluded from earnings and reported as a separate component of stockholders’ equity, net of deferred taxes.
The estimated fair values of the Company’s securities are affected by changes in interest rates, credit spreads, and market illiquidity. The Company conducts a periodic review and evaluation of the securities
69
Table of Contents
PROVIDENT FINANCIAL SERVICES, INC. AND SUBSIDIARY
Notes to Consolidated Financial Statements—(Continued)
December 31, 2009, 2008 and 2007
portfolio to determine if any declines in the fair values of securities are other-than-temporary. If such a decline were deemed other-than-temporary, the Company would measure the total credit-related component of the unrealized loss, and recognize that portion of the loss as a charge to current period earnings. The remaining portion of the unrealized loss would be recognized as an adjustment to accumulated other comprehensive income. In general, as interest rates rise, the market value of fixed-rate securities decreases and as interest rates fall, the market value of fixed-rate securities increases. The current turmoil in the credit markets has resulted in a lack of liquidity in the mortgage-backed securities market. Increases in delinquencies and foreclosures have resulted in limited trading activity and significant price declines, regardless of favorable movements in interest rates. The Company evaluates if it has the intent to sell these securities and if it is not more likely than not that the Company would be required to sell the securities before the anticipated recovery.
Premiums and discounts on securities are amortized to expense and accreted to income using a method that approximates the interest method over the remaining period to contractual maturity, adjusted for anticipated prepayments. Dividend and interest income are recognized when earned. The cost of securities sold is based on the specific identification method.
Fair Value of Financial Instruments
GAAP establishes a fair value hierarchy that prioritizes the inputs to valuation techniques used to measure fair value. The hierarchy gives the highest priority to unadjusted quoted prices in active markets for identical assets or liabilities (level 1 measurements) and the lowest priority to unobservable inputs (level 3 measurements). The three levels of fair value hierarchy are as follows:
| Level 1: |
Unadjusted quoted market prices in active markets that are accessible at the measurement date for identical, unrestricted assets or liabilities; | |
| Level 2: |
Quoted prices in markets that are not active, or inputs that are observable either directly or indirectly, for substantially the full term of the asset or liability; and | |
| Level 3: |
Prices or valuation techniques that require inputs that are both significant to the fair value measurement and unobservable (i.e., supported by little or no market activity). | |
A financial instrument’s level within the fair value hierarchy is based on the lowest level of input that is significant to the fair value measurement. Gains or losses on the sale of securities are based upon the specific identification method. All securities are adjusted for amortization of premiums and accretion of discounts using the level-yield method over the estimated lives of the securities.
Federal Home Loan Bank of New York Stock
The Bank, as a member of the Federal Home Loan Bank of New York (“FHLB”), is required to hold shares of capital stock of the FHLB at cost based on a specified formula. The Bank carries this investment at cost, which approximates fair value.
Loans
Loans receivable are carried at unpaid principal balances plus unamortized premiums, purchase accounting mark-to-market adjustments, certain deferred direct loan origination costs and deferred loan origination fees and discounts, less the allowance for loan losses.
70
Table of Contents
PROVIDENT FINANCIAL SERVICES, INC. AND SUBSIDIARY
Notes to Consolidated Financial Statements—(Continued)
December 31, 2009, 2008 and 2007
The Bank defers loan origination fees and certain direct loan origination costs and accretes such amounts as an adjustment of yield over the expected lives of the related loans using the interest method. Premiums and discounts on loans purchased are amortized or accreted as an adjustment of yield over the contractual lives, of the related loans, adjusted for prepayments when applicable, using methodologies which approximate the interest method.
Loans are generally placed on non-accrual status when they are past due 90 days or more as to contractual obligations or when other circumstances indicate that collection is questionable. When a loan is placed on non-accrual status, any interest accrued but not received is reversed against interest income. Payments received on a non-accrual loan are either applied to the outstanding principal balance or recorded as interest income, depending on an assessment of the ability to collect the loan. A non-accrual loan is restored to accrual status when principal and interest payments become less than 90 days past due and its future collectibility is reasonably assured.
An impaired loan is defined as a loan for which it is probable, based on current information, that the lender will not collect all amounts due under the contractual terms of the loan agreement. Impaired loans are individually assessed to determine that each loan’s carrying value is not in excess of the fair value of the related collateral or the present value of the expected future cash flows. Residential mortgage and consumer loans are deemed smaller balance homogeneous loans which are evaluated collectively for impairment and are therefore excluded from the population of impaired loans.
Allowance for Loan Losses
Losses on loans are charged to the allowance for loan losses. Additions to this allowance are made by recoveries of loans previously charged off and by a provision charged to expense. The determination of the balance of the allowance for loan losses is based on an analysis of the loan portfolio, economic conditions, historical loan loss experience and other factors that warrant recognition in providing for an adequate allowance.
While management uses available information to recognize losses on loans, future additions to the allowance for loan losses may be necessary based on changes in economic conditions in the Bank’s market area. In addition, various regulatory agencies, as an integral part of their examination process, periodically review the Bank’s allowance for loan losses. Such agencies may require the Bank to recognize additions to the allowance or additional write-downs based on their judgments about information available to them at the time of their examination.
Foreclosed Assets
Assets acquired through foreclosure or deed in lieu of foreclosure are carried at the lower of the outstanding loan balance at the time of foreclosure or fair value, less estimated costs to sell. Fair value is generally based on recent appraisals. When an asset is acquired, the excess of the loan balance over fair value, less estimated costs to sell, is charged to the allowance for loan losses. A reserve for foreclosed assets may be established to provide for possible write-downs and selling costs that occur subsequent to foreclosure. Foreclosed assets are carried net of the related reserve. Operating results from real estate owned, including rental income, operating expenses, and gains and losses realized from the sales of real estate owned, are recorded as incurred.
Banking Premises and Equipment
Land is carried at cost. Banking premises, furniture, fixtures and equipment are carried at cost, less accumulated depreciation, computed using the straight-line method based on their estimated useful lives
71
Table of Contents
PROVIDENT FINANCIAL SERVICES, INC. AND SUBSIDIARY
Notes to Consolidated Financial Statements—(Continued)
December 31, 2009, 2008 and 2007
(generally 25 to 40 years for buildings and 3 to 5 years for furniture and equipment). Leasehold improvements, carried at cost, net of accumulated depreciation, are amortized over the terms of the leases or the estimated useful lives of the assets, whichever are shorter, using the straight-line method. Maintenance and repairs are charged to expense as incurred.
Income Taxes
The Company uses the asset and liability method of accounting for income taxes. Under this method, deferred tax assets and liabilities are recognized for the estimated future tax consequences attributable to differences between the financial statement carrying amounts of existing assets and liabilities and their respective tax bases. Deferred tax assets and liabilities are measured using enacted tax rates in effect for the year in which those temporary differences are expected to be recovered or settled. The effect on deferred tax assets and liabilities of a change in tax rates is recognized in income in the period that includes the enactment date. The determination of whether deferred tax assets will be realizable is predicated on estimates of future taxable income. Such estimates are subject to management’s judgment. A valuation reserve is established when management is unable to conclude that it is more likely than not that it will realize deferred tax assets based on the nature and timing of these items. The Company recognizes, when applicable, interest and penalties related to unrecognized tax benefits in the provision for income taxes.
Trust Assets
Trust assets consisting of securities and other property (other than cash on deposit held by the Bank in fiduciary or agency capacities for customers of the Bank’s Wealth Management Group) are not included in the accompanying consolidated statements of financial condition because such properties are not assets of the Bank.
Intangible Assets
Intangible assets of the Bank consist of goodwill, core deposit premiums, and mortgage servicing rights. Goodwill represents the excess of the purchase price over the estimated fair value of identifiable net assets acquired through purchase acquisitions. In accordance with GAAP, goodwill with an indefinite useful life is not amortized, but is evaluated for impairment on an annual basis, or more frequently if events or changes in circumstances indicate potential impairment between annual measurement dates. Goodwill is analyzed for impairment each year at September 30, and the impairment test at September 30, 2009 indicated that there was no impairment.
Core deposit premiums represent the intangible value of depositor relationships assumed in purchase acquisitions and are amortized on an accelerated basis over 8.8 years. Mortgage servicing rights are recorded when purchased or when originated mortgage loans are sold, with servicing rights retained. Mortgage servicing rights are amortized on an accelerated method based upon the estimated lives of the related loans, adjusted for prepayments. Mortgage servicing rights are carried at the lower of amortized cost or fair value.
Bank-owned Life Insurance
Bank-owned life insurance is accounted for using the cash surrender value method and is recorded at its realizable value.
72
Table of Contents
PROVIDENT FINANCIAL SERVICES, INC. AND SUBSIDIARY
Notes to Consolidated Financial Statements—(Continued)
December 31, 2009, 2008 and 2007
Employee Benefit Plans
The Bank maintains a pension plan which covers full-time employees hired prior to April 1, 2003. The Bank’s policy is to fund at least the minimum contribution required by the Employee Retirement Income Security Act of 1974. On April 1, 2003, the pension plan was frozen. GAAP requires an employer to: (a) recognize in its statement of financial position the over-funded or under-funded status of a defined benefit postretirement plan measured as the difference between the fair value of plan assets and the benefit obligation; (b) measure a plan’s assets and its obligations that determine its funded status at the end of the employer’s fiscal year (with limited exceptions); and (c) recognize as a component of other comprehensive income, net of tax, the actuarial gains and losses and the prior service costs and credits that arise during the period.
The Bank has a 401(k) plan covering substantially all employees of the Bank. The Bank may match a percentage of the first 6% contributed by participants. The Bank’s matching contribution, if any, is determined by the Board of Directors in its sole discretion.
The Bank has an Employee Stock Ownership Plan (“ESOP”). The funds borrowed by the ESOP from the Company to purchase the Company’s common stock are being repaid from the Bank’s contributions and dividends paid on unallocated ESOP shares over a period of up to 30 years. The Company’s common stock not allocated to participants is recorded as a reduction of stockholders’ equity at cost. Compensation expense for the ESOP is based on the average price of the Company’s stock during each quarter.
Expense related to stock options is based on the fair value of the options at the date of the grant and is recognized ratably over the vesting period of the options. Expense related to stock awards is based on the fair value of the common stock at the date of the grant and is recognized ratably over the vesting period of the awards.
In connection with the First Sentinel acquisition, the Company assumed the First Savings Bank Directors’ Deferred Fee Plan (the “DDFP”). The DDFP was frozen prior to the acquisition. The Company recorded a deferred compensation equity instrument and corresponding contra-equity account for the value of the shares held by the DDFP at the July 14, 2004 acquisition date. These accounts will be liquidated as shares are distributed from the DDFP in accordance with the plan document. At December 31, 2009, there were 433,283 shares held by the DDFP.
Postretirement Benefits Other Than Pensions
The Bank provides postretirement health care and life insurance plans to certain of its employees. The life insurance coverage is noncontributory to the participant. Participants contribute to the cost of medical coverage based on the employee’s length of service with the Bank. The costs of such benefits are accrued based on actuarial assumptions from the date of hire to the date the employee is fully eligible to receive the benefits. On December 31, 2002, the Bank eliminated postretirement healthcare benefits for employees with less than 10 years of service. GAAP requires an employer to: (a) recognize in its statement of financial position the over-funded or under-funded status of a defined benefit postretirement plan measured as the difference between the fair value of plan assets and the benefit obligation; (b) measure a plan’s assets and its obligations that determine its funded status as of the end of the employer’s fiscal year (with limited exceptions); and (c) recognize as a component of other comprehensive income, net of tax, the actuarial gains and losses and the prior service costs and credits that arise during the period.
73
Table of Contents
PROVIDENT FINANCIAL SERVICES, INC. AND SUBSIDIARY
Notes to Consolidated Financial Statements—(Continued)
December 31, 2009, 2008 and 2007
Comprehensive Income
Comprehensive income is divided into net income and other comprehensive income. Other comprehensive income includes items previously recorded directly to equity, such as unrealized gains and losses on securities available for sale and amortization related to post-retirement obligations. Comprehensive income is presented in the Statements of Changes in Stockholders’ Equity.
Segment Reporting
The Company’s operations are solely in the financial services industry and include providing to its customers traditional banking and other financial services. The Company operates primarily in the geographical regions of northern and central New Jersey. Management makes operating decisions and assesses performance based on an ongoing review of the Bank’s consolidated financial results. Therefore, the Company has a single operating segment for financial reporting purposes.
Earnings Per Share
Basic earnings per share is computed by dividing income available to common stockholders by the weighted average number of shares outstanding for the period. Diluted earnings per share reflects the potential dilution that could occur if securities or other contracts to issue common stock (such as stock options) were exercised or resulted in the issuance of common stock. These potentially dilutive shares would then be included in the weighted average number of shares outstanding for the period using the treasury stock method. Shares issued and shares reacquired during the period are weighted for the portion of the period that they were outstanding.
Impact of Recent Accounting Pronouncements
In June 2009, the Financial Accounting Standards Board (“FASB”) issued a standard that establishes the FASB Accounting Standards Codification (the “Codification”) as the source of authoritative GAAP for nongovernmental entities. The Codification supersedes all existing non-SEC accounting and reporting standards. Rules and interpretative releases of the SEC under the authority of Federal securities laws remain authoritative GAAP for SEC registrants. The Codification is effective for financial statements issued for interim and annual periods ending after September 15, 2009. The adoption of the Codification did not have any impact on the Company’s financial condition, results of operations or amounts reported in financial statement disclosures.
In June 2009, the FASB issued a standard that requires reporting entities to evaluate former qualifying special purpose entities for consolidation, changes the approach to determining a variable interest entity’s (“VIE”) primary beneficiary, increases the frequency of required assessments to determine whether a company is the primary beneficiary of a VIE, clarifies the characteristics that identify a VIE, and requires additional annual and interim disclosures. This standard is effective for fiscal years beginning after November 15, 2009. The adoption of this standard is not expected to have a material impact on the Company’s financial condition, results of operations or financial statement disclosures.
In June 2009, the FASB issued a standard that eliminates the concept of a qualifying special purpose entity, creates more stringent conditions for reporting a transfer of a portion of a financial asset as a sale, clarifies the derecognition criteria, revises how retained interests are initially measured, removes the guaranteed mortgage securitization recharacterization provisions, and requires additional annual and interim disclosures. This standard is effective for fiscal years beginning after November 15, 2009. The Company is currently evaluating the impact of the adoption of this standard.
74
Table of Contents
PROVIDENT FINANCIAL SERVICES, INC. AND SUBSIDIARY
Notes to Consolidated Financial Statements—(Continued)
December 31, 2009, 2008 and 2007
In June 2009, the FASB issued a standard regarding management’s evaluation of events and transactions occurring subsequent to the date of the consolidated financial statements. In February 2010, the FASB issued additional guidance clarifying the application of the initial guidance to ensure consistency with SEC requirements. Management has evaluated events and transactions which transpired after the December 31, 2009 date of the consolidated financial statements to determine whether financial statement recognition or disclosure was necessary. Based on management’s review of all available information, no additional financial statement recognition or disclosure was deemed necessary regarding events or transactions occurring subsequent to the date of the consolidated financial statements.
In April 2009, the FASB issued guidance regarding the estimation of fair value when the volume and level of activity for the asset or liability have significantly decreased, including guidance on identifying circumstances that indicate a transaction is not orderly. Under this guidance, if the reporting entity concludes there has been a significant decrease in the volume and level of activity for the asset or liability, transactions or quoted prices may not be determinative of fair value. Further analysis is required and significant adjustments to the transactions or quoted prices may be necessary. This guidance was effective for interim and annual reporting periods ending after June 15, 2009. The initial adoption of this standard did not have a material impact on the Company’s financial condition, results of operations or financial statement disclosures.
In April 2009, the FASB issued guidance that changes the amount of an other-than-temporary impairment that is recognized in earnings when there are non-credit losses on a debt security which management does not intend to sell, and for which it is more-likely-than-not that the entity will not be required to sell the security prior to the recovery of the non-credit impairment. In those situations, the portion of the total impairment that is attributable to the credit loss would be recognized in earnings, and the remaining difference between the debt security’s amortized cost basis and its fair value would be included in other comprehensive income. This guidance also requires additional disclosures about investments in an unrealized loss position and the methodology and significant inputs used in determining the recognition of other-than-temporary impairment. This guidance was effective for interim and annual reporting periods ending after June 15, 2009. The Company applied the provisions of this standard upon adoption in determining and reporting other-than-temporary impairment losses for the second quarter of 2009.
In April 2009, the FASB issued guidance requiring disclosures about fair value of financial instruments for interim reporting periods of a publicly traded company, as well as in annual financial statements. The disclosure requirements were effective for interim reporting periods ending after June 15, 2009. Upon adoption of this standard, the Company’s interim financial statement disclosures were modified as required.
(2) Stockholders’ Equity and Acquisition
Stockholders’ Equity
On January 15, 2003, the Bank completed its plan of conversion, and the Bank became a wholly-owned subsidiary of the Company. The Company sold 59.6 million shares of common stock (par value $0.01 per share) at $10.00 per share. The Company received net proceeds in the amount of $567.2 million.
In connection with the Bank’s commitment to its community, the plan of conversion provided for the establishment of a charitable foundation. Provident donated $4.8 million in cash and 1.92 million of authorized but unissued shares of common stock to the foundation, which amounted to $24.0 million in aggregate. The Company recognized an expense, net of income tax benefit, equal to the cash and fair value of the stock during 2003. Conversion costs were deferred and deducted from the proceeds of the shares sold in the offering.
Upon completion of the plan of conversion, a “liquidation account” was established in an amount equal to the total equity of the Bank as of the latest practicable date prior to the conversion. The liquidation account was established to provide a limited priority claim to the assets of the Bank to “eligible account holders” and
75
Table of Contents
PROVIDENT FINANCIAL SERVICES, INC. AND SUBSIDIARY
Notes to Consolidated Financial Statements—(Continued)
December 31, 2009, 2008 and 2007
“supplemental eligible account holders” as defined in the Plan, who continue to maintain deposits in the Bank after the conversion. In the unlikely event of a complete liquidation of the Bank, and only in such event, each eligible account holder and supplemental eligible account holder would receive a liquidation distribution, prior to any payment to the holder of the Bank’s common stock. This distribution would be based upon each eligible account holder’s and supplemental eligible account holder’s proportionate share of the then total remaining qualifying deposits. At December 31, 2009, the liquidation account, which is an off-balance sheet memorandum account, amounted to $29,827,000.
Acquisition
The Company completed the acquisition and merger of First Morris with and into the Bank, as of April 1, 2007. First Morris operated nine full-service branch offices in Morris County, New Jersey. Pursuant to the terms of the Agreement and Plan of Merger, 50% of First Morris’ common stock was converted into the Company’s common stock at an exchange rate of 2.1337 shares of the Company’s common stock for each First Morris share, and 50% of First Morris’ common stock was converted into $39.75 in cash for each First Morris share. The aggregate consideration paid in the merger consisted of $62.0 million in cash and 3,330,276 shares of the Company’s common stock, which had a value of $18.60 per share based on the Company’s average closing price from October 12, 2006 to October 17, 2006, for purposes of calculating goodwill in accordance with GAAP. The cash portion of the merger consideration was funded through cash from continuing operations.
The acquisition was accounted for as a purchase and the excess cost over the fair value of net assets acquired (“goodwill”) in the transaction was $89.1 million. In accordance with GAAP, goodwill is not being amortized in connection with this transaction and the goodwill will not be deductible for income tax purposes. The Company also recorded a core deposit intangible of $8.4 million in connection with the acquisition, which is being amortized on an accelerated basis over nine years. The amortization of premiums and discounts resulting from the fair value adjustments of assets and liabilities did not have a material impact on the Company’s results of operations and is not projected to have a material impact on future periods.
(3) Restrictions on Cash and Due from Banks
Included in cash on hand and due from banks at December 31, 2009 and 2008 is $1,323,000 and $10,680,000, respectively, representing reserves required by banking regulations.
76
Table of Contents
PROVIDENT FINANCIAL SERVICES, INC. AND SUBSIDIARY
Notes to Consolidated Financial Statements—(Continued)
December 31, 2009, 2008 and 2007
(4) Investment Securities Held to Maturity
Investment securities held to maturity at December 31, 2009 and 2008 are summarized as follows (in thousands):
| 2009 | ||||||||||
| Amortized cost |
Gross unrealized gains |
Gross unrealized losses |
Fair value | |||||||
| Agency obligations |
$ | 1,000 | — | (8 | ) | 992 | ||||
| Mortgage-backed securities |
64,197 | 1,801 | (445 | ) | 65,553 | |||||
| State and municipal obligations |
260,455 | 8,037 | (206 | ) | 268,286 | |||||
| Corporate obligations |
9,422 | 146 | (14 | ) | 9,554 | |||||
| $ | 335,074 | 9,984 | (673 | ) | 344,385 | |||||
| 2008 | ||||||||||
| Amortized cost |
Gross unrealized gains |
Gross unrealized losses |
Fair value | |||||||
| Mortgage-backed securities |
$ | 91,435 | 910 | (1,236 | ) | 91,109 | ||||
| State and municipal obligations |
256,049 | 5,485 | (1,020 | ) | 260,514 | |||||
| $ | 347,484 | 6,395 | (2,256 | ) | 351,623 | |||||
The Bank generally purchases securities for long-term investment purposes, and differences between carrying and fair values may fluctuate during the investment period. Securities held to maturity having a carrying value of $70,079,000 and $105,334,000 at December 31, 2009 and 2008, respectively, were pledged to secure other borrowings and securities sold under repurchase agreements.
The amortized cost and fair value of investment securities at December 31, 2009 by contractual maturity, are shown below (in thousands). Expected maturities may differ from contractual maturities due to prepayment or early call privileges of the issuer.
| 2009 | |||||
| Amortized cost |
Fair value | ||||
| Due in one year or less |
$ | 13,084 | 13,194 | ||
| Due after one year through five years |
90,843 | 94,818 | |||
| Due after five years through ten years |
101,306 | 104,518 | |||
| Due after ten years |
65,644 | 66,302 | |||
| Mortgage-backed securities |
64,197 | 65,553 | |||
| $ | 335,074 | 344,385 | |||
77
Table of Contents
PROVIDENT FINANCIAL SERVICES, INC. AND SUBSIDIARY
Notes to Consolidated Financial Statements—(Continued)
December 31, 2009, 2008 and 2007
The following table represents the Company’s disclosure on investment securities with temporary impairment (in thousands):
| December 31, 2009 Unrealized Losses | ||||||||||||||||
| Less than 12 months | 12 months or longer | Total | ||||||||||||||
| Fair value | Gross unrealized losses |
Fair value | Gross unrealized losses |
Fair value | Gross unrealized losses |
|||||||||||
| Agency obligations |
$ | 992 | (8 | ) | — | — | 992 | (8 | ) | |||||||
| Mortgage-backed securities |
— | — | 9,082 | (445 | ) | 9,082 | (445 | ) | ||||||||
| State and municipal obligations |
18,138 | (206 | ) | — | — | 18,138 | (206 | ) | ||||||||
| Corporate obligations |
2,246 | (14 | ) | — | — | 2,246 | (14 | ) | ||||||||
| $ | 21,376 | (228 | ) | 9,082 | (445 | ) | 30,458 | (673 | ) | |||||||
| December 31, 2008 Unrealized Losses | ||||||||||||||||
| Less than 12 months | 12 months or longer | Total | ||||||||||||||
| Fair value | Gross unrealized losses |
Fair value | Gross unrealized losses |
Fair value | Gross unrealized losses |
|||||||||||
| Agency obligations |
$ | — | — | — | — | — | — | |||||||||
| Mortgage-backed securities |
20,294 | (994 | ) | 8,395 | (242 | ) | 28,689 | (1,236 | ) | |||||||
| State and municipal obligations |
31,548 | (716 | ) | 10,915 | (304 | ) | 42,463 | (1,020 | ) | |||||||
| Corporate obligations |
— | — | — | — | — | — | ||||||||||
| $ | 51,842 | (1,710 | ) | 19,310 | (546 | ) | 71,152 | (2,256 | ) | |||||||
Based on its detailed review of the securities portfolio, the Company believes that as of December 31, 2009, securities with unrealized loss positions shown above do not represent impairments that are other-than-temporary. The review of the portfolio for other-than-temporary impairment considers the percentage and length of time the market value of an investment is below book value as well as general market conditions, changes in interest rates, credit risk and whether the Company has the intent to sell the securities and whether it is not more likely than not that the Company would be required to sell the securities before the anticipated recovery.
(5) Securities Available for Sale
Securities available for sale at December 31, 2009 and 2008 are summarized as follows (in thousands):
| 2009 | ||||||||||
| Amortized cost |
Gross unrealized gains |
Gross unrealized losses |
Fair value | |||||||
| U.S. Treasury obligations |
$ | — | — | — | — | |||||
| Agency obligations |
223,951 | 1,901 | — | 225,851 | ||||||
| Mortgage-backed securities |
1,076,467 | 19,911 | (11,698 | ) | 1,084,680 | |||||
| State and municipal obligations |
12,199 | 575 | (73 | ) | 12,701 | |||||
| Corporate obligations |
9,567 | 437 | (74 | ) | 9,931 | |||||
| $ | 1,322,184 | 22,824 | (11,845 | ) | 1,333,163 | |||||
78
Table of Contents
PROVIDENT FINANCIAL SERVICES, INC. AND SUBSIDIARY
Notes to Consolidated Financial Statements—(Continued)
December 31, 2009, 2008 and 2007
| 2008 | ||||||||||
| Amortized cost |
Gross unrealized gains |
Gross unrealized losses |
Fair value | |||||||
| U.S. Treasury obligations |
$ | 997 | 16 | — | 1,013 | |||||
| Agency obligations |
91,360 | 3,114 | — | 94,474 | ||||||
| Mortgage-backed securities |
692,020 | 9,578 | (12,137 | ) | 689,461 | |||||
| State and municipal obligations |
17,664 | 490 | (47 | ) | 18,107 | |||||
| Corporate obligations |
3,558 | — | (213 | ) | 3,345 | |||||
| Equity securities |
14,617 | 93 | (781 | ) | 13,929 | |||||
| $ | 820,216 | 13,291 | (13,178 | ) | 820,329 | |||||
Securities available for sale having a carrying value of $543,172,000 and $712,753,000 at December 31, 2009 and 2008, respectively, are pledged to secure other borrowings and securities sold under repurchase agreements.
The amortized cost and fair value of securities available for sale at December 31, 2009, by contractual maturity, are shown below (in thousands). Expected maturities may differ from contractual maturities due to prepayment or early call privileges of the issuer.
| 2009 | |||||
| Amortized cost |
Fair value | ||||
| Due in one year or less |
$ | 170,323 | 171,096 | ||
| Due after one year through five years |
69,327 | 71,096 | |||
| Due after five years through ten years |
6,067 | 6,291 | |||
| Mortgage-backed securities |
1,076,467 | 1,084,680 | |||
| $ | 1,322,184 | 1,333,163 | |||
Proceeds from the sale of securities available for sale during 2009 were $75,466,000, resulting in gross gains and gross losses of $2,497,000 and $1,099,000, respectively. Proceeds from the sale of securities available for sale during 2008 were $36,898,000, resulting in gross gains and gross losses of $947,000 and $19,000, respectively. During 2007, proceeds from the sale of securities available for sale were $124,917,000, resulting in gross gains and gross losses of $131,000 and $1,115,000, respectively.
79
Table of Contents
PROVIDENT FINANCIAL SERVICES, INC. AND SUBSIDIARY
Notes to Consolidated Financial Statements—(Continued)
December 31, 2009, 2008 and 2007
The following table presents a roll-forward of the credit loss component of other-than-temporary impairment (“OTTI”) on debt securities for which a non-credit component of OTTI was recognized in other comprehensive income. The beginning balance represents the credit loss component for debt securities for which OTTI occurred prior to April 1, 2009, the date on which the Company adopted new FASB requirements for the recognition of OTTI. OTTI recognized in earnings after that date for credit-impaired debt securities is presented as an addition in two components, based upon whether the current period is the first time a debt security was credit-impaired (initial credit impairment) or is not the first time a debt security was credit impaired (subsequent credit impairment). Changes in the credit loss component of credit-impaired debt securities were as follows (in thousands):
| December 31, 2009 | |||
| Beginning credit loss amount as of April 1, 2009 |
$ | — | |
| Add: Initial OTTI credit losses |
768,000 | ||
| Subsequent OTTI credit losses |
— | ||
| Less: Realized losses for securities sold |
— | ||
| Securities intended or required to be sold |
— | ||
| Increases in expected cash flows on debt securities |
— | ||
| Ending credit loss amount as of December 31, 2009 |
$ | 768,000 | |
During 2009, the Company recognized in earnings other-than-temporary impairment charges totaling $2,031,000, which consisted of $768,000 of credit-related impairment of two private label mortgage-backed securities and a $1,263,000 reduction in the market value of investments in the common stock of five publicly traded financial institutions. During 2008, the Company recorded other-than-temporary impairment charges totaling $1,410,000 which consisted of a $432,000 credit-related impairment of a bond issued by Lehman Brothers Holdings, Inc. and a $978,000 reduction in the market value of investments and in the common stock of two publicly traded financial institutions. During 2007, the Company recorded an other-than-temporary impairment charge of $1,003,000 related to a reduction in the market value of an investment in the common stock of a publicly traded financial institution. Prior to the charges, any impairment was considered temporary and was recorded as an unrealized loss on securities available for sale and reflected as a reduction of equity, net of tax, through accumulated other comprehensive income. The Company did not have any investments in equity securities at December 31, 2009.
The following table represents the Company’s disclosure on securities available for sale with temporary impairment (in thousands):
| December 31, 2009 Unrealized Losses | ||||||||||||||||
| Less than 12 months | 12 months or longer | Total | ||||||||||||||
| Fair value | Gross unrealized losses |
Fair value |
Gross unrealized losses |
Fair value |
Gross unrealized losses |
|||||||||||
| Mortgage-backed securities |
$ | 272,909 | (2,939 | ) | 55,226 | (8,759 | ) | 328,135 | (11,698 | ) | ||||||
| State and municipal obligations |
737 | (17 | ) | 1,056 | (56 | ) | 1,793 | (73 | ) | |||||||
| Corporate obligations |
— | — | 922 | (74 | ) | 922 | (74 | ) | ||||||||
| $ | 273,646 | (2,956 | ) | 57,204 | (8,889 | ) | 330,850 | (11,845 | ) | |||||||
80
Table of Contents
PROVIDENT FINANCIAL SERVICES, INC. AND SUBSIDIARY
Notes to Consolidated Financial Statements—(Continued)
December 31, 2009, 2008 and 2007
| December 31, 2008 Unrealized Losses | ||||||||||||||||
| Less than 12 months | 12 months or longer | Total | ||||||||||||||
| Fair value | Gross unrealized losses |
Fair value |
Gross unrealized losses |
Fair value |
Gross unrealized losses |
|||||||||||
| Mortgage-backed securities |
$ | 98,334 | (8,283 | ) | 19,718 | (3,854 | ) | 118,052 | (12,137 | ) | ||||||
| State and municipal obligations |
1,133 | (47 | ) | — | — | 1,133 | (47 | ) | ||||||||
| Corporate obligations |
1,863 | (195 | ) | 482 | (18 | ) | 2,345 | (213 | ) | |||||||
| Equity securities |
3,905 | (780 | ) | 298 | (1 | ) | 4,203 | (781 | ) | |||||||
| $ | 105,235 | (9,305 | ) | 20,498 | (3,873 | ) | 125,733 | (13,178 | ) | |||||||
The temporary loss position associated with debt securities is the result of changes in interest rates relative to the coupon of the individual security and changes in credit spreads. In addition, the current turmoil in the credit markets has resulted in a lack of liquidity in the mortgage-backed securities market. Increases in delinquencies and foreclosures have resulted in limited trading activity and significant price declines, regardless of favorable movements in interest rates. The Company did not have any investments in equity securities at December 31, 2009. The Company does not have the intent to sell securities in a temporary loss position at December 31, 2009, and it is not more likely than not that the Company will be required to sell the securities before the anticipated recovery.
The number of securities in an unrealized loss position as of December 31, 2009 totaled 85, compared with 137 at December 31, 2008. There were 19 private label mortgage-backed securities in an unrealized loss position at December 31, 2009, with an amortized cost of $102.7 million and unrealized losses totaling $9.5 million. Of these securities, 16 securities were investment grade and 3 securities were below investment grade at December 31, 2009. Of the investment grade securities, 15 were rated AAA.
The Company estimates the loss projections for each security by stressing the individual loans collateralizing the security and applying a range of expected default rates, loss severities, and prepayment speeds in conjunction with the underlying credit enhancement for each security. Based on specific assumptions about collateral and vintage, a range of possible cash flows was identified to determine whether other-than-temporary impairment existed during the year ended December 31, 2009. Two private label mortgage-backed securities, classified as available for sale, with an amortized cost basis of $17.2 million at December 31, 2009, were deemed to have other-than-temporary impairment totaling $9.8 million in 2009. Of the total amount of the impairment, $768,000 was due to estimated credit losses and charged to earnings and $9.0 million was recognized in other comprehensive income for the year ended December 31, 2009. The evaluation of these securities included a range of likely future cash flows and management-applied, security-specific assumptions as well as market assumptions based on the credit characteristics of this security. The assumptions used to determine the cash flows were based on prepayment, delinquency, loss severity and credit support information. Multiple present value cash flow analyses were used to determine the future expected cash flows. The average borrower credit scores measured as a FICO score for the loans underlying these securities was 733, and the average loan-to-value ratio was 68%. The additional cash flow assumptions that were incorporated into this analysis used credit default rates between 3% and 5% and loss severity expectations ranging between 45% and 65%, discounted at the security’s effective interest rate.
81
Table of Contents
PROVIDENT FINANCIAL SERVICES, INC. AND SUBSIDIARY
Notes to Consolidated Financial Statements—(Continued)
December 31, 2009, 2008 and 2007
(6) Loans
Loans receivable at December 31, 2009 and 2008 are summarized as follows (in thousands):
| 2009 | 2008 | ||||||
| Mortgage loans: |
|||||||
| Residential |
$ | 1,491,358 | 1,793,123 | ||||
| Commercial |
1,089,937 | 923,044 | |||||
| Multi-family |
227,663 | 189,462 | |||||
| Construction |
195,889 | 233,727 | |||||
| Total mortgage loans |
3,004,847 | 3,139,356 | |||||
| Commercial loans |
785,818 | 753,173 | |||||
| Consumer loans |
586,459 | 624,282 | |||||
| Total other loans |
1,372,277 | 1,377,455 | |||||
| Premiums on purchased loans |
8,012 | 10,980 | |||||
| Unearned discounts |
(266 | ) | (492 | ) | |||
| Net deferred costs (fees) |
(676 | ) | (551 | ) | |||
| $ | 4,384,194 | 4,526,748 | |||||
Premiums and discounts on purchased loans are amortized over the lives of the loans as an adjustment to yield. Required reductions due to loan prepayments are charged against interest income. For the years ended December 31, 2009, 2008 and 2007, $2,836,000, $2,569,000 and $3,100,000, respectively, was charged to interest income as a result of prepayments and normal amortization.
Included in Loans receivable are loans for which the accrual of interest income has been discontinued due to deterioration in the financial condition of the borrowers. The principal amount of these nonaccrual loans was $84,477,000 and $59,118,000 at December 31, 2009 and 2008, respectively. There were no loans ninety days or greater past due and still accruing interest at December 31, 2009, or 2008.
If the nonaccrual loans had performed in accordance with their original terms, interest income would have increased by $2,430,000, $2,255,000 and $956,000, for the years ended December 31, 2009, 2008 and 2007, respectively. The amount of cash basis interest income that was recognized on impaired loans during the years ended December 31, 2009, 2008 and 2007 was insignificant for the periods presented. The Company had an unfunded commitment of $276,000 to a borrower whose loan was not accruing interest, but was current at December 31, 2009.
At December 31, 2009, impaired loans consisted of 15 commercial and commercial mortgage loans totaling $41,138,000, all of which were included in nonaccrual loans. At December 31, 2008, impaired loans consisted of ten commercial and commercial mortgage loans totaling $37,847,000, all of which were included in nonaccrual loans. Specific allocations of the allowance for loan losses attributable to impaired loans totaled $12,517,000 and $6,030,000 at December 31, 2009 and 2008, respectively. At December 31, 2009 and 2008, impaired loans for which there was no related allowance for loan losses totaled $11,049,000 and $13,175,000, respectively. The average balances of impaired loans during the years ended December 31, 2009, 2008 and 2007 were $40,097,000, $15,971,000 and $1,264,000, respectively.
Loans serviced for others are not included in the accompanying consolidated statements of condition. The unpaid principal balance of loans serviced for others was approximately $356,710,000 and $265,573,000, at December 31, 2009 and 2008, respectively.
82
Table of Contents
PROVIDENT FINANCIAL SERVICES, INC. AND SUBSIDIARY
Notes to Consolidated Financial Statements—(Continued)
December 31, 2009, 2008 and 2007
In the normal course of conducting its business, the Bank extends credit to meet the financing needs of its customers through commitments. Commitments and contingent liabilities, such as commitments to extend credit (including loan commitments of $517,624,000 and $474,680,000, at December 31, 2009 and 2008, respectively, and undisbursed home equity and personal credit lines of $250,269,000 and $224,953,000, at December 31, 2009 and 2008, respectively), exist, which are not reflected in the accompanying consolidated financial statements. These instruments involve elements of credit and interest rate risk in excess of the amount recognized in the consolidated financial statements. The Bank uses the same credit policies and collateral requirements in making commitments and conditional obligations as it does for on-balance sheet loans. Commitments generally have fixed expiration dates or other termination clauses and may require payment of a fee. Since the commitments may expire without being drawn upon, the total commitment amounts do not necessarily represent future cash requirements. The Bank evaluates each customer’s creditworthiness on a case-by-case basis. The amount of collateral obtained, if deemed necessary by the Bank upon extension of credit, is based on management’s credit evaluation of the borrower.
The Bank grants residential real estate loans on single- and multi-family dwellings to borrowers primarily in New Jersey. Its borrowers’ abilities to repay their obligations are dependent upon various factors, including the borrowers’ income and net worth, cash flows generated by the underlying collateral, value of the underlying collateral, and priority of the Bank’s lien on the property. Such factors are dependent upon various economic conditions and individual circumstances beyond the Bank’s control; the Bank is therefore subject to risk of loss. The Bank believes that its lending policies and procedures adequately minimize the potential exposure to such risks and that adequate provisions for loan losses are provided for all known and inherent risks. Collateral and/or guarantees are required for virtually all loans.
(7) Allowance for Loan Losses
The activity in the allowance for loan losses for the years ended December 31, 2009, 2008 and 2007 is as follows (in thousands):
| Years ended December 31, | ||||||||||
| 2009 | 2008 | 2007 | ||||||||
| Balance at beginning of period |
$ | 47,712 | 40,782 | 32,434 | ||||||
| Allowance of acquired institution (First Morris) |
— | — | 2,825 | |||||||
| Provision charged to operations |
30,250 | 15,100 | 6,530 | |||||||
| Recoveries of loans previously charged off |
2,402 | 2,255 | 2,188 | |||||||
| Loans charged off |
(19,620 | ) | (10,425 | ) | (3,195 | ) | ||||
| Balance at end of period |
$ | 60,744 | 47,712 | 40,782 | ||||||
Loans acquired from First Morris in 2007 that had evidence of deterioration of credit quality since origination such that all contractually required payments were not deemed collectible, were recorded at estimated net realizable value. At the acquisition date those loans had an outstanding contractual balance and carrying value of approximately $2.0 million. No allowance for loan losses was allocated to those loans as of the acquisition date. A reduction in loan value of $870,000 was recorded with an offset to goodwill to reflect the net realizable value of those loans at acquisition.
83
Table of Contents
PROVIDENT FINANCIAL SERVICES, INC. AND SUBSIDIARY
Notes to Consolidated Financial Statements—(Continued)
December 31, 2009, 2008 and 2007
(8) Banking Premises and Equipment
A summary of banking premises and equipment at December 31, 2009 and 2008 is as follows (in thousands):
| 2009 | 2008 | ||||
| Land |
$ | 19,662 | 19,733 | ||
| Banking premises |
86,988 | 82,341 | |||
| Furniture, fixtures and equipment |
50,021 | 48,295 | |||
| Leasehold improvements |
17,377 | 18,296 | |||
| Construction in progress |
6,820 | 5,585 | |||
| 180,868 | 174,250 | ||||
| Less accumulated depreciation and amortization |
104,588 | 98,500 | |||
| $ | 76,280 | 75,750 | |||
Depreciation expense for the years ended December 31, 2009, 2008 and 2007 amounted to $7,272,000, $7,826,000 and $7,543,000, respectively.
(9) Intangible Assets
Intangible assets at December 31, 2009 and 2008 are summarized as follows (in thousands):
| 2009 | 2008 | ||||
| Goodwill |
$ | 346,290 | 498,792 | ||
| Core deposit premiums |
10,049 | 14,918 | |||
| Mortgage servicing rights |
1,719 | 974 | |||
| $ | 358,058 | 514,684 | |||
Amortization expense of intangible assets for the years ended December 31, 2009, 2008 and 2007 is as follows (in thousands):
| 2009 | 2008 | 2007 | |||||
| Core deposit premiums |
$ | 4,869 | 5,966 | 6,476 | |||
| Mortgage servicing rights |
242 | 111 | 110 | ||||
| $ | 5,111 | 6,077 | 6,586 | ||||
Scheduled amortization of core deposit intangibles for each of the next five years is as follows (in thousands):
| Year ended December 31, |
|||
| 2010 |
$ | 3,590 | |
| 2011 |
2,608 | ||
| 2012 |
1,756 | ||
| 2013 |
999 | ||
| 2014 |
626 | ||
84
Table of Contents
PROVIDENT FINANCIAL SERVICES, INC. AND SUBSIDIARY
Notes to Consolidated Financial Statements—(Continued)
December 31, 2009, 2008 and 2007
(10) Deposits
Deposits at December 31, 2009 and 2008 are summarized as follows (in thousands):
| 2009 | Weighted average interest rate |
2008 | Weighted average interest rate |
|||||||||
| Savings deposits |
$ | 868,835 | 0.53 | % | $ | 872,388 | 0.91 | % | ||||
| Money market accounts |
1,185,571 | 0.92 | 756,793 | 2.05 | ||||||||
| NOW accounts |
822,609 | 1.11 | 602,280 | 1.26 | ||||||||
| Non-interest bearing deposits |
514,552 | — | 462,364 | — | ||||||||
| Certificates of deposit |
1,507,610 | 2.21 | 1,532,511 | 3.13 | ||||||||
| $ | 4,899,177 | $ | 4,226,336 | |||||||||
Scheduled maturities of certificates of deposit accounts at December 31, 2009 and 2008 are as follows (in thousands):
| 2009 | 2008 | ||||
| Within one year |
$ | 1,115,158 | 1,166,615 | ||
| One to three years |
234,193 | 267,300 | |||
| Three to five years |
157,274 | 96,161 | |||
| Five years and thereafter |
985 | 2,435 | |||
| $ | 1,507,610 | 1,532,511 | |||
Interest expense on deposits for the years ended December 31, 2009, 2008 and 2007 is summarized as follows (in thousands):
| Years ended December 31, | |||||||
| 2009 | 2008 | 2007 | |||||
| Savings deposits |
$ | 6,284 | 9,915 | 18,674 | |||
| NOW and money market accounts |
22,710 | 23,273 | 21,269 | ||||
| Certificates of deposits |
45,561 | 55,699 | 72,980 | ||||
| $ | 74,555 | 88,887 | 112,923 | ||||
(11) Borrowed Funds
Borrowed funds at December 31, 2009 and 2008 are summarized as follows (in thousands):
| 2009 | 2008 | ||||
| Securities sold under repurchase agreements |
$ | 479,286 | 594,404 | ||
| FHLB line of credit |
— | 96,000 | |||
| FHLB advances |
519,947 | 557,277 | |||
| $ | 999,233 | 1,247,681 | |||
FHLB advances are at fixed and variable rates and mature between January 2010 and January 2019. These advances are secured by investment securities and loans receivable under a blanket collateral agreement.
85
Table of Contents
PROVIDENT FINANCIAL SERVICES, INC. AND SUBSIDIARY
Notes to Consolidated Financial Statements—(Continued)
December 31, 2009, 2008 and 2007
Scheduled maturities of FHLB advances at December 31, 2009 are as follows (in thousands):
| 2009 | |||
| Due in one year or less |
$ | 194,547 | |
| Due after one year through two years |
198,065 | ||
| Due after two years through three years |
9,100 | ||
| Due after three years through four years |
17,679 | ||
| Due after four years through five years |
34,323 | ||
| Thereafter |
66,233 | ||
| $ | 519,947 | ||
Scheduled maturities of securities sold under repurchase agreements at December 31, 2009 are as follows (in thousands):
| 2009 | |||
| Due in one year or less |
$ | 227,065 | |
| Due after one year through two years |
82,221 | ||
| Due after two years through three years |
45,000 | ||
| Due after three years through four years |
45,000 | ||
| Due after four years through five years |
— | ||
| Thereafter |
80,000 | ||
| $ | 479,286 | ||
The following tables set forth certain information as to borrowed funds for the years ended December 31, 2009 and 2008 (in thousands):
| Maximum balance |
Average balance |
Weighted average interest rate |
||||||
| 2009: |
||||||||
| Securities sold under repurchase agreements |
$ | 618,034 | 515,976 | 3.08 | % | |||
| FHLB line of credit |
75,000 | 11,444 | 0.55 | |||||
| FHLB advances |
532,066 | 529,303 | 3.98 | |||||
| 2008: |
||||||||
| Securities sold under repurchase agreements |
$ | 606,749 | 565,945 | 3.73 | % | |||
| FHLB line of credit |
106,000 | 67,727 | 1.84 | |||||
| FHLB advances |
650,425 | 529,859 | 3.96 | |||||
Securities sold under repurchase agreements include wholesale borrowing arrangements, as well as arrangements with deposit customers of the Bank to sweep funds into short-term borrowings. The Bank uses securities available for sale to pledge as collateral for the repurchase agreements. At December 31, 2009 and 2008, the Bank had unused lines of credit with the FHLB of $200,000,000 and $104,000,000, respectively. These lines of credit are subject to renewal annually.
86
Table of Contents
PROVIDENT FINANCIAL SERVICES, INC. AND SUBSIDIARY
Notes to Consolidated Financial Statements—(Continued)
December 31, 2009, 2008 and 2007
(12) Benefit Plans
Pension and Post-retirement Benefits
The Bank has a noncontributory defined benefit pension plan covering its full-time employees who had attained age 21 with at least one year of service as of April 1, 2003. The pension plan was frozen on April 1, 2003. All participants in the pension plan are 100% vested. The pension plan’s assets are invested in investment funds and group annuity contracts currently managed by the Principal Financial Group and Allmerica Financial. Based on the measurement date of December 31, 2009, management believes that no contributions will be made to the pension plan in 2010.
In addition to pension benefits, certain healthcare and life insurance benefits are currently made available to certain of the Bank’s retired employees. The costs of such benefits are accrued based on actuarial assumptions from the date of hire to the date the employee is fully eligible to receive the benefits. Effective January 1, 2007, eligibility for retiree life insurance benefits was frozen to new entrants and retiree life insurance benefits were eliminated for employees with less than ten years of service as of December 31, 2006. Effective January 1, 2003, eligibility for retiree health care benefits was frozen as to new entrants and benefits were eliminated for employees with less than ten years of service as of December 31, 2002.
The following table sets forth information regarding the pension plan and post-retirement healthcare and life insurance plans (in thousands):
| Pension | Post-retirement | ||||||||||||||||||
| 2009 | 2008 | 2007 | 2009 | 2008 | 2007 | ||||||||||||||
| Change in benefit obligation: |
|||||||||||||||||||
| Benefit obligation at beginning of year |
$ | 18,011 | 15,793 | 16,931 | 17,854 | 17,670 | 26,035 | ||||||||||||
| Plan Amendment |
— | — | (2,920 | ) | |||||||||||||||
| Service cost |
— | — | — | 150 | 181 | 228 | |||||||||||||
| Interest cost |
1,084 | 1,030 | 956 | 933 | 1,016 | 995 | |||||||||||||
| Actuarial loss (gain) |
307 | 1,585 | (121 | ) | (1,981 | ) | (416 | ) | (5,493 | ) | |||||||||
| Benefits paid |
(460 | ) | (397 | ) | (1,357 | ) | (453 | ) | (597 | ) | (487 | ) | |||||||
| Change in actuarial assumptions |
— | — | (616 | ) | — | — | (688 | ) | |||||||||||
| Benefit obligation at end of year |
$ | 18,942 | 18,011 | 15,793 | 16,503 | 17,854 | 17,670 | ||||||||||||
| Change in plan assets: |
|||||||||||||||||||
| Fair value of plan assets at beginning of year |
$ | 13,335 | 19,706 | 20,467 | — | — | — | ||||||||||||
| Actual return on plan assets |
2,574 | (5,974 | ) | 596 | — | — | — | ||||||||||||
| Employer contributions |
6,486 | — | — | 453 | 597 | 487 | |||||||||||||
| Benefits paid |
(460 | ) | (397 | ) | (1,357 | ) | (453 | ) | (597 | ) | (487 | ) | |||||||
| Fair value of plan assets at end of year |
$ | 21,935 | 13,335 | 19,706 | — | — | — | ||||||||||||
| Funded status at end of year |
$ | 2,993 | (4,676 | ) | 3,913 | (16,503 | ) | (17,854 | ) | (17,670 | ) | ||||||||
87
Table of Contents
PROVIDENT FINANCIAL SERVICES, INC. AND SUBSIDIARY
Notes to Consolidated Financial Statements—(Continued)
December 31, 2009, 2008 and 2007
The prepaid pension benefits of $3.0 million and the unfunded post-retirement healthcare and life insurance benefits of $16.5 million at December 31, 2009 are included in other assets and other liabilities, respectively, in the consolidated statement of financial condition. The components of accumulated other comprehensive (gain) loss related to the pension plan and other post-retirement benefits, on a pre-tax basis, at December 31, 2009 and 2008 are summarized in the following table (in thousands):
| Pension | Post-retirement | ||||||||||
| 2009 | 2008 | 2009 | 2008 | ||||||||
| Unrecognized transition obligation |
$ | — | — | — | — | ||||||
| Unrecognized prior service cost |
— | — | (21 | ) | (24 | ) | |||||
| Unrecognized net actuarial gain |
6,460 | 8,396 | (8,496 | ) | (7,328 | ) | |||||
| Total accumulated other comprehensive loss (gain) |
$ | 6,460 | 8,396 | (8,517 | ) | (7,352 | ) | ||||
Net periodic benefit cost (increase) for the years ending December 31, 2009, 2008 and 2007, included the following components (in thousands):
| Pension | Post-retirement | ||||||||||||||||||
| 2009 | 2008 | 2007 | 2009 | 2008 | 2007 | ||||||||||||||
| Service cost |
$ | — | — | — | 150 | 181 | 228 | ||||||||||||
| Interest cost |
1,084 | 1,030 | 956 | 933 | 1,016 | 995 | |||||||||||||
| Expected return on plan assets |
(2,574 | ) | 5,974 | (596 | ) | — | — | — | |||||||||||
| Amortization of: |
|||||||||||||||||||
| Net gain (loss) |
2,243 | (7,532 | ) | (1,027 | ) | (814 | ) | (671 | ) | (584 | ) | ||||||||
| Unrecognized prior service cost |
— | — | — | (4 | ) | (4 | ) | (4 | ) | ||||||||||
| Unrecognized remaining assets |
— | — | — | — | — | 181 | |||||||||||||
| Net periodic benefit cost (increase) |
$ | 753 | (528 | ) | (667 | ) | 265 | 522 | 816 | ||||||||||
The weighted average actuarial assumptions used in the plan determinations at December 31, 2009, 2008 and 2007 were as follows:
| Pension | Post-retirement | |||||||||||||||||
| 2009 | 2008 | 2007 | 2009 | 2008 | 2007 | |||||||||||||
| Discount rate |
6.00 | % | 6.00 | % | 6.00 | % | 6.00 | % | 6.00 | % | 6.00 | % | ||||||
| Rate of compensation increase |
— | — | — | — | — | 5.50 | ||||||||||||
| Expected return on plan assets |
8.00 | 8.00 | 8.00 | — | — | — | ||||||||||||
| Medical and life insurance benefits cost rate of increase |
— | — | — | 8.00 | 8.50 | 9.00 | ||||||||||||
The Company provides its actuary with certain rate assumptions used in measuring the benefit obligation. The most significant of these is the discount rate used to calculate the period-end present value of the benefit obligations, and the expense to be included in the following year’s financial statements. A lower discount rate will result in a higher benefit obligation and expense, while a higher discount rate will result in a lower benefit obligation and expense. The discount rate assumption was determined based on a cash flow-yield curve model specific to the Company’s pension and post-retirement plans. We compare this rate to certain market indices, such as long-term treasury bonds, or the Citigroup pension liability indices, for reasonableness. A discount rate of 6.00% was selected for the December 31, 2009 measurement date and the 2009 expense calculation.
88
Table of Contents
PROVIDENT FINANCIAL SERVICES, INC. AND SUBSIDIARY
Notes to Consolidated Financial Statements—(Continued)
December 31, 2009, 2008 and 2007
Assumed health care cost trend rates have a significant effect on the amounts reported for health care plans. A 1% change in the assumed health care cost trend rate would have had the following effects on post-retirement benefits at December 31, 2009 (in thousands):
| 1% increase | 1% decrease | |||||
| Effect on total service cost and interest cost |
$ | 180 | (140 | ) | ||
| Effect on post-retirement benefits obligation |
2,290 | (1,860 | ) | |||
Estimated future benefit payments, which reflect expected future service, as appropriate for the next five years are as follows (in thousands):
| Pension | Post-retirement | |||||
| 2010 |
$ | 524,000 | $ | 700,000 | ||
| 2011 |
555,000 | 726,000 | ||||
| 2012 |
599,000 | 761,000 | ||||
| 2013 |
649,000 | 791,000 | ||||
| 2014 |
704,000 | 814,000 | ||||
The weighted-average asset allocation of pension plan assets at December 31, 2009 and 2008 were as follows:
| Asset Category |
2009 | 2008 | ||||
| Domestic equities |
33 | % | 45 | % | ||
| Foreign equities |
10 | 13 | ||||
| Fixed income |
24 | 42 | ||||
| Real estate |
4 | 0 | ||||
| Cash |
29 | 0 | ||||
| Total |
100 | % | 100 | % | ||
The large cash position at December 31, 2009 was a result of a $6.5 million contribution made on December 11, 2009 that was temporarily pending rebalancing to other asset classes at December 31, 2009. The Company’s expected return on pension plan assets assumption is based on historical investment return experience and evaluation of input from the trustee managing the pension plan’s assets. The expected return on pension plan assets is also impacted by the target allocation of assets, which is based on the Company’s goal of earning the highest rate of return while maintaining risk at acceptable levels.
Management strives to have pension plan assets sufficiently diversified so that adverse or unexpected results from one security class will not have a significant detrimental impact on the entire portfolio. The target allocation of assets and acceptable ranges around the targets are as follows:
| Asset Category |
Target | Allowable Range | ||||
| Domestic equities |
60 | % | 50-70 | % | ||
| Foreign equities |
10 | 5-17 | ||||
| Fixed income |
25 | 10-30 | ||||
| International bonds |
0 | 0-5 | ||||
| Real estate |
5 | 0-10 | ||||
| Cash |
0 | 0-35 | ||||
| Total |
100 | % | ||||
89
Table of Contents
PROVIDENT FINANCIAL SERVICES, INC. AND SUBSIDIARY
Notes to Consolidated Financial Statements—(Continued)
December 31, 2009, 2008 and 2007
The Company anticipates that the long-term asset allocation on average will approximate the targeted allocation. Actual asset allocations are the result of investment decisions by a third party investment manager.
401(k) Plan
The Bank has a 401(k) plan covering substantially all employees of the Bank. For 2009, 2008 and 2007, the Bank matched 25% of the first 6% contributed by the participants. The contribution percentage is determined by the Board of Directors in its sole discretion. The Bank’s aggregate contributions to the 401(k) Plan for 2009, 2008 and 2007 were $501,000, $478,000 and $491,000, respectively.
Supplemental Executive Retirement Plan
The Bank maintains a non-qualified supplemental retirement plan for certain senior officers of the Bank. This plan was frozen as of April 1, 2003. The Supplemental Executive Retirement Plan, which is unfunded, provides benefits in excess of the benefits permitted to be paid by the pension plan under provisions of the tax law. Amounts expensed under this supplemental retirement plan amounted to $184,000, $152,000 and $75,000 for the years 2009, 2008 and 2007, respectively. At December 31, 2009 and 2008, $2,158,000 and $1,985,000, respectively, were recorded in other liabilities on the consolidated statements of condition for this supplemental retirement plan. A charge of $20,000, a charge of $106,000, and an increase of $132,000, net of tax, were recorded in other comprehensive income for 2009, 2008 and 2007, respectively, in connection with this supplemental retirement plan.
Retirement Plan for the Board of Directors of The Provident Bank
The Bank maintains a Retirement Plan for the Board of Directors of the Bank, a non-qualified plan that provides cash payments for up to ten years to eligible retired board members based on age and length of service requirements. The maximum payment under this plan to a board member, who terminates service on or after the age of 72 with at least ten years of service on the board, is forty quarterly payments of $1,250. The Bank may suspend payments under this plan if it does not meet Federal Deposit Insurance Corporation or New Jersey Department of Banking and Insurance minimum capital requirements. The Bank may terminate this plan at any time although such termination may not reduce or eliminate any benefit previously accrued to a board member without his or her consent. The plan further provides that, in the event of a change in control (as defined in the plan), the undistributed balance of a director’s accrued benefit will be distributed to him or her within 60 days of the change in control. The Bank paid $15,000 to former board members under this plan for each of the years ended December 31, 2009, 2008 and 2007. At December 31, 2009 and 2008, $229,000 and $237,000, respectively, were recorded in other liabilities on the consolidated statements of financial condition for this retirement plan. An increase of $29,000, a charge of $4,000, and an increase of $451, net of tax, were recorded in other comprehensive income for 2009, 2008 and 2007, respectively, in connection with this plan.
The plan was amended in December 2005 to terminate benefits under this plan for any directors who had less than ten years of service on the board of directors of the Bank as of December 31, 2006.
Employee Stock Ownership Plan
The ESOP is a tax-qualified plan designed to invest primarily in the Company’s common stock that provides employees with the opportunity to receive a funded retirement benefit from the Bank, based primarily on the value of the Company’s common stock. The ESOP purchased 4,769,464 shares of the Company’s common stock at an average price of $17.09 per share with the proceeds of a loan from the Company to the
90
Table of Contents
PROVIDENT FINANCIAL SERVICES, INC. AND SUBSIDIARY
Notes to Consolidated Financial Statements—(Continued)
December 31, 2009, 2008 and 2007
ESOP. The outstanding loan principal at December 31, 2009, was $67.8 million. Shares of the Company’s common stock pledged as collateral for the loan are released from the pledge for allocation to participants as loan payments are made.
For the ESOP year ending December 31, 2009, 175,474 shares are committed to be released and will be allocated to participants, compared to 172,591 shares released in the ESOP year ending December 31, 2008. Unallocated ESOP shares held in suspense totaled 3,607,810 at December 31, 2009, and had a fair market value of $38.4 million. ESOP compensation expense for the years ended December 31, 2009, 2008 and 2007 was $1,494,000, $2,162,000 and $2,495,000, respectively.
The Supplemental Executive Savings Plan
The Supplemental Executive Savings Plan is a non-qualified plan that provides supplemental benefits to certain executives who are prevented from receiving the full benefits contemplated by the 401(k) Plan’s and the ESOP’s benefit formulas under tax law limits for tax-qualified plans. The supplemental payments for the 401(k) Plan portion of the Supplemental Executive Savings Plan consist of payments representing employee and employer contributions that cannot be allocated to participants under the 401(k) Plan due to the limitations imposed on tax-qualified plans. The supplemental payments for the ESOP portion of the Supplemental Executive Savings Plan consist of payments representing shares that cannot be allocated to participants under the ESOP due to legal limitations imposed on tax-qualified plans. The Supplemental Executive Savings Plan was frozen effective December 31, 2003.
Non-Qualified Supplemental Employee Stock Ownership Plan
Effective January 1, 2004, the Bank established a new deferred compensation plan for executive management and key employees of the Bank, known as The Provident Bank Non-Qualified Supplemental Employee Stock Ownership Plan (the “Supplemental ESOP”). The Supplemental ESOP is a non-qualified plan that provides additional benefits to certain executives whose benefits under the ESOP are limited by tax law limitations applicable to tax-qualified plans. The Supplemental ESOP requires a contribution by the Bank for
each participant who also participates in the ESOP equal to the amount that would have been contributed under the terms of the ESOP but for the tax law limitations, less the amount actually contributed under the ESOP. Expense or benefit is recorded in order to adjust the participants’ benefit accounts based on fluctuations in the Company’s stock price. Supplemental ESOP compensation (benefit) expense for the years ended December 31, 2009, 2008, and 2007 was ($46,000), $33,000 and ($12,000), respectively.
2008 Long-Term Equity Incentive Plan
Upon stockholders’ approval of the 2008 Long-Term Equity Incentive Plan on April 23, 2008, shares available for stock awards and stock options under the 2003 Stock Award Plan and the 2003 Stock Option Plan were reserved for issuance under the new 2008 Long-Term Equity Incentive Plan. No additional grants of stock awards and stock options will be made under the 2003 Stock Award Plan and the 2003 Stock Option Plan. The new plan authorized the issuance of up to 2,481,382 shares of Company common stock with no more than 1,850,000 shares permitted to be issued as stock awards. Shares previously awarded under the 2003 plans that are subsequently forfeited or expire may also be issued under the new plan.
91
Table of Contents
PROVIDENT FINANCIAL SERVICES, INC. AND SUBSIDIARY
Notes to Consolidated Financial Statements—(Continued)
December 31, 2009, 2008 and 2007
Stock Awards
As a general rule, restricted stock grants are held in escrow for the benefit of the award recipient until vested. Awards outstanding generally vest in three or five annual installments, commencing one year from the date of the award. Additionally, certain awards are three-year performance vesting awards, which may or may not vest depending upon the attainment of certain corporate financial targets. Expense attributable to stock awards amounted to $1,888,000, $2,701,000 and $4,594,000 for the years ended December 31, 2009, 2008 and 2007, respectively.
A summary status of the granted but unvested stock awards as of December 31, and changes during the year, is presented below:
| Restricted Stock Awards | |||||||||
| 2009 | 2008 | 2007 | |||||||
| Outstanding at beginning of year |
146,696 | 310,073 | 530,386 | ||||||
| Granted |
483,518 | 61,590 | 74,251 | ||||||
| Forfeited |
(34,638 | ) | (1,963 | ) | (31,560 | ) | |||
| Vested |
(45,883 | ) | (223,004 | ) | (263,004 | ) | |||
| Outstanding at the end of year |
549,693 | 146,696 | 310,073 | ||||||
Stock Options
Each stock option granted entitles the holder to purchase one share of the Company’s common stock at an exercise price not less than the fair market value of a share of the Company’s common stock at the date of grant. Options generally vest over a five-year period from the date of grant and expire no later than 10 years following the grant date. Additionally, certain options are three-year performance vesting options, which may or may not vest depending upon the attainment of certain corporate financial targets. Directors and employees have been granted 4,206,661 stock options as of December 31, 2009.
A summary of the status of the granted but unexercised stock options as of December 31, and changes during the year is presented below:
| 2009 | 2008 | 2007 | ||||||||||||||||
| Number of stock options |
Weighted average exercise price |
Number of stock options |
Weighted average exercise price |
Number of stock options |
Weighted average exercise price | |||||||||||||
| Outstanding at beginning of year |
3,962,349 | $ | 18.23 | 4,400,170 | $ | 18.50 | 4,376,845 | $ | 18.55 | |||||||||
| Granted |
232,872 | 10.39 | 172,090 | 12.54 | 312,617 | 17.78 | ||||||||||||
| Forfeited |
(17,280 | ) | 12.03 | (16,113 | ) | 17.30 | (128,342 | ) | 18.50 | |||||||||
| Expired |
(76,442 | ) | 18.51 | (593,798 | ) | 18.57 | (160,950 | ) | 18.57 | |||||||||
| Outstanding at the end of year |
4,101,499 | $ | 17.81 | 3,962,349 | $ | 18.23 | 4,400,170 | $ | 18.50 | |||||||||
The total fair value of shares vesting during 2009, 2008 and 2007 was $630,000, $2,913,000 and $3,343,000, respectively.
Compensation expense of approximately $735,000, $595,000, and $229,000, is projected for 2010, 2011 and 2012, respectively, on stock options outstanding at December 31, 2009.
92
Table of Contents
PROVIDENT FINANCIAL SERVICES, INC. AND SUBSIDIARY
Notes to Consolidated Financial Statements—(Continued)
December 31, 2009, 2008 and 2007
The following table summarizes information about stock options outstanding at December 31, 2009:
| Options Outstanding | Options Exercisable | |||||||||||
| Range of exercise prices |
Number of options outstanding |
Average remaining contractual life |
Weighted average exercise price |
Number of options exercisable |
Weighted average exercise price | |||||||
| $ 17.43-19.22 |
3,704,673 | 4.0 years | $ | 18.50 | 3,457,270 | $ | 18.53 | |||||
| $ 10.27-15.14 |
396,826 | 8.6 years | $ | 11.40 | 36,982 | $ | 12.82 | |||||
The stock options outstanding and stock options exercisable at December 31, 2009 have an aggregate intrinsic value of $58,000 and $0, respectively.
The expense related to stock options is based on the fair value of the options at the date of the grant and is recognized ratably over the vesting period of the options.
Compensation expense related to the Company’s stock option plan totaled $797,000, $1,929,000 and $3,245,000 for 2009, 2008 and 2007, respectively.
The estimated fair values were determined on the dates of grant using the Black-Scholes Option pricing model. The fair value of the Company’ stock option awards is expensed on a straight-line basis over the vesting period of the stock option. The risk-free rate is based on the implied yield on a U.S. Treasury bond with a term approximating the expected term of the option. The expected volatility computation is based on historical volatility over a period approximating the expected term of the option. The dividend yield is based on the annual dividend payment per share, divided by the grant date stock price. The expected option term is a function of the option life and the vesting period.
The fair value of the option grants was estimated on the date of grant using the Black-Scholes option-pricing model with the following weighted average assumptions:
| For the year ended December 31, | |||||||||
| 2009 | 2008 | 2007 | |||||||
| Expected dividend yield |
4.23 | % | 3.51 | % | 2.26 | % | |||
| Expected volatility |
81.45 | % | 31.94 | % | 17.74 | % | |||
| Risk-free interest rate |
1.92 | % | 2.91 | % | 4.78 | % | |||
| Expected option life |
8 years | 8 years | 8 years | ||||||
The weighted average fair value of options granted during 2009, 2008 and 2007 was $5.39, $3.16, and $3.81 per option, respectively.
93
Table of Contents
PROVIDENT FINANCIAL SERVICES, INC. AND SUBSIDIARY
Notes to Consolidated Financial Statements—(Continued)
December 31, 2009, 2008 and 2007
(13) Income Taxes
The current and deferred amounts of income tax expense (benefit) for the years ended December 31, 2009, 2008 and 2007 are as follows (in thousands):
| Years ended December 31, | ||||||||||
| 2009 | 2008 | 2007 | ||||||||
| Current: |
||||||||||
| Federal |
$ | 12,291 | 19,583 | 14,080 | ||||||
| State |
93 | 121 | 49 | |||||||
| Total current |
12,384 | 19,704 | 14,129 | |||||||
| Deferred: |
||||||||||
| Federal |
(3,997 | ) | (3,707 | ) | (472 | ) | ||||
| State |
(1,378 | ) | (1,060 | ) | (165 | ) | ||||
| Total deferred |
(5,375 | ) | (4,767 | ) | (637 | ) | ||||
| $ | 7,007 | 14,937 | 13,492 | |||||||
The Bank recorded, in accumulated other comprehensive income, deferred tax expense of $4,415,000, $432,000 and $4,494,000 during 2009, 2008 and 2007, respectively, to reflect the tax effect of the unrealized gain on securities available for sale. The Bank recorded, in accumulated other comprehensive income, a deferred tax expense (benefit) of $489,000, ($3,214,000) and $3,513,000 in 2009, 2008 and 2007, respectively, related to the amortization of post-retirement obligations.
A reconciliation between the amount of reported total income tax expense and the amount computed by multiplying the applicable statutory income tax rate is as follows (in thousands):
| Years ended December 31, | ||||||||||
| 2009 | 2008 | 2007 | ||||||||
| Tax expense at statutory rate of 35% |
$ | (40,186 | ) | 19,803 | 17,805 | |||||
| Increase (decrease) in taxes resulting from: |
||||||||||
| State tax, net of federal income tax benefit |
(836 | ) | (611 | ) | (76 | ) | ||||
| Goodwill impairment |
53,376 | — | — | |||||||
| Tax-exempt interest income |
(3,726 | ) | (3,556 | ) | (3,345 | ) | ||||
| Change in valuation reserve |
281 | (339 | ) | 339 | ||||||
| Bank-owned life insurance |
(1,887 | ) | (1,849 | ) | (1,891 | ) | ||||
| Other, net |
(15 | ) | 1,489 | 660 | ||||||
| $ | 7,007 | 14,937 | 13,492 | |||||||
94
Table of Contents
PROVIDENT FINANCIAL SERVICES, INC. AND SUBSIDIARY
Notes to Consolidated Financial Statements—(Continued)
December 31, 2009, 2008 and 2007
The net deferred tax asset is included in other assets in the consolidated statements of financial condition. The tax effects of temporary differences that give rise to significant portions of the deferred tax assets and deferred tax liabilities at December 31, 2009 and 2008 are as follows (in thousands):
| 2009 | 2008 | |||||
| Deferred tax assets: |
||||||
| Allowance for loan losses |
$ | 24,562 | 19,227 | |||
| Post-retirement benefit |
10,236 | 10,302 | ||||
| Deferred compensation |
2,990 | 3,122 | ||||
| Intangibles |
523 | 1,083 | ||||
| Depreciation |
2,307 | 1,744 | ||||
| SERP |
939 | 907 | ||||
| ESOP |
2,496 | 2,187 | ||||
| Stock compensation |
5,771 | 5,371 | ||||
| Non-accrual interest |
2,516 | 404 | ||||
| State AMA |
848 | 849 | ||||
| State NOL |
820 | — | ||||
| Other |
929 | 1,271 | ||||
| Total gross deferred tax assets |
54,937 | 46,467 | ||||
| Valuation Reserve |
(1,098 | ) | — | |||
| Deferred tax liabilities: |
||||||
| Pension expense |
3,861 | 1,520 | ||||
| Deferred loan costs |
2,996 | 2,664 | ||||
| Investment securities, principally due to accretion of discounts |
283 | 247 | ||||
| Purchase accounting adjustments |
1,787 | 2,814 | ||||
| Originated mortgage servicing rights |
671 | 356 | ||||
| Unrealized gain on securities |
4,485 | 70 | ||||
| SFAS No. 158 |
854 | 365 | ||||
| Total gross deferred tax liabilities |
14,937 | 8,036 | ||||
| Net deferred tax asset |
$ | 38,902 | 38,431 | |||
Equity at December 31, 2009 includes approximately $51,800,000 for which no provision for income tax has been made. This amount represents an allocation of income to bad debt deductions for tax purposes only. Events that would result in taxation of these reserves include the failure to qualify as a bank for tax purposes, distributions in complete or partial liquidation, stock redemptions and excess distributions to stockholders. At December 31, 2009 the Company had an unrecognized tax liability of $21,160,000 with respect to this reserve.
In 2009, the company recorded a valuation reserve of $1,098,000. This valuation reserve primarily relates to state net operating losses of approximately $14,000,000 and unused capital loss carryforwards of approximately $800,000. The state net operating losses will expire in 2029.
Management has determined that it is more likely than not that it will realize the net deferred tax asset based upon the nature and timing of the items listed above. In order to fully realize the net deferred tax asset, the Company will need to generate future taxable income. Management has projected that the Company will generate sufficient taxable income to utilize the net deferred tax asset; however, there can be no assurance that such levels of taxable income will be generated.
95
Table of Contents
PROVIDENT FINANCIAL SERVICES, INC. AND SUBSIDIARY
Notes to Consolidated Financial Statements—(Continued)
December 31, 2009, 2008 and 2007
The Company did not have any liabilities for uncertain tax positions or any known unrecognized tax benefits at December 31, 2009 and 2008.
The Company and its subsidiaries file a consolidated U.S. Federal income tax return and each entity files separate State of New Jersey income tax returns. The Company and its subsidiaries are no longer subject to income tax examinations by taxing authorities for years prior to 2006.
(14) Lease Commitments
The approximate future minimum rental commitments, exclusive of taxes and other related charges, for all significant non-cancellable operating leases at December 31, 2009 are summarized as follows (in thousands):
| Year ending December 31: |
|||
| 2010 |
$ | 3,247 | |
| 2011 |
2,954 | ||
| 2012 |
2,285 | ||
| 2013 |
1,564 | ||
| 2014 |
1,059 | ||
| Thereafter |
4,004 | ||
| $ | 15,113 | ||
Rental expense was $4,411,000, $4,263,000 and $4,610,000 for the years ended December 31, 2009, 2008 and 2007, respectively.
(15) Commitments, Contingencies and Concentrations of Credit Risk
In the normal course of business, various commitments and contingent liabilities are outstanding which are not reflected in the accompanying consolidated financial statements. In the opinion of management, the consolidated financial position of the Company will not be materially affected by the outcome of such commitments or contingent liabilities.
A substantial portion of the Bank’s loans are one- to four-family residential first mortgage loans secured by real estate located in New Jersey. Accordingly, the collectibility of a substantial portion of the Bank’s loan portfolio and the recovery of a substantial portion of the carrying amount of other real estate owned are susceptible to changes in local real estate market conditions.
(16) Regulatory Capital Requirements
FDIC regulations require banks to maintain minimum levels of regulatory capital. Under the regulations in effect at December 31, 2009 and 2008, the Bank is required to maintain (i) a minimum leverage ratio of Tier 1 capital to total adjusted assets of 4.00%, and (ii) minimum ratios of Tier 1 and total capital to risk-weighted assets of 4.00% and 8.00%, respectively.
Under its prompt corrective action regulations, the FDIC is required to take certain supervisory actions (and may take additional discretionary actions) with respect to an undercapitalized institution. Such actions could have a direct material effect on an institution’s financial statements. The regulations establish a framework for the classification of savings institutions into five categories: well capitalized, adequately capitalized,
96
Table of Contents
PROVIDENT FINANCIAL SERVICES, INC. AND SUBSIDIARY
Notes to Consolidated Financial Statements—(Continued)
December 31, 2009, 2008 and 2007
undercapitalized, significantly undercapitalized, and critically undercapitalized. Generally, an institution is considered well capitalized if it has a leverage (Tier 1) capital ratio of at least 5.00%; a Tier 1 risk-based capital ratio of at least 6.00%; and a total risk-based capital ratio of at least 10.00%.
The foregoing capital ratios are based in part on specific quantitative measures of assets, liabilities and certain off-balance sheet items as calculated under regulatory accounting practices. Capital amounts and classifications are also subject to qualitative judgments by the FDIC about capital components, risk weightings and other factors.
As of December 31, 2009 and 2008, the Bank exceeded all minimum capital adequacy requirements to which it is subject. Further, the most recent FDIC notification categorized the Bank as a well capitalized institution under the prompt corrective action regulations. There have been no conditions or events since that notification that management believes have changed the Bank’s capital classification.
The Company is regulated as a bank holding company, and as such, is subject to examination, regulation and periodic reporting under the Bank Holding Company Act, as administered by the Federal Reserve Board (“FRB”). The FRB has adopted capital adequacy guidelines for bank holding companies on a consolidated basis substantially similar to those of the FDIC for the Bank. As of December 31, 2009 and 2008, the Company was “well capitalized” under FRB guidelines. Regulations of the FRB provide that a bank holding company must serve as a source of strength to any of its subsidiary banks and must not conduct its activities in an unsafe or unsound manner. Under the prompt corrective action provisions discussed above, a bank holding company parent of an undercapitalized subsidiary bank would be directed to guarantee, within limitations, the capital restoration plan that is required of such an undercapitalized bank. If the undercapitalized bank fails to file an acceptable capital restoration plan or fails to implement an accepted plan, the FRB may prohibit the bank holding company parent of the undercapitalized bank from paying any dividend or making any other form of capital distribution without the prior approval of the FRB.
The following is a summary of the Company’s actual capital amounts and ratios as of December 31, 2009 and 2008, compared to the FRB minimum capital adequacy requirements and the FRB requirements for classification as a well-capitalized institution (dollars in thousands).
| Actual | FRB minimum capital adequacy requirements |
To be well-capitalized under prompt corrective action provisions |
||||||||||||||||
| Amount | Ratio | Amount | Ratio | Amount | Ratio | |||||||||||||
| As of December 31, 2009: |
||||||||||||||||||
| Leverage (Tier 1) |
$ | 520,656 | 7.99 | % | $ | 260,589 | 4.00 | % | $ | 325,736 | 5.00 | % | ||||||
| Risk-based capital: |
||||||||||||||||||
| Tier 1 |
520,656 | 12.17 | 171,121 | 4.00 | 256,682 | 6.00 | ||||||||||||
| Total |
574,221 | 13.42 | 342,242 | 8.00 | 427,803 | 10.00 | ||||||||||||
| Actual | FRB minimum capital adequacy requirements |
To be well-capitalized under prompt corrective action provisions |
||||||||||||||||
| Amount | Ratio | Amount | Ratio | Amount | Ratio | |||||||||||||
| As of December 31, 2008: |
||||||||||||||||||
| Leverage (Tier 1) |
$ | 504,847 | 8.48 | % | $ | 238,219 | 4.00 | % | $ | 297,774 | 5.00 | % | ||||||
| Risk-based capital: |
||||||||||||||||||
| Tier 1 |
504,847 | 12.27 | 164,595 | 4.00 | 246,893 | 6.00 | ||||||||||||
| Total |
552,559 | 13.43 | 329,190 | 8.00 | 411,488 | 10.00 | ||||||||||||
97
Table of Contents
PROVIDENT FINANCIAL SERVICES, INC. AND SUBSIDIARY
Notes to Consolidated Financial Statements—(Continued)
December 31, 2009, 2008 and 2007
The following is a summary of the Bank’s actual capital amounts and ratios as of December 31, 2009 and 2008, compared to the FDIC minimum capital adequacy requirements and the FDIC requirements for classification as a well-capitalized institution (dollars in thousands).
| Actual | FDIC minimum capital adequacy requirements |
To be well-capitalized under prompt corrective action provisions |
||||||||||||||||
| Amount | Ratio | Amount | Ratio | Amount | Ratio | |||||||||||||
| As of December 31, 2009: |
||||||||||||||||||
| Leverage (Tier 1) |
$ | 418,996 | 6.44 | % | $ | 260,279 | 4.00 | % | $ | 325,348 | 5.00 | % | ||||||
| Risk-based capital: |
||||||||||||||||||
| Tier 1 |
418,996 | 9.81 | 170,890 | 4.00 | 256,335 | 6.00 | ||||||||||||
| Total |
472,499 | 11.06 | 341,780 | 8.00 | 427,225 | 10.00 | ||||||||||||
| Actual | FDIC minimum capital adequacy requirements |
To be well-capitalized under prompt corrective action provisions |
||||||||||||||||
| Amount | Ratio | Amount | Ratio | Amount | Ratio | |||||||||||||
| As of December 31, 2008: |
||||||||||||||||||
| Leverage (Tier 1) |
$ | 394,201 | 6.64 | % | $ | 237,639 | 4.00 | % | $ | 297,049 | 5.00 | % | ||||||
| Risk-based capital: |
||||||||||||||||||
| Tier 1 |
394,201 | 9.61 | 164,051 | 4.00 | 246,076 | 6.00 | ||||||||||||
| Total |
441,913 | 10.78 | 328,102 | 8.00 | 410,127 | 10.00 | ||||||||||||
(17) Fair Value of Measurement of Assets and Liabilities
The following tables present the assets and liabilities reported on the consolidated statements of financial condition at their fair value as of December 31, 2009 and 2008, by level within the fair value hierarchy (in thousands).
| Fair Value Measurements at Reporting Date Using: | ||||||||||||
| December 31, 2009 |
Quoted Prices in Active Markets for Identical Assets (Level 1) |
Significant Other Observable Inputs (Level 2) |
Significant Unobservable Inputs (Level 3) | |||||||||
| (Dollars in thousands) | ||||||||||||
| Measured on a recurring basis: |
||||||||||||
| Agency obligations |
$ | 225,851 | $ | 225,851 | $ | — | $ | — | ||||
| Mortgage-backed securities |
1,084,680 | — | 1,084,680 | — | ||||||||
| State and municipal obligations |
12,701 | — | 12,701 | — | ||||||||
| Corporate obligations |
9,931 | — | 9,931 | — | ||||||||
| $ | 1,333,163 | $ | 225,851 | $ | 1,107,312 | — | ||||||
| Measured on a non-recurring basis: |
||||||||||||
| Loans measured for impairment based on the fair value of the underlying collateral |
$ | 28,309 | $ | — | $ | — | $ | 28,309 | ||||
| Foreclosed assets |
6,384 | — | — | 6,384 | ||||||||
| Goodwill |
346,290 | — | — | 346,290 | ||||||||
| $ | 380,983 | $ | — | $ | — | $ | 380,983 | |||||
98
Table of Contents
PROVIDENT FINANCIAL SERVICES, INC. AND SUBSIDIARY
Notes to Consolidated Financial Statements—(Continued)
December 31, 2009, 2008 and 2007
| Fair Value Measurements at Reporting Date Using: | ||||||||||||
| December 31, 2008 |
Quoted Prices in Active Markets for Identical Assets (Level 1) |
Significant Other Observable Inputs (Level 2) |
Significant Unobservable Inputs (Level 3) | |||||||||
| (Dollars in thousands) | ||||||||||||
| Measured on a recurring basis: |
||||||||||||
| U.S. Treasury obligations |
$ | 1,013 | $ | 1,013 | $ | — | $ | — | ||||
| Agency obligations |
94,474 | 94,474 | — | — | ||||||||
| Mortgage-backed securities |
689,461 | — | 689,461 | — | ||||||||
| State and municipal obligations |
18,107 | — | 18,107 | — | ||||||||
| Corporate obligations |
3,345 | — | 3,345 | — | ||||||||
| Equity securities |
13,929 | 13,929 | — | — | ||||||||
| $ | 820,329 | 109,416 | 710,913 | — | ||||||||
| Measured on a non-recurring basis: |
||||||||||||
| Loans measured for impairment based on the fair value of the underlying collateral |
$ | 18,642 | $ | — | $ | — | $ | 18,642 | ||||
The following valuation techniques are based upon the unpaid principal balance only and exclude any accrued interest or dividends at the measurement date. Interest income and expense and dividend income are recorded within the consolidated statements of income depending on the nature of the instrument using the effective interest method based on acquired discount or premium.
The valuation techniques described below were used to measure fair value of financial instruments in the preceding table on a recurring basis during the years ended December 31, 2009 and 2008.
For securities available for sale, fair value was estimated using a market approach. The majority of the Company’s securities are fixed income instruments that are not quoted on an exchange, but are traded in active markets. Prices for these instruments are obtained through third party data service providers or dealer market participants with which the Company has historically transacted both purchases and sales of securities. Prices obtained from these sources include market quotations and matrix pricing. Matrix pricing, a Level 2 input, is a mathematical technique used principally to value certain securities to benchmark or comparable securities. The Company evaluates the quality of Level 2 matrix pricing through comparison to similar assets with greater liquidity and evaluation of projected cash flows. The Company also may hold equity securities and debt instruments issued by the U.S. government and U.S. government-sponsored agencies that are traded in active markets with readily accessible quoted market prices that are considered Level 1 inputs.
The valuation techniques described below were used to measure fair value of financial instruments in the preceding table on a non-recurring basis during the years ended December 31, 2009 and 2008.
For loans measured for impairment based on the fair value of the underlying collateral, fair value was estimated using a market approach. The Company measures the fair value of collateral underlying impaired loans primarily through obtaining independent appraisals that rely upon quoted market prices for similar assets in active markets. These appraisals include adjustments to comparable assets based on the appraisers’ market knowledge and experience, and are considered Level 3 inputs.
99
Table of Contents
PROVIDENT FINANCIAL SERVICES, INC. AND SUBSIDIARY
Notes to Consolidated Financial Statements—(Continued)
December 31, 2009, 2008 and 2007
Assets acquired through foreclosure or deed in lieu of foreclosure included in the preceding table are carried at fair value, less estimated costs to sell. Fair value is generally based on independent appraisals that rely upon quoted market prices for similar assets in active markets. These appraisals include adjustments to comparable assets based on the appraisers’ market knowledge and experience, and are considered Level 3 inputs. When an asset is acquired, the excess of the loan balance over fair value, less estimated costs to sell, is charged to the allowance for loan losses. A reserve for foreclosed assets may be established to provide for possible write-downs and selling costs that occur subsequent to foreclosure. Foreclosed assets are carried net of the related reserve. Operating results from real estate owned, including rental income, operating expenses, and gains and losses realized from the sales of real estate owned, are recorded as incurred.
The fair value of goodwill is determined in the same manner as goodwill recognized in a business combination and uses standard valuation methodologies. Fair value may be determined using market prices, comparison to similar assets, market multiples, discounted cash flow analysis and other factors. Estimated cash flows may extend far into the future and by their nature are difficult to determine over an extended time frame. Factors that may significantly affect the estimates include specific industry or market sector conditions, changes in revenue growth trends, customer behavior, competitive forces, cost structures and changes in discount rates. The Company recognized a goodwill impairment charge of $152.5 million during the year ended December 31, 2009.
There were no changes to the valuation techniques for fair value measurement during the years ended December 31, 2009 and 2008.
(18) Fair Value of Financial Instruments
Fair value estimates, methods and assumptions are set forth below for the Company’s financial instruments.
Cash and Cash Equivalents
For cash and due from banks, federal funds sold and short-term investments, the carrying amount approximates fair value.
Investment Securities and Securities Available for Sale
The fair value of investment securities and securities available for sale is estimated using a market approach. The majority of the Company’s securities are fixed income instruments that are not quoted on an exchange, but are traded in active markets. Prices for these instruments are obtained through third party data service providers or dealer market participants with which the Company has historically transacted both purchases and sales of securities. Prices obtained from these sources include market quotations and matrix pricing. The Company also holds debt instruments issued by the U.S. government and U.S. government-sponsored agencies that are traded in active markets with readily accessible quoted market prices.
FHLB-NY stock
The carrying value of FHLB-NY stock is its cost. The fair value of FHLB-NY stock is based on redemption at par value.
100
Table of Contents
PROVIDENT FINANCIAL SERVICES, INC. AND SUBSIDIARY
Notes to Consolidated Financial Statements—(Continued)
December 31, 2009, 2008 and 2007
Loans
Fair values are estimated for portfolios of loans with similar financial characteristics. Loans are segregated by type such as residential mortgage, construction and consumer. Each loan category is further segmented into fixed and adjustable rate interest terms and into performing and non-performing categories.
The fair value of performing loans is estimated using a combination of techniques, including discounting estimated future cash flows and quoted market prices of similar instruments, where available.
The fair value for significant non-performing loans is based on recent external appraisals of collateral securing such loans, adjusted for the timing of anticipated cash flows.
Deposits
The fair value of deposits with no stated maturity, such as non-interest bearing demand deposits and savings deposits, is equal to the amount payable on demand. The fair value of certificates of deposit is based on the discounted value of contractual cash flows. The discount rate is estimated using the rates currently offered for deposits with similar remaining maturities.
Borrowed Funds
The fair value of borrowed funds is estimated by discounting future cash flows using rates available for debt with similar terms and maturities.
Commitments to Extend Credit and Letters of Credit
The fair value of commitments to extend credit and letters of credit is estimated using the fees currently charged to enter into similar agreements, taking into account the remaining terms of the agreements and the present creditworthiness of the counterparties. For fixed rate loan commitments, fair value also considers the difference between current levels of interest rates and the committed rates. The fair value estimates of commitments to extend credit and standby letters of credit are deemed immaterial.
The estimated fair values of the Company’s financial instruments as of December 31, 2009 and 2008 are presented in the following table (in thousands):
| 2009 | 2008 | ||||||||
| Carrying value |
Fair value | Carrying value |
Fair value | ||||||
| Financial assets: |
|||||||||
| Cash and cash equivalents |
$ | 123,743 | 123,743 | 68,546 | 68,546 | ||||
| Securities available for sale |
1,333,163 | 1,333,163 | 820,329 | 820,329 | |||||
| Investment securities held to maturity |
335,074 | 344,385 | 347,484 | 351,623 | |||||
| FHLB-NY stock |
34,276 | 34,276 | 42,833 | 42,833 | |||||
| Loans |
4,323,450 | 4,424,286 | 4,479,036 | 4,620,925 | |||||
| Financial liabilities: |
|||||||||
| Deposits |
4,899,177 | 4,913,650 | 4,226,336 | 4,233,141 | |||||
| Borrowed funds |
999,233 | 1,020,245 | 1,247,681 | 1,271,763 | |||||
101
Table of Contents
PROVIDENT FINANCIAL SERVICES, INC. AND SUBSIDIARY
Notes to Consolidated Financial Statements—(Continued)
December 31, 2009, 2008 and 2007
Limitations
Fair value estimates are made at a specific point in time, based on relevant market information and information about the financial instrument. These estimates do not reflect any premium or discount that could result from offering for sale at one time the Company’s entire holdings of a particular financial instrument. Because no active market exists for a significant portion of the Company’s financial instruments, fair value estimates are based on judgments regarding future expected loss experience, current economic conditions, risk characteristics of various financial instruments, and other factors. These estimates are subjective in nature and involve uncertainties and matters of significant judgment and, therefore, cannot be determined with precision. Changes in assumptions could significantly affect the estimates.
Fair value estimates are based on existing on- and off-balance sheet financial instruments without attempting to estimate the value of anticipated future business and the value of assets and liabilities that are not considered financial instruments. Significant assets and liabilities that are not considered financial assets or liabilities include deferred tax assets and premises and equipment. In addition, the tax ramifications related to the realization of the unrealized gains and losses can have a significant effect on fair value estimates and have not been considered in the estimates.
(19) Selected Quarterly Financial Data (Unaudited)
The following tables are a summary of certain quarterly financial data for the years ended December 31, 2009 and 2008.
| 2009 Quarter Ended | ||||||||||||||
| March 31 | June 30 | September 30 | December 31 | |||||||||||
| (In thousands, except per share data) | ||||||||||||||
| Interest income |
$ | 73,457 | $ | 72,312 | $ | 73,039 | $ | 73,751 | ||||||
| Interest expense |
29,526 | 29,147 | 27,729 | 25,140 | ||||||||||
| Net interest income |
43,931 | 43,165 | 45,310 | 48,611 | ||||||||||
| Provision for loan losses |
5,800 | 5,800 | 6,500 | 12,150 | ||||||||||
| Net interest income after provision for loan losses |
38,131 | 37,365 | 38,810 | 36,461 | ||||||||||
| Non-interest income |
6,966 | 8,865 | 8,588 | 7,033 | ||||||||||
| Non-interest expense |
185,797 | 38,152 | 35,972 | 37,115 | ||||||||||
| (Loss) income before income tax expense |
(140,700 | ) | 8,078 | 11,426 | 6,379 | |||||||||
| Income tax expense |
2,919 | 1,733 | 2,750 | (395 | ) | |||||||||
| Net (loss) income |
$ | (143,619 | ) | $ | 6,345 | $ | 8,676 | $ | 6,774 | |||||
| Basic earnings per share |
$ | (2.56 | ) | $ | 0.11 | $ | 0.15 | $ | 0.12 | |||||
| Diluted earnings per share |
(2.56 | ) | 0.11 | 0.15 | 0.12 | |||||||||
102
Table of Contents
PROVIDENT FINANCIAL SERVICES, INC. AND SUBSIDIARY
Notes to Consolidated Financial Statements—(Continued)
December 31, 2009, 2008 and 2007
| 2008 Quarter Ended | ||||||||||||
| March 31 | June 30 | September 30 | December 31 | |||||||||
| (In thousands, except per share data) | ||||||||||||
| Interest income |
$ | 76,662 | $ | 75,331 | $ | 76,638 | $ | 75,689 | ||||
| Interest expense |
37,473 | 32,762 | 31,287 | 30,729 | ||||||||
| Net interest income |
39,189 | 42,569 | 45,351 | 44,960 | ||||||||
| Provision for loan losses |
1,300 | 1,500 | 3,800 | 8,500 | ||||||||
| Net interest income after provision for loan losses |
37,889 | 41,069 | 41,551 | 36,460 | ||||||||
| Non-interest income |
8,785 | 6,667 | 7,775 | 6,984 | ||||||||
| Non-interest expense |
31,952 | 33,292 | 31,958 | 33,399 | ||||||||
| Income before income tax expense |
14,722 | 14,444 | 17,368 | 10,045 | ||||||||
| Income tax expense |
4,029 | 4,091 | 4,205 | 2,612 | ||||||||
| Net income |
$ | 10,693 | $ | 10,353 | $ | 13,163 | $ | 7,433 | ||||
| Basic earnings per share |
$ | 0.19 | $ | 0.18 | $ | 0.23 | $ | 0.13 | ||||
| Diluted earnings per share |
0.19 | 0.18 | 0.23 | 0.13 | ||||||||
(20) (Loss) Earnings Per Share
The following is a reconciliation of the outstanding shares used in the basic and diluted (loss) earnings per share calculations.
| For the Year Ended December 31, | ||||||||||
| 2009 | 2008 | 2007 | ||||||||
| (Dollars in thousands, except per share data) | ||||||||||
| Net (loss) income |
$ | (121,824 | ) | $ | 41,642 | $ | 37,380 | |||
| Basic weighted average common shares outstanding |
56,275,694 | 56,031,273 | 59,067,438 | |||||||
| Plus: |
||||||||||
| Dilutive shares |
— | 45 | — | |||||||
| Diluted weighted average common shares outstanding |
56,275,694 | 56,031,318 | 59,067,438 | |||||||
| (Loss) earnings per share: |
||||||||||
| Basic |
$ | (2.16 | ) | $ | 0.74 | $ | 0.63 | |||
| Diluted |
$ | (2.16 | ) | $ | 0.74 | $ | 0.63 | |||
Anti-dilutive stock options and awards totaling 4,267,905 shares at December 31, 2009, were excluded from the earnings per share calculations.
103
Table of Contents
PROVIDENT FINANCIAL SERVICES, INC. AND SUBSIDIARY
Notes to Consolidated Financial Statements—(Continued)
December 31, 2009, 2008 and 2007
(21) Parent-only Financial Information
The condensed financial statements of Provident Financial Services, Inc. (parent company only) are presented below:
PROVIDENT FINANCIAL SERVICES, INC.
Condensed Statements of Financial Condition
(Dollars in Thousands)
| December 31, 2009 | December 31, 2008 | |||||
| ASSETS |
||||||
| Cash and due from banks |
$ | 6,832 | $ | 5,244 | ||
| Short-term investments |
— | — | ||||
| Total cash and cash equivalents |
6,832 | 5,244 | ||||
| Securities available for sale, at fair value |
— | 13,928 | ||||
| Investment in subsidiaries |
782,895 | 907,686 | ||||
| Due from subsidiary—SAP |
21,785 | 22,696 | ||||
| ESOP loan |
67,751 | 69,993 | ||||
| Other assets |
5,292 | 294 | ||||
| Total assets |
$ | 884,555 | $ | 1,019,841 | ||
| LIABILITIES AND STOCKHOLDERS’ EQUITY |
||||||
| Other liabilities |
$ | — | $ | 1,251 | ||
| Total stockholders’ equity |
884,555 | 1,018,590 | ||||
| Total liabilities and stockholders’ equity |
$ | 884,555 | $ | 1,019,841 | ||
104
Table of Contents
PROVIDENT FINANCIAL SERVICES, INC. AND SUBSIDIARY
Notes to Consolidated Financial Statements—(Continued)
December 31, 2009, 2008 and 2007
PROVIDENT FINANCIAL SERVICES, INC.
Condensed Statements of Operations
(Dollars in Thousands)
| For the Year Ended December 31, | ||||||||||||
| 2009 | 2008 | 2007 | ||||||||||
| Dividends from subsidiary | $ | 15,300 | $ | 11,200 | $ | 120,102 | ||||||
| Interest income | 2,800 | 2,884 | 2,962 | |||||||||
| Investment loss | (287 | ) | (544 | ) | (851 | ) | ||||||
| Other income | 27 | 702 | 11 | |||||||||
| Total income |
17,840 | 14,242 | 122,224 | |||||||||
| Non-interest expense |
807 | 1,184 | 793 | |||||||||
| Total expense |
807 | 1,184 | 793 | |||||||||
| Income before income tax expense |
17,033 | 13,058 | 121,431 | |||||||||
| Income tax expense |
61 | 70 | 988 | |||||||||
| Income before undistributed net income of subsidiary |
16,972 | 12,988 | 120,443 | |||||||||
| (Dividends in excess of earnings) equity in undistributed net income) of subsidiary |
(138,796 | ) | 28,654 | (83,063 | ) | |||||||
| Net (loss) income |
$ | (121,824 | ) | $ | 41,642 | $ | 37,380 | |||||
105
Table of Contents
PROVIDENT FINANCIAL SERVICES, INC. AND SUBSIDIARY
Notes to Consolidated Financial Statements—(Continued)
December 31, 2009, 2008 and 2007
PROVIDENT FINANCIAL SERVICES, INC.
Condensed Statements of Cash Flows
(Dollars in Thousands)
| For the Year Ended December 31, | ||||||||||||
| 2009 | 2008 | 2007 | ||||||||||
| Cash flows from operating activities: |
||||||||||||
| Net (loss) income |
$ | (121,824 | ) | $ | 41,642 | $ | 37,380 | |||||
| Adjustments to reconcile net income to net cash provided by operating activities |
||||||||||||
| Dividends in excess of earnings (equity in undistributed net income) of subsidiary |
138,796 | (28,654 | ) | 83,063 | ||||||||
| ESOP allocation |
1,494 | 2,162 | 2,495 | |||||||||
| SAP allocation |
1,888 | 2,701 | 4,594 | |||||||||
| Stock option allocation |
797 | 1,929 | 3,245 | |||||||||
| Loss (gain) on sales of securities available for sale |
845 | (844 | ) | (65 | ) | |||||||
| Securities impairment charge |
1,264 | 978 | 1,003 | |||||||||
| Decrease in Due from Subsidiary—SAP |
911 | 4,442 | 5,204 | |||||||||
| Increase in other assets |
(11,093 | ) | (7,765 | ) | (9,833 | ) | ||||||
| (Decrease) increase in other liabilities |
(1,251 | ) | 178 | 324 | ||||||||
| Net cash provided by operating activities |
11,827 | 16,769 | 127,410 | |||||||||
| Cash flows from investing activities: |
||||||||||||
| Purchases of available for sale securities |
— | (500 | ) | (1,092 | ) | |||||||
| Proceeds from sales of available for sale securities |
12,507 | 7,803 | 2,129 | |||||||||
| Net decrease in ESOP loan |
2,242 | 2,101 | 1,947 | |||||||||
| Cash consideration paid to acquire First Morris net of cash and cash equivalents received |
— | — | (1,383 | ) | ||||||||
| Net cash provided by investing activities |
14,749 | 9,404 | 1,601 | |||||||||
| Cash flows from financing activities: |
||||||||||||
| Purchases of treasury stock |
(119 | ) | (1,447 | ) | (116,820 | ) | ||||||
| Cash dividends paid |
(24,869 | ) | (24,701 | ) | (24,835 | ) | ||||||
| Net cash used in financing activities |
(24,988 | ) | (26,148 | ) | (141,655 | ) | ||||||
| Net increase (decrease) in cash and cash equivalents |
1,588 | 25 | (12,644 | ) | ||||||||
| Cash and cash equivalents at beginning of period |
5,244 | 5,219 | 17,863 | |||||||||
| Cash and cash equivalents at end of period |
$ | 6,832 | $ | 5,244 | $ | 5,219 | ||||||
106
Table of Contents
| Item 9. | Changes in and Disagreements With Accountants on Accounting and Financial Disclosure |
None.
| Item 9A. | Controls and Procedures |
Evaluation of Disclosure Controls and Procedures
Christopher Martin, the Company’s President and Chief Executive Officer, and Thomas M. Lyons, the Company’s Senior Vice President and Chief Financial Officer, conducted an evaluation of the effectiveness of the Company’s disclosure controls and procedures (as defined in Rule 13a-14(c) under the Securities Exchange Act of 1934, as amended) as of December 31, 2009. Based upon their evaluation, they each found that the Company’s disclosure controls and procedures were effective to ensure that information required to be disclosed in the reports that the Company files and submits under the Exchange Act is recorded, processed, summarized and reported as and when required and that such information is accumulated and communicated to the Company’s management as appropriate to allow timely decisions regarding required disclosures. There has been no change in the Company’s internal control over financial reporting during the Company’s fourth fiscal quarter that has materially affected, or is reasonably likely to affect, the Company’s internal control over financial reporting.
Management’s Report on Internal Control Over Financial Reporting
The management of Provident Financial Services, Inc. (the “Company”) is responsible for establishing and maintaining adequate internal control over financial reporting. The Company’s internal control system is a process designed to provide reasonable assurance to the Company’s management and board of directors regarding the preparation and fair presentation of published financial statements.
The Company’s internal control over financial reporting includes policies and procedures that pertain to the maintenance of records that, in reasonable detail, accurately and fairly reflect transactions and dispositions of assets; provide reasonable assurances that transactions are recorded as necessary to permit preparation of financial statements in accordance with U.S. generally accepted accounting principles, and that receipts and expenditures are being made only in accordance with authorizations of management and the directors of the Company; and provide reasonable assurance regarding prevention or timely detection of unauthorized acquisition, use or disposition of the Company’s assets that could have a material effect on its financial statements.
All internal control systems, no matter how well designed, have inherent limitations. Therefore, even those systems determined to be effective can provide only reasonable assurance with respect to financial statement preparation and presentation. Also, projections of any evaluation of effectiveness to future periods are subject to the risk that controls may become inadequate because of changes in conditions, or that the degree of compliance with the policies or procedures may deteriorate.
Management assessed the effectiveness of the Company’s internal control over financial reporting as of December 31, 2009. In making this assessment, we used the criteria set forth by the Committee of Sponsoring Organizations of the Treadway Commission in Internal Control-Integrated Framework. Based on the assessment management believes that, as of December 31, 2009, the Company’s internal control over financial reporting is effective based on those criteria.
The Company’s independent registered public accounting firm that audited the consolidated financial statements has issued an audit report on the effectiveness of the Company’s internal control over financial reporting as of December 31, 2009. This report appears on page 62.
| Item 9B. | Other Information |
None.
107
Table of Contents
| Item 10. | Directors, Executive Officers and Corporate Governance |
Information regarding director nominees, incumbent directors, executive officers, the Audit Committee of the board of directors, Audit Committee financial experts and procedures by which stockholders may recommend director nominees required by this item is set forth under “Proposal I Election of Provident Directors” under the captions “The Board of Directors”, “Executive Officers”, “Audit Committee Matters—Audit Committee”, and “Corporate Governance Matters—Procedures for the Nomination of Directors by Stockholders” in the Proxy Statement filed for the Annual Meeting of Stockholders to be held on April 22, 2010 and is incorporated herein by reference.
Information regarding compliance with Section 16(a) of the Securities Exchange Act of 1934 is set forth under “General Information” under the caption “Section 16(a) Beneficial Ownership Reporting Compliance” in the Proxy Statement filed for the Annual Meeting of Stockholders to be held on April 22, 2010 and is incorporated herein by reference.
Provident has adopted a Code of Business Conduct and Ethics that is applicable to all directors, officers and employees of Provident and The Provident Bank, including the principal executive officer, principal financial officer, principal accounting officer, and all persons performing similar functions. The Code of Business Conduct and Ethics is posted on the “Governance Documents” section of the “Investor Relations” page on The Provident Bank’s website at www.providentnj.com. Amendments to and waivers from the Code of Business Conduct and Ethics will also be disclosed on The Provident Bank’s website.
| Item 11. | Executive Compensation |
The information required by this item is set forth under “Proposal I Election of Provident Directors” under the captions “Compensation Committee Matters”, “Executive Compensation” and “Director Compensation” in the Proxy Statement for the Annual Meeting of Stockholders to be held on April 22, 2010 and is incorporated herein by reference.
| Item 12. | Security Ownership of Certain Beneficial Owners and Management and Related Stockholder Matters |
The information required by this item regarding security ownership of certain beneficial owners and management is set forth under “General Information” under the caption “Security Ownership of Certain Beneficial Owners and Management” in the Proxy Statement filed for the Annual Meeting of Stockholders to be held on April 22, 2010 and is incorporated herein by reference.
Securities Authorized for Issuance Under Equity Compensation Plans
Set forth below is information as of December 31, 2009 regarding equity compensation plans categorized by those plans that have been approved by stockholders and those plans that have not been approved by stockholders.
| Plan |
Number of Securities to be Issued Upon Exercise of Outstanding Options and Rights(1) |
Weighted Average Exercise Price(2) |
Number of Securities Remaining Available For Issuance Under Plan |
|||||
| Equity compensation plans approved by stockholders |
4,101,499 | $ | 17.81 | 2,846,655 | (3) | |||
| Equity compensation plans not approved by stockholders |
— | — | — | |||||
| Total |
4,101,499 | $ | 17.81 | 2,846,655 | ||||
| (1) | Consists of outstanding stock options to purchase 4,101,499 shares of common stock granted under the Company’s stock-based compensation plans. |
108
Table of Contents
| (2) | The weighted average exercise price reflects the exercise price of $18.57 per share for 3,103,350 stock options granted in 2003; an exercise price of $17.43 for 60,000 stock options and $19.22 for 40,000 stock options granted in 2004; an exercise price of $18.03 for 41,000 stock options granted in 2005; an exercise price of $18.55 for 91,850 stock options, $18.48 for 60,000 stock options, $17.86 for 10,000 stock options and $18.87 for 20,000 stock options granted in 2006; an exercise price of $17.94 for 233,473 stock options, $17.45 for 45,000 stock options and $15.14 for 10,000 stock options granted in 2007; an exercise price of $12.54 for 164,110 stock options granted in 2008; and an exercise price of $10.27 for 15,000 stock options and an exercise price of $10.40 for 207,716 stock options granted in 2009 under the Company’s stock-based compensation plans. |
| (3) | Consists of stock options to purchase up to 2,846,655 shares that remained available to grant under the Company’s stock-based compensation plans. |
Upon stockholders’ approval of the 2008 Long-Term Equity Incentive Plan on April 23, 2008, shares available for stock awards and stock options under the 2003 Stock Award Plan and the 2003 Stock Option Plan were reserved for issuance under the new 2008 Long-Term Equity Incentive Plan. No additional grants of stock awards and stock options will be made under the 2003 Stock Award Plan and the 2003 Stock Option Plan. The Company has granted 1,836,843 shares of stock awards and up to 1,401,120 shares remained available to grant as stock awards at December 31, 2009.
| Item 13. | Certain Relationships and Related Transactions, and Director Independence |
The information required by this item is set forth under “Proposal I Election of Provident Directors” under the caption “Corporate Governance Matters—“Director Independence” and “Transactions With Certain Related Persons” in the Proxy Statement filed for the Annual Meeting of Stockholders to be held on April 22, 2010 and is incorporated herein by reference.
| Item 14. | Principal Accountant Fees and Services |
The information required by this item is set forth under “Proposal II Ratification of the Appointment of the Independent Registered Public Accounting Firm” in the Proxy Statement filed for the Annual Meeting of Stockholders to be held on April 22, 2010 and is incorporated herein by reference.
| Item 15. | Exhibits and Financial Statement Schedules |
The exhibits and financial statement schedules filed as a part of this Form 10-K are as follows:
(a)(1) Financial Statements
109
Table of Contents
(a)(2) Financial Statement Schedules
No financial statement schedules are filed because the required information is not applicable or is included in the consolidated financial statements or related notes.
(a)(3) Exhibits
| 3.1 | Certificate of Incorporation of Provident Financial Services, Inc.1 | |
| 3.2 | Second Amended and Restated Bylaws of Provident Financial Services, Inc.5 | |
| 4.1 | Form of Common Stock Certificate of Provident Financial Services, Inc.1 | |
| 10.1 | Employment Agreement by and between Provident Financial Services, Inc and Christopher Martin dated September 23, 2009.9 | |
| 10.2 | Form of Amended and Restated Change in Control Agreement between Provident Financial Services, Inc. and certain executive officers. | |
| 10.3 | Amended and Restated Employee Savings Incentive Plan, as amended.2 | |
| 10.4 | Employee Stock Ownership Plan1 and Amendment No. 1 to the Employee Stock Ownership Plan.2 | |
| 10.5 | Supplemental Executive Retirement Plan of The Provident Bank.7 | |
| 10.6 | Amended and Restated Supplemental Executive Savings Plan.7 | |
| 10.7 | Retirement Plan for the Board of Managers of The Provident Bank.7 | |
| 10.8 | The Provident Bank Amended and Restated Voluntary Bonus Deferral Plan.7 | |
| 10.9 | Provident Financial Services, Inc. Board of Directors Voluntary Fee Deferral Plan.7 | |
| 10.10 | First Savings Bank Directors’ Deferred Fee Plan, as amended.3 | |
| 10.11 | The Provident Bank Amended and Restated Non-Qualified Supplemental Employee Stock Ownership Plan.7 | |
| 10.12 | Provident Financial Services, Inc. 2003 Stock Option Plan.4 | |
| 10.13 | Provident Financial Services, Inc. 2003 Stock Award Plan.4 | |
| 10.14 | Provident Financial Services, Inc. 2008 Long-Term Equity Incentive Plan.6 | |
| 10.15 | Voluntary Separation Agreement and General Release by and between The Provident Bank and Linda A. Niro dated as of July 8, 2009.8 | |
| 10.16 | Consulting Services Agreement by and between The Provident Bank and Paul M. Pantozzi made as of September 23, 2009.9 | |
| 10.17 | Change in Control Agreement by and between Provident Financial Services, Inc. and Christopher Martin dated September 23, 2009.9 | |
| 21 | Subsidiaries of the Registrant. | |
| 23 | Consent of KPMG LLP. | |
| 31.1 | Certification of Chief Executive Officer pursuant to Section 302 of the Sarbanes-Oxley Act of 2002. | |
| 31.2 | Certification of Chief Financial Officer pursuant to Section 302 of the Sarbanes-Oxley Act of 2002. | |
| 32 | Certification of Chief Executive Officer and Chief Financial Officer pursuant to Section 906 of the Sarbanes-Oxley Act of 2002. | |
| 1 | Filed as an exhibit to the Company’s Registration Statement on Form S-1, and any amendments thereto, with the Securities and Exchange Commission (Registration No. 333-98241). |
110
Table of Contents
| 2 | Filed as an exhibit to the Company’s June 30, 2004 Quarterly Report on Form 10-Q filed with the Securities and Exchange Commission (File No. 001-31566). |
| 3 | Filed as an exhibit to the Company’s September 30, 2004 Quarterly Report on Form 10-Q filed with the Securities and Exchange Commission (File No. 001-31566). |
| 4 | Filed as an exhibit to the Company’s Proxy Statement for the 2003 Annual Meeting of Stockholders filed with the Securities and Exchange Commission on June 4, 2003 (File No. 001-31566). |
| 5 | Filed as an exhibit to the Company’s December 31, 2007 Annual Report to Stockholders on Form 10-K filed with the Securities and Exchange Commission on February 29, 2008 (File No. 001-31566). |
| 6 | Filed as an exhibit to the Company’s Proxy Statement for the 2008 Annual Meeting of Stockholders filed with the Securities and Exchange Commission on March 14, 2008 (File No. 001-31566). |
| 7 | Filed as an exhibit to the Company’s December 31, 2008 Annual Report to Stockholders on Form 10-K filed with the Securities and Exchange Commission on March 2, 2009 (File No. 001-31566). |
| 8 | Filed as an exhibit to the Company’s June 30, 2009 Quarterly Report on Form 10-Q filed with the Securities and Exchange Commission on August 10, 2009 (File No. 001-31566). |
| 9 | Filed as an exhibit to the Company’s September 30, 2009 Quarterly Report on Form 10-Q filed with the Securities and Exchange Commission on November 9, 2009 (File No. 001-31566). |
(b) The exhibits listed under (a)(3) above are filed herewith.
111
Table of Contents
Pursuant to the requirements of Section 13 or 15(d) of the Securities Exchange Act of 1934, the registrant has duly caused this report to be signed on its behalf by the undersigned, thereunto duly authorized.
| PROVIDENT FINANCIAL SERVICES, INC. | ||||
| Date: March 1, 2010 | By: | /s/ CHRISTOPHER MARTIN | ||
| Christopher Martin President and Chief Executive Officer | ||||
Pursuant to the requirements of the Securities Exchange Act of 1934, this report has been signed below by the following persons on behalf of the registrant and in the capacities and on the dates indicated.
| By: | /s/ CHRISTOPHER MARTIN | By: | /s/ THOMAS M. LYONS | |||||
| Christopher Martin, President and Chief Executive Officer (Principal Executive Officer) |
Thomas M. Lyons, Senior Vice President and Chief Financial Officer (Principal Financial Officer) | |||||||
| Date: |
March 1, 2010 | Date: | March 1, 2010 | |||||
| By: | /s/ PAUL M. PANTOZZI | By: | /s/ THOMAS W. BERRY | |||||
| Paul M. Pantozzi, Chairman of the Board |
Thomas W. Berry, Director | |||||||
| Date: | March 1, 2010 | Date: | March 1, 2010 | |||||
| By: | /s/ LAURA L. BROOKS | By: | /s/ JOHN G. COLLINS | |||||
| Laura L. Brooks, Director |
John G. Collins, Director | |||||||
| Date: | March 1, 2010 | Date: | March 1, 2010 | |||||
| By: | /s/ GEOFFREY M. CONNOR | By: | /s/ FRANK L. FEKETE | |||||
| Geoffrey M. Connor, Director |
Frank L. Fekete, Director | |||||||
| Date: | March 1, 2010 | Date: | March 1, 2010 | |||||
| By: | /s/ CARLOS HERNANDEZ | By: | /s/ WILLIAM T. JACKSON | |||||
| Carlos Hernandez, Director |
William T. Jackson, Director | |||||||
| Date: | March 1, 2010 | Date: | March 1, 2010 | |||||
| By: | /s/ KATHARINE LAUD | By: | /s/ ARTHUR MCCONNELL | |||||
| Katharine Laud, Director |
Arthur McConnell, Director | |||||||
112
Table of Contents
| Date: | March 1, 2010 | Date: | March 1, 2010 | |||||
| By: | /s/ JOHN P. MULKERIN | By: | /s/ EDWARD O’DONNELL | |||||
| John P. Mulkerin, Director |
Edward O’Donnell, Director | |||||||
| Date: | March 1, 2010 | Date: | March 1, 2010 | |||||
| By: | /s/ JEFFRIES SHEIN | |||||||
| Jeffries Shein, Director |
||||||||
| Date: | March 1, 2010 | |||||||
113
Table of Contents
EXHIBIT INDEX
| 3.1 | Certificate of Incorporation of Provident Financial Services, Inc.1 | |
| 3.2 | Second Amended and Restated Bylaws of Provident Financial Services, Inc.5 | |
| 4.1 | Form of Common Stock Certificate of Provident Financial Services, Inc.1 | |
| 10.1 | Employment Agreement by and between Provident Financial Services, Inc and Christopher Martin dated September 23, 2009.9 | |
| 10.2 | Form of Amended and Restated Change in Control Agreement between Provident Financial Services, Inc. and certain executive officers. | |
| 10.3 | Amended and Restated Employee Savings Incentive Plan, as amended.2 | |
| 10.4 | Employee Stock Ownership Plan1 and Amendment No. 1 to the Employee Stock Ownership Plan.2 | |
| 10.5 | Supplemental Executive Retirement Plan of The Provident Bank.7 | |
| 10.6 | Amended and Restated Supplemental Executive Savings Plan.7 | |
| 10.7 | Retirement Plan for the Board of Managers of The Provident Bank.7 | |
| 10.8 | The Provident Bank Amended and Restated Voluntary Bonus Deferral Plan.7 | |
| 10.9 | Provident Financial Services, Inc. Board of Directors Voluntary Fee Deferral Plan.7 | |
| 10.10 | First Savings Bank Directors’ Deferred Fee Plan, as amended.3 | |
| 10.11 | The Provident Bank Amended and Restated Non-Qualified Supplemental Employee Stock Ownership Plan.7 | |
| 10.12 | Provident Financial Services, Inc. 2003 Stock Option Plan.4 | |
| 10.13 | Provident Financial Services, Inc. 2003 Stock Award Plan.4 | |
| 10.14 | Provident Financial Services, Inc. 2008 Long-Term Equity Incentive Plan.6 | |
| 10.15 | Voluntary Separation Agreement and General Release by and between The Provident Bank and Linda A. Niro dated as of July 8, 2009.8 | |
| 10.16 | Consulting Services Agreement by and between The Provident Bank and Paul M. Pantozzi made as of September 23, 2009.9 | |
| 10.17 | Change in Control Agreement by and between Provident Financial Services, Inc. and Christopher Martin dated September 23, 2009.9 | |
| 21 | Subsidiaries of the Registrant. | |
| 23 | Consent of KPMG LLP. | |
| 31.1 | Certification of Chief Executive Officer pursuant to Section 302 of the Sarbanes-Oxley Act of 2002. | |
| 31.2 | Certification of Chief Financial Officer pursuant to Section 302 of the Sarbanes-Oxley Act of 2002. | |
| 32 | Certification of Chief Executive Officer and Chief Financial Officer pursuant to Section 906 of the Sarbanes-Oxley Act of 2002. | |
| 1 | Filed as an exhibit to the Company’s Registration Statement on Form S-1, and any amendments thereto, with the Securities and Exchange Commission (Registration No. 333-98241). |
| 2 | Filed as an exhibit to the Company’s June 30, 2004 Quarterly Report on Form 10-Q filed with the Securities and Exchange Commission (File No. 001-31566). |
| 3 | Filed as an exhibit to the Company’s September 30, 2004 Quarterly Report on Form 10-Q filed with the Securities and Exchange Commission (File No. 001-31566). |
114
Table of Contents
| 4 | Filed as an exhibit to the Company’s Proxy Statement for the 2003 Annual Meeting of Stockholders filed with the Securities and Exchange Commission on June 4, 2003 (File No. 001-31566). |
| 5 | Filed as an exhibit to the Company’s December 31, 2007 Annual Report to Stockholders on Form 10-K filed with the Securities and Exchange Commission on February 29, 2008 (File No. 001-31566). |
| 6 | Filed as an exhibit to the Company’s Proxy Statement for the 2008 Annual Meeting of Stockholders filed with the Securities and Exchange Commission on March 14, 2008 (File No. 001-31566). |
| 7 | Filed as an exhibit to the Company’s December 31, 2008 Annual Report to Stockholders on Form 10-K filed with the Securities and Exchange Commission on March 2, 2009 (File No. 001-31566). |
| 8 | Filed as an exhibit to the Company’s June 30, 2009 Quarterly Report on Form 10-Q filed with the Securities and Exchange Commission on August 10, 2009 (File No. 001-31566). |
| 9 | Filed as an exhibit to the Company’s September 30, 2009 Quarterly Report on Form 10-Q filed with the Securities and Exchange Commission on November 9, 2009 (File No. 001-31566). |
115