Attached files
| file | filename |
|---|---|
| EX-99.1 - EX-99.1 - DRIL-QUIP INC | d576370dex991.htm |
| 8-K - FORM 8-K - DRIL-QUIP INC | d576370d8k.htm |
1st Quarter 2018 Supplemental Earnings Information Exhibit 99.2
Cautionary Statement Forward-Looking Statements The information furnished in this presentation contains “forward-looking statements” within the meaning of the federal securities laws. Forward-looking statements include goals, projections, estimates, expectations, market outlook, forecasts, plans and objectives, including revenue and other projections, acquisition opportunities, forecasted backlog, forecasted demand, liquidity, cost savings, and share repurchases and are based on assumptions, estimates and risk analysis made by management of Dril-Quip in light of its experience and perception of historical trends, current conditions, expected future developments and other factors. No assurance can be given that actual future results will not differ materially from those contained in the forward-looking statements in this presentation. Although Dril-Quip believes that all such statements contained in this presentation are based on reasonable assumptions, there are numerous variables of an unpredictable nature or outside of Dril-Quip’s control that could affect Dril-Quip’s future results and the value of its shares. Each investor must assess and bear the risk of uncertainty inherent in the forward-looking statements contained in this presentation. Please refer to Dril-Quip’s filings with the SEC for additional discussion of risks and uncertainties that may affect Dril-Quip’s actual future results. Dril-Quip undertakes no obligation to update the forward-looking statements contained herein. Use of Non-GAAP Financial Measures We calculate Adjusted net income, Adjusted diluted EPS, and Adjusted EBITDA to evaluate and compare the results of our operations from period to period by removing the effect of our capital structure from our operating structure. We calculate Free Cash Flow as net cash provided by operating activities less net cash used in the purchase of property, plant, and equipment. These measurements are used in concert with net income and cash flows from operations, respectively, which measure actual cash generated in the period. We believe that these non-GAAP measures are supplemental measurement tools used by analysts and investors to help evaluate overall operating performance, ability to pursue and service possible debt opportunities and make future capital expenditures. These metrics do not represent funds available for our discretionary use and are not intended to represent or to be used as a substitute for net income or cash flows from operations, as measured under U.S. generally accepted accounting principles. The items excluded from Adjusted net income, Adjusted EBITDA and Free Cash Flow, but included in the calculation of reported net income and net cash provided by operating activities, as applicable, are significant components of the consolidated statements of income and must be considered in performing a comprehensive assessment of overall financial performance. Our calculation of Adjusted EBITDA, Adjusted Net Income, Adjusted Diluted EPS and Free Cash Flow may not be consistent with calculations used by other companies. Reconciliations of these non-GAAP measures to the most directly comparable GAAP measure can be found on slides 15-16.
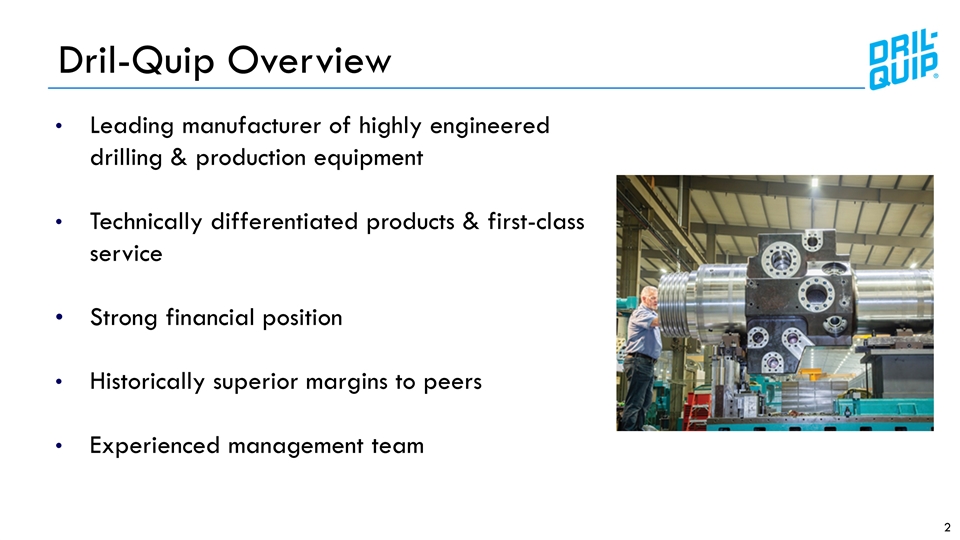
Dril-Quip Overview Leading manufacturer of highly engineered drilling & production equipment Technically differentiated products & first-class service Strong financial position Historically superior margins to peers Experienced management team
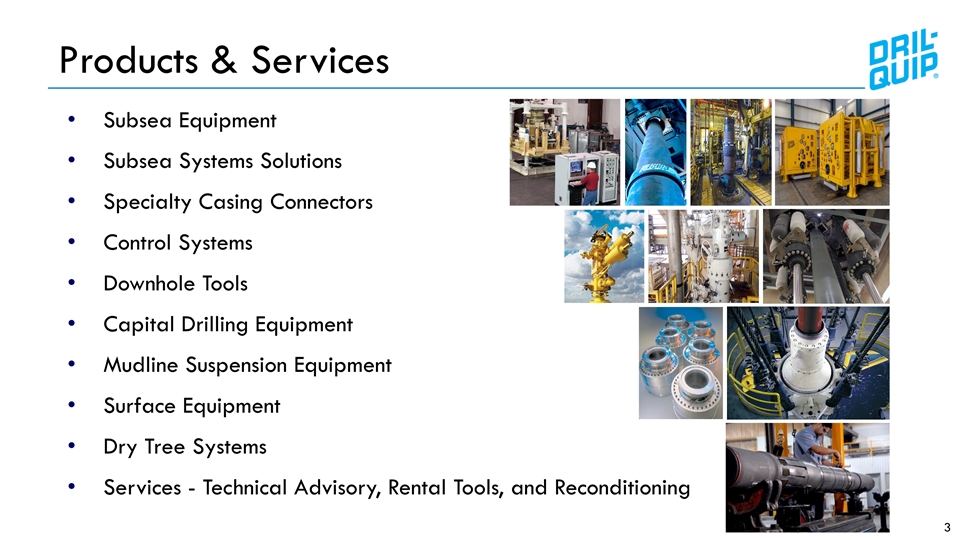
Products & Services Subsea Equipment Subsea Systems Solutions Specialty Casing Connectors Control Systems Downhole Tools Capital Drilling Equipment Mudline Suspension Equipment Surface Equipment Dry Tree Systems Services - Technical Advisory, Rental Tools, and Reconditioning
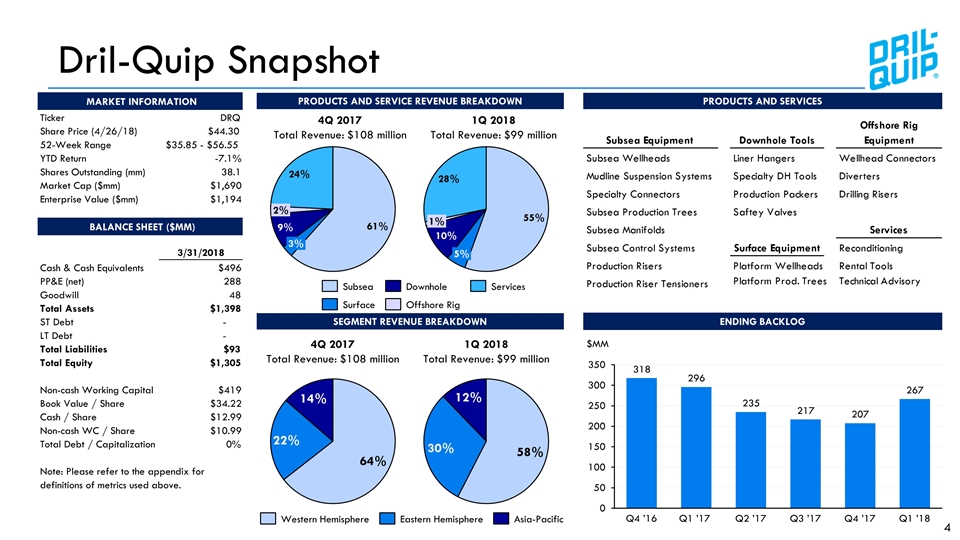
Dril-Quip Snapshot SEGMENT REVENUE BREAKDOWN 4Q 2017 Total Revenue: $108 million 1Q 2018 Total Revenue: $99 million ENDING BACKLOG $MM PRODUCTS AND SERVICE REVENUE BREAKDOWN PRODUCTS AND SERVICES 4Q 2017 Total Revenue: $108 million 1Q 2018 Total Revenue: $99 million Ticker DRQ Share Price (4/26/18) $44.30 52-Week Range $35.85 - $56.55 YTD Return -7.1% Shares Outstanding (mm) 38.1 Market Cap ($mm) $1,690 Enterprise Value ($mm) $1,194 3/31/2018 Cash & Cash Equivalents $496 PP&E (net) 288 Goodwill 48 Total Assets $1,398 ST Debt - LT Debt - Total Liabilities $93 Total Equity $1,305 Non-cash Working Capital $419 Book Value / Share $34.22 Cash / Share $12.99 Non-cash WC / Share $10.99 Total Debt / Capitalization 0% MARKET INFORMATION BALANCE SHEET ($MM) Note: Please refer to the appendix for definitions of metrics used above.
Q1 2018 Highlights Generated $99.2 million of revenue, down 8% sequentially Continued strong gross margin performance Reported a net loss of $7.4 million, or $0.20 loss per diluted share, including charges of $0.04 per share Adjusted loss per diluted share, excluding charges, was $0.16 Generated net cash provided by operating activities of $11.4 million Grew cash on hand to $495.6 million as of Mar. 31, 2018 Maintained clean balance sheet with no debt as of Mar. 31, 2018 Executing Our Strategy While Maintaining Financial Discipline
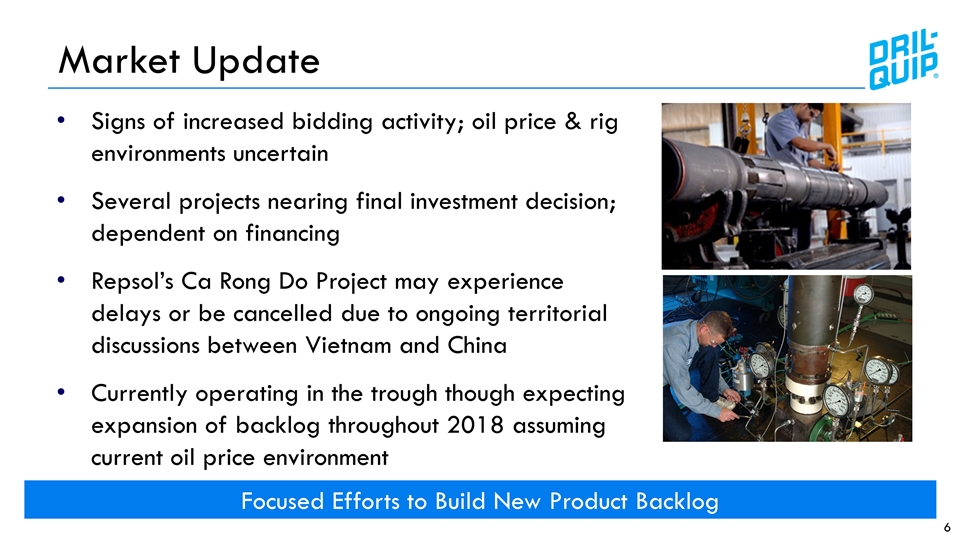
Market Update Signs of increased bidding activity; oil price & rig environments uncertain Several projects nearing final investment decision; dependent on financing Repsol’s Ca Rong Do Project may experience delays or be cancelled due to ongoing territorial discussions between Vietnam and China Currently operating in the trough though expecting expansion of backlog throughout 2018 assuming current oil price environment Focused Efforts to Build New Product Backlog
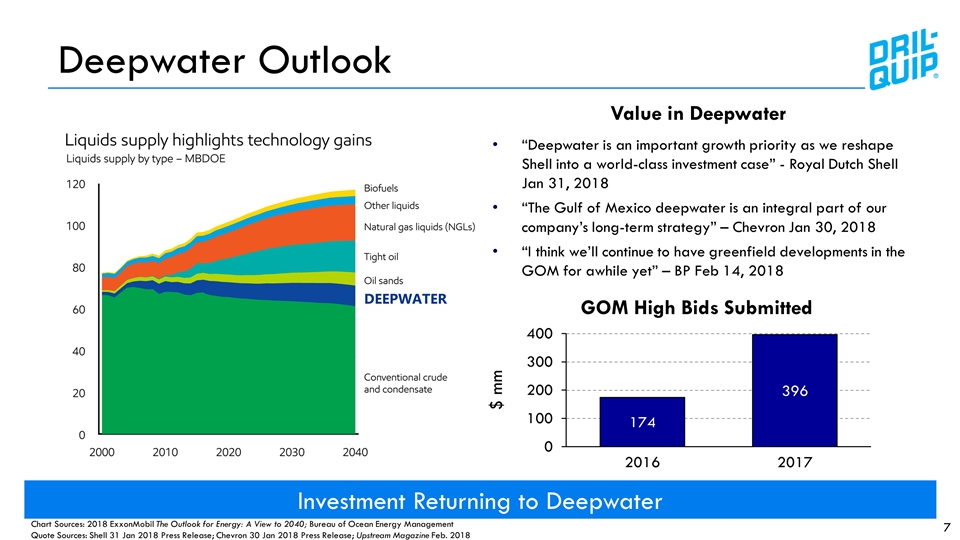
Deepwater Outlook Investment Returning to Deepwater Value in Deepwater “Deepwater is an important growth priority as we reshape Shell into a world-class investment case” - Royal Dutch Shell Jan 31, 2018 “The Gulf of Mexico deepwater is an integral part of our company’s long-term strategy” – Chevron Jan 30, 2018 “I think we’ll continue to have greenfield developments in the GOM for awhile yet” – BP Feb 14, 2018 Chart Sources: 2018 ExxonMobil The Outlook for Energy: A View to 2040; Bureau of Ocean Energy Management Quote Sources: Shell 31 Jan 2018 Press Release; Chevron 30 Jan 2018 Press Release; Upstream Magazine Feb. 2018 DEEPWATER $ mm GOM High Bids Submitted
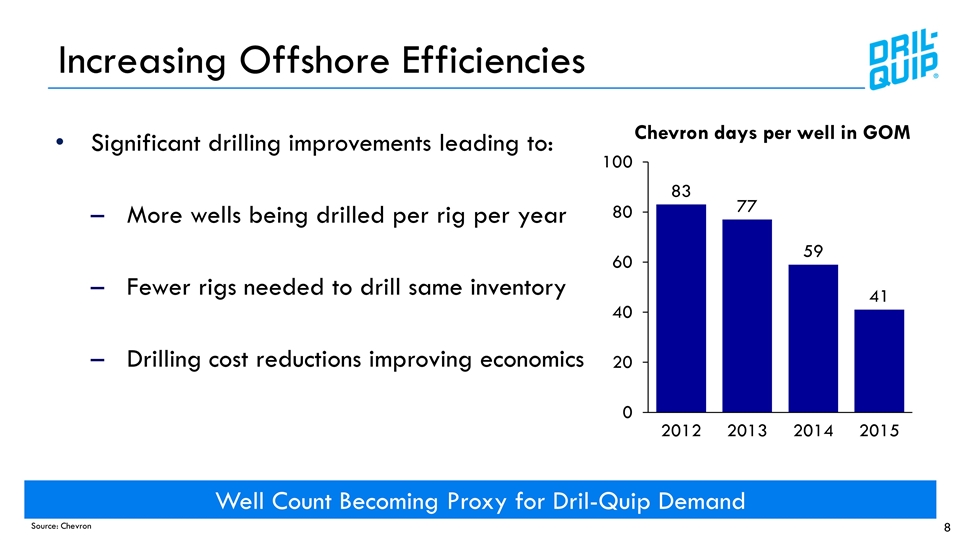
Increasing Offshore Efficiencies Significant drilling improvements leading to: More wells being drilled per rig per year Fewer rigs needed to drill same inventory Drilling cost reductions improving economics Source: Chevron Well Count Becoming Proxy for Dril-Quip Demand Chevron days per well in GOM
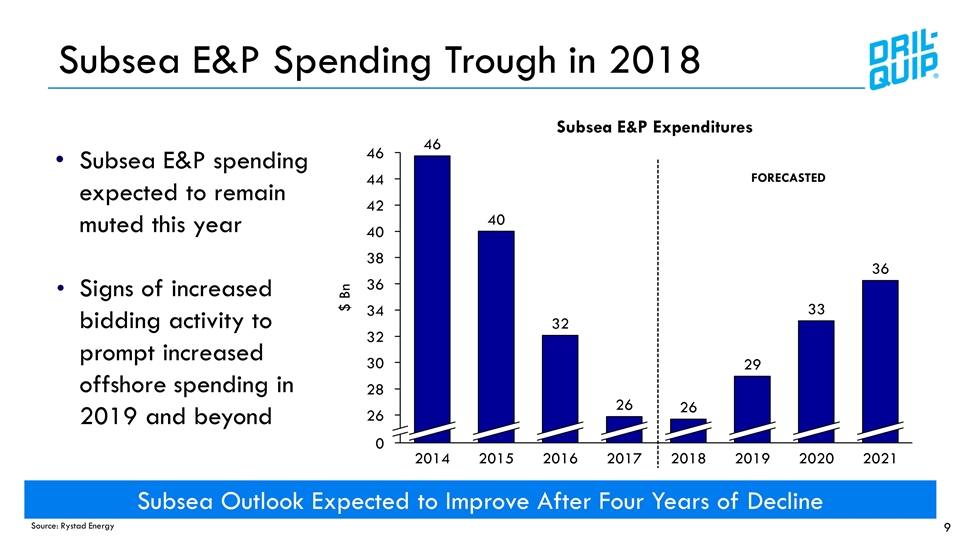
Subsea E&P Spending Trough in 2018 Subsea Outlook Expected to Improve After Four Years of Decline Subsea E&P Expenditures Source: Rystad Energy FORECASTED $ Bn Subsea E&P spending expected to remain muted this year Signs of increased bidding activity to prompt increased offshore spending in 2019 and beyond
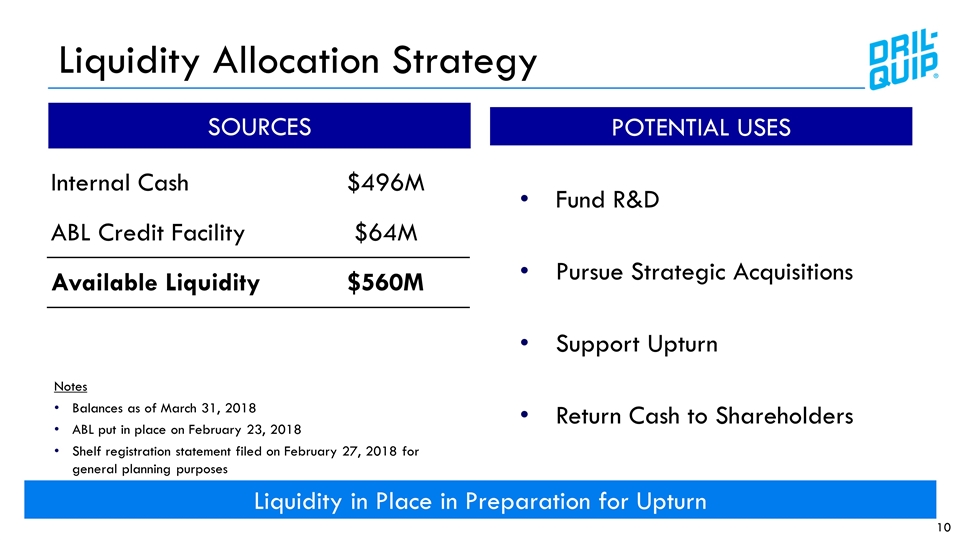
Liquidity Allocation Strategy Liquidity in Place in Preparation for Upturn Internal Cash $496M ABL Credit Facility $64M Available Liquidity $560M Notes Balances as of March 31, 2018 ABL put in place on February 23, 2018 Shelf registration statement filed on February 27, 2018 for general planning purposes SOURCES POTENTIAL USES Fund R&D Pursue Strategic Acquisitions Support Upturn Return Cash to Shareholders
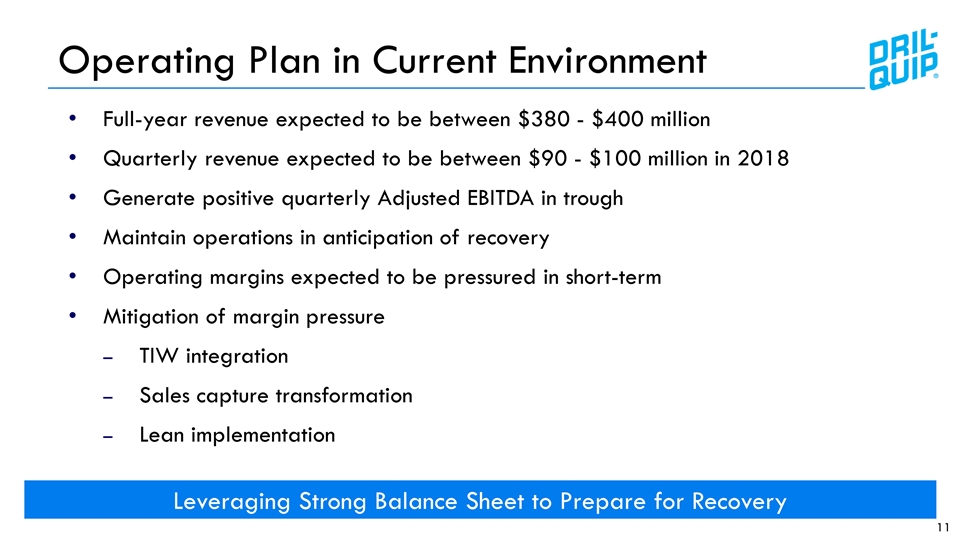
Operating Plan in Current Environment Full-year revenue expected to be between $380 - $400 million Quarterly revenue expected to be between $90 - $100 million in 2018 Generate positive quarterly Adjusted EBITDA in trough Maintain operations in anticipation of recovery Operating margins expected to be pressured in short-term Mitigation of margin pressure TIW integration Sales capture transformation Lean implementation Leveraging Strong Balance Sheet to Prepare for Recovery
Appendix
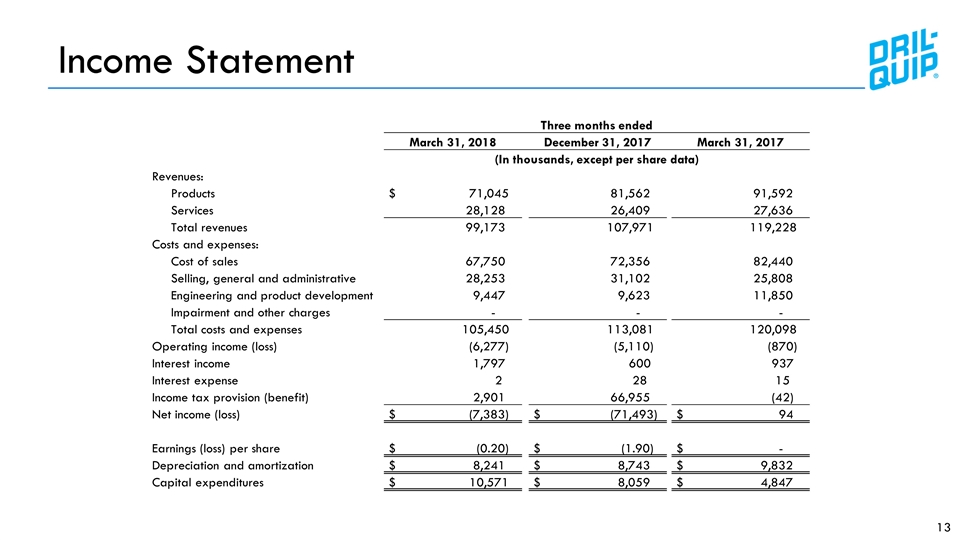
Income Statement Three months ended March 31, 2018 December 31, 2017 March 31, 2017 (In thousands, except per share data) Revenues: Products $ 71,045 81,562 91,592 Services 28,128 26,409 27,636 Total revenues 99,173 107,971 119,228 Costs and expenses: Cost of sales 67,750 72,356 82,440 Selling, general and administrative 28,253 31,102 25,808 Engineering and product development 9,447 9,623 11,850 Impairment and other charges - - - Total costs and expenses 105,450 113,081 120,098 Operating income (loss) (6,277) (5,110) (870) Interest income 1,797 600 937 Interest expense 2 28 15 Income tax provision (benefit) 2,901 66,955 (42) Net income (loss) $ (7,383) $ (71,493) $ 94 Earnings (loss) per share $ (0.20) $ (1.90) $ - Depreciation and amortization $ 8,241 $ 8,743 $ 9,832 Capital expenditures $ 10,571 $ 8,059 $ 4,847
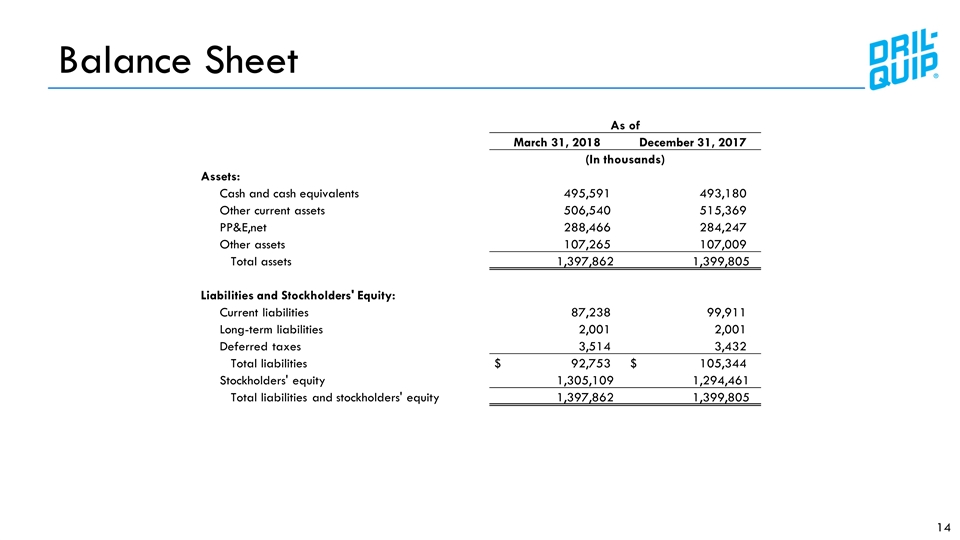
Balance Sheet As of March 31, 2018 December 31, 2017 (In thousands) Assets: Cash and cash equivalents 495,591 493,180 Other current assets 506,540 515,369 PP&E,net 288,466 284,247 Other assets 107,265 107,009 Total assets 1,397,862 1,399,805 Liabilities and Stockholders' Equity: Current liabilities 87,238 99,911 Long-term liabilities 2,001 2,001 Deferred taxes 3,514 3,432 Total liabilities $ 92,753 $ 105,344 Stockholders' equity 1,305,109 1,294,461 Total liabilities and stockholders' equity 1,397,862 1,399,805
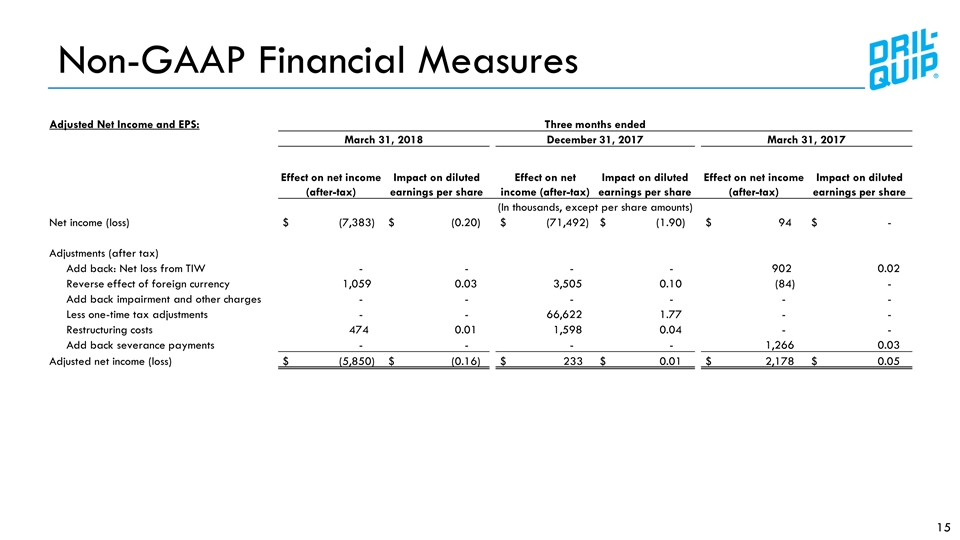
Non-GAAP Financial Measures Adjusted Net Income and EPS: Three months ended March 31, 2018 December 31, 2017 March 31, 2017 Effect on net income (after-tax) Impact on diluted earnings per share Effect on net income (after-tax) Impact on diluted earnings per share Effect on net income (after-tax) Impact on diluted earnings per share (In thousands, except per share amounts) Net income (loss) $ (7,383) $ (0.20) $ (71,492) $ (1.90) $ 94 $ - Adjustments (after tax) Add back: Net loss from TIW - - - - 902 0.02 Reverse effect of foreign currency 1,059 0.03 3,505 0.10 (84) - Add back impairment and other charges - - - - - - Less one-time tax adjustments - - 66,622 1.77 - - Restructuring costs 474 0.01 1,598 0.04 - - Add back severance payments - - - - 1,266 0.03 Adjusted net income (loss) $ (5,850) $ (0.16) $ 233 $ 0.01 $ 2,178 $ 0.05
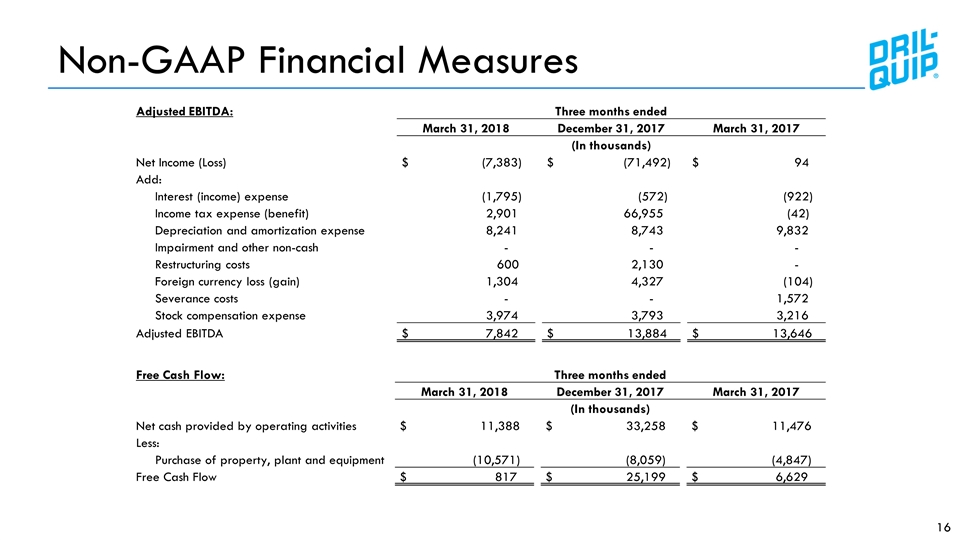
Non-GAAP Financial Measures Adjusted EBITDA: Three months ended March 31, 2018 December 31, 2017 March 31, 2017 (In thousands) Net Income (Loss) $ (7,383) $ (71,492) $ 94 Add: Interest (income) expense (1,795) (572) (922) Income tax expense (benefit) 2,901 66,955 (42) Depreciation and amortization expense 8,241 8,743 9,832 Impairment and other non-cash - - - Restructuring costs 600 2,130 - Foreign currency loss (gain) 1,304 4,327 (104) Severance costs - - 1,572 Stock compensation expense 3,974 3,793 3,216 Adjusted EBITDA $ 7,842 $ 13,884 $ 13,646 Free Cash Flow: Three months ended March 31, 2018 December 31, 2017 March 31, 2017 (In thousands) Net cash provided by operating activities $ 11,388 $ 33,258 $ 11,476 Less: Purchase of property, plant and equipment (10,571) (8,059) (4,847) Free Cash Flow $ 817 $ 25,199 $ 6,629
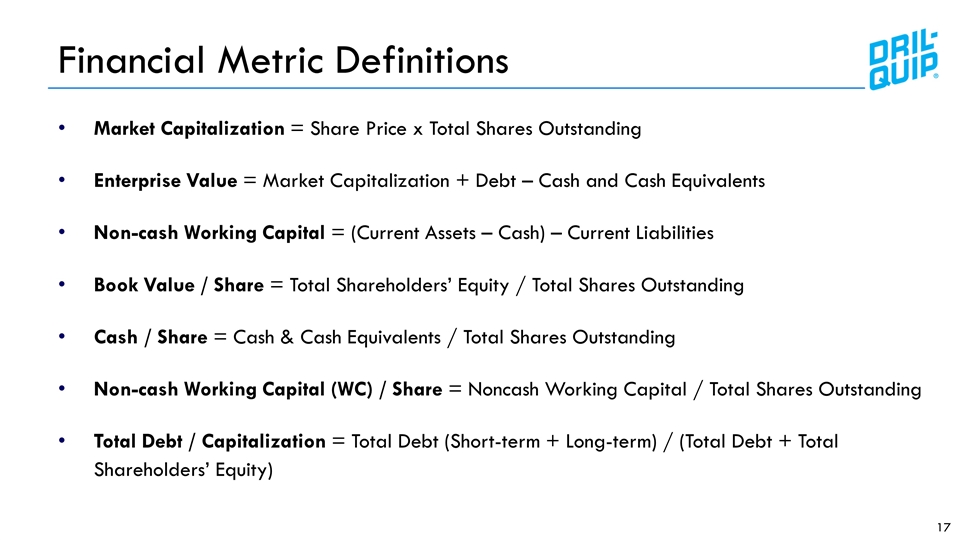
17 Market Capitalization = Share Price x Total Shares Outstanding Enterprise Value = Market Capitalization + Debt – Cash and Cash Equivalents Non-cash Working Capital = (Current Assets – Cash) – Current Liabilities Book Value / Share = Total Shareholders’ Equity / Total Shares Outstanding Cash / Share = Cash & Cash Equivalents / Total Shares Outstanding Non-cash Working Capital (WC) / Share = Noncash Working Capital / Total Shares Outstanding Total Debt / Capitalization = Total Debt (Short-term + Long-term) / (Total Debt + Total Shareholders’ Equity) Financial Metric Definitions
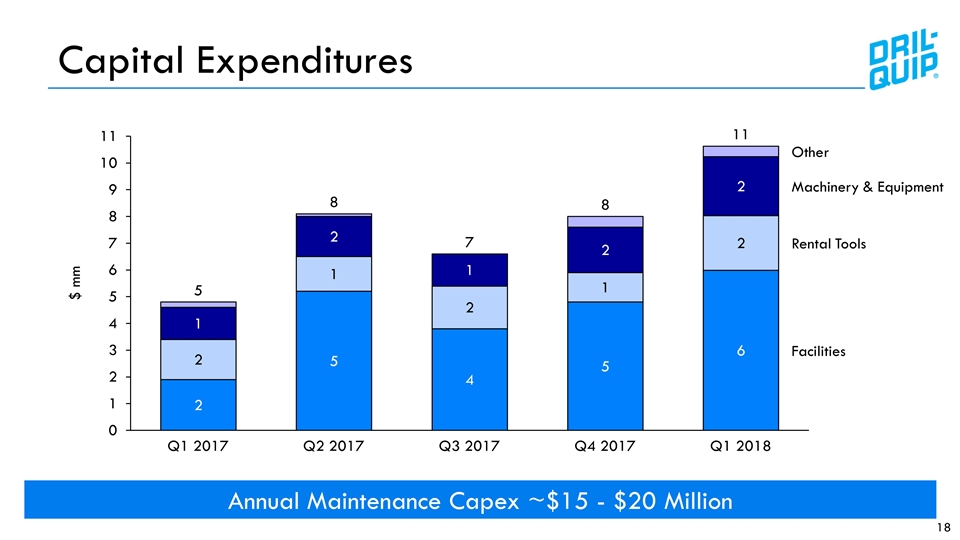
Capital Expenditures Annual Maintenance Capex ~$15 - $20 Million 18 $ mm
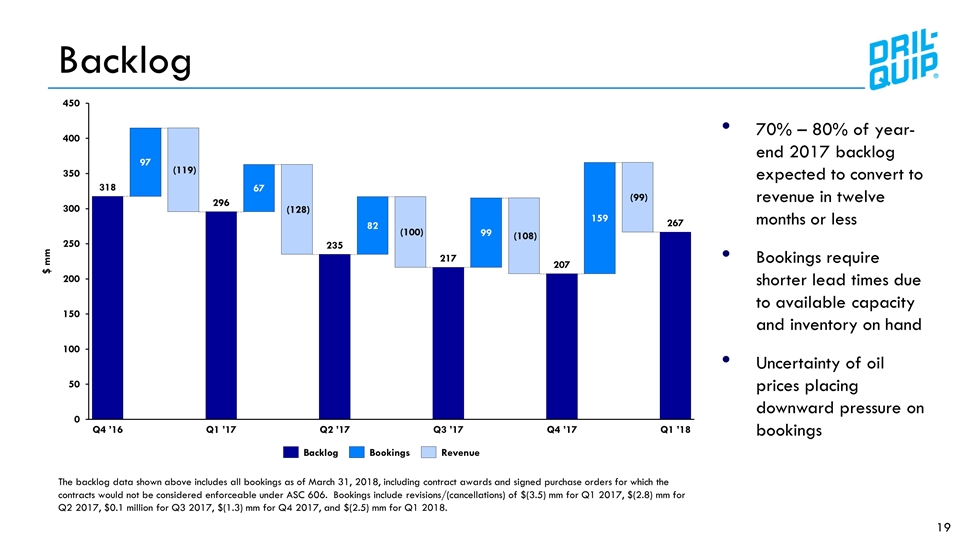
Backlog 70% – 80% of year-end 2017 backlog expected to convert to revenue in twelve months or less Bookings require shorter lead times due to available capacity and inventory on hand Uncertainty of oil prices placing downward pressure on bookings 19 The backlog data shown above includes all bookings as of March 31, 2018, including contract awards and signed purchase orders for which the contracts would not be considered enforceable under ASC 606. Bookings include revisions/(cancellations) of $(3.5) mm for Q1 2017, $(2.8) mm for Q2 2017, $0.1 million for Q3 2017, $(1.3) mm for Q4 2017, and $(2.5) mm for Q1 2018. $ mm
