Attached files
| file | filename |
|---|---|
| EX-99.1 - EXHIBIT 99.1 - VARIAN MEDICAL SYSTEMS INC | tv492036_ex99-1.htm |
| 8-K - FORM 8-K - VARIAN MEDICAL SYSTEMS INC | tv492036_8k.htm |
Exhibit 99.2

J. Michael Bruff Senior Vice President, Investor Relations investors@varian.com April 25, 2018 Second Quarter Fiscal Year 2018

This presentation is intended exclusively for investors. It is not intended for use in Sales or Marketing. 2 Forward - Looking Statements Except for historical information, this presentation contains forward - looking statements within the meaning of the Private Securities Litigation Reform Act of 1995 . Statements concerning industry outlook, including growth drivers, future trends in cancer incidence and trends in cancer treatment needs, demand, innovation and growth opportunities ; Varian Medical System, Inc . ’s (”Varian” or the “company”) future orders, revenues, backlog or earnings growth ; future financial results ; statements concerning Varian’s planned acquisition of Sirtex , expected synergies, accretive expectations, estimated closing date of the Sirtex acquisition, and the company’s ability to close and integrate the Sirtex acquisition and achieve expected synergies ; market acceptance of or transition to new products or technology such as our Edge ̺ radiosurgery system, TrueBeam ̺ , HyperArc TM , 360 Oncology TM , HALCYON TM , image - guided radiation therapy, stereotactic radiosurgery and proton therapy, and any statements using the terms “could”, “believe”, “expect”, “outlook”, “anticipate”, ”vision”, “estimate”, “future”, “horizon”, “aiming”, “driving”, “target” or similar statements are forward - looking statements that involve risks and uncertainties that could cause the company’s actual results to differ materially from those anticipated . Such risks and uncertainties include global economic conditions and changes to trends for cancer treatment regionally ; the impact of changes to the Affordable Health Care for America Act (including excise taxes on medical devices) and any further healthcare reforms (including changes to Medicare and Medicaid), and/or changes to third - party reimbursement levels ; currency exchange rates and tax rates ; the impact of the Tax Cuts and Jobs Act ; demand for the company’s products ; the company’s ability to develop, commercialize, and deploy new products ; the company’s ability to meet Food and Drug Administration (FDA) and other regulatory requirements for product clearances or to comply with FDA and other regulatory regulations or procedures, changes in the regulatory environment, including with respect to FDA requirements ; the company’s assessment of the goodwill associated with its particle therapy business, challenges associated with the successful commercialization of the company’s particle therapy business ; the risks associated with providing financing for the construction and start - up operations of proton therapy centers ; the effect of adverse publicity ; the company’s reliance on sole or limited - source suppliers ; the company’s ability to maintain or increase margins ; the impact of competitive products and pricing ; the potential loss of key distributors or key personnel ; challenges to public tender awards and the loss of such awards or other orders ; and the other risks listed from time to time in the company’s filings with the Securities and Exchange Commission, which by this reference are incorporated herein . The company assumes no obligation to update or revise the forward - looking statements in this presentation because of new information, future events, or otherwise . Reconciliations to GAAP financials can be found at http : //investors . varian . com/financialstatements and the appendix to this presentation . Varian has not filed its Form 10 - Q for the quarter ended March 30 , 2018 . As a result, all financial results described here should be considered preliminary, and are subject to change to reflect any necessary adjustments, or changes in accounting estimates, that are identified prior to the time the company files the Form 10 - Q . Medical Advice Disclaimer Varian as a medical device manufacturer cannot and does not recommend specific treatment approaches. Individual treatment res ult s may vary.

Long - Term Strategy
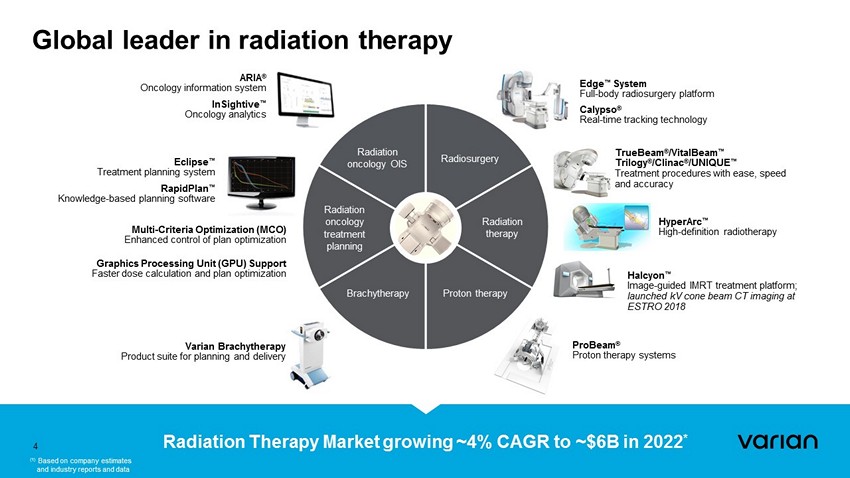
Eclipse ™ Treatment planning system RapidPlan ™ Knowledge - based planning software Calypso ® Real - time tracking technology Edge ™ System Full - body radiosurgery platform Halcyon ™ Image - guided IMRT treatment platform; launched kV cone beam CT imaging at ESTRO 2018 TrueBeam ® /VitalBeam ™ Trilogy ® /Clinac ® /UNIQUE ™ Treatment procedures with ease, speed and accuracy Varian Brachytherapy Product suite for planning and delivery ProBeam ® Proton therapy systems Radiation oncology OIS Radiosurgery Brachytherapy Radiation oncology treatment planning Proton therapy Radiation therapy Global leader in radiation therapy ARIA ® Oncology information system InSightive ™ Oncology analytics Radiation Therapy Market growing ~4% CAGR to ~$6B in 2022 * (1) Based on company estimates * and industry reports and data 4 HyperArc ™ High - definition radiotherapy Multi - Criteria Optimization (MCO) Enhanced control of plan optimization Graphics Processing Unit (GPU) Support Faster dose calculation and plan optimization

Long - term growth and value creation strategy 5 Global Leader in Radiation Therapy Radiation oncology OIS Radiosurgery Brachytherapy Radiation oncology treatment planning Proton therapy Radiation therapy Global Leader in Multi - Disciplinary, Integrated Cancer Care Solutions Interventional oncology Surgical oncology Diagnostic imaging Radiation oncology Precision medicine Medical oncology Generate insights Call on all oncologists Aggregate data Disseminated insights Build AI/ML capabilities
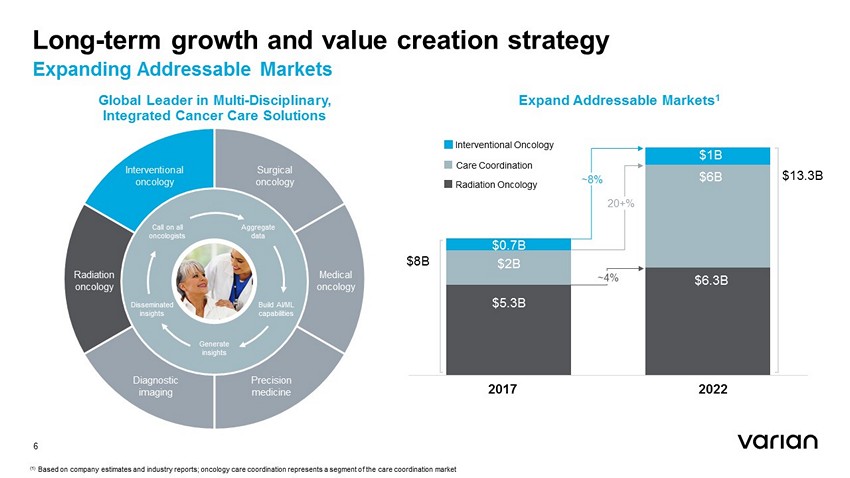
Long - term growth and value creation strategy Expanding Addressable Markets 6 Global Leader in Multi - Disciplinary, Integrated Cancer Care Solutions Interventional oncology Surgical oncology Diagnostic imaging Radiation oncology Precision medicine Medical oncology Generate insights Call on all oncologists Aggregate data Disseminated insights Build AI/ML capabilities Expand Addressable Markets 1 $0.67B $5.3B $6B $6.3B 20+% $13.3B $8B Interventional Oncology Radiation Oncology 2017 2022 ~4% (1) Based on company estimates and industry reports; oncology care coordination represents a segment of the care coordination mar ke t $2B $1B $0.7B ~8% Care Coordination

Enables entry into a faster growing interventional oncology market Strengthening radiation medicine Investing in growth and providing financial return to shareholders • Two global leaders in radiation coming together as the leader in radiation medicine • Expands Varian’s addressable market into interventional oncology • Clear opportunity for expansion/growth; market is expected to grow to ~$1B by 2022, growing ~8% CAGR • Consistent with long - term value creation strategy , which includes balancing growth, profitability and liquidity 7 Varian to acquire Sirtex Announced Q2 FY18; Targeted Close by Late May 2018

Growth priorities and strategic enablers 8 We are here Global Leader in Radiation Therapy Global Leader in Multi - Disciplinary, Integrated Cancer Care Solutions Long - Term Growth and Value Creation Strategy Strengthen Leadership in Radiation Therapy Extend Global Footprint Expand Addressable Market Growth Priorities High Quality Care Through Innovation Build Software Services & Big Data Expertise Operational Efficiency Optimize Cash Conversion & Capital Structure Strategic Enablers Where we are headed

Growth priority: Strengthen our leadership in radiation therapy (1) Based on company estimates and industry reports and data Enhanced quality assurance capabilities with acquisition of Mobius, a leader in radiation oncology QA software Global market leader in radiation therapy, increasing share in a 3% growth market and extending leadership over the trailing twelve months 1 Grew linac install base by 3% ; total install base of 7,954 units R&D up 10% maintaining commitment to driving high - quality, organic innovation Orders Growth in the quarter ⁃ Oncology orders growth of 5 % in the 2 nd quarter, or +1% in constant currency (cc), with orders growth across all regions ⁃ Oncology orders growth of 5% (+4% cc) over the trailing twelve months Since launch last May, Halcyon treatment platform ⁃ 81 orders to date ⁃ More than half are incremental ⁃ >40% for greenfield sites ⁃ New scaled configurations optimized for different customer segments 9

Growth priority: Extend global footprint ~55% international orders mix in Oncology in the quarter; ⁃ EMEA orders growth of 11% ⁃ APAC orders growth of 3% ⁃ Double - digits Latin American orders growth >40% of Halcyon orders in emerging markets, since May 2017 launch ⁃ >60% orders in the 2 nd quarter in emerging markets ⁃ >80% of emerging market orders to date were for incremental units ⁃ Launched kilovoltage cone beam CT imaging at ESTRO 10

Growth priority: Expand addressable market Entering interventional oncology market with acquisition of Sirtex ⁃ Leader in radioembolization within the interventional oncology market ⁃ Expected to close by late May 2018 Enhanced clinical workflow capabilities for 360 Oncology with acquisition of Evinance Innovation, specializing in clinical decision support software Unique software customers grew 5% during the 2 nd quarter; newer applications fuelling enthusiasm for Varian software solutions ⁃ Install base doubled for RapidPlan, our knowledge - based treatment planning software 11

2Q FY 2018 Business Highlights

JUN First patient treated with Varian HyperArc high - definition radiotherapy Varian publishes 2017 Sustainability Report Year in review 13 AUG OCT DEC JAN FEB MARCH 2018 Varian names new CFO Varian Eclipse users generate highest scoring plans in international treatment plan competition Varian installs Cyclotron at Georgia Proton Treatment Center Varian announces Penn Medicine treats world’s first patient on Halcyon system JUL NOV Halcyon receives Shonin approval in Japan Varian opens new facility in Brazil Varian partners with Penn Medicine for proton therapy training and education Halcyon receives ANVISA registration in Brazil Peter MacCallum Cancer Centre in Australia standardizes on Varian solution for cancer treatment planning Halcyon introduced Halcyon receives Taiwan FDA approval Varian ranks first in overall manufacturer, system, and service performance in 2017 Survey of Radiation Oncology Professionals MAY APRIL 2017 JUN SEP Varian signs agreement to acquire Sirtex Varian acquires Mobius Medical Systems Halcyon receives AERB Certificate for Import & Supply in India ARIA, Eclipse and TrueBeam named category leaders in 2018 Best in KLAS Report Varian acquires Evinance Innovation Eclipse customers take top Overall spots at World Championships of Treatment Planning Varian signs memorandum of understanding with Ping An to expand access to high - quality cancer care in China

0% 5% 10% 15% 20% 2Q FY17 3Q FY17 4Q FY17 1Q FY18 2Q FY18 +2 pts Y/Y Cash Flow from Operations 1 ($M) $0 $50 $100 $150 2Q FY17 3Q FY17 4Q FY17 1Q FY18 2Q FY18 Non - GAAP Operating Earnings (% of Revenues) Financial highlights Operating Trends* Strong performance in key financial measures • Revenues up 10% (+6% in cc) due to hardware and services growth in Oncology operating segment • Cash Flow from Operations more than doubled, driven by operating income performance and working capital efficiencies Oncology DSO down from 118 to 103 days • GAAP operating earnings down 1 percentage point to 13%, due to acquisition - related expenses and impairment from expected refinancing of Maryland Proton Treatment Center • Non - GAAP operating earnings up 2 percentage points to 18%, due to gross margin rate expansion and operating cost leverage * All financial metrics, including historical figures, reflect the new revenue recognition standard, ASC 606. (1) Cash Flow is shown on a Total Company basis, including Varex prior to the spinoff. 14 Revenues ($M) GAAP Operating Earnings (% of Revenues) $0 $250 $500 $750 2Q FY17 3Q FY17 4Q FY17 1Q FY18 2Q FY18 0% 5% 10% 15% 20% 2Q FY17 3Q FY17 4Q FY17 1Q FY18 2Q FY18 +104% Y/Y +10% Y/Y - 1 pt Y/Y
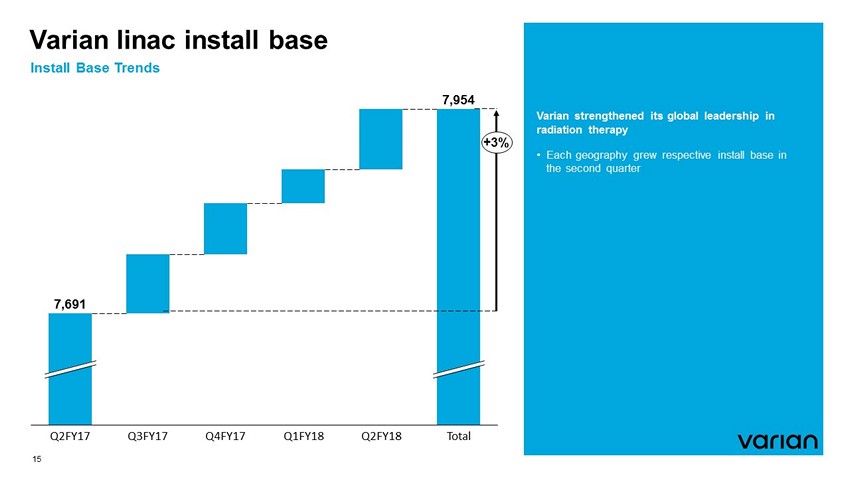
Varian linac install base Install Base Trends Varian strengthened its global leadership in radiation therapy • Each geography grew respective install base in the second quarter 15 Q3FY17 Total Q1FY18 Q2FY17 Q4FY17 Q2FY18 7,691 7,954 +3%

Key wins Americas EMEA APAC Sweden – Karolinska tender 8 TrueBeams UK – Glasgow Beatson & Edinburgh Western 3 TrueBeams Czech Republic – Praha MOTOL 3 TrueBeams India – Himalaya 3 Halcyon systems Mexico Instituto Mexicano del Seguro Social (IMSS) 7 Linacs – 1 Edge, 6 VitalBeams Brazil and Argentina Halcyon orders Tenet 3 TrueBeams , HyperArc China – Guangxi Medical University VitalBeam Australia – St. George Hospital TrueBeam order Korea – Guro & Ansan TrueBeam orders Japan – NHO Kyoto Medical Center TrueBeam & VitalBeam TriHealth 5 Linacs – 4 TrueBeams , 1 Edge with ARIA and Eclipse 16 Brazil Liga Catarinense 3 Linacs – 1 TrueBeam , 1 VitalBeam , 1 Halcyon Ascension Health TrueBeams , Aria & Eclipse for network Italy 2 TrueBeams Pakistan – Peshawar 2 VitalBeams

2Q FY 2018 Financial Overview

Varian consolidated (GAAP) Key P&L Financial Metrics 18 VARIAN FISCAL 2018 $M 2Q Y/Y Gross Orders $666 0% Revenues $730 10% Product $400 10% Services $330 10% Gross Margin $318 16% % of Revenues 43.6% 208 bps SG&A $165 25% % of Revenues 22.6% 271 bps R&D $59 10% % of Revenues 8.1% 3 bps Operating Earnings $94 5% % of Revenues 12.9% - 67 bps EPS ($) $0.79 6% Install Base ( Linac ) 7,954 3% • Gross orders of $666 million flat year - over - year Oncology orders +5% (+1% cc); growth in all regions No new ProBeam orders in the quarter; 6 orders in the trailing twelve months; pipeline remains strong • Revenues of $730 million growing at 10% (+6% cc) Oncology revenues +10% (+6% cc) Proton revenues +2% • Gross margin rate improved 208 bps • SG&A increased 25%, driven by Additional sales team and infrastructure investments to support business growth $20 million acquisition - related expenses $11 million impairment from expected refinancing of Maryland Proton Treatment Center • R&D investment up 10%, maintaining commitment to innovation • GAAP EPS growth of 6% driven by revenue growth and gross margin improvements • Grew linac install base 3% Note: Unless noted otherwise, all ‘Orders’ reflects Gross Orders, all growth rates are in dollars, and year on year, and all numbers reflect continuing operations.

VARIAN FISCAL 2018 $M 2Q Y/Y Gross Orders $666 0% Revenues $730 10% Product $400 10% Services $330 10% Gross Margin $320 16% % of Revenues 43.8% 209 bps SG&A $132 12% % of Revenues 18.1% 38 bps R&D $59 10% % of Revenues 8.1% 3 bps Operating Earnings $129 22% % of Revenues 17.6% 168 bps EPS ($) $1.15 28% Install Base ( Linac ) 7,954 3% Varian consolidated (non - GAAP) Key P&L Financial Metrics 19 Note: Unless noted otherwise, all ‘Orders’ reflects Gross Orders, all growth rates are in dollars, and year on year, and all numbers reflect continuing operations. • Gross orders of $666 million flat year - over - year Oncology orders +5% (+1% cc); growth in all regions No new ProBeam orders in the quarter; 6 orders in the trailing twelve months; pipeline remains strong Revenues of $730 million growing at 10% (+6% cc) Oncology revenues +10% (+6% cc) Proton revenues +2% • Gross margin rate improved 209 bps • SG&A increased 12%, driven by additional sales team and infrastructure investments to support business growth • R&D investment up 10%, maintaining commitment to innovation • Non - GAAP EPS increased 28% due to strong growth and operational execution Excludes impact from $20 million acquisition - related expenses, and $11 million impairment from expected refinancing of Maryland Proton Treatment Center • Grew linac install base 3%

Varian consolidated Key Balance Sheet and Cash Flow Metrics • Cash Flow from Operations more than doubled, driven by operating income performance and working capital efficiencies Trailing twelve - month cash flow from operations of $529 million Oncology DSO down from 118 to 103 days • Continuing to strengthen financial flexibility through operational execution and by steadily reducing debt 20 VARIAN FISCAL 2017 FISCAL 2018 $M 2Q 3Q 4Q 1Q 2Q Cash & Cash Equivalents $706 $658 $716 $823 $740 Cash Flow from Operations 1 $32 $155 $130 $179 $66 Y/Y % 1% 63% - 15% 118% 104% Total Debt $547 $364 $350 $340 $255 (1) Cash Flow is shown on a Total Company basis, including Varex prior to the spinoff.

Oncology operating segment Key Financial Metrics • Orders growth of 5% (+1% cc), with growth in all regions Oncology orders mix: North America ~45%, International ~55% 19 new orders for Halcyon in the quarter • Product revenues growth of 11% driven by robust linac system sales, services, and software • Services revenues growth of 10% driven by hardware contracts and services training • Strong operating leverage as margin growth outpacing revenue growth while continuing to invest in R&D 21 VARIAN FISCAL 2018 $M 2Q Y/Y Gross Orders $664 5% Revenues $698 10% Product $370 11% Services $328 10% Gross Margin $317 15% % of Rev 45.5% 166 bps Operating Earnings 1 $143 16% % of Rev 20.5% 105 bps Install Base ( Linac ) 7,954 3% Note: Unless noted otherwise, all ‘Orders’ reflects Gross Orders, all growth rates are in dollars, and year on year, and all numbers reflect continuing operations. (1) Operating earnings includes an allocation of corporate costs based on relative revenues between the operating segments. The allocated corporate costs excludes certain transactions or adjustments that are considered non - operational in nature, such as restructuring and impairment charges, significant litigation matters and acquisition related items.

22 Oncology gross orders by geography AMERICAS 2% 2Q Y/Y (+2% cc) 1% 2Q TTM 1 (+1% cc) APAC 3% 2Q Y/Y (+1% cc) 2% 2Q TTM (+2% cc) EMEA 11% 2Q Y/Y (+0% cc) 15% 2Q TTM (+11% cc) (1) In North America, trailing twelve - month orders growth of 2% in dollars and constant currency

Particle Therapy operating segment Key Financial Metrics • No new orders for ProBeam systems in the quarter; 6 orders in the trailing twelve months; pipeline remains strong • 7 operational sites with 25 rooms in 5 countries; 16 more sites in progress across the world • Revenues, margins and related growth rates may be volatile until we get to operational scale across the business 23 VARIAN FISCAL 2018 $M 2Q Y/Y Gross Orders $2 - 93% Revenues $32 2% Product $30 0% Services $2 61% Gross Margin $1 204% % of Revenues 3.7% 735 bps Operating Earnings 1 ($17) NM % of Revenues - 54.6% NM Note: Unless noted otherwise, all ‘Orders’ reflects Gross Orders, all growth rates are in dollars, and year on year, and all numbers reflect continuing operations. (1) Operating earnings includes an allocation of corporate costs based on relative revenues between the operating segments. The allocated corporate costs excludes certain transactions or adjustments that are considered non - operational in nature, such as restructuring and impairment charges, significant litigation matters and acquisition related items.

ProBeam proton therapy system sites Operational Centers Centers Under Development 24 Treatment rooms ProBeam Sites Operational rooms Operational Sites 70 25 7 23

FY 2018 Guidance
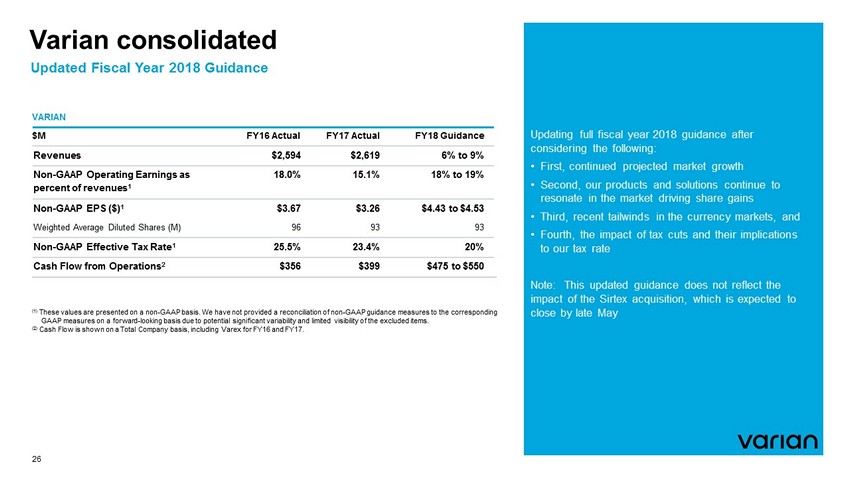
Varian consolidated Updated Fiscal Year 2018 Guidance Updating full fiscal year 2018 guidance after considering the following: • First, continued projected market growth • Second, our products and solutions continue to resonate in the market driving share gains • Third, recent tailwinds in the currency markets, and • Fourth, the impact of tax cuts and their implications to our tax rate Note: This updated guidance does not reflect the impact of the Sirtex acquisition, which is expected to close by late May 26 VARIAN $M FY16 Actual FY17 Actual FY18 Guidance Revenues $2,594 $2,619 6% to 9% Non - GAAP Operating Earnings as percent of revenues 1 18.0% 15.1% 18% to 19% Non - GAAP EPS ($) 1 $3.67 $3.26 $4.43 to $4.53 Weighted Average Diluted Shares (M) 96 93 93 Non - GAAP Effective Tax Rate 1 25.5% 23.4% 20% Cash Flow from Operations 2 $356 $399 $475 to $550 (1) These values are presented on a non - GAAP basis. We have not provided a reconciliation of non - GAAP guidance measures to the corre sponding GAAP measures on a forward - looking basis due to potential significant variability and limited visibility of the excluded items. (2) Cash Flow is shown on a Total Company basis, including Varex for FY16 and FY17.

2Q FY 2018 Financial Overview

Non - GAAP disclosure 28 Discussion of Non - GAAP Financial Measures This presentation includes the following non - GAAP financial measures derived from our Condensed Consolidated Statements of Earnings : non - GAAP operating earnings, non - GAAP net earnings and non - GAAP net earnings per diluted share . We define non - GAAP operating earnings from continuing operations as operating earnings from continuing operations excluding amortization of intangible assets, restructuring charges, legal costs, impairment charges and acquisition - related expenses and benefits . These measures are not presented in accordance with, nor are they a substitute for U . S . generally accepted accounting principles, or GAAP . In addition, these measures may be different from non - GAAP measures used by other companies, limiting their usefulness for comparison purposes . The non - GAAP financial measures should not be considered in isolation from measures of financial performance prepared in accordance with GAAP . Investors are cautioned that there are material limitations associated with the use of non - GAAP financial measures as an analytical tool . We have provided a reconciliation of each non - GAAP financial measure used in this earnings release to the most directly comparable GAAP financial measure . We have not provided a reconciliation of non - GAAP guidance measures to the corresponding GAAP measures on a forward - looking basis due to the potential significant variability and limited visibility of the excluded items discussed below . We utilize a number of different financial measures, both GAAP and non - GAAP, in analyzing and assessing the overall performance of our business, in making operating decisions, forecasting and planning for future periods, and determining payments under compensation programs . We consider the use of the non - GAAP measures to be helpful in assessing the performance of the ongoing operation of our business . We believe that disclosing non - GAAP financial measures provides useful supplemental data that, while not a substitute for financial measures prepared in accordance with GAAP, allows for greater transparency in the review of our financial and operational performance . We also believe that disclosing non - GAAP financial measures provides useful information to investors and others in understanding and evaluating our operating results and future prospects in the same manner as management and in comparing financial results across accounting periods and to those of peer companies . Non - GAAP operating earnings and non - GAAP net earnings exclude the following items, except for significant effects of tax legislation, which are only excluded from non - GAAP net earnings : Amortization of intangible assets : We do not acquire businesses and assets on a predictable cycle . The amount of purchase price allocated to intangible assets and the term of amortization can vary significantly and are unique to each acquisition or purchase . We believe that excluding amortization of intangible assets allows the users of our financial statements to better review and understand the historic and current results of our operations, and also facilitates comparisons to peer companies . Acquisition and integration - related expenses and benefits : We incur expenses or benefits with respect to certain items associated with our acquisitions, such as transaction costs, changes in the fair value of contingent consideration liabilities, gain or expense on settlement of pre - existing relationships, hedging gains and losses, integration costs etc . We exclude such expenses or benefits as they are related to acquisitions and have no direct correlation to the operation of our on - going business . Restructuring and impairment charges : We incur restructuring and impairment charges that result from events, which arise from unforeseen circumstances and/or often occur outside of the ordinary course of our on - going business . Although these events are reflected in our GAAP financials, these unique transactions may limit the comparability of our on - going operations with prior and future periods . Significant effects of tax legislation : We may incur significant effects of tax legislation that are generally unrelated to the level of business activity in the period in which the effects of such legislation are reported . We exclude such expenses, because we believe this does not accurately reflect the underlying performance of our continuing business operations . This exclusion is applicable to non - GAAP net earnings only . Significant litigation charges or benefits and legal costs : We may incur charges or benefits as well as legal costs from time to time related to litigation and other contingencies . We exclude these charges or benefits, when significant, as well as legal costs associated with significant legal matters, because we do not believe they are reflective of on - going business and operating results . We apply our GAAP consolidated effective tax rate to our non - GAAP financial measures, other than when the underlying item has a materially different tax treatment . From time to time in the future, there may be other items that we may exclude if we believe that doing so is consistent with the goal of providing useful information to investors and management . Non - GAAP items are generally included in selling, general and administrative expenses, except for significant effects of tax legislation and unless otherwise specified .

GAAP to non - GAAP reconciliation 29 (1) Includes $1.2 million, $1.2 million, $1.3 million, $1.2 million, and $1.5 million, respectively in cost of revenues for the p eri ods presented. (2) In the second quarter of 2018, there was primarily $16.4 million for the hedging loss related to the Australian dollar purcha se price for Sirtex Medical Limited. (3) Represents the tax effect of a change in law related to the U.S. Tax Cuts and Jobs Act. The corporate rate reduction results in a remeasurement of our Deferred Tax Assets of $37.8 million in the first quarter and $2.5 million in the second quarter of 2018. The mandatory deemed repatriation of unremitted foreign earnings results in an estimated charge of $169.3 mi lli on in the first quarter and $3.7 million in the second quarter of 2018. (4) Excludes immaterial net earnings (loss) from continuing operations attributable to noncontrolling interests for the periods p re sented.

Total revenues by sales classification 30 CC – Constant currency $M 2Q FY17 3Q FY17 4Q FY17 1Q FY18 2Q FY18 Product revenues $364.9 $326.2 $402.8 $365.6 $400.4 Y/Y 10% Service revenues $298.3 $306.6 $319.0 $312.9 $329.5 Y/Y 10% Total revenues $663.2 $632.8 $721.8 $678.5 $729.9 Y/Y 10% Y/Y – CC 6% Product revenues as a percentage of total revenues 55% 52% 56% 54% 55% Service revenues as a percentage of total revenues 45% 48% 44% 46% 45%

Total revenues by product type 31 CC – Constant currency
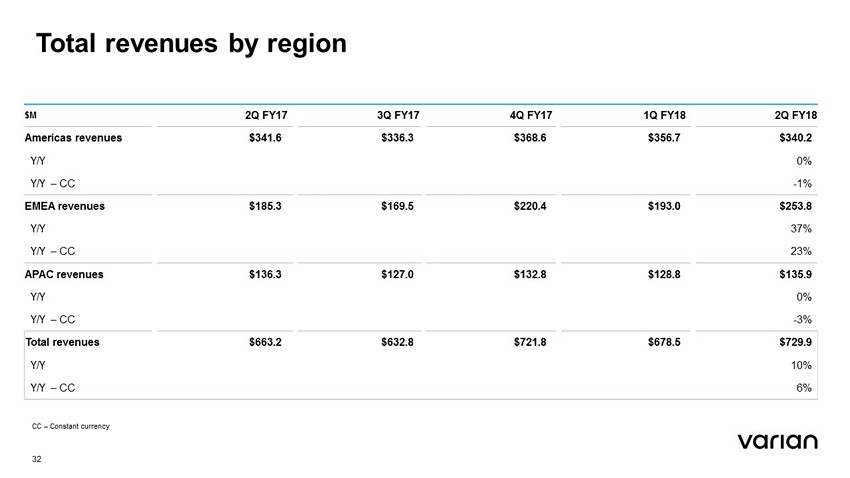
Total revenues by region 32 $M 2Q FY17 3Q FY17 4Q FY17 1Q FY18 2Q FY18 Americas revenues $341.6 $336.3 $368.6 $356.7 $340.2 Y/Y 0% Y/Y – CC - 1% EMEA revenues $185.3 $169.5 $220.4 $193.0 $253.8 Y/Y 37% Y/Y – CC 23% APAC revenues $136.3 $127.0 $132.8 $128.8 $135.9 Y/Y 0% Y/Y – CC - 3% Total revenues $663.2 $632.8 $721.8 $678.5 $729.9 Y/Y 10% Y/Y – CC 6% CC – Constant currency

Total Oncology revenues by sales classification 33 $M 2Q FY17 3Q FY17 4Q FY17 1Q FY18 2Q FY18 Product revenues $334.8 $259.7 $353.7 $338.3 $370.3 Y/Y 11% Y/Y – CC 6% Service revenues $297.1 $304.7 $315.6 $311.1 $327.7 Y/Y 10% Y/Y – CC 6% Total revenues $631.9 $564.4 $669.3 $649.4 $698.0 Y/Y 10% Y/Y – CC 6% Product as a percentage of total Oncology Systems revenues 53% 46% 53% 52% 53% Service as a percentage of total Oncology Systems revenues 47% 54% 47% 48% 47% Oncology Systems revenues as a percentage of total revenues 95% 89% 93% 96% 96% CC – Constant currency

Total Oncology revenues by region 34 $M 2Q FY17 3Q FY17 4Q FY17 1Q FY18 2Q FY18 Americas revenues $332.0 $286.9 $347.1 $337.4 $321.2 Y/Y - 3% Y/Y – CC - 3% EMEA revenues $167.5 $157.6 $196.9 $183.5 $241.2 Y/Y 44% Y/Y – CC 29% APAC revenues $132.4 $119.9 $125.3 $128.5 $135.6 Y/Y 2% Y/Y – CC 0% Total revenues $631.9 $564.4 $669.3 $649.4 $698.0 Y/Y 10% Y/Y – CC 6% CC – Constant currency

Total Particle Therapy revenues by sales classification 35 $M 2Q FY17 3Q FY17 4Q FY17 1Q FY18 2Q FY18 Product revenues $30.1 $66.5 $49.1 $27.3 $30.1 Y/Y 0% Service revenues $1.2 $1.9 $3.4 $1.8 $1.8 Y/Y 61% Total revenues $31.3 $68.4 $52.5 $29.1 $31.9 Y/Y 2% VPT revenues as a percentage of total revenues 5% 11% 7% 4% 4%

Oncology gross orders by region 36 $M 2Q FY17 3Q FY17 4Q FY17 1Q FY18 2Q FY18 Americas orders $335.2 $331.9 $479.0 $299.5 $341.4 Y/Y 2% Y/Y – CC 2% EMEA orders $180.3 $204.5 $315.4 $190.4 $199.3 Y/Y 11% Y/Y – CC 0% APAC orders $119.5 $151.3 $153.0 $130.0 $123.4 Y/Y 3% Y/Y – CC 1% Total orders $635.0 $687.7 $947.4 $619.9 $664.1 Y/Y 5% Y/Y – CC 1% CC – Constant currency