Attached files
| file | filename |
|---|---|
| EX-99.1 - EXHIBIT 99.1 - UNITED COMMUNITY BANKS INC | tv491738_ex99-1.htm |
| 8-K - FORM 8-K - UNITED COMMUNITY BANKS INC | tv491738_8k.htm |
Exhibit 99.2
2018 INVESTOR PRESENTATION FIRST QUARTER 2018 April 24, 2018
ucbi.com | 2 Disclosures CAUTIONARY STATEMENT This investor presentation may contain forward - looking statements, as defined by federal securities laws, including statements about United and its financial outlook and business environment . These statements are based on current expectations and are provided to assist in the understanding of our operations and future financial performance . Our operations and such performance involves risks and uncertainties that may cause actual results to differ materially from those expressed or implied in any such statements . For a discussion of some of the risks and other factors that may cause such forward - looking statements to differ materially from actual results, please refer to United Community Banks, Inc . ’s filings with the Securities and Exchange Commission, including its 2017 Annual Report on Form 10 - K under the section entitled “Forward - Looking Statements . ” Forward - looking statements speak only as of the date they are made, and we undertake no obligation to update or revise forward - looking statements . NON - GAAP MEASURES This presentation includes financial information determined by methods other than in accordance with generally accepted accounting principles (“GAAP”) . This financial information includes certain operating performance measures, which exclude merger - related and other charges that are not considered part of recurring operations . Such measures include : “Net income – operating,” “Net income available to common shareholders – operating,” “Earnings per share – operating,” “Diluted earnings per share – operating,” “Tangible book value per share,” “Return on common equity – operating,” “Return on tangible common equity – operating,” “Return on assets – operating,” “Efficiency ratio – operating,” “Expenses – operating,” “Tangible common equity to risk - weighted assets,” and “Average tangible equity to average assets . ” This presentation also includes “pre - tax, pre - credit earnings,” which excludes the provision for credit losses, income taxes and merger - related and other charges . Management has included these non - GAAP measures because we believe they may provide useful supplemental information for evaluating our underlying performance trends . Further, management uses these measures in managing and evaluating our business and intends to refer to them in discussions about our operations and performance . Operating performance measures should be viewed in addition to, and not as an alternative to or substitute for, measures determined in accordance with GAAP, and are not necessarily comparable to non - GAAP measures that may be presented by other companies . To the extent applicable, reconciliations of these non - GAAP measures to the most directly comparable GAAP measures can be found in the ‘Non - GAAP Reconciliation Tables’ included in the exhibits to this presentation . ucbi.com | 2
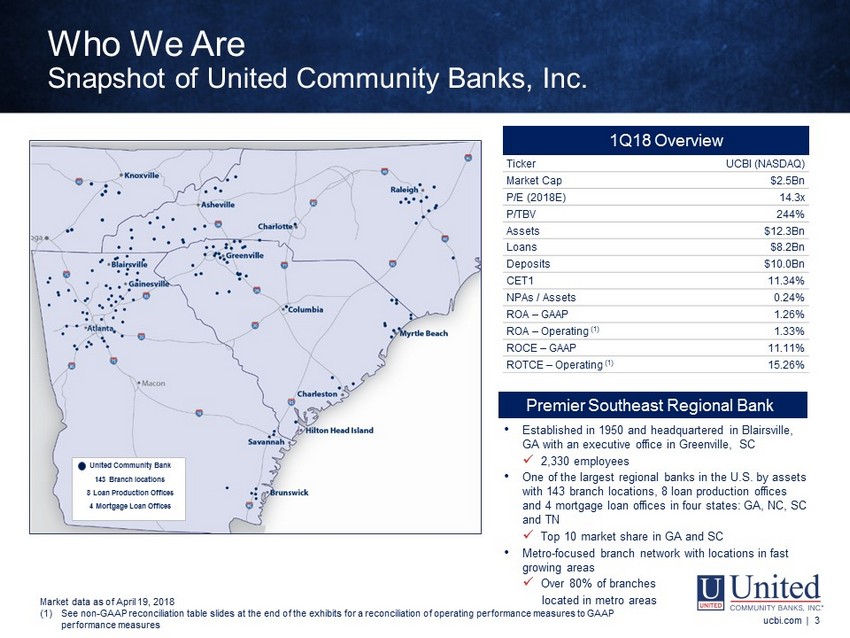
1Q18 Overview Ticker UCBI (NASDAQ) Market Cap $2.5Bn P/E (2018E) 14.3x P/TBV 244% Assets $12.3Bn Loans $8.2Bn Deposits $10.0Bn CET1 11.34% NPAs / Assets 0.24% ROA – GAAP 1.26% ROA – Operating (1) 1.33% ROCE – GAAP 11.11% ROTCE – Operating (1) 15.26% • Established in 1950 and headquartered in Blairsville, GA with an executive office in Greenville, SC x 2,330 employees • One of the largest regional banks in the U.S. by assets with 143 branch locations, 8 loan production offices and 4 mortgage loan offices in four states: GA, NC, SC and TN x Top 10 market share in GA and SC • Metro - focused branch network with locations in fast growing areas x Over 80% of branches located in metro areas Premier Southeast Regional Bank United Community Bank 143 Branch locations 8 Loan Production Offices 4 Mortgage Loan Offices Who We Are Snapshot of United Community Banks, Inc. Market data as of April 19, 2018 (1) See non - GAAP reconciliation table slides at the end of the exhibits for a reconciliation of operating performance measures to GA AP performance measures ucbi.com | 3
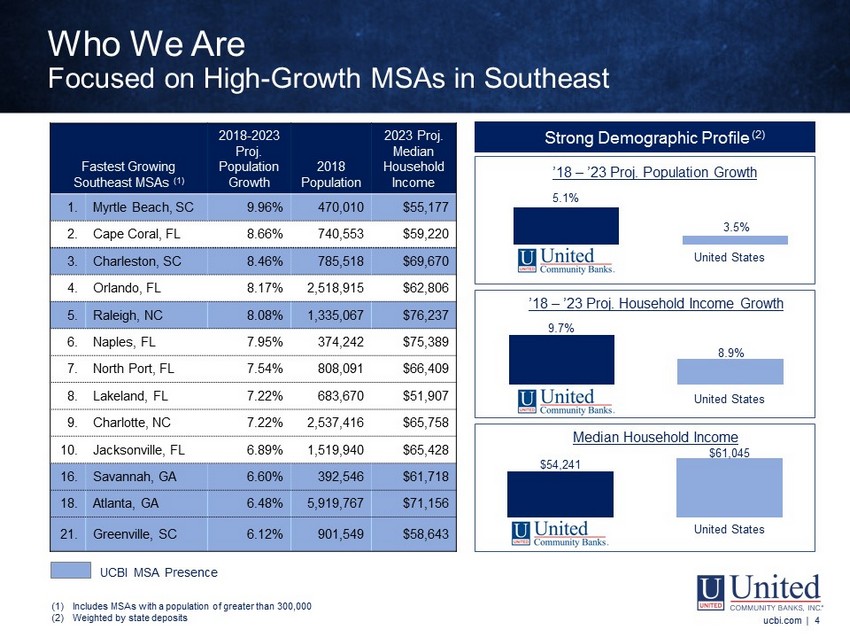
Fastest Growing Southeast MSAs (1) 2018 - 2023 Proj. Population Growth 2018 Population 2023 Proj. Median Household Income 1. Myrtle Beach, SC 9.96% 470,010 $55,177 2. Cape Coral, FL 8.66% 740,553 $59,220 3. Charleston, SC 8.46% 785,518 $69,670 4. Orlando, FL 8.17% 2,518,915 $62,806 5. Raleigh, NC 8.08% 1,335,067 $76,237 6. Naples, FL 7.95% 374,242 $75,389 7. North Port, FL 7.54% 808,091 $66,409 8. Lakeland, FL 7.22% 683,670 $51,907 9. Charlotte, NC 7.22% 2,537,416 $65,758 10. Jacksonville, FL 6.89% 1,519,940 $65,428 16. Savannah, GA 6.60% 392,546 $61,718 18. Atlanta, GA 6.48% 5,919,767 $71,156 21. Greenville, SC 6.12% 901,549 $58,643 9.7% 8.9% ’18 – ’23 Proj. Household Income Growth 5.1% 3.5% ’18 – ’23 Proj. Population Growth Strong Demographic Profile (2) $54,241 $61,045 Median Household Income UCBI MSA Presence Who We Are Focused on High - Growth MSAs in Southeast (1) Includes MSAs with a population of greater than 300,000 (2) Weighted by state deposits ucbi.com | 4 United States United States United States
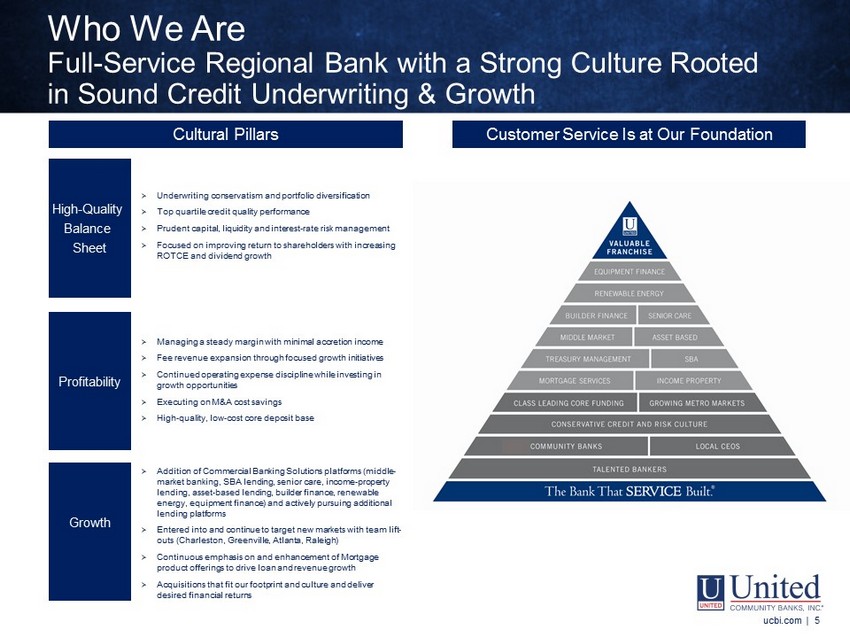
Cultural Pillars Customer Service Is at Our Foundation High - Quality Balance Sheet » Underwriting conservatism and portfolio diversification » Top quartile credit quality performance » Prudent capital, liquidity and interest - rate risk management » Focused on improving return to shareholders with increasing ROTCE and dividend growth Profitability » Managing a steady margin with minimal accretion income » Fee revenue expansion through focused growth initiatives » Continued operating expense discipline while investing in growth opportunities » Executing on M&A cost savings » High - quality, low - cost core deposit base Growth » Addition of Commercial Banking Solutions platforms (middle - market banking, SBA lending, senior care, income - property lending, asset - based lending, builder finance, renewable energy, equipment finance) and actively pursuing additional lending platforms » Entered into and continue to target new markets with team lift - outs (Charleston, Greenville, Atlanta, Raleigh) » Continuous emphasis on and enhancement of Mortgage product offerings to drive loan and revenue growth » Acquisitions that fit our footprint and culture and deliver desired financial returns Who We Are Full - Service Regional Bank with a Strong Culture Rooted in Sound Credit Underwriting & Growth ucbi.com | 5
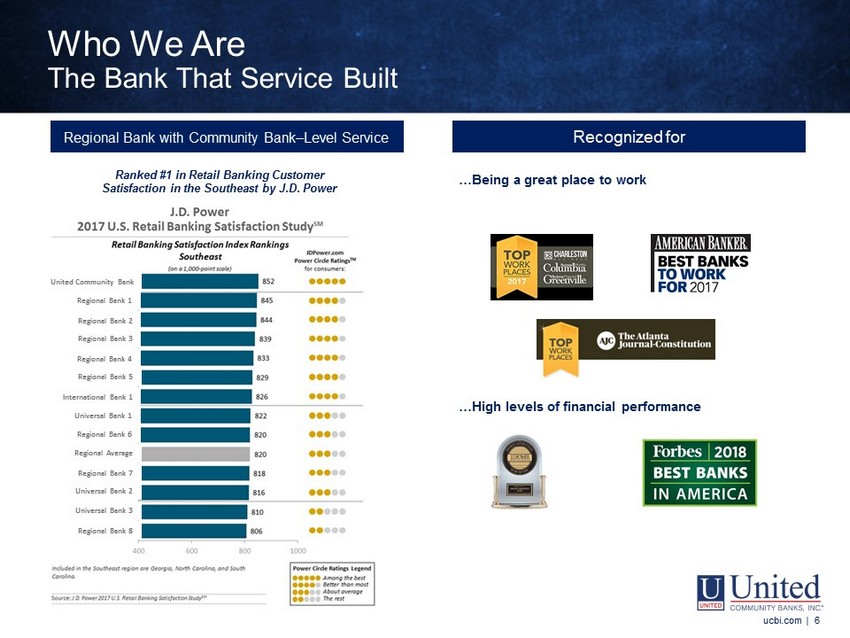
Regional Bank with Community Bank – Level Service Recognized for Ranked #1 in Retail Banking Customer Satisfaction in the Southeast by J.D. Power … Being a great place to work …High levels of financial performance Who We Are The Bank That Service Built ucbi.com | 6 Regional Bank 1 United Community Bank Regional Bank 2 Regional Bank 3 Regional Bank 4 Regional Bank 5 International Bank 1 Universal Bank 1 Regional Bank 6 Regional Average Regional Bank 7 Universal Bank 2 Universal Bank 3 Regional Bank 8
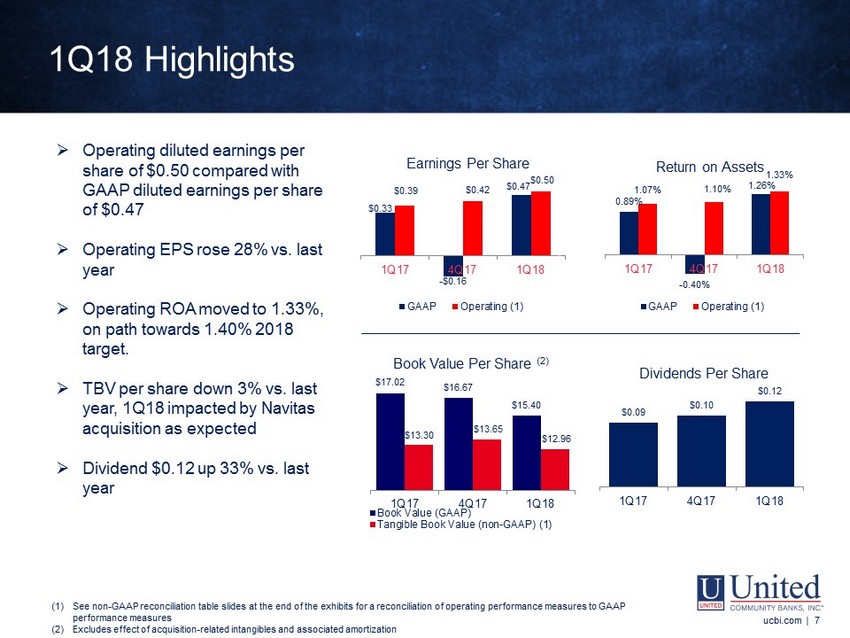
1Q18 Highlights ucbi.com | 7 $17.02 $16.67 $15.40 $13.30 $13.65 $12.96 1Q17 4Q17 1Q18 Book Value Per Share (2) Book Value (GAAP) Tangible Book Value (non-GAAP) (1) $0.33 - $0.16 $0.47 $0.39 $0.42 $0.50 1Q17 4Q17 1Q18 Earnings Per Share GAAP Operating (1) 0.89% - 0.40% 1.26% 1.07% 1.10% 1.33% 1Q17 4Q17 1Q18 Return on Assets GAAP Operating (1) (1) See non - GAAP reconciliation table slides at the end of the exhibits for a reconciliation of operating performance measures to G AAP performance measures ucbi.com | 7 (1) See non - GAAP reconciliation table slides at the end of the exhibits for a reconciliation of operating performance measures to GA AP performance measures (2) Excludes effect of acquisition - related intangibles and associated amortization $0.09 $0.10 $0.12 1Q17 4Q17 1Q18 Dividends Per Share » Operating diluted earnings per share of $0.50 compared with GAAP diluted earnings per share of $0.47 » Operating EPS rose 28% vs. last year » Operating ROA moved to 1.33%, on path towards 1.40% 2018 target. » TBV per share down 3% vs. last year, 1Q18 impacted by Navitas acquisition as expected » Dividend $0.12 up 33% vs. last year
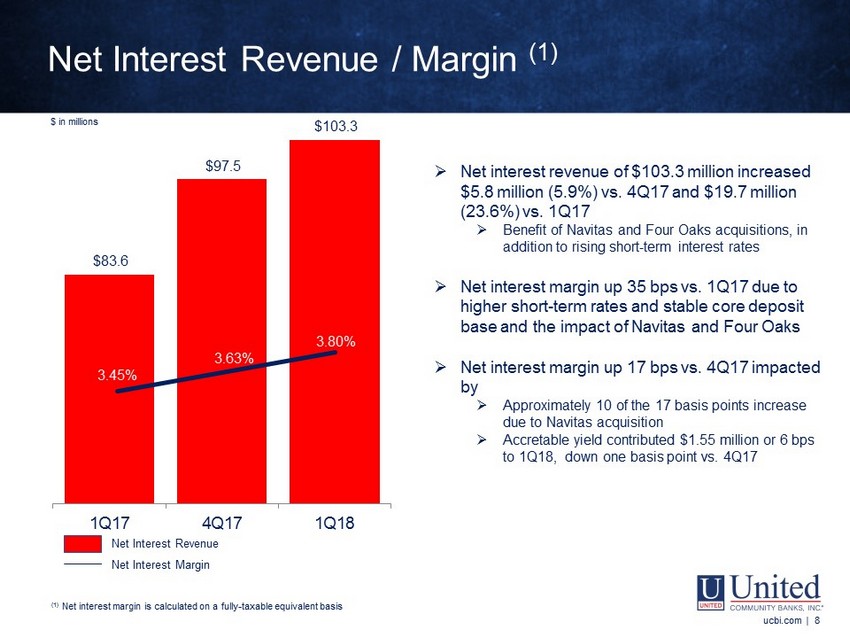
$83.6 $97.5 $103.3 1Q17 4Q17 1Q18 3.45% 3.63% 3.80% ucbi.com | 8 (1) Net interest margin is calculated on a fully taxable equivalent basis (2) E xcludes brokered deposits Net Interest Revenue / Margin (1) ucbi.com | 8 (1) Net interest margin is calculated on a fully - taxable equivalent basis $ in millions Net Interest Revenue Net Interest Margin » Net interest revenue of $103.3 million increased $5.8 million (5.9%) vs. 4Q17 and $19.7 million (23.6%) vs. 1Q17 » Benefit of Navitas and Four Oaks acquisitions, in addition to rising short - term interest rates » Net interest margin up 35 bps vs. 1Q17 due to higher short - term rates and stable core deposit base and the impact of Navitas and Four Oaks » Net interest margin up 17 bps vs. 4Q17 impacted by » Approximately 10 of the 17 basis points increase due to Navitas acquisition » Accretable yield contributed $1.55 million or 6 bps to 1Q18, down one basis point vs. 4Q17
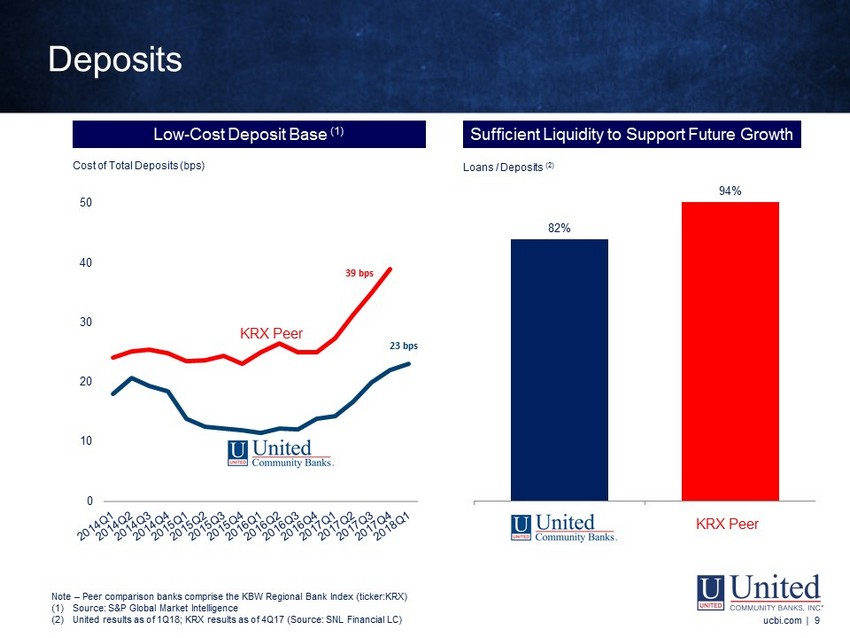
0 10 20 30 40 50 82% 94% Low - Cost Deposit Base (1) Sufficient Liquidity to Support Future Growth Loans / Deposits (2) Cost of Total Deposits (bps) 39 bps 23 bps Deposits KRX Peer ucbi.com | 9 KRX Peer Note – Peer comparison banks comprise the KBW Regional Bank Index (ticker:KRX) (1) Source: S&P Global Market Intelligence (2) United results as of 1Q18; KRX results as of 4Q17 (Source: SNL Financial LC)
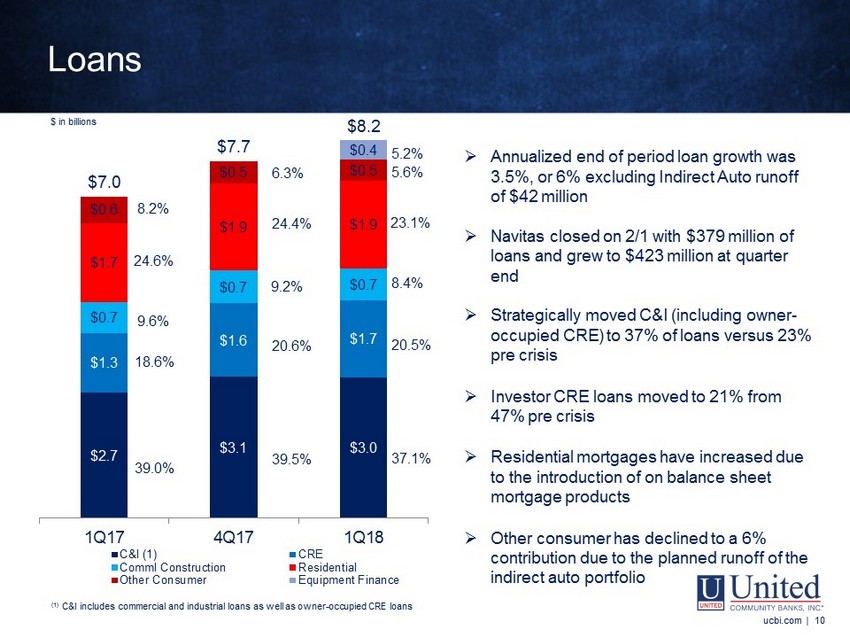
ucbi.com | 10 $2.7 $3.1 $3.0 $1.3 $1.6 $1.7 $0.7 $0.7 $0.7 $1.7 $1.9 $1.9 $0.6 $0.5 $0.5 $0.4 $7.0 $7.7 $8.2 1Q17 4Q17 1Q18 C&I (1) CRE Comml Construction Residential Other Consumer Equipment Finance 24.6% 9.6% 18.6% 39.0% 20.5% 37.1% 8.4% 23.1% 5.6% 20.6% 39.5% 9.2% 24.4% 6.3% 5.2% Loans ucbi.com | 10 $ in billions 8.2% » Annualized end of period loan growth was 3.5 %, or 6% excluding Indirect Auto runoff of $42 million » Navitas closed on 2/1 with $379 million of loans and grew to $423 million at quarter end » Strategically moved C&I (including owner - occupied CRE) to 37% of loans versus 23% pre crisis » Investor CRE loans moved to 21% from 47% pre crisis » Residential mortgages have increased due to the introduction of on balance sheet mortgage products » Other consumer has declined to a 6% contribution due to the planned runoff of the indirect auto portfolio (1) C&I includes commercial and industrial loans as well as owner - occupied CRE loans
ucbi.com | 11 Loan Growth Drivers ucbi.com | 11 » Greater expansion in our metro markets, including our new Myrtle Beach and Raleigh markets » Expansion of our Commercial Banking Solutions (CBS) unit (i.e. deeper penetration and new verticals) » We estimate the Navitas acquisition adds about 200 basis points to our growth rate over time » Continued development of our unique partnership model where the community banks partner with CBS to drive growth » Growth in the mortgage business via expansion into newly acquired markets and with the addition of on - balance sheet adjustable rate products
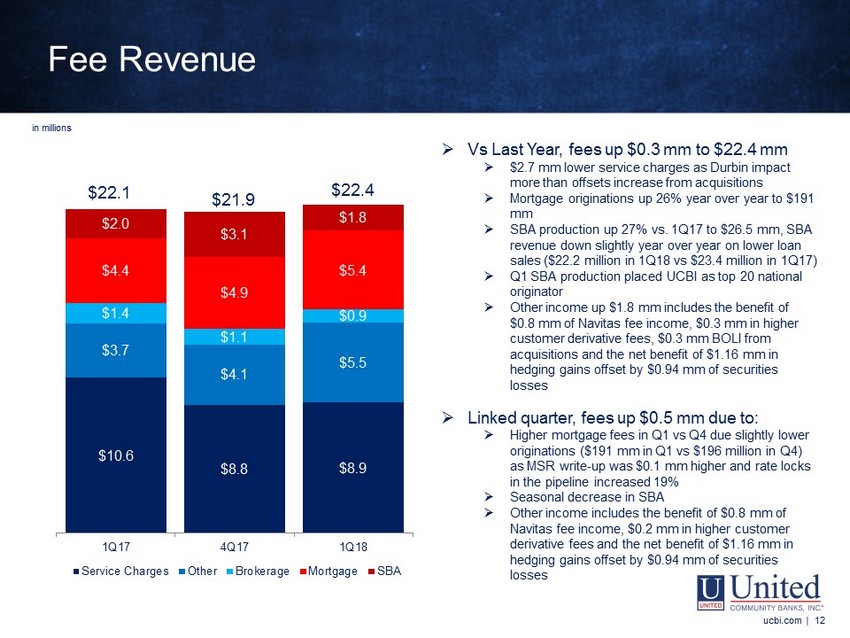
$10.6 $8.8 $8.9 $3.7 $4.1 $5.5 $1.4 $1.1 $0.9 $4.4 $4.9 $5.4 $2.0 $3.1 $1.8 1Q17 4Q17 1Q18 Service Charges Other Brokerage Mortgage SBA ucbi.com | 12 Fee Revenue ucbi.com | 12 in millions » Vs Last Year, fees up $0.3 mm to $22.4 mm » $2.7 mm lower service charges as Durbin impact more than offsets increase from acquisitions » Mortgage originations up 26% year over year to $191 mm » SBA production up 27% vs. 1Q17 to $26.5 mm, SBA revenue down slightly year over year on lower loan sales ($22.2 million in 1Q18 vs $23.4 million in 1Q17) » Q1 SBA production placed UCBI as top 20 national originator » Other income up $1.8 mm includes the benefit of $0.8 mm of Navitas fee income, $0.3 mm in higher customer derivative fees, $0.3 mm BOLI from acquisitions and the net benefit of $1.16 mm in hedging gains offset by $0.94 mm of securities losses » Linked quarter, fees up $0.5 mm due to: » Higher mortgage fees in Q1 vs Q4 due slightly lower originations ($191 mm in Q1 vs $196 million in Q4) as MSR write - up was $0.1 mm higher and rate locks in the pipeline increased 19% » Seasonal decrease in SBA » Other income includes the benefit of $0.8 mm of Navitas fee income, $0.2 mm in higher customer derivative fees and the net benefit of $1.16 mm in hedging gains offset by $0.94 mm of securities losses $22.1 $21.9 $22.4
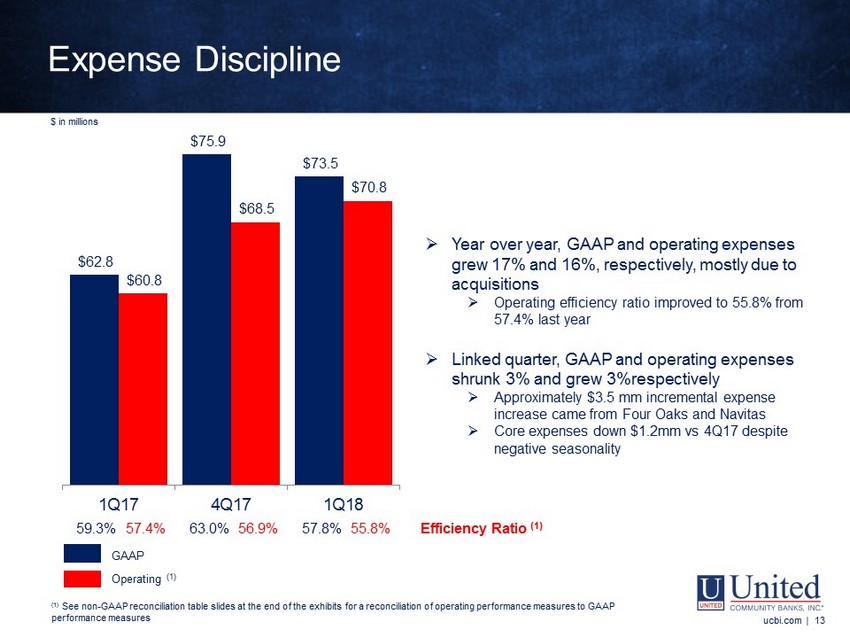
59.3% 63.0% 57.8% 57.4% 56.9% 55.8% 60.78% 59.27% 59.27% 57.79% 56.18% 56.18% $62.8 $75.9 $73.5 $60.8 $68.5 $70.8 1Q17 4Q17 1Q18 ucbi.com | 13 (1) Net interest margin is calculated on a fully taxable equivalent basis (2) E xcludes brokered deposits Expense Discipline ucbi.com | 13 GAAP Operating (1) (1) See non - GAAP reconciliation table slides at the end of the exhibits for a reconciliation of operating performance measures to G AAP performance measures » Year over year, GAAP and operating expenses grew 17% and 16%, respectively, mostly due to acquisitions » Operating efficiency ratio improved to 55.8% from 57.4% last year » Linked quarter, GAAP and operating expenses shrunk 3% and grew 3%respectively » Approximately $3.5 mm incremental expense increase came from Four Oaks and Navitas » Core expenses down $1.2mm vs 4Q17 despite negative seasonality Efficiency Ratio (1) $ in millions
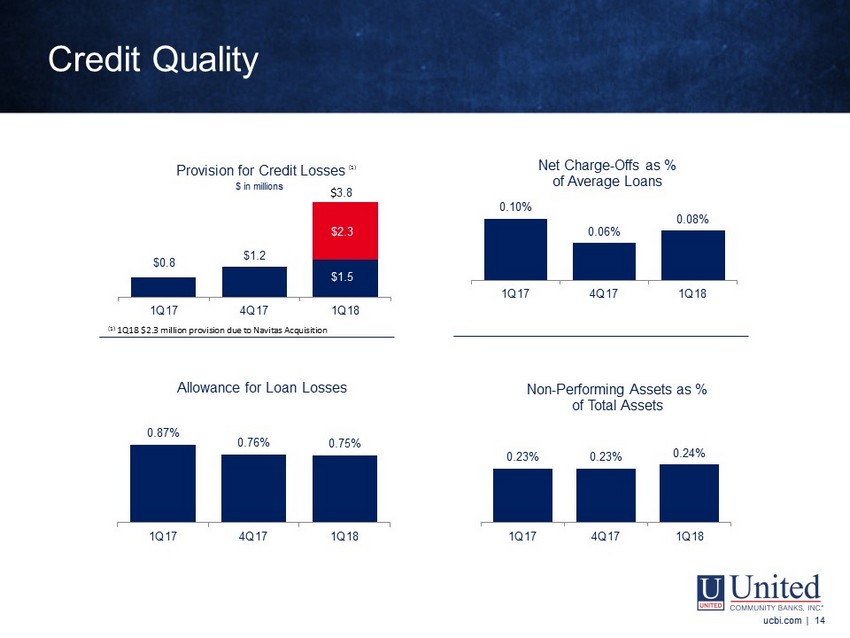
Credit Quality ucbi.com | 14 (1) See non - GAAP reconciliation table slides at the end of the exhibits for a reconciliation of operating performance measures to G AAP performance measures ucbi.com | 14 0.10% 0.06% 0.08% 1Q17 4Q17 1Q18 Net Charge - Offs as % of Average Loans 0.23% 0.23% 0.24% 1Q17 4Q17 1Q18 Non - Performing Assets as % of Total Assets $0.8 $1.2 $1.5 $ 2.3 1Q17 4Q17 1Q18 Provision for Credit Losses $ in millions $ 3.8 0.87% 0.76% 0.75% 1Q17 4Q17 1Q18 Allowance for Loan Losses (1) 1Q18 $2.3 million provision due to Navitas Acquisition (1)
ucbi.com | 15 Key Strengths ucbi.com | 15 » Culture and business model that attracts both bankers and potential acquisition partners » Positioned well in many of the South's fastest - growing markets » Superior customer service helps drive great core deposit growth » Well - developed credit model to drive consistent performance through cycles » Liquid balance sheet and strong capital offer flexibility in a rising rate environment
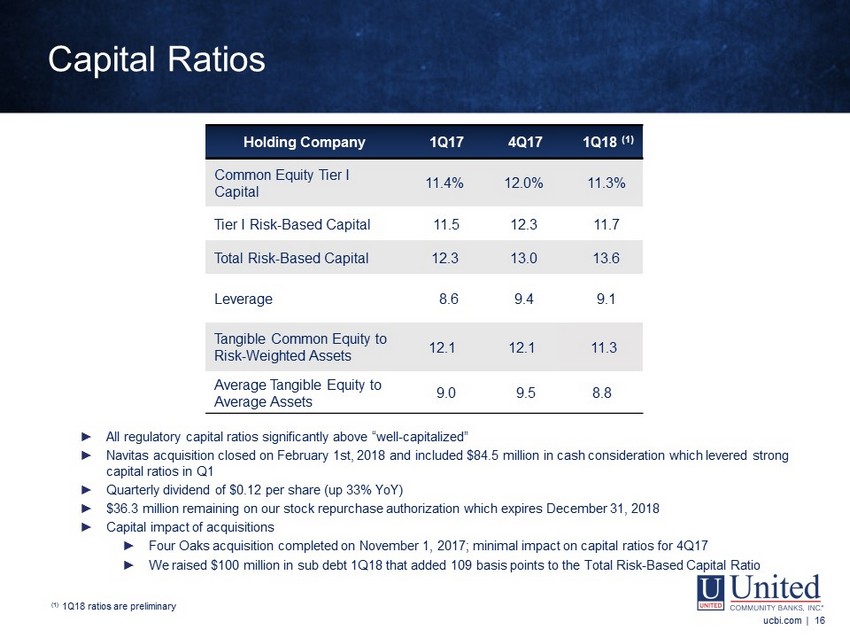
ucbi.com | 16 Holding Company 1Q17 4Q17 1Q18 (1) Common Equity Tier I Capital 11.4% 12.0% 11.3% Tier I Risk - Based Capital 11.5 12.3 11.7 Total Risk - Based Capital 12.3 13.0 13.6 Leverage 8.6 9.4 9.1 Tangible Common Equity to Risk - Weighted Assets 12.1 12.1 11.3 Average Tangible Equity to Average Assets 9.0 9.5 8.8 ► All regulatory capital ratios significantly above “well - capitalized ” ► Navitas acquisition closed on February 1st, 2018 and included $84.5 million in cash consideration which levered strong capital ratios in Q1 ► Quarterly dividend of $0.12 per share (up 33% YoY ) ► $36.3 million remaining on our stock repurchase authorization which expires December 31, 2018 ► Capital impact of acquisitions ► Four Oaks acquisition completed on November 1, 2017; minimal impact on capital ratios for 4Q17 ► We raised $100 million in sub debt 1Q18 that added 109 basis points to the Total Risk - Based Capital Ratio ucbi.com | 16 Capital Ratios (1) 1Q18 ratios are preliminary
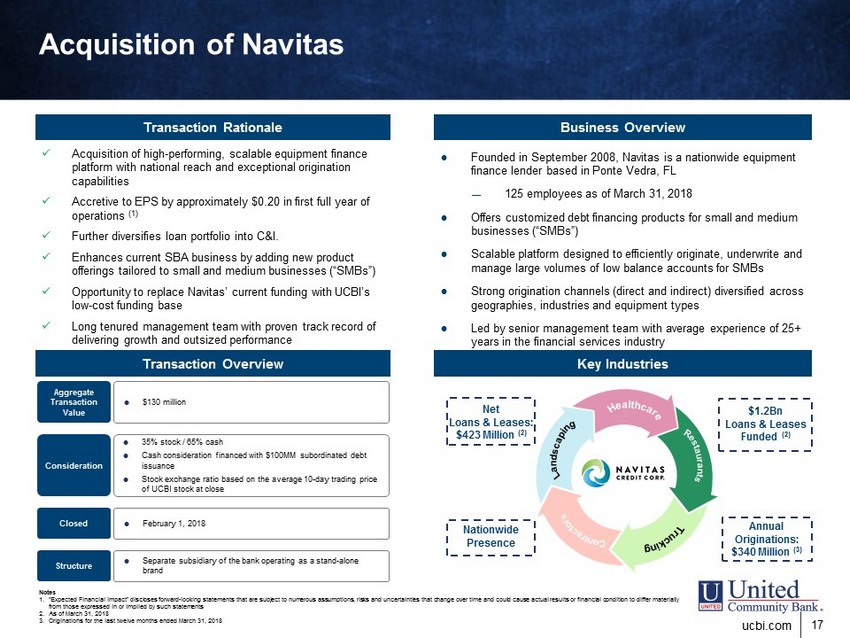
17 ucbi.com Acquisition of Navitas Business Overview Notes 1. "Expected Financial Impact" discloses forward - looking statements that are subject to numerous assumptions, risks and uncertainti es that change over time and could cause actual results or financial condition to differ materially from those expressed in or implied by such statements 2. As of March 31, 2018 3. Originations for the last twelve months ended March 31, 2018 Key Industries ; Founded in September 2008, Navitas is a nationwide equipment finance lender based in Ponte Vedra, FL — 125 employees as of March 31, 2018 ; Offers customized debt financing products for small and medium businesses (“SMBs”) ; Scalable platform designed to efficiently originate, underwrite and manage large volumes of low balance accounts for SMBs ; Strong origination channels (direct and indirect) diversified across geographies, industries and equipment types ; Led by senior management team with average experience of 25+ years in the financial services industry Transaction Rationale Net Loans & Leases: $423 Million (2) Nationwide Presence Annual Originations: $340 Million (3) $1.2Bn Loans & Leases Funded (2) Transaction Overview x Acquisition of high - performing, scalable equipment finance platform with national reach and exceptional origination capabilities x Accretive to EPS by approximately $0.20 in first full year of operations (1) x Further diversifies loan portfolio into C&I. x Enhances current SBA business by adding new product offerings tailored to small and medium businesses (“SMBs”) x Opportunity to replace Navitas’ current funding with UCBI’s low - cost funding base x Long tenured management team with proven track record of delivering growth and outsized performance Aggregate Transaction Value ; $130 million Consideration ; 35% stock / 65% cash ; Cash consideration financed with $100MM subordinated debt issuance ; Stock exchange ratio based on the average 10 - day trading price of UCBI stock at close Closed ; February 1, 2018 Structure ; Separate subsidiary of the bank operating as a stand - alone brand
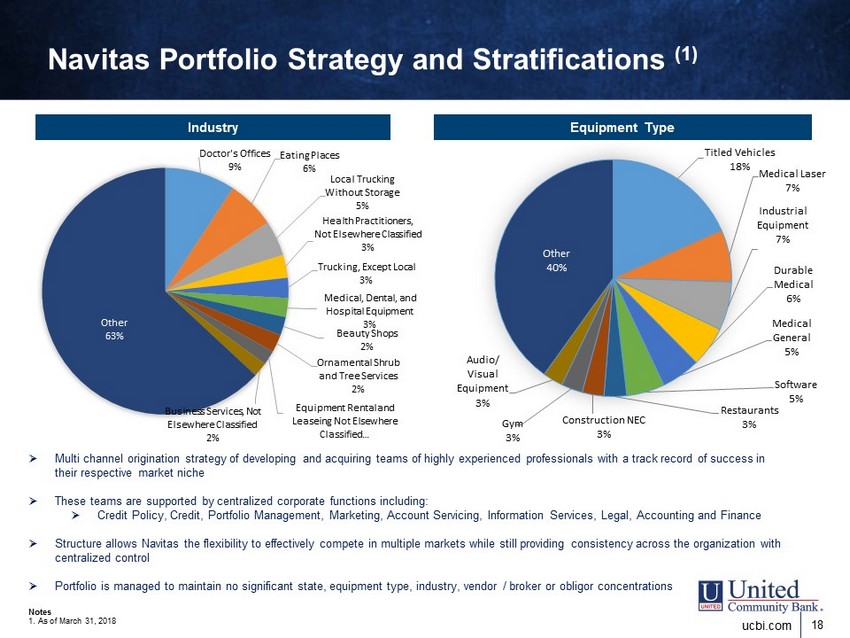
18 ucbi.com Navitas Portfolio Strategy and Stratifications (1) » Multi channel origination strategy of developing and acquiring teams of highly experienced professionals with a track record of success in their respective market niche » These teams are supported by centralized corporate functions including: » Credit Policy, Credit, Portfolio Management, Marketing, Account Servicing, Information Services, Legal, Accounting and Financ e » Structure allows Navitas the flexibility to effectively compete in multiple markets while still providing consistency across the organization with centralized control » Portfolio is managed to maintain no significant state, equipment type, industry, vendor / broker or obligor concentrations Notes 1. As of March 31, 2018 Equipment Type Industry Titled Vehicles 18% Medical Laser 7% Industrial Equipment 7% Durable Medical 6% Medical General 5% Software 5% Restaurants 3% Construction NEC 3% Gym 3% Audio/ Visual Equipment 3% Other 40% Doctor's Offices 9% Eating Places 6% Local Trucking Without Storage 5% Health Practitioners, Not Elsewhere Classified 3% Trucking, Except Local 3% Medical, Dental, and Hospital Equipment 3% Beauty Shops 2% Ornamental Shrub and Tree Services 2% Equipment Rental and Leaseing Not Elsewhere Classified … Business Services, Not Elsewhere Classified 2% Other 63%
2018 INVESTOR PRESENTATION Exhibits FIRST QUARTER 2018 April 24, 2018
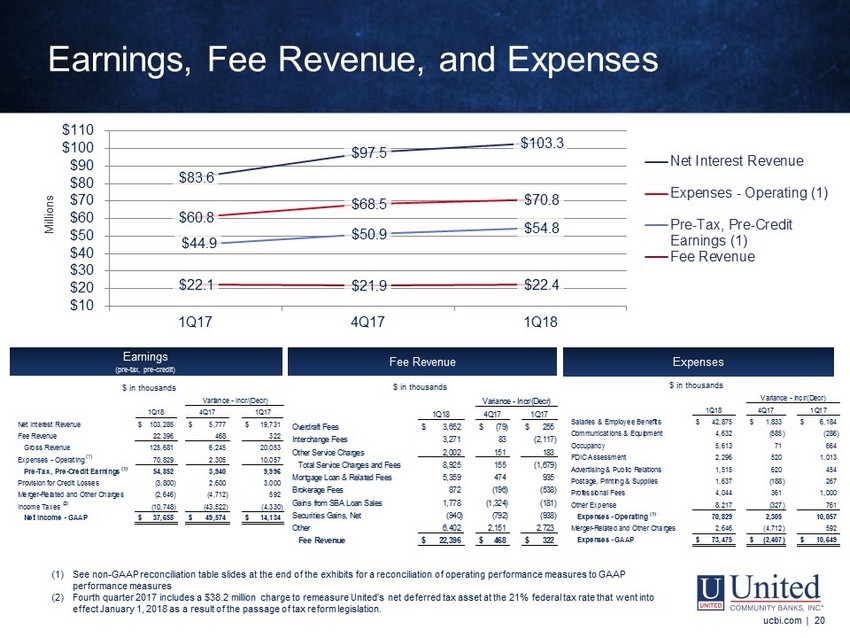
$83.6 $97.5 $103.3 $60.8 $68.5 $70.8 $44.9 $50.9 $54.8 $22.1 $21.9 $22.4 $10 $20 $30 $40 $50 $60 $70 $80 $90 $100 $110 1Q17 4Q17 1Q18 Net Interest Revenue Expenses - Operating (1) Pre-Tax, Pre-Credit Earnings (1) Fee Revenue ucbi.com | 20 1Q18 4Q17 1Q17 Overdraft Fees 3,652$ (79)$ 255$ Interchange Fees 3,271 83 (2,117) Other Service Charges 2,002 151 183 Total Service Charges and Fees 8,925 155 (1,679) Mortgage Loan & Related Fees 5,359 474 935 Brokerage Fees 872 (196) (538) Gains from SBA Loan Sales 1,778 (1,324) (181) Securities Gains, Net (940) (792) (938) Other 6,402 2,151 2,723 Fee Revenue 22,396$ 468$ 322$ Variance - Incr/(Decr) 1Q18 4Q17 1Q17 Net Interest Revenue 103,285$ 5,777$ 19,731$ Fee Revenue 22,396 468 322 Gross Revenue 125,681 6,245 20,053 Expenses - Operating (1) 70,829 2,305 10,057 Pre-Tax, Pre-Credit Earnings (1) 54,852 3,940 9,996 Provision for Credit Losses (3,800) 2,600 3,000 Merger-Related and Other Charges (2,646) (4,712) 592 Income Taxes (2) (10,748) (43,522) (4,330) Net Income - GAAP 37,658$ 49,574$ 14,134$ Variance - Incr/(Decr) $ in thousands $ in thousands $ in thousands Expenses Earnings (pre - tax, pre - credit) Fee Revenue Millions (1) See non - GAAP reconciliation table slides at the end of the exhibits for a reconciliation of operating performance measures to G AAP performance measures Earnings, Fee Revenue, and Expenses ucbi.com | 20 (1) See non - GAAP reconciliation table slides at the end of the exhibits for a reconciliation of operating performance measures to GA AP performance measures (2) Fourth quarter 2017 includes a $38.2 million charge to remeasure United’s net deferred tax asset at the 21% federal tax rate tha t went into effect January 1, 2018 as a result of the passage of tax reform legislation. 1Q18 4Q17 1Q17 Salaries & Employee Benefits 42,875$ 1,833$ 6,184$ Communications & Equipment 4,632 (585) (286) Occupancy 5,613 71 664 FDIC Assessment 2,296 520 1,013 Advertising & Public Relations 1,515 620 454 Postage, Printing & Supplies 1,637 (188) 267 Professional Fees 4,044 361 1,000 Other Expense 8,217 (327) 761 Expenses - Operating (1) 70,829 2,305 10,057 Merger-Related and Other Charges 2,646 (4,712) 592 Expenses - GAAP 73,475$ (2,407)$ 10,649$ Variance - Incr/(Decr)
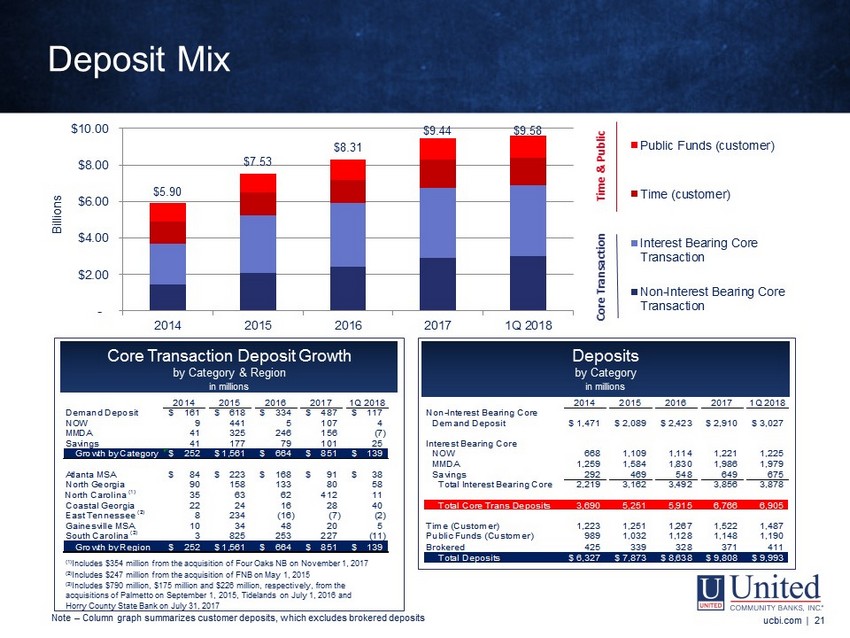
2014 2015 2016 2017 1Q 2018 2014 2015 2016 2017 1Q 2018 Demand Deposit 161$ 618$ 334$ 487$ 117$ Non-Interest Bearing Core NOW 9 441 5 107 4 Demand Deposit 1,471$ 2,089$ 2,423$ 2,910$ 3,027$ MMDA 41 325 246 156 (7) Savings 41 177 79 101 25 Interest Bearing Core Growth by Category 252$ 1,561$ 664$ 851$ 139$ Total CommercialNOW 668 1,109 1,114 1,221 1,225 MMDA 1,259 1,584 1,830 1,986 1,979 Atlanta MSA 84$ 223$ 168$ 91$ 38$ Savings 292 469 548 649 675 North Georgia 90 158 133 80 58 Total Interest Bearing Core 2,219 3,162 3,492 3,856 3,878 North Carolina (1) 35 63 62 412 11 Coastal Georgia 22 24 16 28 40 Total Core Trans Deposits 3,690 5,251 5,915 6,766 6,905 East Tennessee (2) 8 234 (16) (7) (2) Gainesville MSA 10 34 48 20 5 Time (Customer) 1,223 1,251 1,267 1,522 1,487 South Carolina (3) 3 825 253 227 (11) Public Funds (Customer) 989 1,032 1,128 1,148 1,190 Growth by Region 252$ 1,561$ 664$ 851$ 139$ Brokered 425 339 328 371 411 Total LoansTotal Deposits 6,327$ 7,873$ 8,638$ 9,808$ 9,993$ ucbi.com | 21 NOTE - Certain prior period amounts in the loans by category table have been reclassified to conform to the current presentation Deposit Mix $5.90 $7.53 $8.31 $9.44 $9.58 - $2.00 $4.00 $6.00 $8.00 $10.00 2014 2015 2016 2017 1Q 2018 Billions Public Funds (customer) Time (customer) Interest Bearing Core Transaction Non-Interest Bearing Core Transaction Time & Public Core Transaction Core Transaction Deposit Growth by Category & Region in millions Deposits by Category in millions (1) Includes $354 million from the acquisition of Four Oaks NB on November 1, 2017 (2) Includes $247 million from the acquisition of FNB on May 1, 2015 (3) Includes $790 million, $175 million and $226 million, respectively, from the acquisitions of Palmetto on September 1, 2015, Tidelands on July 1, 2016 and Horry County State Bank on July 31, 2017 ucbi.com | 21 Note – Column graph summarizes customer deposits, which excludes brokered deposits
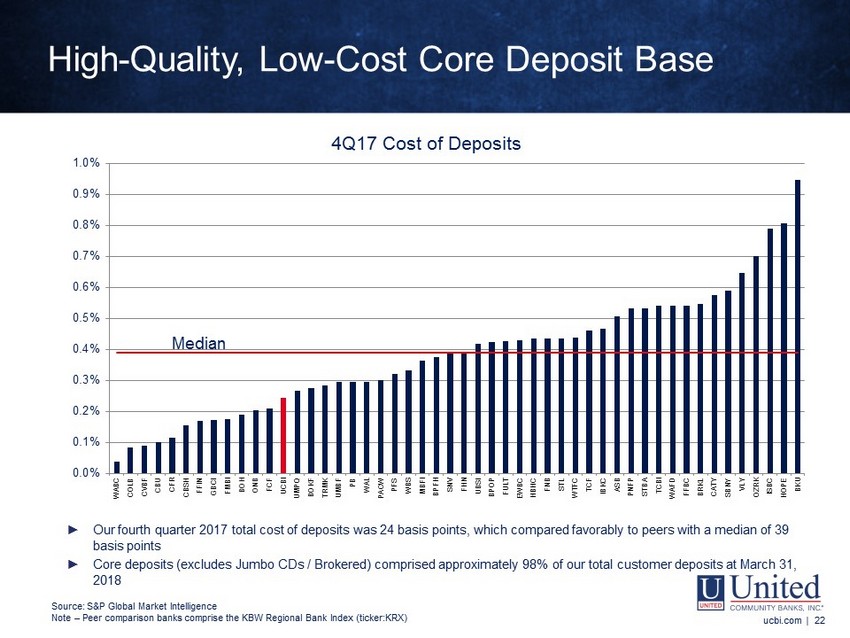
Note: Peer comparison banks comprise the KBW Regional Bank Index (ticker: KRX) ucbi.com | 22 0.0% 0.1% 0.2% 0.3% 0.4% 0.5% 0.6% 0.7% 0.8% 0.9% 1.0% WABC COLB CVBF CBU CFR CBSH FFIN GBCI FMBI BOH ONB FCF UCBI UMPQ BOKF TRMK UMBF PB WAL PACW PFS WBS MBFI BPFH SNV FHN UBSI BPOP FULT EWBC HBHC FNB STL WTFC TCF IBKC ASB PNFP STBA TCBI WAFD FFBC BRKL CATY SBNY VLY OZRK ISBC HOPE BKU 4Q17 Cost of Deposits Median ► Our fourth quarter 2017 total cost of deposits was 24 basis points, which compared favorably to peers with a median of 39 basis points ► Core deposits (excludes Jumbo CDs / Brokered) comprised approximately 98% of our total customer deposits at March 31, 2018 High - Quality, Low - Cost Core Deposit Base ucbi.com | 22 Source: S&P Global Market Intelligence Note – Peer comparison banks comprise the KBW Regional Bank Index (ticker:KRX)
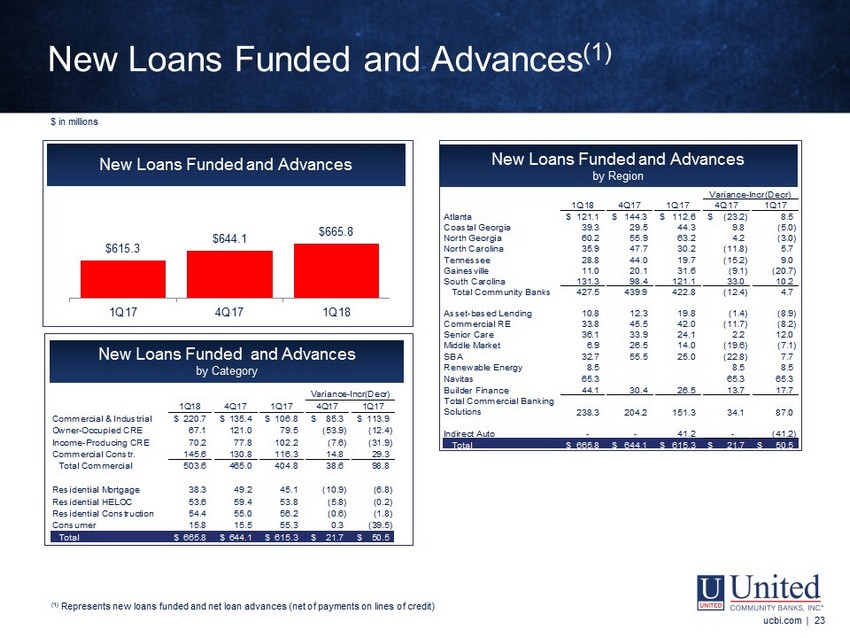
ucbi.com | 23 1Q18 4Q17 1Q17 4Q17 1Q17 Commercial & Industrial 220.7$ 135.4$ 106.8$ 85.3$ 113.9$ Owner-Occupied CRE 67.1 121.0 79.5 (53.9) (12.4) Income-Producing CRE 70.2 77.8 102.2 (7.6) (31.9) Commercial Constr. 145.6 130.8 116.3 14.8 29.3 Total Commercial 503.6 465.0 404.8 38.6 98.8 Residential Mortgage 38.3 49.2 45.1 (10.9) (6.8) Residential HELOC 53.6 59.4 53.8 (5.8) (0.2) Residential Construction 54.4 55.0 56.2 (0.6) (1.8) Consumer 15.8 15.5 55.3 0.3 (39.5) Total 665.8$ 644.1$ 615.3$ 21.7$ 50.5$ Variance-Incr(Decr) NOTE - Certain prior period amounts have been reclassified to conform to the current presentation (1) Represents new loans funded and net loan advances (net of payments on lines of credit) New Loans Funded and Advances $615.3 $644.1 $665.8 1Q17 4Q17 1Q18 New Loans Funded and Advances by Region New Loans Funded and Advances by Category 1Q18 4Q17 1Q17 4Q17 1Q17 Atlanta 121.1$ 144.3$ 112.6$ (23.2)$ 8.5 Coastal Georgia 39.3 29.5 44.3 9.8 (5.0) North Georgia 60.2 55.9 63.2 4.2 (3.0) North Carolina 35.9 47.7 30.2 (11.8) 5.7 Tennessee 28.8 44.0 19.7 (15.2) 9.0 Gainesville 11.0 20.1 31.6 (9.1) (20.7) South Carolina 131.3 98.4 121.1 33.0 10.2 Total Community Banks 427.5 439.9 422.8 (12.4) 4.7 Asset-based Lending 10.8 12.3 19.8 (1.4) (8.9) Commercial RE 33.8 45.5 42.0 (11.7) (8.2) Senior Care 36.1 33.9 24.1 2.2 12.0 Middle Market 6.9 26.5 14.0 (19.6) (7.1) SBA 32.7 55.5 25.0 (22.8) 7.7 Renewable Energy 8.5 8.5 8.5 Navitas 65.3 65.3 65.3 Builder Finance 44.1 30.4 26.5 13.7 17.7 238.3 204.2 151.3 34.1 87.0 Indirect Auto - - 41.2 - (41.2) Total 665.8$ 644.1$ 615.3$ 21.7$ 50.5$ Variance-Incr(Decr) Total Commercial Banking Solutions New Loans Funded and Advances (1) ucbi.com | 23 (1) Represents new loans funded and net loan advances (net of payments on lines of credit) $ in millions
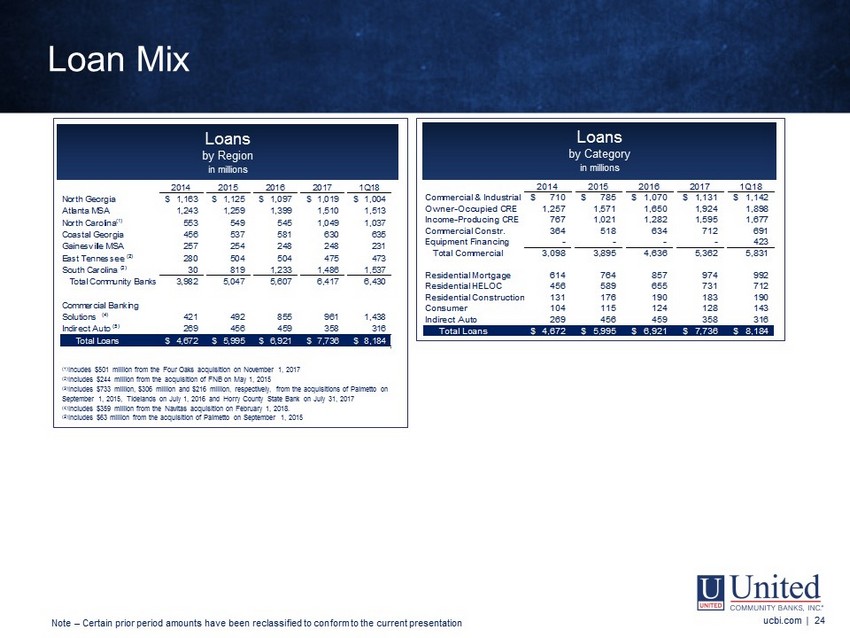
2014 2015 2016 2017 1Q18 North Georgia 1,163$ 1,125$ 1,097$ 1,019$ 1,004$ Atlanta MSA 1,243 1,259 1,399 1,510 1,513 North Carolina(1) 553 549 545 1,049 1,037 Coastal Georgia 456 537 581 630 635 Gainesville MSA 257 254 248 248 231 East Tennessee (2) 280 504 504 475 473 South Carolina (3) 30 819 1,233 1,486 1,537 Total Community Banks 3,982 5,047 5,607 6,417 6,430 421 492 855 961 1,438 Indirect Auto (5) 269 456 459 358 316 Total Loans 4,672$ 5,995$ 6,921$ 7,736$ 8,184$ Commercial Banking Solutions (4) 2014 2015 2016 2017 1Q18 Commercial & Industrial 710$ 785$ 1,070$ 1,131$ 1,142$ Owner-Occupied CRE 1,257 1,571 1,650 1,924 1,898 Income-Producing CRE 767 1,021 1,282 1,595 1,677 Commercial Constr. 364 518 634 712 691 Equipment Financing - - - - 423 Total Commercial 3,098 3,895 4,636 5,362 5,831 Residential Mortgage 614 764 857 974 992 Residential HELOC 456 589 655 731 712 Residential Construction 131 176 190 183 190 Consumer 104 115 124 128 143 Indirect Auto 269 456 459 358 316 Total Loans 4,672$ 5,995$ 6,921$ 7,736$ 8,184$ ucbi.com | 24 (1) Incudes $501 million from the Four Oaks acquisition on November 1, 2017 (2) Includes $244 million from the acquisition of FNB on May 1, 2015 (3) Includes $733 million, $306 million and $216 million, respectively, from the acquisitions of Palmetto on September 1, 2015, Tidelands on July 1, 2016 and Horry County State Bank on July 31, 2017 (4) Includes $359 million from the Navitas acquisition on February 1, 2018. (5) Includes $63 million from the acquisition of Palmetto on September 1, 2015 Loans by Category in millions Loans by Region in millions NOTE - Certain prior period amounts in the loans by category table have been reclassified to conform to the current presentation Loan Mix ucbi.com | 24 Note – Certain prior period amounts have been reclassified to conform to the current presentation
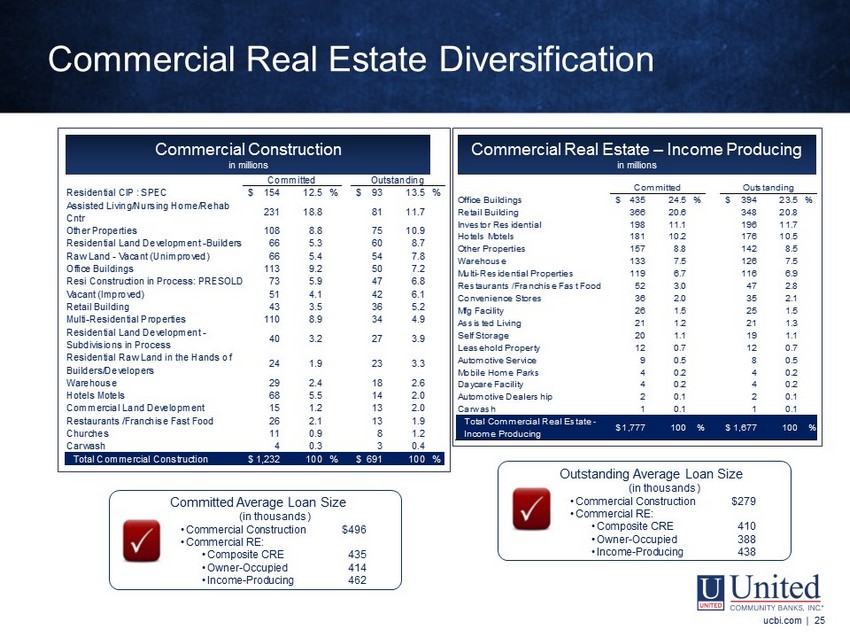
Commercial Real Estate Diversification ucbi.com | 25 Residential CIP : SPEC 154$ 12.5 % 93$ 13.5 % Assisted Living/Nursing Home/Rehab Cntr 231 18.8 81 11.7 Other Properties 108 8.8 75 10.9 Residential Land Development -Builders 66 5.3 60 8.7 Raw Land - Vacant (Unimproved) 66 5.4 54 7.8 Office Buildings 113 9.2 50 7.2 Resi Construction in Process: PRESOLD 73 5.9 47 6.8 Vacant (Improved) 51 4.1 42 6.1 Retail Building 43 3.5 36 5.2 Multi-Residential Properties 110 8.9 34 4.9 Residential Land Development - Subdivisions in Process 40 3.2 27 3.9 Residential Raw Land in the Hands of Builders/Developers 24 1.9 23 3.3 Warehouse 29 2.4 18 2.6 Hotels Motels 68 5.5 14 2.0 Commercial Land Development 15 1.2 13 2.0 Restaurants /Franchise Fast Food 26 2.1 13 1.9 Churches 11 0.9 8 1.2 Carwash 4 0.3 3 0.4 Total Commercial Construction 1,232$ 100 % 691$ 100 % OutstandingCommitted Commercial Real Estate – Income Producing in millions Commercial Construction in millions Office Buildings 435$ 24.5 % 394$ 23.5 % Retail Building 366 20.6 348 20.8 Investor Residential 198 11.1 196 11.7 Hotels Motels 181 10.2 176 10.5 Other Properties 157 8.8 142 8.5 Warehouse 133 7.5 126 7.5 Multi-Residential Properties 119 6.7 116 6.9 Restaurants /Franchise Fast Food 52 3.0 47 2.8 Convenience Stores 36 2.0 35 2.1 Mfg Facility 26 1.5 25 1.5 Assisted Living 21 1.2 21 1.3 Self Storage 20 1.1 19 1.1 Leasehold Property 12 0.7 12 0.7 Automotive Service 9 0.5 8 0.5 Mobile Home Parks 4 0.2 4 0.2 Daycare Facility 4 0.2 4 0.2 Automotive Dealership 2 0.1 2 0.1 Carwash 1 0.1 1 0.1 Total Commercial Real Estate - Income Producing 1,777$ 100 % 1,677$ 100 % Committed Outstanding Outstanding Average Loan Size (in thousands ) • Commercial Construction $279 • Commercial RE: • Composite CRE 410 • Owner - Occupied 388 • Income - Producing 438 Committed Average Loan Size (in thousands ) • Commercial Construction $496 • Commercial RE: • Composite CRE 435 • Owner - Occupied 414 • Income - Producing 462 ucbi.com | 25
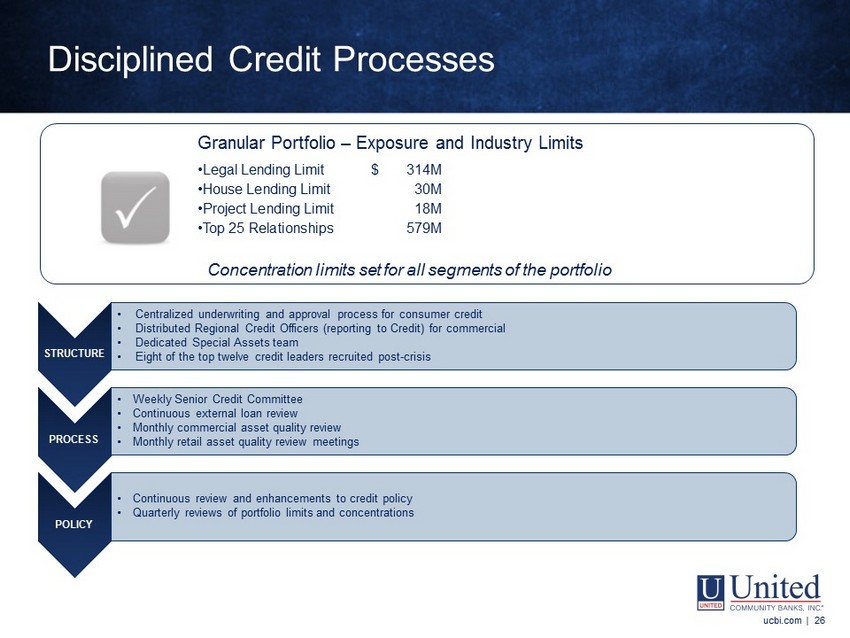
ucbi.com | 26 Granular Portfolio – Exposure and Industry Limits • Legal Lending Limit $ 314M • House Lending Limit 30M • Project Lending Limit 18M • Top 25 Relationships 579M Concentration limits set for all segments of the portfolio Disciplined Credit Processes ucbi.com | 26 STRUCTURE • Centralized underwriting and approval process for consumer credit • Distributed Regional Credit Officers (reporting to Credit) for commercial • Dedicated Special Assets team • Eight of the top twelve credit leaders recruited post - crisis PROCESS • Weekly Senior Credit Committee • Continuous external loan review • Monthly commercial asset quality review • Monthly retail asset quality review meetings POLICY • Continuous review and enhancements to credit policy • Quarterly reviews of portfolio limits and concentrations
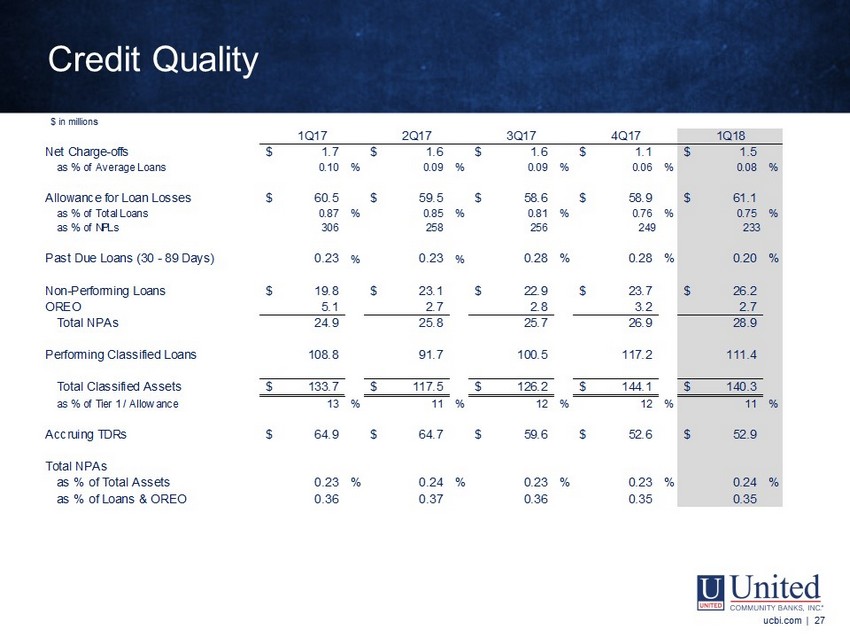
Net Charge-offs 1.7$ 1.6$ 1.6$ 1.1$ 1.5$ as % of Average Loans 0.10 % 0.09 % 0.09 % 0.06 % 0.08 % Allowance for Loan Losses 60.5$ 59.5$ 58.6$ 58.9$ 61.1$ as % of Total Loans 0.87 % 0.85 % 0.81 % 0.76 % 0.75 % as % of NPLs 306 258 256 249 233 Past Due Loans (30 - 89 Days) 0.23 % 0.23 % 0.28 % 0.28 % 0.20 % Non-Performing Loans 19.8$ 23.1$ 22.9$ 23.7$ 26.2$ OREO 5.1 2.7 2.8 3.2 2.7 Total NPAs 24.9 25.8 25.7 26.9 28.9 Performing Classified Loans 108.8 91.7 100.5 117.2 111.4 Total Classified Assets 133.7$ 117.5$ 126.2$ 144.1$ 140.3$ as % of Tier 1 / Allowance 13 % 11 % 12 % 12 % 11 % Accruing TDRs 64.9$ 64.7$ 59.6$ 52.6$ 52.9$ Total NPAs as % of Total Assets 0.23 % 0.24 % 0.23 % 0.23 % 0.24 % as % of Loans & OREO 0.36 0.37 0.36 0.35 0.35 1Q17 4Q172Q17 3Q17 1Q18 $ in millions ucbi.com | 27 Credit Quality ucbi.com | 27
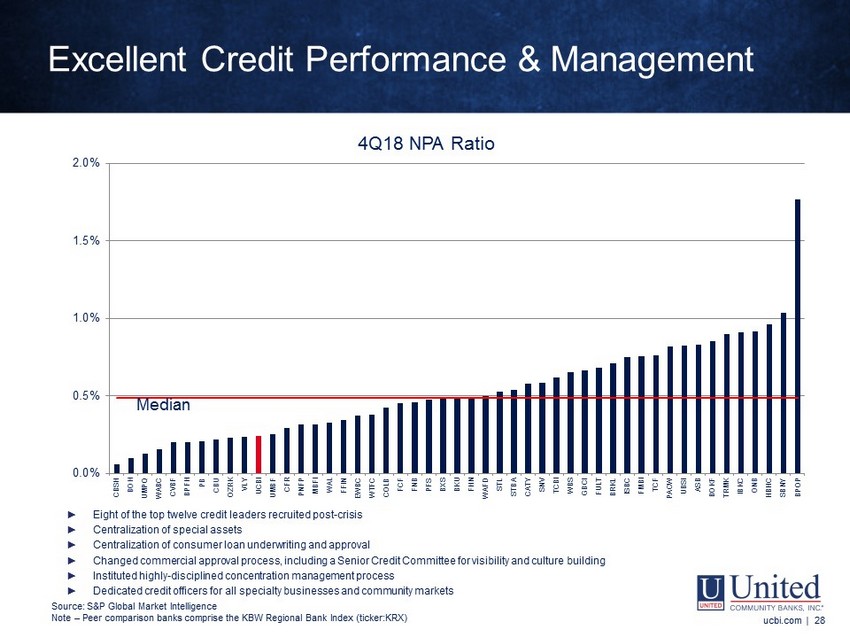
Note: Peer comparison banks comprise the KBW Regional Bank Index (ticker: KRX) Excellent Credit Performance & Management ucbi.com | 28 0.0% 0.5% 1.0% 1.5% 2.0% CBSH BOH UMPQ WABC CVBF BPFH PB CBU OZRK VLY UCBI UMBF CFR PNFP MBFI WAL FFIN EWBC WTFC COLB FCF FNB PFS BXS BKU FHN WAFD STL STBA CATY SNV TCBI WBS GBCI FULT BRKL ISBC FMBI TCF PACW UBSI ASB BOKF TRMK IBKC ONB HBHC SBNY BPOP 4Q18 NPA Ratio Median ► Eight of the top twelve credit leaders recruited post - crisis ► Centralization of special assets ► Centralization of consumer loan underwriting and approval ► Changed commercial approval process, including a Senior Credit Committee for visibility and culture building ► Instituted highly - disciplined concentration management process ► Dedicated credit officers for all specialty businesses and community markets ucbi.com | 28 Source: S&P Global Market Intelligence Note – Peer comparison banks comprise the KBW Regional Bank Index (ticker:KRX)
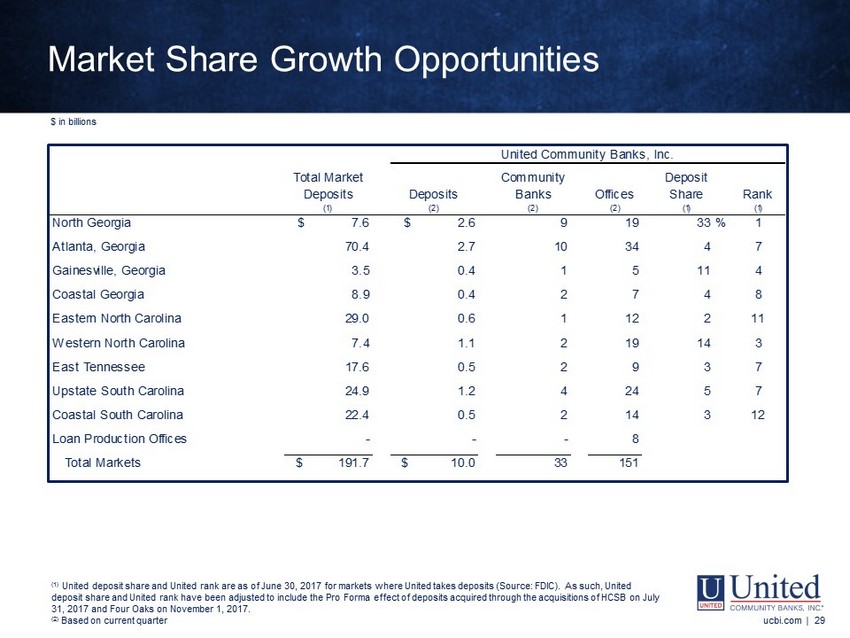
ucbi.com | 29 (1) (2) (2) (2) (1) (1) North Georgia $ 7.6 $ 2.6 9 19 33 % 1 Atlanta, Georgia 70.4 2.7 10 34 4 7 Gainesville, Georgia 3.5 0.4 1 5 11 4 Coastal Georgia 8.9 0.4 2 7 4 8 Eastern North Carolina 29.0 0.6 1 12 2 11 Western North Carolina 7.4 1.1 2 19 14 3 East Tennessee 17.6 0.5 2 9 3 7 Upstate South Carolina 24.9 1.2 4 24 5 7 Coastal South Carolina 22.4 0.5 2 14 3 12 Loan Production Offices - - - 8 Total Markets $ 191.7 $ 10.0 33 151 Rank United Community Banks, Inc. Deposit ShareOffices Community BanksDeposits Total Market Deposits Market Share Growth Opportunities ucbi.com | 29 (1) United deposit share and United rank are as of June 30, 2017 for markets where United takes deposits (Source: FDIC). As such, U nited deposit share and United rank have been adjusted to include the Pro Forma effect of deposits acquired through the acquisition s o f HCSB on July 31, 2017 and Four Oaks on November 1, 2017. (2) Based on current quarter $ in billions
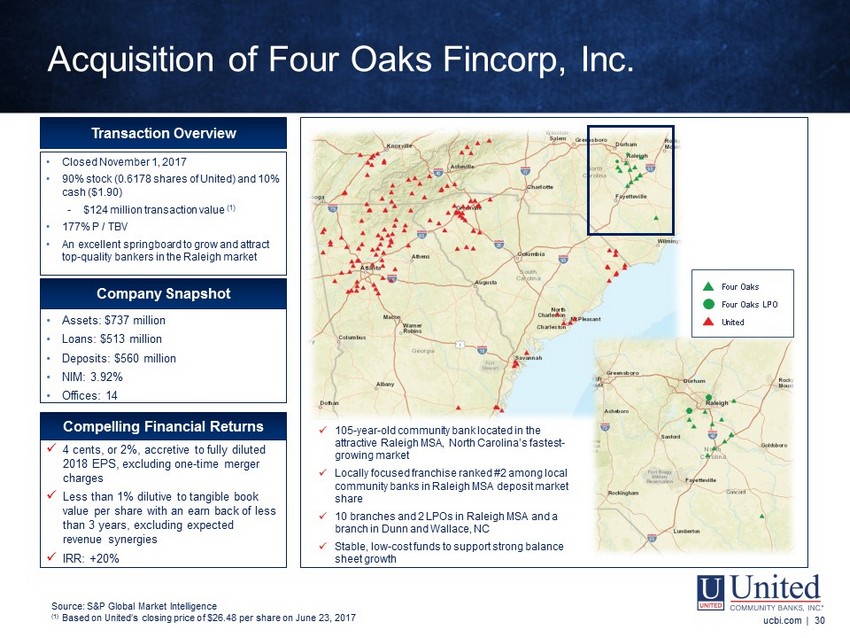
Transaction Overview • Closed November 1, 2017 • 90% stock (0.6178 shares of United) and 10% cash ($1.90) - $124 million transaction value (1) • 177% P / TBV • An excellent springboard to grow and attract top - quality bankers in the Raleigh market Company Snapshot • Assets: $737 million • Loans: $513 million • Deposits: $560 million • NIM: 3.92% • Offices: 14 Compelling Financial Returns Acquisition of Four Oaks Fincorp, Inc. Source: S&P Global Market Intelligence ( 1) Based on United’s closing price of $26.48 per share on June 23, 2017 ucbi.com | 30 x 4 cents, or 2%, accretive to fully diluted 2018 EPS, excluding one - time merger charges x Less than 1% dilutive to tangible book value per share with an earn back of less than 3 years, excluding expected revenue synergies x IRR: +20% x 105 - year - old community bank located in the attractive Raleigh MSA, North Carolina’s fastest - growing market x Locally focused franchise ranked #2 among local community banks in Raleigh MSA deposit market share x 10 branches and 2 LPOs in Raleigh MSA and a branch in Dunn and Wallace, NC x Stable, low - cost funds to support strong balance sheet growth Four Oaks Four Oaks LPO United
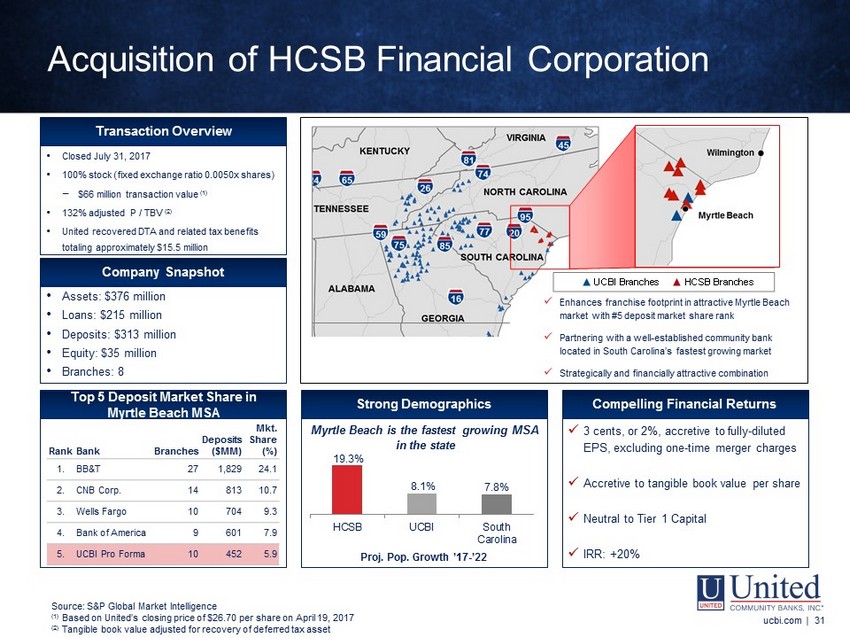
19.3% 8.1% 7.8% HCSB UCBI South Carolina Rank Bank Branches Deposits ($MM) Mkt. Share (%) 1. BB&T 27 1,829 24.1 2. CNB Corp. 14 813 10.7 3. Wells Fargo 10 704 9.3 4. Bank of America 9 601 7.9 5. UCBI Pro Forma 10 452 5.9 Strong Demographics Myrtle Beach is the fastest growing MSA in the state Compelling Financial Returns x 3 cents, or 2%, accretive to fully - diluted EPS, excluding one - time merger charges x Accretive to tangible book value per share x Neutral to Tier 1 Capital x IRR: +20% Transaction Overview • Closed July 31, 2017 • 100% stock (fixed exchange ratio 0.0050x shares) − $66 million transaction value (1) • 132% adjusted P / TBV (2) • United recovered DTA and related tax benefits totaling approximately $15.5 million Company Snapshot • Assets: $376 million • Loans: $215 million • Deposits: $313 million • Equity: $35 million • Branches: 8 Proj. Pop. Growth ’17 - ’22 Top 5 Deposit Market Share in Myrtle Beach MSA 95 26 20 74 40 Charleston North Charleston Mount Pleasant Summerville Myrtle Beach Florence 95 Sumter Wilmington HCSB Branches UCBI Branches x Enhances franchise footprint in attractive Myrtle Beach market with #5 deposit market share rank x Partnering with a well - established community bank located in South Carolina’s fastest growing market x Strategically and financially attractive combination Acquisition of HCSB Financial Corporation Source: S&P Global Market Intelligence ( 1) Based on United’s closing price of $26.70 per share on April 19, 2017 (2) Tangible book value adjusted for recovery of deferred tax asset ucbi.com | 31
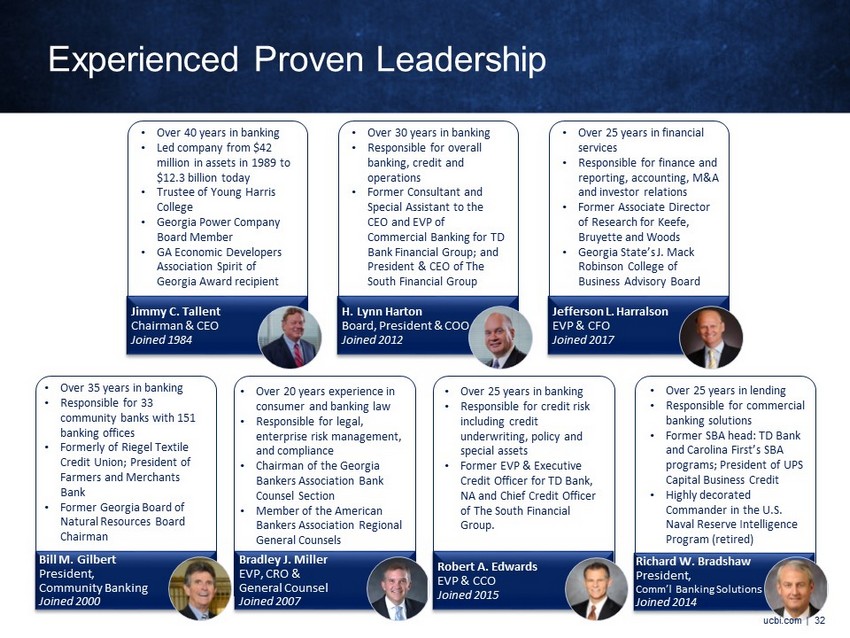
Jimmy C. Tallent Chairman & CEO Joined 1984 H. Lynn Harton Board, President & COO Joined 2012 Bill M. Gilbert President, Community Banking Joined 2000 Bradley J. Miller EVP, CRO & General Counsel Joined 2007 • Over 40 years in banking • Led company from $42 million in assets in 1989 to $12.3 billion today • Trustee of Young Harris College • Georgia Power Company Board Member • GA Economic Developers Association Spirit of Georgia Award recipient • Over 30 years in banking • Responsible for overall banking, credit and operations • Former Consultant and Special Assistant to the CEO and EVP of Commercial Banking for TD Bank Financial Group; and President & CEO of The South Financial Group • Over 25 years in financial services • Responsible for finance and reporting, accounting, M&A and investor relations • Former Associate Director of Research for Keefe, Bruyette and Woods • Georgia State’s J. Mack Robinson College of Business Advisory Board • Over 35 years in banking • Responsible for 33 community banks with 151 banking offices • Formerly of Riegel Textile Credit Union; President of Farmers and Merchants Bank • Former Georgia Board of Natural Resources Board Chairman • Over 20 years experience in consumer and banking law • Responsible for legal, enterprise risk management, and compliance • Chairman of the Georgia Bankers Association Bank Counsel Section • Member of the American Bankers Association Regional General Counsels Robert A. Edwards EVP & CCO Joined 2015 Richard W. Bradshaw President, Comm’l Banking Solutions Joined 2014 • Over 25 years in lending • Responsible for commercial banking solutions • Former SBA head: TD Bank and Carolina First’s SBA programs; President of UPS Capital Business Credit • Highly decorated Commander in the U.S. Naval Reserve Intelligence Program (retired) • Over 25 years in banking • Responsible for credit risk including credit underwriting, policy and special assets • Former EVP & Executive Credit Officer for TD Bank, NA and Chief Credit Officer of The South Financial Group. ucbi.com | 32 Jefferson L. Harralson EVP & CFO Joined 2017 Experienced Proven Leadership ucbi.com | 32
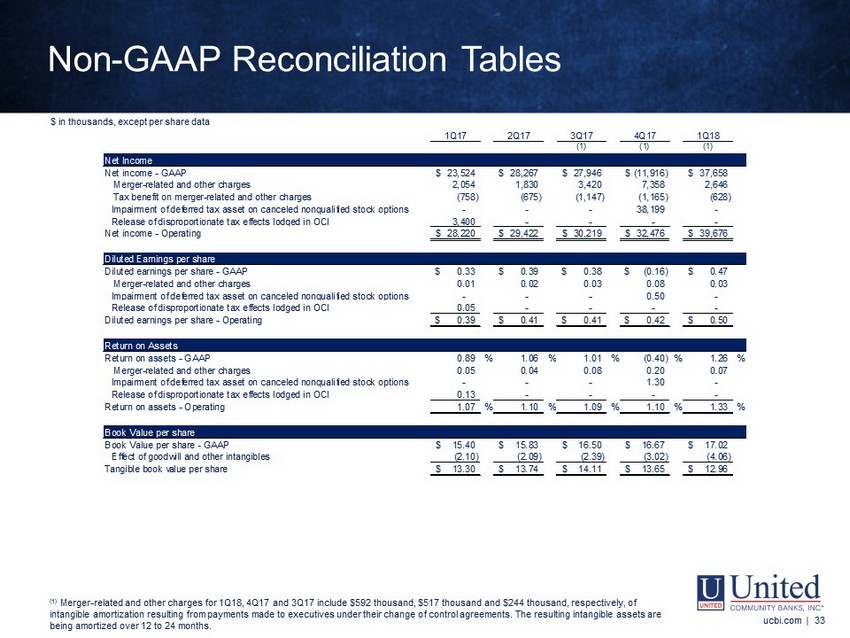
1Q17 2Q17 3Q17 4Q17 1Q18 (1) (1) (1) Net Income Net income - GAAP 23,524$ 28,267$ 27,946$ (11,916)$ 37,658$ Merger-related and other charges 2,054 1,830 3,420 7,358 2,646 Tax benefit on merger-related and other charges (758) (675) (1,147) (1,165) (628) Impairment of deferred tax asset on canceled nonqualified stock options - - - 38,199 - Release of disproportionate tax effects lodged in OCI 3,400 - - - - Net income - Operating 28,220$ 29,422$ 30,219$ 32,476$ 39,676$ Diluted Earnings per share Diluted earnings per share - GAAP 0.33$ 0.39$ 0.38$ (0.16)$ 0.47$ Merger-related and other charges 0.01 0.02 0.03 0.08 0.03 Impairment of deferred tax asset on canceled nonqualified stock options - - - 0.50 - Release of disproportionate tax effects lodged in OCI 0.05 - - - - Diluted earnings per share - Operating 0.39$ 0.41$ 0.41$ 0.42$ 0.50$ Return on Assets Return on assets - GAAP 0.89 % 1.06 % 1.01 % (0.40) % 1.26 % Merger-related and other charges 0.05 0.04 0.08 0.20 0.07 Impairment of deferred tax asset on canceled nonqualified stock options - - - 1.30 - Release of disproportionate tax effects lodged in OCI 0.13 - - - - Return on assets - Operating 1.07 % 1.10 % 1.09 % 1.10 % 1.33 % Book Value per share Book Value per share - GAAP 15.40$ 15.83$ 16.50$ 16.67$ 17.02$ Effect of goodwill and other intangibles (2.10) (2.09) (2.39) (3.02) (4.06) Tangible book value per share 13.30$ 13.74$ 14.11$ 13.65$ 12.96$ ucbi.com | 33 Non - GAAP Reconciliation Tables ucbi.com | 33 $ in thousands, except per share data (1) Merger - related and other charges for 1Q18, 4Q17 and 3Q17 include $ 592 thousand, $517 thousand and $244 thousand, respectively, of intangible amortization resulting from payments made to executives under their change of control agreements. The resulting in tan gible assets are being amortized over 12 to 24 months.
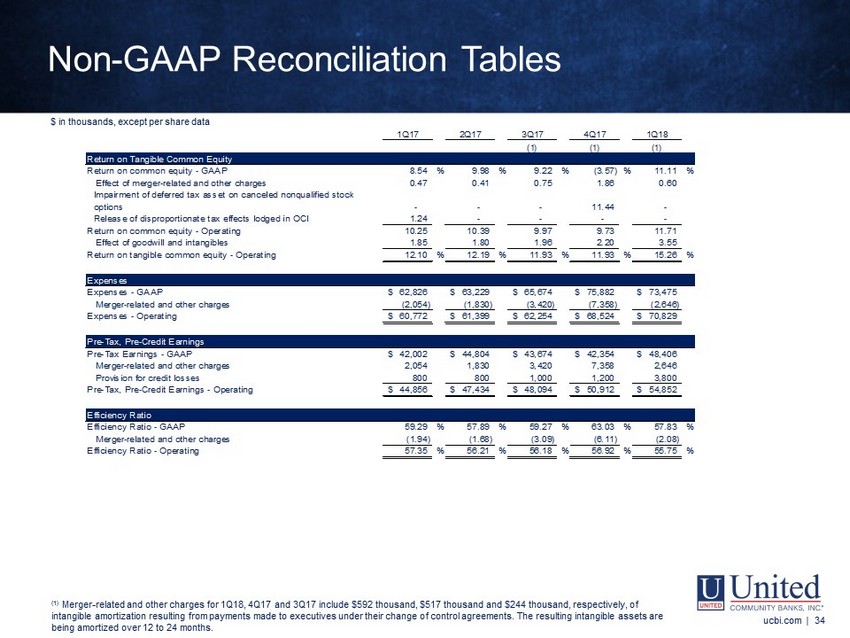
1Q17 2Q17 3Q17 4Q17 1Q18 (1) (1) (1) Return on Tangible Common Equity Return on common equity - GAAP 8.54 % 9.98 % 9.22 % (3.57) % 11.11 % Effect of merger-related and other charges 0.47 0.41 0.75 1.86 0.60 Impairment of deferred tax asset on canceled nonqualified stock options - - - 11.44 - Release of disproportionate tax effects lodged in OCI 1.24 - - - - Return on common equity - Operating 10.25 10.39 9.97 9.73 11.71 Effect of goodwill and intangibles 1.85 1.80 1.96 2.20 3.55 Return on tangible common equity - Operating 12.10 % 12.19 % 11.93 % 11.93 % 15.26 % Expenses Expenses - GAAP 62,826$ 63,229$ 65,674$ 75,882$ 73,475$ Merger-related and other charges (2,054) (1,830) (3,420) (7,358) (2,646) Expenses - Operating 60,772$ 61,399$ 62,254$ 68,524$ 70,829$ Pre-Tax, Pre-Credit Earnings Pre-Tax Earnings - GAAP 42,002$ 44,804$ 43,674$ 42,354$ 48,406$ Merger-related and other charges 2,054 1,830 3,420 7,358 2,646 Provision for credit losses 800 800 1,000 1,200 3,800 Pre-Tax, Pre-Credit Earnings - Operating 44,856$ 47,434$ 48,094$ 50,912$ 54,852$ Efficiency Ratio Efficiency Ratio - GAAP 59.29 % 57.89 % 59.27 % 63.03 % 57.83 % Merger-related and other charges (1.94) (1.68) (3.09) (6.11) (2.08) Efficiency Ratio - Operating 57.35 % 56.21 % 56.18 % 56.92 % 55.75 % ucbi.com | 34 Non - GAAP Reconciliation Tables ucbi.com | 34 $ in thousands, except per share data (1) Merger - related and other charges for 1Q18, 4Q17 and 3Q17 include $592 thousand, $517 thousand and $244 thousand, respectively, of intangible amortization resulting from payments made to executives under their change of control agreements. The resulting in tan gible assets are being amortized over 12 to 24 months.