Attached files
| file | filename |
|---|---|
| 8-K - 8-K - MB FINANCIAL INC /MD | form8-kearningsrelease1q18.htm |
| EX-99.1 - EXHIBIT 99.1 - MB FINANCIAL INC /MD | exhibit_991earningsrelease.htm |

Investor Presentation
April 2018
NASDAQ: MBFI
EXHIBIT 99.2
2
Forward-Looking Statements
When used in this presentation and in reports filed with or furnished to the Securities and Exchange Commission, in press releases or other public
stockholder communications, or in oral statements made with the approval of an authorized executive officer, the words or phrases “believe,” “will,”
“should,” “will likely result,” “are expected to,” “will continue,” “is anticipated,” “estimate,” “project,” “plans,” or similar expressions are intended to
identify “forward-looking statements” within the meaning of the Private Securities Litigation Reform Act of 1995. You are cautioned not to place
undue reliance on any forward-looking statements, which speak only as of the date made. These statements may relate to our future financial
performance, strategic plans or objectives, revenues or earnings projections, or other financial items. By their nature, these statements are subject to
numerous uncertainties that could cause actual results to differ materially from those anticipated in the statements.
Important factors that could cause actual results to differ materially from the results anticipated or projected include, but are not limited to, the
following: (1) the possibility that the actual costs incurred from exiting our national residential mortgage origination business will be materially
different from the estimated costs provided in this presentation, and the possibility that the actual changes in net interest income, mortgage
origination revenue, mortgage servicing revenue, and non-interest expense each from the Mortgage Banking Segment resulting from the
discontinuation of our national mortgage origination business will be materially different from the estimated changes provided in this presentation;
(2) the risk that funds obtained from capital raising activities will not be utilized efficiently or effectively; (3) expected revenues, cost savings, synergies
and other benefits from our merger and acquisition activities might not be realized within the expected time frames or at all and costs or difficulties
relating to integration matters, including but not limited to customer and employee retention, might be greater than expected; (4) the credit risks of
lending activities, including changes in the level and direction of loan delinquencies and write-offs and changes in estimates of the adequacy of the
allowance for loan and lease losses, which could necessitate additional provisions for loan losses, resulting both from originated loans and loans
acquired from other financial institutions; (5) the quality and composition of our securities portfolio; (6) competitive pressures among depository
institutions; (7) interest rate movements and their impact on customer behavior, net interest margin and the value of our mortgage servicing rights;
(8) the possibility that our mortgage banking business may experience increased volatility in its revenues and earnings and the possibility that the
profitability of our mortgage banking business could be significantly reduced, both before and after the discontinuation of our national residential
mortgage origination business, if we are unable to originate and sell mortgage loans at profitable margins or if changes in interest rates negatively
impact the value of our mortgage servicing rights; (9) the impact of repricing and competitors’ pricing initiatives on loan and deposit products; (10)
fluctuations in real estate values; (11) results of examinations of us and our bank subsidiary by regulatory authorities and the possibility that any such
regulatory authority may, among other things, limit our business activities, require us to change our business mix, increase our allowance for loan and
lease losses, write-down asset values or increase our capital levels, or affect our ability to borrow funds or maintain or increase deposits, which could
adversely affect our liquidity and earnings; (12) our ability to adapt successfully to technological changes to meet customers’ needs and developments
in the market place; (13) the possibility that security measures implemented might not be sufficient to mitigate the risk of a cyber attack or cyber
theft, and that such security measures might not protect against systems failures or interruptions; (14) our ability to realize the residual values of our
direct finance,

3
Forward-Looking Statements – continued
leveraged and operating leases; (15) our ability to access cost-effective funding; (16) changes in financial markets; (17) changes in economic conditions
in general and in the Chicago metropolitan area in particular; (18) the costs, effects and outcomes of litigation; (19) new legislation or regulatory
changes, including but not limited to the Dodd-Frank Wall Street Reform and Consumer Protection Act of 2010 (the “Dodd-Frank Act”) and regulations
adopted thereunder, changes in capital requirements pursuant to the Dodd-Frank Act, changes in the interpretation and/or application of laws and
regulations by regulatory authorities, other governmental initiatives affecting the financial services industry and changes in federal and/or state tax
laws, including but not limited to H.R. 1, originally known as the “Tax Cut and Jobs Act,” or interpretations thereof by taxing authorities; (20) changes
in accounting principles, policies or guidelines; (21) our future acquisitions of other depository institutions or lines of business; and (22) future
goodwill impairment due to changes in our business, changes in market conditions, or other factors.
We do not undertake any obligation to update any forward-looking statement to reflect circumstances or events that occur after the date on which
the forward-looking statement is made.

4
Table of Contents
1. Company overview
2. Overview of core business segments
3. Company strategic priorities
• Build a diversified bank with lower risk and consistently better returns than peers
• Build a low-cost and stable funding base
• Focus intensely on fee income
• Invest in human talent
• Proactively acquire companies that fit strategic objectives
• Build a technology environment as an advantage in targeted areas
4. Non-GAAP disclosure reconciliations and footnotes

5 See notes on page 31.
• Headquartered in Chicago, IL
• Guided by six fundamental values – integrity, high performance,
customer focus, mutual respect, open communications, and enthusiasm
• Attractively positioned as a leading independent bank in Chicagoland
• Commercial focus with a diversified loan portfolio by industry type and
geography
• Exceptional deposit franchise with 43% non-interest bearing deposits at
March 31, 2018 and a low cost of funds
• #8 deposit market share in Chicago MSA (June 2017)1, with branches
predominantly located in key Cook and DuPage counties where the vast
majority of Chicago’s middle-market companies are located
• Diverse sources of recurring fee income with strong returns and limited
capital requirements
• Extensive track record of peer-beating operating performance
• Received 2017 national Middle-Market Banking Excellence Awards in
overall satisfaction and cash management from Greenwich Associates
• Skilled at mergers and acquisitions
Overview Branch Footprint – Chicago MSA1
County Rank
Deposits
(bn) Branches
Market
Share
Cook 6 11.2$ 63 4.0%
DuPage 7 1.8 13 4.5%
Will, Kane, Lake, IL
and Lake, IN NA 1.3 10 n/a
Chicago MSA 8 14.3$ 86 3.6%
MB Financial Overview

6
Overview of Core Business Segments

7
Three Business Segments
Banking Segment
• Largest segment with over $16bn in total assets at March 31, 2018
• Generates revenue from its lending, deposit gathering, and fee-based
business activities, including asset based lending, treasury management,
wealth management services, and card services
• Relationship banking culture with experienced calling officers focused on
middle-market and emerging middle-market companies
• 86 branch footprint in the Chicago MSA
Leasing Segment
• Provides a full spectrum of lease and equipment finance solutions, and
related services to a wide variety of businesses on a national basis
• Significant source of fee income and asset growth
Mortgage Banking Segment
• In April 2018 we announced plans to exit our national residential
mortgage origination business. Once fully phased in by 2019, this action
is expected to increase our pre-tax income by approximately $7.7mn per
quarter from the first quarter of 2018. Although we will stop reporting
the mortgage business as a defined segment later in 2018, the
operations remaining after transition are:
• Servicing of residential mortgage loans, currently over $22 billion
in Unpaid Principal Balance
• Existing $1.4 billion residential real estate loan portfolio
• Mortgage originations in greater Chicagoland area
$161.9
$190.5
$211.1
$53.2 $57.4
80% 79%
87%
86% 86%
15%
11%
10%
11%
15%
5%
10%
3%
3%
-1%
-20%
0%
20%
40%
60%
80%
100%($10)
$40
$90
$140
$190
$240
2015 2016 2017 1Q2017 1Q2018
Operating Earnings2 by Segment
(mn)
Banking Leasing Mortgage
See notes on page 31.
8
National Presence
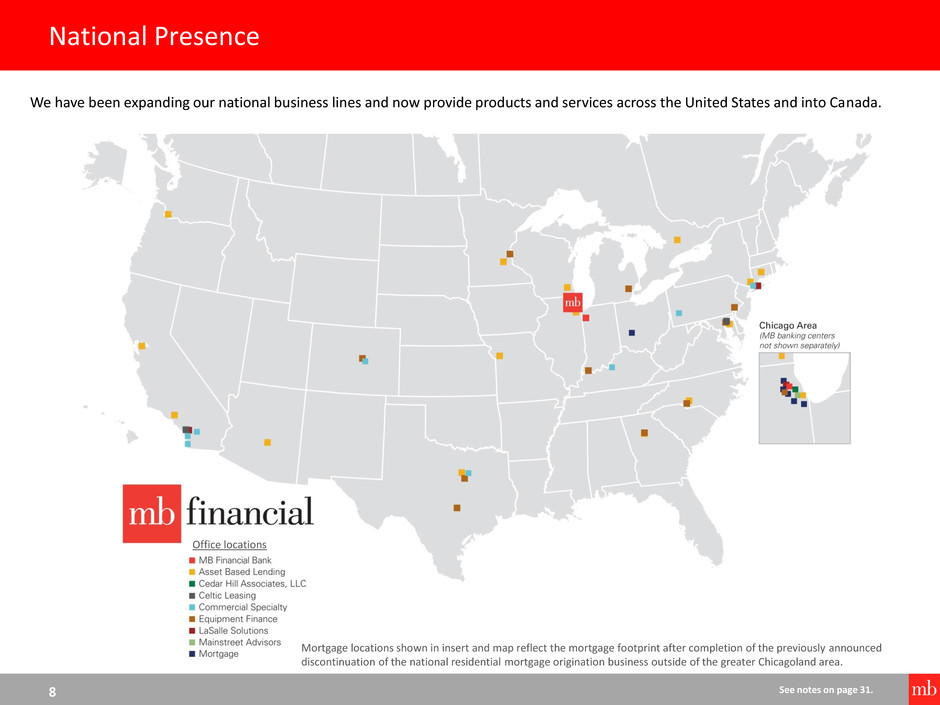
We have been expanding our national business lines and now provide products and services across the United States and into Canada.
See notes on page 31.
Office locations
Mortgage locations shown in insert and map reflect the mortgage footprint after completion of the previously announced
discontinuation of the national residential mortgage origination business outside of the greater Chicagoland area.
9
Banking Segment – Commercial Banking
Note: Business line financial data as of March 31, 2018
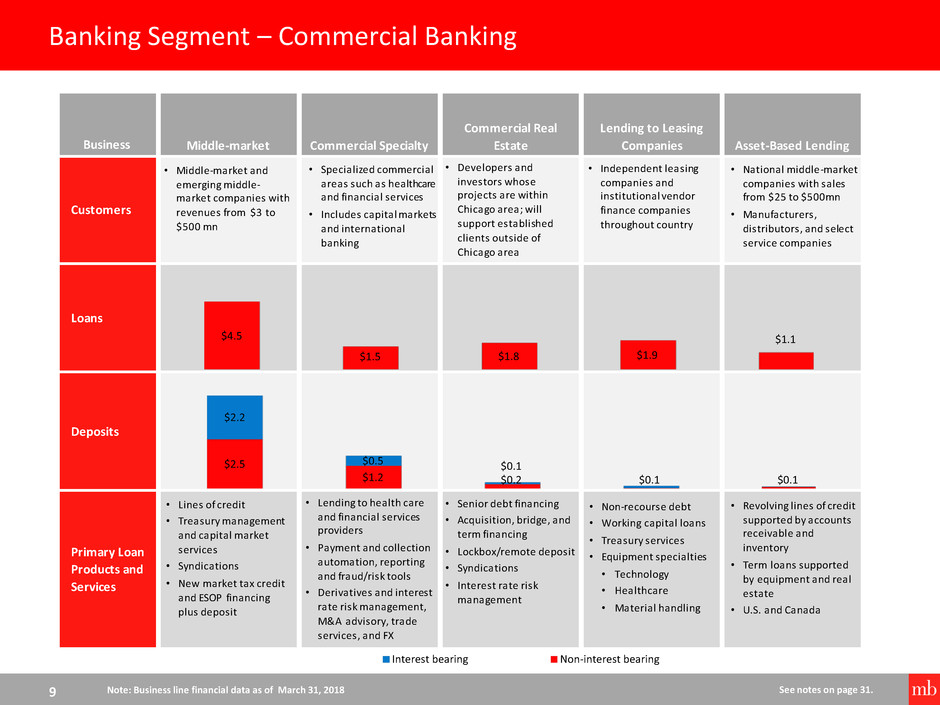
Business
Lending to Leasing
Companies Asset-Based Lending
Customers
Loans
Deposits
Primary Loan
Products and
Services
Middle-market Commercial Specialty
Commercial Real
Estate
• Lines of credit
• Treasury management
and capital market
services
• Syndications
• New market tax credit
and ESOP financing
plus deposit
• Middle-market and
emerging middle-
market companies with
revenues from $3 to
$500 mn
• Developers and
investors whose
projects are within
Chicago area; will
support established
clients outside of
Chicago area
• Senior debt financing
• Acquisition, bridge, and
term financing
• Lockbox/remote deposit
• Syndications
• Interest rate risk
management
• Revolving lines of credit
supported by accounts
receivable and
inventory
• Term loans supported
by equipment and real
estate
• U.S. and Canada
• Lending to health care
and financial services
providers
• Payment and collection
automation, reporting
and fraud/risk tools
• Derivatives and interest
rate risk management,
M&A advisory, trade
services, and FX
• Specialized commercial
areas such as healthcare
and financial services
• Includes capital markets
and international
banking
• National middle-market
companies with sales
from $25 to $500mn
• Manufacturers,
distributors, and select
service companies
• Independent leasing
companies and
institutional vendor
finance companies
throughout country
• Non-recourse debt
• Working capital loans
• Treasury services
• Equipment specialties
• Technology
• Healthcare
• Material handling
$4.5
$1.5 $1.8 $1.9
$1.1
$2.5
$1.2 $0.2 $0.1
$2.2
$0.5 $0.1
$0.1
See notes on page 31.
Interest bearing Non-interest bearing

10
Banking Segment – Consumer, Wealth, Indirect Lending and Card
Business
Prepaid and Credit
Cards and Network
Payments
Customers
Loans
Deposits
Products /
Services
Retail and Small
Business Banking Wealth Management Indirect Lending
• Provides full suite of
deposit products and
cash management
tools
• MB Online and Mobile
Banking
• Financing and loans to
small businesses
• Mortgages
• Consumers and
businesses (with
revenues < $10mn) that
live and work near our
banking centers
• Motorcycle, RV,
powersports, and
marine dealers
• One of the longest-
running motorcycle
programs in the country
• Wide range of finance
terms from 3 to 20
years to fit financial
circumstances
• Consistent credit
decisions and direct
communication with
underwriters
• 90% of loans in the
portfolio have a 700 or
higher FICO® score with
the average being 757
• Business owners, high
net worth families, and
foundations
• Advises on $8.2 bn of
client assets
• Retail and commercial
customers
• BIN Sponsorship
relationships for
program managers and
Independent Sales
Organizations
• Wide selection of
Mastercard® and
Visa® debit, credit, and
prepaid cards
• Credit card rewards
program
• BIN sponsorship for
prepaid card programs
and merchant acquiring
• Generated $18.6mn of
fee income in 2017
• Provides full spectrum
of wealth management,
trust, and investment
services
• Provides investment
advice to community
bank trust departments
and independent trust
companies
• Generated $34.7mn of
fee income in 2017
$0.4 $0.2
$0.7
$0.03
$1.3 $0.0
$0.5
$4.5
$0.3
Note: Business line financial data as of March 31, 2018 See notes on page 31.
Interest bearing Non-interest bearing

11
Leasing Segment
Business
Total Assets
(3/31/2018)
$0.4bn $0.3bn $0.7bn
Target Audience
(National)
Middle-market companies and
divisions of large companies
Middle-market companies
Middle-market to large
companies
Equipment
Specialization
Technology, Healthcare, and
Material Handling
Healthcare and Technology
Transportation, Manufacturing,
Marine, and Distribution
Product
Specialization
Fair market value (FMV) lease
products; reseller of third party
maintenance contracts
(primarily Cisco)
FMV, purchase renewal option,
and dollar out leases
FMV, early buy out, TRAC,
synthetic and dollar out leases,
and traditional loans
Direct Leasing Units
(Leasing Segment)
$60
$74 $70
$83
$20 $24
$0
$20
$40
$60
$80
$100
2014 2015 2016 2017 1Q2017 1Q2018
Lease Financing Fee Revenue
(mn)
Leasing Overview
• Full spectrum of lease and equipment financing solutions and related
services, including capital market syndication capability
• Brokers third party equipment maintenance contracts and provides
life-cycle asset management services
• National customer base in diversified industries ranging from Fortune
1000 to middle-market companies and the Federal government
See notes on page 31.
12
Leasing Segment – Direct Leasing Units
See notes on page 31.
• Leases are originated directly throughout the U.S. by our three leasing units, LaSalle Solutions, Celtic Equipment Finance, and MB
Equipment Finance, which together form our Leasing Segment. LaSalle and Celtic are also customers of our Banking Segment and
generally finance much of their equipment cost with internal debt. MB Equipment Finance funds 100% of its leases internally.
• The lease portfolio is comprised of various types of equipment, including information technology, healthcare, material handling,
general manufacturing distribution, and transportation equipment.
• Lease income is recognized over the life of the lease so that at the end of the lease term the residual amount approximates the fair
market value of the leased equipment.
• MB’s leasing units offer a broad suite of lease products, which at the end of a lease term, may permit the lease to be renewed or
extended or the equipment purchased or returned.
• We also broker equipment maintenance contracts provided by third party vendors to our customers covering equipment leased from
MB as well as other equipment owned or leased by our clients. Third party vendors are responsible for completing any maintenance
covered by a maintenance contract. Maintenance contract revenue is presented, net of the related cost of sales paid to third party
vendors, as part of Lease Financing Fee Income for financial statement purposes.
• Balance sheet classification: Direct Finance and Leveraged Leases that transfer substantially all of the benefits and risk related to
equipment owners are grouped with Lease Loans in the loan section. By contrast, for Operating Leases, the underlying equipment at
cost and net of accumulated depreciation is reflected in Lease investments, net, which is part of other assets, and was $409mn at
3/31/2018, an increase of 30% from 3/31/2017.
• Income statement classification: Interest income on Direct Finance and Leveraged Leases and accreted residual income on these
leases are included in Interest Income. By contrast, Lease Payments on Operating Leases plus accreted residual income on these
leases, less any depreciation expense on the equipment are included in Non-Interest Income as Lease Financing Fee Income.
Proceeds received as a result of lease renewals and equipment sales less any residual investment in the lease results in a gain or loss
that is also reflected in Lease Financing Fee Income.

13
Mortgage Banking Segment
MSR Unpaid Principal Balance $22.4bn
MSR Valuation 1.30%
Residential Loan Portfolio (period end) $1.4bn
Residential Loan Portfolio Yield 3.35%
Mortgage Banking Highlights (1Q2018) Mortgage Banking Business Lines
Originations In April 2018, we announced our intent to discontinue our
national mortgage origination business, which includes all
originations outside of our Chicagoland area footprint. As a
result we expect to incur one-time pre-tax costs of
approximately $37 to $41mn during the remainder of 2018
(starting in 2Q).
Servicing Generates servicing fee income. MSR asset hedged to offset
changes in fair value. Insurance and tax escrow balances
provide good source of non-interest bearing deposits.
Portfolio Loan portfolio consists primarily of retail-originated
adjustable-rate residential real estate loans.
$168
$238
$276
$292
$100
$150
$200
$250
$300
2015 2016 2017 1Q2018
MSR Asset Fair Value at Year-End
(mn)
See notes on page 31.
1Q2018
Actual Change
1Q2019
Estimated
Net interest income post provision 10.5$ (3.3)$ 7.2$
Mortgage origination r venue 17.9 (16.9) 1.0
Mortgage servicing revenue 7.2 (1.2) 6.0
Non-interest expense 35.9 (29.1) 6.8 -
Income before income taxes (0.4)$ 7.7$ 7.3$
Estimat d Recurring Quarterly Impact of Exiting National
Mortgage Origination Business (mn)
14
Company Strategic Priorities

15
Company Strategic Priorities
Priorities Results
• Peer-leading risk-adjusted returns
• 2017 Operating ROA of 1.08% was in the
80th percentile of our peer group
• Add great customers, whether they borrow or not
• Attract and retain low-cost and stable funding
• Maintain strong liquidity and capital
• Valuable deposit franchise
• Low cost of funds
• Grow high quality, recurring, and profitable fees
• Emphasize leasing, specialty banking, cards, commercial
deposit services, treasury management, and wealth
management
• Grow select fee businesses nationally
• Key fee initiatives (excluding mortgage)
are up 15.4% CAGR over the last 3 years
• Lease financing revenue increased 15% in
1Q18 vs 1Q17
• Recruit and retain top talent
• Offer strong training programs
• Be an employer of choice
• Very low turnover of “A” top-performing
employees
• Ranked in Top 25 among large employers
in 2017 Chicago Tribune Top Workplaces
• Skilled and disciplined acquirer
• Long track record of successful integrations
• Deposit enhancing and FDIC-assisted
• Whole-bank acquisitions
• Specialty finance acquisitions
• Leverage cloud computing capabilities
• Establish a culture of collaboration between
development and operations
• Increase speed of delivery of products and services
• Improved service stability and resiliency
• On demand server provisioning with
robust disaster recovery capabilities
• Predefined infrastructure costs to enable
consistent, cost-effective deployments
Build a diversified bank with
lower risk and consistently
better returns than peers
Build a low-cost and stable
funding base
Focus intensely on fee
income
Invest in human talent
Proactively acquire
companies that fit strategic
objectives
Build a technology
environment as an
advantage in targeted areas
See notes on page 31.

16
$3.5
$1.9
$4.8
$4.1
$2.1
$2.4
$0.5
$8.8
$9.7
$12.6
$13.8 $13.8
$0
$4
$8
$12
$16
2014 2015 2016 2017 1Q2018
Period End Loans Outstanding3
(bn)
Acquisitions During Year
Diversified Loan Portfolio Across Many Segments
Loan Highlights Loan Diversification – March 31, 2018
• Approximately half of our loans are to borrowers or secured by
properties outside of Illinois as of March 31, 2018
• Approximately 77% of our commercial and commercial real estate
loans have floating rates of interest indexed to either LIBOR or Prime
• Diversified lending activities including
• Middle-market lending with specialty platforms such as
health care and asset-based lending
• Commercial and construction real estate
• Lease lending with a national footprint
• Consumer includes residential real estate and indirect
motorcycle, powersports, RV, and marine lending
Construction
Consumer
Lease
CRE
Middle-
market
24.5%
4.8%
5.4%
6.2%
7.1%
16.7%
16.8%
18.5%
0% 10% 20% 30%
All other (each < 5.0%)
Transportation Services
Healthcare/Pharmaceuticals
Commercial Services
Food, Beverage Mfg/Whlse
Financials (except Banks)
Materials/Commodities
Equip, Machinery, Parts Mfg
C&I Loans Outstanding Portfolio Mix
11.2%
11.8%
14.2%
18.5%
21.3%
23.1%
0% 10% 20% 30%
Office
Retail
Multifamily
Healthcare
Industrial
CRE Other
CRE Loans Outstanding Mix by Collateral4
See notes on page 31.

17
Peer-leading Investment Securities Portfolio Returns
Investment Securities Portfolio as of March 31, 20185
47.5% 50.2%
1.5% 0.9%
Mortgage-
backed
securities
Municipal
bonds
Corporate
bonds
Government
sponsored
agencies
Weighted average tax equivalent yield 3.20%
Portfolio duration 3.2 years
Portion of portfolio invested in securities exempt
from Federal income taxes
47%
Percentile rank of investment portfolio 3-Year
total return relative to peers6
94%
Portfolio Highlights5
S curity
Securities
Available
for Sale (fair
value)
Unrealized
Gain (Loss),
net on AFS
Securities
Held to
Maturity
(amortized
cost)
Total
Investment
Securities
Portfolio5 AAA
AA+, AA or
AA- A+, A or A-
BBB+, BBB
or BB+
Not
Rated
State and p li ical subdivisions
(municipal bonds)5
$ 367 $ 12 $ 874 $ 1,241 23% 66% 7% 0% 4%
Mortgage-backed securities 1,251 (15) 59 1,310
Corporate bonds 38 (0) - 38
Government sponsored
agencies and enterprises 23 (0) - 23
Totals $ 1,679 $ (3) $ 933 $ 2,612
Percent of portfolio 64% n/a 36% 100%
Municipal Portfolio RatingsInvestment Securities Portfolio March 31, 2018 (mn)
See notes on page 31.

18
Valuable Low Cost Deposit Franchise
$9.0 $9.7
$12.1 $12.5 $12.5
$2.0 $1.8
$2.0 $2.5 $2.5 $11.0 $11.5
$14.1
$15.0 $15.0
$0
$3
$6
$9
$12
$15
$18
2014 2015 2016 2017 1Q18
Period End Deposits
(bn)
Low-cost deposits CDs
Deposit Highlights
• Valuable core deposit franchise, with low cost of deposits
• Multiple business lines generate deposits including Retail, Commercial,
Wealth Management, Treasury Management, Mortgage Servicing
Escrow, and Prepaid Cards
• Attractive deposit mix with peer-beating ratio of non-interest bearing
deposits/total deposits of 43% and low reliance on CDs at 17% of total
deposits 0.09%
0.27% 0.23%
0.53%
0.91%
1.30%
0.83%
1.65%
0.00%
0.50%
1.00%
1.50%
2.00%
1Q2017 2Q2017 3Q2017 4Q2017 1Q2018
Deposit Rates and 1-Month LIBOR
Savings Money market & NOW
CD's 1-Month LIBOR
See notes on page 31.

19
Capital Planning
8.00%
10.00%
8.87%
10.69%
13.62%
0.0%
3.0%
6.0%
9.0%
12.0%
15.0%
Tangible Common
Equity to Tangible
Assets
Tier 1 Risk Based
Capital
Total Risk Based
Capital
Capital Ratios as of March 31, 2018
Bank Well Capitalized Requirement MBFI
• Exceed regulatory well-capitalized requirements top priority
• Reinvest in our business to support organic growth
• Pay a regular dividend
• Dividend payout ratio was 35% in 2016 and 23% in 2017 based
on diluted earnings per common share
• Current quarterly dividend of $0.24 per common share equates
to an annualized yield of approximately 2.4%7
• Consider stock buy-backs when prior capital actions are not sufficient
to utilize excess capital; $50mn stock buy-back completed in 2015
• Issued $200mn of 6.00% Series C Preferred Stock and $175mn of
4.00% fixed-to-floating rate bank-level subordinated notes in
November 2017
• Used proceeds of Series C Preferred Stock issuance to redeem entire
$100mn of 8.00% Series A Preferred Stock in February 2018 and
$20mn of floating rate trust preferred securities in March 2018
• Acquisitions with an active and disciplined approach
• 19 transactions completed since 2000
$0.52
$0.65 $0.74
$0.82
$0.19 $0.24
$1.86
$2.06
$2.34 $2.39
$0.60 $0.64
$0.00
$1.00
$2.00
$3.00
2014 2015 2016 2017 1Q2017 1Q2018
Diluted Operating Earnings and Dividends
per Common Share
Dividends Operating Earnings per Common Share
Capital Deployment
See notes on page 31.
20
Asset and Liability Beta
See notes on page 31.
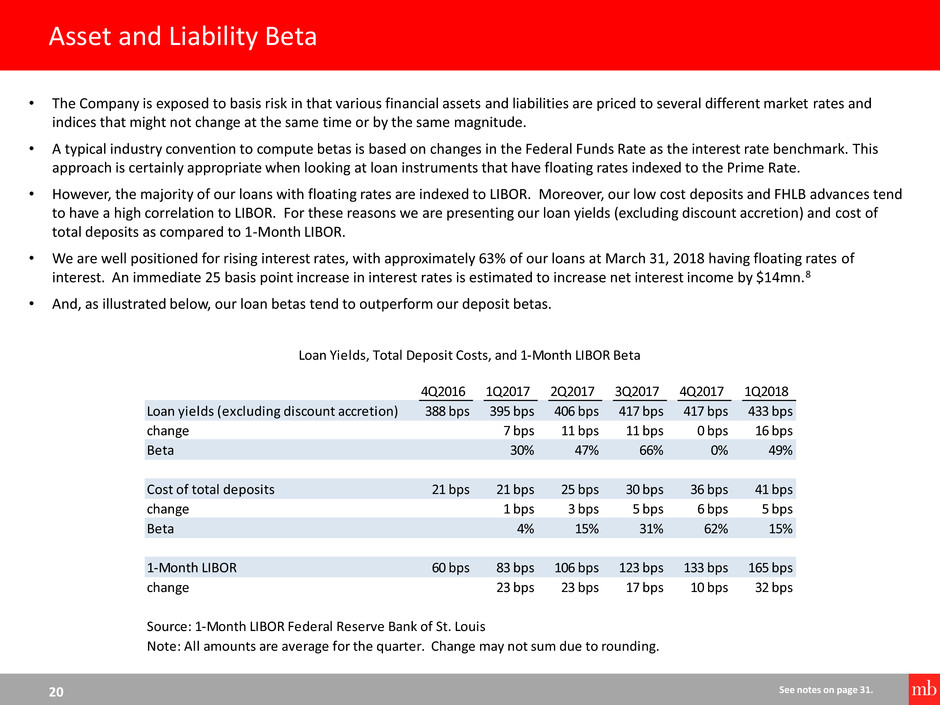
• The Company is exposed to basis risk in that various financial assets and liabilities are priced to several different market rates and
indices that might not change at the same time or by the same magnitude.
• A typical industry convention to compute betas is based on changes in the Federal Funds Rate as the interest rate benchmark. This
approach is certainly appropriate when looking at loan instruments that have floating rates indexed to the Prime Rate.
• However, the majority of our loans with floating rates are indexed to LIBOR. Moreover, our low cost deposits and FHLB advances tend
to have a high correlation to LIBOR. For these reasons we are presenting our loan yields (excluding discount accretion) and cost of
total deposits as compared to 1-Month LIBOR.
• We are well positioned for rising interest rates, with approximately 63% of our loans at March 31, 2018 having floating rates of
interest. An immediate 25 basis point increase in interest rates is estimated to increase net interest income by $14mn.8
• And, as illustrated below, our loan betas tend to outperform our deposit betas.
4Q2016 1Q2017 2Q2017 3Q2017 4Q2017 1Q2018
Loan yields (excluding discount accretion) 388 bps 395 bps 406 bps 417 bps 417 bps 433 bps
change 7 bps 11 bps 11 bps 0 bps 16 bps
Beta 30% 47% 66% 0% 49%
C s f total posits 21 bps 21 bps 25 bps 30 bps 36 bps 41 bps
ch 1 bps 3 bps 5 bps 6 bps 5 bps
B t 4% 15% 31% 62% 15%
1-Month LIBOR 60 bps 83 bps 106 bps 123 bps 133 bps 165 bps
change 23 bps 23 bps 17 bps 10 bps 32 bps
Source: 1-Month LIBOR Federal Reserve Bank of St. Louis
Note: All amounts are average for the quarter. Change may not sum due to rounding.
Loan Yields, Total Deposit Costs, and 1-Month LIBOR Beta
21
Focus on Fee Income
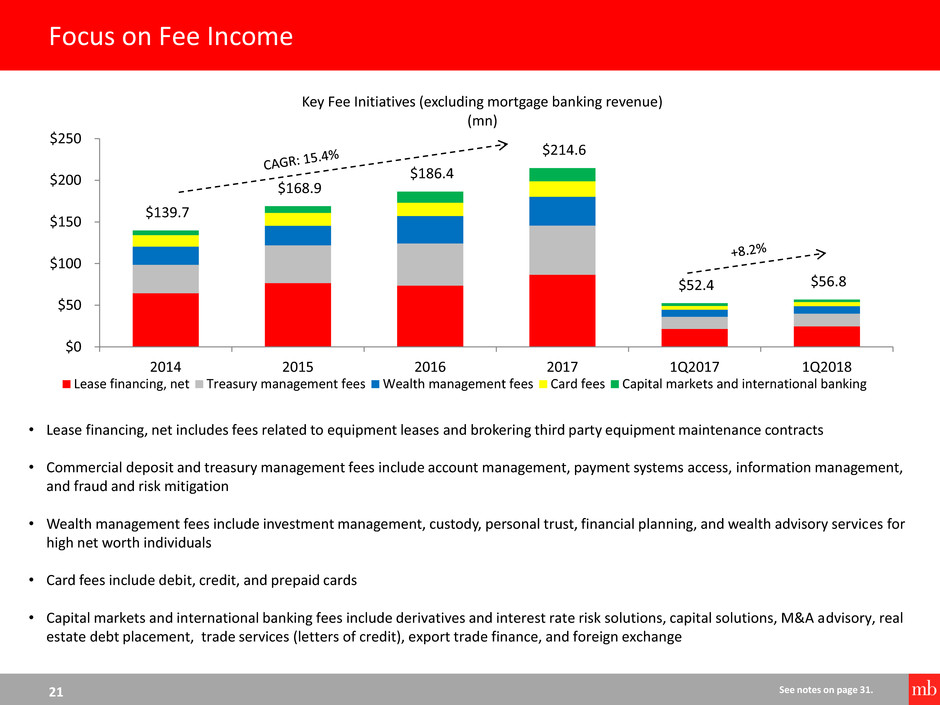
• Lease financing, net includes fees related to equipment leases and brokering third party equipment maintenance contracts
• Commercial deposit and treasury management fees include account management, payment systems access, information management,
and fraud and risk mitigation
• Wealth management fees include investment management, custody, personal trust, financial planning, and wealth advisory services for
high net worth individuals
• Card fees include debit, credit, and prepaid cards
• Capital markets and international banking fees include derivatives and interest rate risk solutions, capital solutions, M&A advisory, real
estate debt placement, trade services (letters of credit), export trade finance, and foreign exchange
41% 44%
$139.7
$168.9
$186.4
$214.6
$52.4 $56.8
$0
$50
$100
$150
$200
$250
2014 2015 2016 2017 1Q2017 1Q2018
Key Fee Initiatives (excluding mortgage banking revenue)
(mn)
Lease financing, net Treasury management fees Wealth management fees Card fees Capital markets and international banking
See notes on page 31.

22
Controlling Non-interest Expenses
$146 $148
$150
$153
$157
$100
$120
$140
$160
$180
1Q17 2Q17 3Q17 4Q17 1Q18
Run-rate Non-interest Expense
(mn)
Non-interest Expenses
• Selectively making investments to grow business lines (e.g.,
direct leasing, healthcare, payments etc.) and improve
functionality and performance of core IT systems.
• Commitment to exit our national residential mortgage
origination business outside of the Chicagoland area is
expected to reduce quarterly non-interest expense by
approximately $26.5mn by the end of 2018.
See notes on page 31.
1Q17 2Q17 3Q17 4Q17 1Q18
Core non-interest expense 155.1$ 158.4$ 158.8$ 163.8$ 164.2$
Less commissions 8.6 9.7 9.2 8.3 7.4
Less net loss (gain) recognized on OREO 0.6 0.7 0.1 (0.2) (0.1)
Less non-repeatable 4Q17 expenses - - - 2.6 -
Run-rate of non-interest expense 145.9$ 147.9$ 149.5$ 153.0$ 156.9$
Trend of Core and Run-rate of Non-interest Expense
(mn)

23
Investing in Human Talent
Strategies Priorities
• Promote our diverse and dynamic work environment, progressive benefits, health and wellness
offerings, and positive corporate culture
• Leverage Top Workplace recognitions and Employee Resource Groups; such as adding a Veteran’s
Employee Resource Group and growth in engagement with our Women’s Leadership Group
• Use performance management to identify and reward high performers
• Provide focused resources and development opportunities to accelerate personal growth and
leadership skills
• Promote robust professional development, training, and talent management offerings:
• Onsite MBA programs and Tuition Reimbursement
• 24-month rotational Leadership Development Program for recent college graduates
• MB University – online training portal for regulatory and other training
• Foster employee engagement through culture programs and activities that promote and reflect
our corporate mission and values. Ensure corporate values consistently guide the organization.
• Promote reinvesting in the community; for example, our key initiative MB on the Block: Education
• Support employee-led groups that create and encourage a diverse and inclusive work place with
senior leaders focused on attracting, retaining, and promoting top diverse talent
• Ensure employees have the tools, resources, and training to be successful and to perform their
jobs efficiently and effectively
• Leverage technology to optimize employee communication and collaboration
Recruit top talent
Develop and retain
our high performers
Commitment to
Learning &
Development
Maintain a strong
corporate culture
Value Technology
We believe our people are our greatest asset. Our mission is to build a human capital foundation that attracts, develops, and retains
a diverse and highly talented pool of employees and leaders who continuously advance MB Financial to a new level of excellence.
We pursue this mission by actively demonstrating and living our core values: Integrity, High Performance, Customer Focus,
Enthusiasm, Open Communication, and Mutual Respect.
See notes on page 31.

24
MB’s Community Building Aligns With Our Values and Strategic Priorities
MB on the Block: Education
• MB Financial Charitable Foundation’s signature philanthropic initiative
aimed at helping almost 1,000 low to moderate income high school
students in Chicago secure livable wage employment by their mid-20s.
• Initial focus on serving two Chicago Public High Schools: Gage
Park and Wells Community Academy
• Providing internship opportunities for high school students
• Better education and employment outcomes for young people
contributes to economically vibrant communities and enhances business
opportunities for our clients, our neighborhoods, and for MB.
MB on the Block Volunteer Day
• Annual event where more than 500 employees volunteer at 20+
nonprofit organizations.
• Volunteerism is an integral part of our corporate culture and contributes
to MB attracting and retaining the best employees.
Community Reinvestment
• MB’s Community Development Corporation makes loans, investments,
and charitable grants to strengthen and revitalize low to moderate
income communities within the bank’s market areas.
• Community reinvestment is consistent with our long-term core mission
to provide value to our stockholders, customers, and employees and
we’re proud to be a leader in addressing needs in the communities we
serve.
See notes on page 31.
25
Low-Risk, Strategically Aligned Acquisition Strategy
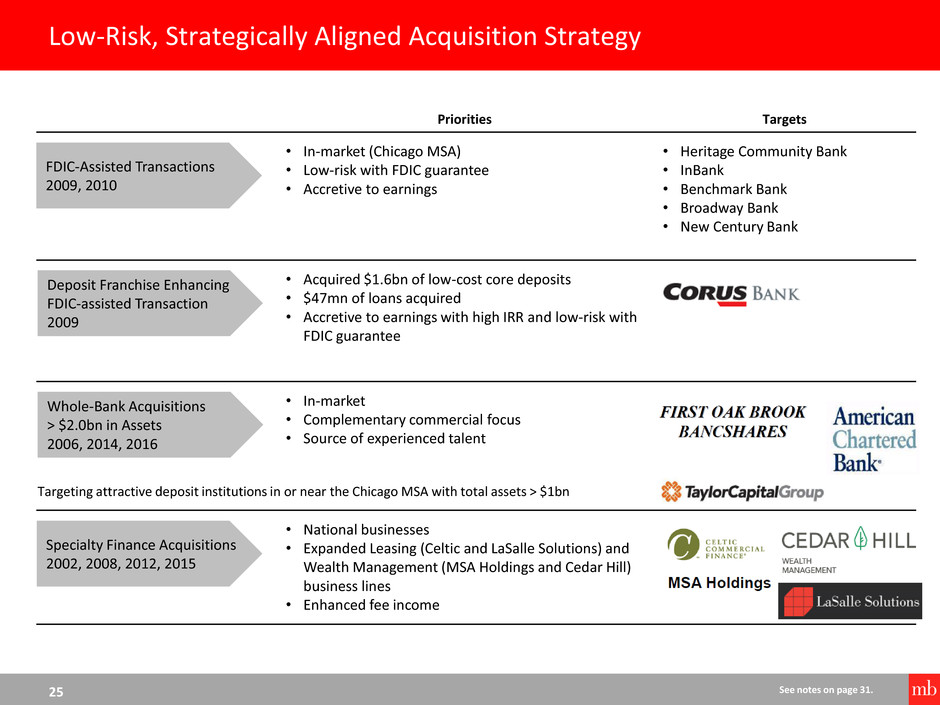
Priorities Targets
• In-market (Chicago MSA)
• Low-risk with FDIC guarantee
• Accretive to earnings
• Heritage Community Bank
• InBank
• Benchmark Bank
• Broadway Bank
• New Century Bank
• Acquired $1.6bn of low-cost core deposits
• $47mn of loans acquired
• Accretive to earnings with high IRR and low-risk with
FDIC guarantee
• In-market
• Complementary commercial focus
• Source of experienced talent
• National businesses
• Expanded Leasing (Celtic and LaSalle Solutions) and
Wealth Management (MSA Holdings and Cedar Hill)
business lines
• Enhanced fee income
FDIC-Assisted Transactions
2009, 2010
Deposit Franchise Enhancing
FDIC-assisted Transaction
2009
Whole-Bank Acquisitions
> $2.0bn in Assets
2006, 2014, 2016
Specialty Finance Acquisitions
2002, 2008, 2012, 2015
Targeting attractive deposit institutions in or near the Chicago MSA with total assets > $1bn
See notes on page 31.

26
Non-GAAP Disclosure Reconciliations and
Footnotes
27
This presentation contains certain financial information determined by methods other than in accordance with accounting principles generally
accepted in the United States of America (GAAP). These measures include operating earnings, diluted operating earnings per common share, core
non-interest income, core non-interest expense, non-core non-interest income, and non-core non-interest expense with net gains and losses on
investment securities, net gains and losses on sale of other assets, gains and losses on extinguishment of debt, loss and recovery of low to moderate
income real estate investments, merger related and repositioning expenses, restructuring severance charges, one-time bonuses, branch exit and
facilities impairment charges, prepayment fees on interest bearing liabilities, and contribution to MB Financial Charitable Foundation excluded from
reported net income. These measures also include the ratio of tangible common equity to tangible assets. Our management uses these non-GAAP
measures, together with the related GAAP measures, in its analysis of our performance and in making business decisions. Management also uses
these measures for peer comparisons.
Management believes that operating earnings, core and non-core non-interest income, and core and non-core non-interest expense are useful in
assessing our core operating performance and in understanding the primary drivers of our non-interest income and non-interest expense when
comparing periods.
Management believes that operating earnings adjusted for merger related and repositioning expenses is a useful measure because it excludes
expenses that can significantly fluctuate from acquisition to acquisition. In addition, management believes that excluding these expenses provides
investors and analysts a measure to better understand the Company's primary operations when comparing the periods presented in the Company’s
earnings release.
The ratio of tangible common equity to tangible assets excludes acquisition-related goodwill and other intangible assets, net of tax benefit, in
determining tangible common equity and tangible assets. Management believes the presentation of this financial measure, excluding the impact of
such items, provides a useful method to assess management’s success in utilizing our tangible capital, as well as our capital strength. Management
also believes that providing a measure that excludes balances of acquisition-related goodwill and other intangible assets, which are subjective
components of valuation, facilitates the comparison of our performance with the performance of our peers. In addition, management believes that
this is a standard financial measure used in the banking industry to evaluate performance.
The non-GAAP disclosures contained herein should not be viewed as substitutes for the results determined to be in accordance with GAAP, nor are
they necessarily comparable to non-GAAP performance measures that may be presented by other companies.
Non-GAAP Disclosure Reconciliations

28
2014 2015 2016 2017 2017 2018
Net income, as reported $ 86.1 $ 158.9 $ 174.1 $ 304.0 $ 54.5 $ 56.8
Non-core i tem adjustments
Net losses (ga ins ) on investment securi ties 2.5 0.2 (0.4) (0.6) (0.2) 0.2
Net losses (ga ins ) on sa le of other assets (3.5) 0.0 0.8 2.3 0.1 0.4
Loss (ga in) on extinguishment of debt (1.9) - - - - 3.1
Loss (recovery) on low to moderate income real
estate investments 2.1 - - (1.7) - -
Merger related and repos i tioning expenses 45.4 5.5 23.7 9.1 0.3 0.6
Restructuring severance charge - - - 0.8
One-time bonuses - - - 2.7
Branch exi t and faci l i ties impairment charges - - 0.2 1.8 - -
Prepayment fees on interest bearing l iabi l i ties - 0.1 - - - -
Contribution to MB Financia l Chari table Foundation 3.3 - 4.0 7.5 - -
Total non-core i tems $ 48.0 $ 5.8 $ 28.2 $ 22.0 $ 0.2 $ 4.3
Income tax expense on non-core i tems 13.7 2.8 10.1 8.6 1.2
Income tax expense - other - - - 106.3 1.5 2.5
Income tax benefi t on adopting new stock-based
compensation guidance - - 1.8 - - -
Operating earnings $ 120.3 $ 161.9 $ 190.5 $ 211.1 $ 53.2 $ 57.4
Dividends on preferred shares (4.0) (8.0) (8.0) (8.0) (2.0) (3.1)
Operating earnings avai lable to common
stockholders $ 116.3 $ 153.9 $ 182.5 $ 203.1 $ 51.2 $ 54.3
Di luted earnings per common share - as reported $ 1.31 $ 2.02 $ 2.13 $ 3.49 $ 0.62 $ 0.81
Impact of non-core i tems, net of tax 0.55 0.04 0.21 (1.10) (0.02) 0.01
Impact of return from preferred s tockholders
redemption - - - - - (0.18)
Di luted operating earnings per common share $ 1.86 $ 2.06 $ 2.34 $ 2.39 $ 0.60 $ 0.64
Operating Earnings
(mn)
Years Ended December 31,
Three Months Ended
March 31,
The following table presents a reconciliation of net income to operating earnings:
Non-GAAP Disclosure Reconciliations

29
2014 2015 2016 2017 2017 2018
Banking Segment:
Net income - as reported $ 60.3 $ 125.8 $ 134.6 $ 180.9 $ 47.0 $ 46.6
Non-core i tems, net of tax 34.2 3.0 16.4 4.2 (1.4) 2.6
Operating earnings $ 94.5 $ 128.7 $ 151.0 $ 185.0 $ 45.6 $ 49.1
Leas ing Segment:
Net income - as reported $ 20.5 $ 25.2 $ 20.6 $ 85.9 $ 5.9 $ 11.1
Non-core i tems, net of tax - - - 65.3 - (2.5)
Operating earnings $ 20.5 $ 25.2 $ 20.6 $ 20.6 $ 5.9 $ 8.6
Mortgage Banking Segment:
Net income - as reported $ 5.3 $ 8.0 $ 18.9 $ 37.3 $ 1.7 $ (0.9)
Non-core i tems, net of tax - - - 31.8 - 0.6
Operating earnings $ 5.3 $ 8.0 $ 18.9 $ 5.5 $ 1.7 $ (0.3)
Operating Earnings
(mn)
Years Ended December 31,
Three Months Ended
March 31,
The following table presents a reconciliation of net income to operating earnings for our operating segments:
Non-GAAP Disclosure Reconciliations

30
Non-GAAP Disclosure Reconciliations
The following table reconciles tangible assets to total assets (mn):
March 31,
2014 2015 2016 2017 2018
Total assets - as reported $ 14,602 $ 15,585 $ 19,302 $ 20,087 $ 20,168
Less: goodwill 711 725 1,001 1,004 1,004
Less: other intangible assets, net of tax benefit 25 29 41 40 39
Tangible assets $ 13,866 $ 14,831 $ 18,260 $ 19,043 $ 19,125
December 31,
The following table reconciles tangible common equity to common stockholder’s equity (mn):
March 31,
2014 2015 2016 2017 2018
Common stockholders' equity - as reported $ 1,913 $ 1,972 $ 2,464 $ 2,700 $ 2,740
Less: goodwill 711 725 1,001 1,004 1,004
Less: other intangible assets, net of tax benefit 25 29 41 40 39
Tangible common equity $ 1,177 $ 1,218 $ 1,422 $ 1,656 $ 1,697
December 31,
31
Footnotes
1. Source: FDIC as of June 30, 2017.
2. Operating earnings is defined as net income as reported less non-core items, net of tax. Non-core items do not pertain to our core business
operations.
3. Excludes purchased credit-impaired loans.
4. The portion of commercial real estate (CRE) loans that are owner-occupied was approximately 31% ($1.3bn) at 3/31/2018. In the chart on slide
16, CRE other includes commercial property and land loans.
5. Excludes marketable equity securities and non-marketable FHLB and FRB stock. The Company has no direct exposure to the State of Illinois in
its investment securities portfolio, but approximately 19% of the state and political subdivisions municipal bonds consisted of securities issued
by municipalities located in Illinois as of March 31, 2018.
6. Source: Performance Trust Capital Partners. Peer set is all US Banks and excludes credit unions. Total 3 year portfolio average annual return of
2.99% (as of 4Q2017) ranks in 94th percentile of peer set.
7. Based on March 29, 2018 closing stock price of $40.48.
8. Net interest income sensitivity to interest rate changes reflects changes in the composition of interest earning assets and interest bearing
liabilities, related interest rates, repricing frequencies, and the fixed or variable characteristics of the interest earning assets and interest
bearing liabilities. The changes in net interest income incorporate the impact of loan floors as well as shifts from low-cost deposits to higher
cost certificates of deposit in a rising rate environment. The assumptions used in our interest rate sensitivity simulation are inherently
uncertain. Amount is pre-tax impact.
