Attached files
| file | filename |
|---|---|
| EX-21 - SUBSIDIARIES OF THE REGISTRANT - MB FINANCIAL INC /MD | exhibit21.htm |
| EX-23 - CONSENT OF MCGLADREY & PULLEN - MB FINANCIAL INC /MD | exhibit23.htm |
| EX-32 - SECTION 1350 CERTIFICATIONS - MB FINANCIAL INC /MD | exhibit32.htm |
| EX-24 - POWER OF ATTORNEY - MB FINANCIAL INC /MD | exhibit24.htm |
| EX-31.1 - CERTIFICATION OF CHEIF EXECUTIVE OFFICER - MB FINANCIAL INC /MD | exhibit31_1.htm |
| EX-99.1 - EXHIBIT 99.1 - MB FINANCIAL INC /MD | exhibit99_1.htm |
| EX-99.2 - EXHIBIT 99.2 - MB FINANCIAL INC /MD | exhibit99_2.htm |
| EX-31.2 - CERTIFICATION OF CHIEF FINANCIAL OFFICER - MB FINANCIAL INC /MD | exhibit31_2.htm |
| EX-10.11 - EXHIBIT10.11 - MB FINANCIAL INC /MD | exhibit10_11.htm |
| EX-10.12 - EXHIBIT 10.12 - MB FINANCIAL INC /MD | exhibit10_12.htm |
UNITED
STATES
SECURITIES
AND EXCHANGE COMMISSION
Washington,
D.C. 20549
___________
FORM
10-K
(Mark
One)
| x |
ANNUAL
REPORT PURSUANT TO SECTION 13 OR 15(d) OF THE SECURITIES EXCHANGE ACT OF
1934
|
|
|
For
the fiscal year ended December 31,
2009
|
|
|
OR
|
| o |
TRANSITION
REPORT PURSUANT TO SECTION 13 OR 15(d) OF THE SECURITIES EXCHANGE ACT OF
1934
|
|
|
For
the transition period from ____________ to
____________
|
Commission
file number 0-24566-01
MB
FINANCIAL, INC.
(Exact
name of registrant as specified in its charter)
|
Maryland
|
36-4460265
|
|
|
(State
or other jurisdiction of incorporation or organization)
|
(I.R.S.
Employer Identification No.)
|
|
|
800
West Madison Street, Chicago, Illinois
|
60607
|
|
|
(Address
of Principal Executive Offices)
|
(Zip
Code)
|
Registrant’s
telephone number, including area code: (888) 422-6562
Securities
registered pursuant to Section 12(b) of the Act:
|
Title of Each Class
|
Name of Each Exchange on Which
Registered
|
|
|
Common Stock, par value $0.01 per
share
|
The NASDAQ Stock Market
LLC
|
|
________________________________ _______________________________
Securities
registered pursuant to Section 12(g) of the Act:
None
(Title
of Class)
Indicate
by check mark if the registrant is a well-known seasoned issuer, as defined in
Rule 405 of the Securities Act. Yes x No o
Indicate
by check mark if the registrant is not required to file reports pursuant to
Section 13 or Section 15(d) of the Act. Yes o No x
Indicate
by check mark whether the registrant (1) has filed all reports required to be
filed by Section 13 or 15(d) of the Securities Exchange Act of 1934 during the
preceding 12 months (or for such shorter period that the registrant was required
to file such reports) and (2) has been subject to such filing requirements for
the past 90 days.
Yes x
No
o
Indicate
by check mark whether the registrant has submitted electronically and posted on
its corporate Web site, if any, every Interactive Data File required to be
submitted and posted pursuant to Rule 405 of Regulation S-T (§ 232.405 of this
chapter) during the preceding 12 months (or for such shorter period that the
registrant was required to submit and post such files).
Yes o No
o
Indicate
by check mark if disclosure of delinquent filers pursuant to Item 405 of
Regulation S-K is not contained herein, and will not be contained, to the best
of registrant’s knowledge, in definitive proxy or information statement
incorporated by reference in Part III of this Form 10-K or any amendment to this
Form 10-K. o
Indicate
by check mark whether the registrant is a large accelerated filer, an
accelerated filer, or a non-accelerated filer. See definition of
“accelerated filer and large accelerated filer” in Rule 12b-2 of the Exchange
Act. (Check one):
Large accelerated filer o Accelerated
filer x
Non-accelerated
filer o(Do not check if a
smaller reporting
company) Smaller
reporting company o
Indicate
by check mark whether the registrant is a shell company (as defined in Rule
12b-2 of the Act). Yes o No x
The
aggregate market value of the voting shares held by non-affiliates of the
Registrant was approximately $348,320,215 as of June 30, 2009, the last business
day of the Registrant’s most recently completed second fiscal
quarter. Solely for the purpose of this computation, it has been
assumed that executive officers and directors of the Registrant are
“affiliates”.
There
were issued and outstanding 51,664,092 shares of the Registrant’s common
stock as of March 3, 2010.
DOCUMENTS
INCORPORATED BY REFERENCE:
|
Document
|
Part of Form 10-K
|
||
|
Portions
of the definitive Proxy Statement to
|
|||
|
be
used in conjunction with the Registrant’s
|
|||
|
2010
Annual Meeting of Stockholders.
|
MB
FINANCIAL, INC. AND SUBSIDIARIES
FORM
10-K
December
31, 2009
|
Page
|
|||
|
Business....................................................................................................................................................................................................................................................................................................................
|
|||
|
Risk
Factors..............................................................................................................................................................................................................................................................................................................
|
|||
|
Unresolved
Staff
Comments..................................................................................................................................................................................................................................................................................
|
|||
|
Properties..................................................................................................................................................................................................................................................................................................................
|
|||
|
Legal
Proceedings...................................................................................................................................................................................................................................................................................................
|
|||
|
Reserved...................................................................................................................................................................................................................................................................................................................
|
|||
|
Market
for Registrant’s Common Equity, Related Stockholder Matters and Issuer
Purchases of Equity
Securities..............................................................................................................................
|
|||
|
Selected
Financial
Data...........................................................................................................................................................................................................................................................................................
|
|||
|
Management’s
Discussion and Analysis of Financial Condition and Results of
Operations....................................................................................................................................................................
|
|||
|
Quantitative
and Qualitative Disclosures about Market
Risk..........................................................................................................................................................................................................................
|
|||
|
Financial
Statements and Supplementary
Data...................................................................................................................................................................................................................................................
|
|||
|
Changes
in and Disagreements with Accountants on Accounting and Financial
Disclosure...................................................................................................................................................................
|
|||
|
Controls
and
Procedures........................................................................................................................................................................................................................................................................................
|
|||
|
Other
Information....................................................................................................................................................................................................................................................................................................
|
|||
|
Directors,
Executive Officers, and Corporate
Governance................................................................................................................................................................................................................................
|
|||
|
Executive
Compensation........................................................................................................................................................................................................................................................................................
|
|||
|
Security
Ownership of Certain Beneficial Owners, and Management and
Related Stockholder
Matters................................................................................................................................................
|
|||
|
Certain
Relationships, Related Transactions and Director
Independence.....................................................................................................................................................................................................
|
|||
|
Principal
Accountant Fees and
Services.............................................................................................................................................................................................................................................................
|
|||
|
Exhibits
and Financial Statement
Schedules.......................................................................................................................................................................................................................................................
|
|||
|
Signatures.................................................................................................................................................................................................................................................................................................................
|
|||
Special
Note Regarding Forward-Looking Statements
When used
in this Annual Report on Form 10-K and in other filings with the Securities and
Exchange Commission, in press releases or other public shareholder
communications, or in oral statements made with the approval of an authorized
executive officer, the words or phrases "believe," "will," "should," "will
likely result," "are expected to," "will continue," "is anticipated,"
"estimate," "project," "plans," or similar expressions are intended to identify
"forward-looking statements" within the meaning of the Private Securities
Litigation Reform Act of 1995. You are cautioned not to place undue reliance on
any forward-looking statements, which speak only as of the date
made. These statements may relate to MB Financial, Inc.’s future
financial performance, strategic plans or objectives, revenues or earnings
projections, or other financial items. By their nature, these
statements are subject to numerous uncertainties that could cause actual results
to differ materially from those anticipated in the statements.
Important
factors that could cause actual results to differ materially from the results
anticipated or projected include, but are not limited to, the following (1)
expected cost savings, synergies and other benefits from our merger and
acquisition activities might not be realized within the anticipated time frames
or at all, and costs or difficulties relating to integration matters, including
but not limited to customer and employee retention, might be greater than
expected; (2) the possibility that the expected benefits of the Heritage
Community Bank, InBank, Corus Bank, and Benchmark Bank transactions will not be
realized; (3) the possibility that the amounts of the gains, if any, we
ultimately realize on the Benchmark and InBank transactions will differ
materially from the recorded gains; (4) the credit risks of lending activities,
including changes in the level and direction of loan delinquencies and
write-offs and changes in estimates of the adequacy of the allowance for loan
losses, which could necessitate additional provisions for loan losses, resulting
both from loans we originate and loans we acquire from other financial
institutions; (5) results of examinations by the Office of Comptroller of
Currency, the Federal Reserve Board and other regulatory authorities, including
the possibility that any such regulatory authority may, among other things,
require us to increase our allowance for loan losses or write-down assets; (6)
competitive pressures among depository institutions; (7) interest rate movements
and their impact on customer behavior and net interest margin; (8) the impact of
repricing and competitors’ pricing initiatives on loan and deposit products; (9)
fluctuations in real estate values; (10) the ability to adapt successfully to
technological changes to meet customers’ needs and developments in the market
place; (11) our ability to realize the residual values of our direct finance,
leveraged, and operating leases; (12) our ability to access cost-effective
funding; (13) changes in financial markets; (14) changes in economic conditions
in general and in the Chicago metropolitan area in particular; (15) the costs,
effects and outcomes of litigation; (16) new legislation or regulatory changes,
including but not limited to changes in federal and/or state tax laws or
interpretations thereof by taxing authorities, changes in laws, rules or
regulations applicable to companies that have participated in the TARP Capital
Purchase Program of the U.S. Department of the Treasury and other governmental
initiatives affecting the financial services industry; (17) changes in
accounting principles, policies or guidelines; (18) our future acquisitions of
other depository institutions or lines of business; and (19) future goodwill
impairment due to changes in our business, changes in market conditions, or
other factors.
We do not
undertake any obligation to update any forward-looking statement to reflect
circumstances or events that occur after the date on which the forward-looking
statement is made.
General
MB
Financial, Inc., headquartered in Chicago, Illinois, is a financial holding
company with 86 banking offices located primarily in the Chicago
area. The words "MB Financial," "the Company," "we," "our"
and "us" refer to MB Financial, Inc. and its wholly owned subsidiaries, unless
we indicate otherwise. Our primary market is the Chicago metropolitan
area, in which we operate 88 banking offices through our bank subsidiary, MB
Financial Bank, N.A. (MB Financial Bank). MB Financial Bank also has
one banking office in the city of Philadelphia, Pennsylvania. Through
MB Financial Bank, we offer a broad range of financial services primarily to
small and middle market businesses and individuals in the markets that we
serve. Our primary lines of business include commercial banking,
retail banking and wealth management. As of December 31, 2009, we had
total assets of $10.9 billion, deposits of $8.7 billion, stockholders’ equity of
$1.3 billion, and $3.3 billion of client assets under administration in our
Wealth Management Group (including $1.8 billion in our trust department, $545
million in our broker/dealer subsidiary, Vision Investment Services, Inc., and
$902 million in our majority owned asset management firm, Cedar Hill Associates
LLC.
We
have grown significantly in the past several years through a number of
acquisitions, including the following most recent transactions:
|
·
|
In
August 2006, we acquired Oak Brook Bank, based in Oak Brook, Illinois, and
its parent First Oak Brook Bancshares, Inc. (FOBB), for $371.0
million. The purchase price was paid through a combination of
cash and our common stock totaling $74.1 million and $296.9 million,
respectively. Oak Brook Bank had assets of approximately $2.6
billion as of the acquisition date.
|
|
·
|
In
April 2008, we purchased an 80% interest in Cedar Hill Associates, LLC
(Cedar Hill), an asset management firm located in Chicago, Illinois, with
approximately $960 million in assets under
management.
|
|
·
|
In
February 2009, we assumed approximately $217 million of deposits of
Glenwood, Illinois-based Heritage Community Bank (Heritage), and acquired
loans of approximately $92.5 million in a loss-share transaction
facilitated by the Federal Deposit Insurance Corporation
(FDIC).
|
|
·
|
In
September 2009, we assumed approximately $135 million of deposits of Oak
Forest, Illinois-based InBank, and acquired loans of approximately $101
million in a transaction facilitated by the
FDIC.
|
|
·
|
In
September 2009, we assumed approximately $6.5 billion in deposits of
Chicago-based Corus Bank (Corus), and acquired loans of approximately
$26.1 million, in a transaction facilitated by the
FDIC. Deposits assumed in the Corus transaction decreased to
$2.1 billion at December 31, 2009. This decrease was expected
and was a result of us redeeming out-of-market certificates of
deposit assumed in the Corus transaction, the withdrawals of assumed
out-of-market money market accounts following our reduction in interest
rates paid on these deposits, and some in-market deposit run-off of
previously higher rate assumed deposits. We expect that we will
ultimately retain approximately $1.6 billion to $2.0 billion of the
deposits we assumed in the Corus
transaction.
|
|
·
|
In
December 2009, we assumed $164 million of deposits of Aurora,
Illinois-based Benchmark Bank (Benchmark), and acquired loans of
approximately $76 million in a loss-share transaction facilitated by the
FDIC.
|
In
November 2007, we sold Union Bank (Union), based in Oklahoma City, Oklahoma, for
$76.3 million in cash, resulting in an after-tax gain of $28.8
million. Union, a former subsidiary of MidCity Financial, had assets
of approximately $398.6 million as of the sale date.
In August
2009, we sold our merchant card processing business, resulting in an after-tax
gain of $6.2 million.
MB
Financial Bank, our largest subsidiary, has six wholly owned subsidiaries with
significant operating activities: MB Financial Center, LLC; MB Financial
Community Development Corporation; MBRE Holdings, LLC; LaSalle Systems Leasing,
Inc.; Vision Investment Services, Inc.; and Ashland Management Agency,
Inc.; MB Financial Bank also has a majority owned subsidiary with
significant operating activities, Cedar Hill Associates, LLC.
Ashland
Management Agency, Inc. holds and/or manages certain properties purchased by the
Company.
As noted
above, Cedar Hill is an asset management firm located in Chicago, Illinois that
we acquired in April 2008, with approximately $902 million in assets under
management at December 31, 2009.
LaSalle
Systems Leasing, Inc. (LaSalle) focuses primarily on leasing technology-related
equipment to middle market and larger businesses located throughout the United
States. During the second quarter of 2005, LaSalle, which was the
owner of 60% of LaSalle Business Solutions (LBS), purchased from the minority
owners the remaining 40% of LBS. LBS specializes in selling and
administering third party equipment maintenance contracts as well as
technology-related equipment. We acquired LaSalle in 2002.
MB
Financial Center LLC manages the real estate activities of our operations center
located in Rosemont, Illinois (See Item 2. Properties for additional
information).
MB
Financial Community Development Corporation engages in community lending and
makes equity investments to facilitate the construction and rehabilitation of
housing in low-to-moderate income neighborhoods in MB Financial Bank’s market
area.
MBRE
Holdings LLC, a Delaware limited liability company, was established in August
2002 as the holding company of MB Real Estate Holdings LLC, which is also a
Delaware limited liability company. MB Real Estate Holdings LLC and
MBRE Holdings LLC were established as part of an initiative to enhance our
earnings by providing alternative methods of raising capital and
funding. The assets of MB Real Estate Holdings LLC consist primarily
of 100% participation interests in commercial real estate loans, construction
real estate loans, residential real estate loans, commercial loans and lease
loans originated by MB Financial Bank and mortgage-backed
securities. MB Real Estate Holdings LLC has elected to be taxed as a
Real Estate Investment Trust for federal income tax purposes. The
management of MBRE Holdings LLC consists of certain officers of MB Financial and
MB Financial Bank who receive no compensation from MBRE Holdings LLC or MB Real
Estate Holdings LLC.
Vision
Investment Services, Inc. (Vision) is registered with the Securities and
Exchange Commission as a broker/dealer, is a member of the Financial Industry
Regulatory Authority, is a member of the Securities Investor Protection
Corporation, and is a licensed insurance agency. Vision has one
wholly owned subsidiary: Vision Insurance Services, Inc. Vision
Insurance Services, Inc. is a licensed insurance agency which functions as a
distribution firm for certain insurance and annuity products. Vision
was acquired in connection with our February 2003 acquisition of South Holland
Trust & Savings Bank (South Holland). Vision provides both
institutional and retail clients with investment and wealth management
services. It had $544.5 million in assets under administration at
December 31, 2009.
We also
own all of the issued and outstanding common securities of Coal City Capital
Trust I, MB Financial Capital Trust II, MB Financial Capital Trust III, MB
Financial Capital Trust IV, MB Financial Capital Trust V, MB Financial Capital
Trust VI, FOBB Capital Trust I, FOBB Capital Trust III, all statutory business
trusts formed for the purpose of issuing trust preferred
securities. See Note 13 of the notes to our
audited consolidated financial statements for additional
information.
Recent
Developments
On
January 27, 2010, the Company announced that it will pay a cash dividend of
$0.01 per share to shareholders of record as of February 15, 2010.
Primary
Lines of Business
Our
operations are currently managed as one unit and we have one reportable
segment. Our chief operating decision-makers use consolidated results
to make operating and strategic decisions.
We
concentrate on serving middle market businesses, leasing companies, and their
respective owners. We also serve consumers who live or work near our
branches. We have established three primary lines of business:
commercial banking; retail banking; and wealth management. Each is
described below.
Commercial
Banking. Commercial banking focuses on serving middle market
businesses, primarily located in the Chicago metropolitan area. We
provide a full set of credit, deposit, and treasury management products to these
companies. In general, our credit products are designed for companies
with annual revenues between $5 million and $100 million and credit needs of up
to $25 million. We have a broad range of credit products for our
target market, including working capital loans and lines of credit; accounts
receivable; inventory and equipment financing; industrial revenue bond
financing; business acquisition loans; owner occupied real estate loans; and
financial, performance and commercial letters of credit. Our deposit
and treasury management products are designed for companies with annual revenues
up to $500 million and include: internet banking products for businesses,
investment sweep accounts, zero balance accounts, automated tax payments, ATM
access, telephone banking, lockbox, automated clearing house transactions,
account reconciliation, controlled disbursement, detail and general information
reporting, wire transfers, a variety of international banking services, and
checking accounts. We also provide a full set of credit, deposit and
treasury management services for real estate operators and
investors.
Commercial
banking also serves small and medium size equipment leasing companies located
throughout the United States. We have provided banking services to
these companies for more than three decades. Competition in serving
equipment lessors generally comes from large banks, finance companies, large
industrial companies and some community banks. We compete based upon
rapid decision making and excellent service and by providing flexible financial
solutions to meet our customers’ needs. We provide full banking
services to leasing companies by financing the debt portion of leveraged
equipment leases (referred to as lease loans), providing short and long-term
equity financing and by making working capital and bridge loans. For
lease loans, a lessee’s credit is often rated as investment grade for its public
debt by Moody’s, Standard & Poors or the equivalent. If a lessee
does not have a public debt rating, they are subject to the same internal credit
analysis as any other customer of MB Financial Bank. We also invest
directly in equipment that we lease to other companies located throughout the
United States (referred to as operating leases). Our operating lease
portfolio is made up of various kinds of equipment, generally technology
related, such as computer systems, satellite equipment, and general
manufacturing equipment. We seek leasing transactions where we
believe the equipment leased is integral to the lessee’s business, thereby
increasing the likelihood of renewal at the end of the lease term.
Additionally,
LaSalle primarily focuses on leasing technology-related equipment to middle
market and larger businesses throughout the United States and provides us the
additional ability to directly originate leases.
Retail
Banking. Retail banking is made up of approximately 87 branch
offices spread principally throughout the Chicago metropolitan area with one
branch in Philadelphia, PA. Our target customer is the household looking
for a complete suite of deposit and lending products and customer service that
resembles that of a community bank. Our full line of consumer deposit
products consists of checking, savings, money market, time deposits and IRA
accounts. Our lead product for 2009 was “MB Red Checking”, an account that
rewarded customers with a high interest rate for meeting specified account
transaction criteria. Retail banking also serves our business customers
(under $10 million in revenues) that desire a full business product set and the
convenience of our branch network. Our business customers can choose from the
same business services available to our larger commercial businesses and receive
the attention within the local branch to which they are accustomed.
All of our deposit products are supported by an array of ancillary products:
“ibankmb.com” is our robust state of the art internet banking and bill payment
service provided to our customers at no cost, allowing them to bank 24/7 from
anywhere around the globe; “MB
Debit MasterCard®”offers purchasing power anywhere MasterCard is
accepted; “My Bank, My Rewards” allows our customers to earn rewards points for
all signature debit card purchases, redeemable for merchandise, gift cards and
travel; and e-statement, which conveniently delivers a paperless statement to
our customer’s email inbox.
Wealth
Management. Our Wealth Management Group provides coordinated
and integrated delivery of investment management, trust, brokerage and private
banking services. Our asset management and trust department offers a
wide range of financial services, including personal trust, investment
management, custody, estate settlement, guardianship, tax-deferred exchange and
retirement plan services. Our private banking department provides
qualified clients with personalized, “high touch” banking products and services,
including a private banker as a single point of contact for all their financial
services needs. MB Financial Bank subsidiaries Cedar Hill and Vision
provide clients with non-FDIC insured investment alternatives and insurance
products.
Lending
Activities
General. We are
primarily a commercial lender and our loan portfolio consists primarily of loans
to businesses or for business purposes.
Commercial
Lending. We make commercial loans to small and middle market
businesses most often located in the Chicago area. Borrowers tend to
be privately owned and are generally manufacturers, wholesalers, distributors,
long-term health care operators and service providers. Loan products
offered are primarily working capital and term loans and lines of credit that
help our customers finance accounts receivable, inventory and
equipment. We also offer financial, performance and commercial
letters of credit. Commercial loans secured by owner occupied real
estate are classified as commercial real estate loans in the loan portfolio
composition table in “Item 7. Management’s Discussion
and Analysis of Financial Condition and Results of Operations” and Note 6 to the audited consolidated financial statements in
“Item 8. Financial Statements and Supplementary Data”. Most
commercial loans are short-term in nature, being one year or less, with the
maximum term generally being five years. Our commercial loans have
typically ranged in size from $500 thousand to $15 million.
Lines of
credit for customers are typically secured, and are subject to renewal upon a
satisfactory review of the borrower’s financial condition and credit
history. Secured short-term commercial business loans are usually
collateralized by accounts receivable, inventory, equipment and/or real
estate. Such loans are typically, but not always, guaranteed by the
owners of the business. Collateral securing commercial loans may
depreciate over time, be difficult to appraise and fluctuate in value based on
the success of the business. In addition, in the case of loans
secured by accounts receivable, the availability of funds for the repayment of
these loans may be substantially dependent on the ability of the borrower to
collect the amounts due from its customers. Accordingly, we make our
commercial loans primarily based on the historical and expected cash flow of the
borrower, secondarily on underlying collateral provided by the borrower, and
lastly on guarantor support.
Commercial Real Estate
Lending. We originate commercial real estate loans that are
generally secured by multi-unit residential property and owner and non-owner
occupied commercial and industrial property. Longer term commercial
real estate loans are generally made at fixed rates, although some have interest
rates that change based on our Reference Rate or LIBOR. Generally,
terms of up to twenty-five years are offered on fully amortizing loans, but most
loans are structured with a balloon payment at the end of five years or
less. For our fixed rate loans with maturities greater than five
years, we may enter into an interest rate swap agreement with a third party to
mitigate interest rate risk. In deciding whether to make a commercial
real estate loan, we consider, among other things, the experience and
qualifications of the borrower as well as the value and cash flow of the
underlying property. Some factors considered are net operating income
of the property before debt service and depreciation, the debt service coverage
ratio (the ratio of the property’s net cash flow to debt service requirements),
the global cash flows of the borrower, the ratio of the loan amount to the
appraised value and the overall creditworthiness of the prospective
borrower. Our commercial real estate loans have typically ranged in
size from $250 thousand to $20 million.
The
repayment of commercial real estate loans is often dependent on the successful
operations of the property securing the loan or the business conducted on the
property securing the loan. These loans may therefore be more
adversely affected by conditions in real estate markets or in the economy in
general. For example, if the cash flow from the borrower’s project is
reduced due to leases not being obtained or renewed, the borrower’s ability to
repay a loan may be impaired. In addition, many commercial real
estate loans are not fully amortized over the loan period, but have balloon
payments due at maturity. A borrower’s ability to make a balloon
payment typically will depend on their ability to either refinance the loan or
complete a timely sale of the underlying property.
Construction Real
Estate. Historically we have provided construction loans for
the acquisition and development of land for further improvement of condominiums,
townhomes, and one-to-four family residences. We have also provided
acquisition, development and construction loans for retail and other commercial
purposes, primarily in our market areas. With regard to construction
lending, there were fewer new loans made during 2009 and 2008 compared to prior
years due to the unfavorable economic environment for new home sales and
commercial properties. Construction lending can involve a higher
level of risk than other types of lending because funds are advanced partially
based upon the value of the project, which is uncertain prior to the project’s
completion. Because of the uncertainties inherent in estimating
construction costs as well as the market value of a completed project and the
effects of governmental regulation of real property, our estimates with regards
to the total funds required to complete a project and the related loan-to-value
ratio may vary from actual results. As a result, construction loans
often involve the disbursement of substantial funds with repayment dependent, in
part, on the success of the ultimate project and the ability of the borrower to
sell or lease the property or refinance the indebtedness. If our
estimate of the value of a project at completion proves to be overstated or
market values have declined since we originated our loan, we may have inadequate
security for repayment of the loan and we may incur a loss.
Lease Loans. We
lend money to leasing companies to finance the debt portion of leases (which we
refer to as lease loans). A lease loan arises when a leasing company
discounts the equipment rental revenue stream owed to the leasing company by a
lessee. Lease loans generally are non-recourse to the leasing
company, and, consequently, our recourse is limited to the lessee and the leased
equipment. For this reason, we underwrite lease loans by examining
the creditworthiness of the lessee rather than the lessor. Generally,
lease loans are secured by an assignment of lease payments and a security
interest in the equipment being leased. As with commercial loans
secured by equipment, equipment securing our lease loans may depreciate over
time, may be difficult to appraise and may fluctuate in value. We
rely on the lessee’s continuing financial stability, rather than the value of
the leased equipment, for repayment of all required amounts under lease
loans. In the event of default, it is unlikely that the proceeds from
the sale of leased equipment will be sufficient to satisfy the outstanding
unpaid amounts under terms of the lease loan.
The
lessee acknowledges the bank’s security interest in the leased equipment and
normally agrees to send lease payments directly to us. Lessees tend
to be companies that have an investment grade public debt rating by
Moody’s or Standard & Poors or the equivalent, though, we also provide
credit to below investment grade and non-rated companies as well. If
the lessee does not have a public debt rating, they are subject to the same
internal credit analysis as any other customer. Lease loans almost
always are fully amortizing, with maturities typically ranging from three to
five years. Loan interest rates are fixed.
We also
invest directly in equipment leased to other companies (which we refer to as
operating leases). The profitability of these investments depends, to
a great degree, upon our ability to realize the expected residual values of this
equipment. See “Item 7. Management’s Discussion and Analysis of
Financial Condition and Results of Operations-Critical Accounting Policies-Residual Value of Our Direct Finance, Leveraged and Operating
Leases.”
Residential Real
Estate. We also originate fixed and adjustable rate
residential real estate loans secured by one to four family homes. Terms
of first mortgages range from five to thirty years. In deciding whether to
make a residential real estate loan, we consider the qualifications of the
borrower as well as the value of the underlying property. Our general
practice is to sell the majority of our newly originated fixed-rate residential
real estate loans shortly after they are funded and to hold in portfolio some
adjustable rate residential real estate loans. On a limited basis we hold loans
with 15 and 30 year maturities.
Consumer
Lending. Our consumer loan portfolio is primarily focused on
home equity lines of credit, fixed-rate second mortgage loans, indirect vehicle
loans, and to a lesser extent, secured and unsecured consumer
loans. Home equity lines of credit are generally extended up to 80%
of the appraised value of the property, less existing liens. Indirect
vehicle loans represent consumer loans made primarily through a network of
motorcycle dealers in 46 states. Consumer loans typically have
shorter terms and lower balances with higher yields as compared to residential
real estate loans, but carry a higher risk of default. Terms for
second mortgages typically range from five to ten years. Consumer
loan collections are dependent on the borrower’s continuing financial stability,
and thus, are more likely to be affected by adverse personal
circumstances. Furthermore, the application of various federal and
state laws, including bankruptcy and insolvency laws, may limit the amount which
can be recovered on these loans.
Foreign
Operations
MB
Financial Bank holds certain commercial real estate loans, residential real
estate loans, other loans and mortgage-backed investment securities in a real
estate investment trust through its wholly owned subsidiary MBRE Holdings LLC
headquartered and domiciled in Freeport, The Bahamas. MBRE Holdings
LLC and its subsidiary, MB Real Estate Holdings LLC, provide us with alternative
methods for raising capital and funding. We do not engage in
operations in any other foreign countries.
Competition
We face
substantial competition in all phases of our operations, including deposit
gathering and loan origination, from a variety of
competitors. Commercial banks, savings institutions, brokerage firms,
credit unions, mutual fund companies, insurance companies and specialty finance
companies all compete with us for new and existing customers. Our
bank competes by providing quality services to our customers, ease of access to
our facilities, convenient hours and competitive pricing of services (including
interest rates paid on deposits, interest rates charged on loans and fees
charged for other non-interest related services).
Personnel
As of
December 31, 2009, we and our subsidiaries employed a total of 1,638 full-time
equivalent employees. We consider our relationship with our employees
to be good.
We, our
subsidiary bank, and its subsidiaries, are subject to an extensive system of
laws and regulations that are intended primarily for the protection of customers
and depositors and not for the protection of security holders. These
laws and regulations govern such areas as capital, permissible activities,
allowance for loan losses, loans and investments, and rates of interest that can
be charged on loans. Described below are elements of selected laws
and regulations. The descriptions are not intended to be complete and
are qualified in their entirety by reference to the full text of the statutes
and regulations described.
Holding Company
Regulation. As a bank holding
company and financial holding company, we are subject to comprehensive
regulation by the Board of Governors of the Federal Reserve System, frequently
referred to as the Federal Reserve Board, under the Bank Holding Company Act of
1956, as amended by the Gramm-Leach-Bliley Act of 1999. We must file
reports with the Federal Reserve Board and such additional information as the
Federal Reserve Board may require, and our holding company and non-banking
affiliates are subject to examination by the Federal Reserve
Board. Under Federal Reserve Board policy, a bank holding company
must serve as a source of strength for its subsidiary banks. Under
this policy, the Federal Reserve Board may require, and has required in the
past, a holding company to contribute additional capital to an undercapitalized
subsidiary bank. The Bank Holding Company Act provides that a bank
holding company must obtain Federal Reserve Board approval before:
|
·
|
Acquiring
directly or indirectly, ownership or control of any voting shares of
another bank or bank holding company if, after such acquisition, it would
own or control more than 5% of such shares (unless it already owns or
controls the majority of such
shares);
|
|
·
|
Acquiring
all or substantially all of the assets of another bank or bank holding
company, or
|
|
·
|
Merging
or consolidating with another bank holding
company.
|
The Bank Holding Company Act generally prohibits a bank holding company from acquiring direct or indirect ownership or control of more than 5% of the voting shares of any company which is not a bank or bank holding company, or from engaging directly or indirectly in activities other than those of banking, managing or controlling banks, or providing services for its subsidiaries. The principal exceptions to these prohibitions involve certain non-bank activities which, by statute or by Federal Reserve Board regulation or order, have been identified as activities closely related to the business of banking or managing or controlling banks. The list of activities permitted by the Federal Reserve Board includes, among other things: lending; operating a savings institution, mortgage company, finance company, credit card company or factoring company; performing certain data processing operations; providing certain investment and financial advice; underwriting and acting as an insurance agent for certain types of credit-related insurance; leasing property on a full-payout, non-operating basis; selling money orders, travelers’ checks and United States Savings Bonds; real estate and personal property appraising; providing tax planning and preparation services; and, subject to certain limitations, providing securities brokerage services for customers. These activities may also be affected by federal legislation.
In
November 1999, the Gramm-Leach-Bliley Act became law. The
Gramm-Leach-Bliley Act is intended to, among other things, facilitate
affiliations among banks, securities firms, insurance firms and other financial
companies. To further this goal, the Gramm-Leach-Bliley Act amended
portions of the Bank Holding Company Act of 1956 to authorize bank holding
companies, such as us, directly or through non-bank subsidiaries to engage in
securities, insurance and other activities that are financial in nature or
incidental to a financial activity. In order to undertake these
activities, a bank holding company must become a "financial holding company" by
submitting to the appropriate Federal Reserve Bank a declaration that the
company elects to be a financial holding company and a certification that all of
the depository institutions controlled by the company are well capitalized and
well managed. We submitted the declaration of our election to become
a financial holding company with the Federal Reserve Bank of Chicago in June
2002, and our election became effective in July 2002.
Depository Institution
Regulation. Our bank subsidiary is
subject to regulation by the Office of the Comptroller of the Currency and the
Federal Deposit Insurance Corporation. This regulatory structure
includes:
|
·
|
Real
estate lending standards, which provide guidelines concerning
loan-to-value ratios for various types of real estate
loans;
|
|
·
|
Risk-based
capital rules, including accounting for interest rate risk, concentration
of credit risk and the risks posed by non-traditional
activities;
|
|
·
|
Rules
requiring depository institutions to develop and implement internal
procedures to evaluate and control credit and settlement exposure to their
correspondent banks;
|
|
·
|
Rules
restricting types and amounts of equity investments;
and
|
|
·
|
Rules
addressing various safety and soundness issues, including operations and
managerial standards, standards for asset quality, earnings and
compensation standards.
|
Capital
Adequacy. The Federal Reserve Board, Office of the Comptroller
of the Currency and Federal Deposit Insurance Corporation have issued
substantially similar risk-based and leverage capital guidelines applicable to
bank holding companies and banks. In addition, these regulatory
agencies may from time to time require that a bank holding company or bank
maintain capital above the minimum levels, based on its financial condition or
actual or anticipated growth.
The
Federal Reserve Board's risk-based guidelines establish a two-tier capital
framework. Tier 1 capital generally consists of common stockholders'
equity, retained earnings, a limited amount of qualifying perpetual preferred
stock, qualifying trust preferred securities and noncontrolling interests in the
equity accounts of consolidated subsidiaries, less goodwill and certain
intangibles. Tier 2 capital generally consists of certain hybrid
capital instruments and perpetual debt, mandatory convertible debt securities
and a limited amount of subordinated debt, qualifying preferred stock, loan loss
allowance, and unrealized holding gains on certain equity
securities. The sum of Tier 1 and Tier 2 capital represents
qualifying total capital, at least 50% of which must consist of Tier 1
capital.
Risk-based
capital ratios are calculated by dividing Tier 1 and total capital by
risk-weighted assets. Assets and off-balance sheet exposures are
assigned to one of four categories of risk-weights, based primarily on relative
credit risk. For bank holding companies, generally the minimum Tier 1
risk-based capital ratio is 4% and the minimum total risk-based capital ratio is
8%. Our Tier 1 and total risk-based capital ratios under these
guidelines at December 31, 2009 were 13.51% and 15.45%,
respectively.
The
Federal Reserve Board’s leverage capital guidelines establish a minimum leverage
ratio determined by dividing Tier 1 capital by adjusted average total
assets. The minimum leverage ratio is 3% for bank holding companies
that meet certain specified criteria, including having the highest regulatory
rating. All other bank holding companies generally are required to
maintain a leverage ratio of at least 4%. At December 31, 2009, we
had a leverage ratio of 8.71%.
The
federal regulatory authorities’ risk-based capital guidelines are based upon the
1988 capital accord (“Basel I”) of the Basel Committee on Banking
Supervision (the “Basel Committee”). The Basel Committee is a committee of
central banks and bank supervisors/regulators from the major industrialized
countries that develops broad policy guidelines for use by each country’s
supervisors in determining the supervisory policies they apply. In 2004, the
Basel Committee published a new capital accord (“Basel II”) to replace
Basel I. Basel II provides two approaches for setting capital
standards for credit risk – an internal ratings-based approach tailored to
individual institutions’ circumstances and a standardized approach that bases
risk weightings on external credit assessments to a much greater extent than
permitted in existing risk-based capital guidelines. Basel II also would set
capital requirements for operational risk and refine the existing capital
requirements for market risk exposures.
A
definitive final rule for implementing the advanced approaches of Basel II
in the United States, which applies only to certain large or internationally
active banking organizations, or “core banks” – defined as those with
consolidated total assets of $250 billion or more or consolidated on-balance
sheet foreign exposures of $10 billion or more, became effective as of
April 1, 2008. Other U.S. banking organizations may elect to adopt the
requirements of this rule (if they meet applicable qualification requirements),
but they are not required to apply them. The rule also allows a banking
organization’s primary federal supervisor to determine that the application of
the rule would not be appropriate in light of the bank’s asset size, level of
complexity, risk profile, or scope of operations. The Company is not required to
comply with the advanced approaches of Basel II.
In July
2008, the agencies issued a proposed rule that would give banking organizations
that do not use the advanced approaches the option to implement a new risk-based
capital framework. This framework would adopt the standardized approach of
Basel II for credit risk, the basic indicator approach of Basel II for
operational risk, and related disclosure requirements. While this proposed rule
generally parallels the relevant approaches under Basel II, it diverges
where United States markets have unique characteristics and risk profiles, most
notably with respect to risk weighting residential mortgage exposures. Comments
on the proposed rule were due to the agencies by October 27, 2008, but a
definitive final rule has not been issued. The proposed rule, if adopted, would
replace the agencies’ earlier proposed amendments to existing risk-based capital
guidelines to make them more risk sensitive (formerly referred to as the
“Basel I-A” approach).
On
September 3, 2009, the United States Treasury Department issued a policy
statement (the “Treasury Policy Statement”) entitled “Principles for Reforming
the U.S. and International Regulatory Capital Framework for Banking Firms.” The
Treasury Policy Statement was developed in consultation with the U.S. bank
regulatory agencies and contemplates changes to the existing regulatory capital
regime that would involve substantial revisions to, if not replacement of, major
parts of the Basel I and Basel II capital frameworks and affects all
regulated banking organizations and other systemically important institutions.
The Treasury Policy Statement calls for, among other things, higher and stronger
capital requirements for all banking firms. The Treasury Policy Statement
suggested that changes to the regulatory capital framework be phased in over a
period of several years. The recommended schedule provides for a comprehensive
international agreement by December 31, 2010, with the implementation of
reforms by December 31, 2012, although it does remain possible that U.S.
bank regulatory agencies could officially adopt, or informally implement, new
capital standards at an earlier date.
On
December 17, 2009, the Basel Committee issued a set of proposals (the
“Capital Proposals”) that would significantly revise the definitions of
Tier 1 capital and Tier 2 capital, with the most significant changes
being to Tier 1 capital. Most notably, the Capital Proposals would
disqualify certain structured capital instruments, such as trust preferred
securities, from Tier 1 capital status. The Capital Proposals would also
re-emphasize that common equity is the predominant component of Tier 1
capital by adding a minimum common equity to risk-weighted assets ratio and
requiring that goodwill, general intangibles and certain other items that
currently must be deducted from Tier 1 capital instead be deducted from
common equity as a component of Tier 1 capital. The Capital Proposals also
suggest the possibility that the current minimum Tier 1 capital and total
capital ratios of 4.0% and 8.0%, respectively, may be increased.
Concurrently
with the release of the Capital Proposals, the Basel Committee also released a
set of proposals related to liquidity risk exposure (the “Liquidity Proposals,”
and together with the Capital Proposals, the “2009 Basel Committee Proposals”).
The Liquidity Proposals have three key elements, including the implementation of
(i) a “liquidity coverage ratio” designed to ensure that a bank maintains
an adequate level of unencumbered, high-quality assets sufficient to meet the
bank’s liquidity needs over a 30-day time horizon under an acute liquidity
stress scenario, (ii) a “net stable funding ratio” designed to promote more
medium and long-term funding of the assets and activities of banks over a
one-year time horizon, and (iii) a set of monitoring tools that the Basel
Committee indicates should be considered as the minimum types of information
that banks should report to supervisors and that supervisors should use in
monitoring the liquidity risk profiles of supervised entities.
Comments
on the 2009 Basel Committee Proposals are due by April 16, 2010, with the
expectation that the Basel Committee will release a comprehensive set of
proposals by December 31, 2010 and that final provisions will be
implemented by December 31, 2012. The U.S. bank regulators have urged
comment on the 2009 Basel Committee Proposals. Ultimate implementation of such
proposals in the U.S. will be subject to the discretion of the U.S. bank
regulators and the regulations or guidelines adopted by such agencies may, of
course, differ from the 2009 Basel Committee Proposals and other proposals that
the Basel Committee may promulgate in the future.
Prompt Corrective
Action. The Federal Deposit Insurance Corporation Improvement
Act of 1991, among other things, identifies five capital categories for insured
depository institutions (well capitalized, adequately capitalized,
undercapitalized, significantly undercapitalized and critically
undercapitalized) and requires the respective federal bank regulatory agencies
to implement systems for "prompt corrective action" for insured depository
institutions that do not meet minimum capital requirements within these
categories. This act imposes progressively more restrictive
constraints on operations, management and capital distributions, depending on
the category in which an institution is classified. Failure to meet
the capital guidelines could also subject a banking institution to capital
raising requirements. An "undercapitalized" bank must develop a
capital restoration plan and its parent holding company must guarantee that
bank's compliance with the plan. The liability of the parent holding
company under any such guarantee is limited to the lesser of five percent of the
bank's assets at the time it became "undercapitalized" or the amount needed to
comply with the plan. Furthermore, in the event of the bankruptcy of
the parent holding company, such guarantee would take priority over the parent's
general unsecured creditors. In addition, the Federal Deposit
Insurance Corporation Improvement Act requires the various regulatory agencies
to prescribe certain non-capital standards for safety and soundness relating
generally to operations and management, asset quality and executive compensation
and permits regulatory action against a financial institution that does not meet
these standards.
The
various federal bank regulatory agencies have adopted substantially similar
regulations that define the five capital categories identified by the Federal
Deposit Insurance Corporation Improvement Act, using the total risk-based
capital, Tier 1 risk-based capital and leverage capital ratios as the relevant
capital measures. These regulations establish various degrees of
corrective action to be taken when an institution is considered
undercapitalized. Under the regulations, a "well capitalized"
institution must have a Tier 1 risk-based capital ratio of at least 6%, a total
risk-based capital ratio of at least 10% and a leverage ratio of at least 5% and
not be subject to a capital directive or order. An institution is
"adequately capitalized" if it has a Tier 1 risk-based capital ratio of at least
4%, a total risk-based capital ratio of at least 8% and a leverage ratio of at
least 4% (3% in certain circumstances). An institution is
“undercapitalized” if it has a Tier 1 risk-based capital ratio of less than 4%,
a total risk-based capital ratio of less than 8% or a leverage ratio of less
than 4% (3% in certain circumstances). An institution is
"significantly undercapitalized" if it has a Tier 1 risk-based capital ratio of
less than 3%, a total risk-based capital ratio of less than 6% or a leverage
ratio of less than 3%. An institution is "critically
undercapitalized" if its tangible equity is equal to or less than 2% of total
assets. Generally, an institution may be reclassified in a lower
capitalization category if it is determined that the institution is in an unsafe
or unsound condition or engaged in an unsafe or unsound practice.
As of
December 31, 2009, our subsidiary bank met the requirements to be classified as
“well-capitalized.”
Dividends. The Federal Reserve Board's
policy is that a bank holding company should pay cash dividends only to the
extent that its net income for the past year is sufficient to cover both the
cash dividends and a rate of earnings retention that is consistent with the
holding company's capital needs, asset quality and overall financial condition,
and that it is inappropriate for a bank holding company experiencing serious
financial problems to borrow funds to pay dividends. Furthermore, a
bank that is classified under the prompt corrective action regulations as
"undercapitalized" will be prohibited from paying any dividends.
On
December 5, 2008, as part of the Troubled Asset Relief Program (“TARP”) Capital
Purchase Program of the United States Department of the Treasury (“Treasury”),
the Company sold to Treasury 196,000 shares of the Company’s Fixed Rate
Cumulative Perpetual Preferred Stock, Series A (the “Series A Preferred Stock”),
having a liquidation preference amount of $1,000 per share, for a purchase price
of $196.0 million in cash and (ii) issued to Treasury a ten-year warrant to
purchase 1,012,048 shares (which was subsequently reduced to 506,024 shares, as
explained below) of the Company’s common stock at an exercise price
of $29.05 per share (the “Warrant”).
The
Company may redeem the Series A Preferred Stock at any time by repaying the
Treasury, without penalty, subject to the Treasury’s consultation with the
Company’s appropriate regulatory agency. Additionally, upon
redemption of the Series A Preferred Stock, the Warrant may be repurchased from
the Treasury at its fair market value as agreed-upon by the Company and the
Treasury.
On
September 17, 2009, the Company completed a public offering of its common stock
by issuing 12,578,125 shares of common stock for aggregate gross proceeds of
$201.3 million. The net proceeds to the Company after deducting
underwriting discounts and commissions and offering expenses were $190.9
million. With the proceeds from this offering and the proceeds
received by the Company from issuances pursuant to its Dividend Reinvestment and
Stock Purchase Plan, the Company has received aggregate gross proceeds from
“Qualified Equity Offerings” in excess of the $196.0 million aggregate
liquidation preference amount of the Series A Preferred Stock. As a
result, the number of shares of the Company’s common stock underlying the
Warrant has been reduced by 50%, from 1,012,048 shares to 506,024
shares.
The
securities purchase agreement between us and Treasury provides that prior to the
earlier of (i) December 5, 2011 and (ii) the date on which all of the shares of
the Series A Preferred Stock have been redeemed by us or transferred by Treasury
to third parties, we may not, without the consent of Treasury, (a) pay a
quarterly cash dividend on our common stock of more than $0.18 per share or (b)
subject to limited exceptions, redeem, repurchase or otherwise acquire shares of
our common stock or preferred stock, other than the Series A Preferred Stock, or
trust preferred securities. In addition, under the terms of the
Series A Preferred Stock, we may not pay dividends on our common stock at any
time we are in arrears on the dividends payable on the Series A Preferred
Stock. Dividends on the Series A Preferred Stock are payable
quarterly at a rate of 5% per annum for the first five years and a rate of 9%
per annum thereafter if not redeemed prior to that time.
Our
primary source for cash dividends is the dividends we receive from our
subsidiary bank. Our bank is subject to various regulatory policies
and requirements relating to the payment of dividends, including requirements to
maintain capital above regulatory minimums. A national bank must
obtain the approval of the Office of the Comptroller of the Currency prior to
paying a dividend if the total of all dividends declared by the national bank in
any calendar year will exceed the sum of the bank’s net profits for that year
and its retained net profits for the preceding two calendar years, less any
required transfers to surplus.
Federal Deposit Insurance
Reform. The FDIC currently maintains the Deposit Insurance
Fund (the “DIF”), which was created in 2006 in the merger of the Bank Insurance
Fund and the Savings Association Insurance Fund. The deposit accounts
of our subsidiary bank are insured by the DIF to the maximum amount provided by
law. This insurance is backed by the full faith and credit of the
United States Government.
As
insurer, the FDIC is authorized to conduct examinations of and to require
reporting by DIF-insured institutions. It also may prohibit any
DIF-insured institution from engaging in any activity the FDIC determines by
regulation or order to pose a serious threat to the DIF. The FDIC
also has the authority to take enforcement actions against insured
institutions.
In
February 2009, the FDIC adopted a final regulation that provided for the
replenishment of the Deposit Insurance Fund over a period of seven years. The
restoration plan changed the FDIC’s base assessment rates and the risk-based
assessment system. The risk-based premium system provides for quarterly
assessments based on an insured institution’s ranking in one of four risk
categories based upon supervisory and capital evaluations. The assessment rate
for an individual institution is determined according to a formula based on a
weighted average of the institution’s individual CAMELS component ratings plus
either six financial ratios or, in the case of an institution with assets of
$10.0 billion or more, the average ratings of its long-term debt.
Well-capitalized institutions (generally those with CAMELS composite ratings of
1 or 2) are grouped in Risk Category I and their initial base assessment rate
for deposit insurance is set at an annual rate of between 12 and 16 basis
points. The initial base assessment rate for institutions in Risk Categories II,
III and IV is set at annual rates of 22, 32 and 50 basis points, respectively.
These initial base assessment rates are adjusted to determine an institution’s
final assessment rate based on its brokered deposits, secured liabilities and
unsecured debt. The adjustments include higher premiums for institutions that
rely significantly on excessive amounts of brokered deposits, including CDARS,
higher premiums for excessive use of secured liabilities, including Federal Home
Loan Bank advances and adding financial ratios and debt issuer ratings to the
premium calculations for banks with over $10 billion in assets, while providing
a reduction for all institutions for their unsecured debt. Total base
assessment rates after adjustments range from 7 to 24 basis points for Risk
Category I, 17 to 43 basis points for Risk Category II, 27 to 58 basis points
for Risk Category III, and 40 to 77.5 basis points for Risk Category
IV. Rates increase uniformly by 3 basis points effective January 1,
2011.
In
addition, all institutions with deposits insured by the FDIC are required to pay
assessments to fund interest payments on bonds issued by the Financing
Corporation, a mixed-ownership government corporation established to
recapitalize a predecessor to the Deposit Insurance Fund. These
assessments will continue until the Financing Corporation bonds mature in
2019.
Insurance
of deposits may be terminated by the FDIC upon a finding that the institution
has engaged or is engaging in unsafe and unsound practices, is in an unsafe or
unsound condition to continue operations or has violated any applicable law,
regulation, rule, order or condition imposed by the FDIC or written agreement
entered into with the FDIC. The management of the Bank does not know of any
practice, condition or violation that might lead to termination of deposit
insurance.
On
May 22, 2009, the FDIC announced a five basis point special assessment on
each insured depository institution’s assets minus its Tier 1 capital as of
June 30, 2009. The FDIC collected MB Financial Bank’s special assessment
amounting to $3.9 million on September 30, 2009. The special assessment was
fully expensed by the Company in the second quarter of 2009.
On
November 12, 2009, the FDIC adopted regulations that required insured
depository institutions to prepay on December 30, 2009, their estimated
quarterly risk-based assessments for the fourth quarter of 2009 and all of 2010,
2011 and 2012, along with their quarterly risk-based assessment for the fourth
quarter of 2009. The FDIC collected MB Financial Bank’s pre-paid assessments
amounting to $45.0 million on December 30, 2009. The prepaid
assessments will be expensed over the three year period.
Temporary Liquidity Guarantee
Program. On November 21, 2008, the Board of Directors of the
FDIC adopted a final rule relating to the Temporary Liquidity Guarantee Program
(“TLG Program”). The TLG Program was announced by the FDIC in October 2008,
preceded by the determination of systemic risk by the Secretary of the
Department of Treasury (after consultation with the President), as an initiative
to counter the system-wide crisis in the nation’s financial sector. Under the
TLG Program, the FDIC will (i) guarantee, through the earlier of
maturity or December 31, 2012 (extended from June 30, 2012 by
subsequent amendment), certain newly issued senior unsecured debt issued by
participating institutions on or after October 14, 2008, and before
October 31, 2009 (extended from June 30, 2009 by subsequent amendment)
and (ii) provide full FDIC deposit insurance coverage for non-interest
bearing transaction deposit accounts, Negotiable Order of Withdrawal (“NOW”)
accounts paying a maximum of 0.5% interest per annum and Interest on Lawyers
Trust Accounts held at participating FDIC insured institutions through
June 30, 2010 (extended from December 31, 2009, subject to an opt-out
provision, by subsequent amendment). The Company did not issue any debt pursuant
to the guaranteed debt program. The Company elected not to opt out of
the six-month extension of the transaction account guarantee program. Coverage
under the TLG Program was available for the first 30 days without
charge. The fee assessment for coverage of senior unsecured debt ranged from
50 basis points to 100 basis points per annum, depending on the
initial maturity of the debt. The fee for full deposit insurance coverage for
such transaction accounts was 10 basis points per quarter during 2009 on
amounts in covered accounts exceeding $250,000. During the six –
month extension period in 2010, the fees for participating banks will range from
15 to 25 basis points, depending on the risk category to which the bank is
assigned for deposit insurance assessment purposes.
Transactions with
Affiliates. We and our subsidiary bank are affiliates within
the meaning of the Federal Reserve Act. The Federal Reserve Act
imposes limitations on a bank with respect to extensions of credit to,
investments in, and certain other transactions with, its parent bank holding
company and the holding company’s other subsidiaries. Furthermore,
bank loans and extensions of credit to affiliates also are subject to various
collateral requirements.
Community Reinvestment
Act. Under the Community Reinvestment Act, every Federal
Deposit Insurance Corporation-insured institution is obligated, consistent with
safe and sound banking practices, to help meet the credit needs of its entire
community, including low and moderate income neighborhoods. The
Community Reinvestment Act requires the appropriate federal banking regulator,
in connection with the examination of an insured institution, to assess the
institution’s record of meeting the credit needs of its community and to
consider this record in its evaluation of certain applications, such as a merger
or the establishment of a branch. An unsatisfactory rating may be
used as the basis for the denial of an application and will prevent a bank
holding company of the institution from making an election to become a financial
holding company.
As of its last examination, MB Financial Bank received a Community
Reinvestment Act rating of “outstanding.”
Interstate Banking and
Branching. The Federal Reserve Board may approve an
application of a bank holding company to acquire control of, or acquire all or
substantially all of the assets of, a bank located in a state other than the
bank holding company's home state, without regard to whether the transaction is
prohibited by the laws of any state. The Federal Reserve Board may
not approve the acquisition of a bank that has not been in existence for the
minimum time period (not exceeding five years) specified by the law of the
target bank’s home state. The Federal Reserve Board also may not
approve an application if the bank holding company (and its bank affiliates)
controls or would control more than ten percent of the insured deposits in the
United States or, generally, 30% or more of the deposits in the target bank's
home state or in any state in which the target bank maintains a
branch. Individual states may waive the 30% statewide concentration
limit. Each state may limit the percentage of total insured deposits
in the state that may be held or controlled by a bank or bank holding company to
the extent the limitation does not discriminate against out-of-state banks or
bank holding companies. De novo branching by a bank outside of its
home state is generally subject to the law of the state where a branch is to be
located as well as federal law.
The
federal banking agencies are authorized to approve interstate bank merger
transactions without regard to whether these transactions are prohibited by the
law of any state, unless the home state of one of the banks opted out of
interstate mergers prior to June 1, 1997. Interstate acquisitions of
branches are permitted only if the law of the state in which the branch is
located permits these acquisitions. Interstate mergers and branch
acquisitions are subject to the nationwide and statewide-insured deposit
concentration limits described above.
Privacy
Rules. Federal banking regulators, as required under the
Gramm-Leach-Bliley Act, have adopted rules limiting the ability of banks and
other financial institutions to disclose nonpublic information about consumers
to non-affiliated third parties. The rules require disclosure of
privacy policies to consumers and, in some circumstances, allow consumers to
prevent disclosure of certain personal information to non-affiliated third
parties. The privacy provisions of the Gramm-Leach-Bliley Act affect
how consumer information is transmitted through diversified financial services
companies and conveyed to outside vendors.
International Money Laundering
Abatement and Financial Anti-Terrorism Act of 2001. The
President signed the USA Patriot Act of 2001 into law in October
2001. This act contains the International Money Laundering Abatement
and Financial Anti-Terrorism Act of 2001 (the “IMLAFA”). The IMLAFA
substantially broadens existing anti-money laundering legislation and the
extraterritorial jurisdiction of the United States, imposes new compliance and
due diligence obligations, creates new crimes and penalties, compels the
production of documents located both inside and outside the United States,
including those of foreign institutions that have a correspondent relationship
in the United States, and clarifies the safe harbor from civil liability to
customers. The U.S. Treasury Department has issued a number of
regulations implementing the USA Patriot Act that apply certain of its
requirements to financial institutions such as our banking and broker-dealer
subsidiaries. The regulations impose obligations on financial
institutions to maintain appropriate policies, procedures and controls to
detect, prevent and report money laundering and terrorist
financing. The increased obligations of financial institutions,
including us, to identify their customers, watch for and report suspicious
transactions, respond to requests for information by regulatory authorities and
law enforcement agencies, and share information with other financial
institutions, requires the implementation and maintenance of internal
procedures, practices and controls which have increased, and may continue to
increase, our costs and may subject us to liability.
As noted
above, enforcement and compliance-related activity by government agencies has
increased. Money laundering and anti-terrorism compliance is among the areas
receiving a high level of focus in the present environment.
Regulatory
Reform. In June 2009, the U.S. President’s administration
proposed a wide range of regulatory reforms that, if enacted, may have
significant effects on the financial services industry in the United States.
Significant aspects of the administration’s proposals that may affect the
Company included, among other things, proposals: (i) to reassess and
increase capital requirements for banks and bank holding companies and examine
the types of instruments that qualify as regulatory capital; (ii) to
combine the OCC and the Office of Thrift Supervision into a National Bank
Supervisor with a unified federal bank charter; (iii) to expand the current
eligibility requirements for financial holding companies, such as MB Financial,
so that the financial holding company must be “well capitalized” and “well
managed” on a consolidated basis; (iv) to create a federal consumer
financial protection agency to be the primary federal consumer protection
supervisor with broad examination, supervision and enforcement authority with
respect to consumer financial products and services; (v) to further limit
the ability of banks to engage in transactions with affiliates; and (vi) to
subject all “over-the-counter” derivatives markets to comprehensive
regulation.
The U.S.
Congress, state lawmaking bodies and federal and state regulatory agencies
continue to consider a number of wide-ranging and comprehensive proposals for
altering the structure, regulation and competitive relationships of the nation’s
financial institutions, including rules and regulations related to the
administration’s proposals. Various financial reform bills intended to address
the proposals set forth by the administration have been introduced in both
houses of Congress and further proposals may be made. In addition, both the U.S.
Treasury Department and the Basel Committee have issued policy statements
regarding proposed significant changes to the regulatory capital framework
applicable to banking organizations as discussed above. The Company cannot
predict whether or in what form further legislation or regulations may be
adopted or the extent to which the Company may be affected thereby.
TARP-Related Compensation and
Corporate Governance Requirements. The Emergency Economic Stabilization
Act of 2008 (“EESA”) was signed into law on October 3, 2008 and authorized
the U.S. Treasury to provide funds to be used to restore liquidity and stability
to the U.S. financial system pursuant to the TARP. Under the
authority of EESA, Treasury instituted the TARP Capital Purchase Program to
encourage U.S. financial institutions to build capital to increase the flow
of financing to U.S. businesses and consumers and to support the
U.S. economy. As noted above, on December 5, 2009, the Company
participated in this program by issuing 196,000 shares of the Company’s Series A
Preferred Stock to Treasury for a purchase price of $196.0 million in cash and
issued the Warrant to Treasury.
In
addition to the restrictions on the Company’s ability to pay dividends on and
repurchase its stock, as described above under “Dividends,” participation in the
TARP Capital Purchase Program also includes certain requirements and
restrictions regarding compensation that were expanded significantly by the
American Recovery and Reinvestment Act of 2009 (“ARRA”), as implemented by
Treasury’s Interim Final Rule on TARP Standards for Compensation and Corporate
Governance. These requirements and restrictions include, among
others, the following: (i) a prohibition on paying or accruing bonuses,
retention awards and incentive compensation, other than qualifying long-term
restricted stock or pursuant to certain preexisting employment contracts, to the
Company’s five most highly-compensated employees; (ii) a general
prohibition on providing severance benefits, or other benefits due to a change
in control of the Company, to the Company’s senior executive officers (“SEOs”)
and next five most highly compensated employees; (iii) a requirement to
make subject to clawback any bonus, retention award, or incentive compensation
paid to any of the SEOs and any of the next twenty most highly compensated
employees if such compensation was based on materially inaccurate financial
statements or any other materially inaccurate performance metric criteria;
(iv) a requirement to establish a policy on luxury or excessive
expenditures; (v) a requirement to provide shareholders with a non-binding
advisory “say on pay” vote on executive compensation; (vi) a prohibition on
deducting more than $500,000 in annual compensation, including performance-based
compensation, to the executives covered under Internal Revenue Code
Section 162(m); (vii) a requirement that the compensation committee of
the board of directors evaluate and review on a semi-annual basis the risks
involved in employee compensation plans; and (viii) a prohibition on
providing tax “gross-ups” to the Company’s SEOs and the next 20 most highly
compensated employees. These requirements and restrictions will
remain applicable to the Company until it has redeemed the Series A Preferred
Stock in full.
Incentive
Compensation. On October 22, 2009, the Federal Reserve
issued a comprehensive proposal on incentive compensation policies (the
“Incentive Compensation Proposal”) intended to ensure that the incentive
compensation policies of banking organizations do not undermine the safety and
soundness of such organizations by encouraging excessive risk-taking. The
Incentive Compensation Proposal, which covers all employees that have the
ability to materially affect the risk profile of an organization, either
individually or as part of a group, is based upon the key principles that a
banking organization’s incentive compensation arrangements should
(i) provide incentives that do not encourage risk-taking beyond the
organization’s ability to effectively identify and manage risks, (ii) be
compatible with effective internal controls and risk management, and
(iii) be supported by strong corporate governance, including active and
effective oversight by the organization’s board of directors. Banking
organizations are instructed to begin an immediate review of their incentive
compensation policies to ensure that they do not encourage excessive risk-taking
and implement corrective programs as needed. Where there are deficiencies in the
incentive compensation arrangements, they must be immediately
addressed.
Additionally,
the Incentive Compensation Proposal will require the Federal Reserve to review,
as part of the regular, risk-focused examination process, the incentive
compensation arrangements of banking organizations, such as us, that are not
“large, complex banking organizations.” These reviews will be tailored to each
organization based on the scope and complexity of the organization’s activities
and the prevalence of incentive compensation arrangements. The findings of the
supervisory initiatives will be included in reports of examination. Deficiencies
will be incorporated into the organization’s supervisory ratings, which can
affect the organization’s ability to make acquisitions and take other actions.
Enforcement actions may be taken against a banking organization if its incentive
compensation arrangements, or related risk-management control or governance
processes, pose a risk to the organization’s safety and soundness and the
organization is not taking prompt and effective measures to correct the
deficiencies.
In
addition, on January 12, 2010, the FDIC announced that it would seek public
comment on whether banks with compensation plans that encourage risky behavior
should be charged at higher deposit assessment rates than such banks would
otherwise be charged.
The scope
and content of the U.S. banking regulators’ policies on executive compensation
are continuing to develop and are likely to continue evolving in the near
future. It cannot be determined at this time whether compliance with such
policies will adversely affect the Company’s ability to hire, retain and
motivate its key employees.
Other Future Legislation and Changes
in Regulations. In addition to the specific proposals
described above, from time to time, various legislative and regulatory
initiatives are introduced in Congress and state legislatures, as well as by
regulatory agencies. Such initiatives may include proposals to expand or
contract the powers of bank holding companies and depository institutions or
proposals to substantially change the financial institution regulatory system.
Such legislation could change banking statutes and the operating environment of
the Company in substantial and unpredictable ways. If enacted, such legislation
could increase or decrease the cost of doing business, limit or expand
permissible activities or affect the competitive balance among banks, savings
associations, credit unions, and other financial institutions. The Company
cannot predict whether any such legislation will be enacted, and, if enacted,
the effect that it, or any implementing regulations, would have on the financial
condition or results of operations of the Company. A change in statutes,
regulations or regulatory policies applicable to the MB Financial or any of its
subsidiaries could have a material effect on the business of the
Company.
Internet
Website
We
maintain a website with the address www.mbfinancial.com. The
information contained on our website is not included as a part of, or
incorporated by reference into, this Annual Report on Form
10-K. Other than an investor's own Internet access charges, we make
available free of charge through our website our Annual Reports on Form 10-K,
Quarterly Reports on Form 10-Q and Current Reports on Form 8-K, and amendments
to these reports, as soon as reasonably practicable after we have electronically
filed such material with, or furnished such material to, the Securities and
Exchange Commission.
An
investment in our common stock is subject to risks inherent in our
business. Before making an investment decision, you should carefully
consider the risks and uncertainties described below together with all of the
other information included in this report. In addition to the risks
and uncertainties described below, other risks and uncertainties not currently
known to us or that we currently deem to be immaterial also may materially and
adversely affect our business, financial condition and results of
operations. The value or market price of our common stock could
decline due to any of these identified or other risks, and you could lose all or
part of your investment.
A
large percentage of our loan portfolio is secured by real estate, in particular
commercial real estate. Continued deterioration in the real estate markets or
other segments of our loan portfolio could lead to additional losses, which
could have a material negative effect on our financial condition and results of
operations.
As
of December 31, 2009, excluding loans acquired in the Heritage and
Benchmark acquisitions and covered by our loss-sharing agreements with the FDIC
for those transactions, approximately 57% of our loan portfolio was secured by
real estate, the majority of which is commercial real estate. The
commercial real estate market continues to experience a variety of
difficulties. In particular, market conditions in the Chicago
metropolitan area, in which a majority of our commercial real estate loans are
concentrated, have declined significantly in the past year. As a
result of increased levels of commercial and consumer delinquencies and
declining real estate values, which reduce the customer's borrowing power and
the value of the collateral securing the loan, we have experienced increasing
levels of charge-offs and provisions for loan losses. Continued increases in
delinquency levels or continued declines in real estate values, which cause our
borrowers’ loan-to-value ratios to increase, could result in additional
charge-offs and provisions for loan losses. This could have a material negative
effect on our business and results of operations.
Our
construction loans are based upon estimates of costs and value associated with
the complete project. These estimates may be inaccurate. A
substantial portion of our construction loans were non-performing at December
31, 2009.
We
provide loans for the acquisition and development of land and for the
acquisition, development, and construction of condominiums, townhomes, and
one-to-four family residences. We also provide acquisition, development and
construction loans for retail and other commercial properties, primarily in our
market areas.
Construction
lending can involve a higher level of risk than other types of lending because
funds are often advanced based upon the value of the project, which is uncertain
prior to the project's completion. Because of the uncertainties inherent in
estimating construction costs and the timing of project completion as well as
the market value of a completed project and the effects of governmental
regulation of real property, our estimates with regard to the total funds
required to complete a project, the proceeds from a project’s sale or refinance,
and the related loan-to-value ratio may vary from actual results. Construction
loans of for sale properties (residential or commercial) often involve the
disbursement of substantial funds with repayment dependent, in part, on the
success of the ultimate project and the ability of the borrower to sell or lease
the property or refinance the indebtedness. If our estimate of the value of a
project at completion proves to be overstated, we may have inadequate security
for repayment of the loan and we may incur a loss.
At
December 31, 2009, excluding loans acquired in the Heritage and Benchmark
acquisitions and covered by our loss-sharing agreements with the FDIC for those
transactions, our construction loans totaled approximately $594.5 million,
or 9% of our total loan portfolio. Of these loans, approximately
$312.7 million, or 53%, were residential construction-related and
approximately $262.9 million, or 44%, were commercial construction related.
Approximately $181.0 million, or 30%, of the $594.5 million of our
construction loans were non-performing at December 31, 2009. These loans
represented approximately 67% of our total non-performing loans as of
December 31, 2009, excluding loans covered by our loss-sharing agreements
with the FDIC for the Heritage and Benchmark acquisitions.
The
deterioration in the quality of our construction loan portfolio has been the
primary factor behind the substantial increases in charge-offs and provisions
for loan losses we have experienced in recent periods. Our provision
for loan losses was $70.0 million for the fourth quarter of 2009, while our net
charge-offs were $82.2 million. For the third quarter of 2009, our
provision for loan losses and net charge-offs were $45.0 million and $37.1
million, respectively. Our provisions for loan losses and net charge
offs for the full 2009 year were $231.8 million and $198.7 million,
respectively, compared with $125.7 million and $46.8 million, respectively, for
2008. The Chicago area real estate market remains very weak, and we
believe that further deterioration in the quality of our construction loan
portfolio is a possibility. This could result in additional
charge-offs and provisions for loan losses, which could have a material negative
effect on our financial condition and results of operations.
Repayment
of our commercial loans and lease loans is often dependent on the cash flows of
the borrower or lessee, which may be unpredictable, and the collateral securing
these loans may fluctuate in value.
We make
our commercial loans primarily based on the identified cash flow of the borrower
and secondarily on the underlying collateral provided by the borrower.
Collateral securing commercial loans may depreciate over time, be difficult to
appraise and fluctuate in value. In addition, in the case of loans secured by
accounts receivable, the availability of funds for the repayment of these loans
may be substantially dependent on the ability of the borrower to collect the
amounts due from its customers. Accordingly, we make our commercial loans
primarily based on the historical and expected cash flow of the borrower and
secondarily on underlying collateral provided by the borrower.
We lend
money to small and mid-sized independent leasing companies to finance the debt
portion of leases (which we refer to as lease loans). A lease loan arises when a
leasing company discounts the equipment rental revenue stream owed to the
leasing company by a lessee. Our lease loans entail many of the same types of
risks as our commercial loans. Lease loans generally are non-recourse to the
leasing company, and, consequently, our recourse is limited to the lessee and
the leased equipment. As with commercial loans secured by equipment, the
equipment securing our lease loans may depreciate over time, may be difficult to
appraise and may fluctuate in value. We rely on the lessee's continuing
financial stability, rather than the value of the leased equipment, for the
repayment of all required amounts under lease loans. In the event of a default
on a lease loan, it is unlikely that the proceeds from the sale of the leased
equipment will be sufficient to satisfy the outstanding unpaid amounts under the
terms of the loan.
Changes
in economic conditions, particularly a further economic slowdown in the Chicago
area, could hurt our business.
Our
business is directly affected by market conditions, trends in industry and
finance, legislative and regulatory changes, and changes in governmental
monetary and fiscal policies and inflation, all of which are beyond our control.
In 2007, the housing and real estate sectors experienced an economic slowdown
that continued through 2009. Further deterioration in economic conditions,
particularly within the Chicago area, could result in the following
consequences, among others, any of which could hurt our business
materially:
|
·
|
loan
delinquencies may increase;
|
|
·
|
problem
assets and foreclosures may
increase;
|
|
·
|
demand
for our products and services may
decline;
|
|
·
|
collateral
for our loans may decline in value, in turn reducing a customer's
borrowing power and reducing the value of collateral securing our loans;
and
|
|
·
|
the
net worth and liquidity of loan guarantors may decline, impairing their
ability to honor commitments to us.
|
Difficult
market conditions and economic trends have adversely affected our industry and
our business.
The
United States experienced a severe economic recession in 2008 and
2009. While economic growth may have resumed recently, the rate of
this growth has been very low and unemployment remains at high
levels. Many lending institutions, including us, have experienced
declines in the performance of their loans, especially construction and
commercial real estate loans. In addition, the values of real estate collateral
supporting many loans have declined and may continue
to decline. Bank and bank holding company stock prices have been negatively
affected, as has the ability of banks and bank holding companies to raise
capital or borrow in the debt markets compared to recent years. These conditions
may have a material negative effect on our financial condition and results of
operations. In addition, as a result of the foregoing factors, there is a
potential for new laws and regulations regarding lending and funding practices
and capital and liquidity standards, and bank regulatory agencies have been and
are expected to continue to be very aggressive in responding to concerns and
trends identified in examinations. In this regard, the U.S. Department of the
Treasury (the "U.S. Treasury") has announced that more rigorous regulatory
capital and liquidity standards for banks should be established by
December 31, 2010 and implemented by December 31, 2012, but no
specific measures have yet been published.
Negative
developments in the financial industry and the impact of new legislation and
regulations in response to those developments could restrict our business
operations, including our ability to originate loans, and negatively impact our
results of operations and financial condition. Overall, during the past few
years, the general business environment has had a negative effect on our
business. Until there is a sustained improvement in economic conditions, we
expect our business, financial condition and results of operations to be
negatively affected.
Our
allowance for loan losses may prove to be insufficient to absorb losses in our
loan portfolio.
Lending
money is a substantial part of our business. Every loan carries a certain risk
that it will not be repaid in accordance with its terms or that any underlying
collateral will not be sufficient to assure repayment. This risk is affected by,
among other things:
|
·
|
cash
flow of the borrower and/or the project being
financed;
|
|
·
|
the
changes and uncertainties as to the future value of the collateral, in the
case of a collateralized loan;
|
|
·
|
the
credit history of a particular
borrower;
|
|
·
|
changes
in economic and industry conditions;
and
|
|
·
|
the
duration of the loan.
|
We
maintain an allowance for loan losses, which is a reserve established through a
provision for loan losses charged to expense, which we believe is appropriate to
provide for probable losses in our loan portfolio. The amount of this allowance
is determined by our management through a periodic review and consideration of
several factors, including, but not limited to:
|
·
|
our
general reserve, based on our historical default and loss
experience;
|
|
·
|
our
specific reserve, based on our evaluation of non-performing loans and
their underlying collateral; and
|
|
·
|
current
macroeconomic factors and model imprecision
factors.
|
The
determination of the appropriate level of the allowance for loan losses
inherently involves a high degree of subjectivity and requires us to make
significant estimates of current credit risks and future trends, all of which
may undergo material changes. Continuing deterioration in economic conditions
affecting borrowers, new information regarding existing loans, identification of
additional problem loans and other factors, both within and outside of our
control, may require an increase in the allowance for loan losses. In addition,
bank regulatory agencies periodically review our allowance for loan losses and
may require an increase in the provision for possible loan losses or the
recognition of further loan charge-offs, based on judgments different than those
of management. In addition, if charge-offs in future periods exceed the
allowance for loan losses, we will need additional provisions to increase the
allowance for loan losses. Any increases in the allowance for loan losses will
result in a decrease in net income and, possibly, capital, and may have a
material negative effect on our financial condition and results of
operations.
The
value of the securities in our investment securities portfolio may be negatively
affected by continued disruptions in securities markets.
Due to
heightened credit and liquidity risks and the volatile economy, among other
things, the market for some of the securities held in our investment portfolio
has become increasingly volatile over the past two years, making the
determination of the value of these securities less certain. There
can be no assurance that the declines in market value associated with these
disruptions will not result in other-than-temporary or permanent impairments of
these assets, which would lead to accounting charges that could have a material
negative effect on our financial condition and results of
operations.
Higher
FDIC deposit insurance premiums and assessments could significantly increase our
non-interest expense.
FDIC
insurance premiums increased significantly in 2009 and we expect to pay higher
FDIC premiums in the future. Recent bank failures have substantially depleted
the insurance fund of the FDIC and reduced the fund's ratio of reserves to
insured deposits. The FDIC implemented a special assessment equal to
five basis points of each insured depository institution's assets minus
Tier 1 capital as of June 30, 2009. We recorded an expense
of $3.6 million in the second quarter of 2009 for this special
assessment. In November 2009, the FDIC amended its assessment
regulations to require insured depository institutions to prepay their estimated
quarterly regular risk-based assessments for the fourth quarter of 2009, and for
all of 2010, 2011, and 2012, on December 30, 2009. We prepaid $45.0
million, which will be expensed in the normal course of business throughout this
three-year period.
We
participate in the FDIC's Transaction Account Guarantee Program, or TAGP, for
non-interest-bearing transaction deposit accounts. The TAGP is a component of
the FDIC's Temporary Liquidity Guarantee Program, or TLGP. The TAGP was
originally set to expire on December 31, 2009, but the FDIC established an
extension period for the TAGP to run from January 1, 2010 through
June 30, 2010. During the extension period, the fees for participating
banks range from 15 to 25 basis points on the amounts in such accounts above the
amounts covered by FDIC deposit insurance, depending on the risk category to
which the bank is assigned for deposit insurance assessment
purposes.
To the
extent that assessments under the TAGP are insufficient to cover any loss or
expenses arising from the TLGP, the FDIC is authorized to impose an emergency
special assessment on all FDIC-insured depository institutions. The FDIC has
authority to impose charges for the TLGP upon depository institution holding
companies, as well. These charges would cause the premiums and TAGP assessments
charged by the FDIC to increase. These actions could significantly increase our
non-interest expense for the foreseeable future.
Changes
in interest rates may reduce our net interest income.
Our
consolidated operating results are largely dependent on our net interest income.
Net interest income is the difference between interest earned on loans and
investments and interest expense incurred on deposits and other borrowings. Our
net interest income is impacted by changes in market rates of interest, changes
in credit spreads, changes in the shape of the yield curve, the interest rate
sensitivity of our assets and liabilities, prepayments on our loans and
investments, and the mix of our funding sources and assets.
Our
interest earning assets and interest bearing liabilities may react in different
degrees to changes in market interest rates. Interest rates on some types of
assets and liabilities may fluctuate prior to changes in broader market interest
rates, while rates on other types may lag behind. The result of these changes to
rates may cause differing spreads on interest earning assets and interest
bearing liabilities. While we take measures intended to manage the risks from
changes in market interest rates, we cannot control or accurately predict
changes in market rates of interest or be sure our protective measures are
adequate.
Our
strategy of pursuing acquisitions exposes us to financial, execution and
operational risks that could negatively affect us.
We pursue
a strategy of supplementing internal growth by acquiring other financial
institutions or their assets and liabilities that will help us fulfill our
strategic objectives and enhance our earnings. There are risks associated with
this strategy, including the following:
|
·
|
We
may be exposed to potential asset quality issues or unknown or contingent
liabilities of the banks, businesses, assets, and liabilities we
acquire. If these issues or liabilities exceed our estimates, our earnings
and financial condition may be negatively
affected;
|
|
·
|
Prices
at which acquisitions can be made fluctuate with market conditions. We
have experienced times during which acquisitions could not be made in
specific markets at prices we considered acceptable and expect that we
will experience this condition in the
future;
|
|
·
|
The
acquisition of other entities generally requires integration of systems,
procedures and personnel of the acquired entity into our company to make
the transaction economically successful. This integration process is
complicated and time consuming and can also be disruptive to the customers
of the acquired business. If the integration process is not conducted
successfully and with minimal effect on the acquired business and its
customers, we may not realize the anticipated economic benefits of
particular acquisitions within the expected time frame, and we may lose
customers or employees of the acquired business. We may also experience
greater than anticipated customer losses even if the integration process
is successful. These risks are present in our recently completed
FDIC-assisted transaction involving our assumption of the deposits and the
acquisition of certain assets of
Benchmark;
|
|
·
|
The
Company entered into loss sharing agreements with the FDIC as part of the
Heritage and Benchmark transactions. These loss sharing agreements require
that MB Financial Bank follow certain servicing procedures as specified in
the agreement or risk losing FDIC reimbursement of losses on covered loans
and other real estate owned.
|
|
·
|
To
finance an acquisition, we may borrow funds, thereby increasing our
leverage and diminishing our liquidity, or raise additional capital, which
could dilute the interests of our existing stockholders;
and
|
|
·
|
We
have completed various acquisitions and opened additional banking offices
in the past few years that enhanced our rate of growth. We may not be able
to continue to sustain our past rate of growth or to grow at all in the
future.
|
Our
growth or future losses may require us to raise additional capital in the
future, but that capital may not be available when it is needed or the cost of
that capital may be very high.
We are
required by federal and state regulatory authorities to maintain adequate levels
of capital to support our operations. We anticipate that our capital resources
will satisfy our capital requirements for the foreseeable future. We may at some
point need to raise additional capital to support continued growth or losses,
both internally and through acquisitions. Any capital we obtain may result in
the dilution of the interests of existing holders of our common
stock.
Our
ability to raise additional capital, if needed, will depend on conditions in the
capital markets at that time, which are outside our control, and on our
financial condition and performance. Accordingly, we cannot make assurances of
our ability to raise additional capital if needed, or if the terms will be
acceptable to us. If we cannot raise additional capital when needed, our ability
to further expand our operations through internal growth and acquisitions could
be materially impaired and our financial condition and liquidity could be
materially and negatively affected.
Conditions
in the financial markets may limit our access to additional funding to meet our
liquidity needs.
Liquidity
is essential to our business, as we must maintain sufficient funds to respond to
the needs of depositors and borrowers. An inability to raise funds through
deposits, borrowings, the sale or pledging as collateral of loans and other
assets could have a substantial negative effect on our liquidity. Our access to
funding sources in amounts adequate to finance our activities could be impaired
by factors that affect us specifically or the financial services industry in
general. Factors that could negatively affect our access to liquidity sources
include a decrease in the level of our business activity due to a market
downturn or negative regulatory action against us. Our ability to borrow could
also be impaired by factors that are not specific to us, such as severe
disruption of the financial markets or negative news and expectations about the
prospects for the financial services industry as a whole, as evidenced by recent
turmoil in the domestic and worldwide credit markets.
Our
wholesale funding sources may prove insufficient to replace deposits or support
our future growth.
As a part
of our liquidity management, we use a number of funding sources in addition to
core deposit growth and repayments and maturities of loans and investments.
These sources include brokered certificates of deposit, repurchase agreements,
federal funds purchased, Federal Reserve term auction funds and Federal Home
Loan Bank advances. Negative operating results or changes in industry conditions
could lead to an inability to replace these additional
funding sources at maturity. Our financial flexibility could be constrained if
we are unable to maintain our access to funding or if adequate financing is not
available to accommodate future growth at acceptable interest rates. Finally, if
we are required to rely more heavily on more expensive funding sources to
support future growth, our revenues may not increase proportionately to cover
our costs. In this case, our results of operations and financial condition would
be negatively affected.
Since
our business is concentrated in the Chicago metropolitan area, a further decline
in the economy of this area may negatively affect our business.
Except
for our lease banking activities, which are nationwide, our lending and deposit
gathering activities are concentrated primarily in the Chicago metropolitan
area. Our success depends on the general economic conditions of this
metropolitan area and its surrounding areas.
Many of
the loans in our portfolio are secured by real estate. Most of these loans are
secured by properties located in the Chicago metropolitan area. Deterioration in
the real estate markets where collateral for a mortgage loan is located could
negatively affect the borrower's ability to repay the loan and the value of the
collateral securing the loan. Real estate values are affected by various other
factors, including changes in general or regional economic conditions,
governmental rules or policies and natural disasters such as
tornados.
Negative
changes in the regional and general economy could reduce our growth rate, impair
our ability to collect loans and generally have a negative effect on our
financial condition and results of operations.
The
soundness of other financial institutions could negatively affect
us.
Our
ability to engage in routine funding and other transactions could be negatively
affected by the actions and commercial soundness of other financial
institutions. Financial services institutions are interrelated as a result of
trading, clearing, counterparty or other relationships. Defaults by, or even
rumors or questions about, one or more financial services institutions, or the
financial services industry generally, have led to market-wide liquidity
problems and losses of depositor, creditor and counterparty confidence and could
lead to losses or defaults by us or by other institutions. We could experience
increases in deposits and assets as a result of the difficulties or failures of
other banks, which would increase the capital we need to support our
growth.
Non-compliance
with the USA PATRIOT Act, Bank Secrecy Act, or other laws and regulations could
result in fines or sanctions.
The USA
PATRIOT and Bank Secrecy Acts require financial institutions to develop programs
to prevent financial institutions from being used for money laundering and
terrorist activities. If such activities are detected, financial institutions
are obligated to file suspicious activity reports with the U.S. Treasury's
Office of Financial Crimes Enforcement Network. These rules require financial
institutions to establish procedures for identifying and verifying the identity
of customers seeking to open new financial accounts. Failure to comply with
these regulations could result in fines or sanctions. During the last year,
several banking institutions have received large fines for non-compliance with
these laws and regulations. Although we have developed policies and procedures
designed to assist in compliance with these laws and regulations, no assurance
can be given that these policies and procedures will be effective in preventing
violations of these laws and regulations.
New
or changes in existing tax, accounting, and regulatory rules and interpretations
could significantly impact strategic initiatives, results of operations, cash
flows, and financial condition.
The
financial services industry is extensively regulated. Federal and state banking
regulations are designed primarily to protect the deposit insurance funds and
consumers, not to benefit a financial company's stockholders. These regulations
may sometimes impose significant limitations on operations. The significant
federal and state banking regulations that affect us are described in this
report under the heading “Item 1. Business-Supervision
and Regulation”. These regulations, along with the currently existing tax,
accounting, securities, insurance, and monetary laws, regulations, rules,
standards, policies, and interpretations control the methods by which financial
institutions conduct business, implement strategic initiatives and tax
compliance, and govern financial reporting and disclosures. These laws,
regulations, rules, standards, policies, and interpretations are constantly
evolving and may change significantly over time.
Significant
legal actions could subject us to substantial liabilities.
We are from time to time subject to claims related to our
operations. These claims and legal actions, including supervisory actions by our
regulators, could involve large monetary claims and significant defense costs.
As a result, we may be exposed to substantial liabilities, which could
negatively affect our results of operations and financial condition.
The
loss of certain key personnel could negatively affect our
operations.
Our
success depends in large part on the retention of a limited number of key
management, lending and other banking personnel. We could undergo a difficult
transition period if we were to lose the services of any of these individuals.
Our success also depends on the experience of our banking facilities' managers
and lending officers and on their relationships with the customers and
communities they serve. The loss of these key persons could negatively impact
the affected banking operations.
As
a result of our participation in the TARP Capital Purchase Program, we are
subject to significant restrictions on compensation payable to our executive
officers and other key employees.
Our
ability to attract and retain key officers and employees may be impacted by
legislation and regulation affecting the financial services industry. In 2009,
the American Recovery and Reinvestment Act (the “ARRA”) became law. The ARRA,
through the implementing regulations of the U.S. Treasury, significantly
expanded the executive compensation restrictions originally imposed on TARP
participants, including us. Among other things, these restrictions limit our
ability to pay bonuses and other incentive compensation and make severance
payments. These restrictions will continue to apply to us for as long as the
preferred stock we issued pursuant to the TARP Capital Purchase Program remains
outstanding. These restrictions may negatively affect our ability to compete
with financial institutions that are not subject to the same
limitations.
We
may experience future goodwill impairment.
If our
estimates of the fair value of our goodwill change as a result of changes in our
business or other factors, we may determine that an impairment charge is
necessary. Estimates of fair value are based on a complex model using, among
other things, cash flows and company comparisons. To the extent our
market capitalization (market value of total common shares outstanding) is less
than the book value of our total stockholders’ equity, this will be considered,
along with other pertinent factors, in determining whether goodwill is
impaired. If our estimates of future cash flows or other components
of our fair value calculations are inaccurate, the fair value of goodwill
reflected in our financial statements could be inaccurate and we could be
required to take asset impairment charges, which could have a material adverse
effect on our results of operations and financial condition.
Our
future success is dependent on our ability to compete effectively in the highly
competitive banking industry.
We face
substantial competition in all phases of our operations from a variety of
different competitors. Our future growth and success will depend on our ability
to compete effectively in this highly competitive environment. To date, we have
grown our business successfully by focusing on our business lines in our
geographic markets and emphasizing the high level of service and responsiveness
desired by our customers. We compete for loans, deposits and other financial
services with other commercial banks, thrifts, credit unions, brokerage houses,
mutual funds, insurance companies and specialized finance companies. Many of our
competitors offer products and services which we do not offer, and many have
substantially greater resources and lending limits, name recognition and market
presence that benefit them in attracting business. In addition, larger
competitors may be able to price loans and deposits more aggressively than we
do, and smaller newer competitors may also be more aggressive in terms of
pricing loan and deposit products than we are in order to obtain a share of the
market. Some of the financial institutions and financial services organizations
with which we compete are not subject to the same degree of regulation as is
imposed on bank holding companies, federally insured state-chartered banks and
national banks and federal savings banks. In addition, increased competition
among financial services companies due to the recent consolidation of certain
competing financial institutions and the conversion of certain investment banks
to bank holding companies may negatively affect our ability to successfully
market our products and services. As a result, these competitors have certain
advantages over us in accessing funding and in providing various
services.
We
are subject to security and operational risks relating to our use of technology
that could damage our reputation and our business.
Security
breaches in our internet banking activities could expose us to possible
liability and damage our reputation. Any compromise of our security also could
deter customers from using our internet banking services that involve the
transmission of confidential information. We rely on standard internet security
systems to provide the security and authentication necessary to effect secure
transmission of data. These precautions may not protect our systems from
compromises or breaches of our security measures that could result in damage to
our reputation and our business. Additionally, we outsource our data processing
to a third party. If our third party provider encounters difficulties or if we
have difficulty in communicating with such third party, it will significantly
affect our ability to adequately process and account for customer transactions,
which would significantly affect our business operations.
None.
We
conduct our business at 87 retail banking center locations, with 86 in the
Chicago metropolitan area and one in Philadelphia, Pennsylvania. We
own 52 of our banking center facilities. The other facilities are
leased for various terms. All of our branches have ATMs, and we have
17 additional ATMs at other locations in the Chicago metropolitan
area. We believe that all of our properties and equipment are well
maintained, in good operating condition and adequate for all of our present and
anticipated needs. See Note 8 of the notes to our consolidated
financial statements for additional information regarding our premises and
equipment.
We also
have non-bank office locations in Chicago, Illinois, Paramus, New Jersey, Troy,
Michigan, Columbus, Ohio, and Freeport, The Bahamas. The Chicago
office is used as the headquarters for Cedar Hill. The Paramus
location is a lease banking services office. The Troy and Columbus
locations are LaSalle sales offices. The Freeport office houses the
headquarters for MBRE Holdings LLC. None of these locations provide
banking services to our customers.
We
believe our facilities in the aggregate are suitable and adequate to operate our
banking and related business.
We are
involved from time to time as plaintiff or defendant in various legal actions
arising in the normal course of our businesses. While the ultimate
outcome of pending proceedings cannot be predicted with certainty, it is the
opinion of management, after consultation with counsel representing us in such
proceedings, that the resolution of these proceedings should not have a material
adverse effect on our consolidated financial position or results of
operation.
Our
common stock is traded on the NASDAQ Global Select Market under the symbol
“MBFI”. There were approximately 1,640 holders of record of our
common stock as of December 31, 2009.
The
following table presents quarterly market price information and cash dividends
paid per share for our common stock for 2009 and 2008:
|
Market
Price Range
|
||||||
|
High
|
Low
|
Dividends
Paid
|
||||
|
2009
|
||||||
|
Quarter
ended December 31, 2009
|
$ 21.77
|
$ 16.67
|
$ 0.01
|
|||
|
Quarter
ended September 30, 2009
|
$ 21.45
|
$ 9.95
|
$ 0.01
|
|||
|
Quarter
ended June 30, 2009
|
$ 17.44
|
$ 9.25
|
$ 0.01
|
|||
|
Quarter
ended March 31, 2009
|
$ 28.04
|
$ 9.77
|
$ 0.12
|
|||
|
2008
|
||||||
|
Quarter
ended December 31, 2008
|
$ 34.59
|
$ 20.43
|
$ 0.18
|
|||
|
Quarter
ended September 30, 2008
|
$ 44.29
|
$ 18.76
|
$ 0.18
|
|||
|
Quarter
ended June 30, 2008
|
$ 32.59
|
$ 22.47
|
$ 0.18
|
|||
|
Quarter
ended March 31, 2008
|
$ 33.30
|
$ 25.41
|
$ 0.18
|
|||
The
timing and amount of cash dividends paid depends on our earnings, capital
requirements, financial condition and other relevant factors. In this
regard, after reviewing these factors and giving consideration to the current
economic environment, we reduced our quarterly common stock cash dividend to
$0.12 per share in the first quarter of 2009 and to $0.01 per share in the
second quarter of 2009. The primary source for dividends paid to
stockholders is dividends paid to us from MB Financial Bank. We have
an internal policy which provides that dividends paid to us by MB Financial Bank
cannot exceed an amount that would cause the bank’s total risk-based capital,
Tier 1 risk-based capital and Tier 1 leverage capital ratios to fall below 12%,
9% and 7%, respectively. These ratios are in excess of the minimum
ratios required for a bank to be considered “well capitalized” for regulatory
purposes (10%, 6% and 5%, respectively). In addition to adhering to
our internal policy, there are regulatory restrictions on the ability of
national banks to pay dividends. See “Item 1. Business - Supervision
and Regulation - Dividends” above and Note 18 of notes to consolidated financial statements
contained in Item 8 of this report.
The
following table sets forth information for the three months ended December 31,
2009 with respect to repurchases of our outstanding common shares:
|
Total
Number
of
Shares
Purchased
(1)
|
Average
Price
Paid per
Share
|
Number
of Shares
Purchased
as
Part Publicly
Announced
Plans
or
Programs
|
Maximum
Number
of
Shares that
May
Yet Be
Purchased
Under
the
Plans or Programs
|
||||
|
October
1, 2009 – October 31, 2009
|
68
|
$ 21.73
|
-
|
-
|
|||
|
November
1, 2009 – November 30, 2009
|
-
|
-
|
-
|
-
|
|||
|
December
1, 2009 – December 31, 2009
|
-
|
-
|
-
|
-
|
|||
|
Total
|
68
|
$ 21.73
|
-
|
|
(1)
|
Represents
shares of stock withheld upon vesting of restricted shares and exercise of
stock options to satisfy tax withholding
obligations.
|
On
December 5, 2008, as part of the Troubled Asset Relief Program (“TARP”) Capital
Purchase Program of the United States Department of the Treasury (“Treasury”),
the Company sold to Treasury 196,000 shares of the Company’s Fixed Rate
Cumulative Perpetual Preferred Stock, Series A (the “Series A Preferred Stock”),
having a liquidation preference amount of $1,000 per share, for a purchase price
of $196.0 million in cash and issued to Treasury a ten-year warrant to purchase
1,012,048 shares of the Company’s common stock at an exercise price of $29.05
per share (the “Warrant”). As explained below, the number of shares
underlying the Warrant has been reduced to 506,024.
The
Company may redeem the Series A Preferred Stock at any time by repaying
Treasury, without penalty, subject to Treasury’s consultation with the Company’s
appropriate regulatory agency. Additionally, upon redemption of the
Series A Preferred Stock, the Warrant may be repurchased from Treasury at its
fair market value as agreed-upon by the Company and Treasury.
On
September 17, 2009, the Company completed a public offering of its common stock
by issuing 12,578,125 shares of common stock for aggregate gross proceeds of
$201.3 million. The net proceeds to the Company after deducting
underwriting discounts and commissions and offering expenses were approximately
$190.9 million. With the proceeds from this offering and the proceeds
received by the Company from issuances pursuant to its Dividend Reinvestment and
Stock Purchase Plan, the Company received aggregate gross proceeds from
“Qualified Equity Offerings” in excess of the $196.0 million aggregate
liquidation preference amount of the Series A Preferred Stock. As a
result, the number of shares of the Company’s common stock underlying the
Warrant was reduced by 50%, from 1,012,048 shares to 506,024
shares.
The
securities purchase agreement between us and Treasury provides that prior to the
earlier of (i) December 5, 2011 and (ii) the date on which all of the shares of
the Series A Preferred Stock have been redeemed by us or transferred by Treasury
to third parties, we may not, without the consent of Treasury, (a) pay a cash
dividend on our common stock of more than $0.18 per share or (b) subject to
limited exceptions, redeem, repurchase or otherwise acquire shares of our common
stock or preferred stock, other than the Series A Preferred Stock, or trust
preferred securities. In addition, under the terms of the Series A
Preferred Stock, we may not pay dividends on our common stock unless we are
current in our dividend payments on the Series A Preferred
Stock. Dividends on the Series A Preferred Stock are payable
quarterly at a rate of 5% per annum for the first five years and a rate of 9%
per annum thereafter if not redeemed prior to that time.
Stock
Performance Presentation
The
following line graph shows a comparison of the cumulative returns for the
Company, the NASDAQ Market Bank Index, an index of peer corporations
selected by the Company and the NASDAQ Composite Index, for the period beginning
December 31, 2004 and ending December 31, 2009. The information
assumes that $100 was invested at the closing price on December 31, 2004 in the
Common Stock and each index, and that all dividends were
reinvested.
|
COMPARISON
OF 5-YEAR CUMULATIVE TOTAL RETURN
AMONG
MB FINANCIAL, INC.,
NASDAQ
BANK INDEX, PEER GROUP INDEX AND NASDAQ COMPOSITE
INDEX
|
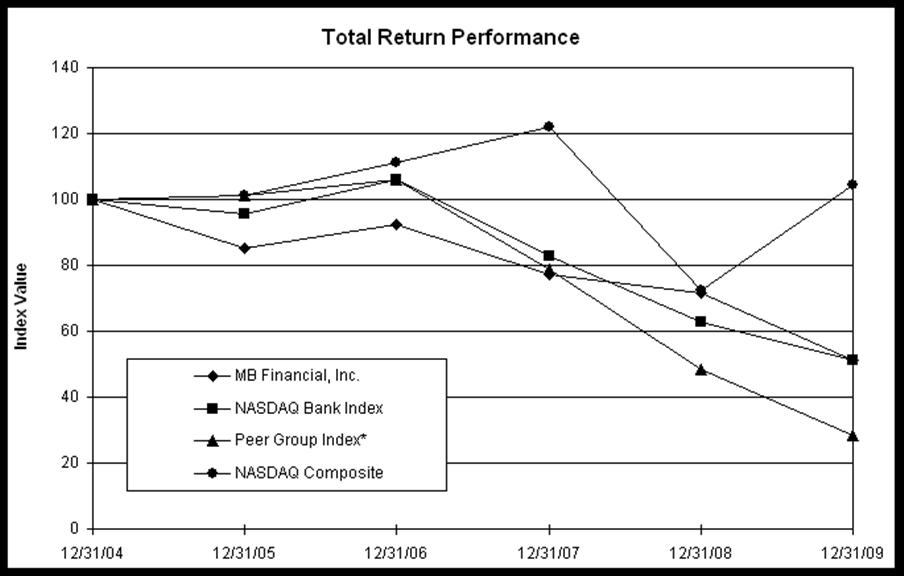
|
Fiscal
Year Ending
|
||||||
|
Index
|
12/31/2004
|
12/31/2005
|
12/31/2006
|
12/31/2007
|
12/31/2008
|
12/31/2009
|
|
MB
Financial, Inc.
|
100.00
|
85.21
|
92.22
|
77.16
|
71.77
|
51.13
|
|
NASDAQ
Bank Index
|
100.00
|
95.67
|
106.20
|
82.76
|
62.96
|
51.31
|
|
Peer
Group Index*
|
100.00
|
101.40
|
106.01
|
78.91
|
48.21
|
28.56
|
|
NASDAQ
Composite
|
100.00
|
101.37
|
111.03
|
121.92
|
72.49
|
104.31
|
The Peer
Group is made up of the common stocks of the following companies:
AMCORE
FINANCIAL INC
FIRST
MIDWEST BANCORP INC
MIDWEST
BANC HOLDINGS INC
OLD
SECOND BANCORP INC
PRIVATEBANCORP
INC
TAYLOR
CAPITAL GROUP INC
WINTRUST
FINANCIAL CORPORATION
Set forth
below and on the following page is our summary consolidated financial
information and other financial data. This information should be read
in conjunction with “Management’s Discussion and Analysis of Financial Condition
and Results of Operations” included herein in response to Item 7 and the
consolidated financial statements and notes thereto included herein in response
to Item 8 (in thousands, except common share data).
On August
10, 2009, the Company sold its merchant card processing business. In
accordance with U.S. GAAP, the assets, liabilities, results of operations,
including a pre-tax gain of $10.2 million, and cash flows of the Company’s
merchant card processing business have been shown separately as discontinued
operations in the consolidated balance sheets, consolidated statements of
operations, and consolidated statements of cash flows for all periods
presented.
On
November 28, 2007, the Company sold its Union Bank subsidiary. In
accordance with U.S. GAAP, the assets, liabilities, results of operations, and
cash flows of the business conducted by Union Bank have been shown separately as
discontinued operations in the consolidated balance sheets, consolidated
statements of operations, and consolidated statements of cash flows for all
periods presented.
For
purposes of the following discussion, balances, average rate, income and
expenses associated with Union Bank, and the Company’s merchant card processing
business have been excluded from continuing operations. See Note 3 in the notes to consolidated financial statements
contained under Item 8. Financial Statements and Supplementary
Data.
Our
summary consolidated financial information and other financial data contain
information determined by methods other than in accordance with accounting
principles generally accepted in the United States of America
(GAAP). These measures include net interest income on a fully tax
equivalent basis, net interest margin on a fully tax equivalent basis;
efficiency ratio, with net gains and losses on securities available for sale,
net gains and losses on sale of assets, and acquisition related gains excluded
from the non-interest income component of this ratio and the FDIC
special assessment expense, contributions to MB Financial Charitable Foundation,
executive separation agreement expense, unamortized issuance costs related to
redemption of trust preferred securities and impairment charges excluded from
the non-interest expense component of this ratio; ratios of tangible equity to
assets, tangible common equity to assets, and tangible common equity to
risk-weighted assets; and tangible book value per common share. Our
management uses these non-GAAP measures in its analysis of our
performance. The tax equivalent adjustment to net interest income
recognizes the income tax savings when comparing taxable and tax-exempt assets
and assumes a 35% tax rate. Management believes that it is a standard
practice in the banking industry to present net interest income and net interest
margin on a fully tax equivalent basis, and accordingly believes that providing
these measures may be useful for peer comparison purposes. Management
also believes that by excluding net gains and losses on securities available for
sale, net gains and losses on sale of assets, and acquisition related gains from
the non-interest income component and the FDIC special assessment expense and
impairment charges from other non-interest expense of the efficiency, this ratio
better reflects our operating performance. The other measures exclude
the ending balances of acquisition-related goodwill and other intangible assets,
net of tax benefit, in determining tangible stockholders’
equity. Management believes the presentation of these other financial
measures excluding the impact of such items provides useful supplemental
information that is helpful in understanding our financial results, as they
provide a method to assess management’s success in utilizing our tangible
capital. These disclosures should not be viewed as substitutes for
the results determined to be in accordance with GAAP, nor are they necessarily
comparable to non-GAAP performance measures that may be presented by other
companies.
Reconciliations
of net interest margin on a fully tax equivalent basis to net interest margin,
efficiency ratio as adjusted to efficiency ratio, and tangible common book value
per common share to common book value per common share are contained in the
“Selected Financial Data” discussed below.
Selected
Financial Data:
|
As
of or for the Year Ended December 31,
|
||||||||||
|
2009
(1)
|
2008
|
2007
|
2006
(2)
|
2005
|
||||||
|
Statement
of Income Data:
|
||||||||||
|
Interest
income
|
$
393,538
|
$
413,788
|
$
457,266
|
$
374,371
|
$
274,522
|
|||||
|
Interest
expense
|
142,986
|
192,900
|
244,960
|
186,192
|
105,689
|
|||||
|
Net
interest income
|
250,552
|
220,888
|
212,306
|
188,179
|
168,833
|
|||||
|
Provision
for loan losses
|
231,800
|
125,721
|
19,313
|
10,100
|
8,150
|
|||||
|
Net
interest income after provision for loan losses
|
18,752
|
95,167
|
192,993
|
178,079
|
160,683
|
|||||
|
Other
income
|
127,154
|
80,393
|
83,528
|
64,376
|
57,822
|
|||||
|
Other
expenses
|
223,750
|
183,390
|
191,506
|
152,218
|
131,155
|
|||||
|
Income
(loss) before income taxes
|
(77,844)
|
(7,830)
|
85,015
|
90,237
|
87,350
|
|||||
|
Applicable
income tax expense (benefit)
|
(45,265)
|
(23,555)
|
23,670
|
27,238
|
26,641
|
|||||
|
Income
(loss) from continuing operations
|
(32,579)
|
15,725
|
61,345
|
62,999
|
60,709
|
|||||
|
Income
from discontinued operations, net of income tax
|
6,453
|
439
|
32,518
|
4,115
|
4,045
|
|||||
|
Net
income (loss)
|
(26,126)
|
16,164
|
93,863
|
67,114
|
64,754
|
|||||
|
Dividends
on preferred shares
|
10,298
|
789
|
-
|
-
|
-
|
|||||
|
Net
income (loss) available to common shareholders
|
$
(36,424)
|
$
15,375
|
$
93,863
|
$
67,114
|
$
64,754
|
|||||
|
Common
Share Data:
|
||||||||||
|
Basic
earnings (loss) per common share from continuing
operations
|
$
(0.81)
|
$
0.45
|
$
1.70
|
$
2.02
|
$
2.13
|
|||||
|
Basic
earnings per common share from discontinued operations
|
0.16
|
0.01
|
0.91
|
0.13
|
0.14
|
|||||
|
Impact
of preferred stock dividends on basic earnings (loss) per common
share
|
(0.26)
|
(0.02)
|
-
|
-
|
-
|
|||||
|
Basic
earnings (loss) per common share
|
(0.91)
|
0.44
|
2.61
|
2.15
|
2.27
|
|||||
|
Diluted
earnings (loss) per common share from continuing
operations
|
(0.81)
|
0.45
|
1.68
|
1.99
|
2.10
|
|||||
|
Diluted
earnings per common share from discontinued operations
|
0.16
|
0.01
|
0.89
|
0.13
|
0.14
|
|||||
|
Impact
of preferred stock dividends on diluted earnings (loss) per common
share
|
(0.26)
|
(0.02)
|
-
|
-
|
-
|
|||||
|
Diluted
earnings (loss) per common share
|
(0.91)
|
0.44
|
2.57
|
2.12
|
2.24
|
|||||
|
Common
book value per common share
|
20.75
|
25.17
|
24.91
|
23.10
|
17.81
|
|||||
|
Less:
goodwill and other tangible assets, net of tax benefit, per common
share
|
8.07
|
11.56
|
11.43
|
10.85
|
4.66
|
|||||
|
Tangible
common book value per common share
|
12.68
|
13.61
|
13.48
|
12.25
|
13.15
|
|||||
|
Weighted
average common shares outstanding:
|
||||||||||
|
Basic
|
40,042,655
|
34,706,092
|
35,919,900
|
31,156,887
|
28,480,909
|
|||||
|
Diluted
|
40,042,655
|
35,061,712
|
36,439,561
|
31,687,220
|
28,895,042
|
|||||
|
Dividend
payout ratio (3)
|
NM
|
163.64%
|
27.59%
|
30.70%
|
24.63%
|
|||||
|
Cash
dividends per common share
|
$
0.15
|
$
0.72
|
$
0.72
|
$
0.66
|
$ 0.56
|
|||||
|
(1)
|
In
2009 we completed four FDIC-assisted transactions. See Note 2 in the notes to consolidated financial statements
contained under Item 8. Financial Statements and Supplementary
Data.
|
|
(2)
|
In
2006 we acquired First Oak Brook Bancshares,
Inc.
|
|
(3)
|
Not
meaningful, due to our net loss for
2009.
|
Selected
Financial Data (continued):
|
As
of or for the Year Ended December 31,
|
||||||||||
|
(Dollars
in thousands)
|
2009
|
2008
|
2007
|
2006
|
2005
|
|||||
|
Balance
Sheet Data:
|
||||||||||
|
Cash
and due from banks
|
$ 136,763
|
$ 79,824
|
$ 141,248
|
$ 142,207
|
$ 82,751
|
|||||
|
Investment
securities
|
2,913,594
|
1,400,376
|
1,241,385
|
1,628,348
|
1,316,149
|
|||||
|
Loans,
gross
|
6,524,547
|
6,228,563
|
5,615,627
|
4,971,494
|
3,480,447
|
|||||
|
Allowance
for loan losses
|
177,072
|
144,001
|
65,103
|
58,983
|
42,290
|
|||||
|
Assets
held for sale
|
-
|
-
|
-
|
393,608
|
370,103
|
|||||
|
Total
assets
|
10,865,393
|
8,819,763
|
7,834,703
|
7,978,298
|
5,719,065
|
|||||
|
Deposits
|
8,683,276
|
6,495,571
|
5,513,783
|
5,580,553
|
3,906,212
|
|||||
|
Short-term
and long-term borrowings
|
323,917
|
960,085
|
1,186,586
|
934,384
|
771,088
|
|||||
|
Junior
subordinated notes issued to capital trusts
|
158,677
|
158,824
|
159,016
|
179,162
|
123,526
|
|||||
|
Liabilities
held for sale
|
-
|
-
|
-
|
361,008
|
341,988
|
|||||
|
Stockholders’
equity
|
1,251,180
|
1,068,824
|
862,369
|
846,952
|
506,986
|
|||||
|
Less:
goodwill
|
387,069
|
387,069
|
379,047
|
379,047
|
125,010
|
|||||
|
Less:
other intangible assets, net of tax benefit
|
24,510
|
16,754
|
16,479
|
18,756
|
8,186
|
|||||
|
Tangible
equity
|
839,601
|
665,001
|
466,843
|
449,149
|
373,790
|
|||||
|
Less:
preferred stock
|
193,522
|
193,025
|
-
|
-
|
-
|
|||||
|
Tangible
common equity
|
646,079
|
471,976
|
466,843
|
449,149
|
373,790
|
|||||
|
Performance
Ratios:
|
||||||||||
|
Return
on average assets
|
(0.27%)
|
0.20%
|
1.19%
|
1.02%
|
1.17%
|
|||||
|
Return
on average common equity
|
(3.91%)
|
1.74%
|
11.03%
|
10.70%
|
13.15%
|
|||||
|
Net
interest margin (1)
|
2.85%
|
3.03%
|
3.22%
|
3.41%
|
3.63%
|
|||||
|
Tax
equivalent effect
|
0.12%
|
0.13%
|
0.11%
|
0.11%
|
0.11%
|
|||||
|
Net
interest margin – fully tax equivalent basis (1)
|
2.97%
|
3.16%
|
3.33%
|
3.52%
|
3.74%
|
|||||
|
Efficiency
ratio (2)
|
62.44%
|
58.94%
|
60.29%
|
58.92%
|
56.07%
|
|||||
|
Loans
to deposits
|
75.14%
|
95.89%
|
101.85%
|
89.09%
|
89.10%
|
|||||
|
Asset
Quality Ratios:
|
||||||||||
|
Non-performing
loans to total loans (3)
|
4.16%
|
2.34%
|
0.44%
|
0.43%
|
0.58%
|
|||||
|
Non-performing
assets to total assets (4)
|
2.84%
|
1.71%
|
0.33%
|
0.31%
|
0.36%
|
|||||
|
Allowance
for loan losses to total loans
|
2.71%
|
2.31%
|
1.16%
|
1.19%
|
1.22%
|
|||||
|
Allowance
for loan losses to non-performing loans (3)
|
65.26%
|
98.67%
|
266.17%
|
274.75%
|
209.66%
|
|||||
|
Net
loan charge-offs to average loans
|
3.09%
|
0.79%
|
0.25%
|
0.24%
|
0.24%
|
|||||
|
Liquidity
and Capital Ratios:
|
||||||||||
|
Tier
1 capital to risk -weighted assets
|
13.51%
|
12.07%
|
9.75%
|
10.49%
|
11.70%
|
|||||
|
Total
capital to risk -weighted assets
|
15.45%
|
14.08%
|
11.58%
|
11.80%
|
12.91%
|
|||||
|
Tier
1 capital to average assets
|
8.71%
|
9.85%
|
8.18%
|
8.39%
|
9.08%
|
|||||
|
Average
equity to average assets
|
11.51%
|
10.90%
|
10.76%
|
9.50%
|
8.93%
|
|||||
|
Tangible
equity to assets (5)
|
8.03%
|
7.90%
|
6.28%
|
5.93%
|
6.69%
|
|||||
|
Tangible
common equity to assets (6)
|
6.18%
|
5.61%
|
6.28%
|
5.93%
|
6.69%
|
|||||
| Tangible common equity to risk-weighted assets (7) |
8.83%
|
7.10% | 7.40% | 7.47% | 8.70% | |||||
|
Other:
|
||||||||||
|
Banking
facilities
|
87
|
72
|
73
|
70
|
45
|
|||||
|
Full
time equivalent employees (8)
|
1,638
|
1,342
|
1,282
|
1,380
|
1,123
|
|||||
|
(1)
|
Net
interest margin represents net interest income from continuing operations
as a percentage of average interest earning
assets.
|
|
(2)
|
Equals
total other expense excluding FDIC special assessment, contributions to
the MB Financial Charitable Foundation, executive separation agreement
expense, unamortized issuance costs related to redemption of trust
preferred securities, and impairment charges divided by the sum of net
interest income on a fully tax equivalent basis and total other income
less net gains (losses) on securities available for sale, net gains
(losses) on sale of other assets, and acquisition related
gains.
|
|
(3)
|
Non-performing
loans include loans accounted for on a non-accrual basis, accruing loans
contractually past due 90 days or more as to interest or principal and
loans the terms of which have been renegotiated to provide reduction or
deferral of interest or principal because of a deterioration in the
financial position of the borrower. Non-performing loans
excludes purchased credit-impaired loans that were acquired as part of the
Heritage, InBank, Corus, and Benchmark FDIC-assisted
transactions. See Note 6 in the notes to
consolidated financial statements contained under Item 8. Financial
Statements and Supplementary Data.
|
|
(4)
|
Non-performing
assets include non-performing loans, other real estate owned and other
repossessed assets. Non-performing assets exclude other real
estate owned that is related to the Heritage, InBank, and Benchmark
FDIC-assisted transactions. See Note 2 in
the notes to consolidated financial statements contained under Item 8.
Financial Statements and Supplementary
Data.
|
|
(5)
|
Equals
total ending shareholders’ equity less goodwill and other intangibles, net
of tax benefit, divided by total assets less goodwill and other
intangibles, net of tax benefit.
|
|
(6)
|
Equals
total ending shareholders’ equity less preferred stock, goodwill and other
intangibles, net of tax benefit, divided by total assets less goodwill and
other intangibles, net of tax
benefit.
|
|
(7)
|
Equals
total ending shareholders’ equity less preferred stock, goodwill and other
intangibles, net of tax benefit, divided by risk-weighted
assets.
|
|
(8)
|
Includes Union Bank employees for
2006 and 2005 and employees of our merchant card processing business for
all years shown.
|
Selected
Financial Data (continued):
Efficiency
Ratio Calculation (Dollars in Thousands)
|
2009
|
2008
|
2007
|
2006
|
2005
|
|||
|
Non-interest
expense
|
$ 223,750
|
$ 183,390
|
$ 191,506
|
$ 152,218
|
$ 131,155
|
||
|
Less
FDIC special assessment
|
3,850
|
-
|
-
|
-
|
-
|
||
|
Less
contributions to MB Financial Charitable Foundation
|
-
|
-
|
4,500
|
-
|
-
|
||
|
Less
executive separation agreement expense
|
-
|
-
|
5,908
|
-
|
-
|
||
|
Less
unamortized issuance costs related to redemption
|
|||||||
|
of
trust preferred securities
|
-
|
-
|
1,914
|
-
|
-
|
||
|
Less
impairment charges
|
4,000
|
-
|
-
|
-
|
-
|
||
|
Non-interest
expense - as adjusted
|
$ 215,900
|
$ 183,390
|
$ 179,184
|
$ 152,218
|
$ 131,155
|
||
|
Net
interest income
|
$ 250,552
|
$ 220,888
|
$ 212,306
|
$ 188,179
|
$ 168,833
|
||
|
Tax
equivalent adjustment
|
10,625
|
9,890
|
7,728
|
6,191
|
5,185
|
||
|
Net
interest income on a fully tax equivalent basis
|
261,177
|
230,778
|
220,034
|
194,370
|
174,018
|
||
|
Plus
other income
|
127,154
|
80,393
|
83,528
|
64,376
|
57,822
|
||
|
Less
net gains (losses) on securities available for sale
|
14,029
|
1,130
|
(3,744)
|
(445)
|
(2,077)
|
||
|
Less
net gains (losses) on sale of other assets
|
(13)
|
(1,104)
|
10,097
|
860
|
20
|
||
|
Less
acquisition related gains
|
28,547
|
-
|
-
|
-
|
-
|
||
|
Net
interest income plus non-interest income -
|
|||||||
|
as
adjusted
|
$ 345,768
|
$ 311,145
|
$ 297,209
|
$ 258,331
|
$ 233,897
|
||
|
Efficiency
ratio
|
62.44%
|
58.94%
|
60.29%
|
58.92%
|
56.07%
|
||
|
Efficiency
ratio (without adjustments)
|
59.24%
|
60.87%
|
64.73%
|
60.27%
|
57.87%
|
||
The
following table sets forth our selected quarterly financial data (in thousands,
except common share data):
|
Three
Months Ended 2009
|
Three
Months Ended 2008
|
|||||||
|
Statement
of Income Data:
|
December
|
September
|
June
|
March
|
December
|
September
|
June
|
March
|
|
Interest
income
|
$ 110,250
|
$
93,609
|
$ 93,864
|
$
95,815
|
$
101,535
|
$
103,061
|
$ 101,390
|
$
107,802
|
|
Interest
expense
|
36,049
|
32,675
|
34,475
|
39,787
|
46,789
|
46,455
|
45,317
|
54,339
|
|
Net
interest income
|
74,201
|
60,934
|
59,389
|
56,028
|
54,746
|
56,606
|
56,073
|
53,463
|
|
Provision
for loan losses
|
70,000
|
45,000
|
27,100
|
89,700
|
72,581
|
18,400
|
12,200
|
22,540
|
|
Net
interest income (loss) after provision for loan losses
|
4,201
|
15,934
|
32,289
|
(33,672)
|
(17,835)
|
38,206
|
43,873
|
30,923
|
|
Other
income
|
42,927
|
30,900
|
24,925
|
28,402
|
17,603
|
21,880
|
20,916
|
19,993
|
|
Other
expenses
|
61,072
|
59,158
|
54,508
|
49,012
|
44,011
|
47,773
|
47,665
|
43,940
|
|
Income
(loss) before income taxes
|
(13,944)
|
(12,324)
|
2,706
|
(54,282)
|
(44,243)
|
12,313
|
17,124
|
6,976
|
|
Income
tax expense (benefit)
|
(4,164)
|
(13,596)
|
(1,480)
|
(26,025)
|
(19,374)
|
(743)
|
(4,759)
|
1,321
|
|
Income
(loss) from continuing operations
|
(9,780)
|
1,272
|
4,186
|
(28,257)
|
(24,869)
|
13,056
|
21,883
|
5,655
|
|
Income
from discontinued operations, net of income tax
|
-
|
6,172
|
129
|
152
|
48
|
98
|
124
|
169
|
|
Net
income (loss)
|
$ (9,780)
|
$
7,444
|
$ 4,315
|
$
(28,105)
|
$
(24,821)
|
$
13,154
|
$ 22,007
|
$
5,824
|
|
Dividends
on preferred shares
|
2,591
|
2,589
|
2,587
|
2,531
|
789
|
-
|
-
|
-
|
|
Net
income (loss) available to common shareholders
|
$ (12,371)
|
$
4,855
|
$ 1,728
|
$
(30,636)
|
$
(25,610)
|
$
13,154
|
$ 22,007
|
$ 5,824
|
|
Net
Interest Margin
|
2.74%
|
2.74%
|
3.05%
|
2.88%
|
2.86%
|
3.04%
|
3.11%
|
3.10%
|
|
Tax
equivalent effect
|
0.12%
|
0.11%
|
0.13%
|
0.13%
|
0.14%
|
0.14%
|
0.14%
|
0.12%
|
|
Net
interest margin on a fully tax equivalent basis
|
2.86%
|
2.85%
|
3.18%
|
3.01%
|
3.00%
|
3.18%
|
3.25%
|
3.22%
|
|
Common
Share Data :
|
||||||||
|
Basic
earnings (loss) per common share from continuing
operations
|
$ (0.19)
|
$ 0.03
|
$ 0.12
|
$ (0.81)
|
$ (0.72)
|
$ 0.38
|
$ 0.63
|
$ 0.16
|
|
Basic
earnings per common share from discontinued operations
|
$ -
|
$ 0.16
|
$ 0.00
|
$ 0.00
|
$ 0.00
|
$ 0.00
|
$ 0.00
|
$ 0.00
|
|
Impact
of preferred stock dividends on basic earnings (loss) per common
share
|
$ (0.05)
|
$ (0.07)
|
$ (0.07)
|
$ (0.07)
|
$ (0.02)
|
$ 0.00
|
$ -
|
$ -
|
|
Basis
earnings (loss) per common share
|
$ (0.25)
|
$ 0.12
|
$ 0.05
|
$ (0.88)
|
$ (0.74)
|
$ 0.38
|
$ 0.63
|
$ 0.17
|
|
Diluted
earnings (loss) per common share from continuing
operations
|
$ (0.19)
|
$ 0.03
|
$ 0.12
|
$ (0.81)
|
$ (0.72)
|
$ 0.38
|
$ 0.62
|
$ 0.16
|
|
Diluted
earnings per common share from discontinued operations
|
$ -
|
$ 0.16
|
$ 0.00
|
$ 0.00
|
$ 0.00
|
$ 0.00
|
$ 0.00
|
$ 0.00
|
|
Impact
of preferred stock dividends on diluted earnings (loss) per common
share
|
$ (0.05)
|
$ (0.07)
|
$ (0.07)
|
$ (0.07)
|
$ (0.02)
|
$ 0.00
|
$ -
|
$ -
|
|
Diluted
earnings (loss) per common share
|
$ (0.25)
|
$ 0.12
|
$ 0.05
|
$ (0.88)
|
$ (0.74)
|
$ 0.38
|
$ 0.63
|
$ 0.17
|
|
Weighted
average common shares outstanding
|
50,279,008
|
39,104,894
|
35,726,879
|
34,914,012
|
34,777,651
|
34,732,633
|
34,692,571
|
34,620,435
|
|
Diluted
weighted average common shares outstanding
|
50,279,008
|
39,299,168
|
35,876,483
|
34,914,012
|
35,164,585
|
35,074,297
|
35,047,596
|
34,994,731
|
Fourth
Quarter Results
We had a
net loss available to common shareholders of $12.4 million for the fourth
quarter of 2009, compared to a net loss available to common shareholders of
$25.6 million for the fourth quarter of 2008. The results for the
fourth quarter of 2009 generated annualized return on average assets of (0.33%),
and an annualized return on average common equity of (4.54%), compared to
(1.15%) and (11.38%), respectively, for the same period in 2008.
Net
interest income increased 35.5% to $74.2 million in the fourth quarter of 2009,
compared to $54.7 million for fourth quarter of 2008. Our average
interest earning assets increased by $3.1 billion from the fourth quarter of
2008 to the fourth quarter of 2009. The increase in average interest
earning assets was partially offset by a 14 basis point decrease in our net
interest margin, on a fully tax equivalent basis. Average interest
earning assets increased primarily due to our FDIC assisted transactions during
2009. See Note 2 in the notes to consolidated
financial statements contained under Item 8. Financial Statements and
Supplementary Data for additional information.
The
provision for loan losses was $70.0 million in the fourth quarter of 2009 and
$72.6 million in the fourth quarter of 2008. Net charge-offs were
$82.2 million in the fourth quarter of 2009 compared to $17.4 million in the
fourth quarter of 2008. See “Management’s Discussion and Analysis of
Financial Condition and Results of Operations-Asset Quality”
in Item 7 below for further analysis of the allowance for loan
losses.
Other
income was $42.9 million during the fourth quarter of 2009, an increase of $25.3
million, or 143.9% compared to $17.6 million for the fourth quarter of
2008. Deposit service fees increased from $7.5 million in the fourth
quarter of 2008 to $9.3 million in the fourth quarter of 2009, primarily due to
an increase in commercial deposit fees related to deposits assumed in our FDIC
assisted transactions. Net lease financing increased primarily due to
an increase in the sales of third party equipment maintenance to
customers. During the fourth quarter of 2009 we recorded an $18.3 million
gain relating to our FDIC assisted Benchmark transaction. Other
operating income increased primarily due to a decrease in market value of assets
held in trust for deferred compensation.
Other
expense increased $17.1 million or 38.8% to $61.1 million for the fourth quarter
of 2009 from $44.0 million for the fourth quarter of 2008. Our
Heritage, InBank, Corus and Benchmark transactions increased salaries and
employee benefits expense, occupancy and equipment expense, computer services
expense, other intangible amortization expense, and FDIC insurance premiums by
approximately $4.9 million, $1.8 million, $903 thousand, $993 thousand and $1.2
million, respectively. Our Heritage, InBank, Corus and Benchmark
transactions increased total other expense by approximately $11.2 million for
the fourth quarter of 2009. Additionally, FDIC insurance premium
expense increased due to our FDIC credits being fully utilized during the fourth
quarter of 2008, the FDIC increasing its assessment rate from the fourth quarter
of 2008 to the fourth quarter of 2009, and our higher level of deposits in
2009.
Income
tax benefit from continuing operations for the fourth quarter of 2009 was $4.2
million, compared to an income tax benefit from continuing operations of $19.4
million for the three months ended December 31, 2008. See Note 16 of notes to consolidated financial statements
contained in Item 8 of this report for further analysis of income
taxes.
The
following is a discussion and analysis of our financial position and results of
operations and should be read in conjunction with the information set forth
under “Item 1A Risks Factors,” “General” in Item 7A, Quantitative and
Qualitative Disclosures about Market Risk, and our consolidated financial
statements and notes thereto appearing under Item 8 of this report.
Overview
We had a
net loss available to common shareholders of $36.4 million for the year ended
December 31, 2009 compared to net income available to common shareholders of
$15.4 million for the year ended December 31, 2008. The decrease in
earnings was primarily due to a $106.1 million increase in provision for loan
losses. Fully diluted earnings (loss) per common share were ($0.91) for
the year ended December 31, 2009, compared to $0.44 per common share in
2008.
The
profitability of our operations depends primarily on our net interest income
after provision for loan losses, which is the difference between interest earned
on interest earning assets and interest paid on interest bearing liabilities
less provision for loan losses. The provision for loan losses is
dependent on changes in our loan portfolio and management’s assessment of the
collectability of our loan portfolio as well as prevailing economic and market
conditions. Additionally, our net income is affected by other income
and other expenses. Non-interest income or other income consists of
loan service fees, deposit service fees, net lease financing income, brokerage
fees, asset management and trust fees, net gains on the sale of investment
securities available for sale, increase in cash surrender value of life
insurance, net gains (losses) on sale of other assets, acquisition related gains
and other operating income. Other expenses include salaries and
employee benefits, occupancy and equipment expense, computer services expense,
advertising and marketing expense, professional and legal expense, brokerage fee
expense, telecommunication expense, other intangibles amortization expense, FDIC
insurance premiums, charitable contributions, impairment charges and other
operating expenses. Additionally, dividends on preferred shares
reduce net income available to common shareholders.
Net
interest income is affected by changes in the volume and mix of interest earning
assets, interest earned on those assets, the volume and mix of interest bearing
liabilities and interest paid on interest bearing liabilities. Other
income and other expenses are impacted by growth of operations and growth in the
number of loan and deposit accounts through both acquisitions and core banking
business growth. Growth in operations affects other expenses
primarily as a result of additional employees, branch facilities and promotional
marketing expense. Growth in the number of loan and deposit accounts
affects other income, including service fees as well as other expenses such as
computer services, supplies, postage, telecommunications and other miscellaneous
expenses.
As noted
under “Item 6 Selected Financial Data,” on August 10,
2009, the Company sold its merchant card processing business, resulting in an
after-tax gain of $6.2 million.
As noted
under “Item 6. Selected Financial Data," on November 28,
2007, we completed the sale of our Oklahoma City-based subsidiary bank, Union
Bank for $76.3 million, resulting in an after-tax gain of $28.8
million. Prior to closing, Union Bank sold to MB Financial Bank
approximately $100 million in performing loans previously purchased from and
originated by MB Financial Bank.
For
purposes of the following discussion, balances, average rate, income and
expenses associated with Union Bank and the Company’s merchant card processing
business, including the gains recognized on the sales, have been excluded from
continuing operations. See Note 3 of the notes
to our consolidated financial statements for additional information on
discontinued operations.
The
Financial Accounting Standards Board’s (FASB) Accounting Standards Codification
(ASC) became effective on July 1, 2009. At that date, the ASC became FASB’s
officially recognized source of authoritative U.S. GAAP applicable to all public
and non-public non-governmental entities, superseding existing FASB, American
Institute of Certified Public Accountants (AICPA), Emerging Issues Task Force
(EITF) and related literature. Rules and interpretive releases of the SEC under
the authority of federal securities laws are also sources of authoritative GAAP
for SEC registrants. All other accounting literature is considered
non-authoritative. The switch to the ASC affects the way companies refer to U.S.
GAAP in financial statements and accounting policies. Citing particular content
in the ASC involves specifying the unique numeric path to the content through
the Topic, Subtopic, Section and Paragraph structure.
Critical
Accounting Policies
Our
consolidated financial statements are prepared in conformity with accounting
principles generally accepted in the United States of America and follow general
practices within the industries in which we operate. This preparation
requires management to make estimates, assumptions, and judgments that affect
the amounts reported in the financial statements and accompanying
notes. These estimates, assumptions, and judgments are based on
information available as of the date of the financial statements; accordingly,
as this information changes, actual results could differ from the estimates,
assumptions, and judgments reflected in the financial
statements. Certain policies inherently have a greater reliance on
the use of estimates, assumptions, and judgments and, as such, have a greater
possibility of producing results that could be materially different than
originally reported. Management believes the following policies are
both important to the portrayal of our financial condition and results of
operations and require subjective or complex judgments; therefore, management
considers the following to be critical accounting
policies. Management has reviewed the application of these polices
with the Audit Committee of our Board of Directors.
Allowance for Loan
Losses. Subject to the use of estimates, assumptions, and
judgments is management's evaluation process used to determine the adequacy of
the allowance for loan losses, which combines several factors: management's
ongoing review and grading of the loan portfolio, consideration of past loan
loss experience, trends in past due and nonperforming loans, risk
characteristics of the various classifications of loans, existing economic
conditions, the fair value of underlying collateral, and other qualitative and
quantitative factors which could affect probable credit
losses. Because current economic conditions can change and future
events are inherently difficult to predict, the anticipated amount of estimated
loan losses, and therefore the adequacy of the allowance, could change
significantly. As an integral part of their examination process,
various regulatory agencies also review the allowance for loan
losses. Such agencies may require that certain loan balances be
charged off when their credit evaluations differ from those of management or
require that adjustments be made to the allowance for loan losses, based on
their judgments about information available to them at the time of their
examination. We believe the allowance for loan losses is adequate and
properly recorded in the financial statements. See "Allowance for Loan Losses" section below for further
analysis.
Residual Value of Our
Direct Finance, Leveraged, and Operating Leases. Lease
residual value represents the present value of the estimated fair value of the
leased equipment at the termination date of the lease. Realization of
these residual values depends on many factors, including management’s use of
estimates, assumptions, and judgment to determine such
values. Several other factors outside of management’s control may
reduce the residual values realized, including general market conditions at the
time of expiration of the lease, whether there has been technological or
economic obsolescence or unusual wear and tear on, or use of, the equipment and
the cost of comparable equipment. If, upon the expiration of a lease,
we sell the equipment and the amount realized is less than the recorded value of
the residual interest in the equipment, we will recognize a loss reflecting the
difference. On a quarterly basis, management reviews the lease
residuals for potential impairment. If we fail to realize our
aggregate recorded residual values, our financial condition and profitability
could be adversely affected. At December 31, 2009, the
aggregate residual value of the equipment leased under our direct finance,
leveraged, and operating leases totaled $55.0 million. See Note 1 and Note 7 of our audited
consolidated financial statements for additional information.
Income Tax
Accounting. ASC Topic 740 provides guidance on accounting for
income taxes by prescribing the minimum recognition threshold that a tax
position must meet to be recognized in the financial statements. ASC
Topic 740 also provides guidance on measurement, recognition, classification,
interest and penalties, accounting in interim periods, disclosure and
transition. As of December 31, 2009, the Company had $291 thousand of
uncertain tax positions. The Company elects to treat interest and
penalties recognized for the underpayment of income taxes as income tax
expense. However, interest and penalties imposed by taxing
authorities on issues specifically addressed in ASC Topic 740 will be taken out
of the tax reserves up to the amount allocated to interest and
penalties. The amount of interest and penalties exceeding the amount
allocated in the tax reserves will be treated as income tax
expense. As of December 31, 2009, the Company had approximately $50
thousand of accrued interest related to tax reserves. The application
of income tax law is inherently complex. Laws and regulations in this
area are voluminous and are often ambiguous. As such, we are required
to make many subjective assumptions and judgments regarding our income tax
exposures. Interpretations of and guidance surrounding income tax
laws and regulations change over time. As such, changes in our
subjective assumptions and judgments can materially affect amounts recognized in
the consolidated balance sheets and statements of income.
Fair Value of Assets and
Liabilities. ASC Topic 820 defines fair value as the price
that would be received to sell the financial asset or paid to transfer the
financial liability in an orderly transaction between market participants at the
measurement date.
The
degree of management judgment involved in determining the fair value of assets
and liabilities is dependent upon the availability of quoted market prices or
observable market parameters. For financial instruments that trade
actively and have quoted market prices or observable market parameters, there is
minimal subjectivity involved in measuring fair value. When
observable market prices and parameters are not fully available, management
judgment is necessary to estimate fair value. In addition, changes in
market conditions may reduce the availability of quoted prices or observable
data. For example, reduced liquidity in the capital markets or
changes in secondary market activities could result in observable market inputs
becoming unavailable. Therefore, when market data is not available,
the Company would use valuation techniques requiring more management judgment to
estimate the appropriate fair value measurement.
During
the year ended December 31, 2009, the Company completed four FDIC assisted
transactions. The Company recorded assets and liabilities at the
estimated fair value as of the acquisition dates. See Note 2 below to the consolidated financial statements for
additional information.
See Note 19 to the consolidated financial statements for a
complete discussion on the Company’s use of fair valuation of assets and
liabilities and the related measurement techniques.
Recent Accounting
Pronouncements. Refer to Note 1 of our
consolidated financial statements for a description of recent accounting
pronouncements including the respective dates of adoption and effects on results
of operations and financial condition.
Net
Interest Income
The
following table presents, for the periods indicated, the total dollar amount of
interest income from average interest earning assets and the related yields, as
well as the interest expense on average interest bearing liabilities, and the
related costs, expressed both in dollars and rates (dollars in
thousands). The table below and the discussion that follows contain
presentations of net interest income and net interest margin on a tax-equivalent
basis, which is adjusted for the tax-favored status of income from certain loans
and investments. Net interest margin also is presented on a
tax-equivalent basis in “Item 6. Selected Financial Data.” We believe
this measure to be the preferred industry measurement of net interest income, as
it provides a relevant comparison between taxable and non-taxable
amounts.
Reconciliations
of net interest income and net interest margin on a tax-equivalent basis to net
interest income and net interest margin in accordance with accounting principles
generally accepted in the United States of America are provided in the
table.
|
Year
Ended December 31,
|
|||||||||||
|
2009
|
2008
|
2007
|
|||||||||
|
Average
|
Yield/
|
Average
|
Yield/
|
Average
|
Yield/
|
||||||
|
Balance
|
Interest
|
Rate
|
Balance
|
Interest
|
Rate
|
Balance
|
Interest
|
Rate
|
|||
|
Interest
Earning Assets:
|
|||||||||||
|
Loans
(1) (2) (3)
|
$ 6,339,229
|
$ 326,293
|
5.15%
|
$ 5,892,845
|
$ 354,210
|
6.01%
|
$ 5,198,249
|
$ 392,526
|
7.55%
|
||
|
Loans
exempt from federal income taxes (4)
|
82,019
|
7,658
|
9.21
|
59,746
|
4,408
|
7.26
|
9,338
|
754
|
7.96
|
||
|
Taxable
investment securities
|
1,444,552
|
45,777
|
3.17
|
868,700
|
40,468
|
4.66
|
1,037,129
|
49,675
|
4.79
|
||
|
Investment
securities exempt from federal income taxes (4)
|
391,071
|
22,698
|
5.72
|
414,234
|
23,849
|
5.66
|
374,025
|
21,326
|
5.62
|
||
|
Federal
funds sold
|
-
|
-
|
-
|
12,849
|
276
|
2.11
|
8,853
|
449
|
5.00
|
||
|
Other
interest bearing deposits
|
545,314
|
1,737
|
0.32
|
52,497
|
467
|
0.89
|
7,193
|
264
|
3.67
|
||
|
Total
interest earning assets
|
8,802,185
|
$ 404,163
|
4.59
|
7,300,871
|
$ 423,678
|
5.80
|
6,634,787
|
$ 464,994
|
7.01
|
||
|
Assets
available for sale
|
-
|
-
|
341,734
|
||||||||
|
Non-interest
earning assets
|
975,103
|
939,473
|
934,089
|
||||||||
|
Total
assets
|
$ 9,777,288
|
$ 8,240,344
|
$ 7,910,610
|
||||||||
|
Interest
Bearing Liabilities:
|
|||||||||||
|
Deposits:
|
|||||||||||
|
NOW
and money market deposit
|
$ 2,098,530
|
$ 17,773
|
0.85%
|
$ 1,292,407
|
$ 23,176
|
1.79%
|
$ 1,213,001
|
$ 37,568
|
3.10%
|
||
|
Savings
deposit
|
473,477
|
1,717
|
0.36
|
383,534
|
1,239
|
0.32
|
428,087
|
3,051
|
0.71
|
||
|
Time
deposits
|
3,725,326
|
102,124
|
2.74
|
3,426,332
|
126,955
|
3.71
|
2,986,964
|
145,030
|
4.86
|
||
|
Short-term
borrowings
|
449,548
|
5,166
|
1.15
|
681,074
|
17,590
|
2.58
|
812,681
|
37,354
|
4.60
|
||
|
Long-term
borrowings and junior subordinated notes
|
512,267
|
16,206
|
3.12
|
581,026
|
23,940
|
4.05
|
364,441
|
21,957
|
5.94
|
||
|
Total
interest bearing liabilities
|
7,259,148
|
$ 142,986
|
1.97
|
6,364,373
|
$ 192,900
|
3.03
|
5,805,174
|
$ 244,960
|
4.22
|
||
|
Non-interest
bearing deposits
|
1,307,021
|
891,072
|
860,557
|
||||||||
|
Liabilities
held for sale
|
-
|
-
|
313,414
|
||||||||
|
Other
non-interest bearing liabilities
|
85,890
|
85,368
|
80,141
|
||||||||
|
Stockholders’
equity
|
1,125,229
|
899,531
|
851,324
|
||||||||
|
Total
liabilities and stockholders’ equity
|
$ 9,777,288
|
$ 8,240,344
|
$ 7,910,610
|
||||||||
|
Net
interest income/interest rate spread (5)
|
$ 261,177
|
2.62%
|
$ 230,778
|
2.77%
|
$ 220,034
|
2.79%
|
|||||
|
Taxable
equivalent adjustment
|
(10,625)
|
(9,890)
|
7,728
|
||||||||
|
Net
interest income, as reported
|
$ 250,552
|
$ 220,888
|
$ 212,306
|
||||||||
|
Net
interest margin (6)
|
2.85%
|
3.03%
|
3.20%
|
||||||||
|
Tax
equivalent effect
|
0.12%
|
0.13%
|
0.12%
|
||||||||
|
Net
interest margin on a fully tax equivalent basis (6)
|
2.97%
|
3.16%
|
3.32%
|
||||||||
|
(1)
|
Non-accrual
loans are included in average
loans.
|
|
(2)
|
Interest
income includes amortization of deferred loan origination fees of $5.1
million, $7.0 million and $6.7 million for the years ended December 31,
2009, 2008 and 2007, respectively.
|
|
(3)
|
Loans
held for sale are included in the average loan balance
listed. Related interest income is included in loan interest
income.
|
|
(4)
|
Non-taxable
loan and investment income is presented on a fully tax equivalent basis
assuming a 35% tax rate.
|
|
(5)
|
Interest
rate spread represents the difference between the average yield on
interest earning assets and the average cost of interest bearing
liabilities and is presented on a fully tax equivalent
basis.
|
|
(6)
|
Net
interest margin represents net interest income as a percentage of average
interest earning assets.
|
Net
interest income on a tax equivalent basis was $261.2 million for the year ended
December 31, 2009, an increase of $30.4 million, or 13.2% from $230.8 million
for the comparable period in 2008. The growth in net interest income
reflects a $1.5 billion, or 20.6%, increase in average interest earning assets,
and an $894.8 million, or 14.1%, increase in average interest bearing
liabilities. This was partially offset by approximately 19 basis
points of margin compression on a fully tax equivalent basis. The
increase in average interest earning assets and the increase in average interest
bearing liabilities was primarily due to interest earning assets acquired and
interest bearing liabilities assumed in four FDIC assisted transactions during
2009. See Note 2 in the notes to consolidated
financial statements contained under Item 8. Financial Statements and
Supplementary Data. The net interest margin, expressed on a fully tax
equivalent basis, was 2.97% for 2009 and 3.16% for 2008. Our
non-performing loans negatively impacted the net interest margin during 2009 and
2008 by approximately 15 basis points, and 9 basis points,
respectively.
Net
interest income on a tax equivalent basis was $230.8 million for the year ended
December 31, 2008, an increase of $10.7 million, or 4.9% from $220.0 million for
the comparable period in 2007. The growth in net interest income
reflects a $666.1 million, or 10.0%, increase in average interest earning
assets, and a $559.2 million, or 9.6%, increase in average interest bearing
liabilities. This was partially offset by approximately 16 basis
points of margin compression on a fully tax equivalent basis. The
increase in average interest earning assets and the increase in average interest
bearing liabilities was due to organic growth. The net interest
margin, expressed on a fully tax equivalent basis, was 3.16% for 2008 and 3.32%
for 2007. The decline in the net interest margin was primarily due to
an increase in non-performing loans during 2008, and our interest earning assets
repricing faster than our interest bearing liabilities during 2008 due to the
dramatic decrease in Fed funds and LIBOR rates during the second half of
2008.
Volume
and Rate Analysis of Net Interest Income
The
following table presents the extent to which changes in volume and interest
rates of interest earning assets and interest bearing liabilities have affected
our interest income and interest expense during the periods
indicated. Information is provided in each category with respect to
(i) changes attributable to changes in volume (changes in volume multiplied by
prior period rate), (ii) changes attributable to changes in rates (changes in
rates multiplied by prior period volume) and (iii) change attributable to a
combination of changes in rate and volume (change in rates multiplied by the
changes in volume) (in thousands). Changes attributable to the
combined impact of volume and rate have been allocated proportionately to the
changes due to volume and the changes due to rate.
|
Year
Ended December 31,
|
||||||||||||
|
2009
Compared to 2008
|
2008
Compared to 2007
|
|||||||||||
|
Change
|
Change
|
Change
|
Change
|
|||||||||
|
Due
to
|
Due
to
|
Total
|
Due
to
|
Due
to
|
Total
|
|||||||
|
Volume
|
Rate
|
Change
|
Volume
|
Rate
|
Change
|
|||||||
|
Interest
Earning Assets:
|
||||||||||||
|
Loans
|
$ 27,016
|
$ (54,933)
|
$ (27,917)
|
$ 47,821
|
$ (86,137)
|
$ (38,316)
|
||||||
|
Loans
exempt from federal income taxes (1)
|
1,899
|
1,351
|
3,250
|
3,725
|
(71)
|
3,654
|
||||||
|
Taxable
investment securities
|
21,039
|
(15,730)
|
5,309
|
(7,878)
|
(1,329)
|
(9,207)
|
||||||
|
Investment
securities exempt from federal income taxes (1)
|
(1,343)
|
192
|
(1,151)
|
2,313
|
210
|
2,523
|
||||||
|
Federal
funds sold
|
(138)
|
(138)
|
(276)
|
152
|
(325)
|
(173)
|
||||||
|
Other
interest bearing deposits
|
1,750
|
(480)
|
1,270
|
538
|
(335)
|
203
|
||||||
|
Total
increase (decrease) in interest income
|
50,223
|
(69,738)
|
(19,515)
|
46,671
|
(87,987)
|
(41,316)
|
||||||
|
Interest
Bearing Liabilities:
|
||||||||||||
|
Deposits
|
||||||||||||
|
NOW
and money market deposit accounts
|
10,323
|
(15,726)
|
(5,403)
|
2,320
|
(16,712)
|
(14,392)
|
||||||
|
Savings
deposits
|
314
|
164
|
478
|
(290)
|
(1,522)
|
(1,812)
|
||||||
|
Time
deposits
|
10,354
|
(35,185)
|
(24,831)
|
19,397
|
(37,472)
|
(18,075)
|
||||||
|
Short-term
borrowings
|
(4,719)
|
(7,705)
|
(12,424)
|
(5,334)
|
(14,430)
|
(19,764)
|
||||||
|
Long-term
borrowings and junior subordinated notes
|
(2,611)
|
(5,123)
|
(7,734)
|
10,356
|
(8,373)
|
1,983
|
||||||
|
Total
(decrease) increase in interest expense
|
13,661
|
(63,575)
|
(49,914)
|
26,449
|
(78,509)
|
(52,060)
|
||||||
|
Total
increase (decrease) in net interest income
|
$ 36,562
|
$ (6,163)
|
$
30,399
|
$ 20,222
|
$ (9,478)
|
$ 10,744
|
||||||
|
(1)
|
Non-taxable
loan and investment income is presented on a fully tax equivalent basis
assuming a 35% rate.
|
Other
Income
|
Year
Ended
|
|||||||
|
December
31,
|
December
31,
|
Increase/
|
Percentage
|
||||
|
2009
|
2008
|
(Decrease)
|
Change
|
||||
|
Other
income (in thousands):
|
|||||||
|
Loan
service fees
|
$
6,913
|
$
9,180
|
$
(2,267)
|
(25%)
|
|||
|
Deposit
service fees
|
30,600
|
28,225
|
2,375
|
8%
|
|||
|
Lease
financing, net
|
18,528
|
16,973
|
1,555
|
9%
|
|||
|
Brokerage
fees
|
4,606
|
4,317
|
289
|
7%
|
|||
|
Trust
and asset management fees
|
12,593
|
11,869
|
724
|
6%
|
|||
|
Net
gain on sale of investment securities
|
14,029
|
1,130
|
12,899
|
1,142%
|
|||
|
Increase
in cash surrender value of life insurance
|
2,459
|
5,299
|
(2,840)
|
(54%)
|
|||
|
Net
loss on sale of other assets
|
(13)
|
(1,104)
|
1,091
|
(99%)
|
|||
|
Acquisition
related gains
|
28,547
|
-
|
28,547
|
N/A
|
|||
|
Other
operating income
|
8,892
|
4,504
|
4,388
|
97%
|
|||
|
Total
other income
|
$
127,154
|
$
80,393
|
$
46,761
|
58%
|
|||
Other
income increased from the year ended December 31, 2009 to the year ended
December 31, 2008 primarily due to gains recognized on the FDIC assisted
transactions during 2009, totaling $28.5 million, as well as a net gain on sale
of investment securities of $14.0 million compared with a net gain on sale of
investment securities of $1.1 million during the year ended December 31,
2008. Loan service fees decreased, primarily due to a decrease in
letter of credit and prepayment fees. The decrease in cash surrender
value of life insurance was primarily due to a decrease in overall interest
rates from the year ended December 31, 2008 to the year ended December 31, 2009,
and $1.4 million of death benefits on bank owned life insurance policies that we
recognized during the year ended December 31, 2008. Other operating
income increased primarily due to an increase in gains recognized on the sale of
loans, and an increase in market value of assets held in trust for deferred
compensation during the year ended December 31, 2009.
|
Year
Ended
|
|||||||
|
December
31,
|
December
31,
|
Increase/
|
Percentage
|
||||
|
2008
|
2007
|
(Decrease)
|
Change
|
||||
|
Other
income (in thousands):
|
|||||||
|
Loan
service fees
|
$
9,180
|
$
6,258
|
$
2,922
|
47%
|
|||
|
Deposit
service fees
|
28,225
|
23,918
|
4,307
|
18%
|
|||
|
Lease
financing, net
|
16,973
|
15,847
|
1,126
|
7%
|
|||
|
Brokerage
fees
|
4,317
|
9,581
|
(5,264)
|
(55%)
|
|||
|
Trust
and asset management fees
|
11,869
|
10,447
|
1,422
|
14%
|
|||
|
Net
gain (loss) on sale of investment securities
|
1,130
|
(3,744)
|
4,874
|
(130%)
|
|||
|
Increase
in cash surrender value of life insurance
|
5,299
|
5,003
|
296
|
6%
|
|||
|
Net
(loss) gain on sale of other assets
|
(1,104)
|
10,097
|
(11,201)
|
(111%)
|
|||
|
Acquisition
related gains
|
-
|
-
|
-
|
N/A
|
|||
|
Other
operating income
|
4,504
|
6,121
|
(1,617)
|
(26%)
|
|||
|
Total
other income
|
$
80,393
|
$
83,528
|
$
(3,135)
|
(4%)
|
|||
Other
income did not change significantly from the year ended December 31, 2007 to the
year ended December 31, 2008. Net gain on sale of other assets
decreased by $11.2 million. During the year ended December 31, 2007,
we realized a gain of $2.4 million on the sale of artwork that was acquired as a
result of our acquisition of FOBB and a gain of $7.4 million on the sale of two
real estate properties. Brokerage fees decreased by $5.3 million,
primarily due to the sale of our third party brokerage business during the
second quarter of 2007, and conversion of customer accounts to the purchaser’s
platform in third quarter. This decrease was offset by a
corresponding reduction in brokerage expense. These decreases were
partially offset by a $1.1 million gain on the sale of investment securities
during the year ended December 31, 2008, compared to a $3.7 million loss on the
sale of investment securities for the comparable period in
2007. Deposit service fees increased primarily due to an increase in
commercial deposit and treasury management fees as a result of a lower earnings
credit rate. Loan service fees increased primarily due to an increase
in letter of credit fees, prepayment fees and swap fees recognized during 2008
compared to 2007. Other income decreased primarily due to a decrease
in market value of assets held in trust for deferred compensation and was offset
by the same amount recorded as other expense.
Other
Expenses
|
Year
Ended
|
|||||||
|
December
31,
|
December
31,
|
Increase/
|
Percentage
|
||||
|
2009
|
2008
|
(Decrease)
|
Change
|
||||
|
Other
expense (in thousands):
|
|||||||
|
Salaries
and employee benefits
|
$ 120,654
|
$ 108,835
|
$ 11,819
|
11%
|
|||
|
Occupancy
and equipment expense
|
31,521
|
28,872
|
2,649
|
9%
|
|||
|
Computer
services expense
|
10,011
|
7,392
|
2,619
|
35%
|
|||
|
Advertising
and marketing expense
|
4,185
|
5,089
|
(904)
|
(18%)
|
|||
|
Professional
and legal expense
|
4,680
|
3,110
|
1,570
|
50%
|
|||
|
Brokerage
fee expense
|
1,999
|
1,929
|
70
|
4%
|
|||
|
Telecommunication
expense
|
3,433
|
2,818
|
615
|
22%
|
|||
|
Other
intangibles amortization expense
|
4,491
|
3,554
|
937
|
26%
|
|||
|
FDIC
insurance premiums
|
16,762
|
1,877
|
14,885
|
793%
|
|||
|
Charitable
contributions
|
73
|
30
|
43
|
143%
|
|||
|
Impairment
charges
|
4,000
|
-
|
4,000
|
N/A
|
|||
|
Other
operating expenses
|
21,941
|
19,884
|
2,057
|
10%
|
|||
|
Total
other expense
|
$ 223,750
|
$ 183,390
|
$ 40,360
|
22%
|
|||
The FDIC assisted transactions increased salaries and employee benefits expense,
occupancy and equipment expense, computer services expense, other intangible
amortization expense, and FDIC insurance premiums from the year ended December
31, 2008 to the year ended December 31, 2009 by approximately $6.6 million, $2.6
million, $2.1 million, $973 thousand, and $1.9 million, respectively.
Salaries and employee benefits expense also increased due to additional
credit remediation staff hired in 2009. Our Heritage, InBank, Corus
and Benchmark transactions increased total other expense by approximately $17.1
million for the year ended December 31, 2009. Additionally, FDIC
insurance premium expense increased as general insurance assessment rates
increased and the FDIC imposed a special premium on all insured depository
institutions based on assets as of June 30, 2009. During 2009, the
Company conducted an impairment review of branch office locations to be
consolidated due to the Company’s recent acquisitions. As a
result, the Company recognized a $4.0 million impairment charge related to three
branches in 2009. See Note 2 to the Consolidated
Financial Statements for further information regarding the Heritage, InBank,
Corus, and Benchmark transactions. Other operating expenses increased
primarily due to an increase in expenses related to other real estate owned from
the year ended December 31, 2008 to the year ended December 31,
2009.
|
Year
Ended
|
|||||||
|
December
31,
|
December
31,
|
Increase/
|
Percentage
|
||||
|
2008
|
2007
|
(Decrease)
|
Change
|
||||
|
Other
expense (in thousands):
|
|||||||
|
Salaries
and employee benefits
|
$
108,835
|
$
110,809
|
$ (1,974)
|
(2%)
|
|||
|
Occupancy
and equipment expense
|
28,872
|
28,878
|
(6)
|
(0%)
|
|||
|
Computer
services expense
|
7,392
|
6,699
|
693
|
10%
|
|||
|
Advertising
and marketing expense
|
5,089
|
4,859
|
230
|
5%
|
|||
|
Professional
and legal expense
|
3,110
|
4,543
|
(1,433)
|
(32%)
|
|||
|
Brokerage
fee expense
|
1,929
|
4,802
|
(2,873)
|
(60%)
|
|||
|
Telecommunication
expense
|
2,818
|
2,805
|
13
|
0%
|
|||
|
Other
intangibles amortization expense
|
3,554
|
3,504
|
50
|
1%
|
|||
|
FDIC
insurance premiums
|
1,877
|
664
|
1,213
|
183%
|
|||
|
Charitable
contributions
|
30
|
4,686
|
(4,656)
|
(99%)
|
|||
|
Other
operating expenses
|
19,884
|
19,257
|
627
|
3%
|
|||
|
Total
other expense
|
$
183,390
|
$ 191,506
|
$ (8,116)
|
(4%)
|
|||
Other
expense for the year ended December 31, 2008, decreased $8.1 million, or 4.2%,
to $183.4 million, compared to $191.5 million for the year ended December 31,
2007. Salaries and employee benefits expense decreased primarily due
to an executive separation agreement expense incurred in 2007, partially offset
by the additional commercial bankers hired from the end of the third quarter of
2007 through the second quarter of 2008 and the acquisition of Cedar
Hill. Professional and legal expense decreased primarily due to $1.9
million of unamortized issuance costs recognized during 2007, as a result of the
redemption of trust preferred securities in October 2007. Charitable
contributions decreased primarily due to contributions totaling $4.5 million
made during 2007 to the MB Financial Charitable Foundation, which is dedicated
to strengthening the communities where MB Financial Bank operates. As
noted earlier, the decrease in our brokerage fee expense from the year ended
December 31, 2007 to the comparable period in 2008 was primarily due to the sale
of our third party brokerage business during the second quarter of
2007.
Income
Taxes
Income
tax benefit from continuing operations for the year ended December 31, 2009 was
$45.3 million, compared to income tax benefit from continuing operations of
$23.6 million for the year ended December 31, 2008. During the
year ended December 31, 2009, our taxable income significantly decreased
compared to the same period in 2008, primarily due to our results of operations
during the year ended December 31, 2009. Additionally, during 2009,
the Company increased the amount of benefit recognized with respect to certain
previously identified uncertain tax positions as a result of developments in
pending tax audits. The increase in recognized tax benefit resulted
in a $7.8 million increase in income tax benefit in 2009.
Income
tax benefit from continuing operations for the year ended December 31, 2008 was
$23.6 million, compared to income tax expense from continuing operations of
$23.7 million for the year ended December 31, 2007, primarily due to a decrease
in taxable income and a reduction in the valuation allowances on state net
operating loss carryforwards during 2008.
For the
years ended December 31, 2009, 2008, and 2007, the Company had $4.1 million,
$236 thousand, and $19.0 million, respectively, of income tax expense from
discontinued operations.
As
previously stated in the “Critical Accounting Policies” section above, income
tax expense recorded in the consolidated income statement involves
interpretation and application of certain accounting pronouncements and federal
and state tax codes, and is, therefore, considered a critical accounting
policy. See Note 1 and Note
16 of the notes to our audited consolidated financial statements for our
income tax accounting policy and additional income tax information.
Balance
Sheet
Total
assets increased $2.0 billion or 23.2% to $10.9 billion at December 31, 2009
from $8.8 billion at December 31, 2008. Net loans increased by $262.9
million or 4.3%, to $6.3 billion at December 31, 2009 from $6.1 billion at
December 31, 2008. See “Loan Portfolio” section
below for further analysis. Investment securities increased $1.5
billion or 108.1%, to $2.9 billion at December 31, 2009 from $1.4 billion at
December 31, 2008. This increase was a result of deploying cash
acquired in the Corus transaction.
Total
liabilities increased by $1.9 billion or 24.0% to $9.6 billion at December 31,
2009 from $7.8 billion at December 31, 2008. Total deposits increased
by $2.2 billion or 33.7% to $8.7 billion at December 31, 2009 from $6.5 billion
at December 31, 2008. The increase in deposits was primarily due to
our FDIC assisted transactions of Heritage, InBank, Corus and Benchmark during
2009.
Total
stockholders’ equity increased $182.4 million to $1.3 billion at December 31,
2009 compared to $1.1 billion at December 31, 2008. In September
2009, the Company completed a public offering of its common stock by issuing
12,578,125 shares of common stock for aggregate gross proceeds of $201.3
million. The net proceeds to the Company after deducting underwriting
discounts and commissions and offering expenses were approximately $190.9
million. With the proceeds from this offering and the proceeds
received by the Company from issuances pursuant to its Dividend Reinvestment and
Stock Purchase Plan, the Company has received aggregate gross proceeds from
“Qualified Equity Offerings” in excess of the $196.0 million aggregate
liquidation preference amount of its Series A preferred stock issued under the
U.S. Treasury Department’s Capital Purchase Program. As a result, the
number of shares of the Company’s common stock underlying the warrant issued to
the Treasury under the Capital Purchase Program has been reduced by 50%, from
1,012,048 shares to 506,024 shares.
Investment
Securities Available for Sale
The
primary purpose of the investment portfolio is to provide a source of earnings,
for liquidity management purposes, and to control interest rate
risk. In managing the portfolio, we seek safety of principal,
liquidity, diversification and maximized return on funds. See “Liquidity” and “Capital Resources”
in this Item 7 and “Quantitative and Qualitative Disclosures About Market Risk -
Asset Liability Management” under Item
7A.
The
following table sets forth the amortized cost and fair value of our investment
securities available for sale, by type of security as indicated (in
thousands):
|
Year
Ended December 31,
|
||||||||||||
|
2009
|
2008
|
2007
|
||||||||||
|
Amortized
|
Fair
|
Amortized
|
Fair
|
Amortized
|
Fair
|
|||||||
|
Cost
|
Value
|
Cost
|
Value
|
Cost
|
Value
|
|||||||
|
Government
sponsored agencies and enterprises
|
$ 69,120
|
$
70,239
|
$
171,385
|
$ 179,373
|
$ 305,768
|
$
310,538
|
||||||
|
States
and political subdivisions
|
366,845
|
380,234
|
417,608
|
427,999
|
407,973
|
412,302
|
||||||
|
Residential
mortgage-backed securities
|
2,382,495
|
2,377,051
|
682,679
|
690,285
|
435,743
|
438,056
|
||||||
|
Corporate
bonds
|
11,400
|
11,395
|
34,546
|
34,565
|
12,797
|
13,057
|
||||||
|
Equity
securities
|
4,280
|
4,314
|
3,595
|
3,606
|
3,446
|
3,460
|
||||||
|
Debt
securities issued by foreign governments
|
-
|
-
|
301
|
302
|
299
|
301
|
||||||
|
Total
|
$ 2,834,140
|
$ 2,843,233
|
$ 1,310,114
|
$ 1,336,130
|
$ 1,166,026
|
$ 1,177,714
|
||||||
The increase in residential mortgage-backed securities was a result of deploying
cash acquired in the Corus transaction.
Government sponsored agencies and enterprises generally consist of fixed rate
securities with maturities of three months to three years. States and
political subdivisions investment securities consist of investment grade and
local non-rated issues with maturities of one year to fifteen
years. The average expected life of mortgage-backed securities
generally ranges between one and four years. Corporate bonds
typically have terms of five years or less.
Securities of a single issuer which had book values in excess of 10.0% of our
stockholder’s equity at December 31, 2009, other than government sponsored
agencies and corporations, included mortgage-backed securities issued by the
Federal National Mortgage Association (FNMA) and the Federal Home Loan Mortgage
Corporation (FHLMC). FNMA issued mortgage-backed securities had an
aggregate book value and market value of $1.0 billion, at December 31,
2009. FHLMC issued mortgage-backed securities had an aggregate book
value and market value of $1.1 billion at December 31, 2009. We do
not have any meaningful direct or indirect holdings of subprime residential
mortgage loans, home equity lines of credit, or any Fannie Mae or Freddie Mac
preferred or common equity securities in our investment
portfolio. Additionally, more than 99% of our mortgage-backed
securities are agency guaranteed.
The following table sets
forth certain information regarding contractual maturities and the weighted
average yields of our investment securities available for sale at December 31,
2009 (dollars in thousands):
|
Due
after One
|
Due
after Five
|
|||||||||||
|
Due
in One
|
Year
through
|
Years
through
|
Due
after
|
|||||||||
|
Year
or Less
|
Five
Years
|
Ten
Years
|
Ten
Years
|
|||||||||
|
Balance
|
Weighted
Average Yield
|
Balance
|
Weighted
Average Yield
|
Balance
|
Weighted
Average Yield
|
Balance
|
Weighted
Average Yield
|
|||||
|
Government
sponsored agencies and enterprises
|
$ 38,131
|
2.16%
|
$ 14,726
|
3.31%
|
$
15,318
|
2.13%
|
$ 2,064
|
2.23%
|
||||
|
States
and political subdivision (1)
|
9,890
|
5.56%
|
70,243
|
5.51%
|
254,849
|
5.84%
|
45,252
|
6.48%
|
||||
|
Residential
mortgage-backed securities (2)
|
12
|
7.22%
|
8,487
|
4.61%
|
147,162
|
4.16%
|
2,221,390
|
4.90%
|
||||
|
Corporate
bonds
|
5,032
|
0.15%
|
-
|
-
|
-
|
-
|
6,363
|
9.25%
|
||||
|
Equity
securities
|
-
|
-
|
-
|
-
|
-
|
-
|
4,314
|
4.07%
|
||||
|
Total
|
$ 53,065
|
2.71%
|
$ 93,456
|
5.08%
|
$ 417,329
|
5.11%
|
$ 2,279,383
|
5.08%
|
||||
|
(1)
|
Yield
is reflected on a fully tax equivalent basis utilizing a 35% tax
rate.
|
|
(2)
|
These
securities are presented based upon contractual
maturities.
|
The
following table sets forth the composition of our loan portfolio (dollars in
thousands):
|
At
December 31,
|
||||||||||||
|
2009
|
2008
|
2007
|
2006
|
2005
|
||||||||
|
%
of
|
%
of
|
%
of
|
%
of
|
%
of
|
||||||||
|
Amount
|
Total
|
Amount
|
Total
|
Amount
|
Total
|
Amount
|
Total
|
Amount
|
Total
|
|||
|
Commercial
related credits:
|
||||||||||||
|
Commercial
loans
|
$ 1,387,476
|
21%
|
$ 1,522,380
|
24%
|
$ 1,323,455
|
24%
|
$ 1,020,707
|
21%
|
$ 767,392
|
22%
|
||
|
Commercial
loans collateralized by
|
||||||||||||
|
assignment
of lease payments (lease loans)
|
953,452
|
15%
|
649,918
|
10%
|
553,138
|
10%
|
392,063
|
8%
|
271,945
|
8%
|
||
|
Commercial
real estate
|
2,472,520
|
38%
|
2,353,261
|
38%
|
1,974,370
|
36%
|
1,804,103
|
36%
|
1,465,875
|
42%
|
||
|
Construction
real estate
|
594,482
|
9%
|
757,900
|
13%
|
845,158
|
14%
|
851,896
|
17%
|
511,379
|
15%
|
||
|
Total
commercial related credits
|
5,407,930
|
83%
|
5,283,459
|
85%
|
4,696,121
|
84%
|
4,068,769
|
82%
|
3,016,591
|
87%
|
||
|
Other
loans:
|
||||||||||||
|
Residential
real estate
|
291,022
|
4%
|
295,336
|
5%
|
354,874
|
6%
|
360,183
|
7%
|
224,006
|
6%
|
||
|
Indirect
vehicle
|
180,267
|
3%
|
189,227
|
3%
|
146,311
|
3%
|
110,573
|
2%
|
56
|
0%
|
||
|
Home
equity
|
405,439
|
6%
|
401,029
|
6%
|
365,589
|
6%
|
381,612
|
8%
|
222,419
|
6%
|
||
|
Consumer
loans
|
66,293
|
1%
|
59,512
|
1%
|
52,732
|
1%
|
50,357
|
1%
|
17,375
|
1%
|
||
|
Total
other loans
|
943,021
|
14%
|
945,104
|
15%
|
919,506
|
16%
|
902,725
|
18%
|
463,856
|
13%
|
||
|
Gross
loans excluding covered loans
|
6,350,951
|
97%
|
6,228,563
|
100%
|
5,615,627
|
100%
|
4,971,494
|
100%
|
3,480,447
|
100%
|
||
|
Covered
loans (1)
|
173,596
|
3%
|
-
|
0%
|
-
|
0%
|
-
|
0%
|
-
|
0%
|
||
|
Gross
loans (2)
|
6,524,547
|
100%
|
6,228,563
|
100%
|
5,615,627
|
100%
|
4,971,494
|
100%
|
3,480,447
|
100%
|
||
|
Allowance
for loan losses
|
(177,072)
|
(144,001)
|
(65,103)
|
(58,983)
|
(42,290)
|
|||||||
|
Net
loans
|
$ 6,347,475
|
$ 6,084,562
|
$ 5,550,524
|
$ 4,912,511
|
$ 3,438,157
|
|||||||
|
(1)
|
Loans
that MB Financial Bank will share losses with the FDIC are referred to as
“covered loans”, and are net of a $63.4 million
discount.
|
|
(2)
|
Gross
loan balances at December 31, 2009, 2008, 2007, 2006, and 2005 are net of
unearned income, including net deferred loans fees of $4.6 million, $4.5
million, $3.7 million, $3.0 million, and $3.2 million,
respectively.
|
Gross
loans and total commercial related credits increased from 2008 to 2009 by
approximately $296.0 million and $124.5 million, respectively. The
decrease in commercial loans from December 31, 2008 to December 31, 2009, was
primarily due to a decrease in the usage of commercial
lines. The increase in lease loans from December 31, 2008 to
December 31, 2009, resulted from additional staff added during the year and less
competitive pressure in the market as some competitors exited the market or
reduced lending. We believe that our leasing portfolio tends to
perform better than our other lending categories as a result of lessees
typically being larger than our typical middle market customer with more staying
power during economic downturns and the leased equipment being core to their
operations. The decrease in construction real estate loans from
December 31, 2008 to December 31, 2009, was primarily due to fewer new loans
made and an increase in charge-offs during 2009. As of December 31,
2009 and 2008, there were $312.7 million and $448.9 million, respectively, of
residential construction loans in our construction real estate
portfolio. The remainder of construction real estate loans consisted
of commercial construction loans.
Total
loans and total commercial related credits increased from 2007 to 2008 by
approximately $612.9 million and $587.3 million,
respectively. Commercial related credits grew primarily due to
organic growth in both existing customer and new customer loan demand resulting
from the Company’s focus on marketing and new business
development. As of December 31, 2008 and 2007, there were $448.9
million and $571.8 million, respectively, of residential construction loans in
our construction real estate portfolio. The remainder of construction
real estate loans consisted of commercial construction loans.
Loan
Maturities
The
following table sets forth information regarding our non-performing loans and
the scheduled maturity information for the performing loans in our loan
portfolio at December 31, 2009 (in thousands). Loans having no stated
maturity, and overdrafts are reported as due in one year or
less.
|
Due
in One Year
|
Due
after One Year
|
Due
after
|
||||||||||||||
|
Or
Less
|
Through
Five Years
|
Five
Years
|
||||||||||||||
|
Non-Performing
|
Fixed
|
Floating
|
Fixed
|
Floating
|
Fixed
|
Floating
|
||||||||||
|
Loans
(1)
|
Rate
(2)
|
Rate
(2)
|
Rate
(2)
|
Rate
(2)
|
Rate
(2)
|
Rate
(2)
|
Total
|
|||||||||
|
Commercial
loans
|
$
10,362
|
$
59,350
|
$
649,616
|
$
153,729
|
$
443,638
|
$
32,011
|
$
38,770
|
$
1,387,476
|
||||||||
|
Commercial
loans collateralized by
|
||||||||||||||||
|
assignment
of lease payments
|
2,089
|
51,863
|
-
|
860,441
|
7,654
|
31,405
|
-
|
953,452
|
||||||||
|
Commercial
real estate
|
58,660
|
297,581
|
443,314
|
1,046,356
|
400,741
|
139,131
|
86,737
|
2,472,520
|
||||||||
|
Construction
real estate
|
180,991
|
24,623
|
232,047
|
12,595
|
95,643
|
48,583
|
-
|
594,482
|
||||||||
|
Residential
real estate
|
8,935
|
21,252
|
5,998
|
19,641
|
870
|
72,743
|
161,583
|
291,022
|
||||||||
|
Indirect
vehicle
|
2,255
|
1,424
|
-
|
107,680
|
-
|
68,908
|
-
|
180,267
|
||||||||
|
Home
equity
|
6,343
|
473
|
28,115
|
14,455
|
245,631
|
10,774
|
99,648
|
405,439
|
||||||||
|
Consumer
loans
|
1,681
|
6,886
|
17,538
|
10,143
|
3,976
|
371
|
25,698
|
66,293
|
||||||||
|
Covered
loans
|
-
|
19,630
|
65,386
|
32,624
|
7,147
|
8,826
|
39,983
|
173,596
|
||||||||
|
Gross
loans
|
$
271,316
|
$
483,082
|
$
1,442,014
|
$
2,257,664
|
$
1,205,300
|
$
412,752
|
$
452,419
|
$
6,524,547
|
||||||||
|
(1)
|
Excludes
purchased credit-impaired loans that were acquired as part of the
Heritage, InBank, Corus, and Benchmark transactions. Purchased
credit-impaired loans have evidence of deterioration in credit quality
prior to acquisition. Fair value of these loans as of
acquisition includes estimates of credit losses. These loans
are accounted for on a pool basis, and the pools are considered to be
performing. See Note 6 to our Consolidated
Financial Statements for further information regarding purchased
credit-impaired loans.
|
|
(2)
|
Excludes
non-performing loans.
|
The
following table sets forth the amounts of non-performing loans and
non-performing assets at the dates indicated (dollars in
thousands):
|
At
December 31,
|
||||||||||
|
2009
|
2008
|
2007
|
2006
|
2005
|
||||||
|
Non-performing
loans(1):
|
||||||||||
|
Non-accruing
loans
|
$ 270,839
|
$ 145,936
|
$ 24,459
|
$ 21,164
|
$ 19,850
|
|||||
|
Loans
90 days or more past due, still accruing interest
|
477
|
-
|
-
|
304
|
321
|
|||||
|
Total
non-performing loans
|
271,316
|
145,936
|
24,459
|
21,468
|
20,171
|
|||||
|
Other
real estate owned(2)
|
36,711
|
4,366
|
1,120
|
2,844
|
354
|
|||||
|
Repossessed
vehicles
|
333
|
356
|
179
|
192
|
-
|
|||||
|
Total
non-performing assets
|
$ 308,360
|
$ 150,658
|
$ 25,758
|
$ 24,504
|
$ 20,525
|
|||||
|
Total
non-performing loans to total loans
|
4.16%
|
2.34%
|
0.44%
|
0.43%
|
0.58%
|
|||||
|
Total
non-performing assets to total assets
|
2.84%
|
1.71%
|
0.33%
|
0.31%
|
0.36%
|
|||||
|
Allowance
for loan losses to non-performing loans(1)
|
65.26%
|
98.67%
|
266.17%
|
274.75%
|
209.66%
|
|||||
|
(1)
|
This
table excludes purchased credit-impaired loans that were acquired as part
of the Heritage, InBank, Corus, and Benchmark
transactions. Purchased credit-impaired loans have evidence of
deterioration in credit quality prior to acquisition. Fair
value of these loans as of acquisition includes estimates of credit
losses. These loans are accounted for on a pool basis, and the
pools are considered to be performing. See Note 6 to our Consolidated Financial Statements for
further information regarding purchased credit-impaired
loans. This table also excludes loans held for
sale.
|
|
(2)
|
This
table excludes other real estate owned that is related to the Heritage,
InBank, and Benchmark FDIC-assisted transactions. Other real
estate owned related to the Heritage and Benchmark transactions, which
totaled $15.3 million at December 31, 2009, is subject to the loss sharing
agreements with the FDIC. Other real estate owned related to
InBank is performing as expected and is therefore excluded from
non-performing assets. See Note 2 of the
notes to our consolidated financial statements for further
information.
|
Including
$69.4 million of partial charge-offs taken on non-performing loans, our
allowance for loan losses to non-performing loans was 72.34% at December 31,
2009. Including $17.4 million of partial charge-offs taken on
non-performing loans, our allowance for loan losses to non-performing loans was
98.82% at December 31, 2008.
The
following table presents a summary of other real estate owned (“OREO”) for the
year ended December 31, 2009 (in thousands):
|
Amount
|
|
|
Balance
at December 31, 2008
|
$
4,366
|
|
Transfers
in at fair value less estimated costs to sell
|
46,992
|
|
Fair
value adjustments
|
(535)
|
|
Net
gains on sales of OREO
|
15
|
|
Cash
received upon disposition
|
(14,127)
|
|
Balance
at December 31, 2009
|
$
36,711
|
The
following table presents data related to non-performing loans, excluding loans
held for sale, by dollar amount and category at December 31, 2009 (dollar
amounts in thousands):
|
Commercial
and Lease Loans
|
Construction
Real Estate Loans
|
Commercial
Real Estate Loans
|
Consumer
Loans
|
Total
Loans
|
||||
|
Number
of Borrowers
|
Amount
|
Number
of Borrowers
|
Amount
|
Number
of Borrowers
|
Amount
|
Amount
|
Amount
|
|
|
$10.0
million or more
|
-
|
$ -
|
5
|
$
76,243
|
1
|
$
10,101
|
$ -
|
$ 86,344
|
|
$5.0
million to $9.9 million
|
-
|
-
|
8
|
52,496
|
1
|
5,647
|
-
|
58,143
|
|
$1.5
million to $4.9 million
|
2
|
3,518
|
11
|
31,346
|
6
|
10,493
|
1,672
|
47,029
|
|
Under
$1.5 million
|
33
|
8,933
|
32
|
20,906
|
78
|
32,419
|
17,542
|
79,800
|
|
35
|
$
12,451
|
56
|
$
180,991
|
86
|
$ 58,660
|
$ 19,214
|
$ 271,316
|
|
|
Percentage
of individual loan category
|
0.53%
|
30.45%
|
2.37%
|
2.04%
|
4.16%
|
|||
The
following table presents data related to non-performing loans, excluding loans
held for sale, by dollar amount and category at December 31, 2008 (dollar
amounts in thousands):
|
Commercial
and Lease
Loans
|
Construction
Real Estate Loans
|
Commercial
Real Estate
Loans
|
Consumer
Loans
|
Total
Loans
|
||||
|
Number
of Borrowers
|
Amount
|
Number
of Borrowers
|
Amount
|
Number
of Borrowers
|
Amount
|
Amount
|
Amount
|
|
|
$5.0
million or more
|
1
|
$
10,851
|
6
|
$
50,959
|
-
|
$ -
|
$
-
|
$
61,810
|
|
$3.0
million to $4.9 million
|
-
|
-
|
7
|
23,647
|
3
|
10,572
|
-
|
34,219
|
|
$1.5
million to $2.9 million
|
-
|
-
|
1
|
2,118
|
4
|
7,345
|
-
|
9,463
|
|
Under
$1.5 million
|
16
|
9,167
|
16
|
9,323
|
33
|
14,141
|
7,813
|
40,444
|
|
17
|
$
20,018
|
30
|
$ 86,047
|
40
|
$
32,058
|
$
7,813
|
$
145,936
|
|
|
Percentage
of individual loan category
|
0.92%
|
11.35%
|
1.36%
|
0.83%
|
2.34%
|
|||
The
aggregate principal amount of non-performing loans was $271.3 million as of
December 31, 2009, compared to $145.9 million as of December 31,
2008. A majority of the increase was attributable to non-performing
construction real estate and to a lesser extent commercial real estate
loans. Non-performing construction real estate loans increased by
$94.9 million, as a result of the continued weak residential construction
market. Non-performing commercial real estate loans increased $26.6
million, primarily due to the economic slowdown during 2009.
The
underlying value of collateral on impaired loans continued to deteriorate during
the year ended December 31, 2009. Overall, the business environment
has been adverse for many households and businesses in the United States,
including those in the Chicago metropolitan area. The business
environment began to significantly deteriorate in the third quarter of 2008 and
continued deteriorating throughout 2009, resulting in significant job losses and
home foreclosures. In October 2009, the United States’ unemployment
rate elevated above 10% for the first time in over 25 years. Single
family homes, condominiums, retail property, manufacturing property, and vacant
land all continued to experience a significant decrease in demand due to the
worsening economic environment during the past two years. As a
result, significant declines in the values of single family homes and other
properties occurred.
Of the
$145.9 million of non-performing loans as of December 31, 2008, only $26.4
million still remained non-performing at December 31,
2009.
Non-performing
Assets
Non-performing
loans include loans accounted for on a non-accrual basis and accruing loans
contractually past due 90 days or more as to interest or
principal. Management reviews the loan portfolio for problem loans on
an ongoing basis. During the ordinary course of business, management
becomes aware of borrowers that may not be able to meet the contractual
requirements of loan agreements. These loans are placed under close
supervision with consideration given to placing the loan on non-accrual status,
increasing the allowance for loan losses and (if appropriate) partial or full
charge-off. After a loan is placed on non-accrual status, any
interest previously accrued but not yet collected is reversed against current
income. If interest payments are received on non-accrual loans, these
payments will be applied to principal and not taken into
income. Loans will not be placed back on accrual status unless back
interest and principal payments are made. With respect to the loans
that were on non-accrual status as of December 31, 2009 and 2008, the gross
interest income that would have been recorded on such loans during the years
ended December 31, 2009 and 2008 had such loans been current in accordance with
their original terms was approximately $12.5 million and $4.6 million,
respectively. The amount of interest income on these loans that was
included in net income (loss) for the years ended December 31, 2009 and 2008 was
$185 thousand and $74 thousand, respectively. Our general policy is
to place loans 90 days past due on non-accrual status.
Non-performing
loans exclude purchased credit-impaired loans that were acquired as part of the
Heritage, InBank, Corus, and Benchmark transactions. Deterioration in
credit quality occurred prior to acquisition. Fair value of these
loans as of acquisition includes estimates of credit losses. These
loans are accounted for on a pool basis, and the pools are considered to be
performing. See Note 6 to our Consolidated
Financial Statements for further information regarding purchased credit-impaired
loans.
Non-performing assets consists of
non-performing loans as well as other repossessed assets and other real estate
owned. Other real estate owned represents properties acquired through
foreclosure or other proceedings and is recorded at the lower of cost or fair
value less the estimated cost of disposal. Other real estate owned is
evaluated regularly to ensure that the recorded amount is supported by its
current fair value. Valuation allowances to reduce the carrying
amount to fair value less estimated costs of disposal are recorded as
necessary. Revenues and expenses from the operations of other real
estate owned and changes in the valuation are included in other income and other
expenses on the income statement. Other repossessed assets primarily
consist of repossessed vehicles. Losses on repossessed vehicles are
charged-off to the allowance when title is taken and the vehicle is
valued. Once the Bank obtains title, repossessed vehicles are not
included in loans, but are classified as “other assets” on the consolidated
balance sheets. The typical holding period for resale of repossessed
automobiles is less than 90 days unless significant repairs to the vehicle are
needed which occasionally results in a longer holding period. The
typical holding period for motorcycles can be more than 90 days, as the average
motorcycle re-sale period is longer than the average automobile re-sale
period. The longer average period for motorcycles is a result of
cyclical trends in the motorcycle market.
Other
real estate owned that is related to the Heritage, InBank, and Benchmark
transactions, is excluded from non-performing assets. Other real
estate owned related to the Heritage and Benchmark transactions, which totaled
$15.3 million at December 31, 2009, is subject to the loss sharing agreements
with the FIDC. Other real estate owned related to InBank is
performing as expected and is therefore excluded from non-performing
assets. See Note 2 of the notes to our
consolidated financial statements for further information.
Management
believes the allowance for loan losses accounting policy is critical to the
portrayal and understanding of our financial condition and results of
operations. Selection and application of this “critical accounting
policy” involves judgments, estimates, and uncertainties that are subject to
change. In the event that different assumptions or conditions were to
prevail, and depending upon the severity of such changes, materially different
financial condition or results of operations is a reasonable
possibility.
We
maintain our allowance for loan losses at a level that management believes is
appropriate to absorb probable losses on existing loans based on an evaluation
of the collectability of loans, underlying collateral and prior loss
experience.
Our
allowance for loan losses is comprised of three elements: a general loss
reserve; a specific reserve for impaired loans; and a reserve for
smaller-balance homogenous loans. Each element is discussed
below.
General Loss
Reserve. We maintain a general loan loss reserve for the four
categories of commercial-related loans in our portfolio - commercial loans,
commercial loans collateralized by the assignment of lease payments (lease
loans), commercial real estate loans and construction real estate
loans. We use a loan loss reserve model that incorporates the
migration of loan risk rating and historical default data over a multi-year
period. Under our loan risk rating system, each loan, with the
exception of those included in large groups of smaller-balance homogeneous
loans, is risk rated between one and nine by the originating loan officer,
Senior Credit Management, Loan Review or any loan committee. Loans
rated one represent those loans least likely to default and a loan rated nine
represents a loss. The probability of loans defaulting for each risk
rating, sometimes referred to as default factors, are estimated based on the
frequency with which loans migrate from one risk rating to another and to
default status over time. Estimated loan default factors are
multiplied by individual loan balances in each risk-rating category and again
multiplied by an historical loss given default estimate for each loan type
(which incorporates estimated recoveries) to determine an appropriate level of
allowance by loan type. This approach is applied to the commercial,
lease, commercial real estate, and construction real estate components of the
portfolio.
The
general allowance for loan losses also includes estimated losses resulting from
macroeconomic factors and imprecision of our loan loss
model. Macroeconomic factors adjust the allowance for loan losses
upward or downward based on the current point in the economic cycle and are
applied to the loan loss model through a separate allowance element for the
commercial, commercial real estate, construction real estate and lease loan
components. To determine our macroeconomic factors, we use specific
economic data that has a statistical correlation to loan losses. We
annually review this data to determine that such a correlation continues to
exist. Additionally, as the factors are only updated annually, we
periodically review the macroeconomic factors in order to conclude they are
adequate based on current economic conditions.
Model
imprecision accounts for the possibility that our limited loan loss history may
result in inaccurate estimated default and loss given default
factors. Factors for imprecision modify estimated default factors
calculated by our migration analysis and are based on the standard deviation of
each estimated default factor.
At each
quarter end, potential problem loans are reviewed individually, with adjustments
made to the general calculated reserve for each loan as deemed
necessary. Specific adjustments are made depending on expected cash
flows and/or the value of the collateral securing the loan. See
discussion in “Specific Reserve” section below.
The
general loss reserve was $118.5 million as of December 31, 2009, and $87.0
million as of December 31, 2008. The increase in the general loss
reserve was primarily due to loans migrating from lower risk ratings to higher
risk ratings during the year ended December 31, 2009. Additionally,
our loss given default factors increased in 2009. Reserves on
impaired loans are included in the “Specific Reserve” section
below. See additional discussion in “Potential Problem Loans”
below.
Specific
Reserves. Our allowance for loan losses also includes specific
reserves on impaired loans. A loan is considered to be impaired when
management believes, after considering collection efforts and other factors, the
borrower’s financial condition is such that the collection of all contractual
principal and interest payments due is doubtful.
At each
quarter end, impaired loans are reviewed individually, with adjustments made to
the general calculated reserve for each loan as deemed
necessary. Specific adjustments are made depending on expected cash
flows and/or the value of the collateral securing the loan. For a
majority of impaired loans, the Company obtains a current external
appraisal. Other valuation techniques are used as well, including
internal valuations, comparable property analysis and contractual sales
information. For substantially all impaired loans with an appraisal
more than 6 months old, the Company often further discounts market prices by
15%-30% and in some cases, up to an additional 50%. This discount is
based on our evaluation of related market conditions and is in addition to a
reduction in value for potential sales costs and discounting that has been
incorporated in the independent appraisal.
The total
specific reserve component of the allowance was $46.0 million as of December 31,
2009 and $52.1 million as of December 31, 2008. The decrease in
specific reserve is primarily due to partial charge-offs of approximately $69.4
taken on impaired loans during the year ended December 31, 2009.
Smaller Balance Homogenous
Loans. Pools of homogeneous loans with similar risk and loss
characteristics are also assessed for probable losses. These loan
pools include consumer, residential real estate, home equity and indirect
vehicle loans. Migration probabilities obtained from past due roll
rate analyses are applied to current balances to forecast charge-offs over a one
year time horizon. For improved accuracy, indirect vehicle loan
losses are estimated using a combination of our historical loss statistics as
well as industry loss statistics. The reserves for smaller balance
homogenous loans totaled $12.6 million at December 31, 2009, and $4.9 million at
December 31, 2008. The increase was primarily due to worsening
macroeconomic factors, declines in the values of collateral and a deteriorating
business environment during 2009.
We
consistently apply our methodology for determining the appropriateness of the
allowance for loan losses, but may adjust our methodologies and assumptions
based on historical information related to charge-offs and management's
evaluation of the loan portfolio. In this regard, we periodically
review the following in order to validate our allowance for loan losses:
historical net charge-offs as they relate to prior allowance for loan loss,
comparison of historical migration years to the current migration year, and any
significant changes in loan concentrations. In reviewing this data,
we adjust qualitative factors within our allowance methodology to appropriately
reflect any changes warranted by the validation process.
The following table presents an analysis of the allowance for loan losses for
the years presented (dollars in thousands):
|
Year
Ended December 31,
|
||||||||||
|
2009
|
2008
|
2007
|
2006
|
2005
|
||||||
|
Balance
at beginning of year
|
$
144,001
|
$
65,103
|
$
58,983
|
$
42,290
|
$
42,255
|
|||||
|
Additions
from acquisitions
|
-
|
-
|
-
|
16,425
|
-
|
|||||
|
Provision
for loan losses
|
231,800
|
125,721
|
19,313
|
10,100
|
8,150
|
|||||
|
Charge-offs:
|
||||||||||
|
Commercial
loans
|
(46,113)
|
(13,653)
|
(7,072)
|
(10,160)
|
(4,007)
|
|||||
|
Commercial
loans collateralized by assignment of lease payments
|
(5,407)
|
(1,258)
|
(515)
|
(246)
|
(826)
|
|||||
|
Commercial
real estate
|
(38,842)
|
(14,872)
|
(3,471)
|
(1,671)
|
(1,052)
|
|||||
|
Residential
real estate
|
(1,476)
|
(550)
|
(1,075)
|
(434)
|
(118)
|
|||||
|
Construction
real estate
|
(103,789)
|
(14,940)
|
(2,294)
|
-
|
(3,824)
|
|||||
|
Indirect
vehicles
|
(4,085)
|
(2,109)
|
(1,193)
|
(307)
|
-
|
|||||
|
Home
equity
|
(3,443)
|
(1,801)
|
(194)
|
(427)
|
(149)
|
|||||
|
Consumer
loans
|
(1,124)
|
(642)
|
(492)
|
(555)
|
(199)
|
|||||
|
Total
charge-offs
|
(204,279)
|
(49,825)
|
(16,306)
|
(13,800)
|
(10,175)
|
|||||
|
Recoveries:
|
||||||||||
|
Commercial
loans
|
1,491
|
891
|
1,265
|
2,402
|
954
|
|||||
|
Commercial
loans collateralized by assignment of lease payments
|
-
|
67
|
979
|
40
|
329
|
|||||
|
Commercial
real estate
|
40
|
266
|
37
|
378
|
51
|
|||||
|
Residential
real estate
|
44
|
29
|
20
|
26
|
97
|
|||||
|
Construction
real estate
|
2,957
|
951
|
38
|
490
|
-
|
|||||
|
Indirect
vehicles
|
757
|
625
|
389
|
4
|
-
|
|||||
|
Home
equity
|
53
|
132
|
344
|
481
|
495
|
|||||
|
Consumer
loans
|
208
|
41
|
41
|
147
|
134
|
|||||
|
Total
recoveries
|
5,550
|
3,002
|
3,113
|
3,968
|
2,060
|
|||||
|
Net
charge-offs
|
(198,729)
|
(46,823)
|
(13,193)
|
(9,832)
|
(8,115)
|
|||||
|
Balance
at December 31,
|
$ 177,072
|
$ 144,001
|
$ 65,103
|
$ 58,983
|
$
42,290
|
|||||
|
Total
loans at December 31,
|
$ 6,524,547
|
$ 6,228,563
|
$ 5,615,627
|
$ 4,971,494
|
$
3,480,447
|
|||||
|
Ratio
of allowance to total loans
|
2.71%
|
2.31%
|
1.16%
|
1.19%
|
1.22%
|
|||||
|
Ratio
of net charge-offs to average loans
|
3.09%
|
0.79%
|
0.25%
|
0.24%
|
0.24%
|
|||||
Provision
for loan losses increased by $106.1 million to $231.8 million for the year ended
December 31, 2009 from $125.7 million in the same period of 2008. The
increase in our provision for loan losses was primarily due to increases in
non-performing loans and net charge-offs, and the migration of performing loans
from better risk ratings to worse risk ratings and higher loss given default
factors during 2009. The migration of performing loans to worse risk
ratings was primarily due to worsening macroeconomic factors, declines in the
values of collateral and a deteriorating business environment during
2009. Also factoring into our provision was our loan growth over the
past twelve months.
Additionally, the underlying value of
collateral on impaired loans continued to deteriorate during the year ended
December 31, 2009. Overall, the business environment has been adverse
for many households and businesses in the United States, including those in the
Chicago metropolitan area. The business environment began to
significantly deteriorate beginning in the third quarter of 2008 and continued
deteriorating throughout 2009, resulting in significant job losses and home
foreclosures. In October 2009, the United States’ unemployment rate
elevated above 10% for the first time in over 25 years. Single family
homes, condominiums, retail property, manufacturing property, and vacant land
all continued to experience a significant decrease in demand due to the
worsening economic environment during the past two years. As a
result, significant declines in the values of single family homes and other
properties occurred and required higher reserves on impaired loans, potential
problem loans and increased reserves based on the macroeconomic
environment.
The
following table sets forth the allocation of the allowance for loan losses for
the years presented and the percentage of loans in each category to total
loans. The purpose of this allocation is only for internal analysis
of the adequacy of the allowance and is not an indication of expected or
anticipated losses (dollars in thousands):
|
At
December 31,
|
|||||||||||||||
|
2009
|
2008
|
2007
|
2006
|
2005
|
|||||||||||
|
%
of Total
|
%
of Total
|
%
of Total
|
%
of Total
|
%
of Total
|
|||||||||||
|
Amount
|
Loans
|
Amount
|
Loans
|
Amount
|
Loans
|
Amount
|
Loans
|
Amount
|
Loans
|
||||||
|
Commercial
loans
|
$ 39,226
|
21%
|
$
40,217
|
24%
|
$ 15,627
|
24%
|
$ 20,918
|
21%
|
$ 14,918
|
22%
|
|||||
|
Commercial
loans collateralized by
|
|||||||||||||||
|
assignment
of lease payments (lease loans)
|
8,726
|
15%
|
10,245
|
10%
|
7,854
|
10%
|
8,897
|
8%
|
6,868
|
8%
|
|||||
|
Commercial
real estate
|
56,710
|
38%
|
31,241
|
38%
|
15,653
|
36%
|
10,458
|
36%
|
11,687
|
42%
|
|||||
|
Residential
real estate
|
2,934
|
4%
|
1,623
|
5%
|
1,430
|
6%
|
1,430
|
7%
|
776
|
6%
|
|||||
|
Construction
real estate
|
59,760
|
9%
|
57,443
|
13%
|
23,039
|
14%
|
15,780
|
17%
|
7,491
|
15%
|
|||||
|
Consumer
loans and other
|
9,716
|
13%
|
3,232
|
10%
|
1,500
|
10%
|
1,621
|
11%
|
550
|
7%
|
|||||
|
Total
|
$ 177,072
|
100%
|
$ 144,001
|
100%
|
$ 65,103
|
100%
|
$ 58,983
|
100%
|
$ 42,290
|
100%
|
|||||
Additions to the allowance for loan losses, which are charged to earnings
through the provision for loan losses, are determined based on a variety of
factors, including specific reserves, current loan risk ratings, delinquent
loans, historical loss experience and economic conditions in our market
area. In addition, federal regulatory authorities, as part of the
examination process, periodically review our allowance for loan
losses. The regulators may require us to record adjustments to the
allowance level based upon their assessment of the information available to them
at the time of examination. Although management believes the
allowance for loan losses is sufficient to cover probable losses inherent in the
loan portfolio, there can be no assurance that the allowance will prove
sufficient to cover actual loan losses. During 2009, the Company
recorded partial charge-offs of approximately $56.6 million related to its
construction real estate portfolio, reducing the amount of allowance for loan
losses allocated to the construction real estate portfolio. In 2009,
the allocation of the allowance for loan losses allocated to commercial real
estate loans increased due to the migration of performing loans from lower risk
rating to higher risk rating during 2009, worsening macroeconomic factors, and
the increases in non-performing loans and potential problem loans during the
year ended December 31, 2009. See discussion below in “Potential
Problem Loans”.
Potential
Problem Loans
We
utilize an internal asset classification system as a means of reporting problem
and potential problem assets. At our scheduled meetings of the board
of directors of MB Financial Bank, a watch list is presented, showing
significant loan relationships listed as “Special Mention,” “Substandard,” and
“Doubtful.” Under our risk rating system noted above, Special
Mention, Substandard, and Doubtful loan classifications correspond to risk
ratings six, seven, and eight, respectively. Substandard assets
include those characterized by the distinct possibility that we will sustain
some loss if the deficiencies are not corrected. Assets classified as
Doubtful, or risk rated eight have all the weaknesses inherent in those
classified Substandard with the added characteristic that the weaknesses present
make collection or liquidation in full, on the basis of currently existing
facts, conditions and values, highly questionable and
improbable. Assets classified as Loss, or risk rated nine are those
considered uncollectible and viewed as valueless assets and have been
charged-off. Assets that do not currently expose us to sufficient
risk to warrant classification in one of the aforementioned categories, but
possess weaknesses that deserve management’s close attention are deemed to be
Special Mention, or risk rated six.
Our
determination as to the classification of our assets and the amount of our
valuation allowances is subject to review by the Office of the Comptroller of
the Currency, MB Financial Bank’s primary regulator, which can order the
establishment of additional general or specific loss
allowances. There can be no assurance that regulators, in reviewing
our loan portfolio, will not request us to materially adjust our allowance for
loan losses. The Office of the Comptroller of the Currency, in
conjunction with the other federal banking agencies, has adopted an interagency
policy statement on the allowance for loan losses. The policy
statement provides guidance for financial institutions on both the
responsibilities of management for the assessment and establishment of adequate
allowances and guidance for banking agency examiners to use in determining the
adequacy of general valuation guidelines. Generally, the policy
statement recommends that (1) institutions have effective systems and controls
to identify, monitor and address asset quality problems; (2) management has
analyzed all significant factors that affect the collectability of the portfolio
in a reasonable manner; and (3) management has established acceptable allowance
evaluation processes that meet the objectives set forth in the policy
statement. Management believes it has established an adequate
allowance for probable loan losses. We analyze our process regularly,
with modifications made if needed, and report those results four times per year
at meetings of our Audit Committee. However, there can be no
assurance that regulators, in reviewing our loan portfolio, will not request us
to materially adjust our allowance for loan losses at the time of their
examination.
Although
management believes that adequate specific and general loan loss allowances have
been established, actual losses are dependent upon future events and, as such,
further additions to the level of specific and general loan loss allowances may
become necessary.
We define
potential problem loans as performing loans rated substandard, that do not meet
the definition of a non-performing loan (See “Asset Quality”
section above for non-performing loans). We do not necessarily expect
to realize losses on potential problem loans, but we recognize potential problem
loans carry a higher probability of default and require additional attention by
management. The aggregate principal amounts of potential problem
loans were $233.4 million, or 3.58% of total loans as of December 31, 2009, and
approximately $100.9 million, or 1.62% of total loans as of December 31,
2008. The majority of the increase in potential problem loans was due
to construction real estate loans. The increase in potential problem
loans was primarily due to the continued deterioration in underlying collateral
values and the overall economic environment during the year ended December 31,
2009. See discussion in “Asset Quality” for
additional discussion of the impacts of the economic environment on the loan
portfolio.
Sources
of Funds
General. Deposits,
short-term and long-term borrowings, including junior subordinated notes issued
to capital trusts and subordinated debt, loan and investment security repayments
and prepayments, proceeds from the sale of securities, and cash flows generated
from operations are the primary sources of our funds for lending, investing,
leasing and other general purposes. Loan repayments are a relatively
predictable source of funds except during periods of significant interest rate
declines, while deposit flows tend to fluctuate with prevailing interests rates,
money markets conditions, general economic conditions and
competition.
Deposits. We offer
a variety of deposit accounts with a range of interest rates and
terms. Our core deposits consist of checking accounts, NOW accounts,
money market accounts, savings accounts and non-public certificates of
deposit. These deposits, along with public fund deposits, brokered
deposits, and short-term and long-term borrowings are used to support our asset
base. Our deposits are obtained predominantly from the geographic
trade areas surrounding each of our office locations. We rely
primarily on customer service and long-standing relationships with customers to
attract and retain deposits; however, market interest rates and rates offered by
competing financial institutions significantly affect our ability to attract and
retain deposits. We also use brokered deposits as an alternative
funding source which allows us flexibility in managing our overall interest
expense. Total deposits increased by $2.2 billion, from December 31,
2008 to December 31, 2009, primarily due to our FDIC assisted transactions
during 2009 and organic growth.
The
following table sets forth the maturities of certificates of deposit and other
time deposits $100,000 and over at December 31, 2009 (in
thousands):
|
Certificates
of deposit $100,000 and over:
|
||
|
Maturing
within three months
|
$ 505,996
|
|
|
After
three but within six months
|
420,181
|
|
|
After
six but within twelve months
|
328,584
|
|
|
After
twelve months
|
511,587
|
|
|
Total
certificates of deposit $100,000 and over (1)
|
$ 1,766,348
|
|
|
Other
time deposits $100,000 and over (2):
|
||
|
Maturing
within three months
|
$ 30,771
|
|
|
After
three but within six months
|
23,728
|
|
|
After
six but within twelve months
|
23,334
|
|
|
After
twelve months
|
41,279
|
|
|
Total
other time deposits $100,000 and over
|
$ 119,112
|
|
(1)
|
Includes
brokered deposits of $528.3
million.
|
|
(2)
|
Consists
of time deposits held in individual retirement accounts (IRAs) and time
certificates that the customer has the option to increase the principal
balance and maintain the original interest
rate.
|
The
following table sets forth the composition of our deposits at the dates
indicated (dollars in thousands):
|
At
December 31,
|
||||||
|
2009
|
2008
|
|||||
|
Amount
|
Percent
|
Amount
|
Percent
|
|||
|
Demand
deposits, noninterest bearing
|
$
1,552,185
|
17.88%
|
$
960,117
|
14.78%
|
||
|
NOW
and money market accounts
|
2,775,468
|
31.96%
|
1,465,436
|
22.56%
|
||
|
Savings
deposits
|
583,783
|
6.72%
|
367,684
|
5.66%
|
||
|
Time
certificates, $100,000 or more
|
1,885,460
|
21.72%
|
2,091,067
|
32.19%
|
||
|
Other
time certificates
|
1,886,380
|
21.72%
|
1,611,267
|
24.81%
|
||
|
Total
|
$
8,683,276
|
100.00%
|
$
6,495,571
|
100.00%
|
||
Borrowings. Short-term
borrowings decreased by $164.7 million to $323.9 million at December 31, 2009
compared to $488.6 million at December 31, 2008. The decrease in
short-term borrowings was primarily due to a decrease in Federal Reserve term
auction funds. We have access to a variety of borrowing sources and
use short-term and long-term borrowings to support our asset
base. Short-term borrowings from time to time include federal funds
purchased, Federal Reserve term auction funds, securities sold under agreements
to repurchase and Federal Home Loan Bank advances. We also offer
customers a deposit account that sweeps balances in excess of an agreed upon
target amount into overnight repurchase agreements.
The
following table sets forth certain information regarding our short-term
borrowings at the dates and for the periods indicated (dollars in
thousands):
|
At
or For the Year Ended December 31,
|
||||||
|
2009
|
2008
|
2007
|
||||
|
Federal
funds purchased:
|
||||||
|
Average
balance outstanding
|
$
499
|
$
44,413
|
$
90,928
|
|||
|
Maximum
outstanding at any month-end during the period
|
51,000
|
175,000
|
199,100
|
|||
|
Balance
outstanding at end of period
|
-
|
5,000
|
170,000
|
|||
|
Weighted
average interest rate during the period
|
0.30%
|
3.09%
|
5.16%
|
|||
|
Weighted
average interest rate at end of the period
|
-
|
0.68%
|
3.86%
|
|||
|
Federal
Reserve term auction funds:
|
||||||
|
Average
balance outstanding
|
$ 84,384
|
$ 91,803
|
$
-
|
|||
|
Maximum
outstanding at any month-end during the period
|
100,000
|
250,000
|
-
|
|||
|
Balance
outstanding at end of period
|
-
|
100,000
|
-
|
|||
|
Weighted
average interest rate during the period
|
0.28%
|
2.59%
|
-
|
|||
|
Weighted
average interest rate at end of the period
|
-
|
0.42%
|
-
|
|||
|
Securities
sold under agreements to repurchase:
|
||||||
|
Average
balance outstanding
|
$ 248,128
|
$ 291,013
|
$ 323,132
|
|||
|
Maximum
outstanding at any month-end during the period
|
305,632
|
366,271
|
409,848
|
|||
|
Balance
outstanding at end of period (1)
|
223,917
|
282,832
|
367,702
|
|||
|
Weighted
average interest rate during the period
|
0.46%
|
1.49%
|
3.66%
|
|||
|
Weighted
average interest rate at end of the period
|
0.50%
|
0.48%
|
3.02%
|
|||
|
Federal
Home Loan Bank advances:
|
||||||
|
Average
balance outstanding
|
$ 116,538
|
$ 252,452
|
$ 397,065
|
|||
|
Maximum
outstanding at any month-end during the period
|
200,785
|
344,011
|
440,019
|
|||
|
Balance
outstanding at end of period
|
100,000
|
100,787
|
440,019
|
|||
|
Weighted
average interest rate during the period
|
3.25%
|
3.75%
|
5.23%
|
|||
|
Weighted
average interest rate at end of the period
|
3.35%
|
2.46%
|
5.05%
|
|||
|
Correspondent
bank lines of credit:
|
||||||
|
Average
balance outstanding
|
$
-
|
$
1,393
|
$ 1,555
|
|||
|
Maximum
outstanding at any month-end during the period
|
-
|
10,000
|
10,000
|
|||
|
Balance
outstanding at end of period
|
-
|
-
|
-
|
|||
|
Weighted
average interest rate during the period
|
-
|
3.23%
|
5.72%
|
|||
|
Weighted
average interest rate at end of the period
|
-
|
-
|
-
|
|||
|
(1)
|
Balance
includes customer repurchase agreements totaling $223.9 million, $282.8
million and $367.7 million at December 31, 2009, 2008 and 2007,
respectively.
|
Long-term
borrowings include notes payable to other banks to support a portfolio of
equipment that we own and lease to other companies, Federal Home Loan Bank
advances, structured repurchase agreements, and subordinated debt. As
of December 31, 2009 and December 31, 2008, our long-term borrowings were $331.3
million and $471.5 million, respectively.
Junior
subordinated notes issued to capital trusts include debentures sold to Coal City
Capital Trust I, FOBB Capital Trust I, FOBB Capital Trust III, MB Financial
Capital Trust II, MB Financial Capital Trust III, MB Financial Capital Trust IV,
MB Financial Capital Trust V, and MB Financial Capital Trust VI in connection
with the issuance of their preferred securities in 1998, 2000, 2003, 2005, 2006,
2006, 2007, and 2007, respectively. As of December 31, 2009 and
December 31, 2008, our junior subordinated notes issued to capital trusts were
$158.7 million and $158.8 million, respectively. See Notes 1 and 13 to the consolidated
financial statements for further analysis.
Bank Liquidity. Liquidity
management is monitored by an Asset/Liability Management Committee, consisting
of members of management, which reviews historical funding requirements, current
liquidity position, sources and stability of funding, marketability of assets,
options for attracting additional funds, and anticipated future funding needs,
including the level of unfunded commitments.
Our
primary sources of funds are retail and commercial deposits, short-term and
long-term borrowings, public funds and funds generated from
operations. Funds from operations include principal and interest
payments received on loans and securities. While maturities and
scheduled amortization of loans and securities provide an indication of the
timing of the receipt of funds, changes in interest rates, economic conditions
and competition strongly influence mortgage prepayment rates and deposit flows,
reducing the predictability of the timing on sources of
funds.
Our
subsidiary bank has no required regulatory liquidity ratios to maintain;
however, it adheres to an internal policy which dictates a ratio of loans to
deposits. This policy provides that the bank may not have a ratio of
loans to deposits (including customer repurchase agreements) in excess of
105%. At December 31, 2009, we were in compliance with the foregoing
policy.
At
December 31, 2009, our subsidiary bank had outstanding letters of credit, loan
origination commitments and unused commercial and retail lines of credit of
approximately $1.6 billion. Our bank anticipates that it will have
sufficient funds available to meet current origination and other lending
commitments. Certificates of deposit that are scheduled to mature
within one year totaled $3.1 billion at December 31, 2009 including brokered
deposits.
In the
event that additional short-term liquidity is needed, our bank has established
relationships with several large regional banks to provide short-term borrowings
in the form of federal funds purchases. While, at December 31, 2009,
there were no firm lending commitments in place, management believes that MB
Financial Bank could borrow approximately $240.0 million for a short time from
these banks on a collective basis. MB Financial Bank can participate
in the Federal Reserve’s Term Auction Facility to provide additional short-term
liquidity, and as of December 31, 2009, the Company could borrow
approximately $309.0 million. Additionally, MB Financial Bank is a
member of Federal Home Loan Bank of Chicago (FHLB). As of December
31, 2009, the Company had $319.9 million outstanding in FHLB advances, and could
borrow an additional amount of approximately $186.1 million. As a
contingency plan for significant funding needs, the Asset/Liability Management
Committee may also consider the sale of investment securities, selling
securities under agreement to repurchase, or the temporary curtailment of
lending activities. As of December 31, 2009, the Company had
approximately $1.7 billion of unpledged securities, excluding securities
available for pledge at the FHLB.
Corporation Liquidity. Our
main sources of liquidity at the holding company level are dividends from our
subsidiary bank.
MB
Financial Bank is subject to various regulatory capital requirements which
affect its ability to pay dividends to us. Failure to meet minimum
capital requirements can initiate certain mandatory and discretionary actions by
regulators that, if undertaken, could have a direct material effect on our
financial statements. Additionally, our current policy effectively
limits the amount of dividends our subsidiary bank may pay to us by requiring
the bank to maintain total risk-based capital, Tier 1 risk-based capital and
Tier 1 leverage capital ratios of 12%, 9% and 7%, respectively. The
minimum ratios required for a bank to be considered "well capitalized" for
regulatory purposes are 10%, 6% and 5%, respectively. In addition to
adhering to our policy, there are regulatory restrictions on the ability of
national banks to pay dividends. See "Item 1. Business – Supervision and Regulation."
Commitments. As a
financial services provider, we routinely enter into commitments to extend
credit, including loan commitments, standby and commercial letters of
credit. While these contractual obligations represent our future cash
requirements, a significant portion of commitments to extend credit may expire
without being drawn upon. Such commitments are subject to the same
credit policies and approval process accorded to loans made by
us. For additional information, see Note 17
“Commitments and Contingencies” to the consolidated financial
statements.
Derivative Financial
Instruments. Derivatives
have become one of several components of our asset/liability management
activities to manage interest rate risk. In general, the assets and
liabilities generated through the ordinary course of business activities do not
naturally create offsetting positions with respect to repricing, basis or
maturity characteristics. Using derivative instruments, principally
interest rate swaps, our interest rate sensitivity is adjusted to maintain the
desired interest rate risk profile. Interest rate swaps used to
adjust the interest rate sensitivity of certain interest-bearing assets and
liabilities will not need to be replaced at maturity, since the corresponding
asset or liability will mature along with the interest rate swap.
Interest
rate swaps designated as an interest rate related hedge of an existing fixed
rate asset or liability are fair value type hedges. We currently use
fair value type hedges, or interest rate swaps, to mitigate the interest
sensitivity of certain qualifying commercial loans and brokered time
certificates of deposit. The change in fair value of both the
interest rate swap and hedged instrument is recorded in current
earnings. If a hedge ceases to qualify for hedge accounting prior to
maturity, previous adjustments to the carrying value of the hedged item are
recognized in earnings to match the earnings recognition pattern of the hedged
item (e.g., level yield amortization if hedging an interest-bearing instrument
that has not been sold or extinguished). For additional information,
including the notional amount and fair value of our interest rate swaps at
December 31, 2009, see Note 21 “Derivative Financial
Instruments” to the consolidated financial statements.
Trust Preferred
Securities. In addition to our commitments and derivative
financial instruments of the types described above, our off balance sheet
arrangements include our combined $4.8 million ownership interests in the common
securities of the statutory trusts we established to issue trust preferred
securities. See “Capital Resources” below in this Item 7 and Note 13 “Junior Subordinated Notes Issued to Capital Trusts”
to the consolidated financial statements.
Contractual Obligations. In
the ordinary course of operations, we enter into certain contractual
obligations. Such obligations include the funding of operations
through debt issuances, subordinated notes issued to capital trusts, operating
leases for premises and equipment, as well as capital expenditures for new
premises and equipment.
The
following table summarizes our significant contractual obligations and other
potential funding needs at December 31, 2009 (in thousands):
|
Contractual
Obligations
|
Total
|
Less
than 1
Year
|
1
- 3 Years
|
3
- 5 Years
|
More
than 5
Years
|
|
Time
certificates
|
$ 3,771,840
|
$ 3,158,663
|
$ 477,429
|
$
122,838
|
$
12,910
|
|
Long-term
borrowings
|
331,349
|
47,350
|
81,510
|
9,030
|
193,459
|
|
Junior
subordinated notes issued to capital trusts(1)
|
158,677
|
-
|
-
|
-
|
158,677
|
|
Operating
leases
|
59,820
|
4,504
|
8,392
|
6,705
|
40,219
|
|
Capital
expenditures
|
29,173
|
29,173
|
-
|
-
|
-
|
|
Total
|
$ 4,350,859
|
$ 3,239,690
|
$ 567,331
|
$
138,573
|
$
405,265
|
|
Commitments
to extend credit and letters of credit
|
$ 1,603,476
|
|
(1)
|
Call
dates are set forth in Note 13 to the audited consolidated financial
statements under Item 8. Financial Statements and Supplementary
Data.
|
Our
subsidiary bank is subject to the risk based capital regulations administered by
the banking regulatory agencies. The risk based capital guidelines
are designed to make regulatory capital requirements more sensitive to
differences in risk profiles among banks, to account for off-balance sheet
exposure, and to minimize disincentives for holding liquid
assets. Under the regulations, assets and off-balance sheet items are
assigned to broad risk categories, each with appropriate weights. The
resulting capital ratios represent capital as a percentage of total risk
weighted assets and off-balance sheet items. Under the prompt
corrective action regulations, to be adequately capitalized a bank must maintain
minimum ratios of total capital to risk-weighted assets of 8.00%, Tier 1 capital
to risk-weighted assets of 4.00%, and Tier 1 capital to total assets of
4.00%. Failure to meet these capital requirements can initiate
certain mandatory and possibly additional discretionary, actions by regulators,
which, if undertaken, could have a direct material effect on the bank’s
financial statements. As of December 31, 2009, the most recent
notification from the federal banking regulators categorized our subsidiary bank
as well capitalized.
A well
capitalized institution must maintain a minimum ratio of total capital to
risk-weighted assets of at least 10.00%, a minimum ratio of Tier 1 capital to
risk weighted assets of at least 6.00%, a minimum ratio of Tier 1 capital to
total assets of at least 5.00% and must not be subject to any written order,
agreement or directive requiring it to meet or maintain a specific capital
level. There are no conditions or events since that notification that
management believes have changed our subsidiary bank’s capital
classification. On a consolidated basis, we must maintain a minimum
ratio of Tier 1 capital to total assets of 4.00%, a minimum ratio of Tier 1
capital to risk-weighted assets of 4.00% and a minimum ratio of total-capital to
risk-weighted assets of 8.00%. See “Item 1. Business – Supervision and Regulation – Capital Adequacy" and "Prompt
Corrective Action." In addition, our internal policy requires us, on
a consolidated basis, to maintain these ratios at or above 7%, 9% and 12%,
respectively.
As of
December 31, 2009, our subsidiary bank was "well capitalized" under the capital
adequacy requirements to which each of us are subject. The following
table sets forth the actual and required regulatory capital amounts and ratios
for our subsidiary bank and us as of December 31, 2009 (dollars in
thousands):
|
Required
|
|||||||||||
|
To
Be Well
|
|||||||||||
|
Required
|
Capitalized
Under
|
||||||||||
|
For
Capital
|
Prompt
Corrective
|
||||||||||
|
Actual
|
Adequacy
Purposes
|
Action
Provisions
|
|||||||||
|
Amount
|
Ratio
|
Amount
|
Ratio
|
Amount
|
Ratio
|
||||||
|
Total
capital (to risk-weighted assets):
|
|||||||||||
|
Consolidated
|
$ 1,130,496
|
15.45%
|
$ 585,205
|
8.00%
|
N/A
|
N/A
|
|||||
|
MB
Financial Bank
|
965,507
|
13.25%
|
583,035
|
8.00%
|
$ 728,793
|
10.00%
|
|||||
|
Tier
1 capital (to risk-weighted assets):
|
|||||||||||
|
Consolidated
|
$ 988,335
|
13.51%
|
$ 292,603
|
4.00%
|
N/A
|
N/A
|
|||||
|
MB
Financial Bank
|
823,346
|
11.30%
|
291,517
|
4.00%
|
$ 437,276
|
6.00%
|
|||||
|
Tier
1 capital (to average assets):
|
|||||||||||
|
Consolidated
|
$ 988,335
|
8.71%
|
$ 453,939
|
4.00%
|
N/A
|
N/A
|
|||||
|
MB
Financial Bank
|
823,346
|
7.27%
|
452,938
|
4.00%
|
$ 566,172
|
5.00%
|
|||||
N/A – not
applicable
We
established statutory trusts for the sole purpose of issuing trust preferred
securities and related trust common securities. The trust preferred
securities are included in our consolidated Tier 1 Capital and Total Capital at
December 31, 2009.
As of
December 31, 2009, we had approximately $29.2 million in capital expenditure
commitments outstanding which relate to various projects to renovate existing
branches, or commitments to purchase branch facilities related to our FDIC
transactions. We expect to pay the outstanding commitments as of
December 31, 2009 through the normal cash flows of our business
operations.
Statement
of Cash Flows
Operating
Activities. Cash flows from continuing operating
activities primarily include net income (loss), adjusted for items in net income
(loss) that did not impact cash. Net cash provided by continuing
operating activities decreased by $6.0 million to $141.2 million for the year
ended December 31, 2009, from $147.2 million for the year ended December 31,
2008. The decrease was primarily due to a decrease in net
income.
Net cash
provided by continuing operating activities increased by $6.2 million to $147.2
million for the year ended December 31, 2008, from $141.0 million for the year
ended December 31, 2007. The increase was primarily due to an
increase in provision for loan losses partially offset by a decrease in net
income.
Investing
Activities. Cash used in continuing investing activities
reflects the impact of loans and investments acquired for the Company’s
interest-earning asset portfolios, as well as cash flows from asset sales and
the impact of acquisitions. For the year ended December 31, 2009, the
Company had net cash flows provided by continuing investing activities of $4.8
billion, compared to net cash flows used in continuing investing activities of
$887.8 million for the year ended December 31, 2008. The change in
cash flows from investing activities was primarily due to cash proceeds received
in FDIC assisted transactions during the year ended December 31,
2009. Additionally, our organic loan growth slowed, primarily due to
the current economic environment.
For the
year ended December 31, 2008, the Company had net cash flows used in continuing
investing activities of $887.8 million, compared to $206.9 million for the year
ended December 31, 2007. The change in cash flows from continuing
investing activities was primarily due to a decrease in the proceeds from sales
and maturities in our investment portfolio, and an increase in purchases of
investment securities during the year ended December 31, 2008, compared to the
year ended December 31, 2007. Additionally, we received $76.1 million
from the sale of Union Bank in 2007.
Financing
Activities. Cash flows from continuing financing activities
include transactions and events whereby cash is obtained from depositors,
creditors or investors. For the year ended December 31, 2009, the
Company had net cash flows used in continuing financing activities of $4.9
billion, compared to net cash flows provided by continuing financing activities
of $931.5 million for the year ended December 31, 2008. The change in
cash flows from financing activities was primarily the result of a planned
reduction in deposits related to our FDIC assisted
transactions. Shortly after the Corus transaction closing on
September 11, 2009, we issued checks to almost all out-of-market Corus
certificate of deposit holders of approximately $2.4 billion for the redemption
of these deposits. Interest rates on some in-market Corus
certificates of deposits were reduced shortly after the transaction closing,
resulting in additional run-off of certificates of
deposit. Additionally, interest rates on out-of-market Corus money
market accounts were reduced to 5 basis points in September 2009. The
net decrease in deposits was partially offset by the issuance of common stock
during the year, which generated cash flows of $206.4 million.
For the
year ended December 31, 2008, the Company had net cash flows provided by
continuing financing activities of $931.5 million, compared to $68.2 million for
the year ended December 31, 2007. The change in cash flows from
continuing financing activities was primarily due to an increase in deposits and
the issuance of preferred stock pursuant to the TARP Capital Purchase Program,
partially offset by a net decrease in borrowings. During 2008 we
improved our liquidity position as a result of an increase in deposits of $981.8
million, and a reduction in short-term borrowings of $489.1
million. In addition, we lengthened the maturities on both customer
and brokered certificates of deposits.
Market
Risk and Asset Liability Management
Market Risk. Market
risk is the risk that the market value or estimated fair value of our assets,
liabilities, and derivative financial instruments will decline as a result of
changes in interest rates or financial market volatility, or that our net income
will be significantly reduced by interest rate changes. Market risk
is managed operationally in our Treasury Group, and is addressed through a
selection of funding and hedging instruments supporting balance sheet growth, as
well as monitoring our asset investment strategies.
Asset Liability
Management. Management and our Treasury Group continually
monitor our sensitivity to interest rate changes. It is our policy to
maintain an acceptable level of interest rate risk over a range of possible
changes in interest rates while remaining responsive to market demand for loan
and deposit products. The strategy we employ to manage our interest
rate risk is to measure our risk using an asset/liability simulation
model. The model considers several factors to determine our potential
exposure to interest rate risk, including measurement of repricing gaps,
duration, convexity, value at risk, and the market value of portfolio equity
under assumed changes in the level of interest rates, shape of the yield curves,
and general market volatility. Management controls our interest rate
exposure using several strategies, which include adjusting the maturities of
securities in our investment portfolio, and limiting fixed rate loans or fixed
rate deposits with terms of more than five years. We also use
derivative instruments, principally interest rate swaps, to manage our interest
rate risk. See “Item 7. Management’s Discussion and Analysis of
Financial Condition and Results of Operations – Off-Balance Sheet Arrangements and Aggregate Contractual
Obligations.”
Interest Rate
Risk. Interest rate risk can come in a variety of forms,
including repricing risk, yield curve risk, basis risk, and prepayment
risk. We experience repricing risk when the change in the average
yield of our interest earning assets or average rate of our interest bearing
liabilities is more sensitive than the other to changes in market interest
rates. Such a change in sensitivity could reflect a number of
possible mismatches in the repricing opportunities of our assets and
liabilities.
In the
event that yields on our assets and liabilities do adjust to changes in market
rates to the same extent, we may still be exposed to yield curve
risk. Yield curve risk reflects the possibility the changes in the
shape of the yield curve could have different effects on our assets and
liabilities.
Variable
rate assets and liabilities that reprice at similar times, have similar
maturities or repricing dates, are based on different indexes still have
interest rate risk. Basis risk reflects the possibility that indexes
will not move in a coordinated manner.
We hold
mortgage-related investments, including mortgage loans and mortgage-backed
securities. Prepayment risk is associated with mortgage-related
investments and results from homeowners’ ability to pay off their mortgage loans
prior to maturity. We limit this risk by restricting the types of
mortgage-backed securities we own to those with limited average life changes
under certain interest-rate shock scenarios, or securities with embedded
prepayment penalties. We also limit the amount of fixed rate mortgage
loans we hold that have maturities greater than five years.
Measuring Interest Rate
Risk. As noted above, interest rate risk can be measured by
analyzing the extent to which the repricing of assets and liabilities are
mismatched to create an interest sensitivity gap. An asset or
liability is said to be interest rate sensitive within a specific period if it
will mature or reprice within that period. The interest rate
sensitivity gap is defined as the difference between the amount of interest
earning assets maturing or repricing within a specific time period and the
amount of interest bearing liabilities maturing or repricing within that same
time period. A gap is considered positive when the amount of interest
rate sensitive assets exceeds the amount of interest rate sensitive
liabilities. A gap is considered negative when the amount of interest
rate sensitive liabilities exceeds the amount of interest rate sensitive
assets. During a period of rising interest rates, therefore, a
negative gap would tend to adversely affect net interest
income. Conversely, during a period of falling interest rates, a
negative gap position would tend to result in an increase in net interest
income.
The
following table sets forth the amounts of interest earning assets and interest
bearing liabilities outstanding at December 31, 2009 that we anticipate, based
upon certain assumptions, to reprice or mature in each of the future time
periods shown. Except as stated below, the amount of assets and
liabilities shown which reprice or mature during a particular period were
determined based on the earlier of the term to repricing or the term to
repayment of the asset or liability. The table is intended to provide
an approximation of the projected repricing of assets and liabilities at
December 31, 2009 based on contractual maturities and scheduled rate adjustments
within a three-month period and subsequent selected time
intervals. The loan amounts in the table reflect principal balances
expected to be reinvested and/or repriced because of contractual amortization
and rate adjustments on adjustable-rate loans. Loan and investment
securities’ contractual maturities and amortization reflect expected prepayment
assumptions. While NOW, money market and savings deposit accounts
have adjustable rates, it is assumed that the interest rates on some of the
accounts will not adjust immediately to changes in other interest
rates.
Therefore,
the information in the table is calculated assuming that NOW, money market and
savings deposits will reprice as follows: 6%, 7% and 6%, respectively, in the
first three months, 15%, 25%, and 17%, respectively, in the next nine months,
56%, 60% and 57%, respectively, from one year to five years, and 23%, 8%, and
20%, respectively over five years (dollars in thousands):
|
Time
to Maturity or Repricing
|
||||||||||
|
0
– 90
|
91
- 365
|
1
– 5
|
Over
5
|
|||||||
|
Days
|
Days
|
Years
|
Years
|
Total
|
||||||
|
Interest
Earning Assets:
|
||||||||||
|
Interest
bearing deposits with banks
|
$
263,192
|
$ 584
|
$
1,481
|
$ -
|
$ 265,257
|
|||||
|
Investment
securities available for sale
|
463,270
|
498,513
|
1,400,242
|
551,569
|
2,913,594
|
|||||
|
Loans
|
3,259,227
|
983,358
|
2,147,465
|
134,497
|
6,524,547
|
|||||
|
Total
interest earning assets
|
$
3,985,689
|
$ 1,482,455
|
$
3,549,188
|
$ 686,066
|
$ 9,703,398
|
|||||
|
Interest
Bearing Liabilities:
|
||||||||||
|
NOW
and money market deposit accounts
|
$
187,748
|
$ 609,255
|
$
1,647,370
|
$ 331,095
|
$ 2,775,468
|
|||||
|
Savings
deposits
|
33,270
|
96,621
|
332,078
|
121,813
|
583,782
|
|||||
|
Time
deposits
|
1,140,177
|
1,991,227
|
625,715
|
14,721
|
3,771,840
|
|||||
|
Short-term
borrowings
|
132,681
|
58,787
|
117,982
|
14,467
|
323,917
|
|||||
|
Long-term
borrowings
|
102,427
|
34,569
|
91,845
|
102,508
|
331,349
|
|||||
|
Junior
subordinated notes issued to capital trusts
|
152,065
|
-
|
-
|
6,612
|
158,677
|
|||||
|
Total
interest bearing liabilities
|
$
1,748,368
|
$ 2,790,459
|
$
2,814,990
|
$ 591,216
|
$ 7,945,033
|
|||||
|
Rate
sensitive assets (RSA)
|
$
3,985,689
|
$ 5,468,144
|
$
9,017,332
|
$ 9,703,398
|
$ 9,703,398
|
|||||
|
Rate
sensitive liabilities (RSL)
|
$
1,748,368
|
$ 4,538,827
|
$
7,353,817
|
$ 7,945,033
|
$ 7,945,033
|
|||||
|
Cumulative
GAP (GAP=RSA-RSL)
|
$
2,237,321
|
$ 929,317
|
$
1,663,515
|
$ 1,758,365
|
$ 1,758,365
|
|||||
|
RSA/Total
assets
|
36.68%
|
50.33%
|
82.99%
|
89.31%
|
89.31%
|
|||||
|
RSL/Total
assets
|
16.09%
|
41.77%
|
67.68%
|
73.12%
|
73.12%
|
|||||
|
GAP/Total
assets
|
20.59%
|
8.55%
|
15.31%
|
16.18%
|
16.18%
|
|||||
|
GAP/RSA
|
56.13%
|
17.00%
|
18.45%
|
18.12%
|
18.12%
|
|||||
Certain
shortcomings are inherent in the method of analysis presented in the foregoing
table. For example, although certain assets and liabilities may have
similar maturities or periods to repricing, they may react in different degrees
to changes in market interest rates. Also, the interest rates on
certain types of assets and liabilities may fluctuate in advance of changes in
market interest rates, while interest rates on other types of assets may lag
behind changes in market rates. Additionally, in the event of a
change in interest rates, prepayment and early withdrawal levels would likely
deviate significantly from those assumed in calculating the
table. Therefore, we do not rely on a gap analysis to manage our
interest rate risk, but rather we use what we believe to be the more reliable
simulation model relating to changes in net interest income.
Based on
simulation modeling which assumes gradual changes in interest rates over a
one-year period, we believe that our net interest income would change due to
changes in interest rates as follows (dollars in thousands):
|
Gradual
|
Change
in Net Interest Income Over One Year Horizon
|
|||||
|
Changes
in
|
At
December 31, 2009
|
At
December 31, 2008
|
||||
|
Levels
of
|
Dollar
|
Percentage
|
Dollar
|
Percentage
|
||
|
Interest
Rates
|
Change
|
Change
|
Change
|
Change
|
||
|
+2.00%
|
$ 8,856
|
2.60
%
|
$ 8,664
|
3.40
%
|
||
|
+1.00%
|
6,425
|
1.89
%
|
3,328
|
1.30
%
|
||
In the
interest rate sensitivity table above, changes in net interest income between
December 31, 2009 and December 31, 2008 reflect changes in the composition of
interest earning assets and interest bearing liabilities, related interest
rates, repricing frequencies, and the fixed or variable characteristics of the
interest earning assets and interest bearing liabilities.
The
assumptions used in our interest rate sensitivity simulation discussed above are
inherently uncertain and, as a result, the simulations cannot precisely measure
net interest income or precisely predict the impact of changes in interest rates
on net interest income. Our model assumes that a portion of our
variable rate loans that have minimum interest rates will remain in our
portfolio regardless of changes in the interest rate
environment. Actual results will differ from simulated results due to
timing, magnitude and frequency of interest rate changes as well as changes in
market conditions and management strategies.
As a
result of the current interest rate environment, the Company does not anticipate
any significant declines in interest rates over the next twelve
months. For this reason, we did not use an interest rate sensitivity
simulation that assumes a gradual decline in the level of interest rates over
the next twelve months.
MB
FINANCIAL, INC.
CONSOLIDATED
FINANCIAL STATEMENTS
December
31, 2009, 2008, and 2007
|
Page
|
|
|
MANAGEMENT’S REPORT ON INTERNAL CONTROL OVER FINANCIAL
REPORTING..........................................................................................................
|
|
|
REPORT OF INDEPENDENT REGISTERED PUBLIC ACCOUNTING FIRM ON
THE CONSOLIDATED FINANCIAL STATEMENTS..............................
|
|
|
FINANCIAL
STATEMENTS
|
|
|
Consolidated Balance
Sheets…….........................................................................................................……………………………..................................……………
|
|
|
Consolidated Statements of
Operations..……………………………………………………………..................................................................................................
|
|
|
Consolidated Statements of Changes in Stockholders'
Equity………………………………………..............................................................................................
|
|
|
Consolidated Statements of Cash
Flows……………………………………………………………...................................................................................................
|
|
|
Notes to Consolidated Financial
Statements………………………………………………………....................................................................................................
|
|

The
management of MB Financial, Inc. (the Company) is responsible for establishing
and maintaining adequate internal control over financial reporting.
The
Company’s internal control over financial reporting is a process designed to
provide reasonable assurance regarding the reliability of financial reporting
and the preparation of financial statements for external purposes in accordance
with accounting principles generally accepted in the United States of America.
The Company’s internal control over financial reporting includes those policies
and procedures that (i) pertain to the maintenance of records that, in
reasonable detail, accurately and fairly reflect the transactions and
dispositions of the assets of the Company; (ii) provide reasonable assurance
that transactions are recorded as necessary to permit preparation of financial
statements in accordance with accounting principles generally accepted in the
United States of America, and that receipts and expenditures of the Company are
being made only in accordance with authorizations of management and directors of
the Company; and (iii) provide reasonable assurance regarding prevention or
timely detection of unauthorized acquisition, use, or disposition of the
Company’s assets that could have a material effect on the financial
statements.
Because
of its inherent limitations, internal control over financial reporting may not
prevent or detect misstatements. All internal control systems, no matter how
well designed, have inherent limitations, including the possibility of human
error and the circumvention of overriding controls. Accordingly, even
effective internal control over financial reporting can provide only reasonable
assurance with respect to financial statement preparation. Also,
projections of any evaluation of effectiveness to future periods are subject to
the risk that controls may become inadequate because of changes in conditions,
or that the degree of compliance with the policies or procedures may
deteriorate.
Management
assessed the effectiveness of the Company’s internal control over financial
reporting as of December 31, 2009, based on the framework set forth by the
Committee of Sponsoring Organizations of the Treadway Commission (COSO) in Internal Control–Integrated
Framework. Based on that assessment, management concluded that, as of
December 31, 2009, the Company’s internal control over financial reporting is
effective based on the criteria established in Internal Control–Integrated
Framework.
On
September 11, 2009, the Company completed a transaction pursuant to a purchase
and assumption agreement with the FDIC to assume all of the deposits and acquire
certain assets of Corus Bank, N.A., which was closed and put into FDIC
receivership on that same day. As permitted by the Securities and Exchange
Commission, management elected to exclude branch and deposit operations in
relation to deposits assumed from management’s assessment of the
effectiveness of the Company’s internal control over financial reporting as of
December 31, 2009. This represents $6.5 billion in deposits at the
date of acquisition and $2.1 billion in deposits at December 31, 2009. See
Note 2 regarding the decrease in these deposits from the
acquisition date to December 31, 2009.
Management’s
assessment of the effectiveness of the Company’s internal control over financial
reporting as of December 31, 2009, has been audited by McGladrey & Pullen,
LLP, an independent registered public accounting firm, as stated in their
attestation report, which expresses an unqualified opinion on the effectiveness
of the Company’s internal control over financial reporting as of December 31,
2009. See “Report of Independent Registered Public Accounting Firm on
Internal Control Over Financial Reporting.”
|
/s/ Mitchell Feiger
|
/s/ Jill E. York
|
||
|
Mitchell
Feiger
|
Jill
E. York
|
||
|
President
and
|
Vice
President and
|
||
|
Chief
Executive Officer
|
Chief
Financial Officer
|
March
4, 2010
REPORT OF INDEPENDENT REGISTERED PUBLIC ACCOUNTING FIRM ON
INTERNAL CONTROL OVER FINANCIAL REPORTING
To the
Board of Directors and Stockholders
MB
Financial, Inc.
We have
audited MB Financial, Inc.’s internal control over financial reporting as of
December 31, 2009, based on criteria established in Internal Control—Integrated
Framework issued by the Committee of Sponsoring Organizations of the
Treadway Commission. The Company’s management is responsible for
maintaining effective internal control over financial reporting and for its
assessment of the effectiveness of internal control over financial reporting
included in the accompanying Management’s Report on Internal
Control Over Financial Reporting. Our responsibility is to
express an opinion on the company's internal control over financial reporting
based on our audit.
We
conducted our audit in accordance with the standards of the Public Company
Accounting Oversight Board (United States). Those standards require
that we plan and perform the audit to obtain reasonable assurance about whether
effective internal control over financial reporting was maintained in all
material respects. Our audit included obtaining an understanding of internal
control over financial reporting, assessing the risk that a material weakness
exists, and testing and evaluating the design and operating effectiveness of
internal control based on the assessed risk. Our audit also included performing
such other procedures as we considered necessary in the
circumstances. We believe that our audit provides a reasonable basis
for our opinion.
As
described in Management’s
Report on Internal Control Over Financial Reporting, on September 11,
2009, the Company completed a transaction pursuant to a purchase and assumption
agreement with the FDIC to assume all of the deposits and acquire certain assets
of Corus Bank, N.A., which was closed and put into FDIC receivership on that
same day. As permitted by the Securities and Exchange Commission,
management elected to exclude branch and deposit operations in relation to
deposits assumed from management’s assessment of the effectiveness of the
Company’s internal control over financial reporting as of December 31,
2009. This represents $6.5 billion in deposits at the date of
acquisition and $2.1 billion in deposits at December 31, 2009. See Note 2 regarding the decrease in these deposits from the
acquisition date to December 31, 2009. Our audit of the internal
control over financial reporting of the Company also excluded an evaluation of
the internal control over financial reporting of branch and deposit operations
in relation to deposits assumed.
A
company's internal control over financial reporting is a process designed to
provide reasonable assurance regarding the reliability of financial reporting
and the preparation of financial statements for external purposes in accordance
with generally accepted accounting principles. A company's internal
control over financial reporting includes those policies and procedures that (1)
pertain to the maintenance of records that, in reasonable detail, accurately and
fairly reflect the transactions and dispositions of the assets of the company;
(2) provide reasonable assurance that transactions are recorded as necessary to
permit preparation of financial statements in accordance with generally accepted
accounting principles, and that receipts and expenditures of the company are
being made only in accordance with authorizations of management and directors of
the company; and (3) provide reasonable assurance regarding prevention or timely
detection of unauthorized acquisition, use, or disposition of the company's
assets that could have a material effect on the financial
statements.
Because
of its inherent limitations, internal control over financial reporting may not
prevent or detect misstatements. Also, projections of any evaluation
of effectiveness to future periods are subject to the risk that controls may
become inadequate because of changes in conditions, or that the degree of
compliance with the policies or procedures may deteriorate.
In our
opinion, MB Financial, Inc. maintained, in all material respects, effective
internal control over financial reporting as of December 31, 2009, based on
criteria established in Internal Control—Integrated
Framework issued by the Committee of Sponsoring Organizations of the
Treadway Commission.
We have
also audited, in accordance with the standards of the Public Company Accounting
Oversight Board (United States), the consolidated financial statements as of and
for the year ended December 31, 2009 of MB Financial, Inc. and our report dated
March 4, 2010 expressed an unqualified opinion.
/s/
McGladrey & Pullen, LLP
Schaumburg,
Illinois
March 4,
2010
To the
Board of Directors and Stockholders
MB
Financial, Inc.
We have
audited the consolidated balance sheets of MB Financial, Inc. and Subsidiaries
as of December 31, 2009 and 2008, and the related consolidated statements
of operations, changes in stockholders’ equity and cash flows for each of the
three years in the period ended December 31, 2009. These financial
statements are the responsibility of the Company's management. Our
responsibility is to express an opinion on these financial statements based on
our audits.
We
conducted our audits in accordance with the standards of the Public Company
Accounting Oversight Board (United States). Those standards require
that we plan and perform the audit to obtain reasonable assurance about whether
the financial statements are free of material misstatement. An audit
includes examining, on a test basis, evidence supporting the amounts and
disclosures in the financial statements. An audit also includes
assessing the accounting principles used and significant estimates made by
management, as well as evaluating the overall financial statement
presentation. We believe that our audits provide a reasonable basis
for our opinion.
In our
opinion, the consolidated financial statements referred to above present fairly,
in all material respects, the financial position of MB Financial, Inc. and
Subsidiaries as of December 31, 2009 and 2008, and the results of their
operations and their cash flows for each of the three years in the period ended
December 31, 2009, in conformity with U.S. generally accepted accounting
principles.
We have
also audited, in accordance with the standards of the Public Company Accounting
Oversight Board (United States), MB Financial Inc. and Subsidiaries’ internal
control over financial reporting as of December 31, 2009, based on the
criteria established in Internal Control—Integrated Framework issued
by the Committee of Sponsoring Organizations of the Treadway Commission (COSO),
and our report dated March 4, 2010 expressed an unqualified opinion on the
effectiveness of the Company’s internal control over financial
reporting.
/s/
McGladrey & Pullen, LLP
Schaumburg,
Illinois
March 4,
2010
MB
FINANCIAL, INC. & SUBSIDIARIES
December
31, 2009 and 2008
(Amounts in thousands, except common
share data)
|
December
31,
|
December
31,
|
|||||
|
2009
|
2008
|
|||||
|
ASSETS
|
||||||
|
Cash
and due from banks
|
$ 136,763
|
$ 79,824
|
||||
|
Interest
bearing deposits with banks
|
265,257
|
261,834
|
||||
|
Total
cash and cash equivalents
|
402,020
|
341,658
|
||||
|
Investment
securities:
|
||||||
|
Securities
available for sale, at fair value
|
2,843,233
|
1,336,130
|
||||
|
Non-marketable
securities - FHLB and FRB stock
|
70,361
|
64,246
|
||||
|
Total
investment securities
|
2,913,594
|
1,400,376
|
||||
|
Loans:
|
||||||
|
Total
loans, excluding covered loans
|
6,350,951
|
6,228,563
|
||||
|
Covered
loans
|
173,596
|
-
|
||||
|
Total
loans
|
6,524,547
|
6,228,563
|
||||
|
Less:
Allowance for loan loss
|
177,072
|
144,001
|
||||
|
Net
Loans
|
6,347,475
|
6,084,562
|
||||
|
Lease
investment, net
|
144,966
|
125,034
|
||||
|
Premises
and equipment, net
|
179,641
|
186,474
|
||||
|
Cash
surrender value of life insurance
|
121,946
|
119,526
|
||||
|
Goodwill,
net
|
387,069
|
387,069
|
||||
|
Other
intangibles, net
|
37,708
|
25,776
|
||||
|
Other
real estate owned, net
|
36,711
|
4,366
|
||||
|
Other
real estate owned related to FDIC transactions
|
18,759
|
-
|
||||
|
FDIC
indemnification asset
|
42,212
|
-
|
||||
|
Other
assets
|
233,292
|
144,922
|
||||
|
Total
assets
|
$ 10,865,393
|
$ 8,819,763
|
||||
|
LIABILITIES
AND STOCKHOLDERS' EQUITY
|
||||||
|
LIABILITIES
|
||||||
|
Deposits:
|
||||||
|
Noninterest
bearing
|
$ 1,552,185
|
$ 960,117
|
||||
|
Interest
bearing
|
7,131,091
|
5,535,454
|
||||
|
Total
deposits
|
8,683,276
|
6,495,571
|
||||
|
Short-term
borrowings
|
323,917
|
488,619
|
||||
|
Long-term
borrowings
|
331,349
|
471,466
|
||||
|
Junior
subordinated notes issued to capital trusts
|
158,677
|
158,824
|
||||
|
Accrued
expenses and other liabilities
|
116,994
|
136,459
|
||||
|
Total
liabilities
|
9,614,213
|
7,750,939
|
||||
|
STOCKHOLDERS'
EQUITY
|
||||||
|
Preferred
stock, ($0.01 par value, authorized 1,000,000 shares at December
31,
|
||||||
|
2009
and December 31, 2008; series A, 5% cumulative perpetual,
196,000
|
||||||
|
shares
issued and outstanding at December 31, 2009 and December 31,
2008,
|
||||||
|
$1,000
liquidation value)
|
193,522
|
193,025
|
||||
|
Common
stock, ($0.01 par value; authorized 70,000,000 shares at December
31,
|
||||||
|
2009
and 50,000,000 at December 31, 2008; issued 51,109,944 shares at December
31,
|
||||||
|
2009
and 37,542,968 at December 31, 2008)
|
511
|
375
|
||||
|
Additional
paid-in capital
|
656,595
|
445,692
|
||||
|
Retained
earnings
|
395,170
|
495,505
|
||||
|
Accumulated
other comprehensive income
|
5,546
|
16,910
|
||||
|
Less:
133,903 and 2,612,143 shares of Treasury stock, at cost,
at
|
||||||
|
December
31, 2009 and December 31, 2008, respectively
|
(2,715)
|
(85,312)
|
||||
|
Controlling
interest stockholders' equity
|
1,248,629
|
1,066,195
|
||||
|
Noncontrolling
interest
|
2,551
|
2,629
|
||||
|
Total
stockholders' equity
|
1,251,180
|
1,068,824
|
||||
|
Total
liabilities and stockholders' equity
|
$ 10,865,393
|
$ 8,819,763
|
||||
See
Accompanying Notes to Consolidated Financial Statements.
|
MB
FINANCIAL, INC. & SUBSIDIARIES
|
||||||
|
Years
Ended December 31, 2009, 2008 and 2007
|
||||||
|
(Amounts
in thousands, except share and per share data)
|
||||||
|
2009
|
2008
|
2007
|
||||
|
Interest
income:
|
||||||
|
Loans
|
$ 331,270
|
$ 357,075
|
$ 393,016
|
|||
|
Investment
securities available for sale:
|
||||||
|
Taxable
|
45,777
|
40,468
|
49,675
|
|||
|
Nontaxable
|
14,754
|
15,502
|
13,862
|
|||
|
Federal
funds sold
|
-
|
276
|
449
|
|||
|
Other
interest bearing accounts
|
1,737
|
467
|
264
|
|||
|
Total
interest income
|
393,538
|
413,788
|
457,266
|
|||
|
Interest
expense:
|
||||||
|
Deposits
|
121,614
|
151,370
|
185,649
|
|||
|
Short-term
borrowings
|
5,166
|
17,590
|
37,354
|
|||
|
Long-term
borrowings and junior subordinated notes
|
16,206
|
23,940
|
21,957
|
|||
|
Total
interest expense
|
142,986
|
192,900
|
244,960
|
|||
|
Net
interest income
|
250,552
|
220,888
|
212,306
|
|||
|
Provision
for loan losses
|
231,800
|
125,721
|
19,313
|
|||
|
Net
interest income after provision for loan losses
|
18,752
|
95,167
|
192,993
|
|||
|
Other
income:
|
||||||
|
Loan
service fees
|
6,913
|
9,180
|
6,258
|
|||
|
Deposit
service fees
|
30,600
|
28,225
|
23,918
|
|||
|
Lease
financing, net
|
18,528
|
16,973
|
15,847
|
|||
|
Brokerage
fees
|
4,606
|
4,317
|
9,581
|
|||
|
Asset
management and trust fees
|
12,593
|
11,869
|
10,447
|
|||
|
Net
gain (loss) on sale of securities available for sale
|
14,029
|
1,130
|
(3,744)
|
|||
|
Increase
in cash surrender value of life insurance
|
2,459
|
5,299
|
5,003
|
|||
|
Net
(loss) gain on sale of assets
|
(13)
|
(1,104)
|
10,097
|
|||
|
Acquisition
related gains
|
28,547
|
-
|
-
|
|||
|
Other
operating income
|
8,892
|
4,504
|
6,121
|
|||
|
Total
other income
|
127,154
|
80,393
|
83,528
|
|||
|
Other
expenses:
|
||||||
|
Salaries
and employee benefits
|
120,654
|
108,835
|
110,809
|
|||
|
Occupancy
and equipment expense
|
31,521
|
28,872
|
28,878
|
|||
|
Computer
services expense
|
10,011
|
7,392
|
6,699
|
|||
|
Advertising
and marketing expense
|
4,185
|
5,089
|
4,859
|
|||
|
Professional
and legal expense
|
4,680
|
3,110
|
4,543
|
|||
|
Brokerage
fee expense
|
1,999
|
1,929
|
4,802
|
|||
|
Telecommunication
expense
|
3,433
|
2,818
|
2,805
|
|||
|
Other
intangibles amortization expense
|
4,491
|
3,554
|
3,504
|
|||
|
FDIC
insurance premiums
|
16,762
|
1,877
|
664
|
|||
|
Charitable
contributions
|
73
|
30
|
4,686
|
|||
|
Impairment
charges on branch facilities
|
4,000
|
-
|
-
|
|||
|
Other
operating expenses
|
21,941
|
19,884
|
19,257
|
|||
|
Total
other expenses
|
223,750
|
183,390
|
191,506
|
|||
|
Income
(loss) before income taxes and discontinued operations
|
(77,844)
|
(7,830)
|
85,015
|
|||
|
Income
taxes
|
(45,265)
|
(23,555)
|
23,670
|
|||
|
Income
(loss) from continuing operations
|
(32,579)
|
15,725
|
61,345
|
|||
|
Income
from discontinued operations, net of tax
|
6,453
|
439
|
32,518
|
|||
|
Net
income (loss)
|
$ (26,126)
|
$ 16,164
|
$ 93,863
|
|||
|
Dividends
on preferred shares
|
10,298
|
789
|
-
|
|||
|
Net
income (loss) available to common shareholders
|
$ (36,424)
|
$ 15,375
|
$ 93,863
|
|||
See Accompanying Notes to
Consolidated Financial Statements.
|
MB
FINANCIAL, INC. & SUBSIDIARIES
|
||||||
|
CONSOLIDATED
STATEMENTS OF INCOME
|
||||||
|
Years
Ended December 31, 2009, 2008 and 2007
|
||||||
|
(Amounts
in thousands, except share and per share data)
|
||||||
|
Common
share data:
|
||||||
|
2009
|
2008
|
2007
|
||||
|
Basic
earnings (loss) per common share from continuing
operations
|
$
(0.81)
|
$
0.45
|
$ 1.70
|
|||
|
Basic
earnings per common share from discontinued operations
|
0.16
|
0.01
|
0.91
|
|||
|
Impact
of preferred stock dividends on basic earnings (loss) per common
share
|
(0.26)
|
(0.02)
|
-
|
|||
|
Basis
earnings (loss) per common share
|
(0.91)
|
0.44
|
2.61
|
|||
|
Diluted
earnings (loss) per common share from continuing
operations
|
(0.81)
|
0.45
|
1.68
|
|||
|
Diluted
earnings per common share from discontinued operations
|
0.16
|
0.01
|
0.89
|
|||
|
Impact
of preferred stock dividends on diluted earnings (loss) per common
share
|
(0.26)
|
(0.02)
|
-
|
|||
|
Diluted
earnings (loss) per common share
|
(0.91)
|
0.44
|
2.57
|
|||
|
Weighted
average common shares outstanding
|
40,042,655
|
34,706,092
|
35,919,900
|
|||
|
Diluted
weighted average common shares outstanding
|
40,042,655
|
35,061,712
|
36,439,561
|
See Accompanying Notes to
Consolidated Financial Statements.
|
MB
FINANCIAL, INC. & SUBSIDIARIES
|
|||||||||
|
Years
Ended December 31, 2009, 2008 and 2007
|
|||||||||
|
(Amounts
in thousands, except share and per share data)
|
|||||||||
|
Accumulated
|
|||||||||
|
Other
|
|||||||||
|
Additional
|
Comprehensive
|
Total
Stock-
|
|||||||
|
Comprehensive
|
Preferred
|
Common
|
Paid-in
|
Retained
|
Income
(Loss),
|
Treasury
|
Noncontrolling
|
holders'
|
|
|
Income
|
Stock
|
Stock
|
Capital
|
Earnings
|
Net
of Tax
|
Stock
|
Interest
|
Equity
|
|
|
Balance
at January 1, 2007
|
$
-
|
$
373
|
$
439,502
|
$
437,353
|
$
(7,602)
|
$ (22,674)
|
$ -
|
$
846,952
|
|
|
Net
income
|
$ 93,863
|
93,863
|
93,863
|
||||||
|
Unrealized
holding gains on investment securities,
|
|||||||||
|
net
of tax expense of $6,715
|
12,470
|
||||||||
|
Reclassification
adjustments for losses included in
|
|||||||||
|
net
income, net of tax benefit of ($1,469)
|
2,729
|
||||||||
|
Other
comprehensive income, net of tax
|
15,199
|
15,199
|
15,199
|
||||||
|
Comprehensive
income
|
$ 109,062
|
||||||||
|
Issuance
of 68,695 shares of restricted stock, net of
|
|||||||||
|
forfeitures
and amortization
|
1
|
2,112
|
2,113
|
||||||
|
Purchase
of 2,333,270 shares of treasury stock
|
(77,524)
|
(77,524)
|
|||||||
|
Reissuance
of 2,250 shares of treasury stock for
|
|||||||||
|
employee
stock awards
|
(70)
|
80
|
10
|
||||||
|
Reissuance
of 40,428 shares of treasury stock for
|
|||||||||
|
prior
Company Directors’ fees deferred
|
(819)
|
1,631
|
812
|
||||||
|
Paid-in
capital – stock options
|
2,127
|
2,127
|
|||||||
|
Stock
options exercised - Reissuance of 173,415
|
|||||||||
|
shares
of treasury stock
|
(2,709)
|
6,498
|
3,789
|
||||||
|
Excess
tax benefits from stock-based payment
|
|||||||||
|
arrangements
|
984
|
984
|
|||||||
|
Cash
dividends declared ($0.72 per share)
|
(25,956)
|
(25,956)
|
|||||||
|
Purchase
of 2,276 shares held in trust for
|
|||||||||
|
deferred
compensation plan
|
74
|
(74)
|
-
|
||||||
|
Balance
at December 31, 2007
|
$
-
|
$
374
|
$
441,201
|
$
505,260
|
$
7,597
|
$ (92,063)
|
$
-
|
$
862,369
|
|
|
Net
income
|
$ 16,164
|
16,164
|
129
|
16,293
|
|||||
|
Unrealized
holding gains on investment securities,
|
|||||||||
|
net
of tax expense of $5,410
|
10,048
|
||||||||
|
Reclassification
adjustments for gains included in
|
|||||||||
|
net
income, net of tax expense of ($395)
|
(735)
|
||||||||
|
Other
comprehensive income, net of tax
|
9,313
|
9,313
|
9,313
|
||||||
|
Comprehensive
income
|
$ 25,477
|
||||||||
|
Noncontrolling
interest of acquiree
|
2,500
|
2,500
|
|||||||
|
Issuance
of 126,078 shares of restricted stock, net of
|
|||||||||
|
forfeitures
and amortization
|
1
|
2,227
|
2,228
|
||||||
|
Purchase
of 51,274 shares of treasury stock
|
(1,349)
|
(1,349)
|
|||||||
|
Reissuance
of 13,098 shares of treasury stock for
|
|||||||||
|
employee
stock awards
|
(465)
|
465
|
-
|
||||||
|
Issuance
of 15,867 shares for employee stock awards
|
-
|
||||||||
|
Paid-in
capital – stock options
|
651
|
651
|
|||||||
|
Stock
options exercised - Reissuance of 230,877
|
|||||||||
|
shares
of treasury stock
|
(3,590)
|
8,175
|
4,585
|
||||||
|
Excess
tax benefits from stock-based payment
|
|||||||||
|
arrangements
|
2,032
|
2,032
|
|||||||
|
Issuance
of preferred stock
|
192,944
|
192,944
|
|||||||
|
Issuance
of stock warrant
|
3,056
|
3,056
|
|||||||
|
Dividends
on preferred shares
|
81
|
(789)
|
(708)
|
||||||
|
Restricted
stock unit dividends
|
40
|
(40)
|
-
|
||||||
|
Cash
dividends declared ($0.72 per share)
|
(25,090)
|
(25,090)
|
|||||||
|
Purchase
of 19,271 shares held in trust for
|
|||||||||
|
deferred
compensation plan
|
540
|
(540)
|
-
|
||||||
|
Balance
at December 31, 2008
|
$ 193,025
|
$
375
|
$
445,692
|
$
495,505
|
$
16,910
|
$ (85,312)
|
$ 2,629
|
$ 1,068,824
|
|
(Continued)
|
MB
FINANCIAL, INC. & SUBSIDIARIES
|
|||||||||
|
CONSOLIDATED
STATEMENTS OF CHANGES IN STOCKHOLDERS' EQUITY
|
|||||||||
|
Years
Ended December 31, 2009, 2008 and 2007
|
|||||||||
|
(Amounts
in thousands, except share and per share data)
|
|||||||||
|
Accumulated
|
|||||||||
|
Other
|
|||||||||
|
Additional
|
Comprehensive
|
Total
Stock-
|
|||||||
|
Comprehensive
|
Preferred
|
Common
|
Paid-in
|
Retained
|
Income
(Loss),
|
Treasury
|
Noncontrolling
|
holders'
|
|
|
Income
(loss)
|
Stock
|
Stock
|
Capital
|
Earnings
|
Net
of Tax
|
Stock
|
Interest
|
Equity
|
|
|
Balance
at January 1, 2009
|
$ 193,025
|
$ 375
|
$ 445,692
|
$ 495,505
|
$ 16,910
|
$ (85,312)
|
$ 2,629
|
$ 1,068,824
|
|
|
Net
income (loss)
|
$
(26,126)
|
(26,126)
|
166
|
(25,960)
|
|||||
|
Unrealized
holding losses on investment securities,
|
|||||||||
|
net
of tax benefit of $1,301
|
(4,195)
|
||||||||
|
Reclassification
adjustments for gains included in
|
|||||||||
|
net
income, net of tax expense of ($6,860)
|
(7,169)
|
||||||||
|
Other
comprehensive loss, net of tax
|
(11,364)
|
(11,364)
|
(11,364)
|
||||||
|
Comprehensive
loss
|
$
(37,490)
|
||||||||
|
Reissuance
of 328,070 shares of treasury stock, for
|
|||||||||
|
restricted
stock awards, net of forfeitures and amortization
|
2,684
|
(10,660)
|
10,660
|
2,684
|
|||||
|
Issuance
of 21,305 shares of common stock for restricted
|
|||||||||
|
stock
awards
|
-
|
-
|
-
|
||||||
|
Restricted
stock vested - tax effect from change in
|
|||||||||
|
market
value
|
(403)
|
(403)
|
|||||||
|
Purchase
of 9,099 shares of treasury stock
|
(130)
|
(130)
|
|||||||
|
Reissuance
of 4,985 shares of treasury stock for
|
|||||||||
|
employee
stock awards
|
(55)
|
(107)
|
162
|
-
|
|||||
|
Paid-in
capital – stock options
|
2,426
|
2,426
|
|||||||
|
Stock
options exercised - Reissuance of 46,349
|
|||||||||
|
shares
of treasury stock
|
96
|
(835)
|
1,173
|
434
|
|||||
|
Tax
effect of expired non-qualified stock options
|
(207)
|
(207)
|
|||||||
|
Excess
tax benefits from stock-based payment
|
|||||||||
|
arrangements
|
28
|
28
|
|||||||
|
Issuance
of 13,545,671 shares of common stock,
|
|||||||||
|
net
of issuance costs
|
136
|
206,245
|
206,381
|
||||||
|
Reissuance
of 2,120,761 shares of treasury stock for
|
-
|
||||||||
|
Dividend
Reinvestment and Stock Purchase Plan
|
(46,851)
|
70,812
|
23,961
|
||||||
|
Dividends
and discount accretion on preferred shares
|
497
|
(10,298)
|
(9,801)
|
||||||
|
Restricted
stock unit dividends
|
9
|
(9)
|
-
|
||||||
|
Cash
dividends declared ($0.15 per share)
|
(5,449)
|
(5,449)
|
|||||||
|
Distributions
to noncontrolling interest
|
(244)
|
(244)
|
|||||||
|
Purchase
of 12,826 shares held in trust for
|
|||||||||
|
deferred
compensation plan
|
80
|
(80)
|
-
|
||||||
|
Balance
at December 31, 2009
|
$ 193,522
|
$ 511
|
$ 656,595
|
$ 395,170
|
$
5,546
|
$ (2,715)
|
$ 2,551
|
$ 1,251,180
|
|
|
See
Accompanying Notes to Consolidated Financial
Statements.
|
|
MB
FINANCIAL, INC. & SUBSIDIARIES
|
|||||
|
Years
Ended December 31, 2009, 2008 and 2007
|
|||||
|
(Amounts
in Thousands)
|
|||||
|
2009
|
2008
|
2007
|
|||
|
Cash
Flows From Operating Activities
|
|||||
|
|
$
(26,126)
|
$ 16,164
|
$
93,863
|
||
|
Net
income from discontinued operations
|
(6,453)
|
(439)
|
(32,518)
|
||
|
Adjustments
to reconcile net income (loss) to net cash provided by
continuing operating activities:
|
|||||
|
Depreciation
on premises and equipment
|
11,776
|
11,743
|
11,179
|
||
|
Depreciation
on leased equipment
|
38,267
|
31,995
|
26,097
|
||
|
Impairment
charges on branch facilities
|
4,000
|
-
|
-
|
||
|
Amortization
of restricted stock awards
|
2,684
|
2,228
|
2,113
|
||
|
Compensation
expense for stock option grants
|
2,454
|
651
|
3,110
|
||
|
(Gain)
loss on sales of premises and equipment and leased
equipment
|
382
|
382
|
(11,683)
|
||
|
Amortization
of other intangibles
|
4,491
|
3,554
|
3,504
|
||
|
Provision
for loan losses
|
231,800
|
125,721
|
19,313
|
||
|
Deferred
income tax expense (benefit)
|
5,525
|
(22,574)
|
(683)
|
||
|
Amortization
of premiums and discounts on investment securities, net
|
13,839
|
3,519
|
2,274
|
||
|
Accretion
of premiums and discounts on loans, net
|
(1,362)
|
(2,732)
|
(3,272)
|
||
|
Net
(gain) loss on sale of investment securities
|
(14,029)
|
(1,130)
|
3,744
|
||
|
Proceeds
from sale of loans held for sale
|
109,560
|
44,108
|
61,794
|
||
|
Origination
of loans held for sale
|
(108,434)
|
(43,586)
|
(60,994)
|
||
|
Net
gain on sale of loans held for sale
|
(1,126)
|
(522)
|
(800)
|
||
|
Net
gains on acquisitions
|
(28,547)
|
-
|
-
|
||
|
Increase
in cash surrender value of life insurance
|
(2,420)
|
(2,836)
|
(2,556)
|
||
|
(Increase)
decrease in other assets
|
(66,537)
|
(36,484)
|
9,460
|
||
|
(Decrease)
increase in other liabilities, net
|
(28,556)
|
17,475
|
17,092
|
||
|
Net
cash provided by continuing operating activities
|
141,188
|
147,237
|
141,037
|
||
|
Cash
Flows From Investing Activities
|
|||||
|
Proceeds
from sales of investment securities available for sale
|
2,178,910
|
14,806
|
315,837
|
||
|
Proceeds
from maturities and calls of investment securities available for
sale
|
389,775
|
351,420
|
409,777
|
||
|
Purchase
of investment securities available for sale
|
(2,167,106)
|
(513,396)
|
(317,653)
|
||
|
Net
increase in loans
|
(197,730)
|
(657,026)
|
(654,054)
|
||
|
Purchases
of premises and equipment
|
(9,471)
|
(15,440)
|
(17,238)
|
||
|
Purchases
of leased equipment
|
(59,436)
|
(61,050)
|
(47,397)
|
||
|
Proceeds
from sales of premises and equipment
|
507
|
129
|
21,842
|
||
|
Proceeds
from sales of leased equipment
|
3,345
|
3,164
|
6,597
|
||
|
Principal
paid on lease investments
|
(119)
|
(1,099)
|
(774)
|
||
|
Cash
proceeds received from sale of bank subsidiary
|
-
|
-
|
76,148
|
||
|
Net
cash proceeds received in FDIC assisted transactions
|
4,673,246
|
-
|
-
|
||
|
Cash
paid, net of cash and cash equivalents in acquisitions
|
-
|
(9,333)
|
-
|
||
|
Net
cash provided by (used in) continuing investing activities
|
4,811,921
|
(887,825)
|
(206,915)
|
||
|
Cash
Flows From Financing Activities
|
|||||
|
Net
(decrease) increase in deposits
|
(4,804,285)
|
981,788
|
(66,770)
|
||
|
Net
(decrease) increase in short-term borrowings
|
(171,733)
|
(489,102)
|
210,117
|
||
|
Proceeds
from long-term borrowings
|
4,962
|
285,384
|
51,530
|
||
|
Principal
paid on long-term borrowings
|
(145,078)
|
(22,783)
|
(9,445)
|
||
|
Proceeds
from junior subordinated notes issued to capital trusts
|
-
|
-
|
52,500
|
||
|
Principal
paid on junior subordinated notes issued to capital trusts
|
-
|
-
|
(71,800)
|
||
|
Issuance
of common stock, net of issuance costs
|
206,381
|
-
|
-
|
||
|
Issuance
of preferred stock
|
-
|
192,944
|
-
|
||
|
Issuance
of common stock warrant
|
-
|
3,056
|
-
|
||
|
Treasury
stock transactions, net
|
23,961
|
(1,348)
|
(76,703)
|
||
|
Stock
options exercised
|
1,269
|
4,585
|
3,789
|
||
|
Excess
tax benefits from share-based payment arrangements
|
28
|
2,032
|
984
|
||
|
Dividends
paid on preferred stock
|
(9,256)
|
-
|
-
|
||
|
Dividends
paid on common stock
|
(5,449)
|
(25,090)
|
(25,956)
|
||
|
Net
cash (used in) provided by continuing financing activities
|
(4,899,200)
|
931,466
|
68,246
|
||
|
Net
increase in cash and cash equivalents from continuing
operations
|
$
53,909
|
$ 190,878
|
$
2,368
|
||
|
Cash
Flows From Discontinued Operations
|
|||||
|
Net cash
provided by operating activities of discontinued
operations
|
6,453
|
439
|
6,497
|
||
|
Net cash
used in investing activities of discontinued operations
|
-
|
-
|
(21,191)
|
||
|
Net cash
provided by financing activities of discontinued
operations
|
-
|
-
|
2,617
|
||
|
Net
cash provided by (used in) discontinued operations
|
6,453
|
439
|
(12,077)
|
||
|
Net
increase/(decrease) in cash and cash equivalents
|
$
60,362
|
$ 191,317
|
$ (9,709)
|
||
|
Cash
and cash equivalents:
|
|||||
|
Beginning
of year (1)
|
341,658
|
150,341
|
160,050
|
||
|
End
of year
|
$
402,020
|
$
341,658
|
$
150,341
|
||
| (1) Includes balances from discontinued operations |
$
-
|
$
-
|
$ 12,757
|
|
(continued)
|
|
MB
FINANCIAL, INC. & SUBSIDIARIES
|
||||||
|
CONSOLIDATED
STATEMENTS OF CASH FLOWS (continued)
|
||||||
|
Years
Ended December 31, 2009, 2008 and 2007
|
||||||
|
(Amounts
in Thousands)
|
||||||
|
2009
|
2008
|
2007
|
||||
|
Supplemental
Disclosures of Cash Flow Information:
|
||||||
|
Cash
payments for:
|
||||||
|
Interest
paid to depositors and other borrowed funds
|
$
152,624
|
$
190,266
|
$
249,292
|
|||
|
Net
income tax (refunds) payments
|
(12,456)
|
12,767
|
35,642
|
|||
|
Supplemental
Schedule of Noncash Investing Activities:
|
||||||
|
Loans
transferred to other real estate owned
|
$
46,992
|
$ 6,327
|
$
1,249
|
|||
|
Loans
transferred to repossessed vehicles
|
1,944
|
1,519
|
681
|
|||
|
Loans
securitized transferred to investment securities available for
sale
|
-
|
50,914
|
-
|
|||
|
Long-term
borrowings reclassified to short-term borrowings
|
-
|
-
|
79,100
|
|||
|
Supplemental
Schedule of Noncash Investing Activities:
|
||||||
|
Acquisitions
|
||||||
|
Noncash
assets acquired:
|
||||||
|
Investment
securities available for sale
|
$ 1,931,617
|
$
-
|
$
-
|
|||
|
Loans,
net of discount
|
295,620
|
-
|
-
|
|||
|
Other
real estate owned, net of discount
|
16,199
|
- | - | |||
|
Premises
and equipment, net
|
-
|
72
|
-
|
|||
|
Goodwill,
net
|
-
|
8,022
|
-
|
|||
|
Other
intangibles, net
|
16,422
|
3,978
|
-
|
|||
|
FDIC
indemnification asset
|
94,179
|
-
|
-
|
|||
|
Other
assets
|
12,679
|
828
|
-
|
|||
|
Total
noncash assets acquired:
|
$ 2,366,716
|
$ 12,900
|
$
-
|
|||
|
Liabilities
assumed:
|
||||||
|
Deposits
|
$ 6,991,990
|
$
-
|
$
-
|
|||
|
Short-term
borrowings
|
7,031
|
-
|
-
|
|||
|
Accrued
expenses and other liabilities
|
12,394
|
1,067
|
-
|
|||
|
Total
liabilities assumed:
|
$ 7,011,415
|
$ 1,067
|
$
-
|
|||
|
Net
noncash assets acquired:
|
$ (4,644,699)
|
$
11,833
|
$
-
|
|||
|
Cash
and cash equivalents acquired
|
$ 4,673,246
|
$ 667
|
$
-
|
|||
|
Noncontrolling
interest
|
$
-
|
$
2,500
|
$
-
|
|||
|
Net
gains recorded on acquisitions
|
$ 28,547
|
$ -
|
$
-
|
See Accompanying Notes to Consolidated Financial Statements.
MB FINANCIAL,
INC. AND SUBSIDIARIES
MB
Financial, Inc. (the Company, we, us, our) is a financial holding company
providing a full range of financial services to individuals and corporate
customers through its banking subsidiary, MB Financial Bank, N.A.
The
Company’s primary market is the Chicago, Illinois metropolitan area, in which
the Company operates 86 banking offices through MB Financial Bank,
N.A. MB Financial Bank, N.A. also has one banking office in
Philadelphia, Pennsylvania.
MB
Financial Bank N.A., our largest subsidiary, has six wholly owned subsidiaries
with significant operating activities: MB Financial Center, LLC; MB Financial
Community Development Corporation; MBRE Holdings, LLC; LaSalle Systems Leasing,
Inc.; Vision Investment Services, Inc.; and Ashland Management Agency,
Inc.; MB Financial Bank also has a majority owned subsidiary with
significant operating activities, Cedar Hill Associates, LLC.
Basis of Financial Statement
Presentation: The consolidated financial statements include the accounts
of the Company and its subsidiaries. Significant intercompany items
and transactions have been eliminated in consolidation. The
accounting and reporting policies of the Company conform to accounting
principles generally accepted in the United States of America and general
practices within the financial services industry. In accordance with
applicable accounting standards, the Company does not consolidate statutory
trusts established for the sole purpose of issuing trust preferred securities
and related trust common securities. See Note
13 below for more detail. In preparing the financial statements,
management is required to make estimates and assumptions that affect the
reported amounts of assets and liabilities as of the date of the balance sheet
and revenues and expenses for the year. Actual results could differ
from those estimates. Areas involving the use of management's
estimates and assumptions, which are more susceptible to change in the near term
include the allowance for loan losses; residual value of direct finance,
leveraged, and operating leases; income tax accounting; and fair value
measurements for assets and liabilities.
The
Financial Accounting Standards Board’s (FASB) Accounting Standards Codification
(ASC) became effective on July 1, 2009. At that date, the ASC became
FASB’s officially recognized source of authoritative U.S. GAAP applicable to all
public and non-public non-governmental entities, superseding existing FASB,
American Institute of Certified Public Accountants (AICPA), Emerging Issues Task
Force (EITF) and related literature. Rules and interpretive releases
of the SEC under the authority of federal securities laws are also sources of
authoritative GAAP for SEC registrants. All other accounting
literature is considered non-authoritative. The switch to the ASC
affects the way companies refer to U.S. GAAP in financial statements and
accounting policies. Citing particular content in the ASC involves
specifying the unique numeric path to the content through the Topic, Subtopic,
Section and Paragraph structure.
On August
10, 2009, the Company sold its merchant card processing
business. This divestiture is accounted for in the accompanying
financial statements as discontinued operations. Please see Note 3 to the notes to the audited consolidated financial
statements for more detail.
On
November 28, 2007, the Company sold Union Bank to Olney Bancshares of Texas,
Inc. This divestiture is accounted for in the accompanying financial
statements as discontinued operations. Please see Note 3 to the notes to the audited consolidated financial
statements for more detail.
Cash and cash
equivalents: For purposes of reporting cash flows, cash and cash
equivalents includes cash on hand, amounts due from banks (including cash items
in process of clearing), interest-bearing deposits with banks, with original
maturities of ninety days or less, and federal funds sold.
Investment securities
available for sale: Securities classified as available for sale are those
securities that the Company intends to hold for an indefinite period of time,
but not necessarily to maturity. Any decision to sell a security
classified as available for sale is based on various factors, including
significant movements in interest rates, changes in the maturity mix of assets
and liabilities, liquidity needs, regulatory capital considerations, and other
factors.
Securities
available for sale are reported at fair value with unrealized gains or losses
reported as accumulated other comprehensive income, net of the related deferred
tax effect. The historical cost of debt securities is adjusted for
amortization of premiums and accretion of discounts over the estimated life of
the security, using the level-yield method. In determining the
estimated life of a mortgage-related security, certain judgments are required as
to the timing and amount of future principal prepayments. These
judgments are made based upon the actual performance of the underlying security
and the general market consensus regarding changes in mortgage interest rates
and underlying prepayment estimates. Amortization of premium and
accretion of discount is included in interest income from the related
security. Realized gains or losses, determined on the basis of the
cost of specific securities sold, are included in earnings. The
Company evaluates the portfolio for impairment each quarter. In
estimating other-than-temporary losses, the Company considers the length of time
and the extent to which the fair value has been less than cost, the financial
condition and near-term prospects of the issuer, and whether the Company is more
likely than not to sell the security before recovery of its cost
basis. If a security has been impaired for more than twelve months,
and the impairment is deemed other than temporary and material, a write down
will occur in that quarter. If a loss is deemed to be
other-than-temporary, it is recognized as a realized loss in the income
statement with the security assigned a new cost basis.
MB FINANCIAL,
INC. AND SUBSIDIARIES
NOTES TO
CONSOLIDATED FINANCIAL STATEMENTS
Federal Home Loan Bank and
Federal Reserve Bank stock: The Company owns investments in the stock of
the Federal Reserve Bank (“FRB”) and the Federal Home Loan Bank of Chicago
(“FHLBC”). No ready market exists for these stocks and they have no quoted
market values. FRB stock is redeemable at par; therefore, market value equals
cost. The Bank, as a member of the FHLBC, is required to maintain an investment
in the capital stock of the FHLBC. The stock is redeemable at par by the FHLBC,
and is therefore, carried at cost and periodically evaluated for
impairment. The Company records dividends in income on the
ex-dividend date.
Loans held for sale:
Mortgage loans originated and intended for sale in the secondary market are
carried at the lower of cost or estimated market value in the
aggregate. Gains and losses recognized on mortgage loans held for
sale include the value of the mortgage servicing rights if the loan is sold with
servicing retained by the Company. Mortgage servicing rights are
stratified based on the predominant risk characteristics of rates, terms, and
the underlying loan types to measure its fair value. The amount of
impairment recognized is the amount by which the capitalized mortgage servicing
rights for a stratum exceed their fair value.
Loans and leases:
Loans are stated at the amount of unpaid principal reduced by the allowance for
loan losses and unearned income. Direct finance and leveraged leases
are included as lease loans for financial statement purposes. Direct
finance leases are stated as the sum of remaining minimum lease payments from
lessees plus estimated residual values less unearned lease
income. Leveraged leases are stated at the sum of remaining minimum
lease payments from lessees (less nonrecourse debt payments) plus estimated
residual values less unearned lease income. On a monthly basis,
management reviews the lease residuals for potential
impairment. Unearned lease income on direct finance and leveraged
leases is recognized over the lives of the leases using the level-yield
method.
Loan
origination and commitment fees and certain direct loan origination costs are
deferred and the net amount amortized as an adjustment of the related loan's
yield. The Company is amortizing these amounts over the contractual
life of the loan. Commitment fees based upon a percentage of a
customer's unused line of credit and fees related to standby letters of credit
are recognized over the commitment period.
Interest
income is accrued daily on the Company’s outstanding loan
balances. The accrual of interest on loans is discontinued at the
time the loan is 90 days past due unless the credit is well-secured and in
process of renewal or collection. Past due status is based on
contractual terms of the loan. In all cases, loans are placed on
non-accrual or charged-off at an earlier date if collection of principal or
interest is considered doubtful. All interest accrued but not
collected for loans that are placed on non-accrual or charged-off is reversed
against interest income. Loans renegotiated in troubled debt
restructurings are those loans on which concessions in terms have been granted
because of a borrower’s financial difficulty.
For
impaired loans, accrual of interest is discontinued on a loan when management
believes, after considering collection efforts and other factors, the borrower's
financial condition is such that collection of interest is
doubtful. Impaired loans also include loans that have been
renegotiated in a troubled debt restructuring. Cash collections on
impaired loans are credited to the loan balance, and no interest income is
recognized on those loans until the principal balance has been determined to be
collectible. Loans, other than those included in large groups of
smaller-balance homogeneous loans, are considered impaired when it is probable
the Company will be unable to collect all contractual principal and interest
payments due in accordance with the terms of the loan
agreement. Impaired loans are measured based on the present value of
expected future cash flows discounted at the loan's effective interest rate or,
as a practical expedient, at the loan's observable market price or the fair
value of the collateral if the loan is collateral dependent. The
amount of impairment, if any, and any subsequent changes are charged against the
allowance for loan losses.
MB FINANCIAL,
INC. AND SUBSIDIARIES
NOTES TO
CONSOLIDATED FINANCIAL STATEMENTS
Loans Acquired Through
Transfer: Loans acquired through the completion of a transfer, including
loans that have evidence of deterioration of credit quality since origination
and for which it is probable, at acquisition, that the Company will be unable to
collect all contractually required payments receivable, are initially recorded
at fair value (as determined by the present value of expected future cash flows)
with no valuation allowance. Loans are evaluated individually to determine if
there is evidence of deterioration of credit quality since
origination. Loans where there is evidence of deterioration of credit
quality since origination may be aggregated and accounted for as a pool of loans
if the loans being aggregated have common risk characteristics. The
difference between the undiscounted cash flows expected at acquisition and the
investment in the loan, or the “accretable yield,” is recognized as interest
income on a level-yield method over the life of the loan. Contractually required
payments for interest and principal that exceed the undiscounted cash flows
expected at acquisition, or the “nonaccretable difference,” are not recognized
as a yield adjustment or as a loss accrual or a valuation allowance. Increases
in expected cash flows subsequent to the initial investment are recognized
prospectively through adjustment of the yield on the loan over its remaining
life. Decreases in expected cash flows are recognized as impairment. If the
Company does not have the information necessary to reasonably estimate cash
flows to be expected, it may use the cost recovery method or cash basis method
of income recognition. Valuation allowances on these impaired loans
reflect only losses incurred after the acquisition (meaning the present value of
all cash flows expected at acquisition that ultimately are not to be
received).
For
purchased loans acquired on or after January 1, 2009 that are not deemed
impaired at acquisition, credit discounts representing the principal losses
expected over the life of the loan are a component of the initial fair value.
Loans may be aggregated and accounted for as a pool of loans if the loans being
aggregated have common risk characteristics. Subsequent to the purchase
date, the methods utilized to estimate the required allowance for credit losses
for these loans is similar to originated loans; however, the Company records a
provision for loan losses only when the required allowance, net of any expected
reimbursement under any loss sharing agreements with the FDIC, exceeds any
remaining credit discounts. The remaining differences between the purchase price
and the unpaid principal balance at the date of acquisition are recorded in
interest income over the life of the loans.
Lease investments:
The Company's investment in assets leased to others is reported as lease
investments, net, and accounted for as operating leases. Rental
income on operating leases is recognized as income over the lease term according
to the provisions of the lease, which is generally on a straight-line
basis. The investment in equipment in operating leases is stated at
cost less depreciation using the straight-line method generally over a life of
five years or less.
Premises and
equipment: Premises and equipment are carried at cost less accumulated
depreciation and amortization. Depreciation and amortization is
computed by the straight-line method over the estimated useful lives of the
assets. Useful lives range from five to ten years for furniture and
equipment, and five to thirty-nine years for buildings and building
improvements. Land improvements are amortized over a period of
fifteen years and leasehold improvements are amortized over the term of the
related lease or the estimated useful lives of the improvements, whichever is
shorter. Land is not subject to depreciation. Maintenance
and repairs are charged to expense as incurred, while major improvements are
capitalized and amortized to operating expense over their identified useful
lives. Premises and equipment and other long-lived assets are tested
for impairment whenever events or changes in circumstances indicate the carrying
amount of the assets may not be recoverable from future undiscounted cash
flows. If impaired, the assets are recorded at fair
value. During 2009, the Company conducted an impairment review of
branch office locations to be consolidated due to the Company’s acquisitions in
2009 (see Note 2 below). As a result, the
Company recognized a $4.0 million impairment charge related to three branches in
2009.
MB FINANCIAL,
INC. AND SUBSIDIARIES
NOTES TO
CONSOLIDATED FINANCIAL STATEMENTS
Cash surrender value of life
insurance: The Company has purchased bank-owned life insurance policies
on certain executives. Bank-owned life insurance is recorded at its
cash surrender value. Changes in the cash surrender values are
included in non-interest income.
Goodwill: The excess of the cost of
an acquisition over the fair value of the net assets acquired consists of
goodwill, and core deposit and client relationship intangibles. See
Note 9 to the Consolidated Financial Statements for further
information regarding core deposit and client relationship
intangibles. Under the provisions of ASC Topic 350, goodwill is
subject to at least annual assessments for impairment by applying a fair value
based test. The Company reviews goodwill and other intangible assets
to determine potential impairment annually, or more frequently if events and
circumstances indicate that the asset might be impaired, by comparing the
carrying value of the asset with the anticipated future cash flows.
The
Company’s annual assessment date is as of December 31. At December
31, 2009, the Company’s stock price was trading below its book
value. However, as of December 31, 2009, the anticipated cash flows
exceeded the carrying value, and no impairment loss was recognized in
2009. No impairment losses were recognized in 2008 or
2007. Goodwill is tested for impairment at the reporting unit
level. A reporting unit is a majority owned subsidiary of the Company
for which discrete financial information is available and regularly reviewed by
management. MB Financial Bank, LaSalle, and Cedar Hill are currently
the Company’s only applicable reporting units for purposes of testing goodwill
impairment.
Other intangibles:
The Company’s other intangible assets consist of core deposit intangibles
obtained through acquisitions. Core deposit intangibles (the portion
of an acquisition purchase price which represents value assigned to the existing
deposit base) have finite lives and are amortized by the declining balance
method over four to fifteen years. Other intangible assets are tested
for impairment whenever events or changes in circumstances indicate that the
carrying amount of the assets may not be recoverable from future undiscounted
cash flows. If impaired, the assets are recorded at fair
value.
FDIC indemnification
asset: As part of the Heritage and Benchmark transactions (see Note 2
below for further information regarding these transactions), the Company entered
into loss sharing agreements with the FDIC. These agreements cover realized
losses on loans and foreclosed real estate. These loss sharing assets are
measured separately from the loan portfolios because they are not contractually
embedded in the loans and are not transferable with the loans should the Company
choose to dispose of them. Fair values at the acquisition dates were estimated
based on projected cash flows available for loss sharing based on the credit
adjustments estimated for each loan pool and the loss sharing percentages.
The loss sharing assets are also separately measured from the related foreclosed
real estate. Although these assets are contractual receivables from the
FDIC, there are no contractual interest rates.
Preferred stock:
Preferred stock callable at the option of the Company is initially recorded at
the amount of proceeds received. Any discount from the liquidation
value is accreted to the expected call date and charged to retained
earnings. This accretion is recorded using the level-yield
method. Preferred dividends paid (declared and accrued) and any
accretion is deducted from net income for computing income available to common
shareholders and earnings per share computations.
MB FINANCIAL,
INC. AND SUBSIDIARIES
NOTES TO
CONSOLIDATED FINANCIAL STATEMENTS
Treasury stock:
Treasury stock is recorded at acquisition cost. Gains and losses on disposition
are recorded as increases or decreases to additional paid-in capital with losses
in excess of previously recorded gains charged directly to retained
earnings.
Derivative Financial
Instruments and Hedging Activities: ASC Topic 815 establishes accounting
and reporting standards requiring that every derivative instrument (including
certain derivative instruments embedded in other contracts) be recorded in the
balance sheet as either an asset or liability measured at its fair
value. ASC Topic 815 requires that changes in the derivative's fair
value be recognized currently in earnings unless specific hedge accounting
criteria are met. Special accounting for qualifying hedges allows a
derivative's gains and losses to offset related results on the hedged item in
the income statement, and requires that a company must formally document,
designate and assess the effectiveness of transactions that receive hedge
accounting.
All derivatives are recognized on the consolidated balance sheet
at their fair value. On the date the derivative contract is entered
into, the Company designates the derivative as either a fair value hedge (i.e. a
hedge of the fair value of a recognized asset or liability) or a cash flow hedge
(i.e. a hedge of the variability of cash flows to be received or paid related to
a recognized asset or liability). The Company formally documents all
relationships between hedging instruments and hedging items, as well as its risk
management objective and strategy for undertaking various hedge
transactions. This process includes linking all derivatives that are
designated as fair value hedges or cash flow hedges to specific assets or
liabilities on the balance sheet. The Company also formally assesses,
both at the hedge's inception and on an ongoing basis, whether the derivatives
that are used in hedging transactions are highly effective in offsetting changes
in fair values or cash flows of hedged items. If it is determined
that a derivative is not highly effective as a hedge or that it has ceased to be
a highly effective hedge, the Company discontinues hedge accounting
prospectively.
For a
derivative designated as a fair value hedge, the changes in the fair value of
the derivative and of the hedged item attributable to the hedged risk are
recognized in earnings. If the derivative is designated as a cash
flow hedge, the effective portions of changes in the fair value of the
derivative are recorded in other comprehensive income and are recognized in the
income statement when the hedged item affects earnings. Ineffective
portions of changes in the fair value of cash flow hedges are recognized in
earnings.
The
Company discontinues hedge accounting prospectively when it is determined that
the derivative is no longer effective in offsetting changes in the fair value or
cash flows of the hedged item, the derivative expires or is sold, terminated, or
exercised, the derivative is designated as a hedging instrument, or management
determines that designation of the derivative as a hedging instrument is no
longer appropriate. When hedge accounting is discontinued because it
is determined that the derivative no longer qualifies as an effective fair value
hedge, the Company continues to carry the derivative on the balance sheet at its
fair value, and no longer adjusts the hedged asset or liability for changes in
fair value. The adjustment of the carrying amount of the hedged asset
or liability is accounted for in the same manner as other components of the
carrying amount of that asset or liability.
Transfers of financial
assets: Transfers of financial assets are accounted for as sales, when
control over the assets has been surrendered. Control over
transferred assets is deemed to be surrendered when the assets have been
isolated from the Company, the transferee obtains the right (free of conditions
that constrain it from taking advantage of the right) to pledge or exchange the
transferred assets, and the Company does not maintain effective control over the
transferred assets through an agreement to repurchase them before their
maturity.
Sale of Maintenance
Contracts: LaSalle Business Solutions (LBS) sells third party maintenance
to customers. The maintenance is serviced by third party providers,
with LBS maintaining no legal obligation under the contract to perform
additional services. Revenues are recorded net of cost of sales, as
LBS is viewed as an agent under ASC Topic 605, accepting minimal credit risk,
maintaining no obligation to perform maintenance under the contracts and having
no control over selection of the maintenance supplier.
Asset Management and Trust
assets: Assets of the asset management and trust department, other than
trust cash on deposit at MB Financial Bank, are not included in these
consolidated financial statements because they are not assets of the
Bank.
MB FINANCIAL,
INC. AND SUBSIDIARIES
NOTES TO
CONSOLIDATED FINANCIAL STATEMENTS
Stock-based
compensation: The Company accounts for its equity awards in accordance
with ASC Topic 718. ASC Topic 718 requires public companies to
recognize compensation expense related to stock-based equity awards in their
income statements. See Note 20 below for more
information.
Income taxes:
Deferred taxes are provided on a liability method whereby deferred tax assets
are recognized for deductible temporary differences and operating loss
carryforwards, and tax credit carryforwards and deferred tax liabilities are
recognized for taxable temporary differences. Temporary differences
are the differences between the reported amounts of assets and liabilities and
their tax bases. Deferred tax assets are reduced by a valuation
allowance when, in the opinion of management, it is more likely than not that
some portion or all of the deferred tax assets will not be
realized. Deferred tax assets and liabilities are adjusted for the
effects of changes in tax laws and rates on the date of
enactment.
Basic and Diluted Earnings Per Common Share: Earnings (loss) per
common share is computed using the two-class method. Basic earnings
(loss) per common share is computed by dividing net income by the
weighted-average number of common shares outstanding during the applicable
period, excluding outstanding participating securities. Participating
securities include non-vested restricted stock awards and restricted stock
units, though no actual shares of common stock related to restricted stock units
have been issued. Non-vested restricted stock awards and restricted
stock units are considered participating securities to the extent holders of
these securities receive non-forfeitable dividends or dividend equivalents at
the same rate as holders of the Company’s common stock. Diluted
earnings per share is computed using the weighted-average number of shares
determined for the basic earnings per common share computation plus the dilutive
effect of stock compensation using the treasury stock method. Due to
the net loss for the year ended December 31, 2009, all of the dilutive stock
based awards are considered anti-dilutive and not included in the computation of
diluted earnings (loss) per share. All previously reported earnings
per share data has been retrospectively adjusted to conform to the new
computation method.
The
following table presents a reconciliation of the number of shares used in the
calculation of basic and diluted earnings (loss) per common share (amounts in
thousands, except common share data).
|
Years
Ended
|
|||||
|
December
31,
|
|||||
|
2009
|
2008
|
2007
|
|||
|
Distributed
earnings allocated to common stock
|
$ 5,419
|
$
24,953
|
$
25,867
|
||
|
Undistributed
earnings (loss) allocated to common stock
|
(37,832)
|
(9,314)
|
35,265
|
||
|
Net
earnings (loss) from continuing operations allocated to common
stock
|
(32,413)
|
15,639
|
61,132
|
||
|
Net
earnings from discontinued operations allocated to common
stock
|
6,453
|
439
|
32,518
|
||
|
Less:
Preferred stock dividends and discount accretion
|
10,298
|
789
|
-
|
||
|
Net
earnings (loss) allocated to common stock
|
(36,258)
|
15,289
|
93,650
|
||
|
Net
earnings (loss) allocated to participating securities
|
(166)
|
86
|
213
|
||
|
Net
income (loss) allocated to common stock and participating
securities
|
$ (36,424)
|
$
15,375
|
$
93,863
|
||
|
Weighted
average shares outstanding for basic earnings per common
share
|
40,042,655
|
34,706,092
|
35,919,900
|
||
|
Dilutive
effect of stock compensation
|
-
|
355,620
|
519,661
|
||
|
Weighted
average shares outstanding for diluted earnings per common
share
|
40,042,655
|
35,061,712
|
36,439,561
|
||
|
Basic
earnings (loss) per common share from continuing
operations
|
$ (0.81)
|
$
0.45
|
$
1.70
|
||
|
Basic
earnings per common share from discontinued operations
|
$
0.16
|
$
0.01
|
$
0.91
|
||
|
Impact
of preferred stock dividends on basic earnings (loss) per common
share
|
$
(0.26)
|
$
(0.02)
|
$
-
|
||
|
Basic
earnings (loss) per common share
|
$
(0.91)
|
$
0.44
|
$
2.61
|
||
|
Diluted
earnings (loss) per common share from continuing
operations
|
$ (0.81)
|
$
0.45
|
$
1.68
|
||
|
Diluted
earnings per common share from discontinued operations
|
$
0.16
|
$
0.01
|
$
0.89
|
||
|
Impact
of preferred stock dividends on diluted earnings (loss) per common
share
|
$
(0.26)
|
$
(0.02)
|
$
-
|
||
|
Diluted
earnings (loss) per common share
|
$
(0.91)
|
$
0.44
|
$
2.57
|
||
MB FINANCIAL,
INC. AND SUBSIDIARIES
NOTES TO
CONSOLIDATED FINANCIAL STATEMENTS
Comprehensive income:
Comprehensive income consists of net income and other comprehensive
income. Other comprehensive income includes unrealized gains and
losses on securities available-for-sale, net of deferred taxes, which are
reported as a separate component of stockholders’ equity on the consolidated
balance sheet.
Segment Reporting:
The Company has one reportable segment. The Company’s chief operating
decision-makers use consolidated results to make operating and strategic
decisions.
New authoritative accounting
guidance: As noted above, on July 1, 2009, the Accounting Standards
Codification became FASB’s officially recognized source of authoritative U.S.
generally accepted accounting principles applicable to all public and non-public
non-governmental entities, superseding existing FASB, AICPA, EITF and related
literature. Rules and interpretive releases of the SEC under the
authority of federal securities laws are also sources of authoritative GAAP for
SEC registrants. All other accounting literature is considered
non-authoritative. The switch to the ASC affects the way companies
refer to U.S. GAAP in financial statements and accounting
policies. Citing particular content in the ASC involves specifying
the unique numeric path to the content through the Topic, Subtopic, Section and
Paragraph structure.
ASC Topic 260, “Earnings Per Share.” On January 1, 2009, the Company
adopted new authoritative accounting guidance under ASC Topic 260,
“Earnings Per Share,” which provides that unvested share-based payment awards
that contain nonforfeitable rights to dividends or dividend equivalents (whether
paid or unpaid) are participating securities and shall be included in the
computation of earnings per share pursuant to the two-class method, as discussed
above. The adoption of this guidance did not significantly impact the
Company’s previously reported financial statements.
ASC Topic 320, “Investments—Debt and Equity Securities.” New
authoritative accounting guidance under ASC Topic 320, “Investments—Debt
and Equity Securities,” (i) changes existing guidance for determining
whether an impairment is other than temporary to debt securities and
(ii) replaces the existing requirement that the entity’s management assert
it has both the intent and ability to hold an impaired security until recovery
with a requirement that management assert: (a) it does not have the intent
to sell the security; and (b) it is more likely than not it will not have
to sell the security before recovery of its cost basis. Under ASC
Topic 320, declines in the fair value of held-to-maturity and
available-for-sale securities below their cost that are deemed to be other than
temporary are reflected in earnings as realized losses to the extent the
impairment is related to credit losses. The amount of the impairment related to
other factors is recognized in other comprehensive income. The Company adopted
the provisions of the new authoritative accounting guidance under ASC
Topic 320 during the first quarter of 2009. Adoption of the new guidance
did not significantly impact the Company’s financial statements.
ASC Topic 805, “Business Combinations.” On January 1, 2009, new
authoritative accounting guidance under ASC Topic 805, “Business
Combinations,” became applicable to the Company’s accounting for business
combinations closing on or after January 1, 2009. ASC Topic 805
applies to all transactions and other events in which one entity obtains control
over one or more other businesses. ASC Topic 805 requires an acquirer, upon
initially obtaining control of another entity, to recognize the assets,
liabilities and any non-controlling interest in the acquiree at fair value as of
the acquisition date. Contingent consideration is required to be recognized and
measured at fair value on the date of acquisition rather than at a later date
when the amount of that consideration may be determinable beyond a reasonable
doubt. This fair value approach replaces the cost-allocation process required
under previous accounting guidance whereby the cost of an acquisition was
allocated to the individual assets acquired and liabilities assumed based on
their estimated fair value. ASC Topic 805 requires acquirers to expense
acquisition-related costs as incurred rather than allocating such costs to the
assets acquired and liabilities assumed, as was previously the case under prior
accounting guidance. Assets acquired and liabilities assumed in a business
combination that arise from contingencies are to be recognized at fair value if
fair value can be reasonably estimated. If fair value of such an asset or
liability cannot be reasonably estimated, the asset or liability would generally
be recognized in accordance with ASC Topic 450, “Contingencies.” Under ASC
Topic 805, the requirements of ASC Topic 420, “Exit or Disposal Cost
Obligations,” would have to be met in order to accrue for a restructuring plan
in purchase accounting. Pre-acquisition contingencies are to be recognized at
fair value, unless it is a non-contractual contingency that is not likely to
materialize, in which case, nothing should be recognized in purchase accounting
and, instead, that contingency would be subject to the probable and estimable
recognition criteria of ASC Topic 450, “Contingencies” (See Note 2 below).
ASC Topic 810, “Consolidation.” New authoritative accounting
guidance under ASC Topic 810, “Consolidation,” amended prior guidance to
establish accounting and reporting standards for the non-controlling interest in
a subsidiary and for the deconsolidation of a subsidiary. Under ASC
Topic 810, a non-controlling interest in a subsidiary, which is sometimes
referred to as minority interest, is an ownership interest in the consolidated
entity that should be reported as a component of equity in the consolidated
financial statements. Among other requirements, ASC Topic 810 requires
consolidated net income to be reported at amounts that include the amounts
attributable to both the parent and the non-controlling interest. It also
requires disclosure, on the face of the consolidated income statement, of the
amounts of consolidated net income attributable to the parent and to the
non-controlling interest. The new authoritative accounting guidance under ASC
Topic 810 became effective for the Company on January 1, 2009, and did
not have a significant impact on the Company’s financial
statements.
MB FINANCIAL,
INC. AND SUBSIDIARIES
NOTES TO
CONSOLIDATED FINANCIAL STATEMENTS
Further new authoritative accounting guidance under ASC Topic 810 amends
prior guidance to change how a company determines when an entity that is
insufficiently capitalized or is not controlled through voting (or similar
rights) should be consolidated. The determination of whether a company is
required to consolidate an entity is based on, among other things, an entity’s
purpose and design and a company’s ability to direct the activities of the
entity that most significantly impact the entity’s economic performance. The new
authoritative accounting guidance requires additional disclosures about the
reporting entity’s involvement with variable-interest entities and any
significant changes in risk exposure due to that involvement as well as its
affect on the entity’s financial statements. The new authoritative accounting
guidance under ASC Topic 810 will be effective January 1, 2010 and is
not expected to have a significant impact on the Company’s financial
statements.
ASC
Topic 815, “Derivatives and Hedging.” New authoritative accounting
guidance under ASC Topic 815, “Derivatives and Hedging,” amends prior
guidance to amend and expand the disclosure requirements for derivatives and
hedging activities to provide greater transparency about (i) how and why an
entity uses derivative instruments, (ii) how derivative instruments and
related hedge items are accounted for under ASC Topic 815, and
(iii) how derivative instruments and related hedged items affect an
entity’s financial position, results of operations and cash flows. To meet those
objectives, the new authoritative accounting guidance requires qualitative
disclosures about objectives and strategies for using derivatives, quantitative
disclosures about fair value amounts of gains and losses on derivative
instruments and disclosures about credit-risk-related contingent features in
derivative agreements. The new authoritative accounting guidance under ASC
Topic 815 became effective for the Company on January 1, 2009 and the
required disclosures are reported in Note 21 below.
ASC
Topic 820, “Fair Value Measurements and Disclosures.” ASC Topic 820,
“Fair Value Measurements and Disclosures,” defines fair value, establishes a
framework for measuring fair value in generally accepted accounting principles,
and expands disclosures about fair value measurements. The provisions of ASC
Topic 820 became effective for the Company on January 1, 2008 for
financial assets and financial liabilities and on January 1, 2009 for
non-financial assets and non-financial liabilities (see Note 19 below).
Additional new authoritative accounting guidance under ASC Topic 820
affirms that the objective of fair value when the market for an asset is not
active is the price that would be received to sell the asset in an orderly
transaction, and clarifies and includes additional factors for determining
whether there has been a significant decrease in market activity for an asset
when the market for that asset is not active. ASC Topic 820 requires an
entity to base its conclusion about whether a transaction was not orderly on the
weight of the evidence. The new accounting guidance amended prior guidance to
expand certain disclosure requirements. The Company adopted the new
authoritative accounting guidance under ASC Topic 820 during the first
quarter of 2009. Adoption of the new guidance did not significantly impact the
Company’s financial statements.
Further new authoritative accounting guidance (Accounting Standards Update
No. 2009-5) under ASC Topic 820 provides guidance for measuring the
fair value of a liability in circumstances in which a quoted price in an active
market for the identical liability is not available. In such instances, a
reporting entity is required to measure fair value utilizing a valuation
technique that uses (i) the quoted price of the identical liability when
traded as an asset, (ii) quoted prices for similar liabilities or similar
liabilities when traded as assets, or (iii) another valuation technique
that is consistent with the existing principles of ASC Topic 820, such as
an income approach or market approach. The new authoritative accounting guidance
also clarifies that when estimating the fair value of a liability, a reporting
entity is not required to include a separate input or adjustment to other inputs
relating to the existence of a restriction that prevents the transfer of the
liability. The forgoing new authoritative accounting guidance under ASC
Topic 820 became effective for the Company’s financial statements for
periods ending after October 1, 2009 and did not have a significant impact
on the Company’s financial statements.
ASC
Topic 860, “Transfers and Servicing.” New authoritative accounting
guidance under ASC Topic 860, “Transfers and Servicing,” amends prior
accounting guidance to enhance reporting about transfers of financial assets,
including securitizations, and where companies have continuing exposure to the
risks related to transferred financial assets. The new authoritative accounting
guidance eliminates the concept of a “qualifying special-purpose entity” and
changes the requirements for derecognizing financial assets. The new
authoritative accounting guidance also requires additional disclosures about all
continuing involvements with transferred financial assets including information
about gains and losses resulting from transfers during the period. The new
authoritative accounting guidance under ASC Topic 860 will be effective
January 1, 2010, and is not expected to have a significant impact on the
Company’s financial statements.
MB FINANCIAL,
INC. AND SUBSIDIARIES
NOTES TO
CONSOLIDATED FINANCIAL STATEMENTS
Reclassifications:
Certain prior period amounts have been reclassified to conform to current period
presentation. These reclassifications did not result in any changes
to previously reported net income or stockholders’ equity.
Business
Combinations. The following business combinations were
accounted for under the purchase method of accounting. Accordingly,
the results of operations of the acquired companies have been included in the
Company’s results of operations since the date of acquisition. Under
this method of accounting, assets and liabilities acquired are recorded at their
estimated fair values, net of applicable income tax effects. The
excess cost over fair value of net assets acquired is recorded as
goodwill. In the event that the fair value of net assets acquired
exceeds the cost, the Company will record a gain on the
acquisition.
On April
18, 2008, we purchased an 80% interest in Cedar Hill Associates, LLC (Cedar
Hill), an asset management firm located in Chicago, Illinois, with approximately
$960 million in assets under management. The purchase of Cedar Hill
complements and expands our wealth management product offerings and
revenues. The transaction generated approximately $8.0 million in
goodwill, $4.0 million in client relationship intangibles, and $2.5 million in
minority interest. In addition, the purchase agreement contains
potential deferred payments related to earn-out provisions over a three year
period. Any future deferred payments related to these earn-out
provisions will be applied to the purchase price. Cedar Hill operates
as a subsidiary of MB Financial Bank.
Pro forma
results of operations for Cedar Hill for the year ended December 31, 2008 are
not included as Cedar Hill would not have had a material impact on the Company’s
financial statements.
On
February 27, 2009, MB Financial Bank assumed all deposits and approximately
$92.5 million in loans net of a $14.5 million discount and a $65.6 million FDIC
indemnification asset, of Glenwood, Illinois-based Heritage Community Bank
(“Heritage”) in a loss-share transaction facilitated by the Federal Deposit
Insurance Corporation (“FDIC”). MB Financial Bank will share in the
losses on assets (loans and other real estate owned) covered under the agreement
(referred to as “covered loans” and “covered other real estate
owned”). On losses up to $51.8 million, the FDIC has agreed to
reimburse MB Financial Bank for 80 percent of losses. On losses
exceeding $51.8 million, the FDIC has agreed to reimburse MB Financial Bank for
95 percent of losses. The loss sharing agreement requires that MB
Financial Bank follow certain servicing procedures as specified in the agreement
or risk losing FDIC reimbursement of losses incurred on covered loans and
covered other real estate owned. The Company accounts for MB
Financial Bank’s loss sharing agreement with the FDIC as an indemnification
asset. The transaction generated $2.1 million in core deposit
intangibles and did not generate any goodwill.
On
September 4, 2009, MB Financial Bank assumed $135.3 million of deposits of Oak
Forest, Illinois-based InBank, and acquired loans and other real estate owned of
approximately $105.6 million, net of a $59.8 million discount, in a transaction
facilitated by the FDIC. This transaction generated a pre-tax gain of
$10.2 million, based on preliminary estimates of the amount by which the assets
acquired exceeded the liabilities assumed, and did not generate any goodwill or
other intangibles based on preliminary estimates.
On
September 11, 2009, MB Financial Bank assumed $6.5 billion of deposits of
Chicago-based Corus Bank, N.A. (“Corus”), and acquired loans of approximately
$26.1 million, in a transaction facilitated by the FDIC. Shortly
after the Corus transaction closing, we issued checks to almost all
out-of-market Corus certificate of deposit holders of approximately $2.4 billion
for the redemption of these deposits. Interest rates on some
in-market Corus certificates of deposits were reduced shortly after the
transaction closing, resulting in additional run-off of certificates of
deposit. Additionally, interest rates on out-of-market Corus money
market accounts were reduced to 5 basis points in September
2009. This transaction generated $14.3 million in core deposit
intangibles and did not generate any goodwill based on preliminary
estimates. We expect that we ultimately will retain approximately
$1.6 billion to $2.0 billion of the deposits assumed in the Corus
transaction.
MB FINANCIAL,
INC. AND SUBSIDIARIES
NOTES TO
CONSOLIDATED FINANCIAL STATEMENTS
On
December 4, 2009, MB Financial Bank assumed $163.7 million of deposits and
approximately $86.5 million in loans and other real estate owned, net of a $15.4
million discount and a $28.6 million FDIC indemnification asset, of Aurora,
Illinois-based Benchmark Bank (“Benchmark”) in a loss-share transaction
facilitated by the FDIC. MB Financial Bank will share in the losses
on assets (loans and other real estate owned) covered under the agreement
(referred to as “covered loans” and “covered other real estate
owned”). On losses up to $39.0 million, the FDIC has agreed to
reimburse MB Financial Bank for 80 percent of losses. On losses
exceeding $39.0 million, the FDIC has agreed to reimburse MB Financial Bank for
95 percent of losses. The loss sharing agreement requires that MB
Financial Bank follow certain servicing procedures as specified in the agreement
or risk losing FDIC reimbursement of covered loan losses. MB
Financial Bank may be required to make a payment to the FDIC if losses do
not meet certain levels by the end of the agreement. The Company
accounts for MB Financial Bank’s loss sharing agreement with the FDIC as an
indemnification asset. This transaction generated a pre-tax gain of
$18.3 million, based on preliminary estimates of the amount by which the assets
acquired exceeded the liabilities assumed, and did not generate any goodwill or
other intangibles.
The table
below summarizes the estimated fair values of the assets acquired and
liabilities assumed in the Heritage, InBank, Corus, and Benchmark transactions,
as of the closing dates of those transactions. Fair values of certain
assets are preliminary and subject to refinement for up to one year after the
closing date of the transaction as information relative to closing date fair
values becomes available.
|
Assets
Acquired and Liabilities Assumed
|
||||||||
|
(Dollar
Amounts in Thousands)
|
||||||||
|
Heritage
|
InBank
|
Corus
|
Benchmark
|
|||||
|
February
27, 2009
|
September
4, 2009
|
September
11, 2009
|
December
4, 2009
|
|||||
|
ASSETS
|
||||||||
|
Cash
and cash equivalents
|
$
36,604
|
$ 11,616
|
$
4,560,422
|
$
64,604
|
||||
|
Investment
securities available for sale
|
18,362
|
28,397
|
1,878,741
|
6,117
|
||||
|
Loans,
net of discount
|
92,467
|
100,632
|
26,084
|
76,437
|
||||
|
Other
real estate owned
|
1,197
|
4,946
|
-
|
10,056
|
||||
|
Other
intangibles
|
2,095
|
-
|
14,327
|
-
|
||||
|
FDIC
indemnification asset
|
65,565
|
-
|
-
|
28,614
|
||||
|
Other
assets
|
921
|
721
|
7,498
|
3,539
|
||||
|
Total
assets
|
$
217,211
|
$ 146,312
|
$
6,487,072
|
$
189,367
|
||||
|
LIABILITIES
|
||||||||
|
Deposits
|
$
216,537
|
$ 135,337
|
$
6,476,456
|
$
163,660
|
||||
|
Other
borrowings
|
-
|
-
|
-
|
7,031
|
||||
|
Accrued
expenses and other liabilities
|
674
|
753
|
10,616
|
351
|
||||
|
Total
liabilities
|
$
217,211
|
$ 136,090
|
$
6,487,072
|
$
171,042
|
||||
|
Net
gain recorded on acquisition
|
$
-
|
$ 10,222
|
$
-
|
$
18,325
|
||||
As noted
earlier, the fair values above are preliminary for loans, other real estate
owned, and the FDIC indemnification assets, as the Company continues to analyze
the portfolios and the underlying risks and collateral values of the
assets. For the Heritage transaction, the FDIC indemnification asset
has been adjusted down by approximately $27 million from the transaction closing
date, due to changes in estimates related to the overall collectability of the
underlying loan portfolio. The downward adjustment in the FDIC
indemnification asset was offset by an increase in the corresponding loan
balance and an adjustment to accretable yield.
Deposits
assumed in the Corus transaction decreased to $2.1 billion at December 31,
2009. As noted above, this decrease was expected and was a result of
the redemption of outstanding checks issued for out-of-market certificates of
deposit assumed in the Corus transaction, the withdrawals of out-of-market Corus
money market accounts, and some in-market run-off of previously higher rate
deposits assumed in the Corus transaction. The decrease in Corus
deposits resulted in a corresponding reduction in cash and cash equivalents and
investment securities acquired in the transaction. Additionally, we
purchased investment securities with a portion of the cash acquired in the Corus
transaction. The Company recorded a $15.1 million deferred tax
liability related to the net gains on the InBank and Benchmark
transactions.
MB FINANCIAL,
INC. AND SUBSIDIARIES
NOTES TO
CONSOLIDATED FINANCIAL STATEMENTS
On August
10, 2009, we completed the sale of our merchant card processing business,
resulting in an after-tax gain of $6.2 million.
In
accordance with U.S. GAAP, the results of operations of the Company’s merchant
card processing business are reflected in the Company’s results of operations as
“discontinued operations.”
The
results of operations for the Company’s merchant card processing business were
as follows (in thousands):
|
Years
Ended December 31,
|
|||
|
2009
(1)
|
2008
|
2007
|
|
|
Interest
income
|
$ -
|
$
-
|
$
-
|
|
Interest
expense
|
-
|
-
|
-
|
|
Net
interest income
|
-
|
-
|
-
|
|
Provision
for loan losses
|
-
|
-
|
-
|
|
Net
interest income after provision for loans losses
|
-
|
-
|
-
|
|
Other
income
|
9,914
|
18,072
|
16,376
|
|
Other
expenses
|
9,535
|
17,397
|
15,330
|
|
Income
before income taxes
|
379
|
675
|
1,046
|
|
Applicable
income taxes
|
148
|
236
|
366
|
|
Operating
income from discontinued operations
|
231
|
439
|
680
|
|
Gain
on sale of discontinued operations, net of tax
|
6,222
|
-
|
-
|
|
$ 6,453
|
$
439
|
$
680
|
|
|
(1)
|
Represents
results of operations through the date of sale, August 10,
2009.
|
On
November 28, 2007, we completed the sale of our Oklahoma City-based subsidiary
bank, Union Bank, N.A., for $76.3 million, resulting in an after-tax gain of
$28.8 million. Prior to closing, Union Bank sold to MB Financial Bank
approximately $100 million in performing loans previously purchased from and
originated by MB Financial Bank.
In
accordance with U.S. GAAP, the results of operations of Union Bank are reflected
in the Company’s results of operations as “discontinued
operations.”
MB FINANCIAL,
INC. AND SUBSIDIARIES
NOTES TO
CONSOLIDATED FINANCIAL STATEMENTS
The
results of operations for Union Bank were as follows (in
thousands):
|
Year
Ended
December
31,
|
|
|
2007
(1)
|
|
|
Interest
income
|
$
21,946
|
|
Interest
expense
|
10,216
|
|
Net
interest income
|
11,730
|
|
Provision
for loan losses
|
1,185
|
|
Net
interest income after provision for loans losses
|
10,545
|
|
Other
income
|
999
|
|
Other
expenses
|
7,554
|
|
Income
before income taxes
|
3,990
|
|
Applicable
income taxes
|
998
|
|
Operating
income from discontinued operations
|
2,992
|
|
Gain
on sale of discontinued operations, net of tax
|
28,846
|
|
$ 31,838
|
|
(1)
|
Represents
results of operations through the date of sale, November 28,
2007.
|
Note
4. Restrictions
on Cash and Due From Banks
MB
Financial Bank is required to maintain reserve balances in cash or on deposit
with the Federal Reserve Bank, based on a percentage of deposits. The
total of those required reserve balances was approximately $55.6 million and
$51.2 million at December 31, 2009 and 2008, respectively.
The
nature of the Company's business requires that it maintain amounts due from
banks and federal funds sold which, at times, may exceed federally insured
limits. Management monitors these correspondent relationships and the
Company has not experienced any losses in such accounts.
MB FINANCIAL,
INC. AND SUBSIDIARIES
NOTES TO
CONSOLIDATED FINANCIAL STATEMENTS
Note
5. Investment
Securities
Carrying
amounts and fair values of investment securities available for sale are
summarized as follows (in thousands):
|
Gross
|
Gross
|
|||||||
|
Amortized
|
Unrealized
|
Unrealized
|
Fair
|
|||||
|
Available
for sale
|
Cost
|
Gains
|
Losses
|
Value
|
||||
|
December
31, 2009:
|
||||||||
|
Government
sponsored agencies
|
$ 69,120
|
$ 1,122
|
$
(3)
|
$ 70,239
|
||||
|
States
and political subdivisions
|
366,845
|
14,369
|
(980)
|
380,234
|
||||
|
Residential
mortgage-backed securities
|
2,382,495
|
12,595
|
(18,039)
|
2,377,051
|
||||
|
Corporate
bonds
|
11,400
|
-
|
(5)
|
11,395
|
||||
|
Equity
securities
|
4,280
|
34
|
-
|
4,314
|
||||
|
Totals
|
$ 2,834,140
|
$ 28,120
|
$ (19,027)
|
$ 2,843,233
|
||||
|
December
31, 2008:
|
||||||||
|
Government
sponsored agencies
|
$ 171,385
|
$ 7,988
|
$ -
|
$ 179,373
|
||||
|
States
and political subdivisions
|
417,608
|
12,585
|
(2,194)
|
427,999
|
||||
|
Residential
mortgage-backed securities
|
682,679
|
8,597
|
(991)
|
690,285
|
||||
|
Corporate
bonds
|
34,546
|
34
|
(15)
|
34,565
|
||||
|
Equity
securities
|
3,595
|
11
|
-
|
3,606
|
||||
|
Debt
securities issued by foreign governments
|
301
|
1
|
-
|
302
|
||||
|
Totals
|
$ 1,310,114
|
$ 29,216
|
$
(3,200)
|
$ 1,336,130
|
||||
We do not
have any meaningful direct or indirect holdings of subprime residential mortgage
loans, home equity lines of credit, or any Fannie Mae or Freddie Mac preferred
or common equity securities in our investment
portfolio. Additionally, more than 99% of our mortgage-backed
securities are agency guaranteed.
Unrealized
losses on investment securities available for sale and the fair value of the
related securities at December 31, 2009 are summarized as follows (in
thousands):
|
Less
Than 12 Months
|
12
Months or More
|
Total
|
||||||||||
|
Fair
|
Unrealized
|
Fair
|
Unrealized
|
Fair
|
Unrealized
|
|||||||
|
Value
|
Losses
|
Value
|
Losses
|
Value
|
Losses
|
|||||||
|
Government
sponsored agencies
|
$ 5,837
|
$ (3)
|
$
-
|
$
-
|
$
5,837
|
$
(3)
|
||||||
|
States
and political subdivisions
|
27,801
|
(620)
|
4,887
|
(360)
|
32,688
|
(980)
|
||||||
|
Residential
mortgage-backed securities
|
1,379,716
|
(18,031)
|
642
|
(8)
|
1,380,358
|
(18,039)
|
||||||
|
Corporate
bonds
|
5,032
|
(5)
|
-
|
-
|
5,032
|
(5)
|
||||||
|
Totals
|
$ 1,418,386
|
$ (18,659)
|
$
5,529
|
$
(368)
|
$
1,423,915
|
$
(19,027)
|
||||||
MB FINANCIAL,
INC. AND SUBSIDIARIES
NOTES TO
CONSOLIDATED FINANCIAL STATEMENTS
Unrealized
losses on investment securities available for sale and the fair value of the
related securities at December 31, 2008 are summarized as follows (in
thousands):
|
Less
Than 12 Months
|
12
Months or More
|
Total
|
||||||||||
|
Fair
|
Unrealized
|
Fair
|
Unrealized
|
Fair
|
Unrealized
|
|||||||
|
Value
|
Losses
|
Value
|
Losses
|
Value
|
Losses
|
|||||||
|
States
and political subdivisions
|
$
57,096
|
$
(1,970)
|
$
4,179
|
$
(224)
|
$
61,275
|
$
(2,194)
|
||||||
|
Residential
mortgage-backed securities
|
141,786
|
(958)
|
5,276
|
(33)
|
147,062
|
(991)
|
||||||
|
Corporate
bonds
|
15,045
|
(15)
|
-
|
-
|
15,045
|
(15)
|
||||||
|
Totals
|
$
213,927
|
$
(2,943)
|
$
9,455
|
$
(257)
|
$
223,382
|
$
(3,200)
|
||||||
The total
number of security positions in the investment portfolio in an unrealized loss
position at December 31, 2009 was 154 compared to 244 at December 31,
2008. Declines in the fair value of available-for-sale securities
below their cost that are deemed to be other than temporary are reflected in
earnings as realized losses to the extent the impairment is related to credit
losses. The amount of the impairment related to other factors is recognized in
other comprehensive income. In estimating other-than-temporary impairment
losses, management considers, among other things, (i) the length of time
and the extent to which the fair value has been less than cost, (ii) the
financial condition and near-term prospects of the issuer, and (iii) the
intent and ability of the Company to retain its investment in the issuer for a
period of time sufficient to allow for any anticipated recovery in
cost.
The
Company views its investment in the stock of the FHLB Chicago as a long-term
investment. Accordingly, when evaluating for impairment, the value is
determined based on the ultimate recovery of the par value rather than
recognizing temporary declines in value. The decision of whether
impairment exists is a matter of judgment that should reflect the investor’s
views on the FHLB Chicago's long term performance, which includes factors such
as its operating performance, the severity and duration of declines of the
market value of its net assets relative to its capital stock amount, its
commitment to make payments required by law or regulation and the level of such
payments in relation to its operating performance, the impact of legislative and
regulation changes on FHLB Chicago and accordingly, on the members of FHLB
Chicago, and its liquidity and funding position. Although the FHLB Chicago
was placed under a Cease and Desist Order, suspended dividends in 2007 and
recorded a net loss for the year ended December 31, 2009, the FHLB Chicago
continued issuing new capital stock at par value since the Cease and Desist
Order and reported that it is in compliance with regulatory capital
requirements. The Company does not believe that its investment in the
FHLB was impaired as December 31, 2009.
Management
has the ability and intent to hold the securities in the table above until they
mature, at which time the Company expects to receive full value for the
securities. Furthermore, as of December 31, 2009, management does not have
the intent to sell any of the securities classified as available for sale in the
table above and believes that it is more likely than not that the Company will
not have to sell any such securities before a recovery of cost. The unrealized
losses are largely due to increases in market interest rates over the yields
available at the time the underlying securities were purchased. The fair value
is expected to recover as the bonds approach their maturity date or repricing
date or if market yields for such investments decline. Management does not
believe any of the securities are impaired due to reasons of credit quality.
Accordingly, as of December 31, 2009, management believes the impairments
detailed in the table above are temporary and no impairment loss has been
realized in the Company’s consolidated income statement.
MB FINANCIAL,
INC. AND SUBSIDIARIES
NOTES TO
CONSOLIDATED FINANCIAL STATEMENTS
Realized
net gains (losses) on sale of investment securities available for sale are
summarized as follows (in thousands):
|
For
the Years Ended December 31,
|
||||||
|
2009
|
2008
|
2007
|
||||
|
Realized
gains
|
$ 15,698
|
$ 1,420
|
$ 962
|
|||
|
Realized
losses
|
(1,669)
|
(290)
|
(4,706)
|
|||
|
Net
gains (losses)
|
$ 14,029
|
$ 1,130
|
$ (3,744)
|
|||
The
amortized cost and fair value of investment securities available for sale as of
December 31, 2009 by contractual maturity are shown below. Maturities
may differ from contractual maturities in mortgage-backed securities because the
mortgages underlying the securities may be called or repaid without any
penalties.
Therefore,
residential mortgage-backed securities are not included in the maturity
categories in the following maturity summary.
|
Amortized
|
Fair
|
|||
|
(In
thousands)
|
Cost
|
Value
|
||
|
Due
in one year or less
|
$ 52,582
|
$ 53,053
|
||
|
Due
after one year through five years
|
80,691
|
84,969
|
||
|
Due
after five years through ten years
|
261,227
|
270,167
|
||
|
Due
after ten years
|
52,865
|
53,679
|
||
|
Equity
securities
|
4,280
|
4,314
|
||
|
Residential
mortgage-backed securities
|
2,382,495
|
2,377,051
|
||
|
Totals
|
$ 2,834,140
|
$ 2,843,233
|
||
Investment
securities available for sale with carrying amounts of $1.1 billion and $765.9
million at December 31, 2009 and 2008, respectively, were pledged as collateral
on public deposits and for other purposes as required or permitted by
law.
Loans
consist of the following at (in thousands):
|
December
31,
|
||||
|
2009
|
2008
|
|||
|
Commercial
loans
|
$ 1,387,476
|
$ 1,522,380
|
||
|
Commercial
loans collateralized by assignment of lease payments
|
953,452
|
649,918
|
||
|
Commercial
real estate
|
2,472,520
|
2,353,261
|
||
|
Residential
real estate
|
291,022
|
295,336
|
||
|
Construction
real estate
|
594,482
|
757,900
|
||
|
Indirect
vehicle
|
180,267
|
189,227
|
||
|
Home
equity
|
405,439
|
401,029
|
||
|
Consumer
loans
|
66,293
|
59,512
|
||
|
Gross
loans, excluding covered loans
|
6,350,951
|
6,228,563
|
||
|
Covered
loans
|
173,596
|
-
|
||
|
Gross
loans(1)
|
6,524,547
|
6,228,563
|
||
|
Allowance
for loan losses
|
(177,072)
|
(144,001)
|
||
|
Loans,
net
|
$ 6,347,475
|
$ 6,084,562
|
||
|
(1)
|
Gross
loan balances at December 31, 2009 and 2008 are net of unearned income,
including net deferred loan fees of $4.6 million, and $4.5 million
respectively.
|
MB FINANCIAL,
INC. AND SUBSIDIARIES
NOTES TO
CONSOLIDATED FINANCIAL STATEMENTS
Loans are
made to individuals as well as commercial and tax exempt
entities. Specific loan terms vary as to interest rate, repayment and
collateral requirements based on the type of loan requested and the credit
worthiness of the prospective borrower. Credit risk tends to be
geographically concentrated in that the majority of the loan customers are
located in the markets serviced by MB Financial Bank.
Non-accrual
loans and loans past due ninety days or more were $271.3 million and $145.9
million at December 31, 2009 and 2008, respectively. The reduction in
interest income associated with loans on non-accrual status was approximately
$12.5 million, $4.6 million, and $1.6 million for the years ended December 31,
2009, 2008 and 2007, respectively.
Information
about impaired loans as of and for the years ended December 31, 2009, 2008 and
2007 are as follows (in thousands):
|
December
31,
|
||||||
|
2009
|
2008
|
2007
|
||||
|
Loans
for which there were related allowance for loan losses
|
$ 251,623
|
$ 143,423
|
$ 18,398
|
|||
|
Other
impaired loans
|
-
|
-
|
564
|
|||
|
Total
impaired loans
|
$ 251,623
|
$ 143,423
|
$ 18,962
|
|||
|
Average
monthly balance of impaired loans
|
$ 233,741
|
$ 76,942
|
$ 16,208
|
|||
|
Related
allowance for loan losses
|
45,966
|
52,112
|
5,960
|
|||
|
Interest
income recognized on a cash basis
|
185
|
74
|
429
|
|||
The
increase in impaired loans was primarily attributable to impaired construction
real estate and commercial real estate loans. Impaired construction
real estate loans increased as a result of the continued weak residential
construction market. Impaired commercial real estate loans increased
primarily due to the economic slowdown during 2009. The Company
experienced significant declines in current valuations of real estate supporting
its collateral in 2009. If real estate values continue to decline and
as updated appraisals are received, the Company may have to increase the
allowance for loan losses accordingly.
The
decrease in specific reserves related to impaired loans is primarily due to
partial charge-offs of approximately $69.4 million taken on impaired loans
during the year ended December 31, 2009.
MB FINANCIAL,
INC. AND SUBSIDIARIES
NOTES TO
CONSOLIDATED FINANCIAL STATEMENTS
Activity
in the allowance for loan losses was as follows (in thousands):
|
Year
Ended December 31,
|
||||||
|
2009
|
2008
|
2007
|
||||
|
Balance
at beginning of year
|
$
144,001
|
$ 65,103
|
$ 58,983
|
|||
|
Provision
for loan losses
|
231,800
|
125,721
|
19,313
|
|||
|
Charge-offs:
|
||||||
|
Commercial
loans
|
(46,113)
|
(13,653)
|
(7,072)
|
|||
|
Commercial
loans collateralized by assignment of lease payments
|
(5,407)
|
(1,258)
|
(515)
|
|||
|
Commercial
real estate
|
(38,842)
|
(14,872)
|
(3,471)
|
|||
|
Residential
real estate
|
(1,476)
|
(550)
|
(1,075)
|
|||
|
Construction
real estate
|
(103,789)
|
(14,940)
|
(2,294)
|
|||
|
Indirect
vehicles
|
(4,085)
|
(2,109)
|
(1,193)
|
|||
|
Home
equity
|
(3,443)
|
(1,801)
|
(194)
|
|||
|
Consumer
loans
|
(1,124)
|
(642)
|
(492)
|
|||
|
Total
charge-offs
|
(204,279)
|
(49,825)
|
(16,306)
|
|||
|
Recoveries:
|
||||||
|
Commercial
loans
|
1,491
|
891
|
1,265
|
|||
|
Commercial
loans collateralized by assignment of lease payments
|
-
|
67
|
979
|
|||
|
Commercial
real estate
|
40
|
266
|
37
|
|||
|
Residential
real estate
|
44
|
29
|
20
|
|||
|
Construction
real estate
|
2,957
|
951
|
38
|
|||
|
Indirect
vehicles
|
757
|
625
|
389
|
|||
|
Home
equity
|
53
|
132
|
344
|
|||
|
Consumer
loans
|
208
|
41
|
41
|
|||
|
Total
recoveries
|
5,550
|
3,002
|
3,113
|
|||
|
Net
charge-offs
|
(198,729)
|
(46,823)
|
(13,193)
|
|||
|
Balance
at December 31,
|
$
177,072
|
$
144,001
|
$ 65,103
|
|||
Loans
outstanding to executive officers and directors of the Company, including
companies in which they have management control or beneficial ownership, at
December 31, 2009 and 2008, were approximately $10.5 million and $10.6 million,
respectively. In the opinion of management, these loans have similar
terms to other customer loans and do not present more than normal risk of
collection.
An
analysis of the activity related to these loans for the year ended December 31,
2009 is as follows (in thousands):
|
Balance,
beginning of year
|
$ 10,614
|
|
|
Additions
|
929
|
|
|
Principal
payments and other reductions
|
(1,007)
|
|
|
Balance,
end of year
|
$ 10,536
|
|
Purchased
loans acquired in a business combination, including loans purchased in the
Heritage, InBank, Corus, and Benchmark transactions, are recorded at estimated
fair value on their purchase date without a carryover of the related allowance
for loan losses. Purchased credit-impaired loans are loans that have
evidence of credit deterioration since origination and it is probable at the
date of acquisition that the Company will not collect all contractually required
principal and interest payments. Evidence of credit quality
deterioration as of the purchase date may include factors such as past due and
non-accrual status. The difference between contractually required
payments at acquisition and the cash flows expected to be collected at
acquisition is referred to as the non-accretable
difference. Subsequent decreases to the expected cash flows will
generally result in a provision for loan losses. Subsequent increases
in cash flows result in a reversal of the provision for loan losses to the
extent of prior charges or a reclassification of the difference from
non-accretable to accretable with a positive impact on interest
income. Further, any excess of cash flows expected at acquisition
over the estimated fair value is referred to as the accretable yield and is
recognized into interest income over the remaining life of the loan when there
is a reasonable expectation about the amount and timing of such cash
flows.
MB FINANCIAL,
INC. AND SUBSIDIARIES
NOTES TO
CONSOLIDATED FINANCIAL STATEMENTS
In our
acquisitions of the assets of Heritage and Benchmark (see Note
2), the preliminary fair value of purchased credit-impaired loans, on the
acquisition date, was determined based on assigned risk ratings, expected cash
flows and the fair value of the loan collateral. The fair value of
loans that were not credit-impaired was determined based on preliminary
estimates of losses on defaults. Due to the loss sharing agreements
with the FDIC for the Heritage and Benchmark transactions, the Bank recorded
receivables from the FDIC equal to the corresponding reimbursement percentages
on the estimated losses embedded in the loan portfolios. The carrying
amount of covered loans at December 31, 2009, consisted of purchased
credit-impaired loans and non-credit-impaired loans as shown in the following
table (in thousands):
|
Heritage
|
Benchmark
|
||||
|
Purchased
Credit-Impaired Loans
|
Purchased
Non-Credit-Impaired Loans
|
Purchased
Credit-Impaired Loans
|
Purchased
Non-Credit-Impaired Loans
|
Total
|
|
|
Commercial
related loans
|
$ 44,038
|
$ 15,906
|
$ 19,843
|
$ 42,630
|
$ 122,417
|
|
Other
loans
|
2,588
|
37,069
|
477
|
11,045
|
51,179
|
|
Total
covered loans
|
$ 46,626
|
$ 52,975
|
$ 20,320
|
$ 53,675
|
$ 173,596
|
|
Estimated
reimbursable amounts from the
|
|||||
|
FDIC
under the loss-share agreement
|
$ 9,490
|
$ 4,108
|
$ 13,099
|
$ 15,515
|
$ 42,212
|
Estimated
reimbursable amounts from the FDIC related to the Heritage purchased
credit-impaired loans has decreased by more than $20 million since inception of
the loss share arrangement, as losses have been reimbursed by the
FDIC. Additionally, for the Heritage transaction, the FDIC
indemnification asset has been adjusted down approximately $27 million from the
transaction closing date, due to changes in estimates related to the overall
collectability of the underlying loan portfolio. The downward
adjustment in the FDIC indemnification asset was offset by an increase in the
corresponding loan balance and an adjustment to accretable yield. The
reimbursable amounts allocated to purchased non-credit-impaired loans are a
result of the uncertainty of collections on loans currently
performing.
The
following table presents information regarding the preliminary estimates of the
contractually required payments receivable, the cash flows expected to be
collected, and the estimated fair value of the loans acquired in the Heritage,
InBank, Corus, and Benchmark transactions, as of the closing dates for those
transactions (in thousands):
|
Heritage
|
InBank
|
Corus
|
Benchmark
|
|||||||||
|
February
27, 2009
|
September
4, 2009
|
September
11, 2009
|
December
4, 2009
|
|||||||||
|
Purchased
Credit-Impaired Loans
|
Purchased
Non-Credit-Impaired Loans
|
Purchased
Credit-Impaired Loans
|
Purchased
Non-Credit-Impaired Loans
|
Purchased
Credit-Impaired Loans
|
Purchased
Non-Credit-Impaired Loans
|
Purchased
Credit-Impaired Loans
|
Purchased
Non-Credit-Impaired Loans
|
|||||
|
Contractually
required payments
|
||||||||||||
|
Commercial
related loans
|
$ 85,341
|
$ 37,871
|
$ 95,786
|
$ 20,785
|
$ 1,946
|
$ 27,278
|
$ 42,339
|
$ 65,819
|
||||
|
Other
loans
|
7,842
|
61,435
|
12,261
|
32,139
|
-
|
-
|
1,031
|
19,229
|
||||
|
Total
|
$ 93,183
|
$ 99,306
|
$ 108,047
|
$ 52,924
|
$ 1,946
|
$ 27,278
|
$ 43,370
|
$ 85,048
|
||||
|
Cash
flows expected to be collected
|
||||||||||||
|
Commercial
related loans
|
$ 42,680
|
$ 24,334
|
$ 51,325
|
$ 18,669
|
$ 1,252
|
$ 26,636
|
$ 23,733
|
$ 48,381
|
||||
|
Other
loans
|
3,448
|
42,616
|
10,009
|
28,915
|
-
|
-
|
584
|
14,515
|
||||
|
Total
|
$ 46,128
|
$ 66,950
|
$ 61,334
|
$ 47,584
|
$ 1,252
|
$ 26,636
|
$ 24,317
|
$ 62,896
|
||||
|
Fair
value of loans acquired
|
||||||||||||
|
Commercial
related loans
|
$ 42,586
|
$ 19,273
|
$ 46,983
|
$ 17,511
|
$ 1,252
|
$ 24,832
|
$ 19,924
|
$ 44,007
|
||||
|
Other
loans
|
3,405
|
27,203
|
9,450
|
26,688
|
-
|
-
|
546
|
11,960
|
||||
|
Total
|
$ 45,991
|
$ 46,476
|
$ 56,433
|
$ 44,199
|
$ 1,252
|
$ 24,832
|
$ 20,470
|
$ 55,967
|
||||
MB FINANCIAL,
INC. AND SUBSIDIARIES
NOTES TO
CONSOLIDATED FINANCIAL STATEMENTS
These
amounts were determined based upon the estimated remaining life of the
underlying loans, which include the effects of estimated
prepayments. The majority of the purchased credit-impaired loans were
valued based on the liquidation value of the underlying
collateral. There was no allowance for credit losses related to these
purchased credit-impaired loans at December 31, 2009. Certain amounts
related to the purchased loans are preliminary estimates. The Company
expects to finalize its analysis of these loans within twelve months of the
acquisition dates and, therefore, adjustments to the estimated amounts may
occur.
The lease
portfolio is comprised of various types of equipment, generally technology
related, including computer systems and satellite equipment, material handling
and general manufacturing equipment. Lessees tend to have an
investment grade public debt rating by Moody’s or Standard & Poors or the
equivalent, though we also provided credit to below investment grade and
non-rated companies.
Lease
investments by categories follow (in thousands):
|
December
31,
|
|||||
|
2009
|
2008
|
||||
|
Direct
finance leases:
|
|||||
|
Minimum
lease payments
|
$ 69,112
|
$ 61,239
|
|||
|
Estimated
unguaranteed residual values
|
7,802
|
7,093
|
|||
|
Less:
unearned income
|
(7,684)
|
(7,484)
|
|||
|
Direct
finance leases (1)
|
$ 69,230
|
$ 60,848
|
|||
|
Leveraged
leases:
|
|||||
|
Minimum
lease payments
|
$ 20,770
|
$ 30,150
|
|||
|
Estimated
unguaranteed residual values
|
4,532
|
4,914
|
|||
|
Less:
unearned income
|
(1,950)
|
(2,804)
|
|||
|
Less:
related non-recourse debt
|
(20,717)
|
(28,437)
|
|||
|
Leveraged
leases (1)
|
$ 2,635
|
$ 3,823
|
|||
|
Operating
leases:
|
|||||
|
Equipment,
at cost
|
$ 235,092
|
$ 196,068
|
|||
|
Less
accumulated depreciation
|
(90,126)
|
(71,034)
|
|||
|
Lease
investments, net
|
$ 144,966
|
$ 125,034
|
|||
|
(1)
|
Direct
finance and leveraged leases are included as commercial loans
collateralized by assignment of lease payments for financial statement
purposes.
|
Leases
that transfer substantially all of the benefits and risk related to the
equipment ownership to the lessee are classified as direct
financing. If these direct finance leases have non-recourse debt
associated with them, they are further classified as leveraged leases, and the
associated debt is netted with the outstanding balance in the consolidated
financial statements. Interest income on direct finance and leveraged
leases is recognized using methods which approximate a level yield over the term
of the lease.
Operating
leases are investments in equipment leased to other companies, where the
residual component makes up more than 10% of the investment. The
Company funds most of the lease equipment purchases internally, but has some
loans at other banks which totaled $20.7 million at December 31, 2009 and $27.7
million at December 31, 2008.
MB FINANCIAL,
INC. AND SUBSIDIARIES
NOTES TO
CONSOLIDATED FINANCIAL STATEMENTS
The
minimum lease payments receivable for the various categories of leases are due
as follows (in thousands) for the years ending December 31,
|
Direct
|
||||||||
|
Finance
|
Leveraged
|
Operating
|
||||||
|
Year
|
Leases
|
Leases
|
Leases
|
Total
|
||||
|
2010
|
$ 31,643
|
$ 13,668
|
$ 45,517
|
$ 90,828
|
||||
|
2011
|
20,769
|
5,562
|
31,923
|
58,254
|
||||
|
2012
|
10,820
|
1,353
|
17,201
|
29,374
|
||||
|
2013
|
4,674
|
187
|
8,431
|
13,292
|
||||
|
2014
|
1,201
|
-
|
2,461
|
3,662
|
||||
|
2015
& Thereafter
|
5
|
-
|
491
|
496
|
||||
|
$ 69,112
|
$ 20,770
|
$ 106,024
|
$ 195,906
|
|||||
Income
from lease investments is composed of (in thousands):
|
Years
Ended December 31,
|
||||||
|
2009
|
2008
|
2007
|
||||
|
Rental
income on operating leases
|
$ 51,809
|
$ 44,210
|
$ 35,160
|
|||
|
LaSalle
Business Solutions revenue
|
47,785
|
32,302
|
46,813
|
|||
|
Gain
on sale of leased equipment
|
1,789
|
1,921
|
4,149
|
|||
|
Income
on lease investments, gross
|
101,383
|
78,433
|
86,122
|
|||
|
Less:
|
||||||
|
Write
down of residual value of equipment
|
(1,371)
|
(512)
|
(1,617)
|
|||
|
LaSalle
Business Solutions cost of sales
|
(43,217)
|
(28,953)
|
(42,561)
|
|||
|
Depreciation
on operating leases
|
(38,267)
|
(31,995)
|
(26,097)
|
|||
|
Income
from lease investments, net
|
$ 18,528
|
$ 16,973
|
$ 15,847
|
|||
LaSalle
Business Solutions (LBS) revenue represents the gross amount of revenue paid to
LBS for maintenance contracts sold to customers. The maintenance
contracts are serviced by third parties, with LBS maintaining no obligations
under the contract. The cost of sales is the amount paid by LBS to
the third party maintenance provider.
Gains on
leased equipment periodically result when a lessee renews a lease or purchases
the equipment at the end of a lease, or the equipment is sold to a third party
at a profit. Individual lease transactions can, however, result in a
loss. This generally happens when, at the end of a lease, the lessee
does not renew the lease or purchase the equipment. To mitigate this
risk of loss, we usually limit individual leased equipment residuals to
approximately $500 thousand per transaction and seek to diversify both the type
of equipment leased and the industries in which the lessees to whom such
equipment is leased participate. Often times, there are several
individual lease schedules under one master lease. There were 2,489
leases at December 31, 2009 compared to 2,273 at December 31,
2008. The average residual value per lease schedule was approximately
$22 thousand at December 31, 2009 and $20 thousand at December 31,
2008. The average residual value per master lease schedule was
approximately $177 thousand at December 31, 2009 and $169 thousand at December
31, 2008.
MB FINANCIAL,
INC. AND SUBSIDIARIES
NOTES TO
CONSOLIDATED FINANCIAL STATEMENTS
At
December 31, 2009, the following reflects the residual values for leases by
category in the year the initial lease term ends (in thousands):
|
Residual
Values
|
||||||||
|
End
of initial lease term
|
Direct
|
|||||||
|
Finance
|
Leveraged
|
Operating
|
||||||
|
December
31,
|
Leases
|
Leases
|
Leases
|
Total
|
||||
|
2010
|
$ 1,678
|
$ 2,057
|
$ 8,957
|
$ 12,692
|
||||
|
2011
|
2,472
|
1,263
|
11,213
|
14,948
|
||||
|
2012
|
1,981
|
1,074
|
10,044
|
13,099
|
||||
|
2013
|
601
|
138
|
4,242
|
4,981
|
||||
|
2014
|
1,037
|
-
|
5,372
|
6,409
|
||||
|
2015
& Thereafter
|
33
|
-
|
2,843
|
2,876
|
||||
|
$ 7,802
|
$ 4,532
|
$ 42,671
|
$ 55,005
|
|||||
The lease
residual value represents the present value of the estimated fair value of the
leased equipment at the termination of the lease. Lease residual
values are reviewed quarterly, and any write-downs or charge-offs deemed
necessary are recorded in the period in which they become known.
Note
8. Premises and
Equipment
Premises
and equipment consist of (in thousands):
|
December
31,
|
||||
|
2009
|
2008
|
|||
|
Land
and land improvements
|
$
55,476
|
$
55,941
|
||
|
Buildings
|
78,087
|
80,582
|
||
|
Furniture
and equipment
|
69,701
|
62,019
|
||
|
Buildings
and leasehold improvements
|
46,197
|
46,055
|
||
|
249,461
|
244,597
|
|||
|
Accumulated
depreciation
|
(69,820)
|
(58,123)
|
||
|
Premises
and equipment, net
|
$ 179,641
|
$
186,474
|
||
Depreciation
on premises and equipment totaled $11.8 million, $11.7, and $11.1 million for
the years ended December 31, 2009, 2008, and 2007, respectively.
During
2009, the Company conducted an impairment review of branch office locations to
be consolidated due to the Company’s acquisitions in 2009 (see Note 2 above). As a result, the Company
recognized a $4.0 million impairment charge related to three branches in
2009.
As of
December 31, 2009, the Company had approximately $29.2 million in capital
expenditure commitments outstanding which relate to various projects to renovate
existing branches and commitments to purchase branch facilities related to our
FDIC transactions (see Note 2 above).
Under the
provisions of ASC Topic 350, goodwill is no longer subject to amortization, but
instead is subject to at least annual assessments for impairment by applying a
fair-value based test. ASC Topic 350 also requires that an acquired
intangible asset be separately recognized if the benefit of the intangible asset
is obtained through contractual or other legal rights, or if the asset can be
sold, transferred, licensed, rented or exchanged, regardless of the acquirer’s
intent to do so. Our most recent impairment assessment on goodwill
and other intangibles was completed as of December 31, 2009. No
impairment losses on goodwill or other intangibles were incurred in 2009, 2008,
and 2007.
MB FINANCIAL,
INC. AND SUBSIDIARIES
NOTES TO
CONSOLIDATED FINANCIAL STATEMENTS
The
following table presents the changes in the carrying amount of goodwill (in
thousands):
|
December
31,
|
||
|
2009
|
2008
|
|
|
Balance
at beginning of period
|
$ 387,069
|
$ 379,047
|
|
Goodwill
from business combinations (1)
|
-
|
8,022
|
|
Balance
at end of period
|
$ 387,069
|
$ 387,069
|
|
(1)
|
See
Note 2 for additional
information.
|
The
Company has other intangible assets consisting of core deposit and client
relationship intangibles that had, as of December 31, 2009, a remaining weighted
average amortization period of approximately five years. The
following table presents the changes in the carrying amount of core deposit and
client relationship intangibles, gross carrying amount, accumulated
amortization, and net book value as of December 31, 2009 and December 31, 2008
(in thousands):
|
December
31,
|
||
|
2009
|
2008
|
|
|
Balance
at beginning of period
|
$ 25,776
|
$ 25,352
|
|
Amortization
expense
|
(4,491)
|
(3,554)
|
|
Other
intangibles from business combinations (1)
|
16,423
|
3,978
|
|
Balance
at end of period
|
$ 37,708
|
$ 25,776
|
|
Gross
carrying amount
|
$ 67,895
|
$ 51,472
|
|
Accumulated
amortization
|
(30,187)
|
(25,696)
|
|
Net
book value
|
$ 37,708
|
$ 25,776
|
|
(1)
|
See
Note 2 for additional
information.
|
The
following presents the estimated amortization expense of other intangible assets
(in thousands):
|
Year
ending December 31,
|
Amount
|
|
|
2010
|
$
6,033
|
|
|
2011
|
5,212
|
|
|
2012
|
4,589
|
|
|
2013
|
4,152
|
|
|
2014
|
3,245
|
|
|
Thereafter
|
14,477
|
|
|
$
37,708
|
Note
10. Deposits
The
composition of deposits is as follows (in thousands):
|
December
31,
|
||||
|
2009
|
2008
|
|||
|
Demand
deposits, noninterest bearing
|
$ 1,552,185
|
$
960,117
|
||
|
NOW
and money market accounts
|
2,775,468
|
1,465,436
|
||
|
Savings
deposits
|
583,783
|
367,684
|
||
|
Time
certificates, $100,000 or more
|
1,885,460
|
2,091,067
|
||
|
Other
time certificates
|
1,886,380
|
1,611,267
|
||
|
Total
|
$ 8,683,276
|
$ 6,495,571
|
||
MB FINANCIAL,
INC. AND SUBSIDIARIES
NOTES TO
CONSOLIDATED FINANCIAL STATEMENTS
Time
certificates of $100,000 or more included $528.3 million and $864.8 million of
brokered deposits at December 31, 2009 and 2008,
respectively. Brokered deposits typically consist of smaller
individual time certificates that have the same liquidity characteristics and
yields consistent with time certificates of $100,000 or more.
At
December 31, 2009, the scheduled maturities of time certificates are as follows
(in thousands):
|
2010
|
$ 3,158,663
|
|
|
2011
|
267,495
|
|
|
2012
|
209,934
|
|
|
2013
|
87,260
|
|
|
2014
|
35,578
|
|
|
Thereafter
|
12,910
|
|
|
$ 3,771,840
|
Note
11. Short-Term
Borrowings
Short-term
borrowings are summarized as follows as of December 31, 2009 and 2008 (dollars
in thousands):
|
December
31,
|
||||
|
2009
|
2008
|
|||
|
Weighted
Average
|
Amount
|
Weighted
Average
|
Amount
|
|
|
Cost
|
Cost
|
|||
|
Federal
funds purchased
|
-
|
$ -
|
0.68%
|
$ 5,000
|
|
Federal
Reserve term auction funds
|
-
|
-
|
0.42%
|
100,000
|
|
Customer
repurchase agreements
|
0.50%
|
223,917
|
0.48%
|
282,832
|
|
Federal
Home Loan Bank advances
|
3.35%
|
100,000
|
2.46%
|
100,787
|
|
1.38%
|
$ 323,917
|
0.88%
|
$ 488,619
|
|
The
Company can use the Federal Reserve term auction facility for short-term
funding. Each auction is for a fixed amount and the rate is
determined by the auction process. These borrowings are primarily
collateralized by commercial and indirect vehicle loans with unpaid principal
balances aggregating no less than 200% of the outstanding advances from the
Federal Reserve Term Auction. On January 27, 2010, the Federal Reserve
announced that the final auction will be conducted on March 8,
2010.
Securities
sold under agreements to repurchase are agreements in which the Company acquires
funds by selling securities or investment grade lease loans to another party
under a simultaneous agreement to repurchase the same securities or lease loans
at a specified price and date. The Company enters into repurchase
agreements and also offers a demand deposit account product to customers that
sweeps their balances in excess of an agreed upon target amount into overnight
repurchase agreements.
The
Company had Federal Home Loan Bank advances with maturity dates less than one
year consisting of $100.0 million in fixed rate advances at December 31, 2009
and $100.8 million in fixed rate advances at December 31, 2008. At
December 31, 2009, the Company had one fixed rate advance with an effective
interest rate of 3.35% and is subject to a prepayment fee. At
December 31, 2009, the advance had a maturity date of January 2010.
A
collateral pledge agreement exists whereby at all times, the Company must keep
on hand, free of all other pledges, liens, and encumbrances, first mortgage
loans and home equity loans with unpaid principal balances aggregating no less
than 133% for first mortgage loans and 200% for home equity loans of the
outstanding secured advances from the Federal Home Loan Bank. As of
December 31, 2009 and 2008, the Company had $464.8 million and $405.0 million,
respectively, of loans pledged as collateral for short-term and long-term
Federal Home Loan Bank advances. Additionally, as of December 31,
2009 and 2008, the Company had $38.2 million and $181.0 million, respectively,
of investment securities pledged as collateral for short-term and long-term
advances from the Federal Home Loan Bank.
MB FINANCIAL,
INC. AND SUBSIDIARIES
NOTES TO
CONSOLIDATED FINANCIAL STATEMENTS
Note
12. Long-term
Borrowings
The
Company had Federal Home Loan Bank advances with original contractual maturities
greater than one year of $219.9 million and $352.5 million at December 31, 2009
and December 31, 2008, respectively. As of December 31, 2009, the advances had
fixed terms with effective interest rates, net of discounts, ranging from 3.26%
to 5.87%.
The
Company had notes payable to banks totaling $20.7 million and $27.7 million at
December 31, 2009 and December 31, 2008, respectively, which as of December 31,
2009, were accruing interest at rates ranging from 3.90% to
10.00%. Lease investments includes equipment with an amortized cost
of $27.8 million and $34.8 million at December 31, 2009 and December 31, 2008,
respectively, that is pledged as collateral on these notes.
The
Company had a $40 million ten year structured repurchase agreement which is
non-putable until 2011 as of December 31, 2009. The borrowing agreement floats
at 3-month LIBOR less 37 basis points and reprices quarterly. The
counterparty to the repurchase agreement has a one-time put option in
2011. If the option is not exercised, the repurchase agreement
converts to a fixed rate borrowing at 4.75% for the remaining term, which would
expire in 2016.
MB
Financial Bank has a $50 million outstanding subordinated debt
facility. Interest is payable at a rate of 3 month LIBOR +
1.70%. The debt matures on October 1, 2017.
The
principal payments on long-term borrowings are due as follows (in
thousands):
|
Amount
|
|
|
Year
ending December 31,
|
|
|
2010
|
$ 47,350
|
|
2011
|
44,884
|
|
2012
|
36,626
|
|
2013
|
8,649
|
|
2014
|
381
|
|
Thereafter
|
193,459
|
|
$ 331,349
|
The
Company has established statutory trusts for the sole purpose of issuing trust
preferred securities and related trust common securities. The
proceeds from such issuances were used by the trusts to purchase junior
subordinated notes of the Company, which are the sole assets of each
trust. Concurrently with the issuance of the trust preferred
securities, the Company issued guarantees for the benefit of the holders of the
trust preferred securities. The trust preferred securities are issues
that qualify, and are treated by the Company, as Tier 1 regulatory
capital. The Company owns all of the common securities of each
trust. The trust preferred securities issued by each trust rank
equally with the common securities in right of payment, except that if an event
of default under the indenture governing the notes has occurred and is
continuing, the preferred securities will rank senior to the common securities
in right of payment. FOBB Capital Trusts I and III were established
by FOBB prior to the Company’s acquisition of FOBB, and the junior subordinated
notes issued by FOBB to FOBB Capital Trusts I and III were assumed by the
Company upon completion of the acquisition.
MB FINANCIAL,
INC. AND SUBSIDIARIES
NOTES TO
CONSOLIDATED FINANCIAL STATEMENTS
The table
below summarizes the outstanding junior subordinated notes and the related trust
preferred securities issued by each trust as of December 31, 2009 (in
thousands):
|
Coal
City
|
MB
Financial
|
MB
Financial (3)
|
MB
Financial (4)
|
|
|
Capital
Trust I
|
Capital
Trust II
|
Capital
Trust III
|
Capital
Trust IV
|
|
|
Junior
Subordinated Notes:
|
||||
|
Principal
balance
|
$ 25,774
|
$ 36,083
|
$ 10,310
|
$ 20,619
|
|
Annual
interest rate
|
3-mo
LIBOR + 1.80%
|
3-mo
LIBOR + 1.40%
|
3-mo
LIBOR + 1.50%
|
3-mo
LIBOR + 1.52%
|
|
Stated
maturity date
|
September
1, 2028
|
September
15, 2035
|
September
23, 2036
|
September
15, 2036
|
|
Call
date
|
September
1, 2008
|
September
15, 2010
|
September
23, 2011
|
September
15, 2011
|
|
Trust
Preferred Securities:
|
||||
|
Face
value
|
$ 25,000
|
$ 35,000
|
$ 10,000
|
$ 20,000
|
|
Annual
distribution rate
|
3-mo
LIBOR + 1.80%
|
3-mo
LIBOR + 1.40%
|
3-mo
LIBOR + 1.50%
|
3-mo
LIBOR + 1.52%
|
|
Issuance
date
|
July
1998
|
August
2005
|
July
2006
|
August
2006
|
|
Distribution
dates (1)
|
Quarterly
|
Quarterly
|
Quarterly
|
Quarterly
|
|
MB
Financial (4)
|
MB
Financial
|
FOBB
(2) (3)
|
FOBB
(2)
|
|
|
Capital
Trust V
|
Capital
Trust VI
|
Capital
Trust I
|
Capital
Trust III
|
|
|
Junior
Subordinated Notes:
|
||||
|
Principal
balance
|
$ 30,928
|
$ 23,196
|
$ 6,186
|
$ 5,155
|
|
Annual
interest rate
|
3-mo
LIBOR + 1.30%
|
3-mo
LIBOR + 1.30%
|
10.60%
|
3-mo
LIBOR + 2.80%
|
|
Stated
maturity date
|
December
15, 2037
|
October
30, 2037
|
September
7, 2030
|
January
23, 2034
|
|
Call
date
|
March
15, 2008
|
October
30, 2012
|
September
7, 2010
|
January
23, 2009
|
|
Trust
Preferred Securities:
|
||||
|
Face
value
|
$ 30,000
|
$ 22,500
|
$ 6,000
|
$ 5,000
|
|
Annual
distribution rate
|
3-mo
LIBOR + 1.30%
|
3-mo
LIBOR + 1.30%
|
10.60%
|
3-mo
LIBOR + 2.80%
|
|
Issuance
date
|
September
2007
|
October
2007
|
September
2000
|
December
2003
|
|
Distribution
dates (1)
|
Quarterly
|
Quarterly
|
Semi-annual
|
Quarterly
|
|
(1)
|
All
distributions are cumulative and paid in
cash.
|
|
(2)
|
Amount
does not include purchase accounting adjustments totaling a premium of
$426 thousand associated with FOBB Capital Trust I and
III.
|
|
(3)
|
Callable
at a premium through 2020.
|
|
(4)
|
Callable
at a premium through 2011.
|
The trust
preferred securities are subject to mandatory redemption, in whole or in part,
upon repayment of the junior subordinated notes at the stated maturity date or
upon redemption on a date no earlier than the call dates noted in the table
above. Prior to these respective redemption dates, the junior
subordinated notes may be redeemed by the Company (in which case the trust
preferred securities would also be redeemed) after the occurrence of certain
events that would have a negative tax effect on the Company or the trusts, would
cause the trust preferred securities to no longer qualify as Tier 1 capital, or
would result in a trust being treated as an investment company. Each
trust’s ability to pay amounts due on the trust preferred securities is solely
dependent upon the Company making payment on the related junior subordinated
notes. The Company’s obligation under the junior subordinated notes
and other relevant trust agreements, in aggregate, constitute a full and
unconditional guarantee by the Company of each trust’s obligations under the
trust preferred securities issued by each trust. The Company has the
right to defer payment of interest on the notes and, therefore, distributions on
the trust preferred securities, for up to five years, but not beyond the stated
maturity date in the table above. During any such deferral period the
Company may not pay cash dividends on its common or preferred stock and
generally may not repurchase its common or preferred stock.
Under the
terms of the securities purchase agreement between the Company and the U.S.
Treasury pursuant to which the Company issued its Series A Preferred Stock as
part to the TARP Capital Purchase Program, prior to the earlier of (i) December
5, 2011 and (ii) the date on which all of the shares of the Series A Preferred
Stock have been redeemed by us or transferred by Treasury to third parties, we
may not redeem our trust preferred securities (or the related junior
subordinated notes), without the consent of Treasury. See
Note 23 below.
MB FINANCIAL,
INC. AND SUBSIDIARIES
NOTES TO
CONSOLIDATED FINANCIAL STATEMENTS
Note
14. Lease
Commitments and Rental Expense
The
Company leases office space for certain branch offices. The future
minimum annual rental commitments for these noncancelable leases and subleases
of such space are as follows (in thousands):
|
Gross
|
Sublease
|
Net
|
||||
|
Year
|
Rents
|
Rents
|
Rents
|
|||
|
2010
|
$ 4,504
|
$
717
|
$ 3,787
|
|||
|
2011
|
4,391
|
743
|
3,648
|
|||
|
2012
|
4,001
|
747
|
3,254
|
|||
|
2013
|
3,623
|
549
|
3,074
|
|||
|
2014
|
3,082
|
566
|
2,516
|
|||
|
Thereafter
|
20,618
|
248
|
20,370
|
|||
|
$ 40,219
|
$ 3,570
|
$ 36,649
|
||||
Under the
terms of these leases, the Company is required to pay its pro rata share of the
cost of maintenance and real estate taxes. Certain leases also
provide for increased rental payments based on increases in the Consumer Price
Index.
Net
rental expense for the years ended December 31, 2009, 2008 and 2007 amounted to
$5.1 million, $3.3 million and $3.6 million, respectively.
Note
15. Employee
Benefit Plans
The
Company has a defined contribution 401(k) profit sharing plan that covers all
full-time employees who have completed three months of service. Each
participant under the plan may contribute up to 75% of his/her eligible
compensation on a pretax basis. The Company's contributions consist
of a discretionary profit-sharing contribution and a matching contribution of
the amounts contributed by the participants. The board of directors
determines the Company’s contributions on an annual basis.
During
2009, each participant was eligible for a maximum total Company matching
contribution of 3.5% of their compensation. Additionally, the Company
may make annual discretionary profit sharing contributions. The
contributions for profit sharing equaled 3.0% of eligible compensation for the
year ended December 31, 2009, 3.0% for the year ended December 31, 2008, and
3.5% for the year ended December 31, 2007. The Company's total
contributions to the plan, for the years ended December 31, 2009, 2008 and 2007,
were approximately $4.4 million, $3.8 million, $3.7 million,
respectively.
The
Company has deferred compensation plans that allow eligible executives, senior
officers and certain other employees and directors to defer payment of up 100%
of their base salary and bonus in the case of employees and board fees in the
case of directors. Discretionary Company contributions to these plans
were approximately $160 thousand, $220 thousand, $263 thousand for the years
ended December 31, 2009, 2008 and 2007, respectively. In addition,
pursuant to the Company’s agreement entered into with the Company’s Chief
Executive Officer, he is entitled to receive on each December 31st
while he is employed by the Company (starting December 31, 2007) a fully vested
employer contribution to his account under the non-stock deferred compensation
plan in amount equal to 20% of his base salary then in effect. The
amounts deferred can be invested in MB Financial stock (under the Company’s
stock deferred compensation plan) or publicly traded mutual funds (under the
Company’s non-stock deferred compensation plan) at the discretion of the
participant. The cost of the MB Financial common stock held by MB
Financial’s deferred compensation plans is reported separately in a manner
similar to treasury stock (that is, changes in fair value are not recognized)
with a corresponding deferred compensation obligation reflected in additional
paid-in capital. The amounts of the assets that are not invested in
MB Financial common stock are recorded at their fair market value in other
assets on the consolidated balance sheet. As of December 31, 2009,
the fair value of the assets held in other publicly traded funds totaled $5.8
million. A liability is established, in other liabilities, in the
consolidated balance sheet, for the fair value of the obligation to the
participants. Any increase or decrease in the fair market value of
plan assets is recorded in other non-interest income on the consolidated
statement of income. Any increase or decrease in the fair value of
the deferred compensation obligation to participants is recorded as additional
compensation expense or a reduction of compensation expense on the consolidated
statement of income. The increase in fair market value of the assets
and the obligation related to the deferred compensation plan was $710 thousand
for the year ended December 31, 2009.
MB FINANCIAL,
INC. AND SUBSIDIARIES
NOTES TO
CONSOLIDATED FINANCIAL STATEMENTS
The
deferred taxes consist of (in thousands):
|
December
31,
|
||||
|
2009
|
2008
|
|||
|
Deferred
tax assets:
|
||||
|
Allowance
for loan losses
|
$ 69,058
|
$ 56,160
|
||
|
Deferred
compensation
|
5,553
|
5,552
|
||
|
Other
real estate owned
|
1,690
|
-
|
||
|
Merger
and non-compete accrual
|
462
|
544
|
||
|
Securities
|
132
|
449
|
||
|
Stock
options, restricted stock, director stock units, and restricted stock
units
|
9,054
|
7,827
|
||
|
Federal
net operating loss carryforwards
|
1,848
|
1,353
|
||
|
State
net operating loss carryforwards
|
20,707
|
17,551
|
||
|
Other
items
|
6,774
|
1,128
|
||
|
Total
deferred tax asset
|
115,278
|
90,564
|
||
|
Valuation
allowance
|
-
|
-
|
||
|
Total
deferred tax asset, net of valuation allowance
|
115,278
|
90,564
|
||
|
Deferred
tax liabilities:
|
||||
|
Securities
discount accretion
|
(106)
|
(603)
|
||
|
Deferred
gain on FDIC assisted transactions
|
(15,142)
|
-
|
||
|
Loans
|
(5,257)
|
(5,486)
|
||
|
Lease
investments
|
(1,522)
|
(1,175)
|
||
|
Premises
and equipment
|
(55,620)
|
(42,118)
|
||
|
Core
deposit intangible
|
(7,172)
|
(8,935)
|
||
|
Federal
Home Loan Bank stock dividends
|
(4,014)
|
(4,014)
|
||
|
Other
items
|
(3,840)
|
(103)
|
||
|
Total
deferred tax liabilities
|
(92,673)
|
(62,434)
|
||
|
Net
deferred tax asset
|
22,605
|
28,130
|
||
|
Net
unrealized holding gain on securities available for sale
|
(3,547)
|
(9,106)
|
||
|
Net
deferred tax asset
|
$ 19,058
|
$ 19,024
|
||
The
Company’s state net operating loss carryforwards totaled approximately $431.4
million at December 31, 2009 and begin to expire in 2010 through
2023. The Company’s Federal net operating loss carryforwards totaled
approximately $4.7 million at December 31, 2009 and expire in 2019.
Income
taxes attributable to continuing operations consist of (in
thousands):
|
Years
Ended December 31,
|
||||||
|
2009
|
2008
|
2007
|
||||
|
Current
(benefit) expense:
|
||||||
|
Federal
|
$ (47,247)
|
$ (1,196)
|
$ 24,153
|
|||
|
State
|
(3,543)
|
216
|
200
|
|||
|
(50,790)
|
(980)
|
24,353
|
||||
|
Deferred
(benefit) expense
|
5,525
|
(22,575)
|
(683)
|
|||
|
$ (45,265)
|
$ (23,555)
|
$ 23,670
|
||||
MB FINANCIAL,
INC. AND SUBSIDIARIES
NOTES TO
CONSOLIDATED FINANCIAL STATEMENTS
The
reconciliation between the statutory federal income tax rate of 35% and the
effective tax rate on income from continuing operations follows (in
thousands):
|
Years
Ended December 31,
|
||||||
|
2009
|
2008
|
2007
|
||||
|
Federal
income tax (benefit) expense at expected statutory rate
|
$ (27,245)
|
$ (2,741)
|
$ 29,755
|
|||
|
Increase
(decrease) due to:
|
||||||
|
Tax
exempt income, net
|
(6,055)
|
(5,521)
|
(4,355)
|
|||
|
Nonincludable
increase in cash surrender value of life insurance
|
(847)
|
(1,855)
|
(1,740)
|
|||
|
Removal
of valuation reserve on state net operating loss
carryforwards
|
-
|
(10,100)
|
-
|
|||
|
Adjustment
of tax contingency reserves
|
(7,723)
|
4,232
|
-
|
|||
|
State
tax, net of federal benefit
|
(2,477)
|
(7,003)
|
130
|
|||
|
Other
items, net
|
(918)
|
(567)
|
(120)
|
|||
|
Income
tax (benefit) expense
|
$ (45,265)
|
$ (23,555)
|
$ 23,670
|
|||
Accounting
for Uncertainty in Income Taxes: ASC Topic 740 provides guidance on financial
statement recognition and measurement of tax positions taken, or expected to be
taken, in tax returns.
During
2009, the Company increased the amount of benefit recognized with respect to
certain previously identified uncertain tax positions as a result of
developments in tax audits. A reconciliation of the change in
unrecognized tax benefits from January 1, 2009 to December 31, 2009 is as
follows (in thousands):
|
Unrecognized
Tax Benefit Without Interest
|
Interest
on unrecognized Tax Benefit
|
Total
Unrecognized Tax Benefit Including Interest
|
|
|
Balance
at January 1, 2009
|
$ 7,050
|
$ 964
|
$ 8,014
|
|
Increases
for tax positions of prior years
|
93
|
187
|
280
|
|
Benefits
recognized
|
(6,902)
|
(1,101)
|
(8,003)
|
|
Balance
at December 31, 2009
|
$ 241
|
$ 50
|
$
291
|
The whole
amount of unrecognized tax benefits would affect the tax provision and the
effective income tax rate if recognized in future periods.
The
Company elects to treat interest and penalties recognized for the underpayment
of income taxes as income tax expense, to the extent not included in
unrecognized tax benefits.
The
Company’s federal income tax returns are open and subject to examination for the
2006 tax return year and from the 2008 tax return year and
forward. The Company’s various state income tax returns are generally
open from the 2002 and later tax return years based on individual state statutes
of limitation. The Company is under examination by Illinois for tax
years 2002 through 2007. The Company is not certain whether these
examinations will be completed within the next twelve
months. Developments in these examinations or other events could
cause management to change its judgment about the amount of unrecognized tax
benefits.
Commitments: The
Company is a party to credit-related financial instruments with
off-balance-sheet risk in the normal course of business to meet the financing
needs of its customers. These financial instruments include
commitments to extend credit, standby letters of credit and commercial letters
of credit. Such commitments involve, to varying degrees, elements of
credit and interest rate risk in excess of the amount recognized in the
consolidated balance sheets.
The
Company's exposure to credit loss is represented by the contractual amount of
these commitments. The Company follows the same credit policies in
making commitments as it does for on-balance-sheet instruments.
MB FINANCIAL,
INC. AND SUBSIDIARIES
NOTES TO
CONSOLIDATED FINANCIAL STATEMENTS
At
December 31, 2009 and 2008, the following financial instruments were
outstanding, the contractual amounts of which represent off-balance sheet credit
risk (in thousands):
|
Contractual
Amount
|
||
|
2009
|
2008
|
|
|
Commitments
to extend credit:
|
||
|
Home
equity lines
|
$
330,856
|
$
376,854
|
|
Other
commitments
|
1,135,137
|
1,261,276
|
|
Letters
of credit:
|
||
|
Standby
|
136,250
|
119,504
|
|
Commercial
|
1,233
|
55,269
|
Commitments
to extend credit are agreements to lend to a customer as long as there is no
violation of any condition established in the contract. Commitments
generally have fixed expiration dates or other termination clauses and may
require a payment of a fee. The commitments for home equity lines of
credit may expire without being drawn upon.
Therefore,
the total commitment amounts do not necessarily represent future cash
requirements. The amount of collateral obtained, if it is deemed
necessary by the Company, is based on management’s credit evaluation of the
customer.
The
Company, in the normal course of its business, regularly offers standby and
commercial letters of credit to its bank customers. Standby and
commercial letters of credit are a conditional but irrevocable form of
guarantee. Under letters of credit, the Company typically guarantees
payment to a third party beneficiary upon the default of payment or
nonperformance by the bank customer and upon receipt of complying documentation
from that beneficiary.
Both
standby and commercial letters of credit may be issued for any length of time,
but normally do not exceed a period of five years. These letters of
credit may also be extended or amended from time to time depending on the bank
customer's needs. As of December 31, 2009, the maximum remaining term
for any standby letter of credit was December 31, 2014. A fee of up
to two percent of face value may be charged to the bank customer and is
recognized as income over the life of the letter of credit, unless considered
non-rebatable under the terms of a letter of credit application.
At
December 31, 2009, the aggregate contractual amount of these letters of credit,
which represents the maximum potential amount of future payments that the
Company would be obligated to pay, decreased $37.3 million to $137.5 million
from $174.8 million at December 31, 2008. Of the $137.5 million in
commitments outstanding at December 31, 2009, approximately $82.8 million of the
letters of credit have been issued or renewed since December 31,
2008. The Company had a $569 thousand liability recorded as of
December 31, 2009 relating to these commitments.
Letters
of credit issued on behalf of bank customers may be done on either a secured,
partially secured or an unsecured basis. If a letter credit is
secured or partially secured, the collateral can take various forms including
bank accounts, investments, fixed assets, inventory, accounts receivable or real
estate, among other things. The Company takes the same care in making
credit decisions and obtaining collateral when it issues letters of credit on
behalf of its customers, as it does when making other types of
loans.
Concentrations of credit
risk: The majority of the loans, commitments to extend credit and standby
letters of credit have been granted to customers in the Company's market
area. Investments in securities issued by states and political
subdivisions also involve governmental entities primarily within the Company's
market area. The geographic distribution of commitments to extend
credit approximates the distribution of loans outstanding. Standby
letters of credit are granted primarily to commercial borrowers.
Contingencies: In the
normal course of business, the Company is involved in various legal
proceedings. In the opinion of management, any liability resulting
from pending proceedings would not be expected to have a material adverse effect
on the Company's consolidated financial statements.
MB FINANCIAL,
INC. AND SUBSIDIARIES
NOTES TO
CONSOLIDATED FINANCIAL STATEMENTS
As of
December 31, 2009, the Company had approximately $29.2 million in capital
expenditure commitments outstanding which relate to various projects to renovate
existing branches and commitments to purchase branch facilities related to our
FDIC transactions (see Note 2 above).
The
Company's primary source of cash is dividends from its subsidiary
bank. The subsidiary bank is subject to certain restrictions on the
amount of dividends that it may declare without prior regulatory
approval. In addition, the dividends declared cannot be in excess of
the amount which would cause the subsidiary bank to fall below the minimum
required for capital adequacy purposes.
The
Company and its subsidiary bank are subject to various regulatory capital
requirements administered by the federal banking agencies. Failure to
meet minimum capital requirements can initiate certain mandatory – and
additional discretionary – actions by regulators that, if undertaken, could have
a direct material effect on the Company's financial statements. Under
capital adequacy guidelines and the regulatory framework for prompt corrective
action, the Company's and its subsidiary bank’s assets, liabilities, and certain
off-balance-sheet items are calculated under regulatory accounting
practices. The Company's and its subsidiary bank’s capital amounts
and classification are also subject to qualitative judgments by the regulators
about components, risk weightings, and other factors. Prompt
corrective action provisions are not applicable to bank holding
companies.
Quantitative
measures established by regulation to ensure capital adequacy require the
Company and its subsidiary bank to maintain minimum amounts and ratios (set
forth in the table below) of total and Tier 1 capital (as defined in the
regulations) to risk-weighted assets (as defined), and of Tier 1 capital (as
defined) to average assets (as defined). Management believes the
Company and its subsidiary bank met all capital adequacy requirements to which
they are subject as of December 31, 2009 and 2008.
As of
December 31, 2009, the most recent notification from the Federal Deposit
Insurance Corporation categorized the subsidiary bank as “well capitalized”
under the regulatory framework for prompt corrective action. To be
categorized as “well capitalized” the subsidiary bank must maintain the total
risk-based, Tier 1 risk-based, and Tier 1 leverage ratios as set forth in the
well-capitalized column in the table below. There are no conditions
or events since that notification that management believes have changed the
subsidiary bank’s categories.
MB FINANCIAL,
INC. AND SUBSIDIARIES
NOTES TO
CONSOLIDATED FINANCIAL STATEMENTS
The
required and actual amounts and ratios for the Company and its subsidiary bank
are presented below (dollars in thousands):
|
To
Be Well
|
|||||||||
|
Capitalized
Under
|
|||||||||
|
For
Capital
|
Prompt
Corrective
|
||||||||
|
Actual
|
Adequacy
Purposes
|
Action
Provisions
|
|||||||
|
Amount
|
Ratio
|
Amount
|
Ratio
|
Amount
|
Ratio
|
||||
|
As
of December 31, 2009
|
|||||||||
|
Total
capital (to risk-weighted assets):
|
|||||||||
|
Consolidated
|
$ 1,130,496
|
15.45%
|
$ 585,205
|
8.00%
|
N/A
|
N/A
|
|||
|
MB
Financial Bank
|
965,507
|
13.25%
|
583,035
|
8.00%
|
$ 728,793
|
10.00%
|
|||
|
Tier
1 capital (to risk-weighted assets):
|
|||||||||
|
Consolidated
|
988,335
|
13.51%
|
292,603
|
4.00%
|
N/A
|
N/A
|
|||
|
MB
Financial Bank
|
823,346
|
11.30%
|
291,517
|
4.00%
|
437,276
|
6.00%
|
|||
|
Tier
1 capital (to average assets):
|
|||||||||
|
Consolidated
|
988,335
|
8.71%
|
453,939
|
4.00%
|
N/A
|
N/A
|
|||
|
MB
Financial Bank
|
823,346
|
7.27%
|
452,938
|
4.00%
|
566,172
|
5.00%
|
|||
|
As
of December 31, 2008
|
|||||||||
|
Total
capital (to risk-weighted assets):
|
|||||||||
|
Consolidated
|
$
936,027
|
14.08%
|
$ 531,968
|
8.00%
|
N/A
|
N/A
|
|||
|
MB
Financial Bank
|
759,845
|
11.46%
|
530,595
|
8.00%
|
$ 663,243
|
10.00%
|
|||
|
Tier
1 capital (to risk-weighted assets):
|
|||||||||
|
Consolidated
|
802,384
|
12.07%
|
265,984
|
4.00%
|
N/A
|
N/A
|
|||
|
MB
Financial Bank
|
626,185
|
9.44%
|
265,297
|
4.00%
|
397,946
|
6.00%
|
|||
|
Tier
1 capital (to average assets):
|
|||||||||
|
Consolidated
|
802,384
|
9.85%
|
325,872
|
4.00%
|
N/A
|
N/A
|
|||
|
MB
Financial Bank
|
626,185
|
7.70%
|
325,300
|
4.00%
|
406,625
|
5.00%
|
|||
N/A – not
applicable
ASC Topic
820 defines fair value as the price that would be received to sell an asset or
paid to transfer a liability in an orderly transaction between market
participants. A fair value measurement assumes that the transaction
to sell the asset or transfer the liability occurs in the principal market for
the asset or liability or, in the absence of a principal market, the most
advantageous market for the asset or liability. The price in the
principal (or most advantageous) market used to measure the fair value of the
asset or liability shall not be adjusted for transaction costs. An
orderly transaction is a transaction that assumes exposure to the market for a
period prior to the measurement date to allow for marketing activities that are
usual and customary for transactions involving such assets and liabilities; it
is not a forced transaction. Market participants are buyers and
sellers in the principal market that are (i) independent, (ii) knowledgeable,
(iii) able to transact and (iv) willing to transact.
ASC Topic
820 requires the use of valuation techniques that are consistent with the market
approach, the income approach and/or the cost approach. The market
approach uses prices and other relevant information generated by market
transactions involving identical or comparable assets and
liabilities. The income approach uses valuation techniques to convert
expected future amounts, such as cash flows or earnings, to a single present
value amount on a discounted basis. The cost approach is based on the
amount that currently would be required to replace the service capacity of an
asset (replacement cost). Valuation techniques should be consistently
applied. Inputs to valuation techniques refer to the assumptions that
market participants would use in pricing the asset or
liability. Inputs may be observable, meaning those that reflect the
assumptions market participants would use in pricing the asset or liability
developed based on market data obtained from independent sources, or
unobservable, meaning those that reflect the reporting entity's own assumptions
about the assumptions market participants would use in pricing the asset or
liability developed based on the best information available in the
circumstances. In that regard, ASC Topic 820 establishes a fair value
hierarchy for valuation inputs that gives the highest priority to quoted prices
in active markets for identical assets or liabilities and the lowest priority to
unobservable inputs. The fair value hierarchy is as
follows:
MB FINANCIAL,
INC. AND SUBSIDIARIES
NOTES TO
CONSOLIDATED FINANCIAL STATEMENTS
Level
1: Quoted prices (unadjusted) for identical assets or liabilities in
active markets that the entity has the ability to access as of the measurement
date.
Level
2: Significant other observable inputs other than Level 1 prices such
as quoted prices for similar assets or liabilities; quoted prices in markets
that are not active; or other inputs that are observable or can be corroborated
by observable market data.
Level
3: Significant unobservable inputs that reflect a reporting entity’s
own assumptions about the assumptions that market participants would use in
pricing an asset or liability.
A
description of the valuation methodologies used for instruments measured at fair
value, as well as the general classification of such instruments pursuant to the
valuation hierarchy, is set forth below.
In
general, fair value is based upon quoted market prices, where
available. If such quoted market prices are not available, fair value
is based upon internally developed models that primarily use, as inputs,
observable market-based parameters. Valuation adjustments may be made
to ensure that financial instruments are recorded at fair
value. These adjustments may include amounts to reflect counterparty
credit quality, the Company's creditworthiness, among other things, as well as
unobservable parameters. Any such valuation adjustments are applied
consistently over time. Our valuation methodologies may produce a
fair value calculation that may not be indicative of net realizable value or
reflective of future fair values. While management believes the
Company’s valuation methodologies are appropriate and consistent with other
market participants, the use of different methodologies or assumptions to
determine the fair value of certain financial instruments could result in a
different estimate of fair value at the reporting date.
Financial Instruments
Recorded at Fair Value on a Recurring Basis
Securities
Available for Sale. The fair values of
securities available for sale are determined by quoted prices in active markets,
when available. If quoted market prices are not available, the fair
value is determined by a matrix pricing, which is a mathematical technique,
widely used in the industry to value debt securities without relying exclusively
on quoted prices for the specific securities but rather by relying on the
securities’ relationship to other benchmark quoted securities.
Assets Held in
Trust for Deferred Compensation and Associated Liabilities. Assets held in trust
for deferred compensation are recorded at fair value and included in “Other
Assets” on the consolidated balance sheets. These assets are invested
in mutual funds and classified as Level 1. Deferred compensation
liabilities, also classified as Level 1, are carried at the fair value of the
obligation to the employee, which corresponds to the fair value of the invested
assets.
Derivatives. Currently, we use interest
rate swaps to manage our interest rate risk. The valuation of these
instruments is determined using widely accepted valuation techniques including
discounted cash flow analysis on the expected cash flows of each
derivative. This analysis reflects the contractual terms of the
derivatives, including the period to maturity, and uses observable market-based
inputs, including LIBOR rate curves. We also obtain dealer quotations
for these derivatives for comparative purposes to assess the reasonableness of
the model valuations.
MB FINANCIAL,
INC. AND SUBSIDIARIES
NOTES TO
CONSOLIDATED FINANCIAL STATEMENTS
The
following table summarizes financial assets and financial liabilities measured
at fair value on a recurring basis as of December 31, 2009 and 2008,
segregated by the level of the valuation inputs within the fair value hierarchy
utilized to measure fair value (in thousands):
|
Total
|
Quoted
Prices
in
Active Markets
for
Identical Assets
(Level
1)
|
Significant
Other
Observable
Inputs
(Level
2)
|
Significant
Unobservable
Inputs
(Level
3)
|
|||
|
2009
|
||||||
|
Financial
assets
|
||||||
|
Securities
available for sale:
|
||||||
|
Government
sponsored agencies and enterprises
|
$ 70,239
|
$
-
|
$
70,239
|
$
-
|
||
|
States
and political subdivisions
|
380,234
|
5,157
|
375,077
|
-
|
||
|
Residential
mortgage-backed securities
|
2,377,051
|
105,828
|
2,269,691
|
1,532
|
||
|
Corporate
bonds
|
11,395
|
-
|
5,030
|
6,365
|
||
|
Equity
securities
|
4,314
|
4,314
|
-
|
-
|
||
|
Assets
held in trust for deferred compensation
|
5,785
|
5,785
|
-
|
-
|
||
|
Derivative
financial instruments
|
12,752
|
-
|
12,752
|
-
|
||
|
Financial
liabilities
|
||||||
|
Other
liabilities (1)
|
5,785
|
5,785
|
-
|
-
|
||
|
Derivative
financial instruments
|
12,092
|
-
|
12,092
|
-
|
||
|
2008
|
||||||
|
Financial
assets
|
||||||
|
Securities
available for sale:
|
||||||
|
Government
sponsored agencies and enterprises
|
$
179,373
|
$ -
|
$ 179,373
|
$ -
|
||
|
States
and political subdivisions
|
427,999
|
-
|
427,999
|
-
|
||
|
Residential
mortgage-backed securities
|
690,285
|
111,533
|
578,752
|
-
|
||
|
Corporate
bonds
|
34,565
|
14,030
|
18,905
|
1,630
|
||
|
Equity
securities
|
3,606
|
3,606
|
-
|
-
|
||
|
Debt
securities issued by foreign governments
|
302
|
-
|
302
|
-
|
||
|
Assets
held in trust for deferred compensation
|
5,383
|
5,383
|
-
|
-
|
||
|
Derivative
financial instruments
|
25,835
|
-
|
25,835
|
-
|
||
|
Financial
liabilities
|
||||||
|
Other
liabilities (1)
|
5,383
|
5,383
|
-
|
-
|
||
|
Derivative
financial instruments
|
24,169
|
-
|
24,169
|
-
|
||
|
(1)
Liabilities associated with assets held in trust for deferred
compensation
|
||||||
The
following table presents additional information about financial assets measured
at fair value on a recurring basis for which the Company used significant
unobservable inputs (Level 3):
|
Year Ended
|
|||
|
(in
thousands)
|
December
31, 2009
|
December
31, 2008
|
|
|
Balance,
beginning of period
|
$ 1,630
|
$ -
|
|
|
Transfer
into Level 3
|
6,283
|
1,911
|
|
|
Net
unrealized losses
|
(16)
|
-
|
|
|
Impairment
charge
|
-
|
(281)
|
|
|
$ 7,897
|
$ 1,630
|
||
MB FINANCIAL,
INC. AND SUBSIDIARIES
NOTES TO
CONSOLIDATED FINANCIAL STATEMENTS
Financial Instruments
Recorded at Fair Value on a Nonrecurring Basis
The
Company may be required, from time to time, to measure certain financial assets
and financial liabilities at fair value on a nonrecurring basis in accordance
with U.S. generally accepted accounting principles. These include
assets that are measured at the lower of cost or market value that were
recognized at fair value below cost at the end of the period.
Impaired
Loans. Loans for which it is
probable that payment of interest and principal will not be made in accordance
with the contractual terms of the loan agreement are considered
impaired. Once a loan is identified as individually impaired,
management measures impairment in accordance with ASC Topic 310. The
fair value of impaired loans is estimated using one of several methods,
including collateral value, market value of similar debt, enterprise value,
liquidation value and discounted cash flows. Those impaired loans not
requiring an allowance represent loans for which the fair value of the expected
repayments or collateral exceed the recorded investments in such
loans. At December 31, 2009, substantially all of the total impaired
loans were evaluated based on the fair value of the collateral. In
accordance with ASC Topic 820, impaired loans where an allowance is established
based on the fair value of collateral require classification in the fair value
hierarchy. Collateral values are estimated using Level 3 inputs based
on customized discounting criteria. For a majority of impaired loans,
the Company obtains a current external appraisal. Other valuation
techniques are used as well, including internal valuations, comparable property
analysis and contractual sales information. For substantially all
impaired loans with an appraisal more than 6 months old, the Company often
further discounts market prices by 15%-30% and in some cases, up to an
additional 50%. This discount is based on our evaluation of related
market conditions and is in addition to a reduction in value for potential sales
costs and discounting that has been incorporated in the independent
appraisal.
Non-Financial Assets and
Non-Financial Liabilities Recorded at Fair Value
Application
of ASC Topic 820 to non-financial assets and non-financial liabilities
became effective January 1, 2009. The Company has no non-financial assets
or non-financial liabilities measured at fair value on a recurring basis.
Certain non-financial assets and non-financial liabilities measured at fair
value on a non-recurring basis include foreclosed assets and other non-financial
long-lived assets measured at fair value.
Other Real Estate
and Repossessed Vehicles Owned (Foreclosed Assets). Foreclosed
assets, upon initial recognition, are measured and reported at fair value
through a charge-off to the allowance for possible loan losses based upon the
fair value of the foreclosed asset. The fair value of foreclosed
assets, upon initial recognition, are estimated using Level 3 inputs based on
customized discounting criteria.
Non-Financial
Long-Lived Assets. During 2009, the Company conducted an
impairment review of branch office locations to be consolidated due to the
Company’s recent acquisitions (see Note
2). As a result, the Company recognized a $4.0 million
impairment charge related to three branches in 2009. The fair values
of the branches were estimated using Level 3 inputs based on internal
appraisals.
MB FINANCIAL,
INC. AND SUBSIDIARIES
NOTES TO
CONSOLIDATED FINANCIAL STATEMENTS
Assets
measured at fair value on a nonrecurring basis as of December 31, 2009 and
2008 are included in the table below (in thousands):
|
Total
|
Quoted
Prices
in
Active Markets
for
Identical Assets
(Level
1)
|
Significant
Other
Observable
Inputs
(Level
2)
|
Significant
Unobservable
Inputs
(Level
3)
|
|||
|
2009
|
||||||
|
Financial
assets:
|
||||||
|
Impaired
loans
|
$ 205,657
|
$ -
|
$ -
|
$ 205,657
|
||
|
Foreclosed
assets
|
55,470
|
-
|
-
|
55,470
|
||
|
Non-financial
long-lived assets
|
2,656
|
-
|
-
|
2,656
|
||
|
2008
|
||||||
|
Financial
assets:
|
||||||
|
Impaired
loans
|
$ 91,311
|
$ -
|
$
-
|
$ 91,311
|
||
|
Foreclosed
assets
|
4,366
|
-
|
-
|
4,366
|
||
ASC Topic
825 requires disclosure of the fair value of financial assets and financial
liabilities, including those financial assets and financial liabilities that are
not measured and reported at fair value on a recurring basis or non-recurring
basis. The methodologies for estimating the fair value of financial
assets and financial liabilities that are measured at fair value on a recurring
or non-recurring basis are discussed above. The estimated fair value
approximates carrying value for cash and cash equivalents, accrued interest and
the cash surrender value of life insurance policies. The
methodologies for other financial assets and financial liabilities are discussed
below:
The
following methods and assumptions were used by the Company in estimating the
fair values of its other financial instruments:
Cash and due from banks and
interest bearing deposits with banks: The carrying amounts reported in
the balance sheet approximate fair value.
Non-marketable securities –
FHLB and FRB Stock: The carrying amounts reported in the balance sheet
approximate fair value.
Loans: Most
commercial loans and some real estate mortgage loans are made on a variable rate
basis. For those variable-rate loans that reprice frequently with no
significant change in credit risk, fair values are based on carrying
values. The fair values for fixed rate and all other loans are
estimated using discounted cash flow analyses, using interest rates currently
being offered for loans with similar terms to borrowers with similar credit
quality.
Non-interest bearing
deposits: The fair values disclosed are equal to their balance sheet
carrying amounts, which represent the amount payable on demand.
Interest bearing
deposits: The fair values disclosed for deposits with no defined
maturities are equal to their carrying amounts, which represent the amounts
payable on demand. The carrying amounts for variable-rate, fixed-term
money market accounts and certificates of deposit approximate their fair values
at the reporting date. Fair values for fixed-rate certificates of
deposit are estimated using a discounted cash flow calculation that applies
interest rates currently being offered on similar certificates to a schedule of
aggregated expected monthly maturities on time deposits.
Short-term
borrowings: The carrying amounts of federal funds purchased, borrowings
under repurchase agreements and other short-term borrowings with maturities of
90 days or less approximate their fair values. The fair value of
short-term borrowings greater than 90 days is based on the discounted value of
contractual cash flows.
Long-term borrowings:
The fair values of the Company's long-term borrowings (other than deposits) are
estimated using discounted cash flow analyses, based on the Company's current
incremental borrowing rates for similar types of borrowing
arrangements.
MB FINANCIAL,
INC. AND SUBSIDIARIES
NOTES TO
CONSOLIDATED FINANCIAL STATEMENTS
Junior subordinated notes
issued to capital trusts: The fair values of the Company’s junior
subordinated notes issued to capital trusts are estimated based on the quoted
market prices, when available, of the related trust preferred security
instruments, or are estimated based on the quoted market prices of comparable
trust preferred securities.
Off-balance-sheet
instruments: Fair values for the Company's off-balance-sheet lending
commitments (guarantees, letters of credit and commitments to extend credit) are
based on fees currently charged to enter into similar agreements, taking into
account the remaining terms of the agreements.
The
estimated fair values of financial instruments are as follows (in
thousands):
|
December
31,
|
December
31,
|
|||||||
|
2009
|
2008
|
|||||||
|
Carrying
|
Carrying
|
|||||||
|
Amount
|
Fair
Value
|
Amount
|
Fair
Value
|
|||||
|
Financial
Assets:
|
||||||||
|
Cash
and due from banks
|
$ 136,763
|
$
136,763
|
$ 79,824
|
$ 79,824
|
||||
|
Interest
bearing deposits with banks
|
265,257
|
265,257
|
261,834
|
261,880
|
||||
|
Investment
securities available for sale
|
2,843,233
|
2,843,233
|
1,336,130
|
1,336,130
|
||||
|
Non-marketable
securities - FHLB and FRB stock
|
70,361
|
70,361
|
64,246
|
64,246
|
||||
|
Loans,
net
|
6,347,475
|
6,242,972
|
6,084,562
|
6,185,940
|
||||
|
Accrued
interest receivable
|
40,492
|
40,492
|
34,096
|
34,096
|
||||
|
Derivative
financial instruments
|
12,752
|
12,752
|
25,835
|
25,835
|
||||
|
Financial
Liabilities:
|
||||||||
|
Non-interest
bearing deposits
|
$ 1,552,185
|
$ 1,552,185
|
$ 960,117
|
$ 960,117
|
||||
|
Interest
bearing deposits
|
7,131,091
|
7,011,987
|
5,535,454
|
5,561,809
|
||||
|
Short-term
borrowings
|
323,917
|
313,209
|
488,619
|
476,899
|
||||
|
Long-term
borrowings
|
331,349
|
340,514
|
471,466
|
484,454
|
||||
|
Junior
subordinated notes issued to capital trusts
|
158,677
|
92,414
|
158,824
|
94,936
|
||||
|
Accrued
interest payable
|
11,651
|
11,651
|
21,289
|
21,289
|
||||
|
Derivative
financial instruments
|
12,092
|
12,092
|
24,169
|
24,169
|
||||
|
Off-balance-sheet
instruments:
|
||||||||
|
Loan
commitments and standby letters of credit
|
$ -
|
$
1,994
|
$
-
|
$ 3,455
|
||||
ASC Topic
718 requires that the grant date fair value of equity awards to employees be
recognized as compensation expense over the period during which an employee is
required to provide service in exchange for such award.
The
following table summarizes the impact of the Company’s share-based payment plans
in the financial statements for the periods shown (in thousands):
|
Year
Ended December 31,
|
||||||
|
2009
|
2008
|
2007
|
||||
|
Total
cost of share-based payment plans during the year
|
$ 5,138
|
$ 4,911
|
$ 5,223
|
|||
|
Amount
of related income tax benefit recognized in income
|
$ 1,964
|
$ 1,663
|
$ 1,773
|
|||
The
Company adopted the Omnibus Incentive Plan (the “Omnibus Plan”) in
1997. In April 2007, the Omnibus Plan was modified to add 2,250,000
authorized shares for a total of 6,000,000 shares of common stock for issuance
to directors, officers, and employees of the Company or any of its
subsidiaries. Grants under the Omnibus Plan can be in the form of
options intended to be incentive stock options, non-qualified stock options,
stock appreciation rights, restricted stock, restricted stock units, performance
shares, performance units, other stock-based awards and cash
awards. As of December 31, 2009, there are 806,353 shares available
for grant, of which, 447,812 shares may be granted for awards in the form of
restricted stock, restricted stock units, performance shares, performance units,
or other stock-based awards.
MB FINANCIAL,
INC. AND SUBSIDIARIES
NOTES TO
CONSOLIDATED FINANCIAL STATEMENTS
Annual
equity-based incentive awards are typically granted to officers and employees in
the middle of the year. Options are granted with an exercise price
equal to no less than the market price of the Company’s shares at the date of
grant; those option awards generally vest based on four years of continuous
service and have 10-year contractual terms. Options may also be
granted at other times throughout the year in connection with the recruitment of
new officers and employees. Restricted shares granted to officers and
employees typically vest over a two to three year period. Directors
currently may elect, in lieu of cash, to receive up to 70% of their fees in
stock options with a five-year term which are fully vested on the grant date
(provided that the director may not sell the underlying shares for at least six
months after the grant date), and up to 100% of their fees in restricted stock,
which vests one year after the grant date.
The
following table summarizes stock options outstanding for the year ended December
31, 2009:
|
Weighted
|
Remaining
|
Aggregate
|
||||||
|
Average
|
Contractual
|
Intrinsic
|
||||||
|
Number
of
|
Exercise
|
Term
|
Value
|
|||||
|
Options
|
Price
|
(In
Years)
|
(in
thousands)
|
|||||
|
Options
outstanding as of January 1, 2009
|
3,241,278
|
$ 29.44
|
||||||
|
Granted
|
137,025
|
12.67
|
||||||
|
Exercised
|
(46,348)
|
9.46
|
||||||
|
Expired
or cancelled
|
(99,554)
|
30.44
|
||||||
|
Forfeited
|
(34,680)
|
32.18
|
||||||
|
Options
outstanding as of December 31, 2009
|
3,197,721
|
$ 28.95
|
5.67
|
$
1,885
|
||||
|
Options
exercisable as of December 31, 2009
|
1,482,596
|
$ 28.87
|
3.17
|
$
1,115
|
The fair
value of each option award is estimated on the date of grant using the Black
Scholes option-pricing model based on certain assumptions. Expected
volatility is based on historical volatilities of Company shares. The
risk free rate for periods within the contractual term of the option is based on
the U.S. Treasury yield curve in effect at the time of the grant. The
expected life of options is estimated based on historical employee behavior and
represents the period of time that options granted are expected to remain
outstanding. These assumptions are summarized in the following
table.
|
For
the Years Ended December 31,
|
|||||
|
2009
|
2008
|
2007
|
|||
|
Risk-free
interest rate
|
2.66%
|
3.61%
|
4.80%
|
||
|
Volatility
of Company's stock
|
35.91%
|
18.92%
|
16.84%
|
||
|
Expected
dividend yield
|
1.25%
|
2.95%
|
2.19%
|
||
|
Expected
life of options
|
5
years
|
6
years
|
6
years
|
||
|
Weighted
average fair value per option of options granted during the
year
|
$ 4.20
|
$ 3.84
|
$ 6.27
|
||
The total
intrinsic value of options exercised during the years ended December 31, 2009,
2008 and 2007 was $194 thousand, $3.3 million and $2.8 million,
respectively.
MB FINANCIAL,
INC. AND SUBSIDIARIES
NOTES TO
CONSOLIDATED FINANCIAL STATEMENTS
The
following is a summary of changes in restricted shares for the year ended
December 31, 2009:
|
Weighted
Average
|
||||
|
Number
of Shares
|
Grant
Date Fair Value
|
|||
|
Shares
Outstanding at December 31, 2008
|
222,233
|
$ 29.29
|
||
|
Granted
|
357,590
|
10.55
|
||
|
Vested
|
(44,962)
|
34.39
|
||
|
Forfeited
|
(8,215)
|
25.62
|
||
|
Shares
Outstanding at December 31, 2009
|
526,646
|
$ 16.19
|
During
2009, the Company issued 164,401 shares of performance-based restricted
stock. Because the performance component of the vesting terms has
been satisfied, which required that the closing price of the Company’s common
stock be at least $18.14 (150% of the closing price on the grant date) for ten
consecutive trading days, these restricted stock awards generally will vest in
full in 2012, on the third anniversary of the grant date. The terms
of each award also include certain restrictions that may be applicable to the
award recipient to the extent necessary to ensure that the award complies with
the limitations on compensation to which the Company is currently subject as a
result of its participation in the TARP Capital Purchase Program of the U.S.
Department of the Treasury. These restrictions, to the extent
applicable, could result in a reduction in the number of shares comprising the
award and/or affect the vesting of the award and transferability of the
shares. A Monte Carlo simulation model was used to value the
performance based restricted stock awards at the time of
issuance. Inputs are similar to those used to value stock options,
discussed above.
As of
December 31, 2009, there was $8.3 million of total unrecognized compensation
cost related to nonvested share-based compensation arrangements (including share
option and nonvested share awards) granted under the Omnibus Plan. At
December 31, 2009, the weighted-average period over which the unrecognized
compensation expense is expected to be recognized was two years.
ASC Topic
815 requires the Company to designate each derivative contract at inception as
either a fair value hedge or a cash flow hedge. Currently, the
Company has only fair value hedges in the portfolio. For fair value
hedges, the interest rate swaps are structured so that all of the critical terms
of the hedged items match the terms of the appropriate leg of the interest rate
swaps at inception of the hedging relationship. The Company tests
hedge effectiveness on a quarterly basis for all fair value
hedges. For prospective and retrospective hedge effectiveness, we use
the dollar offset approach. In periodically assessing retrospectively
the effectiveness of a fair value hedge in having achieved offsetting changes in
fair values under a dollar-offset approach, the Company uses a cumulative
approach on individual fair value hedges.
The
Company uses interest rate swaps to hedge its interest rate risk. The
Company had fair value commercial loan interest rate swaps with an aggregate
notional amount of $10.1 million at December 31, 2009. For fair value
hedges, the changes in fair values of both the hedging derivative and the hedged
item were recorded in current earnings as other income and other
expense. When a fair value hedge no longer qualifies for hedge
accounting, previous adjustments to the carrying value of the hedged item are
reversed immediately to current earnings and the hedge is reclassified to a
trading position.
We also
offer various derivatives, including foreign currency forward contracts, to our
customers and offset our exposure from such contracts by purchasing other
financial contracts. The customer accommodations and any offsetting
financial contracts are treated as non-hedging derivative instruments which do
not qualify for hedge accounting. The notional amounts and fair
values of open foreign currency forward contracts were not significant at
December 31, 2009 and December 31, 2008.
Interest
rate swap contracts involve the risk of dealing with counterparties and their
ability to meet contractual terms. The net amount payable or
receivable under interest rate swaps is accrued as an adjustment to interest
income. The net amount receivable for December 31, 2009 was
approximately $92 thousand and the net amount receivable for December 31, 2008
was approximately $596 thousand. The Company's credit exposure on
interest rate swaps is limited to the Company's net favorable value and interest
payments of all swaps to each counterparty. In such cases collateral
is required from the counterparties involved if the net value of the swaps
exceeds a nominal amount. At December 31, 2009, the Company's credit
exposure relating to interest rate swaps was approximately $15.3
million.
MB FINANCIAL,
INC. AND SUBSIDIARIES
NOTES TO
CONSOLIDATED FINANCIAL STATEMENTS
The
Company’s derivative financial instruments are summarized below as of December
31, 2009 and December 31, 2008 (dollars in thousands):
|
December
31, 2009
|
December
31, 2008
|
||||||||
|
Weighted
Average
|
|||||||||
|
Balance
Sheet
|
Notional
|
Estimated
|
Years
to
|
Receive
|
Pay
|
Notional
|
Estimated
|
||
|
Location
|
Amount
|
Fair
Value
|
Maturity
|
Rate
|
Rate
|
Amount
|
Fair
Value
|
||
|
Derivative
instruments designated as hedges of fair value:
|
|||||||||
|
Pay
fixed/receive variable swaps (1)
|
Other
liabilities
|
$ 10,112
|
$
581
|
3.5
|
2.36%
|
6.23%
|
$ 13,039
|
$ 1,022
|
|
|
Receive
fixed/pay variable swaps (2)
|
Other
assets
|
-
|
-
|
-
|
-
|
-
|
57,177
|
631
|
|
|
Non-hedging
derivative instruments (3)
|
|||||||||
|
Pay
fixed/receive variable swaps
|
Other
liabilities
|
255,643
|
(12,673)
|
6.4
|
2.20%
|
5.95%
|
203,040
|
(24,169)
|
|
|
Pay
variable/receive fixed swaps
|
Other
assets
|
265,643
|
12,752
|
6.2
|
5.88%
|
2.12%
|
204,863
|
24,182
|
|
|
Total
portfolio swaps
|
$ 531,398
|
$
660
|
6.2
|
4.04%
|
4.04%
|
$ 478,119
|
$ 1,666
|
||
|
(1)
Hedged fixed-rate commercial real estate loans
|
|||||||||
|
(2)
Hedges fixed-rate callable brokered deposits
|
|||||||||
|
(3)
These portfolio swaps are not designated as hedging instruments under ASC
Topic 815.
|
|||||||||
Amounts
included in the consolidated statements of income related to interest rate
derivatives designated as hedges of fair value were as follows (dollars in
thousands):
|
Location
of Gain or (Loss)
|
||||||||
|
Recognized
in Income on
|
Year
Ended
|
|||||||
|
Derivatives
|
December
31,
|
|||||||
|
2009
|
2008
|
2007
|
||||||
|
Interest
rate swaps
|
Other
income
|
$ 298
|
$ (294)
|
$ 306
|
||||
Amounts
included in the consolidated statements of income related to non-hedging
derivative instruments were as follows (dollars in thousands):
|
Location
of Gain or (Loss)
|
||||||||
|
Recognized
in Income on
|
Year
Ended
|
|||||||
|
Derivatives
|
December
31,
|
|||||||
|
2009
|
2008
|
2007
|
||||||
|
Interest
rate swaps
|
Other
income
|
$
65
|
$
105
|
$ (218)
|
||||
Methods
and assumptions used by the Company in estimating the fair value of its interest
rate swaps are discussed in Note 19 to consolidated
financial statements.
MB FINANCIAL,
INC. AND SUBSIDIARIES
NOTES TO
CONSOLIDATED FINANCIAL STATEMENTS
Note
22. Condensed
Parent Company Financial Information
The
condensed financial statements of MB Financial, Inc. (parent company only) are
presented below:
|
Balance
Sheets
|
||||
|
(In
thousands)
|
||||
|
December
31,
|
||||
|
2009
|
2008
|
|||
|
Assets
|
||||
|
Cash
|
$ 142,901
|
$ 161,479
|
||
|
Investments
in subsidiaries
|
1,240,241
|
1,044,070
|
||
|
Other
assets
|
30,984
|
27,519
|
||
|
Total
assets
|
$ 1,414,126
|
$ 1,233,068
|
||
|
Liabilities
and Stockholders' Equity
|
||||
|
Junior
subordinated notes issued to capital trusts
|
$ 158,677
|
$ 158,823
|
||
|
Other
liabilities
|
4,269
|
5,421
|
||
|
Stockholders'
equity
|
1,251,180
|
1,068,824
|
||
|
Total
liabilities and stockholders' equity
|
$ 1,414,126
|
$ 1,233,068
|
||
|
Statements
of Income
|
||||||
|
(In
thousands)
|
||||||
|
Years
Ended December 31,
|
||||||
|
2009
|
2008
|
2007
|
||||
|
Dividends
from continuing subsidiaries
|
$ -
|
$ 30,000
|
$ 88,000
|
|||
|
Dividends
from discontinued subsidiary
|
-
|
-
|
6,500
|
|||
|
Interest
and other income
|
1,805
|
(985)
|
757
|
|||
|
Interest
and other expense
|
(7,816)
|
(8,278)
|
(18,201)
|
|||
|
Income
(loss) before income tax benefit and equity in undistributed net income of
subsidiaries
|
(6,011)
|
20,737
|
77,056
|
|||
|
Income
tax benefit
|
(2,321)
|
(3,370)
|
(6,105)
|
|||
|
Income
(loss) before equity in undistributed net income of
subsidiaries
|
(3,690)
|
24,107
|
83,161
|
|||
|
Equity
in undistributed net income (loss) of continuing
subsidiaries
|
(28,889)
|
(8,382)
|
(15,316)
|
|||
|
Equity
in undistributed net income from discontinued operations
|
6,453
|
439
|
26,018
|
|||
|
Net
(loss) income
|
(26,126)
|
16,164
|
93,863
|
|||
|
Dividends
on preferred shares
|
10,298
|
789
|
-
|
|||
|
Net
income (loss) available to common shareholders
|
$ (36,424)
|
$ 15,375
|
$ 93,863
|
|||
MB FINANCIAL,
INC. AND SUBSIDIARIES
NOTES TO
CONSOLIDATED FINANCIAL STATEMENTS
|
Statements
of Cash Flows
|
||||||
|
(In
thousands)
|
||||||
|
Years
Ended December 31,
|
||||||
|
2009
|
2008
|
2007
|
||||
|
Cash
Flows From Operating Activities
|
||||||
|
Net
(loss) income
|
$ (26,126)
|
$ 16,164
|
$
93,863
|
|||
|
Adjustments
to reconcile net income to net cash provided by operating
activities:
|
||||||
|
Amortization
of restricted stock awards
|
2,684
|
2,228
|
2,113
|
|||
|
Compensation
expense for stock option grants
|
2,454
|
651
|
3,111
|
|||
|
Equity
in undistributed net income of continuing subsidiaries
|
28,889
|
8,382
|
15,316
|
|||
|
Equity
in undistributed net income from discontinued operations
|
(6,453)
|
(439)
|
(26,018)
|
|||
|
Change
in other assets and other liabilities
|
(11,460)
|
(30,963)
|
(7,845)
|
|||
|
Net
cash (used in) provided by operating activities
|
(10,012)
|
(3,977)
|
80,540
|
|||
|
Cash
Flows From Investing Activities
|
||||||
|
Investments
in and advances to subsidiaries
|
(225,000)
|
(50,000)
|
(5,000)
|
|||
|
Proceeds
from the sales of other assets
|
-
|
-
|
1,630
|
|||
|
Net
(increase) decrease in loans
|
-
|
7,500
|
(7,500)
|
|||
|
Cash
proceeds received from sale of subsidiary
|
-
|
-
|
76,148
|
|||
|
Net
cash (used in) provided by investing activities
|
(225,000)
|
(42,500)
|
65,278
|
|||
|
Cash
Flows From Financing Activities
|
||||||
|
Treasury
stock transactions, net
|
23,961
|
(1,348)
|
(76,703)
|
|||
|
Stock
options exercised
|
1,269
|
4,585
|
3,789
|
|||
|
Excess
tax benefits from share-based payment arrangements
|
28
|
2,032
|
1,828
|
|||
|
Dividends
paid on common stock
|
(5,449)
|
(25,090)
|
(25,956)
|
|||
|
Dividends
paid on preferred stock
|
(9,256)
|
-
|
-
|
|||
|
Principal
paid long-term debt
|
(500)
|
-
|
-
|
|||
|
Issuance
of preferred stock
|
-
|
192,944
|
-
|
|||
|
Issuance
of common stock warrant
|
-
|
3,056
|
-
|
|||
|
Issuance
of common stock
|
206,381
|
-
|
-
|
|||
|
Proceeds
from junior subordinated notes issued to capital trusts
|
-
|
-
|
52,500
|
|||
|
Principal
paid on junior subordinated notes issued to capital trusts
|
-
|
-
|
(71,800)
|
|||
|
Net
cash provided by (used in) financing activities
|
216,434
|
176,179
|
(116,342)
|
|||
|
Net
increase (decrease) in cash
|
(18,578)
|
129,702
|
29,476
|
|||
|
Cash:
|
||||||
|
Beginning
of year
|
161,479
|
31,777
|
2,301
|
|||
|
End
of year
|
$
142,901
|
$ 161,479
|
$
31,777
|
|||
The
Series A Preferred Stock was issued as part of the Troubled Asset Relief Program
(“TARP”) Capital Purchase Program of the United States Department of the
Treasury (“Treasury”). The Series A Preferred Stock qualifies as Tier
1 capital and pays cumulative dividends on the liquidation preference amount on
a quarterly basis at a rate of 5% per annum for the first five years, and 9% per
annum thereafter. Concurrent with issuing the Series A Preferred
Stock, the Company issued to the Treasury a ten year warrant (the “Warrant”) to
purchase 1,012,048 shares (subsequently reduced to 506,024 shares, as described
below) of the Company’s Common Stock at an exercise price of $29.05 per
share.
The
Company may redeem the Series A Preferred Stock at any time by repaying
Treasury, without penalty, subject to Treasury’s consultation with the Company’s
appropriate regulatory agency. Additionally, upon redemption of the
Series A Preferred Stock, the Warrant may be repurchased from the Treasury at
its fair market value as agreed-upon by the Company and the
Treasury.
MB FINANCIAL,
INC. AND SUBSIDIARIES
NOTES TO
CONSOLIDATED FINANCIAL STATEMENTS
On
September 17, 2009, the Company completed a public offering of its common stock
by issuing 12,578,125 shares of common stock for aggregate gross proceeds of
$201.3 million. The net proceeds to the Company after deducting
underwriting discounts and commissions and offering expenses were approximately
$190.9 million. With the proceeds from this offering and the proceeds
received by the Company from issuances pursuant to its Dividend Reinvestment and
Stock Purchase Plan, the Company has received aggregate gross proceeds from
“Qualified Equity Offerings” in excess of the $196.0 million aggregate
liquidation preference amount of the Series A Preferred Stock. As a
result, the number of shares of the Company’s common stock underlying the
Warrant has been reduced by 50%, from 1,012,048 shares to 506,024
shares.
The
securities purchase agreement between the Company and Treasury provides that
prior to the earlier of (i) December 5, 2011 and (ii) the date on which all of
the shares of the Series A Preferred Stock have been redeemed by the Company or
transferred by Treasury to third parties, the Company may not, without the
consent of Treasury, (a) pay a cash dividend on the Company’s common stock of
more than $0.18 per share or (b) subject to limited exceptions, redeem,
repurchase or otherwise acquire shares of the Company’s common stock or
preferred stock, other than the Series A Preferred Stock, or trust preferred
securities. In addition, under the terms of the Series A Preferred
Stock, the Company may not pay dividends on its common stock unless it is
current in its dividend payments on the Series A Preferred Stock.
Not
applicable.
a) Evaluation of Disclosure
Controls and Procedures: An evaluation of our disclosure controls and
procedures (as defined in Rule 13a-15(e) under the Securities Exchange Act of
1934 (the “Act”)) was carried out as of December 31, 2009 under the supervision
and with the participation of our Chief Executive Officer, Chief Financial
Officer and several other members of our senior management. Our Chief
Executive Officer and Chief Financial Officer concluded that, as of December 31,
2009, our disclosure controls and procedures were effective in ensuring that the
information we are required to disclose in the reports we file or submit under
the Act is (i) accumulated and communicated to our management (including the
Chief Executive Officer and Chief Financial Officer) to allow timely decisions
regarding required disclosure, and (ii) recorded, processed, summarized and
reported within the time periods specified in the SEC’s rules and
forms.
b). Management’s Annual Report
on Internal Control Over Financial Reporting: The annual report of
management on the effectiveness of our internal control over financial reporting
and the attestation report thereon issued by our independent registered public
accounting firm are set forth under “Management’s Report on
Internal Control Over Financial Reporting” and “Report
of Independent Registered Public Accounting Firm” under “Item 8. Financial
Statements and Supplementary Data”.
c) Changes in Internal Control
Over Financial Reporting: During the quarter ended December 31, 2009, no
change occurred in our internal control over financial reporting that has
materially affected, or is reasonably likely to materially affect, our internal
control over financial reporting.
We do not expect that our disclosure controls and procedures and internal
control over financial reporting will prevent all error and all
fraud. A control procedure, no matter how well conceived and
operated, can provide only reasonable, not absolute, assurance that the
objectives of the control procedure are met. Because of the inherent
limitations in all control procedures, no evaluation of controls can provide
absolute assurance that all control issues and instances of fraud, if any,
within the Company have been detected. These inherent limitations
include the realities that judgments in decision-making can be faulty, and that
breakdowns in controls or procedures can occur because of simple error or
mistake. Additionally, controls can be circumvented by the individual
acts of some persons, by collusion of two or more people, or by management
override of the control. The design of any control procedure also is
based in part upon certain assumptions about the likelihood of future events,
and there can be no assurance that any design will succeed in achieving its
stated goals under all potential future conditions; over time, controls may
become inadequate because of changes in conditions, or the degree of compliance
with the policies or procedures may deteriorate. Because of the
inherent limitations in a cost-effective control procedure, misstatements due to
error or fraud may occur and not be detected.
Not
applicable.
Directors
and Executive Officers. The information concerning our
directors and executive officers required by this item is incorporated herein by
reference from our definitive proxy statement for our 2010 Annual Meeting of
Stockholders, a copy of which will be filed with the Securities and Exchange
Commission not later than 120 days after the end of our fiscal
year.
Section
16(a) Beneficial Ownership Reporting Compliance. The
information concerning compliance with the reporting requirements of Section
16(a) of the Securities Exchange Act of 1934 by our directors, officers and ten
percent stockholders required by this item is incorporated herein by reference
from our definitive proxy statement for our 2010 Annual Meeting of Stockholders,
a copy of which will be filed with the Securities and Exchange Commission not
later than 120 days after the end of our fiscal year.
Code of
Ethics. We have adopted a code of ethics that applies to our
principal executive officer, principal financial officer, principal accounting
officer, and persons performing similar functions, and to all of our other
employees and our directors. A copy of our code of ethics is
available on our Internet website address, www.mbfinancial.com.
The information concerning compensation
and other matters required by this item is incorporated herein by reference from
our definitive proxy statement for our 2010 Annual Meeting of Stockholders, a
copy of which will be filed with the Securities and Exchange Commission not
later than 120 days after the end of our fiscal year.
The information concerning security ownership of certain beneficial owners and
management required by this item is incorporated herein by reference from our
definitive proxy statement for our 2010 Annual Meeting of Stockholders, a copy
of which will be filed with the Securities and Exchange Commission no later than
120 days after the end of our fiscal year.
The following table sets forth information as of December 31, 2009 with respect
to compensation plans under which shares of our common stock may be
issued:
| Equity Compensation Plan Information | ||||||
| Plan Category |
Number of
Shares
to be
Issued upon
Exercise of
Outstanding
Options,
warrants
and
rights (1)
|
Weighted
Average
Exercise
Price
of
Outstanding Options,
warrants and
rights (1)
|
Number of
Shares Remaining Available for Future Issuance
Under Equity
Compensation
Plans
(Excluding Shares
Reflected in
the
first
column) (2)
|
|||
| Equity compensation plans approved by stockholders........................................................................ | 3,197,721 | $ 28.95 | 806,353 | |||
| Equity compenstion plans not approved by stockholders................................................................... | N/A | N/A | N/A | |||
| Total............................................................................................................................................................... | 3,197,721 | $ 28.95 | 806,353 | |||
|
(1)
|
Includes
21,158 shares underlying stock options that we assumed in the First
SecurityFed acquisition, and 106,614 shares underlying stock options, and
6,621 shares underlying director stock units that we assumed in the FOBB
acquisition. Since the restricted stock units and the director
stock units do not have an exercise price and are settled only for shares
of our common stock on a one-for-one basis, these units are not relevant
for purposes of computing the weighted average exercise
price.
|
|
(2)
|
Includes
447,812 shares remaining available for future issuance under our Amended
and Restated Omnibus Incentive Plan which could be utilized for
awards to plan participants in the form of restricted stock, restricted
stock units, performance shares, performance units or other stock-based
awards.
|
N/A – not applicable
Not included in the table are shares of our common stock that may be acquired by
directors and officers who participate in the MB Financial, Inc. Stock Deferred
Compensation Plan. This plan, along with the MB Financial, Inc.
Non-Stock Deferred Compensation Plan, allows directors and eligible officers to
defer a portion of their cash compensation. Neither plan has been
approved by our stockholders. All distributions under the stock plan
are made in shares of our common stock purchased by the plan trustee on the open
market, except for fractional shares, which are paid in cash.
The information concerning certain relationships and related transactions and
director independence required by this item is incorporated herein by reference
from our definitive proxy statement for our 2010 Annual Meeting of Stockholders,
a copy of which will be filed with the Securities and Exchange Commission not
later than 120 days after the end of our fiscal year.
The information concerning principal accountant fees and services is
incorporated herein by reference from our definitive proxy statement for our
2010 Annual Meeting of Stockholders, a copy of which will be filed not later
than 120 days after the end of our fiscal year.
|
(a)(1)
|
Financial
Statements: See Part II--Item 8. Financial Statements
and Supplementary Data.
|
|
(a)(2)
|
Financial
Statement Schedules: All financial statement schedules have been omitted
as the information is not required under the related instructions or is
not applicable.
|
|
(a)(3)
|
Exhibits:
See Exhibit Index.
|
|
(b)
|
Exhibits:
See Exhibit Index.
|
Pursuant
to the requirements of Section 13 or 15 (d) of the Securities Exchange Act of
1934, the registrant has duly caused this report to be signed on its behalf by
the undersigned hereunto duly authorized.
MB
FINANCIAL, INC.
(registrant)
By: /s/MITCHELL
FEIGER
Mitchell Feiger
President and Chief Executive
Officer
(Principal Executive
Officer)
Date:
March 4, 2010
Pursuant
to the requirements of the Securities Exchange Act of 1934, this report has been
signed below by the following persons on behalf of the Registrant and in the
capacities and on the dates indicated.
|
Signatures
|
Title
|
|||
|
/s/Mitchell Feiger
|
Director,
President and Chief Executive Officer
|
|||
|
Mitchell
Feiger
|
(Principal
Executive Officer), March 4, 2010
|
|||
|
/s/Jill E. York
|
Vice
President and Chief Financial Officer
|
|||
|
Jill
E. York
|
(Principal
Financial Officer and Principal Accounting Officer), March 4,
2010
|
|||
|
/s/Thomas H. Harvey*
|
Director
|
) March
4, 2010
|
||
|
Thomas
H. Harvey
|
||||
|
/s/David P. Bolger*
|
Director
|
) March
4, 2010
|
||
|
David
P. Bolger
|
||||
|
/s/Robert S. Engleman, Jr.*
|
Director
|
) March
4, 2010
|
||
|
Robert
S. Engleman, Jr.
|
||||
|
/s/Charles J. Gries*
|
Director
|
) March
4, 2010
|
||
|
Charles
J. Gries
|
||||
|
/s/James
N. Hallene*
|
Director
|
) March
4, 2010
|
||
|
James
N. Hallene
|
||||
|
/s/Richard J. Holmstrom*
|
Director
|
) March
4, 2010
|
||
|
Richard
J. Holmstrom
|
||||
|
/s/Karen J. May*
|
Director
|
) March
4, 2010
|
||
|
Karen
J. May
|
||||
|
/s/Patrick Henry*
|
Director
|
) March
4, 2010
|
||
|
Patrick
Henry
|
||||
|
/s/Ronald D. Santo*
|
Director
|
) March
4, 2010
|
||
|
Ronald
D. Santo
|
||||
|
*By: /s/Mitchell
Feiger
|
Attorney-in-Fact
|
)
|
|
EXHIBIT
INDEX
|
|
|
Exhibit Number
|
Description
|
|
2.1
|
Amended
and Restated Agreement and Plan of Merger, dated as of April 19, 2001, by
and among the Registrant, MB Financial, Inc., a Delaware corporation (“Old
MB Financial”) and MidCity Financial (incorporated herein by reference to
Appendix A to the joint proxy statement-prospectus filed by the Registrant
pursuant to Rule 424(b) under the Securities Act of 1933 with the
Securities and Exchange Commission (the “Commission”) on October 9,
2001)
|
|
2.2
|
Agreement
and Plan of Merger, dated as of November 1, 2002, by and among the
Registrant, MB Financial Acquisition Corp II and South Holland Bancorp,
Inc. (incorporated herein by reference to Exhibit 2 to the Registrant’s
Current Report Form 8-K filed on November 5, 2002 (File No.
0-24566-01))
|
|
2.3
|
Agreement
and Plan of Merger, dated as of January 9, 2004, by and among the
Registrant and First SecurityFed Financial, Inc. (incorporated herein by
reference to Exhibit 2 to the Registrant’s Current Report on Form 8-K
filed on January 14, 2004 (File No.0-24566-01))
|
|
2.4
|
Agreement
and Plan of Merger, dated as of May 1, 2006, by and among the Registrant,
MBFI Acquisition Corp. and First Oak Brook Bancshares, Inc. (“First Oak
Brook”)(incorporated herein by reference to Exhibit 2.1 to the
Registrant’s Current Report on Form 8-K filed on May 2, 2006 (File
No.0-24566-01))
|
|
2.5
|
Purchase
and Assumption Agreement among Federal Deposit Insurance Corporation,
Receiver of Corus Bank, National Association, Chicago, Illinois, Federal
Deposit Insurance Corporation and MB Financial Bank, N.A., dated as of
September 11, 2009 (incorporated herein by reference to Exhibit 2.1 to the
Registrant’s Current Report on Form 8-K filed on September 17, 2010 (File
No.0-24566-01))
|
|
3.1
|
Charter
of the Registrant, as amended (incorporated herein by reference to Exhibit
3.1 to the Registrant’s Quarterly Report on Form 10-Q for the quarter
ended September 30, 2009 (File No. 0-24566-01))
|
|
3.1A
|
Articles
Supplementary to the Charter of the Registrant for the Registrant’s Fixed
Rate Cumulative Perpetual Preferred Stock, Series A (incorporated herein
by reference to Exhibit 3.1 to the Registrant’s Current Report on Form 8-K
filed on December 8, 2008 (File No.0-24566-01))
|
|
3.2
|
Bylaws
of the Registrant, as amended (incorporated herein by reference to Exhibit
3.1 to the Registrant’s Current Report on Form 8-K filed on December 11,
2007 (File No. 0-24566-01))
|
|
4.1
|
The
Registrant hereby agrees to furnish to the Commission, upon request, the
instruments defining the rights of the holders of each issue of long-term
debt of the Registrant and its consolidated subsidiaries
|
|
4.2
|
Certificate
of Registrant’s Common Stock (incorporated herein by reference to Exhibit
4.1 to Amendment No. One to the Registrant’s Registration Statement on
Form S-4 (No. 333-64584))
|
| EXHIBIT INDEX | |
| Exhibit Number | Description |
|
4.3
|
Warrant
to purchase shares of the Registrant’s Common Stock (incorporated herein
by reference to Exhibit 4.1 to the Registrant’s Current Report on Form 8-K
filed on December 8, 2008 (File No.0-24566-01))
|
|
10.1
|
Letter
Agreement, dated as of December 5, 2008, between the Registrant and the
United States Department of the Treasury (incorporated herein
by reference to Exhibit 10.1 to the Registrant’s Current Report on Form
8-K filed on December 8, 2008 (File No.0-24566-01))
|
|
10.2
|
Amended
and Restated Employment Agreement between the Registrant and Mitchell
Feiger (incorporated herein by reference to Exhibit 10.2 to the
Registrant’s Annual Report on Form 10-K for the year ended December 31,
2008 (File No. 0-24566-01))
|
|
10.3
|
Employment
Agreement between MB Financial Bank, N.A. and Burton J. Field
(incorporated herein by reference to Exhibit 10.3 to the Registrant’s
Quarterly Report on Form 10-Q for the quarter ended September 30, 2008
(File No. 0-24566-01))
|
|
10.4
|
Form
of Change and Control Severance Agreement between MB Financial Bank,
National Association and each of Thomas Panos, and Jill E. York
(incorporated herein by reference to Exhibit 10.4 to the Registrant’s
Annual Report on Form 10-K for the year ended December 31, 2008 (File No.
0-24566-01))
|
|
10.4B
|
Form
of Change and Control Severance Agreement between MB Financial Bank,
National Association and each of Burton Field, Larry J. Kallembach, Brian
Wildman, Rosemarie Bouman and Susan Peterson (incorporated herein by
reference to Exhibit 10.4B to the Registrant’s Annual Report on Form 10-K
for the year ended December 31, 2008 (File No. 0-24566-01))
|
|
10.5
|
Form
of Letter Agreement dated December 4, 2008 between MB Financial, Inc. and
each of Mitchell Feiger, Thomas Panos, Jill E. York, Thomas P.
Fitzgibbon, Jr., Burton Field, Larry J. Kallembach, Brian Wildman,
Rosemarie Bouman, and Susan Peterson relating to the TARP Capital Purchase
Program (incorporated herein by reference to Exhibit 10.5 to the
Registrant’s Annual Report on Form 10-K for the year ended December 31,
2008 (File No. 0-24566-01))
|
|
10.5A
|
Form
of Compensation Amendment and Waiver Agreement under the TARP Capital
Purchase Program dated July 2009 between MB Financial, Inc. and certain
employees (incorporated herein by reference to Exhibit 10.5A to the
Registrant’s Quarterly Report on Form 10-Q for the quarter ended September
30, 2009 (File No. 0-24566-01))
|
|
10.6
|
Coal
City Corporation 1995 Stock Option Plan (incorporated herein by reference
to Exhibit 10.6 to the Registrant’s Registration Statement on Form S-4
(No. 333-64584))
|
|
10.6A
|
Amendment
to Coal City Corporation 1995 Stock Option Plan ((incorporated herein by
reference to Exhibit 10.6A to the Registrant’s Annual Report on Form
10-K/A for the year ended December 31, 2006, filed on March 2, 2007 (File
No. 0-24566-01))
|
| EXHIBIT INDEX | |
| Exhibit Number | Description |
|
10.7
|
MB
Financial, Inc. Amended and Restated Omnibus Incentive Plan
(the “Omnibus Incentive Plan”) (incorporated herein by reference to the
Registrant’s definitive proxy statement filed on March 23, 2007 (File No.
0-24566-01))
|
|
10.8
|
MB
Financial Stock Deferred Compensation Plan (incorporated herein by
reference to Exhibit 10.8 to the Registrant’s Annual Report on Form 10-K
for the year ended December 31, 2008 (File No. 0-24566-01))
|
|
10.9
|
MB
Financial Non-Stock Deferred Compensation Plan (incorporated herein by
reference to Exhibit 10.9 to the Registrant’s Annual Report on Form 10-K
for the year ended December 31, 2008 (File No. 0-24566-01))
|
|
10.10
|
Avondale
Federal Savings Bank Supplemental Executive Retirement Plan Agreement
(incorporated herein by reference to Exhibit 10.2 to Old MB Financial’s
(then known as Avondale Financial Corp.) Annual Report on Form 10-K for
the year ended December 31, 1996 (File No. 0-24566))
|
|
|
|
|
|
|
|
10.13
|
Amended
and Restated Employment Agreement between MB Financial Bank, N.A. and
Ronald D. Santo (incorporated herein by reference to Exhibit 10.1 to the
Registrant’s Current Report on Form 8-K filed on December 14, 2004 (File
No. 0-24566-01))
|
|
10.13A
|
Amendment
to Amended and Restated Employment Agreement between MB Financial Bank,
N.A. and Ronald D. Santo ((incorporated herein by reference to Exhibit
10.13A to the Registrant’s Annual Report on Form 10-K/A for the year ended
December 31, 2006, filed on March 2, 2007 (File No.
0-24566-01))
|
|
10.14
|
First
SecurityFed Financial, Inc. 1998 Stock Option and Incentive Plan
(incorporated herein by reference to Exhibit B to the definitive proxy
statement filed by First SecurityFed Financial, Inc. on March 24, 1998
(File No. 0-23063))
|
|
10.14A
|
Amendment
to First SecurityFed Financial, Inc. 1998 Stock Option and Incentive Plan
((incorporated herein by reference to Exhibit 10.14A to the Registrant’s
Annual Report on Form 10-K/A for the year ended December 31, 2006, filed
on March 2, 2007 (File No. 0-24566-01))
|
| EXHIBIT INDEX | |
| Exhibit Number | Description |
|
10.15
|
Tax
Gross Up Agreements between the Registrant and each of Mitchell Feiger,
Burton J. Field, Thomas D. Panos, Jill E. York, Larry J. Kallembach, Brian
Wildman, and Susan Peterson (incorporated herein by reference to Exhibit
10.15 to the Registrant’s Annual Report on Form 10-K for the year ended
December 31, 2008 (File No. 0-24566-01))
|
|
10.15A
|
Tax
Gross Up Agreement between the Registrant and Rosemarie Bouman
(incorporated herein by reference to Exhibit 10.15A to the Registrant’s
Annual Report on Form 10-K for the year ended December 31, 2008 (File No.
0-24566-01))
|
|
10.16
|
Form
of Incentive Stock Option Agreement for Executive Officers under the
Omnibus Incentive Plan (incorporated herein by reference to Exhibit 10.16
to the Registrant’s Quarterly Report on Form 10-Q for the quarter ended
June 30, 2007 (File No. 0-24566-01))
|
|
10.17
|
Form
of Non-Qualified Stock Option Agreement for Directors under the Omnibus
Incentive Plan (incorporated herein by reference to Exhibit
10.16 to the Registrant’s Quarterly Report on Form 10-Q for the quarter
ended June 30, 2007 (File No. 0-24566-01))
|
|
10.18
|
Form
of Restricted Stock Agreement for Executive Officers under the Omnibus
Incentive Plan (incorporated herein by reference to Exhibit 10.16 to the
Registrant’s Quarterly Report on Form 10-Q for the quarter ended June 30,
2007 (File No. 0-24566-01))
|
|
10.18A
|
Amendment
to Form of Incentive Stock Option Agreement and Form of Restricted Stock
Agreement for Executive Officers under the Omnibus Incentive Plan
(incorporated herein by reference to Exhibit 10.18A to the Registrant’s
Annual Report on Form 10-K for the year ended December 31, 2008 (File No.
0-24566-01))
|
|
10.18B
|
Form
of Performance-Based Restricted Stock Agreement for Executive Officers
under the Omnibus Incentive Plan (incorporated herein by reference to
Exhibit 10.18B to the Registrant’s Quarterly Report on Form 10-Q for the
quarter ended September 30, 2009 (File No. 0-24566-01))
|
|
10.18C
|
Form
of Restricted Stock Agreement for grants on December 2, 2009 to Mitchell
Feiger, Jill E. York and Burton J. Field (incorporated herein by reference
to Exhibit 10.18C to the Registrant’s Current Report on Form 8-K filed on
December 7, 2009 (File No. 0-24566-01))
|
|
10.19
|
Form
of Restricted Stock Agreement for Directors under the Omnibus Incentive
Plan (incorporated herein by reference to Exhibit 10.16 to the
Registrant’s Quarterly Report on Form 10-Q for the quarter ended June 30,
2007 (File No. 0-24566-01))
|
|
10.20
|
First
Oak Brook Bancshares, Inc. Incentive Compensation Plan (incorporated
herein by reference to Appendix A to the definitive proxy statement filed
by First Oak Brook on March 30, 2004 (File No. 0-14468))
|
| EXHIBIT INDEX | |
| Exhibit Number | Description |
|
10.20A
|
Amendment
to First Oak Brook Bancshares, Inc. Incentive Compensation Plan
((incorporated herein by reference to Exhibit 10.20A to the Registrant’s
Annual Report on Form 10-K/A for the year ended December 31, 2006, filed
on March 2, 2007 (File No. 0-24566-01))
|
|
10.21
|
First
Oak Brook Bancshares, Inc. 2001 Stock Incentive Plan (incorporated herein
by reference to Appendix A to the definitive proxy statement filed by
First Oak Brook on April 2, 2001 (File No. 0-14468))
|
|
10.21A
|
Amendment
to First Oak Brook Bancshares, Inc. 2001 Stock Incentive Plan
((incorporated herein by reference to Exhibit 10.21A to the Registrant’s
Annual Report on Form 10-K/A for the year ended December 31, 2006, filed
on March 2, 2007 (File No. 0-24566-01))
|
|
10.22
|
First
Oak Brook Bancshares, Inc. Directors Stock Plan (incorporated herein by
reference to Exhibit 4.1 to the Registration Statement on Form S-8 filed
by First Oak Brook on October 25, 1999 (File No. 333-89647))
|
|
10.23
|
Reserved.
|
|
10.24
|
Reserved.
|
|
10.25
|
Reserved.
|
|
10.26
|
Reserved.
|
|
10.27
|
First
Oak Brook Bancshares, Inc. Executive Deferred Compensation Plan
(incorporated by reference to Exhibit 10.3 to First Oak Brook’s Annual
Report on Form 10-K for the year ended December 31, 1997 (File No.
0-14468))
|
|
10.27A
|
Amendment
to First Oak Brook Bancshares, Inc. Executive Deferred Compensation Plan
(incorporated herein by reference to Exhibit 10.27A to the Registrant’s
Quarterly Report on Form 10-Q/A for the quarter ended March 31, 2007 filed
on May 15, 2007)
|
|
10.28
|
Transitional
Employment Agreement between the Registrant (as successor to First Oak
Brook) and Susan Peterson (incorporated herein by reference
to Exhibit 10.27 to the Registrant’s Quarterly Report on Form
10-Q for the quarter ended September 30, 2006 (File No.
0-24566-01))
|
| EXHIBIT INDEX | |
| Exhibit Number | Description |
|
10.29
|
Form
of Transitional Employment Agreement between the Registrant (as successor
to First Oak Brook) and Rosemarie Bouman (incorporated herein by reference
to Exhibit 10.10 to First Oak Brook's Annual Report on Form 10-K for the
year ended December 31, 1998 (File No. 0-14468))
|
|
10.29A
|
First
Amendment to Transitional Employment Agreement between the Registrant (as
successor to First Oak Brook) and Rosemarie Bouman ((incorporated herein
by reference to Exhibit 10.28A to the Registrant's Annual Report on Form
10-K/A for the year ended December 31, 2006, filed March 2, 2007 (File No.
0-24566-01))
|
|
10.29B
|
Second
Amendment to Transitional Employment Agreement between the Registrant (as
successor to First Oak Brook) and Rosemarie
Bouman ((incorporated herein by reference to Exhibit 10.28B to
the Registrant’s Annual Report on Form 10-K/A for the year ended December
31, 2006, filed March 2, 2007 (File No. 0-24566-01))
|
|
|
|
|
|
|
|
|
|
|
|
|
|
|
|
|
|
|
|
|
|
|
|
|
|
* Filed
herewith
|