Attached files
| file | filename |
|---|---|
| EX-99.1 - EXHIBIT 99.1 - CAMDEN NATIONAL CORP | ex991directorpr042418.htm |
| 8-K - 8-K - CAMDEN NATIONAL CORP | a8k042418annualmeetingpres.htm |

2018 Annual
Shareholders Meeting

Welcome to the
2018 Annual Shareholders’ Meeting
Lawrence Sterrs
Chair of the Board
1

Agenda
• Business Meeting
• Introductions
• Reading of the Minutes
• Shareholder Voting
• Presentations
• Financial Results – Debbie Jordan
• Strategic Update – Greg Dufour
• Questions and Answers
2

Camden National Bank
Board of Directors
• Larry Sterrs, Chair
• Gregory Dufour,
President/CEO
• Ann Bresnahan
• William Dubord
• David Flanagan
• James Markos, Jr.
• Robert Merrill
• David Ott
• Carl Soderberg
3

Camden National Corporation
Board of Directors
• Larry Sterrs, Chair
• Gregory Dufour,
President/CEO
• Ann Bresnahan
• Craig Denekas
• David Flanagan
• Catherine Longley
• David Ott
• James Page, Ph.D.
• Carl Soderberg
4

Senior Management Team
• Gregory Dufour, President and Chief Executive Officer
• Joanne Campbell, EVP - Risk Management Officer
• Mac Hayden, EVP – Chief Credit Officer
• Debbie Jordan, CPA, EVP – COO and CFO
• Jennifer Mirabile, SVP – Director of Wealth Management
• Tim Nightingale, EVP - Senior Loan Officer
• Patricia Rose, EVP - Retail and Mortgage Banking Officer
• Renée Smyth, EVP – Chief Experience and Marketing Officer
5

Meeting Minutes
6

• Proposal 1: Election of Directors
• Ann Bresnahan
• Gregory Dufour
• S. Catherine Longley
• Carl Soderberg
• Proposal 2: “Say On Pay”
• Proposal 3: Ratification of Independent
Registered Public Accounting Firm
• RSM US LLP
Proposals
7

Submission of Proxy Votes
8

Financial Results for 2017 and
First Quarter 2018
Debbie Jordan
Executive Vice President,
Chief Operating and Financial Officer
9

Forward Looking Statements
This presentation contains certain statements that may be considered forward-looking statements under the Private Securities Litigation
Reform Act of 1995 and other federal securities laws, including certain plans, exceptions, goals, projections, and statements, which are
subject to numerous risks, assumptions, and uncertainties. Forward-looking statements can be identified by the use of the words
“believe,” “expect,” “anticipate,” “intend,” “estimate,” “assume,” “plan,” “target,” or “goal” or future or conditional verbs such as “will,”
“may,” “might,” “should,” “could” and other expressions which predict or indicate future events or trends and which do not relate to
historical matters. Forward-looking statements should not be relied on, because they involve known and unknown risks, uncertainties and
other factors, some of which are beyond the control of Camden National Corporation (the “Company”). These risks, uncertainties and
other factors may cause the actual results, performance or achievements of the Company to be materially different from the anticipated
future results, performance or achievements expressed or implied by the forward-looking statements.
The following factors, among others, could cause the Company’s financial performance to differ materially from the Company’s goals,
plans, objectives, intentions, expectations and other forward-looking statements: weakness in the United States economy in general and
the regional and local economies within the New England region and Maine, which could result in a deterioration of credit quality, an
increase in the allowance for loan losses or a reduced demand for the Company’s credit or fee-based products and services; changes in
trade, monetary, and fiscal policies and laws, including interest rate policies of the Board of Governors of the Federal Reserve System;
inflation, interest rate, market, and monetary fluctuations; competitive pressures, including continued industry consolidation and the
increased financial services provided by non-banks; volatility in the securities markets that could adversely affect the value or credit
quality of the Company’s assets, impairment of goodwill, the availability and terms of funding necessary to meet the Company’s liquidity
needs, and could lead to impairment in the value of securities in the Company's investment portfolio; changes in information technology
that require increased capital spending; changes in consumer spending and savings habits; changes in tax, banking, securities and
insurance laws and regulations; and changes in accounting policies, practices and standards, as may be adopted by the regulatory
agencies as well as the Financial Accounting Standards Board ("FASB"), and other accounting standard setters.
You should carefully review all of these factors, and be aware that there may be other factors that could cause differences, including the
risk factors listed in the Company’s filings with the SEC, including our Annual Report on Form 10-K for the year ended December 31, 2017,
as updated by the Company's quarterly reports on Form 10-Q and other filings with the Securities and Exchange Commission. You should
carefully review the risk factors described therein and should not place undue reliance on our forward-looking statements.
These forward-looking statements were based on information, plans and estimates at the date of this report, and we undertake no
obligation to update any forward-looking statements to reflect changes in underlying assumptions or factors, new information, future
events or other changes, except to the extent required by applicable law or regulation.
10

2017 Financial Performance
• Loans increase 7%
• Deposits increase 6%
• Efficiency Ratio: 57.05%
• Strong Adjusted Return on:
• Assets - 1.07%(1)
• Tangible Equity - 14.35%(1)
11
(1) This is a non-GAAP measure. Please refer to the Company’s 2017 Annual Report on Form 10-K.
$22.8
$24.6
$21.0
$40.1
$28.5
$7.2 M&A
$14.2
Tax Impact
$24.1 $24.6
$28.2
$40.6
$42.7
2013 2014 2015 2016 2017
Adjusted Net Income(1)
(In Millions)

1st Quarter 2018 Financial Results
12
$10.1
$12.8
Q1 17 Q1 18
Net Income
(in millions)
Q1 2017 Q1 2018
Diluted Earnings Per
Share
0.64$ 0.82$
Return on Average
Assets
1.05% 1.28%
Return on Average
Tangible Equity (1)
14.37% 17.35%
Non-Performing
Assets to Total Assets
0.68% 0.47%
(1) This is a non-GAAP measure. Please refer to the Company’s 2017 Annual Report on Form 10-K.

Three Year Total Return
13
Proxy Peer – Average of 20 publicly traded commercial and savings banks in the Northeast.
Source: SNL Financial - Total Return includes stock appreciation and dividends from 4/1/15 to 3/31/18
27.43%
55.74%
57.75%
74.82%
80.10%
1
April 1, 2015 to March 31, 2018
SNL $1B to $5B Bank Index
KBW Bank Total Return Index
Proxy Peer Average
Russell 2000
Camden National

Voting Results
Larry Sterrs
Chair of the Board
14

Strategic Overview
Greg Dufour
President and Chief Executive Officer
15

Who we are
16
• Largest bank
headquartered in
Northern New England
• $4.1 billion in assets
• 60 branches (Maine) and
3 loan offices (New Hampshire
and Massachusetts)
• Market cap over $700 million
• Average daily share volume of
30,000
• Analyst Coverage
• Piper Jaffrey (overweight)
• KBW (market perform)

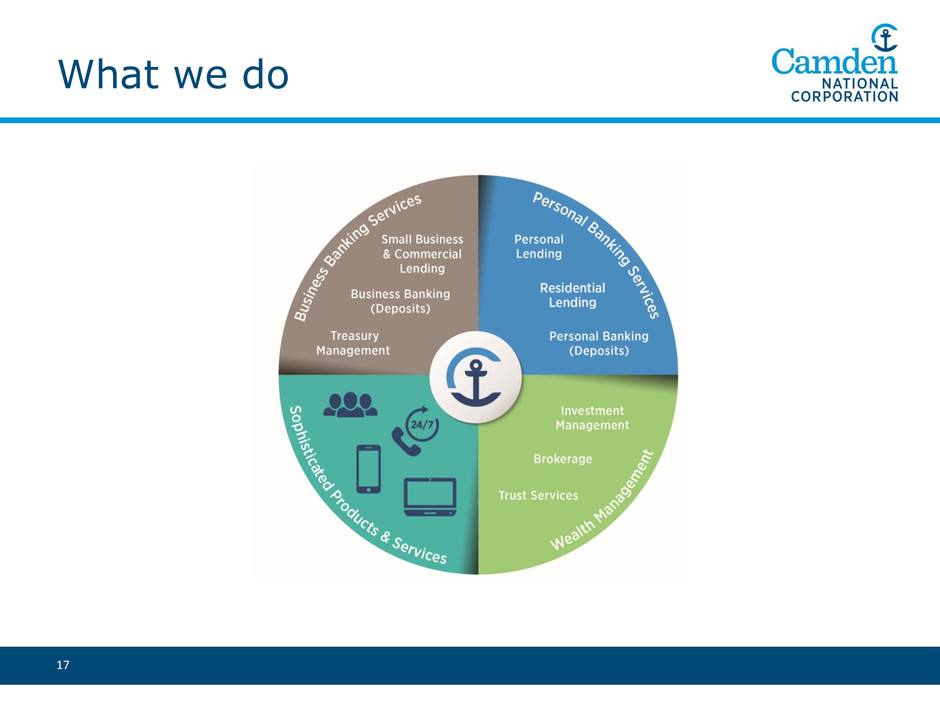
What we do
17

How we interact with customers
18
In person:
60 banking centers
2.8 million transactions
74 ATMs
1.4 million transactions
Online:
Web & Mobile Banking
85,000 customers
Over the phone:
Customer Assistance Center
• 193,400 calls (24% after normal hours)
• 26,400 emails
• 3,300 chat sessions – in just four months!
Technology Advancement.
Recently introduced:
• Mortgage TouchTM
• Treasury LinkTM
• Pay Up

How we measure our experience
• Actively survey our customers
• Utilize Net Promoter Score (“NPS”) to measure the
satisfaction and loyalty of our customers
• Consistently monitor our customers based on their
NPS category, method of transacting, geography and
age demographics.
NPS Category:
Promoter: Loyal and enthusiastic customers
Passive: Content but indifferent
Detractor: Frustrated and negative
19

High performing NPS
20
61 63
0
25
50
75
100
Survey 1 Survey 2
Net Promoter Score
High Performing Avg. 64
Finance Avg. 40

What we’ve heard
21
“Customer
service with
a smile...”
“Your mobile app
is also wicked
convenient and
useful.”
“Love the online banking.
Best that I’ve have used
from several banks.”
“My wife and I appreciate
the personal service that
ALL of your staff provides.”
“The app is great. The
ATM reimbursements are
always quick and a great
benefit. Online banking is
really simple.”
“Exceptionally friendly
and personalized
service --- the
bankers in my branch
really do know me.”

CamdenCircle
22
Always listening.
Continuously innovating.

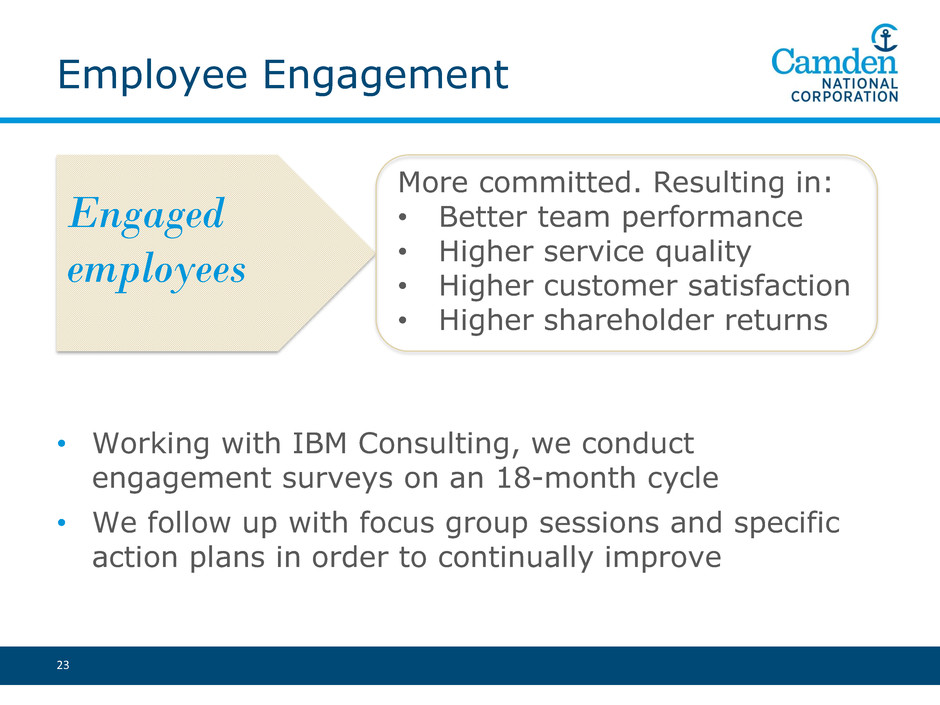
Employee Engagement
• Working with IBM Consulting, we conduct
engagement surveys on an 18-month cycle
• We follow up with focus group sessions and specific
action plans in order to continually improve
23
More committed. Resulting in:
• Better team performance
• Higher service quality
• Higher customer satisfaction
• Higher shareholder returns
Engaged
employees

High Performing Employee
Engagement
24
70
76 78
0
25
50
75
100
2014 2016 2017
Employee Engagement Results
IBM Finance Norm: 73
75th Percentile Norm: 78

What we heard …
25
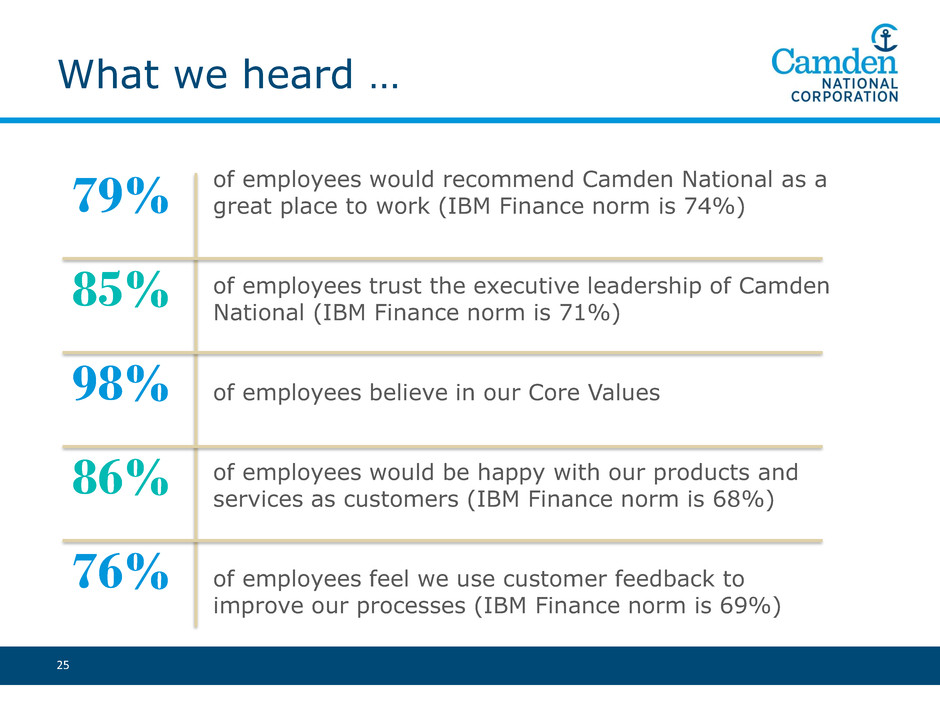
of employees would recommend Camden National as a
great place to work (IBM Finance norm is 74%)
of employees trust the executive leadership of Camden
National (IBM Finance norm is 71%)
of employees believe in our Core Values
of employees would be happy with our products and
services as customers (IBM Finance norm is 68%)
of employees feel we use customer feedback to
improve our processes (IBM Finance norm is 69%)
79%
85%
98%
86%
76%

Social Responsibility
26
Hope@Home.
Raising awareness
and support for
homelessness
$250,000 given
since its inception
in 2015
Leaders & Luminaries.
Recognizing board
leadership as integral to
the success of nonprofit
organizations
$107,000 given to date
in recognition of 31
nonprofit board members
Volunteerism.
Giving time and
talent to support
nonprofit
organizations
18,000 employee
volunteer hours to
over 50
organizations

Why Camden National?
• Strong board governance; “low risk” ISS rating
• Top tier employee engagement
• Strong Net Promoter Scores by customers
• A socially responsible community bank
• Strong shareholder returns;
• 80% total return vs. 56% proxy peer group
average
27

Question & Answers
28
