Attached files
| file | filename |
|---|---|
| EX-99.3 - EX-99.3 - WESBANCO INC | d573945dex993.htm |
| EX-99.2 - EX-99.2 - WESBANCO INC | d573945dex992.htm |
| EX-2.1 - EX-2.1 - WESBANCO INC | d573945dex21.htm |
| 8-K - 8-K - WESBANCO INC | d573945d8k.htm |
Acquisition of Farmers Capital Bank Corporation 19 April 2018 Exhibit 99.1
Matters set forth in this presentation contain certain forward-looking statements, including certain plans, expectations, goals, and projections, and including statements about the benefits of the proposed Merger between WesBanco, Inc. (the “Company”, “WesBanco” or “WSBC”) and Farmers Capital Bank Corporation (“Farmers” or “FFKT”), which are subject to numerous assumptions, risks, and uncertainties. Actual results could differ materially from those contained or implied by such statements for a variety of factors including: the businesses of WesBanco and Farmers may not be integrated successfully or such integration may take longer to accomplish than expected; the expected cost savings and any revenue synergies from the proposed Merger may not be fully realized within the expected timeframes; disruption from the proposed Merger may make it more difficult to maintain relationships with clients, associates, or suppliers; the required governmental approvals of the proposed Merger may not be obtained on the expected terms and schedule; Farmers’ shareholders may not approve the proposed Merger; changes in economic conditions; movements in interest rates; competitive pressures on product pricing and services; success and timing of other business strategies; the nature, extent, and timing of governmental actions and reforms; and extended disruption of vital infrastructure; and other factors described in WesBanco’s 2017 Annual Report on Form 10-K, Farmers’ 2017 Annual Report on Form 10-K, and documents subsequently filed by WesBanco and Farmers with the Securities and Exchange Commission. All forward-looking statements included in this presentation are based on information available at the time of the presentation. Neither WesBanco nor Farmers assumes any obligation to update any forward-looking statement. Forward-Looking Statements
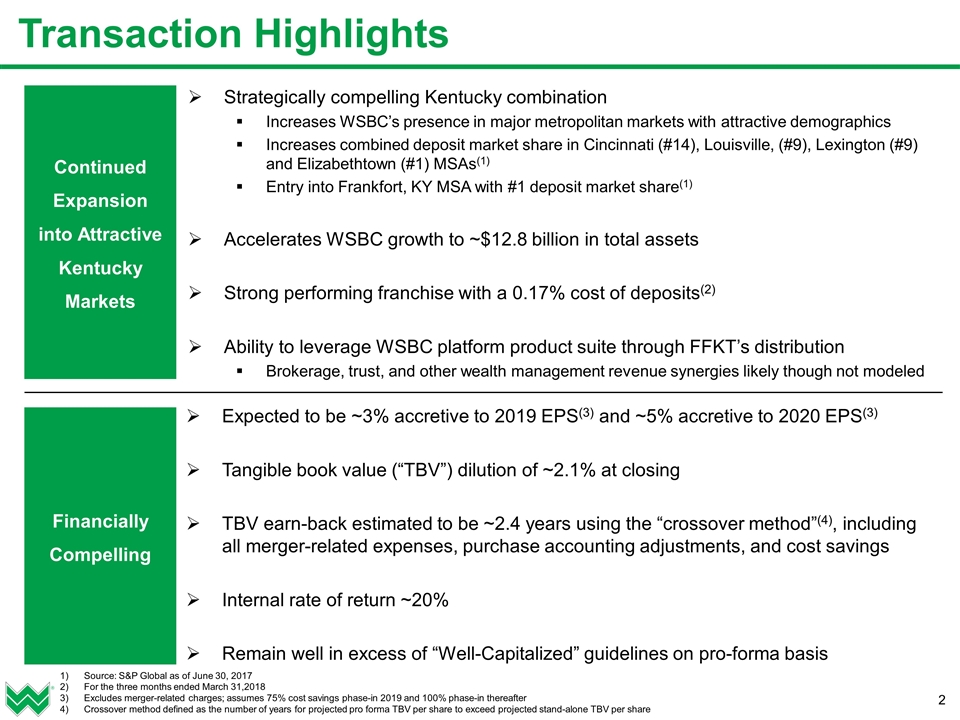
Transaction Highlights Strategically compelling Kentucky combination Increases WSBC’s presence in major metropolitan markets with attractive demographics Increases combined deposit market share in Cincinnati (#14), Louisville, (#9), Lexington (#9) and Elizabethtown (#1) MSAs(1) Entry into Frankfort, KY MSA with #1 deposit market share(1) Accelerates WSBC growth to ~$12.8 billion in total assets Strong performing franchise with a 0.17% cost of deposits(2) Ability to leverage WSBC platform product suite through FFKT’s distribution Brokerage, trust, and other wealth management revenue synergies likely though not modeled Continued Expansion into Attractive Kentucky Markets Financially Compelling Expected to be ~3% accretive to 2019 EPS(3) and ~5% accretive to 2020 EPS(3) Tangible book value (“TBV”) dilution of ~2.1% at closing TBV earn-back estimated to be ~2.4 years using the “crossover method”(4), including all merger-related expenses, purchase accounting adjustments, and cost savings Internal rate of return ~20% Remain well in excess of “Well-Capitalized” guidelines on pro-forma basis Source: S&P Global as of June 30, 2017 For the three months ended March 31,2018 Excludes merger-related charges; assumes 75% cost savings phase-in 2019 and 100% phase-in thereafter Crossover method defined as the number of years for projected pro forma TBV per share to exceed projected stand-alone TBV per share
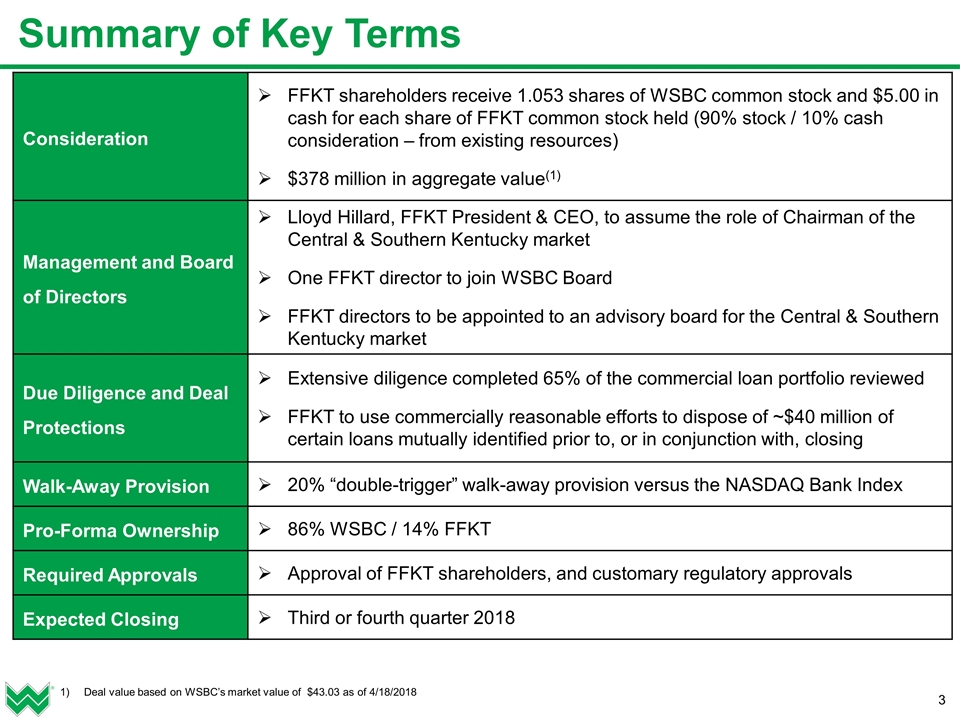
Summary of Key Terms Consideration FFKT shareholders receive 1.053 shares of WSBC common stock and $5.00 in cash for each share of FFKT common stock held (90% stock / 10% cash consideration – from existing resources) $378 million in aggregate value(1) Management and Board of Directors Lloyd Hillard, FFKT President & CEO, to assume the role of Chairman of the Central & Southern Kentucky market One FFKT director to join WSBC Board FFKT directors to be appointed to an advisory board for the Central & Southern Kentucky market Due Diligence and Deal Protections Extensive diligence completed 65% of the commercial loan portfolio reviewed FFKT to use commercially reasonable efforts to dispose of ~$40 million of certain loans mutually identified prior to, or in conjunction with, closing Walk-Away Provision 20% “double-trigger” walk-away provision versus the NASDAQ Bank Index Pro-Forma Ownership 86% WSBC / 14% FFKT Required Approvals Approval of FFKT shareholders, and customary regulatory approvals Expected Closing Third or fourth quarter 2018 Deal value based on WSBC’s market value of $43.03 as of 4/18/2018
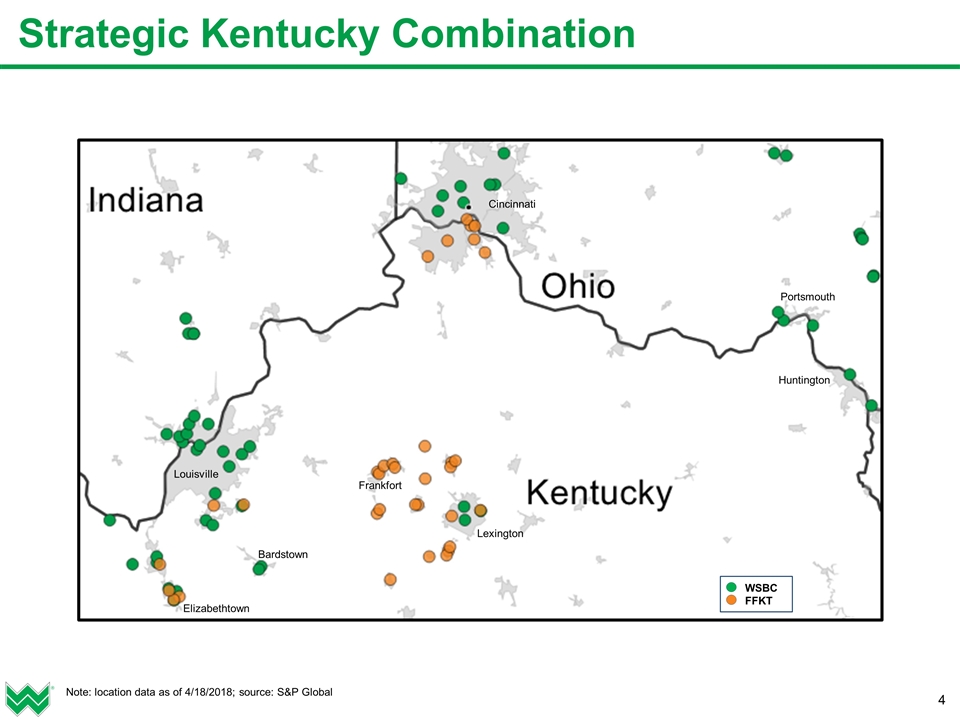
Strategic Kentucky Combination Note: location data as of 4/18/2018; source: S&P Global WSBC FFKT Huntington Portsmouth Cincinnati Lexington Frankfort Elizabethtown Bardstown Louisville
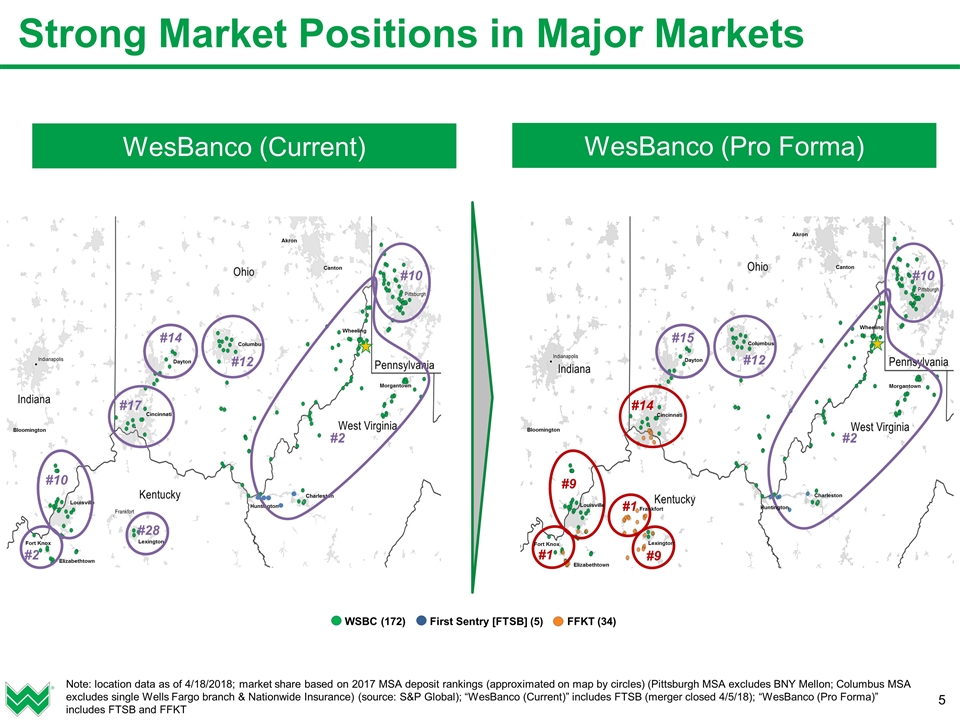
Louisville Lexington Cincinnati Dayton Columbus Bloomington Akron Canton Charleston Wheeling Morgantown Huntington Fort Knox Elizabethtown Strong Market Positions in Major Markets Note: location data as of 4/18/2018; market share based on 2017 MSA deposit rankings (approximated on map by circles) (Pittsburgh MSA excludes BNY Mellon; Columbus MSA excludes single Wells Fargo branch & Nationwide Insurance) (source: S&P Global); “WesBanco (Current)” includes FTSB (merger closed 4/5/18); “WesBanco (Pro Forma)” includes FTSB and FFKT #17 #12 #14 #2 #10 #10 #2 WesBanco (Current) WesBanco (Pro Forma) #14 #12 #15 #1 #9 #10 #2 #28 #9 Louisville Lexington Cincinnati Dayton Columbus Bloomington Akron Canton Charleston Wheeling Morgantown Huntington Fort Knox Elizabethtown #1 Frankfort WSBC (172) First Sentry [FTSB] (5) FFKT (34)
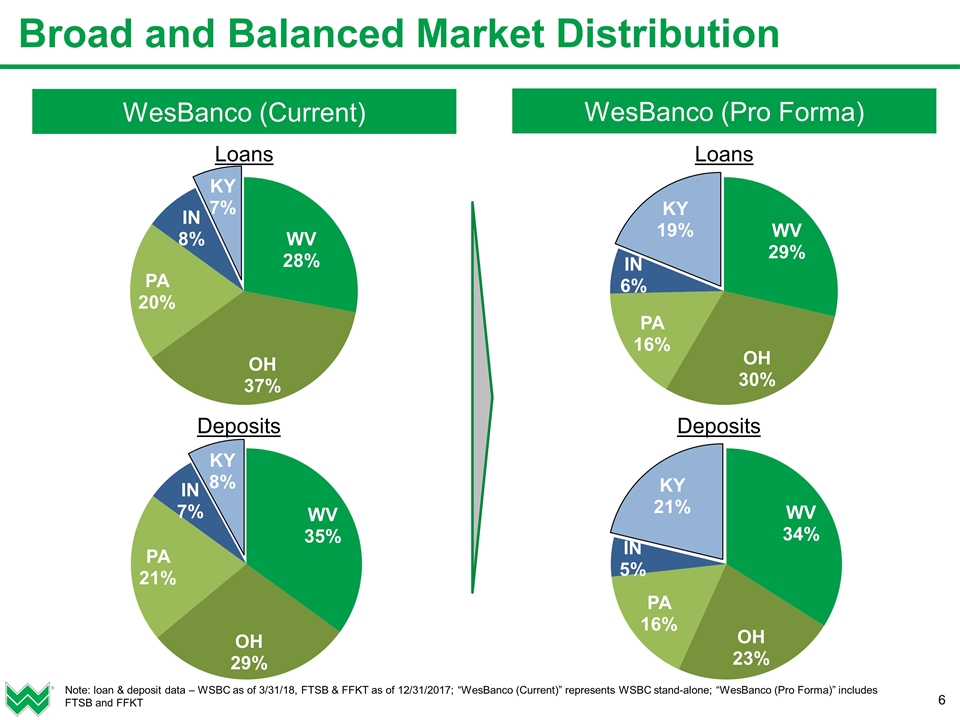
Broad and Balanced Market Distribution Note: loan & deposit data – WSBC as of 3/31/18, FTSB & FFKT as of 12/31/2017; “WesBanco (Current)” represents WSBC stand-alone; “WesBanco (Pro Forma)” includes FTSB and FFKT WesBanco (Current) WesBanco (Pro Forma)
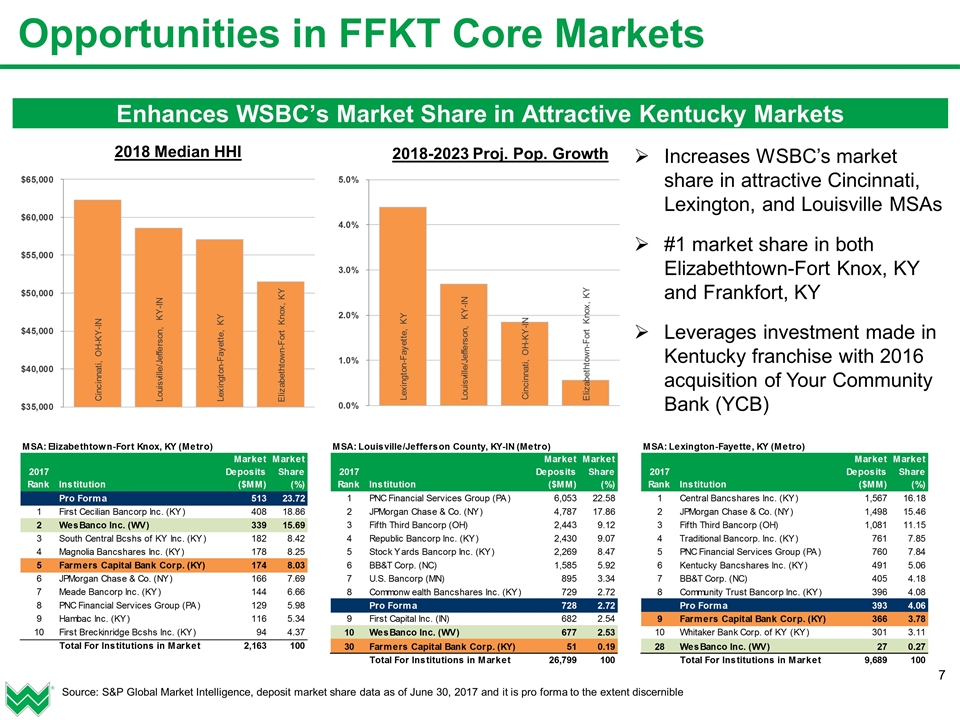
Opportunities in FFKT Core Markets Enhances WSBC’s Market Share in Attractive Kentucky Markets Source: S&P Global Market Intelligence, deposit market share data as of June 30, 2017 and it is pro forma to the extent discernible Increases WSBC’s market share in attractive Cincinnati, Lexington, and Louisville MSAs #1 market share in both Elizabethtown-Fort Knox, KY and Frankfort, KY Leverages investment made in Kentucky franchise with 2016 acquisition of Your Community Bank (YCB) 2018 Median HHI 2018-2023 Proj. Pop. Growth
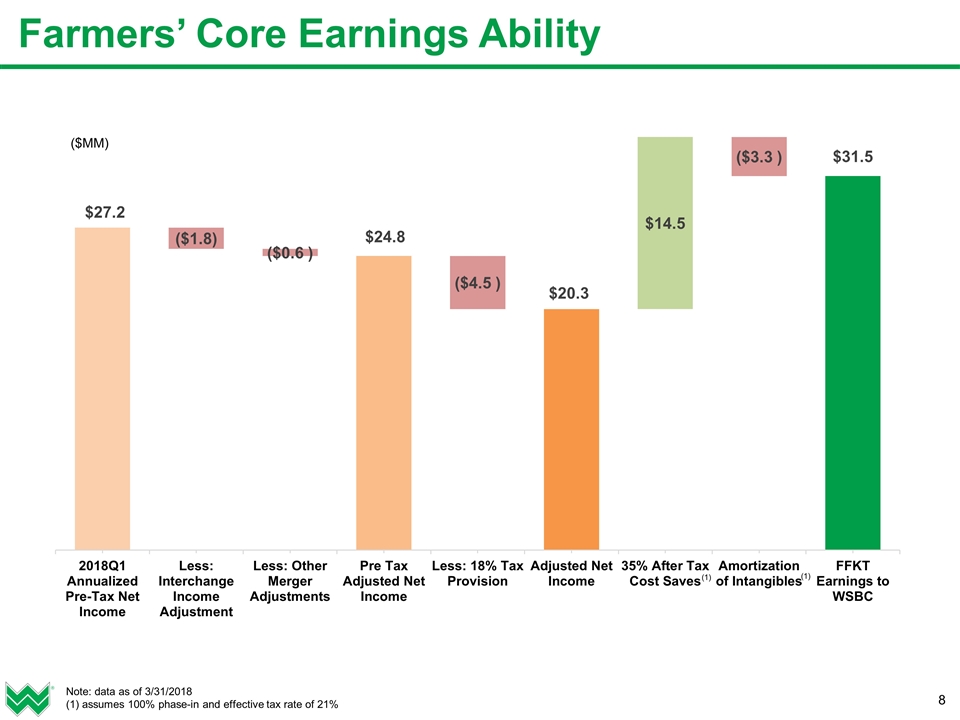
Farmers’ Core Earnings Ability Note: data as of 3/31/2018 (1) assumes 100% phase-in and effective tax rate of 21% (1) (1)
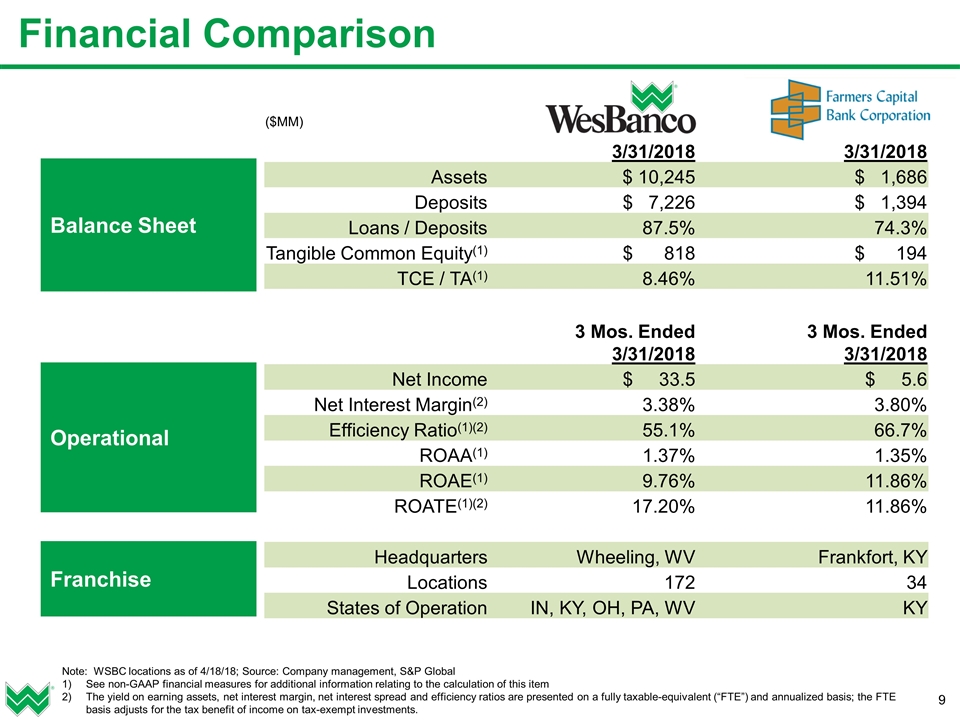
($MM) 3/31/2018 3/31/2018 Assets $ 10,245 $ 1,686 Deposits $ 7,226 $ 1,394 Loans / Deposits 87.5% 74.3% Tangible Common Equity(1) $ 818 $ 194 TCE / TA(1) 8.46% 11.51% 3 Mos. Ended 3/31/2018 3 Mos. Ended 3/31/2018 Net Income $ 33.5 $ 5.6 Net Interest Margin(2) 3.38% 3.80% Efficiency Ratio(1)(2) 55.1% 66.7% ROAA(1) 1.37% 1.35% ROAE(1) 9.76% 11.86% ROATE(1)(2) 17.20% 11.86% Headquarters Wheeling, WV Frankfort, KY Locations 172 34 States of Operation IN, KY, OH, PA, WV KY Financial Comparison Balance Sheet Operational Franchise Note: WSBC locations as of 4/18/18; Source: Company management, S&P Global See non-GAAP financial measures for additional information relating to the calculation of this item The yield on earning assets, net interest margin, net interest spread and efficiency ratios are presented on a fully taxable-equivalent (“FTE”) and annualized basis; the FTE basis adjusts for the tax benefit of income on tax-exempt investments.
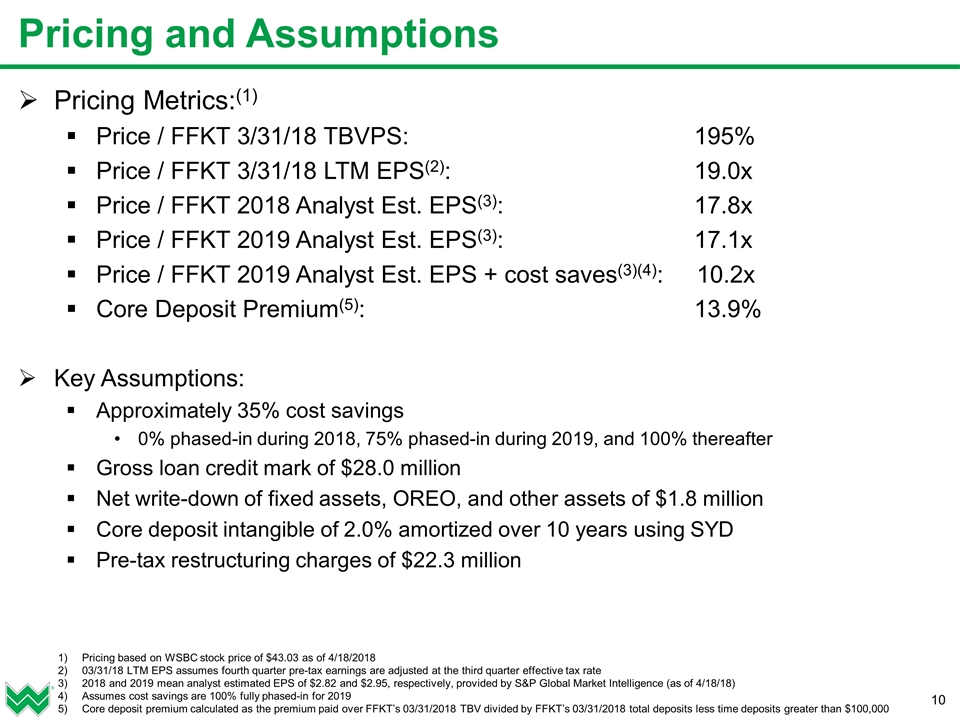
Pricing and Assumptions Pricing Metrics:(1) Price / FFKT 3/31/18 TBVPS: 195% Price / FFKT 3/31/18 LTM EPS(2): 19.0x Price / FFKT 2018 Analyst Est. EPS(3): 17.8x Price / FFKT 2019 Analyst Est. EPS(3): 17.1x Price / FFKT 2019 Analyst Est. EPS + cost saves(3)(4): 10.2x Core Deposit Premium(5): 13.9% Key Assumptions: Approximately 35% cost savings 0% phased-in during 2018, 75% phased-in during 2019, and 100% thereafter Gross loan credit mark of $28.0 million Net write-down of fixed assets, OREO, and other assets of $1.8 million Core deposit intangible of 2.0% amortized over 10 years using SYD Pre-tax restructuring charges of $22.3 million Pricing based on WSBC stock price of $43.03 as of 4/18/2018 03/31/18 LTM EPS assumes fourth quarter pre-tax earnings are adjusted at the third quarter effective tax rate 2018 and 2019 mean analyst estimated EPS of $2.82 and $2.95, respectively, provided by S&P Global Market Intelligence (as of 4/18/18) Assumes cost savings are 100% fully phased-in for 2019 Core deposit premium calculated as the premium paid over FFKT’s 03/31/2018 TBV divided by FFKT’s 03/31/2018 total deposits less time deposits greater than $100,000
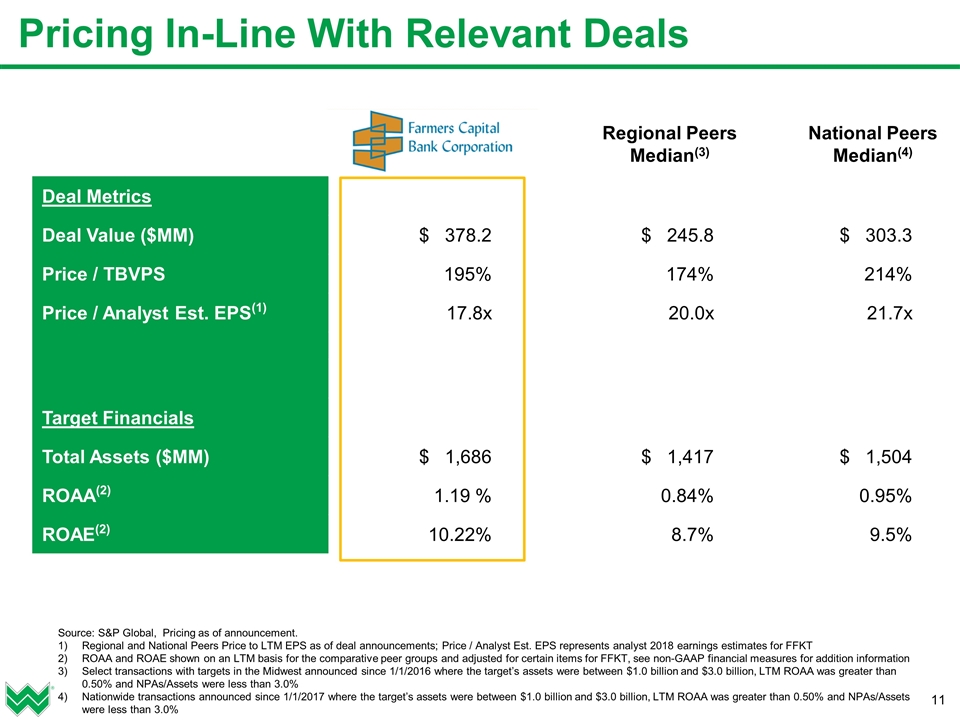
Pricing In-Line With Relevant Deals Deal Metrics Deal Value ($MM) $ 378.2 $ 245.8 $ 303.3 Price / TBVPS 195% 174% 214% Price / Analyst Est. EPS(1) 17.8x 20.0x 21.7x Target Financials Total Assets ($MM) $ 1,686 $ 1,417 $ 1,504 ROAA(2) 1.19 % 0.84% 0.95% ROAE(2) 10.22% 8.7% 9.5% Regional Peers Median(3) National Peers Median(4) Source: S&P Global, Pricing as of announcement. Regional and National Peers Price to LTM EPS as of deal announcements; Price / Analyst Est. EPS represents analyst 2018 earnings estimates for FFKT ROAA and ROAE shown on an LTM basis for the comparative peer groups and adjusted for certain items for FFKT, see non-GAAP financial measures for addition information Select transactions with targets in the Midwest announced since 1/1/2016 where the target’s assets were between $1.0 billion and $3.0 billion, LTM ROAA was greater than 0.50% and NPAs/Assets were less than 3.0% Nationwide transactions announced since 1/1/2017 where the target’s assets were between $1.0 billion and $3.0 billion, LTM ROAA was greater than 0.50% and NPAs/Assets were less than 3.0%
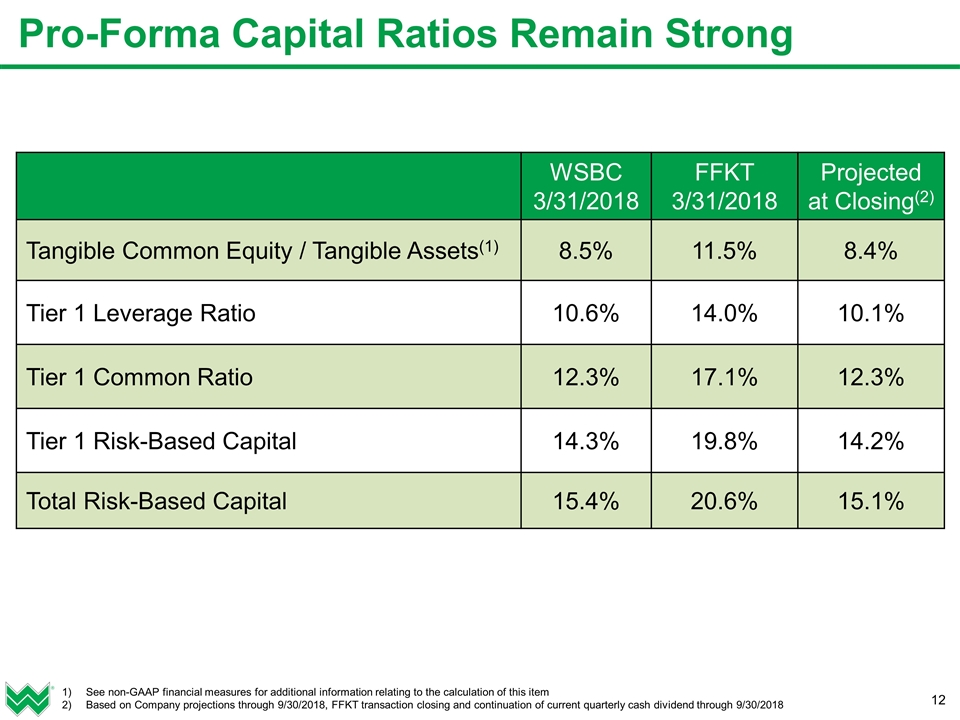
See non-GAAP financial measures for additional information relating to the calculation of this item Based on Company projections through 9/30/2018, FFKT transaction closing and continuation of current quarterly cash dividend through 9/30/2018 Pro-Forma Capital Ratios Remain Strong WSBC 3/31/2018 FFKT 3/31/2018 Projected at Closing(2) Tangible Common Equity / Tangible Assets(1) 8.5% 11.5% 8.4% Tier 1 Leverage Ratio 10.6% 14.0% 10.1% Tier 1 Common Ratio 12.3% 17.1% 12.3% Tier 1 Risk-Based Capital 14.3% 19.8% 14.2% Total Risk-Based Capital 15.4% 20.6% 15.1%
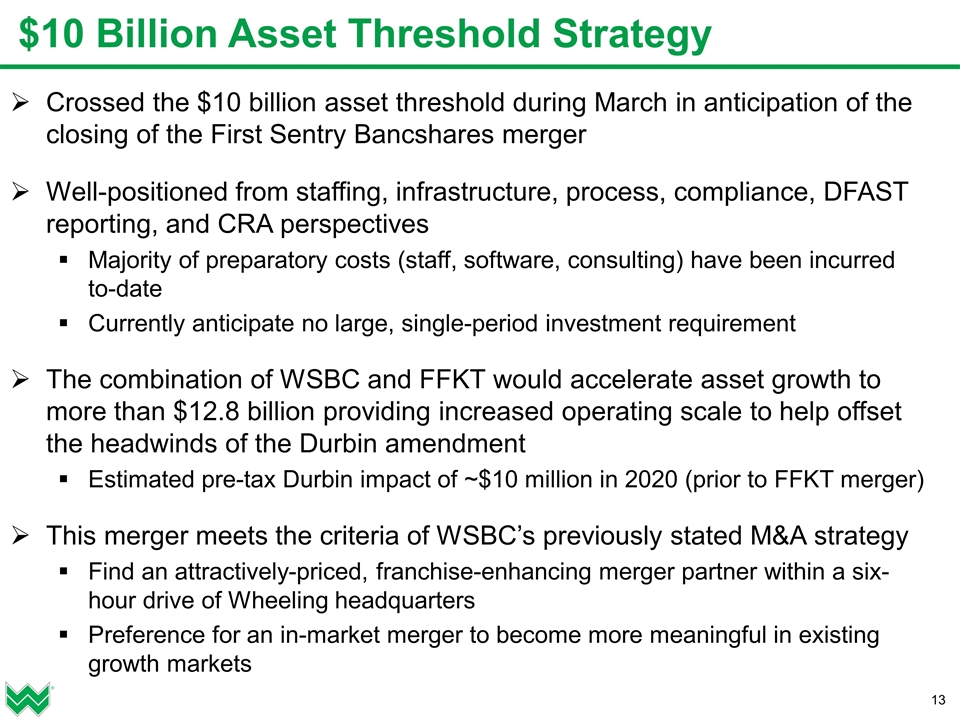
$10 Billion Asset Threshold Strategy Crossed the $10 billion asset threshold during March in anticipation of the closing of the First Sentry Bancshares merger Well-positioned from staffing, infrastructure, process, compliance, DFAST reporting, and CRA perspectives Majority of preparatory costs (staff, software, consulting) have been incurred to-date Currently anticipate no large, single-period investment requirement The combination of WSBC and FFKT would accelerate asset growth to more than $12.8 billion providing increased operating scale to help offset the headwinds of the Durbin amendment Estimated pre-tax Durbin impact of ~$10 million in 2020 (prior to FFKT merger) This merger meets the criteria of WSBC’s previously stated M&A strategy Find an attractively-priced, franchise-enhancing merger partner within a six-hour drive of Wheeling headquarters Preference for an in-market merger to become more meaningful in existing growth markets
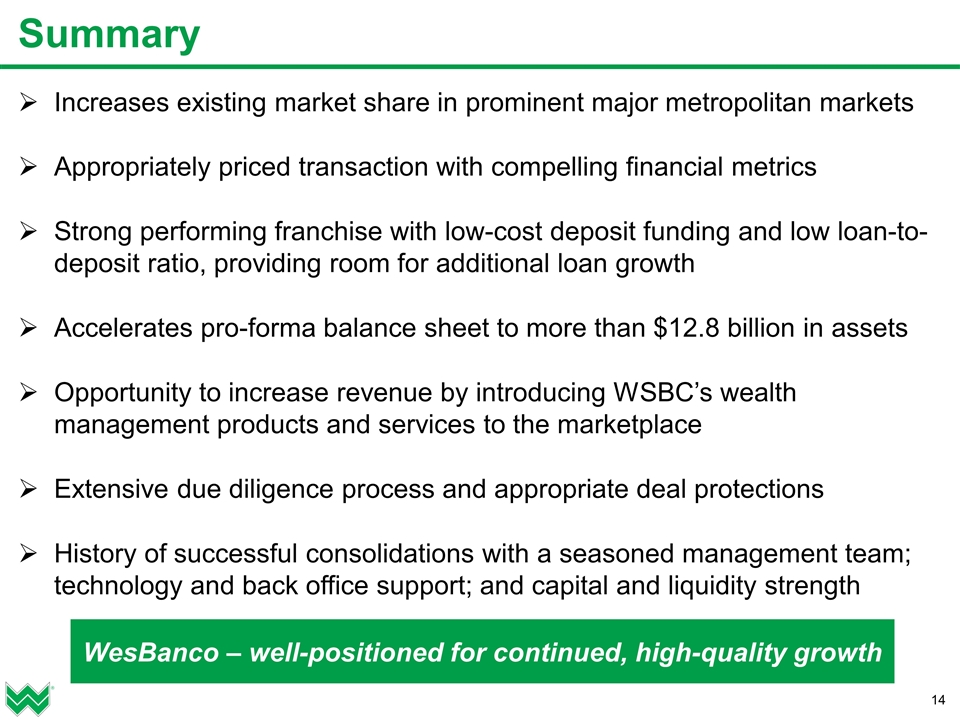
Summary Increases existing market share in prominent major metropolitan markets Appropriately priced transaction with compelling financial metrics Strong performing franchise with low-cost deposit funding and low loan-to-deposit ratio, providing room for additional loan growth Accelerates pro-forma balance sheet to more than $12.8 billion in assets Opportunity to increase revenue by introducing WSBC’s wealth management products and services to the marketplace Extensive due diligence process and appropriate deal protections History of successful consolidations with a seasoned management team; technology and back office support; and capital and liquidity strength WesBanco – well-positioned for continued, high-quality growth
Appendix
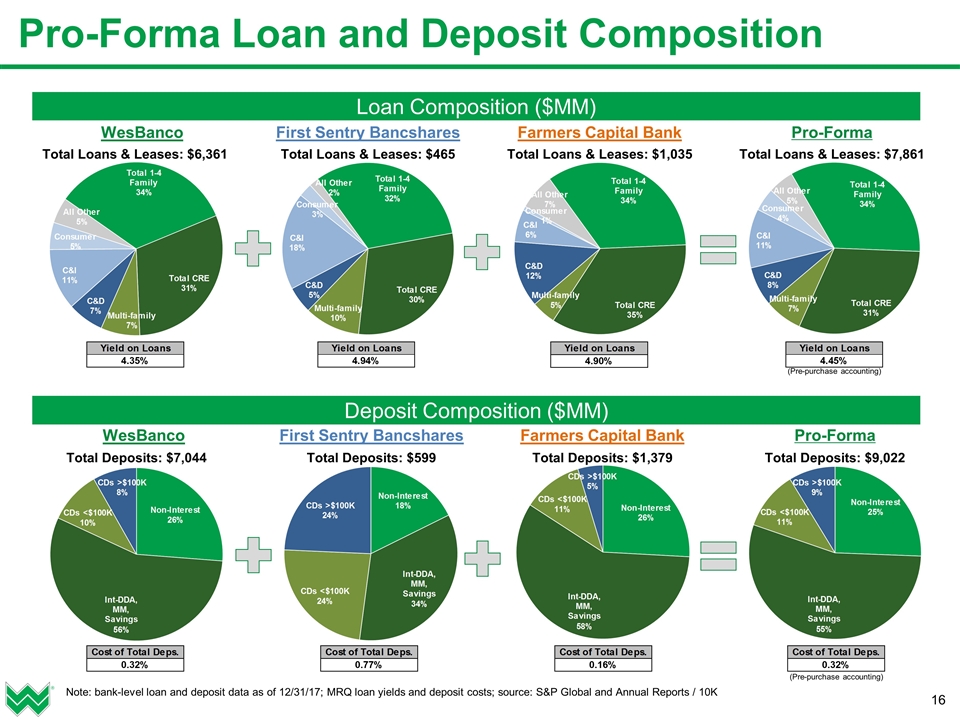
Pro-Forma Loan and Deposit Composition Note: bank-level loan and deposit data as of 12/31/17; MRQ loan yields and deposit costs; source: S&P Global and Annual Reports / 10K Loan Composition ($MM) WesBanco Total Loans & Leases: $6,361 First Sentry Bancshares Total Loans & Leases: $465 Farmers Capital Bank Total Loans & Leases: $1,035 Pro-Forma Total Loans & Leases: $7,861 WesBanco Total Deposits: $7,044 First Sentry Bancshares Total Deposits: $599 Farmers Capital Bank Total Deposits: $1,379 Pro-Forma Total Deposits: $9,022 Deposit Composition ($MM) (Pre-purchase accounting) (Pre-purchase accounting)
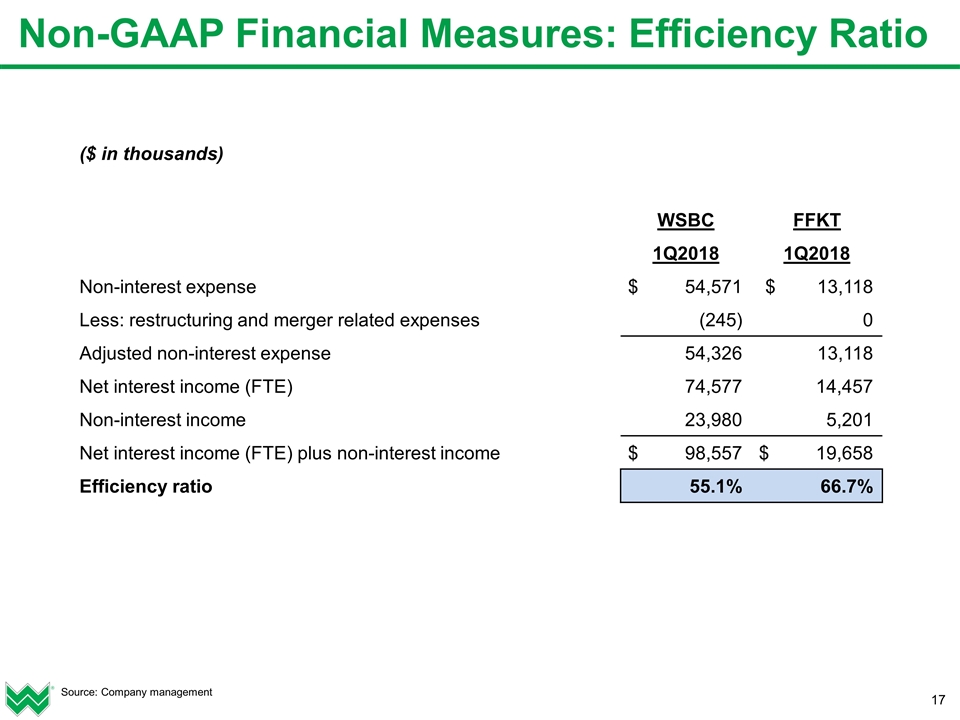
Non-GAAP Financial Measures: Efficiency Ratio Source: Company management ($ in thousands) WSBC FFKT 1Q2018 1Q2018 Non-interest expense $ 54,571 $ 13,118 Less: restructuring and merger related expenses (245) 0 Adjusted non-interest expense 54,326 13,118 Net interest income (FTE) 74,577 14,457 Non-interest income 23,980 5,201 Net interest income (FTE) plus non-interest income $ 98,557 $ 19,658 Efficiency ratio 55.1% 66.7%
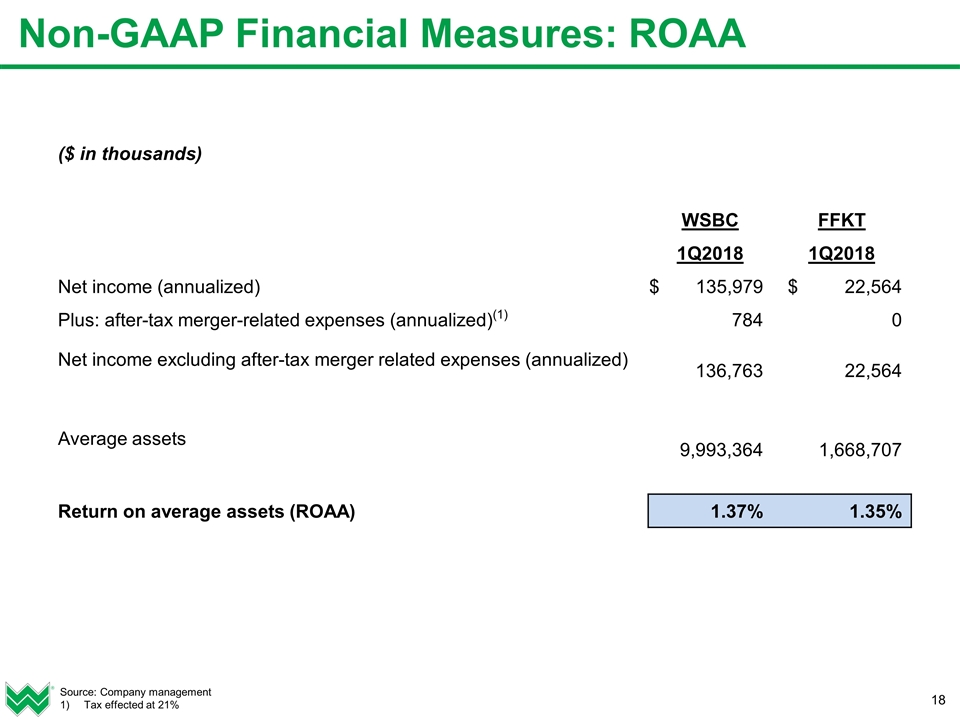
Non-GAAP Financial Measures: ROAA Source: Company management Tax effected at 21% ($ in thousands) WSBC FFKT 1Q2018 1Q2018 Net income (annualized) $ 135,979 $ 22,564 Plus: after-tax merger-related expenses (annualized)(1) 784 0 Net income excluding after-tax merger related expenses (annualized) 136,763 22,564 Average assets 9,993,364 1,668,707 Return on average assets (ROAA) 1.37% 1.35%
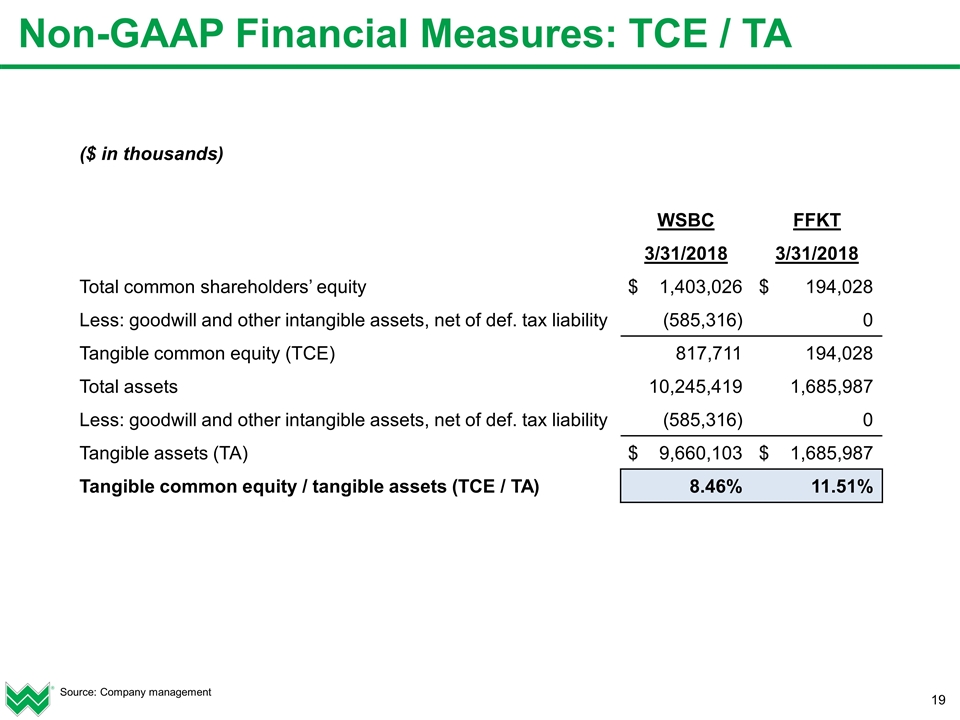
Non-GAAP Financial Measures: TCE / TA Source: Company management ($ in thousands) WSBC FFKT 3/31/2018 3/31/2018 Total common shareholders’ equity $ 1,403,026 $ 194,028 Less: goodwill and other intangible assets, net of def. tax liability (585,316) 0 Tangible common equity (TCE) 817,711 194,028 Total assets 10,245,419 1,685,987 Less: goodwill and other intangible assets, net of def. tax liability (585,316) 0 Tangible assets (TA) $ 9,660,103 $ 1,685,987 Tangible common equity / tangible assets (TCE / TA) 8.46% 11.51%
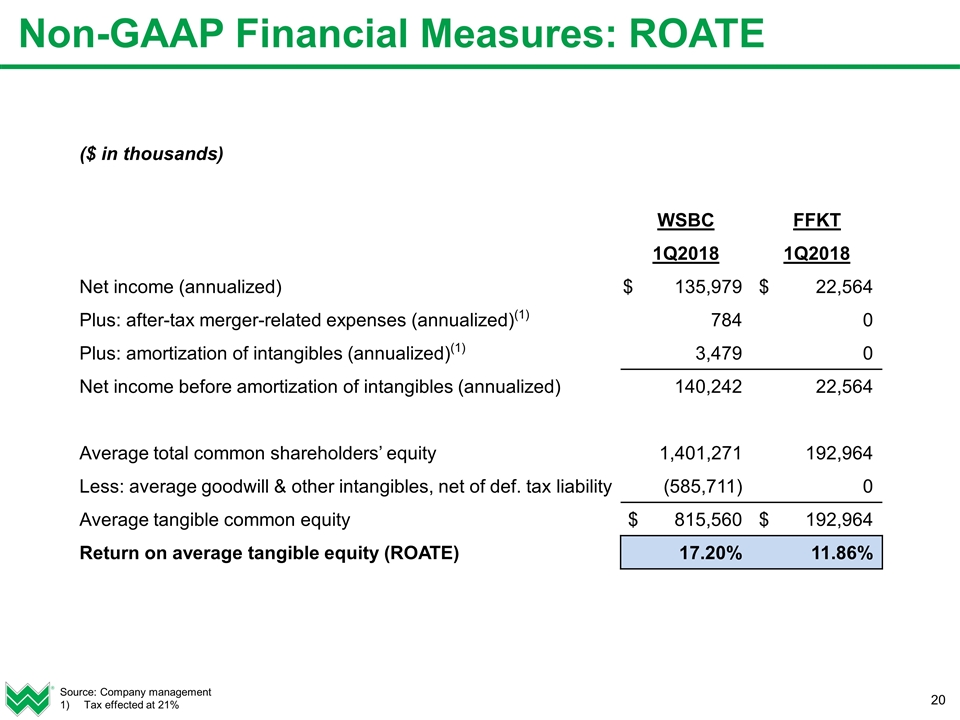
Non-GAAP Financial Measures: ROATE Source: Company management Tax effected at 21% ($ in thousands) WSBC FFKT 1Q2018 1Q2018 Net income (annualized) $ 135,979 $ 22,564 Plus: after-tax merger-related expenses (annualized)(1) 784 0 Plus: amortization of intangibles (annualized)(1) 3,479 0 Net income before amortization of intangibles (annualized) 140,242 22,564 Average total common shareholders’ equity 1,401,271 192,964 Less: average goodwill & other intangibles, net of def. tax liability (585,711) 0 Average tangible common equity $ 815,560 $ 192,964 Return on average tangible equity (ROATE) 17.20% 11.86%
