Attached files
| file | filename |
|---|---|
| EX-99.1 - EX-99.1 - FARMERS NATIONAL BANC CORP /OH/ | d569541dex991.htm |
| 8-K - FORM 8-K - FARMERS NATIONAL BANC CORP /OH/ | d569541d8k.htm |
Annual Meeting of Shareholders Thursday, April 19, 2018 Exhibit 99.2
2017
Carl D. Culp Executive Vice President Chief Financial Officer
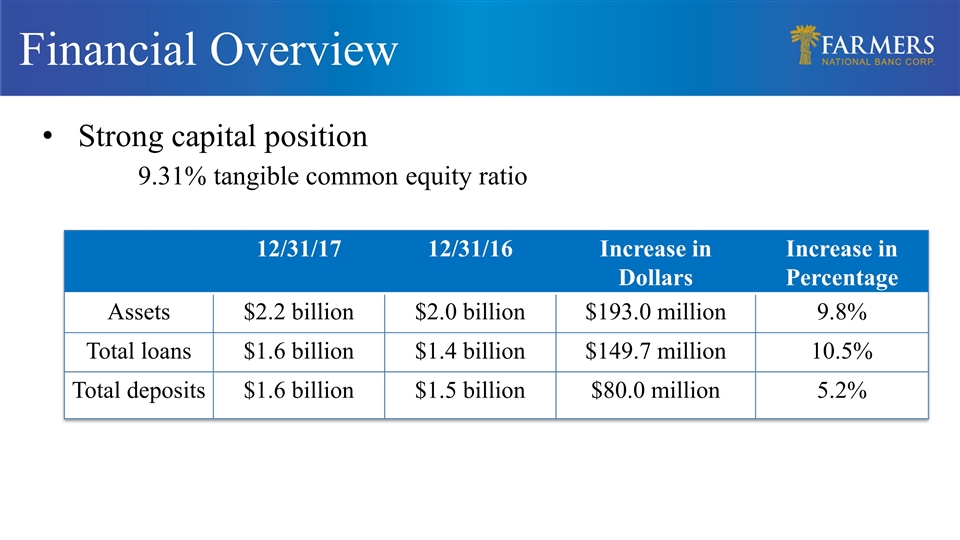
Financial Overview Strong capital position 9.31% tangible common equity ratio 12/31/17 12/31/16 Increase in Dollars Increase in Percentage Assets $2.2 billion $2.0 billion $193.0 million 9.8% Total loans $1.6 billion $1.4 billion $149.7 million 10.5% Total deposits $1.6 billion $1.5 billion $80.0 million 5.2%
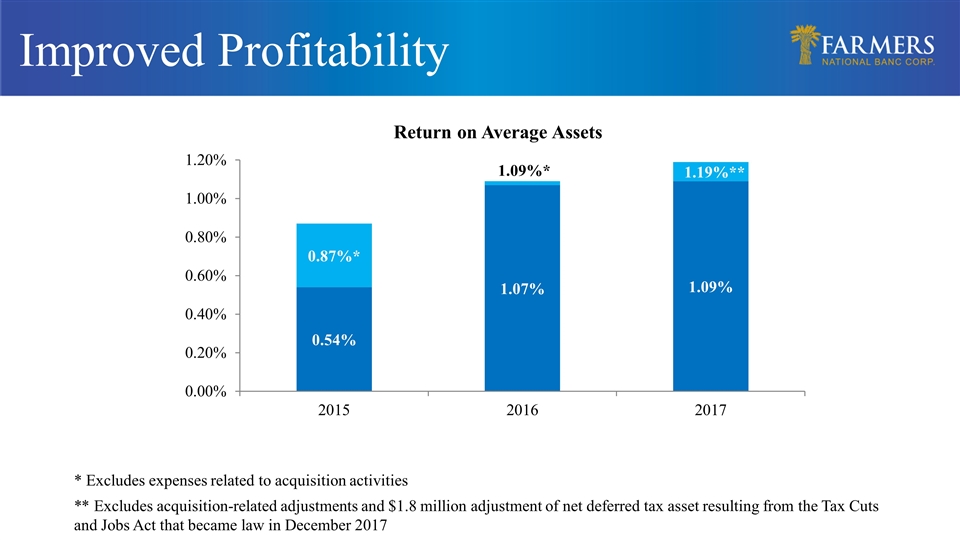
Improved Profitability * Excludes expenses related to acquisition activities ** Excludes acquisition-related adjustments and $1.8 million adjustment of net deferred tax asset resulting from the Tax Cuts and Jobs Act that became law in December 2017
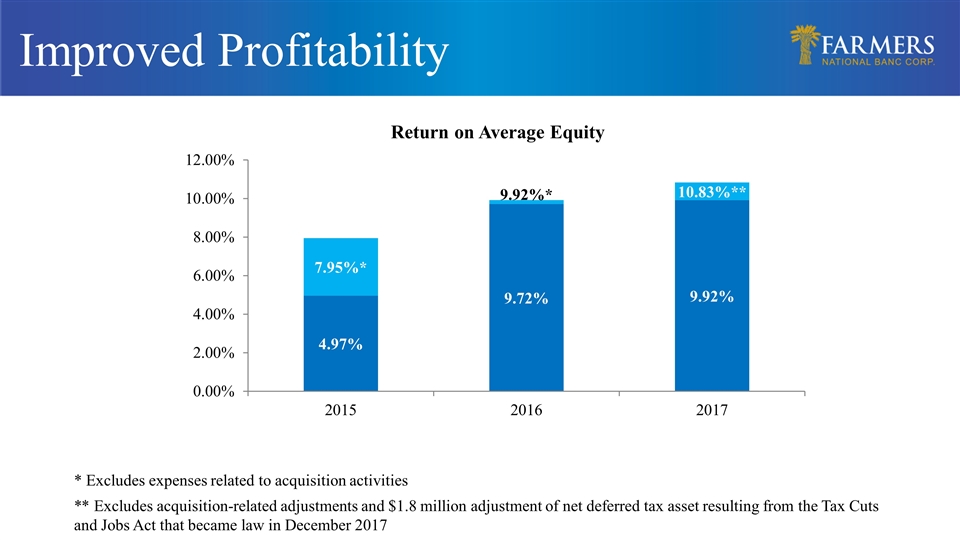
Improved Profitability * Excludes expenses related to acquisition activities ** Excludes acquisition-related adjustments and $1.8 million adjustment of net deferred tax asset resulting from the Tax Cuts and Jobs Act that became law in December 2017
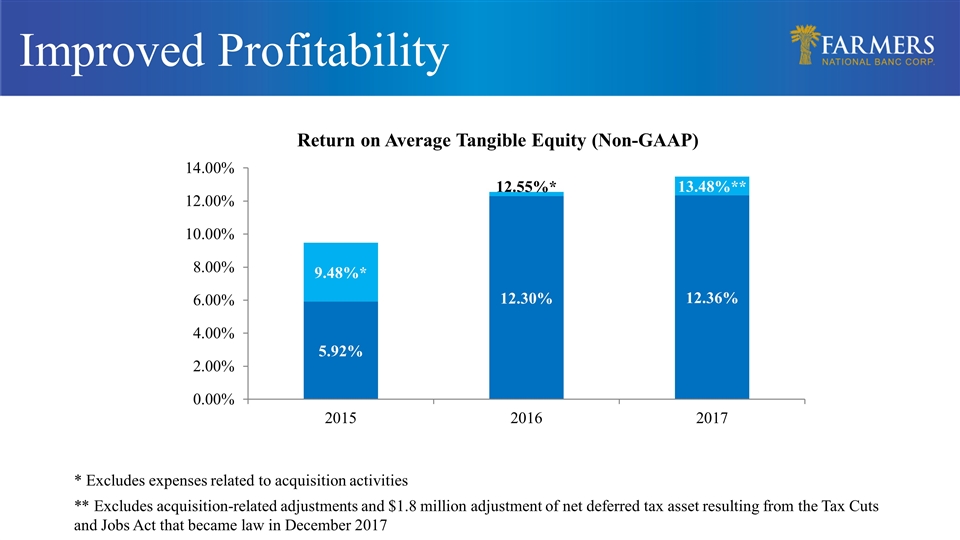
Improved Profitability * Excludes expenses related to acquisition activities ** Excludes acquisition-related adjustments and $1.8 million adjustment of net deferred tax asset resulting from the Tax Cuts and Jobs Act that became law in December 2017
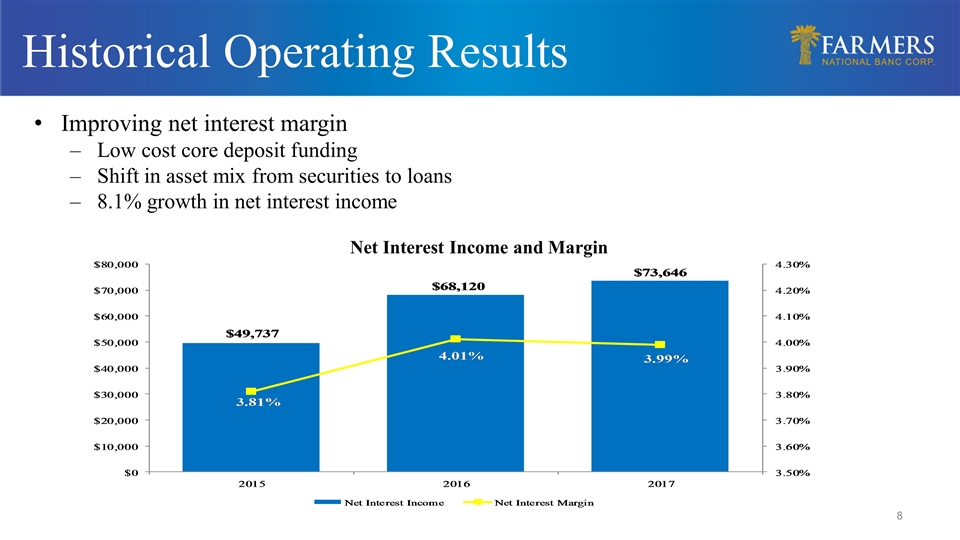
Historical Operating Results Improving net interest margin Low cost core deposit funding Shift in asset mix from securities to loans 8.1% growth in net interest income Net Interest Income and Margin
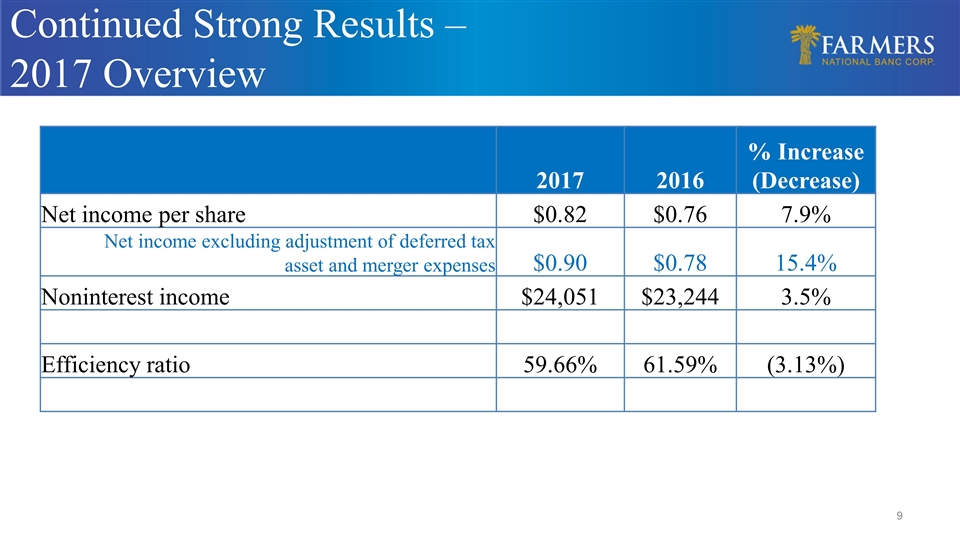
Continued Strong Results – 2017 Overview 2017 2016 % Increase (Decrease) Net income per share $0.82 $0.76 7.9% Net income excluding adjustment of deferred tax asset and merger expenses $0.90 $0.78 15.4% Noninterest income $24,051 $23,244 3.5% Efficiency ratio 59.66% 61.59% (3.13%)
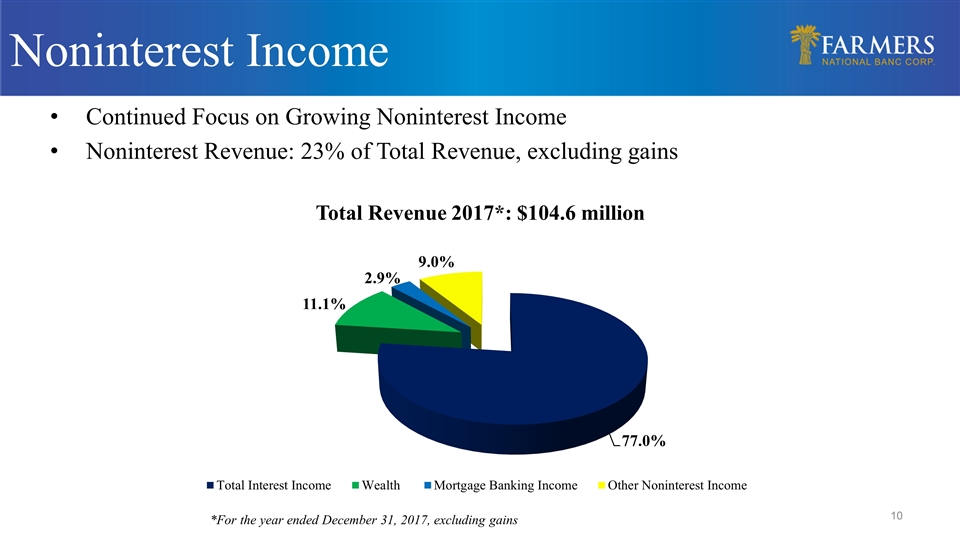
Noninterest Income Continued Focus on Growing Noninterest Income Noninterest Revenue: 23% of Total Revenue, excluding gains *For the year ended December 31, 2017, excluding gains
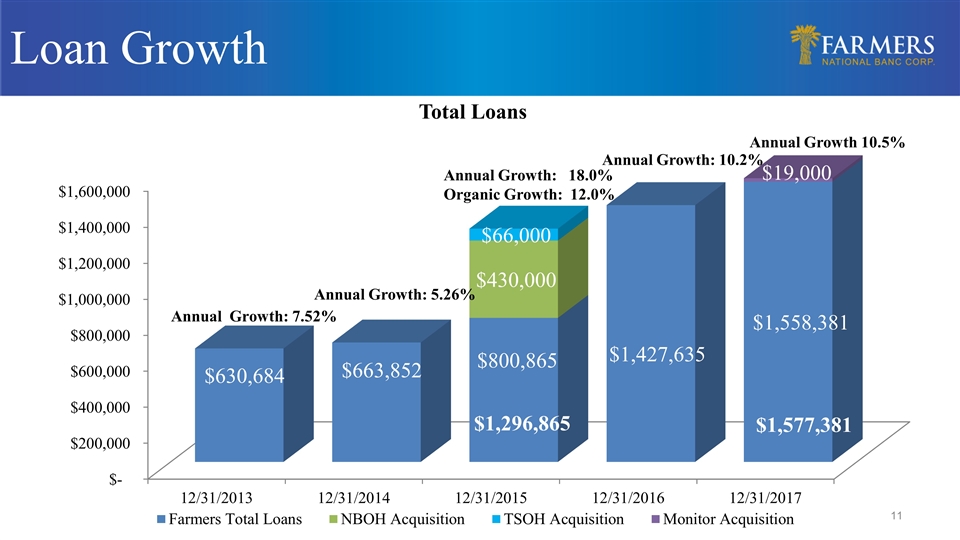
Loan Growth Annual Growth: 10.2% Annual Growth 10.5% Annual Growth: 5.26% Annual Growth: 18.0% Organic Growth: 12.0% $1,577,381 $1,296,865
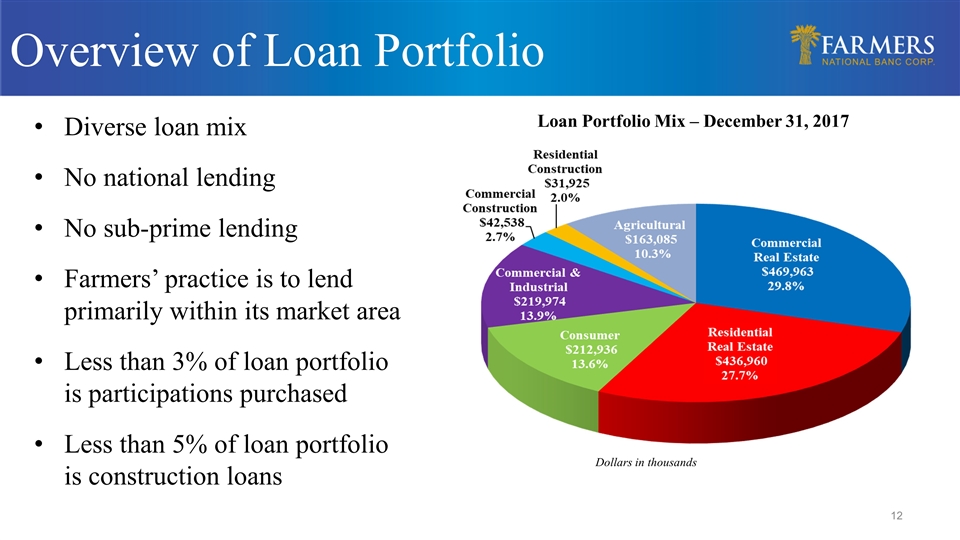
Loan Portfolio Mix – December 31, 2017 Overview of Loan Portfolio Dollars in thousands Diverse loan mix No national lending No sub-prime lending Farmers’ practice is to lend primarily within its market area Less than 3% of loan portfolio is participations purchased Less than 5% of loan portfolio is construction loans
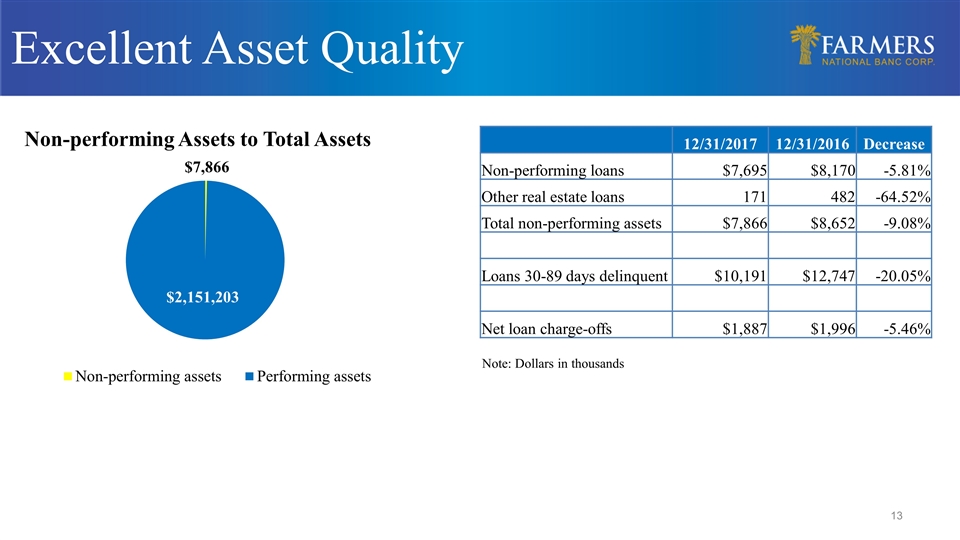
Excellent Asset Quality Note: Dollars in thousands 12/31/2017 12/31/2016 Decrease Non-performing loans $7,695 $8,170 -5.81% Other real estate loans 171 482 -64.52% Total non-performing assets $7,866 $8,652 -9.08% Loans 30-89 days delinquent $10,191 $12,747 -20.05% Net loan charge-offs $1,887 $1,996 -5.46%
Continued Strong Results – Overview of 1Q 2018 Record net income for the quarter of $7.7 million, 34% higher than the same quarter in 2017 141 consecutive quarters of profitability Annualized return on average assets was 1.45% and annualized return on average equity 13.03% for the quarter ended March 31, 2018 9.4% loan growth since March 31, 2017 Non-performing assets to total assets remain at low levels, 0.37% at March 31, 2018
Kevin J. Helmick President & Chief Executive Officer
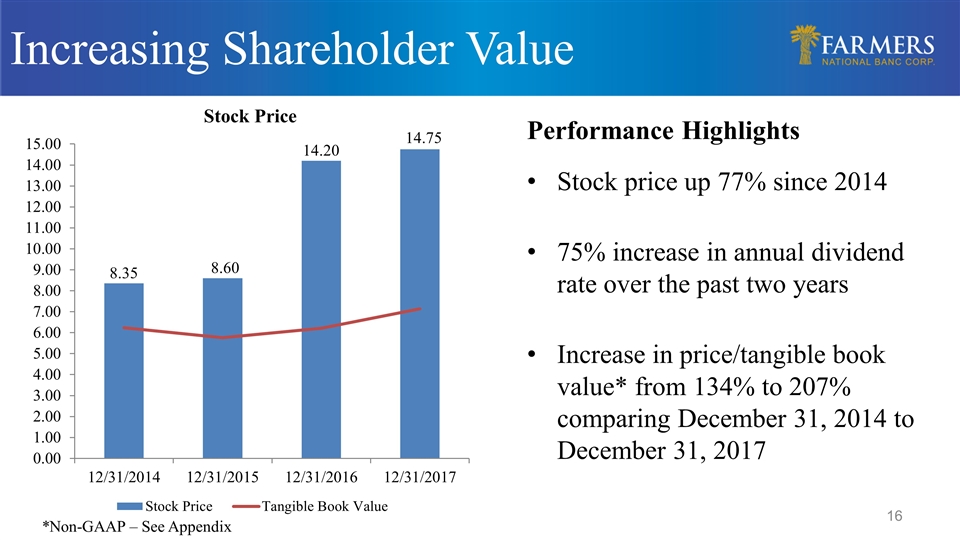
Increasing Shareholder Value Performance Highlights Stock price up 77% since 2014 75% increase in annual dividend rate over the past two years Increase in price/tangible book value* from 134% to 207% comparing December 31, 2014 to December 31, 2017 *Non-GAAP – See Appendix
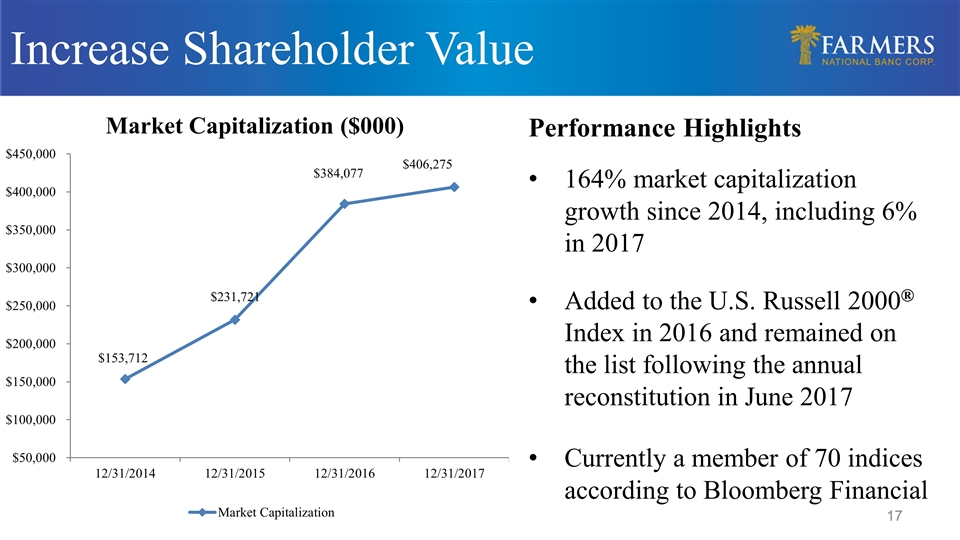
Increase Shareholder Value Performance Highlights 164% market capitalization growth since 2014, including 6% in 2017 Added to the U.S. Russell 2000® Index in 2016 and remained on the list following the annual reconstitution in June 2017 Currently a member of 70 indices according to Bloomberg Financial
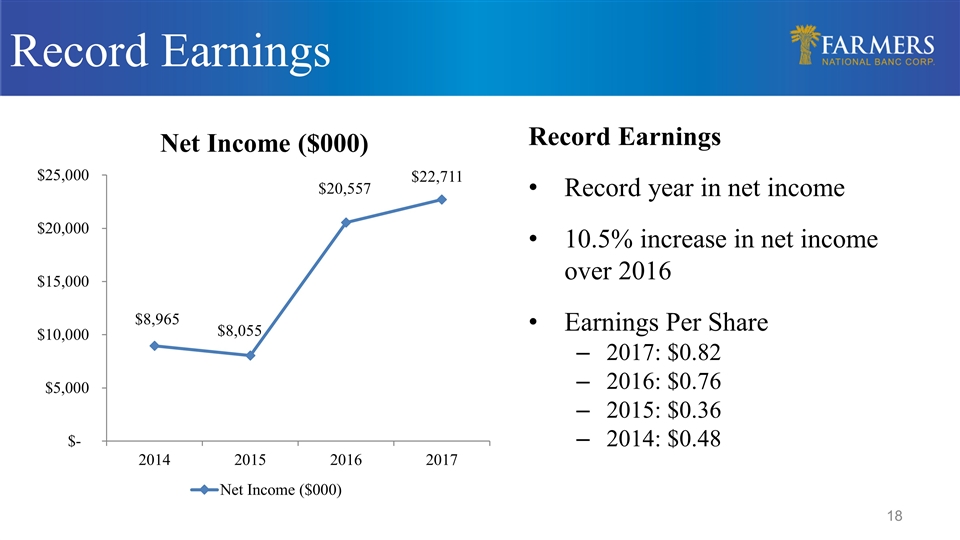
Record Earnings Record Earnings Record year in net income 10.5% increase in net income over 2016 Earnings Per Share 2017: $0.82 2016: $0.76 2015: $0.36 2014: $0.48
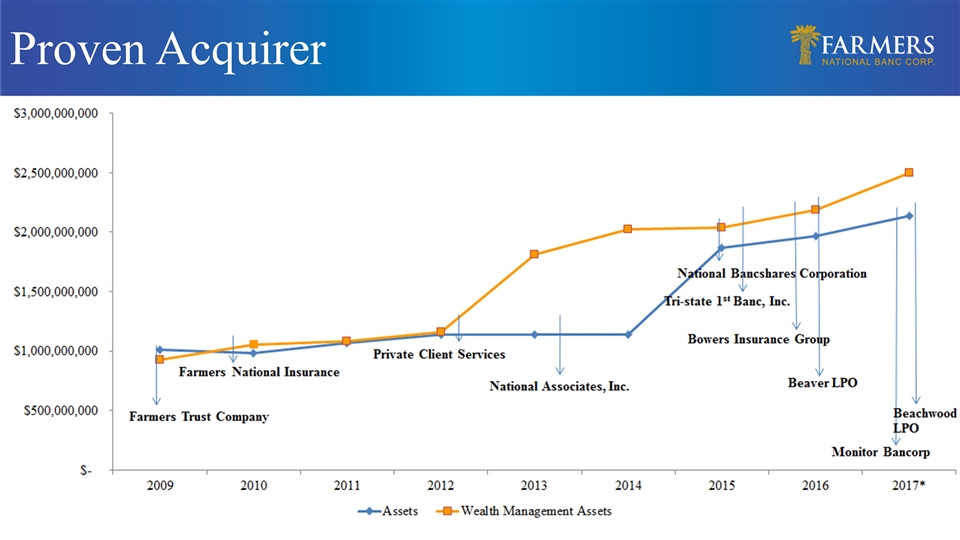
Proven Acquirer
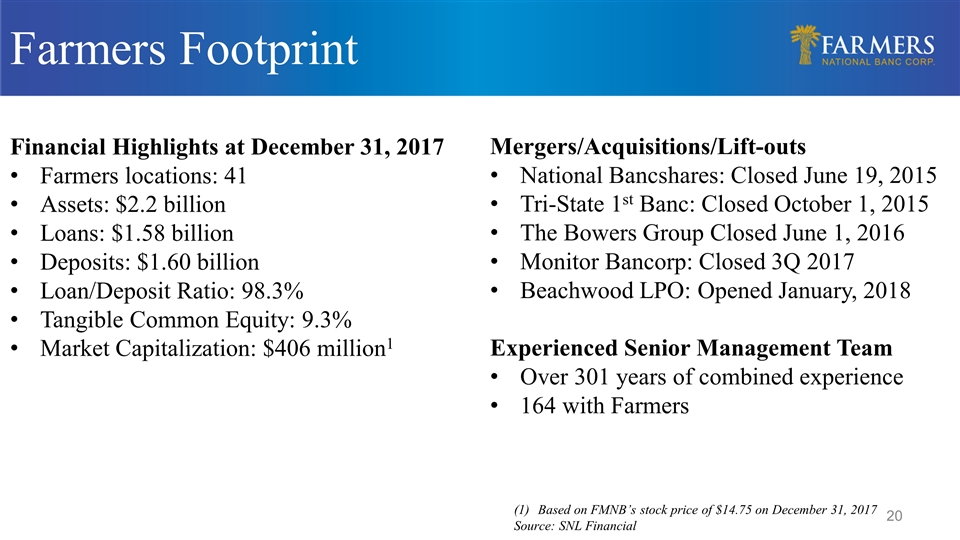
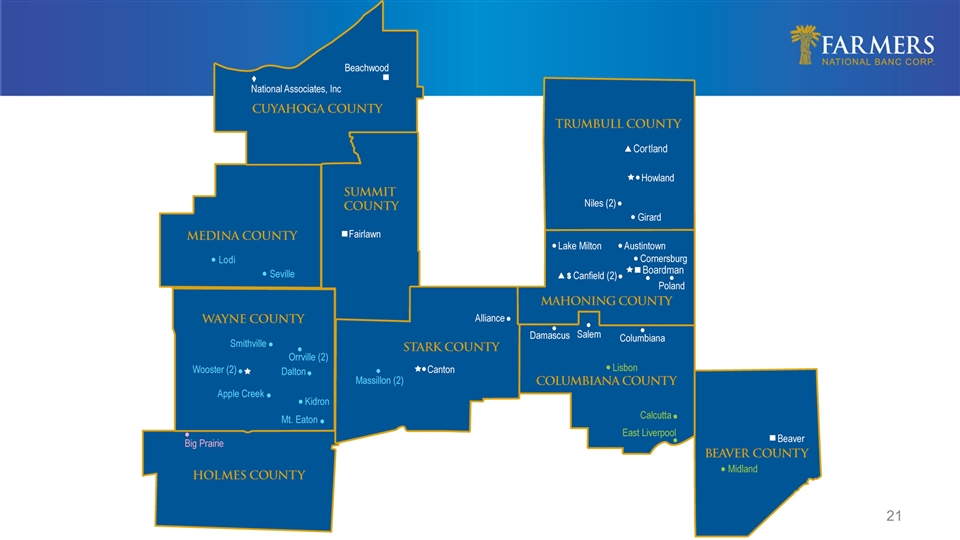
Farmers Footprint Financial Highlights at December 31, 2017 Farmers locations: 41 Assets: $2.2 billion Loans: $1.58 billion Deposits: $1.60 billion Loan/Deposit Ratio: 98.3% Tangible Common Equity: 9.3% Market Capitalization: $406 million1 Based on FMNB’s stock price of $14.75 on December 31, 2017 Source: SNL Financial Mergers/Acquisitions/Lift-outs National Bancshares: Closed June 19, 2015 Tri-State 1st Banc: Closed October 1, 2015 The Bowers Group Closed June 1, 2016 Monitor Bancorp: Closed 3Q 2017 Beachwood LPO: Opened January, 2018 Experienced Senior Management Team Over 301 years of combined experience 164 with Farmers

Amber Wallace Executive Vice President, Chief Retail and Marketing Officer
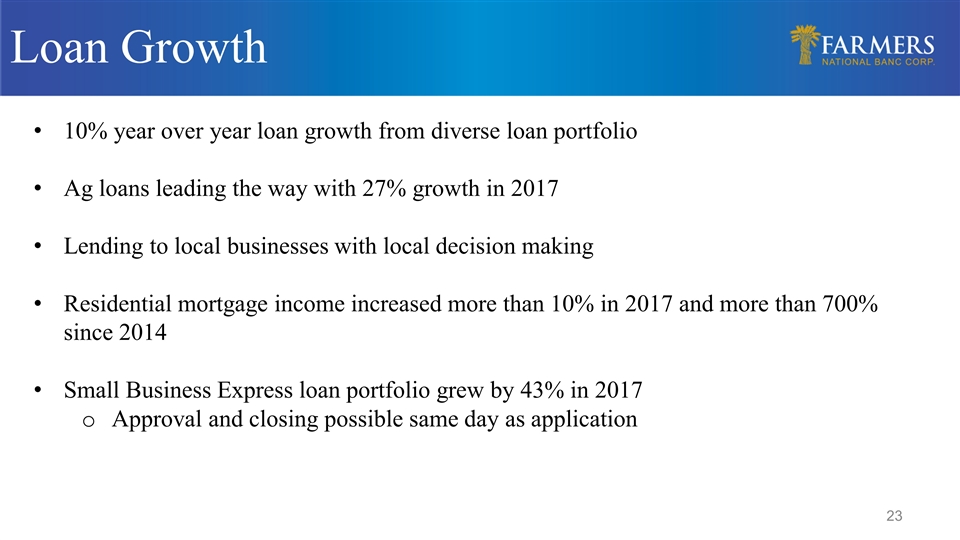
Loan Growth $1,296,865 10% year over year loan growth from diverse loan portfolio Ag loans leading the way with 27% growth in 2017 Lending to local businesses with local decision making Residential mortgage income increased more than 10% in 2017 and more than 700% since 2014 Small Business Express loan portfolio grew by 43% in 2017 Approval and closing possible same day as application
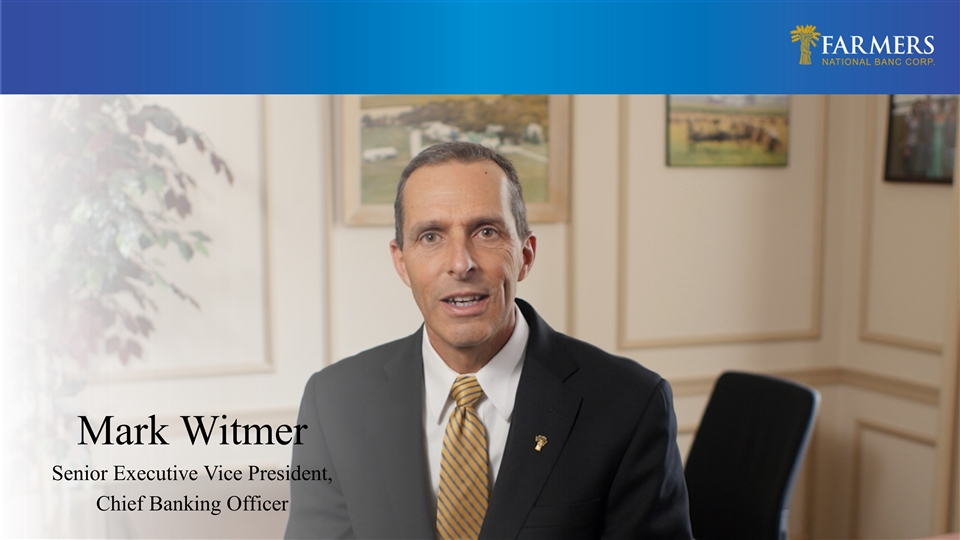
Mark Witmer Senior Executive Vice President, Chief Banking Officer
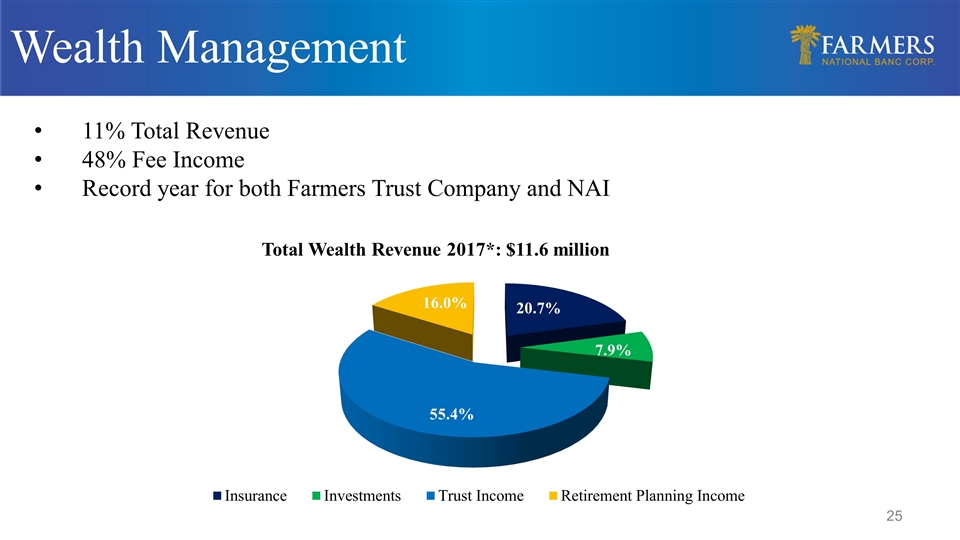
Wealth Management 11% Total Revenue 48% Fee Income Record year for both Farmers Trust Company and NAI

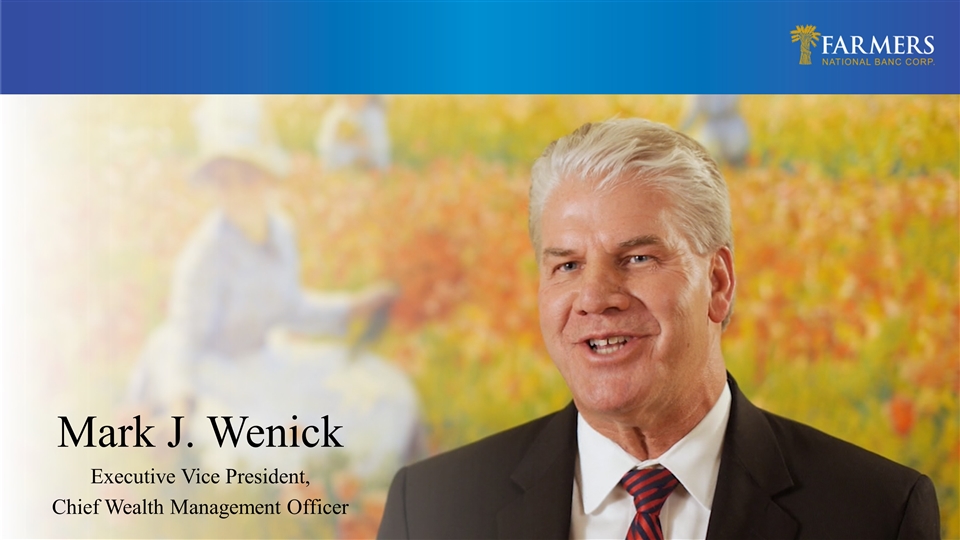
Mark J. Wenick Executive Vice President, Chief Wealth Management Officer

60 Second – Private Banking Flagship Spot 30 Second – Trust Flagship Spot
2018 Top 3 Initiatives Optimize Branch Portfolio Increase Deposits Integrate/Re-brand Wealth Management
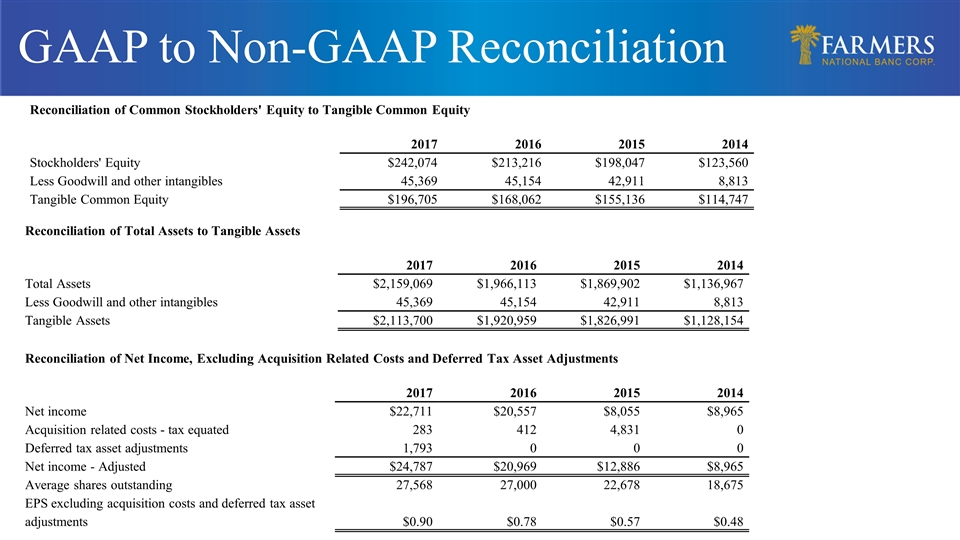
GAAP to Non-GAAP Reconciliation Reconciliation of Common Stockholders' Equity to Tangible Common Equity 2017 2016 2015 2014 Stockholders' Equity $242,074 $213,216 $198,047 $123,560 Less Goodwill and other intangibles 45,369 45,154 42,911 8,813 Tangible Common Equity $196,705 $168,062 $155,136 $114,747 Reconciliation of Total Assets to Tangible Assets 2017 2016 2015 2014 Total Assets $2,159,069 $1,966,113 $1,869,902 $1,136,967 Less Goodwill and other intangibles 45,369 45,154 42,911 8,813 Tangible Assets $2,113,700 $1,920,959 $1,826,991 $1,128,154 Reconciliation of Net Income, Excluding Acquisition Related Costs and Deferred Tax Asset Adjustments 2017 2016 2015 2014 Net income $22,711 $20,557 $8,055 $8,965 Acquisition related costs - tax equated 283 412 4,831 0 Deferred tax asset adjustments 1,793 0 0 0 Net income - Adjusted $24,787 $20,969 $12,886 $8,965 Average shares outstanding 27,568 27,000 22,678 18,675 EPS excluding acquisition costs and deferred tax asset adjustments $0.90 $0.78 $0.57 $0.48
Questions and Answers
