Attached files
| file | filename |
|---|---|
| EX-99.1 - EX-99.1 - KAPSTONE PAPER & PACKAGING CORP | a18-10109_1ex99d1.htm |
| 8-K - 8-K - KAPSTONE PAPER & PACKAGING CORP | a18-10109_18k.htm |
Forward-Looking Statements Forward-looking Statements The information in this presentation and statements made during this presentation may contain certain forward-looking statements within the meaning of federal securities laws. These statements reflect management’s expectations regarding future events and operating performance. Risk Factors These forward-looking statements involve a number of risks and uncertainties. A list of the factors that could cause actual results to differ materially from those expressed in, or underlying, any forward-looking statements can be found in the Company’s filings with the Securities and Exchange Commission, such as its annual and quarterly reports. The Company disclaims any obligation to revise or update such statements to reflect the occurrence of events after the date of this presentation. Non-GAAP Financial Measures This presentation refers to non-U.S. GAAP financial information. A reconciliation of non-U.S. GAAP to U.S. GAAP financial measures is available at the end of the press release and on the company’s website at KapStonepaper.com under Investors. 2
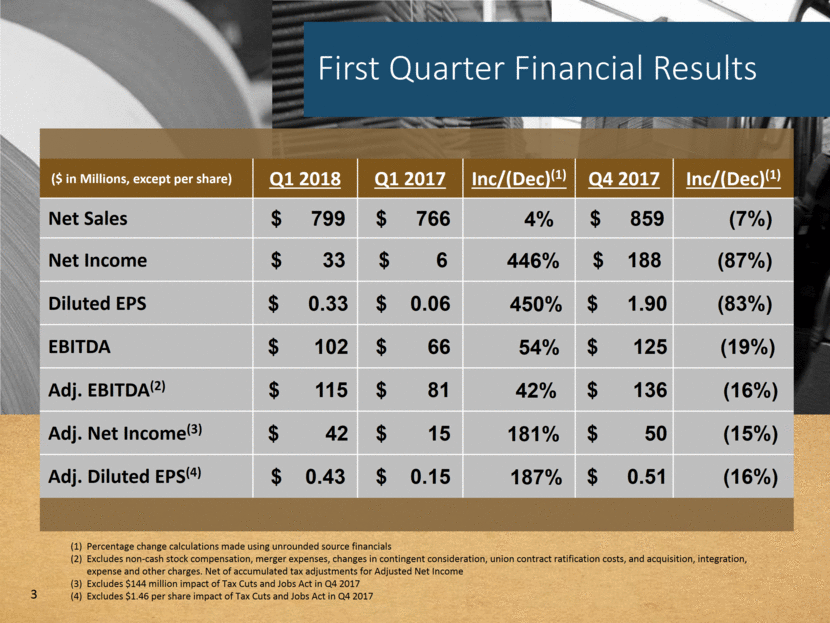
First Quarter Financial Results 3 ($ in Millions, except per share) Q1 2018 Q1 2017 Inc/(Dec)(1) Q4 2017 Inc/(Dec)(1) Net Sales $ 799 $ 766 4% $ 859 (7%) Net Income $ 33 $ 6 446% $ 188 (87%) Diluted EPS $ 0.33 $ 0.06 450% $ 1.90 (83%) EBITDA $ 102 $ 66 54% $ 125 (19%) Adj. EBITDA(2) $ 115 $ 81 42% $ 136 (16%) Adj. Net Income(3) $ 42 $ 15 181% $ 50 (15%) Adj. Diluted EPS(4) $ 0.43 $ 0.15 187% $ 0.51 (16%) (1) Percentage change calculations made using unrounded source financials (2) Excludes non-cash stock compensation, merger expenses, changes in contingent consideration, union contract ratification costs, and acquisition, integration, expense and other charges. Net of accumulated tax adjustments for Adjusted Net Income Excludes $144 million impact of Tax Cuts and Jobs Act in Q4 2017 Excludes $1.46 per share impact of Tax Cuts and Jobs Act in Q4 2017
Q1 2018 Compared to Q1 2017 Higher Prices offset by Outage Costs Drives Earnings Growth Price/mix was favorably impacted by higher average mill selling prices, up $71 per ton reflecting: Higher mill prices of $29 million Favorable product mix of $2 million Higher corrugated products prices of $17 million Sales volume down 37,000 tons in Paper and Packaging segment driven by lower sales of specialty paper. Distribution segment sales up $13 million mainly on price. Adjusted EBITDA flat as higher margins were offset by inflation on operating costs Inflation includes higher virgin fiber costs, compensation and benefits, and freight, offset by lower OCC costs Outages reflects higher planned costs, mainly for a boiler upgrade outage at the Charleston mill Productivity includes higher mill production and lower operating costs, partially offset by $4 million of incentives 4 $766 $48 $28 $13 $799 Net Sales $ in Millions $81 $48 $7 $9 $8 $10 $115 $ in Millions Adjusted EBITDA
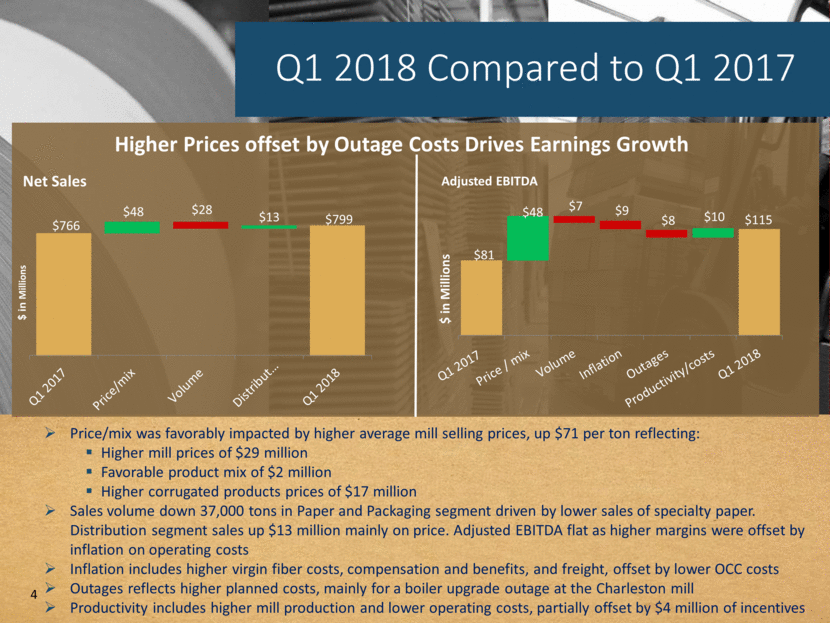
Q1 2018 Compared to Q4 2017 Seasonally Lower Volume and Outage Costs Lower Earnings 5 Price/mix was favorably impacted by higher average mill selling prices, up $21 per ton reflecting: Higher containerboard and corrugated prices and higher specialty paper products Favorable mix primarily reflecting lower export containerboard shipments (-19,000 tons) Paper and Packaging segment sales down $49 million, or 67,000 tons due to two less mill production days, planned outages and seasonality. Distribution segment sales down $19 million due to seasonality resulting in $6 million of lower Adjusted EBITDA Planned outages includes $14 million for the boiler upgrade at Charleston, offset by Cogen outage in ‘17 Costs includes $6 million for two less mill production days, $4 million weather impact in January 2018, and higher costs for freight and chemicals $859 $8 $49 $19 $799 Net Sales $ in Millions $136 $8 $6 $12 $5 $8 $14 $115 $ in Millions Adjusted EBITDA
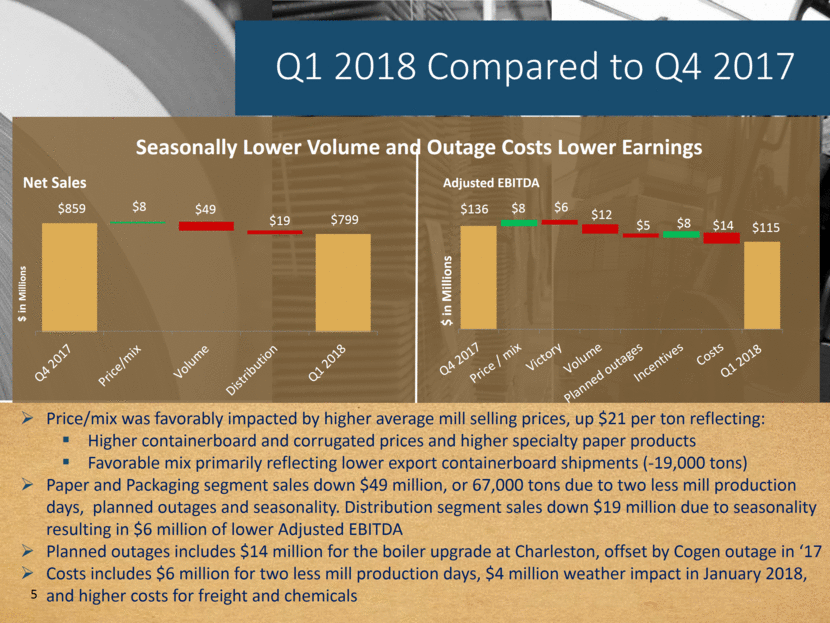
Cash Flows Q1 Operating Cash Flows 6 For Q1 2018 cash flow from operations decreased $28 million YOY primarily due to a $11 million contingent consideration payment for the Victory acquisition, $14 million of merger related expenses, and $31 million of management incentives, partially offset by a $25 million increase in earnings in 2018 Capex of $37 million for the current quarter. Proceeds of $15 million from the sale of the former Oakland box plant Net debt at March 31, 2018 - $1,396 million up $32 million from December 31, 2017 No term loan principal payments due until 2020 Debt to EBITDA leverage ratio (per credit agreement) 2.96 times – March 31, 2018 3.20 times – December 31, 2017 3.99 times – March 31, 2017 Interest rates should remain flat (Fed March rate hike offset by lower margin due to lower leverage ratio) No pension plan funding required in 2018 $10 million cash dividend paid in January $5 $33 2018 2017 $ in Millions
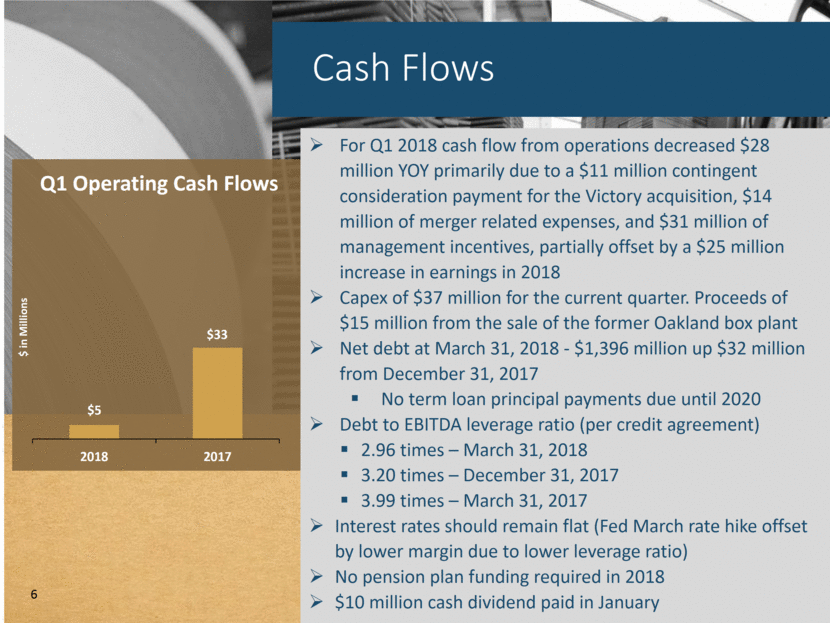
Quarterly Key Performance Indicators 7 Sales and Production Paper and Packaging Product Mix (000 Tons) Containerboard includes all domestic and export sales of linerboard and medium Specialty paper includes Kraft paper, Durasorb, Kraftpak and roll pulp Containerboard and Corrugated Products(1) Specialty Paper(2) Average Mill Revenue per Ton Tons Produced (000) Mill External Shipments (000) $719 $698 $648 1Q 18 4Q 17 1Q 17 674 705 678 1Q 18 4Q 17 1Q 17 442 504 474 1Q 18 4Q 17 1Q 17 441 470 435 221 259 264 1Q 18 4Q 17 1Q 17 1Q 18 4Q 17 1Q 17
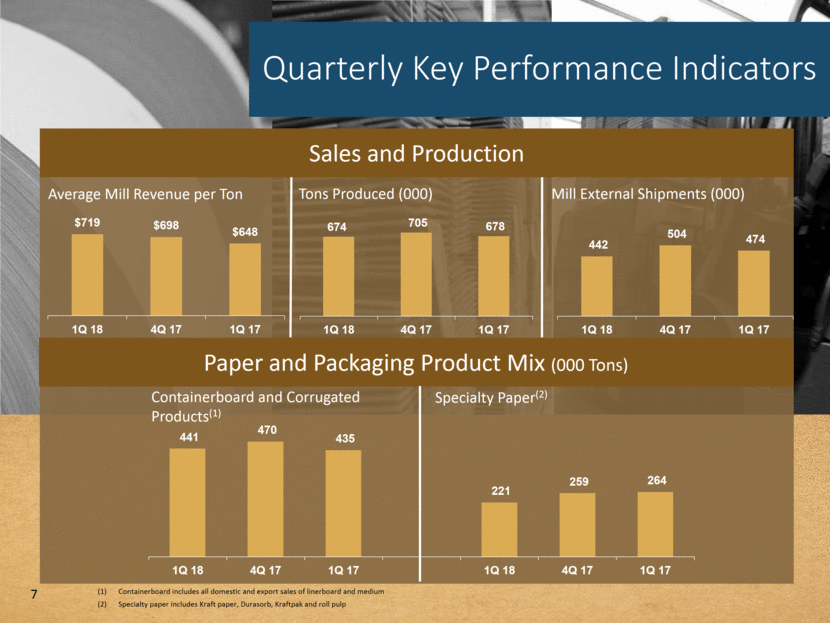
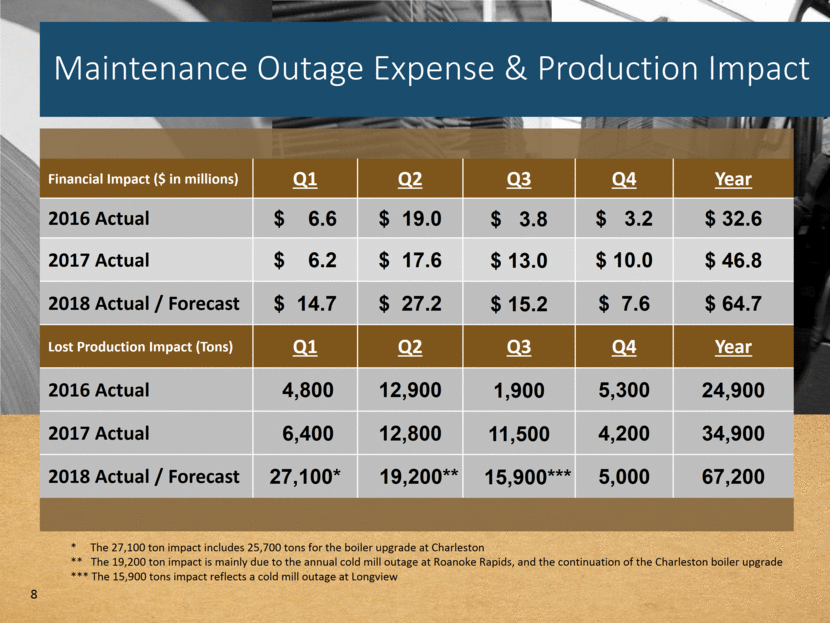
Maintenance Outage Expense & Production Impact 8 Financial Impact ($ in millions) Q1 Q2 Q3 Q4 Year 2016 Actual $ 6.6 $ 19.0 $ 3.8 $ 3.2 $ 32.6 2017 Actual $ 6.2 $ 17.6 $ 13.0 $ 10.0 $ 46.8 2018 Actual / Forecast $ 14.7 $ 27.2 $ 15.2 $ 7.6 $ 64.7 Lost Production Impact (Tons) Q1 Q2 Q3 Q4 Year 2016 Actual 4,800 12,900 1,900 5,300 24,900 2017 Actual 6,400 12,800 11,500 4,200 34,900 2018 Actual / Forecast 27,100* 19,200** 15,900*** 5,000 67,200 * The 27,100 ton impact includes 25,700 tons for the boiler upgrade at Charleston ** The 19,200 ton impact is mainly due to the annual cold mill outage at Roanoke Rapids, and the continuation of the Charleston boiler upgrade *** The 15,900 tons impact reflects a cold mill outage at Longview
