Attached files
| file | filename |
|---|---|
| EX-99.1 - EXHIBIT 99.1 - CROWN CASTLE INTERNATIONAL CORP | q12018earningsrelease.htm |
| 8-K - 8-K - CROWN CASTLE INTERNATIONAL CORP | q120188-k.htm |
Exhibit 99.2


Supplemental Information Package
and Non-GAAP Reconciliations
First Quarter • March 31, 2018
The pathway to possible.
CrownCastle.com
Crown Castle International Corp
First Quarter 2018
TABLE OF CONTENTS | |
Page | |
Company Overview | |
Company Profile | |
Strategy | |
AFFO per Share | |
Tower Portfolio Footprint | |
Corporate Information | |
Research Coverage | |
Historical Common Stock Data | |
Portfolio and Financial Highlights | |
Outlook | |
Financials & Metrics | |
Condensed Consolidated Balance Sheet | |
Condensed Consolidated Statement of Operations | |
Segment Operating Results | |
FFO and AFFO Reconciliations | |
Condensed Consolidated Statement of Cash Flows | |
Components of Changes in Site Rental Revenues | |
Summary of Straight-Lined and Prepaid Rent Activity | |
Summary of Capital Expenditures | |
Lease Renewal and Lease Distribution | |
Customer Overview | |
Asset Portfolio Overview | |
Summary of Tower Portfolio by Vintage | |
Portfolio Overview | |
Ground Interest Overview | |
Ground Interest Activity | |
Capitalization Overview | |
Capitalization Overview | |
Debt Maturity Overview | |
Liquidity Overview | |
Maintenance and Financial Covenants | |
Interest Rate Sensitivity | |
Appendix | |
Cautionary Language Regarding Forward-Looking Statements
This supplemental information package ("Supplement") contains forward-looking statements and information that are based on our management's current expectations as of the date of this Supplement. Statements that are not historical facts are hereby identified as forward-looking statements. Words such as "Outlook," "guide," "forecast," "estimate," "anticipate," "project," "plan," "intend," "believe," "expect," "likely," "predicted," and any variations of these words and similar expressions are intended to identify such forward looking statements. Such statements include, but are not limited to, our Outlook for the second quarter 2018 and full year 2018.
Such forward-looking statements are subject to certain risks, uncertainties and assumptions, including, but not limited to, prevailing market conditions. Should one or more of these or other risks or uncertainties materialize, or should underlying assumptions prove incorrect, actual results may vary materially from those expected. More information about potential risk factors which could affect our results is included in our filings with the Securities and Exchange Commission. Crown Castle assumes no obligation to update publicly any forward-looking statements, whether as a result of new information, future events or otherwise.
The components of financial information presented herein, both historical and forward looking, may not sum due to rounding. Definitions and reconciliations of non-GAAP financial measures, segment measures and other calculations are provided in the Appendix to this Supplement. Unless otherwise indicated, the Company has changed its presentation to millions and, as a result, any necessary rounding adjustments have been made to prior year disclosed amounts.
As used herein, the term "including" and any variation thereof, means "including without limitation." The use of the word "or" herein is not exclusive.
1
Crown Castle International Corp.
First Quarter 2018
COMPANY OVERVIEW | FINANCIALS & METRICS | ASSET PORTFOLIO OVERVIEW | CAPITALIZATION OVERVIEW | APPENDIX |
COMPANY PROFILE | ||||
Crown Castle International Corp. (to which the terms "Crown Castle," "CCIC," "we," "our," "our Company," "the Company" or "us" as used herein refer) owns, operates and leases shared communications infrastructure, including: (1) towers and other structures, such as rooftops (collectively, "towers"), and (2) fiber primarily supporting small cell networks ("small cells") and fiber solutions. Our towers, fiber and small cells assets are collectively referred to herein as "communications infrastructure," and our customers on our communications infrastructure are referred to herein as "tenants." Our towers have a significant presence in each of the top 100 basic trading areas, and the majority of our fiber is located in major metropolitan areas, including a presence within every major U.S. market. Crown Castle owns, operates and leases shared communications infrastructure that has been acquired or constructed over time and is geographically dispersed throughout the U.S., and which consists of (1) approximately 40,000 towers and (2) approximately 60,000 route miles of fiber primarily supporting small cells and fiber solutions.
Our core business is providing access, including space or capacity, to our shared communications infrastructure via long-term contracts in various forms, including licenses, subleases and lease agreements (collectively, "contracts"). We seek to increase our site rental revenues by adding more tenants on our communications infrastructure, which we expect to result in significant incremental cash flows due to our low incremental operating costs.
We operate as a Real Estate Investment Trust ("REIT") for U.S. federal income tax purposes.
STRATEGY | ||||
As a leading provider of shared communications infrastructure in the U.S., our strategy is to create long-term stockholder value via a combination of (1) growing cash flows generated from our portfolio of communications infrastructure, (2) returning a meaningful portion of our cash provided by operating activities to our stockholders in the form of dividends and (3) investing capital efficiently to grow cash flows and long-term dividends per share. Our U.S. focused strategy is based, in part, on our belief that the U.S. is the most attractive market for shared communications infrastructure investment with the greatest long-term growth potential. We measure our efforts to create "long-term stockholder value" by the combined payment of dividends to stockholders and growth in our per share results. The key elements of our strategy are to:
• | Grow cash flows from our communications infrastructure. We seek to maximize our site rental cash flows by working with our customers to provide them quick access to our communications infrastructure and entering into associated long-term contracts. Tenant additions or modifications of existing customer equipment (collectively, "tenant additions") enable our customers to expand coverage and capacity in order to meet increasing demand for data, while generating high incremental returns for our business. We believe our product offerings of towers and small cells provide a comprehensive solution to our wireless customers' growing network needs through our shared communications infrastructure model, which is an efficient and cost-effective way to serve our customers. Additionally, we believe our ability to share our fiber assets across multiple customers to deploy both small cells and offer fiber solutions allows us to generate cash flows and increase stockholder return. We also believe that there will be considerable future demand for our communications infrastructure based on the location of our assets and the rapid growth in demand for data. |
• | Return cash provided by operating activities to stockholders in the form of dividends. We believe that distributing a meaningful portion of our cash provided by operating activities appropriately provides stockholders with increased certainty for a portion of expected long-term stockholder value while still retaining sufficient flexibility to invest in our business and deliver growth. We believe this decision reflects the translation of the high-quality, long-term contractual cash flows of our business into stable capital returns to stockholders. |
• | Invest capital efficiently to grow cash flows and long-term dividends per share. We seek to invest our available capital, including the net cash provided by our operating activities and external financing sources, in a manner that will increase long-term stockholder value on a risk-adjusted basis. Our historical investments have included the following (in no particular order): |
◦ | acquisitions or construction of towers, fiber and small cells; |
◦ | acquisitions of land interests under towers; |
◦ | improvements and structural enhancements to our existing communications infrastructure; |
◦ | purchases of shares of our common stock from time to time; and |
◦ | purchases, repayment or redemption of our debt. |
2
Crown Castle International Corp.
First Quarter 2018
COMPANY OVERVIEW | FINANCIALS & METRICS | ASSET PORTFOLIO OVERVIEW | CAPITALIZATION OVERVIEW | APPENDIX |
Our strategy to create long-term stockholder value is based on our belief that additional demand for our communications infrastructure will be created by the expected continued growth in the demand for data. We believe that such demand for our communications infrastructure will continue, will result in growth of our cash flows due to tenant additions on our existing communications infrastructure, and will create other growth opportunities for us, such as demand for new communications infrastructure.
AFFO PER SHARE(1)(2) | ||||
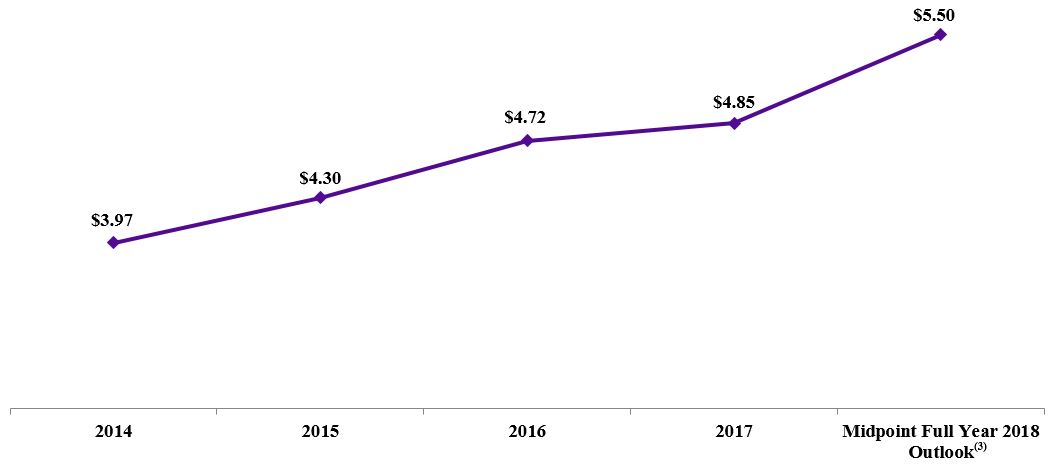
(1) | See reconciliations and definitions provided herein. |
(2) | Attributable to CCIC common stockholders. |
(3) | Represents the midpoint of the full year 2018 Outlook as issued on April 18, 2018. |
TOWER PORTFOLIO FOOTPRINT | ||
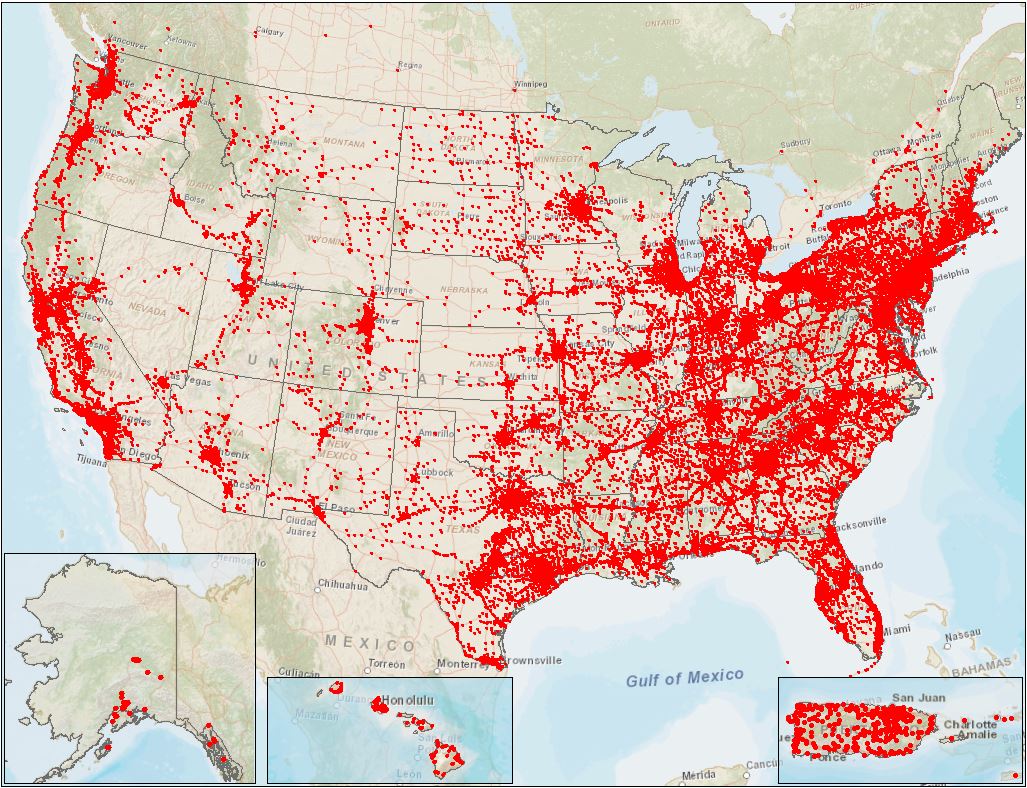 | ||
3
Crown Castle International Corp.
First Quarter 2018
COMPANY OVERVIEW | FINANCIALS & METRICS | ASSET PORTFOLIO OVERVIEW | CAPITALIZATION OVERVIEW | APPENDIX |
GENERAL COMPANY INFORMATION | |
Principal executive offices | 1220 Augusta Drive, Suite 600, Houston, TX 77057 |
Common shares trading symbol | CCI |
Stock exchange listing | New York Stock Exchange |
Fiscal year ending date | December 31 |
Fitch - Long Term Issuer Default Rating | BBB- |
Moody’s - Long Term Corporate Family Rating | Baa3 |
Standard & Poor’s - Long Term Local Issuer Credit Rating | BBB- |
Note: These credit ratings may not reflect the potential risks relating to the structure or trading of the Company’s securities and are provided solely for informational purposes. Credit ratings are not recommendations to buy, sell or hold any security, and may be revised or withdrawn at any time by the issuing organization in its sole discretion. The Company does not undertake any obligation to maintain the ratings or to advise of any change in the ratings. Each agency’s rating should be evaluated independently of any other agency’s rating. An explanation of the significances of the ratings can be obtained from each of the ratings agencies.
EXECUTIVE MANAGEMENT TEAM | |||
Name | Age | Years with Company | Position |
Jay A. Brown | 45 | 18 | President and Chief Executive Officer |
Daniel K. Schlanger | 44 | 2 | Senior Vice President, Chief Financial Officer and Treasurer |
James D. Young | 56 | 12 | Senior Vice President and Chief Operating Officer - Fiber |
Robert C. Ackerman | 65 | 19 | Senior Vice President and Chief Operating Officer - Towers and Small Cells |
Kenneth J. Simon | 57 | 2 | Senior Vice President and General Counsel |
Michael J. Kavanagh | 49 | 7 | Senior Vice President and Chief Commercial Officer |
Philip M. Kelley | 45 | 20 | Senior Vice President - Corporate Development and Strategy |
BOARD OF DIRECTORS | ||||
Name | Position | Committees | Age | Years as Director |
J. Landis Martin | Chairman | NCG(1) | 72 | 22 |
P. Robert Bartolo | Director | Audit, Compensation | 46 | 4 |
Cindy Christy | Director | Compensation, NCG(1), Strategy | 52 | 10 |
Ari Q. Fitzgerald | Director | Compensation, NCG(1), Strategy | 55 | 15 |
Robert E. Garrison II | Director | Audit, Compensation | 76 | 12 |
Andrea J. Goldsmith | Director | NCG(1), Strategy | 53 | < 1 |
Lee W. Hogan | Director | Audit, Compensation, Strategy | 73 | 17 |
Edward C. Hutcheson Jr. | Director | Strategy | 72 | 22 |
Robert F. McKenzie | Director | Audit, Strategy | 74 | 22 |
Anthony J. Melone | Director | NCG(1), Strategy | 57 | 2 |
W. Benjamin Moreland | Director | 54 | 11 | |
Jay A. Brown | Director | 45 | 1 | |
(1) | Nominating & Corporate Governance Committee |
4
Crown Castle International Corp.
First Quarter 2018
COMPANY OVERVIEW | FINANCIALS & METRICS | ASSET PORTFOLIO OVERVIEW | CAPITALIZATION OVERVIEW | APPENDIX |
RESEARCH COVERAGE | ||
Equity Research | ||
Bank of America David Barden (646) 855-1320 | Barclays Amir Rozwadowski (212) 526-4043 | BTIG Walter Piecyk (646) 450-9258 |
Citigroup Michael Rollins (212) 816-1116 | Cowen and Company Colby Synesael (646) 562-1355 | Deutsche Bank Matthew Niknam (212) 250-4711 |
Goldman Sachs Brett Feldman (212) 902-8156 | Guggenheim Robert Gutman (212) 518-9148 | Jefferies Scott Goldman (212) 284-4606 |
JPMorgan Philip Cusick (212) 622-1444 | Macquarie Amy Yong (212) 231-2624 | MoffettNathanson Nick Del Deo (212) 519-0025 |
Morgan Stanley Simon Flannery (212) 761-6432 | New Street Research Spencer Kurn (212) 921-2067 | Oppenheimer & Co. Timothy Horan (212) 667-8137 |
Pacific Crest Securities Brandon Nispel (503) 821-3871 | Raymond James Ric Prentiss (727) 567-2567 | RBC Capital Markets Jonathan Atkin (415) 633-8589 |
SunTrust Robinson Humphrey Greg Miller (212) 303-4169 | UBS Batya Levi (212) 713-8824 | Wells Fargo Securities, LLC Jennifer Fritzsche (312) 920-3548 |
Rating Agency | ||
Fitch John Culver (312) 368-3216 | Moody’s Dilara Sukhov (212) 553-1653 | Standard & Poor’s Ryan Gilmore (212) 438-0602 |
HISTORICAL COMMON STOCK DATA | |||||||||||||||
Three Months Ended | |||||||||||||||
(in millions, except per share amounts) | 3/31/18 | 12/31/17 | 9/30/17 | 6/30/17 | 3/31/17 | ||||||||||
High price(1) | $ | 113.41 | $ | 112.84 | $ | 105.89 | $ | 101.17 | $ | 91.99 | |||||
Low price(1) | $ | 99.79 | $ | 97.47 | $ | 90.42 | $ | 89.75 | $ | 80.01 | |||||
Period end closing price(2) | $ | 109.61 | $ | 109.97 | $ | 98.11 | $ | 97.42 | $ | 90.99 | |||||
Dividends paid per common share | $ | 1.05 | $ | 1.05 | $ | 0.95 | $ | 0.95 | $ | 0.95 | |||||
Volume weighted average price for the period(1) | $ | 107.57 | $ | 105.78 | $ | 98.86 | $ | 94.99 | $ | 85.76 | |||||
Common shares outstanding, at period end | 415 | 406 | 406 | 366 | 361 | ||||||||||
Market value of outstanding common shares, at period end(3) | $ | 45,468 | $ | 44,679 | $ | 39,859 | $ | 35,666 | $ | 32,880 | |||||
(1) | Based on the sales price, adjusted for common stock dividends, as reported by Bloomberg. |
(2) | Based on the period end closing price, adjusted for common stock dividends, as reported by Bloomberg. |
(3) | Period end market value of outstanding common shares is calculated as the product of (a) shares of common stock outstanding at period end and (b) closing share price at period end, adjusted for common stock dividends, as reported by Bloomberg. |
5
Crown Castle International Corp.
First Quarter 2018
COMPANY OVERVIEW | FINANCIALS & METRICS | ASSET PORTFOLIO OVERVIEW | CAPITALIZATION OVERVIEW | APPENDIX |
SUMMARY PORTFOLIO HIGHLIGHTS | |||
(as of March 31, 2018) | |||
Towers | |||
Number of towers(1) | 40,053 | ||
Average number of tenants per tower | 2.2 | ||
Remaining contracted customer receivables ($ in billions)(2) | $ | 18 | |
Weighted average remaining customer contract term (years)(3) | 5 | ||
Percent of towers in the Top 50 / 100 Basic Trading Areas | 56% / 71% | ||
Percent of ground leased / owned (by Towers segment site rental gross margin) | 62% / 38% | ||
Weighted average maturity of ground leases (years)(4) | 34 | ||
Fiber | |||
Number of route miles of fiber (in thousands) | 60 | ||
Remaining contracted customer receivables ($ in billions)(2) | $ | 5 | |
Weighted average remaining customer contract term (years)(3) | 4 | ||
SUMMARY FINANCIAL HIGHLIGHTS | ||||||||
Three Months Ended March 31, | ||||||||
(dollars in millions, except per share amounts) | 2018 | 2017 | ||||||
Operating Data: | ||||||||
Net revenues | ||||||||
Site rental | $ | 1,153 | $ | 857 | ||||
Network services and other | 146 | 159 | ||||||
Net revenues | $ | 1,299 | $ | 1,016 | ||||
Costs of operations (exclusive of depreciation, amortization and accretion) | ||||||||
Site rental | $ | 347 | $ | 265 | ||||
Network services and other | 86 | 99 | ||||||
Total cost of operations | $ | 433 | $ | 364 | ||||
Net income (loss) attributable to CCIC common stockholders | $ | 86 | $ | 119 | ||||
Net income (loss) attributable to CCIC common stockholders per share—diluted(5) | $ | 0.21 | $ | 0.33 | ||||
Non-GAAP Data(6): | ||||||||
Adjusted EBITDA | $ | 763 | $ | 581 | ||||
FFO(7) | 447 | 401 | ||||||
AFFO(7) | 558 | 450 | ||||||
AFFO per share(5)(7) | $ | 1.36 | $ | 1.24 | ||||
(1) | Excludes small cells, fiber and third-party land interests. |
(2) | Excludes renewal terms at customers' option. |
(3) | Excludes renewal terms at customers' option, weighted by site rental revenues. |
(4) | Includes renewal terms at the Company's option, weighted by Towers segment site rental gross margin. |
(5) | Based on diluted weighted-average common shares outstanding of 410 million and 362 million for the three months ended March 31, 2018 and 2017, respectively. |
(6) | See reconciliations of Non-GAAP financial measures provided herein. See also "Definitions of Non-GAAP Measures, Segment Measures and Other Calculations" in the Appendix for a discussion of our definitions of Adjusted EBITDA, FFO and AFFO. |
(7) | Attributable to CCIC common stockholders. |
6
Crown Castle International Corp.
First Quarter 2018
COMPANY OVERVIEW | FINANCIALS & METRICS | ASSET PORTFOLIO OVERVIEW | CAPITALIZATION OVERVIEW | APPENDIX |
SUMMARY FINANCIAL HIGHLIGHTS (CONTINUED) | ||||||||
Three Months Ended March 31, | ||||||||
(dollars in millions) | 2018 | 2017 | ||||||
Summary Cash Flow Data(1): | ||||||||
Net cash provided by (used for) operating activities | $ | 452 | $ | 442 | ||||
Net cash provided by (used for) investing activities(2) | (384 | ) | (1,763 | ) | ||||
Net cash provided by (used for) financing activities | (163 | ) | 949 | |||||
(dollars in millions) | March 31, 2018 | December 31, 2017 | ||||||
Balance Sheet Data (at period end): | ||||||||
Cash and cash equivalents | $ | 220 | $ | 314 | ||||
Property and equipment, net | 13,051 | 12,933 | ||||||
Total assets | 32,250 | 32,229 | ||||||
Total debt and other long-term obligations | 15,746 | 16,159 | ||||||
Total CCIC stockholders' equity | 12,832 | 12,339 | ||||||
Three Months Ended March 31, 2018 | ||||
Other Data: | ||||
Net debt to last quarter annualized Adjusted EBITDA | 5.1 | x | ||
Dividend per common share | $ | 1.05 | ||
OUTLOOK FOR SECOND QUARTER 2018 AND FULL YEAR 2018 | ||||||
(dollars in millions, except per share amounts) | Second Quarter 2018 | Full Year 2018 | ||||
Site rental revenues | $1,153 | to | $1,163 | $4,639 | to | $4,684 |
Site rental cost of operations(3) | $348 | to | $358 | $1,375 | to | $1,420 |
Net income (loss) | $139 | to | $164 | $589 | to | $669 |
Net income (loss) per share—diluted(4)(5) | $0.33 | to | $0.39 | $1.42 | to | $1.61 |
Adjusted EBITDA(6) | $757 | to | $767 | $3,097 | to | $3,142 |
Interest expense and amortization of deferred financing costs(7) | $154 | to | $164 | $616 | to | $661 |
FFO(5)(6) | $496 | to | $506 | $2,002 | to | $2,047 |
AFFO(6)(8) | $539 | to | $549 | $2,255 | to | $2,300 |
AFFO per share(4)(6)(8) | $1.29 | to | $1.32 | $5.44 | to | $5.55 |
(1) | Includes impacts of restricted cash. See the condensed consolidated statement of cash flows for further information. |
(2) | Includes net cash used for acquisitions of approximately $14 million and $1.5 billion for the three months ended March 31, 2018 and 2017, respectively. |
(3) | Exclusive of depreciation, amortization and accretion. |
(4) | The assumption for second quarter 2018 and full year 2018 diluted weighted-average common shares outstanding is 416 million and 415 million, respectively, based on diluted common shares outstanding as of March 31, 2018. For all periods presented, the diluted weighted-average common shares outstanding does not include any assumed conversion of preferred stock in the share count. |
(5) | Calculated using net income (loss) attributable to CCIC common stockholders. |
(6) | See reconciliation of this non-GAAP financial measure to net income (loss) and definition included herein. |
(7) | See the reconciliation of "components of interest expense and amortization of deferred financing costs" in the Appendix. |
(8) | Attributable to CCIC common stockholders. |
7
Crown Castle International Corp.
First Quarter 2018
COMPANY OVERVIEW | FINANCIALS & METRICS | ASSET PORTFOLIO OVERVIEW | CAPITALIZATION OVERVIEW | APPENDIX |
OUTLOOK FOR FULL YEAR 2018 COMPONENTS OF CHANGES IN SITE RENTAL REVENUES | |||
(dollars in millions) | Full Year 2017 | Full Year 2018 Outlook | |
Components of changes in site rental revenues(1): | |||
Prior year site rental revenues exclusive of straight-lined revenues associated with fixed escalators(2)(3) | $3,186 | $3,669 | |
New leasing activity(2)(3) | 166 | 190-220 | |
Escalators | 84 | 80-90 | |
Non-renewals | (90) | (95)-(75) | |
Organic Contribution to Site Rental Revenues(4) | 160 | 185-225 | |
Straight-lined revenues associated with fixed escalators | — | 20-40 | |
Acquisitions(5) | 323 | 745-765 | |
Other | — | — | |
Total GAAP site rental revenues | $3,669 | $4,639-$4,684 | |
Year-over-year changes in revenue: | |||
Reported GAAP site rental revenues(6) | 27.1% | ||
Organic Contribution to Site Rental Revenues(4)(6)(7) | 5.6% | ||
(1) | See additional information regarding Crown Castle's site rental revenues including projected revenue from customer licenses, tenant non-renewals, straight-lined revenues and prepaid rent herein. |
(2) | Includes revenues from amortization of prepaid rent in accordance with GAAP. |
(3) | Includes revenues from the construction of new small cell nodes, exclusive of straight-lined revenues related to fixed escalators. |
(4) | See definitions provided herein. |
(5) | Represents the contribution from recent acquisitions. The financial impact of recent acquisitions is excluded from Organic Contribution to Site Rental Revenues until the one-year anniversary of the acquisition, with the exception of the impact of Lightower, which has been reflected as a contribution from acquisitions for the full year 2018. |
(6) | Calculated based on midpoint of Full Year 2018 Outlook. |
(7) | Calculated as the percentage change from prior year site rental revenues, exclusive of straight-lined revenues associated with fixed escalations, compared to Organic Contribution to Site Rental Revenues for the current period. |
8
Crown Castle International Corp.
First Quarter 2018
COMPANY OVERVIEW | FINANCIALS & METRICS | ASSET PORTFOLIO OVERVIEW | CAPITALIZATION OVERVIEW | APPENDIX |
CONDENSED CONSOLIDATED BALANCE SHEET (Unaudited) | |||||||
(amounts in millions, except par values) | March 31, 2018 | December 31, 2017 | |||||
ASSETS | |||||||
Current assets: | |||||||
Cash and cash equivalents | $ | 220 | $ | 314 | |||
Restricted cash | 120 | 121 | |||||
Receivables, net | 402 | 398 | |||||
Prepaid expenses | 175 | 162 | |||||
Other current assets | 157 | 139 | |||||
Total current assets | 1,074 | 1,134 | |||||
Deferred site rental receivables | 1,304 | 1,300 | |||||
Property and equipment, net | 13,051 | 12,933 | |||||
Goodwill | 10,075 | 10,021 | |||||
Other intangible assets, net | 5,854 | 5,962 | |||||
Long-term prepaid rent and other assets, net | 892 | 879 | |||||
Total assets | $ | 32,250 | $ | 32,229 | |||
LIABILITIES AND EQUITY | |||||||
Current liabilities: | |||||||
Accounts payable | $ | 248 | $ | 249 | |||
Accrued interest | 104 | 132 | |||||
Deferred revenues | 465 | 457 | |||||
Other accrued liabilities | 240 | 339 | |||||
Current maturities of debt and other obligations | 130 | 115 | |||||
Total current liabilities | 1,187 | 1,292 | |||||
Debt and other long-term obligations | 15,616 | 16,044 | |||||
Other long-term liabilities | 2,615 | 2,554 | |||||
Total liabilities | 19,418 | 19,890 | |||||
Commitments and contingencies | |||||||
CCIC stockholders' equity: | |||||||
Common stock, $0.01 par value; 600 shares authorized; shares issued and outstanding: March 31, 2018—415 and December 31, 2017—406 | 4 | 4 | |||||
6.875% Mandatory Convertible Preferred Stock, Series A, $0.01 par value; 20 shares authorized; shares issued and outstanding: March 31, 2018—2 and December 31, 2017—2; aggregate liquidation value: March 31, 2018—$1,650 and December 31, 2017—$1,650 | — | — | |||||
Additional paid-in capital | 17,690 | 16,844 | |||||
Accumulated other comprehensive income (loss) | (4 | ) | (4 | ) | |||
Dividends/distributions in excess of earnings | (4,858 | ) | (4,505 | ) | |||
Total equity | 12,832 | 12,339 | |||||
Total liabilities and equity | $ | 32,250 | $ | 32,229 | |||
9
Crown Castle International Corp.
First Quarter 2018
COMPANY OVERVIEW | FINANCIALS & METRICS | ASSET PORTFOLIO OVERVIEW | CAPITALIZATION OVERVIEW | APPENDIX |
CONDENSED CONSOLIDATED STATEMENT OF OPERATIONS (Unaudited) | |||||||
Three Months Ended March 31, | |||||||
(amounts in millions, except per share amounts) | 2018 | 2017 | |||||
Net revenues: | |||||||
Site rental | $ | 1,153 | $ | 857 | |||
Network services and other | 146 | 159 | |||||
Net revenues | 1,299 | 1,016 | |||||
Operating expenses: | |||||||
Costs of operations (exclusive of depreciation, amortization and accretion): | |||||||
Site rental | 347 | 265 | |||||
Network services and other | 86 | 99 | |||||
General and administrative | 134 | 101 | |||||
Asset write-down charges | 3 | 1 | |||||
Acquisition and integration costs | 6 | 6 | |||||
Depreciation, amortization and accretion | 374 | 289 | |||||
Total operating expenses | 950 | 761 | |||||
Operating income (loss) | 349 | 255 | |||||
Interest expense and amortization of deferred financing costs | (160 | ) | (134 | ) | |||
Gains (losses) on retirement of long-term obligations | (71 | ) | (4 | ) | |||
Interest income | 1 | — | |||||
Other income (expense) | (1 | ) | 6 | ||||
Income (loss) from continuing operations before income taxes | 118 | 123 | |||||
Benefit (provision) for income taxes | (4 | ) | (4 | ) | |||
Net income (loss) | 114 | 119 | |||||
Dividends on preferred stock | (28 | ) | — | ||||
Net income (loss) attributable to CCIC common stockholders | $ | 86 | $ | 119 | |||
Net income (loss) attributable to CCIC common stockholders, per common share: | |||||||
Net income (loss) attributable to CCIC common stockholders, basic | $ | 0.21 | $ | 0.33 | |||
Net income (loss) attributable to CCIC common stockholders, diluted | $ | 0.21 | $ | 0.33 | |||
Weighted-average common shares outstanding: | |||||||
Basic | 409 | 361 | |||||
Diluted | 410 | 362 | |||||
10
Crown Castle International Corp.
First Quarter 2018
COMPANY OVERVIEW | FINANCIALS & METRICS | ASSET PORTFOLIO OVERVIEW | CAPITALIZATION OVERVIEW | APPENDIX |
SEGMENT OPERATING RESULTS | |||||||||||||||||||||||||||||||
Three Months Ended March 31, 2018 | Three Months Ended March 31, 2017 | ||||||||||||||||||||||||||||||
(dollars in millions) | Towers | Fiber | Other | Consolidated Total | Towers | Fiber | Other | Consolidated Total | |||||||||||||||||||||||
Segment site rental revenues | $ | 764 | $ | 389 | $ | 1,153 | $ | 717 | $ | 140 | $ | 857 | |||||||||||||||||||
Segment network services and other revenue | 142 | 4 | 146 | 150 | 9 | 159 | |||||||||||||||||||||||||
Segment revenues | 906 | 393 | 1,299 | 867 | 149 | 1,016 | |||||||||||||||||||||||||
Segment site rental cost of operations | 211 | 126 | 337 | 209 | 47 | 256 | |||||||||||||||||||||||||
Segment network services and other cost of operations | 82 | 2 | 84 | 89 | 8 | 97 | |||||||||||||||||||||||||
Segment cost of operations(1) | 293 | 128 | 421 | 298 | 55 | 353 | |||||||||||||||||||||||||
Segment site rental gross margin(2) | 553 | 263 | 816 | 508 | 93 | 601 | |||||||||||||||||||||||||
Segment network services and other gross margin(2) | 60 | 2 | 62 | 61 | 1 | 62 | |||||||||||||||||||||||||
Segment general and administrative expenses(1) | 26 | 43 | 69 | 24 | 18 | 42 | |||||||||||||||||||||||||
Segment operating profit(2) | 587 | 222 | 809 | 545 | 76 | 621 | |||||||||||||||||||||||||
Unallocated general and administrative expenses(1) | $ | 46 | 46 | $ | 39 | 39 | |||||||||||||||||||||||||
Stock-based compensation expense | 26 | 26 | 25 | 25 | |||||||||||||||||||||||||||
Depreciation, amortization and accretion | 374 | 374 | 289 | 289 | |||||||||||||||||||||||||||
Interest expense and amortization of deferred financing costs | 160 | 160 | 134 | 134 | |||||||||||||||||||||||||||
Other income (expenses) to reconcile to income (loss) from continuing operations before income taxes(3) | 85 | 85 | 11 | 11 | |||||||||||||||||||||||||||
Income (loss) from continuing operations before income taxes | $ | 118 | $ | 123 | |||||||||||||||||||||||||||
(1) | Segment cost of operations excludes (1) stock-based compensation expense of $7 million and $5 million for the three months ended March 31, 2018 and 2017, respectively and (2) prepaid lease purchase price adjustments of $5 million for both of the three months ended March 31, 2018 and 2017. General and administrative expenses exclude stock-based compensation expense of $19 million and $20 million for the three months ended March 31, 2018 and 2017, respectively. |
(2) | See "Definitions of Non-GAAP Financial Measures, Segment Measures and Other Calculations" in the Appendix for a discussion of our definitions of segment site rental gross margin, segment network services and other gross margin and segment operating profit. |
(3) | See condensed consolidated statement of operations for further information. |
11
Crown Castle International Corp.
First Quarter 2018
COMPANY OVERVIEW | FINANCIALS & METRICS | ASSET PORTFOLIO OVERVIEW | CAPITALIZATION OVERVIEW | APPENDIX |
FFO AND AFFO RECONCILIATIONS | |||||||
Three Months Ended March 31, | |||||||
(amounts in millions, except per share amounts) | 2018 | 2017 | |||||
Net income (loss) | $ | 114 | $ | 119 | |||
Real estate related depreciation, amortization and accretion | 359 | 281 | |||||
Asset write-down charges | 3 | 1 | |||||
Dividends on preferred stock | (28 | ) | — | ||||
FFO(1)(2)(3)(4) | $ | 447 | $ | 401 | |||
Weighted average common shares outstanding—diluted(5) | 410 | 362 | |||||
FFO per share(1)(3)(4) | $ | 1.09 | $ | 1.11 | |||
FFO (from above) | $ | 447 | $ | 401 | |||
Adjustments to increase (decrease) FFO: | |||||||
Straight-lined revenue | (16 | ) | (1 | ) | |||
Straight-lined expense | 23 | 23 | |||||
Stock-based compensation expense | 26 | 25 | |||||
Non-cash portion of tax provision | 4 | 4 | |||||
Non-real estate related depreciation, amortization and accretion | 15 | 8 | |||||
Amortization of non-cash interest expense | 2 | 2 | |||||
Other (income) expense | 1 | (6 | ) | ||||
(Gains) losses on retirement of long-term obligations | 71 | 4 | |||||
Acquisition and integration costs | 6 | 6 | |||||
Capital improvement capital expenditures | (13 | ) | (7 | ) | |||
Corporate capital expenditures | (9 | ) | (9 | ) | |||
AFFO(1)(2)(3)(4) | $ | 558 | $ | 450 | |||
Weighted average common shares outstanding—diluted(5) | 410 | 362 | |||||
AFFO per share(1)(3)(4) | $ | 1.36 | $ | 1.24 | |||
(1) | See "Definitions of Non-GAAP Measures, Segment Measures and Other Calculations" in the Appendix for a discussion of our definitions of FFO and AFFO. |
(2) | FFO and AFFO are reduced by cash paid for preferred stock dividends during the period in which they are paid. |
(3) | The above reconciliation excludes line items included in our definition which are not applicable for the periods shown. |
(4) | Attributable to CCIC common stockholders. |
(5) | Based on the diluted weighted-average common shares outstanding for the three months ended March 31, 2018 and 2017. For all periods presented, the diluted weighted-average common shares outstanding does not include any assumed conversion of preferred stock in the share count. |
12
Crown Castle International Corp.
First Quarter 2018
COMPANY OVERVIEW | FINANCIALS & METRICS | ASSET PORTFOLIO OVERVIEW | CAPITALIZATION OVERVIEW | APPENDIX |
CONDENSED CONSOLIDATED STATEMENT OF CASH FLOWS (Unaudited)(1) | ||||||||||||
Three Months Ended March 31, | ||||||||||||
(dollars in millions) | 2018 | 2017 | ||||||||||
Cash flows from operating activities: | ||||||||||||
Net income (loss) | $ | 114 | $ | 119 | ||||||||
Adjustments to reconcile net income (loss) to net cash provided by (used for) operating activities: | ||||||||||||
Depreciation, amortization and accretion | 374 | 289 | ||||||||||
(Gains) losses on retirement of long-term obligations | 71 | 4 | ||||||||||
Amortization of deferred financing costs and other non-cash interest | 2 | 2 | ||||||||||
Stock-based compensation expense | 23 | 22 | ||||||||||
Asset write-down charges | 3 | 1 | ||||||||||
Deferred income tax (benefit) provision | 1 | — | ||||||||||
Other non-cash adjustments, net | 2 | (3 | ) | |||||||||
Changes in assets and liabilities, excluding the effects of acquisitions: | ||||||||||||
Increase (decrease) in liabilities | (90 | ) | (60 | ) | ||||||||
Decrease (increase) in assets | (48 | ) | 68 | |||||||||
Net cash provided by (used for) operating activities | 452 | 442 | ||||||||||
Cash flows from investing activities: | ||||||||||||
Payments for acquisitions of businesses, net of cash acquired | (14 | ) | (1,497 | ) | ||||||||
Capital expenditures | (370 | ) | (262 | ) | ||||||||
Other investing activities, net | — | (4 | ) | |||||||||
Net cash provided by (used for) investing activities | (384 | ) | (1,763 | ) | ||||||||
Cash flows from financing activities: | ||||||||||||
Proceeds from issuance of long-term debt | 1,743 | 998 | ||||||||||
Principal payments on debt and other long-term obligations | (32 | ) | (29 | ) | ||||||||
Purchases and redemptions of long-term debt | (1,318 | ) | — | |||||||||
Borrowings under revolving credit facility | 170 | 1,405 | ||||||||||
Payments under revolving credit facility | (1,050 | ) | (1,070 | ) | ||||||||
Payments for financing costs | (15 | ) | (7 | ) | ||||||||
Net proceeds from issuance of common stock | 843 | 22 | ||||||||||
Net proceeds from issuance of preferred stock | — | — | ||||||||||
Purchases of common stock | (33 | ) | (22 | ) | ||||||||
Dividends/distributions paid on common stock | (443 | ) | (348 | ) | ||||||||
Dividends paid on preferred stock | (28 | ) | — | |||||||||
Net cash provided by (used for) financing activities | (163 | ) | 949 | |||||||||
Net increase (decrease) in cash, cash equivalents, and restricted cash | (95 | ) | (372 | ) | ||||||||
Effect of exchange rate changes | — | — | ||||||||||
Cash, cash equivalents, and restricted cash at beginning of period(1) | 440 | 697 | ||||||||||
Cash, cash equivalents, and restricted cash at end of period(1) | $ | 345 | $ | 325 | ||||||||
Supplemental disclosure of cash flow information: | ||||||||||||
Interest paid | 185 | 144 | ||||||||||
Income taxes paid | — | 1 | ||||||||||
(1) Effective January 1, 2018, the Company is required to explain the change in restricted cash in addition to the change in cash and cash equivalents in its condensed consolidated statement of cash flows. The Company has applied this approach for all periods presented.
13
Crown Castle International Corp.
First Quarter 2018
COMPANY OVERVIEW | FINANCIALS & METRICS | ASSET PORTFOLIO OVERVIEW | CAPITALIZATION OVERVIEW | APPENDIX |
COMPONENTS OF CHANGES IN SITE RENTAL REVENUES | |||||||
Three Months Ended March 31, | |||||||
(dollars in millions) | 2018 | 2017 | |||||
Components of changes in site rental revenues(1): | |||||||
Prior year site rental revenues exclusive of straight-lined revenues associated with fixed escalators(2)(3) | $ | 856 | $ | 782 | |||
New leasing activity(2)(3) | 49 | 41 | |||||
Escalators | 20 | 21 | |||||
Non-renewals | (22 | ) | (28 | ) | |||
Organic Contribution to Site Rental Revenues(4) | 47 | 34 | |||||
Straight-lined revenues associated with fixed escalators | 16 | 1 | |||||
Acquisitions(5) | 234 | 40 | |||||
Other | — | — | |||||
Total GAAP site rental revenues | $ | 1,153 | $ | 857 | |||
Year-over-year changes in revenue: | |||||||
Reported GAAP site rental revenues | 34.5 | % | |||||
Organic Contribution to Site Rental Revenues(4)(6) | 5.5 | % | |||||
(1) | See additional information regarding Crown Castle's site rental revenues including projected revenue from customer licenses, tenant non-renewals, straight-lined revenues and prepaid rent herein. |
(2) | Includes revenues from amortization of prepaid rent in accordance with GAAP. |
(3) | Includes revenues from the construction of new small cell nodes, exclusive of straight-lined revenues related to fixed escalators. |
(4) | See definitions provided herein. |
(5) | Represents the initial contribution of recent acquisitions. The financial impact of recent acquisitions is excluded from Organic Contribution to Site Rental Revenues until the one-year anniversary of the acquisition. |
(6) | Calculated as the percentage change from prior year site rental revenues, exclusive of straight-lined revenues associated with fixed escalations, compared to Organic Contribution to Site Rental Revenues for the current period. |
14
Crown Castle International Corp.
First Quarter 2018
COMPANY OVERVIEW | FINANCIALS & METRICS | ASSET PORTFOLIO OVERVIEW | CAPITALIZATION OVERVIEW | APPENDIX |
SUMMARY OF SITE RENTAL STRAIGHT-LINED REVENUES AND EXPENSES ASSOCIATED WITH FIXED | |||||||||||||||||||||||
ESCALATORS(1) | |||||||||||||||||||||||
Three Months Ended March 31, | |||||||||||||||||||||||
2018 | 2017 | ||||||||||||||||||||||
(dollars in millions) | Towers | Fiber | Total | Towers | Fiber | Total | |||||||||||||||||
Site rental straight-lined revenue | $ | 16 | $ | — | $ | 16 | $ | (1 | ) | $ | 2 | $ | 1 | ||||||||||
Site rental straight-lined expenses | 23 | — | 23 | 23 | — | 23 | |||||||||||||||||
SUMMARY OF PREPAID RENT ACTIVITY(2) | |||||||||||||||||||||||
Three Months Ended March 31, | |||||||||||||||||||||||
2018 | 2017 | ||||||||||||||||||||||
(dollars in millions) | Towers | Fiber | Total | Towers | Fiber | Total | |||||||||||||||||
Prepaid rent received | $ | 28 | $ | 52 | $ | 80 | $ | 30 | $ | 37 | $ | 67 | |||||||||||
Amortization of prepaid rent | 32 | 47 | 79 | 27 | 26 | 53 | |||||||||||||||||
(1) | In accordance with GAAP accounting, if payment terms call for fixed escalations, or rent free periods, the revenue is recognized on a straight-line basis over the fixed, non-cancelable term of the contract. Since the Company recognizes revenue on a straight-line basis, a portion of the site rental revenue in a given period represents cash collected or contractually collectible in other periods. |
(2) | Reflects up front payments received from long-term tenant contracts and other deferred credits (commonly referred to as prepaid rent), and the amortization thereof for GAAP revenue recognition purposes. |
15
Crown Castle International Corp.
First Quarter 2018
COMPANY OVERVIEW | FINANCIALS & METRICS | ASSET PORTFOLIO OVERVIEW | CAPITALIZATION OVERVIEW | APPENDIX |
SUMMARY OF CAPITAL EXPENDITURES | |||||||||||||||||||||||||||||||
Three Months Ended March 31, | |||||||||||||||||||||||||||||||
2018 | 2017 | ||||||||||||||||||||||||||||||
(dollars in millions) | Towers | Fiber | Other | Total | Towers | Fiber | Other | Total | |||||||||||||||||||||||
Discretionary: | |||||||||||||||||||||||||||||||
Purchases of land interests | $ | 14 | $ | — | $ | — | $ | 14 | $ | 21 | $ | — | $ | — | $ | 21 | |||||||||||||||
Communications infrastructure construction and improvements | 75 | 253 | — | 328 | 74 | 151 | — | 225 | |||||||||||||||||||||||
Sustaining: | |||||||||||||||||||||||||||||||
Capital improvement and corporate | 7 | 9 | 6 | 22 | 6 | 3 | 7 | 16 | |||||||||||||||||||||||
Integration | — | — | 6 | 6 | — | — | — | — | |||||||||||||||||||||||
Total | $ | 96 | $ | 262 | $ | 12 | $ | 370 | $ | 101 | $ | 154 | $ | 7 | $ | 262 | |||||||||||||||
PROJECTED REVENUE FROM CUSTOMER CONTRACTS(1) | |||||||||||||||
Remaining nine months | Years Ending December 31, | ||||||||||||||
(as of March 31, 2018; dollars in millions) | 2018 | 2019 | 2020 | 2021 | 2022 | ||||||||||
Components of site rental revenue: | |||||||||||||||
Site rental revenues exclusive of straight-line associated with fixed escalators | $ | 3,433 | $ | 4,671 | $ | 4,774 | $ | 4,883 | $ | 4,980 | |||||
Straight-lined site rental revenues associated with fixed escalators | 4 | (66 | ) | (152 | ) | (222 | ) | (265 | ) | ||||||
GAAP site rental revenue | $ | 3,437 | $ | 4,605 | $ | 4,622 | $ | 4,661 | $ | 4,715 | |||||
PROJECTED GROUND LEASE EXPENSE FROM EXISTING GROUND LEASES(2) | |||||||||||||||
Remaining nine months | Years Ending December 31, | ||||||||||||||
(as of March 31, 2018; dollars in millions) | 2018 | 2019 | 2020 | 2021 | 2022 | ||||||||||
Components of ground lease expense: | |||||||||||||||
Ground lease expense exclusive of straight-line associated with fixed escalators | $ | 598 | $ | 810 | $ | 828 | $ | 847 | $ | 867 | |||||
Straight-lined site rental ground lease expense associated with fixed escalators | 63 | 74 | 62 | 50 | 38 | ||||||||||
GAAP ground lease expense | $ | 661 | $ | 884 | $ | 890 | $ | 897 | $ | 905 | |||||
(1) | Based on customer licenses as of March 31, 2018. All customer licenses are assumed to renew for a new term no later than the respective current term end date. CPI-linked customer contracts are assumed to escalate at 3% per annum. |
(2) | Based on existing ground leases as of March 31, 2018. CPI-linked leases are assumed to escalate at 3% per annum. |
16
Crown Castle International Corp.
First Quarter 2018
COMPANY OVERVIEW | FINANCIALS & METRICS | ASSET PORTFOLIO OVERVIEW | CAPITALIZATION OVERVIEW | APPENDIX |
ANNUALIZED RENTAL CASH PAYMENTS AT TIME OF RENEWAL(1) | |||||||||||||||
Remaining nine months | Years Ending December 31, | ||||||||||||||
(as of March 31, 2018; dollars in millions) | 2018 | 2019 | 2020 | 2021 | 2022 | ||||||||||
AT&T | $ | 36 | $ | 41 | $ | 52 | $ | 82 | $ | 65 | |||||
Sprint | 7 | 29 | 17 | 29 | 23 | ||||||||||
T-Mobile | 20 | 59 | 25 | 43 | 616 | ||||||||||
Verizon | 22 | 28 | 36 | 35 | 40 | ||||||||||
All Others Combined | 146 | 160 | 146 | 83 | 80 | ||||||||||
Total | $ | 231 | $ | 317 | $ | 277 | $ | 272 | $ | 824 | |||||
CUSTOMER OVERVIEW | |||
(as of March 31, 2018) | Percentage of Q1 2018 LQA Site Rental Revenues | Weighted Average Current Term Remaining(2) | Long-Term Credit Rating (S&P / Moody’s) |
AT&T | 22% | 5 | BBB+ / Baa1 |
T-Mobile | 19% | 5 | BB+ |
Verizon | 19% | 6 | BBB+ / Baa1 |
Sprint | 14% | 7 | B / B2 |
All Others Combined | 26% | 3 | N/A |
Total / Weighted Average | 100% | 5 | |
(1) | Reflects lease renewals by year by customer; dollar amounts represent annualized cash site rental revenues from assumed renewals or extension as reflected in the table "Projected Revenue from Customer Contracts." |
(2) | Weighted by site rental revenue contributions; excludes renewals at the customers' option. |
17
Crown Castle International Corp.
First Quarter 2018
COMPANY OVERVIEW | FINANCIALS & METRICS | ASSET PORTFOLIO OVERVIEW | CAPITALIZATION OVERVIEW | APPENDIX |
SUMMARY OF TOWER PORTFOLIO BY VINTAGE | |
(as of March 31, 2018; dollars in thousands) | |
YIELD(1) | NUMBER OF TENANTS PER TOWER |
LQA SITE RENTAL REVENUE PER TOWER | LQA TOWERS SEGMENT SITE RENTAL GROSS MARGIN PER TOWER |
INVESTED CAPITAL PER TOWER(2) | NUMBER OF TOWERS |
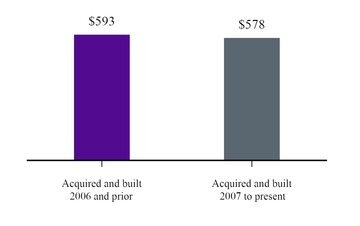
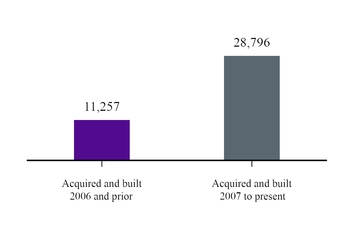
(1) | Yield is calculated as LQA Towers segment site rental gross margin divided by invested capital. |
(2) | Reflects gross total assets, including incremental capital invested by the Company since time of acquisition or construction completion. Inclusive of invested capital related to land at the tower site. |
18
Crown Castle International Corp.
First Quarter 2018
COMPANY OVERVIEW | FINANCIALS & METRICS | ASSET PORTFOLIO OVERVIEW | CAPITALIZATION OVERVIEW | APPENDIX |
PORTFOLIO OVERVIEW(1) | ||
(as of March 31, 2018; dollars in thousands) | ||
NUMBER OF TOWERS | TENANTS PER TOWER | LQA SITE RENTAL REVENUE PER TOWER |
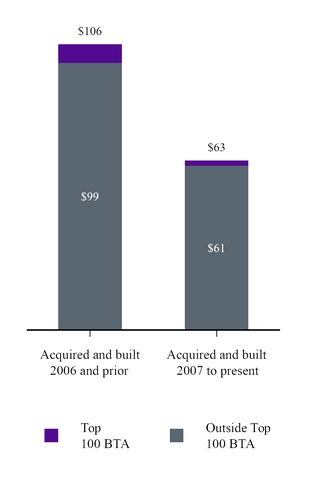
(1) | Includes towers and rooftops, excludes small cells, fiber and third-party land interests. |
19
Crown Castle International Corp.
First Quarter 2018
COMPANY OVERVIEW | FINANCIALS & METRICS | ASSET PORTFOLIO OVERVIEW | CAPITALIZATION OVERVIEW | APPENDIX |
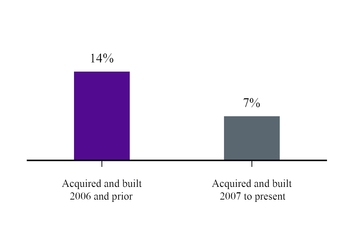
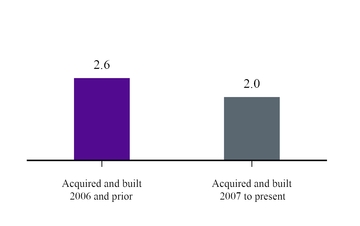
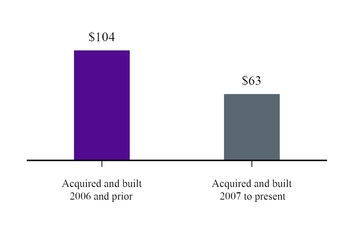
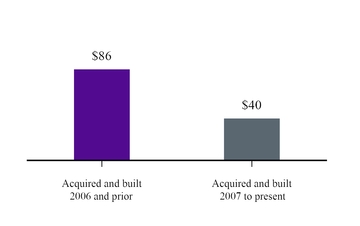
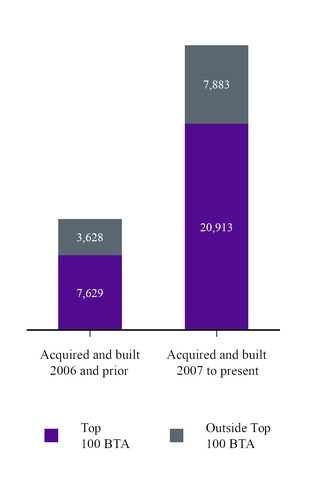
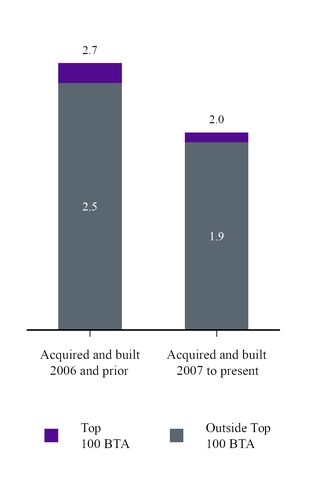
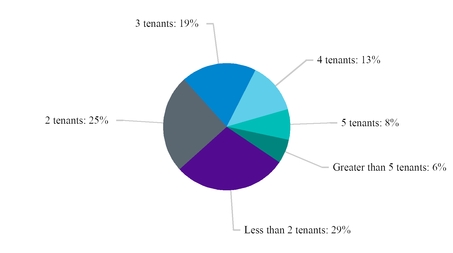
DISTRIBUTION OF TOWER TENANCY (as of March 31, 2018) | |||||
PERCENTAGE OF TOWERS BY TENANTS PER TOWER(1) | |||||
SITES ACQUIRED AND BUILT 2006 AND PRIOR | SITES ACQUIRED AND BUILT 2007 TO PRESENT | ||||
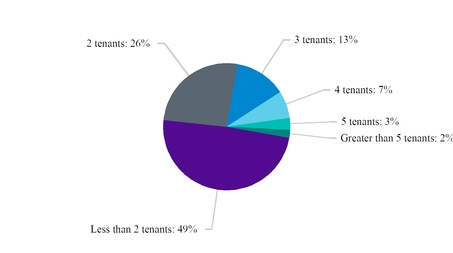
Average: 2.6 | Average: 2.0 |
GEOGRAPHIC TOWER DISTRIBUTION (as of March 31, 2018)(1) | |
PERCENTAGE OF TOWERS BY GEOGRAPHIC LOCATION | PERCENTAGE OF LQA SITE RENTAL REVENUE BY GEOGRAPHIC LOCATION |
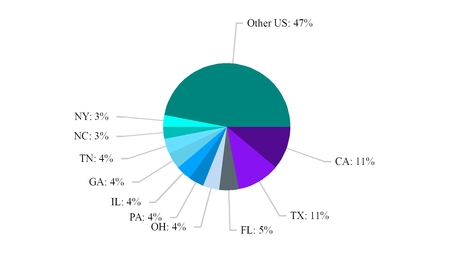
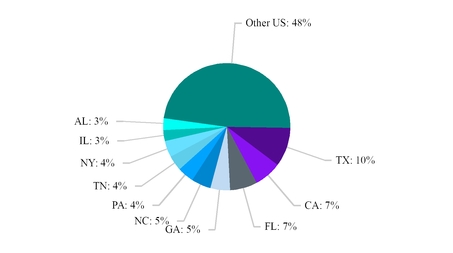
(1) | Includes towers and rooftops, excludes small cells, fiber and third-party land interests. |
20
Crown Castle International Corp.
First Quarter 2018
COMPANY OVERVIEW | FINANCIALS & METRICS | ASSET PORTFOLIO OVERVIEW | CAPITALIZATION OVERVIEW | APPENDIX |
GROUND INTEREST OVERVIEW | ||||||||||||||||
(as of March 31, 2018; dollars in millions) | LQA Site Rental Revenue | Percentage of LQA Site Rental Revenue | LQA Towers Segment Site Rental Gross Margin | Percentage of LQA Towers Segment Site Rental Gross Margin | Number of Towers(1) | Percentage of Towers | Weighted Average Term Remaining (by years)(2) | |||||||||
Less than 10 years | $ | 363 | 12 | % | $ | 207 | 10 | % | 5,654 | 14 | % | |||||
10 to 20 years | 464 | 16 | % | 254 | 12 | % | 7,619 | 19 | % | |||||||
Greater 20 years | 1,266 | 42 | % | 857 | 40 | % | 17,007 | 43 | % | |||||||
Total leased | $ | 2,093 | 70 | % | $ | 1,318 | 62 | % | 30,280 | 76 | % | 34 | ||||
Owned | 880 | 30 | % | 813 | 38 | % | 9,773 | 24 | % | |||||||
Total / Average | $ | 2,973 | 100 | % | $ | 2,131 | 100 | % | 40,053 | 100 | % | |||||
(1) | Includes towers and rooftops, excludes small cells, fiber and third-party land interests. |
(2) | Includes renewal terms at the Company’s option; weighted by Towers segment site rental gross margin. |
GROUND INTEREST ACTIVITY | |||
(dollars in millions) | Three Months Ended March 31, 2018 | ||
Ground Extensions Under Crown Castle Towers: | |||
Number of ground leases extended | 304 | ||
Average number of years extended | 33 | ||
Percentage increase in consolidated cash ground lease expense due to extension activities(1) | 0.1 | % | |
Ground Purchases Under Crown Castle Towers: | |||
Number of ground leases purchased | 66 | ||
Land lease purchases (including capital expenditures, acquisitions and capital leases) | $ | 21 | |
Percentage of Towers segment site rental gross margin from towers residing on land purchased | <1% | ||
(1) | Includes the impact from the amortization of lump sum payments. |
21
Crown Castle International Corp.
First Quarter 2018
COMPANY OVERVIEW | FINANCIALS & METRICS | ASSET PORTFOLIO OVERVIEW | CAPITALIZATION OVERVIEW | APPENDIX |
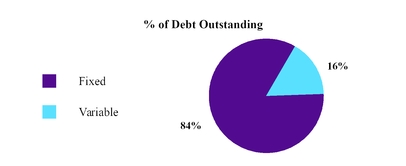
CAPITALIZATION OVERVIEW | ||||||||
(dollars in millions) | Face Value as of 3/31/2018 | Fixed vs. Variable | Secured vs. Unsecured | Interest Rate(2) | Net Debt to LQA EBITDA(3) | Maturity | ||
Cash and cash equivalents(1) | $ | 220 | ||||||
Senior Secured Tower Revenue Notes, Series 2010-6(4) | 1,000 | Fixed | Secured | 4.9% | 2040(4) | |||
Senior Secured Tower Revenue Notes, Series 2015-1(4) | 300 | Fixed | Secured | 3.2% | 2042(4) | |||
Senior Secured Tower Revenue Notes, Series 2015-2(4) | 700 | Fixed | Secured | 3.7% | 2045(4) | |||
3.849% Secured Notes | 1,000 | Fixed | Secured | 3.9% | 2023 | |||
Senior Secured Notes, Series 2009-1, Class A-1 | 28 | Fixed | Secured | 6.3% | 2019 | |||
Senior Secured Notes, Series 2009-1, Class A-2 | 70 | Fixed | Secured | 9.0% | 2029 | |||
Capital leases & other obligations | 228 | Various | Secured | Various | Various | |||
Total secured debt | $ | 3,326 | 4.0% | 1.1x | ||||
2016 Revolver(5) | 100 | Variable | Unsecured | 3.3% | 2022 | |||
2016 Term Term Loan A | 2,386 | Variable | Unsecured | 3.3% | 2022 | |||
5.250% Senior Notes | 1,650 | Fixed | Unsecured | 5.3% | 2023 | |||
4.875% Senior Notes | 850 | Fixed | Unsecured | 4.9% | 2022 | |||
3.400% Senior Notes | 850 | Fixed | Unsecured | 3.4% | 2021 | |||
4.450% Senior Notes | 900 | Fixed | Unsecured | 4.5% | 2026 | |||
3.700% Senior Notes | 750 | Fixed | Unsecured | 3.7% | 2026 | |||
2.250% Senior Notes | 700 | Fixed | Unsecured | 2.3% | 2021 | |||
4.000% Senior Notes | 500 | Fixed | Unsecured | 4.0% | 2027 | |||
4.750% Senior Notes | 350 | Fixed | Unsecured | 4.8% | 2047 | |||
3.200% Senior Notes | 750 | Fixed | Unsecured | 3.2% | 2024 | |||
3.650% Senior Notes | 1,000 | Fixed | Unsecured | 3.7% | 2027 | |||
3.150% Senior Notes | 750 | Fixed | Unsecured | 3.2% | 2023 | |||
3.800% Senior Notes | 1,000 | Fixed | Unsecured | 3.8% | 2028 | |||
Total unsecured debt | $ | 12,536 | 3.8% | 4.1x | ||||
Total net debt | $ | 15,642 | 3.9% | 5.1x | ||||
Preferred Stock, at liquidation value | 1,650 | |||||||
Market Capitalization(6) | 45,468 | |||||||
Firm Value(7) | $ | 62,760 | ||||||
(1) | Excludes restricted cash. |
(2) | Represents the weighted-average stated interest rate. |
(3) | Represents the applicable amount of debt divided by LQA consolidated Adjusted EBITDA. |
(4) | If the respective series of such debt is not paid in full on or prior to an applicable date then the Excess Cash Flow (as defined in the indenture) of the issuers of such notes will be used to repay principal of the applicable series, and additional interest (of an additional approximately 5% per annum) will accrue on the respective series. The Senior Secured Tower Revenue Notes, Series 2010-6, 2015-1 and 2015-2 have anticipated repayment dates in 2020, 2022 and 2025, respectively. Notes are prepayable at par if voluntarily repaid six months or less prior to maturity; earlier prepayment may require additional consideration. |
(5) | As of March 31, 2018, the undrawn availability under the $3.5 billion 2016 Revolver is $3.4 billion. |
(6) | Market capitalization calculated based on $109.61 closing price and 415 million shares outstanding as of March 31, 2018. |
(7) | Represents the sum of net debt, preferred stock (at liquidation value) and market capitalization. |
22
Crown Castle International Corp.
First Quarter 2018
COMPANY OVERVIEW | FINANCIALS & METRICS | ASSET PORTFOLIO OVERVIEW | CAPITALIZATION OVERVIEW | APPENDIX |
DEBT MATURITY OVERVIEW(1) |
(as of March 31, 2018; dollars in millions)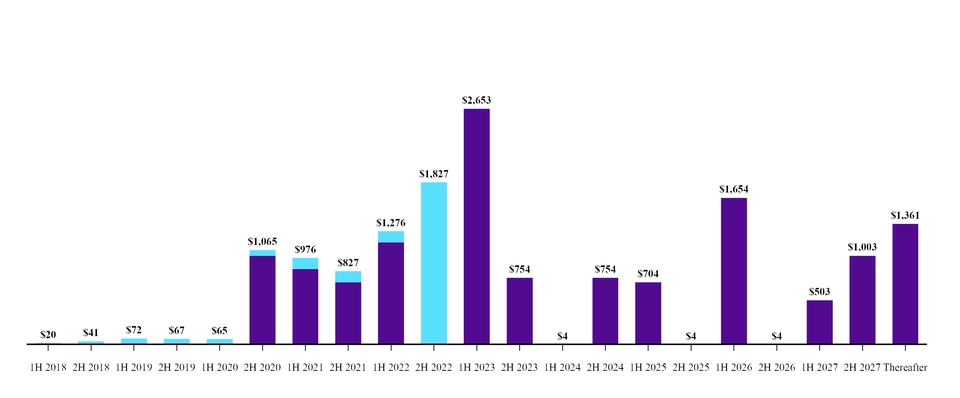
(1) | Where applicable, maturities reflect the Anticipated Repayment Date as defined in the respective debt agreement; excludes capital leases and other obligations; amounts presented at face value net of repurchases held at CCIC. |
23
Crown Castle International Corp.
First Quarter 2018
COMPANY OVERVIEW | FINANCIALS & METRICS | ASSET PORTFOLIO OVERVIEW | CAPITALIZATION OVERVIEW | APPENDIX |
LIQUIDITY OVERVIEW(1) | |||
(dollars in millions) | March 31, 2018 | ||
Cash and cash equivalents(2) | $ | 220 | |
Undrawn 2016 Revolver availability(3) | 3,381 | ||
Restricted cash(4) | 125 | ||
Debt and other long-term obligations | 15,746 | ||
Total equity | 12,832 | ||
(1) | In addition, in April 2018, we established an At-The-Market stock offering program ("ATM Program") through which we may, from time to time, issue and sell shares of our common stock having an aggregate gross sales price of up to $750 million to or through sales agents. No shares of common stock have been sold under the ATM Program. |
(2) | Exclusive of restricted cash. |
(3) | Availability at any point in time is subject to reaffirmation of the representations and warranties in, and there being no default under, our credit agreement governing our 2016 Revolver. |
(4) | Inclusive of $5 million included within long-term prepaid rent and other assets, net on our condensed consolidated balance sheet. |
24
Crown Castle International Corp.
First Quarter 2018
COMPANY OVERVIEW | FINANCIALS & METRICS | ASSET PORTFOLIO OVERVIEW | CAPITALIZATION OVERVIEW | APPENDIX |
SUMMARY OF MAINTENANCE AND FINANCIAL COVENANTS | |||||
Debt | Borrower / Issuer | Covenant(1) | Covenant Level Requirement | As of March 31, 2018 | |
Maintenance Financial Covenants(2) | |||||
2016 Credit Facility | CCIC | Total Net Leverage Ratio | ≤ 6.50x | 5.2x | |
2016 Credit Facility | CCIC | Total Senior Secured Leverage Ratio | ≤ 3.50x | 1.0x | |
2016 Credit Facility | CCIC | Consolidated Interest Coverage Ratio(3) | N/A | N/A | |
Restrictive Negative Financial Covenants | |||||
Financial covenants restricting ability to incur additional debt | |||||
2012 Secured Notes | CC Holdings GS V LLC and Crown Castle GS III Corp. | Debt to Adjusted Consolidated Cash Flow Ratio | ≤ 3.50x | 2.4x | |
Financial covenants requiring excess cash flows to be deposited in a cash trap reserve account and not released | |||||
2010 Tower Revenue Notes | Crown Castle Towers LLC and its Subsidiaries | Debt Service Coverage Ratio | > 1.75x | (4) | 9.2x |
2015 Tower Revenue Notes | Crown Castle Towers LLC and its Subsidiaries | Debt Service Coverage Ratio | > 1.75x | (4) | 9.2x |
2009 Securitized Notes | Pinnacle Towers Acquisition Holdings LLC and its Subsidiaries | Debt Service Coverage Ratio | > 1.30x | (4) | 8.1x |
Financial covenants restricting ability of relevant issuer to issue additional notes under the applicable indenture | |||||
2010 Tower Revenue Notes | Crown Castle Towers LLC and its Subsidiaries | Debt Service Coverage Ratio | ≥ 2.00x | (5) | 9.2x |
2015 Tower Revenue Notes | Crown Castle Towers LLC and its Subsidiaries | Debt Service Coverage Ratio | ≥ 2.00x | (5) | 9.2x |
2009 Securitized Notes | Pinnacle Towers Acquisition Holdings LLC and its Subsidiaries | Debt Service Coverage Ratio | ≥ 2.34x | (5) | 8.1x |
(1) | As defined in the respective debt agreement. In the indentures for the 2010 Tower Revenue Notes, 2015 Tower Revenue Notes and the 2009 Securitized Notes, the defined term for Debt Service Coverage Ratio is "DSCR." |
(2) | Failure to comply with the financial maintenance covenants would, absent a waiver, result in an event of default under the credit agreement governing our 2016 Credit Facility. |
(3) | Applicable solely to the extent that the senior unsecured debt rating by any two of S&P, Moody's and Fitch is lower than BBB-, Baa3 or BBB-, respectively. If applicable, the consolidated interest coverage ratio must be greater than or equal to 2.50. |
(4) | The 2010 Tower Revenue Notes, 2015 Tower Revenue Notes and 2009 Securitized Notes also include the potential for amortization events, which could result in applying current and future cash flow to the prepayment of debt with applicable prepayment consideration. An amortization event occurs when the Debt Service Coverage Ratio falls below 1.45x, 1.45x or 1.15x, in each case as described under the indentures for the 2010 Tower Revenue Notes, 2015 Tower Revenue Notes or 2009 Securitized Notes, respectively. |
(5) | Rating Agency Confirmation (as defined in the respective debt agreement) is also required. |
25
Crown Castle International Corp.
First Quarter 2018
COMPANY OVERVIEW | FINANCIALS & METRICS | ASSET PORTFOLIO OVERVIEW | CAPITALIZATION OVERVIEW | APPENDIX |
INTEREST RATE SENSITIVITY(1) | |||||||||
Remaining nine months | Years Ending December 31, | ||||||||
(as of March 31, 2018; dollars in millions) | 2018 | 2019 | 2020 | ||||||
Fixed Rate Debt: | |||||||||
Face Value of Principal Outstanding(2) | $ | 13,133 | $ | 13,117 | $ | 13,110 | |||
Current Interest Payment Obligations(3) | 396 | 527 | 527 | ||||||
Effect of 0.125% Change in Interest Rates(4) | — | — | <1 | ||||||
Floating Rate Debt: | |||||||||
Face Value of Principal Outstanding(2) | $ | 2,439 | $ | 2,316 | $ | 2,193 | |||
Current Interest Payment Obligations(5) | 64 | 93 | 93 | ||||||
Effect of 0.125% Change in Interest Rates(6) | 2 | 3 | 3 | ||||||
(1) | Excludes capital lease and other obligations. |
(2) | Face value net of required amortizations; assumes no maturity or balloon principal payments; excludes capital leases. |
(3) | Interest expense calculated based on current interest rates. |
(4) | Interest expense calculated based on current interest rates until the sooner of the (1) stated maturity date or (2) the Anticipated Repayment Date, at which time the face value amount outstanding of such indebtedness is refinanced at current rates plus 12.5 bps. |
(5) | Interest expense calculated based on current interest rates. Forward LIBOR assumptions are derived from the 1-month LIBOR forward curve as of March 31, 2018. Calculation assumes no changes to future interest rate margin spread over LIBOR due to changes in the Borrower’s senior unsecured credit rating. |
(6) | Interest expense calculated based on current interest rates using the 1-month LIBOR forward curve as of March 31, 2018 plus 12.5 bps. |
26
Crown Castle International Corp.
First Quarter 2018
COMPANY OVERVIEW | FINANCIALS & METRICS | ASSET PORTFOLIO OVERVIEW | CAPITALIZATION OVERVIEW | APPENDIX |
DEFINITIONS |
Non-GAAP Financial Measures, Segment Measures and Other Calculations
This Supplement includes presentations of Adjusted EBITDA, Adjusted Funds from Operations ("AFFO"), Funds from Operations ("FFO") and Organic Contribution to Site Rental Revenues, which are non-GAAP financial measures. These non-GAAP financial measures are not intended as alternative measures of operating results or cash flow from operations (as determined in accordance with Generally Accepted Accounting Principles ("GAAP")).
Our measures of Adjusted EBITDA, AFFO, FFO and Organic Contribution to Site Rental Revenues may not be comparable to similarly titled measures of other companies, including other companies in the communications infrastructure sector or other REITs. Our definition of FFO is consistent with guidelines from the National Association of Real Estate Investment Trusts with the exception of the impact of income taxes in periods prior to our REIT conversion in 2014.
In addition to the non-GAAP financial measures used herein, we also provide Segment Site Rental Gross Margin, Segment Network Services and Other Gross Margin and Segment Operating Profit, which are key measures used by management to evaluate our operating segments for purposes of making decisions about allocating capital and assessing performance. These segment measures are provided pursuant to GAAP requirements related to segment reporting. In addition, we provide the components of certain GAAP measures, such as capital expenditures.
Adjusted EBITDA, AFFO, FFO and Organic Contribution to Site Rental Revenues, are presented as additional information because management believes these measures are useful indicators of the financial performance of our business. Among other things, management believes that:
• | Adjusted EBITDA is useful to investors or other interested parties in evaluating our financial performance. Adjusted EBITDA is the primary measure used by management (1) to evaluate the economic productivity of our operations and (2) for purposes of making decisions about allocating resources to, and assessing the performance of, our operations. Management believes that Adjusted EBITDA helps investors or other interested parties meaningfully evaluate and compare the results of our operations (1) from period to period and (2) to our competitors, by removing the impact of our capital structure (primarily interest charges from our outstanding debt) and asset base (primarily depreciation, amortization and accretion) from our financial results. Management also believes Adjusted EBITDA is frequently used by investors or other interested parties in the evaluation of the communications infrastructure sector and other REITs to measure financial performance without regard to items such as depreciation, amortization and accretion, which can vary depending upon accounting methods and the book value of assets. In addition, Adjusted EBITDA is similar to the measure of current financial performance generally used in our debt covenant calculations. Adjusted EBITDA should be considered only as a supplement to net income computed in accordance with GAAP as a measure of our performance. |
• | AFFO and AFFO per share are useful to investors or other interested parties in evaluating our financial performance. Management believes that AFFO and AFFO per share help investors or other interested parties meaningfully evaluate our financial performance as they include (1) the impact of our capital structure (primarily interest expense on our outstanding debt and dividends on our preferred stock) and (2) sustaining capital expenditures and excludes the impact of our (a) asset base (primarily depreciation, amortization and accretion) and (b) certain non-cash items, including straight-lined revenues and expenses related to fixed escalations and rent free periods. GAAP requires rental revenues and expenses related to leases that contain specified rental increases over the life of the lease to be recognized evenly over the life of the lease. In accordance with GAAP, if payment terms call for fixed escalations, or rent free periods, the revenue or expense is recognized on a straight-lined basis over the fixed, non-cancelable term of the contract. Management notes that the Company uses AFFO and AFFO per share only as a performance measure. AFFO and AFFO per share should be considered only as a supplement to net income computed in accordance with GAAP as a measure of our performance and should not be considered as an alternative to cash flows from operations or as residual cash flow available for discretionary investment. |
• | FFO and FFO per share are useful to investors or other interested parties in evaluating our financial performance. Management believes that FFO may be used by investors or other interested parties as a basis to compare our financial performance with that of other REITs. FFO and FFO per share help investors or other interested parties meaningfully evaluate financial performance by excluding the impact of our asset base (primarily depreciation, amortization and accretion). FFO and FFO per share are not key performance indicators used by the Company. FFO and FFO per share should be considered only as a supplement to net income computed in accordance with GAAP as a measure of our performance and should not be considered as an alternative to cash flow from operations. |
• | Organic Contribution to Site Rental Revenues is useful to investors or other interested parties in understanding the components of the year-over-year changes in our site rental revenues computed in accordance with GAAP. Management uses the Organic |
27
Crown Castle International Corp.
First Quarter 2018
COMPANY OVERVIEW | FINANCIALS & METRICS | ASSET PORTFOLIO OVERVIEW | CAPITALIZATION OVERVIEW | APPENDIX |
Contribution to Site Rental Revenues to assess year-over-year growth rates for our rental activities, to evaluate current performance, to capture trends in rental rates, new leasing activities and customer non-renewals in our core business, as well to forecast future results. Organic Contribution to Site Rental Revenues is not meant as an alternative measure of revenue and should be considered only as a supplement in understanding and assessing the performance of our site rental revenues computed in accordance with GAAP.
We define our non-GAAP financial measures, segment measures and other calculations as follows:
Non-GAAP Financial Measures
Adjusted EBITDA. We define Adjusted EBITDA as net income (loss) plus restructuring charges (credits), asset write-down charges, acquisition and integration costs, depreciation, amortization and accretion, amortization of prepaid lease purchase price adjustments, interest expense and amortization of deferred financing costs, (gains) losses on retirement of long-term obligations, net (gain) loss on interest rate swaps, (gains) losses on foreign currency swaps, impairment of available-for-sale securities, interest income, other (income) expense, (benefit) provision for income taxes, cumulative effect of a change in accounting principle, (income) loss from discontinued operations and stock-based compensation expense.
Adjusted Funds from Operations. We define Adjusted Funds from Operations as FFO before straight-lined revenue, straight-lined expense, stock-based compensation expense, non-cash portion of tax provision, non-real estate related depreciation, amortization and accretion, amortization of non-cash interest expense, other (income) expense, (gains) losses on retirement of long-term obligations, net (gain) loss on interest rate swaps, (gains) losses on foreign currency swaps, acquisition and integration costs, and adjustments for noncontrolling interests, and less capital improvement capital expenditures and corporate capital expenditures (i.e., sustaining capital expenditures).
AFFO per share. We define AFFO per share as AFFO divided by diluted weighted average common shares outstanding.
Funds from Operations. We define Funds from Operations as net income plus real estate related depreciation, amortization and accretion and asset write-down charges, less noncontrolling interest and cash paid for preferred stock dividends, and is a measure of funds from operations attributable to CCIC common stockholders.
FFO per share. We define FFO per share as FFO divided by the diluted weighted average common shares outstanding.
Organic Contribution to Site Rental Revenues. We define the Organic Contribution to Site Rental Revenues as the sum of the change in GAAP site rental revenues related to (1) new leasing activity, including revenues from the construction of small cells and the impact of prepaid rent, (2) escalators and less (3) non-renewals of customer contracts.
Segment Measures
Segment Site Rental Gross Margin. We define Segment Site Rental Gross Margin as segment site rental revenues less segment site rental cost of operations, excluding stock-based compensation expense and prepaid lease purchase price adjustments recorded in consolidated site rental cost of operations.
Segment Network Services and Other Gross Margin. We define Segment Network Services and Other Gross Margin as segment network services and other revenues less segment network services and other cost of operations, excluding stock-based compensation expense recorded in consolidated network services and other cost of operations.
Segment Operating Profit. We define Segment Operating Profit as segment site rental gross margin plus segment network services and other gross margin, less general and administrative expenses attributable to the respective segment.
Other Calculations
Discretionary capital expenditures. We define discretionary capital expenditures as those capital expenditures made with respect to activities which we believe exhibit sufficient potential to enhance long-term stockholder value. They consist of expansion or development of existing communications infrastructure, construction of new communications infrastructure, and, to a lesser extent, purchases of land assets under towers as we seek to manage our interests in the land beneath our towers.
Sustaining capital expenditures. We define sustaining capital expenditures as those capital expenditures made with respect to either (1) corporate capital expenditures or (2) capital improvement capital expenditures on our communications infrastructure assets that enable our customers' ongoing quiet enjoyment of the communications infrastructure.
Integration capital expenditures. We define integration capital expenditures as those capital expenditures made specifically with respect to recent acquisitions that are essential to integrating acquired companies into our business.
The tables set forth below reconcile the non-GAAP financial measures used herein to comparable GAAP financial measures. The components in these tables may not sum to the total due to rounding.
Reconciliations of Non-GAAP Financial Measures to Comparable GAAP Financial Measures and Other Calculations:
Reconciliation of Historical Adjusted EBITDA:
Three Months Ended March 31, | |||||||
(dollars in millions) | 2018 | 2017 | |||||
Net income (loss) | $ | 114 | $ | 119 | |||
Adjustments to increase (decrease) net income (loss): | |||||||
Asset write-down charges | 3 | 1 | |||||
Acquisition and integration costs | 6 | 6 | |||||
Depreciation, amortization and accretion | 374 | 289 | |||||
Amortization of prepaid lease purchase price adjustments | 5 | 5 | |||||
Interest expense and amortization of deferred financing costs(1) | 160 | 134 | |||||
(Gains) losses on retirement of long-term obligations | 71 | 4 | |||||
Interest income | (1 | ) | — | ||||
Other (income) expense | 1 | (6 | ) | ||||
(Benefit) provision for income taxes | 4 | 4 | |||||
Stock-based compensation expense | 26 | 25 | |||||
Adjusted EBITDA(2)(3) | $ | 763 | $ | 581 | |||
(1) | See the reconciliation of "components of historical interest expense and amortization of deferred financing costs" herein. |
(2) | See "Definitions of Non-GAAP Measures, Segment Measures and Other Calculations" herein for a discussion of our definition of Adjusted EBITDA. |
(3) | The above reconciliation excludes line items included in our definition which are not applicable for the periods shown. |
28
Crown Castle International Corp.
First Quarter 2018
COMPANY OVERVIEW | FINANCIALS & METRICS | ASSET PORTFOLIO OVERVIEW | CAPITALIZATION OVERVIEW | APPENDIX |
Reconciliation of Current Outlook for Adjusted EBITDA:
Q2 2018 | Full Year 2018 | ||||||
(dollars in millions) | Outlook | Outlook | |||||
Net income (loss) | $139 | to | $164 | $589 | to | $669 | |
Adjustments to increase (decrease) net income (loss): | |||||||
Asset write-down charges | $9 | to | $11 | $28 | to | $38 | |
Acquisition and integration costs | $13 | to | $17 | $45 | to | $55 | |
Depreciation, amortization and accretion | $373 | to | $393 | $1,517 | to | $1,552 | |
Amortization of prepaid lease purchase price adjustments | $4 | to | $6 | $19 | to | $21 | |
Interest expense and amortization of deferred financing costs(1) | $154 | to | $164 | $616 | to | $661 | |
(Gains) losses on retirement of long-term obligations | $0 | to | $0 | $71 | to | $71 | |
Interest income | $(1) | to | $1 | $(3) | to | $1 | |
Other (income) expense | $(1) | to | $3 | $3 | to | $5 | |
(Benefit) provision for income taxes | $8 | to | $12 | $28 | to | $36 | |
Stock-based compensation expense | $26 | to | $30 | $104 | to | $112 | |
Adjusted EBITDA(2)(3) | $757 | to | $767 | $3,097 | to | $3,142 | |
Components of Historical Interest Expense and Amortization of Deferred Financing Costs:
Three Months Ended March 31, | |||||||
(dollars in millions) | 2018 | 2017 | |||||
Interest expense on debt obligations | $ | 158 | $ | 132 | |||
Amortization of deferred financing costs and adjustments on long-term debt, net | 5 | 4 | |||||
Other, net | (3 | ) | (2 | ) | |||
Interest expense and amortization of deferred financing costs | $ | 160 | $ | 134 | |||
Components of Current Outlook for Interest Expense and Amortization of Deferred Financing Costs:
Q2 2018 | Full Year 2018 | ||||||
(dollars in millions) | Outlook | Outlook | |||||
Interest expense on debt obligations | $155 | to | $160 | $620 | to | $640 | |
Amortization of deferred financing costs and adjustments on long-term debt, net | $3 | to | $6 | $18 | to | $23 | |
Other, net | $(4) | to | $(2) | $(15) | to | $(10) | |
Interest expense and amortization of deferred financing costs | $154 | to | $164 | $616 | to | $661 | |
(1) | See the reconciliation of "components of current outlook for interest expense and amortization of deferred financing costs" herein. |
(2) | See "Definitions of Non-GAAP Measures, Segment Measures and Other Calculations" herein for a discussion of our definition of Adjusted EBITDA. |
(3) | The above reconciliation excludes line items included in our definition which are not applicable for the periods shown. |
29
Crown Castle International Corp.
First Quarter 2018
COMPANY OVERVIEW | FINANCIALS & METRICS | ASSET PORTFOLIO OVERVIEW | CAPITALIZATION OVERVIEW | APPENDIX |
Reconciliation of Historical FFO and AFFO:
Three Months Ended March 31, | |||||||
(amounts in millions, except per share amounts) | 2018 | 2017 | |||||
Net income (loss) | $ | 114 | $ | 119 | |||
Real estate related depreciation, amortization and accretion | 359 | 281 | |||||
Asset write-down charges | 3 | 1 | |||||
Dividends on preferred stock | (28 | ) | — | ||||
FFO(1)(2)(3)(4) | $ | 447 | $ | 401 | |||
FFO (from above) | $ | 447 | $ | 401 | |||
Adjustments to increase (decrease) FFO: | |||||||
Straight-lined revenue | (16 | ) | (1 | ) | |||
Straight-lined expense | 23 | 23 | |||||
Stock-based compensation expense | 26 | 25 | |||||
Non-cash portion of tax provision | 4 | 4 | |||||
Non-real estate related depreciation, amortization and accretion | 15 | 8 | |||||
Amortization of non-cash interest expense | 2 | 2 | |||||
Other (income) expense | 1 | (6 | ) | ||||
Gains (losses) on retirement of long-term obligations | 71 | 4 | |||||
Acquisition and integration costs | 6 | 6 | |||||
Capital improvement capital expenditures | (13 | ) | (7 | ) | |||
Corporate capital expenditures | (9 | ) | (9 | ) | |||
AFFO(1)(2)(3)(4) | $ | 558 | $ | 450 | |||
Weighted average common shares outstanding—diluted(5) | 410 | 362 | |||||
AFFO per share(1)(3)(4) | $ | 1.36 | $ | 1.24 | |||
(1) | See “Definitions of Non-GAAP Financial Measures, Segment Measures and Other Calculations” herein for a discussion of our definitions of FFO and AFFO. |
(2) | FFO and AFFO are reduced by cash paid for preferred stock dividends during the period in which they are paid. |
(3) | The above reconciliation excludes line items included in our definition which are not applicable for the periods shown. |
(4) | Attributable to CCIC common stockholders. |
(5) | Based on the diluted weighted-average common shares outstanding for the three months ended March 31, 2018 and 2017. For all periods presented, the diluted weighted-average common shares outstanding does not include any assumed conversion of preferred stock in the share count. |
30
Crown Castle International Corp.
First Quarter 2018
COMPANY OVERVIEW | FINANCIALS & METRICS | ASSET PORTFOLIO OVERVIEW | CAPITALIZATION OVERVIEW | APPENDIX |
Reconciliation of Historical FFO and AFFO:
Years Ended December 31, | |||||||||||||||
(amounts in millions, except per share amounts) | 2017 | 2016 | 2015 | 2014 | |||||||||||
Net income (loss) | $ | 445 | $ | 357 | $ | 525 | $ | 346 | |||||||
Real estate related depreciation, amortization and accretion | 1,211 | 1,082 | 1,018 | 972 | |||||||||||
Asset write-down charges | 17 | 34 | 33 | 14 | |||||||||||
Dividends on preferred stock | (30 | ) | (44 | ) | (44 | ) | (44 | ) | |||||||
FFO(1)(2)(3)(4) | $ | 1,643 | $ | 1,430 | $ | 1,533 | $ | 1,288 | |||||||
FFO (from above) | $ | 1,643 | $ | 1,430 | $ | 1,533 | $ | 1,288 | |||||||
Adjustments to increase (decrease) FFO: | |||||||||||||||
Straight-lined revenue | — | (47 | ) | (111 | ) | (183 | ) | ||||||||
Straight-lined expense | 93 | 94 | 99 | 102 | |||||||||||
Stock-based compensation expense | 96 | 97 | 67 | 56 | |||||||||||
Non-cash portion of tax provision | 9 | 7 | (64 | ) | (19 | ) | |||||||||
Non-real estate related depreciation, amortization and accretion | 31 | 26 | 18 | 14 | |||||||||||
Amortization of non-cash interest expense | 9 | 14 | 37 | 81 | |||||||||||
Other (income) expense | (2 | ) | 9 | (57 | ) | (12 | ) | ||||||||
(Gains) losses on retirement of long-term obligations | 4 | 52 | 4 | 45 | |||||||||||
Acquisition and integration costs | 61 | 17 | 16 | 34 | |||||||||||
Capital improvement capital expenditures | (41 | ) | (43 | ) | (47 | ) | (31 | ) | |||||||
Corporate capital expenditures | (44 | ) | (47 | ) | (58 | ) | (50 | ) | |||||||
AFFO(1)(2)(3)(4) | $ | 1,860 | $ | 1,610 | $ | 1,437 | $ | 1,324 | |||||||
Weighted average common shares outstanding—diluted(5) | 383 | 341 | 334 | 333 | |||||||||||
AFFO per share(1)(3)(4) | $ | 4.85 | $ | 4.72 | $ | 4.30 | $ | 3.97 | |||||||
(1) | See "Definitions of Non-GAAP Measures, Segment Measures and Other Calculations" herein for a discussion of our definitions of FFO and AFFO. |
(2) | FFO and AFFO are reduced by cash paid for preferred stock dividends during the period in which they are paid. |
(3) | The above reconciliation excludes line items included in our definition which are not applicable for the periods shown. |
(4) | Attributable to CCIC common stockholders. |
(5) | Based on the diluted weighted-average common shares outstanding for the twelve months ended December 31, 2017, 2016, 2015 and 2014. |
31
Crown Castle International Corp.
First Quarter 2018
COMPANY OVERVIEW | FINANCIALS & METRICS | ASSET PORTFOLIO OVERVIEW | CAPITALIZATION OVERVIEW | APPENDIX |
Reconciliation of Current Outlook for FFO and AFFO:
Q2 2018 | Full Year 2018 | ||||||
(amounts in millions, except per share amounts) | Outlook | Outlook | |||||
Net income (loss) | $139 | to | $164 | $589 | to | $669 | |
Real estate related depreciation, amortization and accretion | $363 | to | $373 | $1,466 | to | $1,486 | |
Asset write-down charges | $9 | to | $11 | $28 | to | $38 | |
Dividends on preferred stock | $(28) | to | $(28) | $(113) | to | $(113) | |
FFO(1)(2)(3) | $496 | to | $506 | $2,002 | to | $2,047 | |
Weighted-average common shares outstanding—diluted(4) | 416 | 415 | |||||
FFO per share(1)(2)(3) | $1.19 | to | $1.22 | $4.83 | to | $4.94 | |
FFO (from above) | $496 | to | $506 | $2,002 | to | $2,047 | |
Adjustments to increase (decrease) FFO: | |||||||
Straight-lined revenue | $(16) | to | $(6) | $(39) | to | $(19) | |
Straight-lined expense | $17 | to | $27 | $77 | to | $97 | |
Stock-based compensation expense | $26 | to | $30 | $104 | to | $112 | |
Non-cash portion of tax provision | $(7) | to | $3 | $3 | to | $18 | |
Non-real estate related depreciation, amortization and accretion | $10 | to | $20 | $51 | to | $66 | |
Amortization of non-cash interest expense | $(1) | to | $4 | $3 | to | $13 | |
Other (income) expense | $(1) | to | $3 | $3 | to | $5 | |
(Gains) losses on retirement of long-term obligations | $0 | to | $0 | $71 | to | $71 | |
Acquisition and integration costs | $13 | to | $17 | $45 | to | $55 | |
Capital improvement capital expenditures | $(19) | to | $(9) | $(67) | to | $(52) | |
Corporate capital expenditures | $(18) | to | $(8) | $(64) | to | $(49) | |
AFFO(1)(2)(3) | $539 | to | $549 | $2,255 | to | $2,300 | |
Weighted-average common shares outstanding—diluted(4) | 416 | 415 | |||||
AFFO per share(1)(2)(3) | $1.29 | to | $1.32 | $5.44 | to | $5.55 | |
(1) | See “Definitions of Non-GAAP Financial Measures, Segment Measures and Other Calculations” herein for a discussion of our definitions of FFO and AFFO. |
(2) | The above reconciliation excludes line items included in our definition which are not applicable for the periods shown. |
(3) | Attributable to CCIC common stockholders. |
(4) | The assumption for second quarter 2018 and full year 2018 diluted weighted-average common shares outstanding is 416 million and 415 million, respectively, based on diluted common shares outstanding as of March 31, 2018. For all periods presented, the diluted weighted-average common shares outstanding does not include any assumed conversion of preferred stock in the share count. |
32
Crown Castle International Corp.
First Quarter 2018
COMPANY OVERVIEW | FINANCIALS & METRICS | ASSET PORTFOLIO OVERVIEW | CAPITALIZATION OVERVIEW | APPENDIX |
Net debt to Last Quarter Annualized Adjusted EBITDA calculation:
Three Months Ended March 31, | |||||||
(dollars in millions) | 2018 | 2017 | |||||
Total face value of debt | $ | 15,862 | $ | 13,584 | |||
Ending cash and cash equivalents(1) | 220 | 205 | |||||
Total net debt | $ | 15,642 | $ | 13,379 | |||
Adjusted EBITDA for the three months ended March 31, | $ | 763 | $ | 581 | |||
Last quarter annualized Adjusted EBITDA | 3,052 | 2,324 | |||||
Net debt to Last Quarter Annualized Adjusted EBITDA | 5.1 | x | 5.8 | x | |||
Cash Interest Coverage Ratio Calculation:
Three Months Ended March 31, | |||||||
(dollars in millions) | 2018 | 2017 | |||||
Adjusted EBITDA | $ | 763 | $ | 581 | |||
Interest expense on debt obligations | 158 | 132 | |||||
Interest Coverage Ratio | 4.8 | x | 4.4 | x | |||
(1) | Excludes restricted cash. |
33