Attached files
| file | filename |
|---|---|
| EX-99.1 - EX-99.1 - HANCOCK WHITNEY CORP | hbhc-20180417xex99_1.htm |
| 8-K - 8-K - HANCOCK WHITNEY CORP | hbhc-20180417x8k.htm |
First Quarter 2018Earnings Conference Call
This presentation contains forward-looking statements within the meaning of section 27A of the Securities Act of 1933, as amended, and section 21E of the Securities Exchange Act of 1934, as amended. Forward looking statements that we may make include statements regarding balance sheet and revenue growth, the provision for loans losses, loan growth expectations, management’s predictions about charge-offs for loans, including energy-related credits, the impact of changes in oil and gas prices on our energy portfolio, and the downstream impact on businesses that support the energy sector, especially in the Gulf Coast region, the impact of the sale of HFC on our performance and financial condition, the impact of the transactions with First NBC and Capital One (pending) on our performance and financial condition, including our ability to successfully integrate the businesses, deposit trends, credit quality trends, net interest margin trends, future expense levels, success of revenue-generating initiatives, projected tax rates, future profitability, improvements in expense to revenue (efficiency) ratio, purchase accounting impacts such as accretion levels, and the financial impact of regulatory requirements and tax reform legislation. Also, any statement that does not describe historical or current facts is a forward-looking statement. These statements often include the words “believes,” “expects,” “anticipates,” “estimates,” “intends,” “plans,” “forecast,” “goals,” “targets,” “initiatives,” “focus,” “potentially,” “probably,” “projects,” “outlook” or similar expressions or future conditional verbs such as “may,” “will,” “should,” “would,” and “could.” Forward-looking statements are based upon the current beliefs and expectations of management and on information currently available to management. Our statements speak as of the date hereof, and we do not assume any obligation to update these statements or to update the reasons why actual results could differ from those contained in such statements in light of new information or future events. Forward-looking statements are subject to significant risks and uncertainties. Any forward-looking statement made in this release is subject to the safe harbor protections set forth in the Private Securities Litigation Reform Act of 1995. Investors are cautioned against placing undue reliance on such statements. Actual results may differ materially from those set forth in the forward looking statements. Additional factors that could cause actual results to differ materially from those described in the forward-looking statements can be found in Part I, “Item 1A. Risk Factors” in our Annual Report on Form 10-K for the year ended December 31, 2017and in other periodic reports that we file with the SEC.
This presentation contains forward-looking statements within the meaning of section 27A of the Securities Act of 1933, as amended, and section 21E of the Securities Exchange Act of 1934, as amended. Forward looking statements that we may make include statements regarding balance sheet and revenue growth, the provision for loans losses, loan growth expectations, management’s predictions about charge-offs for loans, including energy-related credits, the impact of changes in oil and gas prices on our energy portfolio, and the downstream impact on businesses that support the energy sector, especially in the Gulf Coast region, the impact of the sale of HFC on our performance and financial condition, the impact of the transactions with First NBC and Capital One (pending) on our performance and financial condition, including our ability to successfully integrate the businesses, deposit trends, credit quality trends, net interest margin trends, future expense levels, success of revenue-generating initiatives, projected tax rates, future profitability, improvements in expense to revenue (efficiency) ratio, purchase accounting impacts such as accretion levels, and the financial impact of regulatory requirements and tax reform legislation. Also, any statement that does not describe historical or current facts is a forward-looking statement. These statements often include the words “believes,” “expects,” “anticipates,” “estimates,” “intends,” “plans,” “forecast,” “goals,” “targets,” “initiatives,” “focus,” “potentially,” “probably,” “projects,” “outlook” or similar expressions or future conditional verbs such as “may,” “will,” “should,” “would,” and “could.” Forward-looking statements are based upon the current beliefs and expectations of management and on information currently available to management. Our statements speak as of the date hereof, and we do not assume any obligation to update these statements or to update the reasons why actual results could differ from those contained in such statements in light of new information or future events. Forward-looking statements are subject to significant risks and uncertainties. Any forward-looking statement made in this release is subject to the safe harbor protections set forth in the Private Securities Litigation Reform Act of 1995. Investors are cautioned against placing undue reliance on such statements. Actual results may differ materially from those set forth in the forward looking statements. Additional factors that could cause actual results to differ materially from those described in the forward-looking statements can be found in Part I, “Item 1A. Risk Factors” in our Annual Report on Form 10-K for the year ended December 31, 2017and in other periodic reports that we file with the SEC.
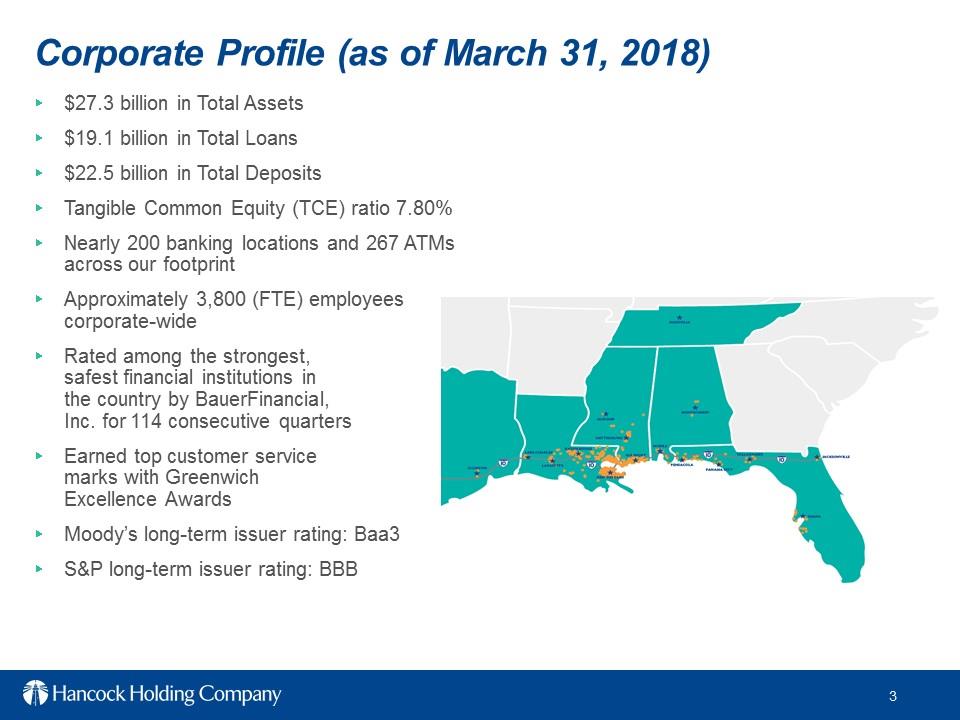
Corporate Profile (as of March 31, 2018) $27.3 billion in Total Assets.$19.1 billion in Total Loans.$22.5 billion in Total Deposits Tangible Common Equity (TCE) ratio 7.80%.Nearly 200 banking locations and 267 ATMs across our footprint. Approximately 3,800 (FTE) employees corporate-wide. Rated among the strongest, safest financial institutions in the country by BauerFinancial, Inc. for 114 consecutive quarters. Earned top customer service marks with Greenwich Excellence Awards. Moody’s long-term issuer rating: Baa3.S&P long-term issuer rating: BBB
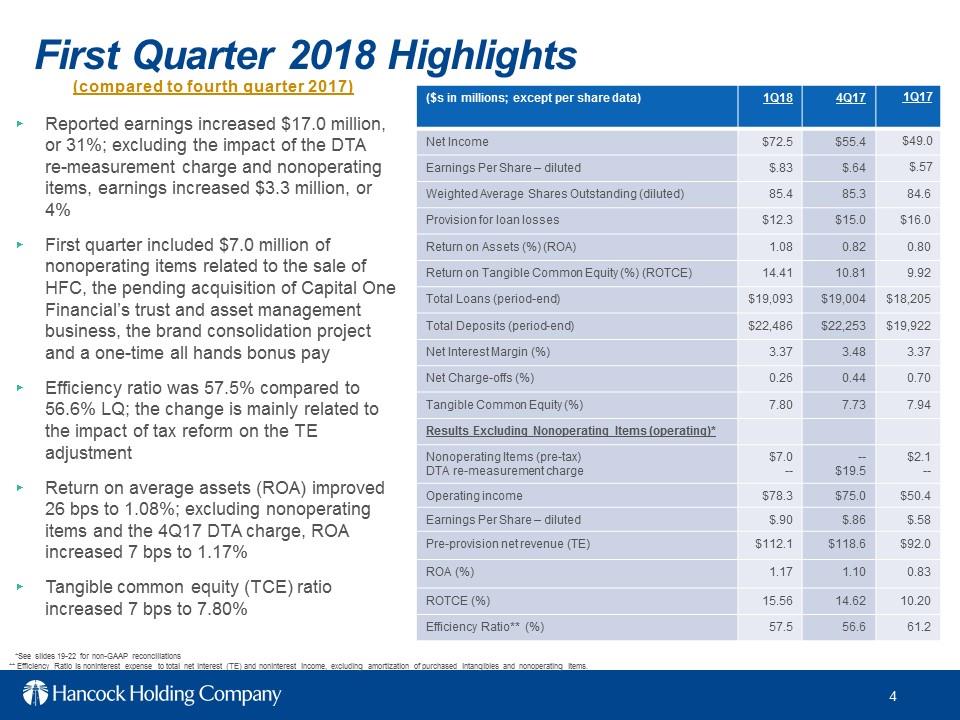
($s in millions; except per share data) 1Q18 4Q17 1Q17 Net Income $72.5 $55.4 $49.0 Earnings Per Share –diluted $.83 $.64 $.57 Weighted Average Shares Outstanding (diluted) 85.4 85.3 84.6 Provision for loan losses $12.3 $15.0 $16.0 Return on Assets (%) (ROA) 1.08 0.82 0.80 Return on Tangible Common Equity (%) (ROTCE) 14.41 10.81 9.92 Total Loans (period-end) $19,093 $19,004 $18,205 Total Deposits (period-end) $22,486 $22,253 $19,922 Net Interest Margin (%) 3.37 3.48 3.37 Net Charge-offs (%) 0.26 0.44 0.70 Tangible Common Equity (%) 7.80 7.73 7.94 Results Excluding Nonoperating Items (operating)*Nonoperating Items (pre-tax) DTA re-measurement charge $7.0 $19.5 $2.1 operating income $78.3 $75.0 $50.4 Earnings Per Share –diluted $.90 $.86 $.58 Pre-provision net revenue (TE) $112.1 $118.6 $92.0 ROA(%) 1.17 1.10 0.83 ROTCE(%) 15.56 14.62 10.20 Efficiency Ratio**(%) 57.5 56.6 61.2 (compared to fourth quarter 2017) First Quarter 2018 Highlights .Reported earnings increased $17.0 million, or 31%; excluding the impact of the DTA re-measurement charge and nonoperating items, earnings increased $3.3 million, or 4%.First quarter included $7.0 million of nonoperatingi tems related to the sale of HFC, the pending acquisition of Capital One Financial’s trust and asset management business, the brand consolidation project and a one-time all hands bonus pay
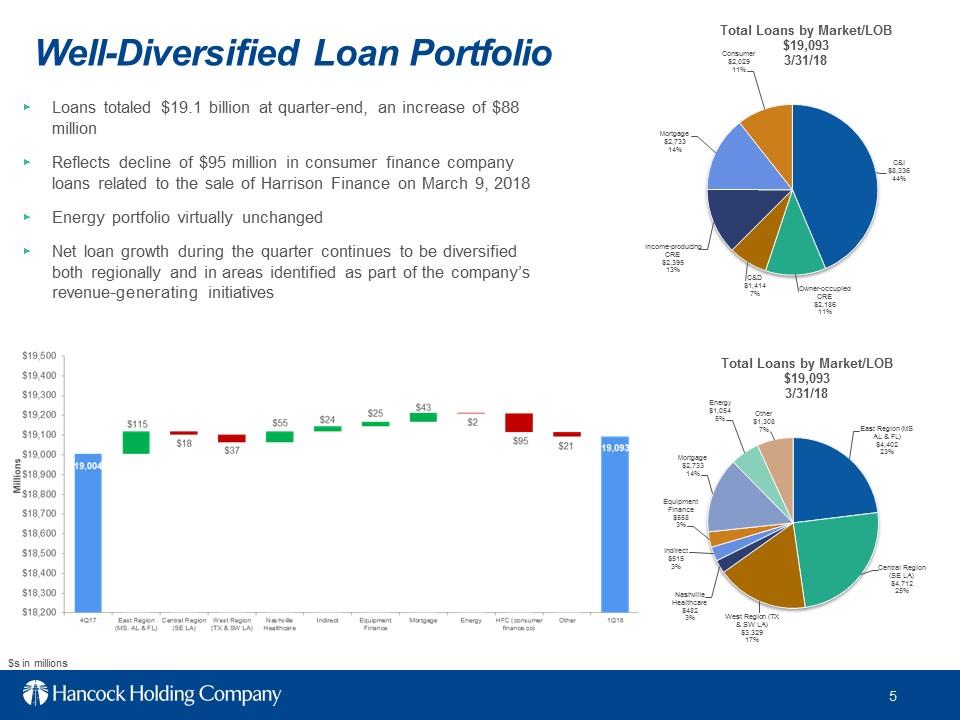
Well-Diversified Loan Portfolio East Region (MS AL & FL)$4,402 23% Central Region (SE LA)$4,712 25% West Region (TX & SW LA)$3,329 17% Nashville Healthcare$482 3% Indirect$515 3% Equipment Finance $558 3% Mortgage $2,733 14% Energy$1,054 5% Other$1,308 7% Total Loans by Market/LOB $19,093 3/31/18 .Loans totaled $19.1 billion at quarter-end, an increase of $88 million. Reflects decline of $95 million in consumer finance company loans related to the sale of Harrison Finance on March 9, 2018. Energy portfolio virtually unchanged.Net loan growth during the quarter continues to be diversified both regionally and in areas identified as part of the company’s revenue-generating initiatives $s in millions C&I $8,336 44% Owner-occupied CRE $2,186 11% C&D $1,414 7% Income-producing CRE $2,395 13% Mortgage $2,733 14% Consumer$2,029 11% Total Loans by Market/LOB $19,093 3/31/18
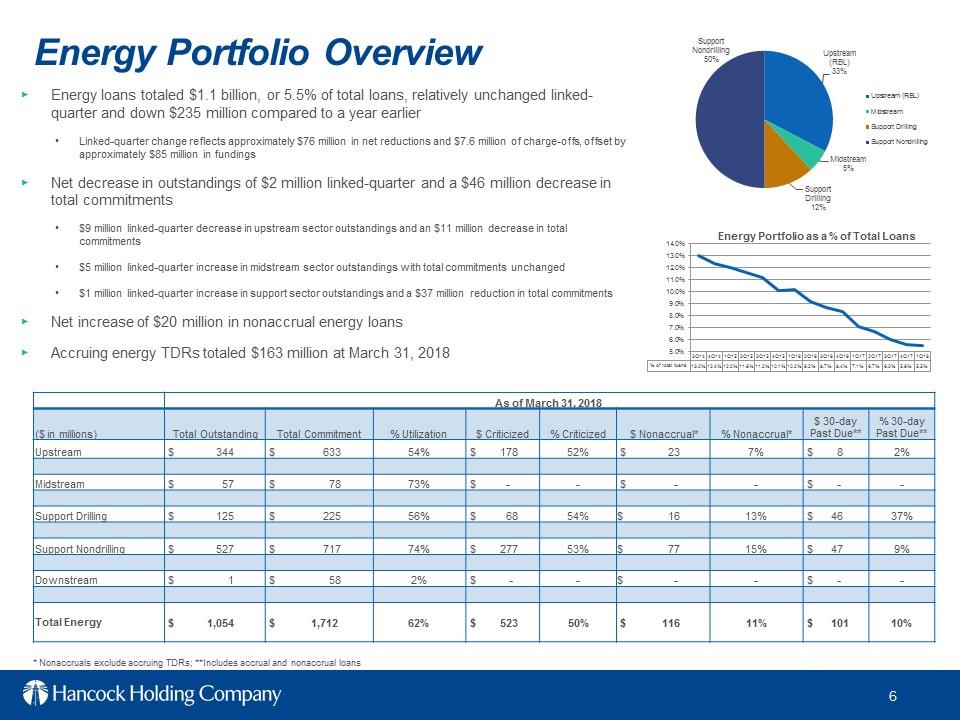
As of March 31, 2018 ($ in millions) Total Outstanding Total Commitment % Utilization $ Criticized % Criticized $ Nonaccrual* % Nonaccrual* $ 30-day % 30-day Past Due** Upstream $ 344 $ 633 54% $ 178 52% $ 23 7% $ 8 2% Midstream $ 57 $ 78 73% $ -$ -$ -Support Drilling $ 125 $ 225 56% $ 68 54% $ 16 13% $ 46 37% Support Nondrilling $ 527 $ 717 74% $ 277 53% $ 77 15% $ 47 9% Downstream $ 1 $ 58 2% $ -$ -$ -Total Energy $ 1,054 $ 1,712 62% $ 523 50% $ 116 11% $ 101 10% Energy Portfolio Overview Energy loans totaled $1.1 billion, or 5.5%of total loans, relatively unchanged linked-quarter and down $235 million compared to a year earlier Linked-quarter change reflects approximately $76 million in net reductions and $7.6 million of charge-offs, offset by approximately $85 million in fundings Net decrease in outstandings of $2million linked-quarter and a $46 million decrease in total commitments $9 million linked-quarter decrease in upstream sector outstandings and an $11 million decrease in total commitments $5 million linked-quarter increase in midstream sector outstandings with total commitments unchanged $1 million linked-quarter increase in support sector outstandings and a $37 million reduction in total commitments Net increase of $20 million in nonaccrual energy loans Accruing energy TDRs totaled $163 million at March 31, 2018 3Q14 4Q14 1Q15 2Q15 3Q15 4Q15 1Q16 2Q16 3Q16 4Q16 1Q17 2Q17 3Q17 4Q17 1Q18 % of total loans 13.0% 12.4% 12.0% 11.6% 11.2% 10.1% 10.2% 9.2% 8.7% 8.4% 7.1% 6.7% 6.0% 5.6% 5.5% 5.0% 6.0% 7.0% 8.0% 9.0% 10.0% 11.0% 12.0% 13.0% 14.0% Energy Portfolio as a % of Total Loans * Nonaccruals exclude accruing TDRs; **Includes accrual and nonaccrual loans Upstream (RBL) 33% Midstream5% Support Drilling 12% Support nondrilling 50% Upstream (RBL) Midstream Support Drilling Support Nondrilling
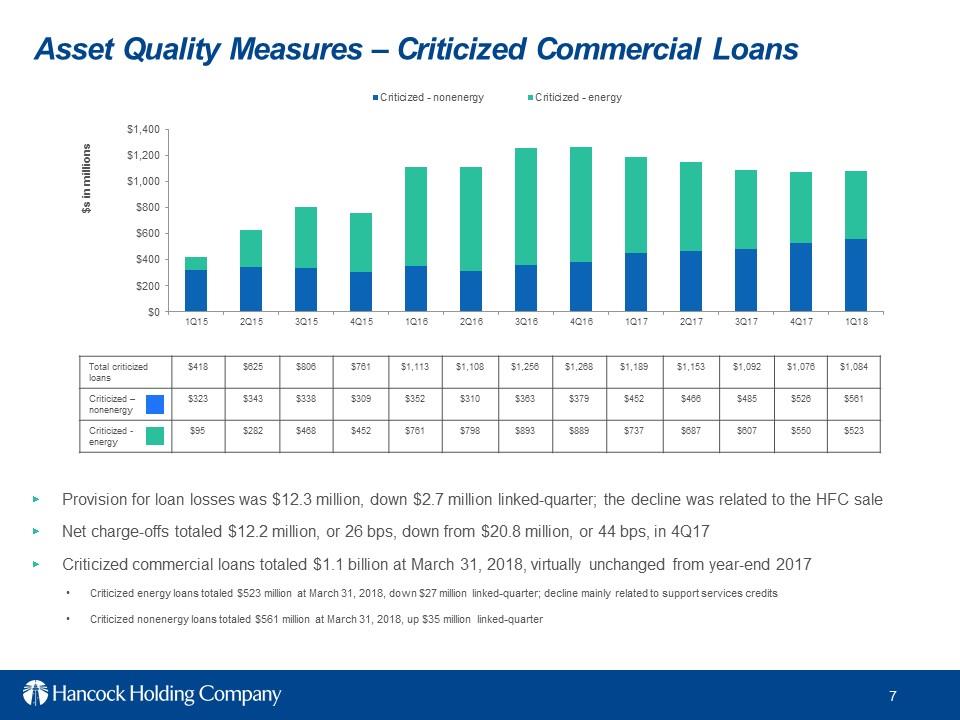
Asset Quality Measures –Criticized Commercial Loans. Provision for loan losses was $12.3 million, down $2.7 million linked-quarter; the decline was related to the HFC sale .Net charge-offs totaled $12.2 million, or 26 bps, down from $20.8 million, or 44 bps, in 4Q17 .Criticized commercial loans totaled $1.1 billion at March 31, 2018, virtually unchanged from year-end 2017 •Criticized energy loans totaled $523 million at March 31, 2018, down $27 million linked-quarter; decline mainly related to support services credits •Criticized nonenergy loans totaled $561 million at March 31, 2018, up $35 million linked-quarter $0 $200 $400 $600 $800 $1,000 $1,200 $1,400 1Q15 2Q15 3Q15 4Q15 1Q16 2Q16 3Q16 4Q16 1Q17 2Q17 3Q17 4Q17 1Q18 $s in millions Criticized – nonenergy Criticized – energy Total criticized loans $418 $625 $806 $761 $1,113 $1,108 $1,256 $1,268 $1,189 $1,153 $1,092 $1,076 $1,084 Criticized –nonenergy $323 $343 $338 $309 $352 $310 $363 $379 $452 $466 $485 $526 $561 Criticized –energy $95 $282 $468 $452 $761 $798 $893 $889 $737 $687 $607 $550 $523
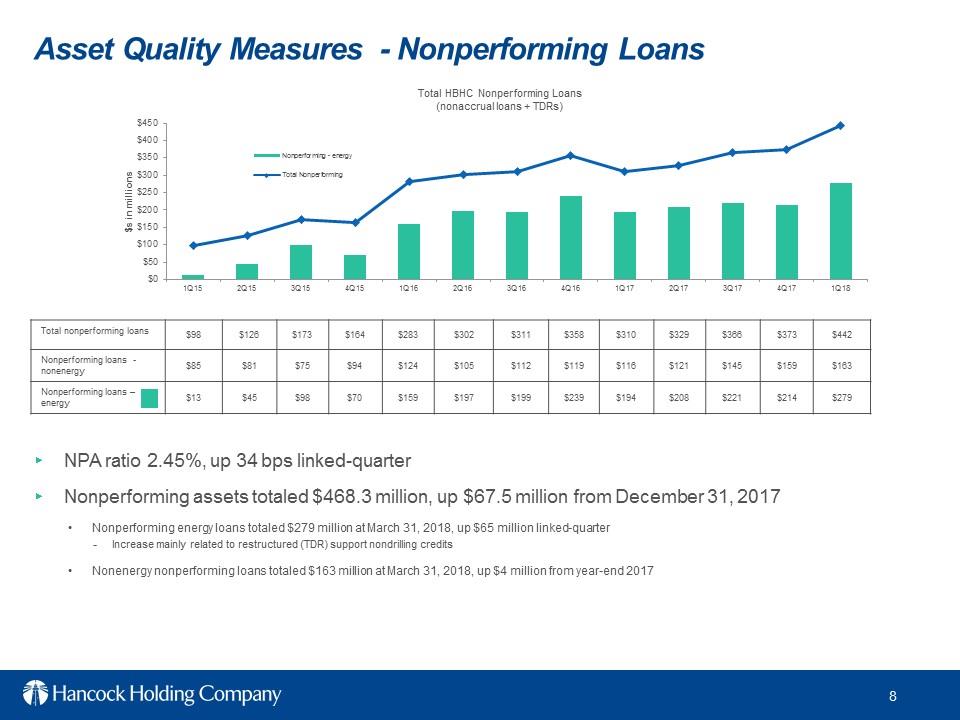
Total nonperforming loans $98 $126 $173 $164 $283 $302 $311 $358 $310 $329 $366 $373 $442 Nonperforming loans- nonenergy $85 $81 $75 $94 $124 $105 $112 $119 $116 $121 $145 $159 $163 Nonperforming loans energy $13 $45 $98 $70 $159 $197 $199 $239 $194 $208 $221 $214 $279 Asset Quality Measures -Nonperforming Loans .NPA ratio 2.45%, up 34 bps linked-quarter .Nonperforming assets totaled $468.3 million, up $67.5 million from December 31, 2017 •Nonperforming energy loans totaled $279 million at March 31, 2018, up $65 million linked-quarter -Increase mainly related to restructured (TDR) support nondrilling credits •Nonenergy nonperforming loans totaled $163 million at March 31, 2018, up $4 million from year-end 2017 $0 $50 $100 $150 $200 $250 $300 $350 $400 $450 1Q15 2Q15 3Q15 4Q15 1Q16 2Q16 3Q16 4Q16 1Q17 2Q17 3Q17 4Q17 1Q18 $s in millions Nonperforming – energy Total Nonperforming Total HBHC Nonperforming Loans(nonaccrual loans + TDRs)
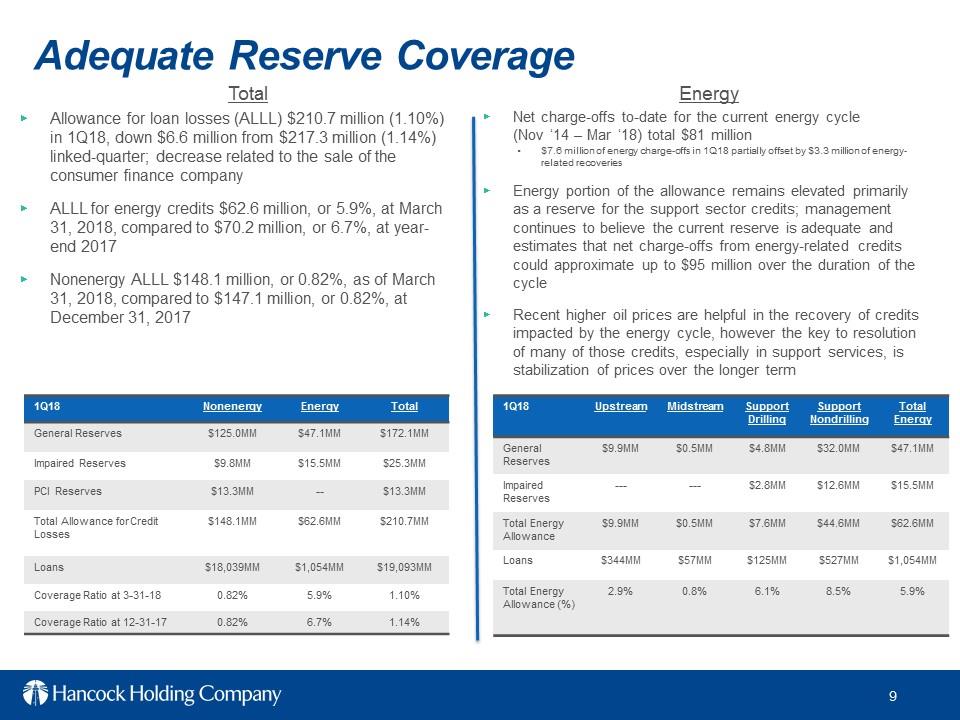
Adequate Reserve Coverage .Allowance for loan losses (ALLL) $210.7 million (1.10%) in 1Q18, down $6.6 million from $217.3 million (1.14%) linked-quarter; decrease related to the sale of the consumer finance company .ALLL for energy credits $62.6 million, or 5.9%, at March 31, 2018, compared to $70.2 million, or 6.7%, at year-end 2017 .Nonenergy ALLL $148.1 million, or 0.82%, as of March 31, 2018, compared to $147.1 million, or 0.82%, at December 31, 2017 1Q18 Upstream Midstream Support Drilling Support
Nondrilling Total Energy General Reserves $9.9MM $0.5MM $4.8MM $32.0MM $47.1MM Impaired Reserves $2.8MM $12.6MM $15.5MM Total Energy Allowance $9.9MM $0.5MM $7.6MM $44.6MM $62.6MM Loans $344MM $57MM $125MM $527MM $1,054MM Total Energy Allowance (%) 2.9% 0.8% 6.1% 8.5% 5.9% .Net charge-offs to-date for the current energy cycle (Nov ‘14 –Mar ‘18) total $81 million•$7.6 million of energy charge-offs in 1Q18 partially offset by $3.3 million of energy-related recoveries .Energy portion of the allowance remains elevated primarily as a reserve for the support sector credits; management continues to believe the current reserve is adequate and estimates that net charge-offs from energy-related credits could approximate up to $95 million over the duration of the cycle. Recent higher oil prices are helpful in the recovery of credits impacted by the energy cycle, however the key to resolution of many of those credits, especially in support services, is stabilization of prices over the longer term Total Energy 1Q18 Nonenergy Energy Total General Reserves $125.0MM $47.1MM $172.1MM Impaired Reserves $9.8MM $15.5MM $25.3MM PCI Reserves $13.3MM $13.3MM Total Allowance for Credit Losses $148.1MM $62.6MM $210.7MM Loans $18,039MM $1,054MM $19,093MM Coverage Ratio at 3-31-18 0.82% 5.9% 1.10% Coverage Ratio at 12-31-17 0.82% 6.7% 1.14%
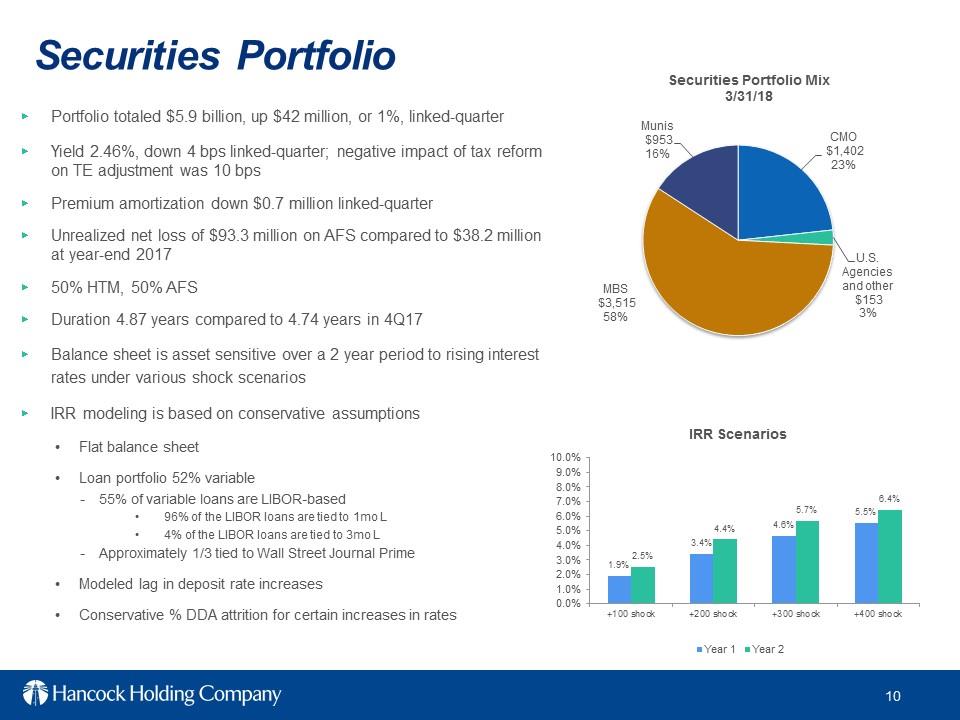
Securities Portfolio totaled $5.9 billion, up $42 million, or 1%, linked-quarter
Yield 2.46%, down 4bps linked-quarter; negative impact of tax reform on TE adjustment was 10 bps
Premium amortization down $0.7 million linked-quarter Unrealized net loss of $93.3 million on AFS compared to $38.2 million at year-end 2017 50% HTM, 50% AFS Duration 4.87 years compared to 4.74 years in 4Q17 Balance sheet is asset sensitive over a 2 year period to rising interest rates under various shock scenarios IRR modeling is based on conservative assumptions Flat balance sheet Loan portfolio 52% variable 55% of variable loans are LIBOR-based 96% of the LIBOR loans are tied to 1mo L 4% of the LIBOR loans are tied to 3mo L Approximately 1/3 tied to Wall Street Journal Prime Modeled lag in deposit rate increases Conservative % DDA attrition for certain increases in rates CMO$1,402
23% U.S. Agencies and other$153 3% MBS $3,515 58% Munis $953 16% Securities Portfolio Mix 3/31/18
1.9% 3.4% 4.6% 5.5% 2.5% 4.4% 5.7% 6.4% 0.0% 1.0% 2.0% 3.0% 4.0% 5.0% 6.0% 7.0% 8.0% 9.0% 10.0% +100 shock +200 shock +300 shock +400 shock IRR Scenarios Year 1 Year 2
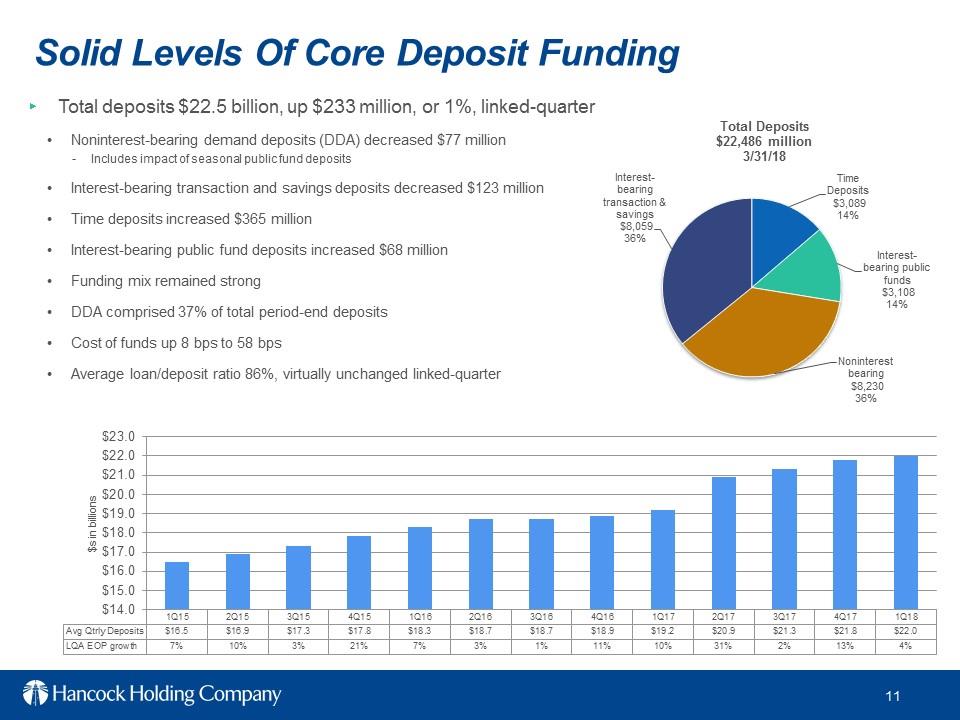
Solid Levels of Core Deposit Funding Total deposits $22.5 billion, up $233 million, or 1%, linked-quarter Noninterest-bearing demand deposits (DDA) decreased $77 million Includes impact of seasonal public fund deposits Interest-bearing transaction and savings deposits decreased $123 million Time deposits increased $365 million Interest-bearing public fund deposits increased $68 million Funding mix remained strong DDA comprised 37% of total period-end deposits Cost of funds up 8bps to 58 bps
Average loan/deposit ratio 86%, virtually unchanged linked-quarter Time Deposits $3,089 14% Interest-bearing public funds$3,108 14% Noninterest Bearing$8,230 36% Interest-bearing transaction & savings $8,059 36% Total Deposits $22,486 million 3/31/18 1Q15 2Q15 3Q15 4Q15 1Q16 2Q16 3Q16 4Q16 1Q17 2Q17 3Q17 4Q17 1Q18 Avg Qtrly Deposits $16.5 $16.9 $17.3 $17.8 $18.3 $18.7 $18.7$18.9 $19.2
$20.9 $21.3 $21.8 $22.0 LQA EOP growth 7% 10% 3% 21% 7% 3% 1% 11% 10% 31% 2% 13% 4% $14.0 $15.0 $16.0 $17.0 $18.0 $19.0 $20.0 $21.0 $22.0 $23.0 $s in billions
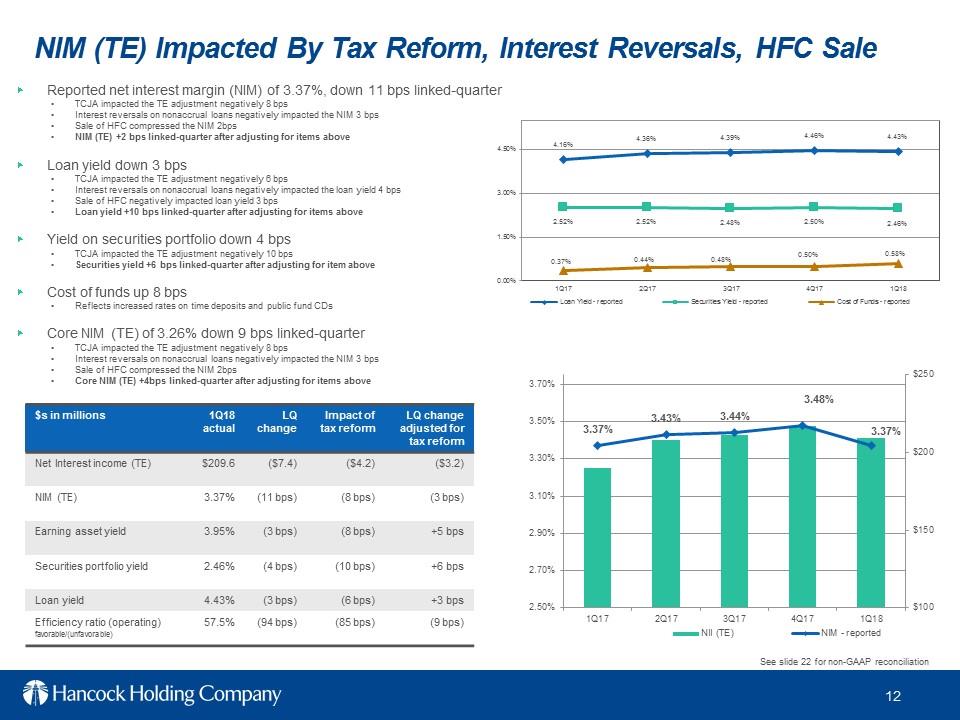
3.37% 3.43% 3.44% 3.48% 3.37% $100 $150 $200 $250 2.50% 2.70% 2.90% 3.10% 3.30% 3.50% 3.70% 1Q17 2Q17 3Q17 4Q17 1Q18 NII (TE) NIM – reported NIM (TE) Impacted By Tax Reform, Interest Reversals, HFC Sale 4.16% 4.36% 4.39% 4.46% 4.43% 2.52% 2.52% 2.48% 2.50% 2.46% 0.37% 0.44% 0.48% 0.50% 0.58% 0.00% 1.50% 3.00% 4.50% 1Q17 2Q17 3Q17 4Q17 1Q18 Loan Yield – reported Securities Yield – reported Cost of Funds – reported .Reported net interest margin (NIM) of 3.37%, down 11 bps linked-quarter TCJA impacted the TE adjustment negatively 8 bps Interest reversals on nonaccrual loans negatively impacted the NIM 3 bps Sale of HFC compressed the NIM 2bps NIM (TE) +2 bps linked-quarter after adjusting for items above Loan yield down 3 bps TCJA impacted the TE adjustment negatively 6bps •Interest reversals on nonaccrual loans negatively impacted the loan yield 4 bps Sale of HFC negatively impacted loan yield 3 bps loan yield +10 bps linked-quarter after adjusting for items above Yield on securities portfolio down 4 bps TCJA impacted the TE adjustment negatively 10 bps Securities yield +6 bps linked-quarter after adjusting for item above Cost of funds up 8 bps Reflects increased rates on time deposits and public fund CDs Core NIM (TE) of 3.26% down 9bps linked-quarter TCJA impacted the TE adjustment negatively 8 bps Interest reversals on nonaccrual loans negatively impacted the NIM 3 bps Sale of HFC compressed the NIM 2bps Core NIM (TE) +4bps linked-quarter after adjusting for items above See slide 22 for non-GAAP reconciliation $s in millions 1Q18actual LQ change impact of tax reform LQ change adjusted for tax reform Net Interest income (TE) $209.6 ($7.4) ($4.2) ($3.2) NIM (TE) 3.37% (11 bps) (8 bps) (3 bps) Earning asset yield 3.95% (3 bps) (8 bps) +5 bps Securities portfolio yield 2.46% (4 bps) (10 bps) +6 bps Loan yield 4.43% (3 bps) (6bps) +3 bps Efficiency ratio (operating) favorable/(unfavorable) 57.5% (94 bps) (85 bps) (9 bps)
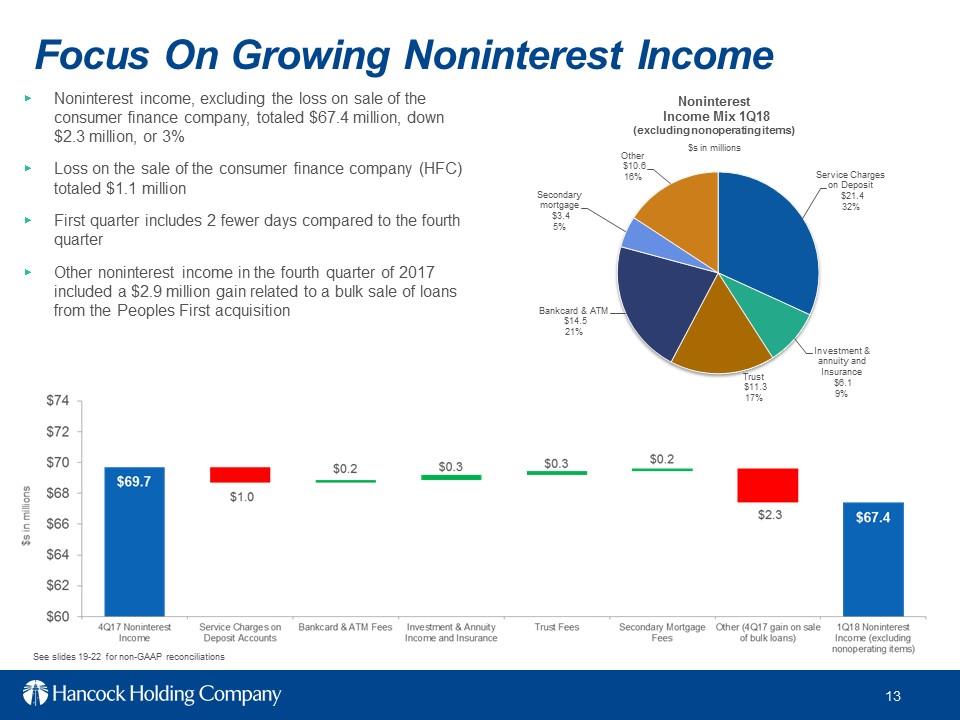
Focus On Growing Noninterest Income Service Charges in Deposit $21.4 32% Investment & annuity and Insurance $6.1 9% Trust$11.3 17% Bankcard & ATM $14.5 21% Secondary mortgage $3.4 5% Other $10.6 16% Noninterest Income Mix 1Q18 (excluding nonoperating items) Noninterest income, excluding the loss on sale of the consumer finance company, totaled $67.4 million, down $2.3 million, or 3% Loss on the sale of the consumer finance company (HFC) totaled $1.1 million First quarter includes 2 fewer days compared to the fourth quarter Other noninterest income in the fourth quarter of 2017 included a $2.9 million gain related to a bulk sale of loans from the Peoples First acquisition $s in millions See slides 19-22 for non-GAAP reconciliations
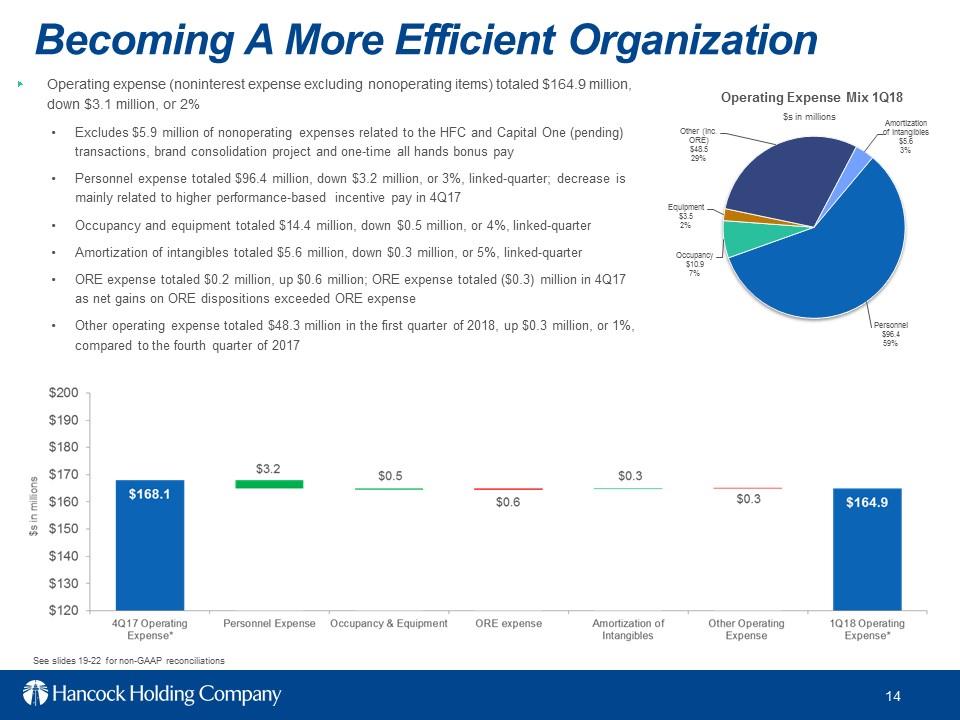
Becoming a More Efficient Organization Personnel $96.4 59% Occupancy $10.9 7% Equipment $3.5 2% Other (inc. ORE) $48.5 29% Amortization of intangibles $5.6 3% Operating Expense Mix 1Q18 Operating expense (noninterest expense excluding nonoperating items) totaled $164.9 million, down $3.1 million, or 2% Excludes $5.9 million of nonoperating expenses related to the HFC and Capital One (pending) transactions, brand consolidation project and one-time all hands bonus pay Personnel expense totaled $96.4 million, down $3.2 million, or 3%, linked-quarter; decrease is mainly related to higher performance-based incentive pay in 4Q17 Occupancy and equipment totaled $14.4 million, down $0.5 million, or 4%, linked-quarter Amortization of intangibles totaled $5.6 million, down $0.3 million, or 5%, linked-quarter ORE expense totaled $0.2 million, up $0.6 million; ORE expense totaled ($0.3) million in 4Q17 as net gains on ORE dispositions exceeded ORE expense Other operating expense totaled $48.3 million in the first quarter of 2018, up $0.3 million, or 1%, compared to the fourth quarter of 2017 $s in millions See slides 19-22 for non-GAAP reconciliations
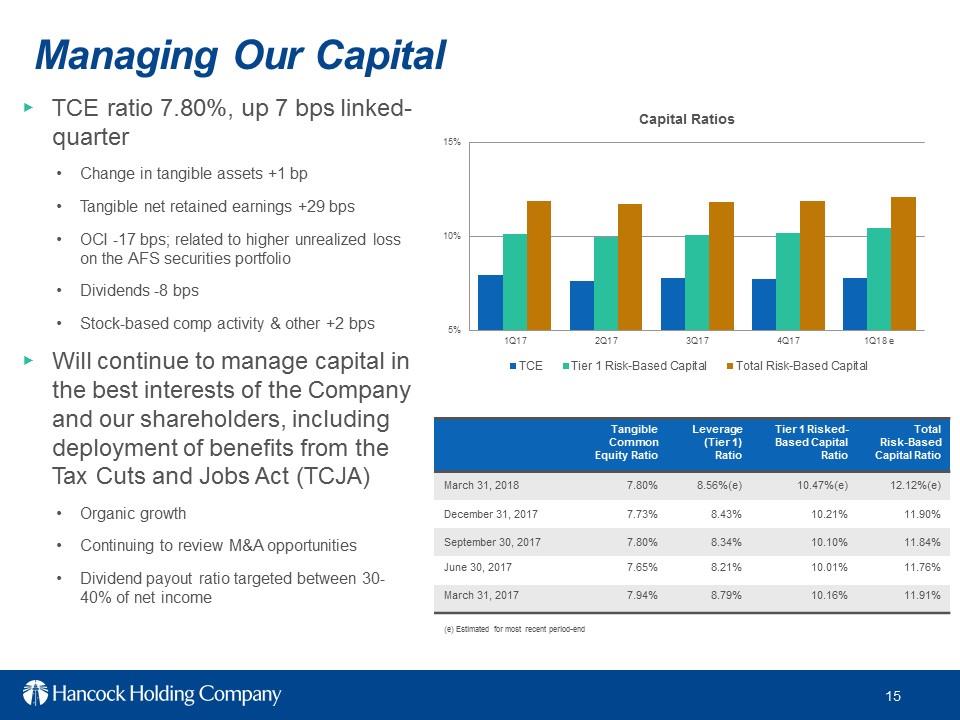
TCE ratio 7.80%, up 7 bps linked-quarter Change in tangible assets +1 bp Tangible net retained earnings 29 bps OCI -17 bps; related to higher unrealized loss on the AFS securities portfolio Dividends -8 bps Stock-based comp activity & other +2 bps Will continue to manage capital in the best interests of the Company and our shareholders, including deployment of benefits from the Tax Cuts and Jobs Act (TCJA) Organic growth Continuing to review M&A opportunities Dividend payout ratio targeted between 30-40% of net income Managing Our Capital 5% 10% 15% 1Q17 2Q17 3Q17 4Q17 1Q18 e Capital Ratios TCE Tier 1 Risk-Based Capital Total Risk-Based Capital Tangible Common Equity Ratio Leverage (Tier1) Ratio Tier 1 Risked-Based Capital Ratio Total Risk-Based Capital Ratio March 31, 2018 7.80% 8.56%(e) 10.47%(e) 12.12%(e) December 31, 2017 7.73% 8.43% 10.21% 11.90% September 30, 2017 7.80% 8.34% 10.10% 11.84% June 30, 2017 7.65% 8.21% 10.01% 11.76% March 31, 2017 7.94% 8.79% 10.16% 11.91% (e) Estimated for most recent period-end
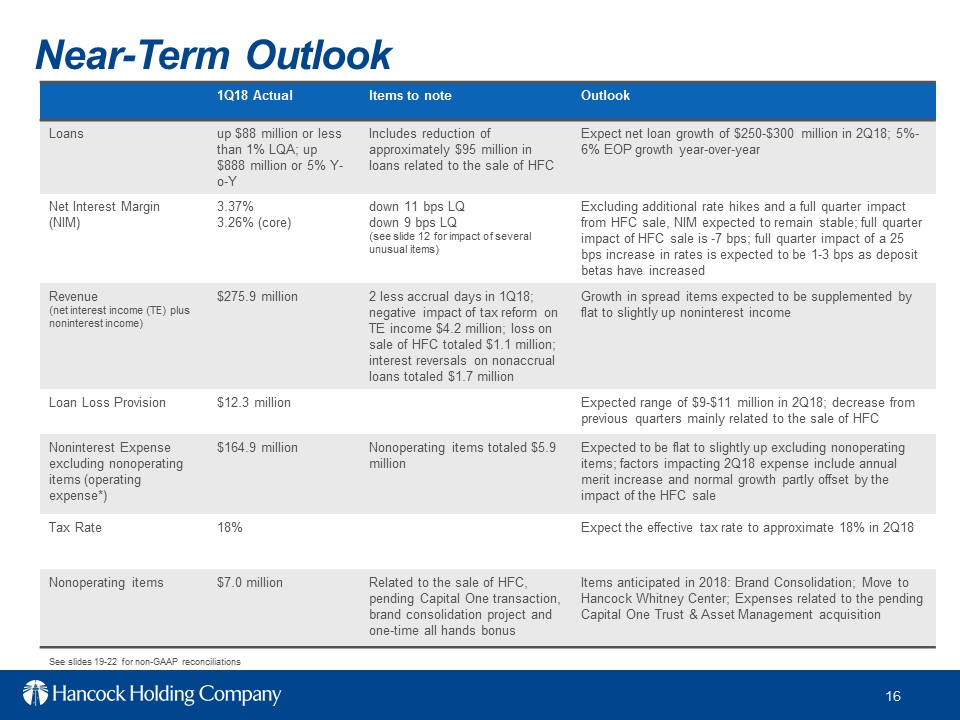
Near-Term Outlook 1Q18 Actual Items to note Outlook Loans up $88 million or less than 1% LQA; up $888 million or 5% Y-o-Y Includes reduction of approximately $95million in loans related to the sale of HFC Expect net loan growth of $250-$300 million in 2Q18; 5%-6% EOP growth year-over-year Net Interest Margin (NIM) 3.37% 3.26% (core) down 11 bps LQ down 9 bps LQ (see slide 12 for impact of several unusual items) Excluding additional rate hikes and a full quarter impact from HFC sale, NIM expected to remain stable; full quarter impact of HFC sale is -7 bps; full quarter impact of a 25 bps increase in rates is expected to be 1-3 bps as deposit betas have increased Revenue(net interest income (TE) plus noninterest income) $275.9million 2 less accrual days in 1Q18; negative impact of tax reform on TE income $4.2 million; loss on sale of HFC totaled $1.1 million; interest reversals on nonaccrual loans totaled $1.7 million Growth in spread items expected to be supplemented by flat to slightly up noninterest income Loan Loss Provision $12.3 million Expected range of $9-$11 million in 2Q18; decrease from previous quarters mainly related to the sale of HFC Noninterest Expense excluding nonoperating items (operating expense*) $164.9 million Nonoperating items totaled $5.9 million Expected to be flat to slightly up excluding nonoperating items; factors impacting 2Q18 expense include annual merit increase and normal growth partly offset by the impact of the HFC sale Tax Rate 18% Expect the effective tax rate to approximate 18% in 2Q18 Nonoperating items $7.0 million Related to the sale of HFC, pending Capital One transaction, brand consolidation project and one-time all hands bonus Items anticipated in 2018:Brand Consolidation; Move to Hancock Whitney Center; Expenses related to the pending Capital One Trust & Asset Management acquisition See slides 19-22 for non-GAAP reconciliations
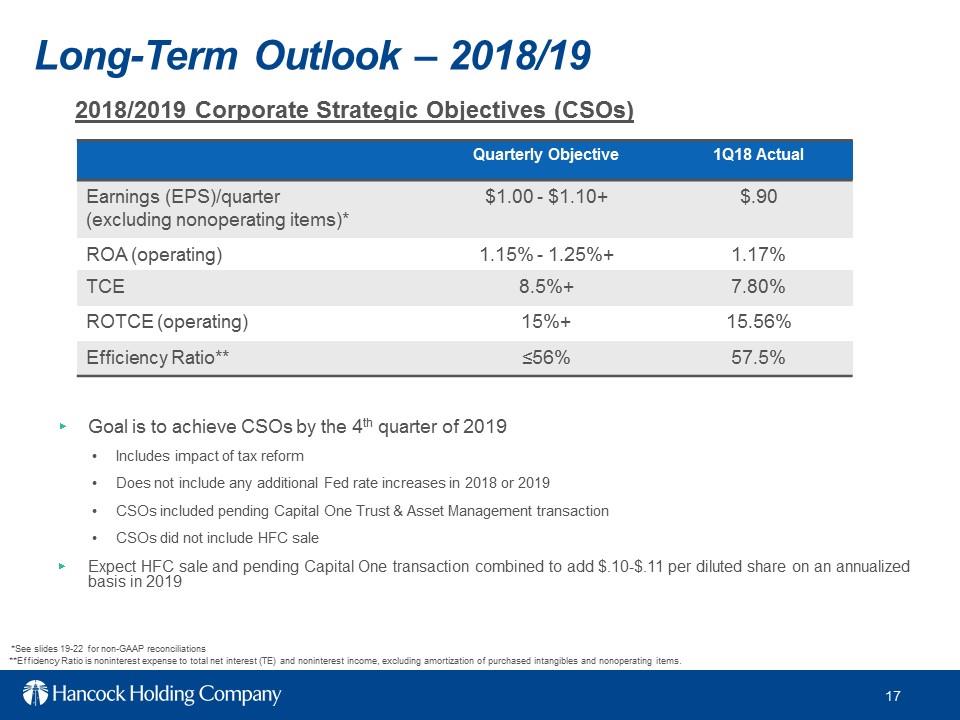
Long-Term Outlook –2018/19 Goal is to achieve CSOs by the 4thquarter of 2019 Includes impact of tax reform Does not include any additional Fed rate increases in 2018 or 2019 CSOs included pending capital One Trust & Asset Management transaction CSOs did not include HFC sale Expect HFC sale and pending Capital One transaction combined to add $.10-$.11 per diluted share on an annualized basis in 2019 Quarterly Objective 1Q18 Actual Earnings (EPS)/quarter (excluding nonoperating items)* $1.00 -$1.10+ $.90 ROA (operating) 1.15% -1.25%+ 1.17% TCE 8.5%+ 7.80% ROTCE (operating) 15%+ 15.56% Efficiency Ratio** =56% 57.5% 2018/2019 Corporate Strategic Objectives (CSOs) **Efficiency Ratio is noninterest expense to total net interest (TE) and noninterest income, excluding amortization of purchased intangibles and nonoperating items *See slides 19-22 for non-GAAP reconciliations
Non-GAAP Reconciliations
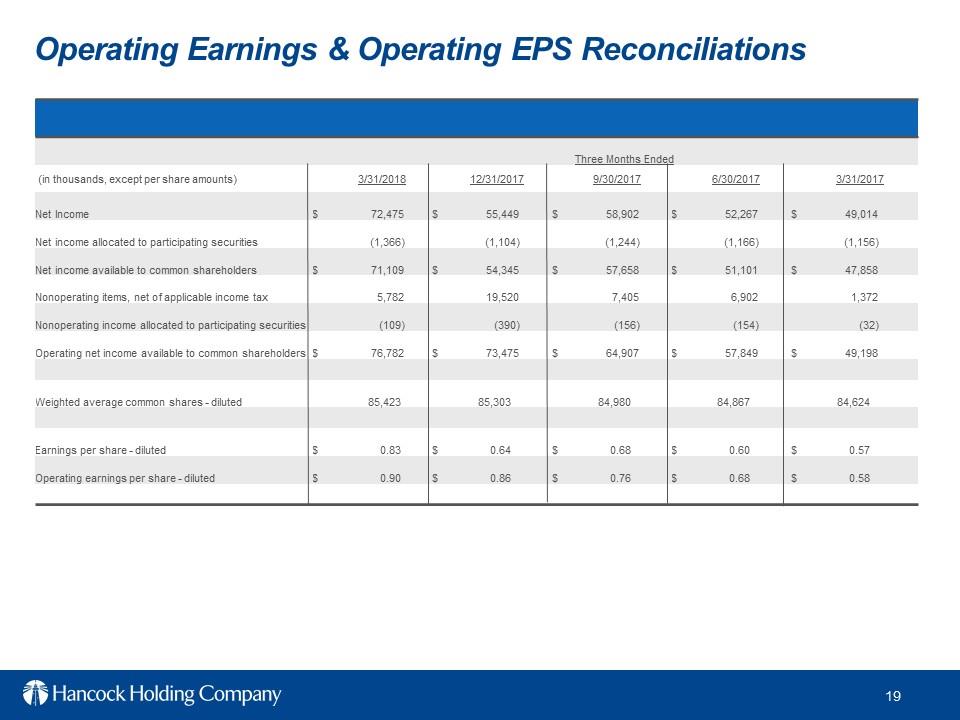
Operating Earnings & Operating EPS Reconciliations Three Months Ended (in thousands, except per share amounts) 3/31/2018 12/31/2017 9/30/2017 6/30/2017 3/31/2017 Net Income $72,475 $55,449 $58,902 $52,267 $49,014 Net income allocated to participating securities (1,366) (1,104) (1,244) (1,166) (1,156) Net income available to common shareholders $71,109 $54,345 $57,658 $51,101 $47,858 Nonoperating items, net of applicable income tax 5,782 19,520 7,405 6,902 1,372 Nonoperating income allocated to participating securities (109) (390) (156) (154) (32) Operating net income available to common shareholders $76,782 $73,475 $64,907 $57,849 $49,198 Weighted average common shares –diluted 85,423 85,303 84,980 84,867 84,624 Earnings per share –diluted $0.83 $0.64 $0.68 $0.60 $0.57 Operating earnings per share –diluted $0.90 $0.86 $0.76 $0.68 $0.58
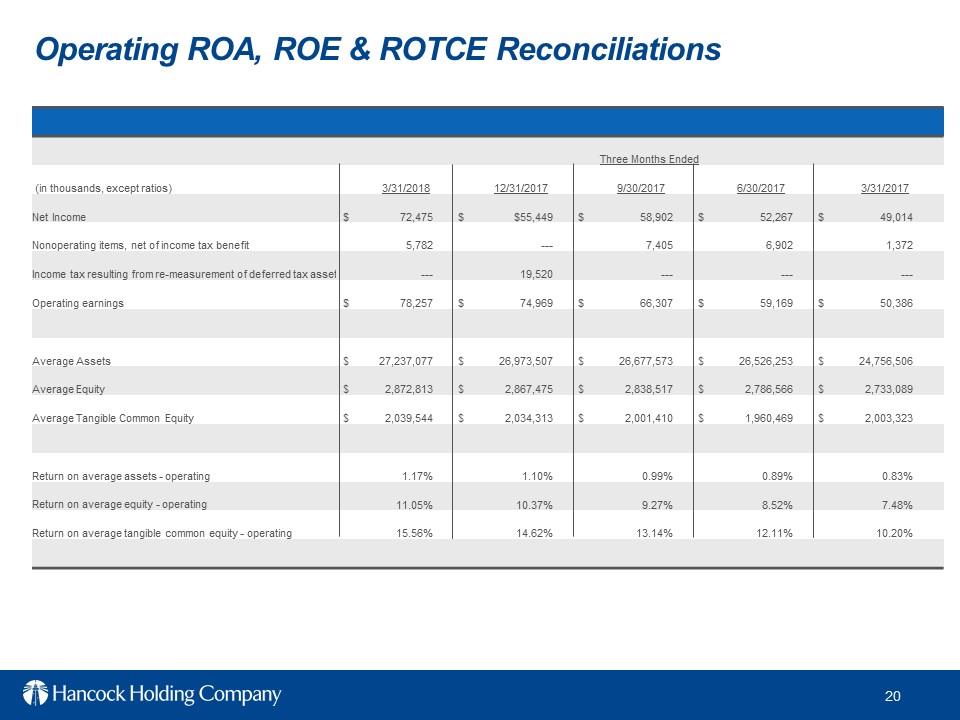
Operating ROA, ROE & ROTCE Reconciliations Three Months Ended (in thousands, except ratios) 3/31/2018 12/31/2017 9/30/2017 6/30/2017 3/31/2017 Net Income $72,475 $$55,449 $58,902 $52,267 $49,014 Nonoperating items, net of income tax benefit 5,782 7,405 6,902 1,372 Income tax resulting from re-measurement of deferred tax asset 19,520 Operating earnings $78,257 $74,969 $66,307 $59,169 $50,386 Average Assets $27,237,077 $26,973,507 $26,677,573 $26,526,253 $24,756,506 Average Equity $2,872,813 $2,867,475 $2,838,517 $2,786,566 $2,733,089 Average Tangible Common Equity $2,039,544 $2,034,313 $2,001,410 $1,960,469 $2,003,323 Return on average assets –operating 1.17% 1.10% 0.99% 0.89% 0.83% Return on average equity –operating 11.05% 10.37% 9.27% 8.52% 7.48% Return on average tangible common equity –operating 15.56% 14.62% 13.14% 12.11% 10.20%
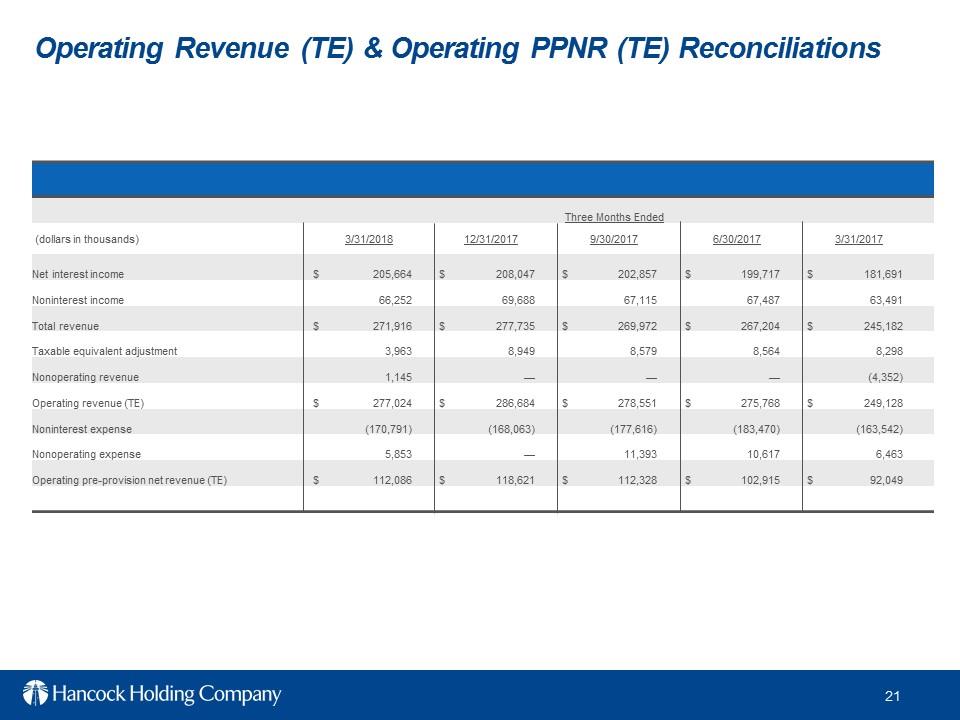
Operating Revenue (TE) & Operating PPNR (TE) Reconciliations Three Months Ended (dollars in thousands) 3/31/2018 12/31/2017 9/30/2017 6/30/2017 3/31/2017 Net interest income $205,664 $208,047 $202,857 $199,717 $181,691 Noninterest income 66,252 69,688 67,115 67,487 63,491 Total revenue $271,916 $277,735 $269,972 $267,204 $245,182 Taxable equivalent adjustment 3,963 8,949 8,579 8,564 8,298 Nonoperating revenue 1,145 (4,352) Operating revenue (TE) $277,024 $286,684 $278,551 $275,768 $249,128 Noninterest expense (170,791) (168,063) (177,616) (183,470) (163,542) Nonoperating expense 5,853 11,393 10,617 6,463 Operating pre-provision net revenue (TE) $112,086 $118,621 $112,328 $102,915 $92,049
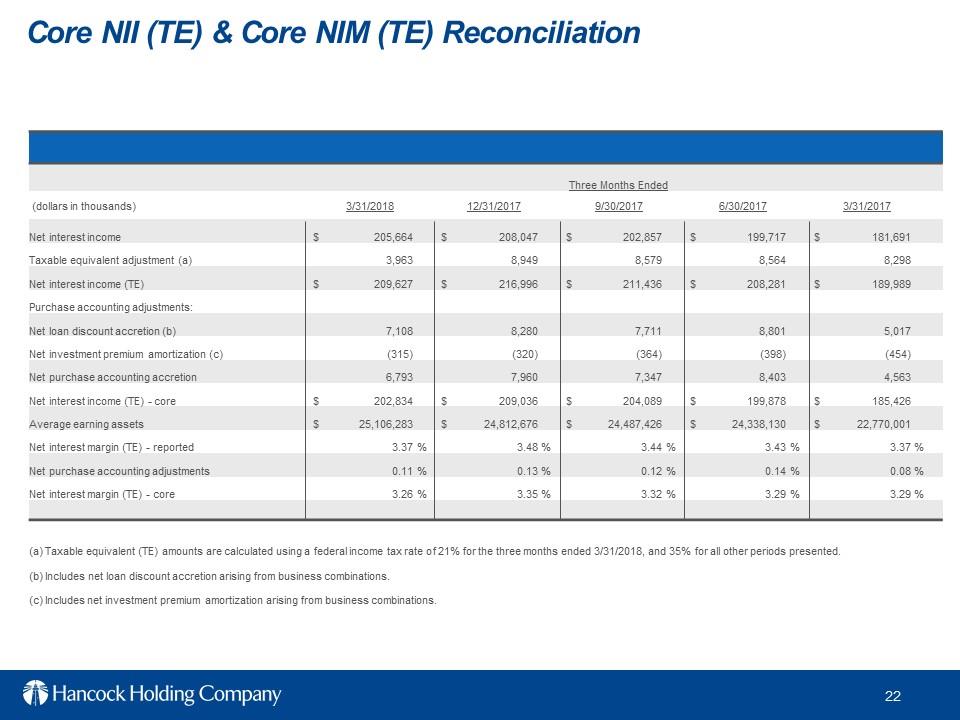
Core NII (TE) & Core NIM (TE) Reconciliation Three Months Ended (dollars in thousands) 3/31/2018 12/31/2017 9/30/2017 6/30/2017 3/31/2017 Net interest income $205,664 $208,047 $202,857 $199,717 $181,691 Taxable equivalent adjustment (a) 3,963 8,949 8,579 8,564 8,298 Net interest income (TE) $209,627 $216,996 $211,436 $208,281 $189,989 Purchase accounting adjustments: Net loan discount accretion (b) 7,108 8,280 7,711 8,801 5,017 Net investment premium amortization (c) (315) (320) (364) (398) (454) Net purchase accounting accretion 6,793 7,960 7,347 8,403 4,563 Net interest income (TE) –core $202,834 $209,036 $204,089 $199,878 $185,426 Average earning assets $25,106,283 $24,812,676 $24,487,426 $24,338,130 $22,770,001 Net interest margin (TE) –reported 3.37% 3.48% 3.44% 3.43% 3.37% Net purchase accounting adjustments 0.11% 0.13% 0.12% 0.14% 0.08% Net interest margin (TE) –core 3.26% 3.35% 3.32% 3.29% 3.29% (a) Taxable equivalent (TE) amounts are calculated using a federal income tax rate of 21% for the three months ended 3/31/2018, and 35% for all other periods presented (b) Includes net loan discount accretion arising from business combinations (c) Includes net investment premium amortization arising from business combinations
Appendix
Sale of Harrison Finance Announced the sale of Hancock’s consumer finance company (Harrison Finance) line of business on February 22, 2018 The transaction closed March 9, 2018 Loans totaled $95 million at year-end 2017 Operated 35 branches with 137 FTE employees in LA, MS, AL & FL Loss on sale totaled $1.1 million in 1Q18 Impact on NIM -2 bps in first quarter 2018; full quarter impact of sale -7 bps Impact on loan yield -3 bps in first quarter 2018; full quarter impact of sale -10 bps Change in overall corporate strategy led to divestiture of business Historical profitability had been breakeven to a slight quarterly loss, therefore immediately accretive to earnings
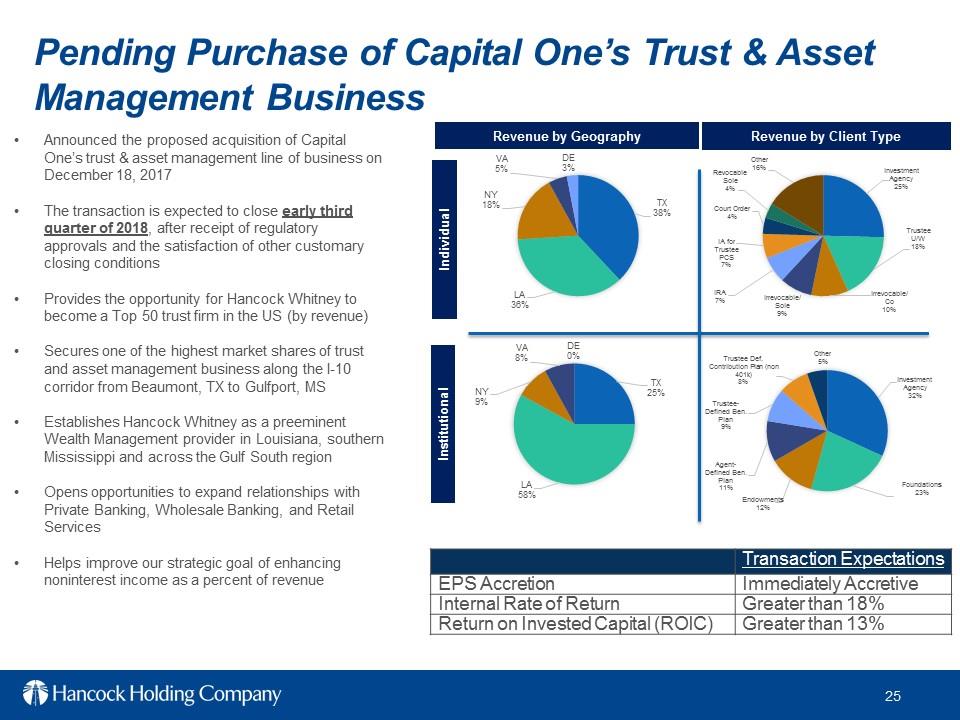
Pending Purchase of Capital One’s Trust & Asset Management Business Announced the proposed acquisition of Capital One’s trust & asset management line of business on December 18, 2017 The transaction is expected to close early third quarter of 2018, after receipt of regulatory approvals and the satisfaction of other customary closing conditions Provides the opportunity for Hancock Whitney to become a Top 50 trust firm in the US (by revenue) Secures one of the highest market shares of trust and asset management business along the I-10 corridor from Beaumont, TX to Gulfport, MS Establishes Hancock Whitney as a preeminent Wealth Management provider in Louisiana, southern Mississippi and across the Gulf South region Opens opportunities to expand relationships with Private Banking, wholesale Banking, and Retail Services Helps improve our strategic goal of enhancing noninterest income as a percent of revenue Transaction Expectations EPS Accretion Immediately Accretive Internal Rate of Return Greater than 18% Return on Invested Capital (ROIC) Greater than 13% Revenue by geography Revenue by Client Type Institutional Individual TX 38% LA 36% NY 18% VA 5% DE 3% Investment Agency 25% Trustee U/W 18% Irrevocable/Co 10% Irrevocable/Sole 9% IRA 7% IA for Trustee PCS 7% Court Order 4% Revocable Sole 4% Other 16% TX 25% LA 58% NY 9% VA 8% DE 0% Investment Agency 32% Foundations 23% Endowments 12% Agent-Defined Ben Plan 11% Trustee-Defined Ben Plan 9% Trustee Def. Contribution Plan (non 401k) 8% Other5%
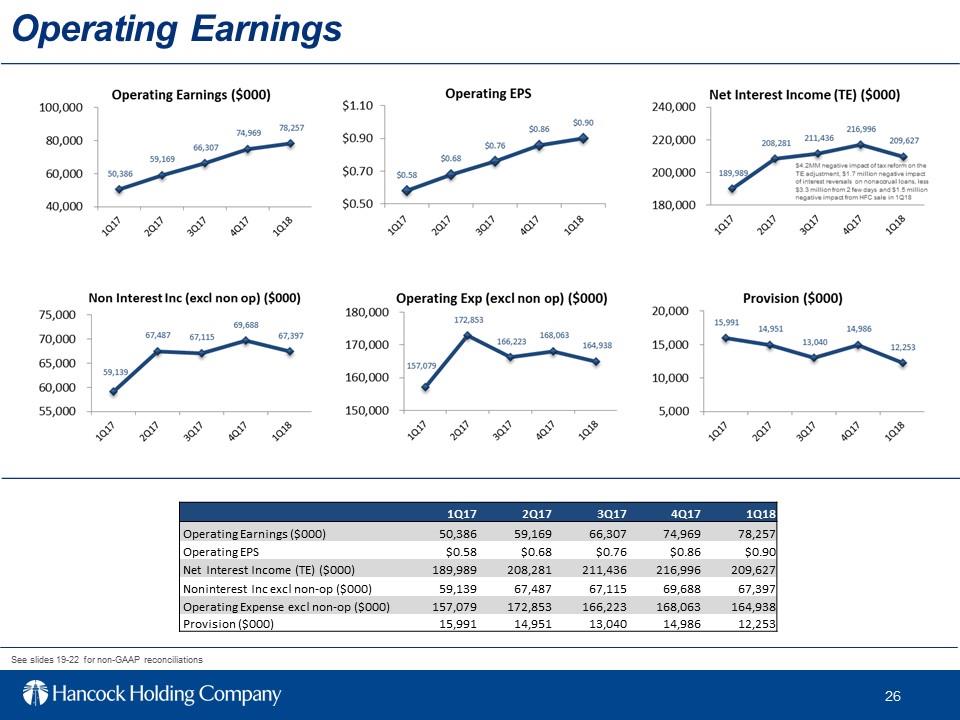
Operating Earnings See slides 19-22 for non-GAAP reconciliations 1Q17 2Q17 3Q17 4Q17 1Q18 Operating Earnings ($000) 50,386 59,169 66,307 74,969 78,257 Operating EPS $0.58 $0.68 $0.76 $0.86 $0.90 Net Interest Income (TE) ($000) 189,989 208,281 211,436 216,996 209,627 Noninterest Inc excl non-op ($000) 59,139 67,487 67,115 69,688 67,397 Operating Expense excl non-op ($000) 157,079 172,853 166,223 168,063 164,938 Provision ($000) 15,991 14,951 13,040 14,986 12,253
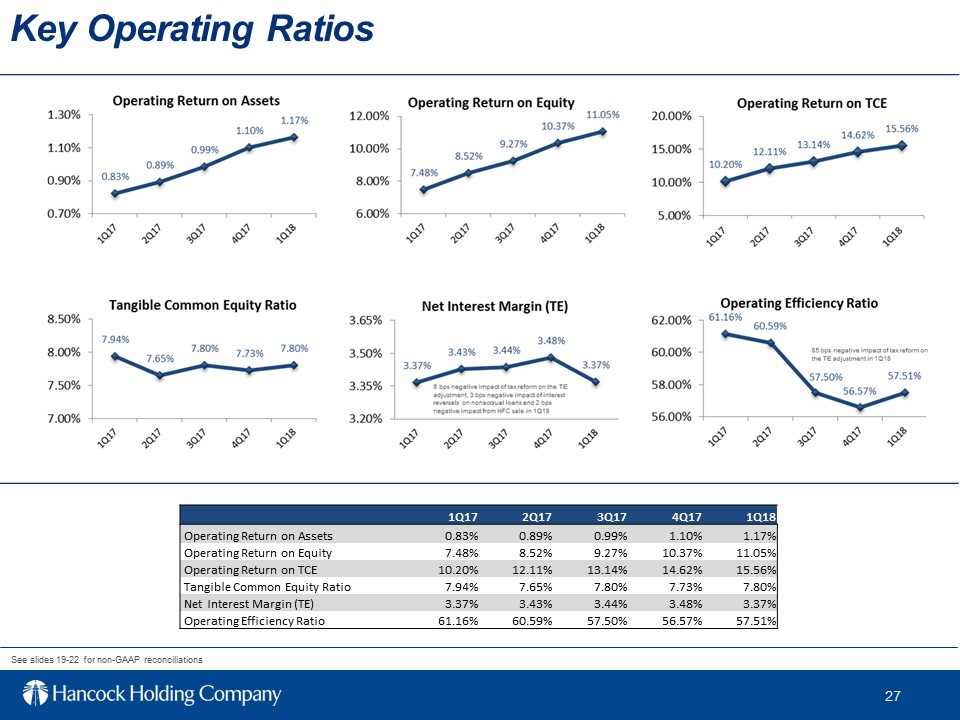
Key Operating Ratios See slides 19-22 for non-GAAP reconciliations 1Q17 2Q17 3Q17 4Q17 1Q18 Operating Return on Assets 0.83% 0.89% 0.99% 1.10% 1.17% Operating Return on Equity 7.48% 8.52% 9.27% 10.37% 11.05% Operating Return on TCE 10.20% 12.11% 13.14% 14.62% 15.56% Tangible Common Equity Ratio 7.94% 7.65% 7.80% 7.73% 7.80% Net Interest Margin (TE) 3.37% 3.43% 3.44% 3.48% 3.37% Operating Efficiency Ratio 61.16% 60.59% 57.50% 56.57% 57.51%
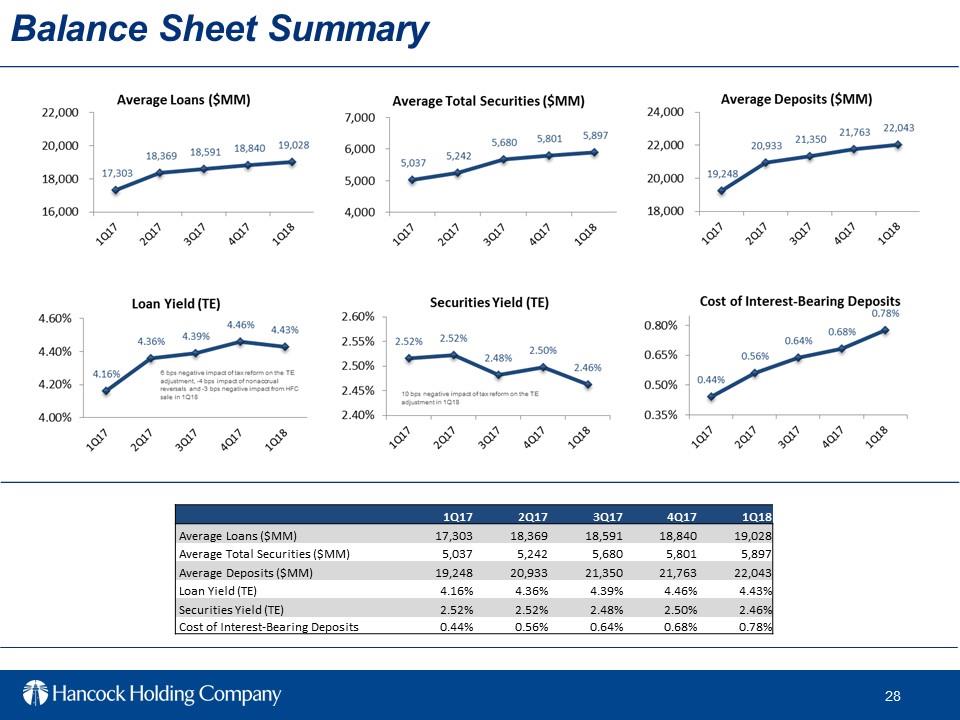
Balance Sheet Summary 1Q17 2Q17 3Q17 4Q17 1Q18 Average Loans ($MM) 17,303 18,369 18,591 18,840 19,028 Average Total Securities ($MM) 5,037 5,242 5,680 5,801 5,897 Average Deposits ($MM) 19,248 20,933 21,350 21,763 22,043 Loan Yield (TE) 4.16% 4.36% 4.39% 4.46% 4.43% Securities Yield (TE) 2.52% 2.52% 2.48% 2.50% 2.46% Cost of Interest-Bearing Deposits 0.44% 0.56% 0.64% 0.68% 0.78%
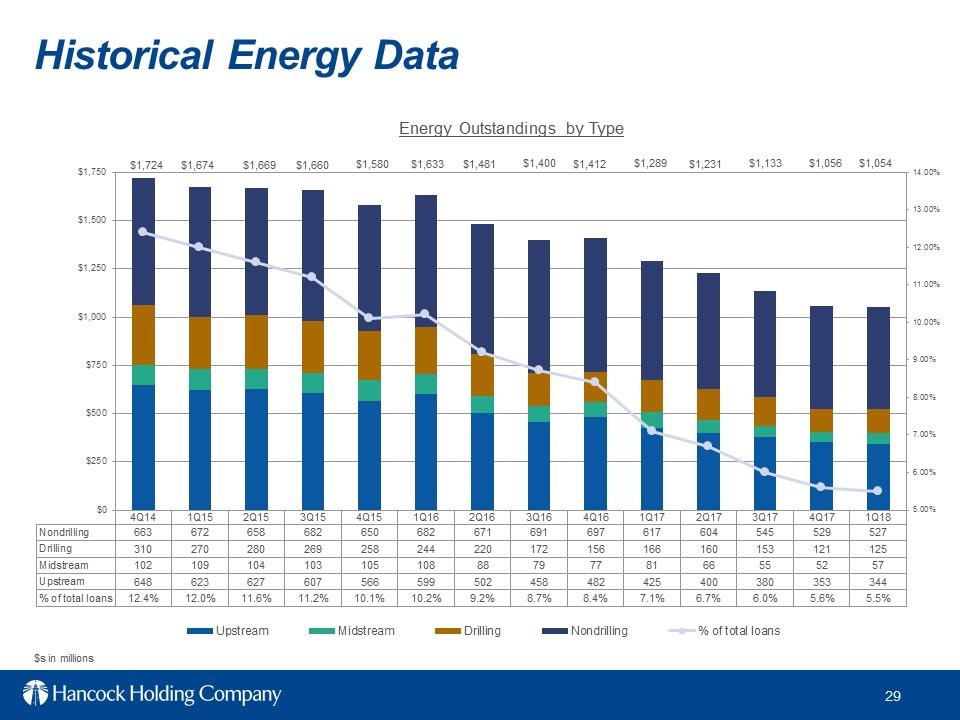
4Q14 1Q15 2Q15 3Q15 4Q15 1Q16 2Q16 3Q16 4Q16 1Q17 2Q17 3Q17 4Q17 1Q18 Nondrilling 663 672 658 682 650 682 671 691 697 617 604 545 529 527 Drilling 310 270 280 269 258 244 220 172 156 166 160 153 121 125 Midstream 102 109 104 103 105 108 88 79 77 81 66 55 52 57 Upstream 648 623 627 607 566 599 502 458 482 425 400 380 353 344 % of total loans 12.4% 12.0% 11.6% 11.2% 10.1% 10.2% 9.2% 8.7% 8.4% 7.1% 6.7% 6.0% 5.6% 5.5% 5.00% 6.00% 7.00% 8.00% 9.00% 10.00% 11.00% 12.00% 13.00% 14.00% $0 $250 $500 $750 $1,000 $1,250 $1,500 $1,750 Upstream Midstream Drilling Nondrilling % of total loans Historical Energy Data $s in millions Energy Outstandings by Type $1,724 $1,674 $1,669 $1,660 $1,580 $1,633 $1,231 $1,400 $1,412 $1,481 $1,289 $1,133 $1,056 $1,054
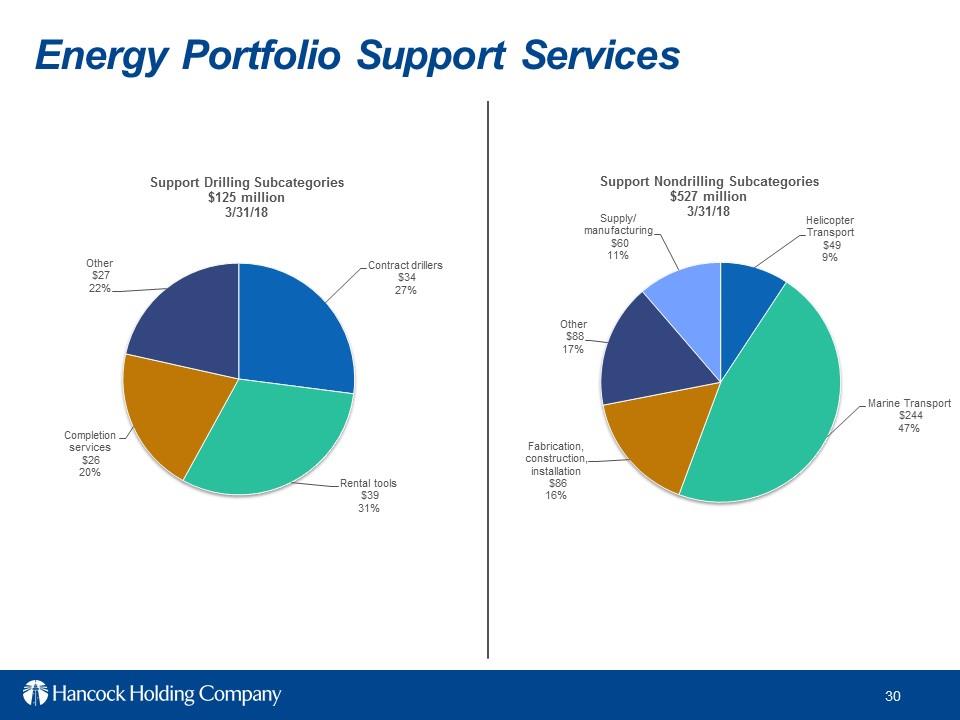
Energy Portfolio Support Services Contract drillers$34 27% Rental tools$39 31% Completion services$26 20% other $27 22% Support Drilling Subcategories $125 million 3/31/18 Helicopter Transport$49 9% Marine Transport $244 47% Fabrication, construction, installation$86 16% other $88 17% Supply manufacturing$60 11% Support Nondrilling Subcategories $527 million 3/31/18
Glossary of Terms. IRR–Interest rate risk .Linked-quarter (LQ)–current quarter compared to previous quarter. Loan Mark–Fair value discount on loans acquired in a business combination. LOB–Line of Business .LPO –Loan production office. LQA–Linked-quarter annualized .M&A –Mergers and acquisitions
.NII –Net interest income .NIM–Net interest margin .NPA –Nonperforming assets .O&G–Oil and gas
.Operating–Net income excluding nonoperating items .ORE–Other real estate .PAA–Purchase accounting adjustments from business combinations; including loan accretion, offset by any amortization of a bond portfolio premium, amortization of an indemnification asset and amortization of intangibles .PPNR–Pre-provision net revenue .RBL–Reserve-based lending .ROA–Return on average assets .RR–Risk rating .SBIC–Small Business Investment Company .SNC–Shared National Credit .TCE –Tangible common equity ratio (common shareholders’ equity less intangible assets divided by total assets less intangible assets)
.TCJA–Tax Cuts and Jobs Act .TDR–Troubled Debt Restructuring .TE–Taxable equivalent (calculated using the current statutory federal tax rate) .Y-o-Y–Year over year .1Q17–First Quarter of 2017 .1Q18–First Quarter of 2018 .2Q18–Second Quarter of 2018 .4Q17–Fourth Quarter of 2017 .4Q18–Fourth Quarter of 2018 .AFS–Available for sale securities .ALLL–Allowance for loan and lease losses .Annualized–Calculated to reflect a rate based on a full year .CDI–Core Deposit Intangible .Core–Excluding purchase accounting items and nonoperating items .Core NIM –Reported net interest income (TE) excluding total net purchase accounting adjustments, annualized, as a percent of average earning assets. Core Revenue –Net interest income (TE) plus noninterest income excluding purchase accounting adjustments and nonoperating items for both categories .CSO–Corporate strategic objective .Current Energy Cycle–Refers to the energy cycle beginning in November of 2014 through the most recent quarter end .DDA–Noninterest-bearing demands deposit accounts .DTA–Deferred Tax Asset .E&P–Exploration and Production (Oil & Gas) .Efficiency ratio –noninterest expense to total net interest (TE) and noninterest income, excluding amortization of purchased intangibles and nonoperating items .EOP–End of period
.EPS–Earnings per share .FNBC I–Acquired selected assets & liabilities from FNBC .FNBC II–Acquired selected assets & liabilities of FNBC from FDIC .FTE–full time equivalent .HFC–Harrison Finance Company (consumer finance company sold 3/9/18) .HTM–Held to maturity securities

4/18/2018 First Quarter 2018Earnings Conference Call
4/18/2018 First Quarter 2018Earnings Conference Call