Attached files
| file | filename |
|---|---|
| EX-99.2 - EX-99.2 - GALECTIN THERAPEUTICS INC | d566596dex992.htm |
| 8-K - FORM 8-K - GALECTIN THERAPEUTICS INC | d566596d8k.htm |
A multicenter, randomized, double-blind, placebo-controlled trial of Galectin-3 inhibitor (GR-MD-02) for one year in patients with NASH cirrhosis and portal hypertension The NASH-CX Trial 1Naga Chalasani, 2Guadalupe Garcia-Tsao, 3Zachary Goodman, 4Eric Lawitz, 5Manal Abdelmalek, 6Mary Rinella, 7Michael Ryan, 8Mazen Noureddin, 9Christopher Jue, 1Maxmillan Pyko, 10Adam Allgood, 10Harold Shlevin, 10Rex Horton, 10Eliezer Zomer, 10Peter G. Traber, 11Rohit Loomba, 12Brent Neuschwander-Tetri, 13Arun Sanyal, 14Stephen A Harrison 1Indiana University, Indianapolis, IN, 2Yale University, New Haven, CT, 3INOVA Fairfax Hospital, Fairfax, VA, 4Texas Liver Institute, San Antonio, TX, 5Duke University, Durham, NC, 6Northwestern University, Chicago, IL, 7Digestive and Liver Disease Specialists, Norfolk, VA, 8Cedars Sinai Medical Center, Los Angeles, CA, 9Digestive Health Specialists, Winston-Salem, NC, 10Galectin Therapeutics, Norcross, GA, 11UCSD, San Diego, CA, 12St. Louis University, St. Louis, MO, 13VCU, Richmond, VA, 14Pinnacle Clinical Research, San Antonio, TX Exhibit 99.1
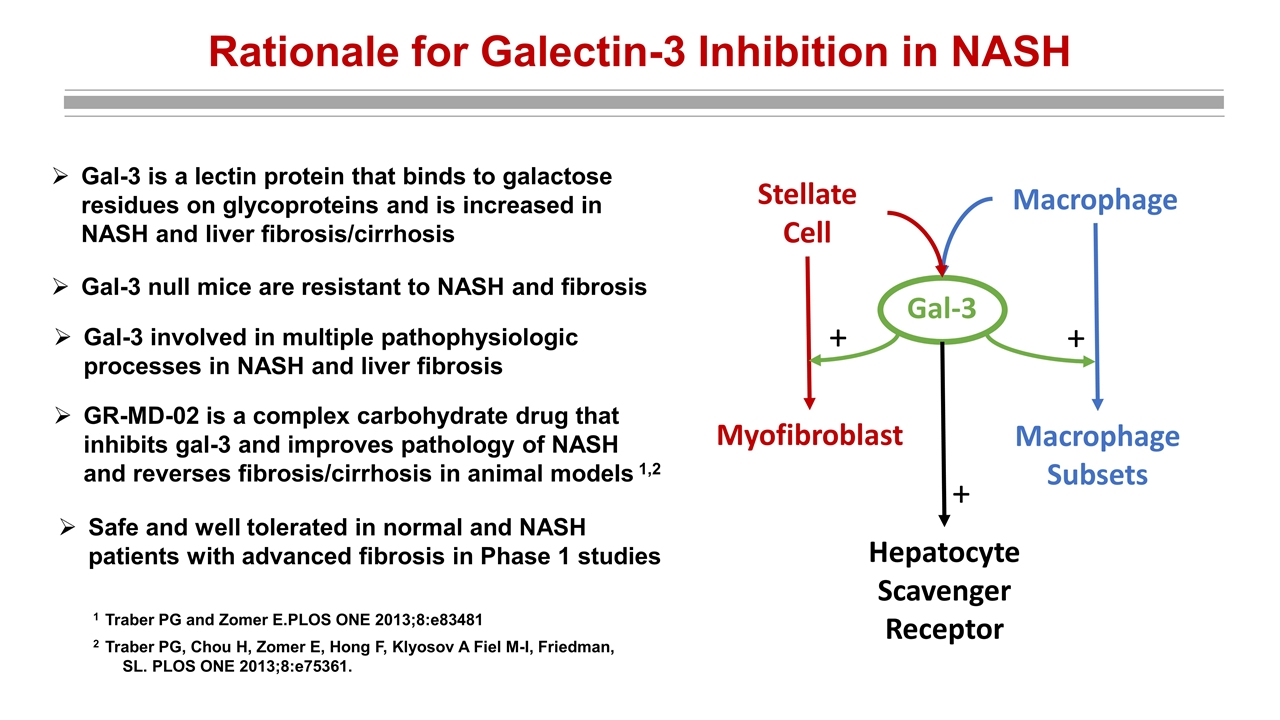
Rationale for Galectin-3 Inhibition in NASH Gal-3 is a lectin protein that binds to galactose residues on glycoproteins and is increased in NASH and liver fibrosis/cirrhosis Gal-3 null mice are resistant to NASH and fibrosis Gal-3 Stellate Cell Macrophage Myofibroblast Macrophage Subsets Hepatocyte Scavenger Receptor + + + 1 Traber PG and Zomer E.PLOS ONE 2013;8:e83481 2 Traber PG, Chou H, Zomer E, Hong F, Klyosov A Fiel M-I, Friedman, SL. PLOS ONE 2013;8:e75361. Gal-3 involved in multiple pathophysiologic processes in NASH and liver fibrosis GR-MD-02 is a complex carbohydrate drug that inhibits gal-3 and improves pathology of NASH and reverses fibrosis/cirrhosis in animal models 1,2 Safe and well tolerated in normal and NASH patients with advanced fibrosis in Phase 1 studies
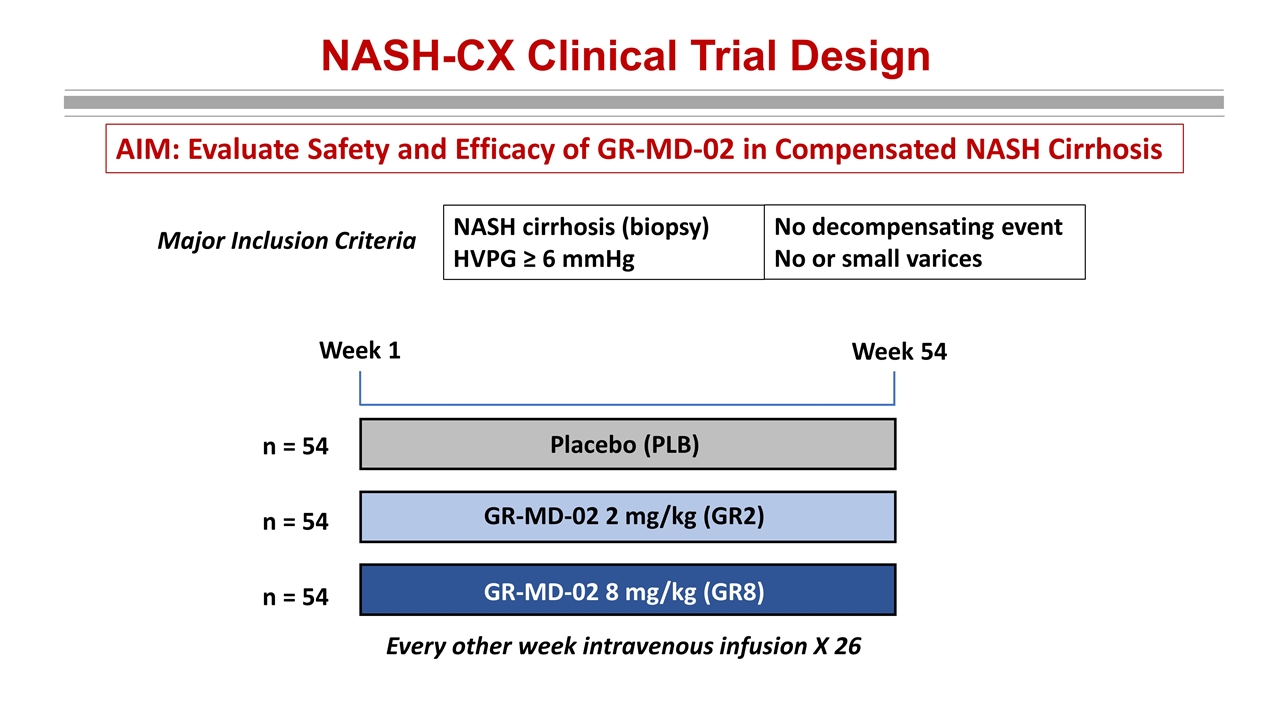
NASH-CX Clinical Trial Design NASH cirrhosis (biopsy) HVPG ≥ 6 mmHg Major Inclusion Criteria No decompensating event No or small varices Every other week intravenous infusion X 26 Placebo (PLB) GR-MD-02 2 mg/kg (GR2) GR-MD-02 8 mg/kg (GR8) Week 1 Week 54 n = 54 n = 54 n = 54 AIM: Evaluate Safety and Efficacy of GR-MD-02 in Compensated NASH Cirrhosis
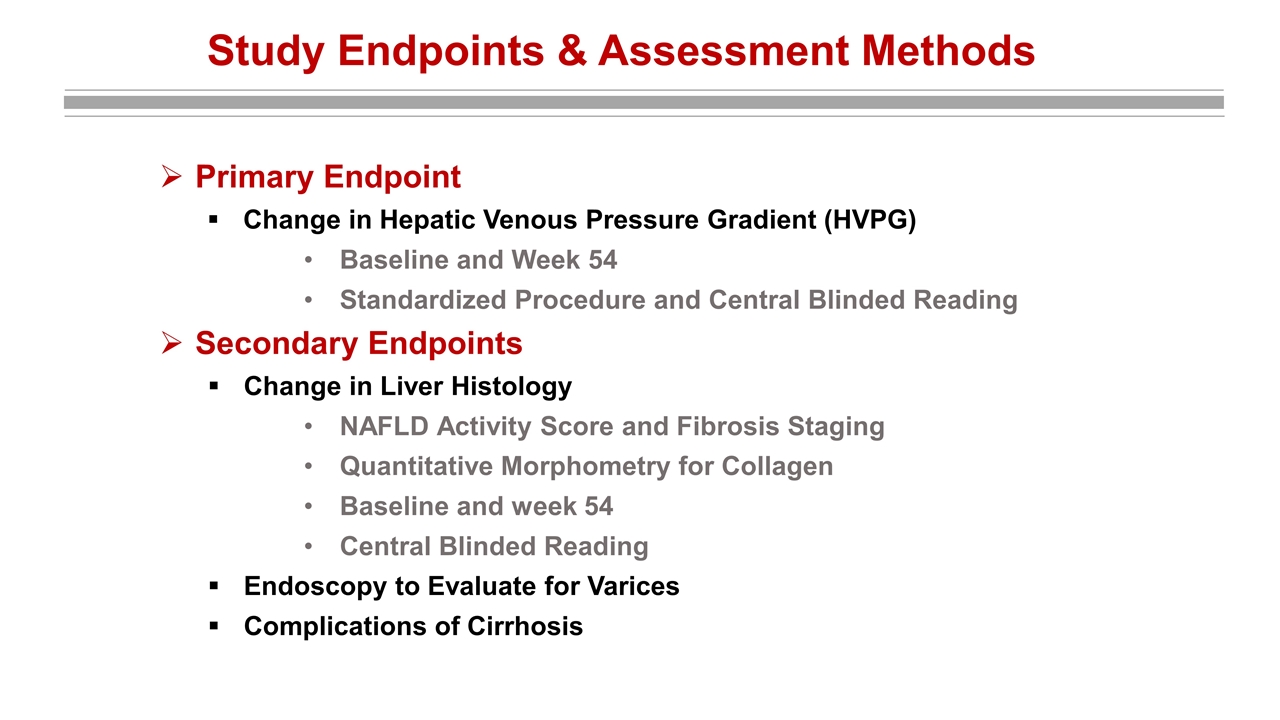
Study Endpoints & Assessment Methods Primary Endpoint Change in Hepatic Venous Pressure Gradient (HVPG) Baseline and Week 54 Standardized Procedure and Central Blinded Reading Secondary Endpoints Change in Liver Histology NAFLD Activity Score and Fibrosis Staging Quantitative Morphometry for Collagen Baseline and week 54 Central Blinded Reading Endoscopy to Evaluate for Varices Complications of Cirrhosis
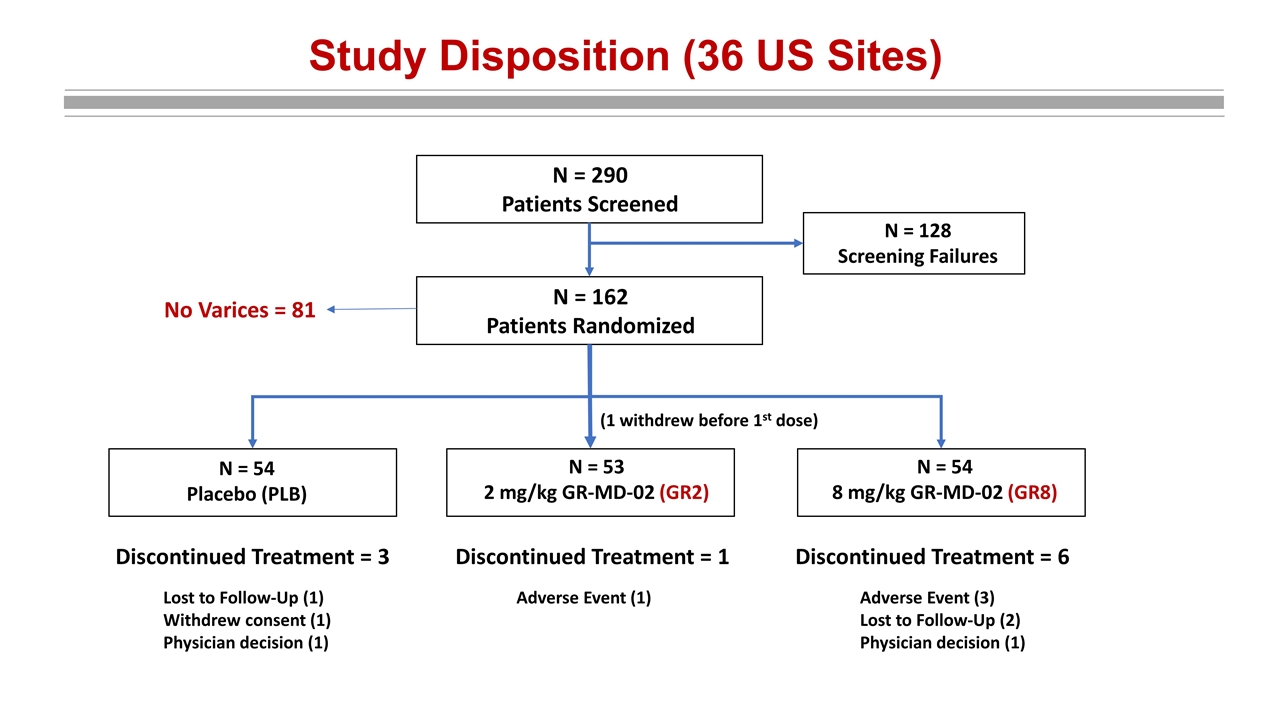
Study Disposition (36 US Sites) N = 290 Patients Screened N = 128 Screening Failures N = 162 Patients Randomized N = 54 Placebo (PLB) N = 53 2 mg/kg GR-MD-02 (GR2) N = 54 8 mg/kg GR-MD-02 (GR8) (1 withdrew before 1st dose) No Varices = 81 Discontinued Treatment = 3 Discontinued Treatment = 1 Discontinued Treatment = 6 Lost to Follow-Up (1) Withdrew consent (1) Physician decision (1) Adverse Event (1) Adverse Event (3) Lost to Follow-Up (2) Physician decision (1)
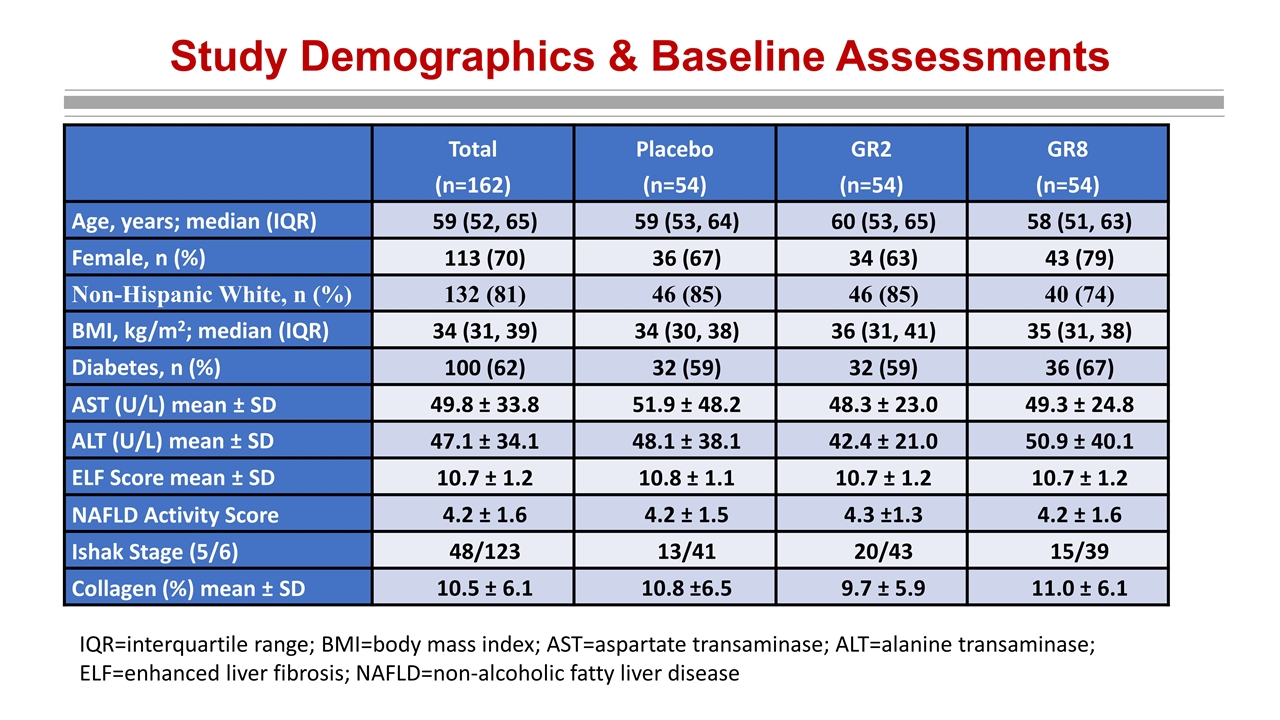
Study Demographics & Baseline Assessments Total (n=162) Placebo (n=54) GR2 (n=54) GR8 (n=54) Age, years; median (IQR) 59 (52, 65) 59 (53, 64) 60 (53, 65) 58 (51, 63) Female, n (%) 113 (70) 36 (67) 34 (63) 43 (79) Non-Hispanic White, n (%) 132 (81) 46 (85) 46 (85) 40 (74) BMI, kg/m2; median (IQR) 34 (31, 39) 34 (30, 38) 36 (31, 41) 35 (31, 38) Diabetes, n (%) 100 (62) 32 (59) 32 (59) 36 (67) AST (U/L) mean ± SD 49.8 ± 33.8 51.9 ± 48.2 48.3 ± 23.0 49.3 ± 24.8 ALT (U/L) mean ± SD 47.1 ± 34.1 48.1 ± 38.1 42.4 ± 21.0 50.9 ± 40.1 ELF Score mean ± SD 10.7 ± 1.2 10.8 ± 1.1 10.7 ± 1.2 10.7 ± 1.2 NAFLD Activity Score 4.2 ± 1.6 4.2 ± 1.5 4.3 ±1.3 4.2 ± 1.6 Ishak Stage (5/6) 48/123 13/41 20/43 15/39 Collagen (%) mean ± SD 10.5 ± 6.1 10.8 ±6.5 9.7 ± 5.9 11.0 ± 6.1 IQR=interquartile range; BMI=body mass index; AST=aspartate transaminase; ALT=alanine transaminase; ELF=enhanced liver fibrosis; NAFLD=non-alcoholic fatty liver disease
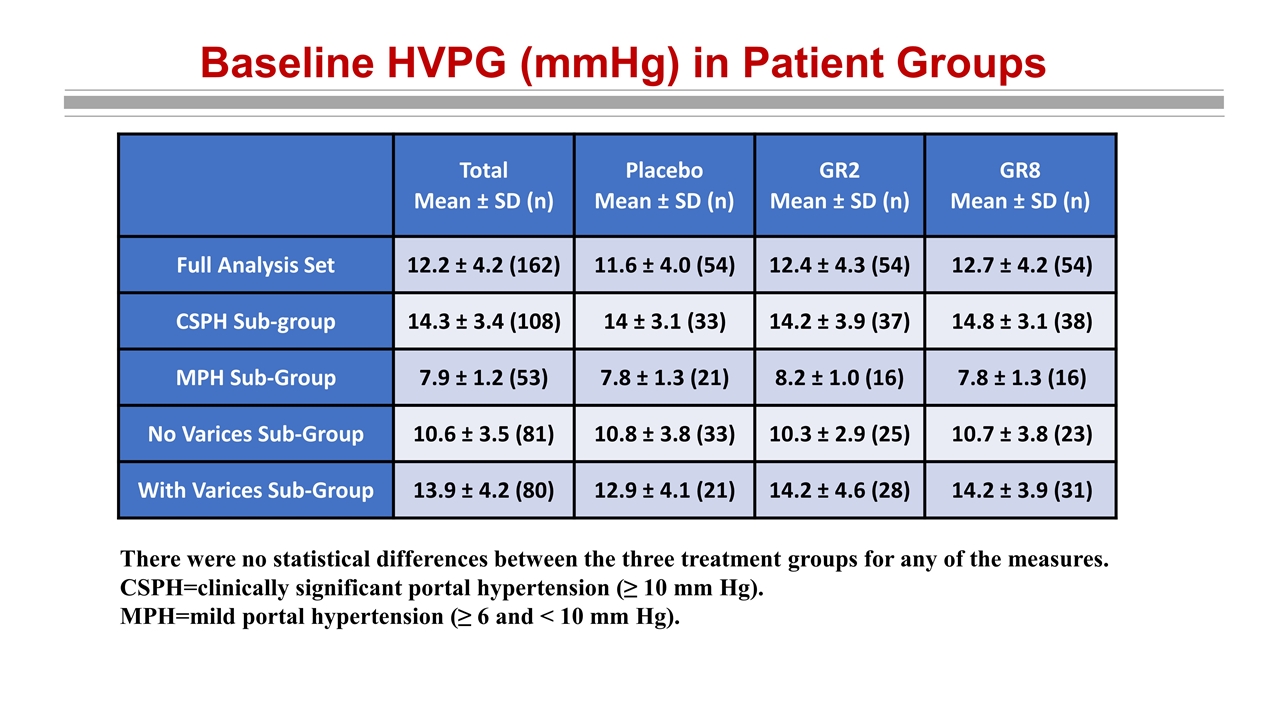
Baseline HVPG (mmHg) in Patient Groups There were no statistical differences between the three treatment groups for any of the measures. CSPH=clinically significant portal hypertension (≥ 10 mm Hg). MPH=mild portal hypertension (≥ 6 and < 10 mm Hg). Total Mean ± SD (n) Placebo Mean ± SD (n) GR2 Mean ± SD (n) GR8 Mean ± SD (n) Full Analysis Set 12.2 ± 4.2 (162) 11.6 ± 4.0 (54) 12.4 ± 4.3 (54) 12.7 ± 4.2 (54) CSPH Sub-group 14.3 ± 3.4 (108) 14 ± 3.1 (33) 14.2 ± 3.9 (37) 14.8 ± 3.1 (38) MPH Sub-Group 7.9 ± 1.2 (53) 7.8 ± 1.3 (21) 8.2 ± 1.0 (16) 7.8 ± 1.3 (16) No Varices Sub-Group 10.6 ± 3.5 (81) 10.8 ± 3.8 (33) 10.3 ± 2.9 (25) 10.7 ± 3.8 (23) With Varices Sub-Group 13.9 ± 4.2 (80) 12.9 ± 4.1 (21) 14.2 ± 4.6 (28) 14.2 ± 3.9 (31)
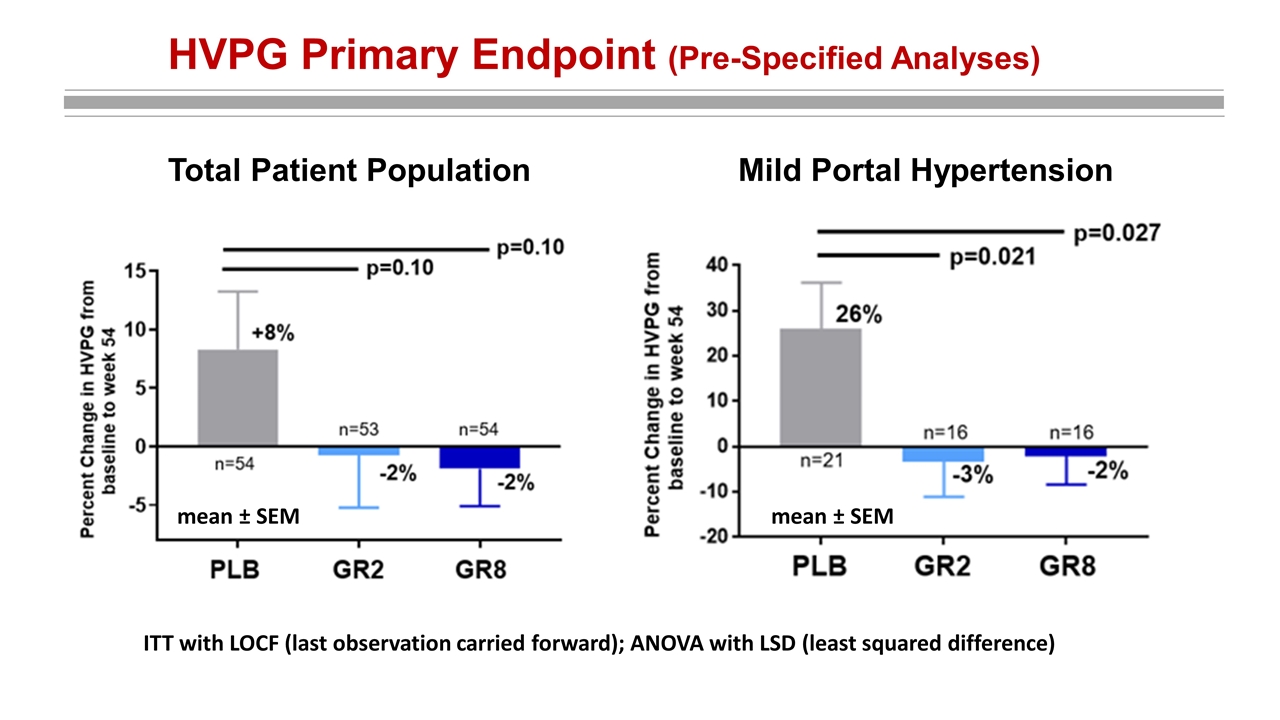
HVPG Primary Endpoint (Pre-Specified Analyses) mean ± SEM Mild Portal Hypertension mean ± SEM Total Patient Population ITT with LOCF (last observation carried forward); ANOVA with LSD (least squared difference) mean ± SEM
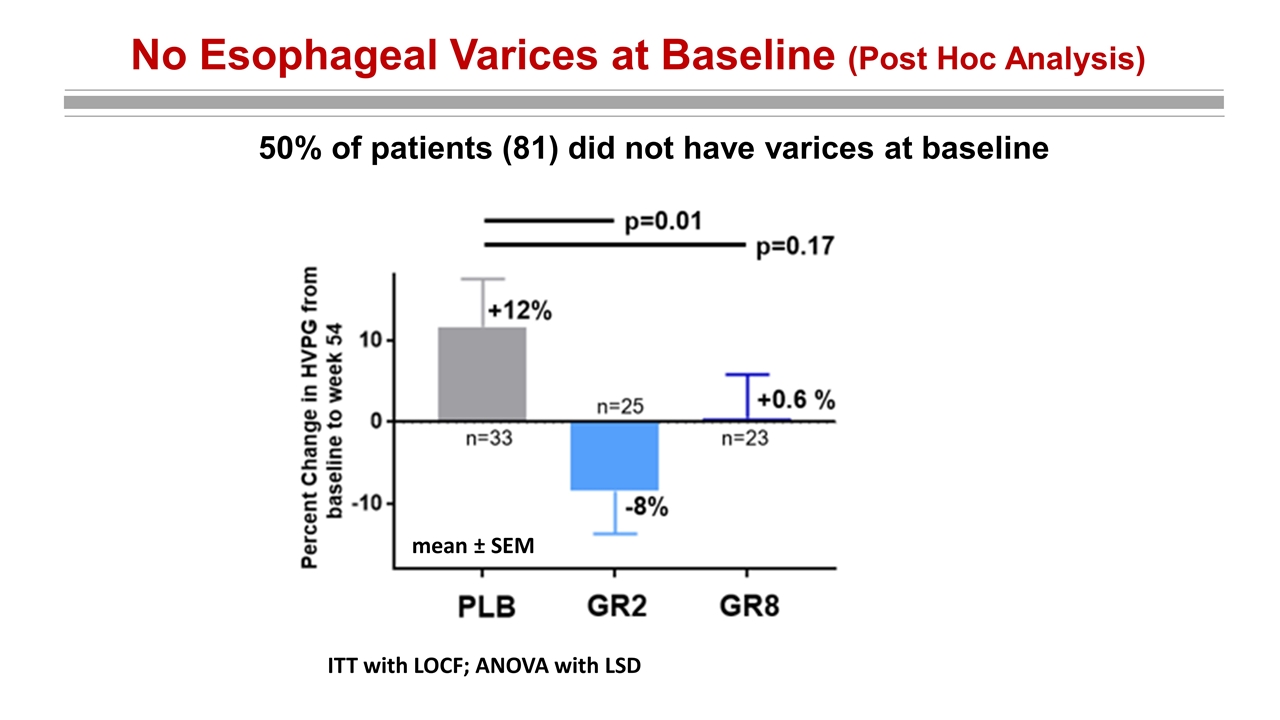
No Esophageal Varices at Baseline (Post Hoc Analysis) mean ± SEM ITT with LOCF; ANOVA with LSD 50% of patients (81) did not have varices at baseline
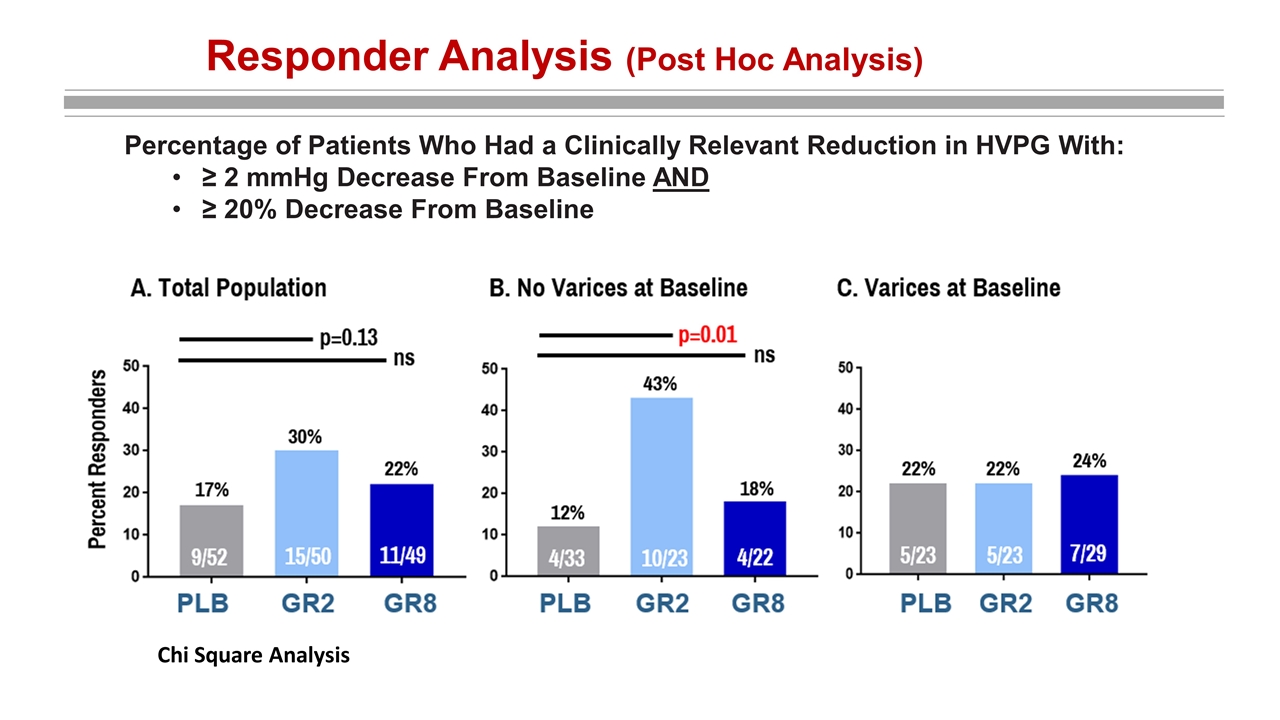
Responder Analysis (Post Hoc Analysis) Percentage of Patients Who Had a Clinically Relevant Reduction in HVPG With: ≥ 2 mmHg Decrease From Baseline AND ≥ 20% Decrease From Baseline Chi Square Analysis
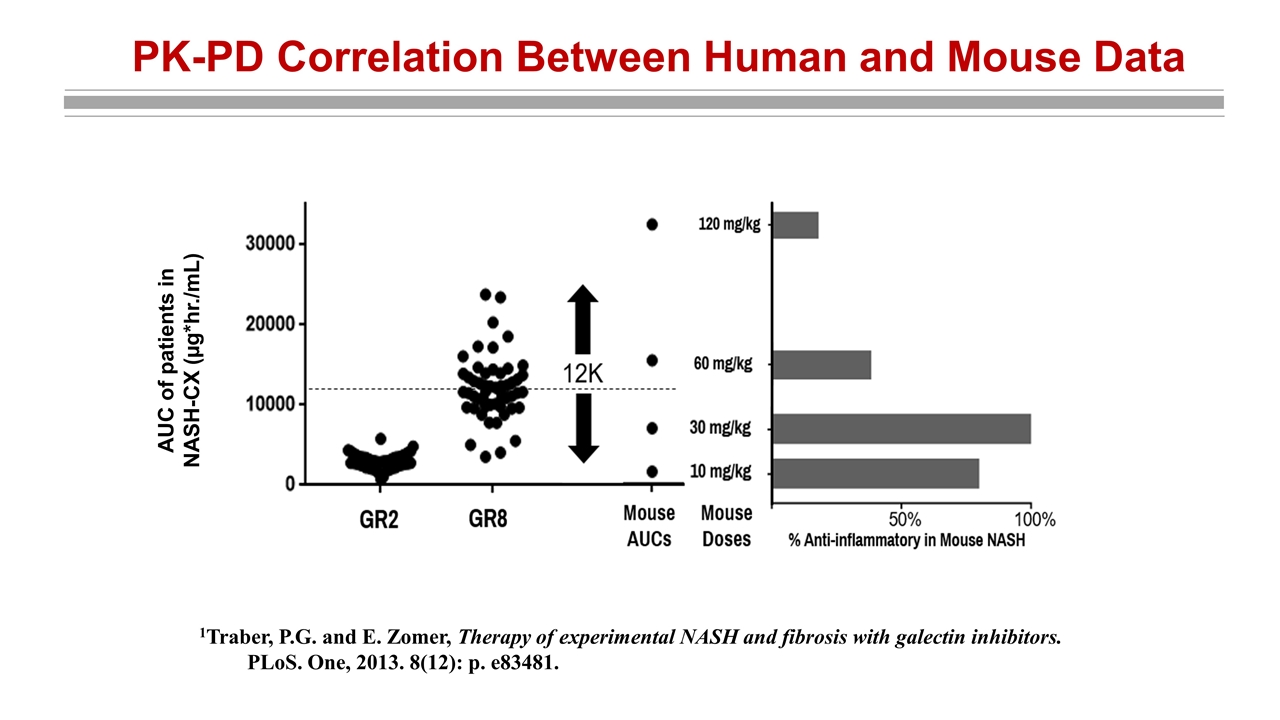
PK-PD Correlation Between Human and Mouse Data 1Traber, P.G. and E. Zomer, Therapy of experimental NASH and fibrosis with galectin inhibitors. PLoS. One, 2013. 8(12): p. e83481. AUC of patients in NASH-CX (µg*hr./mL)
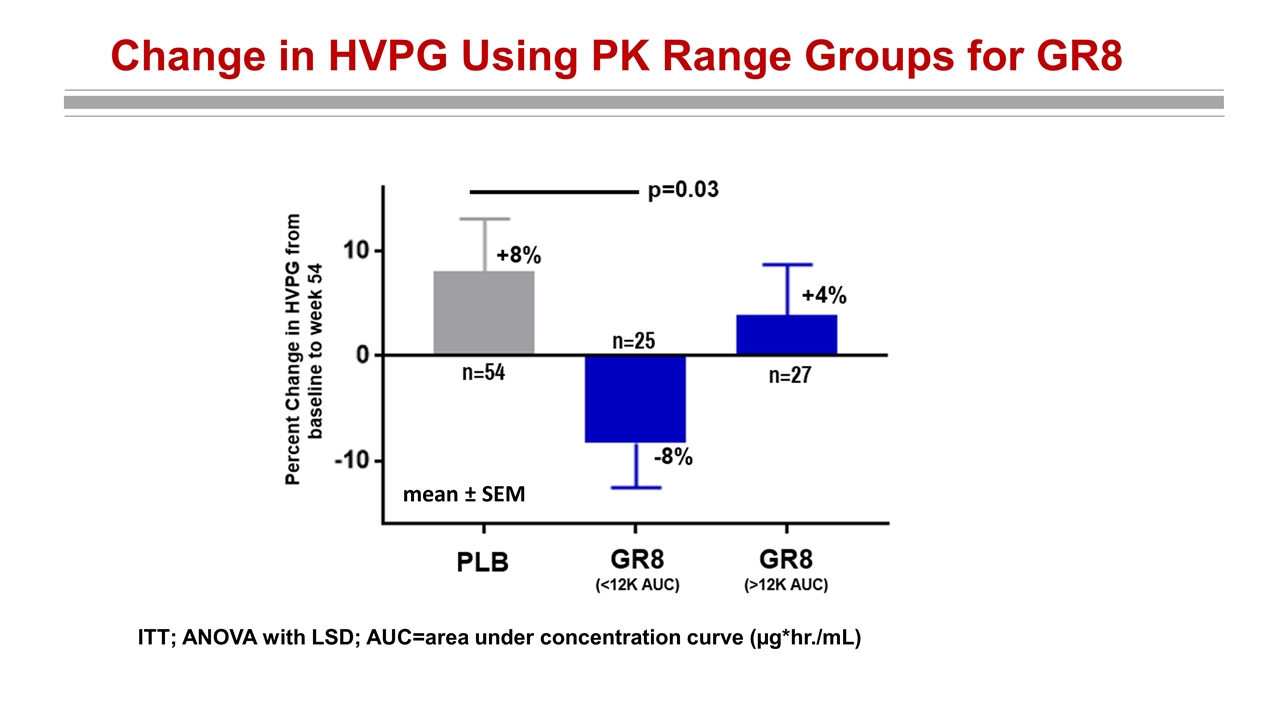
Change in HVPG Using PK Range Groups for GR8 mean ± SEM ITT; ANOVA with LSD; AUC=area under concentration curve (µg*hr./mL)
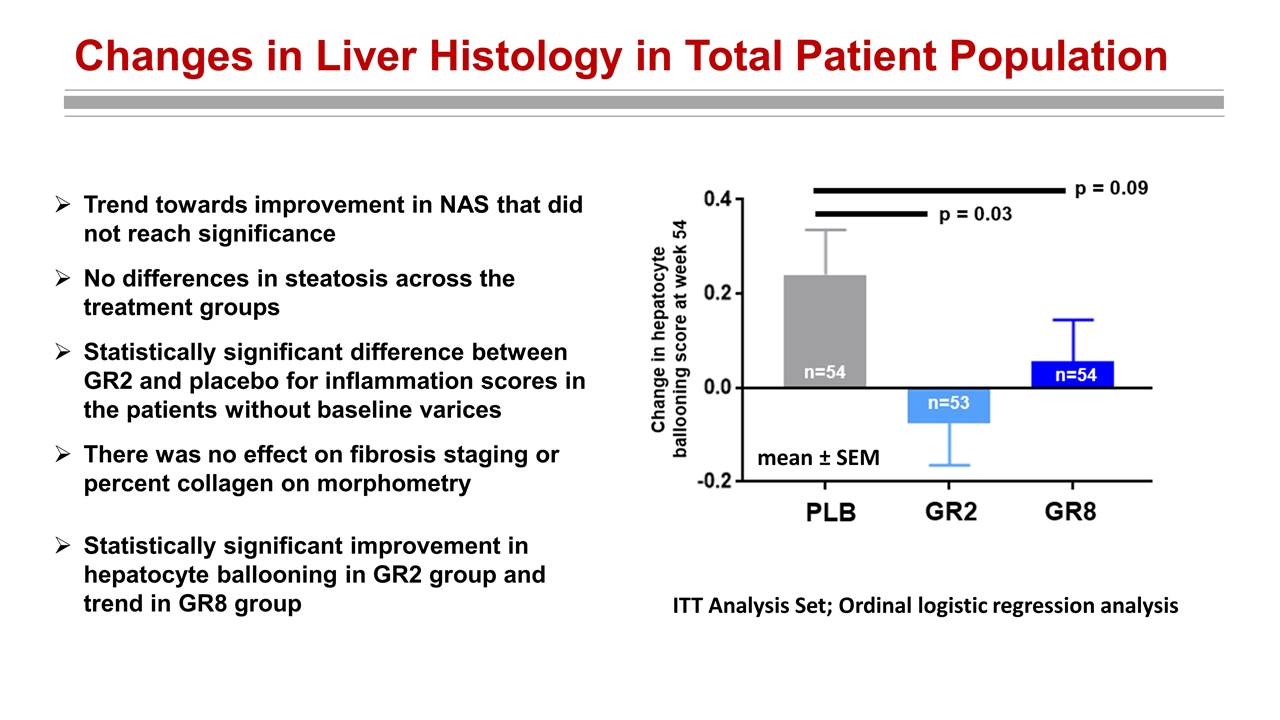
Changes in Liver Histology in Total Patient Population Trend towards improvement in NAS that did not reach significance No differences in steatosis across the treatment groups Statistically significant difference between GR2 and placebo for inflammation scores in the patients without baseline varices There was no effect on fibrosis staging or percent collagen on morphometry ITT Analysis Set; Ordinal logistic regression analysis mean ± SEM Statistically significant improvement in hepatocyte ballooning in GR2 group and trend in GR8 group
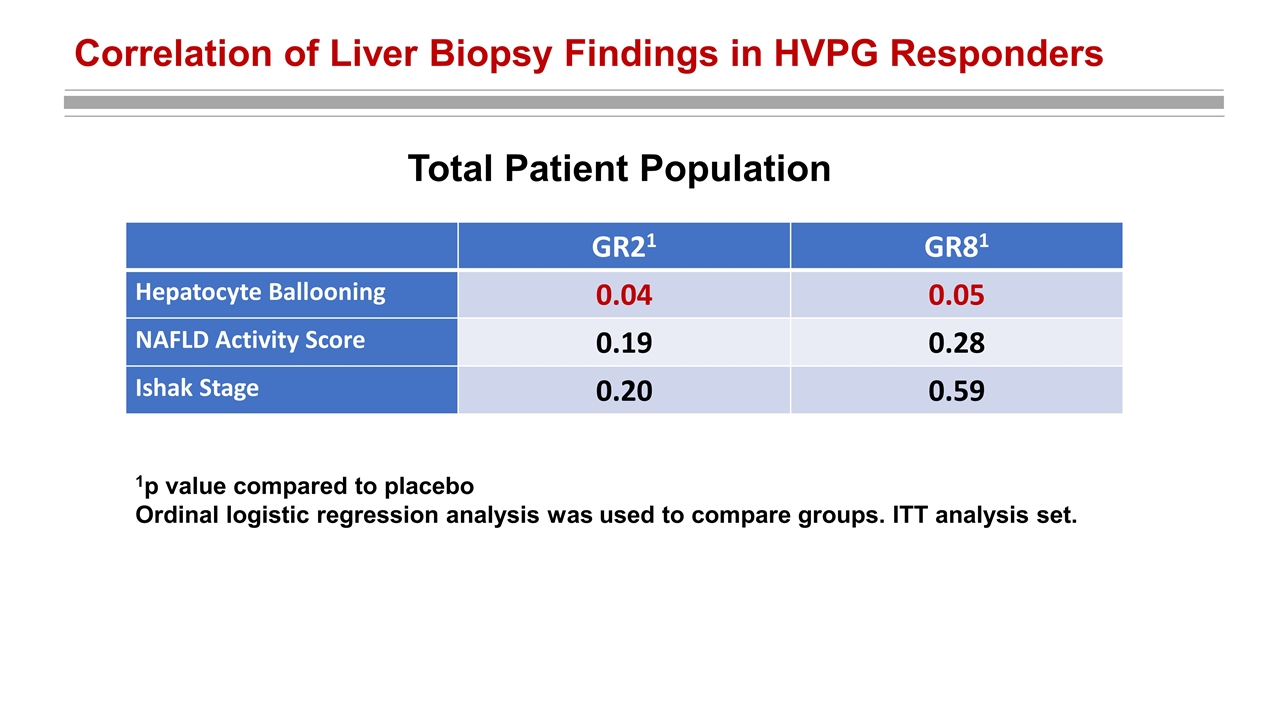
Correlation of Liver Biopsy Findings in HVPG Responders 1p value compared to placebo Ordinal logistic regression analysis was used to compare groups. ITT analysis set. GR21 GR81 Hepatocyte Ballooning 0.04 0.05 NAFLD Activity Score 0.19 0.28 Ishak Stage 0.20 0.59 Total Patient Population
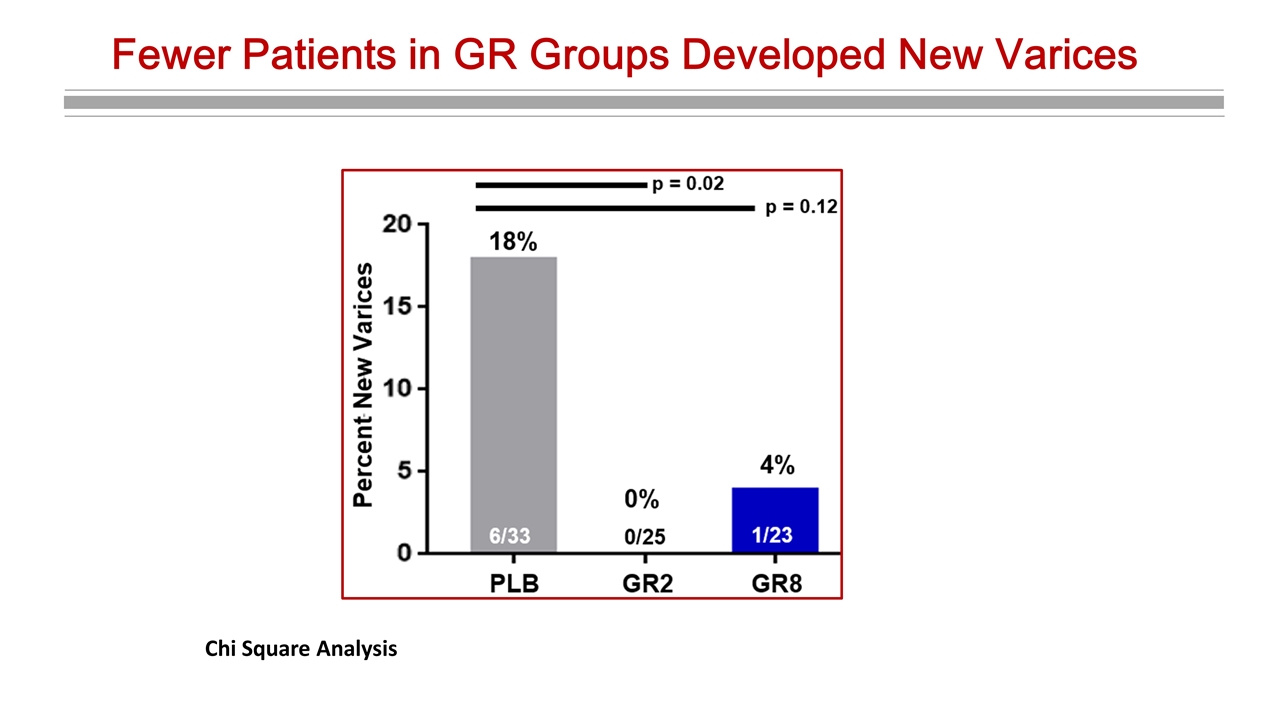
Fewer Patients in GR Groups Developed New Varices Chi Square Analysis
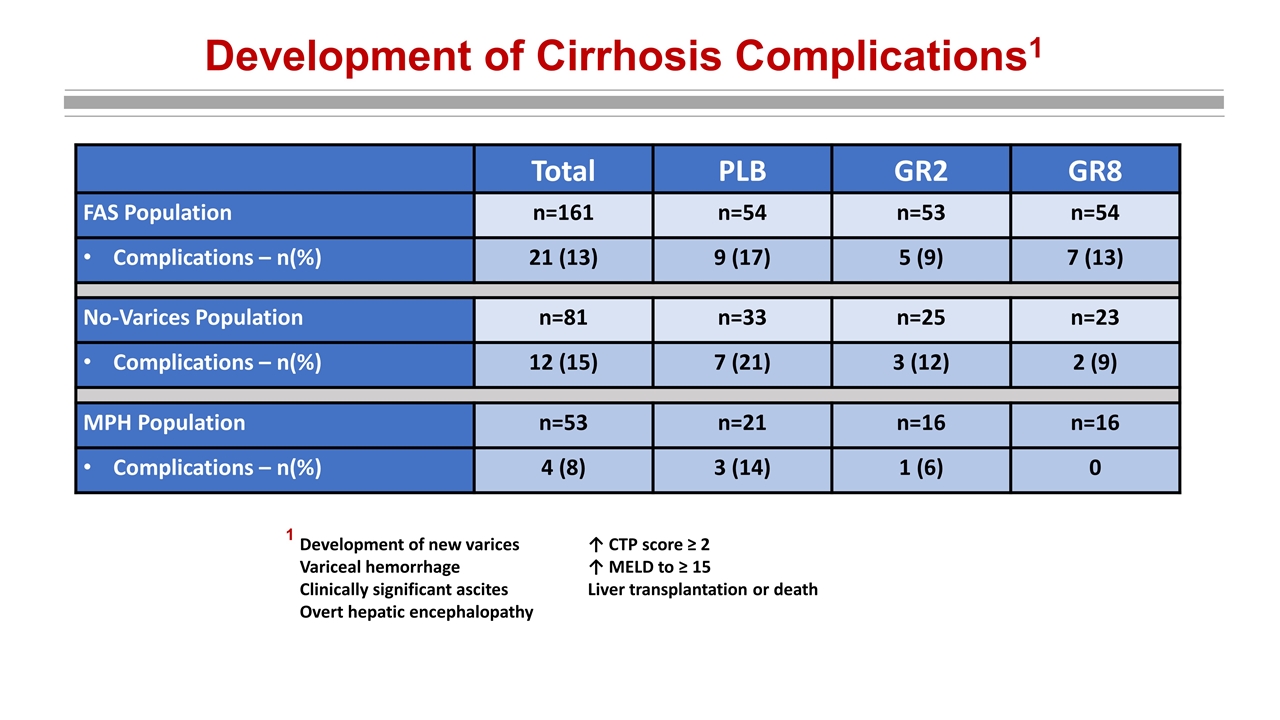
Development of Cirrhosis Complications1 Total PLB GR2 GR8 FAS Population n=161 n=54 n=53 n=54 Complications – n(%) 21 (13) 9 (17) 5 (9) 7 (13) No-Varices Population n=81 n=33 n=25 n=23 Complications – n(%) 12 (15) 7 (21) 3 (12) 2 (9) MPH Population n=53 n=21 n=16 n=16 Complications – n(%) 4 (8) 3 (14) 1 (6) 0 Development of new varices ↑ CTP score ≥ 2 Variceal hemorrhage↑ MELD to ≥ 15 Clinically significant ascitesLiver transplantation or death Overt hepatic encephalopathy 1
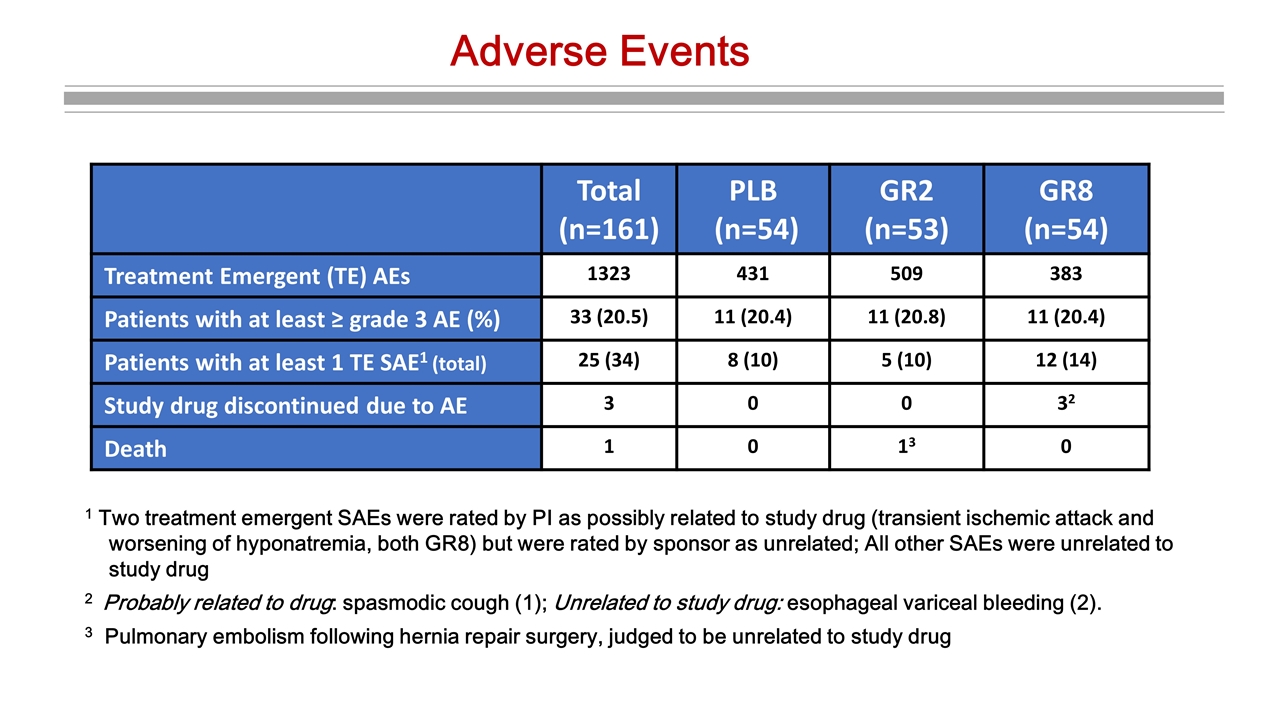
Adverse Events Total (n=161) PLB (n=54) GR2 (n=53) GR8 (n=54) Treatment Emergent (TE) AEs 1323 431 509 383 Patients with at least ≥ grade 3 AE (%) 33 (20.5) 11 (20.4) 11 (20.8) 11 (20.4) Patients with at least 1 TE SAE1 (total) 25 (34) 8 (10) 5 (10) 12 (14) Study drug discontinued due to AE 3 0 0 32 Death 1 0 13 0 1 Two treatment emergent SAEs were rated by PI as possibly related to study drug (transient ischemic attack and worsening of hyponatremia, both GR8) but were rated by sponsor as unrelated; All other SAEs were unrelated to study drug 2 Probably related to drug: spasmodic cough (1); Unrelated to study drug: esophageal variceal bleeding (2). 3 Pulmonary embolism following hernia repair surgery, judged to be unrelated to study drug
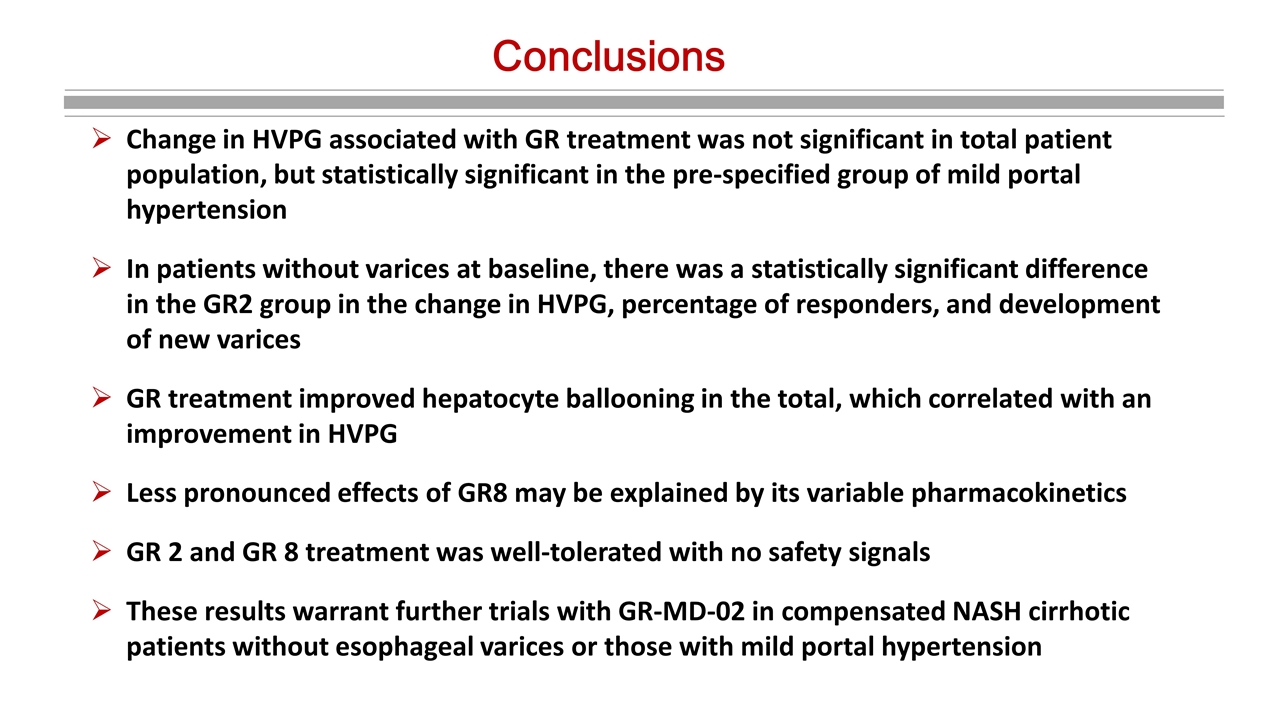
Conclusions Change in HVPG associated with GR treatment was not significant in total patient population, but statistically significant in the pre-specified group of mild portal hypertension In patients without varices at baseline, there was a statistically significant difference in the GR2 group in the change in HVPG, percentage of responders, and development of new varices GR treatment improved hepatocyte ballooning in the total, which correlated with an improvement in HVPG Less pronounced effects of GR8 may be explained by its variable pharmacokinetics GR 2 and GR 8 treatment was well-tolerated with no safety signals These results warrant further trials with GR-MD-02 in compensated NASH cirrhotic patients without esophageal varices or those with mild portal hypertension
Acknowledgements We extend our thanks to the patients, their families and all participating investigators This study was funded by Galectin Therapeutics, Inc.
