Attached files
| file | filename |
|---|---|
| 8-K - 8-K - HF Foods Group Inc. | s109653_8k.htm |
Exhibit 99.1
1 Acquisition of HF Group Holding Corporation Investor Presentation April 2018 ATLANTIC ACQUISITION CORP.
DISCLAIMER HF Group Holding Corporation (“HF”), Atlantic Acquisition Corp. (“Atlantic”), and their respective directors, executive offic ers and employees and other persons may be deemed to be participants in the solicitation of proxies from the holders of Atlantic comm on stock in respect of the proposed transaction described herein. Information about Atlantic’s directors and executive officers and their ow nership of Atlantic’s common stock is set forth in Atlantic’s Annual Report on Form 10 - K for the year ended December 31, 2017 filed with th e SEC, as modified or supplemented by any Form 3 or Form 4 filed with the SEC since the date of such filing. Other information regardi ng the interests of the participants in the proxy solicitation will be included in the proxy statement pertaining to the proposed tr ans action when it becomes available. These documents can be obtained free of charge from the sources indicated above. In connection with the transaction between HF and Atlantic, Atlantic filed a preliminary proxy statement on Schedule 14A with th e Securities and Exchange Commission (the “SEC”) on April 6, 2018. Promptly after filing its definitive proxy statement with th e S EC, Atlantic will mail the definitive proxy statement and a proxy card to each stockholder entitled to vote at the special meeting relatin g t o the transaction. INVESTORS AND SECURITY HOLDERS OF ATLANTIC ARE URGED TO READ THESE MATERIALS (INCLUDING ANY AMENDMENTS OR SUPPLEMENTS THERETO) AND ANY OTHER RELEVANT DOCUMENTS IN CONNECTION WITH THE TRANSACTION THAT ATLANTIC WILL FILE WITH THE SEC WHEN THEY BECOME AVAILABLE BECAUSE THEY WILL CONTAIN IMPORTANT INFORMATION ABOUT ATLANTIC, HF AND THE TRANSACTION. The definitive proxy statement, the preliminary proxy statement and other relevant materials in connection w ith the transaction (when they become available), and any other documents filed by Atlantic with the SEC, may be obtained free of cha rge at the SEC’s website (www.sec.gov) or by writing to Atlantic Acquisition Corp., 1250 Broadway, 36th Floor, New York, NY 10001. 2
DISCLAIMER (CONTINUED) This presentation contains certain “forward - looking statements” within the meaning of the Securities Act of 1933 and the Securit ies Exchange Act of 1934, both as amended by the Private Securities Litigation Reform Act of 1995. Statements that are not historical facts, including statemen ts about the pending transaction between Atlantic and HF and the transactions contemplated thereby, and the parties’ perspectives and expectations, are forward lookin g s tatements. Such statements include, but are not limited to, statements regarding the proposed transaction, including the anticipated initial enterprise value and po st - closing equity value, the benefits of the proposed transaction, integration plans, expected synergies and revenue opportunities, anticipated future financial and o per ating performance and results, including estimates for growth, the expected management and governance of the combined company, and the expected timing of th e t ransactions contemplated by the merger agreement between Atlantic and HF dated March 28, 2018 (the “Merger Agreement”). The words “expect,” “believe,” “e sti mate,” “intend,” “plan” and similar expressions indicate forward - looking statements. These forward - looking statements are not guarantees of future performan ce and are subject to various risks and uncertainties, assumptions (including assumptions about general economic, market, industry and operational factors), know n o r unknown, which could cause the actual results to vary materially from those indicated or anticipated. Such risks and uncertainties include, but are not limited to: (i) risks related to the expected timing and likelihood of comp let ion of the pending transaction, including the risk that the transaction may not close due to one or more closing conditions to the transaction not being satisfied or w aiv ed, such as regulatory approvals not being obtained, on a timely basis or otherwise, or that a governmental entity prohibited, delayed or refused to grant approva l f or the consummation of the transaction or required certain conditions, limitations or restrictions in connection with such approvals, or that the requir ed approval of the Merger Agreement by the stockholders of Atlantic was not obtained; (ii) the occurrence of any event, change or other circumstances that could give ri se to the termination of the Merger Agreement; (iii) the risk that there may be a material adverse change with respect to the financial position, performance, op era tions or prospects of HF or Atlantic; (iv) risks related to disruption of management time from ongoing business operations due to the proposed transaction; (v) the ri sk that any announcements relating to the proposed transaction could have adverse effects on the market price of Atlantic’s common stock; (vi) the risk that the pr oposed transaction and its announcement could have an adverse effect on the ability of HF to retain customers and retain and hire key personnel and main tai n relationships with their suppliers and customers and on their operating results and businesses generally; (vii) risks related to successfully integrating the co mpa nies, which may result in the combined company not operating as effectively and efficiently as expected; and (viii) risks associated with the financing of the propo sed transaction. A further list and description of risks and uncertainties can be found in Atlantic’s Annual Report on Form 10 - K for the fiscal y ear ending December 31, 2017 filed with the SEC, in Atlantic’s quarterly reports on Form 10 - Q filed with the SEC subsequent thereto and in the preliminary proxy stateme nt on Schedule 14A filed by Atlantic on April 6, 2018 and the definitive proxy statement on Schedule 14A that will be filed with the SEC by Atlantic in connection wi th the proposed transaction, and other documents that the parties may file or furnish with the SEC, which you are encouraged to read. Should one or more of these r isk s or uncertainties materialize, or should underlying assumptions prove incorrect, actual results may vary materially from those indicated or anticipated by such fo rward - looking statements. Accordingly, you are cautioned not to place undue reliance on these forward - looking statements. Forward - looking statements relat e only to the date they were made, and Atlantic, HF, and their subsidiaries undertake no obligation to update forward - looking statements to reflect events or circu mstances after the date they were made except as required by law or applicable regulation. 3
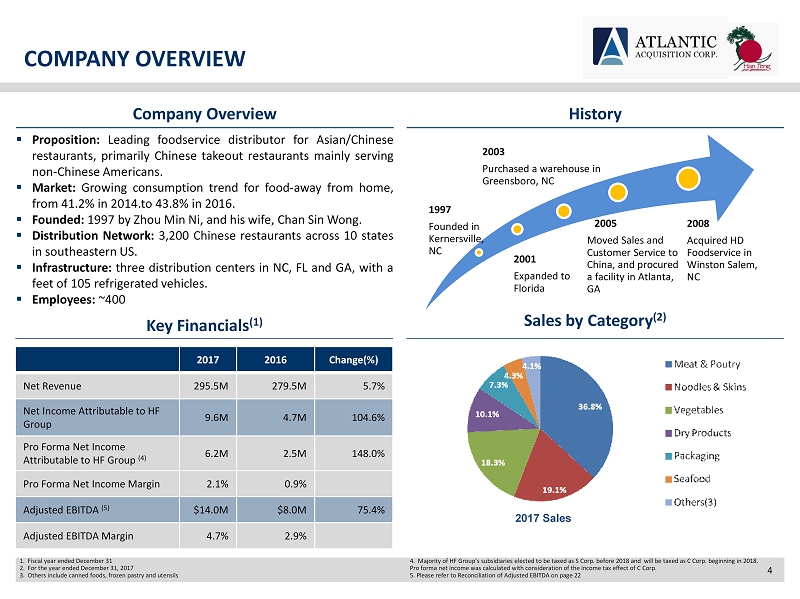
COMPANY OVERVIEW Company Overview History ▪ Proposition : Leading foodservice distributor for Asian/Chinese restaurants, primarily Chinese takeout restaurants mainly serving non - Chinese Americans . ▪ Market : Growing consumption trend for food - away from home, from 41 . 2 % in 2014 . to 43 . 8 % in 2016 . ▪ Founded : 1997 by Zhou Min Ni, and his wife, Chan Sin Wong . ▪ Distribution Network : 3 , 200 Chinese restaurants across 10 states in southeastern US . ▪ Infrastructure : three distribution centers in NC, FL and GA, with a feet of 105 refrigerated vehicles . ▪ Employees : ~ 400 Key Financials (1) Sales by Category (2) 1997 Founded in Kernersville, NC 2003 Purchased a warehouse in Greensboro, NC 2001 Expanded to Florida 2005 Moved Sales and Customer Service to China, and procured a facility in Atlanta, GA 2008 Acquired HD Foodservice in Winston Salem, NC 2017 2016 Change(%) Net Revenue 295.5M 279.5M 5.7% Net Income Attributable to HF Group 9.6M 4.7M 104.6% Pro Forma Net Income Attributable to HF Group (4) 6.2M 2.5M 148.0% Pro Forma Net Income Margin 2.1% 0.9% Adjusted EBITDA (5) $14.0M $8.0M 75.4% Adjusted EBITDA Margin 4.7% 2.9% 1. Fiscal year ended December 31 2. For the year ended December 31, 2017 3. Others include canned foods, frozen pastry and utensils 4. Majority of HF Group’s subsidiaries elected to be taxed as S Corp. before 2018 and will be taxed as C Corp. beginning in 201 8. Pro forma net income was calculated with consideration of the income tax effect of C Corp. 5. Please refer to Reconciliation of Adjusted EBITDA on page 22 2017 Sales 4
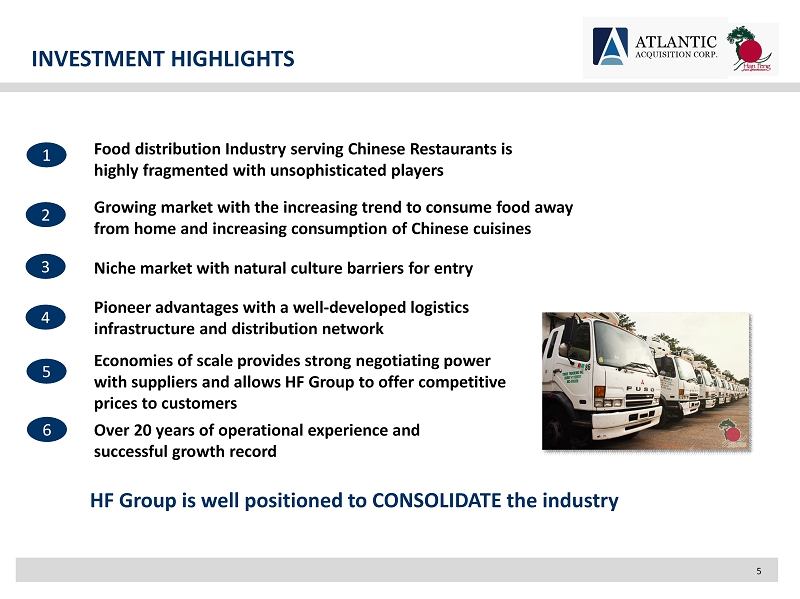
INVESTMENT HIGHLIGHTS 1 Food distribution Industry serving Chinese Restaurants is highly fragmented with unsophisticated players Growing market with the increasing trend to consume food away from home and increasing consumption of Chinese cuisines Niche market with natural culture barriers for entry Pioneer advantages with a well - developed logistics infrastructure and distribution network Economies of scale provides strong negotiating power with suppliers and allows HF Group to offer competitive prices to customers Over 20 years of operational experience and successful growth record HF Group is well positioned to CONSOLIDATE the industry 2 3 4 5 6 5

6 TRANSACTION SUMMARY
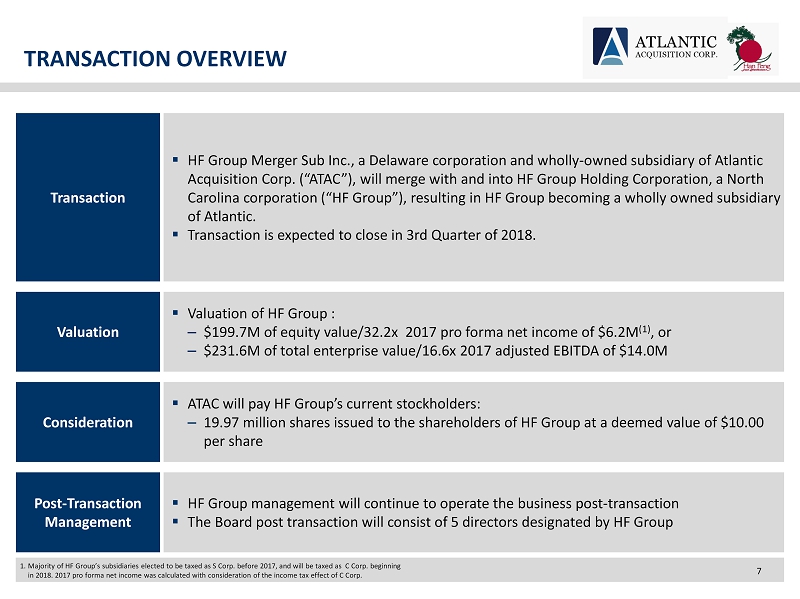
TRANSACTION OVERVIEW Transaction ▪ HF Group Merger Sub Inc., a Delaware corporation and wholly - owned subsidiary of Atlantic Acquisition Corp. (“ATAC”), will merge with and into HF Group Holding Corporation, a North Carolina corporation (“HF Group”), resulting in HF Group becoming a wholly owned subsidiary of Atlantic. ▪ Transaction is expected to close in 3rd Quarter of 2018. Post - Transaction Management ▪ HF Group management will continue to operate the business post - transaction ▪ The Board post transaction will consist of 5 directors designated by HF Group Consideration ▪ ATAC will pay HF Group’s current stockholders: – 19.97 million shares issued to the shareholders of HF Group at a deemed value of $10.00 per share Valuation ▪ Valuation of HF Group : – $199.7M of equity value/32.2x 2017 pro forma net income of $6.2M (1) , or – $231.6M of total enterprise value/16.6x 2017 adjusted EBITDA of $14.0M 1. Majority of HF Group’s subsidiaries elected to be taxed as S Corp. before 2017, and will be taxed as C Corp. beginning in 2018. 2017 pro forma net income was calculated with consideration of the income tax effect of C Corp. 7
CAPITALIZATION AND OWNERSHIP (PRO FORMA) 8
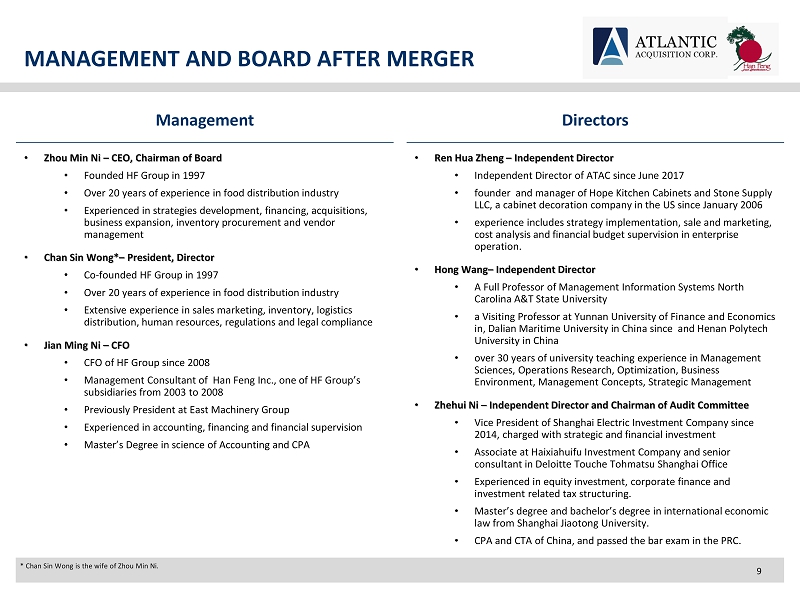
MANAGEMENT AND BOARD AFTER MERGER Management Directors * Chan Sin Wong is the wife of Zhou Min Ni. • Zhou Min Ni – CEO, Chairman of Board • Founded HF Group in 1997 • Over 20 years of experience in food distribution industry • Experienced in strategies development, financing, acquisitions, business expansion, inventory procurement and vendor management • Chan Sin Wong* – President, Director • Co - founded HF Group in 1997 • Over 20 years of experience in food distribution industry • Extensive experience in sales marketing, inventory, logistics distribution, human resources, regulations and legal compliance • Jian Ming Ni – CFO • CFO of HF Group since 2008 • Management Consultant of Han Feng Inc., one of HF Group’s subsidiaries from 2003 to 2008 • Previously President at East Machinery Group • Experienced in accounting, financing and financial supervision • Master’s Degree in science of Accounting and CPA • Ren Hua Zheng – Independent Director • Independent Director of ATAC since June 2017 • founder and manager of Hope Kitchen Cabinets and Stone Supply LLC, a cabinet decoration company in the US since January 2006 • experience includes strategy implementation, sale and marketing, cost analysis and financial budget supervision in enterprise operation. • Hong Wang – Independent Director • A Full Professor of Management Information Systems North Carolina A&T State University • a Visiting Professor at Yunnan University of Finance and Economics in, Dalian Maritime University in China since and Henan Polytech University in China • over 30 years of university teaching experience in Management Sciences, Operations Research, Optimization, Business Environment, Management Concepts, Strategic Management • Zhehui Ni – Independent Director and Chairman of Audit Committee • Vice President of Shanghai Electric Investment Company since 2014, charged with strategic and financial investment • Associate at Haixiahuifu Investment Company and senior consultant in Deloitte Touche Tohmatsu Shanghai Office • Experienced in equity investment, corporate finance and investment related tax structuring. • Master’s degree and bachelor’s degree in international economic law from Shanghai Jiaotong University. • CPA and CTA of China, and passed the bar exam in the PRC. 9
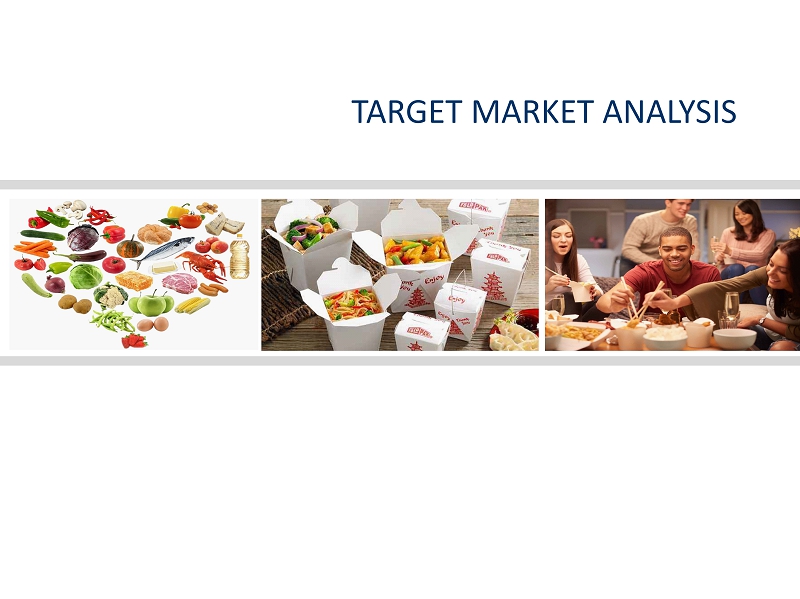
10 TARGET MARKET ANALYSIS
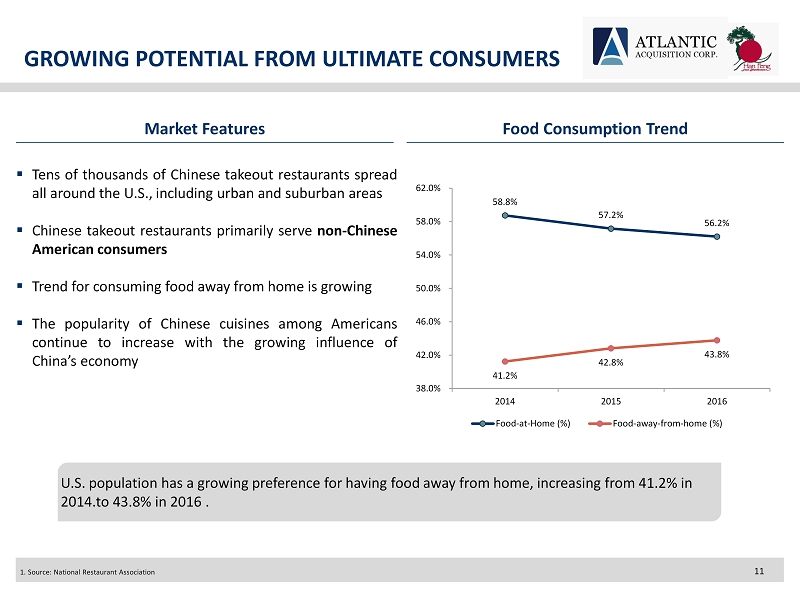
GROWING POTENTIAL FROM ULTIMATE CONSUMERS Market Features Food Consumption Trend 1. Source: National Restaurant Association 58.8% 57.2% 56.2% 41.2% 42.8% 43.8% 38.0% 42.0% 46.0% 50.0% 54.0% 58.0% 62.0% 2014 2015 2016 Food-at-Home (%) Food-away-from-home (%) U.S. population has a growing preference for having food away from home, increasing from 41.2% in 2014.to 43.8% in 2016 . ▪ Tens of thousands of Chinese takeout restaurants spread all around the U . S . , including urban and suburban areas ▪ Chinese takeout restaurants primarily serve non - Chinese American consumers ▪ Trend for consuming food away from home is growing ▪ The popularity of Chinese cuisines among Americans continue to increase with the growing influence of China’s economy 11
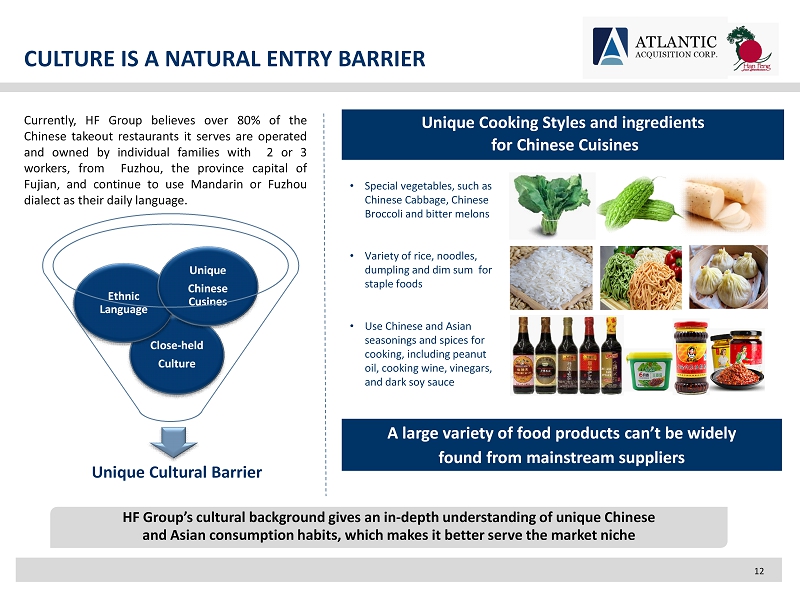
CULTURE IS A NATURAL ENTRY BARRIER Currently, HF Group believes over 80 % of the Chinese takeout restaurants it serves are operated and owned by individual families with 2 or 3 workers, from Fuzhou, the province capital of Fujian, and continue to use Mandarin or Fuzhou dialect as their daily language . Close - held Culture Ethnic Language Unique Chinese Cusines Unique Cultural Barrier Unique Cooking Styles and ingredients for Chinese Cuisines A large variety of food products can’t be widely found from mainstream suppliers • Special vegetables, such as Chinese Cabbage, Chinese Broccoli and bitter melons • Variety of rice, noodles, dumpling and dim sum for staple foods • Use Chinese and Asian seasonings and spices for cooking, including peanut oil, cooking wine, vinegars, and dark soy sauce HF Group’s cultural background gives an in - depth understanding of unique Chinese and Asian consumption habits, which makes it better serve the market niche 12
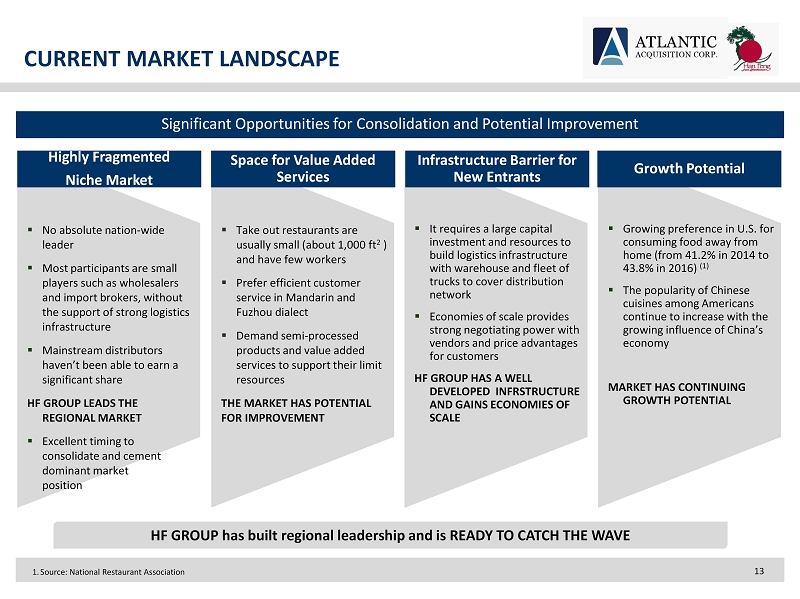
CURRENT MARKET LANDSCAPE 1. Source: National Restaurant Association ▪ Growing preference in U.S. for consuming food away from home (from 41.2% in 2014 to 43.8% in 2016) (1) ▪ The popularity of Chinese cuisines among Americans continue to increase with the growing influence of China’s economy MARKET HAS CONTINUING GROWTH POTENTIAL ▪ It requires a large capital investment and resources to build logistics infrastructure with warehouse and fleet of trucks to cover distribution network ▪ Economies of scale provides strong negotiating power with vendors and price advantages for customers HF GROUP HAS A WELL DEVELOPED INFRSTRUCTURE AND GAINS ECONOMIES OF SCALE ▪ No absolute nation - wide leader ▪ Most participants are small players such as wholesalers and import brokers, without the support of strong logistics infrastructure ▪ Mainstream distributors haven’t been able to earn a significant share HF GROUP LEADS THE REGIONAL MARKET ▪ Excellent timing to consolidate and cement dominant market position ▪ Take out restaurants are usually small (about 1,000 ft 2 ) and have few workers ▪ Prefer efficient customer service in Mandarin and Fuzhou dialect ▪ Demand semi - processed products and value added services to support their limit resources THE MARKET HAS POTENTIAL FOR IMPROVEMENT Growth Potential Infrastructure Barrier for New Entrants Highly Fragmented Niche Market Space for Value Added Services HF GROUP has built regional leadership and is READY TO CATCH THE WAVE Significant Opportunities for Consolidation and Potential Improvement 13

14 BUSINESS AND OPERATIONS
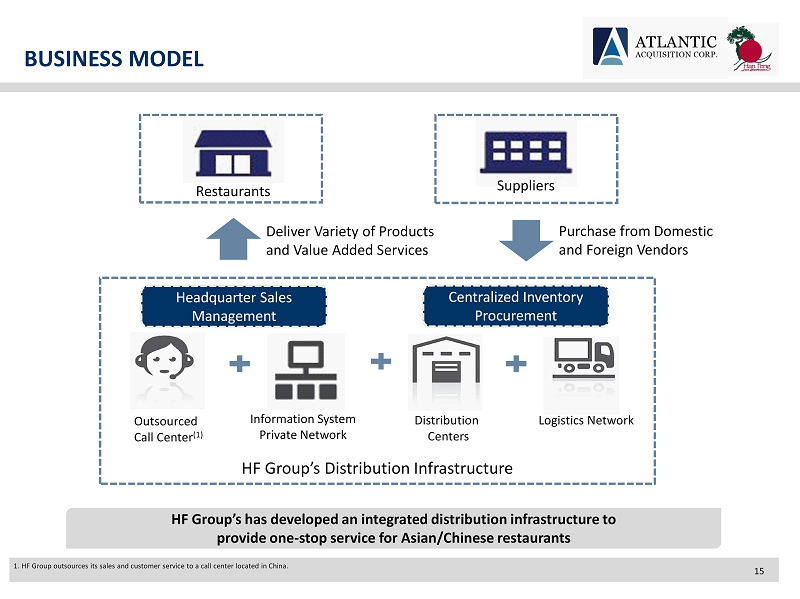
BUSINESS MODEL 1. HF Group outsources its sales and customer service to a call center located in China. Outsourced Call Center (1) Information System Private Network Distribution Centers Logistics Network Headquarter Sales Management Centralized Inventory Procurement Deliver Variety of Products and Value Added Services Restaurants Suppliers Purchase from Domestic and Foreign Vendors HF Group’s Distribution Infrastructure HF Group’s has developed an integrated distribution infrastructure to provide one - stop service for Asian/Chinese restaurants 15
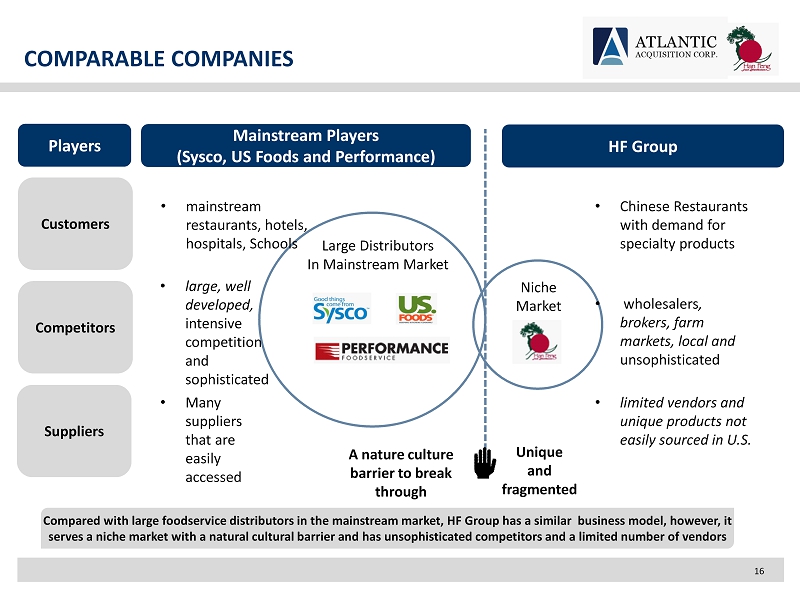
COMPARABLE COMPANIES Large Distributors In Mainstream Market Niche Market • mainstream restaurants, hotels, hospitals, Schools • Chinese Restaurants with demand for specialty products A nature culture barrier to break through • large, well developed, intensive competition and sophisticated • wholesalers , brokers, farm markets, local and unsophisticated • Many suppliers that are easily accessed Mainstream Players (Sysco, US Foods and Performance) HF Group • limited vendors and unique products not easily sourced in U.S. Players Competitors Suppliers Customers Unique and fragmented Compared with large foodservice distributors in the mainstream market, HF Group has a s imilar business model, however, it serves a niche market with a natural cultural barrier and has unsophisticated competitors and a limited number of vendors 16
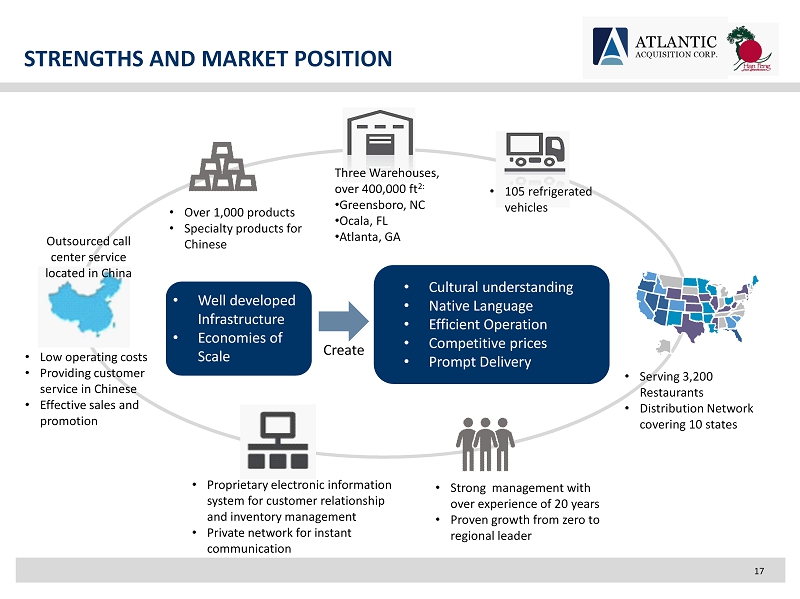
STRENGTHS AND MARKET POSITION • Proprietary electronic information system for customer relationship and inventory management • Private network for instant communication • Over 1,000 products • Specialty products for Chinese • Strong management with over experience of 20 years • Proven growth from zero to regional leader • Serving 3,200 Restaurants • Distribution Network covering 10 states Outsourced call center service located in China • Low operating costs • Providing customer service in Chinese • Effective sales and promotion Three Warehouses, over 400,000 ft 2: • Greensboro, NC • Ocala, FL • Atlanta, GA • 105 refrigerated vehicles • Cultural understanding • Native Language • Efficient Operation • Competitive prices • Prompt Delivery • Well developed Infrastructure • Economies of Scale Create 17
18 GROWTH STRATEGY

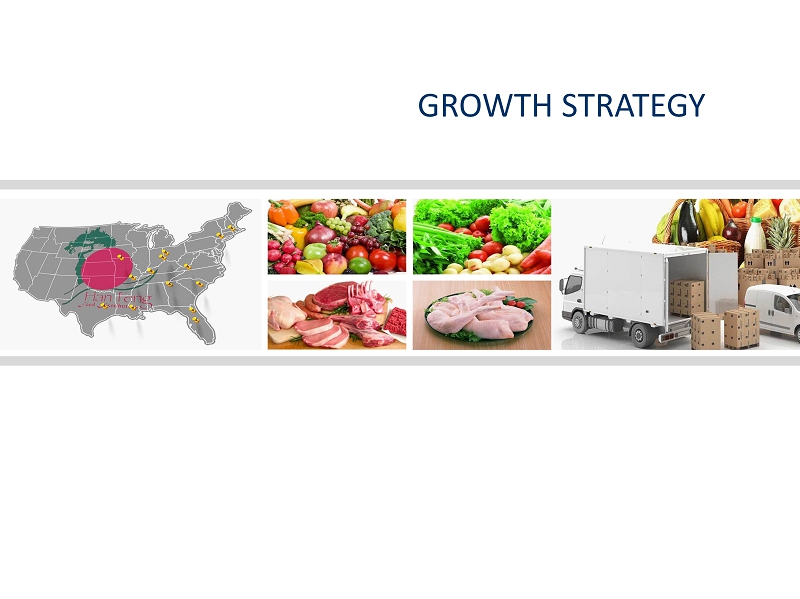
GROWTH STRATEGY Expand distribution network through acquisitions Explore semi - prepared products and value added services Streamline infrastructure and improve productivity Enhance technology platform Integrate sales management Long Term Vision Become a nationwide leading foodservice company serving Asian/Chinese restaurants in the U.S. Provide training and growth support and Enlarge customer base ACQUISITIONS are a key strategy for HF Group to grow 19
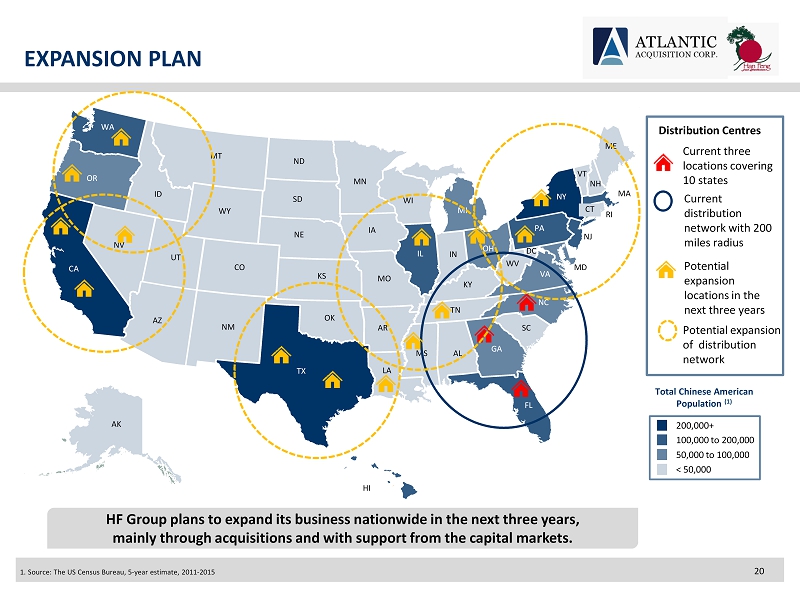
EXPANSION PLAN 1. Source: The US Census Bureau, 5 - year estimate, 2011 - 2015 WA OR NV CA UT ID MT WY SD ND NE CO AZ NM TX OK KS MN IA MO AR LA MS AL GA FL SC NC TN KY IL WI MI IN OH PA NY VT CT RI NH ME NJ MA WV VA MD DC HI AK < 50,000 50,000 to 100,000 100,000 to 200,000 200,000+ Total Chinese American Population (1) Distribution Centres Current three locations covering 10 states Potential expansion locations in the next three years HF Group plans to expand its business nationwide in the next three years, mainly through acquisitions and with support from the capital markets. Current distribution network with 200 miles radius Potential expansion of distribution network 20

21 APPENDIX
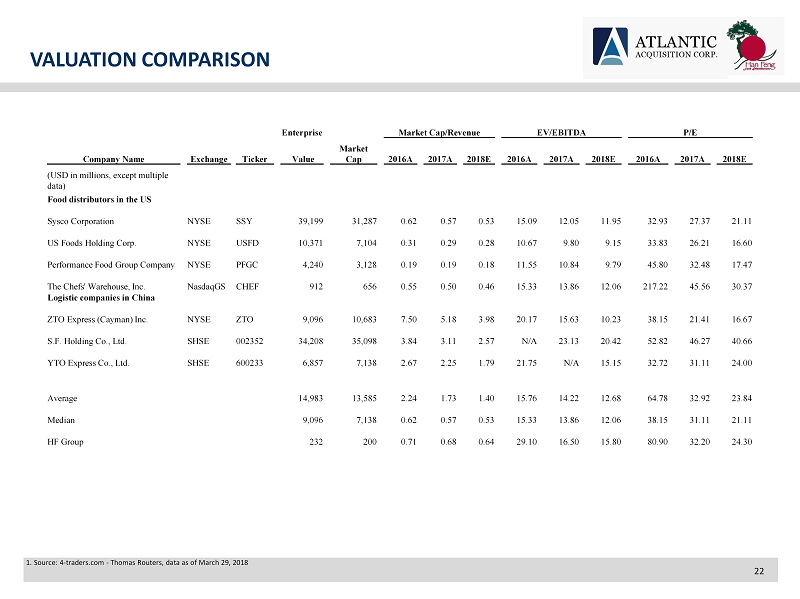
VALUATION COMPARISON 1. Source: 4 - traders.com - Thomas Routers, data as of March 29, 2018 Enterprise Market Cap/Revenue EV/EBITDA P/E Company Name Exchange Ticker Value Market Cap 2016A 2017A 2018E 2016A 2017A 2018E 2016A 2017A 2018E (USD in millions, except multiple data) Food distributors in the US Sysco Corporation NYSE SSY 39,199 31,287 0.62 0.57 0.53 15.09 12.05 11.95 32.93 27.37 21.11 US Foods Holding Corp. NYSE USFD 10,371 7,104 0.31 0.29 0.28 10.67 9.80 9.15 33.83 26.21 16.60 Performance Food Group Company NYSE PFGC 4,240 3,128 0.19 0.19 0.18 11.55 10.84 9.79 45.80 32.48 17.47 The Chefs' Warehouse, Inc. NasdaqGS CHEF 912 656 0.55 0.50 0.46 15.33 13.86 12.06 217.22 45.56 30.37 Logistic companies in China ZTO Express (Cayman) Inc. NYSE ZTO 9,096 10,683 7.50 5.18 3.98 20.17 15.63 10.23 38.15 21.41 16.67 S.F. Holding Co., Ltd. SHSE 002352 34,208 35,098 3.84 3.11 2.57 N/A 23.13 20.42 52.82 46.27 40.66 YTO Express Co., Ltd. SHSE 600233 6,857 7,138 2.67 2.25 1.79 21.75 N/A 15.15 32.72 31.11 24.00 Average 14,983 13,585 2.24 1.73 1.40 15.76 14.22 12.68 64.78 32.92 23.84 Median 9,096 7,138 0.62 0.57 0.53 15.33 13.86 12.06 38.15 31.11 21.11 HF Group 232 200 0.71 0.68 0.64 29.10 16.50 15.80 80.90 32.20 24.30 22
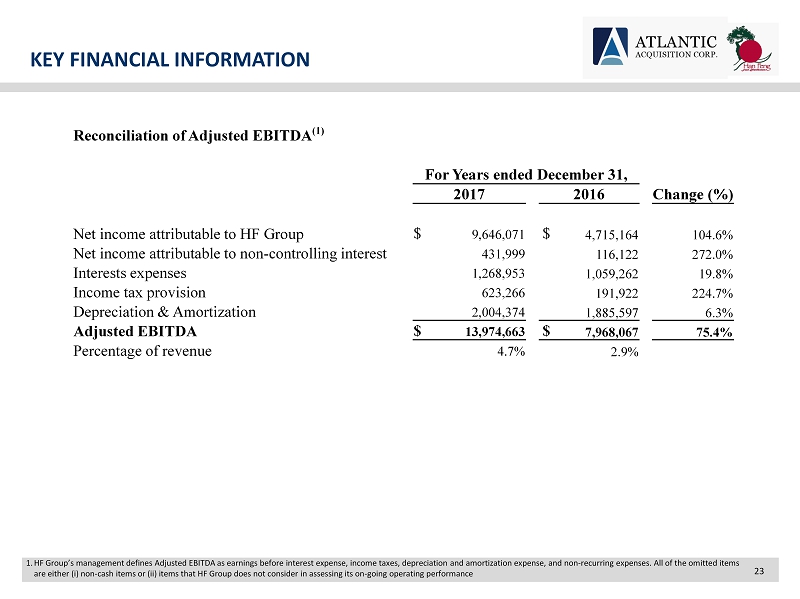
KEY FINANCIAL INFORMATION 1. HF Group’s management defines Adjusted EBITDA as earnings before interest expense, income taxes, depreciation and amortizatio n e xpense, and non - recurring expenses. All of the omitted items are either (i) non - cash items or (ii) items that HF Group does not consider in assessing its on - going operating performance Reconciliation of Adjusted EBITDA (1) For Years ended December 31, 2017 2016 Change (%) Net income attributable to HF Group $ 9,646,071 $ 4,715,164 104.6% Net income attributable to non - controlling interest 431,999 116,122 272.0% Interests expenses 1,268,953 1,059,262 19.8% Income tax provision 623,266 191,922 224.7% Depreciation & Amortization 2,004,374 1,885,597 6.3% Adjusted EBITDA $ 13,974,663 $ 7,968,067 75.4% Percentage of revenue 4.7% 2.9% 23
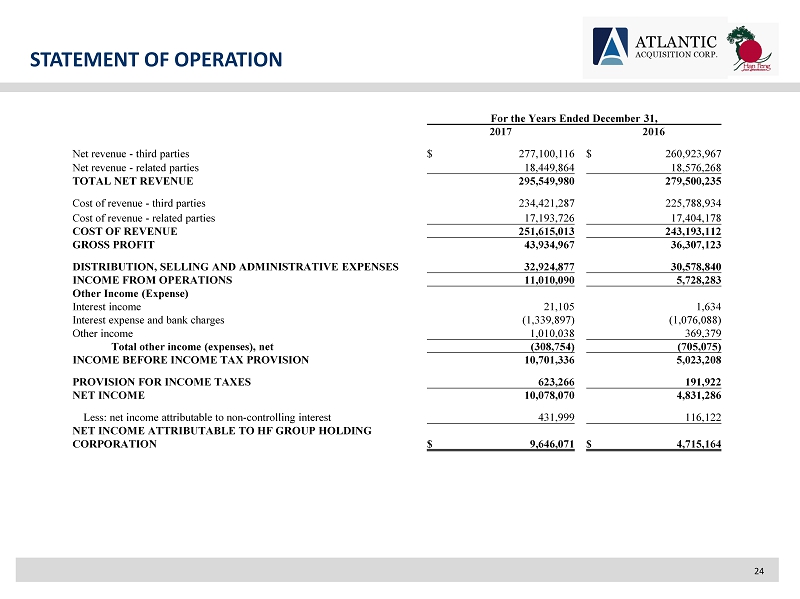
STATEMENT OF OPERATION For the Years Ended December 31, 2017 2016 Net revenue - third parties $ 277,100,116 $ 260,923,967 Net revenue - related parties 18,449,864 18,576,268 TOTAL NET REVENUE 295,549,980 279,500,235 Cost of revenue - third parties 234,421,287 225,788,934 Cost of revenue - related parties 17,193,726 17,404,178 COST OF REVENUE 251,615,013 243,193,112 GROSS PROFIT 43,934,967 36,307,123 DISTRIBUTION, SELLING AND ADMINISTRATIVE EXPENSES 32,924,877 30,578,840 INCOME FROM OPERATIONS 11,010,090 5,728,283 Other Income (Expense) Interest income 21,105 1,634 Interest expense and bank charges (1,339,897) (1,076,088) Other income 1,010,038 369,379 Total other income (expenses), net (308,754) (705,075) INCOME BEFORE INCOME TAX PROVISION 10,701,336 5,023,208 PROVISION FOR INCOME TAXES 623,266 191,922 NET INCOME 10,078,070 4,831,286 Less: net income attributable to non - controlling interest 431,999 116,122 NET INCOME ATTRIBUTABLE TO HF GROUP HOLDING CORPORATION $ 9,646,071 $ 4,715,164 24
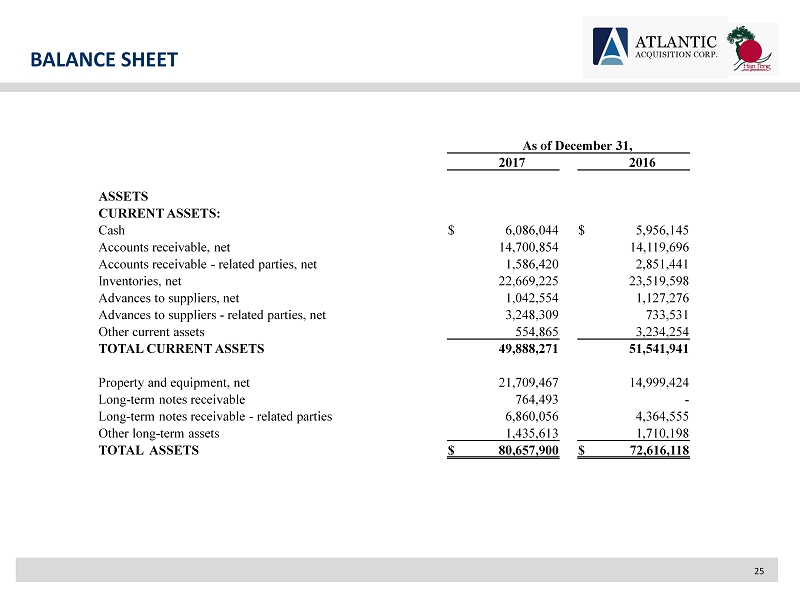
BALANCE SHEET 25 As of December 31, 2017 2016 ASSETS CURRENT ASSETS: Cash $ 6,086,044 $ 5,956,145 Accounts receivable, net 14,700,854 14,119,696 Accounts receivable - related parties, net 1,586,420 2,851,441 Inventories, net 22,669,225 23,519,598 Advances to suppliers, net 1,042,554 1,127,276 Advances to suppliers - related parties, net 3,248,309 733,531 Other current assets 554,865 3,234,254 TOTAL CURRENT ASSETS 49,888,271 51,541,941 Property and equipment, net 21,709,467 14,999,424 Long - term notes receivable 764,493 - Long - term notes receivable - related parties 6,860,056 4,364,555 Other long - term assets 1,435,613 1,710,198 TOTAL ASSETS $ 80,657,900 $ 72,616,118
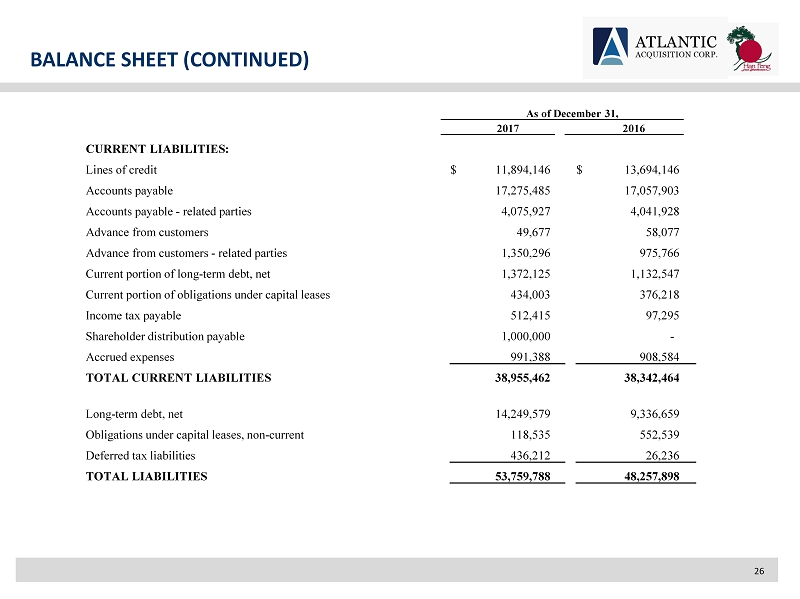
BALANCE SHEET (CONTINUED) CURRENT LIABILITIES: Lines of credit $ 11,894,146 $ 13,694,146 Accounts payable 17,275,485 17,057,903 Accounts payable - related parties 4,075,927 4,041,928 Advance from customers 49,677 58,077 Advance from customers - related parties 1,350,296 975,766 Current portion of long - term debt, net 1,372,125 1,132,547 Current portion of obligations under capital leases 434,003 376,218 Income tax payable 512,415 97,295 Shareholder distribution payable 1,000,000 - Accrued expenses 991,388 908,584 TOTAL CURRENT LIABILITIES 38,955,462 38,342,464 Long - term debt, net 14,249,579 9,336,659 Obligations under capital leases, non - current 118,535 552,539 Deferred tax liabilities 436,212 26,236 TOTAL LIABILITIES 53,759,788 48,257,898 As of December 31, 2017 2016 26
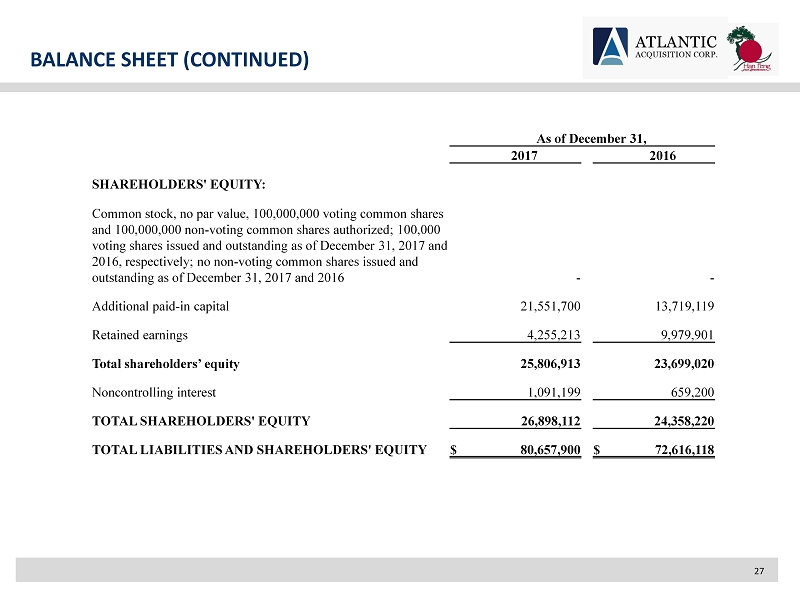
BALANCE SHEET (CONTINUED) 27 As of December 31, 2017 2016 SHAREHOLDERS' EQUITY: Common stock, no par value, 100,000,000 voting common shares and 100,000,000 non - voting common shares authorized; 100,000 voting shares issued and outstanding as of December 31, 2017 and 2016, respectively; no non - voting common shares issued and outstanding as of December 31, 2017 and 2016 - - Additional paid - in capital 21,551,700 13,719,119 Retained earnings 4,255,213 9,979,901 Total shareholders’ equity 25,806,913 23,699,020 Noncontrolling interest 1,091,199 659,200 TOTAL SHAREHOLDERS' EQUITY 26,898,112 24,358,220 TOTAL LIABILITIES AND SHAREHOLDERS' EQUITY $ 80,657,900 $ 72,616,118

28 Thank You