Attached files
| file | filename |
|---|---|
| EX-32.2 - EXHIBIT 32.2 - HF Foods Group Inc. | ex_176637.htm |
| EX-32.1 - EXHIBIT 32.1 - HF Foods Group Inc. | ex_176636.htm |
| EX-31.2 - EXHIBIT 31.2 - HF Foods Group Inc. | ex_176635.htm |
| EX-31.1 - EXHIBIT 31.1 - HF Foods Group Inc. | ex_176634.htm |
| EX-23.1 - EXHIBIT 23.1 - HF Foods Group Inc. | ex_177380.htm |
| EX-21 - EXHIBIT 21 - HF Foods Group Inc. | ex_177170.htm |
UNITED STATES
SECURITIES AND EXCHANGE COMMISSION
Washington, D.C. 20549
FORM 10-K
|
|
☒ |
ANNUAL REPORT PURSUANT TO SECTION 13 OR 15(d) OF THE SECURITIES EXCHANGE ACT OF 1934 |
For the fiscal year ended December 31, 2019
OR
|
|
☐ |
TRANSITION REPORT PURSUANT TO SECTION 13 OR 15(d) OF THE SECURITIES EXCHANGE ACT OF 1934 |
For the transition period from ____________to____________
COMMISSION FILE NO. 001-38180
HF Foods Group Inc.
(Exact Name of Registrant as Specified in Its Charter)
|
Delaware |
81-2717873 |
|
(State or Other Jurisdiction of |
(I.R.S. Employer |
|
6001 W. Market Street Greensboro, NC |
27409 |
|
(Address of Principal Executive Offices) |
(Zip Code) |
(Registrant’s Telephone Number, Including Area Code): (336) 268-2080
Securities registered pursuant to Section 12(b) of the Act:
|
Title of each Class |
Trading Symbols |
Name of each Exchange on which registered |
|
Common Stock, par value $0.0001 per share |
HFFG |
Nasdaq Capital Market |
Securities registered pursuant to Section 12(g) of the Act: None
Indicate by check mark if the registrant is a well-known seasoned issuer, as defined in Rule 405 of the Securities Act. Yes ☐ No ☒
Indicate by check mark if the registrant is not required to file reports pursuant to Section 13 or Section 15(d) of the Act. Yes ☐ No ☒
Indicate by check mark whether the registrant: (1) has filed all reports required to be filed by Section 13 or 15(d) of the Securities Exchange Act of 1934 during the preceding 12 months (or for such shorter period that the registrant was required to file such reports), and (2) has been subject to such filing requirements for the past 90 days. Yes ☒ No ☐
Indicate by check mark whether the registrant has submitted electronically every Interactive Data File required to be submitted pursuant to Rule 405 of Regulation S-T (§232.405 of this chapter) during the preceding 12 months (or for such shorter period that the registrant was required to submit such files). Yes ☒ No ☐
Indicate by check mark if disclosure of delinquent filers pursuant to Item 405 of Regulation S-K (§229.405 of this chapter) is not contained herein, and will not be contained, to the best of registrant’s knowledge, in definitive proxy or information statements incorporated by reference in Part III of this Form 10-K or any amendment to this Form 10-K. ☐
Indicate by check mark whether the registrant is a large accelerated filer, an accelerated filer, a non-accelerated filer, a smaller reporting company, or an emerging growth company. See the definitions of “large accelerated filer,” “accelerated filer,” “smaller reporting company,” and “emerging growth company” in Rule 12b-2 of the Exchange Act. (Check one):
|
Large accelerated filer |
☐ |
|
Accelerated filer |
☒ |
|
Non-accelerated filer |
☐ |
|
Smaller reporting company |
☐ |
|
|
|
|
Emerging growth company |
☒ |
If an emerging growth company, indicate by check mark if the registrant has elected not to use the extended transition period for complying with any new or revised financial accounting standards provided pursuant to Section 13(a) of the Exchange Act. ☐
Indicate by check mark whether the registrant is a shell company (as defined in Rule 12b-2 of the Exchange Act.) Yes ☐ No ☒
The aggregate market value of the registrant’s common stock held by non-affiliates of the registrant on June 28, 2019, the last business day of the registrant’s most recently completed second fiscal quarter, was approximately $771,650,187.66 based on the closing price of $34.81 per share as reported on the Nasdaq Capital Market on June 28, 2019.
As of March 13, 2020, the registrant had 52,145,096 shares of common stock issued and outstanding.
DOCUMENTS INCORPORATED BY REFERENCE:
Part III of this Annual Report on Form 10-K incorporates by reference certain portions of the registrant’s definitive proxy statement for its 2020 Annual Meeting of Stockholders to be filed with the Securities and Exchange Commission not later than 120 days after the end of the fiscal year covered by this report.
HF FOODS GROUP INC.
ANNUAL REPORT ON FORM 10-K
For the Fiscal Year Ended December 31, 2019
Table of Contents
|
|
Page No. |
|
|
PART I |
|
|
|
Cautionary Note About Forward-Looking Statements |
2 | |
|
Item 1. Business |
3 | |
|
Item 1A. Risk Factors |
14 | |
|
Item 2. Properties |
26 | |
|
Item 3. Legal Proceedings |
27 | |
|
Item 4. Mine Safety Disclosures |
27 | |
|
|
||
|
PART II |
||
|
Item 5. Market for Registrant's Common Equity, Related Stockholder Matters and Issuer Purchases of Equity Securities |
27 | |
| Item 6. Selected Financial Data | 27 | |
|
Item 7. Management’s Discussion and Analysis of Financial Condition and Results of Operations |
27 | |
| Item 7A. Quantitative and Qualitative Disclosures About Market Risk | 40 | |
|
Item 8. Financial Statements and Supplementary Data |
40 | |
|
Item 9. Changes in and Disagreements with Accountants on Accounting and Financial Disclosure |
69 | |
|
Item 9A. Controls and Procedures |
69 | |
|
Item 9B. Other Information |
69 | |
|
|
||
|
PART III |
||
|
Item 10. Directors, Executive Officers and Corporate Governance |
70 | |
|
Item 11. Executive Compensation |
70 | |
|
Item 12. Security Ownership of Certain Beneficial Owners and Management and Related Matters |
70 | |
|
Item 13. Certain Relationships and Related Transactions, and Director Independence |
70 | |
|
Item 14. Principal Accounting Fees and Services |
70 | |
|
|
||
|
PART IV |
||
|
Item 15. Exhibits and Financial Statement Schedules |
70 | |
|
Item 16. Form 10-K Summary |
72 | |
CAUTIONARY NOTE ABOUT FORWARD LOOKING STATEMENTS
This Annual Report on Form 10-K for HF Foods Group Inc. (“HF Group,” the “Company,” “we,” “us,” or “our”) contains forward-looking statements. Forward-looking statements include statements about our expectations, beliefs, plans, objectives, intentions, assumptions and other statements that are not historical facts. Words or phrases such as “anticipate,” “believe,” “continue,” “estimate,” “expect,” “intend,” “may,” “ongoing,” “plan,” “potential,” “predict,” “project,” “will” or similar words or phrases, or the negatives of those words or phrases, may identify forward-looking statements, but the absence of these words does not necessarily mean that a statement is not forward-looking. We derive many of our forward-looking statements from our operating budgets and forecasts, which are based on many detailed assumptions. While we believe that our assumptions are reasonable, we caution that it is very difficult to predict the impact of known factors, and it is impossible for us to anticipate all factors that could affect our actual results. All forward-looking statements are subject to risks and uncertainties that may cause actual results to differ materially from those that we expected. Important factors that could cause actual results to differ materially from our expectations, or cautionary statements, include without limitation:
|
● |
Unfavorable macroeconomic conditions in the United States; |
|
● |
Competition in the food service distribution industry particularly the entry of new competitors into the Chinese/Asian restaurant market niche; |
|
● |
Increases in fuel costs; |
|
● |
Increases in commodity prices; |
|
● |
Disruption of relationships with vendors and increases in product prices; |
|
● |
US government tariffs on products imported into the United States, particularly from China; |
|
● |
Changes in consumer eating and dining out habits; |
|
● |
Disruption of relationships with or loss of customers; |
|
● |
Our ability to execute our acquisition strategy; |
|
● |
Availability of financing to execute our acquisition strategy; |
|
● |
Our success at integrating B&R Global Holdings, Inc. (“B&R Global”) into HF Group; |
|
● |
Our ability to renew or replace our current leases; |
|
● |
Control of the Company by our Chief Executive Officer and principal stockholder; |
|
● |
Failure to retain our senior management and other key personnel particularly; |
|
● |
Our ability to attract, train and retain employees; |
|
● |
Changes in and enforcement of immigration laws; |
|
● |
Failure to comply with various federal, state and local rules and regulations regarding food safety, sanitation, transportation, minimum wage, overtime and other health and safety laws; |
|
● |
Product recalls, voluntary recalls or withdrawals if any of the products we distribute are alleged to have caused illness, been mislabeled, misbranded or adulterated or to otherwise have violated applicable government regulations; |
|
● |
Failure to protect our intellectual property rights; |
|
● |
Any cyber security incident, other technology disruption or delay in implementing our information technology systems; |
|
● |
The development of an active trading market for our common stock; and |
|
● |
other factors discussed in “Item 1A. Risk Factors.” and “Item 7 Management's Discussion and Analysis of Financial Condition and Results of Operations.” in this Annual Report on Form 10-K. |
All written and oral forward-looking statements attributable to us, or persons acting on our behalf, are expressly qualified in their entirety by these cautionary statements as well as other cautionary statements that are made from time to time in our other filings with the Securities and Exchange Commission (the "SEC") and public communications. We caution you that the important factors referenced above may not contain all of the factors that are important to you. In addition, we cannot assure you that we will realize the results or developments we expect or anticipate or, even if substantially realized, that they will result in the consequences or affect us or our operations in the way we expect. The forward-looking statements included in this Annual Report on Form 10-K are made only as of the date hereof. Except as otherwise required by law, we undertake no obligation to update or revise any forward-looking statement as a result of new information, future events or otherwise.
PART I.
|
ITEM 1. |
BUSINESS. |
Overview
HF Foods Group Inc. acting through its subsidiaries (“HF Group,” the “Company,” “we,” “us,” or “our”), is a leading Asian foodservice distributor to Asian restaurants, primarily Chinese restaurants located in the southeastern, Pacific and mountain west regions of the United States. HF Group is the result of successful merger between 2 two complementary market leaders, HF Foods Group and B&R Global Holdings on November 4, 2019.
The company now has 14 distribution centers strategically located across the east and west coasts of the United States in California, Arizona, Colorado, Florida, Georgia, Montana, Nevada, North Carolina, Oregon, Utah, and Washington, and a fleet of over 340 refrigerated vehicles. Capitalizing on its deep understanding of the Chinese culture and with 960 employees supported by two call centers in China, HF Group has become a trusted partner serving over 10,000 Asian restaurants in 21 states and provides round-the-clock sales and service support to its customers who mainly converse in Mandarin or Chinese dialects. Operating through its subsidiaries, the Company is dedicated to serving the vast array of Asian and Chinese restaurants in need of high-quality food ingredients at competitive prices.
HF Foods is committed to providing excellent customer service by delivering a distinctive product portfolio built from an indelible partnership with both foreign and domestic suppliers. These relationships, coupled with state-of-the-art technology, ensure that we deliver an outstanding array of products at unbeatable prices. The Company also utilizes a centralized inventory procurement system for all its distribution centers which provides great negotiating power with suppliers resulting in competitive prices for its customers. This proprietary system helps to better manage customer relationships and inventory while providing a solid platform for expansion from acquisition of smaller companies in this fast growing yet fragmented niche market.
Recent Developments
Business Combination with B&R Global
On November 4 2019, the Company completed the transactions contemplated by that certain the merger agreement dated as of June 21, 2019 (the “Merger Agreement”) by and among the Company, B&R Merger Sub Inc., a Delaware corporation (“Merger Sub”), B&R Global, the stockholders of B&R Global (the “B&R Global Stockholders”), and Xiao Mou Zhang (aka Peter Zhang), as representative of the stockholders (the “Business Combination”). Capitalized terms used herein without definition have the meaning given to them in the Merger Agreement.
Pursuant to the Merger Agreement, Merger Sub merged with and into B&R Global, resulting in B&R Global becoming a wholly owned subsidiary of HF Group. In connection with the closing, HF Group issued 30.7 million of its shares of common stock to the B&R Global Stockholders.
Pursuant to the Amendment to HF Group’s certificate of incorporation, HF Group currently has authorized share capital of 101,000,000 shares consisting of 100,000,000 shares of common stock with a par value of $0.0001 per share and 1,000,000 shares of preferred stock with a par value of $0.0001 per share.
Immediately after the Business Combination, HF Group’s pre-Business Combination public shareholders owned approximately 12% of HF Group, HF Group’s pre-Business Combination directors, officers and affiliates owned approximately 29.1% of HF Group, and the B&R Global Stockholders owned approximately 58.9% of HF Group.
In connection with the Business Combination:
|
● |
HF Group, Xiao Mou Zhang, as representative of the stockholders of B&R Group, and Loeb & Loeb LLP, as escrow agent, entered into an Escrow Agreement pursuant to which HF Group deposited shares of HF Group common stock representing 5% of the aggregate amount of shares issued to the B&R Global Stockholders pursuant to the Merger, to secure the indemnification obligations of the B&R Global Stockholders as contemplated by the Merger Agreement. |
|
● |
Certain shareholders of HF Group and certain of the B&R Global Stockholders entered into a Tag-Along Agreement, which provides the stockholder parties thereto with tag-along rights in the event any such stockholder desires to sell his or her HF Group securities in a private transaction, or enter into any transaction that would have the same effect as a sale, or enter into any swap, hedge or other arrangement that transfers, in whole or in part, any of the economic consequences of ownership of such shares, or to enter into any transaction, swap, hedge or other arrangement, or engage in any short sales with respect to any such securities. |
|
● |
HF Group and the B&R Global Stockholders entered into a Registration Rights Agreement to provide for the registration of the common stock issued to the B&R Global Stockholders in connection with the Business Combination. The B&R Global Stockholders will be entitled to “piggy-back” registration rights with respect to registration statements filed following the consummation of the Business Combination, and will have certain demand rights for registration. HF Group will bear the expenses incurred in connection with the filing of any such registration statements. |
|
● |
HF Group, B&R Global, and certain of the B&R Global Stockholders entered into a five year Voting Agreement, which provided that, immediately after the closing of the Business Combination, (i) Zhou Min Ni, the prior Chief Executive Officer of HF Group, would continue to serve as a director and the chairman of the board of the Company and as its Co-CEO; (ii) Xiao Mou Zhang, the pre-Business Combination Chief Executive Officer of B&R Global, would begin serving as a director of HF Group and its Co-CEO; (iii) Zhou Min Ni would select one person to serve as an independent director of the Company, (iv) Xiao Mou Zhang would select one person to serve as an independent director, and (v) Zhou Min Ni and Xiao Mou Zhang would jointly select one person to serve as an independent director. |
Acquisition of Warehouse Facilities
On January 17, 2020, the Company completed the transactions contemplated by that certain membership interest purchase agreement dated the same date (the “Purchase Agreement”) by and among its subsidiary B&R Global, B&R Group Realty, and nine subsidiary limited liability companies wholly owned by B&R Group Realty (the “B&R Realty Subsidiaries”) (the “Acquisition”). Capitalized terms used herein without definition have the meaning given to them in the Purchase Agreement
Pursuant to the Purchase Agreement, B&R Global acquired all equity membership interests in the B&R Realty Subsidiaries, which own warehouse facilities that were being leased by the Company for its operations in California, Arizona, Utah, Colorado, Washington, and Montana. Co-CEO of the Company, Peter Zhang, managed and owned an 8.91% interest in B&R Group Realty. The total purchase price for the Acquisition was set at $101,269,706. Financing for the Acquisition was provided under the Second Amended and Restated Credit Agreement, the terms of which are set forth below, and the lender parties thereto relied upon the appraisals in determining to provide such financing. Based in part on the foregoing, the special transactions review committee, composed of the Company’s independent directors, reviewed and approved the Acquisition and the related financing on behalf of HF Group’s board.
Consideration for the Acquisition was a funded by (i) $75.6 million in mortgage-backed term loans financed under the Second Amended and Restated Credit Agreement, (ii) issuance by B&R Global and the Company of a $7.0 million Unsecured Subordinated Promissory Note (the “Note”) to B&R Group Realty, and (iii) payment of $18.7 million from funds drawn from the Company’s revolving credit facility. The restatement of the mortgage-backed term loans released B&R Group Realty from its obligations to the lenders under the First Amended Credit Agreement and predecessor financing arrangements.
Amendment to Credit Facility
On November 4, 2019, the Company, B&R Global, and certain of the wholly-owned subsidiaries and affiliates of the Company (collectively with the Company, the “Borrowers”), as borrowers, and certain material subsidiaries of the Company as guarantors, entered into an Amended and Restated Credit Agreement (the “Amended Credit Agreement”) with JPMorgan Chase Bank, N.A. (“JPMorgan”), as Administrative Agent, and certain lender parties thereto. The Amended Credit Agreement provided for (a) a $100 million asset-secured revolving credit facility maturing on November 4, 2022, and (b) mortgage-secured Term Loans of $55.4 million, and amended and restated the existing $75 million secured revolving credit facility and $60 million of real estate term loans evidenced by that certain Credit Agreement, dated as of November 6, 2017, among B&R Global, its affiliates and JP Morgan Chase Bank, N.A., as the sole lender.
On January 17, 2020, the Company, B&R Global, and the Borrowers, and certain material subsidiaries of the Company as guarantors, entered into a Second Amended and Restated Credit Agreement (the “Second Amended Credit Agreement”) by and among JPMorgan, as Administrative Agent, and certain lender parties thereto, including Comerica Bank. The Second Amended Credit Agreement provided for (a) a $100 million asset-secured revolving credit facility maturing on November 4, 2022 (the “Facility”), and (b) mortgage-secured Term Loans of $75.6 million. The Second Amended Credit Agreement amended and restated the existing $55.0 million of real estate term loans under the Amended Credit Agreement. As of January 17, 2020, the existing balance of revolving debt under the Amended Credit Agreement, $41.2 million, was rolled over, and an additional $18.7 million available to the Company under the Facility was drawn. The Company used the $75.6 million in mortgage-secured term loans and $18.7 million drawn from the revolving credit facility to fund in part the Acquisition.
Borrowings under the Second Amended Credit Agreement may be used for, among other things, working capital and other general corporate purposes of the Company and its subsidiaries (including permitted acquisitions). The Borrowers have the ability to increase the amount of the Facility, which increases may take the form of increases to the revolving credit commitments, by an aggregate amount of up to $30 million upon satisfaction of customary conditions precedent for such increases, or incremental loans and receipt of additional commitments by one or more existing or new lenders.
Borrowings under the Facility bear interest at a floating rate which will be, at the Borrowers’ option, either LIBOR plus 1.375%, or a base rate of prime rate minus 1.125%. The Term Loans bear interest at a floating rate which will be, at the Borrowers’ option, either LIBOR plus 1.875%, or a base rate of prime rate minus 0.625%. A commitment fee of 0.15% is payable monthly in arrears based on the daily amount of the undrawn portion of each lender’s revolving credit commitments under the Facility.
Business Model and Competitive Advantage
We are committed to providing our customers with a wide range of products at competitive prices. Since inception, we have differentiated ourselves from our competitors with our distinctive product portfolio, supplier relationships, strategic locations, and technology. Our wide range of Asian Specialty product offerings sets us apart from other mainstream competitors such as Sysco and US Foods, as many of the items we offer are specific to the Chinese restaurant industry. More importantly, our relationships with our suppliers allow us to procure a large variety of products in volume at a low cost. We also import specialized items that would be difficult to procure domestically. With fourteen warehouses and over three hundred trucks executing daily routes within 300 miles of our distribution centers, we offer our customers prompt delivery of high-quality products.
We believe that the following elements of our business model provide us with a competitive advantage and has contributed greatly to our success:
|
● |
We offer a wide array of specialty products that are not commonly provided by large distributors serving the mainstream market. |
|
● |
We have a deep understanding of Chinese culture and most of our employees can speak the native language of our customers. |
|
● |
We lower administrative expenses by outsourcing our telephone-based sales and customer service directly to a call center located in China, which serves our customers with Chinese speaking agents. |
|
● |
We capitalize on economies of scale and have strong negotiating power with our suppliers. |
|
● |
We have strategically placed distribution centers and with a trucking fleet with routes limited to 3 to 5 hours of driving time. Our customers receive their orders quickly. |
|
● |
With our self-developed proprietary information system, we are able to manage our customer relationships and inventory efficiently and reduce operating expenses. |
|
● |
Employees’ bilingual capabilities provide a competitive advantage against other major providers in the industry. |
We plan to strategically consolidate our market segment by acquiring competitors, including other distributors and wholesalers, to expand our business into untapped regions around the United States and to eventually grow into a nationwide foodservice distributor. We will continue develop our management technology systems to further improve our operational efficiency, accuracy and customer satisfaction. We will also explore providing value-added items such as semi-prepared food products to help our customers upgrade their service.
Industry and Market Analysis
We distribute food and supplies to Chinese/Asian restaurants, primarily Chinese restaurants that mainly serve non-Chinese Americans, which is a niche market segment of the foodservice distribution industry. The foodservice industry in the U.S. is generally large and has a long history, with several large players such as Sysco Corporation, US Foods Holding Corp. and Performance Food Group Company, each serving a significant market share of the industry by offering a food related products and services, or carrying specific products for large chains. However, the Chinese restaurants are generally not well served by these mainstream players which open up opportunity for specialty players like HF Foods Group.
Features of Chinese Restaurants
Set forth below are the principal characteristics of the Chinese/Asian restaurants we serve.
Primarily Serving Non-Chinese Americans. There are tens of thousands of Chinese restaurants spread throughout the U.S., which primarily serve non-Chinese American customers. Although the dishes they serve cater to the preferences of American mainstream customers and are more simply and quickly prepared as compared to traditional full-service Chinese restaurant cuisine, they still require typical Chinese ingredients utilizing traditional cooking styles.
Operated by Chinese Individual Families. Most Chinese restaurants serviced by HF Group are operated and owned by individual families with very few workers, who are usually immigrants from China or second generation Chinese Americans. These restaurant owners have very limited resources and appreciate value-added services to help them improve their operational efficiency. The owners and workers in the Chinese restaurants usually speak Mandarin or other regional dialects of the Chinese language. Understanding the Chinese culture and language is paramount to facilitating efficient communications with customers.
Close-Knit Chinese American Community. Second or third generation Chinese Americans living in the U.S. inherit their traditional cultural, and ethnic languages, and our experience has been that people in these communities prefer to do business with Chinese Americans as opposed to other ethnic groups.
Unique Cooking Style and Ingredients for Chinese Cuisines. Chinese cuisine requires unique cooking styles such as steaming and wokking, and requires specialty ingredients and vegetables such as bitter melons, Chinese yams, vine spinach, Chinese cabbage and winter melon. It also requires Chinese and Asian seasonings and spices, including peanut oil, cooking wine, vinegar, dark soy source, black bean sauce, pepper oil and chili oil. Most of the unique ingredients for Chinese cuisine are not widely available from mainstream U.S. suppliers, but are staple supplies of HF Group.
Growth Potential
Growing Consumption Trend for Food Away from Home. According to National Restaurant Association, the percentage of Americans which prefer food away from home increased from 41.2% in 2014 to 43.8% in 2018. We believe the trend of consuming food away from home likely represents a potential increase of demand for Chinese restaurants.
Increased Recognition of Chinese Cuisines by Americans. With the growing influence of China’s economy and culture, more and more Americans are consuming Chinese cuisines. The management of the Company has seen regularly increasing demand for Chinese cuisine and believes this will result in expanded opportunities for Chinese restaurants, and thus the food distribution industry that supplies them.
Current Industry Landscape and Opportunities
Natural Culture Barriers to Entry. Understanding Chinese cooking culture is important to run a Chinese restaurant and, therefore, most Chinese restaurants are operated by Chinese Americans. It is very difficult for mainstream food distributors to serve these restaurants because of various cultural and language barriers.
Highly Fragmented Market Segment. The market is currently highly fragmented with many unsophisticated competitors and there is no recognized industry leader nationwide. Most participants are small players such as wholesalers, specialty import brokers, farmers markets, and local produce retailers without the support of sophisticated logistics infrastructure. We believe we are the only Chinese food distributor operating in the United States with such a well-developed logistics infrastructure and experienced management team and that the fragmented market gives us the opportunity to consolidate supply and further develop a dominant market position.
Infrastructure Barriers for New Entrants. The food distribution industry requires large capital investments and resources to build the necessary logistics infrastructure including warehouses and a fleet of trucks to cover its distribution network. In addition, the size of HF Group gives us greater negotiating power with vendors, resulting in price advantages for our customers which we believe are simply not achievable by smaller suppliers.
Demand for Value-Added Services. Our customers are Chinese/Asian restaurants, primarily takeout restaurants. These customers are price and quality sensitive and prefer large suppliers with scale economies providing competitive prices for products. Given the limited labor forces and resources of these restaurants, most desire to have more value-added services from the suppliers to help them to operate more efficiently.
In sum, we see a great opportunity for market consolidation. We believe we have numerous advantages to address the current market imperfections and become a national leader in this niche market. With economies of scale, we can provide high quality products at competitive prices in an efficient way.
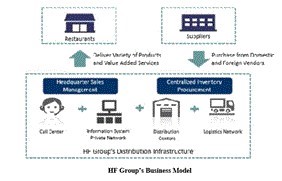
Business Model
Our business model features an integrated structure with fourteen distribution centers with one million square feet of total storage space, a fleet of over 340 vehicles for short-distance delivery, and centralized inventory management and procurement, supported by an outsourced call center located in China for customer relationship management. We offer a variety of high-quality products at competitive prices to our customers. Customers can benefit from our efficient supply chain to support their own growth.
We offer one-stop service to Chinese restaurants with over 1,500 types of products, including fresh and frozen meats, Chinese specialty vegetables, sauces, and packaging materials for takeout restaurants. Chinese restaurants, especially small or takeout restaurants, can find virtually all the products they need in our product lists, which can help minimize the effort involved in managing their purchase of inventory. We use an outsourced call center in Fuzhou, China, with 24-hour availability for sales and marketing, order placement and post-sales service, which reduces our operating costs, and offers service to our customers in Mandarin, Cantonese and regional Chinese dialects, in addition to English.
With 20 years of operations, we have established a large supplier network and we maintain long-term relationships with many major suppliers. The procurement team is led by Zhou Min Ni and Peter Zhang, co-CEOs of the Company, who have a deep insight in the industry. The centralized procurement management system gives us increased negotiating power given the large procurement quantities, improves our turnover of inventory and account payables, and reduces our operating costs.
The graph below depicts our business model:
Products
We offer over 1,500 different products for our clients, primarily Chinese/Asian restaurants, which includes virtually all items needed to operate their business. Products range from perishable produce to takeout food packaging materials. To meet our customers’ demands, we have a large variety and a complete line of products in our inventory. Eighty percent of our sales volume currently consists of domestic goods such as frozen meat and vegetables, which are procured through large suppliers or directly from the producer. The remaining twenty percent are imported specialty products. We provide full service one-stop-shop for our customers by providing most or all of the products they need, from order placement to delivery and post-sales services. Services to customers are supported by our plentiful physical facilities, vehicles, material handling equipment and techniques, and administrative and operating staffs.
The products we distribute include:
|
● |
Asian specialty food items: Asian specialty encompasses any product that has an Asian flair or flavor, including a multitude of noodles, rice, dry goods (dried mushrooms, and dried beans), specialty sauces/ seasonings, spring rolls, and canned products (such as preserved vegetables, bamboo shoots and water chestnut). |
|
● |
Meat and Poultry: We provide our customers with a variety of beef, pork, chicken and duck products with different brands to choose from, such as Smithfield, Teys Australia and Tyson. |
|
● |
Seafood: We are committed to providing our customers with the freshest possible seafood. We provide our clients with all sorts of seafood including lobster, shrimp, crab, scallops and flavorful fish such as tuna and Alaskan salmon, with different brands to choose from, like Asian Star and Atlantic Bay. |
|
● |
Fresh Produce: We offer fresh, seasonal fruits and vegetables including celery, Chinese cabbage, and winter melon, which is widely used in Chinese cuisines. |
|
● |
Packaging and Other Items: We offer a wide range of take-out accessories for customers, from bamboo chopsticks to takeout containers, plastic cups and sushi combo boxes. |
|
● |
Commodities: True commodity products such as regular rice, flour, sugar and oil are classified as “commodity”. |
The following table sets forth sales percentage by category for the year ended December 31, 2019 (pro-forma together with B&R Global Foods for the period prior to the closing of the merger):
|
Category |
|
Percentage |
|
|
|
Asian Specialty |
28 |
% |
||
|
Meat and Poultry |
24 |
% |
||
|
Seafood |
|
|
20 |
% |
|
Fresh Produce |
|
|
13 |
% |
|
Packaging and Others |
|
|
9 |
% |
|
Commodity |
|
|
6 |
% |
Customer Service
We use an outsourced call center located in China to manage our sales order, customer development, sales promotion and post-sales services. The outsourced call center is located in Fuzhou, the capital city of Fujian Province of China, with local employees speaking Mandarin, Cantonese, regional Chinese dialects and English. By offering the customer service in their native language, the sales staff can communicate smoothly and efficiently with our clients and understand what they need. With cultural understanding and a common language, salespeople can design a product portfolio for our customers and use a precision marketing strategy to promote our products. The location of the outsourced call center controls costs by employing skilled salespersons at lower wages in China as compared with the U.S.
We also have a sales team in the U.S., with sales agents that make on-site visits to our customers’ restaurants, in order to gain a better understanding of our customers’ operations and needs.
Currently, we maintain our sales department, which involves decision-making for sales strategies and supervision of sales performance by our key sales managers, in our headquarters in Greensboro, North Carolina and City of Industry, California. The sales managers work closely with the sales staff in China to ensure our market strategies are precisely implemented. Our plan is to further integrate our operating model with the outsourced call center to expand our business and operate even more efficiently.
A proprietary information system is used to maintain each customer’s records, including location, size, contact information, purchasing history, preferences, orders and payment records. Customers can directly call the outsourced call center in China to inquire about products and to place orders. Once orders are confirmed, electronic sales orders are generated by the information system and sent to the distribution center closest to the customer. Upon receipt of the sales orders, products are pulled from the shelves and moved to a staging area at the loading docks. Products are then loaded into delivery vehicles in preparation for delivery. Products are generally delivered to customers within only two days of an order. Customer analysis can be generated through the information system and prompts the salesperson to follow up with customers for product promotion, post-sales services and the taking of new orders.
We offer a refund policy for non-satisfaction without penalty, which many of our small competitors in the market segment are unable to provide. We provide a 100% satisfaction guarantee to our customer. When a shipment is made and the products are not to the standards of the customer, we allow our customers to reject the order in whole or in part with no penalty within 24 hours. The non-penalty refund policy works to help us earn the trust and loyalty of our customers.
Inventory Procurement
The Company utilizes centralized procurement on bulk and frequently sold items. Subsidiaries send their inventory procurement requests to headquarters where the operations team is responsible for fulfillment in the most cost-effective way. The centralized procurement allows HF Group to establish a meaningful vendor relationship under one brand.
We maintain a large supplier network through a vendor pool with a carefully selected group of suppliers to ensure product quality, availability and competitive pricing. Eighty percent of sales volume currently consists of domestic goods such as frozen meat and vegetables, which are procured through large suppliers or directly from the producer. The remaining twenty percent are imported specialty products. To minimize costs, the procurement team directly manages our major vendors for large and frequent purchases and engages brokers for our smaller suppliers of specialty goods. Utilizing brokers allows us to maintain lower costs due to the brokers’ volume.
The key procurement team members closely monitor the supply market for seasonal products such as vegetables and make procurement adjustments according to market conditions. In addition, they use a dual-sourcing method for their suppliers and can negotiate lower prices for comparable products. For high volume sale products such as certain vegetables and meats, we usually negotiate long term agreements with its suppliers to ensure stabile pricing and minimize risk due to market fluctuations.
Each distribution center reviews the inventory level in the information system on a daily basis and submits purchase requests as needed to the procurement team at headquarters. The procurement at headquarters also can alter or adjust purchasing decisions based on an analysis of the inventory data in the system. Upon receipt of ordered products, the delivery schedule is determined based on the needs of each location. The lead-time for products is dependent on the product category and need. For perishable goods, products are usually delivered by suppliers within 72 hours of placing the order. Products that are ordered through import brokers have lead times of up to seven days.
We employ a large supplier network to ensure product availability and low pricing. These suppliers range from small importers of specialty goods to large produce and meat suppliers. JBS USA LLC accounted for approximately 13.2% of our aggregate purchases during the year ended December 31, 2018. None of our suppliers accounted for more than 10% of our aggregate purchases during the year ended December 31, 2019.
Warehousing
We use our information system for warehouse management with daily inventory monitoring. The system allows us to manage our inventory in an efficient way. It optimizes the inventory level and turnover, reducing waste, and helps to reduce labor costs to track and record the inventory.
Inventory levels are maintained based on the category of products. Perishable goods are kept in the refrigerated warehouse for a period of no more than seven days. This includes fresh produce and fresh meat products. Frozen produce, seafood and meat products are kept in the freezer to extend shelf life. Frozen products usually turn over between 30 and 60 days. Non-perishable goods are held in greater quantities of inventory based on the pricing of the market. Non-perishable items are carefully monitored for pricing changes. As they have an extended shelf life, there is an advantage to ordering larger quantities of stock. Non-perishable goods generally turn over in approximately three weeks, which we believe is average for distributors of similar size. Maintaining this level of inventory allows us to manage any surges in demand.
Products are stored throughout warehouses in our various distribution centers. A routine inventory count is taken weekly to ensure stock quantity and replenishment needs. Forty percent of the inventory consists of fresh meats and produce; this inventory is counted daily and turns over on average in about ten days. The other sixty percent consists of frozen and dry goods with interim cycle counts every two weeks and an average turnover of about 30 days. Non-perishable items are stored on racks until their shelf life is reached or the product is sold, whichever comes first. Products are broken down from their pallets and sold in their original packaging. Items stored in the warehouses are not removed from their original packaging. Each package is sold as one unit and priced accordingly.
Locations
We currently have fourteen distribution centers with a total of over one million square feet of storage, including refrigerated storage of over 320,000 square feet. The distribution centers are located on the route of many of our suppliers; delivery of each truckload can be made to each location with one large order. Each warehouse is equipped with multiple loading docks, allowing parallel methods of loading goods to the trucks during the start of each shift. Warehouse locations are also located in industrial regions, allowing large delivery trucks to enter without the need of acquiring permits.
It is important for us to strategically place our warehouses within certain markets to maximize our market share. We currently strategically place our warehouses within markets that are not saturated and have limited competitors. This allows us to quickly penetrate the market and develop customer relationships that will assist in promotion of products and services. Upon penetrating the market, we seek to expand our warehouses into regional areas in order to streamline our distribution network. This strategy is designed to improve the delivery routes and maximize the utilization of our delivery vehicles.
The table below summarizes certain details of our distribution centers:
|
Location |
Total Size |
Size of Cooler and |
Year |
Number of |
||||||||||||
|
Phoenix, AZ |
68,000 | 14,000 | 2011 | 18 | ||||||||||||
|
City of Industry, CA |
128,000 | 35,000 | 2013 | 87 | ||||||||||||
|
Fresno, CA |
10,000 | 3,000 | 2011 | ---- | ||||||||||||
|
Hayward, CA |
108,000 | 36,000 | 2012 | 29 | ||||||||||||
|
Irwindale, CA |
85,000 | 45,000 | 2006 | 29 | ||||||||||||
|
West Sacramento, CA |
25,000 | 8,000 | 2011 | 19 | ||||||||||||
|
Aurora, CO |
55,000 | 16,000 | 2010 | 18 | ||||||||||||
|
Ocala, FL |
130,000 | 30,000 | 2008 | 35 | ||||||||||||
|
Atlanta, GA |
100,000 | 25,000 | 2006 | 20 | ||||||||||||
|
Hardin, MT |
16,000 | 5,000 | 2011 | --- | ||||||||||||
|
Greensboro, NC |
170,000 | 45,000 | 2002 | 50 | ||||||||||||
|
Murray, UT |
59,000 | 14,000 | 2013 | 14 | ||||||||||||
|
West Jordan, UT |
34,000 | 10,000 | 2006 | --- | ||||||||||||
|
Renton, WA |
70,000 | 40,000 | 2015 | 24 | ||||||||||||
|
Total: |
1,058,000 | 326,000 | 343 | |||||||||||||
Fleet Management
We currently own a fleet of over 340 refrigerated vehicles. Vehicles range from vans, 26-foot semi-delivery trucks, to 53-foot long refrigerated trucks and trailer units. These vehicles are maintained by both in-house and external mechanics and follow a strict maintenance schedule. Each vehicle has a 7-year life cycle of approximately 250,000 miles. Each vehicle is refueled daily upon return from its delivery route. When smaller delivery vehicle reaches the end of their usable life, they will be retired and replaced with larger vehicles that are 53 feet long and have a capacity of 40,000 lbs.
Promotion and Marketing
We don’t advertise in the media or magazines. We believe that it is more efficient and cost effective to promote our business through telemarketing and have our drivers promote our business while executing deliveries. Our drivers visit the Chinese/Asian restaurants along their delivery route and are trained to market our products to non-customers along their route. Telemarketing is conducted by salespersons from the outsourced call center in China.
Competitive Strengths
We believe we have the following competitive strengths that give us an advantage over our competitors in the niche industry sector of food service distribution to Chinese restaurants:
A Large Array of Products to Meet the Demands of Customers. We offer over 1,500 products ranging from meats, vegetables and specialty products to packaging materials. Compared with the mainstream foodservice distributors in the United States, our products are selected to meet the specific demands of Chinese restaurants. A large array of products allows Chinese restaurants to purchase from us virtually all of the products they need for operation, and receive one-stop service, which can help them run their business more efficiently with limited operation resources.
Cultural Understanding and Language Advantages. By offering customers service in their native language, the salespersons can communicate smoothly and efficiently with our customers and understand what the customers need. With cultural understanding and a common language, our sales staff can design a product portfolio for our customers and use a precision marketing strategy to promote our products. The location of the outsourced call center controls costs by employing skilled salespersons at lower wages in China as compared with the U.S.
Outsourced Customer Call Center with Low Costs. We use an outsourced call center in China to manage our sales order, customer development, sales promotion, and post-sales services. The outsourced call center is located in Fuzhou, the capital city of Fujian Province of China, with local employees speaking Mandarin, Cantonese, regional Chinese dialects and English. In addition to the advantage provided by interacting with customers in their native language, the location of the outsourced call center also helps us control costs by employing skilled salespersons at lower wages in China as compared with the U.S.
Cost Efficiency with Economies of Scale. We have developed our business around our three distribution centers serving over 3,200 Chinese restaurants in ten states in the southeastern United States and eleven distribution centers serving over 6800 customers in over ten states in the Western United States. We believe we are the only Asian/Chinese food service distributor with a well-developed logistic infrastructure and experienced management team in the regions covered by our distribution network. Compared with small and local distributors, we operate in a more cost-efficient manner and have generated economies of scale, which allows us to offer products with competitive prices to our customers.
Strong Negotiation Power with Vendors. With a large purchase volume and a centralized procurement management, we have strong negotiating power with our vendors and are able to source high quality products at lower prices than many competitors. With a developed inventory procurement system supported by strong negotiating power and an experienced management team, we can offer our customers high quality products at competitive prices.
Developed Logistics Infrastructure. We have developed a sophisticated infrastructure with fourteen distribution centers in the U.S. having a total storage capacity of over one million square feet and a fleet of over 300 vehicles. The Company operates three distribution centers in the, southeastern United States, serving North Carolina, South Carolina, Georgia, Florida, Alabama, Virginia, West Virginia, Tennessee, Kentucky, and Mississippi. We have eleven additional distribution centers in the Western United States, serving customers in Arizona, California, Colorado, Montana, Nevada, Oregon, Utah, Washington, and elsewhere. In conjunction with the development of our logistics infrastructure and business expansion, we have also developed our proprietary information system to manage our customer relationships and inventory. The logistics infrastructure provides efficiency and economies of scale resulting in significant advantages for us and creates a high entry barrier for potential competitors.
Proprietary Information System. We have developed a proprietary electronic information system for our customer relationship and inventory management. All customer information including preferences, purchases and payment history is recorded in the system and can be used to provide post-sales services and promotion. We use this system to monitor our inventory daily, which provides prompt management of inventory and access to important historical information to make operating decisions quickly. The use of the electronic information system improves our management efficiency and reduces operating costs and makes us more competitive in the industry.
Experienced Management and Proven Growth. Key management personnel include Mr. Zhou Min Ni, Co-Chief Executive Officer, and Peter Zhang, Co-Chief Executive Officer, each of whom founded the respective east- and west-coast operations of the current Company, which has have grown it into a regional industry leader serving over 11,000 Chinese restaurants in more than twenty states in the southeastern and western U.S. over the past 20 years. The Company has also built a top-tier management team with operational experience, financial expertise and IT knowledge to grow the business. We believe that we are well-positioned to expand our business into other underserved regions through consolidation of small competitors.
Competition
The foodservice distribution industry is large and highly competitive. There are a few very large distributors serving the mainstream U.S. market. However, with natural cultural barriers, the mainstream foodservice distributors haven’t yet earned a significant market share for Chinese restaurants. Management believes that the market participants in the niche market segment that we are serving is highly fragmented and immature. With the continuing growth of demand for Chinese cuisine, we believe that this industry sector has significant opportunity for consolidation.
The competitors serving the industry sector for Chinese restaurants include a large number of small wholesalers, some medium-sized distributors, as well as large established market players. However, we believe there is no dominating market provider in this segment. Our customers also make purchases from local farms, retailers and grocery stores. Small wholesalers sometimes supply the same specialized items such as spices, specialized sauces, and specialty foods, which we carry, but these small suppliers are not able to offer the same broad base and wide array of products that we do. Compared with the medium-sized distributors and large mainstream market players, we have the advantages of offering a broad line of both staple and niche products, efficient operation infrastructure, and cultural understanding to maintain our market position and continue to grow our business.
Trademarks and Other Intellectual Property
We own several registered trademarks, including the following word marks -- : Han Feng, Inc., Green Leave, Rong, 333, Sea888 (U.S. Regis. No. 5520118), and Sea333 (U.S. Regis. No. 5503974), and the following design/combined marks -- SEA333 (U.S. Regis. No. 5713248), HF [Color Logo] (U.S. Regis. No. 5888817) and HF [B/W Logo] (U.S. Regis. No. 5985676).
Insurance
We use insurance to provide coverage for potential liability for workers compensation, automobile and general liability, product liability, director and officer’s liability, employee health care benefits and other casualty and property risks coverage. Changes in legal trends and interpretations, variability in inflation rates, changes in the nature and method of claims settlement, benefit level changes due to changes in applicable laws, insolvency or insurance carriers, and changes in discount rates could all affect the ultimate settlements of various claims. We evaluate our insurance requirements on an ongoing basis to ensure we maintain adequate levels of coverage.
Employees
As of December 31, 2019, we had a workforce of approximately 1,000 persons, including both our employees and workers engaged through agency placements, 900 of whom are full-time associates and the remaining 100 of whom work part-time. We have over 150 employees who have worked for us for ten years or more. Our workforce is not unionized and we are not aware of any plans for them to unionize. We have never experienced a strike or significant work stoppage. We regard our employee relations to be good.
Government Regulation
Legal compliance is important to our operations. We are required to comply, and it is our policy to comply, with all applicable laws in the numerous jurisdictions in which we do business.
As a marketer and distributor of food products in the United States, we are subject to the Federal Food, Drug and Cosmetic Act and regulations promulgated thereunder by the U.S. Food and Drug Administration (FDA). The FDA regulates food safety and quality through various statutory and regulatory mandates, including manufacturing and holding requirements for foods through good manufacturing practice regulations, hazard analysis and critical control point (HACCP) requirements for certain foods, and the food and color additive approval process. The agency also specifies the standards of identity for certain foods, prescribes the format and content of information required to appear on food product labels, regulates food contact packaging and materials, and maintains a Reportable Food Registry for the industry to report when there is a reasonable probability that an article of food will cause serious adverse health consequences. For certain product lines, we are also subject to the Federal Meat Inspection Act, the Poultry Products Inspection Act, the Perishable Agricultural Commodities Act, the Packers and Stockyard Act and regulations promulgated by the U.S. Department of Agriculture (USDA) to interpret and implement these statutory provisions. The USDA imposes standards for product safety, quality and sanitation through the federal meat and poultry inspection program. The USDA reviews and approves the labeling of these products and also establishes standards for the grading and commercial acceptance of produce shipments from our suppliers. We are also subject to the Public Health Security and Bioterrorism Preparedness and Response Act of 2002, which imposes certain registration and record keeping requirements on facilities that manufacture, process, pack or hold food for human or animal consumption.
The recently published and pending rules under the Food Safety Modernization Act (FSMA) will significantly expand food safety requirements, including those of the Company. Among other things, FDA regulations implementing the FSMA require us to establish and maintain comprehensive, prevention-based controls across the food supply chain that are both verified and validated. The FSMA also imposes new requirements for food products imported into the U.S. and provides the FDA with mandatory recall authority.
The Company and our products are also subject to state and local regulation through such measures as the licensing of our facilities; enforcement by state and local health agencies of state and local standards for our products; and regulation of our trade practices in connection with the sale of our products. Our facilities are subject to regulations issued pursuant to the U.S. Occupational Safety and Health Act by the U.S. Department of Labor. These regulations require us to comply with certain manufacturing, health and safety standards to protect employees from accidents and to establish hazard communication programs to transmit information on the hazards of certain chemicals which may be present in products that we distribute.
Our distribution facilities must be registered with the FDA biennially and are subject to periodic government agency inspections by the FDA and USDA. Our facilities are generally inspected at least annually by federal and/or state authorities. Further, we are required to establish communication programs to transmit information about the hazards of certain chemicals present in some of the products we distribute.
Our business and employment practices are also subject to regulation by numerous federal, state and local regulatory agencies, including, but not limited to, the U.S. Department of Labor, which sets employment practice standards for workers, and the U.S. Department of Transportation, as well as its agencies, the Surface Transportation Board, the Federal Highway Administration, the Federal Motor Carrier Safety Administration, and the National Highway Traffic Safety Administration, which collectively regulate our trucking business through the regulation of operations, safety, insurance and hazardous materials. We must comply with the safety and fitness regulations promulgated by the Federal Motor Carrier Safety Administration, including those relating to drug and alcohol testing and hours-of service. Such matters as weight and dimension of equipment also fall under federal and state regulations. In addition, we are subject to the U.S. False Claims Act, and similar state statutes, which prohibit the submission of claims for payment to the government that are false and the knowing retention of overpayments.
Our operations are also subject to a broad range of U.S. federal, state, and local environmental laws and regulations, as well as zoning and building regulations. Environmental laws and regulations cover a variety of procedures, including appropriately managing wastewater and stormwater; complying with clean air laws, including those governing vehicle emissions; properly handling and disposal of solid and hazardous wastes; protecting against and appropriately investigating and remediating spills and releases; and monitoring and maintaining underground and aboveground storage tanks for diesel fuel and other petroleum products. As of December 31, 2019, the costs of managing our compliance with environmental laws and regulations was nominal.
The U.S. Foreign Corrupt Practices Act (FCPA) prohibits bribery of public officials to obtain or retain business in foreign jurisdictions. The FCPA also requires us to keep accurate books and records and to maintain internal accounting controls to detect and prevent bribery and to ensure that transactions are properly authorized. We will be required to implement and continue to develop a robust anti-corruption compliance program applicable to our operations which will allow us to detect and prevent bribery and to comply with these and other anti-corruption laws in countries where we operate.
For the purchase of items produced, harvested or manufactured outside of the United States, we are subject to applicable customs laws regarding the import and export of various products. Certain activities, including working with customs brokers and freight forwarders, are subject to applicable regulation by U.S. Customs and Border Protection, which is a part of the Department of Homeland Security.
|
ITEM 1A. |
RISK FACTORS. |
The following are significant factors known to us that could materially adversely affect our business, reputation, operating results, industry, financial position and/or future financial performance.
Risk Factors Relating to Our Business
Unfavorable macroeconomic conditions in the U.S. may adversely affect the results of operations and financial condition of the Company.
The operating results of the Company are substantially affected by the operating and economic conditions in the regions in which we operate. Economic conditions can affect us in the following ways:
|
● |
A reduction in discretionary spending by consumers could adversely impact sales of Chinese/Asian restaurants, and their purchases from us. Future economic conditions affecting disposable consumer income, such as employment levels, business conditions, changes in housing market conditions, the availability of consumer credit, interest rates, tax rates and fuel and energy costs, could reduce overall consumer spending. |
|
● |
Food cost and fuel cost inflation experienced by consumers can lead to reductions in the frequency of and the amount spent by consumers for food-away-from-home purchases, which could negatively impact our business by reducing demand for our products. |
|
● |
Heightened uncertainty in the financial markets negatively affects consumer confidence and discretionary spending, which can cause disruptions with our customers and suppliers. |
|
● |
Liquidity issues and the inability of our customers to consistently access credit markets to obtain cash to support their operations can cause temporary interruptions in our ability to conduct day-to-day transactions involving the collection of funds from such customers. |
|
● |
Liquidity issues and the inability of suppliers to consistently access credit markets to obtain cash to support their operations can cause temporary interruptions in our ability to obtain the foodservice products and supplies needed by us in the quantities and at the prices requested. |
In addition, our existing operations are mainly located in the Southeastern and Western United States. The geographic concentration of our operations creates an exposure to the economy of those regions and any financial downturn in these areas could materially adversely affect our financial condition and results of operations.
Competition may increase intensively in the future, which may adversely impact our margins and ability to retain customers, and make it difficult to maintain our market share, growth rate and profitability.
The foodservice distribution industry in the United States is fragmented and highly competitive, with local, regional, multi-regional distributors, and specialty competitors. However, we believe that the market participants serving Chinese restaurants are highly fragmented. Currently, we face competition from smaller and/or dispersed competitors focusing on the niche market serving Chinese/Asian restaurants, especially Chinese takeout restaurants. However, with the growing demand for Chinese cuisines, others may also begin operating in this niche market in the future. Those potential competitors include: (i) national and regional foodservice distributors, (ii) local wholesalers and brokers, (iii) food retailers, and (iv) farmers’ markets. The national and regional distributors are experienced in operating multiple distribution locations and expanding management, and they have greater marketing and financial resources than we do. Even though they currently offer only a limited selection of Chinese and Asian specialty foods, they may be able to devote greater resources to sourcing, promoting and selling their products if they choose to do so. Conversely, the local wholesalers and brokers are small in size with a deep understanding of local preferences, but their lack of scale results in high risk and limited growth potential.
If more competitors enter this market segment aiming to serve Chinese/Asian restaurants in the future, our operating results may be negatively impacted through a loss of sales, reduction in margins from competitive price changes, and/or greater operating costs, such as marketing costs, due to the increase of competition.
We may not be able to fully compensate for increases in fuel costs when fuel prices experience high volatility, and our operating results would be adversely affected.
Volatile fuel prices have a direct impact on the industry served by us. We require significant quantities of fuel for delivery vehicles and are exposed to the risk associated with fluctuations in the market price for fuel. The price and supply of fuel can fluctuate significantly based on international, political and economic circumstances, as well as other factors outside our control, such as actions by the Organization of the Petroleum Exporting Countries, or OPEC, and other oil and gas producers, regional production patterns, weather conditions and environmental concerns. The cost of fuel affects the price paid by us for products, as well as the costs we incur to deliver products to the customers. Although we have been able to pass along a portion of increased fuel costs to our customers in the past, there is no guarantee that we will be able to do so in the future. If fuel costs increase in the future, we may experience difficulties in passing all or a portion of these costs along to its customers, which may have a negative impact on our results of operations.
Disruption of relationships with vendors could negatively affect our business. Suppliers may increase product prices, which could increase our product costs.
We purchase our food items and related products from third-party suppliers. Although our purchasing volume can provide benefits when dealing with suppliers, suppliers may not provide the products and supplies needed by us in the quantities and at the prices requested. The cancellation of our supply arrangement with any of our suppliers or the disruption, delay and/or inability to supply the requested products by our suppliers could adversely affect our sales. If our suppliers fail to comply with food safety or other laws and regulations, or face allegations of non-compliance, their operations may be disrupted. We cannot assure you that we would be able to find replacement suppliers on commercially reasonable terms.
In addition, we purchase seasonal Chinese vegetables and fruits from farms and other vendors. Increased frequency or duration of extreme weather conditions could impair production capabilities, disrupt our supply chain or impact demand for our products. Input costs could increase at any point in time for a large portion of the products that we sell for a prolonged period. Our inability to obtain adequate supplies of food items and related products as a result of any of the foregoing factors or otherwise could mean that we are unable to fulfill our obligations to customers, and customers may turn to other distributors.
The purchase prices of our products vary from time to time, which is subject to market conditions and negotiation with our suppliers. The prices of some of our products, especially seasonal products, such as vegetables and fruits, have significant fluctuation. We can mitigate the risk of fluctuation in the purchasing and distribution costs by either fixing a price for a certain supply period through negotiation with our suppliers, streamlining our inventory turnover, and passing portions of the price fluctuation to our customers. However, we may not always be able to do that if there are significant and frequent fluctuations. If we are unable to mitigate these price fluctuations, our performance results will be adversely affected.
As a foodservice distributor, it is necessary for us to maintain an inventory of products that may have declines in product pricing levels between the time we purchase the product from suppliers and the time we sell the product to customers, which could reduce the margin on that inventory, adversely affecting our results of operations.
Our relationships with customers may be materially diminished or terminated. The loss of customers could adversely affect our business, financial condition, and results of operations.
We have maintained long-standing relationships with a number of our customers. However, those customers could unilaterally terminate their relationship with us or materially reduce the amount of business they conduct with us at any time. Our customers may shift their purchase orders from us to other competitors due to market competition, change of customer requirements and preferences, or because of the customer’s financial condition. There is no guarantee that we will be able to maintain relationships with any of our customers on acceptable terms, or at all. The loss of a number of customers could adversely affect our business, financial condition, and results of operations.
Changes in consumer eating habits could materially and adversely affect our business, financial condition, and results of operations.
We provide foodservice distribution to Chinese/Asian restaurants, primarily Chinese takeout restaurants, which focus on serving Chinese food to non-Chinese Americans. Changes in consumer eating habits (such as a decline in consuming food away from home, a decline in portion sizes, or a shift in preferences toward western foods) could reduce demand for our products. Consumer eating habits could be affected by a number of factors, including attitudes regarding diet and health or new information regarding the health effects of consuming certain foods. If consumer eating habits change significantly, we may be required to modify or discontinue sales of certain items in our product portfolio, and we may experience higher costs and/or supply shortages associated with our efforts to accommodate those changes as our suppliers adapt to new eating preferences. Additionally, changes in consumer eating habits may result in the enactment or amendment of laws and regulations that impact the ingredients and nutritional content of our food products, or laws and regulations requiring us to disclose the nutritional content of our food products. Compliance with these laws and regulations, as well as others regarding the ingredients and nutritional content of food products, may be costly and time-consuming. We cannot make any assurances regarding our ability to effectively respond to changes in consumer culture preference, health perceptions or resulting new laws or regulations or to adapt our product offerings to trends in eating habits.
The coronavirus pandemic may adversely affect our sources of supply and our sales.
The impact on our business of the coronavirus outbreak is unknown at this time, but the developing situation could have some negative effect on the operations of our suppliers and services vendors, both domestically and in China, as well as on our US domestic sales revenue in the event that consumer behaviors change in response to the public health epidemic.
We may not be able to achieve the financial targets in the projections disclosed in our June 18, 2018 Proxy Statement.
Our ability to meet the financial targets as disclosed in our June 18, 2018 Proxy Statement depends largely on our successful execution of business plan including various related initiatives. There are various risks related to these efforts, including the risk that these efforts may not provide the expected benefits in our anticipated time frame, if at all, and may prove costlier than expected; and the risk of adverse effects to our business, results of operations and liquidity if past and future undertakings, and the associated changes to our business, do not prove to be cost effective or do not result in the cost savings and other benefits at the levels that we anticipate. Our intentions and expectations with regard to the execution of our business plan, and the timing of any related initiatives, are subject to change at any time based on management’s subjective evaluation of our overall business needs. If we are unable to successfully execute our business plan, whether due to the failure to realize the anticipated benefits from our various business initiatives in the anticipated time frame or otherwise, we may be unable to achieve these financial targets.
We may be unable to protect or maintain our intellectual property, which could result in customer confusion, a negative perception of our brand and adversely affect our business.
We believe that our intellectual property has substantial value and has contributed significantly to the success of our business. In particular, our “HF” logo trademarks and the name “Han Feng,” are valuable assets that reinforce our customers’ favorable perception of our products. Our trademark rights and related registrations may be challenged in the future and could be canceled or narrowed. Failure to protect our trademark rights could cause customer confusion or negatively affect customers’ perception of our brand and products, and eventually adversely affect our sales and profitability. Moreover, intellectual property disputes and proceedings and infringement claims may result in a significant distraction for management and significant expense, which may not be recoverable regardless of whether we are successful. Such proceedings may be protracted with no certainty of success, and an adverse outcome could subject us to liability, force us to cease use of certain trademarks or other intellectual property or force us to enter into licenses with others. Any one of these occurrences may have a material adverse effect on our business, results of operations and financial condition.
If we are unable to renew or replace our current leases on favorable terms, or any of our current leases are terminated prior to expiration of their stated terms, and we cannot find suitable alternate locations, our operations and profitability could be negatively impacted.
We currently have leases for some of our warehouses. Our ability to re-negotiate favorable terms on an expiring lease or to negotiate favorable terms for a suitable alternate location, and our ability to negotiate favorable lease terms for additional locations, could depend on conditions in the real estate market, competition for desirable properties, our relationships with current and prospective landlords, and/or other factors that are not within our control. Any or all of these factors and conditions could negatively impact our growth and profitability.
Failure to retain our senior management and other key personnel may adversely affect our operations.
Our success is substantially dependent on the continued service of our senior management and other key personnel. These executives have been primarily responsible for determining the strategic direction of our business and for executing our growth strategy and are integral to our brand and culture, and the reputation the Company enjoys with suppliers and consumers. The loss of the services of any of these executives and other key personnel could have a material adverse effect on our business and prospects, as we may not be able to find suitable individuals to replace them on a timely basis, if at all. In addition, any such departure could be viewed in a negative light by investors and analysts, which may cause our stock price to decline. The loss of key employees could negatively affect our business.
If we are unable to attract, train and retain employees, we may not be able to grow or successfully operate our business.
The foodservice distribution industry is labor intensive. Our success depends in part upon our ability to attract, train and retain a sufficient number of employees who understand and appreciate our culture and are able to represent our brand effectively and establish credibility with our business partners and customers. Our ability to meet our labor needs, while controlling wage and labor-related costs, is subject to numerous external factors, including the availability of a sufficient number of qualified persons in the work force of the regions in which we are located, unemployment levels within those regions, prevailing wage rates, changing demographics, health and other insurance costs and changes in employment legislation. In the event of increasing wage rates, if we fail to increase our wages competitively, the quality of our workforce could decline, causing our customer service to suffer, while increasing our wages could cause our profits to decrease. If we are unable to hire and retain employees capable of meeting our business needs and expectations, our business and brand image may be impaired. Any failure to meet our staffing needs or any material increase in turnover rates of our employees may adversely affect our business, results of operations and financial condition.
Changes in and enforcement of immigration laws could increase our costs and adversely affect our ability to attract and retain qualified employees.
Federal and state governments from time to time implement immigration laws, regulations or programs that regulate our ability to attract or retain qualified foreign employees. Some of these changes may increase our obligations for compliance and oversight, which could subject us to additional costs and make our hiring process more cumbersome or reduce the availability of potential employees. Although we have implemented, and are in the process of enhancing, procedures to ensure our compliance with the employment eligibility verification requirements, there can be no assurance that these procedures are adequate and some of our employees may, without our knowledge, be unauthorized workers. The employment of unauthorized workers may subject us to fines or civil or criminal penalties, and if any of our workers are found to be unauthorized, we could experience adverse publicity that negatively impacts our brand and makes it more difficult to hire and keep qualified employees. We may be required to terminate the employment of certain of our employees who are determined to be unauthorized workers. The termination of a significant number of employees may disrupt our operations, cause temporary increases in our labor costs as we train new employees and result in adverse publicity. Our financial performance could be materially harmed as a result of any of these factors.
Potential labor disputes with employees and increases in labor costs could adversely affect our business.
A considerable amount of our operating costs are attributable to labor costs and, therefore, our financial performance is greatly influenced by increases in wage and benefit costs. As a result, we are exposed to risks associated with a competitive labor market. Rising health care costs and the nature and structure of work rules will always be important issues. Any work stoppages or labor disturbances as a result of employee dissatisfaction with their current employment terms could have a material adverse effect on our financial condition, results of operations and cash flows. We also expect that in the event of a work stoppage or labor disturbance, we could incur additional costs and face increased competition.
If we fail to comply with requirements imposed by applicable law and other governmental regulations, we could become subject to lawsuits, investigations and other liabilities and restrictions on our operations that could significantly and adversely affect our business.
We are subject to regulation by various federal, state, and local governments, applicable to food safety and sanitation, ethical business practices, transportation, minimum wage, overtime, other wage payment requirements, employment discrimination, immigration, and human health and safety. While we attempt to comply with all applicable laws and regulations, we cannot represent that we are in full compliance with all applicable laws and regulations or interpretations of these laws and regulations at all times or that we will be able to comply with any future laws, regulations or interpretations of these laws and regulations. If we fail to comply with applicable laws and regulations, we may be subject to investigations, criminal sanctions or civil remedies, including fines, injunctions, and prohibitions on exporting. The cost of compliance or the consequences of non-compliance, including debarments, could have an adverse effect on our results of operations. In addition, governmental units may make changes in the regulatory frameworks within which we operate that may require us to incur substantial increases in costs in order to comply with such laws and regulations.
If the products distributed by us are alleged to have caused injury or illness, or to have failed to comply with governmental regulations, we may need to recall our products and may experience product liability claims.
We, like any other foodservice distributor, may be subject to product recalls, including voluntary recalls or withdrawals, if the products we distribute are alleged to have caused injury or illness, to have been mislabeled, misbranded, or adulterated or to otherwise have violated applicable governmental regulations. We may also choose to voluntarily recall or withdraw products that we determine do not satisfy our quality standards, whether for taste, appearance, or otherwise, in order to protect our brand and reputation. Any future product recall or withdrawal that results in substantial and unexpected expenditures, destruction of product inventory, damage to our reputation, and/or lost sales due to the unavailability of the product for a period of time, could materially adversely affect our results of operations and financial condition.
We also face the risk of exposure to product liability claims in the event that the use of products sold by us are alleged to have caused injury or illness. We cannot be sure that consumption of our products will not cause a health-related illness in the future or that we will not be subject to claims or lawsuits relating to such matters. Further, even if a product liability claim is unsuccessful or is not fully pursued, the negative publicity surrounding any assertion that our products caused illness or injury could adversely affect our reputation with existing and potential customers and our corporate and brand image.
With respect to product liability claims, we believe we have sufficient insurance coverage. However, this insurance may not continue to be available at a reasonable cost or, if available, may not be adequate to cover all of our liabilities. We generally seek contractual indemnification and insurance coverage from parties supplying products to us, but this indemnification or insurance coverage is limited, as a practical matter, to the creditworthiness of the indemnifying party and the insured limits of any insurance provided by such suppliers. If we do not have adequate insurance or contractual indemnification available, product liability relating to defective products could materially adversely affect our results of operations and financial condition.
We may incur significant costs to comply with environmental laws and regulations, and we may be subject to substantial fines, penalties and/or third-party claims for non-compliance.
Our operations are subject to various federal, state, and local laws, rules and regulations relating to the protection of the environment, including those governing:
|
● |
the discharge of pollutants into the air, soil, and water; |
|
● |
the management and disposal of solid and hazardous materials and wastes; |
|
● |
employee exposure to hazards in the workplace; and |
|
● |
the investigation and remediation of contamination resulting from releases of petroleum products and other regulated materials. |
In the course of business, we operate, maintain, and fuel vehicles; store fuel in on-site above ground containers; operate refrigeration systems; and use and dispose of hazardous substances and food waste. We could incur substantial costs, including fines or penalties and third-party claims for property damage or personal injury, as a result of any violations of environmental or workplace safety laws and regulations or releases of regulated materials into the environment. In addition, we could incur investigation, remediation and/or other costs related to environmental conditions at our currently or formerly owned or operated properties.
Litigation may materially adversely affect our business, financial condition and results of operations.
Our operations carry an exposure to litigation risk from consumers, customers, our labor force and others, and may be a party to individual personal injury, product liability and/or other legal actions in the ordinary course of our business, including litigation arising from food-related illness. The outcome of litigation, particularly class action lawsuits and regulatory actions, is difficult to assess or quantify. Plaintiffs in these types of lawsuits may seek recovery of very large or indeterminate amounts, and the magnitude of the potential loss relating to such lawsuits may remain unknown for substantial periods of time. The cost to defend future litigation may be significant. There may also be adverse publicity associated with litigation that may decrease consumer confidence in our businesses, regardless of whether the allegations are valid or whether we are ultimately found liable. As a result, litigation may materially adversely affect our businesses, financial condition, results of operations and cash flows.
Increased commodity prices and availability may impact profitability.
Many of our products include ingredients such as wheat, corn, oils, sugar, and other commodities. Commodity prices worldwide have been increasing. While commodity price inputs do not typically represent the substantial majority of our product costs, any increase in commodity prices may cause our vendors to seek price increases from us. Although we are typically able to mitigate vendor efforts to increase our costs, we may be unable to continue to do so, either in whole or in part. In the event we are unable to continue mitigating potential vendor price increases, we may in turn consider raising our prices, and our customers may be deterred by any such price increases. Our profitability may be impacted through increased costs to us which may affect our gross margins, or through reduced revenue as a result of a decline in the number and average size of customer transactions.
The U.S. government is currently imposing increased tariffs on certain products imported into the U.S., including products imported from China, which may have an adverse impact on our future operating results.
We sell our products based on the cost of such products plus a percentage markup. We import approximately 20% of our products from other countries, including China. The U.S. government is currently imposing and proposing increased tariffs on certain products imported into the U.S., including products imported from China. Some of our imported products may be subject to these increased tariffs and accordingly, our purchase costs will be increased. We may determine to increase our sales prices in order to pass these increased costs to our customers. In the event we determine to take such action, our customers may reduce their orders from us, which could negatively affect our profitability and operating results.
Severe weather, natural disasters and adverse climate changes may materially adversely affect our financial condition and results of operations.
Severe weather conditions and other natural disasters in areas where our distribution network covers or from which we obtain the products we sell may materially adversely affect our operations and our product offerings and, therefore, our results of operations. Such conditions may result in physical damage to, or temporary or permanent closure of, one or more of our distribution centers, an insufficient work force in our market regions and/or temporary disruption in the supply of products, including delays in the delivery of goods to our warehouses and/or a reduction in the availability of products in our offerings. In addition, adverse climate conditions and adverse weather patterns, such as drought or flood, that impact growing conditions and the quantity and quality of crops may materially adversely affect the availability or cost of certain products within our supply chain. Any of these factors may disrupt our businesses and materially adversely affect our financial condition, results of operations and cash flows.
We rely on technology in our business and any cybersecurity incident, other technology disruption or delay in implementing new technology could negatively affect our business and our relationships with customers.
We use technology in our business operations, and our ability to serve customers most effectively depends on the reliability of our technology systems. We use software and other technology systems, among other things, to generate and select orders, to make purchases, to manage warehouses and to monitor and manage our business on a day-to-day basis. Further, our business involves the storage and transmission of numerous classes of sensitive and/or confidential information and intellectual property, including customers’ and suppliers’ personal information, private information about employees, and financial and strategic information about the company and its business partners.
These technology systems are vulnerable to disruption from circumstances beyond our control, including fire, natural disasters, power outages, systems failures, security breaches, espionage, cyber-attacks, viruses, theft and inadvertent releases of information. Any such disruption to these software and other technology systems, or the technology systems of third parties on which we rely, the failure of these systems to otherwise perform as anticipated, or the theft, destruction, loss, misappropriation, or release of sensitive and/or confidential information or intellectual property, could result in business disruption, negative publicity, brand damage, violation of privacy laws, loss of customers, potential liability and competitive disadvantage, any or all of which could potentially adversely affect our customer service, decrease the volume of our business and/or result in increased costs and lower profits.
Further, as we pursue our strategy to grow through acquisitions and to pursue new initiatives that improve our operations and cost structure, we are also expanding and improving our information technology, resulting in a larger technological presence and corresponding exposure to cybersecurity risk. If we fail to assess and identify cybersecurity risks associated with acquisitions and new initiatives, we may become increasingly vulnerable to such risks. Information technology systems continue to evolve and, in order to remain competitive, we need to implement new technologies in a timely and efficient manner. If our competitors implement new technologies more quickly or successfully than we do, such competitors may be able to provide lower cost or enhanced services of superior quality compared to those we provide, which could have an adverse effect on our results of operations.
Our current indebtedness may adversely affect our liquidity position and ability of future financing.
As of December 31, 2019, we have $8.194 million of debt borrowed from bank credit lines and $14.565 million of long-term mortgage loans, which could adversely affect our cash flow, our ability to raise additional capital or obtain financing in the future, react to changes in business and repay other debts. On January 17, 2020, the Company, B&R Global, and the Borrowers, and certain material subsidiaries of the Company as guarantors, entered into a Second Amended and Restated Credit Agreement (the “Second Amended Credit Agreement”) by and among JPMorgan, as Administrative Agent, and certain lender parties thereto, including Comerica Bank. The Second Amended Credit Agreement provided for (a) a $100 million asset-secured revolving credit facility maturing on November 4, 2022 (the “Facility”), and (b) mortgage-secured Term Loans of $75.6 million. The Second Amended Credit Agreement amended and restated the existing $55.0 million of real estate term loans under the Amended Credit Agreement. As of January 17, 2020, the existing balance of revolving debt under the Amended Credit Agreement, $41.2 million, was rolled over, and an additional $18.7 million available to the Company under the Facility was drawn. These bank loans contain covenants that restrict our ability to incur additional debt and operate our business. We may not be able to generate a sufficient amount of cash needed to pay interest and principal on our debt facilities or refinance all or a portion of our indebtedness, due to a number of factors, including significant change of economic conditions, market competition, weather conditions, natural disaster, and failure to execute our business plan.
Risk Factors Relating to our Acquisition Strategy
HF Group has incurred and expects to incur significant costs associated with the Business Combination. These costs have reduced the amount of cash available to be used for other corporate purposes.
HF Group incurred significant costs associated with the Business Combination – approximately $0.8 million in the aggregate. These expenses have reduced the amount of cash available to be used for other corporate purposes.
Our continued growth depends on future acquisitions of other distributors or wholesalers and enlarging our customer bases. The failure to achieve these goals could negatively impact our results of operations and financial condition.
Historically, a portion of our growth has come through acquisitions, and our growth strategy depends, in large part, on acquiring other distributors or wholesalers to access untapped market regions and enlarge our customer base. Successful implementation of this strategy is dependent on sufficient capital support from financing, finding suitable targets to acquire, identifying suitable locations and negotiating acceptable acquisition prices and terms. There can be no assurance that we will continue to grow through acquisitions. We may not be able to obtain sufficient capital support for our expansion plan, or successfully implement the plan to acquire other competitors timely or within budget or operate those businesses successfully.
If we are unable to integrate acquired businesses successfully (including B&R Global) or realize anticipated economic, operational and other benefits and synergies in a timely manner, our earnings may be materially adversely affected. A significant expansion of our business and operations, in terms of geography or magnitude (such as with the Business Combination), could strain our administrative and operational resources. Significant acquisitions may also require the issuance of material additional amounts of debt or equity, which could materially alter our debt-to-equity ratio, increase our interest expense and decrease net income, and make it difficult for us to obtain favorable financing for other acquisitions or capital investments.
Our operating results will be adversely affected if we fail to implement our growth strategy or if we invest resources in a growth strategy that ultimately proves unsuccessful.
There is a scarcity of and competition for acquisition opportunities.
There are a limited number of operating companies available for acquisition that we deem to be desirable targets. In addition, there is a very high level of competition among companies seeking to acquire these operating companies. Many established and well-financed entities are active in acquiring interests in companies that we may find to be desirable acquisition candidates. Many of these entities have significantly greater financial resources, technical expertise and managerial capabilities than we do. Consequently, we will be at a competitive disadvantage in negotiating and executing possible acquisitions of such businesses. Even if we are able to successfully compete with these larger entities, this competition may affect the terms of the transactions we are able to negotiate and, as a result, we may pay more or receive less favorable terms than we expected for potential acquisitions. We may not be able to identify operating companies that complement our strategy, and even if we identify a company that does so, we may be unable to complete an acquisition of such a company for many reasons, including:
|
● |
failure to agree on necessary terms, such as the purchase price; |
|
● |
incompatibility between our operational strategies and management philosophies with those of the potential acquiree; |
|
● |
competition from other acquirers of operating companies; |
|
● |
lack of sufficient capital to acquire a profitable company; and |
|
● |
unwillingness of a potential acquiree to work with our management. |
Risks related to acquisition financing.
We have a limited amount of financial resources and our ability to make additional acquisitions without securing additional financing from outside sources is limited. In order to continue to pursue our acquisition strategy, we may be required to obtain additional financing. We may obtain such financing through a combination of traditional debt financing and/or the placement of debt and equity securities. We may finance some portion of our future acquisitions by either issuing equity or by using shares of our common stock for all or a portion of the purchase price for such businesses. In the event that our common stock does not attain or maintain a sufficient market value, or potential acquisition candidates are otherwise unwilling to accept our common stock as part of the purchase price for the sale of their businesses, we may be required to use more of our cash resources, if available, in order to maintain our acquisition program. If we do not have sufficient cash resources, we will not be able to complete acquisitions and our growth could be limited unless we are able to obtain additional capital through debt or equity financings. The terms of our credit facility require that we obtain the consent of our lenders prior to securing additional debt financing. There could be circumstances in which our ability to obtain additional debt financing could be constrained if we are unable to secure such consent.
To the extent we make any material acquisitions, our earnings may be adversely affected by non-cash charges relating to the amortization of intangible assets.
Under applicable accounting standards, purchasers are required to allocate the total consideration paid in a business combination to the identified acquired assets and liabilities based on their fair values at the time of acquisition. The excess of the consideration paid to acquire a business over the fair value of the identifiable tangible assets acquired must be allocated among identifiable intangible assets including goodwill. The amount allocated to goodwill is not subject to amortization. However, it is tested at least annually for impairment. The amount allocated to identifiable intangible assets, such as customer relationships and the like, is amortized over the life of these intangible assets. We expect that this will subject us to periodic charges against our earnings to the extent of the amortization incurred for that period. Because our business strategy focuses, in part, on growth through acquisitions, our future earnings may be subject to greater non-cash amortization charges than a company whose earnings are derived solely from organic growth. As a result, we may experience an increase in non-cash charges related to the amortization of intangible assets acquired in our acquisitions. Our financial statements will show that our intangible assets are diminishing in value, even if the acquired businesses are increasing (or not diminishing) in value.
We are not obligated to follow any particular criteria or standards for identifying acquisition candidates.
We are not obligated to follow any particular operating, financial, geographic or other criteria in evaluating candidates for potential acquisitions or business combinations. We will determine the purchase price and other terms and conditions of acquisitions. Our stockholders will not have the opportunity to evaluate the relevant economic, financial and other information that our management team will use and consider in deciding whether or not to enter into a particular transaction.
We may be required to incur a significant amount of indebtedness in order to successfully implement our acquisition strategy.
Subject to the restrictions contained under our current credit facilities, we may be required to incur a significant amount of indebtedness in order to complete future acquisitions. If we are not able to generate sufficient cash flow from the operations of acquired businesses to make scheduled payments of principal and interest on the indebtedness, then we will be required to use our capital for such payments. This will restrict our ability to make additional acquisitions. We may also be forced to sell an acquired business in order to satisfy indebtedness. We cannot be certain that we will be able to operate profitably once we incur this indebtedness or that we will be able to generate a sufficient amount of proceeds from the ultimate disposition of such acquired businesses to repay the indebtedness incurred to make these acquisitions.
We may experience difficulties in integrating the operations, personnel and assets of acquired businesses that may disrupt our business, dilute stockholder value and adversely affect our operating results.
A core component of our business plan is to acquire businesses and assets in the food distribution industry. There can be no assurance that we will be able to identify, acquire or profitably manage businesses or successfully integrate acquired businesses into the Company without substantial costs, delays or other operational or financial problems. Such acquisitions also involve numerous operational risks, including:
|
● |
difficulties in integrating operations, technologies, services and personnel; |
|
● |
the diversion of financial and management resources from existing operations; |
|
● |
the risk of entering new markets; |
|
● |
the potential loss of existing or acquired strategic operating partners following an acquisition; |
|
● |
the potential loss of key employees following an acquisition and the associated risk of competitive efforts from such departed personnel; |
|
● |
possible legal disputes with the acquired company following an acquisition; and |
|
● |
the inability to generate sufficient revenue to offset acquisition or investment costs. |
As a result, if we fail to properly evaluate and execute any acquisitions or investments, our business and prospects may be seriously harmed.
Risk Factors Relating to our Common Stock
A trading market for our common stock may not be sustained and our common stock prices could decline.
Although our common stock is listed on the Nasdaq Capital Market under the symbol “HFFG”, an active trading market for the shares of our common stock may not be sustained. Accordingly, no assurance can be given as to the following:
|
● |
the likelihood that an active trading market for shares of our common stock will be sustained; |
|
● |
the liquidity of any such market; |
|
● |
the ability of our stockholders to sell their shares of common stock; or |
|
● |
the price that our stockholders may obtain for their common stock. |
In addition, our common stock has experienced price and volume volatility over the past year. The market price and volume of our common stock may continue to experience fluctuations not only due to general stock market conditions but also due to government regulatory action, tax laws, interest rates, the condition of the U.S. economy and a change in sentiment in the market regarding our industry, operations or business prospects. In addition to other factors, the price and volume volatility of our common stock may be affected by:
|
● |
factors influencing consumer food choices; |
|
● |
the operating and securities price performance of companies that investors consider comparable to us; |
|
● |
announcements of strategic developments, acquisitions and other material events by us or our competitors; |
|
● |
changes in global financial markets and global economies and general market conditions, such as tariffs, interest rates, commodity and equity prices and the value of financial assets; |
|
● |
additions or departures of key personnel; |
|
● |
operating results that vary from the expectations of securities analysts and investors; |
|
● |
sales of our equity securities by stockholders or management or sales of additional equity securities by us; |
|
● |
actions by stockholders; and |
|
● |
passage of legislation or other regulatory developments that adversely affect us or our industry. |
If an active market is not maintained, or if our common stock continues to experience price and volume volatility, the market price of our common stock may decline.
Stockholders of a public company sometimes bring securities class action suits against the company following periods of instability in the market price of that company’s securities. If we were involved in a class action suit, it could divert a significant amount of our management’s attention and other resources from our business and operations, which could harm our results of operations and require us to incur significant expenses to defend the suit. Any such class action suit, whether or not successful, could harm our reputation and restrict our ability to raise capital in the future. In addition, if a claim is successfully made against us, we may be required to pay significant damages, which could have a material adverse effect on our results of operations and financial condition.
Furthermore, our ability to raise funds through the issuance of equity securities or otherwise by using our common stock as consideration is impacted by the price of our common stock. A low stock price may adversely impact our ability to reduce our financial leverage, as measured by the ratio of total debt to total capital. Continued high levels of leverage or significant increases may adversely affect our credit ratings and make it more difficult for us to access additional capital. These factors may limit our ability to implement our operating and growth plans.
Our executive officers beneficially own approximately 16.2% of our outstanding common stock and have the ability to control our business and affairs, which may prevent us from taking actions that may be favorable to our other stockholders.
As of March 13, 2020, our executive officers beneficially owned approximately 8,448,592 of our outstanding common stock, representing approximately 16.2% of the voting power of our capital stock. As a result, our executive officers may have the ability to control all matters requiring approval by our stockholders, including the election and removal of directors and any proposed merger, consolidation or sale of all or substantially all of our assets. This concentration of ownership could have the effect of delaying, deferring or preventing a change in control of the Company or impeding a merger or consolidation, takeover or other business combination involving us that could be favorable to you.
Our current management does not have corporate governance experience, and we may need to recruit expertise on corporate governance and capital markets to comply with the regulations and effectively communicate with the capital markets, which may increase our operating expenses.
Our current management doesn’t have experience in running a public company and conducting the corporate governance required of a public company. It may take time for our management team to learn to comply with the reporting, disclosure and corporate governance requirements and listing standards of the Nasdaq Stock Market. We may need to recruit expertise on corporate governance and capital markets to comply with applicable regulations and effectively communicate with the capital markets, which may increase our operating expenses.
We have identified material weaknesses in our internal control over financial reporting, which could affect our ability to ensure timely and reliable financial reports, affect the ability of our auditors to attest to the effectiveness of our internal controls, and weaken investor confidence in our financial reporting.
The Sarbanes-Oxley Act of 2002 requires, among other things, that we design, implement and maintain adequate internal controls and procedures over financial reporting. Our management has concluded that (i) our internal controls over financial reporting were not effective as of December 31, 2019, (ii) there existed material weaknesses in our internal control over financial reporting as of December 31, 2019, and (iii) our disclosure controls and procedures were not effective as of December 31, 2019. Please see the discussion of these conclusions below under Item 9A. “Controls and Procedures” of this Annual Report on Form 10-K.
We believe we are taking appropriate actions to remediate such material weakness and inadequate disclosure controls and procedures; however, such measures may not be sufficient to address the material weaknesses identified or ensure that our disclosure controls and procedures are effective. We may also discover other material weaknesses in the future. Any failure to maintain or implement required new or improved controls, or any difficulties we encounter in the implementation of such controls, could cause us to fail to meet our periodic reporting obligations or result in material misstatements in our financial statements and affect the ability of our auditors to attest to the effectiveness of our internal controls over financing reporting. In addition, substantial costs and resources may be required to rectify any internal control deficiencies. If we cannot produce reliable financial reports, investors could lose confidence in our reported financial information, the market price of our common stock could decline significantly, and our business and financial condition could be adversely affected.
We are not required to obtain an attestation report on our assessment of our internal control over financial reporting from an independent registered public accounting firm, which may cause investors to lose confidence in us and cause the price of our common stock to be negatively impacted.
Under rules adopted by the SEC pursuant to Section 404 of the Sarbanes-Oxley Act of 2002, we are not required to obtain from our independent registered public accounting firm an attestation report on our assessment of our internal control over financial reporting, and we have not voluntarily sought such a report in the past. If we do not voluntarily seek to obtain an unqualified attestation report on our assessment of our internal control over financial reporting from our independent registered public accounting firm in the future, or if we seek to obtain such a report but our independent registered public accounting firm is unable to provide one to us, investors may lose confidence in us and the price of our common stock may be negatively impacted.
We are an “emerging growth company” and we cannot be certain if the reduced disclosure requirements applicable to emerging growth companies will make our common stock less attractive to investors.
We are an “emerging growth company”, as defined in the JOBS Act, and we intend to take advantage of certain exemptions from various reporting requirements that are applicable to other public companies which do not meet the definition of an “emerging growth company”, including, but not limited to, not being required to comply with the auditor attestation requirements of Section 404 of the Sarbanes-Oxley Act, reduced disclosure obligations regarding executive compensation in our periodic reports and proxy statements, and exemptions from the requirements of holding a nonbinding advisory vote on executive compensation and stockholder approval of any golden parachute payments not previously approved. We intend to take advantage of these reporting exemptions until we are no longer an emerging growth company. We cannot predict if investors will find our common stock less attractive because we will rely on these exemptions. If some investors find our common stock less attractive as a result, there may be a less active trading market for our common stock and our stock price may be more volatile.
We will remain an emerging growth company for up to five years, although we will lose that status sooner if we have more than $1.07 billion of revenues in a fiscal year, have more than $700 million in market value of our common stock held by non-affiliates as of any June 30 or issue more than $1.0 billion of non-convertible debt over a rolling three-year period.
Under the JOBS Act, emerging growth companies can delay adopting new or revised accounting standards until such time as those standards apply to private companies. We have elected to avail ourselves of this exemption and, therefore, we will not be subject to the same new or revised accounting standards as other public companies that are not emerging growth companies.
To the extent that we rely on any of the exemptions available to emerging growth companies, you will receive less information about our executive compensation and internal control over financial reporting than issuers that are not emerging growth companies.
Future sales of our common stock may cause our stock price to decline.
As of March 13, 2020, there were 52,145,096 shares of our common stock outstanding. Of this number, approximately 6.2 million shares of common stock were freely tradable without restriction, unless the shares are purchased by our affiliates. The remaining shares of common stock were “restricted securities” as that term is defined under Rule 144 of the Securities Act. None of our directors, executive officers or employees are subject to lock-up agreements or market stand-off provisions that limit their ability to sell shares of our common stock. The sale of a large number of shares of our common stock, or the belief that such sales may occur, could cause a drop in the market price of our common stock.
If securities analysts do not publish, or cease publishing, research or reports about us, our business or our market, or if they change their recommendations regarding our stock adversely, the price of our common stock and trading volume could decline.
The trading market for our common stock could be influenced by any research and reports that securities or industry analysts publish about us, our business or our market. If one or more of the analysts who covers us downgrades our common stock or publishes inaccurate or unfavorable research about us, our business or our market, the price of our common stock would likely decline. If one or more of these analysts ceases coverage of us or fails to publish reports on us regularly, demand for our common stock could decrease, which could cause the price of our common stock and trading volume to decline.
We do not currently intend to pay dividends on our common stock and, consequently, your ability to achieve a return on your investment will depend on appreciation in the price of our common stock.
We have not declared or paid dividends on our common stock and we do not intend to do so in the near term. We currently intend to invest our future earnings, if any, to fund our growth. Therefore, you are not likely to receive any dividends on your common stock in the near term, and capital appreciation, if any, of our common stock will be your sole source of gain for the foreseeable future.
|
ITEM 2. |
PROPERTIES. |
Our headquarters are located at 6001 West Market Street, Greensboro, North Carolina 27409, which we own. As of December 31, 2019, we utilize distribution, warehouse and office facilities within the southeastern and western regions of the United States. Our significant facilities are listed below by location, ownership, and function as of December 31, 2019; subsequent acquisitions of properties in January 2020 are noted:
|
Location Owned/Leased Use |
Owned/Leased |
Use |
|
6001 West Market St Greensboro, NC 27409 Owned warehouse |
Owned |
Warehouse and office |
|
303 Albemarle St., Lexington, NC 27292 Owned warehouse |
Owned |
Warehouse |
|
80 Coleman Blvd, Pooler, GA 31322 Owned warehouse |
Owned |
Warehouse |
|
601 SW 33nd Ave Ocala, FL 34474 Owned warehouse |
Owned |
Warehouse and office |
|
520-530 SW 31st Ave., Ocala, FL 34474 Owned warehouse |
Owned |
Warehouse |
|
Shop Road Extension, Columbia, SC Owned land |
Owned |
Land |
|
114 Furlong Industrial Dr, Kernersville, NC Owned warehouse |
Owned |
Warehouse |
|
36 Enterprise Blvd., Atlanta, GA Leased warehouse |
Leased |
Warehouse and office |
|
19317-19319 Arenth Avenue, City of Industry, CA 91748 |
Leased;acquired Jan. 2020 |
Warehouse and office |
|
15854 Ornelas Street, Irwindale, CA 91706 |
Leased;acquired Jan. 2020 |
Warehouse and office |
|
31056 Genstar Road, Hayward, CA 94544 |
Leased;acquired Jan. 2020 |
Warehouse and office |
|
4122 S 500 W, Murray, UT 84123 |
Leased;acquired Jan. 2020 |
Warehouse and office |
|
1333 West 7900 South, West Jordan, UT 84088 |
Leased;acquired Jan. 2020 |
Warehouse and office |
|
930 W 3rd St., Hardin, MT 59034 |
Leased;acquired Jan. 2020 |
Warehouse and office |
|
3333 Moline Street, Aurora, CO, 80010 |
Leased;acquired Jan. 2020 |
Warehouse and office |
|
3401 West Buckeye Road, Phoenix, AZ 85009 |
Leased;acquired Jan. 2020 |
Warehouse and office |
|
601 SW 7th Street, Renton, WA 98055 |
Leased;acquired Jan. 2020 |
Warehouse and office |
| 6830 E 49th Avenue, Commerce City, CO 80022 | Leased;acquired Jan. 2020 | Warehouse and office |
|
2503 S. Chestnut Avenue, Fresno, CA 93725 |
Leased |
Warehouse |
|
1590 Raleys Court, Suite 10 and 20, West Sacramento, CA 97015 |
Leased |
Warehouse and office |
|
6800 NE 59th Place, Portland, OR 97218 |
Leased |
Office |
|
2334 Stagecoach Road, Suite F, Stockton, CA 95206 |
Leased |
Warehouse and office |
|
4830 S Procyon, Las Vegas, NV 89103 |
Leased |
Truck parking |
|
1101 W San Marcos Boulevard, San Marcos, CA 92078 |
Leased |
Truck parking |
Each of the properties identified above serve our two operating segments: sales to independent restaurants and wholesale. For additional information about our material properties, please see section entitled “BUSINESS – Locations” above.
|
ITEM 3. |
LEGAL PROCEEDINGS. |
On or about January 4, 2017, Kirnland Food Distribution, Inc., our subsidiary, entered into a tolling agreement with the United States Department of Labor, Wage and Hour Division, Atlanta Regional Office (“DOL”), in connection with that agency’s administrative investigation of the Company’s compliance with laws regulating employee wage payment and prior undertaking of back wages payments. The inquiry concerned wage practices and record keeping during the years 2013 through 2016 and continuing through 2018. On or about March 11, 2019, Kirnland entered into a settlement agreement with the DOL to fully resolve these matters pursuant to which it paid $1,794,752 for alleged back wages and liquidated damages as restitution to 133 current and former employees of Kirnland and five contract labor suppliers, paid a penalty of $36,414 to DOL, and undertook a number of affirmative compliance measures going forward.
We are not a party to any material pending legal proceeding.
|
ITEM 4. |
MINE SAFETY DISCLOSURES. |
Not applicable.
PART II.
|
ITEM 5. |
MARKET FOR REGISTRANT’S COMMON EQUITY, RELATED STOCKHOLDER MATTERS AND ISSUER PURCHASES OF EQUITY SECURITIES. |
Shares of our common stock are listed for trading on The Nasdaq Capital Market (“Nasdaq”) under the symbol “HFFG,” and have been publicly traded since August 8, 2017. Prior to that date, there was no public market for our stock.
Holders of Record
As of March 13, 2020, there were 52,145,096 shares of our common stock issued and outstanding and held by 70 stockholders of record. The number of record holders was determined from the records of our transfer agent and does not include beneficial owners of common stock whose shares are held in the names of various security brokers, dealers, and registered clearing agencies.
Dividends
We have not paid any cash dividends on our common stock to date. The payment of cash dividends in the future will be dependent upon our revenues and earnings, if any, capital requirements and our general financial condition. The payment of any dividends will be within the discretion of our board of directors at such time. It is the present intention of our board of directors to retain all earnings, if any, for use in our business operations and, accordingly, our board of directors does not anticipate declaring any dividends in the foreseeable future. In addition, our board of directors is not currently contemplating and does not anticipate declaring any stock dividends in the foreseeable future. Further, if we incur any indebtedness, our ability to declare dividends may be limited by restrictive covenants we may agree to in connection therewith.
|
ITEM 6. |
SELECTED FINANCIAL DATA. |
HF Foods is not required to provide the information required by the item due to the transition rules for smaller reporting companies that have become accelerated filers.
|
ITEM 7. |
MANAGEMENT’S DISCUSSION AND ANALYSIS OF FINANCIAL CONDITION AND RESULTS OF OPERATIONS. |
You should read the following description of our results of operations and financial condition in conjunction with our audited consolidated financial statements for the years ended December 31, 2019 and 2018.
Overview
HF Foods Group Inc. (“HF Group”, or the “Company”) markets and distributes fresh produces, frozen and dry food, and non- food products to primarily Asian restaurants and other foodservice customers throughout the Southeast, Pacific and Mountain West regions region of the United States.
The Company was originally incorporated in Delaware on May 19, 2016 as a special purpose acquisition company under the name Atlantic Acquisition Corp. (“Atlantic”), in order to acquire, through a merger, share exchange, asset acquisition, share purchase, recapitalization, reorganization or similar business combination, one or more businesses or entities.
Effective August 22, 2018, Atlantic consummated the transactions contemplated by a merger agreement (the “Atlantic Merger Agreement”), dated as of March 28, 2018, by and among Atlantic, HF Group Merger Sub Inc., a Delaware subsidiary formed by Atlantic, HF Group Holding Corporation, a North Carolina corporation (“HF Holding”), the stockholders of HF Holding, and Zhou Min Ni, as representative of the stockholders of HF Holding. Pursuant to the Atlantic Merger Agreement, HF Holding merged with HF Merger Sub and HF Holding became the surviving entity (the “Atlantic Merger”) and a wholly-owned subsidiary of Atlantic (the “Atlantic Acquisition”). Additionally, upon the closing of the transactions contemplated by the Atlantic Merger Agreement (the “Atlantic Closing”), (i) the stockholders of HF Holding became the holders of a majority of the shares of common stock of Atlantic, and (ii) Atlantic changed its name to HF Foods Group Inc. (Collectively, these transactions are referred to as the “Atlantic Transactions”).
At closing on August 22, 2018, Atlantic issued the HF Holding stockholders an aggregate of 19,969,831 shares of its common stock, equal to approximately 88.5% of the aggregate issued and outstanding shares of Atlantic’s common stock. The pre- Transaction stockholders of Atlantic owned the remaining 11.5% of the issued and outstanding shares of common stock of the combined entity.
Following the consummation of the Atlantic Transactions on August 22, 2018, there were 22,167,486 shares of common stock issued and outstanding, consisting of (i) 19,969,831 shares issued to HF Holding’s stockholders pursuant to the Atlantic Merger Agreement, (ii) 400,000 shares redeemed by one of Atlantic’s shareholders in conjunction with the Atlantic Transactions, (iii) 10,000 restricted shares issued to one of Atlantic’s shareholders in conjunction with the Atlantic Transactions, and (iv) 2,587,655 shares originally issued to the pre-Transaction stockholders of Atlantic.
Effective November 4, 2019, HF Group consummated the transactions contemplated by a merger agreement (the “B&R Global Merger Agreement”), dated as of June 21, 2019, by and among the Company, B&R Global Merger Sub Inc., a Delaware corporation (“Merger Sub”), B&R Global, the stockholders of B&R Global (the ”B&R Global Stockholders”), and Xiao Mou Zhang, as representative of the stockholders (the “Business Combination”). Upon the closing of the transactions contemplated by the B&R Global Merger Agreement (the “Closing”), Merger Sub merged with and into B&R Global, resulting in B&R Global becoming a wholly owned subsidiary of HF Group. HF Group acquired 100% of the controlling interest of B&R Global, in exchange for 30,700,000 shares of HF Group Common Stock. The aggregate fair value of the consideration paid by HF Group in the business combination is approximately $576,699,494 and is based on the closing share price at the date of Closing.
Due to the acquisition of B&R Global, the financial information of the Company for the year ended December 31, 2019 is not comparable to the full year ended December 31, 2018. As such, the Company has presented our results of operations for the years ended December 31, 2019 and 2018 as well as the unaudited pro forma combined results of operations for years ended December 31, 2019 and 2018. For more information, see section titled “Supplemental Unaudited Pro Forma Combined Financial Information”.
Outlook
The Company plans to continue to expand our business through acquisition of other distributors and wholesalers, which depends on access to sufficient capital. If the Company is unable to obtain equity or debt financing, or borrowings from bank loans, the Company may not be able to execute our plan to acquire other distributors and wholesalers. Even if the Company is able to make such acquisitions, the Company may not be able to successfully integrate any acquired businesses or improve their profitability, which could have a material adverse effect on our financial condition and future operating performance.
Our net revenue for the year ended December 31, 2019 was $388.2 million, an increase of $97.2 million, or 33.4%, from $291.0 million for the year ended December 31, 2018. Net income attributable to HF Group’s stockholders for the year ended December 31, 2019 was $5.39 million, a decrease of $0.9 million, or 14.3%, from $6.3 million for the year ended December 31, 2018. Adjusted EBITDA for the year ended December 31, 2019 was $16.9 million, an increase of $2.7 million, or 19.0%, from $14.2 million for the year ended December 31, 2018. For additional information on Adjusted EBITDA, see the section entitled “MANAGEMENT’S DISCUSSION AND ANALYSIS OF FINANCIAL CONDITION AND RESULTS OF OPERATIONS— Adjusted EBITDA” below.
On a pro-forma basis, assuming that the Business Combination took place on January 1, 2018, our net revenue for the year ended December 31, 2019 would have been $828.0 million, an increase of $10.0 million, or 1.2% from $818.0 million for the year ended December 31, 2018. Net income attributable to HF Group’s stockholders for the year ended December 31, 2019 would have been $5.7 million, a decrease of $10.1 million, or 64.1%, from net income attributable to HF Group’s stockholder of $15.8 million for the year ended December 31, 2018. Adjusted EBITDA for the year ended December 31, 2019 would have been $32.9 million, a decrease of $5.8 million, or 15.1%, from $38.7 million for the year ended December 31, 2018. For additional information on our pro-forma results, see the section entitled “SUPPLEMENTAL UNAUDITED PRO FORMA COMBINED FINANCIAL INFORMATION” below.
The COVID-19 epidemic may pose significant risks to our business. It is too early to quantify the impact this situation will have on company revenue and profits at this time, but the public health actions being undertaken to reduce spread of the virus are capable of creating uncertainties regarding consumer demand for meals away from home and regarding reliability of our supply chain. Accordingly, management is evaluating the Company’s liquidity position, communicating with and monitoring customers and suppliers, and reviewing our analysis of our financial performance as we seek to position the Company to withstand the uncertainty related to the coronavirus.
How to Assess HF Group’s Performance
In assessing our performance, the Company considers a variety of performance and financial measures, including principal growth in net revenue, gross profit, distribution, general and administrative expenses, and adjusted EBITDA. The key measures that the Company uses to evaluate the performance of our business are set forth below:
Net Revenue
Net revenue is equal to gross sales minus sales returns, sales incentives that the Company offers to our customers, such as rebates and discounts that are offsets to gross sales; and certain other adjustments. Our net sales are driven by changes in number of customers and average customer order amount, product inflation that is reflected in the pricing of its products and mix of products sold.
Gross Profit
Gross profit is equal to net sales minus cost of revenue. Cost of revenue primarily includes inventory costs (net of supplier consideration), inbound freight, custom clearance fees and other miscellaneous expenses. Cost of revenue generally changes as the Company incurs higher or lower costs from suppliers and as the customer and product mix changes.
Distribution, Selling and Administrative Expenses
Distribution, selling and administrative expenses primarily consist of salaries and benefits for employees and contract laborers, trucking and fuel expenses, utilities, maintenance and repair expenses, insurance expenses, depreciation and amortization expenses, selling and marketing expenses, professional fees and other operating expenses.
Adjusted EBITDA
The Company believes that Adjusted EBITDA is a useful performance measure and can be used to facilitate a comparison of the Company’s operating performance on a consistent basis from period to period and to provide for a more complete understanding of factors and trends affecting our business than GAAP measures alone can provide. Our management believes that Adjusted EBITDA is less susceptible to variances in actual performance resulting from depreciation, amortization and other non-cash charges and more reflective of other factors that affect our operating performance. Our management believes that the use of these non-GAAP financial measures provides an additional tool for investors to use in evaluating ongoing operating results and trends and in comparing our financial performance with other companies in the same industry, many of which present similar non-GAAP financial measures to investors. The Company presents Adjusted EBITDA in order to provide supplemental information that the Company considers relevant for the readers of our consolidated financial statements included elsewhere in this report, and such information is not meant to replace or supersede U.S. GAAP measures.
The Company defines Adjusted EBITDA as net income (loss) before interest expense, income taxes, and depreciation and amortization, further adjusted to exclude certain unusual, non-cash, non-recurring, cost reduction, and other adjustment items. The definition of Adjusted EBITDA may not be the same as similarly titled measures used by other companies in the industry. Adjusted EBITDA is not defined under U.S. GAAP and is subject to important limitations as analytical tools and you should not consider them in isolation or as substitutes for analysis of HF Group’s results as reported under U.S. GAAP. For example, Adjusted EBITDA:
|
● |
excludes certain tax payments that may represent a reduction in cash available to the Company; |
|
● |
does not reflect any cash capital expenditure requirements for the assets being depreciated and amortized that may have to be replaced in the future; |
|
● |
does not reflect changes in, or cash requirements for, our working capital needs; and |
|
● |
does not reflect the significant interest expense, or the cash requirements, necessary to service our debt. |
For additional information on Adjusted EBITDA, see the section entitled “MANAGEMENT’S DISCUSSION AND ANALYSIS OF FINANCIAL CONDITION AND RESULTS OF OPERATIONS — Adjusted EBITDA” below.
Results of Operations for the years ended December 31, 2019 and 2018
The following table sets forth a summary of our consolidated results of operations for the years ended December 31, 2019 and 2018. The historical results presented below are not necessarily indicative of the results that may be expected for any future period.
| For the years ended | ||||||||||||||||
| December 31 | Changes | |||||||||||||||
| 2019 | 2018 | Amount | % | |||||||||||||
|
Net revenue |
$ | 388,162,281 | $ | 291,006,698 | $ | 97,155,583 | 33.4 | % | ||||||||
|
Cost of revenue |
324,953,758 | 241,441,149 | 83,512,609 | 34.6 | % | |||||||||||
|
Gross profit |
63,208,523 | 49,565,549 | 13,642,974 | 27.5 | % | |||||||||||
|
Distribution, selling and administrative expenses |
54,931,157 | 41,039,438 | 13,891,719 | 33.8 | % | |||||||||||
|
Income from operations |
8,277,366 | 8,526,111 | (248,745 | ) | (2.9 | )% | ||||||||||
|
Interest income |
418,530 | 493,358 | (74,828 | ) | (15.2 | )% | ||||||||||
|
Interest expenses and bank charges |
(1,661,454 | ) | (1,372,508 | ) | (288,946 | ) | 21.1 | % | ||||||||
|
Other income |
1,057,936 | 1,196,989 | (139,053 | ) | (11.6 | )% | ||||||||||
|
Income before income tax provision |
8,092,378 | 8,843,950 | (751,572 | ) | (8.5 | )% | ||||||||||
|
Provision for income taxes |
2,197,092 | 2,490,255 | 293,163 | (11.8 | )% | |||||||||||
|
Net income |
5,895,286 | 6,353,695 | (458,409 | ) | (7.2 | )% | ||||||||||
|
Less: net income attributable to noncontrolling interest |
505,609 | 67,240 | 438,369 | 651.9 | % | |||||||||||
|
Net income attributable to HF Foods Group Inc. |
$ | 5,389,677 | $ | 6,286,455 | $ | (896,778 | ) | (14.3 | )% | |||||||
Net Revenue
Our net revenue was $388.2 million for the year ended December 31, 2019, which consisted of $366.4 million, or 94.4% of net revenue, of sales to independent restaurants and $21.7 million, or 5.6% of net revenue, of sales to wholesale distributors. Net revenue was $291.0 million for the year ended December 31, 2018, which consisted of $272.2 million, or 93.5% of net revenue, of sales to independent restaurants and $18.8 million, or 6.5% of net revenue, of sales to wholesale distributors.
The following table sets forth the breakdown of net revenue:
|
For the years ended December 31, |
||||||||||||||||||||||||
|
2019 |
2018 |
Changes |
||||||||||||||||||||||
|
Amount |
% |
Amount |
% |
Amount |
% |
|||||||||||||||||||
|
Net revenue |
||||||||||||||||||||||||
|
Sales to independent restaurants |
$ | 366,432,448 | 94.4 |
% |
$ | 272,172,106 | 93.5 |
% |
$ | 94,260,342 | 34.6 |
% |
||||||||||||
|
Wholesale |
21,729,833 | 5.6 |
% |
18,834,592 | 6.5 |
% |
2,895,241 | 15.4 |
% |
|||||||||||||||
|
Total |
$ | 388,162,281 | 100.0 |
% |
$ | 291,006,698 | 100.0 |
% |
$ | 97,155,583 | 33.4 |
% |
||||||||||||
Compared with the year ended December 31, 2018, net revenue increased by $97.2 million, or 33.4%, for the year ended December 31, 2019, primarily attributable to the acquisition of B&R Global, which contributed $1.8 million in sales to wholesale customers and $84.3 million in sales to independent restaurants. The increase in revenue is also due to a $10.0 million increase in sales to independent restaurants of HF, resulting primarily from slightly increased commodity prices in 2019 and increases in the average order size of existing customers by introducing new products during the year. Additionally, HF sales to wholesale customers increased $1.1 million primarily due to the increase in sales to three wholesale customers and sales to two new customers.
Cost of Revenue and Gross Profit
The following table sets forth the calculation of gross profit and gross margin for sales to independent restaurants, wholesalers, and total net revenue:
|
For the years ended December 31, |
Changes |
|||||||||||||||
|
2019 |
2018 |
Amount |
% |
|||||||||||||
|
Sales to independent restaurants |
||||||||||||||||
|
Net revenue |
$ | 366,432,448 | $ | 272,172,106 | $ | 94,260,342 | 34.6 |
% |
||||||||
|
Cost of revenue |
304,139,896 | 223,535,244 | 80,604,652 | 36.1 |
% |
|||||||||||
|
Gross profit |
$ | 62,292,552 | $ | 48,636,862 | $ | 13,655,690 | 28.1 |
% |
||||||||
|
Gross Margin |
17.0 |
% |
17.9 |
% |
(0.9 |
)% |
||||||||||
|
Wholesale |
||||||||||||||||
|
Net revenue |
$ | 21,729,833 | $ | 18,834,592 | $ | 2,895,241 | 15.4 |
% |
||||||||
|
Cost of revenue |
20,813,862 | 17,905,905 | 2,907,957 | 16.2 |
% |
|||||||||||
|
Gross profit |
$ | 915,971 | $ | 928,687 | $ | (12,716 | ) | (1.4 |
)% |
|||||||
|
Gross Margin |
4.2 |
% |
4.9 |
% |
(0.7 |
)% |
||||||||||
|
Total sales |
||||||||||||||||
|
Net revenue |
$ | 388,162,281 | $ | 291,006,698 | $ | 97,155,583 | 33.4 |
% |
||||||||
|
Cost of revenue |
324,953,758 | 241,441,149 | 83,512,609 | 34.6 |
% |
|||||||||||
|
Gross profit |
$ | 63,208,523 | $ | 49,565,549 | $ | 13,642,974 | 27.5 |
% |
||||||||
|
Gross Margin |
16.3 |
% |
17.0 |
% |
(0.7 |
)% |
||||||||||
Cost of revenue was $325.0 million for the year ended December 31, 2019, an increase of $83.5 million, or 34.6%, from $241.4 million for the year ended December 31, 2018, attributable primarily to the acquisition of B&R Global, with $71.2 million and $1.7 million in cost of revenue for sales to independent restaurants and wholesale customers, respectively. The remaining increase is attributable to the $9.4 million increase in cost of revenue for the sales to independent restaurants of HG driven by the increase in sales.
Gross profit was $63.2 million for the year ended December 31, 2019, an increase of $13.6 million, or 27.5%, from $49.6 million for the year ended December 31, 2018, attributable primarily to B&R Global, with $13.1 million and $0.1 million in gross profit derived from sales to independent restaurants and wholesale customers, respectively.
Gross margin decreased from 17.0% for the year ended December 31, 2018 to 16.3% for the year ended December 31, 2019, primarily attributable to the lower gross margin of B&R Global. B&R Global’s gross margin for 2019 was 15.3%.
Distribution, Selling and Administrative Expenses
Distribution, selling and administrative expenses were $54.9 million for the year ended December 31, 2019, an increase of $13.9 million, or 33.8%, from $41.0 million for the year ended December 31, 2018. The increase was mainly attributable to the Business Combination with B&R Global of $10.1 million, the amortization expense of $1.8 million relating to the intangible assets acquired from the Business Combination, and $0.8 million of professional fees associated with the Business Combination.
Interest Expenses and Bank Charges
Interest expenses and bank charges are generated primarily from lines of credit, long-term debt, and finance leases. Interest expenses and bank charges were $1.7 million and $1.4 million for the years ended December 31, 2019 and 2018, respectively. The increase was mainly attributable to B&R Global, with interest expenses of $0.2 million for the two months ended December 31, 2019.
Other Income
Other income consists primarily of non-operating income and rental income. Other income was $1.1 million for the year ended December 31, 2019 as compared to $1.2 million for the year ended December 31, 2018, representing a decrease of $0.1 million, or 11.6%.
Income taxes Provision
Provision for income taxes decreased by $0.3 million, or 11.8%, from $2.5 million for the year ended December 31, 2018 to $2.2 million for the year ended December 31, 2019. The decrease is mainly attributable to lower income before tax provision for HF Group from $8.8 million for the year ended December 31, 2018 to $8.0 million for the year ended December 31, 2019.
Net Income Attributable to Noncontrolling interest
Net income attributable to noncontrolling interest was derived from four minority owned subsidiaries and increased by $438,370, or 652.0%, from $67,240 for the year ended December 31, 2018 to $505,608 for the year ended December 31, 2019, as a result of the increase of net income of the subsidiaries which are partially owned by noncontrolling interest shareholders.
Net Income Attributable to HF Foods Group Inc.
As a result of above, net income attributable to our stockholders decreased by $0.9 million, or 14.3%, from $6.3 million for the year ended December 31, 2018 to $5.4 million for the year ended December 31, 2019.
Adjusted EBITDA
The following table sets forth of the calculation of our Adjusted EBITDA and reconciliation to Net Income, the closest US GAAP measure:
|
For the years ended December 31, |
Changes |
|||||||||||||||
|
2019 |
2018 |
Amount |
% |
|||||||||||||
|
Net income |
$ | 5,895,286 | $ | 6,353,695 | $ | (458,409 |
) |
(7.2 |
)% |
|||||||
|
Interest expense |
1,661,454 | 1,372,508 | 288,946 | 21.1 |
% |
|||||||||||
|
Income tax provision |
2,197,092 | 2,490,255 | (293,163 | ) | (11.8 |
%) |
||||||||||
|
Depreciation & Amortization |
6,754,508 | 2,134,832 | 4,619,676 | 216.4 |
% |
|||||||||||
|
Non-recurring expenses* |
375,000 | 1,831,167 | (1,456,167 | ) | (79.5 |
%) |
||||||||||
|
Adjusted EBITDA |
$ | 16,883,340 | $ | 14,182,457 | $ | 2,700,883 | 19.0 |
% |
||||||||
|
Percentage of revenue |
4.3 |
% |
4.9 |
% |
(0.6 |
)% |
||||||||||
* For the year ended December 31, 2018, represents labor dispute expenses accrued in connection with United States Department of Labor investigation of our subsidiary Kirnland Food Distribution, Inc. For the year ended December 31, 2019, represents a non-recurring expense for a loss related to negligence claim(s) for damages arising in the ordinary course of business.
Adjusted EBITDA was $16.9 million for the year ended December 31, 2019, an increase of $2.7 million, or 19.0%, compared to $14.2 million for the year ended December 31, 2018, resulting mainly from the acquisition of B&R Global, totaled $2.5 million. Excluding the B&R Global impact, the increase is offset by $1.4 million decrease in non-recurring expenses, $0.5 million decrease in net income, $0.3 million decrease in income tax provision and $0.8 million increase in depreciation and amortization.
Supplemental Unaudited Pro Forma Combined Financial Information
As described above, the Company completed the Business Combination with B&R Global on November 4, 2019. For comparative purposes, the Company is presenting supplemental unaudited pro forma combined statements of operations for the years ended December 31, 2019 and 2018, and the Company discusses such unaudited pro forma combined results as well as our actual results of operations for the years ended December 31, 2019 and 2018. The unaudited pro forma combined statements of operations for these periods present our consolidated results of operations giving pro forma effect to the Business Combination as if it had occurred on January 1, 2018. The pro forma combined adjustments give effect to the items identified in the unaudited pro forma combined tables below in connection with the Business Combination.
The unaudited pro forma combined adjustments are based on available information and upon assumptions that our management believes are reasonable in order to reflect, on a pro forma combined basis, the impact of the Business Combination on our historical financial information, as applicable.
The B&R Global Financial Statements and our financial statements have been adjusted in the pro forma financial information to give effect to events that are (1) directly attributable to the Business Combination, (2) factually supportable, and (3) expected to have a continuing impact on the combined company.
The unaudited pro forma combined financial information has been prepared for informational purposes only and is not necessarily indicative of or intended to represent what the combined company’s financial position or results of operations actually would have been had the Business Combination occurred as of the dates indicated. In addition, the unaudited pro forma combined financial information does not purport to project the future financial position or operating results of the combined company. The unaudited pro forma adjustments are based on information available at the time of the preparation of the unaudited pro forma combined financial information.
The unaudited pro forma combined financial information does not reflect cost savings, synergies or revenue enhancements that the Company may achieve with respect to combining the companies or costs to integrate the B&R Global business or the impact of any non-recurring activity and any one-time transaction related costs. Synergies and integration costs have been excluded from consideration because they do not meet the criteria for unaudited pro forma adjustments.
Unaudited Pro Forma Results of Operations
The pro forma adjustments are based on our preliminary estimates and assumptions that are subject to change. The following adjustments have been reflected in the unaudited pro forma financial statements:
|
Year ended December 31, 2019 |
||||||||||||||||
|
HF |
B&R Global |
Adjustments |
Pro Forma Combined |
|||||||||||||
|
Net revenue |
$ | 302,103,038 | $ | 525,942,665 | $ | - | $ | 828,045,703 | ||||||||
|
Net income |
5,864,471 | 11,825,523 | (10,890,300 | )(1) | 6,799,694 | |||||||||||
|
Net Income Attributable to HF Foods Group Inc. |
$ | 5,406,526 | $ | 11,146,273 | $ | (10,890,300 | ) | $ | 5,662,499 | |||||||
|
Year ended December 31, 2018 |
||||||||||||||||
|
HF |
B&R Global |
Adjustments |
Pro Forma Combined |
|||||||||||||
|
Net revenue |
$ | 291,006,698 | $ | 526,974,506 | $ | - | $ | 817,981,204 | ||||||||
|
Net income |
6,353,695 | 20,650,852 | (10,890,300 | )(1) | 16,114,247 | |||||||||||
|
Net Income Attributable to HF Foods Group |
$ | 6,286,456 | $ | 20,378,257 | $ | (10,890,300 | ) | $ | 15,774,413 | |||||||
|
(1) |
Includes intangibles asset amortization expense of $10,890,300 and $10,890,300 for the years ended December 31, 2019 and December 31, 2018, respectively. |
Liquidity and Capital Resources
As of December 31, 2019, the Company had cash of approximately $14.5 million. The Company funded working capital and other capital requirements primarily by equity contribution from shareholders, cash flows from operations, and bank loans and lines of credit. Cash is required to pay purchase costs for inventory, salaries, fuel and trucking expenses, selling expenses, rental expenses, income taxes, other operating expenses and repay debts.
On April 18, 2019, the Company and its operating subsidiaries Han Feng, New Southern Food Distributers and Kirnland entered into a credit agreement with East West Bank, which replaced our prior credit agreement with East West Bank. The credit agreement provides a $25,000,000 revolving credit facility which was due August 18, 2021, accrued interest based on the prime rate less 0.375% or 2.20% above LIBOR, but in no event less than 4.214% per annum, and was secured by virtually all assets of the Company and our domestic subsidiaries. On November 4, 2019, the East West Bank revolving credit facility loan was paid off from borrowings under the Amended and Restated Credit Agreement entered into connection with the merger with B&R Global, as described below.
On November 4, 2019, the Company entered into an Amended and Restated Credit Agreement with JP Morgan. The Amended and Restated Credit Agreement provides for (a) a $100 million asset-secured revolving credit facility maturing on November 4, 2022, and (b) mortgage-secured term loans of $55.4 million.
On January 17, 2020, the Company, B&R Global, and the Borrowers, and certain material subsidiaries of the Company as guarantors, entered into a Second Amended and Restated Credit Agreement (the “Second Amended Credit Agreement”) by and among JPMorgan, as Administrative Agent, and certain lender parties thereto, including Comerica Bank. The Second Amended Credit Agreement provided for (a) a $100 million asset-secured revolving credit facility maturing on November 4, 2022 (the “Facility”), and (b) mortgage-secured Term Loans of $75.6 million. The Second Amended Credit Agreement amended and restated the existing $55.0 million of real estate term loans under the Amended Credit Agreement. As of January 17, 2020, the existing balance of revolving debt under the Amended Credit Agreement, $41.2 million, was rolled over, and an additional $18.7 million available to the Company under the Facility was drawn. The Company used the $75.6 million in mortgage-secured term loans and $18.7 million drawn from the revolving credit facility to fund in part the Acquisition of the B&R Realty Subsidiaries, as noted above. Borrowings under the Second Amended Credit Agreement may be used for, among other things, working capital and other general corporate purposes of the Company and its subsidiaries (including permitted acquisitions). The Borrowers have the ability to increase the amount of the Facility, which increases may take the form of increases to the revolving credit commitments, by an aggregate amount of up $30 million upon satisfaction of customary conditions precedent for such increases or incremental loans and receipt of additional commitments by one or more existing or new lenders. Borrowings under the Facility bear interest at a floating rate, which will be, at the Borrowers’ option, either LIBOR plus 1.375%, or a base rate of prime rate minus 1.125%. The mortgage-secured Term Loans bear interest at a floating rate, which will be, at the Borrowers’ option, either LIBOR plus 1.875%, or a base rate of prime rate minus 0.625%. A commitment fee of 0.15% is payable monthly in arrears based on the daily amount of the undrawn portion of each lender’s revolving credit commitments under the Facility. The Borrowers are obligated to pay monthly installments on the mortgage-secured Term Loans in the amount of $252,000.00, with a final installment of the remaining principal balance of the Term Loans due on January 17, 2030, the Term Loan Maturity Date.
Although management believes that the cash generated from operations will be sufficient to meet our normal working capital needs for at least the next twelve months, our ability to repay our current obligations will depend on the future realization of our current assets. Management has considered the historical experience, the economy, trends in the foodservice distribution industry, the expected collectability of accounts receivable and the realization of the inventories as of December 31, 2019. Based on the above considerations, management is of the opinion that the Company has sufficient funds to meet our working capital requirements and debt obligations as they become due. However, there is no assurance that the Company will be successful in our plan. There are a number of factors that could potentially arise that could result in shortfalls to our plan, such as the demand for our products, economic conditions, the competitive pricing in the foodservice distribution industry and the ability of our banks and suppliers to provide continued support. If the future cash flow from operations and other capital resources are insufficient to fund our liquidity needs, the Company may be forced to reduce or delay our acquisition plan, sell assets, obtain additional debt or equity capital which may not be available on terms acceptable to us, if at all, or refinance all or a portion of our debt.
The following table summarizes cash flow data for the years ended December 31, 2019 and 2018:
|
For the years ended December 31, |
||||||||
|
2019 |
2018 |
|||||||
|
Net cash provided by operating activities |
$ | 4,666,528 | $ | 11,953,466 | ||||
|
Net cash provided by (used) in investing activities |
2,775,115 | (6,365,313 |
) |
|||||
|
Net cash provided by (used) in financing activities |
1,607,239 | (6,184,793 |
) |
|||||
|
Net increase (decrease) in cash and cash equivalents |
$ | 9,048,882 | $ | (596,640 |
) |
|||
Operating Activities
Net cash provided by operating activities consists primarily of net income adjusted for non-cash items, including depreciation and amortization, changes in deferred income taxes and others, and adjusted for the effect of working capital changes. Net cash provided by operating activities was approximately $4.7 million for the year ended December 31, 2019, a decrease of $7.3 million, or 61%, compared to net cash provided by operating activities of $12.0 million for the year ended December 31, 2018. The decrease was a combined results of a decrease of $10.5 million from changes in working capital items mainly resulting from changes in accounts receivable, inventory, accounts payable, advances to suppliers, accrued expenses, other long- term assets and net income which were offset by an increase of $1.8 million in depreciation and amortization expense, and advances from customers – related parties. In addition, the decrease was offset by an increase from newly acquired B&R Global with total net cash provided by operating activities of $3.2 million.
Investing Activities
Net cash provided in investing activities was approximately $2.8 million for the year ended December 31, 2019, an increase of $9.1 million, or 144%, compared to $6.4 million net cash used investing activities for the year ended December 31, 2018. The increase was a combined result of cash acquired of $7.0 million from the merger with B&R Global, decreased cash paid for notes receivable to third parties and related parties of $2.9 million and $1.4 million, respectively, offset by increased cash paid for the purchase of property and equipment of $1.6 million and decrease of cash acquired from the reverse merger with Atlantic Acquisition Corp. of $1.4 million.
Financing Activities
Net cash provided in financing activities was approximately $1.6 million for the year ended December 31, 2019, an increase of $7.8 million, or 126%, compared with $6.2 million of net cash used in financing activities for the year ended December 31, 2018. The increase was a combined result of increase in proceeds from lines of credit and long term debt of $38.2 million and a decrease of $0.9 million in cash dividend to shareholders, offset by an increase of $28.4 million in repayment of lines of credit, long term debt and finance leases and newly acquired B&R Global with cash provided by financing activities of $2.9 million.
Commitments and Contractual Obligations
The following table presents our material contractual obligations as of December 31, 2019:
|
Contractual Obligations |
Total |
Less than 1 year |
1-3 years |
3-5 years |
More than 5 Years |
|||||||||||||||
|
Lines of credit |
$ | 41,268,554 | $ | - | $ | 41,268,554 | $ | - | $ | - | ||||||||||
|
Long-term debt |
21,261,997 | 2,726,981 | 4,668,439 | 1,886,975 | 11,979,602 | |||||||||||||||
|
Finance lease liabilities |
1,610,911 | 373,715 | 696,248 | 540,948 | - | |||||||||||||||
|
Operating lease obligations |
18,684,526 | 4,930,181 | 8,239,473 | 5,514,872 | - | |||||||||||||||
|
Total |
$ | 82,825,987 | $ | 8,030,876 | $ | 54,872,714 | $ | 7,942,795 | $ | 11,979,601 | ||||||||||
On July 2, 2018, AnHeart, Inc., one of our subsidiaries, entered into two separate leases for two buildings located in Manhattan, New York, at 273 Fifth Avenue and 275 Fifth Avenue, for 30 years and 15 years, respectively, which are net leases, meaning that AnHeart is required to pay all costs associated with the buildings, including utilities, maintenance and repairs. HF Holding provided a guaranty for all rent and related costs of the leases, including costs associated with the construction of a two-story structure at 273 Fifth Avenue and rehabilitation of the building at 275 Fifth Avenue. Under the lease for 273 Fifth Avenue, the fixed rent costs over 30 years commence at $325,000 for the first year and escalate every year during the term to $1,047,000 in year 30. Under the lease for 275 Fifth Avenue, the fixed rent costs over 15 years commence at $462,000 for the first year and escalate every year during the term to approximately $760,878 in year 15. The 275 Fifth Avenue lease includes an option to extend the term for an additional 10 years. Under the leases, AnHeart delivered a letter of credit in favor of the Landlord in the amount of $213,000 as security for AnHeart’s obligations under the lease at 273 Fifth Avenue, and $115,500 with respect to 275 Fifth Avenue. The Company entered into the leases for the purpose of expanding our product lines to include Chinese herb supplements, and to use the sites to develop into a hub for such products. The Company has since determined to cease this business expansion.
On February 23, 2019, the Company executed an agreement to transfer all of our ownership interest in AnHeart to Jianping An, a resident of New York, for a sum of $20,000. The transfer of ownership has been disclosed and landlord consent was obtained. However, the transfer of ownership does not release HF Holding’s guaranty of AnHeart’s obligations or liabilities under the original lease agreements. Under the terms of the transfer agreement, AnHeart executed a security agreement which grants us a security interest in AnHeart assets and a covenant to assign the leases to HF Group if AnHeart defaults. Further, AnHeart has tendered an unconditional guaranty of all liabilities arising under the leases, in favor of the Company, executed by Minsheng Pharmaceutical Group Company, Ltd., a Chinese manufacturer and distributor of herbal medicines.
Off -balance Sheet Arrangements
The Company is not a party to any off-balance sheet arrangements.
Critical Accounting Policies
The discussion and analysis of our financial condition and results of operations are based upon our financial statements, which have been prepared in accordance with GAAP. These principles require our management to make estimates and judgments that affect the reported amounts of assets, liabilities, sales and expenses, cash flow and related disclosure of contingent assets and liabilities. The estimates include, but are not limited to, accounts receivable, revenue recognition, impairment of long-lived assets and income taxes. The Company bases our estimates on historical experience and various other assumptions that the Company believes to be reasonable under the circumstances. Actual results may differ from these estimates. To the extent that there are material differences between these estimates and the actual results, future financial statements will be affected.
The Company believes that among our significant accounting policies, which are described in Note 2 to the audited consolidated financial statements included in this report, the following accounting policies involve a greater degree of judgment and complexity. Accordingly, the Company believes these are the most critical to fully understand and evaluate our financial condition and results of operations.
Accounts receivable
Accounts receivable represent amounts due from customers in the ordinary course of business and are recorded at the invoiced amount and do not bear interest. Receivables are presented net of the allowance for doubtful accounts in the accompanying unaudited condensed consolidated balance sheets. The Company evaluates the collectability of our accounts receivable and determines the appropriate allowance for doubtful accounts based on a combination of factors. When the Company becomes aware of a customer’s inability to meet its financial obligation, a specific allowance for doubtful accounts is recorded, reducing the receivable to the net amount the Company reasonably expects to collect. In addition, allowances are recorded for all other receivables based on historic collection trends, write-offs and the aging of receivables. The Company uses specific criteria to determine when uncollectible receivables are to be written off, including, e.g., bankruptcy filings, the referral of customer accounts to outside parties for collection, and the length that accounts remain past due. As of December 31, 2019, and December 31, 2018, the allowances for doubtful accounts were $623,970 and $658,104, respectively.
Revenue recognition
The Company recognizes revenue from the sale of products when title and risk of loss passes and the customer accepts the goods, which occurs at delivery. Sales taxes invoiced to customers and remitted to government authorities are excluded from net sales.
On January 1, 2018 the Company adopted Accounting Standards Update (“ASU”) 2014-09 Revenue from Contracts with Customers (FASB ASC Topic 606) using the modified retrospective method for contracts that were not completed as of January 1, 2018. The results of applying Topic 606 using the modified retrospective approach were insignificant and did not have a material impact on our consolidated financial condition, results of operations, cash flows, business process, controls or systems.
The core principle underlying the referenced ASU is that the Company will recognize revenue to represent the transfer of goods and services to customers in an amount that reflects the consideration to which the Company expects to be entitled in such exchange. This will require us to identify contractual performance obligations and determine whether revenue should be recognized at a point in time or over time, based on when control of goods and services transfers to a customer. The majority of our contracts have one single performance obligation as the promise to transfer the individual goods is not separately identifiable from other promises in the contracts and is, therefore, not distinct. Our revenue streams are recognized at a specific point in time.
The contract assets and contract liabilities are recorded on the Condensed Consolidated Balance Sheet as accounts receivable and advance payments from customers as of December 31, 2019 and December 31, 2018. For the year ended December 31, 2018, revenue recognized from performance obligations related to prior periods was insignificant.
Revenue expected to be recognized in any future periods related to remaining performance obligations is insignificant. The following table summarizes disaggregated revenue from contracts with customers by geographic locations:
|
For the Years Ended |
||||||||
|
December 31, 2019 |
December 31, 2018 |
|||||||
|
North Carolina |
$ | 145,756,172 | $ | 138,790,263 | ||||
|
Florida |
91,173,814 | 88,670,044 | ||||||
|
Georgia |
65,173,052 | 63,546,391 | ||||||
|
Arizona |
7,196,217 | - | ||||||
|
California |
54,877,209 | - | ||||||
|
Colorado |
6,658,931 | - | ||||||
|
Utah |
8,249,684 | - | ||||||
|
Washington |
9,077,202 | - | ||||||
|
Total |
$ | 388,162,281 | $ | 291,006,698 | ||||
Impairment of Long-lived Assets
The Company assesses our long-lived assets such as property and equipment for impairment whenever events or changes in circumstances indicate the carrying amount of an asset may not be recoverable. Factors which may indicate potential impairment include a significant underperformance related to the historical or projected future operating results or a significant negative industry or economic trend. Recoverability of these assets is measured by comparison of their carrying amounts to future undiscounted cash flows which the assets are expected to generate. If property and equipment are considered to be impaired, the impairment to be recognized equals the amount by which the carrying value of the assets exceeds their fair value.
Income taxes
The Company accounts for income taxes under the asset and liability method, which requires the recognition of deferred tax assets and liabilities for the expected future tax consequences of events that have been included in the financial statements. Under this method, the Company determines deferred tax assets and liabilities on the basis of the differences between the financial statement and tax bases of assets and liabilities by using enacted tax rates in effect for the year in which the differences are expected to reverse. The effect of a change in tax rates on deferred tax assets and liabilities is recognized in income in the period that includes the enactment date.
The Company recognizes deferred tax assets to the extent that the Company believes that these assets are more likely than not to be realized. In making such a determination, the Company considers all available positive and negative evidence, including future reversals of existing taxable temporary differences, projected future taxable income, tax-planning strategies, and results of recent operations. If the Company determines that it would be able to realize our deferred tax assets in the future in excess of their net recorded amount, the Company would make an adjustment to the deferred tax asset valuation allowance, which would reduce the provision for income taxes.
The Company records uncertain tax positions in accordance with ASC 740 on the basis of a two-step process in which (1) the Company determines whether it is more likely than not that the tax positions will be sustained on the basis of the technical merits of the position and (2) for those tax positions that meet the more-likely-than-not recognition threshold, the Company recognizes the largest amount of tax benefit that is more than 50 percent likely to be realized upon ultimate settlement with the related tax authority. The Company does not believe that there were any uncertain tax positions at December 31, 2019, and 2018.
Recent accounting pronouncements
In June 2016, the FASB issued ASU 2016-13, Measurement of Credit Losses on Financial Instruments (Topic 326): Measurement of Credit Losses on Financial Instruments (“ASU 2016-13”). ASU 2016-13 requires companies to measure credit losses utilizing a methodology that reflects expected credit losses and requires a consideration of a broader range of reasonable and supportable information to inform credit loss estimates. ASU 16-13 was further amended in November 2019, Codification Improvements to Topic 326, Financial Instruments-Credit losses. This guidance is effective for fiscal years beginning after December 15, 2019, including those interim periods within those fiscal years. The Company is currently assessing the impact of adopting this standard, but based on a preliminary assessment, does not expect the adoption of this guidance to have a material impact on its consolidated financial statements.
In August 2018, the FASB issued ASU 2018-13, “Fair Value Measurement (Topic 820): Disclosure Framework—Changes to the Disclosure Requirements for Fair Value Measurement” (“ASU 2018-13”). ASU 2018-13 removes, modifies and adds certain disclosure requirements in Topic 820 “Fair Value Measurement”. ASU 2018-13 eliminates certain disclosures related to transfers and the valuations process, modifies disclosures for investments that are valued based on net asset value, clarifies the measurement uncertainty disclosure, and requires additional disclosures for Level 3 fair value measurements. ASU 2018-13 is effective for the Company for annual and interim reporting periods beginning January 1, 2020. The Company is currently evaluating the impact ASU 2018-13 will have on its consolidated financial statements.
In December 2019, the FASB issued ASU No. 2019-12, Income Taxes (Topic 740): Simplifying the Accounting for Income Taxes, which is intended to simplify various aspects related to accounting for income taxes. ASU 2019-12 removes certain exceptions to the general principles in Topic 740 and also clarifies and amends existing guidance to improve consistent application. This guidance is effective for fiscal years, and interim periods within those fiscal years, beginning after December 15, 2020, with early adoption permitted. The Company is currently assessing the impact of adopting this standard, but based on a preliminary assessment, does not expect the adoption of this guidance to have a material impact on its consolidated financial statements.
|
ITEM 7A. |
QUANTITATIVE AND QUALITATIVE DISCLOSURES ABOUT MARKET RISK. |
HF Foods is not required to provide the information required by the item due to the transition for smaller reporting companies that have become accelerated filers.
|
ITEM 8. |
FINANCIAL STATEMENTS AND SUPPLEMENTARY DATA. |
HF Foods Group Inc.
Consolidated Financial Statements
For the Fiscal Years Ended December 31, 2019 and December 31, 2018
Index to Financial Statements
|
|
Page |
|
Report of Independent Registered Public Accounting Firm |
41 |
|
Consolidated Financial Statements |
|
|
Consolidated Balance Sheets |
42 |
|
Consolidated Statements of Income |
43 |
|
Consolidated Statements of Cash Flows |
44 |
|
Consolidated Statements of Changes in Shareholders’ Equity |
45 |
|
Notes to Consolidated Financial Statements |
46 |
REPORT OF INDEPENDENT REGISTERED PUBLIC ACCOUNTING FIRM
To the Shareholders and the Board of Directors of
HF Foods Group Inc.
Opinion on the Financial Statements
We have audited the accompanying consolidated balance sheets of HF Foods Group Inc. and its subsidiaries (collectively, the “Company”) as of December 31, 2019 and 2018, and the related consolidated statements of income, changes in shareholders’ equity, and cash flows for each of the years in the two-year period ended December 31, 2019, and the related notes (collectively referred to as the “consolidated financial statements”). In our opinion, the consolidated financial statements present fairly, in all material respects, the financial position of the Company as of December 31, 2019 and 2018, and the results of its operations and its cash flows for each of the two years in the period ended December 31, 2019, in conformity with accounting principles generally accepted in the United States of America.
Basis for Opinion
These consolidated financial statements are the responsibility of the Company’s management. Our responsibility is to express an opinion on the Company’s consolidated financial statements based on our audits. We are a public accounting firm registered with the Public Company Accounting Oversight Board (United States) (“PCAOB”) and are required to be independent with respect to the Company in accordance with the U.S. federal securities laws and the applicable rules and regulations of the Securities and Exchange Commission and the PCAOB.
We conducted our audits in accordance with the standards of the PCAOB. Those standards require that we plan and perform the audits to obtain reasonable assurance about whether the consolidated financial statements are free of material misstatement, whether due to error or fraud. The Company is not required to have, nor were we engaged to perform, an audit of its internal control over financial reporting. As part of our audits we are required to obtain an understanding of internal control over financial reporting, but not for the purpose of expressing an opinion on the effectiveness of the Company’s internal control over financial reporting. Accordingly, we express no such opinion.
Our audits included performing procedures to assess the risks of material misstatement of the consolidated financial statements, whether due to error or fraud, and performing procedures that respond to those risks. Such procedures included examining, on a test basis, evidence regarding the amounts and disclosures in the consolidated financial statements. Our audits also included evaluating the accounting principles used and significant estimates made by management, as well as evaluating the overall presentation of the consolidated financial statement. We believe that our audits provide a reasonable basis for our opinion.
/s/ Friedman LLP
We have served as the Company’s auditor since 2017.
New York, New York
March 16, 2020
HF Foods Group Inc.
Consolidated Balance Sheets
|
As of |
||||||||
|
December 31 |
December 31 |
|||||||
|
2019 |
2018 |
|||||||
|
ASSETS |
||||||||
|
CURRENT ASSETS: |
||||||||
|
Cash |
$ | 14,538,286 | $ | 5,489,404 | ||||
|
Accounts receivable, net |
50,027,134 | 14,406,476 | ||||||
|
Accounts receivable - related parties, net |
4,202,870 | 2,292,151 | ||||||
|
Inventories, net |
77,531,854 | 22,175,769 | ||||||
|
Advances to suppliers - related parties, net |
745,135 | 1,526,482 | ||||||
|
Notes receivable |
- | 3,803,826 | ||||||
|
Notes receivable - related parties, current |
- | 8,117,686 | ||||||
|
Other current assets |
4,374,338 | 1,230,970 | ||||||
|
TOTAL CURRENT ASSETS |
151,419,617 | 59,042,764 | ||||||
|
Property and equipment, net |
37,538,147 | 22,650,021 | ||||||
|
Security deposits-related parties |
591,380 | - | ||||||
|
Long-term notes receivable - related parties |
- | 423,263 | ||||||
|
Operating lease right-of-use assets |
17,155,584 | - | ||||||
|
Long-term investments |
2,296,276 | - | ||||||
| Intangible assets, net | 186,687,950 | - | ||||||
| Goodwill | 406,703,348 | - | ||||||
| Deferred tax assets | 78,993 | 117,933 | ||||||
|
Other long-term assets |
372,499 | 242,426 | ||||||
|
TOTAL ASSETS |
$ | 802,843,794 | $ | 82,476,407 | ||||
|
CURRENT LIABILITIES: |
||||||||
|
Bank overdraft |
$ | 14,952,510 | - | |||||
|
Lines of credit |
41,268,554 | 8,194,146 | ||||||
|
Accounts payable |
39,689,911 | 17,474,206 | ||||||
|
Accounts payable - related parties |
4,521,356 | 3,923,120 | ||||||
| Accrued expenses and other payables | 2,683,696 | 2,376,498 | ||||||
|
Current portion of long-term debt, net |
2,726,981 | 1,455,441 | ||||||
|
Current portion of obligations under finance leases |
280,243 | 164,894 | ||||||
|
Current portion of obligations under operating leases |
4,322,503 | - | ||||||
|
TOTAL CURRENT LIABILITIES |
110,445,754 | 33,588,305 | ||||||
|
Long-term debt, net |
18,535,016 | 13,109,854 | ||||||
|
Obligations under finance leases, non-current |
1,053,166 | 120,705 | ||||||
|
Obligations under operating leases, non-current |
12,833,081 | - | ||||||
|
Deferred tax liabilities |
52,320,045 | 1,196,061 | ||||||
|
TOTAL LIABILITIES |
$ | 195,187,062 | $ | 48,014,925 | ||||
|
SHAREHOLDERS’ EQUITY: |
||||||||
|
Preferred Stock, $0.0001 par value, 1,000,000 shares authorized, no shares issued and outstanding as of December 31, 2019 and December 31, 2018, respectively |
- | - | ||||||
|
Common Stock, $0.0001 par value, 100,000,000 shares authorized, 53,050,211 shares issued, and 52,145,096 shares outstanding as of December 31, 2019, and 30,000,000 shares authorized, 22,167,486 shares issued and outstanding as of December 31, 2018 |
5,305 | 2,217 | ||||||
|
Treasury Stock, at cost, 905,115 shares as of December 31, 2019, and - 0 - shares at December 31, 2018 |
(12,038,030 | ) | - | |||||
|
Additional paid-in capital |
599,617,009 | 22,920,603 | ||||||
|
Retained earnings |
15,823,661 | 10,433,984 | ||||||
|
Total shareholders’ equity attributable to HF Foods Group, Inc. |
603,407,945 | 33,356,804 | ||||||
|
Noncontrolling interest |
4,248,787 | 1,104,678 | ||||||
|
TOTAL SHAREHOLDERS’ EQUITY |
607,656,732 | 34,461,482 | ||||||
|
TOTAL LIABILITIES AND SHAREHOLDERS’ EQUITY |
802,843,794 | $ | 82,476,407 | |||||
The accompanying notes are an integral part of these consolidated financial statements.
HF Foods Group Inc.
Consolidated Statements of Income
|
For the years ended December 31 |
||||||||
|
2019 |
2018 |
|||||||
|
Net revenue - third parties |
$ | 368,809,865 | $ | 272,859,695 | ||||
|
Net revenue - related parties |
19,352,416 | 18,147,003 | ||||||
|
TOTAL NET REVENUE |
388,162,281 | 291,006,698 | ||||||
|
Cost of revenue - third parties |
306,370,972 | 223,694,206 | ||||||
|
Cost of revenue - related parties |
18,582,786 | 17,746,943 | ||||||
|
TOTAL COST OF REVENUE |
324,953,758 | 241,441,149 | ||||||
|
GROSS PROFIT |
63,208,523 | 49,565,549 | ||||||
|
DISTRIBUTION, SELLING AND ADMINISTRATIVE EXPENSES |
54,931,157 | 41,039,438 | ||||||
|
INCOME FROM OPERATIONS |
8,277,366 | 8,526,111 | ||||||
|
Other Income (Expenses) |
||||||||
|
Interest income |
418,530 | 493,358 | ||||||
|
Interest expense and bank charges |
(1,661,454 | ) | (1,372,508 | ) | ||||
|
Rental income – related parties |
525,600 | 525,600 | ||||||
| Other income | 532,336 | 671,389 | ||||||
|
Total Other Income (Expenses), net |
(184,988 | ) | 317,839 | |||||
|
INCOME BEFORE INCOME TAX PROVISION |
8,092,378 | 8,843,950 | ||||||
|
PROVISION FOR INCOME TAXES |
2,197,092 | 2,490,255 | ||||||
|
NET INCOME |
5,895,286 | 6,353,695 | ||||||
|
Less: net income attributable to noncontrolling interest |
505,609 | 67,240 | ||||||
|
NET INCOME ATTRIBUTABLE TO HF FOODS GROUP INC. |
$ | 5,389,677 | $ | 6,286,455 | ||||
|
Earnings per common share – basic and diluted |
$ | 0.22 | $ | 0.30 | ||||
|
Weighted average shares – basic and diluted |
27,113,288 | 20,991,004 | ||||||
The accompanying notes are an integral part of these consolidated financial statements.
HF Foods Group Inc.
Consolidated Statements of Cash Flows
|
For the years ended December 31 |
||||||||
|
2019 |
2018 |
|||||||
|
Cash flows from operating activities: |
||||||||
|
Net Income |
$ | 5,895,286 | $ | 6,353,695 | ||||
|
Adjustments to reconcile net income to net cash provided by operating activities: |
||||||||
|
Depreciation and amortization expense |
6,754,508 | 2,134,832 | ||||||
|
Gain from disposal of equipment |
65,624 | - | ||||||
|
Allowance for doubtful accounts |
72,359 | 90,996 | ||||||
|
Allowance for inventory |
(16,928 | ) | - | |||||
|
Deferred tax expenses (benefit) |
(250,705 | ) | 641,916 | |||||
| (Income) from equity method investment | (6,886 | ) | - | |||||
|
Changes in operating assets and liabilities: |
||||||||
|
Accounts receivable, net |
(4,758,186 | ) | 203,381 | |||||
|
Accounts receivable - related parties, net |
1,483,211 | (705,731 | ) | |||||
|
Inventories |
1,112,728 | 493,456 | ||||||
|
Advances to suppliers - related parties, net |
781,347 | 1,721,827 | ||||||
|
Other current assets |
(271,098 | ) | (513,940 | ) | ||||
|
Other long-term assets |
142,426 | 1,193,186 | ||||||
|
Accounts payable |
(2,668,541 | ) | 198,721 | |||||
|
Accounts payable - related parties |
(929,903 | ) | (152,807 | ) | ||||
|
Operating lease liabilities |
(1,601,678 | ) | - | |||||
|
Income tax payable |
- | (453,492 | ) | |||||
|
Accrued expenses and other payables |
(1,137,036 | ) | 747,426 | |||||
|
Net cash provided by operating activities |
4,666,528 | 11,953,466 | ||||||
|
Cash flows from investing activities: |
||||||||
|
Cash received from business combination with Atlantic Acquisition Corp. |
- | 1,430,298 | ||||||
|
Cash received from acquisition of B&R Global |
7,017,467 | - | ||||||
|
Purchase of property and equipment |
(4,835,929 | ) | (3,075,385 | ) | ||||
|
Proceeds from disposal of equipment |
286,831 | - | ||||||
|
Cash received from long-term notes receivable |
290,071 | - | ||||||
|
Cash paid for issuance of long-term notes receivable |
(108,750 | ) | (3,039,333 | ) | ||||
|
Cash received from long-term notes receivable to related parties |
386,358 | - | ||||||
|
Cash paid for issuance of long-term notes receivable to related parties |
(260,933 | ) | (1,680,893 | ) | ||||
|
Net cash provided by (used in) investing activities |
2,775,115 | (6,365,313 | ) | |||||
|
Cash flows from financing activities: |
||||||||
|
Proceeds from bank overdraft |
2,870,416 | - | ||||||
|
Proceeds from lines of credit |
144,045,699 | 3,900,000 | ||||||
|
Repayment of lines of credit |
(146,661,467 | ) | (7,600,000 | ) | ||||
|
Proceeds from long-term debt |
8,378,467 | 2,250,350 | ||||||
|
Repayment of long-term debt |
(6,338,525 | ) | (3,119,747 | ) | ||||
|
Repayment of obligations under finance leases |
(384,851 | ) | (453,951 | ) | ||||
|
Cash distribution paid to shareholders |
(302,500 | ) | (1,161,445 | ) | ||||
|
Net cash provided by (used in) financing activities |
1,607,239 | (6,184,793 | ) | |||||
|
Net increase (decrease) in cash |
9,048,882 | (596,640 | ) | |||||
|
Cash at beginning of the year |
5,489,404 | 6,086,044 | ||||||
|
Cash at end of the year |
14,538,286 | $ | 5,489,404 | |||||
The accompanying notes are an integral part of these consolidated financial statements.
HF Foods Group Inc.
Consolidated Statements of Changes in Shareholders’ Equity
For the Years Ended December 31, 2019 and 2018
|
Common Stock |
||||||||||||||||||||||||||||||||
|
Number of Shares |
Amount |
Treasury Stock |
Additional Paid-in Capital |
Retained Earnings |
Total Shareholders’ Equity Attributable to HF Foods Group Inc |
Noncontrolling Interest |
Total Shareholders’ Equity |
|||||||||||||||||||||||||
|
Balance at December 31, 2017 |
19,969,831 | $ | 1,997 | $ | - | $ | 21,549,703 | $ | 4,255,213 | $ | 25,806,913 | $ | 1,091,199 | $ | 26,898,112 | |||||||||||||||||
|
Effect of reverse |
||||||||||||||||||||||||||||||||
|
acquisition |
2,197,655 | 220 | - | 1,370,900 | - | 1,371,120 | - | 1,371,120 | ||||||||||||||||||||||||
|
Net income |
- | - | - | - | 6,286,455 | 6,286,455 | 67,240 | 6,353,695 | ||||||||||||||||||||||||
|
Distribution to shareholders |
- | - | - | - | (107,684 |
) |
(107,684 |
) |
(53,761 |
) |
(161,445 |
) |
||||||||||||||||||||
|
Balance at December 31, 2018 |
22,167,486 | $ | 2,217 | $ | - | $ | 22,920,603 | $ | 10,433,984 | $ | 33,356,804 | $ | 1,104,678 | $ | 34,461,482 | |||||||||||||||||
|
Net income |
- | - | - | - | 5,389,677 | 5,389,677 | 505,609 | 5,895,286 | ||||||||||||||||||||||||
|
Exercise of Stock Options |
182,725 | 18 | - | (18 |
) |
- | - | - | - | |||||||||||||||||||||||
|
Buyback of common stock from a shareholder in exchange for notes receivable |
(905,115 |
) |
- | (12,038,030 | ) | - | - | (12,038,030 |
) |
- | (12,038,030 |
) |
||||||||||||||||||||
|
Acquisition of B&R Global by issuance of common stock |
30,700,000 | 3,070 | - | 576,696,424 | - | 576,699,494 | 2,941,000 | 579,640,494 | ||||||||||||||||||||||||
|
Distribution to shareholders |
- | - | - | - | - | - | (302,500 |
) |
(302,500 |
) |
||||||||||||||||||||||
|
Balance at December 31, 2019 |
52,145,096 | $ | 5,305 | $ | (12,038,030 | ) | $ | 599,617,009 | 15,823,661 | $ | 603,407,945 | $ | 4,248,787 | $ | 607,656,732 | |||||||||||||||||
The accompanying notes are an integral part of these consolidated financial statements.
HF FOODS GROUP INC.
NOTES TO CONSOLIDATED FINANCIAL STATEMENTS
NOTE 1 - ORGANIZATION AND BUSINESS DESCRIPTION
Organization and General
HF Foods Group Inc. (“HF Group”, or the “Company”) markets and distributes fresh produces, frozen and dry food, and non- food products to primarily Asian restaurants and other foodservice customers throughout the Southeast, Pacific and Mountain West regions region of the United States.
The Company was originally incorporated in Delaware on May 19, 2016 as a special purpose acquisition company under the name Atlantic Acquisition Corp. (“Atlantic”), in order to acquire, through a merger, share exchange, asset acquisition, share purchase, recapitalization, reorganization or similar business combination with one or more businesses or entities.
Reorganization of HF Holding
HF Group Holding Corporation (“HF Holding”) was incorporated in the State of North Carolina on October 11, 2017. Effective January 1, 2018, HF Holding entered into a Share Exchange Agreement (the “Agreement”) whereby the controlling shareholders of the following 11 entities contributed their respective stocks to HF Holding in exchange for all of HF Holding’s outstanding shares. Upon completion of the share exchanges, these entities became either wholly-owned or majority-owned subsidiaries of HF Holding.
|
● |
Han Feng, Inc. (“Han Feng”) |
|
● |
Truse Trucking, Inc. (“TT”) |
|
● |
Morning First Delivery, Inc. (“MFD”) |
|
● |
R&N Holdings, LLC (“R&N Holdings”) |
|
● |
R&N Lexington, LLC (“R&N Lexington”) |
|
● |
Kirnsway Manufacturing Inc. (“Kirnsway”) |
|
● |
Chinesetg, Inc. (“Chinesetg”) |
|
● |
New Southern Food Distributors, Inc. (“NSF”) |
|
● |
B&B Trucking Services, Inc. (“BB”) |
|
● |
Kirnland Food Distribution, Inc. (“Kirnland”) |
|
● |
HG Realty LLC (“HG Realty”) |
In accordance with Accounting Standards Codification (“ASC”) 805-50-25, the transaction consummated through the Agreement has been accounted for as a transaction among entities under common control since the same shareholders controlled all these 11 entities prior to the execution of the Agreement. The consolidated financial statements of the Company have been prepared to report results of operations for the period in which the transfer occurred as though the transfer of net assets or exchange of equity interests had occurred at the beginning of the period presented, in this case January 1, 2018. Results of operations for the period presented comprise those of the previously separate entities combined from the beginning of the period to the end of the period. By eliminating the effects of intra-entity transactions in determining the results of operations for the period before the combination, those results will be on substantially the same basis as the results of operations for the period after the date of combination. The effects of intra-entity transactions on current assets, current liabilities, revenue, and cost of sales for periods presented and on retained earnings at the beginning of the periods presented are eliminated to the extent possible. Furthermore, ASC 805-50-45-5 indicates that the financial statements and financial information presented for prior years also shall be retrospectively adjusted to furnish comparative information.
In accordance with ASC 805-50-30-5, when accounting for a transfer of assets or exchange of shares between entities under common control, the entity that receives the net assets or the equity interests should initially recognize the assets and liabilities transferred at their carrying amounts in the accounts of the transferring entity at the date of the transfer. If the carrying amounts of the assets and liabilities transferred differ from the historical cost of the parent of the entities under common control, then the financial statements of the receiving entity should reflect the transferred assets and liabilities at the historical cost of the parent of the entities under common control. Accordingly, the Company has recorded the assets and liabilities transferred from the above entities at their carrying amount.
The following table summarizes the entities under HF Foods Group Inc. after the above-mentioned reorganization:
| Name |
Date of incorporation |
State of incorporation |
Percentage of legal ownership by HF Group |
Principal activities |
||||
| Parent: | ||||||||
|
HF Holding |
October 11, 2017 |
North Carolina |
100% |
Holding Company | ||||
|
Subsidiaries: |
||||||||
|
Han Feng |
January 14, 1997 |
North Carolina |
100% |
Distributing food and related products | ||||
|
TT |
August 6, 2002 |
North Carolina |
100% |
Trucking service |
||||
|
MFD |
April 15, 1999 |
North Carolina |
100% |
Trucking service |
||||
| R&N Holdings | November 21, 2002 | North Carolina | 100% | Real estate holding | ||||
| R&N Lexington | May 27, 2010 | North Carolina | 100% | Real estate holding | ||||
|
R&N Charlotte |
June xx, 2019 |
North Carolina |
100% |
Real estate holding |
||||
|
Kirnsway |
May 24, 2006 |
North Carolina |
100% |
Design and printing services |
||||
| Chinesetg | July 12, 2011 | North Carolina | 100% | Design and printing services | ||||
| NSF | December 17, 2008 | Florida | 100% | Distributing food and related products | ||||
|
BB |
September 12, 2001 |
Florida |
100% |
Trucking service | ||||
|
Kirnland |
April 11, 2006 |
Georgia |
66.7% |
Distributing food and related products |
||||
|
HG Realty |
May 11, 2012 |
Georgia |
100% |
Real estate holding |
Reverse Acquisition of HF Holding
Effective August 22, 2018, Atlantic consummated the transactions contemplated by a merger agreement (the “Atlantic Merger Agreement”), dated as of March 28, 2018, by and among Atlantic, HF Group Merger Sub Inc., a Delaware subsidiary formed by Atlantic, HF Holding, the stockholders of HF Holding, and Zhou Min Ni, as representative of the stockholders of HF Holding. Pursuant to the Atlantic Merger Agreement, HF Holding merged with HF Merger Sub and HF Holding became the surviving entity (the “Atlantic Merger”) and a wholly-owned subsidiary of Atlantic (the “Atlantic Acquisition”). Additionally, upon the closing of the transactions contemplated by the Atlantic Merger Agreement (the “Atlantic Closing”), (i) the stockholders of HF Holding became the holders of a majority of the shares of common stock of Atlantic, and (ii) Atlantic changed its name to HF Foods Group Inc. (Collectively, these transactions are referred to as the “Atlantic Transactions”).
At closing on August 22, 2018, Atlantic issued the HF Holding stockholders an aggregate of 19,969,831 shares of its common stock, equal to approximately 88.5% of the aggregate issued and outstanding shares of Atlantic’s common stock. The pre- Transaction stockholders of Atlantic owned the remaining 11.5% of the issued and outstanding shares of common stock of the combined entity.
Following the consummation of the Atlantic Transactions on August 22, 2018, there were 22,167,486 shares of common stock issued and outstanding, consisting of (i) 19,969,831 shares issued to HF Holding’s stockholders pursuant to the Atlantic Merger Agreement, (ii) 400,000 shares redeemed by one of Atlantic’s shareholders in conjunction with the Atlantic Transactions, (iii) 10,000 restricted shares issued to one of Atlantic’s shareholders in conjunction with the Atlantic Transactions, and (iv) 2,587,655 shares originally issued to the pre-Transactions stockholders of Atlantic.
The Atlantic Acquisition was treated as a reverse acquisition under the acquisition method of accounting in accordance with accounting principles generally accepted in the United States of America (“U.S. GAAP”). For accounting purposes, HF Holding was considered to be acquiring Atlantic in this transaction. Therefore, the aggregate consideration paid in connection with the business combination was allocated to Atlantic’s tangible and intangible assets and liabilities based on their fair market values. The assets and liabilities and results of operations of Atlantic were consolidated into the results of operations of HF Holding as of the completion of the business combination.
Business Combination with B&R Global
Effective November 4, 2019, HF Group consummated the transactions contemplated by a merger agreement (the “B&R Merger Agreement”), dated as of June 21, 2019, by and among the Company, B&R Merger Sub Inc., a Delaware corporation (“Merger Sub”), B&R Global, the stockholders of B&R Global (the ”B&R Global Stockholders”), and Xiao Mou Zhang, as representative of the stockholders (the “Business Combination”). Upon the closing of the transactions contemplated by the B&R Merger Agreement (the “Closing”), Merger Sub merged with and into B&R Global, resulting in B&R Global becoming a wholly owned subsidiary of HF Group. HF Group acquired 100% of the controlling interest of B&R Global, in exchange for 30,700,000 shares of HF Group Common Stock. The aggregate fair value of the consideration paid by HF Group in the business combination is approximately $576,699,494 and is based on the closing share price of the Company’s common stock at the date of Closing.
Founded in 1999, B&R Global supplies approximately 6,800 restaurants across 11 Western states, and combined with HF Group, creates what we believe is the largest food distributors to Asian restaurants in the United States. The combined entity now has 14 distribution centers strategically located in nine states across the East and West Coasts of the United States and a fleet of over 340 refrigerated vehicles. With 960 employees supported by two call centers in China, HF Group now serves over 10,000 restaurants in 21 states and provides round-the-clock sales and service support to its customers, who mainly converse in Mandarin or Chinese dialects.
The following table summarizes the entities under B&R Global in the Business Combination:
|
Name |
|
Date of formation / incorporation |
|
Place of formation / incorporation |
|
Percentage of legal ownership by B&R Global |
|
Principal activities |
|
Parent: |
|
|
|
|
|
|
|
|
|
B&R Global |
|
January 3, 2014 |
|
Delaware, USA |
|
— |
|
Holding Company |
|
Subsidiaries: |
|
|
|
|
|
|
|
|
|
Rongcheng Trading, LLC (“RC”) |
|
January 31, 2006 |
|
California, USA |
|
100% |
|
Food distribution |
|
Capital Trading, LLC (“UT”) |
|
March 10, 2003 |
|
Utah, USA |
|
100% |
|
Food distribution |
|
Win Woo Trading, LLC (‘WW”) |
|
January 23, 2004 |
|
California, USA |
|
100% |
|
Food distribution |
|
Mountain Food, LLC (“MF”) |
|
May 2, 2006 |
|
Colorado, USA |
|
100% |
|
Food distribution |
|
R & C Trading L.L.C. (“RNC”) |
|
November 26, 2007 |
|
Arizona, USA |
|
100% |
|
Food distribution |
|
Great Wall Seafood LA, LLC (“GW”) |
|
March 7, 2014 |
|
California, USA |
|
100% |
|
Food distribution |
|
B&L Trading, LLC (“BNL”) |
|
July 18, 2013 |
|
Washington, USA |
|
100% |
|
Food distribution |
|
Min Food, Inc. (“MIN”) |
|
May 29, 2014 |
|
California, USA |
|
60.25% |
|
Food distribution |
|
B&R Group Logistics Holding, LLC (“BRGL”) |
|
July 17, 2014 |
|
Delaware, USA |
|
100% |
|
Food distribution |
|
Ocean West Food Services, LLC (“OW”) |
|
December 22, 2011 |
|
California, USA |
|
67.5% |
|
Food distribution |
|
Monterey Food Service, LLC (“MS”) |
|
September 14, 2017 |
|
California, USA |
|
65% |
|
Food distribution |
|
Irwindale Poultry, LLC (“IP”) |
December 27, 2017 |
California, USA |
100% |
Poultry processing |
||||
|
Best Choice Trucking, LLC (“BCT”) |
January 1, 2011 |
California, USA |
100% |
Logistics solutions |
||||
|
KYL Group, Inc. (“KYL”) |
|
April 18, 2014 |
|
Nevada, USA |
|
100% |
|
Logistics solutions |
|
American Fortune Foods Inc. (“AF”) |
|
February 19, 2014 |
|
California, USA |
|
100% |
|
Logistics solutions and importer |
|
Happy FM Group, Inc. (“HFM”) |
|
April 9, 2014 |
|
California, USA |
|
100% |
|
Logistics solutions |
|
GM Food Supplies, Inc. (“GM”) |
|
March 22, 2016 |
|
California, USA |
|
100% |
|
Logistics solutions |
|
Lin’s Distribution, Inc., Inc. (“LIN”) |
|
February2, 2010 |
Utah, USA |
|
100% |
|
Logistics solutions |
|
|
Lin’s Farms, LLC (“LNF”) |
|
July 2, 2014 |
|
Utah, USA |
|
100% |
|
Poultry processing |
|
New Berry Trading, LLC (“NBT”) |
|
September 5, 2012 |
|
California, USA |
|
100% |
|
Logistics solutions |
|
Hayward Trucking, Inc. (“HRT”) |
September 5, 2012 |
California, USA |
100% |
Logistics solutions |
||||
|
Fuso Trucking Corp. (“FUSO”) |
January 20, 2015 |
California, USA |
VIE* |
Logistics solutions |
||||
|
Yi Z Service LLC (“YZ”) |
|
October2, 2017 |
|
California, USA |
|
100% |
|
Logistics solutions |
|
Golden Well Inc. (“GWT”) |
|
November 8, 2011 |
|
California, USA |
|
100% |
|
Logistics solutions |
|
Kami Trading Inc. (“KAMI”) |
|
November 20, 2013 |
|
California, USA |
|
100% |
|
Importer |
|
Royal Trucking Services, Inc. (“RTS”) |
|
May 19, 2015 |
|
Washington, USA |
|
100% |
|
Logistics solutions |
|
Royal Service Inc. (“RS”) |
|
December 29, 2014 |
|
Oregon, USA |
|
100% |
|
Logistics solutions |
|
MF Food Services Inc. (“MFS”) |
|
December 21, 2017 |
|
California, USA |
|
100% |
|
Logistics solutions |
*At the acquisition date and as of December 31, 2019, B&R Global consolidates FUSO, which is considered as variable interest entity (“VIE”) under accounting principles generally accepted in the United States of America (“U.S. GAAP”), due to its pecuniary and contractual interest in this entity as a result of the funding arrangements outlined in the entity.
NOTE 2- SUMMARY OF SIGNIFICANT ACCOUNTING POLICIES
Basis of Presentation and Principles of Consolidation
The accompanying consolidated financial statements have been prepared in accordance with U.S. GAAP. The consolidated financial statements include the financial statements of HF Group, its subsidiaries and the VIE. The VIE has been accounted for at historical cost and prepared on the basis as if common control had been established as of the beginning of the first period presented in the accompanying consolidated financial statements. All inter-company balances and transactions have been eliminated upon consolidation.
U.S. GAAP provides guidance on the identification of VIE and financial reporting for entities over which control is achieved through means other than voting interests. The Company evaluates each of its interests in an entity to determine whether or not the investee is a VIE and, if so, whether the Company is the primary beneficiary of such VIE. In determining whether the Company is the primary beneficiary, the Company considers if the Company (1) has power to direct the activities that most significantly affect the economic performance of the VIE, and (2) receives the economic benefits of the VIE that could be significant to the VIE. If deemed the primary beneficiary, the Company consolidates the VIE.
As of December 31, 2019 and 2018, FUSO is considered to be a VIE. FUSO was established solely to provide exclusive services to the Company. The entity lacks sufficient equity to finance its activities without additional subordinated financial support from the Company, and the Company has the power to direct the VIEs’ activities. In addition, the Company receives the economic benefits from the entity and has concluded that the Company is a primary beneficiary.
The carrying amounts of the assets, liabilities, the results of operations and cash flows of the VIE is included in the Company’s consolidated balance sheets, statements of income and statements of cash flows are as follows:
|
December 31, 2019 |
December 31, 2018 |
|||||||
|
Current assets |
$ | 158,184 | $ | - | ||||
|
Non-current assets |
301,803 | - | ||||||
|
Total assets |
$ | 459,987 | $ | - | ||||
|
Current liabilities |
$ | 805,666 | $ | - | ||||
|
Non-current liabilities |
69,321 | - | ||||||
|
Total liabilities |
$ | 874,987 | $ | - | ||||
|
For the year ended December 31 |
||||||||
|
2019 |
2018 |
|||||||
|
Net revenue |
$ | 420,163 | $ | - | ||||
|
Net income |
$ | 68,449 | $ | - | ||||
|
For the year ended December 31 |
||||||||
|
2019 |
2018 |
|||||||
|
Net cash provided by operating activities |
$ | 201,885 | $ | - | ||||
|
Net cash used in financing activities |
(207,159 | ) | - | |||||
|
Net decrease in cash and cash equivalents |
$ | (5,274 | ) | $ | - | |||
Noncontrolling Interests
U.S. GAAP requires that noncontrolling interests in subsidiaries and affiliates be reported in the equity section of a company’s balance sheet. In addition, the amounts attributable to the net income (loss) of those subsidiaries are reported separately in the consolidated statements of income.
As of December 31, 2019 and 2018, noncontrolling interest consisted of the following:
|
Name of Entity |
Percentage of Ownership of noncontrolling interest |
December 31, 2019 |
December 31, 2018 |
|||||||||
|
Kirnland |
33.30 | % | 1,292,623 | 1,104,678 | ||||||||
|
OW |
32.50 | % | 1,600,058 | - | ||||||||
|
MS |
35.00 | % | 459,126 | - | ||||||||
|
MIN |
39.70 | % | 896,980 | - | ||||||||
|
Total |
4,248,787 | 1,104,678 | ||||||||||
Uses of Estimates
The preparation of consolidated financial statements in conformity with U.S. GAAP requires management to make estimates and assumptions that affect the reported amounts of assets and liabilities and disclosure of contingent assets and liabilities at the date of the consolidated financial statements and the reported amounts of revenue and expenses during each reporting period. Actual results could differ from those estimates. Significant accounting estimates reflected in the Company’s consolidated financial statements include, but are not limited to, allowance for doubtful accounts, useful lives of property and equipment, lease assumptions, impairment of long-lived assets, long-term investments, goodwill, the purchase price allocation and fair value of noncontrolling interests with respect to business combinations, realization of deferred tax assets, and uncertain income tax positions.
Cash and Cash Equivalents
The Company considers all highly liquid investments purchased with a maturity of three or fewer months to be cash equivalents. As of December 31, 2019 and 2018, the Company had no cash equivalents.
Accounts Receivable
Accounts receivable represent amounts due from customers in the ordinary course of business and are recorded at the invoiced amount and do not bear interest. Receivables are presented net of the allowance for doubtful accounts in the accompanying consolidated balance sheets. The Company evaluates the collectability of its accounts receivable and determines the appropriate allowance for doubtful accounts based on a combination of factors. When the Company is aware of a customer’s inability to meet its financial obligation, a specific allowance for doubtful accounts is recorded, reducing the receivable to the net amount the Company reasonably expects to collect. In addition, allowances are recorded for all other receivables based on historic collection trends, write-offs and the aging of receivables. The Company uses specific criteria to determine uncollectible receivables to be written off, including, e.g., bankruptcy filings, the referral of customer accounts to outside parties for collection, and the length that accounts remain past due. As of December 31, 2019 and 2018, the allowances for doubtful accounts were $623,970 and $658,104, respectively.
Inventories
The Company’s inventories, consisting mainly of food and other food service-related products, are primarily considered as finished goods. Inventory costs, including the purchase price of the product and freight charges to deliver it to the Company’s warehouses, are net of certain cash or non-cash consideration received from vendors. The Company assesses the need for valuation allowances for slow-moving, excess and obsolete inventories by estimating the net recoverable value of such goods based upon inventory category, inventory age, specifically identified items, and overall economic conditions. Inventories are stated at the lower of cost or net realizable value using the first-in, first-out (FIFO) method. As of December 31, 2019 and 2018, the valuation allowance was $16,928 and nil, respectively.
Property and Equipment
Property and equipment are stated at cost, less accumulated depreciation and amortization. Depreciation is calculated using the straight-line method over the estimated useful lives of the assets. Following are the estimated useful lives of the Company’s property and equipment:
|
Estimated useful lives (years) |
||||
|
Buildings and improvements |
7 | - | 39 | |
|
Machinery and equipment |
3 | - | 15 | |
|
Motor vehicles |
5 | - | 7 | |
Repair and maintenance costs are charged to expense as incurred, whereas the cost of renewals and betterment that extends the useful lives of property, plant and equipment are capitalized as additions to the related assets. Retirements, sales and disposals of assets are recorded by removing the cost and accumulated depreciation from the asset and accumulated depreciation accounts with any resulting gain or loss reflected in the consolidated statements of income in other income or expenses.
Business Combinations
The Company accounts for its business combinations using the purchase method of accounting in accordance with ASC 805 (“ASC 805”), “Business Combinations”. The purchase method of accounting requires that the consideration transferred be allocated to the assets, including separately identifiable assets and liabilities the Company acquired, based on their estimated fair values. The consideration transferred in an acquisition is measured as the aggregate of the fair values at the date of exchange of the assets given, liabilities incurred, and equity instruments issued as well as the contingent considerations and all contractual contingencies as of the acquisition date. Identifiable assets, liabilities and contingent liabilities acquired or assumed are measured separately at their fair value as of the acquisition date, irrespective of the extent of any non-controlling interests. The excess of (i) the total of cost of acquisition, fair value of the noncontrolling interests and acquisition date fair value of any previously held equity interest in the acquiree over, (ii) the fair value of the identifiable net assets of the acquiree, is recorded as goodwill. If the cost of acquisition is less than the fair value of the net assets of the subsidiary acquired, the difference is recognized directly in earnings.
The Company estimates the fair value of assets acquired and liabilities assumed in a business combination. While the Company uses its best estimates and assumptions to accurately value assets acquired and liabilities assumed at the acquisition date, its estimates are inherently uncertain and subject to refinement. Significant estimates in valuing certain intangible assets include, but are not limited to future expected revenues and cash flows, useful lives, discount rates, and selection of comparable companies. Although the Company believes the assumptions and estimates it has made in the past have been reasonable and appropriate, they are based in part on historical experience and information obtained from management of the acquired companies and are inherently uncertain. During the measurement period, which may be up to one year from the acquisition date, the Company records adjustments to the assets acquired and liabilities assumed with the corresponding offset to goodwill. On the conclusion of the measurement period or final determination of the values of assets acquired or liabilities assumed, whichever comes first, any subsequent adjustments are recorded to the Company’s consolidated statements of income.
Transaction costs associated with business combinations are expensed as incurred, and are included in general and administrative expenses in the Company’s consolidated statements of income. The results of operations of the businesses that HF Group acquired are included in the Company’s consolidated financial statements from the date of acquisition.
Goodwill
The Company early adopted ASU No. 2017-04, Intangibles - Goodwill and Other (Topic 350): Simplifying the Test for Goodwill Impairment. The standard simplifies the subsequent measurement of goodwill by removing Step 2 of the current goodwill impairment test, which requires a hypothetical purchase price allocation. Under the new standard, an impairment loss will be recognized in the amount by which a reporting unit's carrying value exceeds its fair value, not to exceed the carrying amount of goodwill.
Goodwill represents the excess of the purchase price over the fair value of net assets acquired in a business combination. The Company tests goodwill for impairment at least annually, in the fourth quarter, or whenever events or changes in circumstances indicate that goodwill might be impaired.
The Company reviews the carrying values of goodwill and identifiable intangibles whenever events or changes in circumstances indicate that such carrying values may not be recoverable and annually for goodwill and indefinite lived intangible assets as required by ASC Topic 350, Intangibles — Goodwill and Other. This guidance provides the option to first assess qualitative factors to determine whether it is more likely than not that the fair value of a reporting unit is less than its carrying value. If, based on a review of qualitative factors, it is more likely than not that the fair value of a reporting unit is less than its carrying value, the Company performs a quantitative analysis. If the quantitative analysis indicates the carrying value of a reporting unit exceeds its fair value, the Company measures any goodwill impairment losses as the amount by which the carrying amount of a reporting unit exceeds its fair value, not to exceed the total amount of goodwill allocated to that reporting unit.
Intangible Assets
Intangible assets are carried at cost and amortized on a straight-line basis over their estimated useful lives. The Company determines the appropriate useful life of its intangible assets by measuring the expected cash flows of acquired assets. The estimated useful lives of intangible assets are as follows:
|
Estimated useful lives (years) |
||
|
Tradenames |
10 | |
|
Customer relationships |
20 |
Long term investments
The Company’s investments in unconsolidated entities consist of equity investments without readily determinable fair value.
The Company follows ASC 321, using the measurement alternative to measure investments in investees that do not have readily determinable fair value and over which the Company does not have significant influence at cost, less any impairment, plus or minus changes resulting from observable price changes in orderly transactions for identical or similar investments of the same issuer, if any. The Company makes a qualitative assessment of whether the investment is impaired at each reporting date. If a qualitative assessment indicates that the investment is impaired, the Company has to estimate the investment’s fair value in accordance with the principles of ASC Topic 820, Fair Value Measurements and Disclosures. If the fair value is less than the investment’s carrying value, the entity has to recognize an impairment loss in net income equal to the difference between the carrying value and fair value.
Investments in entities in which the Company can exercise significant influence but does not own a majority equity interest or control are accounted for using the equity method of accounting in accordance with ASC 323 (“ASC 323”), “Investments-Equity Method and Joint Ventures”. Under the equity method, the Company initially records its investment at cost and the difference between the cost and the fair value of the underlying equity in the net assets of the equity investee is recognized as equity method goodwill, which is included in the equity method investment on the consolidated balance sheets. The equity method goodwill is not subsequently amortized and is not tested for impairment under ASC 350. The Company subsequently adjusts the carrying amount of the investment to recognize the Company’s proportionate share of each equity investee’s net income or loss into earnings after the date of investment. The Company evaluates the equity method investments for impairment under ASC 323. An impairment loss on the equity method investments is recognized in earnings when the decline in value is determined to be other-than-temporary.
The Company did not record any impairment loss on its long term investments as of December 31, 2019 and 2018.
Impairment of Long-lived Assets other than goodwill
The Company assesses its long-lived assets such as property and equipment for impairment whenever events or changes in circumstances indicate the carrying amount of an asset may not be recoverable. Factors which may indicate potential impairment include a significant underperformance related to the historical or projected future operating results or a significant negative industry or economic trend. Recoverability of these assets is measured by comparison of their carrying amounts to future undiscounted cash flows the assets are expected to generate. If property and equipment, and intangible assets are considered to be impaired, the impairment to be recognized equals the amount by which the carrying value of the assets exceeds their fair value. The Company did not record any impairment loss on its long-lived assets as of December 31, 2019 and 2018.
Revenue Recognition
The Company recognizes revenue from the sale of products when title and risk of loss passes and the customer accepts the goods, which occurs at delivery. Sales taxes invoiced to customers and remitted to government authorities are excluded from net sales.
On January 1, 2018 the Company adopted Accounting Standards Update (“ASU”) 2014-09 Revenue from Contracts with Customers (FASB ASC Topic 606) using the modified retrospective method for contracts that were not completed as of January 1, 2018. The results of applying Topic 606 using the modified retrospective approach were insignificant and did not have a material impact on the Company’s consolidated financial condition, results of operations, cash flows, business process, controls or systems.
The core principle underlying the revenue recognition ASU is that the Company will recognize revenue to represent the transfer of goods and services to customers in an amount that reflects the consideration to which the Company expects to be entitled in such exchange. This will require the Company to identify contractual performance obligations and determine whether revenue should be recognized at a point in time or over time, based on when control of goods and services transfers to a customer. The majority of the Company’s contracts have one single performance obligation as the promise to transfer the individual goods is not separately identifiable from other promises in the contracts and is, therefore, not distinct. The Company’s revenue streams are recognized at a specific point in time.
The contract assets and contract liabilities are recorded on the consolidated balance sheets as accounts receivable and advance payments from customers as of December 31, 2019 and 2018. For the years ended December 31, 2019 and 2018, revenue recognized from performance obligations related to prior periods was insignificant.
Revenue expected to be recognized in any future periods related to remaining performance obligations is insignificant. The following table summarizes disaggregated revenue from contracts with customers by geographic locations:
|
For the Years Ended |
||||||||
|
December 31, 2019 |
December 31, 2018 |
|||||||
|
North Carolina |
$ | 145,756,172 | $ | 138,790,263 | ||||
|
Florida |
91,173,814 | 88,670,044 | ||||||
|
Georgia |
65,173,052 | 63,546,391 | ||||||
|
Arizona |
7,196,217 | - | ||||||
|
California |
54,877,209 | - | ||||||
|
Colorado |
6,658,931 | - | ||||||
|
Utah |
8,249,684 | - | ||||||
|
Washington |
9,077,202 | - | ||||||
|
Total |
$ | 388,162,281 | $ | 291,006,698 | ||||
Shipping and Handling Costs
Shipping and handling costs, which include costs related to the selection of products and their delivery to customers, are presented in distribution, selling and administrative expenses. Shipping and handling costs were $4,443,967 and $5,205,673 for the years ended December 31, 2019 and 2018, respectively.
Income Taxes
The Company accounts for income taxes under the asset and liability method, which requires the recognition of deferred tax assets and liabilities for the expected future tax consequences of events that have been included in the financial statements. Under this method, the Company determines deferred tax assets and liabilities on the basis of the differences between the financial statement and tax bases of assets and liabilities by using enacted tax rates in effect for the year in which the differences are expected to reverse. The effect of a change in tax rates on deferred tax assets and liabilities is recognized in income in the period that includes the enactment date.
The Company recognizes deferred tax assets to the extent that it believes that these assets are more likely than not to be realized. In making such a determination, the Company considers all available positive and negative evidence, including future reversals of existing taxable temporary differences, projected future taxable income, tax-planning strategies, and results of recent operations. If the Company determines that it would be able to realize its deferred tax assets in the future in excess of their net recorded amount, the Company would make an adjustment to the deferred tax asset valuation allowance, which would reduce the provision for income taxes.
The Company records uncertain tax positions in accordance with ASC 740 on the basis of a two-step process in which (1) the Company determines whether it is more likely than not that the tax positions will be sustained on the basis of the technical merits of the position and (2) for those tax positions that meet the more-likely-than-not recognition threshold, the Company recognizes the largest amount of tax benefit that is more than 50 percent likely to be realized upon ultimate settlement with the related tax authority. The Company does not believe that there were any uncertain tax positions at December 31, 2019 and 2018.
Leases
On January 1, 2019, the Company adopted Accounting Standards Update (“ASU”) 2016-02. For all leases that were entered into prior to the effective date of ASC 842, the Company elected to apply the package of practical expedients. Based on this guidance the Company will not reassess the following: (1) whether any expired or existing contracts are or contain leases; (2) the lease classification for any expired or existing leases; and (3) initial direct costs for any existing leases. The new standard was adopted in the current quarter and did not have a material impact on the Company’s consolidated balance sheets or on its consolidated income statements.
The adoption of Topic 842 resulted in the presentation of $21.2 million of operating lease assets and operating lease liabilities on the consolidated balance sheet as of January 1, 2019. See Note 11 for additional information.
The Company determines if an arrangement is a lease at inception. Operating leases are included in operating lease right-of-use (“ROU”) assets, current portion of obligations under operating leases, and obligations under operating leases, non-current on the Company’s consolidated balance sheets. Finance leases are included in property and equipment, net, current portion of finance lease liabilities, and finance lease liabilities, non-current on the consolidated balance sheets.
Operating lease ROU assets and operating lease liabilities are recognized based on the present value of the future minimum lease payments over the lease term at commencement date. As most of the Company’s leases do not provide an implicit rate, the Company uses its incremental borrowing rate based on the information available at commencement date in determining the present value of future payments. The operating lease ROU asset also includes any lease payments made and excludes lease incentives and initial direct costs incurred. The Company’s lease terms may include options to extend or terminate the lease when it is reasonably certain that the Company will exercise that option. Lease expense for minimum lease payments is recognized on a straight-line basis over the lease term.
Earnings Per Share
The Company computes earnings per share (“EPS”) in accordance with ASC 260, “Earnings per Share” (“ASC 260”). ASC 260 requires companies with complex capital structures to present basic and diluted EPS. Basic EPS is measured as net income divided by the weighted average common shares outstanding for the period. Diluted EPS is similar to basic EPS but presents the dilutive effect on a per share basis of potential common shares (e.g., convertible securities, options and warrants) as if they had been converted at the beginning of the periods presented, or issuance date, if later. Potential common shares that have an anti- dilutive effect (i.e., those that increase income per share or decrease loss per share) are excluded from the calculation of diluted EPS. There is no anti-dilutive effect for the years ended December 31, 2019 and 2018.
Fair Value of Financial Instruments
The Company follows the provisions of FASB ASC 820, Fair Value Measurements and Disclosures. ASC 820 clarifies the definition of fair value, prescribes methods for measuring fair value, and establishes a fair value hierarchy to classify the inputs used in measuring fair value as follows:
Level 1 - Inputs are unadjusted quoted prices in active markets for identical assets or liabilities available at the measurement date.
Level 2 - Inputs are unadjusted quoted prices for similar assets and liabilities in active markets, quoted prices for identical or similar assets and liabilities in markets that are not active, inputs other than quoted prices that are observable, and inputs derived from or corroborated by observable market data.
Level 3 - Inputs are unobservable inputs which reflect the reporting entity’s own assumptions about what assumptions market participants would use in pricing the asset or liability based on the best available information.
The carrying amounts reported in the balance sheets for cash, accounts receivable, advances to suppliers, notes receivable - current, other current assets, accounts payable, bank overdraft, income tax payable, advances from customers, current portion of long-term debt, current portion of obligations under capital and operating leases, and accrued expenses and other liabilities approximate their fair value based on the short-term maturity of these instruments.
Concentrations and Credit Risk
Credit risk
Accounts receivable are typically unsecured and derived from revenue earned from customers, and thereby exposed to credit risk. The risk is mitigated by the Company’s assessment of its customers’ creditworthiness and its ongoing monitoring of outstanding balances.
Concentration risk
There were no receivables from any one customer representing more than 10% of the Company’s consolidated gross accounts receivable at December 31, 2019 and 2018.
For the years ended December 31, 2019 and 2018, no supplier accounted for more than 10% of the total cost of revenue. As of December 31, 2019, two suppliers accounted for 34% and 15% of total advance payments outstanding and these two suppliers accounted for 70% and 30% of advance payments to related parties, respectively. As of December 31, 2018, three suppliers accounted for 55%, 18% and 12% of total advance payments outstanding and these three suppliers accounted for 65%, 22% and 14% of advance payments to related parties, respectively.
Recent Accounting Pronouncements
In June 2016, the FASB issued ASU 2016-13, “Measurement of Credit Losses on Financial Instruments (Topic 326): Measurement of Credit Losses on Financial Instruments” (“ASU 2016-13”). ASU 2016-13 requires companies to measure credit losses utilizing a methodology that reflects expected credit losses and requires a consideration of a broader range of reasonable and supportable information to inform credit loss estimates. ASU 16-13 was further amended in November 2019 in “Codification Improvements to Topic 326, Financial Instruments-Credit losses”. This guidance is effective for fiscal years beginning after December 15, 2019, including those interim periods within those fiscal years. The Company is currently assessing the impact of adopting this standard, but based on a preliminary assessment, does not expect the adoption of this guidance to have a material impact on its consolidated financial statements.
In August 2018, the FASB issued ASU 2018-13, “Fair Value Measurement (Topic 820): Disclosure Framework—Changes to the Disclosure Requirements for Fair Value Measurement” (“ASU 2018-13”). ASU 2018-13 removes, modifies and adds certain disclosure requirements in Topic 820 “Fair Value Measurement”. ASU 2018-13 eliminates certain disclosures related to transfers and the valuations process, modifies disclosures for investments that are valued based on net asset value, clarifies the measurement uncertainty disclosure, and requires additional disclosures for Level 3 fair value measurements. ASU 2018-13 is effective for the Company for annual and interim reporting periods beginning January 1, 2020. The Company is currently evaluating the impact ASU 2018-13 will have on its consolidated financial statements.
In December 2019, the FASB issued ASU No. 2019-12, “Income Taxes (Topic 740): Simplifying the Accounting for Income Taxes” (“ASU 2019-12”), which is intended to simplify various aspects related to accounting for income taxes. ASU 2019-12 removes certain exceptions to the general principles in Topic 740 and also clarifies and amends existing guidance to improve consistent application. This guidance is effective for fiscal years, and interim periods within those fiscal years, beginning after December 15, 2020, with early adoption permitted. The Company is currently assessing the impact of adopting this standard, but based on a preliminary assessment, does not expect the adoption of this guidance to have a material impact on its consolidated financial statements.
NOTE 3 - ACCOUNTS RECEIVABLE, NET
Accounts receivable consisted of the following:
|
As of 2019 |
As of 2018 |
|||||||
|
Accounts receivable |
$ | 50,651,104 | $ | 15,064,580 | ||||
|
Less: allowance for doubtful accounts |
(623,970 |
) |
(658,104 |
) |
||||
|
Accounts receivable, net |
$ | 50,027,134 | $ | 14,406,476 | ||||
Movement of allowance for doubtful accounts is as follows:
|
For the Years Ended |
||||||||
|
December 31, 2019 |
December 31, 2018 |
|||||||
|
Beginning balance |
$ | 658,104 | $ | 567,108 | ||||
|
Provision for doubtful accounts |
(4,515 | ) | 119,329 | |||||
|
Less: write off/recovery |
(29,619 | ) | (28,333 |
) |
||||
|
Ending balance |
$ | 623,970 | $ | 658,104 | ||||
NOTE 4- NOTES RECEIVABLE
On September 30, 2018, the Company entered into a line of credit promissory note agreement with Feilong Trading, Inc, which is a supplier to the Company. Pursuant to the promissory note agreement, Feilong Trading, Inc. was permitted to borrow up to $4,000,000 from time to time. The note bore interest at the rate of 5% per annum on the unpaid balance, compounded monthly. On September 30, 2019, the entire outstanding balance of $3,622,505 was sold to Mr. Zhou Min Ni in exchange for 272,369 shares of common stock of the Company, which shares were received and recorded as treasury stock by the Company as of September 30, 2019. In connection with the sale of this note receivable, the Company also required 89,882 additional shares of common stock of the Company owned by Mr. Ni to be placed in an escrow account for a period of one year (the “Escrow Period”), which will be delivered to the Company in part or in full, if the weighted average closing price of the Company’s common stock for the 250-trading-day period immediately preceding the expiration of the Escrow Period is less than $13.30.
NOTE 5 – LONG TERM INVESTMENTS
Long term investments consisted of the following:
|
Ownership as of December 31, 2019 |
As of |
As of |
|||||||||
|
Pt. Tamron Akuatik Produk Industri |
12% | $ | 1,800,000 | $ | - | ||||||
|
Asahi Food, Inc. |
49% | 496,276 | - | ||||||||
|
Long term investments |
$ | 2,296,276 | $ | - | |||||||
The investment in Pt. Tamron Akuatik Produk Industri is accounted for using the measurement alternative under ASC321, which is measured at cost, less any impairment, plus or minus changes resulting from observable price changes in orderly transactions for identical or similar investments, if any. The investment in Asahi Food, Inc. is accounted for under the equity method due to the fact that the Company has significant influence but does not exercise full control over this investee. The Company believes there was no impairment as of December 31, 2019 and 2018 for these investments.
NOTE 6 - PROPERTY AND EQUIPMENT, NET
Property and equipment, net consisted of the following:
|
As of 2019 |
As of 2018 |
|||||||
|
Land |
$ | 2,010,253 | $ | 1,608,647 | ||||
|
Buildings and improvements |
26,903,528 | 18,784,628 | ||||||
|
Machinery and equipment |
13,412,961 | 10,160,205 | ||||||
|
Motor vehicles |
23,841,730 | 10,267,095 | ||||||
|
Subtotal |
66,168,472 | 40,820,575 | ||||||
|
Less: accumulated depreciation |
(28,630,325 |
) |
(18,170,554 |
) |
||||
|
Property and equipment, net |
$ | 37,538,147 | $ | 22,650,021 | ||||
Depreciation expense was $3,251,162 and $2,134,832 for the years ended December 31, 2019 and 2018, respectively.
NOTE 7 – BUSINESS COMBINATION WITH B&R GLOBAL
Effective November 4, 2019, HF Group acquired 100% of the controlling interest of B&R Global, in exchange for 30,700,000 shares of HF Group Common Stock. HF Group is considered at both the legal and accounting acquirer based on the fact that there was no change of control in connection with this business combination. The aggregate fair value of the consideration paid by HF Group in the business combination is $576,699,494 and is based on the closing share price of the Company’s common stock at the date of Closing.
The information included herein has been prepared based on the allocation of the purchase price using estimates of the fair value of assets acquired and liabilities assumed which were determined with the assistance of independent valuations using quoted market prices, discounted cash flow, and estimates made by management. The purchase price allocation is subject to further adjustment until all pertinent information regarding the assets and liabilities acquired are fully evaluated by the Company, not to exceed one year as permitted under ASC 805, Business Combinations.
The following table presents the estimated fair value of the assets acquired and liabilities assumed at the date of acquisition:
|
Cash |
$ | 7,017,467 | ||
|
Accounts receivable, net |
30,934,831 | |||
|
Accounts receivable - related parties, net |
3,393,930 | |||
|
Inventories, net |
56,451,885 | |||
|
Other current assets |
2,332,063 | |||
|
Other current assets - related parties |
498,211 | |||
|
Advances to suppliers, net |
97,964 | |||
|
Property and equipment, net |
11,042,601 | |||
|
Deposit |
281,282 | |||
|
Deposit – related parties |
591,380 | |||
|
Long-term investments |
2,289,389 | |||
|
Right-of-use assets |
17,791,681 | |||
|
TANGIBLE ASSETS ACQUIRED |
132,722,684 | |||
|
Lines of credit |
$ | 35,567,911 | ||
|
Accounts payable |
24,884,247 | |||
|
Accounts payable - related parties |
1,528,139 | |||
|
Bank overdraft |
12,082,094 | |||
|
Accrued expenses |
778,779 | |||
|
Other payables |
185,938 | |||
|
Other payables – related party |
733,448 | |||
|
Customer deposits |
38,510 | |||
|
Long-term debt |
3,284,159 | |||
|
Lease liabilities |
17,791,680 | |||
|
Deferred tax liabilities arising from acquired intangible assets |
51,413,633 | |||
|
TANGIBLE LIABILITIES ASSUMED |
148,288,538 | |||
|
NET TANGIBLE LIABILITIES ASSUMED |
(15,565,854 | ) | ||
|
Identifiable intangible assets |
188,503,000 | |||
|
Goodwill |
406,703,348 | |||
|
INTANGIBLE ASSETS ACQUIRED |
595,206,348 | |||
|
Noncontrolling interests |
2,941,000 | |||
|
Total consideration |
576,699,494 | |||
| $ | 579,640,494 |
The Company recorded acquired intangible assets of $188,503,000. These intangible assets include tradenames of $29,303,000 and customer relationships of $159,200,000. The associated goodwill and intangible assets are not deductible for tax purposes.
The amounts of revenue and earnings of B&R Global included in the Company’s consolidated statement of income from the acquisition date to December 31, 2019 are as follows:
|
From acquisition date to December 31, 2019 |
||||
|
Net Revenue |
$ | 86,059,243 | ||
|
Net Income |
$ | 1,355,343 | ||
The following table presents the Company’s unaudited pro forma results for the years ended December 31, 2019 and 2018, respectively, as if the B&R Global Acquisition had occurred on January 1, 2018. The unaudited pro forma financial information presented includes the effects of adjustments related to the amortization of acquired intangible assets, and excludes other non-recurring transaction costs directly associated with the acquisition such as legal and other professional service fees. Statutory rates were used to calculate income taxes.
|
Year ended December 31, |
||||||||
|
2019 |
2018 |
|||||||
|
Pro forma Net revenue |
$ | 828,045,703 | $ | 817,981,204 | ||||
|
Pro forma Net income |
6,799,694 | (1) | 16,114,247 | (1) | ||||
|
Pro forma Net income attributable to HF Group |
5,662,499 | (1) | 15,774,413 | (1) | ||||
|
Pro forma earnings per common share - basic and diluted |
$ | 0.11 | $ | 0.31 | ||||
|
Weighted average shares - basic and diluted |
53,293,566 | 51,232,829 | ||||||
|
(1) |
Includes intangibles asset amortization expense of $10,890,300 for the years ended December 31, 2019 and December 31, 2018, respectively. |
NOTE 8 - GOODWILL AND ACQUIRED INTANGIBLE ASSETS
Goodwill
The changes in HF Group’s carrying amount of goodwill by segment are presented below:
|
HF Group |
|
Total |
||||||||||
|
Balance at January 1 and December 31, 2018 |
- | - | - | |||||||||
|
B&R Global Acquisition |
- | 406,703,348 | 406,703,348 | |||||||||
|
Balance at December 31, 2019(1) |
$ | - | $ | 406,703,348 | $ | 406,703,348 | ||||||
|
(1) |
There are no accumulated impairment losses. |
Acquired Intangible Assets
In connection with the Business Acquisition, HF Group acquired $188,503,000 of intangible assets, primarily representing tradenames and customer relationships, which have an estimated weighted-average amortization period of approximately 10 years and 20 years respectively. The components of the intangible assets are as follows:
|
At December 31, |
2019 |
2018 |
||||||||||||||||||||||
|
Gross Carrying Amount |
Accumulated Amortization |
Net Carrying amount |
Gross Carrying Amount |
Accumulated Amortization |
Net Carrying Amount |
|||||||||||||||||||
|
Tradenames |
$ | 29,303,000 | $ | (488,383 | ) | 28,814,617 | $ | - | $ | - | - | |||||||||||||
|
Customer relationships |
159,200,000 | (1,326,667 | ) | 157,873,333 | - | - | ||||||||||||||||||
|
Total |
$ | 188,503,000 | $ | (1,815,050 | ) | 186,687,950 | $ | - | $ | - | - | |||||||||||||
HF Group’s amortization expense for intangible assets was $1,815,050 in 2019 and nil in 2018, respectively. Estimated future amortization expense for intangible assets is presented below:
|
Twelve months ending December 31, |
||||
|
2020 |
$ | 10,890,300 | ||
|
2021 |
10,890,300 | |||
|
2022 |
10,890,300 | |||
|
2023 |
10,890,300 | |||
|
2024 |
10,890,300 | |||
|
Thereafter |
132,236,450 | |||
|
Total |
$ | 186,687,950 |
NOTE 9 - LINES OF CREDIT
On July 1, 2016, Han Feng, HF Group’s main operating entity, entered into a line of credit agreement with East West Bank. The line of credit agreement provided for a revolving credit of $14,500,000. The line of credit was secured by virtually all assets of Han Feng, the premises and an adjoining undeveloped parcel of land owned by R&N Holding, and premises owned by R&N Lexington. The principal and all accrued unpaid interest were originally due in May 2018 and then extended to May 27, 2019, in order to provide an uninterrupted credit facility while the renewal of the line of credit is being reviewed by the bank. Interest was based on the prime rate less 0.15%, but in no event less than 3.25% per annum, and was payable monthly. On April 18, 2019, this $5,156,018 obligation was repaid in full with proceeds from the Credit Agreement with East West Bank entered into on April 18, 2019, as described below.
On November 14, 2012, NSF, another operating entity, entered into a line of credit agreement with Bank of America. The line of credit agreement provided for a revolving credit of $4,000,000. The line of credit was secured by three real properties owned by NSF, and guaranteed by the two shareholders of the Company, as well as BB, a subsidiary of the Company. The maximum borrowings were determined by certain percentages of eligible accounts receivable and inventories. The principal and all accrued unpaid interest were originally due in January 2018 and subsequently extended to February 2020. Interest was based on the LIBOR rate plus 2.75%. On April 18, 2019, this $954,984 obligation was paid off in full with proceeds from the Credit Agreement with East West Bank entered into on April 18, 2019, as described below.
On April 18, 2019, the Company, Han Feng, NSF and Kirnland entered into a Credit Agreement (the “Credit Agreement”) with East West Bank. The Credit Agreement provided for a $25 million secured line of credit facility available to be used in one or more revolving loans to the Company’s domestic subsidiaries that were parties to the Credit Agreement for working capital and general corporate purposes. Han Feng, NSF and Kirnland (the “Borrower Subsidiaries”) were the borrowers and the Company and each of its other material subsidiaries were guarantors of all the obligations under the Credit Agreement. The original maturity of the line of credit was August 18, 2021. Contemporaneously with the execution of the Credit Agreement, existing senior debt of the Borrower Subsidiaries in the amount of $6,111,692 was paid from revolving loans drawn on the line of credit. Under the Credit Agreement, the Borrower subsidiaries were to pay interest on the principal amounts drawn on the line of credit at a rate per annum equal to (a) 0.375% below the Prime Rate in effect from time to time, or (b) 2.20% above the LIBOR Rate in effect from time to time, depending on the rate elected at the time a borrowing request is made, but in no event would the interest rate of any revolving loan at any time be less than 4.214% per annum (4.625% at September 30, 2019). The outstanding balance on the line of credit at September 30, 2019 was $11,864,481. The Credit Agreement contained certain financial covenants which, among other things, required Han Feng to maintain certain financial ratios. On November 4, 2019, the line of credit was paid off from borrowings under the Amended and Restated Credit Agreement entered into in connection with the closing of the merger with B&R Global as described below. The outstanding balance paid off, including accrued interest, was $13,864,481.
On November 4, 2019, the Company entered into an Amended and Restated Credit Agreement with JP Morgan Chase Bank, N.A. (“JP Morgan”). The Amended and Restated Credit Agreement provides for a $100 million asset-secured revolving credit facility maturing on November 4, 2022, with an option to renew at the bank’s discretion. The line of credit is collateralized by all assets of the Company and is also guaranteed by B&R Group Realty Holding, LLC (“B&R Group Realty”) and its subsidiaries (“B&R Realty Subsidiaries”), which are related parties of the Company. The Amended and Restated Credit Agreement contains financial covenants requiring the Company on a consolidated basis to maintain a Fixed Charge Coverage Ratio of 1.10 to 1.00, determined as of the end of each fiscal quarter for the four fiscal quarter periods then ended. As of December 31, 2019, the Company was in compliance with the covenants under the credit agreement. The outstanding principal balance on the line of credit as of December 31, 2019 was $41.6 million.
NOTE 10 - LONG-TERM DEBT
Long-term debt at December 31, 2019 and 2018 is as follows:
|
Bank name |
Maturity |
Interest rate at December 31, 2019 |
As of 2019 |
As of 2018 |
|||||||||||
|
East West Bank – (a) |
August 2027 - September 2029 |
3.94% | - | 4.25% | $ | 6,989,016 | $ | 5,053,539 | |||||||
|
Capital Bank – (b) |
October 2027 |
3.85% | 4,967,075 | 5,138,988 | |||||||||||
|
Bank of America – (c) |
April 2021 – December 2029 |
3.9% | 5.51% | 4,263,663 | 1,363,211 | ||||||||||
|
J.P. Morgan Chase (d) |
February 2023 – December 2023 | 3.07% | 2,702,371 | - | |||||||||||
|
BMO Harris Bank – (e) |
April 2022 - January 2024 |
5.87% | - | 5.99% | 508,564 | 2,256,724 | |||||||||
|
Peoples United Bank – (e) |
April 2020 – January 2023 |
5.75% | 7.53% | 1,114,993 | |||||||||||
|
Other finance companies – (e) |
January 2020 – March 2024 |
3.9% | - | 6.14% | 716,315 | 752,833 | |||||||||
|
Total debt |
21,261,997 | 14,565,295 | |||||||||||||
|
Less: current portion |
(2,726,981 |
) |
(1,455,441 |
) |
|||||||||||
|
Long-term debt |
$ | 18,535,016 | $ | 13,109,854 | |||||||||||
The terms of the various loan agreements related to long-term bank borrowings contain certain restrictive financial covenants which, among other things, require the Company to maintain specified ratios of debt to tangible net assets and debt service coverage. As of December 31, 2019 and 2018, the Company was in compliance with such covenants.
The loans outstanding were guaranteed by the following properties, entities or individuals, or otherwise secured as shown:
|
(a) |
Guaranteed by two shareholders of the Company, as well as five subsidiaries of the Company, Han Feng, TT, MFD, R&N Holding and R&N Lexington. Also secured by assets of Han Feng and R&N Lexington and R&N Holding, two real properties of R&N Holding, and a parcel of real property owned by R&N Lexington. Balloon payment of $2,293,751 is due in 2027 and another balloon payments of $3,007,239 is due in 2029. |
|
(b) |
Guaranteed by two shareholders, as well as Han Feng, a subsidiary of the Company. Also secured by a real property owned by HG Realty. Balloon payment for this debt is $3,116,687. |
|
(c) |
Guaranteed by two shareholders, as well as two subsidiaries of the Company, NSF and BB. Secured by real property, equipment and fixtures, inventories, receivables and all other personal property owned by NSF. Balloon payment for this long-term debt is $1,382,046. |
|
(d) |
Secured by specific vehicles and equipment as defined in loan agreements. |
|
(e) |
Secured by vehicles. |
The future maturities of long-term debt as of December 31,2019 are as follows:
|
Twelve months ending December 31, |
||||
|
2020 |
$ | 2.726.981 | ||
|
2021 |
2,498,578 | |||
|
2022 |
2,169,861 | |||
|
2023 |
1,202,845 | |||
|
2024 |
684,129 | |||
|
Thereafter |
11,979,603 | |||
|
Total |
$ | 21,261,997 |
NOTE 11 - LEASES
On January 1, 2019, the Company adopted Accounting Standards Update (“ASU”) 2016-02. For all leases that were entered into prior to the effective date of ASC 842, the Company elected to apply the package of practical expedients. The Company leases office space and warehouses under non-cancelable operating leases, with terms typically ranging from one to five years, as well as operating and finance leases for vehicles and delivery trucks, forklifts and computer equipment with various expiration dates through 2021. The Company determines whether an arrangement is or includes an embedded lease at contract inception.
Operating lease assets and lease liabilities are recognized at commencement date and initially measured based on the present value of lease payments over the defined lease term. Lease expense is recognized on a straight-line basis over the lease term. For finance leases, the Company also recognizes a finance lease asset and finance lease liability at inception, with lease expense recognized as interest expense and amortization of the lease payment.
Operating Leases
The components of lease expense were as follows:
|
For the Year Ended |
||||
|
December 31, 2019 |
||||
|
Operating lease cost |
$ | 1,601,678 | ||
|
Weighted Average Remaining Lease Term (Months) |
||||
|
Operating leases |
51 |
|
Weighted Average Discount Rate |
||||
|
Operating leases |
4.0 |
% |
Finance Leases
The components of lease expense were as follows:
|
For the Year Ended |
||||||||
|
December 31, 2019 |
December 31, 2018 |
|||||||
|
Finance leases cost: |
||||||||
|
Amortization of right-of-use assets |
$ | 571,130 | $ | 275,163 | ||||
|
Interest on lease liabilities |
110,274 | 51,637 | ||||||
|
Total finance leases cost |
$ | 681,404 | $ | 326,800 | ||||
Supplemental cash flow information related to finance leases was as follows:
|
For the Year Ended |
||||||||
|
December 31, 2019 |
December 31, 2018 |
|||||||
|
Cash paid for amounts included in the measurement of lease liabilities: |
||||||||
|
Operating cash flows from finance leases |
110,274 | 51,537 | ||||||
Supplemental balance sheet information related to leases was as follows:
|
December 31 2019 |
December 31, 2018 |
|||||||
|
Finance Leases |
||||||||
|
Property and equipment, at cost |
$ | 2,793,731 | $ | 1,484,911 | ||||
|
Accumulated depreciation |
(1,293,130 |
) |
(810,753 |
) |
||||
|
Property and equipment, net |
$ | 1,500,601 | $ | 674,158 | ||||
|
Weighted Average Remaining Lease Term (Months) |
||||||||
|
Finance leases |
54 | 27 | ||||||
|
Weighted Average Discount Rate |
||||||||
|
Finance leases |
7.51 |
% |
8.05 |
% |
||||
Maturities of lease liabilities were as follows
|
Twelve months ending December 31, |
Operating Leases |
Finance Leases |
||||||
|
2020 |
$ | 4,956,356 | $ | 373,715 | ||||
|
2021 |
4,423,554 | 362,024 | ||||||
|
2022 |
3,860,092 | 334,223 | ||||||
|
2023 |
3,330,372 | 313,160 | ||||||
|
2024 |
2,184,500 | 227,788 | ||||||
|
Total Lease Payments |
18,754,874 | 1,610,910 | ||||||
|
Less Imputed Interest |
(1,599,290 |
) |
(277,501 |
) |
||||
|
Total |
$ | 17,155,584 | $ | 1,333,409 | ||||
On July 2, 2018, AnHeart entered into two separate leases for two buildings located in Manhattan, New York, at 273 Fifth Avenue and 275 Fifth Avenue, for 30 years and 15 years, respectively, which are net leases, meaning that AnHeart is required to pay all costs associated with the buildings, including utilities, maintenance and repairs. HF Holding provided a guaranty for all rent and related costs of the leases, including costs associated with the construction of a two-story structure at 273 Fifth Avenue and rehabilitation of the building at 275 Fifth Avenue.
On February 23, 2019, HF Group executed an agreement to transfer all of its ownership interest in AnHeart to Jianping An, a resident of New York, for a sum of $20,000. The transfer of ownership was completed on May 2, 2019. However, the transfer of ownership does not release HF Holding’s guaranty of AnHeart’s obligations or liabilities under the original lease agreements. Under the terms of the sale to Ms. An, AnHeart executed provided a security interest in all AnHeart assets and a covenant that the Company will be assigned the leases if AnHeart defaults. Further, AnHeart has tendered an unconditional guaranty of all AnHeart liabilities arising from the leases, in favor of the Company, executed by Minsheng Pharmaceutical Group Company, Ltd., a Chinese manufacturer and distributor of herbal medicines.
NOTE 12 – SUPPLEMENTAL CASH FLOWS INFORMATION
Supplemental cash flow disclosures and noncash investing and financing activities are as follows:
|
For the Years Ended |
||||||||
|
December 31, 2019 |
December 31, 2018 |
|||||||
|
Supplemental disclosure of cash flow data: |
||||||||
|
Cash paid for interest |
$ | 1,520,545 | $ | 1,344,750 | ||||
|
Cash paid for income taxes |
$ | 2,677,205 | $ | 2,065,000 | ||||
|
Supplemental disclosure of non-cash investing and financing activities |
||||||||
|
Right of use assets obtained in exchange for operating lease liabilities |
$ | 767,323 | $ | - | ||||
|
Property and equipment obtained in exchange for finance lease liabilities |
$ | 1,432,662 | $ | - | ||||
|
Property and equipment purchases from notes payable |
$ | 1,080,153 | $ | - | ||||
|
Notes receivable sold to shareholder in exchange of common stock |
$ | 12,038,030 | $ | - | ||||
|
Common Stock issued for consideration of acquisition of B&R Global* |
$ | 576,699,494 | $ | - | ||||
*See Note 7 for details of assets acquired and liabilities assumed under the B&R Acquisition.
NOTE 13 - TAXES
|
A. |
Corporate Income Taxes (“CIT”) |
Prior to January 1, 2018, Han Feng, TT, MFD, Kirnsway, Chinesetg, NSF and BB had elected under the Internal Revenue Code to be S corporations. R&N Holdings, R&N Lexington and HG realty were formed as limited liability companies taxed as partnerships. An S corporation or partnership is considered a flow-through entity and is generally not subject to federal or state income tax at the entity level. In lieu of corporate income taxes, the stockholders and members of these entities are taxed on their proportionate share of the entities’ taxable income. Kirnland did not elect to be treated as an S corporation and was the only entity that is subject to corporate income taxes under this report.
Effective January 1, 2018, all of the above-listed S corporation and partnership entities were converted to C corporations and will be taxed at the entity level going forward. Accordingly, the Company shall account for income taxes of all these entities under ASC 740. The Company has recognized the impact on deferred income tax assets and liabilities from the conversion of the above-mentioned S corporations and partnership entities to C corporations in the consolidated financial statements as of December 31, 2018.
On December 22, 2017, the U.S. enacted the Tax Cuts and Jobs Act (the “Act”), which significantly changed U.S. tax law. The Act lowered the Company’s U.S. statutory federal income tax rate from 35% to 21% effective January 1, 2018, while also imposing a deemed repatriation tax on deferred foreign income. The Act also created a new minimum tax on certain future foreign earnings. The Company expects the new federal income tax rate will significantly lower the Company’s income tax expenses going forward. The Company does not expect the repatriation tax and new minimum tax on certain future foreign earnings to have any impact on the Company’s operations since it currently has no foreign income and does not expect to generate any foreign income in the future.
|
(i) |
The provision for income taxes of the Company for the years ended December 31, 2019 and 2018 consists of the following: |
|
For the Years Ended |
||||||||
|
December 31, 2019 |
December 31, 2018 |
|||||||
|
Current: |
||||||||
|
Federal |
$ | 1,907,309 | $ | 1,474,467 | ||||
|
State |
540,488 | 373,871 | ||||||
|
Current income taxes |
2,447,797 | 1,848,338 | ||||||
|
Deferred: |
||||||||
|
Federal |
(156,892 |
) |
520,163 | |||||
|
State |
(93,813 | ) | 121,754 | |||||
|
Deferred income taxes |
(250,705 |
) |
641,917 | |||||
|
Total provision for income taxes |
$ | 2,197,092 | $ | 2,490,255 | ||||
|
(ii) |
Temporary differences and carryforwards of the Company that created significant deferred tax assets and liabilities are as follows: |
|
As of 2019 |
As of 2018 |
|||||||
|
Deferred tax assets: |
||||||||
|
Allowance for doubtful accounts |
$ | 373,438 | $ | 165,083 | ||||
|
Inventories |
594,628 | 113,730 | ||||||
|
Federal NOL |
228,637 | - | ||||||
|
State NOL |
80,514 | - | ||||||
|
Section 481(a) adjustment |
- | 40,317 | ||||||
|
Accrued expenses |
80,100 | 46,750 | ||||||
|
Total deferred tax assets |
1,357,317 | 365,880 | ||||||
|
Deferred tax liabilities: |
||||||||
|
Property and equipment |
(3,270,536 |
) |
(1,444,008 |
) |
||||
|
Intangibles assets |
(50,327,833 |
) |
- | |||||
|
Total deferred tax liabilities |
(53,598,369 |
) |
(1,444,008 |
) |
||||
|
Net deferred tax liabilities |
$ | (52,241,052 |
) |
$ | (1,078,128 |
) |
||
The net deferred tax liabilities presented in the Company's Consolidated Balance Sheets were as follows:
|
As of 2019 |
As of 2018 |
|||||||
|
Deferred tax assets |
$ | 78,993 | $ | 117,933 | ||||
|
Deferred tax liabilities |
(52,320,045 |
) |
(1,196,061 |
) |
||||
|
Net deferred tax liabilities |
$ | (52,241,052 |
) |
$ | (1,078,128 |
) |
||
|
(iii) |
Reconciliations of the statutory income tax rate to the effective income tax rate are as follows: |
|
For the Years Ended |
||||||||
|
December 31, 2019 |
December 31, 2018 |
|||||||
|
Federal statutory tax rate |
21.0 |
% |
21.0 |
% |
||||
|
State statutory tax rate |
4.0 |
% |
4.4 |
% |
||||
|
U.S. permanent difference |
1.0 |
% |
1.0 |
% |
||||
|
Other |
1.2 |
% |
1.7 | % | ||||
|
Effective tax rate |
27.2 |
% |
28.1 |
% |
||||
NOTE 14 – RELATED PARTY TRANSACTIONS
The Company records transactions with various related parties. The related party transactions as of December 31, 2019 and 2018 and for the years ended December 31, 2019 and 2018 are identified as follows:
Related party balances:
|
a. |
Accounts receivable - related parties, net |
Below is a summary of accounts receivable with related parties as of December 31, 2019 and 2018, respectively:
|
As of December 31 |
As of December 31, |
||||||||
|
Name of Related Party |
2019 |
2018 |
|||||||
|
(a) |
Allstate Trading Company Inc. |
$ | 11,322 | $ | 1,000 | ||||
|
(b) |
Enson Seafood GA Inc. (formerly “GA-GW Seafood, Inc.”) |
348,833 | 255,412 | ||||||
|
(c) |
Eagle Food Service LLC |
979,591 | 817,275 | ||||||
|
(d) |
Fortune One Foods Inc. |
53,862 | 130,314 | ||||||
|
(e) |
Eastern Fresh LLC |
1,511,075 | 784,836 | ||||||
|
(f) |
Enson Trading LLC |
341,200 | 170,633 | ||||||
|
(g) |
Hengfeng Food Service Inc. |
477,541 | 83,654 | ||||||
|
(h) |
N&F Logistic, Inc. |
119,241 | - | ||||||
|
(i) |
ABC Trading, LLC |
238,513 | - | ||||||
|
Others |
121,692 | 49,027 | |||||||
|
Total |
$ | 4,202,870 | $ | 2,292,151 | |||||
|
(a) |
Mr. Zhou Min Ni, the Chairman and Co-Chief Executive Officer of the Company, owns a 40% equity interest in this entity; |
|
(b) |
Mr. Zhou Min Ni owns a 50% equity interest in this entity. |
|
(c) |
Tina Ni, one of Mr. Zhou Min Ni’s family members, owns a 50% equity interest in this entity. |
|
(d) |
Mr. Zhou Min Ni owns a 17.5% equity interest in this entity. |
|
(e) |
Mr. Zhou Min Ni owns a 30% equity interest in this entity. |
|
(f) |
Mr. Zhou Min Ni owns a 25% equity interest in this entity. |
|
(g) |
Mr. Zhou Min Ni owns a 45% equity interest in this entity. |
|
(h) |
Mr. Zhou Min Ni owns a 25% equity interest in this entity. |
|
(i) |
Mr. Peter Zhang, Co-Chief Executive Officer and Chief Financial Officer of the Company, owns 10.38% equity interest in this entity. |
All accounts receivable from these related parties are current and considered fully collectible. No allowance is deemed necessary.
|
b. |
Advances to suppliers - related parties, net |
The Company periodically provides purchase advances to various vendors, including the related party suppliers. These advances are made in the normal course of business and are considered fully realizable.
Below is a summary of advances to related party suppliers as of December 31, 2019 and December 31, 2018, respectively:
|
As of |
As of |
|||||||
|
Name of Related Party |
December 31, 2019 |
December 31, 2018 |
||||||
|
(1) Ocean Pacific Seafood Group |
$ | 223,303 | $ | 208,960 | ||||
|
(2) Revolution Industry, LLC |
521,832 | 329,394 | ||||||
|
(3) First Choice Seafood Inc. |
- | 988,128 | ||||||
|
Total |
$ | 745,135 | $ | 1,526,482 | ||||
|
(1) |
Mr. Zhou Min Ni owns a 25% equity interest in this entity. |
|
(2) |
The son of Mr. Zhou Min N, Raymond Ni, owns 100% of Revolution Industry, LLC. |
|
(3) |
First Choice Seafood is owned by Enson Seafood GA Inc., of which Mr. Zhou Min Ni owns a 50% equity interest. |
|
c. |
Notes receivable - related parties |
The Company had previously made advances or loans to certain entities that are either owned by the controlling shareholders of the Company or family members of the controlling shareholders.
As of December 30, 2019, and December 31, 2018, the outstanding loans to various related parties consist of the following:
|
Name of Related Party |
As of December 31, 2019 |
As of December 31, 2018 |
||||||
|
Enson Seafood GA Inc. (formerly “GA-GW Seafood, Inc.”) |
$ | - | $ | 1,987,241 | ||||
|
Han Feng Global Inc., t/a NSG International Inc. (“NSG”) (1) |
- | 6,092,397 | ||||||
|
Revolution Automotive, LLC (“Revolution Automotive”) (2) |
- | 461,311 | ||||||
|
Total |
$ | - | $ | 8,540,949 | ||||
|
Less: Current portion |
$ | - | $ | 8,117,686 | ||||
|
Total |
$ | - | $ | 423,263 | ||||
|
(1) |
Mr. Zhou Min Ni owns a 30% equity interest in this entity. |
|
(2) |
The son of Mr. Zhou Min Ni, Raymond Ni, owns 100% of Revolution Automotive LLC. |
On January 1, 2018, the Company entered into a promissory note agreement with Enson Seafood. Pursuant to the promissory note agreement, the outstanding balances of $550,000 due from Enson Seafood as of December 31, 2017 were converted into promissory notes bearing annual interest of 5% commencing January 1, 2018. The principal plus interest was due no later than December 31, 2019. Interest was computed on the outstanding balance on the basis of the actual number of days elapsed in a year of 360 days.
On September 30, 2018, the Company signed a promissory note agreement with Enson Seafood in the principal amount of $2,000,000. The note accrued interest at the rate of 5% per annum on the unpaid balance, compounded monthly. The principal plus all accrued and unpaid interest was initially due no later than September 30, 2019, with an option to renew, and required Enson Seafood to make monthly payments of $171,215 for twelve months. On March 1, 2019, the Company and Enson Seafood extended the expiration date of the note until February 29, 2024 and Mr. Zhou Min Ni agreed to personally guarantee the note.
On January 1, 2018, the Company signed a promissory note agreement with NSG. Pursuant to the promissory note agreement, the outstanding balances of $5,993,552 due from NSG as of December 31, 2017 were converted into promissory notes bearing annual interest of 5% commencing January 1, 2018. The principal plus interest was required to be paid off no later than December 31, 2019. Interest was computed on the outstanding balance on the basis of the actual number of days elapsed in a year of 360 days.
On March 1, 2019, the Company entered into a new five year-term promissory note agreement with NSG that comprised a restatement and novation and superseded the note dated January 1, 2018. Pursuant to the new promissory note agreement, the outstanding balance of $5,941,031 together with interest at the rate of 5% per annum became payable in monthly installments until principal and accrued interest was paid in full on or before March 1, 2024.
On March 1, 2018, the Company entered into a promissory note agreement by which Revolution Automotive was loaned $483,628. Pursuant to this promissory note agreement, Revolution Automotive was required to make monthly payments of $5,000 for 60 months, including interest, with final payment of $284,453. The loan bore interest of 5% per annum. Interest was computed on the outstanding balance on the basis of the actual number of days elapsed in a year of 360 days. The principal plus interest was to be paid off no later than April 30, 2023.
On March 1, 2019, the Company and each of Enson Seafood and NSG agreed to extend the expiration date of their notes payable until February 29, 2024, and Mr. Zhou Min Ni agreed to personally guarantee these notes.
On September 30, 2019, the entire outstanding balance of all the above notes of $8,415,525 was sold to Mr. Zhou Min Ni in exchange for 632,746 shares of common stock of the Company, which shares were received and recorded in treasury stock by the Company as of September 30, 2019. In connection with the sale of the above notes, the Company also required 208,806 additional shares of common stock of the Company owned by Mr. Ni to be placed in an escrow account for a period of one year (the “Escrow Period”), which will be delivered to the Company in part or in full, if the volume weighted average closing price of the Company’s common stock for the 250-trading-day period immediately preceding the expiration of the Escrow Period is less than $13.30.
|
d. |
Accounts payable - related parties |
As of December 31, 2019, and December 31, 2018, the Company had a total accounts payable balance of $4,521,356 and $3,923,120 due to various related parties, respectively. All these accounts payable to related parties occurred in the ordinary course of business and are payable upon demand without interest.
|
e. |
Advances from customers - related parties |
The Company also periodically receives advances from its related parties for business purposes. These advances are interest free and due upon demand. There were no advances from customers involving related parties at December 31, 2019 and $166,490 as of December 31, 2018.
|
f. |
Security deposit - related parties |
The Company made deposits to its related parties for warehouse rental purposes. These deposits are expected to be returned upon termination of the respective leases. Total deposits to related parties amounted to $591,380 as of December 31, 2019 and there were no deposits as of December 31, 2018.
|
g. |
Term Loan guaranty - related parties |
B&R Global Group Realty and its subsidiaries have a mortgage-secured Term Loan in the amount of $55.4 million as of December 31, 2019. The term loan is collateralized by all assets of the Company.
Lease Agreements with Related Parties:
A subsidiary of the Company, R&N Holding, leases a facility to a related party under an operating lease agreement expiring in 2024. The cost of the leased building is $400,000 at December 31, 2019 and 2018, and the accumulated depreciation of the leased building is $78,282 and $100,000 at December 31, 2019 and December 31, 2018, respectively. Rental income for the year ended December 31, 2019 and December 31, 2018 was $45,600 and $45,600, respectively.
In 2017, a subsidiary of the Company, HG Realty, leased a warehouse to a related party under an operating lease agreement expiring on September 21, 2027. The cost of the leased building is $3,223,745 at December 31, 2019 and December 31, 2018, and the accumulated depreciation of the leased building is $516,626 and $433,966 as of December 31, 2019 and December 31, 2018, respectively. Rental income for the year ended December 31, 2019 and December 31, 2018 was $480,000 and $480,000, respectively.
B&R Global leased warehouses from related parties owned by the majority shareholder of B&R Global. Rent incurred to the related parties was $751,000 for the year ended on December 31, 2019.
In 2019, a subsidiary of the Company, Kirnland, leased a warehouse from a related party under an operating lease agreement expiring on December 31, 2019. Rent incurred to the related party was $120,000 for the year ended December 31, 2019.
Related party sales and purchases transactions:
The Company makes regular sales to and purchases from various related parties during the normal course of business. The total sales to related parties were $19,352,408 and $18,147,003 for the years ended 2019 and 2018, respectively. The total purchases made from related parties were $40,388,000 and $31,676,828 for the year ended December 31, 2019 and 2018, respectively.
NOTE 15 - SEGMENT REPORTING
ASC 280, “Segment Reporting,” establishes standards for reporting information about operating segments on a basis consistent with the Company’s internal organizational structure as well as information about geographical areas, business segments and major customers in financial statements for details on the Company’s business segments. The Company uses the “management approach” in determining reportable operating segments. The management approach considers the internal organization and reporting used by the Company’s chief operating decision maker for making operating decisions and assessing performance as the source for determining the Company’s reportable segments. Management, including the chief operating decision makers, reviews operation results by the revenue of different products. After acquiring the business of B&R Global, the Company distinguishes revenues, costs and expenses between HF Group and B&R Global in its internal reporting, and reports costs and expenses by nature in different operating segments. As a result, the Company has two reportable segments, including HF Group and B&R Global, and has re-presented the segment reporting for the year ended December 31, 2018 as follows.
The following table presents net sales by segment for the years ended December 31, 2019 and 2018, respectively:
|
For the Year Ended |
||||||||
|
December 31, 2019 |
December 31, 2018 |
|||||||
|
Net revenue |
||||||||
|
HF |
$ | 302,103,038 | $ | 291,006,698 | ||||
|
B&R Global |
86,059,243 | - | ||||||
|
Total |
$ | 388,162,281 | $ | 291,006,698 | ||||
All the Company’s revenue was generated from its business operations in the U.S.
|
For the Year Ended December 31, 2019 |
||||||||||||
|
HF |
B&R Global |
Total |
||||||||||
|
Revenue |
$ | 302,103,038 | $ | 86,059,243 | $ | 388,162,281 | ||||||
|
Cost of revenue |
252,078,738 | 72,875,020 | 324,953,758 | |||||||||
|
Gross profit |
50,024,300 | 13,184,223 | 63,208,523 | |||||||||
|
Depreciation and amortization |
5,487,027 | 1,267,481 | 6,754,508 | |||||||||
|
Total capital expenditures |
$ | 4,681,404 | $ | 154,525 | $ | 4,835,929 | ||||||
|
For the Year Ended December 31, 2018 |
||||||||||||
|
HF |
B&R Global |
Total |
||||||||||
|
Revenue |
$ | 291,006,698 | $ | - | $ | 291,006,698 | ||||||
|
Cost of revenue |
241,441,149 | - | 241,441,149 | |||||||||
|
Gross profit |
49,565,549 | - | 49,565,549 | |||||||||
|
Depreciation and amortization |
$ | 2,134,832 | $ | - | $ | 2,134,832 | ||||||
|
As of 2019 |
As of 2018 |
|||||||
|
Total assets: |
||||||||
|
HF |
$ | 80,514,529 | $ | 82,476,407 | ||||
|
B&R Global |
722,329,265 | - | ||||||
|
Total Assets |
$ | 802,843,794 | $ | 82,476,407 | ||||
All of the Company’s long-lived assets are located in the US.
NOTE 16 – COMMITMENT AND CONTINGENCY
Various labor and employment lawsuits were filed by former employees against FUSO, NBT, and HRT, alleging these entities failed to provide proper meal and rest breaks, as well as other related violations. These entities deny all the allegations. Management believes there is no merit to the cases and will vigorously defend the cases. Therefore, the Company did not accrue any loss contingency for this matter on its consolidated financial statements as of December 31, 2019 and 2018.
NOTE 17 – SUBSEQUENT EVENTS
On January 17, 2020, the Company, its wholly-owned subsidiary, B&R Global, and certain of the wholly-owned subsidiaries and affiliates of the Company, as borrowers, and certain material subsidiaries of the Company as guarantors, entered into a Second Amended and Restated Credit Agreement (the “Second Amended Credit Agreement”) with JPMorgan Chase Bank, N.A. (“JPMorgan”), as Administrative Agent, and certain lender parties thereto, including Comerica Bank. The Second Amended Credit Agreement provides for (a) a $100 million asset-secured revolving credit facility maturing on November 4, 2022 (the “Facility”), and (b) mortgage-secured Term Loans of $75.6 million.
On January 17, 2020, the Company completed the transactions contemplated by that certain member interest purchase agreement dated the same date (the “Purchase Agreement”) by and among its subsidiary B&R Global, B&R Group Realty, and nine subsidiary limited liability companies wholly owned by B&R Group Realty (the “B&R Realty Subsidiaries”) (the “Acquisition”). The total purchase price for the Acquisition was around $101 million. Consideration for the Acquisition was funded by (i) $75.6 million in mortgage-backed term loans financed under the Second Amended Credit Agreement, (ii) issuance by B&R Global and the Company of a $7.0 million Unsecured Subordinated Promissory Note to B&R Group Realty, and (iii) payment of $18.7 million from funds drawn from the Company’s revolving credit facility. Upon completion of this acquisition, B&R Realty Subsidiaries became wholly-owned subsidiaries of the Company.
|
ITEM 9. |
CHANGES IN AND DISAGREEMENTS WITH ACCOUNTANTS ON ACCOUNTING AND FINANCIAL DISCLOSURE. |
None.
|
ITEM 9A. |
CONTROLS AND PROCEDURES. |
Evaluation of Disclosure Controls and Procedures
Under the supervision and with the participation of our management, including our principal executive officer and principal financial and accounting officer, we conducted an evaluation of the effectiveness of our disclosure controls and procedures, as such term is defined in Rules 13a-15(e) and 15d-15(e) under the Exchange Act, as of the end of the fiscal year ended December 31, 2019. Based on this evaluation, our principal executive officer and principal financial and accounting officer have concluded that as a result of the material weakness in our internal control over financial reporting as described below, our disclosure controls and procedures were not effective as of December 31, 2019. Notwithstanding the material weakness, our management has concluded that the financial statements included elsewhere in this report present fairly, and in all materials respects, our financial position on results of operation and cash flow in conformity with GAAP.
Disclosure controls and procedures are designed to ensure that information required to be disclosed by us in our Exchange Act reports is recorded, processed, summarized, and reported within the time periods specified in the SEC’s rules and forms, and that such information is accumulated and communicated to our management, including our principal executive officer and principal financial officer or persons performing similar functions, as appropriate to allow timely decisions regarding required disclosure.
Management’s Report on Internal Control Over Financial Reporting
Our management is responsible for establishing and maintaining adequate internal control over financial reporting, as defined in Rules 13a-15(f) and 15d-15(f) of the Exchange Act. Our internal control over financial reporting is a process designed under the supervision of our Chief Executive Officers and Chief Financial Officer to provide reasonable assurance regarding the reliability of financial reporting and the preparation of financial statements for external purposes in accordance with generally accepted accounting principles.
Because of its inherent limitations, internal control over financial reporting may not detect or prevent misstatements. Also, projections of any evaluation of the effectiveness to future periods are subject to risk that controls may become inadequate because of changes in conditions, or that the degree of compliance with the policies or procedures may deteriorate.
As of December 31, 2019, our management assessed the effectiveness of our internal control over financial reporting based on the criteria for effective internal control over financial reporting established in “Internal Control - Integrated Framework”, issued by the Committee of Sponsoring Organizations of the Treadway Commission in 2013. In connection with this review and the audit of our consolidated financial statements for the year ended December 31, 2019, we identified material weaknesses and control deficiencies in our internal control over financial reporting. The material weaknesses related to (1) of the Company does not have in-house accounting personnel with sufficient knowledge of US GAAP and SEC reporting experiences, especially related to complex transactions and new accounting pronouncements; and (2) The Company failed to maintain effective IT General Controls, including missing certain entity level controls in IT management, lack of segregation of duties in IT functions, proper review of the operation of application systems, and measures to protect data security and maintain business sustainability. Control deficiencies are related to the lack of proper documentation to evidence the management review in various business processes. Due to the foregoing material weakness and control deficiencies, management concluded that as of December 31, 2019, our internal control over financial reporting was ineffective.
In order to address and resolve the foregoing material weakness, we have begun to implement measures designed to improve our internal control over financial reporting to remediate this material weakness, including hiring additional financial personnel with requisite training and experience in the preparation of financial statements in compliance with applicable SEC requirements, formalizing our processes to generate documentation sufficient to support customer orders and purchase orders, and implementing controls to obtain documentation evidencing customer agreements to transaction amounts and account balances.
The measures we are implementing are subject to continued management review supported by confirmation and testing, as well as audit committee oversight. Management remains committed to the implementation of remediation efforts to address this material weakness. Although we will continue to implement measures to remedy our internal control deficiencies, there can be no assurance that our efforts will be successful or avoid potential future material weakness. In addition, until remediation steps have been completed and/or operated for a sufficient period of time, and subsequent evaluation of their effectiveness is completed, the material weakness identified and described above will continue to exist.
Our independent registered public accounting firm is not yet required to formally attest to the effectiveness of our internal controls over financial reporting, and will not be required to do so for as long as we are an “emerging growth company” pursuant to the provisions of the JOBS Act.
Changes in Internal Controls Over Financial Reporting
There have been no changes in our internal controls over financial reporting for the three months ended December 31, 2019 that have materially affected, or are reasonably likely to materially affect, our internal controls over financial reporting.
|
ITEM 9B. |
OTHER INFORMATION. |
None.
PART III.
|
ITEM 10. |
DIRECTORS, EXECUTIVE OFFICERS AND CORPORATE GOVERNANCE. |
The information required by this item will be set forth under “Proposal No. 1: Election of Directors” in the Company’s Proxy Statement for its 2020 Annual Meeting of Stockholders to be filed with the SEC and is incorporated herein by reference.
The information required by this item regarding Section 16(a) beneficial ownership reporting compliance will be set forth under “Section 16(a) Beneficial Ownership Reporting Compliance” in the Company’s Proxy Statement for its 2020 Annual Meeting of Stockholders to be filed with the SEC and is incorporated herein by reference.
|
ITEM 11. |
EXECUTIVE COMPENSATION. |
The information required by this item will be set forth under “Executive and Director Compensation” in the Company’s Proxy Statement for its 2020 Annual Meeting of Stockholders to be filed with the SEC and is incorporated herein by reference.
The Equity Compensation Plan Information table required pursuant to Item 201(d) of Regulation S-K will be set forth in the Company’s Proxy Statement for its 2020 Annual Meeting of Stockholders to be filed with the SEC and is incorporated herein by reference.
|
ITEM 12. |
SECURITY OWNERSHIP OF CERTAIN BENEFICIAL OWNERS AND MANAGEMENT AND RELATED STOCKHOLDER MATTERS. |
The information required by this item will be set forth under “Stock Ownership” in the Company’s Proxy Statement for its 2020 Annual Meeting of Stockholders to be filed with the SEC and is incorporated herein by reference.
|
ITEM 13. |
CERTAIN RELATIONSHIPS AND RELATED TRANSACTIONS, AND DIRECTOR INDEPENDENCE. |
The information required by this item will be set forth under “Transactions with Related Persons” and “Determination of Independence” in the Company’s Proxy Statement for its 2020 Annual Meeting of Stockholders to be filed with the SEC and is incorporated herein by reference.
|
ITEM 14. |
PRINCIPAL ACCOUNTING FEES AND SERVICES. |
The information required by this item will be set forth under “Ratification of Freedman LLP as Independent Registered Public Accounting Firm for 2020” in Company’s Proxy Statement for its 2020 Annual Meeting of Stockholders to be filed with the SEC and is incorporated herein by reference.
PART IV
|
ITEM 15. |
EXHIBITS AND FINANCIAL STATEMENT SCHEDULES. |
The following exhibits are incorporated herein by reference or are filed or furnished with this report as indicated below:
|
Exhibit Number |
Description |
|
2.1 |
|
3.1 |
|
|
3.2 |
|
|
3.3 |
|
|
4.1 |
|
|
4.2 |
|
|
4.3 |
|
|
10.1 |
|
|
10.2 |
|
|
10.3 |
|
|
10.4 |
|
|
10.5 |
|
|
10.6 |
|
|
10.7 |
|
|
10.8 |
|
|
10.9 |
|
10.10 |
|
|
10.11 |
|
|
10.12 |
|
|
10.13 |
|
|
10.14 |
|
|
10.15 |
|
|
10.16 |
|
|
10.17 |
|
|
10.18 |
|
|
21 |
|
| 23.1 | Consent of Friedman |
|
31.1 |
|
|
31.2 |
|
|
32.1 |
|
|
32.2 |
|
101.INS |
XBRL Instance Document |
|
101.SCH |
XBRL Taxonomy Extension Schema Document |
|
101.CAL |
XBRL Taxonomy Extension Calculation Linkbase Document |
|
101.DEF |
XBRL Taxonomy Extension Definition Linkbase Document |
|
101.LAB |
XBRL Taxonomy Extension Label Linkbase Document |
|
101.PRE |
XBRL Taxonomy Extension Presentation Linkbase Document |
* Management contract or compensatory plan or arrangement.
|
ITEM 16. |
FORM 10-K SUMMARY |
None.
SIGNATURES
Pursuant to the requirements of Section 13 or 15(d) of the Securities Exchange Act of 1934, as amended, the registrant has duly caused this report to be signed on its behalf by the undersigned, thereunto duly authorized.
|
|
HF Foods Group Inc. |
||
|
|
|
|
|
|
Date: March 16, 2020 |
By: |
|
/s/ Zhou Min Ni |
|
|
|
|
Zhou Min Ni |
|
|
|
|
Co- Chief Executive Officer (Principal executive officer) |
|
|
|
|
|
|
Date: March 16, 2020 |
By: |
|
/s/ Xiao Mou Zhang |
|
|
|
|
Xiao Mou Zhang |
|
|
|
|
Co- Chief Executive Officer and Co-Chief Financial Officer (Principal financial and accounting officer) |
Pursuant to the requirements of the Securities Exchange Act of 1934, as amended, this report has been signed below by the following persons on behalf of the Registrant and in the capacities and on the dates indicated.
|
Signature |
|
Title |
|
Date |
|
|
|
|
||
|
/s/ Zhou Min Ni |
|
Chairman of the Board, Chief Executive Officer |
|
March 16, 2020 |
|
Zhou Min Ni |
|
(Principal executive officer) |
|
|
|
|
|
|
|
|
|
/s/ Xiao Mou Zhang |
|
Co- Chief Executive Officer and Co-Chief Financial Officer |
|
March 16, 2020 |
|
Xiao Mou Zhang |
|
(Principal financial and accounting officer) |
|
|
|
|
|
|
|
|
|
/s/ Zhehui Ni |
|
Director |
|
March 16, 2020 |
|
Zhehui Ni |
|
|
|
|
|
|
|
|
|
|
|
/s/ Xi Lin |
|
Director |
|
March 16, 2020 |
|
Xi Lin |
|
|
|
|
|
|
|
|
|
|
|
/s/ Hong Wang |
|
Director |
|
March 16, 2020 |
|
Hong Wang |
|
|
|
|
| 73 |