Attached files
| file | filename |
|---|---|
| 8-K - 8-K - Chaparral Energy, Inc. | chpe-8k_20180410.htm |
April 10, 2018 IPAA Oil & Gas Investment Symposium Exhibit 99.1
Statements made in these presentation slides and by representatives of Chaparral Energy (“Chaparral” or the “company”) during the course of this presentation that are not historical facts are “forward-looking statements.” These statements are based on certain assumptions and expectations made by the company, which reflect management’s experience, estimates and perception of historical trends, current conditions and anticipated future developments. Such statements are subject to a number of assumptions, risks and uncertainties, many of which are beyond the control of the company, which may cause actual results to differ materially from those implied or anticipated in the forward-looking statements. These include risks relating to financial performance and results, ability to improve our financial results and profitability following emergence from bankruptcy, availability of sufficient cash flow to execute our business plan, continued low or further declining commodity prices and demand for oil, natural gas and natural gas liquids, ability to hedge future production, ability to replace reserves and efficiently develop current reserves and the regulatory environment and other important factors that could cause actual results to differ materially from those anticipated or implied in the forward-looking statements. Initial production (IP) rates are discreet data points in each well’s productive history. These rates are sometimes actual rates and sometimes extrapolated or normalized rates. As such, the rates for a particular well may decline over time and change as additional data becomes available. Peak production rates are not necessarily indicative or predictive of future production rates or economic rates of return from such wells and should not be relied upon for such purpose. The ability of the company or the relevant operator to maintain expected levels of production from a well is subject to numerous risks and uncertainties, including those referenced and discussed above. In addition, methodology the company and other industry participants utilize to calculate peak IP rates may not be consistent and, as a result, the values reported may not be directly and meaningfully comparable. These and other important factors could cause actual results to differ materially from those anticipated or implied in the forward-looking statements. Please read “risk factors” in the company’s annual reports on form 10-K, quarterly reports on form 10-Q and other public filings. We undertake no obligation to publicly update any forward-looking statements, whether as a result of new information or future events. Forward-Looking Statements and Risk Factors
General Overview
High-growth STACK pure-play upstream oil company Effectively completed transition to pure-play with sale of EOR Q1 2018E STACK production of ~12 Mboe/d 2018 STACK production growth projected 20-30% STACK reserves increase from YE16 to YE 17 - 58% 117,000 acres in world-class STACK resource play Deep inventory of STACK operated drilling locations Robust well economics – IRR ranging ~40% - 80% Low cost structure with focus on continued cost reduction Strong balance sheet Chaparral Story Building the premier pure-play upstream oil company in the STACK
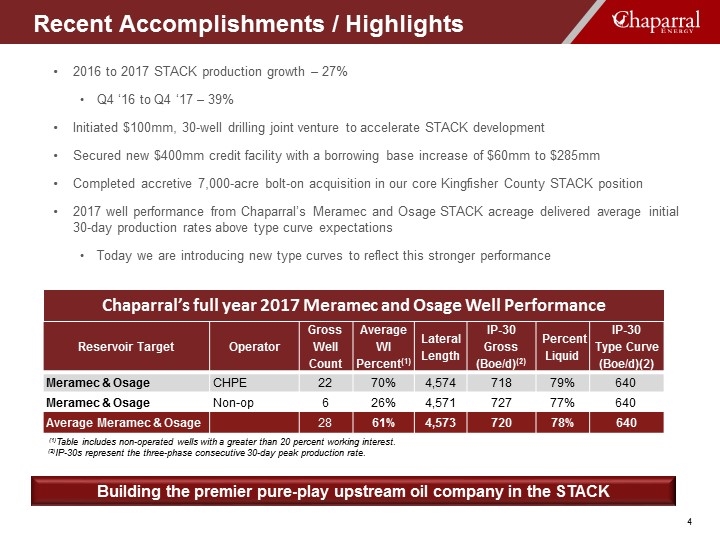
2016 to 2017 STACK production growth – 27% Q4 ‘16 to Q4 ‘17 – 39% Initiated $100mm, 30-well drilling joint venture to accelerate STACK development Secured new $400mm credit facility with a borrowing base increase of $60mm to $285mm Completed accretive 7,000-acre bolt-on acquisition in our core Kingfisher County STACK position 2017 well performance from Chaparral’s Meramec and Osage STACK acreage delivered average initial 30-day production rates above type curve expectations Today we are introducing new type curves to reflect this stronger performance Recent Accomplishments / Highlights Building the premier pure-play upstream oil company in the STACK Reservoir Target Operator Gross Well Count Average WI Percent(1) Lateral Length IP-30 Gross (Boe/d)(2) Percent Liquid IP-30 Type Curve (Boe/d)(2) Meramec & Osage CHPE 22 70% 4,574 718 79% 640 Meramec & Osage Non-op 6 26% 4,571 727 77% 640 Average Meramec & Osage 28 61% 4,573 720 78% 640 (1)Table includes non-operated wells with a greater than 20 percent working interest. (2)IP-30s represent the three-phase consecutive 30-day peak production rate. Note: 668 TC Avg. = average of Meramec (752 Boe/d) with the average of 2 Osage type curves (600 KF +567 GF = 584); a straight average of all 3, equally weighted would be 640 Boe/d Chaparral’s full year 2017 Meramec and Osage Well Performance
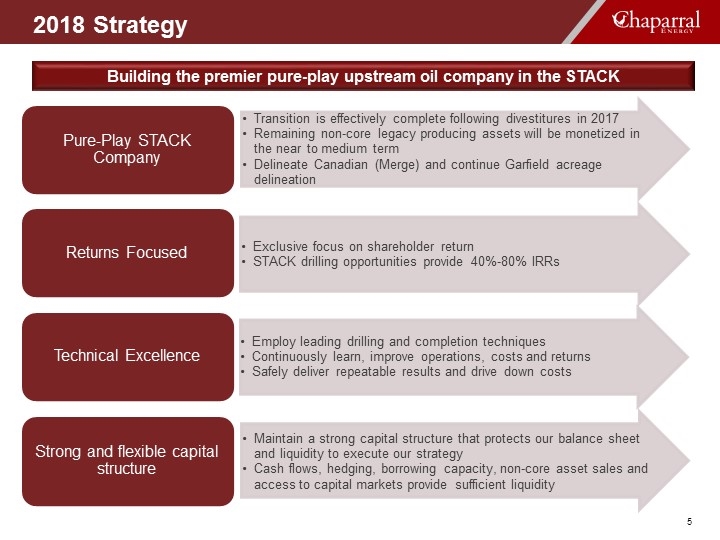
2018 Strategy Building the premier pure-play upstream oil company in the STACK Pure-Play STACK Company Technical Excellence Strong and flexible capital structure Employ leading drilling and completion techniques Maintain a strong capital structure that protects our balance sheet and liquidity to execute our strategy Returns Focused Exclusive focus on shareholder return Transition is effectively complete following divestitures in 2017 Safely deliver repeatable results and drive down costs Remaining non-core legacy producing assets will be monetized in the near to medium term Cash flows, hedging, borrowing capacity, non-core asset sales and access to capital markets provide sufficient liquidity Continuously learn, improve operations, costs and returns STACK drilling opportunities provide 40%-80% IRRs Delineate Canadian (Merge) and continue Garfield acreage delineation
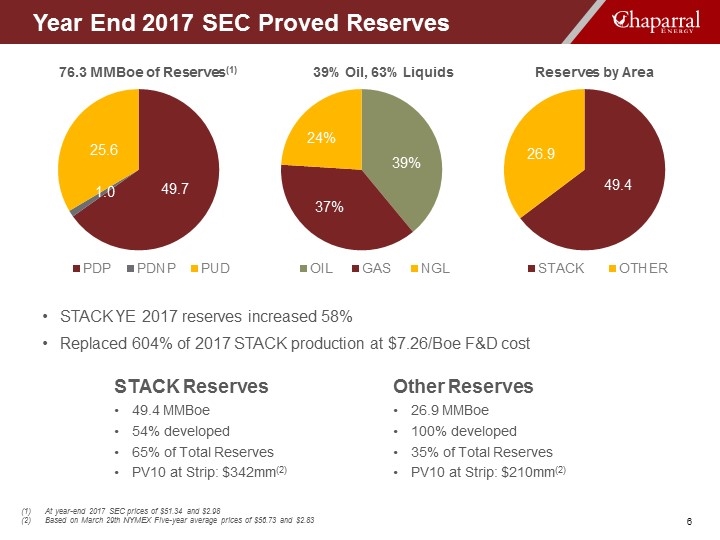
At year-end 2017 SEC prices of $51.34 and $2.98 Based on March 29th NYMEX Five-year average prices of $56.73 and $2.83 Year End 2017 SEC Proved Reserves STACK YE 2017 reserves increased 58% Replaced 604% of 2017 STACK production at $7.26/Boe F&D cost STACK Reserves 49.4 MMBoe 54% developed 65% of Total Reserves PV10 at Strip: $342mm(2) Other Reserves 26.9 MMBoe 100% developed 35% of Total Reserves PV10 at Strip: $210mm(2)
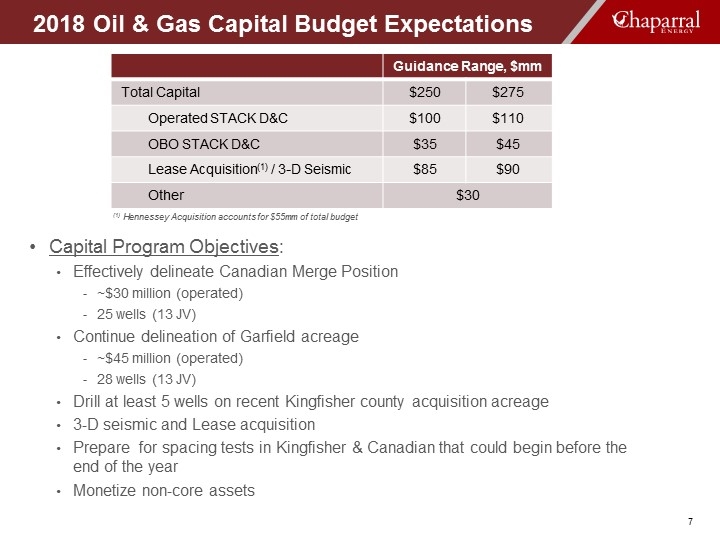
Capital Program Objectives: Effectively delineate Canadian Merge Position ~$30 million (operated) 25 wells (13 JV) Continue delineation of Garfield acreage ~$45 million (operated) 28 wells (13 JV) Drill at least 5 wells on recent Kingfisher county acquisition acreage 3-D seismic and Lease acquisition Prepare for spacing tests in Kingfisher & Canadian that could begin before the end of the year Monetize non-core assets 2018 Oil & Gas Capital Budget Expectations (1) Hennessey Acquisition accounts for $55mm of total budget Guidance Range, $mm Total Capital $250 $275 Operated STACK D&C $100 $110 OBO STACK D&C $35 $45 Lease Acquisition(1) / 3-D Seismic $85 $90 Other $30

Asset Overview
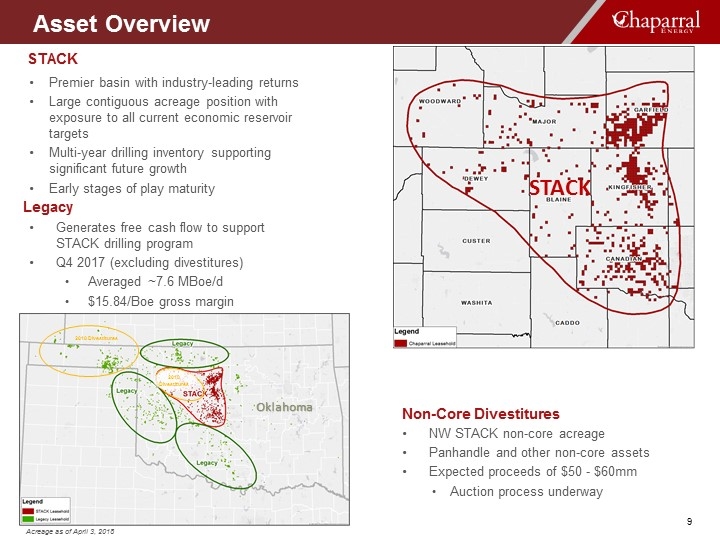
NW STACK non-core acreage Panhandle and other non-core assets Expected proceeds of $50 - $60mm Auction process underway Premier basin with industry-leading returns Large contiguous acreage position with exposure to all current economic reservoir targets Multi-year drilling inventory supporting significant future growth Early stages of play maturity STACK Generates free cash flow to support STACK drilling program Q4 2017 (excluding divestitures) Averaged ~7.6 MBoe/d $15.84/Boe gross margin Legacy Non-Core Divestitures Acreage as of April 3, 2018 Asset Overview Oklahoma STACK 2018 Divestitures 2018 Divestitures
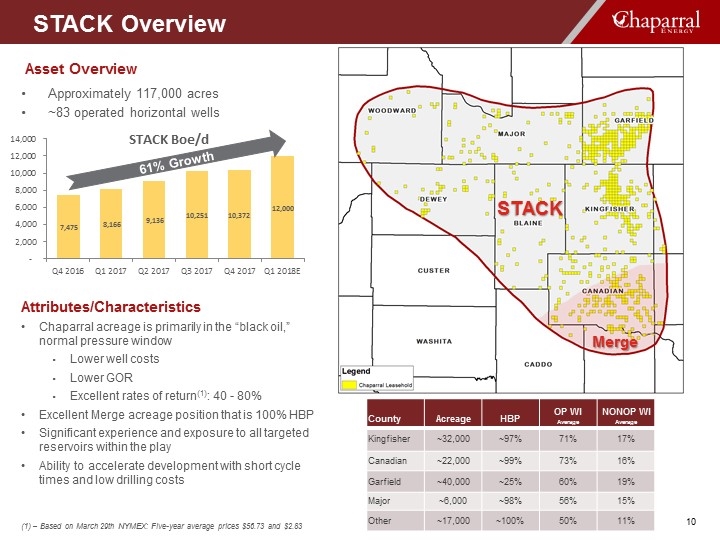
Asset Overview Chaparral acreage is primarily in the “black oil,” normal pressure window Lower well costs Lower GOR Excellent rates of return(1): 40 - 80% Excellent Merge acreage position that is 100% HBP Significant experience and exposure to all targeted reservoirs within the play Ability to accelerate development with short cycle times and low drilling costs Attributes/Characteristics STACK Overview (1) – Based on March 29th NYMEX: Five-year average prices $56.73 and $2.83 Approximately 117,000 acres ~83 operated horizontal wells STACK County Acreage HBP OP WI Average NONOP WI Average Kingfisher ~32,000 ~97% 71% 17% Canadian ~22,000 ~99% 73% 16% Garfield ~40,000 ~25% 60% 19% Major ~6,000 ~98% 56% 15% Other ~17,000 ~100% 50% 11% 61% Growth Merge
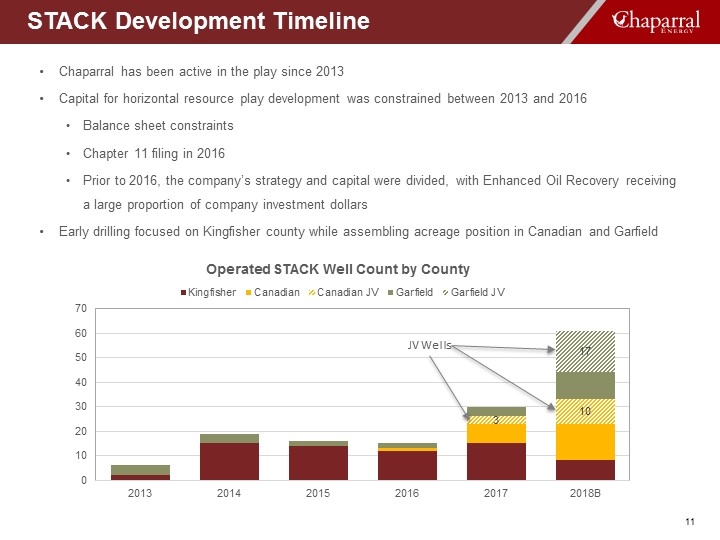
STACK Development Timeline Chaparral has been active in the play since 2013 Capital for horizontal resource play development was constrained between 2013 and 2016 Balance sheet constraints Chapter 11 filing in 2016 Prior to 2016, the company’s strategy and capital were divided, with Enhanced Oil Recovery receiving a large proportion of company investment dollars Early drilling focused on Kingfisher county while assembling acreage position in Canadian and Garfield JV Wells
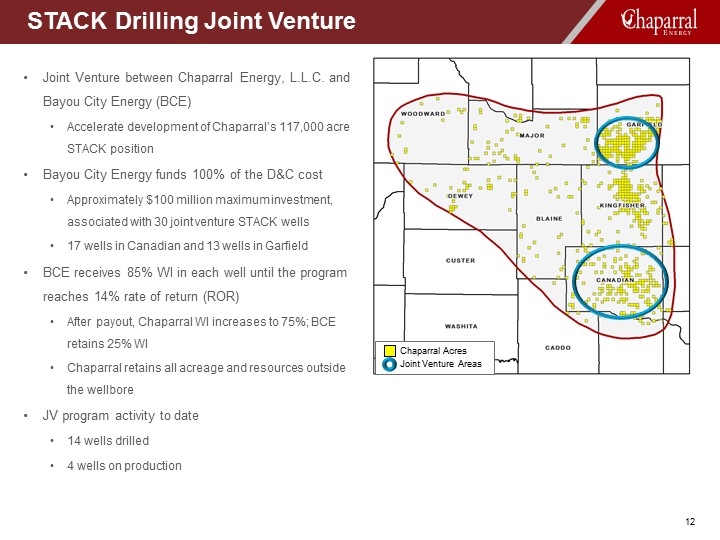
STACK Drilling Joint Venture Joint Venture between Chaparral Energy, L.L.C. and Bayou City Energy (BCE) Accelerate development of Chaparral’s 117,000 acre STACK position Bayou City Energy funds 100% of the D&C cost Approximately $100 million maximum investment, associated with 30 joint venture STACK wells 17 wells in Canadian and 13 wells in Garfield BCE receives 85% WI in each well until the program reaches 14% rate of return (ROR) After payout, Chaparral WI increases to 75%; BCE retains 25% WI Chaparral retains all acreage and resources outside the wellbore JV program activity to date 14 wells drilled 4 wells on production Chaparral Acres Joint Venture Areas
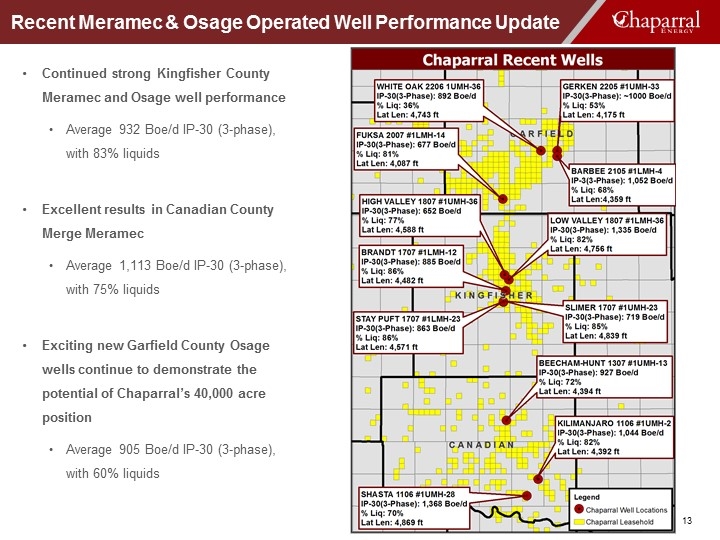
Recent Meramec & Osage Operated Well Performance Update Continued strong Kingfisher County Meramec and Osage well performance Average 932 Boe/d IP-30 (3-phase), with 83% liquids Excellent results in Canadian County Merge Meramec Average 1,113 Boe/d IP-30 (3-phase), with 75% liquids Exciting new Garfield County Osage wells continue to demonstrate the potential of Chaparral’s 40,000 acre position Average 905 Boe/d IP-30 (3-phase), with 60% liquids
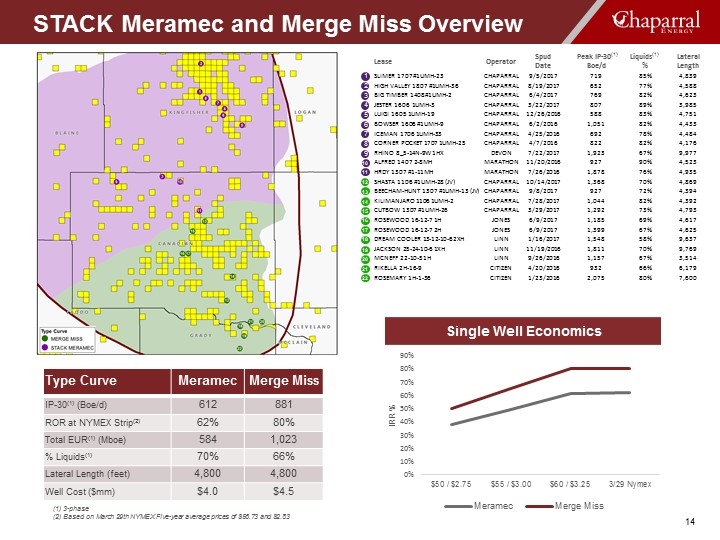
STACK Meramec and Merge Miss Overview Lease Operator Spud Date Peak IP-30(1) Boe/d Liquids(1) % Lateral Length SLIMER 1707 #1UMH-23 CHAPARRAL 9/5/2017 719 85% 4,839 HIGH VALLEY 1807 #1UMH-36 CHAPARRAL 8/19/2017 652 77% 4,588 BIG TIMBER 1408 #1UMH-2 CHAPARRAL 6/4/2017 769 82% 4,623 JESTER 1606 1UMH-3 CHAPARRAL 3/22/2017 807 89% 3,985 LUIGI 1605 1UMH-19 CHAPARRAL 12/26/2016 588 83% 4,751 BOWSER 1606 #1UMH-9 CHAPARRAL 6/2/2016 1,051 82% 4,433 ICEMAN 1706 1UMH-33 CHAPARRAL 4/25/2016 692 78% 4,484 CORNER POCKET 1707 1UMH-25 CHAPARRAL 4/7/2016 822 82% 4,176 RHINO 8_5-14N-9W 1HX DEVON 7/22/2017 1,923 67% 9,977 ALFRED 1407 2-8MH MARATHON 11/20/2016 927 90% 4,523 HRDY 1307 #1-11MH MARATHON 7/26/2016 1,878 76% 4,935 SHASTA 1106 #1UMH-28 (JV) CHAPARRAL 10/14/2017 1,368 70% 4,869 BEECHAM-HUNT 1307 #1UMH-13 (JV) CHAPARRAL 9/8/2017 927 72% 4,394 KILIMANJARO 1106 1UMH-2 CHAPARRAL 7/28/2017 1,044 82% 4,392 CUTBOW 1307 #1UMH-26 CHAPARRAL 3/29/2017 1,292 73% 4,793 ROSEWOOD 16-12-7 1H JONES 6/9/2017 1,185 69% 4,617 ROSEWOOD 16-12-7 2H JONES 6/9/2017 1,399 67% 4,625 DREAM COOLER 13-12-10-6 2XH LINN 1/16/2017 1,548 58% 9,637 JACKSON 25-24-10-6 1XH LINN 11/19/2016 1,811 70% 9,769 MCNEFF 22-10-5 1H LINN 9/26/2016 1,157 67% 3,514 RIKELLA 2H-16-9 CITIZEN 4/20/2016 932 66% 6,179 ROSEMARY 1H-1-36 CITIZEN 1/23/2016 2,075 80% 7,600 17 1 2 3 4 5 6 7 8 9 10 11 12 16 13 14 15 18 19 20 21 22 Type Curve Meramec Merge Miss IP-30(1) (Boe/d) 612 881 ROR at NYMEX Strip(2) 62% 80% Total EUR(1) (Mboe) 584 1,023 % Liquids(1) 70% 66% Lateral Length (feet) 4,800 4,800 Well Cost ($mm) $4.0 $4.5 Single Well Economics (1) 3-phase (2) Based on March 29th NYMEX Five-year average prices of $56.73 and $2.83
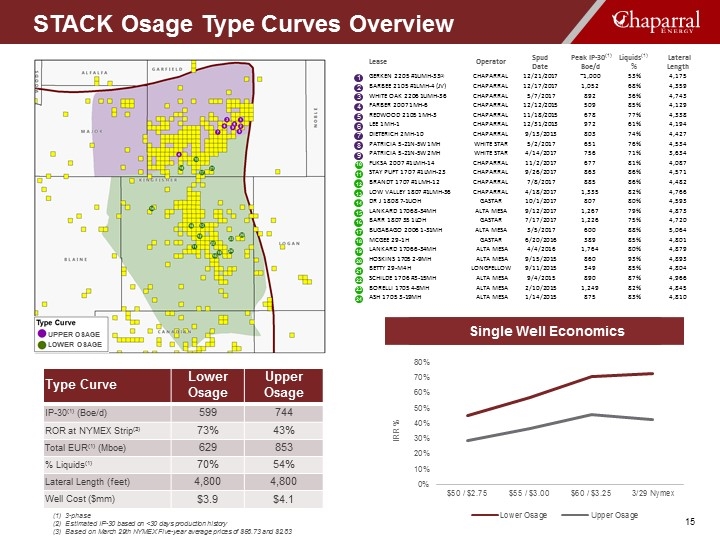
STACK Osage Type Curves Overview Lease Operator Spud Date Peak IP-30(1) Boe/d Liquids(1) % Lateral Length GERKEN 2205 #1UMH-33(2) CHAPARRAL 12/21/2017 ~1,000 53% 4,175 BARBEE 2105 #1LMH-4 (JV) CHAPARRAL 12/17/2017 1,052 68% 4,359 WHITE OAK 2206 1UMH-36 CHAPARRAL 5/7/2017 892 36% 4,743 FARBER 2007 1MH-6 CHAPARRAL 12/12/2015 509 85% 4,129 REDWOOD 2105 1MH-3 CHAPARRAL 11/18/2015 678 77% 4,338 LEE 1MH-1 CHAPARRAL 12/31/2013 972 61% 4,194 DIETERICH 2MH-10 CHAPARRAL 9/13/2013 803 74% 4,427 PATRICIA 5-21N-5W 1MH WHITE STAR 5/2/2017 651 76% 4,534 PATRICIA 5-21N-5W 2MH WHITE STAR 4/14/2017 756 71% 3,634 FUKSA 2007 #1LMH-14 CHAPARRAL 11/2/2017 677 81% 4,087 STAY PUFT 1707 #1LMH-23 CHAPARRAL 9/26/2017 863 86% 4,571 BRANDT 1707 #1LMH-12 CHAPARRAL 7/8/2017 885 86% 4,482 LOW VALLEY 1807 #1LMH-36 CHAPARRAL 4/18/2017 1,335 82% 4,766 DR J 1808 7-1UOH GASTAR 10/1/2017 807 80% 4,593 LANKARD 1706 8-34MH ALTA MESA 9/12/2017 1,267 79% 4,873 BARR 1807 35 1LOH GASTAR 7/17/2017 1,226 75% 4,720 BUGABAGO 2006 1-31MH ALTA MESA 3/5/2017 600 88% 5,064 MCGEE 29-1H GASTAR 6/20/2016 389 85% 4,801 LANKARD 1706 6-34MH ALTA MESA 4/4/2016 1,764 80% 4,879 HOSKINS 1705 2-9MH ALTA MESA 9/15/2015 860 93% 4,893 BETTY 29-M4H LONGFELLOW 9/11/2015 349 85% 4,804 SCHILDE 1706 #3-15MH ALTA MESA 9/4/2015 890 87% 4,966 BORELLI 1705 4-8MH ALTA MESA 2/10/2015 1,249 82% 4,845 ASH 1705 3-19MH ALTA MESA 1/14/2015 875 83% 4,810 17 1 2 3 4 5 6 7 8 9 10 11 12 16 13 14 15 18 19 20 21 22 23 24 Lower Osage Upper Osage Lateral Length (ft) 4,800 4,800 Well Cost ($mm) $3.9 $4.1 Well Cost ($/ft) $813 $854 Total EUR (Mboe) 548 853 % Liquids 72% 54% IP-30 606 744 Single Well Economics 3-phase Estimated IP-30 based on <30 days production history Based on March 29th NYMEX Five-year average prices of $56.73 and $2.83 Type Curve Lower Osage Upper Osage IP-30(1) (Boe/d) 599 744 ROR at NYMEX Strip(3) 73% 43% Total EUR(1) (Mboe) 629 853 % Liquids(1) 70% 54% Lateral Length (feet) 4,800 4,800 Well Cost ($mm) $3.9 $4.1 Single Well Economics UPPER OSAGE LOWER OSAGE
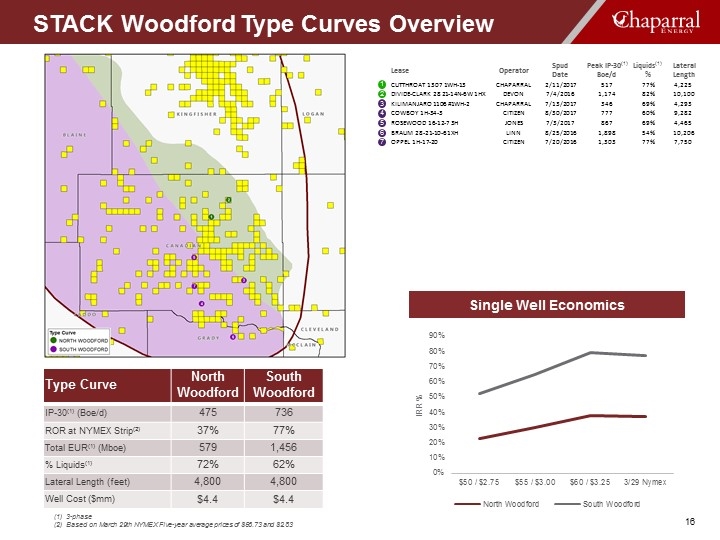
STACK Woodford Type Curves Overview Lease Operator Spud Date Peak IP-30(1) Boe/d Liquids(1) % Lateral Length CUTTHROAT 1307 1WH-13 CHAPARRAL 2/11/2017 517 77% 4,225 DIVIDE-CLARK 28 21-14N-6W 1HX DEVON 7/4/2016 1,174 82% 10,100 KILIMANJARO 1106 #1WH-2 CHAPARRAL 7/13/2017 346 69% 4,293 COWBOY 1H-34-3 CITIZEN 8/30/2017 777 60% 9,282 ROSEWOOD 16-12-7 3H JONES 7/3/2017 867 69% 4,465 BRAUM 28-21-10-6 1XH LINN 8/25/2016 1,898 54% 10,206 OPPEL 1H-17-20 CITIZEN 7/20/2016 1,303 77% 7,750 1 2 3 4 5 6 7 North Woodford South Woodford Lateral Length (ft) 4,800 4,800 Well Cost ($mm) $4.4 $4.4 Well Cost ($/ft) $917 $917 Total EUR (Mboe) 579 1,456 % Liquids 72% 62% IP-30 475 736 3-phase Based on March 29th NYMEX Five-year average prices of $56.73 and $2.83 Type Curve North Woodford South Woodford IP-30(1) (Boe/d) 475 736 ROR at NYMEX Strip(2) 37% 77% Total EUR(1) (Mboe) 579 1,456 % Liquids(1) 72% 62% Lateral Length (feet) 4,800 4,800 Well Cost ($mm) $4.4 $4.4 Single Well Economics
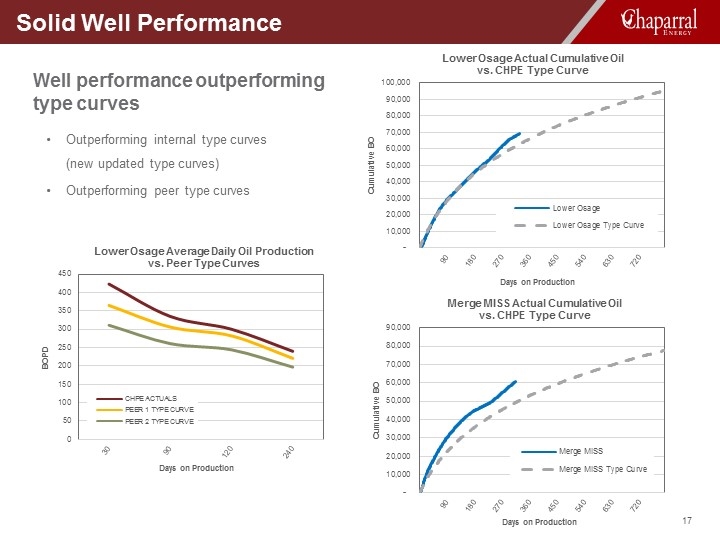
Solid Well Performance Well performance outperforming type curves Outperforming internal type curves (new updated type curves) Outperforming peer type curves
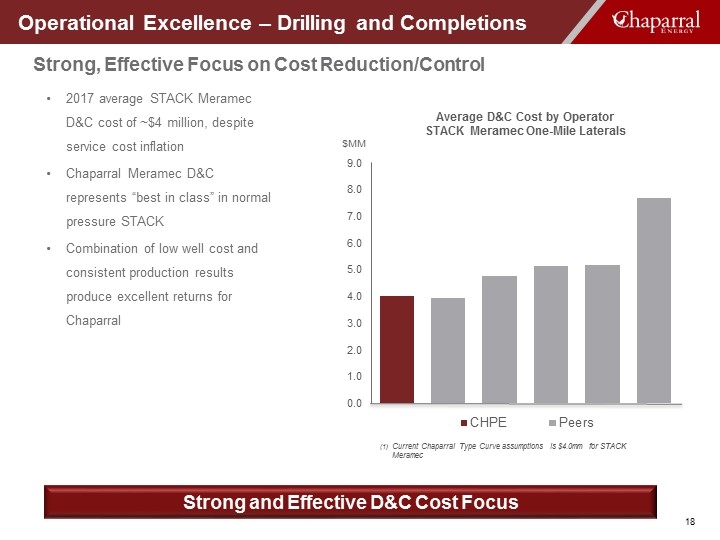
Operational Excellence – Drilling and Completions Strong, Effective Focus on Cost Reduction/Control 2017 average STACK Meramec D&C cost of ~$4 million, despite service cost inflation Chaparral Meramec D&C represents “best in class” in normal pressure STACK Combination of low well cost and consistent production results produce excellent returns for Chaparral Average D&C Cost by Operator STACK Meramec One-Mile Laterals $MM Strong and Effective D&C Cost Focus Current Chaparral Type Curve assumptions is $4.0mm for STACK Meramec
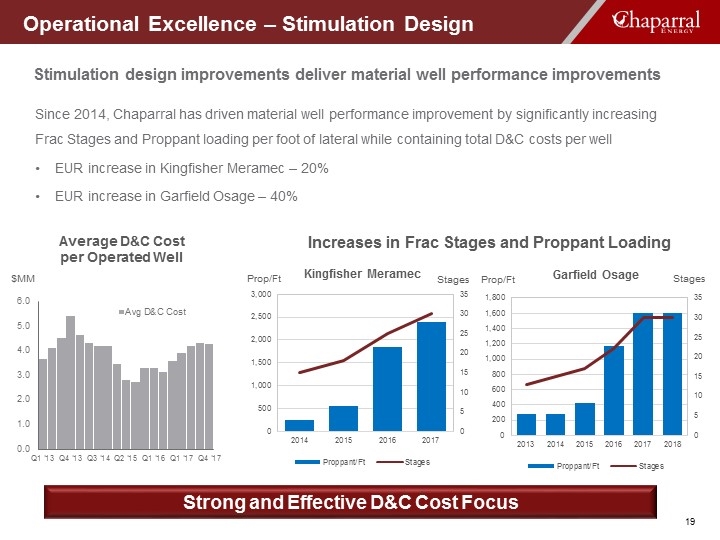
Operational Excellence – Stimulation Design Since 2014, Chaparral has driven material well performance improvement by significantly increasing Frac Stages and Proppant loading per foot of lateral while containing total D&C costs per well EUR increase in Kingfisher Meramec – 20% EUR increase in Garfield Osage – 40% Increases in Frac Stages and Proppant Loading Prop/Ft Strong and Effective D&C Cost Focus Stages Garfield Osage Kingfisher Meramec Prop/Ft Stages Stimulation design improvements deliver material well performance improvements Average D&C Cost per Operated Well $MM
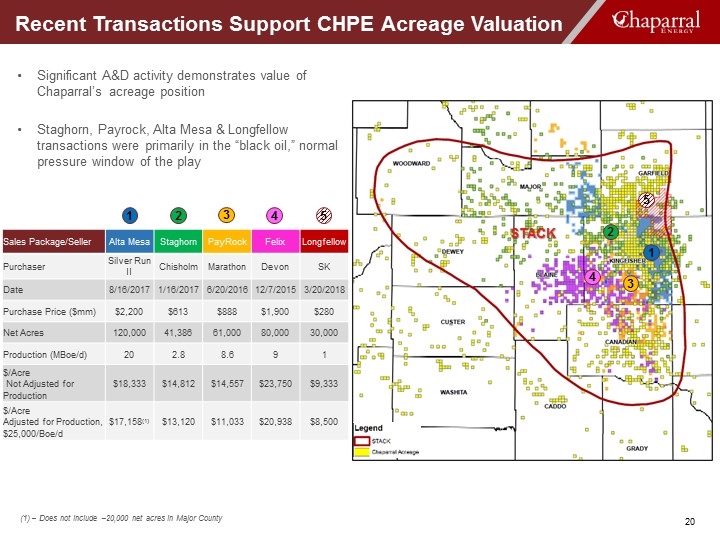
Significant A&D activity demonstrates value of Chaparral’s acreage position Staghorn, Payrock, Alta Mesa & Longfellow transactions were primarily in the “black oil,” normal pressure window of the play 2 3 4 4 3 2 Recent Transactions Support CHPE Acreage Valuation 1 1 (1) – Does not include ~20,000 net acres in Major County Sales Package/Seller Alta Mesa Staghorn PayRock Felix Longfellow Purchaser Silver Run II Chisholm Marathon Devon SK Date 8/16/2017 1/16/2017 6/20/2016 12/7/2015 3/20/2018 Purchase Price ($mm) $2,200 $613 $888 $1,900 $280 Net Acres 120,000 41,386 61,000 80,000 30,000 Production (MBoe/d) 20 2.8 8.6 9 1 $/Acre Not Adjusted for Production $18,333 $14,812 $14,557 $23,750 $9,333 $/Acre Adjusted for Production, $25,000/Boe/d $17,158(1) $13,120 $11,033 $20,938 $8,500 STACK 5 5
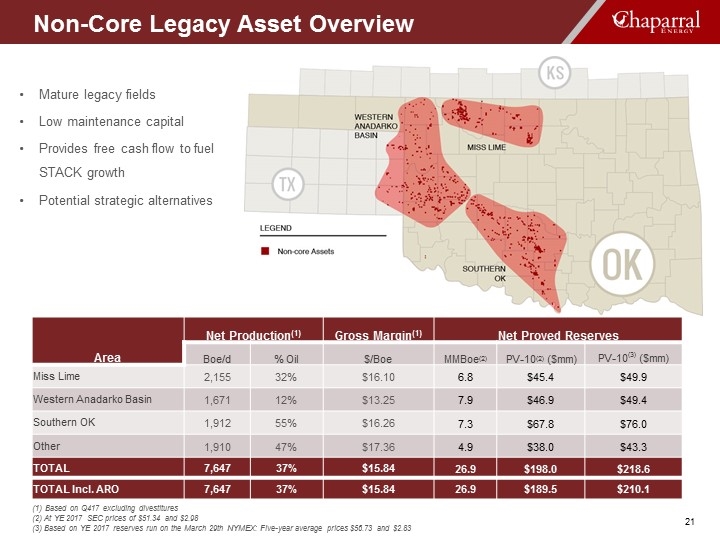
Mature legacy fields Low maintenance capital Provides free cash flow to fuel STACK growth Potential strategic alternatives Area Net Production(1) Gross Margin(1) Net Proved Reserves Boe/d % Oil $/Boe MMBoe(2) PV-10(2) ($mm) PV-10(3) ($mm) Miss Lime 2,155 32% $16.10 6.8 $45.4 $49.9 Western Anadarko Basin 1,671 12% $13.25 7.9 $46.9 $49.4 Southern OK 1,912 55% $16.26 7.3 $67.8 $76.0 Other 1,910 47% $17.36 4.9 $38.0 $43.3 TOTAL 7,647 37% $15.84 26.9 $198.0 $218.6 TOTAL Incl. ARO 7,647 37% $15.84 26.9 $189.5 $210.1 (1) Based on Q417 excluding divestitures (2) At YE 2017 SEC prices of $51.34 and $2.98 (3) Based on YE 2017 reserves run on the March 29th NYMEX: Five-year average prices $56.73 and $2.83 Non-Core Legacy Asset Overview

Financial Overview
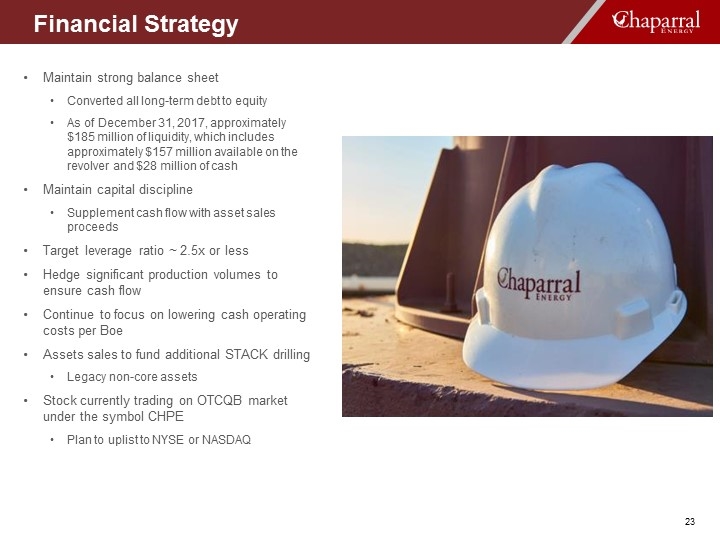
Maintain strong balance sheet Converted all long-term debt to equity As of December 31, 2017, approximately $185 million of liquidity, which includes approximately $157 million available on the revolver and $28 million of cash Maintain capital discipline Supplement cash flow with asset sales proceeds Target leverage ratio ~ 2.5x or less Hedge significant production volumes to ensure cash flow Continue to focus on lowering cash operating costs per Boe Assets sales to fund additional STACK drilling Legacy non-core assets Stock currently trading on OTCQB market under the symbol CHPE Plan to uplist to NYSE or NASDAQ Financial Strategy
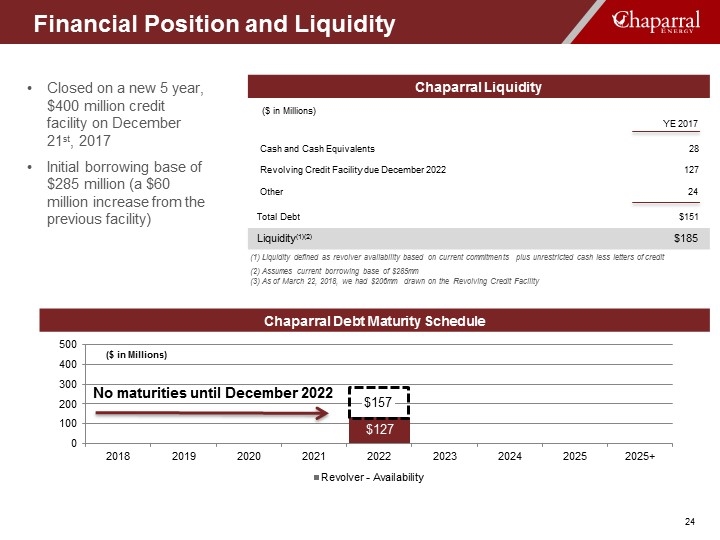
Financial Position and Liquidity Closed on a new 5 year, $400 million credit facility on December 21st, 2017 Initial borrowing base of $285 million (a $60 million increase from the previous facility) Chaparral Liquidity ($ in Millions) YE 2017 Cash and Cash Equivalents 28 Revolving Credit Facility due December 2022 127 Other 24 Total Debt $151 Liquidity(1)(2) $185 (1) Liquidity defined as revolver availability based on current commitments plus unrestricted cash less letters of credit (2) Assumes current borrowing base of $285mm (3) As of March 22, 2018, we had $206mm drawn on the Revolving Credit Facility Chaparral Debt Maturity Schedule
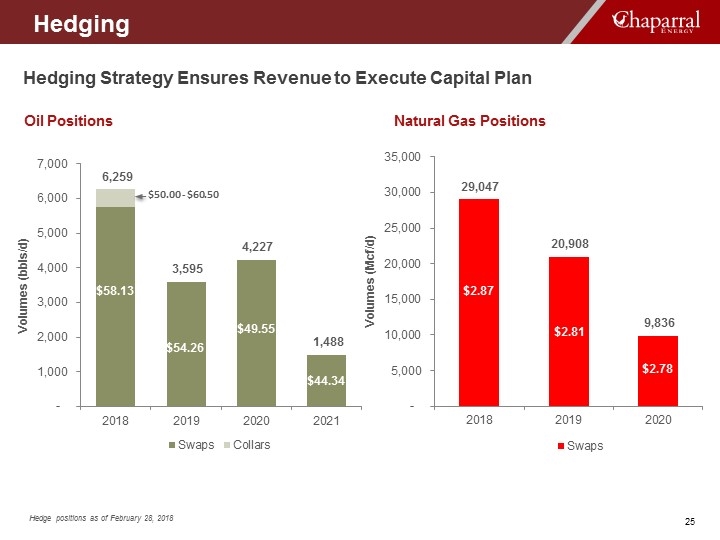
Hedging Strategy Ensures Revenue to Execute Capital Plan Oil Positions Natural Gas Positions Hedging $50.00 - $60.50 $58.13 $54.26 $49.55 $44.34 $2.87 $2.81 $2.78 Hedge positions as of February 28, 2018
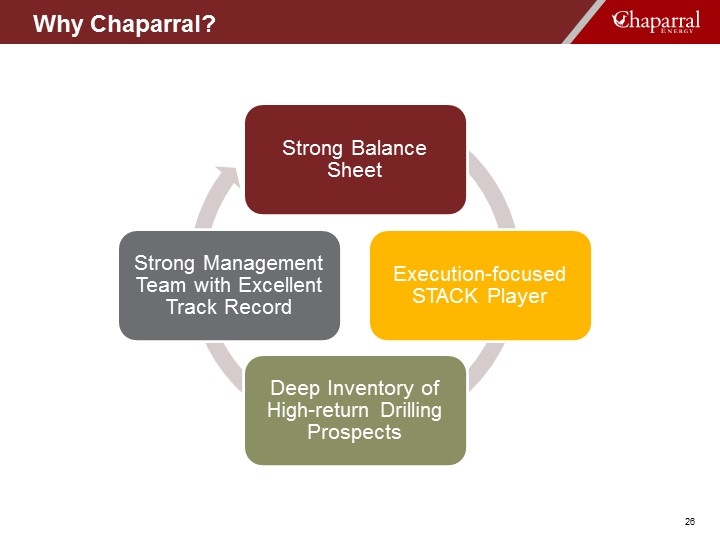
Why Chaparral? Why Chaparral? Strong Balance Sheet Execution-focused STACK Player Deep Inventory of High-return Drilling Prospects Strong Management Team with Excellent Track Record

ENERGIZING America’s Heartland

Appendix

Investors Joe Evans Chief Financial Officer joe.evans@chaparralenergy.com 405-426-4590 Jeff Smail VP, Corp. Finance & Investor Relations jeff.smail@chaparralenergy.com 405-426-4359 Media Brandi Wessel Manager – Communications brandi.wessel@chaparralenergy.com 405-426-6657 Contact Information Contact Information Chaparral Energy, Inc. 701 Cedar Lake Boulevard Oklahoma City, OK 73114
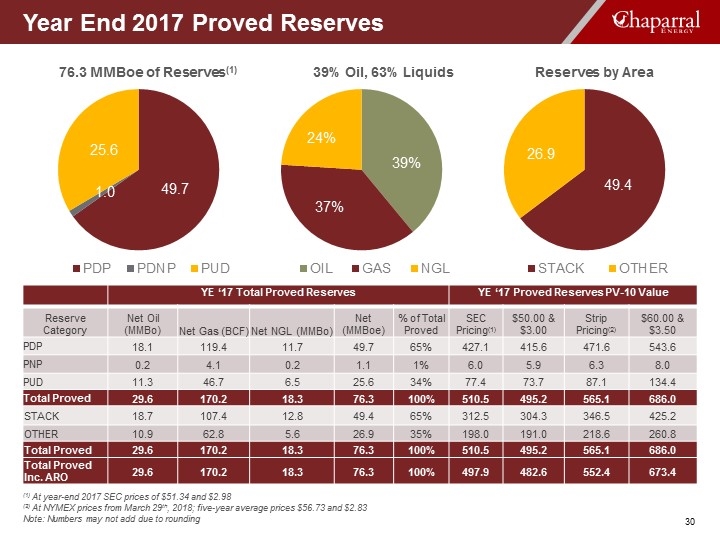
YE ‘17 Total Proved Reserves YE ‘17 Proved Reserves PV-10 Value Reserve Category Net Oil (MMBo) Net Gas (BCF) Net NGL (MMBo) Net (MMBoe) % of Total Proved SEC Pricing(1) $50.00 & $3.00 Strip Pricing(2) $60.00 & $3.50 PDP 18.1 119.4 11.7 49.7 65% 427.1 415.6 471.6 543.6 PNP 0.2 4.1 0.2 1.1 1% 6.0 5.9 6.3 8.0 PUD 11.3 46.7 6.5 25.6 34% 77.4 73.7 87.1 134.4 Total Proved 29.6 170.2 18.3 76.3 100% 510.5 495.2 565.1 686.0 STACK 18.7 107.4 12.8 49.4 65% 312.5 304.3 346.5 425.2 OTHER 10.9 62.8 5.6 26.9 35% 198.0 191.0 218.6 260.8 Total Proved 29.6 170.2 18.3 76.3 100% 510.5 495.2 565.1 686.0 Total Proved Inc. ARO 29.6 170.2 18.3 76.3 100% 497.9 482.6 552.4 673.4 (1) At year-end 2017 SEC prices of $51.34 and $2.98 (2) At NYMEX prices from March 29th, 2018; five-year average prices $56.73 and $2.83 Note: Numbers may not add due to rounding Year End 2017 Proved Reserves YE 2017 proved reserves increased by 36% over YE 2016 reserves, on a pro forma basis excluding 2017 divestitures, including the fourth quarter sale of EOR assets Proved reserves for Chaparral’s STACK assets increased by 58 percent on a year-over-year basis, from 31.2 MMBoe to 49.4 MMBoe In the STACK, Chaparral replaced 604 percent of estimated 2017 STACK production
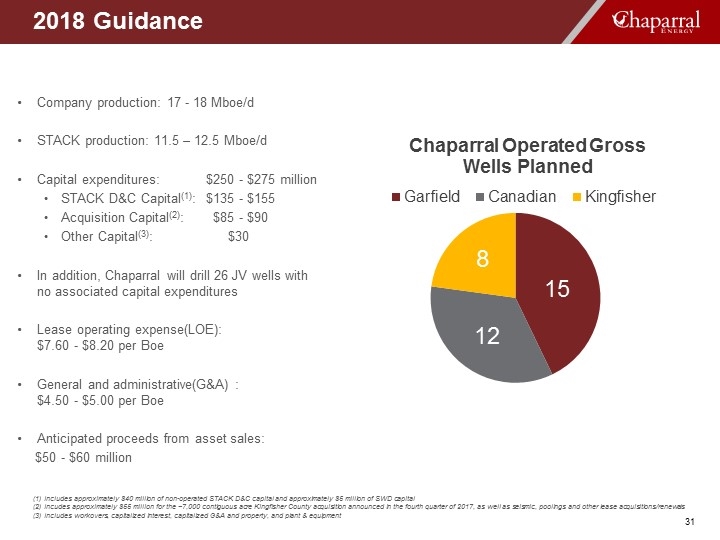
Company production: 17 - 18 Mboe/d STACK production: 11.5 – 12.5 Mboe/d Capital expenditures: $250 - $275 million STACK D&C Capital(1): $135 - $155 Acquisition Capital(2): $85 - $90 Other Capital(3): $30 In addition, Chaparral will drill 26 JV wells with no associated capital expenditures Lease operating expense(LOE): $7.60 - $8.20 per Boe General and administrative(G&A) : $4.50 - $5.00 per Boe Anticipated proceeds from asset sales: $50 - $60 million 2017 Guidance (1) Includes approximately $40 million of non-operated STACK D&C capital and approximately $5 million of SWD capital (2) Incudes approximately $55 million for the ~7,000 contiguous acre Kingfisher County acquisition announced in the fourth quarter of 2017, as well as seismic, poolings and other lease acquisitions/renewals (3) Includes workovers, capitalized interest, capitalized G&A and property, and plant & equipment 2018 Guidance
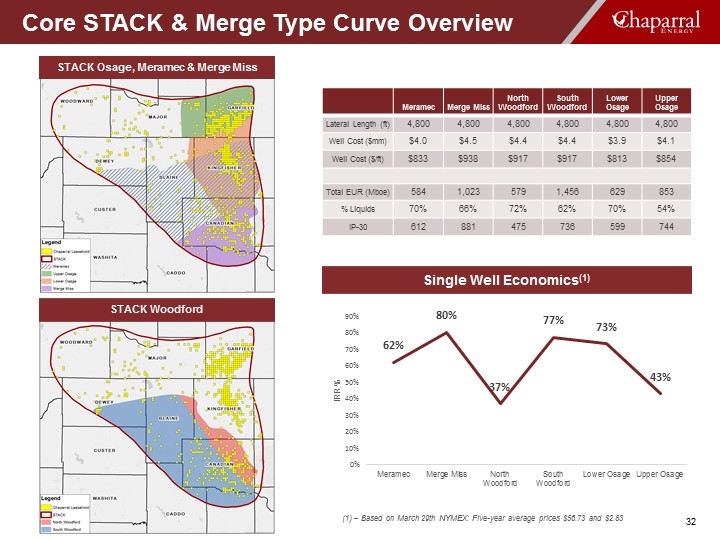
Core STACK & Merge Type Curve Overview (1) – Based on March 29th NYMEX: Five-year average prices $56.73 and $2.83 Meramec Merge Miss North Woodford South Woodford Lower Osage Upper Osage Lateral Length (ft) 4,800 4,800 4,800 4,800 4,800 4,800 Well Cost ($mm) $4.0 $4.5 $4.4 $4.4 $3.9 $4.1 Well Cost ($/ft) $833 $938 $917 $917 $813 $854 Total EUR (Mboe) 584 1,023 579 1,456 629 853 % Liquids 70% 66% 72% 62% 70% 54% IP-30 612 881 475 736 599 744 Single Well Economics(1) STACK Osage, Meramec & Merge Miss STACK Woodford
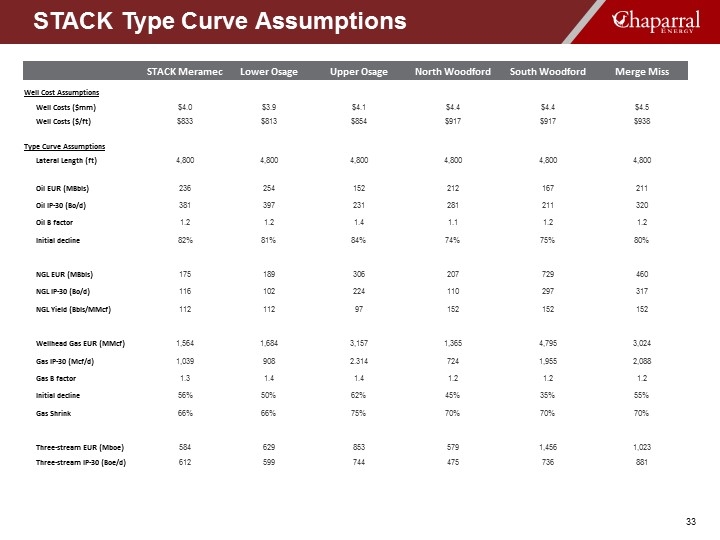
STACK Meramec Lower Osage Upper Osage North Woodford South Woodford Merge Miss Well Cost Assumptions Well Costs ($mm) $4.0 $3.9 $4.1 $4.4 $4.4 $4.5 Well Costs ($/ft) $833 $813 $854 $917 $917 $938 Type Curve Assumptions Lateral Length (ft) 4,800 4,800 4,800 4,800 4,800 4,800 Oil EUR (MBbls) 236 254 152 212 167 211 Oil IP-30 (Bo/d) 381 397 231 281 211 320 Oil B factor 1.2 1.2 1.4 1.1 1.2 1.2 Initial decline 82% 81% 84% 74% 75% 80% NGL EUR (MBbls) 175 189 306 207 729 460 NGL IP-30 (Bo/d) 116 102 224 110 297 317 NGL Yield (Bbls/MMcf) 112 112 97 152 152 152 Wellhead Gas EUR (MMcf) 1,564 1,684 3,157 1,365 4,795 3,024 Gas IP-30 (Mcf/d) 1,039 908 2.314 724 1,955 2,088 Gas B factor 1.3 1.4 1.4 1.2 1.2 1.2 Initial decline 56% 50% 62% 45% 35% 55% Gas Shrink 66% 66% 75% 70% 70% 70% Three-stream EUR (Mboe) 584 629 853 579 1,456 1,023 Three-stream IP-30 (Boe/d) 612 599 744 475 736 881 STACK Type Curve Assumptions
Reserve Estimates The SEC permits oil and natural gas companies, in their filings with the SEC, to disclose only proved, probable and possible reserves that meet the SEC’s definitions for such terms. The company may use terms in this presentation that the SEC’s guidelines strictly prohibit in SEC filings, such as estimated ultimate recovery or EUR, resources, net resources, total resource potential and similar terms to estimate oil and natural gas that may ultimately be recovered. These estimates are by their nature more speculative than estimates of proved, probable and possible reserves as used in SEC filings and, accordingly, are subject to substantially greater uncertainty of being actually realized. These estimates have not been fully risked by management. Actual quantities that may be ultimately recovered will likely differ substantially from these estimates. Factors affecting ultimate recovery include the scope of the company’s actual drilling program, which will be directly affected by the availability of capital, drilling and production costs, commodity prices, availability of drilling services and equipment, lease expirations, transportation constraints, regulatory approvals, field spacing rules, actual drilling results and recoveries of oil and natural gas in place and other factors. These estimates may change significantly as the development of properties provides additional data. PV-10 PV-10 value is a non-GAAP measure that differs from the standardized measure of discounted future net cash flows in that PV-10 value is a pre-tax number, while the standardized measure of discounted future net cash flows is an after-tax number. We believe that the presentation of the PV-10 value is relevant and useful to investors because it presents the discounted future net cash flows attributable to our proved reserves prior to taking into account future corporate income taxes, and it is a useful measure of evaluating the relative monetary significance of our oil and natural gas properties. Further, investors may utilize the measure as a basis for comparison of the relative size and value of our reserves to other companies. We use this measure when assessing the potential return on investment related to our oil and natural gas properties. However, PV-10 value is not a substitute for the standardized measure of discounted future net cash flows. Our PV-10 value measure and the standardized measure of discounted future net cash flows do not purport to present the fair value of our oil and natural gas reserves. Reserve and Non-GAAP Information Statement
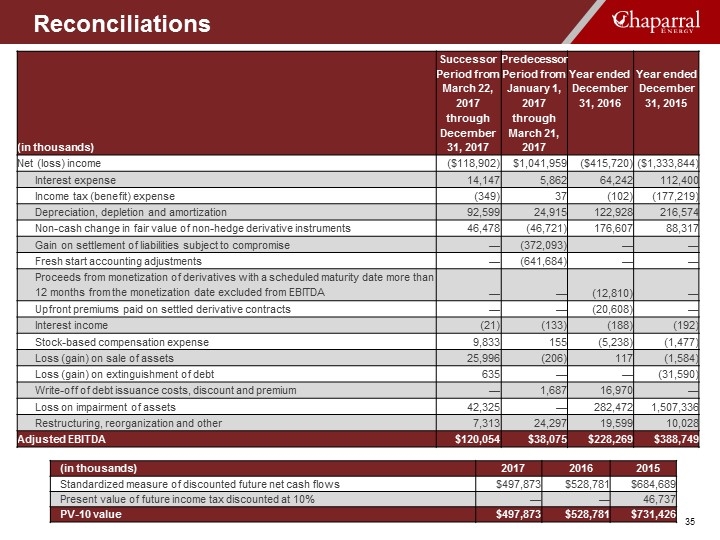
Reconciliations (in thousands) Successor Period from March 22, 2017 through December 31, 2017 Predecessor Period from January 1, 2017 through March 21, 2017 Year ended December 31, 2016 Year ended December 31, 2015 Net (loss) income ($118,902) $1,041,959 ($415,720) ($1,333,844) Interest expense 14,147 5,862 64,242 112,400 Income tax (benefit) expense (349) 37 (102) (177,219) Depreciation, depletion and amortization 92,599 24,915 122,928 216,574 Non-cash change in fair value of non-hedge derivative instruments 46,478 (46,721) 176,607 88,317 Gain on settlement of liabilities subject to compromise — (372,093) — — Fresh start accounting adjustments — (641,684) — — Proceeds from monetization of derivatives with a scheduled maturity date more than 12 months from the monetization date excluded from EBITDA — — (12,810) — Upfront premiums paid on settled derivative contracts — — (20,608) — Interest income (21) (133) (188) (192) Stock-based compensation expense 9,833 155 (5,238) (1,477) Loss (gain) on sale of assets 25,996 (206) 117 (1,584) Loss (gain) on extinguishment of debt 635 — — (31,590) Write-off of debt issuance costs, discount and premium — 1,687 16,970 — Loss on impairment of assets 42,325 — 282,472 1,507,336 Restructuring, reorganization and other 7,313 24,297 19,599 10,028 Adjusted EBITDA $120,054 $38,075 $228,269 $388,749 (in thousands) 2017 2016 2015 Standardized measure of discounted future net cash flows $497,873 $528,781 $684,689 Present value of future income tax discounted at 10% — — 46,737 PV-10 value $497,873 $528,781 $731,426 Reconciliations
