Attached files
| file | filename |
|---|---|
| EX-32.2 - EXHIBIT 32.2 - MongoDB, Inc. | mdb-13118x10kxex322.htm |
| EX-32.1 - EXHIBIT 32.1 - MongoDB, Inc. | mdb-13118x10kxex321.htm |
| EX-31.2 - EXHIBIT 31.2 - MongoDB, Inc. | mdb-13118x10kxex312.htm |
| EX-31.1 - EXHIBIT 31.1 - MongoDB, Inc. | mdb-13118x10kxex311.htm |
| EX-23.1 - EXHIBIT 23.1 - MongoDB, Inc. | mdb-13118x10kxex231.htm |
| EX-21.1 - EXHIBIT 21.1 - MongoDB, Inc. | mdb-13118x10kxex211.htm |
| EX-10.12 - EXHIBIT 10.12 - MongoDB, Inc. | mdb-1318x10kxex1012.htm |
| EX-10.3 - EXHIBIT 10.3 - MongoDB, Inc. | mdb-13118x10kxex103.htm |
UNITED STATES
SECURITIES AND EXCHANGE COMMISSION
WASHINGTON, DC 20549
_____________________
FORM 10-K
_____________________
(Mark One)
☒ ANNUAL REPORT PURSUANT TO SECTION 13 OR 15(d) OF THE SECURITIES EXCHANGE ACT OF 1934
For the fiscal year ended January 31, 2018
OR
☐ TRANSITION REPORT PURSUANT TO SECTION 13 OR 15(d) OF THE SECURITIES EXCHANGE ACT OF 1934
For the transition period from to
Commission File Number: 001-38240
_____________________
MONGODB, INC.
(Exact name of registrant as specified in its charter)
_____________________
Delaware | 26-1463205 | |
(State or other jurisdiction of incorporation or organization) | (I.R.S. Employer Identification No.) | |
229 W. 43rd Street, 5th Floor New York, New York | 10036 | |
(Address of principal executive offices) | (Zip Code) | |
Registrant’s telephone number, including area code: 646-727-4092
_____________________
Securities registered pursuant to Section 12(b) of the Act:
Title of each class | Name of each exchange on which registered | |
Class A Common Stock, $0.001 par value | The Nasdaq Stock Market LLC | |
Securities registered pursuant to Section 12(g) of the Act:
None
(Title of class)
_____________________
Indicate by check mark if the registrant is a well-known seasoned issuer, as defined in Rule 405 of the Securities Act. Yes ☐ No ☑
Indicate by check mark if the registrant is not required to file reports pursuant to Section 13 or Section 15(d) of the Act. Yes ☐ No ☑
Indicate by check mark whether the registrant (1) has filed all reports required to be filed by Section 13 or 15(d) of the Securities Exchange Act of 1934 during the preceding 12 months (or for such shorter period that the registrant was required to file such reports), and (2) has been subject to such filing requirements for the past 90 days. Yes ☑ No ☐
Indicate by check mark whether the registrant has submitted electronically and posted on its corporate Web site, if any, every Interactive Data File required to be submitted and posted pursuant to Rule 405 of Regulation S-T (§ 232.405 of this chapter) during the preceding 12 months (or for such shorter period that the registrant was required to submit and post such files). Yes ☑ No ☐
Indicate by check mark if disclosure of delinquent filers pursuant to Item 405 of Regulation S-K (§ 229.405 of this chapter) is not contained herein, and will not be contained, to the best of registrant’s knowledge, in definitive proxy or information statements incorporated by reference in Part III of this Form 10-K or any amendment to this Form 10-K. ☑
Indicate by check mark whether the registrant is a large accelerated filer, an accelerated filer, a non-accelerated filer, a smaller reporting company or an emerging growth company. See the definitions of “large accelerated filer,” “accelerated filer,” “smaller reporting company” and “emerging growth company” in Rule 12b-2 of the Exchange Act.
Large accelerated filer | ☐ | Accelerated filer | ☐ |
Non-accelerated filer | ☑ (Do not check if a small reporting company) | Small reporting company | ☐ |
Emerging growth company | ☑ | ||
If an emerging growth company, indicate by check mark if the registrant has elected not to use the extended transition period for complying with any new or revised financial accounting standards provided pursuant to Section 13(a) of the Exchange Act. ☐
Indicate by check mark whether the registrant is a shell company (as defined in Rule 12b-2 of the Exchange Act). Yes ☐ No ☑
The aggregate market value of the voting and non-voting common equity held by non-affiliates of the registrant, based on the closing price of the registrant’s shares of Class A common stock as reported by The Nasdaq Global Market on January 31, 2018, was approximately $359.3 million. The registrant has elected to use January 31, 2018 as the calculation date, which was the last trading date of the registrant’s most recently completed fiscal year, because on July 31, 2017 (the last business day of the registrant’s second fiscal quarter), the registrant was a privately-held company.
As of March 26, 2018, there were 13,325,834 shares of the registrant’s Class A common stock and 37,250,011 shares of the registrant’s Class B common stock outstanding.
DOCUMENTS INCORPORATED BY REFERENCE
Portions of the registrant’s definitive proxy statement relating to its 2018 annual meeting of shareholders (the “2018 Proxy Statement”) are incorporated by reference into Part III of this Annual Report on Form 10-K where indicated. The 2018 Proxy Statement will be filed with the U.S. Securities and Exchange Commission within 120 days after the end of the registrant’s fiscal year ended January 31, 2018.
MongoDB, Inc.
Form 10-K
For the Fiscal Year Ended January 31, 2018
TABLE OF CONTENTS
Page | ||
General
Unless the context otherwise indicates, references in this report to the terms “MongoDB,” “the Company,” “we,” “our” and “us” refer to MongoDB, Inc., its divisions and its subsidiaries. All information presented herein is based on our fiscal calendar. Unless otherwise stated, references to particular years, quarters, months or periods refer to the Company’s fiscal years ended in January and the associated quarters, months and periods of those fiscal years.
Trademarks
“MongoDB” and the MongoDB leaf logo, and other trademarks or service marks of MongoDB, Inc. appearing in this Annual Report on Form 10-K (“Form 10-K”) are the property of MongoDB, Inc. This Form 10-K contains additional trade names, trademarks and service marks of others, which are the property of their respective owners. Solely for convenience, trademarks and trade names referred to in this Form 10-K may appear without the ® or ™ symbols.
Special Note Regarding Forward-Looking Statements
This Form 10-K contains forward-looking statements within the meaning of Section 27A of the Securities Act of 1933, as amended (the “Securities Act”), and Section 21E of the Securities Exchange Act of 1934, as amended (the “Exchange Act”), that are based on our management’s beliefs and assumptions and on information currently available to our management. Forward-looking statements are inherently subject to risks and uncertainties, some of which cannot be predicted or quantified. All statements other than present and historical facts and conditions contained in this Form 10-K, including statements regarding our future results of operations and financial position, business strategy, plans and our objectives for future operations, are forward-looking statements. In some cases, you can identify forward-looking statements by terminology such as “anticipate,” “believe,” “can,” “continue,” “could,” “estimate,” “expect,” “intend,” “may,” “might,” “objective,” “ongoing,” “plan,” “potential,” “predict,” “project,” “should,” “will,” or “would,” or the negative of these terms or other comparable terminology. Actual events or results may differ from those expressed in these forward-looking statements, and these differences may be material and adverse. Forward-looking statements include, but are not limited to, statements about:
• | our future operating and financial performance, ability to generate positive cash flow and ability to achieve and sustain profitability; |
• | our ability to successfully anticipate and satisfy customer demands, including through the introduction of new features, products or services and the provision of professional services; |
• | the effects of increased competition in our market; |
• | our ability to expand our sales and marketing organization and to scale our business, including entering into new markets and managing our international expansion; |
• | our ability to continue to build and maintain credibility with the developer community; |
• | our ability to attract and retain customers to use our products; |
• | our ability to maintain, protect, enforce and enhance our intellectual property; |
• | the growth and expansion of the market for database products, and our ability to penetrate such market; |
• | our ability to maintain the security of our software and adequately address privacy concerns; |
• | our ability to accurately forecast our sales cycle and make changes to our pricing model; |
• | our ability to form new and expand existing strategic partnerships; |
• | the attraction and retention of highly skilled and key personnel; |
• | our ability to enhance our brand; |
• | our ability to effectively manage our growth and future expenses and maintain our corporate culture; and |
• | our ability to comply with modified or new laws and regulations applying to our business. |
1
We have based the forward-looking statements contained in this Form 10-K primarily on our current expectations and projections about future events and trends that we believe may affect our business, financial condition, results of operations, prospects, business strategy and financial needs. The outcome of the events described in these forward-looking statements is subject to risks, uncertainties, assumptions and other factors described in the section titled “Risk Factors” and elsewhere in this Form 10-K. These risks are not exhaustive. Other sections of this Form 10-K include additional factors that could adversely affect our business and financial performance. Moreover, we operate in a very competitive and rapidly changing environment. New risks and uncertainties emerge from time to time and it is not possible for us to predict all risks and uncertainties that could have an impact on the forward-looking statements contained in this Form 10-K. We cannot assure you that the results, events and circumstances reflected in the forward-looking statements will be achieved or occur, and actual results, events or circumstances could differ materially from those described in the forward-looking statements. In light of the significant uncertainties in these forward-looking statements, you should not regard these statements as a representation or warranty by us or any other person that we will achieve our objectives and plans in any specified time frame or at all.
In addition, statements that “we believe” and similar statements reflect our beliefs and opinions on the relevant subject. These statements are based upon information available to us as of the date of this Form 10-K, and while we believe such information forms a reasonable basis for such statements, such information may be limited or incomplete, and our statements should not be read to indicate that we have conducted an exhaustive inquiry into, or review of, all potentially available relevant information. These statements are inherently uncertain and investors are cautioned not to unduly rely upon these statements.
The forward-looking statements made in this Form 10-K relate only to events as of the date on which such statements are made. We undertake no obligation to update any forward-looking statements after the date of this Form 10-K or to conform such statements to actual results or revised expectations, except as required by law.
This Form 10-K contains market data and industry forecasts that were obtained from industry publications. These data and forecasts involve a number of assumptions and limitations, and you are cautioned not to give undue weight to such information. We have not independently verified any third-party information. While we believe the market position, market opportunity and market size information included in this Form 10-K is generally reliable, such information is inherently imprecise.
PART I
Item 1. Business
Overview
MongoDB is the leading modern, general purpose database platform. Our robust platform enables developers to build and modernize applications rapidly and cost-effectively across a broad range of use cases. Organizations can deploy our platform at scale in the cloud, on-premise or in a hybrid environment. Through our unique document-based database architecture, we are able to address the needs of organizations for performance, scalability, flexibility and reliability while maintaining the strengths of legacy databases. Our business model combines the developer mindshare and adoption benefits of open source with the economic benefits of a proprietary software subscription business model.
Software applications are redefining how organizations across industries engage with their customers, operate their businesses and compete with each other. To compete effectively in today’s global, data-driven market environment, organizations must provide their end-users with applications that capture and leverage the vast volumes and varieties of available data. As a result, the software developers who build and maintain these applications are increasingly influential in organizations and demand for their talent has grown substantially. Consequently, organizations have significantly increased investment in developers and their productivity has become a strategic imperative for organizations of all sizes, industries and geographies.
A database is at the heart of every software application. Every software application requires a database to store, organize and process data. Large organizations can have tens of thousands of applications and associated databases. A database directly impacts an application's performance, scalability, flexibility and reliability. As a result, selecting a database is a highly strategic decision that directly affects developer productivity, application performance and organizational competitiveness.
2
Legacy relational databases were first developed in the 1970s and their underlying architecture remains largely unchanged even though the nature of applications, how they are deployed and their role in business have evolved dramatically. Modern software development is highly iterative and requires flexibility. Relational databases were not built to support the volume, variety and velocity of data being generated today, hindering application performance and developer productivity. In a relational database environment, developers are often required to spend significant time fixing and maintaining the linkages between modern applications and the rigid database structures that are inherent in relational offerings. Further, relational databases were built before cloud computing was popularized and were not designed for “always-on” globally distributed deployments. These factors have left developers and their organizations in need of more agile and effective database alternatives. A number of non-relational database alternatives, sometimes called NoSQL, have attempted to address the limitations of relational databases, but they have not achieved widespread developer mindshare and marketplace adoption due to technical trade-offs in their product architectures and the resulting compromises developers are required to make in application development. When we refer to a modern database, we are referring to a database that was originally commercialized after the year 2000 and that is designed for globally distributed deployments.
Our unique platform architecture combines the best of both relational and non-relational databases. We believe our core platform differentiation is driven by our ability to address the needs of organizations for performance, scalability, flexibility and reliability while maintaining the strengths of relational databases. Our document-based architecture enables developers to manage data in a more natural way, making it easy and intuitive for developers to rapidly and cost-effectively build, modernize, deploy and maintain applications, thereby increasing developer productivity. Customers can run our platform in any environment, depending on their operational requirements: in the cloud, on-premise or in a hybrid environment.
The database market is one of the largest in the software industry. According to IDC, the worldwide database software market, which it refers to as structured data management software, was $44.9 billion in 2016 and is expected to grow to $63.3 billion in 2020, representing an 8.9% compound annual growth rate. Legacy database vendors have historically dominated this market. We believe this market is one of the few within the enterprise technology stack that has yet to be disrupted by a modern alternative, creating our opportunity.
Our business model combines the developer mindshare and adoption benefits of open source with the economic benefits of a proprietary software subscription business model. To encourage developer usage, familiarity and adoption of our platform, we offer Community Server, a free-to-download version of our database, as an open source offering, analogous to a “freemium” offering. This allows developers to evaluate our platform in a frictionless manner, which we believe has contributed to our platform's popularity among developers and driven enterprise adoption of our subscription offering. The economic attractiveness of our subscription-based model is driven by customer renewals and increasing existing customer subscriptions over time, referred to as land-and-expand. Unlike software companies built around third-party open source projects, we own the intellectual property of our offerings since we are the creators of the software, enabling our proprietary software subscription business model. Owning the intellectual property of our offering also allows us to retain control over our future product roadmap, including the determination of which features are included in our free or paid offerings.
Our Solution
The key differentiators of our platform include:
We Built a Modern Platform for Applications.
Our founders were frustrated by the challenges of working with legacy database offerings. Our platform was built to address these challenges while maintaining the best aspects of relational databases, allowing developers both to build new, modern applications that could not be built on relational databases and to more quickly and easily modernize existing applications. While the percentage varies from quarter to quarter, over the course of the past fiscal year, approximately one quarter to one third of our new business resulted from the migration of applications from legacy databases. Core features and capabilities of our platform include:
• | Performance. We deliver the extreme throughput and predictable low-latency required by the most demanding applications and leverage modern server architectures, delivering millions of operations per second. |
• | Scalability. Our architecture scales horizontally across thousands of servers, supporting petabytes of data and millions of users in a globally distributed environment. It is easy to add capacity to our platform in a modular, predictable and cost-efficient manner. |
3
• | Flexibility. Our document-based architecture easily accommodates the variety of data types required by modern applications. It also makes it easy for developers to prototype, iterate on and add new functionality to their applications. |
• | Reliability. Our platform includes the critical, advanced security features and fault-tolerance that enterprises demand. It was built to operate in a globally distributed environment for “always-on” applications. |
We Built Our Platform for Developers.
MongoDB was built by developers for developers. We architected our platform with robust functionality and made it easy and intuitive for developers to build, modernize, deploy and maintain applications rapidly and cost-effectively, thereby increasing developer productivity. Our document-based architecture enables developers to manage and interact with data in a more natural way than legacy alternatives. As a result, developers can focus on the application and end-user experience, as they do not have to spend significant time fixing and maintaining the linkages between the application and a rigid relational database structure. We also develop and maintain drivers in all leading programming languages, allowing developers to interact with our platform using the programming language of their choice, further increasing developer productivity. In addition, customers of MongoDB Atlas, our cloud hosted database-as-a-service (“DBaaS”) offering, enjoy the benefits of consuming MongoDB as a service in the public cloud, further enabling developers to focus on their application performance and end-user experience, rather than the back-end infrastructure lifecycle management. With MongoDB Atlas, organizations only have to manage how their applications use the database and are freed from the tasks of infrastructure provisioning, operating system configuration, upgrades and more. All of this has led to increased application agility, higher levels of developer productivity and high levels of developer adoption and engagement. According to Stack Overflow, in both 2017 and 2018, more developers wanted to work with MongoDB than any other database.
We Allow Customers to Run Any Application Anywhere.
As a general purpose database, we support applications across a wide range of use cases. Our software is easily configurable, allowing customers to adjust settings and parameters to optimize performance for a specific application and use case. Customers can run our platform in any environment, depending on their operational requirements: in the cloud, on-premise or in a hybrid environment. In addition, customers can deploy our platform in any of the major public cloud alternatives, providing them with increased flexibility and cost-optimization opportunities by preventing public cloud vendor lock-in. Customers have a consistent experience regardless of infrastructure, providing optionality, flexibility and efficiency.
Key Customer Benefits
Our platform delivers the following key business benefits for our customers:
• | Maximize Competitive Advantage through Software and Data. Our platform is built to support modern applications, allowing organizations to harness the full power of software and data to drive competitive advantage. Developers use our platform to build new, operational and customer-facing applications, including applications that cannot be built on legacy databases. As a result, our platform can help drive our customers’ ability to compete, improve end-user satisfaction, increase their revenue and gain market share. |
• | Increase Developer Productivity. By empowering developers to build and modernize applications quickly and cost-efficiently, we enable developers’ agility, accelerating the time-to-revenue for new products. Our platform’s document-based architecture and intuitive drivers make developing and iterating on applications very efficient on our platform, increasing developer productivity. MongoDB Atlas allows developers to focus on how their applications use the database, application performance and end-user experience, rather than the database infrastructure management including provisioning, operating system configuration, upgrades, monitoring and backups. |
• | Deliver High Reliability for Mission-Critical Deployments. Our platform is designed to support mission-critical applications by being fault-tolerant and always-on, reducing downtime for our customers and minimizing the risk of lost revenue. Also, given the competitive criticality of applications today, we designed our platform to enable better end-user experiences. |
4
• | Reduce Total Cost of Ownership. The speed and efficiency of application development using our platform, coupled with decreased developer resources required for application maintenance, can result in a dramatic reduction in the total cost of ownership for enterprises. In addition, our platform runs on commodity hardware, requires less oversight and management from operations personnel and can operate in the cloud or other low-cost environments, leading to reduced application-related overhead costs for our customers. |
Our Growth Strategy
We are pursuing our large market opportunity with growth strategies that include:
• | Acquiring New Customers. We believe there is a substantial opportunity to continue to grow our customer base. We benefit from word-of-mouth awareness and frictionless experimentation by the developer community through our Community Server offering. As a result, our direct sales prospects are often familiar with our platform and may have already built applications using our technology. While we sell to organizations of all sizes across a broad range of industries, our key focus is on enterprises that invest more heavily in software application development and deployment. These organizations have a greater need for databases and, in the largest enterprises, can have tens of thousands of applications and associated databases. We plan to continue to invest in our direct sales force to grow our larger enterprise subscription base, both domestically and internationally. |
• | Driving Usage of MongoDB Atlas. In June 2016, we introduced MongoDB Atlas, our cloud hosted DBaaS offering, which enables customers to consume MongoDB as a service in the public cloud, without having to manage the infrastructure supporting the database. This hosted cloud offering is an important part of our run-anywhere solution and has allowed us to generate revenue from our Community Server offering. To accelerate adoption of this DBaaS offering, in early 2017, we introduced tools to easily migrate existing users of our Community Server offering to become customers of MongoDB Atlas. We have also expanded our introductory offerings for MongoDB Atlas, including a free tier, which provides limited processing power and storage, in order to drive usage and adoption of MongoDB Atlas among developers. MongoDB Atlas serves as both a self-serve solution that can attract new customers, as well as a solution that customers can deploy and quickly scale over time for incremental workloads. |
• | Expanding Sales Within Our Customer Base. We seek to grow our sales with our customers in several ways. As an application grows and requires additional capacity, our customers increase their subscriptions to our platform. In addition, our customers may expand their subscriptions to our platform as they migrate additional existing applications or build new applications, either within the same department or in other lines of business or geographies. Also, as customers modernize their IT infrastructure and move to the cloud, they may migrate applications from legacy databases. Even within our largest customers, we believe we currently represent a small percentage of their overall spend on databases, reflecting our small market penetration. Our goal is to increase the number of customers that standardize on our database platform within their organization, which can include offering centralized internal support for developers within the organization or the deployment of an internal MongoDB-as-a-service offering. Our net ARR expansion rate, which has been over 120% for each of the last 12 fiscal quarters, demonstrates our ability to expand within existing customers. See Item 7, Management’s Discussion and Analysis of Financial Condition and Results of Operations, included in Part II of this Form 10-K for a description of ARR and a discussion of our net ARR expansion rate. |
• | Extending Product Leadership and Introducing New Products. We intend to continue to invest in our product offerings with the goal of becoming the most widely deployed database in the world. We direct our product innovation toward initiatives intended to drive customer adoption and expansion and increase developer productivity. For example, in November 2017, we introduced cross-region replication for MongoDB Atlas, which helps ensure that an application remains operational even if an entire cloud region goes down, as well as allowing MongoDB customers to locate data closer to their users for performance or compliance reasons. In addition, in February 2018, we announced that MongoDB 4.0, scheduled for release in the summer of 2018, will extend ACID support to multi-document transactions. |
• | Fostering the MongoDB Developer Community. We have attracted a large and growing community of highly engaged developers, who have downloaded our Community Server offering over 35 million times from our website since February 2009 and over 12 million times in the last 12 months alone. We believe that the engagement of developers increases our brand awareness. Many of these developers become proponents of MongoDB within their organizations, which may result in new enterprise customers selecting our platform as well as expansion opportunities within existing customers. Historically, we have invested in our community through active sponsorship |
5
of user groups, our annual user conference, MongoDB World, MongoDB University and other community-centered events. As of January 31, 2018, there were 117 meetup groups dedicated to MongoDB with over 55,000 members worldwide, and over 850,000 registrations for MongoDB University courses, which help members of our community increase their familiarity and productivity with our platform. We intend to continue to invest in the MongoDB developer community.
• | Growing and Cultivating Our Partner Ecosystem. We have built a partner ecosystem of independent software vendors, systems integrators, value added resellers and technology partners. For example, in fiscal year 2018, we partnered with Accenture to make MongoDB available as part of the Accenture Insights Platform, their analytics-as-a-service solution, helping customers address analytics at any scale and for a wider range of use cases. We also launched a mainframe offloading solution with Infosys to help customers accelerate their digital transformation and application modernization efforts. In addition, Tata Consultancy Services developed a modernization practice built around MongoDB and elevated MongoDB to a Top Tier Partner. Our partners include Accenture, Adobe, Amazon Web Services (“AWS”), Cisco, Google, Infosys, Microsoft, Pivotal, Red Hat, Splunk, Tableau, Tata Consultancy Services and more than 1,000 other organizations. Our partner ecosystem provides us with significant benefits, including lead generation, new customer acquisition, accelerated deployment and additional customer support. Our system integrator partners have also been valuable in working with organizations to migrate applications to our platform. We intend to continue to expand and enhance our partner relationships to grow our market presence and drive greater sales efficiency. |
• | Expanding Internationally. We believe there is significant opportunity to continue to expand the use of our platform outside the United States. During the fiscal years ended January 31, 2018, 2017 and 2016, total revenue generated outside of the United States was 36%, 35% and 31% of our total revenue. We intend to continue to expand our sales and drive adoption of our platform globally. |
Our Culture
We believe our culture is critical to our success and has delivered tangible financial and operational benefits for our customers, our employees and our stockholders. Our values guide our business, our product development, our practices and our brand. They are what we look for in every employee. As our company continues to evolve and grow, these six values remain constant:
• | Think Big, Go Far. We are big dreamers with a passion for creativity. We eagerly pursue new opportunities and markets through innovation and disruption. We have a pioneering spirit—always ready to forge new paths and take smart risks. |
• | Make It Matter. We are relentless in our pursuit of meaningful impact. We think strategically and are clear on what we are and are not trying to do. We accomplish an amazing amount of important work, and we are obsessed with follow through. |
• | Embrace the Power of Differences. We commit to creating a culture of inclusion by seeking and valuing employees from different backgrounds and circumstances. This is cultivated by learning from and respecting each other’s differences. We firmly believe that everyone deserves to feel valued and safe in the workplace, and we acknowledge that underrepresented groups may not always feel this way. We recognize that a diverse workforce is the best way to broaden our perspectives, foster innovation and enable a sustainable competitive advantage. |
• | Build Together. We achieve amazing things by connecting and leveraging the diversity of skills, experiences and backgrounds of our entire organization. We discuss things thoroughly, but prioritize commitment over consensus. We are good listeners and always communicate with clarity and respect. We create and support a positive, inclusive and accepting environment. |
• | Be Intellectually Honest. We embrace reality. We apply high-quality thinking and rigor. We have courage in our convictions but work hard to ensure biases or personal beliefs do not get in the way of finding the best solutions. |
• | Own What You Do. We take ownership and are accountable for everything that we do. We empower and we are empowered to make things happen, and balance independence with interdependence. We demand excellence from ourselves. We each play our own part in making MongoDB a great place to work. |
6
Our Employees
As of January 31, 2018, we had a total of 962 employees, including 332 employees located outside the United States. None of our employees are represented by a labor union or covered by a collective bargaining agreement. We have not experienced any work stoppages, and we consider our relations with our employees to be good.
Our Products
We built MongoDB to be a modern, general purpose database platform. We believe that organizations should be able to run our platform anywhere: from a developer’s laptop, to an enterprise data center, in the public cloud or in a hybrid environment. Our core offerings are MongoDB Enterprise Advanced, MongoDB Atlas and Community Server. MongoDB Enterprise Advanced is our comprehensive offering for enterprise customers that can be run in the cloud, on-premise or in a hybrid environment, and includes our proprietary database server, enterprise management capabilities, our graphical user interface, analytics integrations, technical support and a commercial license to our platform. To encourage developer usage, familiarity and adoption of our platform, we offer Community Server as an open source offering, analogous to a “freemium” offering. Community Server is a free-to-download version of our database that does not include all of the features of our commercial platform. MongoDB Atlas is our cloud-hosted DBaaS offering that includes comprehensive infrastructure and management of Community Server. To support our database platform and increase customer retention, we provide professional services to our customers with the goal of making customers’ applications on our platform successful.
MongoDB Enterprise Advanced
Our primary subscription package, MongoDB Enterprise Advanced, includes a commercial license to our platform and the following:
• | MongoDB Enterprise Database Server. The MongoDB enterprise database server, called Enterprise Server, is our proprietary database. It stores, organizes and processes data and facilitates access and changes to the data. Enterprise Server includes advanced security features, auditing functionality and enterprise-standard authentication and authorization. Enterprise Server also includes encrypted and in-memory storage engines to enable a wide range of workloads. |
• | Enterprise Management Capabilities. MongoDB Enterprise Advanced provides Cloud Manager Premium and Ops Manager, our sophisticated suite of management tools that allows operations teams to run, manage and configure MongoDB according to their needs. This includes the ability to monitor and alert on over 100 system metrics, to back up data and restore it to any point in time for disaster recovery, and to automate common operational tasks such as upgrades, scaling and configuration changes. MongoDB Enterprise Advance customers can choose either our Cloud Manager Premium product (for customers who want to manage our platform via the cloud) or Ops Manager (generally for those with on-premise deployments). |
• | Graphical User Interface. We have developed a graphical user interface product, called MongoDB Compass, to help developers and database administrators work with the database visually and to provide a familiar experience for those accustomed to working with relational databases. Users of MongoDB Compass can interact with data more easily, and it allows them to visualize the schema of data and to construct ad hoc queries, which can be useful for performance tuning and debugging. For example, MongoDB Compass users can view and optimize query performance, helping them make better decisions about indexing and document validation. |
• | Analytics Integrations. We provide integrations to allow data and business analysts to analyze data in applications running on our platform using their existing business intelligence and analytics tools. For integration with business intelligence products like Tableau, analysts can use our MongoDB Connector for BI product. We also provide open source connectors for Spark and Hadoop, which are often used for data warehouse analysis. Our analytics integrations ensure that enterprises can efficiently extract significant value from applications built on our platform. |
• | Technical Support. As part of our MongoDB Enterprise Advanced subscription, we also provide technical support to customers during the subscription period. Our technical support is designed to maximize customer success. We provide customers with around-the-clock (24x365) technical support with an enterprise-grade service level agreement. Customers use our technical support to ask database performance questions or troubleshoot issues. |
MongoDB Enterprise Advanced represented 62%, 64% and 62% of our total revenue for the fiscal years ended January 31, 2018, 2017 and 2016, respectively.
7
MongoDB Atlas
In June 2016, we introduced MongoDB Atlas, our hosted DBaaS offering which we run and manage in the public cloud. MongoDB Atlas is based on Community Server and provides customers with an elastic, managed offering that includes automated provisioning and healing, comprehensive system monitoring, managed backup and restore, default security and other features that reduce operational complexity and increase application resiliency. MongoDB Atlas allows customers to remove themselves from the complexity of managing the database and related underlying infrastructure, so they can instead focus on the application and end-user experience. MongoDB Atlas is available on AWS, Google Cloud Platform (“GCP”), and Microsoft Azure, providing customers broad geographic coverage across more than 50 regions globally, enabling them to leverage the benefits of different cloud platforms for different use cases and helping them avoid infrastructure vendor lock-in. To drive usage and experimentation by developers, we have expanded our introductory offerings for MongoDB Atlas to include a free tier, which provides limited processing power and storage.
MongoDB Atlas represented 7% and 1% of our total revenue for the fiscal years ended January 31, 2018 and 2017, respectively.
Community Server
Community Server is a free-to-download version of our database that includes the core functionality that developers need to get started with MongoDB but not all of the features of our commercial platform. Community Server is available under a license that protects our intellectual property and supports our subscription business model. We plan to continue to convert Community Server users to paying customers of our more robust, commercial offerings. Our Community Server had been downloaded over 35 million times from our website alone since February 2009.
We generate revenue from our Community Server through MongoDB Atlas and our MongoDB Professional package. Our MongoDB Professional package includes access to our graphical user interface product, Compass, our Cloud Manager Premium management suite and technical support, but it does not include a commercial license to our platform.
We offer commercial technical support for customers of our paid, commercial offerings. We offer commercial support in our two subscription packages, MongoDB Enterprise Advanced and MongoDB Professional. In addition, for customers that request greater technical support, we contract with them to provide additional support personnel. Although we offer documentation to drive adoption of best practices, we offer limited support for users of Community Server.
Professional Services
We provide professional services to our customers, including consulting and training, with the goal of making customer deployments of our platform successful, thereby increasing customer retention and driving customer revenue expansion. Given that we have designed our platform to be easy to deploy, our services typically do not involve implementation and are designed to facilitate a more rapid and successful deployment of MongoDB by our customers. Professional services is an important part of our customer retention and expansion strategy. Customers who purchase professional services have typically increased their subscription with us to higher levels and done so more quickly than customers who have not engaged our professional services.
Professional services represented 8%, 10% and 10% of our total revenue for the fiscal years ended January 31, 2018, 2017 and 2016, respectively.
Our Customers
As of January 31, 2018, we had over 5,700 customers spanning a wide range of industries in more than 90 countries around the world. All affiliated entities are counted as a single customer. No single customer represented more than 10% of our revenue in fiscal year 2018.
Sales and Marketing
Our sales and marketing teams work together closely to drive awareness and adoption of our platform, accelerate customer acquisition and generate and increase revenue from customers. While we sell to organizations of all sizes across a broad range of industries, our key focus is on enterprises that invest more heavily in software application development and deployment. These organizations have a greater need for databases and, in the largest enterprises, can have tens of thousands of applications and associated databases. We plan to continue to invest in our direct sales force to grow our larger enterprise subscription base, both domestically and internationally.
8
Our go-to-market model is primarily focused on driving awareness and usage of our platform among software developers with the goal of converting that usage into paid consumption of our platform. We are a pioneer of developer evangelism and education and have cultivated a large, highly engaged global developer community. We foster developer engagement through community events and conferences to demonstrate how developers can create or modernize applications quickly and intuitively using our platform. We intend to continue to cultivate our relationships with developers through continued investment in and growth of our MongoDB Advocacy Hub, User Groups and MongoDB University. We also have a partner ecosystem of global system integrators, value-added resellers and independent software vendors, which we collectively refer to as strategic partners.
We have embraced the trend toward open source software in order to drive developer awareness of, engagement with and adoption of our platform. We created our Community Server offering to let developers use, experiment and evaluate our platform frictionlessly, which we believe has contributed to our platform’s popularity. We believe that developers are often advocates for us because of our developer-focused approach. As a result, our direct sales prospects are often familiar with our platform and may have already built applications using our technology. In order to assess the most likely commercial prospects, we employ a process-oriented and data-driven approach to sales. We also utilize advanced marketing technologies and processes to drive awareness and engagement, educate and convert prospects into customers. As customers expand their usage of our platform, our relationships with them often evolve to include technology and business leaders within their organizations and our goal is to get organizations to standardize on our platform. Once our customers reach a certain spending level with us, we support them with customer success advocates to ensure their satisfaction and expand their usage of our platform.
Our sales and marketing organization includes sales development, inside sales, field sales, sales engineering and marketing personnel. As of January 31, 2018, we had 394 employees in our sales and marketing organization.
Research and Development
Our research and development efforts are focused on enhancing our existing products and developing new products to extend our product leadership, increase our market penetration and deepen our relationships with our customers. Our research and development organization is built around small development teams. Our small development teams foster greater agility, which enables us to develop new, innovative products and make rapid changes to our infrastructure that increase resiliency and operational efficiency.
Our research and development teams are organized into three primary groups: the server team, the cloud team and the drivers and integrations team.
As of January 31, 2018, we had 249 employees in our research and development organization. We intend to continue to invest in our research and development capabilities to extend our platform. Research and development expense totaled $62.2 million, $51.8 million and $43.5 million during the fiscal years ended January 31, 2018, 2017 and 2016, respectively.
Competition
The worldwide database software market is rapidly evolving and highly competitive. We believe that the principal competitive factors in our market are:
• | mindshare with software developers and IT executives; |
• | product capabilities, including flexibility, scalability, performance, security and reliability; |
• | flexible deployment model, including in the cloud, on-premise or in a hybrid environment; |
• | ease of deployment; |
• | breadth of use cases supported; |
• | ease of integration with existing IT infrastructure; |
• | robustness of professional services and customer support; |
• | price and total cost of ownership; |
• | adherence to industry standards and certifications; |
9
• | size of customer base and level of user adoption; |
• | strength of sales and marketing efforts; and |
• | brand awareness and reputation. |
We believe that we compete favorably on the basis of the factors listed above.
We primarily compete with established legacy database software providers such as IBM, Microsoft, Oracle and other similar companies. We also compete with non-relational database software providers and certain cloud providers such as AWS, GCP and Microsoft Azure that offer basic database functionality.
Some of our actual and potential competitors, in particular the legacy database providers, have advantages over us, such as longer operating histories, more established relationships with current or potential customers and commercial partners, significantly greater financial, technical, marketing or other resources, stronger brand recognition, larger intellectual property portfolios and broader global distribution and presence. Such competitors may make their products available at a low cost or no cost basis in order to enhance their overall relationships with current or potential customers. Our competitors may also be able to respond more quickly and effectively than we can to new or changing opportunities, technologies, standards or customer requirements. In addition, some of our larger competitors have substantially broader offerings and can bundle competing products with hardware or other software offerings, including their cloud computing and customer relationship management platforms. In addition, some large software and internet companies may seek to enter our market. With the introduction of new technologies and new market entrants, we expect competition to intensify in the future.
Seasonality
We have in the past and expect in the future to experience seasonal fluctuations in our revenue and sales from time to time. Our recent growth and the ratable nature of our subscription revenue make this seasonality less apparent in our overall financial results.
Intellectual Property
We rely on a combination of patent, copyright, trademark and trade secret laws in the United States and other jurisdictions, as well as license agreements and other contractual protections, to protect our proprietary technology. We also rely on a number of registered and unregistered trademarks to protect our brand.
As of January 31, 2018, in the United States, we had been issued 12 patents, which expire between 2030 and 2033, and had 40 patent applications pending, of which four are provisional applications. In addition, as of January 31, 2018, we had 12 registered trademarks in the United States and one pending trademark application in the United States.
Unlike software companies built around open source projects, we own the intellectual property of our offerings, allowing us to retain control over our future product roadmap, including the determination of which features are included in our free or paid offerings. We offer Community Server under the GNU Affero General Public License version 3 (the “AGPL”). The AGPL permits users to run the database without charge but subject to certain terms and conditions. The AGPL requires users to make publicly available the source code for any modified version of the database that they distribute, run as a service or otherwise make available to end users. By contrast, we offer our Enterprise Server database under a commercial license that does not have this requirement and this is one of the reasons some organizations elect to buy a subscription including a commercial license to our platform. In addition, by offering Community Server under the AGPL, we limit the appeal to other parties, including public cloud vendors, of monetizing our software without licensing it from us, further supporting our software subscription business model.
In addition, we seek to protect our intellectual property rights by implementing a policy that requires our employees and independent contractors involved in development of intellectual property on our behalf to enter into agreements acknowledging that all works or other intellectual property generated or conceived by them on our behalf are our property, and assigning to us any rights, including intellectual property rights, that they may claim or otherwise have in those works or property, to the extent allowable under applicable law.
Information about Segment and Geographic Areas
Segment and geographic information required herein is set forth in Note 12 in our Notes to Consolidated Financial Statements included in Part II, Item 8, Financial Statements, of this Form 10-K.
10
Corporate Information
We were originally incorporated in the state of Delaware in November 2007 under the name 10Gen, Inc. In August 2013, we changed our name to MongoDB, Inc. In October 2017, we completed our initial public offering and our Class A common stock is listed on The Nasdaq Global Market (“Nasdaq”) under the symbol “MDB.” Our principal executive offices are located at 229 West 43rd Street, 5th Floor, New York, New York 10036, and our telephone number is (646) 727-4092.
Available Information
Our Annual Report on Form 10-K, Quarterly Reports on Form 10-Q, Current Reports on Form 8-K, and amendments to reports filed pursuant to Sections 13(a) and 15(d) of the Exchange Act are filed with the U.S. Securities and Exchange Commission (“SEC”). We are subject to the informational requirements of the Exchange Act and file or furnish reports, proxy statements and other information with the SEC. Such reports and other information filed by us with the SEC are available free of charge on our website at www.mongodb.com/ir when such reports are available on the SEC’s website. The public may read and copy any materials filed by the Company with the SEC at the SEC’s Public Reference Room at 100 F Street, NE, Room 1580, Washington, DC 20549. The public may obtain information on the operation of the Public Reference Room by calling the SEC at 1-800-SEC-0330. The SEC maintains an internet site that contains reports, proxy and information statements and other information regarding issuers that file electronically with the SEC at www.sec.gov. The information contained on the websites referenced in this Form 10-K is not incorporated by reference into this filing. Further, our references to website URLs are intended to be inactive textual references only.
Item 1A. Risk Factors
Our operations and financial results are subject to various risks and uncertainties including those described below. You should consider carefully the risks and uncertainties described below, in addition to other information contained in this Form 10-K, including our consolidated financial statements and related notes. The risks and uncertainties described below are not the only ones we face. Additional risks and uncertainties that we are unaware of, or that we currently believe are not material, may also become important factors that adversely affect our business. If any of the following risks or others not specified below materialize, our business, financial condition and results of operations could be materially and adversely affected. In that case, the trading price of our Class A common stock could decline.
Risks Related to Our Business and Industry
We have a limited operating history, which makes it difficult to predict our future results of operations.
We were incorporated in 2007 and introduced MongoDB Community Server in 2009, MongoDB Enterprise Advanced in 2013 and MongoDB Atlas in 2016. As a result of our limited operating history, our ability to forecast our future results of operations is limited and subject to a number of uncertainties, including our ability to accurately predict future growth. Our historical revenue growth has been inconsistent and should not be considered indicative of our future performance. Further, in future periods, our revenue growth could slow or our revenue could decline for a number of reasons, including slowing demand for our subscription offerings and related services, reduced conversion of our open source users to paying customers, increasing competition, changes to technology or our intellectual property or our failure, for any reason, to continue to capitalize on growth opportunities. We have also encountered and will encounter risks and uncertainties frequently experienced by growing companies in rapidly changing industries, such as the risks and uncertainties described herein. If our assumptions regarding these risks and uncertainties and our future revenue growth are incorrect or change, or if we do not address these risks successfully, our operating and financial results could differ materially from our expectations and our business could suffer.
We have a history of losses, and as our costs increase, we may not be able to generate sufficient revenue to achieve or sustain profitability.
We have incurred net losses in each period since our inception, including net losses of $96.4 million, $86.7 million and $73.5 million for the fiscal years ended January 31, 2018, 2017 and 2016, respectively. We had an accumulated deficit of $443.8 million as of January 31, 2018. We expect our operating expenses to increase significantly as we increase our sales and marketing efforts, continue to invest in research and development, and expand our operations and infrastructure, both domestically and internationally. In addition, we expect to incur significant additional legal, accounting, and other expenses related to being a public company. While our revenue has grown in recent years, if our revenue declines or fails to grow at a rate faster than these increases in our operating expenses, we will not be able to achieve and maintain profitability in future
11
periods. As a result, we expect to continue to generate losses. We cannot assure you that we will achieve profitability in the future or that, if we do become profitable, we will be able to sustain profitability.
Because we derive substantially all of our revenue from our database platform, failure of this platform to satisfy customer demands could adversely affect our business, results of operations, financial condition and growth prospects.
We derive and expect to continue to derive substantially all of our revenue from our database platform. As such, market adoption of our database platform is critical to our continued success. Demand for our platform is affected by a number of factors beyond our control, including continued market acceptance by developers, the availability of our Community Server offering, the continued volume, variety and velocity of data that is generated, timing of development and release of new offerings by our competitors, technological change, and the rate of growth in our market. If we are unable to continue to meet the demands of our customers and the developer community, our business operations, financial results and growth prospects will be materially and adversely affected.
We currently face significant competition.
The database software market, for both relational and non‑relational database products, is highly competitive, rapidly evolving and others may put out competing databases or sell services in connection with existing open source databases, including ours. The principal competitive factors in our market include: mindshare with software developers and IT executives; product capabilities, including flexibility, scalability, performance, security and reliability; flexible deployment options, including in the cloud, on‑premise or in a hybrid environment, and ease of deployment; breadth of use cases supported; ease of integration with existing IT infrastructure; robustness of professional services and customer support; price and total cost of ownership; adherence to industry standards and certifications; size of customer base and level of user adoption; strength of sales and marketing efforts; and brand awareness and reputation. If we fail to compete effectively with respect to any of these competitive factors, we may fail to attract new customers or lose or fail to renew existing customers, which would cause our business and results of operations to suffer.
We primarily compete with legacy relational database software providers such as IBM, Microsoft, Oracle and other similar companies. We also compete with non‑relational database software providers and certain cloud providers such as AWS, GCP, and Microsoft Azure. In addition, other large software and internet companies may seek to enter our market.
Some of our actual and potential competitors, in particular the legacy relational database providers, have advantages over us, such as longer operating histories, more established relationships with current or potential customers and commercial partners, significantly greater financial, technical, marketing or other resources, stronger brand recognition, larger intellectual property portfolios and broader global distribution and presence. Such competitors may make their products available at a low cost or no cost basis in order to enhance their overall relationships with current or potential customers. Our competitors may also be able to respond more quickly and effectively than we can to new or changing opportunities, technologies, standards or customer requirements. With the introduction of new technologies and new market entrants, we expect competition to intensify in the future. In addition, some of our larger competitors have substantially broader offerings and can bundle competing products with hardware or other software offerings, including their cloud computing and customer relationship management platforms. As a result, customers may choose a bundled offering from our competitors, even if individual products have more limited functionality compared to our software. These larger competitors are also often in a better position to withstand any significant reduction in technology spending, and will therefore not be as susceptible to competition or economic downturns. In addition, some competitors may offer products or services that address one or a limited number of functions at lower prices, with greater depth than our products or in geographies where we do not operate.
Furthermore, our actual and potential competitors may establish cooperative relationships among themselves or with third parties that may further enhance their resources and offerings in the markets we address. In addition, third parties with greater available resources may acquire current or potential competitors. As a result of such relationships and acquisitions, our actual or potential competitors might be able to adapt more quickly to new technologies and customer needs, devote greater resources to the promotion or sale of their products, initiate or withstand substantial price competition, take advantage of other opportunities more readily or develop and expand their offerings more quickly than we do. For all of these reasons, we may not be able to compete successfully against our current or future competitors.
If we do not effectively expand our sales and marketing organization, we may be unable to add new customers or increase sales to our existing customers.
Increasing our customer base and achieving broader market acceptance of our subscription offerings and related services will depend, to a significant extent, on our ability to effectively expand our sales and marketing operations and
12
activities. We are substantially dependent on our direct sales force and our marketing efforts to obtain new customers. We plan to continue to expand our sales and marketing organization both domestically and internationally. We believe that there is significant competition for experienced sales professionals with the sales skills and technical knowledge that we require, particularly as we continue to target larger enterprises. In addition, we are currently in the process of replacing our Chief Revenue Officer and we may have difficulty finding someone with the right skills and experience for such position. It may also be more difficult to recruit other sales professionals without a Chief Revenue Officer. Our ability to achieve significant revenue growth in the future will depend, in part, on our success in recruiting, training and retaining a sufficient number of experienced sales professionals, especially in large markets like New York, the San Francisco Bay Area and London, England. New hires require significant training and time before they achieve full productivity, particularly in new or developing sales territories. Our recent hires and planned hires, including any new Chief Revenue Officer we may hire, may not become as productive as quickly as we expect, and we may be unable to hire or retain sufficient numbers of qualified individuals in the future in the markets where we do business. Because of our limited operating history, we cannot predict whether, or to what extent, our sales will increase as we expand our sales and marketing organization or how long it will take for sales personnel to become productive. Our business and results of operations will be harmed if the expansion of our sales and marketing organization does not generate a significant increase in revenue.
Our adoption strategies include offering Community Server and a free tier of MongoDB Atlas, and we may not be able to realize the benefits of these strategies.
To encourage developer usage, familiarity and adoption of our platform, we offer Community Server as an open source offering, analogous to a “freemium” offering. Community Server is a free‑to‑download version of our database that does not include all of the features of our commercial platform. We also offer a free tier of MongoDB Atlas in order to accelerate adoption, promote usage and drive brand and product awareness. We do not know if we will be able to convert these users to paying customers of our platform. Our marketing strategy also depends in part on persuading users who use one of these free versions to convince others within their organization to purchase and deploy our platform. To the extent that users of Community Server or our free tier of MongoDB Atlas do not become, or lead others to become, paying customers, we will not realize the intended benefits of these strategies, and our ability to grow our business or achieve profitability may be harmed.
We have invested significantly in our MongoDB Atlas offering and if it fails to achieve market adoption our business, results of operations and financial condition could be harmed.
We introduced MongoDB Atlas in June 2016. We have less experience marketing, determining pricing for and selling MongoDB Atlas, and we are still determining how to best market, price and support adoption of this offering. We have directed, and intend to continue to direct, a significant portion of our financial and operating resources to develop and grow MongoDB Atlas, including offering a free tier of MongoDB Atlas to generate developer usage and awareness. Although MongoDB Atlas has seen rapid adoption since its commercial launch, we cannot guarantee that rate of adoption will continue at the same pace or at all. If we are unsuccessful in our efforts to drive customer adoption of MongoDB Atlas, or if we do so in a way that is not profitable or fails to compete successfully against our current or future competitors, our business, results of operations and financial condition could be harmed.
We could be negatively impacted if the GNU Affero General Public License Version 3 and other open source licenses under which some of our software is licensed are not enforceable.
The latest release of Community Server is licensed under the AGPL. This license states that any program licensed under it may be copied, modified and distributed provided certain conditions are met. It is possible that a court would hold this license to be unenforceable. If a court held this license or certain aspects of this license to be unenforceable, others may be able to use our software to compete with us in the marketplace in a manner not subject to the restrictions set forth in the AGPL.
We offer Community Server under an open source license, which could negatively affect our ability to monetize and protect our intellectual property rights.
We make our Community Server offering available under the AGPL. Community Server is a free‑to‑download version of our database that includes the core functionality developers need to get started with MongoDB but not all of the features of our commercial platform. The AGPL grants licensees broad freedom to view, use, copy, modify and redistribute the source code of Community Server. Some commercial enterprises consider AGPL‑licensed software to be unsuitable for commercial use because of its “copyleft” requirement that further distribution of AGPL‑licensed software and modifications or adaptations to that software must be made available pursuant to the AGPL as well. However, some of those same
13
commercial enterprises do not have the same concerns regarding using the software under the AGPL for internal purposes. As a result, these commercial enterprises may never convert to paying customers of our platform. Anyone can obtain a free copy of Community Server from the Internet, and we do not know who all of our AGPL licensees are. Competitors could develop modifications of our software to compete with us in the marketplace. We do not have visibility into how our software is being used by licensees, so our ability to detect violations of the AGPL is extremely limited.
In addition to Community Server, we contribute other source code to open source projects under open source licenses and release internal software projects under open source licenses, and anticipate doing so in the future. Because the source code for Community Server and any other software we contribute to open source projects or distribute under open source licenses is publicly available, our ability to monetize and protect our intellectual property rights with respect to such source code may be limited or, in some cases, lost entirely.
Our software incorporates third‑party open source software, which could negatively affect our ability to sell our products and subject us to possible litigation.
Our software includes third‑party open source software, and we intend to continue to incorporate third‑party open source software in our products in the future. There is a risk that the use of third‑party open source software in our software could impose conditions or restrictions on our ability to monetize our software. Although we monitor the incorporation of open source software into our products to avoid such restrictions, we cannot be certain that we have not incorporated open source software in our products or platform in a manner that is inconsistent with our licensing model. Certain open source projects also include other open source software and there is a risk that those dependent open source libraries may be subject to inconsistent licensing terms. This could create further uncertainties as to the governing terms for the open source software we incorporate.
In addition, the terms of certain open source licenses to which we are subject have not been interpreted by U.S. or foreign courts, and there is a risk that open source software licenses could be construed in a manner that imposes unanticipated restrictions or conditions on our use of such software. Additionally, we may from time to time face claims from third parties claiming ownership of, or demanding release of, the software or derivative works that we developed using such open source software, which could include proprietary portions of our source code, or otherwise seeking to enforce the terms of the open source licenses. These claims could result in litigation and could require us to make those proprietary portions of our source code freely available, purchase a costly license or cease offering the implicated software or services unless and until we can re‑engineer them to avoid infringement. This re‑engineering process could require significant additional research and development resources, and we may not be able to complete it successfully.
In addition to risks related to license requirements, use of third‑party open source software can lead to greater risks than use of third‑party commercial software, as open source licensors generally do not provide warranties. In addition, licensors of open source software included in our offerings may, from time to time, modify the terms of their license agreements in such a manner that those license terms may become incompatible with our licensing model, and thus could, among other consequences, prevent us from incorporating the software subject to the modified license.
Any of these risks could be difficult to eliminate or manage, and if not addressed, could have a negative effect on our business, results of operations and financial condition.
If we are not able to introduce new features or services successfully and to make enhancements to our software or services, our business and results of operations could be adversely affected.
Our ability to attract new customers and increase revenue from existing customers depends in part on our ability to enhance and improve our software and to introduce new features and services. For example, we introduced MongoDB Atlas in June 2016. To grow our business and remain competitive, we must continue to enhance our software and develop features that reflect the constantly evolving nature of technology and our customers’ needs. The success of new products, enhancements and developments depends on several factors: our anticipation of market changes and demands for product features, including timely product introduction and conclusion, sufficient customer demand, cost effectiveness in our product development efforts and the proliferation of new technologies that are able to deliver competitive products and services at lower prices, more efficiently, more conveniently or more securely. In addition, because our software is designed to operate with a variety of systems, applications, data and devices, we will need to continuously modify and enhance our software to keep pace with changes in such systems. We may not be successful in developing these modifications and enhancements. Furthermore, the addition of features and solutions to our software will increase our research and development expenses. Any new features that we develop may not be introduced in a timely or cost‑effective manner or may not achieve the market acceptance necessary to generate sufficient revenue to justify the related expenses. It is difficult to predict customer adoption
14
of new features. Such uncertainty limits our ability to forecast our future results of operations and subjects us to a number of challenges, including our ability to plan for and model future growth. If we cannot address such uncertainties and successfully develop new features, enhance our software or otherwise overcome technological challenges and competing technologies, our business and results of operations could be adversely affected.
We also offer professional services including consulting and training and must continually adapt to assist our customers in deploying our software in accordance with their specific IT strategies. If we cannot introduce new services or enhance our existing services to keep pace with changes in our customers’ deployment strategies, we may not be able to attract new customers, retain existing customers and expand their use of our software or secure renewal contracts, which are important for the future of our business.
Our success is highly dependent on our ability to penetrate the existing market for database products, as well as the growth and expansion of the market for database products.
Our future success will depend in large part on our ability to service existing demand, as well as the continued growth and expansion of the database market. It is difficult to predict demand for our offerings, the conversion from one to the other and related services and the size, growth rate and expansion of these markets, the entry of competitive products or the success of existing competitive products. Our ability to penetrate the existing database market and any expansion of the market depends on a number of factors, including cost, performance and perceived value associated with our subscription offerings, as well as our customers’ willingness to adopt an alternative approach to relational and other database products available in the market. Furthermore, many of our potential customers have made significant investments in relational databases, such as offerings from Oracle, and may be unwilling to invest in new products. If the market for databases fails to grow at the rate that we anticipate or decreases in size or we are not successful in penetrating the existing market, our business would be harmed.
Our future quarterly results may fluctuate significantly, and if we fail to meet the expectations of analysts or investors, our stock price could decline substantially.
Our results of operations, including our revenue, operating expenses and cash flows may vary significantly in the future as a result of a variety of factors, many of which are outside of our control, may be difficult to predict and may or may not fully reflect the underlying performance of our business and period‑to‑period comparisons of our operating results may not be meaningful. Some of the factors that may cause our results of operations to fluctuate from quarter to quarter include:
• | changes in actual and anticipated growth rates of our revenue, customers and other key operating metrics; |
• | new product announcements, pricing changes and other actions by competitors; |
• | the mix of revenue and associated costs attributable to subscriptions for our MongoDB Enterprise Advanced and MongoDB Atlas offerings and professional services, as such relative mix may impact our gross margins and operating income; |
• | the mix of revenue and associated costs attributable to sales where subscriptions are bundled with services versus sold on a standalone basis and sales by us and our partners; |
• | our ability to attract new customers; |
• | our ability to retain customers and expand their usage of our software, particularly for our largest customers; |
• | the inability to enforce our AGPL license; |
• | delays in closing sales, including the timing of renewals, which may result in revenue being pushed into the next quarter, particularly because a large portion of our sales occur toward the end of each quarter; |
• | the timing of revenue recognition; |
• | the mix of revenue attributable to larger transactions as opposed to smaller transactions; |
• | changes in customers’ budgets and in the timing of their budgeting cycles and purchasing decisions; |
• | customers and potential customers opting for alternative products, including developing their own in‑house solutions, or opting to use only the free version of our products; |
15
• | fluctuations in currency exchange rates; |
• | our ability to control costs, including our operating expenses; |
• | the timing and success of new products, features and services offered by us and our competitors or any other change in the competitive dynamics of our industry, including consolidation among competitors, customers or strategic partners; |
• | significant security breaches of, technical difficulties with, or interruptions to, the delivery and use of our software; |
• | our failure to maintain the level of service uptime and performance required by our customers; |
• | the collectability of receivables from customers and resellers, which may be hindered or delayed if these customers or resellers experience financial distress; |
• | general economic conditions, both domestically and internationally, as well as economic conditions specifically affecting industries in which our customers participate; |
• | sales tax and other tax determinations by authorities in the jurisdictions in which we conduct business; |
• | the impact of new accounting pronouncements; and |
• | fluctuations in stock‑based compensation expense. |
The occurrence of one or more of the foregoing and other factors may cause our results of operations to vary significantly. We also intend to continue to invest significantly to grow our business in the near future rather than optimizing for profitability or cash flows. In addition, we expect to incur significant additional expenses due to the increased costs of operating as a public company. Accordingly, historical patterns and our results of operations in any one quarter may not be meaningful and should not be relied upon as indicative of future performance. Additionally, if our quarterly results of operations fall below the expectations of investors or securities analysts who follow our stock, the price of our Class A common stock could decline substantially, and we could face costly lawsuits, including securities class action suits.
We have experienced rapid growth in recent periods. If we fail to continue to grow and to manage our growth effectively, we may be unable to execute our business plan, increase our revenue, improve our results of operations, maintain high levels of service, or adequately address competitive challenges.
We have recently experienced a period of rapid growth in our business, operations, and employee headcount. For fiscal years 2018, 2017 and 2016, our total revenue was $154.5 million, $101.4 million and $65.3 million, respectively, representing a 52% and 55% growth rate, respectively. We have also significantly increased the size of our customer base from over 1,100 customers as of January 31, 2015 to over 5,700 customers as of January 31, 2018, and we grew from 383 employees as of January 31, 2015 to 962 employees as of January 31, 2018. We expect to continue to expand our operations and employee headcount in the near term. Our success will depend in part on our ability to continue to grow and to manage this growth, domestically and internationally, effectively.
Our recent growth has placed, and future growth will continue to place, a significant strain on our management, administrative, operational and financial infrastructure. We will need to continue to improve our operational, financial, and management processes and controls, and our reporting systems and procedures to manage the expected growth of our operations and personnel, which will require significant expenditures and allocation of valuable management and employee resources. If we fail to implement these infrastructure improvements effectively, our ability to ensure uninterrupted operation of key business systems and comply with the rules and regulations that are applicable to public reporting companies will be impaired. Further, if we do not effectively manage the growth of our business and operations, the quality of our products and services could suffer, the preservation of our culture, values and entrepreneurial environment may change and we may not be able to adequately address competitive challenges. This could impair our ability to attract new customers, retain existing customers and expand their use of our products and services, all of which would adversely affect our brand, overall business, results of operations and financial condition.
16
If our security measures, or those of our service providers, are breached or unauthorized access to private or proprietary data is otherwise obtained, our software may be perceived as not being secure, customers may reduce or terminate their use of our software, and we may incur significant liabilities.
Because our software, which can be deployed in the cloud, on‑premise or in a hybrid environment and can be hosted by our customers or can be hosted by us as a service, allows customers to store and transmit data, there exists an inherent risk of a security breach or other security incident, which may result in the loss of, or unauthorized access to, this data. For example, since January 2017, industry publications have reported ransomware attacks on over 80,000 MongoDB instances. Almost all of these instances were launched by users with our Community Server offering rather than users of MongoDB Enterprise Advanced. We believe these attacks were due to the users’ failure to properly turn on the recommended security settings when running MongoDB. We, or our service providers, may also suffer a security breach or other security incident affecting the systems or networks used to operate our business, or otherwise impacting the data that is stored or processed in the conduct of our business. Any such security breach or other security incident could lead to litigation, indemnity obligations, regulatory investigations and enforcement actions, and other liability. If our security measures, or those of our services providers, are breached or are believed to have been breached, whether as a result of third‑party action, employee, vendor, or contractor error, malfeasance, phishing attacks, social engineering or otherwise, unauthorized access to or loss of data may result. If any of these events occur, our reputation could be damaged, our business may suffer, and we may face regulatory investigations and actions, litigation, indemnity obligations, damages for contract breach, and fines and penalties for violations of applicable laws or regulations. Security breaches could also result in significant costs for remediation that may include liability for stolen assets or information and repair of system damage that may have been caused, incentives offered to customers or other business partners in an effort to maintain business relationships after a breach, and other liabilities. Similarly, if a cyber incident (including any accidental or intentional computer or network issues such as phishing attacks, viruses, denial of service (“DoS”), attacks, malware installation, server malfunction, software or hardware failures, loss of data or other computer assets, adware, or other similar issues) impairs the integrity or availability of our systems, or those of our service providers, by affecting our data or the data of our customers, or reducing access to or shutting down one or more of our or our service providers’ computing systems or IT network, or if any such impairment is perceived to have occurred, we may be subject to negative treatment by our customers, our business partners, the press, and the public at large. We may also experience security breaches that may remain undetected for an extended period. Techniques used to obtain unauthorized access or sabotage systems change frequently and generally are not identified until they are launched against a target, and cybersecurity threats continue to evolve and are difficult to predict due to advances in computer capabilities, new discoveries in the field of cryptography and new and sophisticated methods used by criminals, including phishing, social engineering or other illicit acts. We may be unable to anticipate these techniques or to implement adequate preventative measures. Any or all of these issues could harm our reputation and negatively impact our ability to attract new customers and increase engagement by existing customers, cause existing customers to elect not to renew their subscriptions, or subject us to third‑party lawsuits, regulatory fines, actions, and investigations, or other actions or liability, thereby adversely affecting our financial results.
While we maintain general liability insurance coverage and coverage for errors or omissions, we cannot assure you that such coverage will be adequate or otherwise protect us from liabilities or damages with respect to claims alleging compromises of personal or other confidential data or otherwise relating to privacy or data security matters or that such coverage will continue to be available to us on commercially reasonable terms or at all.
Our sales cycle may be long and is unpredictable, and our sales efforts require considerable time and expense.
The timing of our sales and related revenue recognition is difficult to predict because of the length and unpredictability of the sales cycle for our offerings. We are often required to spend significant time and resources to better educate and familiarize potential customers with the value proposition of paying for our products and services. The length of our sales cycle, from initial evaluation to payment for our offerings is generally three to nine months, but can vary substantially from customer to customer or from application to application within a given customer. As the purchase and deployment of our products can be dependent upon customer initiatives, our sales cycle can extend to more than a year for some customers. Customers often view a subscription to our products and services as a strategic decision and significant investment and, as a result, frequently require considerable time to evaluate, test and qualify our product offering prior to entering into or expanding a subscription. During the sales cycle, we expend significant time and money on sales and marketing and contract negotiation activities, which may not result in a sale. Additional factors that may influence the length and variability of our sales cycle include:
•the effectiveness of our sales force, in particular new sales people as we increase the size of our sales force;
17
•the discretionary nature of purchasing and budget cycles and decisions;
•the obstacles placed by a customer’s procurement process;
•our ability to convert users of our free Community Server offering to paying customers;
•economic conditions and other factors impacting customer budgets;
•customer evaluation of competing products during the purchasing process; and
•evolving customer demands.
Given these factors, it is difficult to predict whether and when a sale will be completed, and when revenue from a sale will be recognized, particularly since we generally recognize revenue over the term of a subscription and in some cases, when our subscription offering is purchased with a service contract, we do not recognize revenue from the subscription until services are provided, which may result in lower than expected revenue in any given period, which would have an adverse effect on our business, results of operations and financial condition.
We have a limited history with our subscription offerings and pricing model and if, in the future, we are forced to reduce prices for our subscription offerings, our revenue and results of operations will be harmed.
We have limited experience with respect to determining the optimal prices for our subscription offerings. As the market for databases evolves, or as new competitors introduce new products or services that compete with ours, we may be unable to attract new customers or convert Community Server users to paying customers on terms or based on pricing models that we have used historically. In the past, we have been able to increase our prices for our subscriptions offerings, but we may choose not to introduce or be unsuccessful in implementing future price increases. As a result of these and other factors, in the future we may be required to reduce our prices or be unable to increase our prices, or it may be necessary for us to increase our services or product offerings without additional revenue to remain competitive, all of which could harm our results of operations and financial condition.
If we are unable to attract new customers in a manner that is cost‑effective and assures customer success, we will not be able to grow our business, which would adversely affect our results of operations, and financial condition.
In order to grow our business, we must continue to attract new customers in a cost‑effective manner and enable these customers to realize the benefits associated with our products and services. We may not be able to attract new customers for a variety of reasons, including as a result of their use of traditional relational and/or other database products, and their internal timing, budget or other constraints that hinder their ability to migrate to or adopt our products or services.
Even if we do attract new customers, the cost of new customer acquisition, product implementation and ongoing customer support may prove so high as to prevent us from achieving or sustaining profitability. For example, in fiscal years 2018, 2017 and 2016, total sales and marketing expense represented 71%, 78% and 87% of revenue, respectively. We intend to continue to hire additional sales personnel, increase our marketing activities to help educate the market about the benefits of our platform and services, grow our domestic and international operations, and build brand awareness. We also intend to continue to cultivate our relationships with developers through continued investment and growth of our MongoDB World, MongoDB Advocacy Hub, User Groups, MongoDB University and our partner ecosystem of global system integrators, value‑added resellers and independent software vendors. If the costs of these sales and marketing efforts increase dramatically, if we do not experience a substantial increase in leverage from our partner ecosystem, or if our sales and marketing efforts do not result in substantial increases in revenue, our business, results of operations, and financial condition may be adversely affected. In addition, while we expect to continue to invest in our professional services organization to accelerate our customers’ ability to adopt our products and ultimately create and expand their use of our products over time, we cannot assure you that any of these investments will lead to the cost‑effective acquisition of additional customers.
Our business and results of operations depend substantially on our customers renewing their subscriptions with us and expanding their use of software and related services. Any decline in our customer renewals or failure to convince our customers to broaden their use of subscription offerings and related services would harm our business, results of operations, and financial condition.
Our subscription offerings are term‑based and a majority of our subscription contracts were one year in duration in fiscal year 2018. In order for us to maintain or improve our results of operations, it is important that our customers renew their subscriptions with us when the existing subscription term expires, and renew on the same or more favorable quantity
18
and terms. Our customers have no obligation to renew their subscriptions, and we may not be able to accurately predict customer renewal rates. In addition, the growth of our business depends in part on our customers expanding their use of subscription offerings and related services. Historically, some of our customers have elected not to renew their subscriptions with us for a variety of reasons, including as a result of changes in their strategic IT priorities, budgets, costs and, in some instances, due to competing solutions. Our retention rate may also decline or fluctuate as a result of a number of other factors, including our customers’ satisfaction or dissatisfaction with our software, the increase in the contract value of subscription and support contracts from new customers, the effectiveness of our customer support services, our pricing, the prices of competing products or services, mergers and acquisitions affecting our customer base, global economic conditions, and the other risk factors described herein. As a result, we cannot assure you that customers will renew subscriptions or increase their usage of our software and related services. If our customers do not renew their subscriptions or renew on less favorable terms, or if we are unable to expand our customers’ use of our software, our business, results of operations, and financial condition may be adversely affected.
If we fail to offer high quality support, our business and reputation could suffer.
Our customers rely on our personnel for support of our software included in our MongoDB Enterprise Advanced, MongoDB Atlas and MongoDB Professional packages. High‑quality support is important for the renewal and expansion of our agreements with existing customers. The importance of high‑quality support will increase as we expand our business and pursue new customers. If we do not help our customers quickly resolve issues and provide effective ongoing support, our ability to sell new software to existing and new customers could suffer and our reputation and relationships with existing or potential customers could be harmed.
Real or perceived errors, failures or bugs in our software could adversely affect our business, results of operations, financial condition, and growth prospects.
Our software is complex, and therefore, undetected errors, failures or bugs have occurred in the past and may occur in the future. Our software is used in IT environments with different operating systems, system management software, applications, devices, databases, servers, storage, middleware, custom and third‑party applications and equipment and networking configurations, which may cause errors or failures in the IT environment into which our software is deployed. This diversity increases the likelihood of errors or failures in those IT environments. Despite testing by us, real or perceived errors, failures or bugs may not be found until our customers use our software. Real or perceived errors, failures or bugs in our products could result in negative publicity, loss of or delay in market acceptance of our software, harm to our brand, weakening of our competitive position, or claims by customers for losses sustained by them or failure to meet the stated service level commitments in our customer agreements. In such an event, we may be required, or may choose, for customer relations or other reasons, to expend significant additional resources in order to help correct the problem. Any errors, failures or bugs in our software could also impair our ability to attract new customers, retain existing customers or expand their use of our software, which would adversely affect our business, results of operations and financial condition.
Because our software and services could be used to collect and store personal information, domestic and international privacy concerns could result in additional costs and liabilities to us or inhibit sales of our software.
Personal privacy has become a significant issue in the United States, Europe and in many other countries where we offer our software and services. The regulatory framework for privacy issues worldwide is rapidly evolving and is likely to remain uncertain for the foreseeable future. Many federal, state and foreign government bodies and agencies have adopted or are considering adopting laws, rules and regulations regarding the collection, use, storage and disclosure of personal information and breach notification procedures. Interpretation of these laws, rules and regulations and their application to our software and professional services in the United States and foreign jurisdictions is ongoing and cannot be fully determined at this time.
In the United States, these include rules and regulations promulgated under the authority of the Federal Trade Commission, the Electronic Communications Privacy Act, Computer Fraud and Abuse Act, the Health Insurance Portability and Accountability Act of 1996 (“HIPAA”), the Gramm Leach Bliley Act and state laws relating to privacy and data security. Internationally, virtually every jurisdiction in which we operate has established its own data security and privacy legal framework with which we, or our customers, must comply. There may be substantial amounts of personally identifiable information or other sensitive information uploaded to our services and managed using our software.
In December 2015, European Union (“EU”) institutions reached agreement on a draft regulation that was formally adopted in April 2016, referred to as the General Data Protection Regulation (the “GDPR”), which will be enforced beginning in May 2018. The GDPR updates and modernizes the principles of the 1995 EU Data Protection Directive. The
19
GDPR significantly increases the level of sanctions for non‑compliance from those in existing EU data protection law. EU data protection authorities will have the power to impose administrative fines for violations of the GDPR of up to a maximum of €20 million or 4% of the data controller’s or data processor’s total worldwide global turnover for the preceding financial year, whichever is higher, and violations of the GDPR may also lead to damages claims by data controllers and data subjects. Since we act as a data processor for our MongoDB Atlas customers, we are taking steps to cause our processes to be compliant with applicable portions of the GDPR, but we cannot assure you that such steps will be effective.
In addition to government regulation, privacy advocates and industry groups may propose new and different self‑regulatory standards that may apply to us. Because the interpretation and application of privacy and data protection laws, regulations, rules and other standards are still uncertain, it is possible that these laws, rules, regulations, and other actual or alleged legal obligations, such as contractual or self‑regulatory obligations, may be interpreted and applied in a manner that is inconsistent with our data management practices or the features of our software. If so, in addition to the possibility of fines, lawsuits and other claims, we could be required to fundamentally change our business activities and practices or modify our software, which we may be unable to do in a commercially reasonable manner or at all, and which could have an adverse effect on our business. Any inability to adequately address privacy concerns, even if unfounded, or comply with applicable privacy or data protection laws, regulations and other actual or alleged obligations, could result in additional cost and liability to us, damage our reputation, inhibit sales and adversely affect our business.
Furthermore, the costs of compliance with, and other burdens imposed by, the laws, regulations, and policies that are applicable to the businesses of our customers may limit the use and adoption of, and reduce the overall demand for, our software. Privacy concerns, whether valid or not valid, may inhibit market adoption of our software particularly in certain industries and foreign countries.
The estimates of market opportunity and forecasts of market growth included in this Form 10-K may prove to be inaccurate, and even if the market in which we compete achieves the forecasted growth, our business could fail to grow at similar rates, if at all.
Market opportunity estimates and growth forecasts included in this Form 10-K are subject to significant uncertainty and are based on assumptions and estimates that may not prove to be accurate. Even if the market in which we compete meets the size estimates and growth forecasted in this Form 10-K, our business could fail to grow for a variety of reasons, which would adversely affect our results of operations.
We could incur substantial costs in protecting or defending our intellectual property rights, and any failure to protect our intellectual property rights could reduce the value of our software and brand.
Our success and ability to compete depend in part upon our intellectual property rights. As of January 31, 2018, we had twelve issued patents and 40 pending patent applications in the United States, which may not result in issued patents. Even if a patent issues, we cannot assure you that such patent will be adequate to protect our business. We primarily rely on copyright, trademark laws, trade secret protection and confidentiality or other contractual arrangements with our employees, customers, partners and others to protect our intellectual property rights. However, the steps we take to protect our intellectual property rights may not be adequate. In order to protect our intellectual property rights, we may be required to spend significant resources to establish, monitor and enforce such rights. Litigation brought to enforce our intellectual property rights could be costly, time‑consuming and distracting to management and could be met with defenses, counterclaims and countersuits attacking the validity and enforceability of our intellectual property rights, which may result in the impairment or loss of portions of our intellectual property. The laws of some foreign countries do not protect our intellectual property rights to the same extent as the laws of the United States, and effective intellectual property protection and mechanisms may not be available in those jurisdictions. We may need to expend additional resources to defend our intellectual property in these countries, and our inability to do so could impair our business or adversely affect our international expansion. Even if we are able to secure our intellectual property rights, there can be no assurances that such rights will provide us with competitive advantages or distinguish our products and services from those of our competitors or that our competitors will not independently develop similar technology. In addition, we regularly contribute source code under open source licenses and have made some of our own software available under open source licenses, and we include third‑party open source software in our products. Because the source code for any software we contribute to open source projects or distribute under open source licenses is publicly available, our ability to protect our intellectual property rights with respect to such source code may be limited or lost entirely. In addition, from time to time, we may face claims from third parties claiming ownership of, or demanding release of, the software or derivative works that we have developed using third‑party open source software, which could include our proprietary source code, or otherwise seeking to enforce the terms of the applicable open‑source license.
20
Unfavorable conditions in our industry or the global economy or reductions in information technology spending could limit our ability to grow our business and negatively affect our results of operations.
Our results of operations may vary based on the impact of changes in our industry or the global economy on us or our customers. The revenue growth and potential profitability of our business depend on demand for database software and services generally and for our subscription offering and related services in particular. Current or future economic uncertainties or downturns could adversely affect our business and results of operations. Negative conditions in the general economy both in the United States and abroad, including conditions resulting from changes in gross domestic product growth, financial and credit market fluctuations, political turmoil, natural catastrophes, warfare and terrorist attacks on the United States, Europe, the Asia Pacific region or elsewhere, could cause a decrease in business investments, including spending on information technology, and negatively affect the growth of our business. To the extent our database software is perceived by customers and potential customers as costly, or too difficult to deploy or migrate to, our revenue may be disproportionately affected by delays or reductions in general information technology spending. Also, competitors, many of whom are larger and more established than we are, may respond to market conditions by lowering prices and attempting to lure away our customers. In addition, the increased pace of consolidation in certain industries may result in reduced overall spending on our subscription offerings and related services. We cannot predict the timing, strength or duration of any economic slowdown, instability or recovery, generally or within any particular industry. If the economic conditions of the general economy or markets in which we operate worsen from present levels, our business, results of operations and financial condition could be adversely affected.
If we are unable to maintain successful relationships with our partners, our business, results of operations and financial condition could be harmed.
In addition to our direct sales force and our website, we use strategic partners, such as global system integrators, value‑added resellers and independent software vendors to sell our subscription offerings and related services. Our agreements with our partners are generally nonexclusive, meaning our partners may offer their customers products and services of several different companies, including products and services that compete with ours, or may themselves be or become competitors. If our partners do not effectively market and sell our subscription offerings and related services, choose to use greater efforts to market and sell their own products and services or those of our competitors, or fail to meet the needs of our customers, our ability to grow our business and sell our subscription offerings and related services may be harmed. Our partners may cease marketing our subscription offerings or related services with limited or no notice and with little or no penalty. The loss of a substantial number of our partners, our possible inability to replace them, or the failure to recruit additional partners could harm our growth objectives and results of operations.
We rely upon third‑party cloud providers to host our cloud offering; any disruption of or interference with our use of third‑party cloud providers would adversely affect our business, results of operations and financial condition.
We outsource substantially all of the infrastructure relating to MongoDB Atlas across AWS, Microsoft Azure and GCP to host our cloud offering. Customers of MongoDB Atlas need to be able to access our platform at any time, without interruption or degradation of performance, and we provide them with service level commitments with respect to uptime. Third‑party cloud providers run their own platforms that we access, and we are, therefore, vulnerable to their service interruptions. We may experience interruptions, delays and outages in service and availability from time to time as a result of problems with our third‑party cloud providers’ infrastructure. Lack of availability of this infrastructure could be due to a number of potential causes including technical failures, natural disasters, fraud or security attacks that we cannot predict or prevent. Such outages could lead to the triggering of our service level agreements and the issuance of credits to our cloud offering customers, which may impact our business, results of operations and financial condition. In addition, if our security, or that of any of these third‑party cloud providers, is compromised, our software is unavailable or our customers are unable to use our software within a reasonable amount of time or at all, then our business, results of operations and financial condition could be adversely affected. In some instances, we may not be able to identify the cause or causes of these performance problems within a period of time acceptable to our customers. It is possible that our customers and potential customers would hold us accountable for any breach of security affecting a third‑party cloud provider’s infrastructure and we may incur significant liability from those customers and from third parties with respect to any breach affecting these systems. We may not be able to recover a material portion of our liabilities to our customers and third parties from a third‑party cloud provider. It may also become increasingly difficult to maintain and improve our performance, especially during peak usage times, as our software becomes more complex and the usage of our software increases. Any of the above circumstances or events may harm our business, results of operations and financial condition.
21
Interruptions or performance problems associated with our technology and infrastructure may adversely affect our business, results of operations and financial condition.
Our continued growth depends in part on the ability of our existing customers and new customers to access our software at any time and within an acceptable amount of time. We may experience service disruptions, outages and other performance problems due to a variety of factors, including infrastructure changes or failures, human or software errors, malicious acts, terrorism or capacity constraints. Capacity constraints could be due to a number of potential causes including technical failures, natural disasters, fraud or security attacks. In some instances, we may not be able to identify and/or remedy the cause or causes of these performance problems within an acceptable period of time. It may become increasingly difficult to maintain and improve our performance as our software offerings and customer implementations become more complex. If our software is unavailable or if our customers are unable to access features of our software within a reasonable amount of time or at all, or if other performance problems occur, our business, results of operations and financial conditions may be adversely affected.
Incorrect or improper implementation or use of our software could result in customer dissatisfaction and harm our business, results of operations, financial condition and growth prospects.
Our database software and related services are designed to be deployed in a wide variety of technology environments, including in large‑scale, complex technology environments, and we believe our future success will depend at least, in part, on our ability to support such deployments. Implementations of our software may be technically complicated, and it may not be easy to maximize the value of our software without proper implementation and training. For example, since January 2017, industry publications have reported ransomware attacks on over 80,000 MongoDB instances. Almost all of these instances were launched by users with our Community Server offering rather than users of MongoDB Enterprise Advanced. We believe these attacks were due to the users’ failure to properly turn on the recommended security settings when running MongoDB. If our customers are unable to implement our software successfully, or in a timely manner, customer perceptions of our company and our software may be impaired, our reputation and brand may suffer, and customers may choose not to renew their subscriptions or increase their purchases of our related services.
Our customers and partners need regular training in the proper use of and the variety of benefits that can be derived from our software to maximize its potential. We often work with our customers to achieve successful implementations, particularly for large, complex deployments. Our failure to train customers on how to efficiently and effectively deploy and use our software, or our failure to provide effective support or professional services to our customers, whether actual or perceived, may result in negative publicity or legal actions against us. Also, as we continue to expand our customer base, any actual or perceived failure by us to properly provide these services will likely result in lost opportunities for follow‑on sales of our related services.
If we fail to meet our service level commitments, our business, results of operations and financial condition could be adversely affected.
Our agreements with customers typically provide for service level commitments. Our MongoDB Professional and MongoDB Enterprise Advanced customers typically get service level commitments with certain guaranteed response times and comprehensive 24x365 coverage. Our MongoDB Atlas customers typically get monthly uptime service level commitments, where we are required to provide a service credit for any extended periods of downtime. The complexity and quality of our customer’s implementation and the performance and availability of cloud services and cloud infrastructure are outside our control and, therefore, we are not in full control of whether we can meet these service level commitments. Our business, results of operations and financial condition could be adversely affected if we fail to meet our service level commitments for any reason. Any extended service outages could adversely affect our business, reputation and brand.
We rely on the performance of highly skilled personnel, including senior management and our engineering, professional services, sales and technology professionals; if we are unable to retain or motivate key personnel or hire, retain and motivate qualified personnel, our business would be harmed.
We believe our success has depended, and continues to depend, on the efforts and talents of our senior management team, particularly our Chief Executive Officer and Chief Technology Officer, and our highly skilled team members, including our sales personnel, client services personnel and software engineers. We do not maintain key man insurance on any of our executive officers or key employees. From time to time, there may be changes in our senior management team resulting from the termination or departure of our executive officers and key employees. The majority of our senior management and key employees are employed on an at‑will basis, which means that they could terminate their employment with us at any time. The loss of any of our senior management or key employees could adversely affect our ability to build on the efforts they
22
have undertaken and to execute our business plan, and we may not be able to find adequate replacements. We are currently in the process of replacing our Chief Revenue Officer and such a transition may take longer than we expect, disrupt our ongoing business, lead to increased attrition and divert our management’s attention, which may adversely impact our results of operations in the near term. We cannot ensure that we will be able to retain the services of any members of our senior management or other key employees.
Our ability to successfully pursue our growth strategy also depends on our ability to attract, motivate and retain our personnel. Competition for well‑qualified employees in all aspects of our business, including sales personnel, client services personnel and software engineers, is intense. Our recruiting efforts focus on elite organizations and our primary recruiting competition are well‑known, high‑paying technology companies. Our continued ability to compete effectively depends on our ability to attract new employees and to retain and motivate existing employees. If we do not succeed in attracting well‑qualified employees or retaining and motivating existing employees, our business would be adversely affected.
If we are not able to maintain and enhance our brand, especially among developers, our business and results of operations may be adversely affected.
We believe that developing and maintaining widespread awareness of our brand, especially with developers, in a cost‑effective manner is critical to achieving widespread acceptance of our software and attracting new customers. Brand promotion activities may not generate customer awareness or increase revenue, and even if they do, any increase in revenue may not offset the expenses we incur in building our brand. For instance, our continued focus and investment in MongoDB World, MongoDB University, and similar investments in our brand and customer engagement and education may not generate a sufficient financial return. If we fail to successfully promote and maintain our brand, or continue to incur substantial expenses, we may fail to attract or retain customers necessary to realize a sufficient return on our brand‑building efforts, or to achieve the widespread brand awareness that is critical for broad customer adoption of our platform.
Our corporate culture has contributed to our success, and if we cannot maintain this culture as we grow, we could lose the innovation, creativity and entrepreneurial spirit we have worked hard to foster, which could harm our business.
We believe that our culture has been and will continue to be a key contributor to our success. From January 31, 2015 to January 31, 2018, we increased the size of our workforce by 579 employees, and we expect to continue to hire aggressively as we expand, especially research and development and sales and marketing personnel. If we do not continue to maintain our corporate culture as we grow, we may be unable to foster the innovation, creativity, and entrepreneurial spirit we believe we need to support our growth. Moreover, once the lock-up period in connection with our initial public offering (“IPO”) expires in April 2018, many of our existing employees may be able to receive significant proceeds from sales of our Class A common stock in the public markets, which could lead to employee attrition and disparities of wealth among our employees that adversely affect relations among employees and our culture in general. Our substantial anticipated headcount growth and our transition from a private company to a public company may result in a change to our corporate culture, which could harm our business.
We depend and rely upon SaaS technologies from third parties to operate our business, and interruptions or performance problems with these technologies may adversely affect our business and results of operations.
We rely on hosted SaaS applications from third parties in order to operate critical functions of our business, including enterprise resource planning, order management, contract management billing, project management, and accounting and other operational activities. If these services become unavailable due to extended outages, interruptions or because they are no longer available on commercially reasonable terms, our expenses could increase, our ability to manage finances could be interrupted and our processes for managing sales of our platform and supporting our customers could be impaired until equivalent services, if available, are identified, obtained and implemented, all of which could adversely affect our business.
We may be subject to intellectual property rights claims by third parties, which may be costly to defend, could require us to pay significant damages and could limit our ability to use certain technologies.
Companies in the software and technology industries, including some of our current and potential competitors, own large numbers of patents, copyrights, trademarks and trade secrets and frequently enter into litigation based on allegations of infringement or other violations of intellectual property rights. We have in the past and may in the future be subject to claims that we have misappropriated, misused or infringed the intellectual property rights of our competitors, non‑practicing entities or other third parties. This risk is exacerbated by the fact that our software incorporates third‑party open source software.
23
Any intellectual property claims, with or without merit, could be very time‑consuming and expensive and could divert our management’s attention and other resources. These claims could also subject us to significant liability for damages, potentially including treble damages if we are found to have willfully infringed patents or copyrights. These claims could also result in our having to stop using technology found to be in violation of a third party’s rights, some of which we have invested considerable effort and time to bring to market. We might be required to seek a license for the intellectual property, which may not be available on reasonable terms or at all. Even if a license is available, we could be required to pay significant royalties, which would increase our operating expenses. As a result, we may be required to develop alternative non‑infringing technology, which could require significant effort and expense. If we cannot license or develop technology for any aspect of our business that may ultimately be determined to infringe on the intellectual property rights of another party, we could be forced to limit or stop sales of subscriptions to our software and may be unable to compete effectively. Any of these results would adversely affect our business, results of operations and financial condition.
Indemnity provisions in various agreements potentially expose us to substantial liability for intellectual property infringement and other losses.
Our agreements with customers and other third parties may include indemnification provisions under which we agree to indemnify them for losses suffered or incurred as a result of claims of intellectual property infringement, damages caused by us to property or persons, or other liabilities relating to or arising from our software, services or other contractual obligations. Large indemnity payments could harm our business, results of operations and financial condition. Although we normally contractually limit our liability with respect to such indemnity obligations, we may still incur substantial liability related to them. Any dispute with a customer with respect to such obligations could have adverse effects on our relationship with that customer and other existing customers and new customers and harm our business and results of operations.
We recognize a majority of our revenue over the term of our customer contracts. Consequently, increases or decreases in new sales may not be immediately reflected in our results of operations and may be difficult to discern.
We currently recognize subscription revenue from subscription customers ratably over the terms of their contracts. The majority of our subscription contracts were one year in duration in fiscal year 2018. As a result, a portion of the revenue we report in each quarter is derived from the recognition of deferred revenue relating to subscriptions entered into during previous quarters. Consequently, a decline in new or renewed subscriptions in any single quarter may have a small impact on the revenue that we recognize for that quarter. However, such a decline will negatively affect our revenue in future quarters. Accordingly, the effect of significant downturns in sales and potential changes in our pricing policies or rate of customer expansion or retention, may not be fully reflected in our results of operations until future periods. In addition, a significant majority of our costs are expensed as incurred, while revenue is recognized over the life of the subscription agreement. As a result, growth in the number of customers could continue to result in our recognition of higher costs and lower revenue in the earlier periods of our subscription agreements. Finally, our subscription‑based revenue model also makes it difficult for us to rapidly increase our revenue through additional sales in any period, as revenue from new customers and significant increases in the size of subscriptions with existing customers must be recognized over the applicable subscription term.
In May 2014, the Financial Accounting Standards Board (“FASB”) issued FASB Accounting Standards Updated (“ASU”) No. 2014‑09, Revenue from Contracts with Customers (Topic 606), which supersedes the revenue recognition requirements in Accounting Standards Codification 605, Revenue Recognition. We are evaluating ASU 2014-09 and have not determined the impact it may have on our financial reporting. However, upon adoption, we may be required to recognize revenue differently with respect to our subscriptions, which may cause variability in our reported operating results due to periodic or long-term changes in the mix among our subscription offerings. For further details, see the risk factor below titled “Our reported financial results may be adversely affected by changes in accounting principles generally accepted in the United States.”
Because our long‑term growth strategy involves further expansion of our sales to customers outside the United States, our business will be susceptible to risks associated with international operations.
A component of our growth strategy involves the further expansion of our operations and customer base internationally. In the fiscal years ended January 31, 2018, 2017 and 2016, total revenue generated from customers outside the United States was 36%, 35% and 31%, respectively, of our total revenue. We currently have international offices outside of North America throughout Europe, the Middle East and Africa (“EMEA”) and the Asia‑Pacific region, focusing primarily on selling our products and services in those regions. In the future, we may expand to other international locations. Our current international operations and future initiatives involve a variety of risks, including:
• | changes in a specific country’s or region’s political or economic conditions; |
24
• | the need to adapt and localize our products for specific countries; |
• | greater difficulty collecting accounts receivable and longer payment cycles; |
• | unexpected changes in laws, regulatory requirements, taxes or trade laws; |
• | more stringent regulations relating to privacy and data security and the unauthorized use of, or access to, commercial and personal information, particularly in EMEA; |
• | differing labor regulations, especially in EMEA, where labor laws are generally more advantageous to employees as compared to the United States, including deemed hourly wage and overtime regulations in these locations; |
• | challenges inherent in efficiently managing an increased number of employees over large geographic distances, including the need to implement appropriate systems, policies, benefits and compliance programs; |
• | difficulties in managing a business in new markets with diverse cultures, languages, customs, legal systems, alternative dispute systems and regulatory systems; |
• | increased travel, real estate, infrastructure and legal compliance costs associated with international operations; |
• | currency exchange rate fluctuations and the resulting effect on our revenue and expenses, and the cost and risk of entering into hedging transactions if we chose to do so in the future; |
• | limitations on our ability to reinvest earnings from operations in one country to fund the capital needs of our operations in other countries; |
• | laws and business practices favoring local competitors or general preferences for local vendors; |
• | limited or insufficient intellectual property protection or difficulties enforcing our intellectual property; |
• | political instability or terrorist activities; |
• | exposure to liabilities under anti‑corruption and anti‑money laundering laws, including the U.S. Foreign Corrupt Practices Act, U.K. Bribery Act and similar laws and regulations in other jurisdictions; and |
• | adverse tax burdens and foreign exchange controls that could make it difficult to repatriate earnings and cash. |
Our limited experience in operating our business internationally increases the risk that any potential future expansion efforts that we may undertake will not be successful. If we invest substantial time and resources to expand our international operations and are unable to do so successfully and in a timely manner, our business and results of operations will suffer.
If currency exchange rates fluctuate substantially in the future, our financial results, which are reported in U.S. dollars, could be adversely affected.
As we continue to expand our international operations, we become more exposed to the effects of fluctuations in currency exchange rates. Often, contracts executed by our foreign operations are denominated in the currency of that country or region and a portion of our revenue is therefore subject to foreign currency risks. However, a strengthening of the U.S. dollar could increase the real cost of our subscription offerings and related services to our customers outside of the United States, adversely affecting our business, results of operations and financial condition. We incur expenses for employee compensation and other operating expenses at our non‑U.S. locations in the local currency. Fluctuations in the exchange rates between the U.S. dollar and other currencies could result in the dollar equivalent of such expenses being higher. This could have a negative impact on our reported results of operations. To date, we have not engaged in any hedging strategies, and any such strategies, such as forward contracts, options and foreign exchange swaps related to transaction exposures that we may implement in the future to mitigate this risk may not eliminate our exposure to foreign exchange fluctuations. Moreover, the use of hedging instruments may introduce additional risks if we are unable to structure effective hedges with such instruments.
25
Changes in laws and regulations related to the internet or changes in the internet infrastructure itself may diminish the demand for our software, and could have a negative impact on our business.
The future success of our business, and particularly our cloud offerings, such as MongoDB Atlas, depends upon the continued use of the internet as a primary medium for commerce, communication and business applications. Federal, state or foreign government bodies or agencies have in the past adopted, and may in the future adopt, laws or regulations affecting the use of the internet as a commercial medium. Changes in these laws or regulations could require us to modify our software in order to comply with these changes. In addition, government agencies or private organizations may begin to impose taxes, fees or other charges for accessing the internet or commerce conducted via the internet. These laws or charges could limit the growth of internet‑related commerce or communications generally, resulting in reductions in the demand for internet‑based solutions such as ours.
In addition, the use of the internet as a business tool could be adversely affected due to delays in the development or adoption of new standards and protocols to handle increased demands of internet activity, security, reliability, cost, ease of use, accessibility, and quality of service. The performance of the internet and its acceptance as a business tool have been adversely affected by “ransomware,” “viruses,” “worms,” “malware,” “phishing attacks,” “data breaches” and similar malicious programs, behavior, and events, and the internet has experienced a variety of outages and other delays as a result of damage to portions of its infrastructure. If the use of the internet is adversely affected by these issues, demand for our subscription offerings and related services could suffer.
Our corporate structure and intercompany arrangements are subject to the tax laws of various jurisdictions, and we could be obligated to pay additional taxes, which would harm our results of operations.
Based on our current corporate structure, we may be subject to taxation in several jurisdictions around the world with increasingly complex tax laws, the application of which can be uncertain. The amount of taxes we pay in these jurisdictions could increase substantially as a result of changes in the applicable tax principles, including increased tax rates, new tax laws or revised interpretations of existing tax laws and precedents. The authorities in these jurisdictions could review our tax returns or require us to file tax returns in jurisdictions in which we are not currently filing, and could impose additional tax, interest and penalties. In addition, the authorities could claim that various withholding requirements apply to us or our subsidiaries, assert that benefits of tax treaties are not available to us or our subsidiaries, or challenge our methodologies for valuing developed technology or intercompany arrangements, including our transfer pricing. The relevant taxing authorities may determine that the manner in which we operate our business does not achieve the intended tax consequences. If such a disagreement was to occur, and our position was not sustained, we could be required to pay additional taxes, and interest and penalties. Such authorities could claim that various withholding requirements apply to us or our subsidiaries or assert that benefits of tax treaties are not available to us or our subsidiaries. Any increase in the amount of taxes we pay or that are imposed on us could increase our worldwide effective tax rate and harm our business and results of operations.
We may acquire or invest in companies, which may divert our management’s attention and result in additional dilution to our stockholders. We may be unable to integrate acquired businesses and technologies successfully or achieve the expected benefits of such acquisitions.
Our success will depend, in part, on our ability to grow our business in response to changing technologies, customer demands and competitive pressures. In some circumstances, we may choose to do so through the acquisition of businesses and technologies rather than through internal development. The identification of suitable acquisition candidates can be difficult, time‑consuming and costly, and we may not be able to successfully complete identified acquisitions. The risks we face in connection with acquisitions include:
• | an acquisition may negatively affect our results of operations because it may require us to incur charges or assume substantial debt or other liabilities, may cause adverse tax consequences or unfavorable accounting treatment, may expose us to claims and disputes by stockholders and third parties, including intellectual property claims and disputes, or may not generate sufficient financial return to offset additional costs and expenses related to the acquisition; |
• | we may encounter difficulties or unforeseen expenditures in integrating the business, technologies, products, personnel or operations of any company that we acquire, particularly if key personnel of the acquired company decide not to work for us; |
• | we may not be able to realize anticipated synergies; |
26
• | an acquisition may disrupt our ongoing business, divert resources, increase our expenses and distract our management; |
• | an acquisition may result in a delay or reduction of customer purchases for both us and the company acquired due to customer uncertainty about continuity and effectiveness of service from either company; |
• | we may encounter challenges integrating the employees of the acquired company into our company culture; |
• | we may encounter difficulties in, or may be unable to, successfully sell any acquired products; |
• | our use of cash to pay for acquisitions would limit other potential uses for our cash; |
• | if we incur debt to fund any acquisitions, such debt may subject us to material restrictions on our ability to conduct our business, including financial maintenance covenants; and |
• | if we issue a significant amount of equity securities in connection with future acquisitions, existing stockholders may be diluted and earnings per share may decrease. |
The occurrence of any of these risks could have an adverse effect on our business, results of operations and financial condition.
We are an “emerging growth company,” and our election to comply with the reduced disclosure requirements as a public company may make our Class A common stock less attractive to investors.
For so long as we remain an “emerging growth company,” as defined in the Jumpstart Our Business Startups Act of 2012 (the “JOBS Act”), we may take advantage of certain exemptions from various requirements that are applicable to public companies that are not “emerging growth companies,” including not being required to comply with the independent auditor attestation requirements of Section 404 of the Sarbanes‑Oxley Act of 2002 (the “Sarbanes‑Oxley Act”), reduced disclosure obligations regarding executive compensation in our periodic reports and proxy statements, being required to provide fewer years of audited financial statements, and exemptions from the requirements of holding a non‑binding advisory vote on executive compensation and stockholder approval of any golden parachute payments not previously approved. We will remain an “emerging growth company” until the earlier to occur of (1) the last day of the fiscal year (a) following October 23, 2022, (b) in which our annual gross revenue is $1.07 billion or more, or (c) in which we are deemed to be a “large accelerated filer” as defined in the Exchange Act, and (2) the date on which we have, during the previous rolling three‑year period, issued more than $1 billion in non‑convertible debt securities. In addition, the JOBS Act also provides that an “emerging growth company” can take advantage of an extended transition period for complying with new or revised accounting standards. We have chosen to take advantage of such extended transition period, and as a result, we will not comply with new or revised accounting standards on the relevant dates on which adoption of such standards is required for non‑emerging growth companies.
We cannot predict if investors will find our Class A common stock less attractive because we may rely on these exemptions. If some investors find our Class A common stock less attractive as a result, there may be a less active trading market for our Class A common stock, and our stock price may be more volatile and may decline.
Failure to comply with anti‑bribery, anti‑corruption, and anti‑money laundering laws could subject us to penalties and other adverse consequences.
We are subject to the U.S. Foreign Corrupt Practices Act of 1977, as amended (the “FCPA”), the U.S. Travel Act, the U.K. Bribery Act (the “Bribery Act”), and other anti‑corruption, anti‑bribery and anti‑money laundering laws in various jurisdictions around the world. The FCPA, Bribery Act, and similar applicable laws generally prohibit companies, their officers, directors, employees and third‑party intermediaries, business partners, and agents from making improper payments or providing other improper things of value to government officials or other persons. We and our third‑party intermediaries may have direct or indirect interactions with officials and employees of government agencies or state‑owned or affiliated entities and other third parties where we may be held liable for the corrupt or other illegal activities of these third‑party business partners and intermediaries, our employees, representatives, contractors, resellers, and agents, even if we do not explicitly authorize such activities. While we have policies and procedures and internal controls to address compliance with such laws, we cannot assure you that all of our employees and agents will not take actions in violation of our policies and applicable law, for which we may be ultimately held responsible. To the extent that we learn that any of our employees, third‑party intermediaries, agents, or business partners do not adhere to our policies, procedures, or internal controls, we are committed to taking appropriate remedial action. In the event that we believe or have reason to believe that our directors,
27
officers, employees, third‑party intermediaries, agents, or business partners have or may have violated such laws, we may be required to investigate or have outside counsel investigate the relevant facts and circumstances. Detecting, investigating and resolving actual or alleged violations can be extensive and require a significant diversion of time, resources, and attention from senior management. Any violation of the FCPA, Bribery Act, or other applicable anti‑bribery, anti‑corruption laws, and anti‑money laundering laws could result in whistleblower complaints, adverse media coverage, investigations, loss of export privileges, severe criminal or civil sanctions, fines, and penalties or suspension or debarment from U.S. government contracts, all of which may have a material adverse effect on our reputation, business, operating results and prospects, and financial condition.
Our reported financial results may be adversely affected by changes in accounting principles generally accepted in the United States.
Generally accepted accounting principles in the United States (“GAAP”), are subject to interpretation by the FASB, the SEC, and various bodies formed to promulgate and interpret appropriate accounting principles. A change in these principles or interpretations could have a significant effect on our reported financial results, and could affect the reporting of transactions completed before the announcement of a change.
In particular, in May 2014, the FASB issued FASB ASU No. 2014‑09, Revenue from Contracts with Customers (Topic 606), which supersedes the revenue recognition requirements in ASC 605, Revenue Recognition. The core principle of ASU 2014‑09 is that an entity should recognize revenue to depict the transfer of promised goods or services to customers in an amount that reflects the consideration to which the entity expects to be entitled in exchange for those goods or services. As an “emerging growth company” the JOBS Act allows us to delay adoption of new or revised accounting pronouncements applicable to public companies until such pronouncements are made applicable to private companies. We have elected to use this extended transition period under the JOBS Act with respect to ASU 2014‑09. If we lose our “emerging growth company” status this year, we could be required to adopt the new revenue standard for our fiscal year ending January 31, 2019. If we remain an “emerging growth company,” we will be required to adopt the new standard no later than the fiscal year ending January 31, 2020, though early adoption is permitted.
While we continue to assess the potential impacts of the new revenue standard, we currently expect unearned subscription revenue to decline significantly upon adoption. Currently, as our subscription offerings include software term licenses and post-contract customer support for which we have not established vendor specific objective evidence (“VSOE”), the entire subscription fee is recognized ratably over the term of the contract. However, under the new revenue standard, the requirement for VSOE for undelivered elements is eliminated and, as a result, we will be required to identify all deliverables in a contract and recognize revenue based on each deliverable separately. We currently expect that the portion related to the software term license deliverable will be recognized upon delivery. We are in the process of determining the revenue recognition impact for the other deliverables of each contract. We continue to evaluate the effect that the new revenue standard will have on our consolidated financial statements and related disclosures, and preliminary assessments are subject to change.
If our estimates or judgments relating to our critical accounting policies prove to be incorrect, our results of operations could be adversely affected.
The preparation of financial statements in conformity with GAAP requires management to make estimates and assumptions that affect the amounts reported in the consolidated financial statements and accompanying notes. We base our estimates on historical experience and on various other assumptions that we believe to be reasonable under the circumstances, as described in Note 2 to the Notes to Consolidated Financial Statements included in Part II, Item 8, Financial Statements, of this Form 10-K. The results of these estimates form the basis for making judgments about the carrying values of assets, liabilities and equity, and the amount of revenue and expenses that are not readily apparent from other sources. Significant assumptions and estimates used in preparing our Consolidated Financial Statements include those related to revenue recognition, allowances for doubtful accounts, fair value of stock‑based awards, fair value of redeemable convertible preferred stock warrants prior to our IPO, legal contingencies, fair value of acquired intangible assets and goodwill, useful lives of acquired intangible assets and property and equipment, and accounting for income taxes. Our results of operations may be adversely affected if our assumptions change or if actual circumstances differ from those in our assumptions, which could cause our results of operations to fall below the expectations of securities analysts and investors, resulting in a decline in the trading price of our Class A common stock.
28
If we fail to maintain an effective system of disclosure controls and internal control over financial reporting, our ability to produce timely and accurate financial statements or comply with applicable regulations could be impaired.
As a public company, we are subject to the reporting requirements of the Exchange Act, the Sarbanes‑Oxley Act, and the rules and regulations of the applicable listing standards of the Nasdaq. We expect that the requirements of these rules and regulations will continue to increase our legal, accounting and financial compliance costs, make some activities more difficult, time‑consuming and costly, and place significant strain on our personnel, systems and resources.
The Sarbanes‑Oxley Act requires, among other things, that we maintain effective disclosure controls and procedures and internal control over financial reporting. We are continuing to develop and refine our disclosure controls and other procedures that are designed to ensure that information required to be disclosed by us in the reports that we will file with the SEC is recorded, processed, summarized and reported within the time periods specified in SEC rules and forms and that information required to be disclosed in reports under the Exchange Act is accumulated and communicated to our principal executive and financial officers. We are also continuing to improve our internal control over financial reporting. In order to maintain and improve the effectiveness of our disclosure controls and procedures and internal control over financial reporting, we have expended, and anticipate that we will continue to expend, significant resources, including accounting‑related costs and significant management oversight.
Our current controls and any new controls that we develop may become inadequate because of changes in conditions in our business. Further, weaknesses in our disclosure controls and internal control over financial reporting may be discovered in the future. Any failure to develop or maintain effective controls or any difficulties encountered in their implementation or improvement could harm our results of operations or cause us to fail to meet our reporting obligations and may result in a restatement of our financial statements for prior periods. Any failure to implement and maintain effective internal control over financial reporting also could adversely affect the results of periodic management evaluations and annual independent registered public accounting firm attestation reports regarding the effectiveness of our internal control over financial reporting that we will eventually be required to include in our periodic reports that will be filed with the SEC. Ineffective disclosure controls and procedures and internal control over financial reporting could also cause investors to lose confidence in our reported financial and other information, which would likely have a negative effect on the trading price of our Class A common stock. In addition, if we are unable to continue to meet these requirements, we may not be able to remain listed on the Nasdaq. We are not currently required to comply with the SEC rules that implement Section 404 of the Sarbanes‑Oxley Act and are therefore not required to make a formal assessment of the effectiveness of our internal control over financial reporting for that purpose. As a public company, we will be required to provide an annual management report on the effectiveness of our internal control over financial reporting commencing with our second annual report on Form 10‑K.
Our independent registered public accounting firm is not required to formally attest to the effectiveness of our internal control over financial reporting until after we are no longer an “emerging growth company” as defined in the JOBS Act. At such time, our independent registered public accounting firm may issue a report that is adverse in the event it is not satisfied with the level at which our internal control over financial reporting is documented, designed or operating. Any failure to maintain effective disclosure controls and internal control over financial reporting could have an adverse effect on our business and results of operations and could cause a decline in the price of our Class A common stock.
We may require additional capital to support our operations or the growth of our business, and we cannot be certain that this capital will be available on reasonable terms when required, or at all.
We intend to continue to make investments to support our business growth and may require additional funds to respond to business challenges, including the need to develop new features or otherwise enhance our database software, improve our operating infrastructure or acquire businesses and technologies. Accordingly, we may need to secure additional capital through equity or debt financings. If we raise additional capital, our existing stockholders could suffer significant dilution, and any new equity securities we issue could have rights, preferences and privileges superior to those of holders of our Class A common stock and Class B common stock. Any debt financing that we may secure in the future could involve restrictive covenants relating to our capital raising activities and other financial and operational matters, which may make it more difficult for us to obtain additional capital and to pursue business opportunities, including potential acquisitions. We may not be able to obtain additional financing on terms that are favorable to us, if at all. If we are unable to obtain adequate financing or financing on terms that are satisfactory to us when we require it, our ability to continue to support our business growth and to respond to business challenges could be significantly impaired, and our business may be harmed.
29
We are a multinational organization faced with increasingly complex tax issues in many jurisdictions, and we could be obligated to pay additional taxes in various jurisdictions.
As a multinational organization, we may be subject to taxation in several jurisdictions around the world with increasingly complex tax laws, the amount of taxes we pay in these jurisdictions could increase substantially as a result of changes in the applicable tax principles, including increased tax rates, new tax laws or revised interpretations of existing tax laws and precedents, which could have a material adverse effect on our liquidity and operating results. In addition, the authorities in these jurisdictions could review our tax returns and impose additional tax, interest and penalties, and the authorities could claim that various withholding requirements apply to us or our subsidiaries or assert that benefits of tax treaties are not available to us or our subsidiaries, any of which could have a material impact on us and the results of our operations.
The enactment of legislation implementing changes in U.S. taxation of international business activities or the adoption of other tax reform policies could materially impact our financial position and results of operations.
Changes to U.S. tax laws, including limitations on the ability of taxpayers to claim and utilize foreign tax credits and the deferral of certain tax deductions until earnings outside of the United States are repatriated to the United States, as well as changes to U.S. tax laws that may be enacted in the future, could impact the tax treatment of our foreign earnings. Due to expansion of our international business activities, any changes in the U.S. taxation of such activities may increase our worldwide effective tax rate and adversely affect our financial position and results of operations.
In addition, potential tax reform in the United States may result in significant changes to U.S. federal income taxation law, including changes to the U.S. federal income taxation of corporations (including the Company) and/or changes to the U.S. federal income taxation of stockholders in U.S. corporations, including investors in our Class A common stock. We are currently unable to predict whether such changes will occur and, if so, the impact of such changes, including on the U.S. federal income tax considerations relating to the purchase, ownership and disposition of our Class A common stock.
For example, the Tax Cuts and Jobs Act of 2017 (the “Tax Act”) was enacted on December 22, 2017 and significantly reformed the Internal Revenue Code of 1986, as amended (the “Code”). The Tax Act contains significant changes to corporate taxation, including reduction of the corporate tax rate from 35% to 21%, limitation of the tax deduction for interest expense to 30% of earnings, limitation of the deduction for net operating losses to 80% of current year taxable income and elimination of net operating loss (“NOL”) carrybacks, one time taxation of offshore earnings at reduced rates regardless of whether they are repatriated, elimination of U.S. tax on foreign earnings (subject to certain important exceptions), immediate deductions for certain new investments instead of deductions for depreciation expense over time, and modifying or repealing many business deductions and credits. Given the significant complexity of the Tax Act, anticipated guidance from the Internal Revenue Service about implementing the Tax Act, and the potential for additional guidance from the SEC or the FASB related to the Tax Act, the overall impact of the Tax Act on us is uncertain, and our business and financial condition could be adversely affected.
Our ability to use our net operating losses to offset future taxable income may be subject to certain limitations.
As of January 31, 2018, we had NOL carryforwards for federal, state and Irish income tax purposes of approximately $209.5 million, $166.5 million and $182.3 million, respectively, which may be available to offset taxable income in the future, and which expire in various years beginning in the year ending January 31, 2028 for federal purposes and the year ending January 31, 2021 for state purposes if not utilized. Ireland allows NOLs to be carried forward indefinitely. A lack of future taxable income would adversely affect our ability to utilize these NOLs before they expire. In general, under Section 382 of the Code, a corporation that undergoes an “ownership change” (as defined under Section 382 of the Code and applicable Treasury Regulations) is subject to limitations on its ability to utilize its pre‑change NOLs to offset future taxable income. We may experience a future ownership change under Section 382 of the Code that could affect our ability to utilize the NOLs to offset our income. Furthermore, our ability to utilize NOLs of companies that we have acquired or may acquire in the future may be subject to limitations. There is also a risk that due to regulatory changes, such as suspensions on the use of NOLs or other unforeseen reasons, our existing NOLs could expire or otherwise be unavailable to reduce future income tax liabilities, including for state tax purposes. For example, the Tax Act included changes to the uses and limitations of NOLs. While the Tax Act allows for federal NOLs incurred in tax years beginning prior to December 31, 2017 to be carried forward indefinitely, the Tax Act also imposes an 80% limitation on the use of federal NOLs that are generated in tax years beginning after December 31, 2017.
30
For these reasons, we may not be able to utilize a material portion of the NOLs reflected on our balance sheet, even if we attain profitability, which could potentially result in increased future tax liability to us and could adversely affect our results of operations and financial condition.
Taxing authorities may successfully assert that we should have collected or in the future should collect sales and use, value added or similar taxes, and we could be subject to liability with respect to past or future sales, which could adversely affect our results of operations.
We do not collect sales and use, value added or similar taxes in all jurisdictions in which we have sales, and we have been advised that such taxes are not applicable to our products and services in certain jurisdictions. Sales and use, value added and similar tax laws and rates vary greatly by jurisdiction. Certain jurisdictions in which we do not collect such taxes may assert that such taxes are applicable, which could result in tax assessments, penalties and interest, to us or our end‑customers for the past amounts, and we may be required to collect such taxes in the future. If we are unsuccessful in collecting such taxes from our end‑customers, we could be held liable for such costs. Such tax assessments, penalties and interest, or future requirements may adversely affect our results of operations.
We are subject to governmental export and import controls that could impair our ability to compete in international markets or subject us to liability if we violate the controls.
Our offerings are subject to United States export controls, and we incorporate encryption technology into certain of our offerings. These encryption offerings and the underlying technology may be exported outside of the United States only with the required export authorizations, including by license.
Furthermore, our activities are subject to the U.S. economic sanctions laws and regulations that prohibit the shipment of certain products and services without the required export authorizations or export to countries, governments, and persons targeted by U.S. sanctions. While we take precautions to prevent our offerings from being exported in violation of these laws, including obtaining authorizations for our encryption offerings, implementing IP address blocking and screenings against U.S. Government and international lists of restricted and prohibited persons, we cannot guarantee that the precautions we take will prevent violations of export control and sanctions laws.
We also note that if our channel partners fail to obtain appropriate import, export or re‑export licenses or permits, we may also be adversely affected, through reputational harm as well as other negative consequences including government investigations and penalties. We presently incorporate export control compliance requirements in our channel partner agreements. Complying with export control and sanctions regulations for a particular sale may be time‑consuming and may result in the delay or loss of sales opportunities.
If we fail to comply with U.S. sanctions and export control laws and regulations, we and certain of our employees could be subject to substantial civil or criminal penalties, including the possible loss of export or import privileges, fines, which may be imposed on us and responsible employees or managers and, in extreme cases, the incarceration of responsible employees or managers.
Also, various countries, in addition to the United States, regulate the import and export of certain encryption and other technology, including import and export permitting and licensing requirements, and have enacted laws that could limit our ability to distribute our offerings or could limit our customers’ ability to implement our offerings in those countries. Changes in our offerings or future changes in export and import regulations may create delays in the introduction of our offerings in international markets, prevent our customers with international operations from deploying our offerings globally or, in some cases, prevent the export or import of our offerings to certain countries, governments, or persons altogether. Any change in export or import regulations, economic sanctions or related legislation, or change in the countries, governments, persons or technologies targeted by such regulations, could result in decreased use of our offerings by, or in our decreased ability to export or sell our offerings to, existing or potential customers with international operations. Any decreased use of our offerings or limitation on our ability to export or sell our offerings would likely adversely affect our business operations and financial results.
Our business is subject to the risks of earthquakes, fire, floods and other natural catastrophic events, and to interruption by man‑made problems such as power disruptions, computer viruses, data security breaches or terrorism.
Our corporate headquarters is located in New York City, and we have an office in Palo Alto, California and in 32 other locations. A significant natural disaster or man‑made problem, such as an earthquake, fire, flood or an act of terrorism, occurring in any of these locations, or where a business partner is located, could adversely affect our business, results of
31
operations and financial condition. Further, if a natural disaster or man‑made problem were to affect datacenters used by our cloud infrastructure service providers this could adversely affect the ability of our customers to use our products. In addition, natural disasters and acts of terrorism could cause disruptions in our or our customers’ businesses, national economies or the world economy as a whole. In the event of a major disruption caused by a natural disaster or man‑made problem, we may be unable to continue our operations and may endure system interruptions, reputational harm, delays in our development activities, lengthy interruptions in service, breaches of data security and loss of critical data, any of which could adversely affect our business, results of operations and financial condition.
In addition, as computer malware, viruses and computer hacking, fraudulent use attempts and phishing attacks have become more prevalent, we face increased risk from these activities to maintain the performance, reliability, security and availability of our subscription offerings and related services and technical infrastructure to the satisfaction of our customers, which may harm our reputation and our ability to retain existing customers and attract new customers.
Risks Related to Ownership of Our Class A Common Stock
The dual class structure of our common stock has the effect of concentrating voting control with those stockholders who held our capital stock prior to the completion of our IPO, including our executive officers, employees and directors and their affiliates, which will limit your ability to influence the outcome of important transactions, including a change in control.
Our Class B common stock has 10 votes per share, and our Class A common stock has one vote per share. As a result, as of January 31, 2018, holders of our Class B common stock represented approximately 97% of the voting power of our outstanding capital stock and our directors, executive officers, and each of their affiliated entities, represented approximately 56% of the voting power of our outstanding capital stock. This concentrated control will limit the ability of holders of our Class A common stock to influence corporate matters for the foreseeable future. For example, holders of our Class B common stock will be able to control all matters submitted to our stockholders for approval even when the shares of Class B common stock represent a small minority of all outstanding shares of our Class A common stock and Class B common stock, including amendments of our amended and restated certificate of incorporation or amended and restated bylaws, increases to the number of shares available for issuance under our equity incentive plans or adoption of new equity incentive plans and approval of any merger or sale of assets for the foreseeable future. Holders of our Class B common stock may also have interests that differ from the interests of holders of our Class A common stock and may vote in a way with which holders of our Class A common stock may disagree and which may be adverse to such holders’ interests. This concentrated control may have the effect of delaying, preventing or deterring a change in control of our company, could deprive our stockholders of an opportunity to receive a premium for their capital stock as part of a sale of our company and might ultimately affect the market price of our Class A common stock.
Future transfers by holders of our Class B common stock will generally result in those shares converting into shares of our Class A common stock, subject to limited exceptions, such as certain transfers effected for tax or estate planning purposes. The conversion of shares of our Class B common stock into shares of our Class A common stock will have the effect, over time, of increasing the relative voting power of those holders of Class B common stock who retain their shares in the long term. For example, as of January 31, 2018, Kevin P. Ryan, Eliot Horowitz and Dwight Merriman represented approximately 20% of the voting power of our outstanding capital stock, and if they retain a significant portion of their holdings of our Class B common stock for an extended period of time, they could control a significant portion of the voting power of our capital stock for the foreseeable future. As board members, Messrs. Ryan and Horowitz each owe a fiduciary duty to our stockholders and must act in good faith and in a manner they each reasonably believe to be in the best interests of our stockholders. As stockholders, Messrs. Ryan, Horowitz and Merriman are entitled to vote their shares in their own interests, which may not always be in the interests of our stockholders generally.
We cannot predict the impact our dual class structure may have on our stock price or our business.
We cannot predict whether our dual class structure, combined with the concentrated control of our stockholders who held our capital stock prior to the completion of our IPO, including our executive officers, employees and directors and their affiliates, will result in a lower or more volatile market price of our Class A common stock or in adverse publicity or other adverse consequences. For example, certain index providers have announced restrictions on including companies with multiple‑class share structures in certain of their indexes. In July 2017, FTSE Russell announced that it plans to require new constituents of its indexes to have greater than 5% of the company’s voting rights in the hands of public stockholders, and S&P Dow Jones announced that it will no longer admit companies with multiple‑class share structures to certain of its indexes. Because of our dual class structure, we will likely be excluded from these indexes and we cannot assure you that other stock indexes will not take similar actions. Given the sustained flow of investment funds into passive strategies that
32
seek to track certain indexes, exclusion from stock indexes would likely preclude investment by many of these funds and could make our Class A common stock less attractive to other investors. As a result, the market price of our Class A common stock could be adversely affected.
The trading price of our Class A common stock has been and is likely to continue to be volatile, which could cause the value of our Class A common stock to decline.
Technology stocks have historically experienced high levels of volatility. The trading price of our Class A common has been and is likely to continue to be volatile. Factors that could cause fluctuations in the trading price of our Class A common stock include the following:
• | announcements of new products or technologies, commercial relationships, acquisitions or other events by us or our competitors; |
• | changes in how customers perceive the benefits of our product and future product offerings and releases; |
• | departures of key personnel; |
• | price and volume fluctuations in the overall stock market from time to time; |
• | fluctuations in the trading volume of our shares or the size of our public float; |
• | sales of large blocks of our Class A common stock; |
• | actual or anticipated changes or fluctuations in our results of operations; |
• | whether our results of operations meet the expectations of securities analysts or investors; |
• | changes in actual or future expectations of investors or securities analysts; |
• | significant data breach involving our software; |
• | litigation involving us, our industry, or both; |
• | regulatory developments in the United States, foreign countries or both; |
• | general economic conditions and trends; |
• | major catastrophic events in our domestic and foreign markets; and |
• | “flash crashes,” “freeze flashes” or other glitches that disrupt trading on the securities exchange on which we are listed. |
In addition, if the market for technology stocks or the stock market in general experiences a loss of investor confidence, the trading price of our Class A common stock could decline for reasons unrelated to our business, results of operations or financial condition. The trading price of our Class A common stock might also decline in reaction to events that affect other companies in our industry even if these events do not directly affect us. In the past, following periods of volatility in the trading price of a company’s securities, securities class action litigation has often been brought against that company. If our stock price is volatile, we may become the target of securities litigation. Securities litigation could result in substantial costs and divert our management’s attention and resources from our business. This could have an adverse effect on our business, results of operations and financial condition.
If securities analysts or industry analysts were to downgrade our stock, publish negative research or reports or fail to publish reports about our business, our competitive position could suffer, and our stock price and trading volume could decline.
The trading market for our Class A common stock will, to some extent, depend on the research and reports that securities or industry analysts publish about us or our business. We do not have any control over these analysts. If one or more of the analysts who cover us should downgrade our stock or publish negative research or reports, cease coverage of our company or fail to regularly publish reports about our business, our competitive position could suffer, and our stock price and trading volume could decline.
33
Sales of substantial amounts of our Class A common stock in the public markets, or the perception that such sales could occur, could reduce the price that our Class A common stock might otherwise attain.
Sales of a substantial number of shares of our Class A common stock in the public markets, or the perception that such sales could occur, could adversely affect the market price of our Class A common stock and may make it more difficult for you to sell your Class A common stock at a time and price that you deem appropriate.
We, our executive officers, directors and holders of a substantial majority of our common stock and securities convertible into or exchangeable for shares of our common stock are subject to lock‑up agreements or market standoff provisions that restrict our and their ability to transfer any shares or any securities convertible into or exchangeable for shares of our common stock for a period of 180 days from October 18, 2017. When the lock‑up period in the lock‑up agreements and market standoff provisions expires, we and our locked‑up security holders will be able to sell our shares in the public market. In addition, Morgan Stanley & Co. LLC, Goldman Sachs & Co. LLC and Barclays Capital Inc., on behalf of the underwriters, may release all or some portion of the shares subject to the lock‑up agreements or market standoff provisions prior to the expiration of the lock‑up period. Sales of a substantial number of such shares, or the perception that such sales may occur, upon expiration of, or early release of the securities subject to, the lock‑up agreements or market standoff agreements, could cause our stock price to fall or make it more difficult for you to sell your Class A common stock at a time and price that you deem appropriate.
As of January 31, 2018, there were an aggregate of 12,637,435 shares of our Class A common stock and Class B common stock subject to outstanding options and 245,746 shares of our Class A common stock subject to outstanding restricted stock units. We have registered all of the shares of Class A common stock issuable upon, and issuable upon conversion of the shares of Class B common stock issuable upon, exercise of outstanding options and the settlement of restricted stock units and upon exercise or settlement of any options, restricted stock units or other equity incentives we may grant in the future, for public resale under the Securities Act. Accordingly, these shares may be freely sold in the public market upon issuance as permitted by any applicable vesting requirements, subject to the lock-up agreements and market standoff provisions described above. In addition, certain holders of shares of our capital stock may require us, subject to certain conditions, to file a registration statement covering the sale of their shares or to include their shares in registration statements that we may file for ourselves or other stockholders. If we register the resale of these shares in the future, the holders could sell those shares freely in the public market, without regard to the limitations of Rule 144.
Our issuance of additional capital stock in connection with financings, acquisitions, investments, our equity incentive plans or otherwise will dilute all other stockholders.
We expect to issue additional capital stock in the future that will result in dilution to all other stockholders. We expect to grant equity awards to employees, directors and consultants under our equity incentive plans. We may also raise capital through equity financings in the future. As part of our business strategy, we may acquire or make investments in companies, products or technologies and issue equity securities to pay for any such acquisition or investment. Any such issuances of additional capital stock may cause stockholders to experience significant dilution of their ownership interests and the per share value of our Class A common stock to decline.
We do not intend to pay dividends on our Class A common stock for the foreseeable future.
We have never declared or paid any dividends on our capital stock. We intend to retain any earnings to finance the operation and expansion of our business, and we do not anticipate paying any dividends in the foreseeable future. As a result, investors in our Class A common stock may only receive a return if the market price of our Class A common stock increases.
We will incur increased costs as a result of operating as a public company, and our management will be required to devote substantial time to compliance with our public company responsibilities and corporate governance practices.
As a public company, and particularly after we are no longer an “emerging growth company,” we will incur significant legal, accounting and other expenses. The Sarbanes‑Oxley Act, the Dodd‑Frank Wall Street Reform and Consumer Protection Act, the listing requirements of the Nasdaq and other applicable securities rules and regulations impose various requirements on public companies. Our management and other personnel will need to devote a substantial amount of time to compliance with these requirements. Moreover, these rules and regulations will increase our legal and financial compliance costs and will make some activities more time‑consuming and costly. For example, we expect that these rules and regulations may make it more difficult and more expensive for us to obtain directors’ and officers’ liability insurance, which could make it more difficult for us to attract and retain qualified members of our Board of Directors. We cannot predict or estimate the amount of additional costs we will incur as a public company or the timing of such costs.
34
Our amended and restated certificate of incorporation provides that the Court of Chancery of the State of Delaware and the federal district courts of the United States of America will be the exclusive forums for substantially all disputes between us and our stockholders, which could limit our stockholders’ ability to obtain a favorable judicial forum for disputes with us or our directors, officers, or employees.
Our amended and restated certificate of incorporation provides that the Court of Chancery of the State of Delaware is the exclusive forum for:
• | any derivative action or proceeding brought on our behalf; |
• | any action asserting a breach of fiduciary duty; |
• | any action asserting a claim against us arising under the Delaware General Corporation Law, our amended and restated certificate of incorporation, or our amended and restated bylaws; and |
• | any action asserting a claim against us that is governed by the internal‑affairs doctrine. |
Our amended and restated certificate of incorporation further provides that the federal district courts of the United States of America will be the exclusive forum for resolving any complaint asserting a cause of action arising under the Securities Act.
These exclusive‑forum provisions may limit a stockholder’s ability to bring a claim in a judicial forum that it finds favorable for disputes with us or our directors, officers, or other employees, which may discourage lawsuits against us and our directors, officers, and other employees. If a court were to find either exclusive‑forum provision in our amended and restated certificate of incorporation to be inapplicable or unenforceable in an action, we may incur additional costs associated with resolving the dispute in other jurisdictions, which could seriously harm our business.
Delaware law and our corporate charter and bylaws contain anti‑takeover provisions that could delay or discourage takeover attempts that stockholders may consider favorable.
Our amended and restated certificate of incorporation and amended and restated bylaws contain provisions that could delay or prevent a change in control of our company. These provisions could also make it difficult for stockholders to elect directors who are not nominated by the current members of our Board of Directors or take other corporate actions, including effecting changes in our management. These provisions include:
• | a classified Board of Directors with three‑year staggered terms, which could delay the ability of stockholders to change the membership of a majority of our Board of Directors; |
• | the ability of our Board of Directors to issue shares of preferred stock and to determine the price and other terms of those shares, including preferences and voting rights, without stockholder approval, which could be used to significantly dilute the ownership of a hostile acquirer; |
• | the exclusive right of our Board of Directors to elect a director to fill a vacancy created by the expansion of our Board of Directors or the resignation, death or removal of a director, which prevents stockholders from being able to fill vacancies on our Board of Directors; |
• | a prohibition on stockholder action by written consent, which forces stockholder action to be taken at an annual or special meeting of our stockholders; |
• | the requirement that a special meeting of stockholders may be called only by our Board of Directors, the chairperson of our Board of Directors, our chief executive officer or our president (in the absence of a chief executive officer), which could delay the ability of our stockholders to force consideration of a proposal or to take action, including the removal of directors; |
• | the requirement for the affirmative vote of holders of a majority of the voting power of all of the then outstanding shares of the voting stock, voting together as a single class, to amend the provisions of our amended and restated certificate of incorporation relating to the management of our business (including our classified board structure) or certain provisions of our amended and restated bylaws, which may inhibit the ability of an acquirer to effect such amendments to facilitate an unsolicited takeover attempt; |
35
• | the ability of our Board of Directors to amend our bylaws, which may allow our Board of Directors to take additional actions to prevent an unsolicited takeover and inhibit the ability of an acquirer to amend our bylaws to facilitate an unsolicited takeover attempt; |
• | advance notice procedures with which stockholders must comply to nominate candidates to our Board of Directors or to propose matters to be acted upon at a stockholders’ meeting, which may discourage or deter a potential acquirer from conducting a solicitation of proxies to elect the acquirer’s own slate of directors or otherwise attempting to obtain control of us; and |
• | the authorization of two classes of common stock, as discussed above. |
In addition, as a Delaware corporation, we are subject to Section 203 of the Delaware General Corporation Law, which may prohibit large stockholders, in particular those owning 15% or more of our outstanding voting stock, from merging or combining with us for a specified period of time.
Item 1B. Unresolved Staff Comments
None.
Item 2. Properties
Our current principal executive office is located in New York, New York and consists of approximately 63,722 square feet of space under a lease that expires in December 2018. In December 2017, we entered into a lease agreement for 106,230 rentable square feet of office space (the “Premises”) to accommodate our growing employee base in New York City. The Premises were delivered to us on January 1, 2018. We expect to complete the renovations and vacate our current office space prior to the expiration of our existing lease.
We also lease space in Dublin, Ireland, our international headquarters, under a lease that expires in December 2026. We lease 32 other offices around the world for our employees, including in Palo Alto, Austin, London, Sydney and Gurgaon, India.
We lease all of our facilities and do not own any real property. We intend to procure additional space in the future as we continue to add employees and expand geographically. We believe our facilities are adequate and suitable for our current needs and that, should it be needed, suitable additional or alternative space will be available to accommodate our operations.
Item 3. Legal Proceedings
From time to time, we may be subject to legal proceedings and claims in the ordinary course of business. We are not presently a party to any legal proceedings that, if determined adversely to us, would individually or taken together have a material adverse effect on our business, results of operations, financial condition or cash flows. We have received, and may in the future continue to receive, claims from third parties asserting, among other things, infringement of their intellectual property rights. Future litigation may be necessary to defend ourselves, our partners and our customers by determining the scope, enforceability and validity of third-party proprietary rights, or to establish our proprietary rights. The results of any current or future litigation cannot be predicted with certainty, and regardless of the outcome, litigation can have an adverse impact on us because of defense and settlement costs, diversion of management resources, and other factors.
Item 4. Mine Safety Disclosures
Not applicable.
36
PART II
Item 5. Market for Registrant's Common Equity, Related Stockholder Matters and Issuer Purchases of Equity Securities
Market Information for Common Stock
Our Class A common stock began trading on The Nasdaq Global Market (the “Nasdaq”) under the symbol “MDB” on October 19, 2017. Prior to that date, there was no public trading market for our Class A common stock. Our Class B Common Stock is not listed or traded on any exchange, but each share of Class B common stock is convertible at any time at the option of the holder into one share of Class A common stock.
The following table sets forth for the indicated periods the high and low intra-day sales prices per share of our Class A common stock, as reported by the Nasdaq.
Fiscal Year 2018 Quarters Ended: | High | Low | |||||
October 31, 2017 (beginning October 19, 2017) | $ | 34.00 | $ | 29.10 | |||
January 31, 2018 | 31.11 | 24.62 | |||||
Holders of Record
As of March 26, 2018, there were 72 stockholders of record of our Class A common stock, and the closing price of our Class A common stock was $44.80 per share as reported on the Nasdaq. Because many of our shares of Class A common stock are held by brokers and other institutions on behalf of stockholders, we are unable to estimate the total number of stockholders represented by these record holders. As of March 26, 2018, there were 605 stockholders of record of our Class B common stock.
Dividend Policy
We have never declared or paid any dividends on our common stock. We currently intend to retain all available funds and any future earnings for the operation and expansion of our business. Accordingly, we do not anticipate declaring or paying dividends in the foreseeable future. The payment of any future dividends will be at the discretion of our Board of Directors and will depend on our results of operations, capital requirements, financial condition, prospects, contractual arrangements, any limitations on payment of dividends present in any debt agreements, and other factors that our Board of Directors may deem relevant.
Recent Sales of Unregistered Securities
None.
Use of Proceeds
In October 2017, we closed our initial public offering (“IPO”) of 9,200,000 shares of our Class A common stock at an offering price of $24.00 per share, including 1,200,000 shares pursuant to the underwriters’ option to purchase additional shares of our Class A common stock, resulting in gross proceeds to us of $220.8 million. All of the shares of our Class A common stock issued and sold in our IPO were registered under the Securities Act pursuant to a registration statement on Form S-1 (File No. 333-220557), which was declared effective by the U.S. Securities and Exchange Commission (the “SEC”) on October 18, 2017.
Morgan Stanley & Co. LLC, Goldman Sachs & Co. LLC, Barclays Capital Inc., Allen & Company LLC, Stifel, Nicolaus & Company, Incorporated, Canaccord Genuity Inc. and JMP Securities LLC acted as underwriters for the offering. The offering commenced on October 18, 2017 and, following the sale of the shares upon the closing of the IPO, the offer terminated. The net proceeds to us, after deducting underwriting discounts and commission of $15.5 million and offering expenses of $3.9 million, were $201.6 million. No offering expenses were paid directly or indirectly to any of our directors or officers (or their associates) or persons owning 10% or more of any class of our equity securities or to any other affiliates. There has been no material change in the planned use of proceeds from our IPO from those disclosed in the final prospectus for our IPO dated as of October 18, 2017 and filed with the SEC pursuant to Rule 424(b)(4) on October 19, 2017.
37
Issuer Purchases of Equity Securities
The table below provides information with respect to repurchases of shares of our Class A common stock during the three months ended January 31, 2018:
Period | Total number of shares purchased | Average price paid per share | ||||
November 1 to November 30, 2017 | — | — | ||||
December 1 to December 31, 2017 (1) | 225 | $8.40 | ||||
January 1 to January 31, 2018 | — | — | ||||
(1) Under certain stock option grant agreements between us and our employees, in the event an employee’s service with us terminates, we have the right to repurchase shares of Class A common stock that were acquired by such employee pursuant to the exercise of stock options that have not yet vested as of such employee’s termination date. Pursuant to these agreements, we may repurchase all or any unvested shares at the lower of (i) the fair market value of such shares (as determined under our 2016 Amended and Restated Equity Incentive Plan) on the date of repurchase, or (ii) the price equal to the employee’s exercise price for such shares. The shares set forth above were repurchased pursuant to this right of repurchase. | ||||||
Stock Performance Graph
The graph below shows a comparison, from October 19, 2017 (the date our Class A common stock commenced trading on the Nasdaq) through January 31, 2018, of the cumulative total return to stockholders of our Class A common stock relative to the Nasdaq Composite Index (“Nasdaq Composite”) and the Nasdaq Computer Index (“Nasdaq Computer”).
The graph assumes that $100 was invested in each of our Class A common stock, the Nasdaq Composite and the Nasdaq Computer at their respective closing prices on October 19, 2017 and assumes reinvestment of gross dividends. The stock price performance shown in the graph represents past performance and should not be considered an indication of future stock price performance.
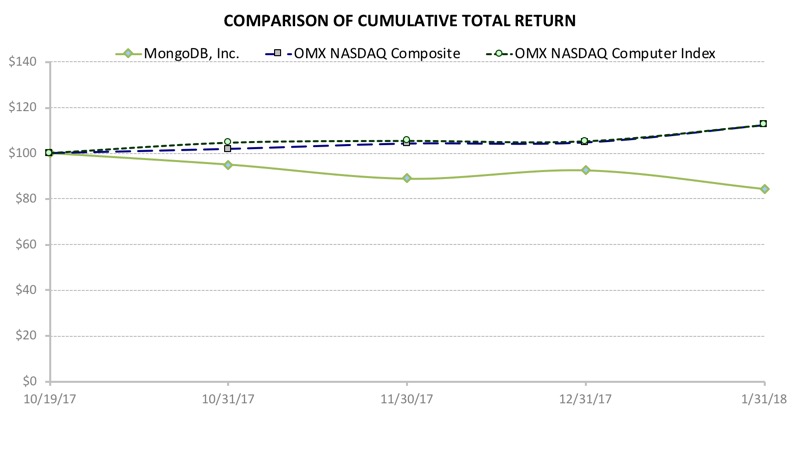
This performance graph shall not be deemed “soliciting material” or to be “filed” with the SEC for purposes of Section 18 of the Exchange Act, or otherwise subject to the liabilities under that Section, and shall not be deemed to be incorporated by reference into any filing of MongoDB, Inc. under the Securities Act or the Exchange Act.
38
Item 6. Selected Financial Data
The following selected consolidated financial data should be read in conjunction with Part II, Item 7, Management’s Discussion and Analysis of Financial Condition and Results of Operations and the consolidated financial statements and related notes included in Part II, Item 8, Financial Statements, of this Form 10-K. The consolidated statements of operations data for the fiscal years ended January 31, 2018, 2017, and 2016, and the consolidated balance sheet data as of January 31, 2018 and 2017 are derived from our audited consolidated financial statements and related notes included elsewhere in this Form 10-K. The consolidated statements of operations data for the fiscal year ended January 31, 2015 and the consolidated balance sheet data as of January 31, 2016 and 2015 are derived from audited consolidated financial statements, which are not included in this Form 10-K. The selected consolidated financial data in this section are not intended to replace our consolidated financial statements and the related notes, and are qualified in their entirety by the consolidated financial statements and related notes included elsewhere in this Form 10-K. Our historical results are not necessarily indicative of our results in any future period.
Years Ended January 31, | |||||||||||||||
2018 | 2017 | 2016 | 2015 | ||||||||||||
(in thousands, except share and per share data) | |||||||||||||||
Consolidated Statements of Operations Data: | |||||||||||||||
Revenue: | |||||||||||||||
Subscription | $ | 141,490 | $ | 91,235 | $ | 58,561 | $ | 34,109 | |||||||
Services | 13,029 | 10,123 | 6,710 | 6,679 | |||||||||||
Total revenue | 154,519 | 101,358 | 65,271 | 40,788 | |||||||||||
Cost of revenue(1): | |||||||||||||||
Subscription | 30,766 | 19,352 | 13,146 | 11,305 | |||||||||||
Services | 12,093 | 10,515 | 7,715 | 6,805 | |||||||||||
Total cost of revenue | 42,859 | 29,867 | 20,861 | 18,110 | |||||||||||
Gross profit | 111,660 | 71,491 | 44,410 | 22,678 | |||||||||||
Operating expenses: | |||||||||||||||
Sales and marketing(1) | 109,950 | 78,584 | 56,613 | 52,072 | |||||||||||
Research and development(1) | 62,202 | 51,772 | 43,465 | 33,316 | |||||||||||
General and administrative(1) | 36,775 | 27,082 | 17,070 | 13,005 | |||||||||||
Total operating expenses | 208,927 | 157,438 | 117,148 | 98,393 | |||||||||||
Loss from operations | (97,267 | ) | (85,947 | ) | (72,738 | ) | (75,715 | ) | |||||||
Other income (expense), net | 2,195 | (15 | ) | (306 | ) | (660 | ) | ||||||||
Loss before provision for income taxes | (95,072 | ) | (85,962 | ) | (73,044 | ) | (76,375 | ) | |||||||
Provision for income taxes | 1,287 | 719 | 442 | 298 | |||||||||||
Net loss | $ | (96,359 | ) | $ | (86,681 | ) | $ | (73,486 | ) | $ | (76,673 | ) | |||
Net loss per share attributable to common stockholders, basic and diluted | $ | (4.06 | ) | $ | (7.10 | ) | $ | (6.54 | ) | $ | (7.21 | ) | |||
Weighted-average shares used to compute net loss per share attributable to common stockholders, basic and diluted | 23,718,391 | 12,211,711 | 11,240,696 | 10,633,985 | |||||||||||
(1) | Includes stock‑based compensation expense as follows: |
39
Years Ended January 31, | |||||||||||||||
2018 | 2017 | 2016 | 2015 | ||||||||||||
(in thousands) | |||||||||||||||
Cost of revenue—subscription | $ | 730 | $ | 570 | $ | 282 | $ | 182 | |||||||
Cost of revenue—services | 462 | 482 | 272 | 187 | |||||||||||
Sales and marketing | 6,364 | 5,514 | 3,524 | 2,637 | |||||||||||
Research and development | 5,752 | 5,755 | 4,034 | 2,194 | |||||||||||
General and administrative | 7,927 | 8,683 | 4,675 | 1,897 | |||||||||||
Total stock‑based compensation expense | $ | 21,235 | $ | 21,004 | $ | 12,787 | $ | 7,097 | |||||||
Years Ended January 31, | |||||||||||||||
2018 | 2017 | 2016 | 2015 | ||||||||||||
(in thousands) | |||||||||||||||
Consolidated Balance Sheet Data: | |||||||||||||||
Cash, cash equivalents and short-term investments | $ | 278,974 | $ | 116,500 | $ | 113,159 | $ | 157,588 | |||||||
Working capital | 200,933 | 60,662 | 78,355 | 131,909 | |||||||||||
Total assets | 415,196 | 174,432 | 156,813 | 195,891 | |||||||||||
Deferred revenue, current and non-current | 137,430 | 93,739 | 58,260 | 41,034 | |||||||||||
Redeemable convertible preferred stock warrant liability | — | 1,272 | 1,310 | 1,211 | |||||||||||
Redeemable convertible preferred stock | — | 345,257 | 310,315 | 310,315 | |||||||||||
Accumulated deficit | (443,760 | ) | (347,401 | ) | (259,269 | ) | (185,783 | ) | |||||||
Total stockholders’ equity (deficit) | 193,493 | (286,514 | ) | (228,505 | ) | (171,013 | ) | ||||||||
Item 7. Management’s Discussion and Analysis of Financial Condition and Results of Operations
The following discussion should be read in conjunction with the consolidated financial statements and notes thereto included in Part II, Item 8, Financial Statements and Supplementary Data, of this Form 10-K. All information presented herein is based on our fiscal calendar. Unless otherwise stated, references to particular years, quarters, months or periods refer to our fiscal years ended January 31 and the associated quarters, months and periods of those fiscal years.
Overview
MongoDB is the leading modern, general purpose database platform. Our robust platform enables developers to build and modernize applications rapidly and cost-effectively across a broad range of use cases. Organizations can deploy our platform at scale in the cloud, on-premise or in a hybrid environment. Software applications are redefining how organizations across industries engage with their customers, operate their businesses and compete with each other. A database is at the heart of every software application. As a result, selecting a database is a highly strategic decision that directly affects developer productivity, application performance and organizational competitiveness. Our platform addresses the performance, scalability, flexibility and reliability demands of modern applications while maintaining the strengths of legacy databases. Our business model combines the developer mindshare and adoption benefits of open source with the economic benefits of a proprietary software subscription business model.
We generate revenue primarily from sales of subscriptions, which accounted for 92%, 90% and 90% of our total revenue for the years ended January 31, 2018, 2017 and 2016, respectively. Our primary subscription package is MongoDB Enterprise Advanced, which represented 68%, 71% and 69% of our subscription revenue for the years ended January 31, 2018, 2017 and 2016, respectively. MongoDB Enterprise Advanced is our comprehensive offering for enterprise customers that can be run in the cloud, on-premise or in a hybrid environment, and includes our proprietary database server, enterprise management capabilities, our graphical user interface, analytics integrations, technical support and a commercial license to our platform.
Many of our enterprise customers initially get to know our software by using Community Server, which is our free-to-download version of our database that includes the core functionality developers need to get started with MongoDB without all the features of our commercial platform. As a result, our direct sales prospects are often familiar with our platform and may have already built applications using our technology. We sell subscriptions directly through our field and inside sales
40
teams, as well as indirectly through channel partners. Our subscription offerings are generally priced on a per server basis, subject to a per server RAM limit. The majority of our subscription contracts are one year in duration and invoiced upfront, although a growing number of our customers are entering into multi-year subscriptions. When we enter into multi-year subscriptions, we typically invoice the customer on an annual basis.
We introduced MongoDB Atlas in June 2016. MongoDB Atlas is our cloud-hosted database-as-a-service (“DBaaS”) offering that includes comprehensive infrastructure and management of Community Server. It represented 1% of our total revenue for the year ended January 31, 2017 and increased to 7% of our total revenue for the year ended January 31, 2018. During the three months ended January 31, 2018, MongoDB Atlas revenue represented 11% of our total revenue, which highlights the continued growth of this offering. We have experienced strong growth in self-service customers of MongoDB Atlas. These customers are charged monthly based on their usage. In addition, we have also seen growth in MongoDB Atlas customers sold by our sales force. These customers typically sign annual commitments and pay in advance or monthly. Given our platform has been downloaded from our website more than 35 million times since February 2009 and over 12 million times in the last 12 months alone, our initial growth strategy for MongoDB Atlas is to convert developers and their organizations who are already using Community Server to become customers of MongoDB Atlas and enjoy the benefits of a managed offering.
We also generate revenue from services, which consist primarily of fees associated with consulting and training services. Revenue from services accounted for 8%, 10% and 10% of our total revenue for the years ended January 31, 2018, 2017 and 2016, respectively. We expect to continue to invest in our services organization as we believe it plays an important role in accelerating our customers’ realization of the benefits of our platform, which helps drive customer retention and expansion.
We believe the market for our offerings is large and growing, and we have experienced rapid growth. We have made substantial investments in developing our platform and expanding our sales and marketing footprint and intend to continue to invest heavily to grow our business to take advantage of our market opportunity rather than optimizing for profitability or cash flow in the near term.
Factors Affecting Our Performance
Extending Product Leadership and Maintaining Developer Mindshare
We are committed to delivering market-leading products to continue to build and maintain credibility with the global software developer community. We believe we must maintain our product leadership position and the strength of our brand to drive further revenue growth. For example, we introduced MongoDB Atlas in 2016, an important part of our run-anywhere solution, to capitalize on the existing demand for a managed version of our Community Server offering which many companies currently self-deploy and manage in the cloud. In 2017, we introduced cross-region replication for MongoDB Atlas, which helps ensure that an application remains operational even if an entire cloud region goes down, as well as allowing MongoDB customers to locate data closer to their users for performance or compliance reasons. In addition, in February 2018, we announced that MongoDB 4.0, scheduled for release in the summer of 2018, will extend ACID transaction support currently available in a single document to multiple documents. We intend to continue to invest in our engineering capabilities and marketing activities to maintain our strong position in the developer community. We have spent $230.2 million on research and development since our inception. Our results of operations may fluctuate as we make these investments to drive increased customer adoption and usage.
Growing Our Customer Base
We are intensely focused on continuing to grow our customer base. We have invested, and expect to continue to invest, heavily in our sales and marketing efforts and developer community outreach, which are critical to driving customer acquisition. As of January 31, 2018, we had over 5,700 customers across a wide range of industries and in 97 countries, compared to over 3,200 customers and 1,700 customers as of January 31, 2017 and 2016, respectively. All affiliated entities are counted as a single customer. As of January 31, 2018, we had over 1,450 customers that were sold through our direct sales force and channel partners, as compared to over 1,200 and 900 such customers as of January 31, 2017 and 2016, respectively. These customers, which we refer to as our Direct Customers, accounted for 90%, 95% and 96% of our subscription revenue for the year ended January 31, 2018, 2017 and 2016, respectively. We are also focused on increasing the number of MongoDB Atlas customers. After launching in June 2016, we had over 3,400 MongoDB Atlas customers as of January 31, 2018.
41
Increasing Adoption of MongoDB Atlas
In June 2016, we introduced MongoDB Atlas. This hosted cloud offering is an important part of our run-anywhere strategy and allows us to generate revenue from Community Server, converting users who do not need all of the benefits of MongoDB Enterprise Advanced to customers. To accelerate adoption of this DBaaS offering, in 2017, we introduced tools to easily migrate existing users of our Community Server offering to MongoDB Atlas. We have also expanded our introductory offerings for MongoDB Atlas, including a free tier, which provides limited processing power and storage, in order to drive usage and adoption of MongoDB Atlas among developers. In December 2017, we announced the availability of MongoDB Atlas on AWS Marketplace, making it easier for AWS customers to buy and consume MongoDB Atlas. We have invested significantly in MongoDB Atlas and our ability to drive adoption of MongoDB Atlas is a key component of our growth strategy. For the year ended January 31, 2018, MongoDB Atlas revenue represented 7% of our total revenue.
Retaining and Expanding Revenue from Existing Customers
The economic attractiveness of our subscription-based model is driven by customer renewals and increasing existing customer subscriptions over time, referred to as land-and-expand. We believe that there is a significant opportunity to drive additional sales to existing customers, and expect to invest in sales and marketing and customer success personnel and activities to achieve additional revenue growth from existing customers. If an application grows and requires additional capacity, our customers increase their subscriptions to our platform. In addition, our customers expand their subscriptions to our platform as they migrate additional existing applications or build new applications, either within the same department or in other lines of business or geographies. Also, as customers modernize their IT infrastructure and move to the cloud, they may migrate applications from legacy databases. Our goal is to increase the number of customers that standardize on our database within their organization, which can include offering centralized internal support or providing MongoDB-as-a-service internally. Over time, the average subscription amount for our Direct Customers has increased. In addition, self-service customers have begun to increase their consumption of our products, particularly MongoDB Atlas.
We monitor annualized recurring revenue (“ARR”) to help us measure our subscription performance. We define ARR as the subscription revenue we would contractually expect to receive from customers over the following 12 months assuming no increases or reductions in their subscriptions. Except as set forth in the following paragraph with respect to net ARR expansion rate, ARR excludes self-service products, including MongoDB Atlas not sold on a commitment basis. ARR also excludes professional services. For customers who utilize our self-service offerings, we measure the annualized monthly recurring revenue (“MRR”), which is calculated by annualizing their usage of our self-serve products in the prior 30 days and assuming no increases or reductions in their usage. The number of customers with $100,000 or greater in ARR and annualized MRR was 354, 246 and 164 as of January 31, 2018, 2017 and 2016, respectively.
We also examine the rate at which our customers increase their spend with us, which we call net ARR expansion rate. We calculate net ARR expansion rate by dividing the ARR at the close of a given period (the “measurement period”), from customers who were also customers at the close of the same period in the prior year (the “base period”), by the ARR from all customers at the close of the base period, including those who churned or reduced their subscriptions. In the calculation of our net ARR expansion rate, we include any annualized MRR from customers who were Direct Customers in the base period, the measurement period or both such periods. Our net ARR expansion rate has been over 120% for each of the last 12 fiscal quarters.
Our ability to increase sales to existing customers will depend on a number of factors, including customers’ satisfaction or dissatisfaction with our products and services, competition, pricing, economic conditions or overall changes in our customers’ spending levels.
Investing in Growth and Scaling Our Business
We are focused on our long-term revenue potential. We believe that our market opportunity is large, and we will continue to invest significantly in scaling across all organizational functions in order to grow our operations both domestically and internationally. Any investments we make in our sales and marketing organization will occur in advance of experiencing the benefits from such investments, so it may be difficult for us to determine if we are efficiently allocating resources in those areas. We have increased our sales and marketing headcount to 394 employees as of January 31, 2018 from 280 employees and 174 employees as of January 31, 2017 and 2016, respectively.
42
Components of Results of Operations
Revenue
Subscription Revenue. Our subscription revenue is comprised of term licenses and hosted as‑a‑service solutions. Subscriptions to term licenses include technical support and access to new software versions on a when‑and‑if available basis. Revenue from our term licenses is recognized ratably and is typically billed annually in advance. Revenue from our hosted as‑a‑service solutions is primarily generated on a usage basis and is billed either in arrears or paid up front.
Services Revenue. Services revenue is comprised of consulting and training services and is recognized over the period of delivery of the applicable services. We recognize revenue from services agreements as services are delivered if sold on a stand‑alone basis and ratably over the contractual period if sold as a bundled element along with our subscriptions.
We expect our revenue may vary from period to period based on, among other things, the timing and size of new subscriptions, the rate of customer renewals and expansions, delivery of professional services, the impact of significant transactions and seasonality of or fluctuations in usage for our consumption‑based customers. Certain of our services agreements are sold as a bundled element along with our subscriptions. In those cases, when services commence later than the start date of the subscription, no revenue is recognized until services commence. Once services commence, as long as all other revenue recognition criteria have been met, we record a cumulative catch up of revenue that would have been recognized over the period from the beginning of the subscription term until the commencement of services.
Cost of Revenue
Cost of Subscription Revenue. Cost of subscription revenue primarily includes personnel costs, including salaries, bonuses and benefits, and stock‑based compensation, for employees associated with our subscription arrangements principally related to technical support and allocated shared costs, as well as depreciation and amortization. Our cost of subscription revenue for our hosted as‑a‑service solutions includes third‑party cloud infrastructure and overhead. We expect our cost of subscription revenue to increase in absolute dollars as our subscription revenue increases and, depending on the results of MongoDB Atlas, our cost of subscription revenue may increase as a percentage of subscription revenue as well.
Cost of Services Revenue. Cost of services revenue primarily includes personnel costs, including salaries and benefits, and stock‑based compensation, for employees associated with our professional service contracts, travel costs and allocated shared costs, as well as depreciation and amortization. We expect our cost of services revenue to increase in absolute dollars as our services revenue increases.
Gross Profit and Gross Margin
Gross Profit. Gross profit represents revenue less cost of revenue.
Gross Margin. Gross margin, or gross profit as a percentage of revenue, has been and will continue to be affected by a variety of factors, including the average sales price of our products and services, the mix of products sold, transaction volume growth and the mix of revenue between subscriptions and services. We expect our gross margin to fluctuate over time depending on the factors described above and, to the extent MongoDB Atlas revenue increases as a percentage of total revenue, our gross margin may decline as a result of the associated hosting costs of MongoDB Atlas.
Operating Expenses
Our operating expenses consist of sales and marketing, research and development and general and administrative expenses. Personnel costs are the most significant component of each category of operating expenses. Operating expenses also include allocated overhead costs for facilities, information technology and employee benefit costs.
Sales and Marketing. Sales and marketing expense consists primarily of personnel costs, including salaries, sales commission and benefits, bonuses and stock‑based compensation. These expenses also include costs related to marketing programs, travel‑related expenses and allocated overhead. Marketing programs consist of advertising, events, corporate communications, and brand‑building and developer‑community activities. We expect our sales and marketing expense to increase in absolute dollars over time as we expand our sales force and increase our marketing resources, expand into new markets and further develop our channel program.
43
Research and Development. Research and development expense consists primarily of personnel costs, including salaries, bonuses and benefits, and stock‑based compensation. It also includes amortization associated with intangible acquired assets and allocated overhead. We expect our research and development expenses to continue to increase in absolute dollars, as we continue to invest in our platform and develop new products.
General and Administrative. General and administrative expense consists primarily of personnel costs, including salaries, bonuses and benefits, and stock‑based compensation for administrative functions including finance, legal, human resources and external legal and accounting fees, as well as allocated overhead. We expect general and administrative expense to increase in absolute dollars over time as we continue to invest in the growth of our business and incur the costs of compliance associated with being a publicly traded company.
Other Income (Expense), net
Other income (expense), net consists primarily of interest income and gains and losses from foreign currency transactions.
Provision for Income Taxes
Provision for income taxes consists primarily of state income taxes in the United States and income taxes in certain foreign jurisdictions in which we conduct business. As of January 31, 2018, we had net operating loss (“NOL”) carryforwards for federal, state and Irish income tax purposes of $209.5 million, $166.5 million and $182.3 million, respectively, which begin to expire in the year ending January 31, 2028 for federal purposes and January 31, 2021 for state purposes if not utilized. Ireland allows NOLs to be carried forward indefinitely. The deferred tax assets associated with the NOL carryforwards in each of these jurisdictions are subject to a full valuation allowance. Under Section 382 of the U.S. Internal Revenue Code of 1986, or Code, a corporation that experiences an “ownership change” is subject to a limitation on its ability to utilize its pre-change NOLs to offset future taxable income. In April 2017, we completed an analysis under Section 382 to evaluate whether there are any limitations on our NOLs through January 31, 2017 and concluded that the prior ownership changes do not limit the utilization of the NOLs before they expire, assuming sufficient future federal and state taxable income. However, it is possible that we could experience a future ownership change under Section 382 or other regulatory changes, such as suspension on the use of the NOLs, that could result in the expiration of our NOLs or otherwise cause them to be unavailable to offset future federal and state taxable income.
Highlights for the Years Ended January 31, 2018, 2017 and 2016
For the years ended January 31, 2018, 2017 and 2016, our total revenue was $154.5 million, $101.4 million and $65.3 million, respectively. Our net loss was $96.4 million, $86.7 million and $73.5 million for the years ended January 31, 2018, 2017 and 2016, respectively. Our operating cash flow was $(44.9) million, $(38.1) million and $(47.0) million for the years ended January 31, 2018, 2017 and 2016, respectively. Our free cash flow was $(47.0) million, $(39.8) million and $(47.4) million for the years ended January 31, 2018, 2017 and 2016, respectively. See the section titled “Liquidity and Capital Resources—Non-GAAP Free Cash Flow” below.
In October 2017, we closed our IPO of 9,200,000 shares of our Class A common stock at an offering price of $24.00 per share, including 1,200,000 shares pursuant to the underwriters’ option to purchase additional shares of our Class A common stock, resulting in net proceeds to us of $201.6 million, after deducting underwriting discounts and commissions of $15.5 million and offering expenses of $3.9 million.
44
Results of Operations
The following tables set forth our results of operations for the periods presented in dollars and as a percentage of our total revenue:
Years Ended January 31, | |||||||||||
2018 | 2017 | 2016 | |||||||||
(in thousands) | |||||||||||
Consolidated Statements of Operations Data: | |||||||||||
Revenue: | |||||||||||
Subscription | $ | 141,490 | $ | 91,235 | $ | 58,561 | |||||
Services | 13,029 | 10,123 | 6,710 | ||||||||
Total revenue | 154,519 | 101,358 | 65,271 | ||||||||
Cost of revenue(1): | |||||||||||
Subscription | 30,766 | 19,352 | 13,146 | ||||||||
Services | 12,093 | 10,515 | 7,715 | ||||||||
Total cost of revenue | 42,859 | 29,867 | 20,861 | ||||||||
Gross profit | 111,660 | 71,491 | 44,410 | ||||||||
Operating expenses: | |||||||||||
Sales and marketing(1) | 109,950 | 78,584 | 56,613 | ||||||||
Research and development(1) | 62,202 | 51,772 | 43,465 | ||||||||
General and administrative(1) | 36,775 | 27,082 | 17,070 | ||||||||
Total operating expenses | 208,927 | 157,438 | 117,148 | ||||||||
Loss from operations | (97,267 | ) | (85,947 | ) | (72,738 | ) | |||||
Other income (expense), net | 2,195 | (15 | ) | (306 | ) | ||||||
Loss before provision for income taxes | (95,072 | ) | (85,962 | ) | (73,044 | ) | |||||
Provision for income taxes | 1,287 | 719 | 442 | ||||||||
Net loss | $ | (96,359 | ) | $ | (86,681 | ) | $ | (73,486 | ) | ||
(1) | Includes stock‑based compensation expense as follows: |
Years Ended January 31, | |||||||||||
2018 | 2017 | 2016 | |||||||||
(in thousands) | |||||||||||
Cost of revenue—subscription | $ | 730 | $ | 570 | $ | 282 | |||||
Cost of revenue—services | 462 | 482 | 272 | ||||||||
Sales and marketing | 6,364 | 5,514 | 3,524 | ||||||||
Research and development | 5,752 | 5,755 | 4,034 | ||||||||
General and administrative | 7,927 | 8,683 | 4,675 | ||||||||
Total stock‑based compensation expense | $ | 21,235 | $ | 21,004 | $ | 12,787 | |||||
45
Years Ended January 31, | ||||||||
2018 | 2017 | 2016 | ||||||
Percentage of Revenue Data: | ||||||||
Revenue: | ||||||||
Subscription | 92 | % | 90 | % | 90 | % | ||
Services | 8 | 10 | 10 | |||||
Total revenue | 100 | 100 | 100 | |||||
Cost of revenue: | ||||||||
Subscription | 20 | 19 | 20 | |||||
Services | 8 | 10 | 12 | |||||
Total cost of revenue | 28 | 29 | 32 | |||||
Gross profit | 72 | 71 | 68 | |||||
Operating expenses: | ||||||||
Sales and marketing | 71 | 78 | 87 | |||||
Research and development | 40 | 51 | 67 | |||||
General and administrative | 24 | 27 | 25 | |||||
Total operating expenses | 135 | 156 | 179 | |||||
Loss from operations | (63 | ) | (85 | ) | (111 | ) | ||
Other income (expense), net | 1 | — | (1 | ) | ||||
Loss before provision for income taxes | (62 | ) | (85 | ) | (112 | ) | ||
Provision for income taxes | 1 | 1 | 1 | |||||
Net loss | (63 | )% | (86 | )% | (113 | )% | ||
Comparison of the Years Ended January 31, 2018 and 2017
Revenue
Years Ended January 31, | Change | |||||||||||||
2018 | 2017 | $ | % | |||||||||||
(dollars in thousands) | ||||||||||||||
Subscription | $ | 141,490 | $ | 91,235 | $ | 50,255 | 55 | % | ||||||
Services | 13,029 | 10,123 | 2,906 | 29 | % | |||||||||
Total revenue | $ | 154,519 | $ | 101,358 | $ | 53,161 | 52 | % | ||||||
Total revenue growth reflects increased demand for our platform and related services. Subscription revenue increased by $50.3 million including $17.6 million from sales to new customers. The remainder of the increase in subscription revenue resulted from sales to existing customers. The increase in services revenue was driven primarily by an increase in sales of professional services to new customers.
46
Cost of Revenue, Gross Profit and Gross Margin Percentage
Years Ended January 31, | Change | |||||||||||||
2018 | 2017 | $ | % | |||||||||||
(dollars in thousands) | ||||||||||||||
Subscription cost of revenue | $ | 30,766 | $ | 19,352 | $ | 11,414 | 59 | % | ||||||
Services cost of revenue | 12,093 | 10,515 | 1,578 | 15 | % | |||||||||
Total cost of revenue | 42,859 | 29,867 | 12,992 | 43 | % | |||||||||
Gross profit | $ | 111,660 | $ | 71,491 | $ | 40,169 | 56 | % | ||||||
Gross margin | 72 | % | 71 | % | ||||||||||
Subscription | 78 | % | 79 | % | ||||||||||
Services | 7 | % | (4 | )% | ||||||||||
The increase in subscription cost of revenue was due to a $6.8 million increase in third‑party cloud infrastructure costs, including costs associated with the growth of MongoDB Atlas, as well as a $3.9 million increase in personnel costs associated with increased headcount in our support organization. The increase in services cost of revenue was primarily due to higher headcount in our services organization. Total headcount in our support and services organizations increased 12% from January 31, 2017 to January 31, 2018.
The increase in overall gross margin was driven by higher sales volume and greater efficiencies by our technical support and services teams, partially offset by an increase in third-party cloud infrastructure costs associated with MongoDB Atlas. Our services gross margin is subject to fluctuations as a result of timing of sales of standalone consulting and training services, as well as the timing of revenue recognized for previously sold service agreements as a bundled element with subscriptions, the latter of which benefited services gross margin for the year ended January 31, 2018.
Operating Expenses
Sales and Marketing
Years Ended January 31, | Change | |||||||||||||
2018 | 2017 | $ | % | |||||||||||
(dollars in thousands) | ||||||||||||||
Sales and marketing | $ | 109,950 | $ | 78,584 | $ | 31,366 | 40 | % | ||||||
The increase in sales and marketing expense was primarily due to an increase of $20.6 million in personnel costs, including an increase in commission expense of $4.7 million, driven by an increase in our sales and marketing headcount of 41% to 394 as of January 31, 2018 from 280 as of January 31, 2017. The remainder of the increase was primarily attributable to increased travel and other expenses related to increased headcount, as well as higher spend on marketing programs, including for MongoDB Atlas.
Research and Development
Years Ended January 31, | Change | |||||||||||||
2018 | 2017 | $ | % | |||||||||||
(dollars in thousands) | ||||||||||||||
Research and development | $ | 62,202 | $ | 51,772 | $ | 10,430 | 20 | % | ||||||
The increase in research and development expense was primarily driven by an increase in personnel costs as we increased our research and development headcount by 28% to 249 as of January 31, 2018 from 193 as of January 31, 2017.
47
General and Administrative
Years Ended January 31, | Change | |||||||||||||
2018 | 2017 | $ | % | |||||||||||
(dollars in thousands) | ||||||||||||||
General and administrative | $ | 36,775 | $ | 27,082 | $ | 9,693 | 36 | % | ||||||
The increase in general and administrative expense was primarily due to an increase in general and administrative personnel headcount, resulting in an increase of $7.4 million in personnel costs, as well as a $1.8 million increase in professional services‑related fees from higher costs of compliance associated with being a publicly traded company.
Other Income (Expense), net
Years Ended January 31, | Change | |||||||||||||
2018 | 2017 | $ | % | |||||||||||
(dollars in thousands) | ||||||||||||||
Other income (expense), net | $ | 2,195 | $ | (15 | ) | $ | 2,210 | 14,733 | % | |||||
The increase in other income (expense), net was due to net gains from foreign currency transactions, as well as an increase in interest income from our larger average cash equivalents and short-term investments balance during the year ended January 31, 2018.
Provision for Income Taxes
Years Ended January 31, | Change | |||||||||||||
2018 | 2017 | $ | % | |||||||||||
(dollars in thousands) | ||||||||||||||
Provision for income taxes | $ | 1,287 | $ | 719 | $ | 568 | 79 | % | ||||||
The increase in provision for income taxes was primarily due to an increase in foreign taxes as we continued our global expansion.
Comparison of the Years Ended January 31, 2017 and 2016
Revenue
Years Ended January 31, | Change | |||||||||||||
2017 | 2016 | $ | % | |||||||||||
(dollars in thousands) | ||||||||||||||
Subscription | $ | 91,235 | $ | 58,561 | $ | 32,674 | 56 | % | ||||||
Services | 10,123 | 6,710 | 3,413 | 51 | % | |||||||||
Total revenue | $ | 101,358 | $ | 65,271 | $ | 36,087 | 55 | % | ||||||
Total revenue growth reflects increased demand for our platform and related services. Subscription revenue increased by $32.7 million, $11.5 million of which resulted from sales to new customers and the remaining balance of which resulted from sales to existing customers. The increase in services revenue was driven primarily by an increase in sales of professional services to new customers.
48
Cost of Revenue, Gross Profit and Gross Margin Percentage
Years Ended January 31, | Change | |||||||||||||
2017 | 2016 | $ | % | |||||||||||
(dollars in thousands) | ||||||||||||||
Subscription cost of revenue | $ | 19,352 | $ | 13,146 | $ | 6,206 | 47 | % | ||||||
Services cost of revenue | 10,515 | 7,715 | 2,800 | 36 | % | |||||||||
Total cost of revenue | 29,867 | 20,861 | 9,006 | 43 | % | |||||||||
Gross profit | $ | 71,491 | $ | 44,410 | $ | 27,081 | 61 | % | ||||||
Gross margin | 71 | % | 68 | % | ||||||||||
Subscription | 79 | % | 78 | % | ||||||||||
Services | (4 | )% | (15 | )% | ||||||||||
The increase in subscription cost of revenue was primarily due to a $4.2 million increase in personnel costs associated with increased headcount in our support organization, a $1.1 million increase in third-party cloud infrastructure, including costs associated with the launch of MongoDB Atlas, and a $0.3 million increase in stock-based compensation. The increase in services cost of revenue was primarily due to a $2.1 million increase in personnel costs associated with increased headcount in our services organization and a $0.2 million increase in stock-based compensation. Total headcount in our support and services organizations increased 50% from January 31, 2016 to January 31, 2017.
The three percentage point increase in gross margin was primarily due to an increase in subscription gross margin of one percentage point and an increase in services gross margin, primarily driven by higher sales volume, our mix of subscriptions sold, and economies of scale in our technical support team, and an increase in services gross margin, primarily driven by economies of scale achieved in our services organization.
Operating Expenses
Sales and Marketing
Years Ended January 31, | Change | |||||||||||||
2017 | 2016 | $ | % | |||||||||||
(dollars in thousands) | ||||||||||||||
Sales and marketing | $ | 78,584 | $ | 56,613 | $ | 21,971 | 39 | % | ||||||
The increase in sales and marketing expense was primarily due to an increase of $14.5 million in personnel costs, including an increase in commission expenses of $5.5 million, and an increase of $2.0 million in stock-based compensation expense, both driven by an increase in sales and marketing headcount of 61% from 174 as of January 31, 2016 to 280 as of January 31, 2017. The remainder of the increase was primarily attributable to an increase of $2.4 million in travel expenses and of $1.6 million in marketing programs.
Research and Development
Years Ended January 31, | Change | |||||||||||||
2017 | 2016 | $ | % | |||||||||||
(dollars in thousands) | ||||||||||||||
Research and development | $ | 51,772 | $ | 43,465 | $ | 8,307 | 19 | % | ||||||
The increase in research and development expense was primarily driven by an increase of $5.4 million in personnel costs and an increase of $1.7 million in stock-based compensation expense, as we increased our research and development headcount.
49
General and Administrative
Years Ended January 31, | Change | |||||||||||||
2017 | 2016 | $ | % | |||||||||||
(dollars in thousands) | ||||||||||||||
General and administrative | $ | 27,082 | $ | 17,070 | $ | 10,012 | 59 | % | ||||||
The general and administrative expense increase was primarily due to an increase in general and administrative personnel headcount, resulting in an increase of $4.0 million in personnel costs. The increase was also driven by a $4.0 million increase in stock-based compensation expense, $2.4 million of which resulted from the option repricing we effected in April 2016, and a $1.8 million increase in facilities-related costs.
Other Income (Expense), net
Years Ended January 31, | Change | |||||||||||||
2017 | 2016 | $ | % | |||||||||||
(dollars in thousands) | ||||||||||||||
Other income (expense), net | $ | (15 | ) | $ | (306 | ) | $ | 291 | 95 | % | ||||
The increase in other income (expense), net was primarily due to an increase in interest income on investments and net gains from foreign currency transactions.
Provision for Income Taxes
Years Ended January 31, | Change | |||||||||||||
2017 | 2016 | $ | % | |||||||||||
(dollars in thousands) | ||||||||||||||
Provision for income taxes | $ | 719 | $ | 442 | $ | 277 | 63 | % | ||||||
The increase in provision for income taxes was primarily due to an increase in foreign taxes as we continued our global expansion.
Quarterly Results of Operations
The following tables summarize our selected unaudited quarterly consolidated statements of operations data for each of the eight quarters in the period ended January 31, 2018. The information for each of these quarters has been prepared on the same basis as our audited annual consolidated financial statements and reflect, in the opinion of management, all adjustments of a normal, recurring nature that are necessary for the fair statement of the results of operations for these periods. This data should be read in conjunction with our audited consolidated financial statements and related notes included in Part II, Item 8, Financial Statements, in this Form 10-K. Historical results are not necessarily indicative of the results that may be expected in the future.
50
Three Months Ended | |||||||||||||||||||||||||||||||
January 31, 2018 | October 31, 2017 | July 31, 2017 | April 30, 2017 | January 31, 2017 | October 31, 2016 | July 31, 2016 | April 30, 2016 | ||||||||||||||||||||||||
(in thousands) | |||||||||||||||||||||||||||||||
Revenue: | |||||||||||||||||||||||||||||||
Subscription | $ | 41,887 | $ | 37,885 | $ | 32,531 | $ | 29,187 | $ | 27,217 | $ | 23,805 | $ | 21,163 | $ | 19,050 | |||||||||||||||
Services | 3,154 | 3,603 | 3,069 | 3,203 | 2,717 | 2,500 | 2,447 | 2,459 | |||||||||||||||||||||||
Total revenue | 45,041 | 41,488 | 35,600 | 32,390 | 29,934 | 26,305 | 23,610 | 21,509 | |||||||||||||||||||||||
Cost of revenue(1): | |||||||||||||||||||||||||||||||
Subscription | 9,097 | 7,904 | 7,215 | 6,550 | 5,696 | 4,981 | 4,384 | 4,291 | |||||||||||||||||||||||
Services | 3,304 | 3,167 | 2,973 | 2,649 | 2,649 | 2,238 | 2,989 | 2,639 | |||||||||||||||||||||||
Total cost of revenue | 12,401 | 11,071 | 10,188 | 9,199 | 8,345 | 7,219 | 7,373 | 6,930 | |||||||||||||||||||||||
Gross profit | 32,640 | 30,417 | 25,412 | 23,191 | 21,589 | 19,086 | 16,237 | 14,579 | |||||||||||||||||||||||
Operating expenses: | |||||||||||||||||||||||||||||||
Sales and marketing(1) | 32,863 | 28,050 | 26,892 | 22,145 | 22,474 | 18,656 | 20,158 | 17,296 | |||||||||||||||||||||||
Research and development(1) | 16,788 | 16,588 | 15,749 | 13,077 | 13,232 | 13,300 | 13,240 | 12,000 | |||||||||||||||||||||||
General and administrative(1) | 10,242 | 9,829 | 8,933 | 7,771 | 7,166 | 6,385 | 6,228 | 7,303 | |||||||||||||||||||||||
Total operating expenses | 59,893 | 54,467 | 51,574 | 42,993 | 42,872 | 38,341 | 39,626 | 36,599 | |||||||||||||||||||||||
Loss from operations | (27,253 | ) | (24,050 | ) | (26,162 | ) | (19,802 | ) | (21,283 | ) | (19,255 | ) | (23,389 | ) | (22,020 | ) | |||||||||||||||
Other income (expense), net | 1,349 | 170 | 335 | 341 | (71 | ) | (177 | ) | (322 | ) | 555 | ||||||||||||||||||||
Loss before provision for income taxes | (25,904 | ) | (23,880 | ) | (25,827 | ) | (19,461 | ) | (21,354 | ) | (19,432 | ) | (23,711 | ) | (21,465 | ) | |||||||||||||||
Provision for income taxes | 470 | 336 | 252 | 229 | 466 | 103 | 67 | 83 | |||||||||||||||||||||||
Net loss | $ | (26,374 | ) | $ | (24,216 | ) | $ | (26,079 | ) | $ | (19,690 | ) | $ | (21,820 | ) | $ | (19,535 | ) | $ | (23,778 | ) | $ | (21,548 | ) | |||||||
Net loss per share attributable to common stockholders, basic and diluted | $ | (0.52 | ) | $ | (1.39 | ) | $ | (1.92 | ) | $ | (1.50 | ) | $ | (1.69 | ) | $ | (1.57 | ) | $ | (1.99 | ) | $ | (1.86 | ) | |||||||
Weighted-average shares used to compute net loss per share attributable to common stockholders, basic and diluted | 50,287,162 | 17,421,642 | 13,600,435 | 13,164,559 | 12,891,905 | 12,418,879 | 11,926,183 | 11,596,502 | |||||||||||||||||||||||
(1) | Includes stock‑based compensation expense as follows: |
Three Months Ended | |||||||||||||||||||||||||||||||
January 31, 2018 | October 31, 2017 | July 31, 2017 | April 30, 2017 | January 31, 2017 | October 31, 2016 | July 31, 2016 | April 30, 2016 | ||||||||||||||||||||||||
(in thousands) | |||||||||||||||||||||||||||||||
Cost of revenue—subscription | $ | 227 | $ | 183 | $ | 170 | $ | 151 | $ | 145 | $ | 131 | $ | 129 | $ | 165 | |||||||||||||||
Cost of revenue—services | 170 | 123 | 98 | 72 | 85 | 70 | 127 | 200 | |||||||||||||||||||||||
Sales and marketing | 1,964 | 1,704 | 1,482 | 1,215 | 1,168 | 1,095 | 1,283 | 1,968 | |||||||||||||||||||||||
Research and development | 1,680 | 1,505 | 1,322 | 1,245 | 1,237 | 1,206 | 1,248 | 2,064 | |||||||||||||||||||||||
General and administrative | 2,128 | 2,184 | 1,845 | 1,771 | 1,852 | 1,732 | 1,744 | 3,355 | |||||||||||||||||||||||
Total stock‑based compensation expense | $ | 6,169 | $ | 5,699 | $ | 4,917 | $ | 4,454 | $ | 4,487 | $ | 4,234 | $ | 4,531 | $ | 7,752 | |||||||||||||||
51
Three Months Ended | |||||||||||||||||||||||
January 31, 2018 | October 31, 2017 | July 31, 2017 | April 30, 2017 | January 31, 2017 | October 31, 2016 | July 31, 2016 | April 30, 2016 | ||||||||||||||||
(in thousands) | |||||||||||||||||||||||
Percentage of Revenue Data: | |||||||||||||||||||||||
Revenue: | |||||||||||||||||||||||
Subscription | 93 | % | 91 | % | 91 | % | 90 | % | 91 | % | 90 | % | 90 | % | 89 | % | |||||||
Services | 7 | 9 | 9 | 10 | 9 | 10 | 10 | 11 | |||||||||||||||
Total revenue | 100 | 100 | 100 | 100 | 100 | 100 | 100 | 100 | |||||||||||||||
Cost of revenue: | |||||||||||||||||||||||
Subscription | 20 | 19 | 20 | 20 | 19 | 18 | 18 | 20 | |||||||||||||||
Services | 8 | 8 | 9 | 8 | 9 | 9 | 13 | 12 | |||||||||||||||
Total cost of revenue | 28 | 27 | 29 | 28 | 28 | 27 | 31 | 32 | |||||||||||||||
Gross profit | 72 | 73 | 71 | 72 | 72 | 73 | 69 | 68 | |||||||||||||||
Operating expenses: | |||||||||||||||||||||||
Sales and marketing | 73 | 68 | 76 | 68 | 75 | 71 | 86 | 80 | |||||||||||||||
Research and development | 37 | 40 | 44 | 40 | 44 | 51 | 56 | 56 | |||||||||||||||
General and administrative | 23 | 24 | 25 | 24 | 24 | 24 | 26 | 34 | |||||||||||||||
Total operating expenses | 133 | 132 | 145 | 132 | 143 | 146 | 168 | 170 | |||||||||||||||
Loss from operations | (61 | ) | (58 | ) | (73 | ) | (61 | ) | (71 | ) | (73 | ) | (99 | ) | (102 | ) | |||||||
Other income (expense), net | 3 | — | 1 | 1 | — | (1 | ) | (1 | ) | 3 | |||||||||||||
Loss before provision for income taxes | (58 | ) | (58 | ) | (72 | ) | (60 | ) | (71 | ) | (74 | ) | (100 | ) | (99 | ) | |||||||
Provision for income taxes | 1 | — | 1 | 1 | 2 | — | 1 | 1 | |||||||||||||||
Net loss | (59 | )% | (58 | )% | (73 | )% | (61 | )% | (73 | )% | (74 | )% | (101 | )% | (100 | )% | |||||||
Seasonality
We have in the past and expect in the future to experience fluctuations in our revenue and sales from time to time. Our recent growth and the ratable nature of our subscription revenue makes these quarterly fluctuations less apparent in our overall financial results.
Quarterly Revenue Trends
Our quarterly subscription revenue increased sequentially for all periods presented due primarily to an increase in the sales of subscriptions and related services. Our quarterly services revenue experiences fluctuations as a result of timing of sales of standalone consulting and training services, as well as the timing of revenue recognized for previously sold service agreements as a bundled element with subscriptions.
Quarterly Cost of Revenue, Gross Profit and Gross Margin Trends
Cost of revenue has generally increased sequentially as a result of the increase in our subscription and services revenue. Gross profit in absolute dollar terms increased sequentially for all periods presented, primarily due to growth in revenue. Sequential fluctuations in gross margin were primarily driven by a shift in the mix of subscriptions sold to our customers, as well as timing of employee hiring as we continued to build out our technical support organization. We expect that the growth of MongoDB Atlas may reduce subscription gross margin due to the third-party cloud infrastructure costs we incur associated with our DBaaS offering.
Quarterly Expense Trends
Total operating expenses generally increased sequentially for all periods presented primarily due to the addition of personnel in connection with the expansion of our business.
Liquidity and Capital Resources
As of January 31, 2018, we had cash, cash equivalents, short‑term investments and restricted cash totaling $279.5 million. Our cash and cash equivalents primarily consist of bank deposits and money market funds. Our short‑term investments consist of U.S. government treasury securities. Our restricted cash represents collateral for our available credit on corporate credit cards.
52
In October 2017, we closed our IPO of 9,200,000 shares of our Class A common stock at an offering price of $24.00 per share, including 1,200,000 shares pursuant to the underwriters’ option to purchase additional shares of our Class A common stock, resulting in net proceeds to us of $201.6 million, after deducting underwriting discounts and commissions of $15.5 million and offering expenses of $3.9 million. Previously, we financed our operations principally through private placements of our redeemable convertible preferred stock. We have received net proceeds of $345.3 million from the issuance of shares of our redeemable convertible preferred stock. We believe our existing cash and cash equivalents and short‑term investments will be sufficient to fund our operating and capital needs for at least the next 12 months.
We have generated significant operating losses and negative cash flows from operations as reflected in our accumulated deficit and consolidated statements of cash flows. As of January 31, 2018, we had an accumulated deficit of $443.8 million. We expect to continue to incur operating losses and negative cash flows from operations in the future and may require additional capital resources to execute strategic initiatives to grow our business. Our future capital requirements will depend on many factors including our growth rate, the timing and extent of spending to support development efforts, the expansion of sales and marketing and international operation activities, the timing of new subscription introductions, and the continuing market acceptance of our subscriptions and services. We may in the future enter into arrangements to acquire or invest in complementary businesses, services and technologies, including intellectual property rights. We may be required to seek additional equity or debt financing. In the event that additional financing is required from outside sources, we may not be able to raise it on terms acceptable to us or at all. If we are unable to raise additional capital when desired, our business, results of operations and financial condition would be adversely affected.
The following table summarizes our cash flows for the periods presented:
Years Ended January 31, | |||||||||||
2018 | 2017 | 2016 | |||||||||
(in thousands) | |||||||||||
Net cash used in operating activities | $ | (44,881 | ) | $ | (38,078 | ) | $ | (46,961 | ) | ||
Net cash (used in) provided by investing activities | (172,287 | ) | 31,056 | (80,422 | ) | ||||||
Net cash provided by financing activities | $ | 209,892 | $ | 43,114 | $ | 3,087 | |||||
Non‑GAAP Free Cash Flow
To supplement our consolidated financial statements, which are prepared and presented in accordance with generally accepted accounting principles in the United States (“GAAP”), we provide investors with the amount of free cash flow, which is a non‑GAAP financial measure. Free cash flow represents net cash used in operating activities less capital expenditures and capitalized software development costs, if any. For the fiscal years ended January 31, 2018, 2017 and 2016, we did not capitalize any software development costs. Free cash flow is a measure used by management to understand and evaluate our liquidity and to generate future operating plans. The exclusion of capital expenditures and amounts capitalized for software development facilitates comparisons of our liquidity on a period‑to‑period basis and excludes items that we do not consider to be indicative of our liquidity. We believe that free cash flow is a measure of liquidity that provides useful information to our management, investors and others in understanding and evaluating the strength of our liquidity and future ability to generate cash that can be used for strategic opportunities or investing in our business in the same manner as our management and Board of Directors. Nevertheless, our use of free cash flow has limitations as an analytical tool, and you should not consider it in isolation or as a substitute for analysis of our financial results as reported under GAAP. Further, our definition of free cash flow may differ from the definitions used by other companies and therefore comparability may be limited. You should consider free cash flow alongside our other GAAP‑based financial performance measures, such as net cash used in operating activities, and our other GAAP financial results. The following table presents a reconciliation of free cash flow to net cash used in operating activities, the most directly comparable GAAP measure, for each of the periods indicated.
Years Ended January 31, | |||||||||||
2018 | 2017 | 2016 | |||||||||
(in thousands) | |||||||||||
Net cash used in operating activities | $ | (44,881 | ) | $ | (38,078 | ) | $ | (46,961 | ) | ||
Capital expenditures | (2,135 | ) | (1,683 | ) | (468 | ) | |||||
Capitalized software | — | — | — | ||||||||
Free cash flow | $ | (47,016 | ) | $ | (39,761 | ) | $ | (47,429 | ) | ||
53
Operating Activities
Cash used in operating activities during the year ended January 31, 2018 was $44.9 million primarily driven by our net loss of $96.4 million and was partially offset by non‑cash charges of $21.2 million for stock‑based compensation and $3.7 million for depreciation and amortization. In addition, our cash used in operating activities was further offset by an increase of $44.1 million in deferred revenue resulting from the overall growth of our sales and our expanding customer base, and an increase of $8.1 million in accrued liabilities mainly related to commissions and bonuses not yet paid. The change in deferred revenue and accrued liabilities was partially offset by an increase of $15.9 million in accounts receivable and $5.5 million in deferred commissions, as a result of the overall increase in revenue and deferred revenue, as well as an increase of $2.6 million in prepaid expenses and other current assets.
Cash used in operating activities during the year ended January 31, 2017 was $38.1 million primarily driven by our net loss of $86.7 million and was partially offset by non-cash charges of $21.0 million for stock-based compensation and $3.8 million for depreciation and amortization. In addition, our cash used in operating activities was further offset by an increase of $35.8 million in deferred revenue resulting from the overall growth of our sales and our expanding customer base. This change in deferred revenue was partially offset by increases of $9.3 million in accounts receivable and of $6.0 million in deferred commissions, both corresponding with our increased sales and customer expansions.
Cash used in operating activities during the year ended January 31, 2016 was $47.0 million primarily driven by our net loss of $73.5 million and was partially offset by non-cash charges of $12.8 million for stock-based compensation and $4.1 million for depreciation and amortization. In addition, our cash used in operating activities was further offset by an increase of $17.7 million in deferred revenue resulting from the overall growth of our sales and our expanding customer base. This change in deferred revenue was partially offset by an increase of $10.1 million in accounts receivable corresponding with our increased sales and customer expansions.
Investing Activities
Cash used in investing activities during the year ended January 31, 2018 of $172.3 million resulted primarily from the purchase of marketable securities, net of maturities.
Cash provided by investing activities during the year ended January 31, 2017 of $31.1 million resulted primarily from net proceeds from sales and maturities of marketable securities.
Cash used in investing activities during the year ended January 31, 2016 of $80.4 million resulted primarily from the purchase of marketable securities, net of maturities.
Financing Activities
Cash provided by financing activities during the year ended January 31, 2018 was $209.9 million. This was primarily due to $205.5 million in proceeds from our IPO completed in October 2017.
Cash provided by financing activities of $43.1 million during the year ended January 31, 2017 was primarily due to $34.9 million in net proceeds from the issuances of our Series F redeemable convertible preferred stock, and $8.2 million of proceeds from the exercise of stock options.
Cash provided by financing activities of $3.1 million during the year ended January 31, 2016 was due to proceeds from the exercise of stock options.
Off Balance Sheet Arrangements
As of January 31, 2018, we did not have any relationships with any entities or financial partnerships, such as structured finance or special purpose entities that would have been established for the purpose of facilitating off‑balance sheet arrangements or other purposes.
54
Contractual Obligations and Commitments
The following table summarizes our contractual obligations as of January 31, 2018:
Payments Due by Period | |||||||||||||||||||
Total | Less Than 1 Year | 1 to 3 Years | 3 to 5 Years | More Than 5 Years | |||||||||||||||
(in thousands) | |||||||||||||||||||
Operating lease obligations | $ | 107,960 | $ | 8,420 | $ | 17,571 | $ | 19,288 | $ | 62,681 | |||||||||
Purchase obligations | 37,330 | 13,921 | 23,409 | — | — | ||||||||||||||
Total | $ | 145,290 | $ | 22,341 | $ | 40,980 | $ | 19,288 | $ | 62,681 | |||||||||
Our purchase obligations relate to non-cancellable agreements for subscription and marketing services and capacity commitments. During the year ended January 31, 2018, we increased certain capacity commitments with respect to cloud infrastructure services. In addition, in November 2017, we entered into an enterprise partnership arrangement with a cloud infrastructure provider that includes a non-cancelable commitment of $36.0 million over three years, inclusive of capacity commitments that existed at that time of approximately $6.7 million.
In December 2017, we entered into a lease agreement for 106,230 rentable square feet of office space (the “Premises”) to accommodate our growing employee base in New York City. We received delivery of the Premises on January 1, 2018 to commence renovations of the Premises. We expect to complete our renovations and vacate our current office space prior to the expiration of our existing lease in December 2018. Total estimated aggregate base rent payments over the initial 12-year term of the lease are $87.9 million, with payments beginning 18 months after delivery of the Premises. As a result of our involvement during the construction period, whereby we have certain indemnification obligations related to the construction, we are considered, for accounting purposes only, the owner of the construction project under build-to-suit lease accounting. Accordingly, we have recorded the estimated fair value of the leased space as an asset on our consolidated balance sheet, with a corresponding long-term liability. For further details, refer to our Notes to Consolidated Financial Statements, within Part II, Item 8, Financial Statements and Supplementary Data of this Form 10-K, specifically Note 4, Property and Equipment, net and Note 6, Commitments and Contingencies.
Critical Accounting Policies and Estimates
Our financial statements are prepared in accordance with GAAP. The preparation of these financial statements requires us to make estimates and assumptions that affect the reported amounts of assets, liabilities, revenue, expenses, and related disclosures. We evaluate our estimates and assumptions on an ongoing basis. Our estimates are based on historical experience and various other assumptions that we believe to be reasonable under the circumstances. Our actual results could differ from these estimates.
The critical accounting estimates, assumptions and judgments that we believe have the most significant impact on our consolidated financial statements are described below.
Revenue Recognition
We derive our revenue from two sources: (1) sales of subscriptions, including term license and support arrangements and consumption-based hosted as-a-service offerings; and (2) services revenue comprised of evaluation, configuration and implementation services. We consider revenue realizable and earned when all of the following criteria are satisfied:
• | there is persuasive evidence of an arrangement; |
• | delivery has occurred; |
• | the collection of the fees is probable; and |
• | fees for consideration are fixed or determinable. |
Our subscription service arrangements generally are non-cancelable and do not contain refund-type provisions.
We recognize subscription revenue ratably over the contract term, provided that all other revenue recognition criteria have been met. We provide our support services pursuant to these subscription arrangements, which are primarily on an annual basis and involve technical support and access to new software versions on a when-and-if available basis. In addition,
55
revenues related to hosted as-a-service solutions are recognized on a usage-basis, as consideration for these arrangements are contingent upon the frequency that the licensee uses the product or on the size and speed of the required infrastructure of the hosted deployment. We recognize revenue from services agreements as services are delivered if sold on a stand-alone basis and over the contractual subscription period if sold as a bundled element along with our subscriptions. When services commence later than the start date of the bundled subscription, as long as all other revenue recognition criteria have been met, we record a cumulative catch up of revenue that would have been recognized over the period from the beginning of the subscription term until the commencement of services.
Subscription Revenue
Our subscription revenue is primarily comprised of time-based software licenses sold in conjunction with post-contract support (“PCS”). As our subscription offerings include a software license and PCS for which we have not established Vender Specific-Objective Evidence (“VSOE”), the entire fee is recognized ratably over the term of the contract. See "—Multiple-Element Arrangements" below. With our MongoDB Atlas product, we make our software available to our customers in a hosted as-a-service offering. Generally, revenue related to our MongoDB Atlas product is recognized on a usage-basis, as determined by the frequency that the customer uses the product and based on other characteristics of the instances they utilize.
Services Revenue
Our services contracts are provisioned on a time-and-materials, fixed-fee or subscription basis. Revenue is recognized as the services are delivered on a proportional performance basis for standalone contracts sold on a time-and-materials and fixed-fee basis. When services are sold with subscription offerings they are treated as multiple-element arrangements. All revenue in the arrangement is recognized ratably over the term of the undelivered elements assuming all other revenue recognition criteria have been met. See "—Multiple-Element Arrangements" below.
Multiple-Element Arrangements
Guidance for multiple-element arrangements (“MEA”), dictates that contract fees be allocated across each element in an MEA based on VSOE of fair value. In cases where MEA software arrangements include both delivered and undelivered elements and VSOE of fair value exists for all undelivered elements, we may utilize the residual method for allocating fair value. Essentially, revenue recognition would occur immediately for the delivered elements and commence for the undelivered element(s), assuming all other revenue recognition criteria have been met.
In the event an MEA includes both delivered and undelivered elements and we have not established VSOE for the undelivered elements, all revenue from the arrangement shall be deferred until the earlier of the point at which VSOE is established or all elements have been delivered. As an exception to this guidance, in the event VSOE is not established for the undelivered elements and the only undelivered element is either PCS or services that do not involve significant production, modification or customization of software, the entire fee shall be recognized ratably over the term of the undelivered elements assuming all other revenue recognition criteria have been met. We have not established VSOE for PCS or services.
Stock-Based Compensation Expense
We account for stock-based compensation expense related to stock-based awards based on the estimated fair value of the award on the grant date. We historically issued options to purchase shares of our common stock. In the future, we expect to issue an increased percentage of stock-based awards to our employees in the form of restricted stock units.
In November 2016 we created two classes of common stock, Class A and Class B, and exchanged all of our outstanding stock options to purchase common stock for options to purchase shares of our Class B common stock. All of our stock options granted under our 2016 Plan, which was adopted December 6, 2016, have been and will be for shares of our Class A common stock.
We estimate the fair value of stock options using the Black-Scholes option-pricing model, which requires the use of subjective assumptions, including the expected term of the option, the expected stock price volatility, expected dividend yield and the risk-free interest rate for the expected term of the option. Prior to the IPO, the fair value of common stock underlying the stock options had historically been determined by our Board of Directors, with input from the Company’s management. Our Board of Directors previously determined the fair value of the common stock at the time of grant of the options by considering a number of objective and subjective factors, including valuations of comparable companies, sales of redeemable convertible preferred stock, sales of common stock to unrelated third parties, operating and financial performance, the lack of liquidity of our capital stock, and general and industry-specific economic outlook. Subsequent to the IPO, the fair value of the
56
underlying common stock is determined by the closing price, on the date of grant, of our Class A common stock, as reported by the Nasdaq. The expected term represents the period of time the stock options are expected to be outstanding. Due to the lack of sufficient historical exercise data to provide a reasonable basis upon which to otherwise estimate the expected term of the stock options, we use the simplified method to estimate the expected term for our stock options. Under the simplified method, the expected term of an option is presumed to be the mid-point between the vesting date and the end of the contractual term. Expected volatility is based on historical volatilities for publicly traded stock of comparable companies over the estimated expected term of the stock options. We assume no dividend yield because dividends on our common stock are not expected to be paid in the near future, which is consistent with our history of not paying dividends on our common stock.
For stock-based awards issued to employees, the related stock-based compensation expense is recognized on a straight-line basis over the period in which an employee is required to provide service in exchange for the stock-based award, which is generally four years. For stock-based awards issued to non-employees, including consultants, we record expense related to stock options based on the fair value of the options calculated using the Black-Scholes option-pricing model over the service performance period.
The following table summarizes the assumptions used to estimate the fair value of stock options granted during the periods presented:
Years Ended January 31, | |||||
2018 | 2017 | 2016 | |||
Expected term (in years) | 5.85 - 6.20 | 5.77-6.99 | 6.08 | ||
Expected volatility | 41.2% - 45.7% | 41.4%-43.7% | 43.5% | ||
Risk-free interest rate | 1.8% - 2.4% | 1.2% - 2.0% | 1.5% - 1.9% | ||
Dividend yield | 0% | 0% | 0% | ||
As discussed in "Recently Adopted Accounting Pronouncements" in Note 2, Summary of Significant Accounting Policies, in the Notes to Consolidated Financial Statements included in Part II, Item 8, Financial Statements, of this Form 10-K, we have elected to early adopt Accounting Standards Update No. 2016-09, Compensation—Stock Compensation (Topic 718): Improvement to Employee Share-based Payment Accounting, which, among other things, permits an entity to make an entity-wide policy election to either (1) estimate the number of awards that are expected to vest or (2) account for forfeitures when they occur. We have elected to account for forfeitures as they occur, rather than estimate expected forfeitures beginning on February 1, 2016.
We will continue to use judgment in evaluating the assumptions related to our stock-based compensation on a prospective basis. As we continue to accumulate additional data related to our common stock, we may have refinements to our estimates, which could materially impact our future stock-based compensation expense.
Recent Accounting Pronouncements
See Note 2, Summary of Significant Accounting Policies, in the Notes to Consolidated Financial Statements included in Part II, Item 8, Financial Statements, of this Form 10-K for a discussion of recent accounting pronouncements.
JOBS Act
As an “emerging growth company,” the Jumpstart Our Business Startups Act of 2012 (the “JOBS Act”), allows us to delay adoption of new or revised accounting pronouncements applicable to public companies until such pronouncements are made applicable to private companies. We have elected to use this extended transition period under the JOBS Act. As a result, our financial statements may not be comparable to the financial statements of public companies who are required to comply with the effective dates for new or revised accounting standards, which may make comparison of our financial statements to those of other public companies more difficult.
57
Item 7A. Quantitative and Qualitative Disclosures About Market Risk
We have operations both within the United States and internationally, and we are exposed to market risk in the ordinary course of business.
Interest Rate Risk
Our cash and cash equivalents primarily consist of bank deposits and money market funds, and our short-term investments consist of U.S. government treasury securities. As of January 31, 2018 and 2017, we had cash, cash equivalents and short-term investments of $279.0 million and $116.5 million, respectively. The carrying amount of our cash equivalents reasonably approximates fair value, due to the short maturities of these instruments. The primary objectives of our investment activities are the preservation of capital, the fulfillment of liquidity needs and the fiduciary control of cash and investments. We do not enter into investments for trading or speculative purposes. Our investments are exposed to market risk due to a fluctuation in interest rates, which may affect our interest income and the fair market value of our investments. The effect of a hypothetical 10% increase or decrease in interest rates would not have had a material impact on the fair market value of our investments as of January 31, 2018 and 2017.
Foreign Currency Risk
Our sales contracts are primarily denominated in U.S. dollars, British pounds (“GBP”) or Euros (“EUR”). A portion of our operating expenses are incurred outside the United States and denominated in foreign currencies and are subject to fluctuations due to changes in foreign currency exchange rates, particularly changes in the GBP and EUR. Additionally, fluctuations in foreign currency exchange rates may cause us to recognize transaction gains and losses in our statement of operations. The effect of a hypothetical 10% change in foreign currency exchange rates applicable to our business would not have a material impact on our historical consolidated financial statements for the years ended January 31, 2018 and 2017. Given the impact of foreign currency exchange rates has not been material to our historical operating results, we have not entered into derivative or hedging transactions, but we may do so in the future if our exposure to foreign currency should become more significant. As our international operations grow, we will continue to reassess our approach to manage our risk relating to fluctuations in currency rates.
58
Item 8. Financial Statements and Supplementary Data
MongoDB, Inc.
Form 10-K
For the Fiscal Year Ended January 31, 2018
INDEX TO CONSOLIDATED FINANCIAL STATEMENTS
Page | |
Financial Statements: | |
The supplementary financial information required by this Item 8, is included in Part II, Item 7, Management’s Discussion and Analysis of Financial Condition and Results of Operations, under the caption “Quarterly Results of Operations Data,” which is incorporated herein by reference.
59
Report of Independent Registered Public Accounting Firm
To the Board of Directors and Stockholders of MongoDB, Inc.
Opinion on the Financial Statements
We have audited the accompanying consolidated balance sheets of MongoDB, Inc. and its subsidiaries as of January 31, 2018 and January 31, 2017, and the related consolidated statements of operations, of comprehensive loss, of redeemable convertible preferred stock and stockholders’ equity (deficit), and of cash flows for each of the three years in the period ended January 31, 2018, including the related notes and schedule of valuation and qualifying accounts for each of the three years in the period ended January 31, 2018 appearing under Item 15(a)(2) (collectively referred to as the “consolidated financial statements”). In our opinion, the consolidated financial statements present fairly, in all material respects, the financial position of the Company as of January 31, 2018 and January 31, 2017, and the results of its operations and its cash flows for each of the three years in the period ended January 31, 2018 in conformity with accounting principles generally accepted in the United States of America.
Basis for Opinion
These consolidated financial statements are the responsibility of the Company's management. Our responsibility is to express an opinion on the Company’s consolidated financial statements based on our audits. We are a public accounting firm registered with the Public Company Accounting Oversight Board (United States) (“PCAOB”) and are required to be independent with respect to the Company in accordance with the U.S. federal securities laws and the applicable rules and regulations of the Securities and Exchange Commission and the PCAOB.
We conducted our audits of these consolidated financial statements in accordance with the standards of the PCAOB. Those standards require that we plan and perform the audit to obtain reasonable assurance about whether the consolidated financial statements are free of material misstatement, whether due to error or fraud.
Our audits included performing procedures to assess the risks of material misstatement of the consolidated financial statements, whether due to error or fraud, and performing procedures that respond to those risks. Such procedures included examining, on a test basis, evidence regarding the amounts and disclosures in the consolidated financial statements. Our audits also included evaluating the accounting principles used and significant estimates made by management, as well as evaluating the overall presentation of the consolidated financial statements. We believe that our audits provide a reasonable basis for our opinion.
/s/ PricewaterhouseCoopers LLP
San Jose, California
March 30, 2018
We have served as the Company's auditor since 2013.
60
MONGODB, INC.
CONSOLIDATED BALANCE SHEETS
(in thousands, except share and per share data)
As of January 31, | |||||||
2018 | 2017 | ||||||
Assets | |||||||
Current assets: | |||||||
Cash and cash equivalents | $ | 61,902 | $ | 69,305 | |||
Short-term investments | 217,072 | 47,195 | |||||
Accounts receivable, net of allowance for doubtful accounts of $1,238 and $958 as of January 31, 2018 and 2017, respectively | 46,872 | 31,340 | |||||
Deferred commissions | 11,820 | 7,481 | |||||
Prepaid expenses and other current assets | 5,884 | 3,131 | |||||
Total current assets | 343,550 | 158,452 | |||||
Property and equipment, net | 59,557 | 4,877 | |||||
Goodwill | 1,700 | 1,700 | |||||
Acquired intangible assets, net | 1,627 | 2,511 | |||||
Deferred tax assets | 326 | 114 | |||||
Other assets | 8,436 | 6,778 | |||||
Total assets | $ | 415,196 | $ | 174,432 | |||
Liabilities, Redeemable Convertible Preferred Stock and Stockholders’ Equity (Deficit) | |||||||
Current liabilities: | |||||||
Accounts payable | $ | 2,261 | $ | 2,841 | |||
Accrued compensation and benefits | 17,433 | 11,402 | |||||
Other accrued liabilities | 8,423 | 5,269 | |||||
Deferred revenue | 114,500 | 78,278 | |||||
Total current liabilities | 142,617 | 97,790 | |||||
Redeemable convertible preferred stock warrant liability | — | 1,272 | |||||
Deferred rent, non-current | 925 | 1,058 | |||||
Deferred tax liability, non-current | 18 | 108 | |||||
Deferred revenue, non-current | 22,930 | 15,461 | |||||
Other liabilities, non-current | 55,213 | — | |||||
Total liabilities | 221,703 | 115,689 | |||||
Commitments and contingencies (Note 6) | |||||||
Redeemable convertible preferred stock, par value $0.001 per share; no shares authorized, issued or outstanding as of January 31, 2018; 41,234,841 shares authorized as of January 31, 2017; 41,148,282 shares issued and outstanding with aggregate liquidation preference of $345,997 as of January 31, 2017 | — | 345,257 | |||||
Stockholders’ equity (deficit): | |||||||
Class A common stock, par value of $0.001 per share; 1,000,000,000 and 162,500,000 shares authorized as of January 31, 2018 and 2017, respectively; 13,303,028 and no shares issued and outstanding as of January 31, 2018 and 2017, respectively | 13 | — | |||||
Class B common stock, par value of $0.001 per share; 100,000,000 and 113,000,000 shares authorized as of January 31, 2018 and 2017, respectively; 37,371,914 and 13,192,992 shares issued as of January 31, 2018 and 2017, respectively; 37,272,543 and 13,093,621 shares outstanding as of January 31, 2018 and 2017, respectively | 38 | 13 | |||||
Additional paid-in capital | 638,680 | 62,557 | |||||
Treasury stock, 99,371 shares (repurchased at an average of $13.27 per share) as of January 31, 2018 and 2017 | (1,319 | ) | (1,319 | ) | |||
Accumulated other comprehensive loss | (159 | ) | (364 | ) | |||
Accumulated deficit | (443,760 | ) | (347,401 | ) | |||
Total stockholders’ equity (deficit) | 193,493 | (286,514 | ) | ||||
Total liabilities, redeemable convertible preferred stock and stockholders’ equity (deficit) | $ | 415,196 | $ | 174,432 | |||
The accompanying notes are an integral part of these consolidated financial statements.
61
MONGODB, INC.
CONSOLIDATED STATEMENTS OF OPERATIONS
(in thousands, except share and per share data)
Years Ended January 31, | |||||||||||
2018 | 2017 | 2016 | |||||||||
Revenue: | |||||||||||
Subscription | $ | 141,490 | $ | 91,235 | $ | 58,561 | |||||
Services | 13,029 | 10,123 | 6,710 | ||||||||
Total revenue | 154,519 | 101,358 | 65,271 | ||||||||
Cost of revenue: | |||||||||||
Subscription | 30,766 | 19,352 | 13,146 | ||||||||
Services | 12,093 | 10,515 | 7,715 | ||||||||
Total cost of revenue | 42,859 | 29,867 | 20,861 | ||||||||
Gross profit | 111,660 | 71,491 | 44,410 | ||||||||
Operating expenses: | |||||||||||
Sales and marketing | 109,950 | 78,584 | 56,613 | ||||||||
Research and development | 62,202 | 51,772 | 43,465 | ||||||||
General and administrative | 36,775 | 27,082 | 17,070 | ||||||||
Total operating expenses | 208,927 | 157,438 | 117,148 | ||||||||
Loss from operations | (97,267 | ) | (85,947 | ) | (72,738 | ) | |||||
Other income (expense): | |||||||||||
Interest income | 1,308 | 302 | 146 | ||||||||
Interest expense | (8 | ) | (9 | ) | (24 | ) | |||||
Other income (expense), net | 895 | (308 | ) | (428 | ) | ||||||
Loss before provision for income taxes | (95,072 | ) | (85,962 | ) | (73,044 | ) | |||||
Provision for income taxes | 1,287 | 719 | 442 | ||||||||
Net loss | $ | (96,359 | ) | $ | (86,681 | ) | $ | (73,486 | ) | ||
Net loss per share attributable to common stockholders, basic and diluted | $ | (4.06 | ) | $ | (7.10 | ) | $ | (6.54 | ) | ||
Weighted-average shares used to compute net loss per share attributable to common stockholders, basic and diluted for Class A and Class B | 23,718,391 | 12,211,711 | 11,240,696 | ||||||||
The accompanying notes are an integral part of these consolidated financial statements.
62
MONGODB, INC.
CONSOLIDATED STATEMENTS OF COMPREHENSIVE LOSS
(in thousands)
Years Ended January 31, | |||||||||||
2018 | 2017 | 2016 | |||||||||
Net loss | $ | (96,359 | ) | $ | (86,681 | ) | $ | (73,486 | ) | ||
Other comprehensive income (loss), net of tax: | |||||||||||
Unrealized (loss) gain on available-for-sale securities | (88 | ) | 18 | (33 | ) | ||||||
Foreign currency translation adjustments | 293 | (31 | ) | (59 | ) | ||||||
Other comprehensive income (loss) | 205 | (13 | ) | (92 | ) | ||||||
Total comprehensive loss | $ | (96,154 | ) | $ | (86,694 | ) | $ | (73,578 | ) | ||
The accompanying notes are an integral part of these consolidated financial statements.
63
MONGODB, INC.
CONSOLIDATED STATEMENT OF REDEEMABLE CONVERTIBLE PREFERRED STOCK AND STOCKHOLDERS’ EQUITY (DEFICIT)
(in thousands, except share data)
Redeemable Convertible Preferred Stock | Class A and Class B Common Stock | Additional Paid-In Capital | Treasury Stock | Accumulated Other Comprehensive Loss | Accumulated Deficit | Total Stockholders’ Equity (Deficit) | |||||||||||||||||||||||||||
Shares | Amount | Shares | Amount | ||||||||||||||||||||||||||||||
Balances as of January 31, 2015 | 39,055,497 | $ | 310,315 | 11,001,782 | $ | 11 | $ | 16,337 | $ | (1,319 | ) | $ | (259 | ) | $ | (185,783 | ) | $ | (171,013 | ) | |||||||||||||
Stock option exercises | — | — | 579,390 | 1 | 2,907 | — | — | — | 2,908 | ||||||||||||||||||||||||
Vesting of early exercised stock options | — | — | — | — | 391 | — | — | — | 391 | ||||||||||||||||||||||||
Repurchase of common stock | — | — | (15,408 | ) | — | — | — | — | — | — | |||||||||||||||||||||||
Stock-based compensation | — | — | — | — | 12,787 | — | — | — | 12,787 | ||||||||||||||||||||||||
Unrealized loss on available-for-sale securities | — | — | — | — | — | — | (33 | ) | — | (33 | ) | ||||||||||||||||||||||
Foreign currency translation adjustment | — | — | — | — | — | — | (59 | ) | — | (59 | ) | ||||||||||||||||||||||
Net loss | — | — | — | — | — | — | — | (73,486 | ) | (73,486 | ) | ||||||||||||||||||||||
Balances as of January 31, 2016 | 39,055,497 | 310,315 | 11,565,764 | 12 | 32,422 | (1,319 | ) | (351 | ) | (259,269 | ) | (228,505 | ) | ||||||||||||||||||||
Cumulative effect of accounting change | — | — | — | — | 1,451 | — | — | (1,451 | ) | — | |||||||||||||||||||||||
Proceeds from Series F financing, net of issuance costs of $58 | 2,092,785 | 34,942 | — | — | — | — | — | — | — | ||||||||||||||||||||||||
Stock option exercises | — | — | 1,534,211 | 1 | 6,777 | — | — | — | 6,778 | ||||||||||||||||||||||||
Vesting of early exercised stock options | — | — | — | — | 903 | — | — | — | 903 | ||||||||||||||||||||||||
Repurchase of common stock | — | — | (6,354 | ) | — | — | — | — | — | — | |||||||||||||||||||||||
Stock-based compensation | — | — | — | — | 21,004 | — | — | — | 21,004 | ||||||||||||||||||||||||
Unrealized gain on available-for-sale securities | — | — | — | — | — | — | 18 | — | 18 | ||||||||||||||||||||||||
Foreign currency translation adjustment | — | — | — | — | — | — | (31 | ) | — | (31 | ) | ||||||||||||||||||||||
Net loss | — | — | — | — | — | — | — | (86,681 | ) | (86,681 | ) | ||||||||||||||||||||||
Balances as of January 31, 2017 | 41,148,282 | 345,257 | 13,093,621 | 13 | 62,557 | (1,319 | ) | (364 | ) | (347,401 | ) | (286,514 | ) | ||||||||||||||||||||
Exercise of preferred stock warrants | 85,170 | 1,171 | — | — | — | — | — | — | — | ||||||||||||||||||||||||
Exercise of common stock warrants | — | — | 99,534 | 1 | — | — | — | — | 1 | ||||||||||||||||||||||||
Stock option exercises | — | — | 1,263,722 | 1 | 5,596 | — | — | — | 5,597 | ||||||||||||||||||||||||
Repurchase of early exercised options | — | — | (34,710 | ) | — | — | — | — | — | — | |||||||||||||||||||||||
Conversion of redeemable convertible preferred stock to common stock | (41,233,452 | ) | (346,428 | ) | 26,953,404 | 27 | 346,401 | — | — | — | 346,428 | ||||||||||||||||||||||
Issuance of common stock upon Initial public offering, net of offering costs | — | — | 9,200,000 | 9 | 201,611 | — | — | — | 201,620 | ||||||||||||||||||||||||
Vesting of early exercised stock options | — | — | — | — | 1,280 | — | — | — | 1,280 | ||||||||||||||||||||||||
Stock-based compensation | — | — | — | — | 21,235 | — | — | — | 21,235 | ||||||||||||||||||||||||
Unrealized gain on available-for-sale securities | — | — | — | — | — | — | (88 | ) | — | (88 | ) | ||||||||||||||||||||||
Foreign currency translation adjustment | — | — | — | — | — | — | 293 | — | 293 | ||||||||||||||||||||||||
Net loss | — | — | — | — | — | — | — | (96,359 | ) | (96,359 | ) | ||||||||||||||||||||||
Balances as of January 31, 2018 | — | $ | — | 50,575,571 | $ | 51 | $ | 638,680 | $ | (1,319 | ) | $ | (159 | ) | $ | (443,760 | ) | $ | 193,493 | ||||||||||||||
The accompanying notes are an integral part of these consolidated financial statements.
64
MONGODB, INC.
CONSOLIDATED STATEMENTS OF CASH FLOWS
(in thousands)
Years Ended January 31, | |||||||||||
2018 | 2017 | 2016 | |||||||||
Cash flows from operating activities | |||||||||||
Net loss | $ | (96,359 | ) | $ | (86,681 | ) | $ | (73,486 | ) | ||
Adjustments to reconcile net loss to net cash used in operating activities: | |||||||||||
Depreciation and amortization | 3,703 | 3,751 | 4,062 | ||||||||
Stock-based compensation | 21,235 | 21,004 | 12,787 | ||||||||
Deferred income taxes | (302 | ) | (4 | ) | (2 | ) | |||||
Change in fair value of warrant liability | (101 | ) | (38 | ) | (52 | ) | |||||
Change in operating assets and liabilities: | |||||||||||
Accounts receivable | (15,901 | ) | (9,263 | ) | (10,123 | ) | |||||
Prepaid expenses and other current assets | (2,595 | ) | (450 | ) | (460 | ) | |||||
Deferred commissions | (5,545 | ) | (6,019 | ) | (533 | ) | |||||
Other long-term assets | (687 | ) | (784 | ) | (27 | ) | |||||
Accounts payable | (371 | ) | 1,296 | 371 | |||||||
Deferred rent | (133 | ) | (672 | ) | (681 | ) | |||||
Accrued liabilities | 8,115 | 3,948 | 3,478 | ||||||||
Deferred revenue | 44,060 | 35,834 | 17,705 | ||||||||
Net cash used in operating activities | (44,881 | ) | (38,078 | ) | (46,961 | ) | |||||
Cash flows from investing activities | |||||||||||
Purchases of property and equipment | (2,135 | ) | (1,683 | ) | (468 | ) | |||||
Proceeds from maturities of marketable securities | 82,230 | 114,775 | 38,000 | ||||||||
Purchases of marketable securities | (252,382 | ) | (82,036 | ) | (117,954 | ) | |||||
Net cash (used in) provided by investing activities | (172,287 | ) | 31,056 | (80,422 | ) | ||||||
Cash flows from financing activities | |||||||||||
Proceeds from exercise of stock options, including early exercised stock options | 8,367 | 8,220 | 3,104 | ||||||||
Repurchase of early exercised stock options | (242 | ) | (48 | ) | (17 | ) | |||||
Proceeds from issuance of Series F financing, net of issuance cost | — | 34,942 | — | ||||||||
Proceeds from initial public offering, net of underwriting discounts and commissions | 205,494 | — | — | ||||||||
Proceeds from exercise of redeemable convertible preferred stock warrants | 1 | — | — | ||||||||
Payment of initial public offering costs | (3,728 | ) | — | — | |||||||
Net cash provided by financing activities | 209,892 | 43,114 | 3,087 | ||||||||
Effect of exchange rate changes on cash, cash equivalents, and restricted cash | 291 | 7 | (92 | ) | |||||||
Net (decrease) increase in cash, cash equivalents, and restricted cash | (6,985 | ) | 36,099 | (124,388 | ) | ||||||
Cash, cash equivalents, and restricted cash, beginning of period | 69,412 | 33,313 | 157,701 | ||||||||
Cash, cash equivalents, and restricted cash, end of period | $ | 62,427 | $ | 69,412 | $ | 33,313 | |||||
65
Supplemental cash flow disclosure | |||||||||||
Cash paid during the period for: | |||||||||||
Income taxes, net of refunds | $ | 1,004 | $ | 411 | $ | 522 | |||||
Interest | $ | 8 | $ | 16 | $ | 14 | |||||
Noncash investing and financing activities | |||||||||||
Issuance of Series F redeemable convertible preferred stock warrants | $ | — | $ | — | $ | 151 | |||||
Vesting of early exercised stock options | $ | 1,280 | $ | 903 | $ | 391 | |||||
Conversion of redeemable convertible preferred stock warrant liability to redeemable convertible preferred stock as a result of warrant exercise | $ | 1,171 | $ | — | $ | — | |||||
Conversion of redeemable convertible preferred stock to common stock | $ | 346,428 | $ | — | $ | — | |||||
Estimated fair value of office space under a build-to-suit lease | $ | 54,709 | $ | — | $ | — | |||||
Reconciliation of cash, cash equivalents, and restricted cash within the consolidated balance sheets to the amounts shown in the statements of cash flows above: | |||||||||||
Cash and cash equivalents | $ | 61,902 | $ | 69,305 | $ | 33,205 | |||||
Restricted cash, current | 525 | 107 | 108 | ||||||||
Total cash, cash equivalents and restricted cash | $ | 62,427 | $ | 69,412 | $ | 33,313 | |||||
The accompanying notes are an integral part of these consolidated financial statements.
66
MONGODB, INC.
NOTES TO CONSOLIDATED STATEMENTS OF OPERATIONS
1. | Organization and Description of Business |
MongoDB, Inc. (“MongoDB” or the “Company”) was originally incorporated in the state of Delaware in November 2007 under the name 10Gen, Inc. In August 2013, the Company changed its name to MongoDB, Inc. The Company is headquartered in New York City. MongoDB is the leading, modern, general purpose database platform. The Company’s robust platform enables developers to build and modernize applications rapidly and cost-effectively across a broad range of use cases. Organizations can deploy our platform at scale in the cloud, on-premise or in a hybrid environment. In addition to selling its software, the Company provides post-contract support, training, and consulting services for its offerings. The Company’s fiscal year ends January 31.
Reverse Stock Split
In October 2017, the Company’s Board of Directors (the “Board of Directors”) and stockholders approved an amendment to the Company’s amended and restated certificate of incorporation effecting a 1-for-2 reverse stock split of the Company’s issued and outstanding shares of common stock and accordingly adjusted the conversion rate of the Series A, B, C, D and E redeemable convertible preferred stock to common stock to 1:0.75 and the conversion rate of the Series F redeemable convertible preferred stock to common stock to 1:0.5. The reverse split was effected on October 5, 2017. The par value of the common stock and redeemable convertible preferred stock was not adjusted as a result of the reverse stock split. All issued and outstanding share and per share amounts included in the accompanying consolidated financial statements have been adjusted to reflect this reverse stock split for all periods presented.
Initial Public Offering
In October 2017, the Company closed its initial public offering (“IPO”) of 9,200,000 shares of its Class A common stock at an offering price of $24.00 per share, including 1,200,000 shares pursuant to the underwriters’ option to purchase additional shares of the Company’s Class A common stock. The Company received net proceeds of $201.6 million, after deducting underwriting discounts and commissions of $15.5 million and offering expenses of $3.9 million. Immediately prior to the closing of the IPO, all 41,232,762 shares of the Company’s then-outstanding redeemable convertible preferred stock automatically converted into 26,952,887 shares of common stock at their respective conversion ratios and the Company reclassified $346.4 million from temporary equity to Class B common stock and additional paid-in capital on its consolidated balance sheet.
2. | Summary of Significant Accounting Policies |
Basis of Presentation
The consolidated financial statements have been prepared in accordance with accounting principles generally accepted in the United States of America (“U.S. GAAP”) and include the accounts of the Company and its wholly owned subsidiaries. All intercompany transactions and accounts have been eliminated.
Use of Estimates
The preparation of the consolidated financial statements in conformity with U.S. GAAP requires management to make estimates and assumptions that affect the reported amounts of assets and liabilities, disclosure of contingent assets and liabilities at the date of the financial statements, and the reported amounts of revenue and expenses during the reporting period. Such estimates include, but are not limited to, revenue recognition, allowances for doubtful accounts, stock-based compensation, fair value of common stock and redeemable convertible preferred stock warrants prior to the IPO, legal contingencies, fair value of acquired intangible assets and goodwill, useful lives of acquired intangible assets and property and equipment, and accounting for income taxes. The Company bases these estimates on historical and anticipated results, trends and various other assumptions that it believes are reasonable under the circumstances, including assumptions as to future events. Actual results could differ from those estimates.
67
Emerging Growth Company Status
As an “emerging growth company” (“EGC”), the Jump-start Our Business Start-ups Act (“JOBS Act”), allows the Company to delay adoption of new or revised accounting pronouncements applicable to public companies until such pronouncements are made applicable to private companies. The Company has elected to use this extended transition period under the JOBS Act. As a result, the Company’s financial statements may not be comparable to the financial statements of issuers who are required to comply with the effective dates for new or revised accounting standards that are applicable to public companies, which may make the Company’s common stock less attractive to investors.
Foreign Currency
The functional currency of the Company’s international subsidiaries is either the U.S. dollar or the local currency in which the international subsidiary operates. For these subsidiaries where the U.S. dollar is the functional currency, foreign currency denominated monetary assets and liabilities are re-measured into U.S. dollars at current exchange rates and foreign currency denominated nonmonetary assets and liabilities are re-measured into U.S. dollars at historical exchange rates. Gains or losses from foreign currency re-measurement and settlements are included in other income (expense), net in the consolidated statements of operations. For foreign subsidiaries where the functional currency is the local currency, the Company uses the period-end exchange rates to translate assets and liabilities, and the average exchange rates to translate revenue and expenses into U.S. dollars. The Company records translation gains and losses in accumulated other comprehensive income (loss) as a component of stockholders' equity (deficit).
Comprehensive Loss
The Company’s comprehensive loss includes net loss and unrealized gains and losses on available-for-sale securities and foreign currency translation adjustments.
Cash and Cash Equivalents
The Company considers all highly liquid investments, including money market funds with an original maturity of three months or less at the date of purchase, to be cash equivalents.
Marketable Securities
The Company’s short-term investments consist of U.S. government treasury securities and money market instruments. The Company determines the appropriate classification of its short-term investments at the time of purchase and reevaluates such designation at each balance sheet date. The Company has classified and accounted for its short-term investments as available-for-sale securities as the Company may sell these securities at any time for use in its current operations or for other purposes, even prior to maturity. As a result, the Company classifies its short-term investments within current assets on the consolidated balance sheets.
Available-for-sale securities are recorded at fair value each reporting period. Unrealized gains and losses on these short-term investments are reported as a separate component of accumulated other comprehensive loss on the consolidated balance sheets until realized. The Company periodically evaluates its short-term investments to assess whether those with unrealized loss positions are other than temporarily impaired. The Company considers various factors in determining whether to recognize an impairment charge. Realized gains and losses are determined based on the specific identification method and are reported in interest income in the consolidated statements of operations. If the Company determines that the decline in an investment's fair value is other-than-temporary, the difference is recognized as an impairment loss in the consolidated statements of operations. As of January 31, 2018 and 2017, the Company has not recorded any other-than-temporary-impairment in its consolidated statements of operations.
Restricted Cash
The Company pledged $0.5 million and $0.1 million of collateral for its available credit on corporate credit cards as of January 31, 2018 and 2017, respectively. Restricted cash balances are included in other assets on the consolidated balance sheets.
68
Fair Value of Financial Instruments
The Company’s financial instruments consist of cash equivalents, short-term investments, accounts receivable, accounts payable, accrued liabilities and the redeemable convertible preferred stock warrant liability. Cash equivalents are stated at amortized cost, which approximates fair value at the balance sheet dates, due to the short period of time to maturity. Short-term investments are recorded at fair value. Accounts receivable, accounts payable and accrued liabilities are stated at their carrying value, which approximates fair value due to the short time to the expected receipt or payment date. The redeemable convertible preferred stock warrant liability is carried at fair value.
Assets and liabilities recorded at fair value on a recurring basis in the balance sheets consisting of cash equivalents, short-term investments and the redeemable convertible preferred stock warrant liability are categorized based upon the level of judgment associated with the inputs used to measure their fair values. Fair value is defined as the exchange price that would be received for an asset or paid to transfer a liability (an exit price) in the principal or most advantageous market for the asset or liability in an orderly transaction between market participants on the measurement date. Valuation techniques used to measure fair value must maximize the use of observable inputs and minimize the use of unobservable inputs. The standard describes a fair value hierarchy based on three levels of inputs, as described below, of which the first two are considered observable and the last unobservable, that may be used to measure fair value:
• | Level 1: Observable inputs, such as quoted prices (unadjusted) in active markets for identical assets or liabilities at the measurement date. |
• | Level 2: Observable inputs, other than Level 1 prices, such as quoted prices in active markets for similar assets and liabilities, quoted prices in markets that are not active, or other inputs that are observable or can be corroborated by observable market data for substantially the full term of the assets or liabilities. |
• | Level 3: Unobservable inputs that are supported by little or no market activity and that are significant to the fair value of the assets or liabilities. |
The Company’s financial instruments that are carried at fair value consist of Level 1 assets and Level 3 liabilities. Level 1 assets include highly liquid money market funds classified as cash equivalents and U.S. government treasury securities classified as short-term investments. Level 3 liabilities consist of the redeemable convertible preferred stock warrant liability.
Concentration of Credit Risk
Financial instruments that potentially subject us to concentrations of credit risk are primarily cash, cash equivalents, restricted cash, short-term investments, and accounts receivable. The primary focus of the Company’s investment strategy is to preserve capital and meet liquidity requirements. The Company maintains its cash accounts with financial institutions where, at times, deposits exceed federal insurance limits. The Company invests its excess cash in highly-rated money market funds and in short-term investments consisting of U.S. government treasury securities. The Company extends credit to customers in the normal course of business. The Company performs credit analyses and monitors the financial health of its customers to reduce credit risk. Trade accounts receivable are recorded at the invoiced amount and do not bear interest. The Company records an allowance for doubtful accounts relating to certain trade accounts receivable. The allowance is based on various factors, including the review of credit profiles of its customers, contractual terms and conditions, current economic trends and historical customer payment experience.
As of January 31, 2018 and 2017, no customer represented 10% or more of net accounts receivable. For the years ended January 31, 2018, 2017 and 2016, no customer represented 10% of more of revenue.
Allowance for Doubtful Accounts
The Company performs initial and ongoing evaluations of its customers' financial position, and generally extends credit without collateral. The Company determines the need for an allowance for doubtful accounts based upon various factors, including past collection experience, credit quality of the customer, age of the receivable balance, and current economic conditions, as well as specific circumstances arising with individual customers. Trade receivables are written off against the allowance when management determines a balance is uncollectible and the Company no longer actively pursues collection of the receivable.
69
Capitalized Software Costs
Software development costs for software to be sold, leased, or otherwise marketed are expensed as incurred until the establishment of technological feasibility, at which time those costs are capitalized until the product is available for general release to customers and amortized over the estimated life of the product. Technological feasibility is established upon the completion of a working prototype that has been certified as having no critical bugs and is a release candidate. To date, costs and time incurred between the establishment of technological feasibility and product release have not been material, resulting in software development costs qualifying for capitalization being immaterial. As a result, all software development costs have been recorded in research and development expense in the consolidated statements of operations.
Costs related to software acquired, developed, or modified solely to meet the Company’s internal requirements, with no substantive plans to market such software at the time of development, or costs related to development of web-based product are capitalized. Costs incurred during the preliminary planning and evaluation stage of the project and during post implementation operational stage are expensed as incurred. Costs incurred during the application development stage of the project are capitalized. The Company did not capitalize any costs related to computer software developed for internal use or web-based product in the years ended January 31, 2018 and 2017.
Property and Equipment
Property and equipment are recorded at cost and depreciated over their estimated useful lives using the straight-line method and the following estimated useful lives:
Property and Equipment | Estimated Useful Life | |
Computer and office equipment | Two to three years | |
Purchased software | Two to three years | |
Servers | Three years | |
Furniture and fixtures | Five years | |
Leasehold improvements | Lesser of estimated useful life or remaining lease term | |
Upon retirement or sale, the cost of assets disposed of, and the related accumulated depreciation, is removed from the accounts and any resulting gain or loss is reflected in the consolidated statements of operations. There was no material gain or loss incurred as a result of retirement or sale in the periods presented. Repair and maintenance costs are expensed as incurred.
Long-Lived Assets, Including Goodwill and Other Acquired Intangible Assets
The Company evaluates the recoverability of property and equipment and amortizable intangible assets for possible impairment whenever events or circumstances indicate that the carrying amount of such assets may not be recoverable. Recoverability of these assets is measured by a comparison of the carrying amounts to the future undiscounted cash flows the assets are expected to generate. If such review indicates that the carrying amount of property and equipment and intangible assets is not recoverable, the carrying amount of such assets is reduced to fair value. In addition, the Company tests goodwill for impairment at least annually or more frequently if events or changes in circumstances indicate that this asset may be impaired. These tests are based on the Company’s single operating segment and reporting unit structure. No indications of impairment of goodwill were noted during the years ended January 31, 2018 and 2017.
Acquired amortizable intangible assets are amortized on a straight-line basis over the estimated useful lives of the assets. The estimated remaining useful lives for intangible assets range from 1.8 to 2.2 years as of January 31, 2018 and 2.8 to 3.2 years as of January 31, 2017.
In addition to the recoverability assessment, the Company periodically reviews the remaining estimated useful lives of property and equipment and amortizable intangible assets. If the estimated useful life assumption for any asset is changed, the remaining unamortized balance would be depreciated or amortized over the revised estimated useful life, on a prospective basis.
70
Deferred Rent
Rent expense is recognized on a straight-line basis over the non-cancelable term of the operating lease. The Company records the difference between cash rent payments and recognized rent expense as a deferred rent liability included in accrued liabilities and other liabilities on the consolidated balance sheets. Incentives granted under the Company’s facility leases, including allowances to fund leasehold improvements, are deferred and are recognized as adjustments to rental expense on a straight-line basis over the term of the lease.
Revenue Recognition
The Company derives its revenue from two sources: (1) sales of subscriptions, including term license and technical support arrangements, and consumption-based hosted as-a-service offerings; and (2) services revenue comprised of consulting and training arrangements. The Company considers revenue realizable and earned when all of the following criteria are satisfied:
• | there is persuasive evidence of an arrangement; |
• | delivery has occurred; |
• | the collection of the fees is probable; and |
• | fees for consideration are fixed or determinable. |
The Company’s subscription service arrangements generally are non-cancelable and do not contain refund-type provisions.
The Company recognizes subscription revenue ratably over the contract term, provided that all other revenue recognition criteria have been met. The Company provides its support services pursuant to these subscription arrangements, which are primarily on an annual basis and involve technical support and access to new software versions on a when-and-if available basis. In addition, revenue related to hosted as-a-service solutions are recognized on a usage-basis, as consideration for these arrangements are contingent upon the frequency that the licensee uses the product or on the size and speed of the required infrastructure of the hosted deployment. The Company recognizes revenue from services agreements on a percent complete basis if sold on a stand-alone basis and over the contractual subscription period if sold as a bundled element along with the Company’s subscriptions. When services commence later than the start date of the subscription, no revenue is recognized until services commence. Once services commence, as long as all other revenue recognition criteria have been met, we record a cumulative catch up of revenue that would have been recognized over the period from the beginning of the subscription term until the commencement of services.
Subscription Revenue
The Company’s subscription revenue is primarily comprised of time-based software licenses sold in conjunction with post-contract customer support (“PCS”). The Company typically bills subscription revenue annually in advance. As the Company’s subscription offerings include a software license and PCS for which the Company has not established Vendor Specific Objective Evidence (“VSOE”), the entire fee is recognized ratably over the term of the PCS. See "—Multiple-Element Arrangements" section below. In certain circumstances, the Company makes software available to its customers online under hosting arrangements. The online services are currently comprised of an automated database backup storage tool, a database management automation tool and a database as-a-service tool wherein the customer can purchase storage, security and monitoring capabilities. Generally, revenue related to hosted as-a-service solutions are recognized on a usage-basis, as consideration for these arrangements are contingent upon the frequency that the licensee uses the product or on the size and speed of the required infrastructure of the hosted deployment.
Services Revenue
The Company’s services contracts are provisioned on either a time-and-materials basis, fixed-fee basis or subscription basis. Revenue is recognized on a proportional performance basis as the services are delivered for standalone time and materials contracts and for standalone fixed price contracts. As arrangements in which services are sold with subscription offerings are in essence multiple-element arrangements, all revenue in the arrangement is recognized ratably over the term of the undelivered elements assuming all other revenue recognition criteria have been met. See "—Multiple-Element Arrangements" section below.
71
Multiple-Element Arrangements
Guidance for multiple-element arrangements (“MEA”) dictate that contract fees be allocated across each element in an MEA based on VSOE of fair value. In cases where MEA software arrangements include both delivered and undelivered elements and VSOE of fair value exists for all undelivered elements, the Company may utilize the residual method for allocating fair value. Essentially, revenue recognition occurs immediately for the delivered elements and commences for the undelivered element(s), assuming all other revenue recognition criteria have been met.
In the event an MEA includes both delivered and undelivered elements, and the Company has not established VSOE for the undelivered elements, all revenue from the arrangement shall be deferred until the earlier of the point at which VSOE is established or all elements have been delivered. As an exception to this guidance, in the event VSOE is not established for the undelivered elements and the only undelivered element is either PCS or services that do not involve significant production, modification or customization of software, the entire fee is recognized ratably over the term of the undelivered elements assuming all other revenue recognition criteria have been met and services are generally provided at the beginning or over the course of the arrangement.
Cost of Revenue
Cost of revenue consists primarily of costs related to providing the Company’s subscription and hosting services to its paying customers, including personnel costs, including salaries, bonuses and benefits, and stock-based compensation and related expenses for datacenter operations, customer support and services personnel, as well as depreciation of servers and equipment.
Deferred Commissions and Commissions Expense
Deferred commissions are the incremental costs that are directly associated with non-cancelable subscription contracts with customers and consist of sales commissions paid to the Company’s direct sales force. The commissions are deferred and amortized over the non-cancelable terms of the related customer contracts. Sales commissions are generally paid up front and one month in arrears, however, payment timing is based on contractual terms of the underlying subscription contract and is subject to an evaluation of customer credit-worthiness. The deferred commission amounts are recoverable through the future revenue streams under the non-cancelable customer contracts. The Company capitalized commission costs of $15.5 million and $14.2 million for the years ended January 31, 2018 and 2017, respectively. Amortization of deferred commissions is included in sales and marketing expense in the consolidated statements of operations. As of January 31, 2018 and 2017, the Company recorded short-term deferred commissions of $11.8 million and $7.5 million, respectively, and long-term deferred commissions of $6.8 million and $5.6 million, respectively, in other long-term assets on the consolidated balance sheets.
Research and Development
Research and development costs are expensed as incurred and consist primarily of personnel costs, including salaries, bonuses and benefits, and stock-based compensation. Research and development costs also include amortization associated with intangible acquired assets and allocated overhead.
Advertising
Advertising costs are charged to operations as incurred or the first time the advertising takes place, based on the nature of the advertising, and include direct marketing, events, public relations, sales collateral materials and partner programs. Advertising costs were $3.4 million, $2.4 million and $1.2 million for the years ended January 31, 2018, 2017 and 2016, respectively. Advertising costs are recorded in sales and marketing expenses in the consolidated statement of operations.
Redeemable Convertible Preferred Stock Warrant
The Company previously issued redeemable convertible preferred stock warrants, which required liability classification and accounting as the underlying convertible preferred stock were contingently redeemable as discussed in Note 8, Warrants. As of January 31, 2018, all redeemable convertible preferred stock warrants were exercised in full.
Common Stock Warrant
The Company previously issued common stock warrants, as discussed in Note 8, Warrants, which were measured at their estimated fair value upon issuance using the Black-Scholes pricing model and were recorded in additional paid-in capital on the consolidated balance sheets. As of January 31, 2018, all common stock warrants were exercised in full.
72
Stock-Based Compensation
Compensation expense related to stock options granted to employees is calculated based on the fair value of stock-based awards on the date of grant. The Company determines the grant date fair value of the awards using the Black-Scholes option-pricing model. The related stock-based compensation expense is recognized on a straight-line basis over the period in which an employee is required to provide service in exchange for the stock-based award, which is generally four years.
For stock-based awards issued to non-employees, including consultants, the Company records expense related to stock options based on the fair value of the options calculated using the Black-Scholes option-pricing model over the service performance period. The Company believes that the fair value of the stock options is more reliably measured than the fair value of the services received. The fair value of each non-employee stock-based compensation award is re-measured each period until a commitment date is reached, which is generally the vesting date.
The Company’s stock price volatility and expected option life involve management's best estimates, both of which impact the fair value of the option calculated under the Black-Scholes option pricing model and, ultimately, the expense that will be recognized over the life of the option. During the year ended January 31, 2017, the Company adopted Accounting Standards Update (“ASU”) 2016-09 allowing the recognition of forfeitures as they occur. See "Recently Adopted Accounting Pronouncements" for the impact of the adoption.
Net Loss Per Share
The Company calculates basic and diluted net loss per share attributable to common stockholders in conformity with the two-class method required for companies with participating securities. The Company considers all series of redeemable convertible preferred stock to be participating securities as the holders are entitled to receive non-cumulative dividends on a pari passu basis in the event that a dividend is paid on common stock. Under the two-class method, the net loss attributable to common stockholders is not allocated to the redeemable convertible preferred stock as the holders of redeemable convertible preferred stock do not have a contractual obligation to share in losses.
Under the two-class method, basic net loss per share attributable to common stockholders is calculated by dividing the net loss by the weighted-average number of shares of common stock outstanding during the period, less shares subject to repurchase. Diluted net loss per share attributable to common stockholders is computed by giving effect to all potentially dilutive common stock equivalents outstanding for the period. For purposes of this calculation, redeemable convertible preferred stock, stock options to purchase common stock, early exercised stock options, and warrants to purchase redeemable convertible preferred stock and common stock are considered common shares equivalents, but have been excluded from the calculation of diluted net loss per share attributable to common stockholders as their effect is antidilutive.
Segment Information
The Company operates as one operating segment as it only reports financial information on an aggregate and consolidated basis to the Company’s Chief Executive Officer, who is the chief operating decision maker.
Income Taxes
The Company follows the asset and liability method of accounting for income taxes. This method requires recognition of deferred tax assets and liabilities for the expected future tax consequences of temporary differences between the carrying amounts and the tax basis of assets and liabilities. A valuation allowance has been established for the full amount of the net deferred tax assets as the Company has determined that the future realization of the tax benefit is not more likely than not.
The Company recognizes the tax benefit from uncertain tax positions only if it is more likely than not that the tax position will be sustained on examination by the tax authorities, based on the technical merits of the position. The tax benefit is measured based on the largest benefit that is more likely than not of being realized upon ultimate settlement. The Company recognizes interest and penalties on amounts due to taxing authorities as a component of other income and (expense), net.
On December 22, 2017, the 2017 Tax Cuts and Jobs Act (the “Tax Act”) was enacted into law and the new legislation significantly revised the Internal Revenue Code of 1986, as amended. The newly enacted federal income tax law, among other things, contains significant changes to corporate taxation, including the reduction of the corporate tax rate from a top marginal rate of 35% to a flat rate of 21%, limitation of the tax deduction for interest expense to 30% of adjusted earnings, limitation of the deduction for newly generated net operating losses (“NOLs”) to 80% of current year taxable income and elimination of NOL carrybacks, one time taxation of offshore earnings at reduced rates regardless of whether they are repatriated (the “Transition Tax”), future taxation of certain classes of offshore earnings regardless of whether they are
73
repatriated, immediate deductions for certain new investments instead of deductions for depreciation expense over time, and modifying or repealing many business deductions and credits. The Company is required to recognize the effect of these significant tax law changes in the period of enactment.
Also on December 22, 2017, the SEC staff issued Staff Accounting Bulletin No. 118, Income Tax Accounting Implications of the Tax Cuts and Jobs Act (“SAB 118”), which allows the Company to record provisional amounts during a measurement period not to extend beyond one year of the enactment date. Given the significant complexity of the Tax Act, anticipated guidance from the Internal Revenue Service about implementing the Tax Act, and the potential for additional guidance from the SEC or the FASB related to the Tax Act, the Company’s current estimates may be adjusted in future periods. The Company expects to complete its analysis within the measurement period in accordance with SAB 118. Any subsequent adjustments to current estimates will be recorded to tax expense during the quarter in the Company’s fiscal year ending January 31, 2019 in which the Company’s analysis of and accounting for the Tax Act is complete. Refer to Note 11, Income Taxes, for further information.
Related Party Transactions
All contracts with related parties are executed in the ordinary course of business. There were no material related party transactions in the years ended January 31, 2018, 2017 and 2016. As of January 31, 2018 and 2017, there were no material amounts payable to or amounts receivable from related parties.
Recently Adopted Accounting Pronouncements
Stock-Based Compensation. Starting February 1, 2016, the Company elected to early adopt ASU No. 2016-09, Compensation—Stock Compensation (Topic 718): Improvement to Employee Share-based Payment Accounting, which would among other items, provide an accounting policy election to account for forfeitures as they occur, rather than to account for them based on an estimate of expected forfeitures and modifies financial statement presentation of excess tax benefits or deficiencies. The Company elected to account for forfeitures as they occur and therefore, stock-based compensation expense for the years ended months ended January 31, 2018 and 2017 has been calculated based on actual forfeitures in the consolidated statements of operations. The cumulative effect of this change increased the accumulated deficit and decreased additional paid-in capital as of February 1, 2016 by $1.5 million. In addition, the effect on the Company’s historical consolidated financial statements was limited to an immaterial cumulative-effect adjustment for previously unrecognized excess tax benefits as a deferred tax asset with an offset to opening accumulated deficit, which was fully offset by a valuation allowance.
In May 2017, the Financial Accounting Standards Board (“FASB”), issued ASU 2017-09, Compensation—Stock Compensation (Topic 718). The amendments in the update provide guidance on types of changes to the terms or conditions of share-based payment awards, which would be required to apply modification accounting under Accounting Standards Codification (“ASC”) 718. The new guidance became effective for the Company for the fiscal year ending January 31, 2018. The adoption of ASU 2017-09 did not have a material impact on the Company’s consolidated financial statements.
Consolidated Statements of Cash Flows. Starting February 1, 2016, the Company elected to early adopt ASU No. 2016-15, Statement of Cash Flows (Topic 230): Classification of Certain Cash Receipts and Cash Payments and ASU No. 2016-18, Statement of Cash Flows (Topic 230): Restricted Cash. ASU No. 2016-15 eliminates the diversity in practice related to the classification of certain cash receipts and payments for debt prepayment or extinguishment costs, the maturing of a zero-coupon bond, the settlement of contingent liabilities arising from a business combination, proceeds from insurance settlements, distributions from certain equity method investees and beneficial interests obtained in a financial asset securitization. ASU No. 2016-18 requires that the statement of cash flows explain the change during the period in the total of cash, cash equivalents, and amounts generally described as restricted cash or restricted cash equivalents. The Company adopted ASU No. 2016-15 and ASU No. 2016-18 using the retrospective transition method and adjusted the consolidated statements of cash flows in all comparative periods presented.
New Accounting Pronouncements Not Yet Adopted
Goodwill Impairment. In January 2017, the FASB issued ASU 2017-04—Intangibles—Goodwill and Other (Topic 350): Simplifying the Test for Goodwill Impairment. The new standard will simplify the measurement of goodwill by eliminating step two of the two-step impairment test. Step two measures a goodwill impairment loss by comparing the implied fair value of a reporting unit’s goodwill with the carrying amount of that goodwill. The new guidance requires an entity to compare the fair value of a reporting unit with its carrying amount and recognize an impairment charge for the amount by which the carrying amount exceeds the reporting unit’s fair value. Additionally, an entity should consider income
74
tax effects from any tax deductible goodwill on the carrying amount of the reporting unit when measuring the goodwill impairment loss, if applicable. The new guidance becomes effective for the Company for the fiscal year ending January 31, 2022, though early adoption is permitted. The Company does not expect the adoption of the new accounting standard to have a material impact on its consolidated financial statements.
Leases. In February 2016, the FASB issued ASU No. 2016-02, Leases (Topic 842), which modifies lease accounting for lessees to increase transparency and comparability by recording lease assets and liabilities for operating leases and disclosing key information about leasing arrangements. Depending on when the Company loses its EGC status, it may be required to adopt the new lease standard as early as its interim results for the period ending April 30, 2019, but no later than for its annual results for the fiscal year ending January 31, 2021, though early adoption is permitted. The Company is currently evaluating adoption methods and whether this standard will have a material impact on its consolidated financial statements.
Revenue Recognition. In May 2014, the FASB issued ASU No. 2014-09, Revenue from Contracts with Customers (Topic 606), which amends the existing accounting standard for revenue recognition. ASU 2014-09 is based on principles that govern the recognition of revenue at an amount to which an entity expects to be entitled when products are transferred to customers. Subsequently, the FASB has issued the following pronouncements related to ASU 2014-09: ASU No. 2016-08, Revenue from Contracts with Customers (Topic 606): Principal versus Agent Considerations; ASU No. 2016-10, Revenue from Contracts with Customers (Topic 606): Identifying Performance Obligations and Licensing; ASU No. 2016-12, Revenue from Contracts with Customers (Topic 606): Narrow-Scope Improvements and Practical Expedients; and ASU 2016-20, Technical Corrections and Improvements to Topic 606, which clarifies narrow aspects of ASC 606 or corrects unintended application of the guidance. The Company must adopt ASU 2016-08, ASU 2016-10, ASU 2016-12, and ASU 2016-20 with ASU 2014-09 (collectively, the “new revenue standard”).
The Company plans to adopt the new revenue standard using the full retrospective transition method when it becomes effective for the Company. Depending on when the Company loses its EGC status, it may be required to adopt the new revenue standard as early as its annual results for the fiscal year ending January 31, 2019, but no later than for its annual results for the fiscal year ending January 31, 2020, though early adoption is permitted. While the Company continues to assess the potential impacts of the new revenue standard, the Company currently expects unearned subscription revenue to decline significantly upon adoption. Currently, as the Company’s subscription offerings include software term licenses and post-contract customer support for which the Company has not established vendor specific objective evidence (“VSOE”), the entire subscription fee is recognized ratably over the term of the contract. However, under the new revenue standard, the requirement for VSOE for undelivered elements is eliminated and, as a result, the Company will be required to identify all deliverables in a contract and recognize revenue based on each deliverable separately. The Company currently expects that the portion related to the software term license deliverable will be recognized upon delivery. The Company is in the process of determining the revenue recognition impact for the other deliverables of each contract. The Company continues to evaluate the effect that the new revenue standard will have on its consolidated financial statements and related disclosures, and preliminary assessments are subject to change.
3. | Fair Value Measurements |
The following tables present information about the Company’s financial assets and liabilities that have been measured at fair value on a recurring basis as of January 31, 2018 and 2017, and indicate the fair value hierarchy of the valuation inputs utilized to determine such fair value (in thousands):
Fair Value Measurement at January 31, 2018 | |||||||||||||||
Level 1 | Level 2 | Level 3 | Total | ||||||||||||
Financial Assets: | |||||||||||||||
Cash equivalents: | |||||||||||||||
Money market funds | $ | 45,918 | $ | — | $ | — | $ | 45,918 | |||||||
Short-term investments: | |||||||||||||||
U.S. government treasury securities | 217,072 | — | — | 217,072 | |||||||||||
Total financial assets | $ | 262,990 | $ | — | $ | — | $ | 262,990 | |||||||
75
Fair Value Measurement at January 31, 2017 | |||||||||||||||
Level 1 | Level 2 | Level 3 | Total | ||||||||||||
Financial Assets: | |||||||||||||||
Cash equivalents: | |||||||||||||||
Money market funds | $ | 35,104 | $ | — | $ | — | $ | 35,104 | |||||||
U.S. government treasury securities | 20,000 | — | — | 20,000 | |||||||||||
Short-term investments: | |||||||||||||||
U.S. government treasury securities | 47,195 | — | — | 47,195 | |||||||||||
Total financial assets | $ | 102,299 | $ | — | $ | — | $ | 102,299 | |||||||
Financial Liability: | |||||||||||||||
Redeemable convertible preferred stock warrant liability | $ | — | $ | — | $ | 1,272 | $ | 1,272 | |||||||
Total financial liability | $ | — | $ | — | $ | 1,272 | $ | 1,272 | |||||||
The Company utilized the market approach and Level 1 valuation inputs to value its money market mutual funds and U.S. government treasury securities because published net asset values were readily available. As of January 31, 2018 and 2017, gross unrealized gains and unrealized losses for cash equivalents and short-term investments were not material, and the contractual maturity of all marketable securities was less than one year.
The Company’s redeemable convertible preferred stock warrants were categorized as Level 3 because they were valued based on unobservable inputs and management’s judgment due to the absence of quoted mark prices, inherent lack of liquidity and the long-term nature of such financial instruments. The Company estimated the fair value of its historical redeemable convertible preferred stock warrant liability using the Black-Scholes pricing model. The significant unobservable inputs used in the fair value measurement of the redeemable convertible preferred stock warrant liability were the fair value of the underlying stock at the valuation date and the estimated term of the warrant. Generally, increases (decreases) in the fair value of the underlying stock and estimated term resulted in a directionally similar impact to the fair value measurement, as recognized in other income (expense), net in the consolidated statements of operations. As of January 31, 2018, all previously outstanding redeemable convertible preferred stock warrants were fully exercised, as described in Note 8, Warrants.
The following table presents a reconciliation of the redeemable convertible preferred stock warrant liability measured at fair value using significant unobservable inputs (in thousands):
Fair value, beginning balance, January 31, 2017 | $ | 1,272 | |
Issuance of redeemable convertible preferred stock warrants | — | ||
Conversion of redeemable convertible preferred stock warrant liability into redeemable convertible preferred stock | (1,171 | ) | |
Change in fair value of redeemable convertible preferred stock warrant liability | (101 | ) | |
Fair value, ending balance, January 31, 2018 | $ | — | |
76
4. | Property and Equipment, Net |
Property and equipment, net consists of the following (in thousands):
January 31, 2018 | January 31, 2017 | ||||||
Servers | $ | 4,279 | $ | 4,175 | |||
Furniture and fixtures | 2,259 | 2,014 | |||||
Computer and office equipment | 175 | 309 | |||||
Purchased software | 887 | 702 | |||||
Leasehold improvements | 8,548 | 7,235 | |||||
Construction in process | 883 | 171 | |||||
Building | 54,709 | — | |||||
Total property and equipment | 71,740 | 14,606 | |||||
Less: accumulated depreciation and amortization | (12,183 | ) | (9,729 | ) | |||
Property and equipment, net | $ | 59,557 | $ | 4,877 | |||
In December 2017, the Company entered into a lease agreement for 106,230 rentable square feet of office space to accommodate its growing employee base in New York City. As a result of the Company’s involvement during the construction period, whereby the Company has certain indemnification obligations related to the construction, the Company is considered, for accounting purposes only, the owner of the construction project under build-to-suit lease accounting. As a result, the Company has recorded the estimated fair value of the leased space as an asset, noted in the table above as “Building.” Costs incurred to renovate the new office space will be capitalized as “Construction in process” and when completed, will increase the “Building” asset, as well as the corresponding long-term liability. Refer to Note 6, Commitments and Contingencies for further details.
Depreciation and amortization expense related to property and equipment was $2.8 million and $2.9 million for the years ended January 31, 2018 and 2017, respectively.
5. | Acquired Intangible Assets, Net |
The gross carrying amount and accumulated amortization of the Company’s intangible assets are as follows (in thousands):
January 31, 2018 | |||||||||||
Gross Carrying Value | Accumulated Amortization | Net Book Value | |||||||||
Developed technology | $ | 4,300 | $ | (2,723 | ) | $ | 1,577 | ||||
Domain name | 155 | (105 | ) | 50 | |||||||
Total | $ | 4,455 | $ | (2,828 | ) | $ | 1,627 | ||||
January 31, 2017 | |||||||||||
Gross Carrying Value | Accumulated Amortization | Net Book Value | |||||||||
Developed technology | $ | 4,300 | $ | (1,863 | ) | $ | 2,437 | ||||
Domain name | 155 | (81 | ) | 74 | |||||||
Total | $ | 4,455 | $ | (1,944 | ) | $ | 2,511 | ||||
Acquired intangible assets are amortized on a straight-line basis. As of January 31, 2018, the weighted-average remaining useful lives of identifiable, acquisition-related intangible assets was 1.8 years for developed technology and 2.2 years for domain name. Amortization expense of intangible assets was $0.9 million for each of the years ended January 31, 2018, 2017 and 2016.
77
As of January 31, 2018, future amortization expense related to the intangible assets is as follows (in thousands):
Years Ending January 31, | |||
2019 | $ | 883 | |
2020 | 740 | ||
2021 | 4 | ||
Total | $ | 1,627 | |
6. | Commitments and Contingencies |
Future minimum lease payments under non-cancelable office leases and other non-cancelable agreements as of January 31, 2018, were as follows (in thousands):
Year Ending January 31, | Operating Leases | Other Obligations | |||||
2019 | $ | 8,420 | $ | 13,921 | |||
2020 | 6,641 | 12,222 | |||||
2021 | 10,930 | 11,187 | |||||
2022 | 9,658 | — | |||||
2023 | 9,630 | — | |||||
Thereafter | 62,681 | — | |||||
Total minimum payments | $ | 107,960 | $ | 37,330 | |||
Operating Leases
The Company has entered into non-cancellable operating leases, primarily related to rental of office space expiring through 2029. The Company recognizes operating lease costs on a straight-line basis over the term of the agreement, taking into account adjustments for market provisions such as free or escalating base monthly rental payments or deferred payment terms such as rent holidays that defer the commencement date of the required payments. The Company may receive renewal or expansion options, leasehold improvement allowances or other incentives on certain lease agreements. Total rent expense related to operating leases was $9.1 million, $7.0 million and $5.3 million for the years ended January 31, 2018, 2017 and 2016, respectively.
In August 2016, the Company amended an existing irrevocable, standby letter of credit with Silicon Valley Bank for $0.5 million to serve as a security deposit for the Company’s headquarters lease in New York City. The amendment reduced the letter of credit from $1.1 million to $0.5 million. In January 2017, the Company entered into an irrevocable, standby letter of credit with Silicon Valley Bank for $0.4 million to serve as a security deposit for the Company’s lease in Texas. In October 2017, the Company entered into an irrevocable, standby letter of credit with Silicon Valley Bank for $0.2 million to serve as a security deposit for the Company’s lease in Australia. These letters of credit mature at various dates, but do not extend beyond the corresponding lease agreements for which such letter of credit has been obtained.
In December 2017, the Company entered into a lease agreement for 106,230 rentable square feet of office space (the “Premises”) to accommodate its growing employee base in New York City. The Company received delivery of the Premises on January 1, 2018 to commence construction to renovate the Premises and expects to complete its renovations and vacate its current office space prior to the expiration of its existing lease in December 2018. Total estimated aggregate base rent payments over the initial 12-year term of the lease are $87.9 million, with payments beginning 18 months after delivery of the Premises.
As a result of the Company’s involvement during the construction period, whereby the Company has certain indemnification obligations related to the construction, the Company is considered, for accounting purposes only, the owner of the construction project under build-to-suit lease accounting. Refer to Note 4, Property and Equipment, net for further details. Once the construction of the Premises is completed, which is estimated to be prior to December 2018, the Company will evaluate the lease in order to determine whether or not the lease meets the criteria for “sale-leaseback” treatment.
78
Other Obligations
The Company has entered into certain other non-cancelable agreements primarily for subscription, marketing services and capacity commitments. During the year ended January 31, 2018, the Company increased certain capacity commitments with respect to cloud infrastructure services. In addition, in November 2017, the Company entered into an enterprise partnership arrangement with a cloud infrastructure provider that includes a non-cancelable commitment of $36.0 million over the next three years, inclusive of capacity commitments that existed at that time of approximately $6.7 million.
Legal Matters
From time to time, the Company has become involved in claims and other legal matters arising in the ordinary course of business. The Company investigates these claims as they arise. Although claims are inherently unpredictable, the Company is currently not aware of any matters that, if determined adversely to the Company, would individually or taken together have a material adverse effect on its business, financial position, results of operations or cash flows.
The Company accrues estimates for resolution of legal and other contingencies when losses are probable and estimable. From time to time, the Company is a party to litigation and subject to claims and threatened claims incident to the ordinary course of business, including intellectual property claims, labor and employment claims, breach of contract claims, and other matters.
Although the results of litigation and claims are inherently unpredictable, the Company believes that there was not at least a reasonable possibility that the Company had incurred a material loss with respect to such loss contingencies, as of January 31, 2018 and 2017, therefore, the Company has not recorded an accrual for such contingencies.
Indemnification
The Company enters into indemnification provisions under its agreements with other companies in the ordinary course of business, including business partners, landlords, contractors and parties performing its research and development. Pursuant to these arrangements, the Company agrees to indemnify, hold harmless, and reimburse the indemnified party for certain losses suffered or incurred by the indemnified party as a result of the Company’s activities. The terms of these indemnification agreements are generally perpetual. The maximum potential amount of future payments the Company could be required to make under these agreements is not determinable. The Company has never incurred costs to defend lawsuits or settle claims related to these indemnification agreements. As a result, the Company believes the fair value of these agreements is not material. The Company maintains commercial general liability insurance and product liability insurance to offset certain of the Company’s potential liabilities under these indemnification provisions.
The Company has entered into indemnification agreements with each of its directors and executive officers. These agreements require the Company to indemnify such individuals, to the fullest extent permitted by Delaware law, for certain liabilities to which they may become subject as a result of their affiliation with the Company.
7. | Stockholders’ Equity (Deficit) |
Redeemable Convertible Preferred Stock
The Company previously issued redeemable convertible preferred stock in one or more series, each with such designations, rights, qualifications, limitations, and restrictions as set forth in the Company’s certificate of incorporation, as in effect prior to the IPO. Immediately prior to the completion of the IPO, as described in Note 1, Organization and Business Description, all shares of redeemable convertible preferred stock then outstanding were automatically converted to 26,952,887 shares of Class B common stock at the respective conversion ratios.
Class A and Class B Common Stock
The Company has two classes of common stock, Class A and Class B. The rights of the holders of Class A and Class B common stock are identical, except with respect to voting. Each share of Class A common stock is entitled to one vote per share. Each share of Class B common stock is entitled to 10 votes per share. Shares of Class B common stock may be converted to Class A common stock at any time at the option of the stockholder. Shares of Class B common stock automatically convert to Class A common stock upon the following: (i) sale or transfer of such share of Class B common stock, subject to specified permitted transfers; (ii) the death of the Class B common stockholder (or nine months after the date of death if the stockholder is one of the founders); and (iii) on the final conversion date, defined as the earlier of (a) the first trading day on or after the date on which the outstanding shares of Class B common stock represent less than 10% of the
79
then-outstanding Class A and Class B common stock; or (b) the date specified by vote of the Board of Directors and the holders of a majority of the outstanding shares of Class B common stock and redeemable convertible preferred stock, voting together as a single class on an as-converted basis. Class A and Class B common stock are referred to as common stock throughout the notes to the consolidated financial statements, unless otherwise noted.
As of January 31, 2018, the Company had authorized 1,000,000,000 shares and 100,000,000 shares of Class A and Class B common stock, respectively, each par value $0.001 per share, of which 13,303,028 shares of Class A common stock were issued and outstanding and 37,371,914 and 37,272,543 shares of Class B common stock were issued and outstanding, respectively.
8. | Warrants |
Redeemable Convertible Preferred Stock Warrants
The Company previously issued warrants to purchase Series E and Series F redeemable convertible preferred stock at an exercise price of $0.01 per share in connection with a software development contract with a customer. During the year ended January 31, 2018, warrants to purchase 45,301 shares of Series E redeemable convertible preferred stock and 41,258 shares of Series F redeemable convertible preferred stock were exercised in full, representing the total number of redeemable convertible preferred stock warrants outstanding. Upon the exercise of these warrants, the aggregate fair value of the Series E and Series F redeemable convertible preferred stock warrant liabilities was re-measured to be $1.2 million on the exercise date and was reclassified to redeemable convertible preferred stock. During the year ended January 31, 2018, these shares of redeemable convertible preferred stock were automatically converted to 53,562 shares of Class B common stock at the respective conversion ratios.
Common Stock Warrants
In April 2013, in connection with a lease agreement and a loan agreement with the same financial institution, the Company issued immediately exercisable and fully vested warrants to purchase an aggregate of 116,258 shares of Class B common stock at an exercise price of $5.72 per share. Furthermore, in April 2013, in connection with a loan agreement with another financial institution, the Company issued immediately exercisable and fully vested warrants to purchase 5,785 shares of Class B common stock at an exercise price of $5.72 per share. These warrants were net exercised in full during the year ended January 31, 2018 and the Company issued 99,534 shares of Class B common stock upon such exercise. No common stock warrants were outstanding as of January 31, 2018.
9. | Equity Incentive Plans |
2008 and 2016 Stock Plan
In 2008 and 2016, the Company adopted the 2008 Stock Incentive Plan (as amended, the “2008 Plan”), and the 2016 Equity Incentive Plan (as amended, the “2016 Plan”), primarily for the purpose of granting stock-based awards to employees, directors and consultants, including stock options and other stock-based awards including restricted stock units (“RSUs”). With the establishment of the 2016 Plan in December 2016, all shares available for grant under the 2008 Plan were transferred to the 2016 Plan. The Company no longer grants any stock-based awards under the 2008 Plan and any shares underlying stock options canceled under the 2008 Plan will be automatically transferred to the 2016 Plan. Stock options granted under the stock option plans may be either incentive stock options (“ISOs”) or nonstatutory stock options (“NSOs”). ISOs may be granted to employees and NSOs may be granted to employees, directors, or consultants. As of January 31, 2018, the Company made one ISO grant, all other stock options outstanding were granted as NSOs. The exercise prices of the stock option grants must be not less than 100% of the fair value of the common stock on the grant date as determined by the Board of Directors. If, at the date of grant, the optionee owns more than 10% of the total combined voting power of all classes of outstanding stock (a “10% stockholder”), the exercise price must be at least 110% of the fair value of the common stock on the date of grant as determined by the Board of Directors. Options granted are exercisable over a maximum term of 10 years from the date of grant or five years from the date of grant for ISOs granted to any 10% stockholder. The Board of Directors or a committee thereof determines the vesting schedule for all equity awards. Stock option awards generally vest over a period of four years with 25% vesting on the one year anniversary of the award and the remainder vesting monthly over the next 36 months of the grantee’s service to the Company. RSU awards generally vest over a period of four years with 25% vesting on the one year anniversary of the award and the remainder vesting quarterly over the next 12 quarters of the grantee’s service to the Company.
80
Stock Options and Restricted Stock Units
The following table summarizes stock option and RSU award activity for the 2008 and 2016 Plans (in thousands, except share and per share data and years):
Options Outstanding | |||||||||||||||
Shares Available for Grant | Shares | Weighted- Average Exercise Price Per Share | Weighted- Average Remaining Contractual Term (In Years) | Aggregate Intrinsic Value | |||||||||||
Balance - January 31, 2016 | 974,433 | 9,322,281 | $ | 13.20 | 8.3 | $ | 8,459 | ||||||||
Authorized | 3,000,000 | — | — | ||||||||||||
Options granted | (4,404,228 | ) | 4,404,228 | 6.74 | |||||||||||
Options exercised | — | (1,534,211 | ) | 5.43 | |||||||||||
Early exercised shares repurchased | 6,354 | — | — | ||||||||||||
Options forfeited and expired | 1,101,701 | (1,101,701 | ) | 11.09 | |||||||||||
Balance - January 31, 2017 | 678,260 | 11,090,597 | 6.47 | 8.2 | $ | 21,717 | |||||||||
Authorized | 6,979,900 | — | — | ||||||||||||
Options granted | (3,642,275 | ) | 3,642,275 | 10.80 | |||||||||||
Options exercised | — | (1,263,722 | ) | 6.59 | |||||||||||
Early exercised shares repurchased | 34,710 | — | — | ||||||||||||
Options forfeited and expired | 831,715 | (831,715 | ) | 7.73 | |||||||||||
RSUs granted | (245,746 | ) | |||||||||||||
Balance - January 31, 2018 | 4,636,564 | 12,637,435 | 7.63 | 7.7 | 246,227 | ||||||||||
Options vested and exercisable - January 31, 2017 | 4,344,092 | 6.21 | 7.3 | 9,875 | |||||||||||
Options vested and exercisable - January 31, 2018 | 5,540,858 | $ | 6.33 | 6.6 | $ | 115,122 | |||||||||
Options vested and exercisable - Stock options vested and expected to vest - January 31, 2018 | 12,637,435 | $ | 7.63 | 7.7 | $ | 246,227 | |||||||||
The weighted-average grant-date fair value of options granted was $4.76 per share, $2.91 per share, and $7.53 per share during the years ended January 31, 2018, 2017 and 2016, respectively. The intrinsic value of options exercised for the years ended January 31, 2018, 2017 and 2016 was determined to be $4.1 million, $2.9 million, and $6.5 million, respectively.
The total grant date fair value of options vested for the years ended January 31, 2018, 2017 and 2016, was $13.5 million, $15.5 million, and $11.6 million, respectively. As of January 31, 2018, we had stock-based compensation expenses of $37.4 million, related to unvested stock options that we expect to recognize over a weighted-average period of 2.54 years.
During the year ended January 31, 2018, the Company granted 245,746 RSUs with a total grant date fair value of $6.4 million. No RSUs were vested, forfeited or canceled as of January 31, 2018. No RSUs were granted during the year ended January 31, 2017.
2016 China Stock Appreciation Rights Plan
In April 2016, the Company adopted the 2016 China Stock Appreciation Rights Plan (as amended, the “China SAR Plan”) for its employees in China. For grants made prior to the IPO, the China SAR Plan included a service vesting condition and a performance vesting condition. The service vesting condition is generally over four years with 25% vesting on the one year anniversary of the award and the remainder vesting monthly over the next 36 months of the grantee’s service to the Company. The performance vesting condition is defined as the Company’s common stock being publicly traded (a qualifying liquidity event). The China SAR Plan units are cash settled upon exercise and will be paid as a cash bonus equal to the difference between the strike price of the vested plan units and the fair market value of common stock at the end of each reporting period.
81
For the year ended January 31, 2017, the Company granted 21,500 units of the China SAR Plan at a weighted average strike price of $6.78 per share. The Company granted 8,000 units under this plan for the year ended January 31, 2018. All of the units granted during the year ended January 31, 2017 were still outstanding as of January 31, 2018. During the year ended January 31, 2018, upon the vesting of 9,302 units, the total expense and liability related to China SAR for the year ended January 31, 2018 was $0.2 million and was recorded as part of the “Accrued compensation and benefits” on the Company’s consolidated balance sheet. The Company did not recognize any compensation expense related to the China SAR Plan prior to October 18, 2017 because the Company had determined the performance conditions, with respect to the occurrence of a qualifying liquidity event, were not probable until the successful IPO.
2017 Employee Stock Purchase Plan
In October 2017, the Board of Directors adopted, and stockholders approved, the 2017 Employee Stock Purchase Plan (“ESPP”). A total of 995,000 shares of the Company’s Class A common stock have been initially authorized for issuance under the 2017 ESPP. Subject to any plan limitations, the 2017 ESPP allows eligible employees to contribute, normally through payroll deductions, up to 15% of their earnings for the purchase of the Company’s Class A common stock at a discounted price per share. Except for the initial offering period, the ESPP provides for separate six-month offering periods. The initial offering period will run from October 18, 2017 through June 15, 2018.
Unless otherwise determined by the Board of Directors, the Company’s Class A common stock will be purchased for the accounts of employees participating in the ESPP at a price per share that is the lesser of (1) 85% of the fair market value of the Company’s Class A common stock on the first trading day of the offering period, which for the initial offering period is the price at which shares of the Company’s Class A common stock were first sold to the public, or (2) 85% of the fair market value of the Company’s Class A common stock on the last trading day of the offering period.
During the year ended January 31, 2018, no shares of Class A common stock were purchased under the 2017 ESPP. The total expense related to the 2017 ESPP for year ended January 31, 2018 was $0.7 million.
Stock Option Repricing
On April 13, 2016, the Company amended all then-current employee and active non-employee stock options with an exercise price greater than $6.50 per share that remained outstanding and unexercised on such date to reprice their respective exercise prices to $6.50 per share, the fair market value of the Company’s common stock as of April 13, 2016, as determined by the Board of Directors. Pursuant to this repricing, options to purchase 6,898,736 shares of common stock were repriced, including options to purchase 3,303,786 shares of common stock held by the Company’s executive officers. The Company determined the total incremental compensation expense related to the repriced awards was $10.7 million, of which $2.4 million and $5.6 million was recorded during the years ended January 31, 2018 and 2017, respectively.
Early Exercise of Stock Options
The Company allows employees and directors to exercise options granted prior to vesting. The unvested shares are subject to lapsing repurchase rights upon termination of employment. For early exercised stock options under the 2008 Plan, the repurchase price is at the original purchase price. For early exercised stock options under the 2016 Plan, the repurchase price is the lower of (i) the then-current fair market value of the common stock on the date of repurchase, and (ii) the original purchase price. The proceeds initially are recorded in other current and noncurrent liabilities from the early exercise of stock options and reclassified to common stock and paid-in capital as the repurchase right lapses.
For the years ended January 31, 2018 and 2017, the Company issued common stock of 363,894 and 240,678 shares, respectively, for stock options exercised prior to vesting. For the years ended January 31, 2018 and 2017, the Company repurchased 34,710 and 6,354 shares, respectively, of common stock related to unvested stock options at the original exercise price due to the termination of employees. As of January 31, 2018 and 2017, there were 256,640 and 118,059 shares, respectively, held by employees and directors that were subject to potential repurchase at an aggregate price of $2 million and $0.8 million, respectively.
Determination of Fair Value
The determination of the fair value of stock options on the date of grant using an option-pricing model is affected by the fair value of the Company’s common stock, as well as assumptions regarding a number of complex and subjective variables. The Company uses the Black-Scholes option-pricing model to calculate the fair value of stock options, which requires the use of assumptions including actual and projected employee stock option exercise behaviors, expected price
82
volatility of the Company’s common stock, the risk-free interest rate and expected dividends. Each of these inputs is subjective and generally requires significant judgment to determine.
Fair Value of Common Stock. Prior to the IPO, the fair value of common stock underlying the stock options had historically been determined by the Board of Directors, with input from the Company’s management. The Board of Directors previously determined the fair value of the common stock at the time of grant of the options by considering a number of objective and subjective factors, including valuations of comparable companies, sales of redeemable convertible preferred stock, sales of common stock to unrelated third parties, operating and financial performance, the lack of liquidity of the Company’s capital stock, and general and industry-specific economic outlook. Subsequent to the IPO, the fair value of the underlying common stock is determined by the closing price, on the date of grant, of the Company’s Class A common stock, which is traded publicly on The Nasdaq Global Market.
Expected Term. The expected term represents the period that stock-based awards are expected to be outstanding. For option grants that are considered to be “plain vanilla,” the Company determines the expected term using the simplified method. The simplified method deems the term to be the average of the time-to-vesting and the contractual life of the options. For other option grants, the Company estimates the expected term using historical data on employee exercises and post-vesting employment termination behavior taking into account the contractual life of the award.
Expected Volatility. Since the Company has limited trading history of its common stock, the expected volatility is derived from the average historical stock volatilities of several unrelated public companies within the Company’s industry that the Company considers to be comparable to its own business over a period equivalent to the expected term of the stock option grants.
Risk-Free Interest Rate. The risk-free interest rate is based on the U.S. Treasury yield curve in effect at the time of grant for zero-coupon U.S. Treasury notes with maturities approximately equal to the option’s expected term.
Dividend Rate. The expected dividend is assumed to be zero as the Company has never paid dividends and has no current plans to do so.
The fair value of stock options granted was estimated on the date of grant using the Black-Scholes option pricing model with the following assumptions:
Years Ended January 31, | |||||
2018 | 2017 | 2016 | |||
Expected term (in years) | 5.85 - 6.20 | 5.77-6.99 | 6.08 | ||
Expected volatility | 41.2% - 45.7% | 41.4%-43.7% | 43.5 % | ||
Risk-free interest rate | 1.8% - 2.4% | 1.2% - 2.0% | 1.5% - 1.9% | ||
Dividend yield | 0% | 0% | 0% | ||
The fair value of the purchase rights granted under the 2017 ESPP was estimated on the first day of the offering period using the Black-Scholes option-pricing model with the following assumptions:
Year Ended January 31, | |
2018 | |
Expected term (in years) | 0.67 - 0.7 |
Expected volatility | 23% - 24% |
Risk-free interest rate | 1.2% |
Dividend yield | 0% |
83
Stock-Based Compensation Expense
Total stock-based compensation expense recognized in the Company’s consolidated statements of operations is as follows (in thousands):
Years Ended January 31, | |||||||||||
2018 | 2017 | 2016 | |||||||||
Cost of revenue—subscription | $730 | $570 | $282 | ||||||||
Cost of revenue—services | 462 | 482 | 272 | ||||||||
Sales and marketing | 6,364 | 5,514 | 3,524 | ||||||||
Research and development | 5,752 | 5,755 | 4,034 | ||||||||
General and administrative | 7,927 | 8,683 | 4,675 | ||||||||
Total stock-based compensation expense | $ | 21,235 | $ | 21,004 | $ | 12,787 | |||||
10. | Net Loss per Share Attributable to Common Stockholders |
The Company calculates basic and diluted net loss per share attributable to common stockholders in conformity with the two-class method required for companies with participating securities. The Company considered all series of redeemable convertible preferred stock to have been participating securities as the holders were entitled to receive non-cumulative dividends on a pari passu basis in the event that a dividend was paid on common stock. Under the two-class method, the net loss attributable to common stockholders is not allocated to the redeemable convertible preferred stock as the holders of redeemable convertible preferred stock do not have a contractual obligation to share in losses.
Under the two-class method, basic net loss per share attributable to common stockholders is calculated by dividing the net loss by the weighted-average number of shares of common stock outstanding during the period, less shares subject to repurchase. Diluted net loss per share attributable to common stockholders is computed by giving effect to all potentially dilutive common stock equivalents outstanding for the period. For purposes of this calculation, redeemable convertible preferred stock, stock options to purchase common stock, early exercised stock options, and warrants to purchase redeemable convertible preferred stock and common stock are considered common shares equivalents, but have been excluded from the calculation of diluted net loss per share attributable to common stockholders as their effect is antidilutive. Basic and diluted net loss per share was the same for each period presented, as the inclusion of all potential common shares outstanding would have been antidilutive.
The rights, including the liquidation and dividend rights, of the holders of Class A and Class B common stock are identical, except with respect to voting. As the liquidation and dividend rights are identical, the undistributed earnings are allocated on a proportionate basis and the resulting net loss per share attributed to common stockholders will, therefore, be the same for both Class A and Class B common stock on an individual or combined basis.
The following table sets forth the computation of basic and diluted net loss per share attributable to common stockholders (in thousands, except share and per share data):
Years Ended January 31, | |||||||||||
2018 | 2017 | 2016 | |||||||||
Net loss attributable to common stockholders | $ | (96,359 | ) | $ | (86,681 | ) | $ | (73,486 | ) | ||
Weighted-average shares used to compute net loss per share attributable to common stockholders, basic and diluted for Class A and Class B | 23,718,391 | 12,211,711 | 11,240,696 | ||||||||
Net loss per share attributable to common stockholders, basic and diluted | $ | (4.06 | ) | $ | (7.10 | ) | $ | (6.54 | ) | ||
84
The following weighted-average outstanding potentially dilutive common shares were excluded from the computation of diluted net loss per share attributable to common stockholders for the periods presented because the impact of including them would have been antidilutive:
Years Ended January 31, | ||||||||
2018 | 2017 | 2016 | ||||||
Redeemable convertible preferred stock (as converted) | 19,534,014 | 25,856,309 | 25,853,450 | |||||
Redeemable convertible preferred stock warrants (as converted) | 22,592 | 54,604 | 54,604 | |||||
Common stock warrants | 90,143 | 122,043 | 122,043 | |||||
Stock options to purchase Class B common stock | 9,612,572 | 10,777,310 | 8,844,392 | |||||
Stock options to purchase Class A common stock | 2,552,397 | 52,663 | — | |||||
Early exercised stock options | 236,675 | 79,394 | 29,744 | |||||
11. | Income Taxes |
The components of loss before provision for income taxes were as follows (in thousands):
Years Ended January 31, | |||||||||||
2018 | 2017 | 2016 | |||||||||
United States | $ | (57,903 | ) | $ | (55,878 | ) | $ | (44,218 | ) | ||
Foreign | (37,169 | ) | (30,084 | ) | (28,826 | ) | |||||
Total | $ | (95,072 | ) | $ | (85,962 | ) | $ | (73,044 | ) | ||
The components of the provision for income taxes were as follows (in thousands):
Years Ended January 31, | |||||||||||
2018 | 2017 | 2016 | |||||||||
Current: | |||||||||||
Federal | $ | — | $ | — | $ | — | |||||
State | 88 | 97 | 134 | ||||||||
Foreign | 1,493 | 626 | 310 | ||||||||
Total | 1,581 | 723 | 444 | ||||||||
Deferred: | |||||||||||
Federal | (96 | ) | 39 | 58 | |||||||
State | 6 | 4 | 8 | ||||||||
Foreign | (204 | ) | (47 | ) | (68 | ) | |||||
Total | (294 | ) | (4 | ) | (2 | ) | |||||
Provision for income taxes | $ | 1,287 | $ | 719 | $ | 442 | |||||
85
The items accounting for the difference between income taxes computed at the federal statutory income tax rate of 33.8% and the provision for income taxes consisted of the following (in thousands):
Years Ended January 31, | |||||||||||
2018 | 2017 | 2016 | |||||||||
Income tax benefit at statutory rate | $ | (32,145 | ) | $ | (29,228 | ) | $ | (24,834 | ) | ||
State taxes, net of federal benefit | 564 | 101 | 141 | ||||||||
Impact of foreign income taxes | 5,555 | 7,053 | 6,767 | ||||||||
Stock based compensation | 1,741 | 1,796 | 827 | ||||||||
Non-deductible expenses | 615 | 531 | 368 | ||||||||
Change in valuation allowance | (7,605 | ) | 19,390 | 17,197 | |||||||
Research and development credits | (1,146 | ) | (775 | ) | (894 | ) | |||||
Prior year true ups | (144 | ) | 918 | (103 | ) | ||||||
Change in tax rate due to the Tax Act | 33,110 | — | — | ||||||||
Other | 742 | 933 | 973 | ||||||||
Provision for income taxes | $ | 1,287 | $ | 719 | $ | 442 | |||||
Impact of the 2017 Tax Cuts and Jobs Act
The Tax Act was enacted on December 22, 2017, impacting U.S. federal taxation of corporations. Due to the Tax Act, the Company re-measured its U.S. federal deferred tax assets and liabilities based on the rates at which they are expected to reverse in the future, which changed from approximately 35% to 21%. However, the Company is currently analyzing certain aspects of the Tax Act and refining its calculations, which could potentially affect the measurement of these balances or give rise to new deferred tax amounts. The provisional amount recorded related to the re-measurement of the Company’s deferred tax balance was $33.1 million before the valuation allowance. The provisional decrease to the valuation allowance related to the re-measurement of the deferred tax balance was $33.1 million. The remaining impact of the change in tax rate was recorded to income tax benefit, which relates to the reduction of deferred tax liabilities with respect to indefinite-lived intangibles.
The Tax Act also includes a one-time transition tax on the Company’s total post-1986 earnings and profits (“E&P”), which were previously deferred from U.S. federal income taxes as the E&P were considered to be indefinitely reinvested. The Company has prepared a provisional estimate of the impact of the transition tax, and has determined that due to significant non-U.S. E&P deficits, the Company does not expect to be subject to the transition tax.
The Act also includes provisions for certain foreign-sourced earnings referred to as Global Intangible Low-Taxed Income (“GILTI”), which impose a tax on foreign income in excess of a deemed return on tangible assets of foreign corporations. The FASB issued guidance in January 2018 to allow companies to make an accounting policy election to either (i) account for GILTI as a component of tax expense in the period in which the tax is incurred (the “period cost method”), or (ii) account for GILTI in the measurement of deferred taxes (the “deferred method”). Because of the complexity of the new provisions, the Company is continuing to evaluate the accounting impact under GAAP and will make an election once this analysis has been completed.
Given the significant complexity of the Tax Act, anticipated guidance from the Internal Revenue Service about implementing the Tax Act, and the potential for additional guidance from the SEC or the FASB related to the Tax Act, the Company’s estimates may be adjusted in future periods. Any subsequent adjustment to estimates will be recorded to current tax expense in future quarters at which point the Company’s analysis and accounting for all aspects of the Tax Act is complete.
Deferred Income Taxes
At January 31, 2018 the Company had NOL carryforwards for federal, state and Irish income tax purposes of $209.5 million, $166.5 million and $182.3 million, respectively, which begin to expire in the year ending January 31, 2028 for federal purposes and January 31, 2021 for state purposes. Ireland allows NOLs to be carried forward indefinitely. The deferred tax assets associated with the NOL carryforwards in each of these jurisdictions are subject to a full valuation allowance. Utilization of the federal net operating loss carryforwards and credits may be subject to a substantial annual
86
limitation due to the ownership change limitations provided by the Internal Revenue Code of 1986, as amended, and similar state provisions. Under Section 382 of the U.S. Internal Revenue Code of 1986, a corporation that experiences an “ownership change” is subject to a limitation on the Company’s ability to utilize its pre-change NOLs to offset future taxable income. In April 2017, the Company completed an analysis under Section 382 to evaluate whether there are any limitations on its NOLs through January 31, 2017 and concluded that any prior ownership changes do not limit the utilization of the NOLs before they expire assuming sufficient future federal and state taxable income. However, it is possible that the Company could experience a future ownership change under Section 382 or other regulatory changes, such as suspension on the use of the NOLs, that could result in the expiration of its NOLs or otherwise cause them to be unavailable to offset future federal and state taxable income.
Deferred income taxes arise from temporary differences between the carrying amounts of assets and liabilities for financial reporting and the amounts used for income tax reporting purposes, as well as operating losses and tax credit carryforwards.
Significant components of the Company’s deferred tax assets for federal and state income taxes are as follows as of January 31, 2018, 2017 and 2016, respectively (in thousands):
Years Ended January 31, | |||||||
2018 | 2017 | ||||||
Deferred tax assets: | |||||||
Net operating loss carryforwards | $ | 77,434 | $ | 82,762 | |||
Deferred revenue | 3,537 | 1,683 | |||||
Other liabilities and accruals | 6,852 | 7,863 | |||||
Depreciable assets | 1,583 | 1,919 | |||||
Other reserves | 339 | 352 | |||||
Gross deferred tax assets | 89,745 | 94,579 | |||||
Valuation allowance | (89,336 | ) | (94,465 | ) | |||
Total deferred tax assets, net of valuation allowance | 409 | 114 | |||||
Deferred tax liability: | |||||||
Goodwill | (101 | ) | (108 | ) | |||
Total deferred tax liability | (101 | ) | (108 | ) | |||
Net deferred tax assets | $ | 308 | $ | 6 | |||
Deferred tax assets are recognized when management believes it more likely than not that they will be realized. Deferred tax assets are reduced by a valuation allowance if, based on available evidence, it is more likely than not that some or all of the deferred tax assets will not be realized. Due to the significant negative evidence resulting from losses since inception in the U.S. federal, U.S. state and Ireland jurisdictions, management maintains a full valuation allowance against the net deferred tax assets in these jurisdictions. The valuation allowance for deferred tax assets as of January 31, 2018 and 2017 was $89.3 million and $94.5 million, respectively. In assessing the realizabilty of deferred tax assets, management considers whether it is more likely than not that some portion or all of the deferred tax assets will not be realized. The ultimate realization of deferred tax assets is dependent upon the generation of future taxable income during the periods in which those temporary differences become deductible. Management considers the scheduled reversal of deferred tax liabilities (including the impact of available carryback and carryforward periods), projected future taxable income, and tax planning strategies in making this assessment.
Uncertain Tax Positions
The calculation of the Company’s tax obligations involves dealing with uncertainties in the application of complex tax laws and regulations. ASC 740, Income Taxes, provides that a tax benefit from an uncertain tax position may be recognized when it is more likely than not that the position will be sustained upon examination, including resolutions of any related appeals or litigation processes, on the basis of the technical merits. The Company has assessed its income tax positions and recorded tax benefits for all years subject to examination, based upon the Company’s evaluation of the facts, circumstances and information available at each period end. For those tax positions where the Company has determined there is a greater
87
than 50% likelihood that a tax benefit will be sustained, the Company has recorded the largest amount of tax benefit that may potentially be realized upon ultimate settlement with a taxing authority that has full knowledge of all relevant information. For those income tax positions where it is determined there is less than 50% likelihood that a tax benefit will be sustained, no tax benefit has been recognized.
Although the Company believes that it has adequately reserved for its uncertain tax positions, the Company can provide no assurance that the final tax outcome of these matters will not be materially different. As the Company expands internationally, it will face increased complexity, and the Company’s unrecognized tax benefits may increase in the future. The Company makes adjustments to its reserves when facts and circumstances change, such as the closing of a tax audit or the refinement of an estimate. To the extent that the final tax outcome of these matters is different than the amounts recorded, such differences will affect the provision for income taxes in the period in which such determination is made.
The activity within the Company’s unrecognized gross tax benefits was as follows (in thousands):
Years Ended January 31, | |||||||||||
2018 | 2017 | 2016 | |||||||||
Unrecognized tax benefits at beginning of year | $ | 4,400 | $ | 3,411 | $ | 2,229 | |||||
Decreases in tax positions in prior years | (1,494 | ) | (83 | ) | — | ||||||
Additions based on tax positions in the current year | 1,143 | 1,072 | 1,182 | ||||||||
Unrecognized tax benefits at end of year | $ | 4,049 | $ | 4,400 | $ | 3,411 | |||||
Principally, because the Tax Act has now applied a federal tax on accumulated foreign earnings through January 31, 2018, as well as the potential that U.S state and foreign withholding taxes may also apply, the Company is continuing to evaluate the impacts of the Tax Act during the measurement period, including whether to continue applying the exception to the presumption of the repatriation of foreign earnings. The Company has not provided for foreign withholding taxes on approximately $0.8 million of undistributed earnings from non-U.S. operations as of January 31, 2018 because the Company intends to reinvest such earnings indefinitely outside of the United States. If the Company were to distribute these earnings, then foreign withholding tax would be payable. The amount of unrecognized deferred tax liability related to these earnings was estimated to be immaterial.
The Company is not currently under Internal Revenue Service, state, or foreign income tax examination. The Company does not anticipate any significant increases or decreases in its uncertain tax positions within the next twelve months. The Company files tax returns in the United States for federal, California and other states. All tax years remain open to examination for both federal and state purposes as a result of the net operating loss and credit carryforwards. The Company files foreign tax returns in various locations. These foreign returns are open to examination for the fiscal years ending January 31, 2012 through January 31, 2017.
12. | Segments and Geographic Revenue |
The Company operates its business as one operating segment as it only reports financial information on an aggregate and consolidated basis to the Chief Executive Officer, who is the Company’s chief operating decision maker. The following table sets forth the Company’s total revenue by geographic area based on the customers’ location (in thousands):
Years Ended January 31, | |||||||||||
2018 | 2017 | 2016 | |||||||||
Americas | $ | 104,446 | $ | 69,068 | $ | 45,231 | |||||
Europe | 43,668 | 29,139 | 17,685 | ||||||||
Asia Pacific | 6,405 | 3,151 | 2,355 | ||||||||
Total | $ | 154,519 | $ | 101,358 | $ | 65,271 | |||||
Customers located in the United States accounted for 64%, 65% and 69% of total revenue for the years ended January 31, 2018, 2017 and 2016, respectively. Customers located in the United Kingdom accounted for 11% and 11% of total revenue for the years ended January 31, 2018 and 2017, respectively. No other country accounted for 10% or more of revenue for the periods presented.
88
As of January 31, 2018 and 2017, substantially all of the Company’s long-lived assets were located in the United States.
Item 9. Changes in and Disagreements with Accountants on Accounting and Financial Disclosure
None.
ITEM 9A. Controls and Procedures
Evaluation of Disclosure Controls and Procedures
We maintain “disclosure controls and procedures,” as defined in Rule 13a-15(e) and Rule 15d-15(e) under the Exchange Act that are designed to ensure that information required to be disclosed by a company in the reports that it files or submits under the Exchange Act is recorded, processed, summarized and reported within the time periods specified in the SEC’s rules and forms. Disclosure controls and procedures include, without limitation, controls and procedures designed to ensure that information required to be disclosed by a company in the reports that it files or submits under the Exchange Act is accumulated and communicated to our management, including our principal executive and principal financial officers, as appropriate to allow timely decisions regarding required disclosure.
Our management, with the participation of our Chief Executive Officer and our Chief Financial Officer, evaluated the effectiveness of our disclosure controls and procedures as of January 31, 2018. Based on the evaluation of our disclosure controls and procedures as of January 31, 2018, our Chief Executive Officer and Chief Financial Officer concluded that, as of such date, our disclosure controls and procedures were effective at the reasonable assurance level.
Management's Report on Internal Control over Financial Reporting
This Form 10-K does not include a report of management's assessment regarding internal control over financial reporting or an attestation report of our independent registered public accounting firm due to a transition period established by the rules of the SEC for newly public companies.
Changes in Internal Control Over Financial Reporting
There was no change in our internal control over financial reporting identified in connection with the evaluation required by Rule 13a-15(d) and 15d-15(d) of the Exchange Act that occurred during the fiscal quarter ended January 31, 2018 that has materially affected, or is reasonably likely to materially affect, our internal control over financial reporting.
Inherent Limitations on Effectiveness of Controls
Our management, including our Chief Executive Officer and Chief Financial Officer, believes that our disclosure controls and procedures and internal control over financial reporting are designed to provide reasonable assurance of achieving their objectives and are effective at the reasonable assurance level. However, our management does not expect that our disclosure controls and procedures or our internal control over financial reporting will prevent all errors and all fraud. A control system, no matter how well conceived and operated, can provide only reasonable, not absolute, assurance that the objectives of the control system are met. Further, the design of a control system must reflect the fact that there are resource constraints, and the benefits of controls must be considered relative to their costs. Because of the inherent limitations in all control systems, no evaluation of controls can provide absolute assurance that all control issues and instances of fraud, if any, have been detected. These inherent limitations include the realities that judgments in decision making can be faulty, and that breakdowns can occur because of a simple error or mistake. Additionally, controls can be circumvented by the individual acts of some persons, by collusion of two or more people or by management override of the controls. The design of any system of controls also is based in part upon certain assumptions about the likelihood of future events, and there can be no assurance that any design will succeed in achieving its stated goals under all potential future conditions; over time, controls may become inadequate because of changes in conditions, or the degree of compliance with policies or procedures may deteriorate. Because of the inherent limitations in a cost-effective control system, misstatements due to error or fraud may occur and not be detected.
Item 9B. Other Information
None.
89
PART III
Item 10. Directors, Executive Officers and Corporate Governance
The information required by this Item (other than the information set forth in the next paragraph in this Item) will be included in the 2018 Proxy Statement to be filed with the SEC within 120 days after the end of our fiscal year ended January 31, 2018, and is incorporated herein by reference.
We have adopted a Code of Business Conduct and Ethics (the “Code of Conduct”), applicable to all of our employees, executive officers and directors. The Code of Conduct is available on our website at investors.mongodb.com. The nominating and corporate governance committee of our board of directors is responsible for overseeing the Code of Conduct and must approve any waivers of the Code of Conduct for employees, executive officers and directors. We expect that any amendments to the Code of Conduct, or any waivers of its requirements, will be disclosed on our website, as required by applicable law or the listing standards of The Nasdaq Global Market. The inclusion of our website address in this Form 10-K does not include or incorporate by reference into this Form 10-K the information on or accessible through our website.
Item 11. Executive Compensation
The information required by this Item will be included in the 2018 Proxy Statement and is incorporated herein by reference.
Item 12. Security Ownership of Certain Beneficial Owners and Management and Related Stockholder Matters
The information required by this Item will be included in the 2018 Proxy Statement and is incorporated herein by reference.
Item 13. Certain Relationships and Related Transactions, and Director Independence
The information required by this Item will be included in the 2018 Proxy Statement and is incorporated herein by reference.
Item 14. Principal Accounting Fees and Services
The information required by this Item will be included in the 2018 Proxy Statement and is incorporated herein by reference.
90
PART IV
Item 15. Exhibits, Financial Statement Schedules
(a) Documents filed as part of this report
(1) All financial statements
Index to Consolidated Financial Statements | Page |
Financial Statements: | |
(2) Financial Statement Schedules
Schedule II: Valuation and Qualifying Accounts
The table below details the activity of the allowance for doubtful accounts for the years ended January 31, 2018, 2017 and 2016 (in thousands):
Balance at Beginning of Year | Additions | Usage (Deductions) | Balance at End of Year | |||||||||
Year ended January 31, 2018 | ||||||||||||
Allowance for doubtful accounts | $ | 958 | $ | 1,417 | $ | (1,137 | ) | $ | 1,238 | |||
Deferred tax asset valuation allowance | 94,465 | — | (5,129 | ) | 89,336 | |||||||
Year ended January 31, 2017 | ||||||||||||
Allowance for doubtful accounts | $ | 669 | $ | 621 | $ | (332 | ) | $ | 958 | |||
Deferred tax asset valuation allowance | 68,692 | 25,773 | — | 94,465 | ||||||||
Year ended January 31, 2016 | ||||||||||||
Allowance for doubtful accounts | $ | 331 | $ | 570 | $ | (232 | ) | $ | 669 | |||
Deferred tax asset valuation allowance | 51,467 | 17,225 | — | 68,692 | ||||||||
All other financial statement schedules have been omitted, since the required information is not applicable or is not present in amounts sufficient to require submission of the schedule, or because the information required is included in the consolidated financial statements and notes thereto included in this Form 10-K.
(3) Exhibits
Incorporated by Reference | Filed Herewith | ||||||||
Exhibit Number | Description | Form | File No. | Exhibit | Filing Date | ||||
3.1 | 8-K | 001-38240 | 3.1 | 10/25/17 | |||||
3.2 | S-1 | 333-220557 | 3.4 | 9/21/17 | |||||
4.1 | S-1/A | 333-220557 | 4.1 | 10/6/17 | |||||
91
Incorporated by Reference | Filed Herewith | ||||||||
Exhibit Number | Description | Form | File No. | Exhibit | Filing Date | ||||
4.2 | S-1 | 333-220557 | 4.1 | 9/21/17 | |||||
10.1# | S-1 | 333-220557 | 10.1 | 9/21/17 | |||||
10.2# | S-1/A | 333-220557 | 10.2 | 10/6/17 | |||||
10.3# | x | ||||||||
10.4# | S-1/A | 333-220557 | 10.3 | 10/6/17 | |||||
10.5# | S-1/A | 333-220557 | 10.4 | 10/6/17 | |||||
10.6# | S-1 | 333-220557 | 10.5 | 9/21/17 | |||||
10.7# | S-1/A | 333-220557 | 10.6 | 10/6/17 | |||||
10.8# | S-1/A | 333-220557 | 10.7 | 10/6/17 | |||||
10.9# | S-1/A | 333-220557 | 10.8 | 10/6/17 | |||||
10.10# | S-1/A | 333-220557 | 10.9 | 10/6/17 | |||||
10.11# | S-1/A | 333-220557 | 10.10 | 10/6/17 | |||||
10.12 | x | ||||||||
21.1 | x | ||||||||
23.1 | x | ||||||||
31.1 | x | ||||||||
31.2 | x | ||||||||
32.1* | x | ||||||||
92
Incorporated by Reference | Filed Herewith | ||||||||
Exhibit Number | Description | Form | File No. | Exhibit | Filing Date | ||||
32.2* | x | ||||||||
101.INS | XBRL Instance Document | ||||||||
101.SCH | XBRL Taxonomy Extension Schema Document | ||||||||
101.CAL | XBRL Taxonomy Extension Calculation Linkbase Document | ||||||||
101.DEF | XBRL Taxonomy Extension Definition Linkbase Document | ||||||||
101.LAB | XBRL Taxonomy Extension Label Linkbase Document | ||||||||
101.PRE | XBRL Taxonomy Extension Presentation Linkbase Document | ||||||||
# | Indicates management contract or compensatory plan. | |
* | This certification is deemed not filed for purposes of Section 18 of the Securities Exchange Act of 1934, as amended, or otherwise subject to the liability of that section, nor shall it be deemed incorporated by reference into any filing under the Securities Act of 1933, as amended, or the Securities Exchange Act of 1934, as amended. | |
Item 16. Form 10-K Summary
None.
93
SIGNATURES
Pursuant to the requirements of Section 13 or 15(d) of the Securities Exchange Act of 1934, the registrant has duly caused this report to be signed on its behalf by the undersigned thereunto duly authorized.
MONGODB, INC. | |||
Date: March 30, 2018 | By: | /s/ Dev Ittycheria | |
Name: | Dev Ittycheria | ||
Title: | President, Chief Executive Officer and Director | ||
Pursuant to the requirements of the Securities Exchange Act of 1934, this report has been signed below by the following persons on behalf of the registrant and in the capacities and on the dates indicated.
Signature | Title | Date | ||
/s/ Dev Ittycheria | President, Chief Executive Officer and Director | March 30, 2018 | ||
Dev Ittycheria | (Principal Executive Officer) | |||
/s/ Michael Gordon | Chief Financial Officer | March 30, 2018 | ||
Michael Gordon | (Principal Financial Officer) | |||
/s/ Thomas Bull | Corporate Controller | March 30, 2018 | ||
Thomas Bull | (Principal Accounting Officer) | |||
/s/ Kevin P. Ryan | Director | March 30, 2018 | ||
Kevin P. Ryan | ||||
/s/ Roelof Botha | Director | March 30, 2018 | ||
Roelof Botha | ||||
/s/ Hope Cochran | Director | March 30, 2018 | ||
Hope Cochran | ||||
/s/ Charles M. Hazard, Jr. | Director | March 30, 2018 | ||
Charles M. Hazard, Jr. | ||||
/s/ Eliot Horowitz | Director | March 30, 2018 | ||
Eliot Horowitz | ||||
/s/ Tom Killalea | Director | March 30, 2018 | ||
Tom Killalea | ||||
/s/ John McMahon | Director | March 30, 2018 | ||
John McMahon | ||||