Attached files
| file | filename |
|---|---|
| 8-K - FORM 8-K - COMMUNITY FINANCIAL CORP /MD/ | tv489717_8k.htm |
Exhibit 99.1

1 Parent of: KBW Washington D.C. Bus Trip March 2018
2 Certain statements contained in this communication may not be based on historical facts and are “forward - looking statements” wit hin the meaning of Section 27A of the Securities Act of 1933, as amended, and Section 21E of the Securities Exchange Act of 1934, as amended. These forward - looking statements include, without limitation, th ose relating to The Community Financial Corporation, Community Bank of the Chesapeake’s and County First Bank’s future growth and management’s outlook or expectations for revenue, assets, asset qualit y, profitability, business prospects, net interest margin, non - interest revenue, allowance for loan losses, the level of credit losses from lending, liquidity levels, capital levels, or other future financi al or business performance strategies or expectations. These forward looking statements may also include: management’s plan relating to the transaction; the expected completion of the transaction; the payment of any c ont ingent cash consideration in the transaction; any statements of the plans and objectives of management for future operations, products or services, including the execution of integration plans relating t o t he transaction; any statement of expectation or belief; projections related to certain financial metrics; and any statement of assumptions underlying the foregoing. These forward - looking statements may be identified by reference to a future period(s) or by the use of forward - looking terminology, such as “anticipate,” “estimate,” “expect,” “foresee,” “may,” “might,” “will,” “would,” “could” or “intend,” future or condit ion al verb tenses, and variations or negatives of such terms. Forward - looking statements involve known and unknown risks, uncertainties and other important factors that could cause our actua l results, performance or achievements to differ materially from our expectations of future results, performance or achievements, or industry results, expressed or implied by these forward - looking statements. In addition to factors previously disclosed in The Community Financial Corporation’s reports filed with the Securities and Ex cha nge Commission including those we file with the SEC, including in our Annual Report on Form 10 - K for the year ended December 31, 2016, and those identified elsewhere in this document, the following factors among others, could cause actual results to differ materially from forward - looking statements or historical performance: changes in The Community Financial Corporation’s and Community Bank of the Chesapeake’s op erating or expansion strategy; availability of and costs associated with obtaining adequate and timely sources of liquidity; the ability to maintain credit quality; the effects of future economic, bus iness and market conditions; weaker than anticipated market conditions in our primary market areas; changes in interest rates; governmental monetary and fiscal policies; changes in prices and values of real esta te; legislative and regulatory changes, including changes in banking, securities and tax laws and regulations and their application by our regulators, including changes in the cost and scope of FDIC insurance; the fai lure of assumptions regarding the levels of non - performing assets and the adequacy of the allowance for loan losses; possible adverse rulings, judgments, settlements and other outcomes of pending litigation; th e ability of Community Bank of the Chesapeake and County First Bank to collect amounts due under loan agreements; changes in consumer preferences; liquidity risks through an inability to raise funds throu gh deposits, borrowings or other sources, or to maintain sufficient liquidity at the Company separate from the Bank’s liquidity; volatility in the capital and credit markets; effectiveness of Community Bank of the Chesapeake’s interest rate risk management strategies; the ability to obtain regulatory approvals and meet other closing conditions to the transaction, including approval by County First Bank’s sharehol der s on the expected terms and schedule; delay in closing the transaction; difficulties and delays in integrating the County First Bank’s business or fully realizing cost savings and other benefits of the transact ion in the expected timeframes, if at all; business disruption following the transaction; inflation; customer acceptance of Community Bank of the Chesapeake’s products and services; customer borrowing, repayment, in ves tment and deposit practices; customer disintermediation; and the introduction, withdrawal, success and timing of business initiatives. You are cautioned not to place undue reliance on the forward - looking statements contained in this document in that actual result s could differ materially from those indicated in such forward - looking statements, due to a variety of factors. Any forward - looking statement speaks only as of the date of this Report, and we undertake no obliga tion to update these forward - looking statements to reflect events or circumstances that occur after the date of this Report. Forward - looking statements regarding the transaction are based upon currently availabl e information. Annualized, pro forma, projected and estimated numbers are used for illustrative purpose only, are not forecasts, and may not re flect actual results. Forward Looking Information

3 Fourth Quarter 2017 Financial Update

4 Financial Highlights Source:, Company regulatory and SEC filings. TCFC has had no intangible assets in all presented periods. Gross loans presente d n et of deferred loan fees. (1) Non - GAAP financial measures. Refer to Appendix to this presentation for a reconciliation. (2) Tier 1 capital in 2015 was impacted by the redemption of $20 million of SBLF in February 2015 with proceeds of $23 million su bor dinated debt offering. (3) NPLs include nonaccrual loans, loans 90+ days past due and accruing TDRs. NPAs include NPLs and OREO. (4) Operating results for 2017 are non - GAAP financial measures and exclude the impact of the Tax Cuts and Jobs Act as well as one - ti me merger expenses. Refer to Appendix to this presentation for a reconciliation. x Continued organic loan growth x Strong expense control x Asset quality improvement has continued with low net charge offs x Capital position remains strong x 2017 results impacted by $2.7 million deferred tax asset revaluation and $725,000 of one - time merger costs (after - tax). x County First legal merger effective January 1, 2018, increasing total assets to approximately $1.6 billion. YTD Highlights 2014 FY 2015 FY 2016 FY 2017 FY ($000s except per share) 12/31/14 12/31/15 12/31/16 12/31/17 Balance Sheet Total Assets 1,082,878$ 1,143,332$ 1,334,257$ 1,405,961$ Total Gross Loans 870,890 917,740 1,089,379 1,151,130 Total Deposits 869,384 906,899 1,038,825 1,106,237 Tangible Common Equity (1) 96,559 99,783 104,426 109,957 Consolidated Capital (%) Tang. Common Equity/ Assets (1) 8.92 % 8.73 % 7.83 % 7.82 % Tier 1 Risk Based Ratio (2) 14.26 11.38 10.62 10.53 Risk-Based Capital Ratio 15.21 14.58 13.60 13.40 TBV Per Share (1) 20.53 21.48 22.54 23.65 Asset Quality (%) NPAs/ Assets (3) 2.71 % 2.98 % 1.99 % 1.71 % NCOs/ Avg Loans 0.28 0.16 0.10 0.03 Operating (4) Reserves/ NPLs (3) 36.1 34.8 52.4 71.5 12/31/17 8481 8034 8138 8540 9106 Profitability Net Income to Common 6,290$ 6,320$ 7,331$ 7,208$ 10,672$ ROAA 0.63 % 0.58 % 0.60 % 0.52 % 0.78 % ROACE 6.7 6.3 7.1 6.6 9.7 Net Interest Margin 3.68 3.57 3.46 3.34 Efficiency Ratio (1) 66.6 67.9 64.8 60.4 60.4 Efficiency Ratio (Reported) (1) 67.0 71.4 67.4 63.4 Non-Interest Exp/Avg Assets (Reported) (1) 2.56 2.60 2.37 2.19 2.13 Net Operating Exp/Avg Assets (Reported) (1) 2.16 2.30 2.10 1.89 1.83 Diluted EPS 1.35$ 1.35$ 1.59$ 1.56$ 2.31$

5 Loan Composition Loan Composition (12/31/2017) Loan Composition (12/31/2017) – Pro forma with County First Bank Source: Management and company filings. Gross loans presented net of deferred loan fees. $1.2 Billion Yield: 4.45% Owner Occupied CRE was $316 million at 12/31/17 x Regulatory concentrations of 310% and 65% for CRE and Construction at December 31, 2017 x Pro forma CRE concentrations after County First merger below 300% x Commercial Bank Model - 81% commercial real estate, residential rentals and commercial & industrial loans as December 31, 2017. Owner Occ. CRE and C&I , 33% Residential Rentals , 10% Commercial Real Estate , 38% Residential Construction , 2% Residential & Consumer , 17% $1.3 Billion Owner Occ. CRE and C&I , 32% Residential Rentals , 11% Commercial Real Estate , 39% Residential Construction , 2% Residential & Consumer , 16%
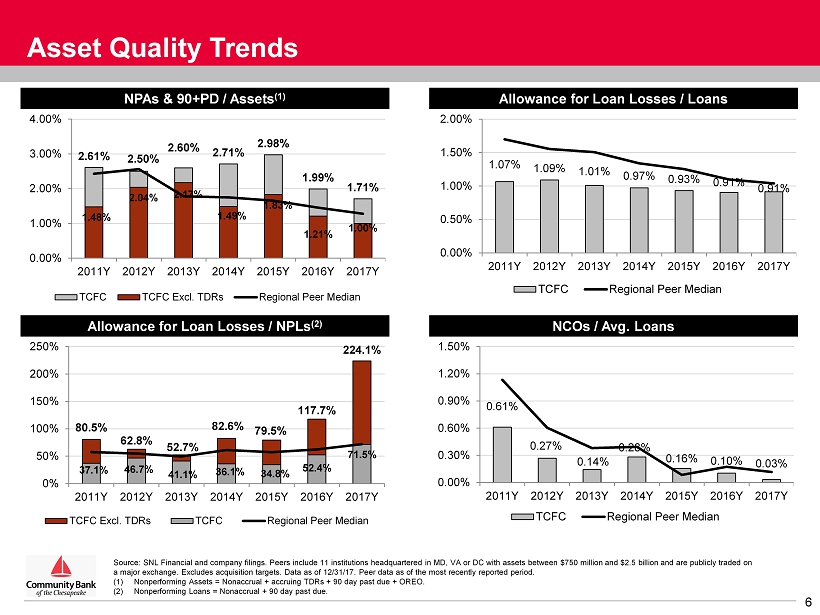
6 Asset Quality Trends NPAs & 90+PD / Assets (1) Allowance for Loan Losses / Loans Allowance for Loan Losses / NPLs (2) NCOs / Avg. Loans Source: SNL Financial and company filings. Peers include 11 institutions headquartered in MD, VA or DC with assets between $7 50 million and $2.5 billion and are publicly traded on a major exchange. Excludes acquisition targets. Data as of 12/31/17. Peer data as of the most recently reported period. (1) Nonperforming Assets = Nonaccrual + accruing TDRs + 90 day past due + OREO. (2) Nonperforming Loans = Nonaccrual + 90 day past due. 2.61% 2.50% 2.60% 2.71% 2.98% 1.99% 1.71% 1.48% 2.04% 2.17% 1.49% 1.83% 1.21% 1.00% 0.00% 1.00% 2.00% 3.00% 4.00% 2011Y 2012Y 2013Y 2014Y 2015Y 2016Y 2017Y TCFC TCFC Excl. TDRs Regional Peer Median 80.5% 62.8% 52.7% 82.6% 79.5% 117.7% 224.1% 37.1% 46.7% 41.1% 36.1% 34.8% 52.4% 71.5% 0% 50% 100% 150% 200% 250% 2011Y 2012Y 2013Y 2014Y 2015Y 2016Y 2017Y TCFC Excl. TDRs TCFC Regional Peer Median 1.07% 1.09% 1.01% 0.97% 0.93% 0.91% 0.91% 0.00% 0.50% 1.00% 1.50% 2.00% 2011Y 2012Y 2013Y 2014Y 2015Y 2016Y 2017Y TCFC Regional Peer Median 0.61% 0.27% 0.14% 0.28% 0.16% 0.10% 0.03% 0.00% 0.30% 0.60% 0.90% 1.20% 1.50% 2011Y 2012Y 2013Y 2014Y 2015Y 2016Y 2017Y TCFC Regional Peer Median

7 Asset Quality Overview Source: SNL Financial, Management and company filings. (1) Classified assets include loans graded as substandard, doubtful or loss, non - investment grade securities and OREO. Classified Asset Trends as a Percentage of Assets Nonperforming Asset Composition (12/31/2017) x 39%, or $31.6 million, reduction in classified assets (1) since their peak in Q3 2011 from $81.9 million to $50.3 million at Q4 2017 x Loans more than 90 days past due are approximately $2.5 million or approximately 22 basis points of total loans Accruing TDRs $10.0M OREO $9.3M Non - Accrual Loans $4.7M $24.0M 8.10% 5.97% 5.55% 4.99% 3.80% 2.94% 3.58% 0.00% 1.00% 2.00% 3.00% 4.00% 5.00% 6.00% 7.00% 8.00% 9.00% 12/31/11 12/31/12 12/31/13 12/31/14 12/31/15 12/31/16 12/31/17 Total Classified Loans Classified Securities Other Real Estate Owned 12/31/2011 12/31/2012 12/31/2013 12/31/2014 12/31/2015 12/31/2016 12/31/2017 Classified Assets 79,638$ 58,595$ 56,880$ 54,022$ 43,346$ 39,246$ 50,298$

8 Deposit Franchise Source: Management and company filings. Data as of 12/31/17. (1) Comparison reflects twelve month average balance as of 12/31/17 as compared to twelve month average balance as of 12/31/16. Deposit Composition (12/31/2017) $1.3 Billion x At December 31, 2017 the Bank’s deposit funding consisted of approximately 59% transaction accounts compared to less than 45% at December 31, 2011 x Average noninterest bearing deposits increased 8.5%, or $12.1 million, during 2017 to $154.2 million (1) x Increased average balance of transaction accounts by $56.0 million, or 9.8%, over last twelve months (1) Deposit Composition (12/31/2017) – Pro Forma with County First Bank $1.1 Billion IB Transaction 45% NIB Transaction 14% Time Deposits 41% IB Transaction 46% NIB Transaction 17% Time Deposits 37%

9 Deposit Franchise – Cost of Funds Cost of Funding Source: Management and company filings. Data as of 12/31/17. (1) Comparison reflects twelve month average balance as of 12/31/17 as compared to twelve month average balance as of 12/31/16. 1.43% 1.05% 0.71% 0.56% 0.48% 0.48% 0.56% 1.59% 1.21% 0.88% 0.74% 0.75% 0.73% 0.81% 0.00% 0.50% 1.00% 1.50% 2.00% 2011Y 2012Y 2013Y 2014Y 2015Y 2016Y 2017Y Cost of Deposits Cost of Funds x Success in increasing transaction deposits, including noninterest bearing deposits, has helped alleviate pressure on cost of funds in 2017. x Acquisition of County First should positively impact first quarter 2018 cost of deposits and cost of funds.

10 2.47% 2.56% 2.56% 2.60% 2.37% 2.19% 0.00% 1.00% 2.00% 3.00% 4.00% 2012Y 2013Y 2014Y 2015Y 2016Y 2017Y TCFC Regional Peer Median 67.7% 66.8% 66.6% 68.0% 64.8% 60.4% 40.0% 50.0% 60.0% 70.0% 80.0% 2012Y 2013Y 2014Y 2015Y 2016Y 2017Y TCFC Regional Peer Median Focus on Efficiency & Expenses Efficiency Ratio Reported Noninterest Expense / Avg. Assets Source: SNL Financial and company filings. Data as of 12/31/17. Regional peers include 11 institutions headquartered in MD, VA or DC with assets between $750 million and $2.5 billion and ar e p ublicly traded on a major exchange. Excludes acquisition targets. Efficiency ratio is a non - GAAP financial measures; refer to Appendix to this presentation for a reconciliat ion. x Historically maintained our efficiency ratio below peer institutions x Expense discipline continued through recent growth history, including expansion into Fredericksburg, VA and Anne Arundel County, MD markets x Review operating expense base for specific savings initiatives, including closure of underperforming branches x Year over year operating expenses increased approximately 3.2% vs. revenue growth of 16.1%

11 Increasing Bottom Line Profitability Return on Average Assets (%) Source: SNL Financial and company filings. (1) Fourth Quarter 2017 metrics are non - GAAP financial measures and exclude the impact of the Tax Cuts and Jobs Act as well as o ne - time merger expenses. Refer to Appendix to this presentation for a reconciliation. x The combination of improved expense discipline, continued organic growth and asset quality performance has produced a steady improvement in profitability over the last 18 months x 3 rd Quarter 2017 results positively impacted by a $294,000 pre - tax SBA gain Return on Average Common Equity (%) 0.56% 0.57% 0.63% 0.62% 0.70% 0.74% 0.80% 0.72% 3/31/16 6/30/16 9/30/16 12/31/16 3/31/17 6/30/17 9/30/17 12/31/17 6.4% 6.8% 7.5% 7.7% 8.8% 9.4% 10.0% 8.9% 3/31/16 6/30/16 9/30/16 12/31/16 3/31/17 6/30/17 9/30/17 12/31/17 (1) (1)

12 Acquisition of County First Bank

13 Transaction Rationale Leverages Existing Presence in Southern Maryland Markets County First Improves Core Funding & Liquidity Profile Lower Integration Risk x All 5 County First branch locations are within 1.5 miles of an existing TCFC branch location x Approximately $1.3 billion of combined deposits and #1 deposit market share position in Southern Maryland markets (Calvert, Charles and Saint Mary’s Counties) x County First adds $200 million of high quality, low cost deposits x Nearly 85% non - time deposits; 33% noninterest bearing deposits x 19 bps cost of funds (quarter ended December 31, 2017) x Loan to deposit ratio of 72%; pro forma TCFC loan to deposit ratio reduced to 99% from 104% x Extensive due diligence conducted: ▪ Greater than 55% of the outstanding commercial portfolio ▪ 100% of nonperforming assets reviewed ▪ Management’s efforts supplemented by third party credit review experts x Familiarity with County First’s markets and customers x Significant and achievable opportunities for cost savings in the transaction Source: SNL Financial. County First data as of 12/31/17. Deposit market share data is as of 6/30/17.

14 Expanding Market Share Position in Southern Maryland Source: SNL Financial. (1) Includes Calvert, Charles and Saint Mary’s Counties. Deposit market share data as of 6/30/17. (2) Includes only counties with overlap between TCFC and County First Bank; dollars in thousands. Median HH Income by County (2) Deposit Market Share – MD Markets (1) $93 $93 $113 $61 Charles Saint Mary's Calvert US Pro Forma Franchise Rank Institution (ST) Deposits in Market ($mm) Market Share (%) Pro Forma - TCFC 1,274 25.5 1 Community Financial Corp. 1,065 21.3 2 PNC Financial Services Group Inc. 1,005 20.1 3 Bank of America Corp. 986 19.7 4 Old Line Bancshares Inc. 501 10.0 5 BB&T Corp. 392 7.8 6 SunTrust Banks Inc. 390 7.8 7 M&T Bank Corp. 212 4.2 8 County First Bank 209 4.2 9 Capital One Financial Corp. 98 2.0 10 Wells Fargo & Co. 76 1.5 TCFC CUMD – La Plata – Retained (1) CUMD – Closures May/June 2018 (4)

15 Cons A&D 3% Residential R.E. 23% Commercial R.E. 63% Commercial & Industrial 8% Consumer & Other 3% NIB Demand Deposits 17% NOW & Other Trans. Accts 18% MMDA & Other Savings 28% Time Deposits 37% Pro Forma Loan and Deposit Portfolios Source: SNL Financial and County First Bank. Data as of 12/31/17. Does not include purchase accounting adjustments. Pro Forma Loan Portfolio ($1.3 Billion) Pro Forma Deposit Portfolio ($1.3 Billion) Pro Forma Loan / Deposit Ratio Falls from 104% to 99% Time deposit percentage improves from 41% to 37%

16 Announced Transaction Impacts (1) Includes the cumulative interest rate marks on securities, loans and deposits. (2) Estimated based on consensus earnings estimates for The Community Financial Corporation plus assumed transaction adjustments. Th e Community Financial Corporation does not endorse consensus earnings estimates or publish financial guidance. Actual results may differ from conse nsu s earnings estimates. (3) Estimated tangible book value per share impact assumes a 12/31/17 closing date. (4) Using the crossover method. x Identified pre - tax cost savings of approximately $4.4 million when fully phased - in • ~60% assumed phased - in during 2018 and 100% thereafter • No revenue enhancements assumed x Announced impacts to TCFC shareholders: • 2018 EPS: ~4% accretive (2) • 2019 EPS: ~12% accretive (2) • TBV Impact: ~2.7% dilutive (3) • TBV Earnback: ~2.4 years (4) • IRR: ~20% • Estimated pro forma capital ratios in excess of well - capitalized at close x All earnings impacts have been enhanced by the Tax Cuts and Jobs Act passed in December 2017 Attractive Returns for TCFC Shareholders

17 Transaction Update x Legal merger closed on January 1, 2018 x Core conversion scheduled for May 2018 x Initial branch closings expected in May/June 2018 x Customer retention has been strong x TCFC integration team has been very active in preparing County First employees for the conversion to TCFC systems x Identified cost savings are on track and expected to be realized consistent with our modeling of the transaction

18 Investment Highlights

19 $10.02 $10.48 $10.98 $12.06 $13.09 $14.28 $16.79 $17.23 $17.43 $18.25 $18.32 $19.34 $19.52 $20.53 $21.48 $22.54 $23.65 $- $5.00 $10.00 $15.00 $20.00 $25.00 2001 2002 2003 2004 2005 2006 2007 2008 2009 2010 2011 2012 2013 2014 2015 2016 2017 Tangible Book Value Per Share Consistent Shareholder Value Creation Source: SNL Financial and company filings. Note: Tangible book value per share is a non - GAAP financial measure. Refer to Appendix to this presentation for a reconciliation . In October 2013, the Company issued 1,591,300 shares of common stock at a price of $18.75 per share resulting in net proceeds of $27.4 million after commissions and related offering expenses. The additional shares outstanding impacted year to year comparability of per share book value amounts beginning with the year end ed December 31, 2013.

20 Investment Highlights x More than 30 consecutive years of profitability x Increased Momentum: • Profitability • Loan and Deposit Growth • Asset Quality Improvement x Positioned in Demographically Attractive Markets x Strong Market Share Position in Core Market x Strong, Experienced Management Team The Community Financial Corporation Acquisition of County First Bank x Financially attractive x Achievable cost savings opportunities x Enhances positioning within attractive Southern Maryland markets x Acquisition of low cost, stable core deposit base x Comprehensive due diligence conducted x Low integration risk

21 Appendix

22 Executive Leadership Team William J. Pasenelli x EVP and Chief Risk Officer x Joined in 2005 x Former EVP and Senior Loan Officer at Mercantile Southern Maryland Bank x President and Chief Executive Officer x Joined in 2000 x Former CFO of Acacia Federal Savings Bank (1987 - 2000) James M. Burke Todd L. Capitani x EVP and Chief Financial Officer x Joined in 2009 x Former Senior Finance Manager with Deloitte Consulting and CFO of Ruesch International, Inc. Christy M. Lombardi x EVP and Chief Administrative Officer x Joined in 1998 x Oversees human resources and shareholder relations Gregory Cockerham x EVP and Chief Lending Officer x Joined in 1988 x Former Executive with Maryland National Bank James F. Di Misa x EVP and Chief Operating Officer x Joined in 2005 x Former EVP at Mercantile Southern Maryland Bank

23 Significant In - Market Federal Agency Presence x Department of Defense in - market presence: • National Energetics Center – Naval Support Facility at Indian Head (Charles County) • Naval Surface Warfare – Naval Support Facility at Dahlgren (King George County) • Air Force One – Andrews AFB (Prince Georges County) • US Marines – Quantico (Prince William County) • Defense Intelligence Agency & Defense Intelligence Analysis Center – Joint Base Anacostia - Bolling (Prince Georges County) • Naval Air Station Patuxent River (St. Mary’s County) x Additional major in - market Federal Agency presence: • Federal Aviation Administration (FAA) Unmanned Aerial Vehicle (UAV) Drones Program • Homeland Security • FBI & DEA – Quantico (Prince William County)

24 Summary of Terms – County First Acquisition Source: SNL Financial. (1) Based upon TCFC’s closing share price of $36.27 as of 7/28/17. (2) Based upon TCFC’s closing share price of $36.27 as of 7/28/17 and County First’s 6/30/17 tangible book value per share of $26 .87 . (3) Represents the median price to tangible book value for nationwide depository transactions since 11/8/2016 with targets betwee n $ 100 million and $500 million of total assets and announced deal values greater than $10 million. x Acquisition of 100% of the common stock of County First Bank x Shares of County First will be exchanged for 0.9543 shares of TCFC common stock and $1.00 of cash x Implied Price per Share: $35.61 (1) x Transaction Value: $34.3 million (1) x Price / Tangible Book Value: 1.33x (2) (vs. 1.51x for recent nationwide transactions (3) ) x Consideration Mix: 97% stock / 3% cash (excluding contingent cash) x Contingent Cash Consideration: Up to a maximum of $2.24 per share • Contingent cash consideration to be based upon the resolution of certain identified assets prior to the closing of the transaction x County First Bank legacy shareholders to own approximately 16.5% of the combined entity x One current County First board member to be appointed to the boards of TCFC and Community Bank of the Chesapeake x County First Bank shareholder approval x Customary regulatory approvals Transaction Summary Board Seats Required Approvals
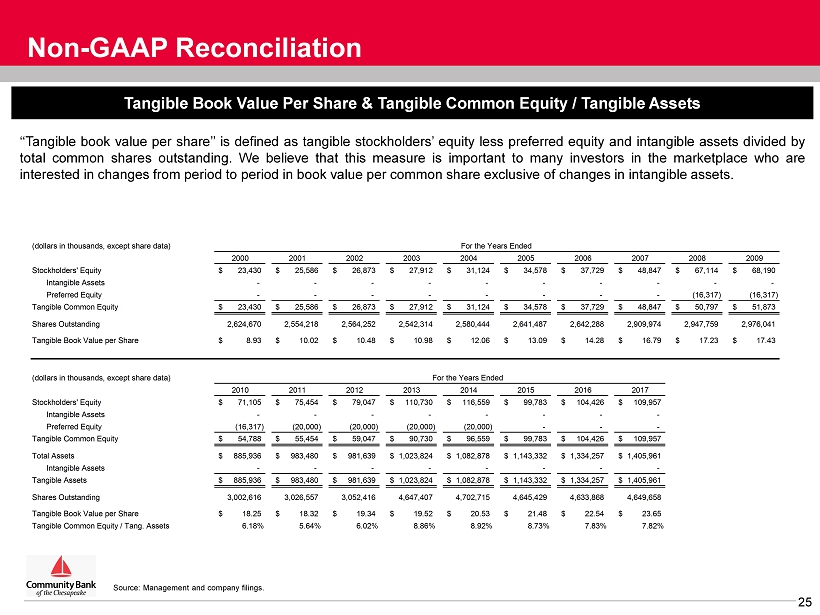
25 Non - GAAP Reconciliation ‘‘Tangible book value per share’’ is defined as tangible stockholders’ equity less preferred equity and intangible assets divided by total common shares outstanding . We believe that this measure is important to many investors in the marketplace who are interested in changes from period to period in book value per common share exclusive of changes in intangible assets . Source: Management and company filings. (dollars in thousands, except share data) For the Years Ended 2000 2001 2002 2003 2004 2005 2006 2007 2008 2009 Stockholders' Equity 23,430$ 25,586$ 26,873$ 27,912$ 31,124$ 34,578$ 37,729$ 48,847$ 67,114$ 68,190$ Intangible Assets - - - - - - - - - - Preferred Equity - - - - - - - - (16,317) (16,317) Tangible Common Equity 23,430$ 25,586$ 26,873$ 27,912$ 31,124$ 34,578$ 37,729$ 48,847$ 50,797$ 51,873$ Shares Outstanding 2,624,670 2,554,218 2,564,252 2,542,314 2,580,444 2,641,487 2,642,288 2,909,974 2,947,759 2,976,041 Tangible Book Value per Share 8.93$ 10.02$ 10.48$ 10.98$ 12.06$ 13.09$ 14.28$ 16.79$ 17.23$ 17.43$ (dollars in thousands, except share data) For the Years Ended 2010 2011 2012 2013 2014 2015 2016 2017 Stockholders' Equity 71,105$ 75,454$ 79,047$ 110,730$ 116,559$ 99,783$ 104,426$ 109,957$ Intangible Assets - - - - - - - - Preferred Equity (16,317) (20,000) (20,000) (20,000) (20,000) - - - Tangible Common Equity 54,788$ 55,454$ 59,047$ 90,730$ 96,559$ 99,783$ 104,426$ 109,957$ Total Assets 885,936$ 983,480$ 981,639$ 1,023,824$ 1,082,878$ 1,143,332$ 1,334,257$ 1,405,961$ Intangible Assets - - - - - - - - Tangible Assets 885,936$ 983,480$ 981,639$ 1,023,824$ 1,082,878$ 1,143,332$ 1,334,257$ 1,405,961$ Shares Outstanding 3,002,616 3,026,557 3,052,416 4,647,407 4,702,715 4,645,429 4,633,868 4,649,658 Tangible Book Value per Share 18.25$ 18.32$ 19.34$ 19.52$ 20.53$ 21.48$ 22.54$ 23.65$ Tangible Common Equity / Tang. Assets 6.18% 5.64% 6.02% 8.86% 8.92% 8.73% 7.83% 7.82% Tangible Book Value Per Share & Tangible Common Equity / Tangible Assets

26 Efficiency Ratio & Noninterest Expense to Average Assets ‘‘Efficiency ratio” is defined as recurring non - interest expense less foreclosed real estate (OREO) expenses and valuation allowances, less merger and acquisition costs, less amortization of intangible assets divided by operating revenue . Operating revenue is equal to net interest income plus non - interest income excluding gains and losses on securities and foreclosed real estate . In our judgment, the adjustments made to non - interest expense and operating revenue allow investors and analysts to better assess our operating expenses in relation to our core operating revenue by removing the volatility that is associated with certain one - time items and other discrete items that are unrelated to our core business . “Efficiency ratio as reported” is defined as non - interest expense divided by operating revenue . This is the ratio that appears in the Company’s SEC filings . Source: Management and company filings. 2011 FY 2012 FY 2013 FY 2014 FY 2015 FY 2016 FY 2017 FY (dollars in thousands) 12/31/2011 12/31/2012 12/31/2013 12/31/2014 12/31/2015 12/31/2016 12/31/2017 Non-interest Expense (Reported) 22,249$ 23,804$ 24,844$ 26,235$ 28,418$ 29,159$ 30,097$ OREO Valuation Allowance & Expenses (2,452) (771) (787) (386) (1,059) (861) (746) Non-Recurring M&A Expenses - - - - - - (829) Adjusted Non-Interest Expense 19,797$ 23,033$ 24,057$ 25,849$ 27,359$ 28,298$ 28,522$ Net Interest Income 26,838$ 29,689$ 32,032$ 35,061$ 36,528$ 39,905$ 43,388$ Non-Interest Income 4,193 4,410 4,174 4,093 3,299 3,360 4,084 Operating Revenue (Reported) 31,031 34,099 36,206 39,154 39,827 43,265 47,472 (Gains)/Losses on OREO Disposals (454) (89) (179) (322) 20 436 (43) Realized (Gains)/ Losses on Other Assets (23) 4 - (7) 407 (12) (47) Realized (Gains)/ Losses on Securities - - - (19) (4) (31) (175) Operating Revenue 30,554$ 34,014$ 36,027$ 38,806$ 40,250$ 43,658$ 47,207$ Average Assets 905,683$ 963,061$ 969,063$ 1,026,442$ 1,092,906$ 1,229,471$ 1,376,983$ Efficiency Ratio 64.8% 67.7% 66.8% 66.6% 68.0% 64.8% 60.4% Efficiency Ratio (Reported) (1) 71.7% 69.8% 68.6% 67.0% 71.4% 67.4% 63.4% Non-Interest Expense /Avg Assets (Reported) 2.46% 2.47% 2.56% 2.56% 2.60% 2.37% 2.19% Net Operating Expense (2) /Avg Assets (Reported) 1.99% 2.01% 2.13% 2.16% 2.30% 2.10% 1.89% (1) Efficiency ratio as reported is defined as non-interest expense divided by operating revenue. (2) Net operating expense is the sum of non-interest expense offset by non-interest income. Non - GAAP Reconciliation

27 Operating Metrics – Excluding the Impact of the Tax Cuts and Jobs Act & One - Time Merger Costs During 2017 , our operating results were negatively impacted by one - time expenses related to our acquisition of County First Bank, as well as the enactment of the Tax Cuts and Jobs Act which lowered the federal corporate tax rate to 21 % beginning in 2018 . As a result of the Tax Cuts and Jobs Act, we were required to revalue our deferred tax asset position resulting in a non - cash after - tax expense of $ 2 . 7 million during the fourth quarter of 2017 . Additionally, we incurred after - tax non - recurring expenses of $ 0 . 7 million (consisting primarily of professional expenses) during 2017 related to our acquisition of County First Bank . We believe that investors would benefit from analyzing our profitability and expense metrics excluding these one - time items . Source: Management and company filings. Non - GAAP Reconciliation Year Quarter Ended Ended (dollars in thousands) 12/31/2017 12/31/2017 Non-interest Expense (Reported) 30,097$ 7,746$ Non-Recurring M&A Expenses (829) (335) Non-Interest Expense (Operating) 29,268$ 7,411$ Non-Interest Income 4,084 1,000 Net Operating Expense (Operating) 25,184$ 6,411$ GAAP Net Income 7,208$ (459)$ Impact of Tax Cut and Jobs Act 2,740 2,740 After-Tax Merger Expenses 724 230 Operating Net Income 10,672$ 2,511$ Diluted Shares Outstanding 4,629,228 4,616,515 Average Assets 1,376,983$ 1,398,945$ Average Common Equity 109,979$ 113,017$ Non-Interest Expense /Avg Assets (Operating) 2.13% 2.12% (2) Net Operating Expense (1) /Avg Assets (Operating) 1.83% 1.83% (2) Operating ROAA 0.78% 0.72% (2) Operating ROACE 9.7% 8.9% (2) Operating Earnings Per Share $2.31 $0.54 (1) Net operating expense is the sum of non-interest expense offset by non-interest income. (2) Annualized