Attached files
| file | filename |
|---|---|
| EX-99.3 - EX-99.3 - JANUS HENDERSON GROUP PLC | a18-8483_1ex99d3.htm |
| EX-99.2 - EX-99.2 - JANUS HENDERSON GROUP PLC | a18-8483_1ex99d2.htm |
| 8-K - 8-K - JANUS HENDERSON GROUP PLC | a18-8483_18k.htm |

|
|
|
|
|
|
|
|
|
|
|
|
|
|
|
About Janus Henderson |
|
Janus Henderson is a leading global active asset manager dedicated to helping investors achieve long-term financial goals through a broad range of investment solutions, including equities, fixed income, quantitative equities, multi-asset and alternative asset class strategies. |
|
|
Janus Henderson Group plc Annual Report 2017 |
|

|
|
| |||||
|
|
| |||||
|
|
||||||
|
|
| |||||
|
|
|
|
|
|
| |
|
|
|
|
|
|
Business review | |
|
Business highlights
2017 was a landmark year in the history of our company, with the completion of the merger of equals to form Janus Henderson Group plc (‘the Group’).
The Group’s investment performance improved year-on-year and despite net outflows, we continue to see strong levels of engagement and support from clients globally. In 2017, we delivered revenue and profitability growth, and are pleased with the pace of progress towards our targeted cost synergies. |
|
This report and additional information about the Group can be found online at janushenderson.com/ir |
|
|
2 Group at a glance 4 Chairman and Deputy Chairman’s statement 6 Co-Chief Executive Officers’ statement 9 Launching Janus Henderson 10 Investment management overview 14 Client relationships and brand
Governance
18 Board of Directors 22 Governance overview
Form 10-K
26 Form 10-K
Other information
214 Shareholder information 216 Two year financial summary (unaudited)
| |
|
|
|
|
|
|
| |
|
|
|
|
|
|
| |
|
|
|
|
|
|
| |
|
|
|
|
|
|
| |
|
Investment outperformance1 (%) |
|
Net new money growth2 (%) |
|
|
Notes
Data for 2016 and 2017 periods present the results of JHG as if the merger had occurred at the beginning of the period shown. See pro forma adjusted financial measures reconciliation on Form 10-K pages 43 and 44 for additional information.
In accordance with the Australian Securities and Investment Commission Corporations Instrument 2016/91, amounts in this Annual Report have been rounded to the nearest US$0.1m, unless otherwise stated.
1. Investment performance data represents percentage of AUM outperforming the relevant benchmark. Full performance disclosures detailed on page 216.
2. Calculated as total flows divided by beginning of period AUM.
3. 2017 includes a hypothetical per share dividend for Janus Henderson Group plc for 1Q17. The amount is derived by taking the sum of the cash dividends each legacy firm paid to its respective shareholders (for legacy Janus that was US$20.3m and for legacy Henderson that was US$26.9m), divided by the number of shares outstanding as at 30 May 2017 (approximately 200.4m). USD/GBP 1.3017.
| |
|
66% |
|
(3%) |
|
| ||
|
of AUM beating benchmark over three years |
|
|
|
| ||
|
|
|
|
|
| ||
|
|
|
|
|
| ||
|
|
|
|
|
| ||
|
|
|
|
|
| ||
|
|
|
|
|
| ||
|
Assets under management (AUM) (US$) |
|
Adjusted operating margin (%) |
|
| ||
|
370.8bn |
|
39.6% |
|
| ||
|
|
|
|
|
| ||
|
|
|
|
|
| ||
|
|
|
|
|
| ||
|
|
|
|
|
| ||
|
|
|
|
|
| ||
|
|
|
|
|
| ||
|
Adjusted diluted earnings per share (US$) |
|
Dividend per share3 (US$) |
|
| ||
|
2.48 |
|
1.20 |
|
| ||
|
|
|
|
|
| ||
|
|
|
|
|
| ||
|
|
|
|
|
| ||
|
|
|
|
|
| ||
|
|
|
|
|
| ||
|
|
|
|
|
|
Janus Henderson Group plc Annual Report 2017 | |
|
|
|
|
|
|
| |


|
|
|
| |||||
|
|
|
| |||||
|
|
BUSINESS REVIEW
|
| |||||
|
|
|
| |||||
|
Group at a glance |
|
Janus Henderson is an independent global asset manager, specialising in active management. We offer a broad range of investment solutions across major asset classes to a client base around the world. | |||||
|
|
|
| |||||
|
|
|
| |||||
|
Our purpose: |
|
At Janus Henderson: | |||||
|
|
|
| |||||
|
We exist to help our clients achieve their long-term financial goals
|
|
We put our clients first |
We succeed as a team |
We act like an owner | |||
|
|
|
| |||||
|
We aim to: |
|
| |||||
|
|
|
| |||||
|
Be a partner our clients can trust working to deliver excellence in both investment returns and service |
Partner with each other on our responsibilities to our clients and create an environment where all our colleagues can thrive and successfully achieve their personal and professional goals
|
Be a responsible steward for our owners, pursuing efficiency and taking pride in delivering stable and consistent financial returns | |||||
|
|
|
| ||||||
|
Total assets under management (AUM) (US$) 370.8bn 2016: 319.2bn |
|
Investment performance by capability | ||||||
|
|
| |||||||
|
|
Percentage of AUM outperforming benchmark
| |||||||
|
|
|
AUM |
1 year |
3 years |
5 years | |||
|
|
Equities |
189.7 |
|
|
| |||
|
Equities (US$) 189.7bn 2016: 153.3bn Diverse business encompassing a wide range of geographic and investment styles.
Quantitative Equities (US$) 49.9bn 2016: 46.5bn Our quantitative equity manager, Intech, applies advanced mathematical and systematic portfolio rebalancing intended to harness the volatility of stock price movements.
Alternatives (US$) 19.5bn 2016: 17.7bn Expertise in liquid alternatives and absolute return alongside traditional hedge funds. |
|
Fixed Income (US$) 80.1bn 2016: 73.7bn Coverage across the asset class, with an increasingly global offering.
Multi-Asset (US$) 31.6bn 2016: 28.0bn Retail and institutional offering through a diversity of strategies including global asset allocation, traditional multi-manager and alternative asset class specialists. |
|
Fixed Income |
80.1 |
|
|
|
|
|
Quantitative Equities |
49.9 |
|
|
| |||
|
|
Multi-Asset |
31.6 |
|
|
| |||
|
|
Alternatives |
19.5 |
|
|
| |||
|
|
Total Group |
370.8 |
|
|
| |||
|
|
|
|
|
|
| |||
|
|
Note: Investment performance data represents percentage of AUM outperforming the relevant benchmark. Full performance disclosures detailed on page 216.
Strong client relationships Our clients are financial professionals as well as private and institutional investors. We focus on excellent client service and on establishing long-term client relationships based on trust.
An award-winning brand proposition We believe in the sharing of expert insight for better investment and business decisions. We call this ethos Knowledge. Shared. This award-winning brand proposition provides investment insight, thought leadership and transparency to our clients in a timely and cost-efficient way.
Note: All data as at 31 December 2017, unless stated otherwise. | |||||||
|
|
|
|
|
| ||||
|
Janus Henderson Group plc Annual Report 2017 |
|
| ||||||
|
|
|
| ||||||
|
|
|
|
|
| ||||
|
|
| ||||||||||||||||||||||||
|
|
| ||||||||||||||||||||||||
|
|
|||||||||||||||||||||||||
|
| |||||||||||||||||||||||||
|
|
|
|
|
|
|
|
|
|
|
| |||||||||||||||
|
Assets under management | |||||||||||||||||||||||||
|
|
|
|
|
|
|
|
|
|
|
| |||||||||||||||
|
|
|
|
|
|
|
|
|
|
|
| |||||||||||||||
|
|
AUM by client type (%) |
|
|
|
AUM by capability (%) |
|
|
|
AUM by client location (%) |
| |||||||||||||||
|
|
|
|
|
|
|
|
|
|
|
| |||||||||||||||
|
|
|
|
|
|
|
|
|
|
|
| |||||||||||||||
|
|
Our clients are financial professionals as well as private and institutional investors. |
|
|
|
We manage assets diversified across five core investment capabilities: Equities, Fixed Income, Quantitative Equities, Multi-Asset and Alternatives. |
|
|
|
We manage assets for clients based across the world. |
| |||||||||||||||
|
|
|
|
|
|
|
|
|
|
|
| |||||||||||||||
|
|
|
|
|
|
|
|
|
|
|
| |||||||||||||||
|
|
|
|
|
|
|
|
|
|
|
| |||||||||||||||
|
|
|
|
|
|
|
|
|
|
|
|
|
|
|
|
|
| |||||||||
|
|
|
US$62.0bn |
|
|
|
|
|
US$189.7bn |
|
|
|
|
|
US$192.8bn |
|
| |||||||||
|
|
|
US$164.1bn |
|
|
|
|
|
US$80.1bn |
|
|
|
|
|
US$120.2bn |
|
| |||||||||
|
|
|
US$144.7bn |
|
|
|
|
|
US$49.9bn |
|
|
|
|
|
US$57.8bn |
|
| |||||||||
|
|
|
|
|
|
|
|
|
US$31.6bn |
|
|
|
|
|
|
|
| |||||||||
|
|
|
|
|
|
|
|
|
US$19.5bn |
|
|
|
|
|
|
|
| |||||||||
|
|
|
|
|
|
|
|
|
|
|
|
|
|
|
|
|
| |||||||||
|
|
|
|
|
|
|
|
|
|
|
|
|
|
| ||||||||||||
|
|
|
|
|
|
|
|
|
|
|
|
|
|
| ||||||||||||
|
Global geographic distribution |
|
|
|
|
|
|
| ||||||||||||||||||
|
|
|
|
|
|
|
|
|
|
|
|
|
|
| ||||||||||||
|
We have strong distribution platforms and deep client relationships in the US, UK, Continental Europe, Japan and Australia, and an evolving business in Latin America and the Middle East. |
|
|
|
For more information go to page 16 |
| ||||||||||||||||||||
|
|
|
|
|
|
|
|
|
|
|
|
|
|
| ||||||||||||
|
|
|
|
|
|
|
|
|
|
|
| |||||||||||||||
|
|
Americas |
|
|
|
Europe, Middle East and Africa (EMEA) |
|
|
|
Asia Pacific |
| |||||||||||||||
|
|
|
|
|
|
|
|
|
|
|
| |||||||||||||||
|
|
Total AUM
|
US$192.8bn
|
|
|
|
Total AUM
|
US$120.2bn
|
|
|
|
Total AUM
|
US$57.8bn
|
| ||||||||||||
|
|
Investment professionals
|
281
|
|
|
|
Investment professionals
|
202
|
|
|
|
Investment professionals
|
43
|
| ||||||||||||
|
|
Distribution professionals
|
280
|
|
|
|
Distribution professionals
|
231
|
|
|
|
Distribution professionals
|
91
|
| ||||||||||||
|
|
|
|
|
|
|
|
|
|
|
| |||||||||||||||
|
|
Established North American distribution network serving a diverse set of clients across financial intermediaries, institutions and self-directed channels. The organic build out of our Latin America business is gathering momentum. |
|
|
|
Strong retail and institutional client base in the UK with an award-winning Investment Trust business. Strong relationships with global distributors in Continental Europe and growing institutional opportunities. |
|
|
|
Strategic partnership with Dai-ichi Life and its partners supports the growth of our Japanese business. Australian distribution offers a suite of global and domestic capabilities. The wider Asian business continues to evolve, with growing brand presence. |
| |||||||||||||||
|
|
|
|
|
|
|
|
|
|
|
| |||||||||||||||
|
|
|
|
|
| |||||||||||||||||||||
|
|
|
|
|
|
|
|
|
|
|
| |||||||||||||||
|
|
|
|
|
|
|
|
|
|
|
| |||||||||||||||
|
|
|
|
|
|
|
|
|
|
|
| |||||||||||||||
|
Investment case |
| ||||||||||||||||||||||||
|
|
|
| |||||||||||||||||||||||
|
|
|
| |||||||||||||||||||||||
|
|
Janus Henderson has: |
| |||||||||||||||||||||||
|
|
|
| |||||||||||||||||||||||
|
|
|
|
|
|
|
| |||||||||||||||||||
|
|
Depth, breadth and connectivity of investment teams focused on delivering better risk-adjusted outcomes for clients. |
Distribution strength in largest five markets globally, to leverage the opportunity to deepen client relationships. |
Compelling products and solutions to address a broad range of client needs. |
Scale and capacity to innovate amid continuing regulatory change. |
A robust balance sheet providing stability for the company to weather changes in market conditions. |
| |||||||||||||||||||
|
|
|
|
|
|
|
| |||||||||||||||||||
|
|
|
| |||||||||||||||||||||||
|
Note: All data as at 31 December 2017, unless stated otherwise. |
| ||||||||||||||||||||||||
|
|
|
| |||||||||||||||||||||||
|
|
|
|
|
|
Janus Henderson Group plc Annual Report 2017
| ||||||||||||||||||||


|
|
|
|
|
|
|
|
|
|
|
BUSINESS REVIEW
|
|
|
|
|
|
| ||||
|
Chairman and Deputy Chairman’s statement |
|
This has been a significant year for Janus Henderson. We look forward to developing the opportunities before us for clients, shareholders and employees. | ||||
|
|
|
| ||||
|
|
|
| ||||
|
|
|
|
|
| ||
|
|
|
|
|
| ||
|
2017 total dividend per share (US$) 1.20 2016: n/a |
|
Launching Janus Henderson
It is with great pleasure that we introduce the inaugural Janus Henderson Group annual report. 2017 was a momentous year for the firm, with the completion of the merger of Janus Capital Group and Henderson Group. It marked a step change in the shape and footprint of our respective businesses.
We operate in a challenging landscape, with pressures from competitors, clients, regulators and technology, and we must evolve and innovate in order to remain relevant. Both Janus and Henderson were successful companies in their own right and it was with the most careful consideration by the respective Boards and Management teams that the transformational merger was recommended to shareholders.
As a merged group with US$371 billion assets managed for clients globally, Janus Henderson has distribution strength in the largest five markets in the world – the US, UK, Continental Europe, Japan and Australia. Together with our highly diversified product range and the scale to invest and innovate, we believe we have the foundations to be a leading, global, active asset manager. |
|
The Group’s activities over the past year can be separated into two halves: merger completion and integration. The transatlantic merger was one of the largest executed in our industry. Multiple workstreams focused on the preparations ahead of the merger’s completion on 30 May 2017, involving hundreds of employees and multiple advisors. Our focus on delivering value to our clients, however, remained unwavering. It was critical that our investment teams were undisrupted through the merger. The achievement of this is evidenced in our improved long-term investment performance, with two thirds or more of AUM outperforming benchmarks over one, three and five-year periods as at 31 December 2017. We would particularly highlight the positive response from clients, derived from the complementary nature of the merger and transparent communication. Equally, we are pleased by the subsequent excellent progress made with integrating the firms, without adversely affecting outcomes for our clients. The timeline to complete integration will continue into 2018 and beyond, and we are encouraged by how well the business has come together in the last seven months. | ||


Janus Henderson Group plc Annual Report 2017
|
|
|
|
|
|
|
|
|
|
|
|
|
|
|
Launching a new company with over 2,000 employees and with offices in 27 cities world-wide has required an extraordinary effort by our teams and partners in a very short time. We express our thanks to all Janus Henderson employees and our partners for their efforts and commitment to achieving our collective goal.
Leadership and governance
Establishing a common culture for Janus Henderson is one of the over-arching aims of the Board and Management. This has even greater relevance in a merger of equals, where it is imperative to bring the two cultures together in a truly collaborative way. The process has been helped by the strong focus the two firms had on pure-play, active asset management and client service.
The decision to appoint co-Chief Executive Officers (co-CEOs) has been important in enabling the merger and critical to the successful integration. We are pleased with the highly qualified team which the co-CEOs, Andrew Formica and Dick Weil, have now built around them to lead Janus Henderson forward. Andrew and Dick, together with their Executive Committee, have a strong sense of responsibility to our shareholders, recognise the importance of collaboration between employees, and have passionate belief in the value active management delivers for clients. It is this cultural fit and their leadership that has laid the best possible foundation for the new Group. In getting to this position, we acknowledge the contribution of a number of colleagues from the individual firms’ leaderships who have now left but who were critical to achieving the merger. |
|
The new Board of Janus Henderson Group met formally throughout the second half of 2017. As a dual-listed company on the New York Stock Exchange (NYSE) and the Australian Securities Exchange (ASX) incorporated in Jersey, Janus Henderson has a unique corporate structure and regulatory obligations. The Group adopted a corporate governance policy in a form customary for NYSE-listed companies, adapted as necessary to reflect Janus Henderson’s dual-listed status in the US and Australia. We are pleased to say that the new Board has come together very well since the completion of the merger.
Later in this report we have included an overview of the governance structure and topics addressed by the Board in its first meetings.
Financial strength and capital management
This year’s financial results reflect the benefit of the Group’s increased scale, with total adjusted operating income of US$732 million and adjusted diluted earnings per share of US$2.48, compared to US$1.94 in 2016 on a pro forma basis1.
The Board takes an active, disciplined approach to the management of Janus Henderson’s cash and capital resources. It believes in balancing the capital needs and the investment opportunities of the business with shareholder interests, without emphasising the use of leverage. This approach has been demonstrated by the funding of a quarterly dividend which we expect will broadly grow in line with adjusted earnings growth. As integration efforts bed down and short-term needs for cash abate, and when capital generation outweighs opportunities to organically invest in the business, we will look to return excess capital to shareholders. |
|
Dai-ichi Life Holdings Inc. and Janus Henderson: A strategic partnership
We would like to take the opportunity to express our thanks to our strategic partners at Dai-ichi Life. We thank them not only for their support in completing the merger but also for reaffirming their commitment as shareholders, their additional investment in Janus Henderson products, and their continued support to grow our Japanese business. We are grateful for their partnership and look forward to continuing to develop the relationship in the years to come.
In concluding, we would like to thank our fellow Board members for their care and commitment, and to all our colleagues at Janus Henderson for a successful year. We express our thanks also to our clients and shareholders for their continuing support.
2017 will be remembered as a significant year for Janus Henderson. Through the merger we have created a firm with a greater global footprint, product capabilities and scale with which to invest. We are just at the start of our path as a new firm but look forward with anticipation to developing together the opportunities ahead.
Richard Gillingwater Chairman
Glenn Schafer Deputy Chairman |

|
|
|
|
|
|
|
1. Data for the 2016 and 2017 periods present the results of JHG as if the merger had occurred at the beginning of the period shown. See pro forma adjusted financial measures reconciliation on Form 10-K pages 43 and 44 for additional information. | ||||
Janus Henderson Group plc Annual Report 2017
|
|
|
|
|
|
|
|
|
|
|
BUSINESS REVIEW
|
|
|
|
|
|
| ||||
|
Co-Chief Executive Officers’ statement |
|
Janus Henderson is a business of great opportunity and potential. 2017 was a year of integration and setting the foundations for growth. | ||||
|
|
|
| ||||
|
|
|
| ||||
|
|
|
| ||||
|
|
|
|
|
| ||
|
|
|
|
|
| ||
|
2017 adjusted diluted earnings per share (US$)1 2.48 2016: 1.94 (Pro forma) |
|
2017 was a landmark year in the history of our company. Janus Henderson starts life with a rich opportunity set in front of us. We have a business underpinned with a broad array of clients who support and rely on us, great talent and a strong balance sheet enabling us to make the investments required to adapt efficiently to the ever-changing environment.
A year in review
Looking to the dynamics of the financial markets in which we operate, 2017 was a year in which markets experienced broad-based growth despite meaningful change in the macro environment. We began the year with concerns for the potential impact of global disruption: the effect of geopolitical change on policies, questions about how long the bull market – and central banks’ support – could continue, and whether the growth prospects for global economies would underperform. What followed was a year of impressive, synchronised global growth, with all 35 of the OECD countries2 recording positive growth. Market commentators were surprised that macro momentum did not drive inflation or have significant impacts on interest rates globally. This was good news for equities and fixed income asset prices generally. There were however big variations within markets, with growth stocks continuing to outperform in 2017. |
|
It was against this backdrop that Janus Henderson saw continued improvement in the Group’s combined investment performance. Over one, three and five-year periods, 76%, 66% and 79% of assets outperformed their benchmarks respectively3, which compared favourably over the same time periods a year ago.
We are truly blessed with a broad and deep array of investment talent but a risk of any transformational transaction in our industry is that it disrupts the investment process. Pleasingly, the strength of our performance is evidence that Janus Henderson saw no such disruption, and is testament to the teams quickly embracing the value of the merger and their professionalism in appreciating that change can help build better outcomes for clients through the sharing of ideas.
At the core of Janus Henderson is the belief in the role active management has to play in helping our clients achieve their long-term financial goals, and we are very pleased with investment performance achieved in 2017.
| ||


Janus Henderson Group plc Annual Report 2017
|
|
|
|
|
|
|
|
|
|
|
|
Janus Henderson starts life with a rich opportunity set in front of us.” Dick Weil Co-Chief Executive Officer |
|
|
At our core is the belief in the role that active management has to play in helping our clients achieve their long-term financial goals.” Andrew Formica Co-Chief Executive Officer |
|
|
| |||||
|
|
|
|
|
|
| |
|
|
|
|
|
|
|
|
|
|
|
|
|
|
|
At the end of 2017, Janus Henderson managed US$371 billion for clients, an increase of 16%, with growth during the year1 driven by positive markets and currency movements. The Group saw net outflows for the year, totalling US$10.2 billion. US$7.6 billion of the net outflows were derived from our Quantitative Equities business, primarily in the first quarter, as a result of poor performance in the second half of 2016. Despite these headwinds, we have been encouraged by feedback from our clients.
Our Equities capability saw net outflows of US$1.3 billion for the year, with flows into our Intermediary and Institutional channels impacted by headwinds in the Self-directed business. Geographically, Intermediary flows in our European business were weak but notably in the US Intermediary channel, we gained share in the equity market during 2017, with our Equity mutual fund business outpacing the industry’s organic growth rate by 180 basis points. Fixed Income net flows were flat for the year. Outflows from the Janus Henderson European Corporate Bond Fund were offset by strong inflows into our Absolute Return fund run out of Australia by our fully owned subsidiary, Kapstream, and encouraging interest in the Janus Henderson Global Unconstrained Bond Fund. Our Multi-Asset business experienced an improvement in net outflows during the year and we were pleased by the improvement in investment performance in Janus Henderson Balanced, this capability’s single largest strategy. Absolute Return products continued to attract strong inflows in our Alternatives capability throughout 2017. These were offset by a combination of Institutional mandate losses and modest outflows attributed to the UK Property PAIF, albeit reduced from levels seen in 2016.
Our Institutional offering saw good traction globally across a diverse breadth of strategies. The ten largest Institutional net inflows for the year were sourced from nine different strategies. With improved investment performance and consultants beginning to take Janus Henderson off post-merger ‘watch’ lists, we are excited by the opportunities for new business. |
|
Later in this report, Janus Henderson’s Chief Investment Officer, Enrique Chang, and our Global Head of Distribution, Phil Wagstaff, provide further detail into our diverse investment capabilities and increased distribution strength.
Our business results translated into strong financial results, providing evidence of the improved operating leverage in the business following the merger.
§ Adjusted revenue of US$1,848 million (2016: US$1,669 million)1
§ Adjusted operating income of US$732 million (2016: US$565 million)1
§ Adjusted diluted earnings per share increased to US$2.48 (2016: US$1.94)1
As reflected in the results above, the combined business has greater financial scale which provides enhanced flexibility to invest in our business as well as the ability to adapt more efficiently to regulatory change and evolving governance expectations. In recent years, we have seen a wealth of regulatory change globally. 2017 saw no let-up in that pace, as rules were implemented to protect clients and help them better understand the products in which their money is invested. As a firm, we continue to ready the business. Whatever the outcome of global regulatory or political change, we are confident Janus Henderson will be able to continue to deliver services in the interests of clients.
One of the significant regulatory changes that we prepared for through 2017 was MiFID II and in the second half of 2017 we saw a rapid development in the process by which investment managers were planning to pay for third-party research in compliance with this new EU regulation. Driven by client demand and changing industry dynamics, there was a marked shift in the way costs for this research would be passed on to clients. Janus Henderson confirmed it will pay directly for third-party investment research for its European fund products and segregated clients of its European business. Excellence in research is fundamental to Janus Henderson’s investment processes. Our decision reflects our commitment to working on behalf of our clients to provide the best solution to meet their needs. |
|
Building a leading global active asset manager
Janus Henderson is a client-centric organisation, where investment excellence and client experience are paramount. We have an enviable market position in the largest markets in the world and aspire to be trusted by our clients and a destination employer. To achieve this, our culture needs to support and encourage our objectives.
In the months leading up to the merger, there was an extraordinary amount of work carried out to launch the brand of Janus Henderson effectively across a huge range of communications and provide clients with a seamless ‘Janus Henderson’ experience from Day One. Seven months in, integration efforts across the business have been successful and are progressing ahead of schedule. The business continues to come together and through the integration period employees around the world are embodying our brand proposition of Knowledge. Shared.
In November we announced an expansion of our long-standing strategic partnership with BNP Paribas whereby they will take over responsibility for the majority of our US back and middle office fund administration, fund accounting and custody functions. The enhanced partnership with BNP, coupled with the pace of integration across the firm, enabled us to increase our target for cost synergies that we expect to realise as a result of the merger within three years from completion. We remain well on track for our target of at least US$125 million in run rate net cost synergies and believe we will achieve US$90 million by the end of year one. |
|
|
|
|
|
|
|
1. Data for the 2016 and 2017 periods present the results of JHG as if the merger had occurred at the beginning of the period shown. See pro forma adjusted financial measures reconciliation on Form 10-K pages 43 and 44 for additional information.
2. The Organisation for Economic Co-operation and Development.
3. Investment performance data represents percentage of AUM outperforming the relevant benchmark. Full performance disclosures detailed on page 216. | ||||
Janus Henderson Group plc Annual Report 2017
|
|
|
|
|
|
|
|
|
|
|
BUSINESS REVIEW
|
|
|
|
|
|
|
|
Co-Chief Executive Officers’ statement continued |
|
|
|
|
|
|
|
Revenue growth opportunities
|
|
|
|
| ||
|
|
|
|
|
| ||
|
| ||||||
|
|
|
|
|
|
|
|
|
|
|
|
|
|
|
|
|
|
Dai-ichi strategic partnership § US$500 million funding into Global Growth, European Corporate Bond and European Secured Loan funds § Potential for distribution of additional products through Asset Management One § Broader global product offering for the Japanese market |
|
Cross-sell opportunities § Increasing penetration of existing products e.g. Global Equity Income and Emerging Markets in the US, and Unconstrained Bond and Intech in Europe § Launching existing products in alternative vehicles to broaden distribution |
|
New product development § Leveraging existing regional capabilities to create global products e.g. Global Small Cap § Enhancing Intech’s capabilities to create new products § Expanding Multi-Asset and Alternatives capabilities § Partnering with our clients to develop innovative solutions |
|
|
|
|
|
|
| ||
|
|
|
|
|
| ||
|
Looking forward
During the year, we have spoken often about the revenue synergies we believe we can deliver through our new combination. We think of these opportunities in three stages. Firstly, our strategic partner Dai-ichi completed the US$500 million investment into former-Henderson products it committed to at the time we announced the merger. Dai-ichi continues to be a great partner to Janus Henderson and we are excited about the future prospects with them and their affiliate, Asset Management One. Stage two leverages opportunities to cross-sell products to clients globally. Enhanced distribution strength was at the heart of the merger and with more than 600 distribution employees worldwide, we can advance opportunities which did not exist to us as individual companies. New product development completes the set of revenue synergies. We would expect the third stage to take the most amount of time to realise its potential as it involves the expansion of capabilities or partnering with our clients to develop innovative solutions. All of these opportunities are expected to materialise over multiple years however we are very pleased with the exceptional client response since we closed the merger and are encouraged with the progress we have seen to date. |
|
Priorities and outlook
What has been achieved in 2017 is remarkable and we are more convinced than ever of the merit of the merger. Janus Henderson is a business of great opportunity and potential. We have a broad, global footprint, with greater depth in each market and enhanced diversity of product. 2017 was a year of integration, in which a major part of our activity was largely internal as we set the foundations for growth. With the groundwork in place, we can turn our effort more external – focusing on achieving positive organic growth by being a trusted partner to our clients, delivering market-leading investment returns, insights and client experiences.
We finish by paying tribute to all of our colleagues at Janus Henderson for their hard work over the past year. None of what we accomplished this year would have been possible without your dedication and collaboration. It is a privilege to lead Janus Henderson and we very much look forward to seeing its potential realised.
Andrew Formica and Dick Weil Co-Chief Executive Officers |
|
| ||

Janus Henderson Group plc Annual Report 2017
|
|
|
|
|
|
|
|
|
|
|
| ||||||
|
Launching Janus Henderson |
|
In the months leading up to the merger, an extraordinary amount of work was carried out to launch the Janus Henderson brand and provide clients with a seamless experience from Day One. | ||||||
|
|
|
| ||||||
|
|
|
Rebranded | ||||||
|
|
10,000 |
70 |
27 | |||||
|
|
items of literature |
websites |
offices in a
| |||||
|
|
4,000 |
330+ |
| |||||
|
|
fund factsheets |
institutional client reports
|
| |||||
|
|
Accounting platforms merged |
Shareholders | ||||||
|
|
2 |
45,000 |
| |||||
|
|
|
transitioned in a single weekend
| ||||||
|
|
Fund holdings |
Offices consolidated |
US Mutual funds | |||||
|
|
100,000 |
7 |
78 | |||||
|
|
merged into a single system |
and 3 closed |
merged or approved
| |||||
|
|
|
|
| |||||
|
|
|
|
|
| ||||
|
|
|
Market capitalisation (US$)
|
Dual-listed
| |||||
|
|
7.7bn
|
NYSE & ASX | ||||||
|
|
Employees worldwide |
Offices |
Fund manager average |
Employee | ||||
|
|
+2,000 |
27 |
20 |
7% | ||||
|
|
|
in 14 countries
|
|
| ||||
|
|
2017 adjusted revenue |
2017 adjusted operating |
2017 adjusted diluted | |||||
|
|
1,848m |
732m |
2.48 | |||||


Note: All data as at 31 December 2017.
1. Data for the 2017 period presents the results of JHG as if the merger had occurred at the beginning of the period shown. See pro forma adjusted financial measures reconciliation on Form 10-K pages 43 and 44 for additional information.
Janus Henderson Group plc Annual Report 2017
|
|
|
|
|
|
|
|
|
|
|
BUSINESS REVIEW
|
|
|
|
|
|
|
|
Investment management overview |
|
We firmly believe in the role of active management and amongst the activity of the merger, our focus has remained on adding value for clients. |
|
|
|
|

|
Our primary goal is to help clients meet their investment objectives. In order to accomplish this, it is important that we have the correct products, management structure, investment experts and supporting teams. 2017 was a busy year in which the merger was accomplished with a view to minimising any disruption to clients. It is testament to the hard work of our operational, technology and client service teams that our investment experts were able to focus their energies on managing client portfolios. In aggregate, we were able to deliver solid investment performance for clients as demonstrated on page 11.
Building a global investment management team
While minimal, the merger engendered some reshaping of senior investment management as we sought to reflect the realities of the enlarged global business. As Global Chief Investment Officer of the combined group, I am pleased with the strength of the senior team around me and I believe we are in a strong position to drive the business forward. Fixed Income was further strengthened with the recruitment of Jim Cielinski as Global Head of Fixed Income. The Global Head of Equities role was made a joint role given the demands of multiple strategies; the depth of experience meant we were able to promote from within the organisation, with George Maris, based in Denver, covering North America and Alex Crooke, based in London, covering the rest of the world. |
A great strength of our business is that we are able to accommodate teams with distinct investment processes and did not stifle creativity as a result of the merger. Janus Henderson firmly believes in active management, so it was important to sustain this pursuit of adding value for clients within a risk-controlled environment. We continued, therefore, to encourage teams to follow existing successful models but also invested further in our risk management and compliance functions.
Throughout 2017 we fostered an environment where research was exchanged and ideas debated globally and this took on increased prominence with the merger. We seamlessly melded our corporate credit research teams in Denver and London, with a transatlantic analyst exchange programme deepening the interaction. The network of investment professionals in different locations directly feeding into individual mandates continued to expand, and encompasses strategies as diverse as absolute return fixed income, Asian equities and sustainable investment. With regards to our investment responsibilities to the environment, we signed a new initiative – Climate Action 100. Participants aim to engage with the top 100+ companies that contribute the most to global emissions, seeking action to reduce emissions and calling for enhanced corporate disclosure. |
The merger did not prevent us from launching new funds to address client demand. This included an AlphaGen hedge fund, which targets mispricings in derivative contracts, driven by a supply-demand imbalance originating in the market for structured products, and a Euro Secured Loans fund, which is primarily tailored to institutional investors seeking an attractive return in a low risk environment. In Japan, we launched the Janus Henderson Mid-Cap Growth fund in October for retail investors, which attracted more than US$400 million in a few short months.
Investment performance through active management
Evidence of synchronised global growth, US tax reform, and the resurgence in commodity prices spurred many equity markets to new highs. Within our Equities capability, both our technology franchises performed well and attracted net flows as investors sought access to a sector that is transforming the global economy through disruptive innovation. Other distinct specialist propositions, including life sciences, saw similar success and natural resources also performed well. Our emerging market equity franchise continues to gain clients across geographies, attracted to the team’s disciplined investment process. |
Janus Henderson Group plc Annual Report 2017
|
|
|
|
|
|
|
|
|
|
|
| ||||
|
In terms of style, growth outperformed value in most markets. Small and mid-cap strategies were typically strong performers, with our mid-cap growth fund Janus Henderson Enterprise bringing in net inflows of more than US$1.8 billion and Janus Henderson Triton also seeing net inflows. Despite the strength in growth stocks, a majority of our Perkins value strategies performed well and battled against the investor style rotation. There were mixed results from European equities, however, with disappointing performance in some of the growth strategies leading to outflows. Income remained a requirement for many investors, helping to maintain strong flows into the global equity income strategy.
Buoyed by ongoing central bank purchases, relatively restrained inflation, and an ongoing search for yield, fixed income markets generally experienced further yield and spread compression, which lifted bond prices. Towards the end of the year, however, there was firmer evidence of central banks looking to wind back loose monetary policy and yields began to climb. There was clear investor appetite for strategies that were unconstrained and are intended to offer more in the way of protection against the prospect of rising interest rates, with some investors rotating out of more core strategies. Australia remained a key source of growth for our fixed income capability with good performance and flows across both our domestic and global capabilities, with the Kapstream subsidiary being named KangaNews Australian Credit Fund Manager of the Year 2017.
Intech, our Quantitative Equity manager, performed well in 2017, with relative risk strategies performing particularly strongly and absolute risk, low volatility strategies in line with expectations. However, flows reflected ongoing industry trends towards passive management in US equities, as well as investor response to underperformance in 2016, and total net outflows from Intech were US$7.6 billion. This was primarily reflected in the US-focused strategies, as Intech’s global capabilities attracted more than US$1 billion in net inflows. In 2017 Intech marked the 30th anniversary of its founding with a major refresh of its brand and the launch of a new website. Other key developments included enhanced capability in creating customised portfolios for clients, allowing for greater client reach, and the launch of a new absolute return capability. |
Investment performance by capability |
| ||||
|
|
| |||||
|
Percentage of AUM outperforming benchmark |
| |||||
|
| ||||||
|
|
AUM |
|
|
| ||
|
|
(US$bn) |
1 year |
3 years |
5 years | ||
|
Equities |
189.7 |
|
|
| ||
|
Fixed Income |
80.1 |
|
|
| ||
|
Quantitative Equities |
49.9 |
|
|
| ||
|
Multi-Asset |
31.6 |
|
|
| ||
|
Alternatives |
19.5 |
|
|
| ||
|
Total Group |
370.8 |
|
|
| ||
|
|
|
|
|
| ||
|
Note: Investment performance data represents percentage of AUM outperforming the relevant benchmark. Full performance disclosures detailed on page 216. | ||||||
|
|
|
|
|
| ||
|
|
|
|
|
| ||
|
Multi-Asset in the US is dominated by our Balanced strategy. Net flows for the year were down despite strong performance and broadly reflected retail investors seeking more aggressive strategies given the momentum in equity markets. Within Europe, there was a recovery in performance of the retail funds and the diversified growth strategy and efforts were focused on strengthening distribution partners.
Investors looking for sources of uncorrelated return spurred interest in many of our alternative strategies, including diversified risk premia and UK absolute return, with the latter bringing in an additional US$1.7 billion of net flows. The UK commercial property fund performed well in 2017 after the Brexit-related challenges of 2016 and flows, albeit negative for the year as a whole, recovered as the year progressed, with investors regaining their trust in ‘bricks and mortar’ as a source of income.
Taken together, the strong aggregate performance is encouraging since we are ultimately judged on our capacity to meet client’s return objectives. With the key merger milestones successfully passed, 2018 offers a year in which our depth of investment talent and breadth of strategies create a firm platform from which to retain and attract investors. |
|
|
|
| ||
Janus Henderson Group plc Annual Report 2017
|
|
|
|
|
|
|
|
|
|
|
BUSINESS REVIEW
|
|
|
|
|
|
|
|
| ||||||||
|
Investment management overview continued |
|
|
|
| ||||||||
|
|
|
|
|
| ||||||||
|
|
|
|
|
| ||||||||
|
|
|
|
|
| ||||||||
|
|
|
|
|
| ||||||||
|
|
|
|
|
| ||||||||
|
|
|
|
|
| ||||||||
|
|
|
|
|
| ||||||||
|
|
|
|
|
| ||||||||
|
We offer expertise across major asset classes, with investment teams situated around the world. |
|
Equities
We offer clients a wide range of equity strategies encompassing different geographic focuses and investment styles. The equity teams include those with a global perspective, those with a regional focus – US, Europe, Asia and Australia – and those invested in specialist sectors. |
|
Fixed Income
Our Fixed Income teams provide coverage across the asset class applying a wide range of innovative and differentiated techniques. These teams include those adopting global unconstrained approaches through to teams with more focused mandates – based in the US, Europe, Asia and Australia. The capabilities of these teams can be accessed through individual strategies and are combined where appropriate to form multi-strategy offerings. | ||||||||
|
|
|
|
|
| ||||||||
|
|
|
|
|
| ||||||||
|
|
|
Equities AUM (US$bn) |
|
Fixed Income AUM (US$bn) | ||||||||
|
|
|
|
|
| ||||||||
|
|
|
189.7bn |
|
80.1bn | ||||||||
|
|
|
|
|
| ||||||||
|
|
|
Investment outperformance |
|
Investment outperformance | ||||||||
|
|
|
|
|
|
|
|
|
|
|
| ||
|
|
|
|
1 year |
3 years |
5 years |
|
|
1 year |
3 years |
5 years | ||
|
|
|
Equities |
|
|
|
|
Fixed Income |
|
|
| ||
|
|
|
|
|
| ||||||||
|
|
|
Largest pooled funds |
|
Largest pooled funds | ||||||||
|
|
|
|
AUM |
|
|
AUM | ||||||
|
|
|
|
31 Dec 2017 |
|
|
31 Dec 2017 | ||||||
|
|
|
Funds |
(US$bn) |
|
Funds |
(US$bn) | ||||||
|
|
|
JnsHnd Enterprise |
16.1 |
|
JnsHnd Flexible Bond |
8.6 | ||||||
|
|
|
JnsHnd Research |
13.5 |
|
JnsHnd Absolute Return |
4.9 | ||||||
|
|
|
JnsHnd Forty |
11.6 |
|
JnsHnd Strategic Bond |
2.7 | ||||||
|
|
|
JnsHnd Triton |
9.6 |
|
JnsHnd Hzn European Corporate Bond |
2.2 | ||||||
|
|
|
JnsHnd Global Equity Income |
5.6 |
| ||||||||
|
|
|
|
|
|
JnsHnd Global Unconstrained Bond |
2.2 | ||||||


Note: Investment performance data represents percentage of AUM outperforming the relevant benchmark. Full performance disclosures detailed on page 216.
Janus Henderson Group plc Annual Report 2017
|
|
|
|
|
|
|
|
|
|
|
|
|
|
|
|
|
|
|
|
|
| |||||||||||||
|
|
|
|
|
|
| |||||||||||||
|
Quantitative Equities
Our Quantitative Equities business, known under the brand ‘Intech’, applies advanced mathematics and systematic portfolio rebalancing intended to harness the volatility of movements in stock prices – a reliable source of excess returns and risk control. With more than 30 years of volatility expertise, the Intech team employs a distinctive quantitative approach based on observations of actual price movements, not on subjective forecasts of companies’ future performance. |
|
Multi-Asset
Janus Henderson Multi-Asset includes teams in the US and UK. In the US, the team manages Global Asset Allocation strategies. In the UK, we have traditional multi-manager investors, asset allocation specialists and those focused on alternative asset classes. |
|
Alternatives
The Janus Henderson Alternatives grouping includes teams with different areas of focus and approach. Diversified Alternatives brings together a cross-asset class combination of alpha generation, risk management and efficient beta replication strategies. These include Multi-Strategy, Liquid Alternatives, Absolute Return, Agriculture and Global Commodities/Managed Futures. Finally, the investment management of our direct UK commercial property offering is sub-advised to TH Real Estate. |
| |||||||||||||
|
|
|
|
|
|
| |||||||||||||
|
Quantitative Equities AUM (US$bn) |
|
Multi-Asset AUM (US$bn) |
|
Alternatives AUM (US$bn) |
| |||||||||||||
|
|
|
|
|
|
| |||||||||||||
|
49.9bn |
|
31.6bn |
|
19.5bn |
| |||||||||||||
|
|
|
|
|
|
| |||||||||||||
|
Investment outperformance |
|
Investment outperformance |
|
Investment outperformance |
| |||||||||||||
|
|
1 year |
3 years |
5 years |
|
|
1 year |
3 years |
5 years |
|
|
1 year |
3 years |
5 years |
| ||||
|
Quantitative Equities |
|
|
|
|
Multi-Asset |
|
|
|
|
Alternatives |
|
|
|
| ||||
|
|
|
|
|
|
| |||||||||||||
|
Five investment platforms |
|
Largest pooled funds |
|
Largest pooled funds |
| |||||||||||||
|
All strategies subscribe to an investment idea used across five investment platforms: equity price volatility is enduring and a reliable source of both excess return and a key to risk control.
|
|
Funds |
AUM |
|
Funds |
AUM |
| |||||||||||
|
|
||||||||||||||||||
|
|
||||||||||||||||||
|
JnsHnd Balanced |
14.0 |
|
JnsHnd UK Absolute |
6.0 |
||||||||||||||
|
Enhanced Equity
Active Core Equity
Adaptive Volatility Equity
Low Volatility Equity
Absolute Return
|
|
Low Tracking Error Relative Return Objective
Low Standard Deviation Absolute Return Objective |
|
JnsHnd Cautious Managed |
3.0 |
|
Return (SICAV) |
|
||||||||||
|
JnsHnd Multi-Manager |
0.6 |
JnsHnd UK Property |
4.1 |
|||||||||||||||
|
Managed |
|
|
PAIF/PAIF Feeder |
|
||||||||||||||
|
|
|
|
JnsHnd UK Absolute |
3.5 |
||||||||||||||
|
|
|
|
Return (OEIC) |
|
||||||||||||||
|
JnsHnd Horizon Pan |
1.2 |
|||||||||||||||||
|
JnsHnd Multi-Asset |
0.2 |
|||||||||||||||||
|
| ||||||||||||||||||


Janus Henderson Group plc Annual Report 2017
|
|
|
|
|
|
|
|
|
|
|
|
BUSINESS REVIEW
|
|
|
|
|
|
|
|
Client relationships |
|
In a year that saw developments in the political, economic, and our own corporate landscape, we focused on putting clients first and aligning around common goals. |
|
|
|
|

|
One of the best pieces of advice I was given and now share with new starters in the industry is to embrace change. I think this applies to many aspects of life but is especially true within the asset management industry. Resistance to change is, in my view, energy wasted; the world is continuously changing and it is far better to respond with openness and flexibility.
Change is the essence of what we do – it is the reason clients turn to us for long-term solutions, the subject of our investment teams’ analysis and the object of their portfolio positioning. It is, therefore, our ability as a business to recognise the drivers with the most meaningful potential to create change and our ability to adapt on behalf of our clients that will determine our success.
2017 was a year of significant change. At a macro level, it combined new, uncharted political developments with the impact of moves by central banks away from many years of emergency economic stimulus. It saw regulators impose new requirements on the industry and saw the merits of active and passive investment again in the spotlight. And, of course, for us at a corporate level, it saw the creation of Janus Henderson.
|
Janus Henderson merger
As one of the largest cross-border mergers ever seen in the industry, there was high potential for disruption to those people that matter the most to us: our clients. It was therefore imperative to me that the integration be managed smoothly and at no point come at a cost to our day-to-day relationships with clients. There were notable changes to communicate, a global rebrand to implement and product ranges to bring together, but the aim was to keep disruption to clients to a minimum.
Looking back, I am pleased with what we achieved. There were bumps along the road, but feedback from clients and peers has been overwhelmingly positive. Our investment capabilities have been broadened, our distribution teams were strengthened, and enhancements were made to the back office systems that allow us to best service our clients. Our distribution footprint is now truly global and this opens up the potential to build new and stronger relationships with global distributors and key institutional clients, something that has already proved beneficial since the merger completed. With experienced and talented distribution teams covering all major markets worldwide, we are able to understand the variety of challenges facing our clients and seek to deliver solutions accordingly. |
Clients are already benefiting from the wider product range we offer, with notable examples of US investors exploring opportunities with our UK-based Global Equity Income, Strategic Fixed Income and Global Emerging Markets teams, while European and Asia Pacific clients have access to highly experienced US-based fixed income teams and our equities franchise.
Knowledge. Shared
A key aspect of our approach is sharing expert insight for better investment and business decisions. We call this ethos Knowledge. Shared. It is reflected both in how our investment teams interact and in our commitment to empowering clients in their decision-making.
Central to this approach is making the intellectual capital of our investment teams and subject matter experts readily available. 2017 provided many opportunities, with market-moving events leading clients to naturally seek the views of experts. For some of our US clients, Knowledge. Shared would have been a new concept, so it was pleasing to see strong interaction with our US blog and websites. This was alongside the excellent Janus Henderson Labs, a series of high-value consultancy and training programmes that have been popular with US professional clients for a number of years, and which we are now in the process of adapting for use globally where appropriate. |
Janus Henderson Group plc Annual Report 2017
|
|
|
|
|
|
|
|
|
|
|
|
|
|
|
We also continued to publish our quarterly study of the dividends paid by leading global companies and our well-regarded Market GPS outlook. This mix of forward-looking insight led to strong pick-up in the media globally and onward distribution of articles and videos by third parties and clients.
In addition, we also offered clients the chance to hear from our managers first-hand at a series of Knowledge Exchange events. These included panel discussions with experts, both from within Janus Henderson and externally, and interactive sessions at which clients were able to set the agenda. These events ran across the US, Europe, Asia and Australia, and were complemented in the US by the extensive programme of Labs development and training sessions.
Feedback from clients on Knowledge. Shared has been extremely positive and it has also been pleasing to receive external validation with a number of high-profile industry awards. These included: a Content Marketing Strategy award from the Gramercy Institute; the Advisor Services and Advisor Special Communications large asset level awards at the Mutual Fund Education Alliance STAR Awards; Most Accessible Fund Managers at Citywire Selector’s Pan-European Awards; the Judges Award for Knowledge. Shared at Investment Week’s Investment Marketing and Innovation Awards; and winner of the ‘Best Digital Marketing’ and ‘Best International’ categories at the 2017 Financial Services Forum’s Awards for Marketing Effectiveness. |
Where next?
From a distribution perspective, this year has been about bringing together the various teams from our legacy businesses, improving systems and processes to enhance client experiences and exploring the opportunities presented by our wider investment management capabilities. The foundations for all of these are now in place and we look forward to our clients benefiting from the new structure in the years ahead.
With our own integration progressing well, it is important to maintain our focus on the wider industry. As explained in further detail on the right, currently we see four powerful themes likely to impact the landscape from a distribution standpoint.
With our enhanced global presence, we believe Janus Henderson is well placed for each theme and hope to be among the best at adapting and delivering client solutions. By combining a sharp focus on client needs, generating investment excellence and utilising our distribution strength we will continue to embrace rather than resist change as we seek to benefit our investors globally.
|
|
Four key themes impacting the Distribution landscape
|
|
| |||
|
A buyers’ market
Financial markets are becoming increasingly transparent, which we welcome, and regulators are applying additional requirements. Having the scale and experience to respond to these will be critical. Millennials are also likely to seek new ways to engage with traditional wealth management and it is important that we adapt to their shifting appetites.
Digital technologies
Technology giants are likely to enter our sector as gatekeepers and it will be important to work with them as a new breed of distributors. Digital also means client engagement has the potential to be taken to new levels through interaction and the use of big data.
Funding the future
Asset and wealth managers are likely to fill the funding gaps that have arisen since banks took a step back as capital providers following the 2008 financial crisis. Governments have also taken a step back and it is to companies such as Janus Henderson that individuals are turning.
Outcomes matter
Clients increasingly tell us that outcome-oriented solutions matter. In helping achieve these outcomes, be it by combining different asset classes, for example within fixed income or via multi-asset approaches, it is important to be able to harness a wide variety of capabilities. We also see increased interest in strategies that deliver certain outcomes by investing within an Environmental, Social and Governance (ESG) framework.
| |||
|
|
|
|
|
|
|
|
|
|
|
|
|
‘Best Digital Marketing Award’ and ‘Best International Award’ 2017 for Knowledge. Shared |
|


Janus Henderson Group plc Annual Report 2017
|
|
|
|
|
|
|
|
|
|
|
|
BUSINESS REVIEW
|
|
|
|
|
|
|
|
|
|
Client relationships |
|
|
|
|

Janus Henderson Group plc Annual Report 2017

|
|
|
|
|
|
|
|
|
|
|
|
GOVERNANCE
|
|
|
|
|
|
|
|
|
|
|
Board of Directors |
|
The Board comprises a Non-Executive Chairman, two Executive Directors and nine other Non-Executive Directors. | |||
|
|
|
|
|
|
|
|
|
|
|
|
|
|
|
|
|
|
|
|
|
|
|
|
|
|
|
|
|
|
|
|
|
| |
|
|
|
|
|
|
|
|
|
|
|
|
|
|
|
Richard Gillingwater
Chairman; Nominating & Corporate Governance Committee Chair
Richard Gillingwater has been a Non-Executive Director and Chairman of Janus Henderson since May 2017. He was a Non-Executive Director of the Henderson Group Board from February 2013 to May 2017, taking the position of Chairman in May 2013. He is currently the Chair of the Nominating and Governance Committee and a member of the Compensation Committee.
Mr Gillingwater started his career in investment banking in 1980 at Kleinwort Benson, where he spent ten years. After this he moved to BZW and, in due course, became joint Head of Corporate Finance. BZW was taken over by Credit Suisse First Boston and he ultimately became Chairman of European Investment Banking at Credit Suisse First Boston. In 2003, he was asked by the UK Government to found and become the Chief Executive and later, Chairman of the Shareholder Executive. In 2007, he became Dean of Cass Business School which role he held until 2012. In his Non-Executive career, Mr Gillingwater has been Chairman of CDC Group plc and has also been a Non-Executive Director of P&O, Debenhams, Tomkins, Qinetiq Group, Kidde, Hiscox Ltd and Wm Morrison Supermarkets plc. Mr Gillingwater is Chairman of SSE plc and Non-Executive Director of Helical plc. Mr Gillingwater holds an MA in Law, St Edmund Hall, Oxford University and a MBA from the International Institute for Management Development (IMD) in Lausanne. Mr Gillingwater is a qualified solicitor. |
|
Glenn Schafer
Deputy Chairman
Glenn Schafer has been a Non-Executive Director and Deputy Chairman of Janus Henderson since May 2017. He was a Director of Janus Capital Group from December 2007 to May 2017, taking the position of Chairman in April 2012. He is a member of the Compensation Committee and the Nominating and Governance Committee.
Mr Schafer serves as a Director of GeoOptics LLC, a weather satellite manufacturer. Mr Schafer served as a Director of the Michigan State University Foundation from 2004 to 2014. He was Vice Chairman of Pacific Life Insurance Company (Pacific Life) from April 2005 until his retirement in December 2005; a member of Pacific Life’s Board of Directors and President of Pacific Life from 1995 to 2005; and Executive Vice President and Chief Financial Officer of Pacific Life from 1991 to 1995. From 2006 to 2007, he served on the Board of Directors for Scottish Re Group. Between 2006 and 2017 Mr Schafer was a Director of Genesis Healthcare, Inc., the successor company resulting from the merger with Skilled Healthcare Group, Inc. of which Mr Schafer was a director. Mr Schafer also served as a Director of Mercury General Corporation, an insurance holding company, between 2015 up until his resignation in February 2018. Mr Schafer has a BS from Michigan State University and an MBA from the University of Detroit. |
|
Andrew Formica
Co-Chief Executive Officer and Executive Director
Andrew Formica is Co-Chief Executive Officer of Janus Henderson and has been an Executive Director since May 2017. Mr Formica was Chief Executive and an Executive Director of Henderson Group from November 2008 to May 2017.
Mr Formica has been with Henderson since 1998 and in the fund management industry since 1993. He has held various senior roles with Henderson and he has been a member of the executive committee since 2004. Prior to being appointed Chief Executive, he served as Joint Managing Director of the Listed Assets business (from September 2006) and as Head of Equities (from September 2004). In the early part of his career, he was an equity manager and analyst for Henderson. Mr Formica was a director of TIAA Henderson Real Estate Limited from April 2014 to July 2015. Mr Formica is the senior independent director of the board of The Investment Association and has served as a non-executive director of Hammerson plc since November 2015. Mr Formica received a B Econ and MA in Economics from Macquarie University and a MBA from London Business School. He is a Fellow of the Institute of Actuaries in both the UK and Australia. | |


Janus Henderson Group plc Annual Report 2017
|
|
|
|
|
|
|
|
|
|
|
|
|
|
|
|
|
|
|
|
| |
|
|
|
|
|
|
|
|
|
|
|
|
|
|
|
Dick Weil
Co-Chief Executive Officer and Executive Director
Dick Weil is Co-Chief Executive Officer of Janus Henderson and has been an Executive Director since May 2017. Mr Weil was Chief Executive Officer of Janus Capital Group from February 2010 to May 2017.
Mr Weil has 24 years of financial industry experience. Prior to joining Janus as Chief Executive Officer in 2010, Mr Weil spent 15 years with PIMCO where most recently he served as the global head of PIMCO Advisory, a member of PIMCO’s executive committee, and a member of the board of trustees of the PIMCO Funds. Previous to his appointment as global head of PIMCO Advisory, he served as chief operating officer of PIMCO, a position he held for ten years, in which time he successfully led the development of PIMCO’s global business and founded their German operations. Mr Weil also previously served as PIMCO Advisors LP’s general counsel. Prior to joining PIMCO in 1996, Mr Weil was with Bankers Trust Global Asset Management and Simpson Thacher & Bartlett LLP in New York. Mr Weil earned his bachelor of arts degree in economics from Duke University and his juris doctorate from the University of Chicago Law School. |
|
Sarah Arkle
Independent Non-Executive Director; Risk Committee Chair
Sarah Arkle has been a Non-Executive Director of Janus Henderson since May 2017. Ms Arkle was a Non-Executive Director of Henderson Group from September 2012 to May 2017 and is currently the Chair of the Risk Committee and member of the Audit Committee and Nominating and Governance Committee.
Ms Arkle has been in the financial industry for over 34 years. She joined Allied Dunbar Asset Management in 1983 which became Threadneedle in 1994. She was Vice Chairman of Threadneedle until the end of July 2012 and was Chief Investment Officer until December 2010, a role she held for ten years. Previously, Ms Arkle worked at the Far Eastern stockbroker WI Carr (Overseas) Limited and was an advisor to the South Yorkshire Pension Fund. Ms Arkle is currently a Non-Executive Director of Foreign & Colonial Investment Trust plc and Chair of J.P. Morgan Emerging Markets Investment Trust plc. Ms Arkle has also been a member of the Royal Commission of the Great Exhibition of 1851 Finance Committee since January 2017. Ms Arkle holds an MA in Management Studies from Cambridge University and is an associate of the Institute of Chartered Secretaries and Administrators. |
|
Kalpana Desai
Independent Non-Executive Director
Kalpana Desai has been a Non-Executive Director of Janus Henderson since May 2017. Ms Desai was a Non-Executive Director of Henderson Group from October 2015 to May 2017 and is currently a member of the Audit Committee and Nominating and Governance Committee.
Ms Desai has over 30 years of international advisory and investment banking experience, primarily gained in the Asia-Pacific region. Until 2013, Ms Desai was Head of Macquarie Capital Asia, the investment banking division of Macquarie Group Limited, headquartered in Australia. Prior to this, she was Head of the Asia-Pacific Mergers & Acquisitions Group and a Managing Director from 2001 in the investment banking division of Bank of America Merrill Lynch based in Hong Kong. Earlier, Ms Desai worked in the corporate finance divisions of Barclays de Zoete Wedd in London and Hong Kong and at J. Henry Schroder Wagg in London, having started her career in the financial services division of Coopers & Lybrand Consulting in London. She was a member of the Takeovers and Mergers Panel of the Securities and Futures Commission in Hong Kong from 2007 to 2014. She is currently a Non-Executive Director of Canaccord Genuity Group Inc., headquartered in Canada. Ms Desai has a BSc in Economics from the London School of Economics and Political Science and qualified as a Chartered Accountant with PricewaterhouseCoopers in London in 1991. | |


Janus Henderson Group plc Annual Report 2017
|
|
|
|
|
|
|
|
|
|
|
|
GOVERNANCE
|
|
|
|
|
|
|
|
|
|
|
Board of Directors continued |
|
| |||
|
|
|
|
|
|
|
|
|
|
|
|
|
|
|
|
|
|
|
|
|
|
|
|
|
|
|
|
|
|
|
|
|
|
|
|
|
|
|
|
| |
|
|
|
|
|
|
|
|
|
|
|
|
|
|
|
Jeffrey Diermeier
Independent Non-Executive Director; Audit Committee Chair
Jeffrey Diermeier has been a Non-Executive Director of Janus Henderson since May 2017. Mr Diermeier was an Independent Director of Janus Capital Group from March 2008 to May 2017 and is currently the Chair of the Board Audit Committee and member of the Nominating and Governance Committee and the Risk Committee.
Mr Diermeier is a Director of the University of Wisconsin Foundation, a non-profit fundraising and endowment management organisation, and former Chairman of its Investment Committee. In January 2011, Mr Diermeier became a Director of Adams Street Partners, a private equity firm located in Chicago. Between 2010 and 2017 he was a co-owner and Chairman of L.B. White Company, a heating equipment manufacturer. He is also a minority owner of Stairway Partners, LLC, a registered investment adviser located in Chicago, and was an advisory board member from 2005 to December 2012. He was a Trustee of the Board of the Financial Accounting Foundation, which oversees the Financial Accounting Standards Board and the Government Accounting Standards Board, from January 2009 to December 2015 and Chairman of the Trustees from November 2012 to December 2015. From 2005 until January 2009, he served as President and Chief Executive Officer of the CFA Institute, a non-profit educational organization for investment professionals in Charlottesville, Virginia, and previously in a number of capacities in the global asset management division of UBS and predecessor organisations, primarily Brinson Partners, Inc., beginning as an Equity Analyst and culminating as its Global Chief Investment Officer from 2000 to 2004. Mr Diermeier holds the Chartered Financial Analyst designation. |
|
Kevin Dolan
Independent Non-Executive Director
Kevin Dolan has been a Non-Executive Director of Janus Henderson since May 2017. Mr Dolan was a Non-Executive Director of Henderson Group from September 2011 to May 2017 and is currently a member of the Nominating and Governance Committee and Risk Committee.
Mr Dolan has been in the financial services industry for 36 years, many of them as head of significant investment management organisations and has extensive experience in M&A transactions, both in Europe and the US. He spent ten years with the AXA Group where he was Chief Executive Officer of AXA Investment Managers Paris, and Global Deputy Chief Executive Officer of AXA Investment Managers. Mr Dolan has held other executive positions, including as Chief Executive of the Asset Management Division of Bank of Ireland Group, Chief Executive of Edmond de Rothschild Asset Management and Chief Executive of their Private Equity arm, Edmond de Rothschild Capital Partners. He was Chief Executive of La Fayette Investment Management in London from 2006 to 2009 and was a Director of Meeschaert Gestion Privée in Paris until 2015. He is the founding partner of Anafin LLC, and a senior advisor to London based Private Equity firm One Peak Partners. Mr Dolan has a BS in Business Administration from Georgetown University. |
|
Eugene Flood Jr.
Independent Non-Executive Director
Eugene Flood Jr. has been a Non-Executive Director of Janus Henderson since May 2017. Mr Flood was a Non-Executive Director of Janus Capital Group from January 2014 to May 2017 and is currently a member of the Audit Committee, Nominating and Governance Committee and Risk Committee.
Currently, Mr Flood also serves as Chairman of the advisory board for the Institute for Global Health and Infectious Diseases at the University of North Carolina Chapel Hill; is a member of the Steering Board of the Eshelman Institute at the University of North Carolina Eshelman School of Pharmacy; is a Trustee of the Financial Accounting Foundation; and, has been a Director of the Research Corporation for Science Advancement since 2015. Previously, Mr Flood served as a Director of The Foundation for the Carolinas from 2012 to 2015. He was Executive Vice President of TIAA-CREF from 2011 until his retirement in 2012, serving on the CREF Board of Trustees and the TIAA-CREF Mutual Fund Board of Trustees for seven years, and chairing the Investment Committee. Prior to joining TIAA-CREF as an executive in 2011, Mr Flood spent 12 years with Smith Breeden Associates, a North Carolina-based fixed income asset manager, as President and Chief Executive Officer. Mr Flood also served with Morgan Stanley in a range of trading and investment positions from 1987 to 1999 and was an Assistant Professor of Finance at Stanford Business School from 1982 to 1987. Mr Flood earned a Bachelor of Arts degree in economics from Harvard University and a PhD in economics from the Massachusetts Institute of Technology. | |


Janus Henderson Group plc Annual Report 2017
|
|
|
|
|
|
|
|
|
|
|
|
|
|
|
|
|
|
|
|
| |
|
|
|
|
|
|
|
|
|
|
|
|
|
|
|
Lawrence Kochard
Independent Non-Executive Director; Compensation Committee Chair
Lawrence Kochard has been a Non-Executive Director of Janus Henderson since May 2017. Mr Kochard was an Independent Director of Janus Capital Group from March 2008 to May 2017 and is currently the Chair of the Compensation Committee and a member of the Nominating and Governance Committee.
Mr Kochard is Chief Investment Officer at Makena Capital Management. Until January 2018, he was the Chief Executive Officer and Chief Investment Officer of the University of Virginia Investment Management Company. Mr Kochard has served as a Director of the Virginia Commonwealth University Investment Management Company since 2015, as a Director and the Chair of the Investment Committee for the Virginia Environmental Endowment since 2013 and a Member of the Investment Advisory Committee of the Virginia Retirement System since March 2011, serving as Chair since 2017. He previously served as the Chairman of the College of William & Mary Investment Committee from 2005 to October 2011. From 2004 to 2010, he was the Chief Investment Officer for Georgetown University, and from 2001 to 2004 was Managing Director of Equity and Hedge Fund Investments for the Virginia Retirement System. Mr Kochard worked as an Assistant Professor of Finance at the McIntire School of Commerce at the University of Virginia from 1999 to 2001. He started his career in financial analysis and planning, corporate finance and capital markets for E.I. DuPont de Nemours and Company, Fannie Mae and The Goldman Sachs Group, Inc. Mr Kochard holds the Chartered Financial Analyst designation and a Ph.D. in economics from the University of Virginia. |
|
Angela Seymour-Jackson
Independent Non-Executive Director
Angela Seymour-Jackson has been a Non-Executive Director of Janus Henderson since May 2017. Ms Seymour-Jackson was a Non-Executive Director of Henderson Group from January 2014 to May 2017 and is currently a member of the Compensation Committee and the Nominating and Governance Committee. She also chairs Henderson Global Holdings Asset Management Limited (a holding company of the legacy-Henderson Group).
Ms Seymour-Jackson has over 20 years’ experience in retail financial services. She has held various senior marketing and distribution roles in Norwich Union Insurance, General Accident Insurance, CGU plc and Aviva. She was Chief Executive Officer of RAC Motoring Services Limited from 2010 until 2012. She joined Aegon UK in May 2012 and was appointed Managing Director of the Workplace Solutions Division in December 2012. Ms Seymour-Jackson was a Senior Advisor to Lloyds Banking Group (insurance) until October 2017. She is a Non-Executive Director of Rentokil Initial plc, Page Group plc and esure Group plc and is also Deputy Chair and Senior Independent Director at Gocompare.com Group plc. Ms Seymour-Jackson has a BA (Hons) in French and European Studies from the University of East Anglia, a diploma from the Chartered Institute of Marketing and an MSc in Marketing. |
|
Tatsusaburo Yamamoto
Independent Non-Executive Director
Tatsusaburo Yamamoto has been a Non-Executive Director of Janus Henderson since May 2017. Mr Yamamoto was an Independent Director of Janus Capital Group from July 2015 to May 2017 and is currently a member of the Nominating and Governance Committee.
Mr Yamamoto is currently Managing Executive Officer, Corporate Planning Unit, of The Dai-ichi Life Holdings, Inc. (Dai-ichi Life) and has worked in many different capacities for Dai-ichi Life over his 29-year career with the firm. Prior to his current role, Mr Yamamoto served as Executive Officer at Asset Management Business Unit of Dai-ichi Life and Investment Planning Department of Dai-ichi Life Insurance Company, Limited. Mr Yamamoto was appointed to the Janus Capital Group Board after being designated by Dai-ichi Life as its representative for appointment to the Board. This right was granted to Dai-ichi Life as a result of the Investment and Strategic Co-operation Agreement (the “Agreement”) between Dai-ichi Life and Janus Capital Group. In connection with the Agreement, Mr Yamamoto works with Janus Henderson’s senior management to further the goals of the strategic alliance between the two firms and to enhance product distribution opportunities. Mr Yamamoto has a Bachelor of Arts in Economics from WASEDA University. | |


Janus Henderson Group plc Annual Report 2017
|
|
|
|
|
|
|
|
|
|
|
|
GOVERNANCE
|
|
|
|
|
|
|
|
|
|
|
Governance overview |
|
An overview of governance structure, Board business and skills. | |||
|
|
|
|
|
|
|
|
|
|
|
|
|
|
|
|
|
|
|
|
|
|
|
|
|
|
|
|
|
|
|
|
|
|
|
|
|
|
|
|
|
|
|
Janus Henderson views good corporate governance as essential to achieving the goals of the organisation. The Janus Henderson Group Board comprises a Non-Executive Chairman, a Non-Executive Deputy Chairman, two Executive Directors and eight other Non-Executive Directors who meet in London and Denver. The Board has delegated specific responsibilities to four standing Committees of the Board. A copy of the matters reserved to the Board is available on our website at janushenderson.com/ir.
Board business
The Board met throughout the course of the second half of 2017 after its first formal meeting in July. An overview of the topics addressed by the Board since its formation is provided in the summary overleaf.
A typical Board agenda is ordered so that the strategic items and projects are considered first. Depending on the importance of the items, either regulatory or finance, capital and budget items are considered next, followed by other business matters. The items that do not require detailed consideration or discussion are set out at the end of the agenda. Where possible, items |
|
are grouped together to ensure that the items flow according to topic and that management’s time is used effectively when presenting. Sessions are usually provided which include training or presentations from the business during days on which Board meetings are held.
Committees
Janus Henderson has four standing committees of the Group Board: Audit, Compensation, Nominating and Corporate Governance, and Risk.
Audit
The Audit Committee is responsible for monitoring the reliability and appropriateness of the Group’s financial reporting, reviewing the qualifications, performance and independence of the independent auditors (as well as being responsible for recommending their appointment, reappointment and removal), assessing the effectiveness of the Internal Audit function, and reviewing the Group’s compliance with legal and regulatory requirements. Ultimate responsibility for reviewing and approving the Group’s financial reporting and other public reports, declarations and statements remains with the Board. The Committee is chaired by Jeffrey Diermeier. |
|
Compensation
The Compensation Committee is responsible for determining the remuneration of the Co-CEOs, certain other executive officers, and the Group’s independent directors. The Committee is chaired by Lawrence Kochard.
Nominating and Corporate Governance
The Nominating and Corporate Governance Committee has responsibility for considering the size, composition, expertise and balance of the Board as well as succession planning. The Committee is also responsible for recommending the applicable Corporate Governance Guidelines to the Board and oversees the Board’s annual evaluation. The Committee is chaired by Richard Gillingwater.
Risk
The purpose of the Risk Committee is to assist the Board in the oversight of risk. The Committee also looks to identify any forward-looking and emerging risks that relate to the industry or Janus Henderson specifically, and will refresh and monitor these risks and look at mitigating actions on an ongoing basis. The Committee is chaired by Sarah Arkle. | |
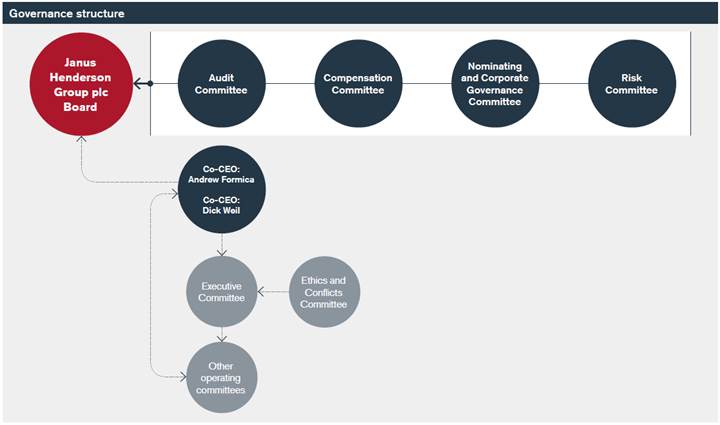
Janus Henderson Group plc Annual Report 2017
|
|
|
|
|
|
|
|
|
|
|
|
|
|
|
2017 Director attendance at Board and Committee meetings
Five meetings were held by the Janus Henderson Group plc Board during 2017, on: 25 July, 7 August, 24 October, 8 November, and 12 December.
|
Board and Committee meetings attended |
|
|
|
|
|
|
|
|
|
Board and Committee meetings attended | ||||
|
|
|
|
|
|
Nominating |
|
|
|
Date |
|
|
|
and |
|
|
|
appointed
|
Board |
Audit |
Compensation |
Governance |
Risk |
|
Richard Gillingwater |
30 May ’17 |
5/5 |
n/a |
4/4 |
2/2 |
n/a |
|
Glenn Schafer |
30 May ’17 |
5/5 |
3/4 |
4/4 |
2/2 |
n/a |
|
Andrew Formica |
30 May ’17 |
5/5 |
n/a |
n/a |
n/a |
n/a |
|
Dick Weil |
30 May ’17 |
5/5 |
n/a |
n/a |
n/a |
n/a |
|
Sarah Arkle |
30 May ’17 |
5/5 |
4/4 |
n/a |
2/2 |
2/2 |
|
Kalpana Desai |
30 May ’17 |
5/5 |
4/4 |
n/a |
2/2 |
n/a |
|
Jeffrey Diermeier |
30 May ’17 |
5/5 |
4/4 |
n/a |
2/2 |
2/2 |
|
Kevin Dolan |
30 May ’17 |
5/5 |
n/a |
n/a |
2/2 |
2/2 |
|
Eugene Flood Jr. |
30 May ’17 |
5/5 |
1/4 |
n/a |
2/2 |
2/2 |
|
Lawrence Kochard |
30 May ’17 |
5/5 |
n/a |
4/4 |
2/2 |
n/a |
|
Angela Seymour-Jackson |
30 May ’17 |
5/5 |
n/a |
4/4 |
2/2 |
n/a |
|
Tatsusaburo Yamamoto1 |
30 May ’17 |
4/5 |
n/a |
n/a |
1/2 |
n/a |
Notes
§ All Directors attended 100% of Board and Committee meetings of which they were members, with the exception of Tatsusaburo Yamamoto who was not present at one Board and one Nomination and Corporate Governance Committee meeting.
§ Glenn Shafer stepped down from the Audit Committee on 8 November 2017; Eugene Flood Jr. was appointed to the Audit Committee on 8 November 2017.
1. As Dai-ichi prepared to issue their 10b5-1 stock purchase programme authority of Janus Henderson shares, Mr Yamamoto did not attend one Board and one Nomination and Corporate Governance Committee meeting in order to comply with regulatory procedures.
|
An overview of the topics addressed by the Board in 2017 |
| |
|
July § Janus Henderson’s strategy § Update on integration (including an update on BNP outsourcing) § Capital management and dividend policy § Update on regulatory matters § Update on Brexit |
August § Second quarter results § Capital position and dividend for 2Q17 |
October § 3Q17 financial update § Update on integration § Janus Henderson’s strategy § Modern Slavery policy § BNP outsourcing § Update on regulatory matters § Update on Brexit |
|
November |
December |
|
|
§ Third quarter results |
§ 2018 Budget |
|
|
§ Capital position and dividend for 3Q17 |
§ Janus Henderson’s strategy |
|
|
|
§ US tax reform
|
|
Janus Henderson Group plc Annual Report 2017
|
|
|
|
|
|
|
|
|
|
|
|
GOVERNANCE
|
|
|
|
|
|
|
|
|
|
|
Governance overview continued |
|
| |||
|
|
|
|
|
|
|
|
|
|
|
|
|
|
|
|
|
|
|
|
|
|
|
|
|
|
|
|
|
|
|
|
|
|
|
|
Training
To ensure that the Directors continually update their skills and knowledge, all Directors receive regular presentations on different aspects of the Group’s business and on financial, legal and regulatory matters affecting our sector. During 2017 all former-Janus and former-Henderson Directors received training upon being appointed to the Janus Henderson Group Board and they independently met with senior people within the business.
The Board also received presentations on: US Regulation and Australian Stock Exchange (ASX) disclosure and Corporate Governance; Brexit; key regulatory risks and issues for Janus Henderson; key compliance policies for Janus Henderson; the Markets in Financial Instruments Directive II (MiFID II); General Data Protection Regulation; Senior Managers & Certification Regime; and Executive compensation disclosures required by the US Securities and Exchange Commission (SEC). |
|
Relations with shareholders
Janus Henderson conducts an active Investor Relations programme, engaging with shareholders across the Group’s two listings.
In 2017, Management and IR conducted over 230 individual meetings with existing and potential shareholders in London, Sydney, Melbourne, New York, Boston and Denver. This included three roadshows to Australia and two to the US to engage with shareholders following results announcements and in advance of, and following, the merger of Janus Capital and Henderson Group. The Chairman also met with shareholders in London.
The Board regularly receives feedback on shareholder sentiment and sell-side analysts’ view of the Group and the wider industry. Board members welcome the opportunity to learn more about shareholders’ interests in Janus Henderson. Equally, Management receive weekly updates on shareholder engagement, topics raised and key discussion points.
In the course of a year, Janus Henderson gives four scheduled updates to the market in addition to our Annual General Meeting. The Investor Relations team and Management have frequent contact with the 16 sell-side analysts who follow Janus Henderson. |
|
| |

|
Board skills |
|
|
|
|
|
|
|
|
|
|
|
|
|
|
|
|
Asset |
|
|
|
|
|
|
|
Management
|
International |
Finance |
Risk |
Client Focus |
Acquisitions |
|
Richard Gillingwater |
P |
PP |
PP |
P |
PP |
PP |
|
Glenn Schafer |
PP |
P |
PP |
PP |
P |
PP |
|
Andrew Formica |
PP |
PP |
P |
P |
PP |
PP |
|
Dick Weil |
PP |
PP |
P |
P |
PP |
PP |
|
Sarah Arkle |
PP |
P |
P |
PP |
PP |
P |
|
Kalpana Desai |
P |
PP |
PP |
P |
P |
PP |
|
Jeffrey Diermeier |
PP |
P |
PP |
PP |
P |
P |
|
Kevin Dolan |
PP |
PP |
P |
P |
P |
PP |
|
Eugene Flood Jr. |
PP |
P |
PP |
PP |
P |
P |
|
Lawrence Kochard |
PP |
P |
PP |
PP |
P |
P |
|
Angela Seymour-Jackson |
P |
P |
P |
PP |
PP |
PP |
|
Tatsusaburo Yamamoto |
PP |
PP |
P |
P |
P |
PP |
Janus Henderson Group plc Annual Report 2017
|
|
|
|
|
|
|
|
|
|
|
|
|
|
|
|
|
|
|
|
|
|
Directors’ Report
Further disclosures, where applicable to the Company, are contained in the sections of this Annual Report and Accounts identified below and form part of the Directors’ report for the period:
§ Pages 31 to 56, Item 7 on Form 10-K – Management’s Discussion and Analysis
§ Pages 125 to 135, Item 10 on Form 10-K – Directors, Executive Officers and Corporate Governance
§ Pages 135 to 159, Item 11 on Form 10-K – Executive Compensation
ASX Corporate Governance Principles and Recommendations
Details of Janus Henderson’s compliance with the ASX Corporate Governance Principles and Recommendations during the reporting period are available on the Company’s website at janushenderson.com/ir.
Diversity
Janus Henderson fosters and maintains an environment that values the unique talents and contributions of every individual. We know that having a diverse and inclusive workplace will support our strategic vision.
We invite you to review our Commitment to Diversity and recent initiatives on our website at janushenderson.com/diversity. |
|
Financial reporting
The Directors are required to prepare and approve the financial statements for the Group and Company in accordance with Jersey law for each financial year which show a true and fair view of the state of affairs of the Group and the Company and of the profit or loss of the Group for that period in accordance with generally accepted accounting principles. The Directors have elected to prepare the Group and Company financial statements in accordance with US generally accepted accounting principles (US GAAP).
The Directors confirm that to the best of their knowledge:
§ the financial records of the Group and Company have been properly maintained
§ the financial statements of the Group and Company comply with US GAAP and give a true and fair view of the financial position and performance of the Group and Company, and
§ this opinion has been formed on the basis of a sound system of risk management and internal control which is operating effectively.
Supplementary note to Item 11 on SEC Form 10-K
The “Total compensation table” on page 137 of the Company’s Annual Report on SEC Form 10-K is revised as follows:
§ by replacing the figure of $484,910 shown in the “Other” column for Richard M. Weil with $610,952, and
§ by replacing footnote (7) to the table with the following text:
“Amounts shown in ‘Other’ include dividends on ESOP and unvested shares. Mr. Weil’s amount includes $172,240 in such dividends, $312,670 in relocation benefits and $126,042 in housing benefits per Company policy as a result of his 2017 move to the UK from the US.” |
|
Signed in accordance with a resolution of the Directors:
Andrew Formica Co-Chief Executive Officer 27 February 2018
Richard Weil Co-Chief Executive Officer 27 February 2018
Roger Thompson Chief Financial Officer 27 February 2018
|

Janus Henderson Group plc Annual Report 2017

UNITED STATES
SECURITIES AND EXCHANGE COMMISSION
WASHINGTON, D.C. 20549
FORM 10-K
x ANNUAL REPORT PURSUANT TO SECTION 13 OR 15(d) OF THE SECURITIES EXCHANGE ACT OF 1934
For the fiscal year ended December 31, 2017
OR
o TRANSITION REPORT PURSUANT TO SECTION 13 OR 15(d) OF THE SECURITIES EXCHANGE ACT OF 1934
For the transition period from to
Commission File Number 001-38103
![]()
Janus Henderson Group plc
(Exact name of registrant as specified in its charter)
|
Jersey, Channel Islands |
|
98-1376360 |
|
(State or other jurisdiction of |
|
(I.R.S. Employer Identification No.) |
|
incorporation or organization) |
|
|
|
201 Bishopsgate EC2M 3AE |
|
N/A |
|
United Kingdom |
|
(Zip Code) |
|
(Address of principal executive offices) |
|
|
+44 (0) 20 7818 1818
(Registrant’s telephone number, including area code)
Securities registered pursuant to Section 12(b) of the Act:
|
Title of Each Class
|
|
Name of Each Exchange on Which Registered
|
|
Common Stock, $1.50 Per Share Par Value |
|
New York Stock Exchange |
Securities registered pursuant to Section 12(g) of the Act:
None
Indicate by check mark if the registrant is a well-known seasoned issuer, as defined in Rule 405 of the Securities Act. Yes £ No S
Indicate by check mark if the registrant is not required to file reports pursuant to Section 13 or Section 15(d) of the Act. Yes £ No S
Indicate by check mark whether the registrant: (1) has filed all reports required to be filed by Section 13 or 15(d) of the Securities Exchange Act of 1934 during the preceding 12 months (or for such shorter period that the Company was required to file such reports), and (2) has been subject to the filing requirements for the past 90 days. Yes x No o
Indicate by check mark whether the registrant has submitted electronically and posted on its corporate Web site, if any, every Interactive Data File required to be submitted and posted pursuant to Rule 405 of Regulation S-T (§232.405 of this chapter) during the preceding 12 months (or for such shorter period that the registrant was required to submit and post such files). Yes x No o
Indicate by check mark if disclosure of delinquent filers pursuant to Item 405 of Regulation S-K (§229.405 of this chapter) is not contained herein, and will not be contained, to the best of registrant’s knowledge, in definitive proxy or information statements incorporated by reference in Part III of this Form 10-K or any amendment to this Form 10-K. o (Not applicable. See Item 1 Business.)
Indicate by check mark whether the registrant is a large accelerated filer, an accelerated filer, a non-accelerated filer, smaller reporting company, or an emerging growth company. See the definitions of ‘‘large accelerated filer,’’ ‘‘accelerated filer,’’ ‘‘ smaller reporting company,’’ and ‘‘emerging growth company’’ in Rule 12b-2 of the Exchange Act. (Check one):
|
Large accelerated filer o |
Accelerated filer o |
Non-accelerated filer x |
Smaller reporting company o |
|
|
|
(Do not check if a smaller |
Emerging growth company o |
|
|
|
reporting company) |
|
If an emerging growth company, indicate by check mark if the registrant has elected not to use the extended transition period for complying with any new or revised financial accounting standards provided pursuant to Section 13(a) of the Exchange Act. £
Indicate by check mark whether the registrant is a shell company (as defined in Rule 12b-2 of the Exchange Act). Yes £ No S
As of June 30, 2017, the aggregate market value of common equity held by non-affiliates was $6,635,447,229.18. As of February 22, 2018, there were 200,406,138 shares of the Company’s common stock, $1.50 par value per share, issued and outstanding.
DOCUMENTS INCORPORATED BY REFERENCE
None
JANUS HENDERSON GROUP PLC
2017 FORM 10-K ANNUAL REPORT
TABLE OF CONTENTS
|
|
|
Page |
|
|
|
|
|
|
PART I |
|
|
Item 1. |
Business |
2 |
|
Item 1A. |
Risk Factors |
11 |
|
Item 1B. |
Unresolved Staff Comments |
26 |
|
Item 2. |
Properties |
26 |
|
Item 3. |
Legal Proceedings |
26 |
|
Item 4. |
Mine Safety Disclosures |
26 |
|
|
|
|
|
|
PART II |
|
|
Item 5. |
Market for Registrant’s Common Equity, Related Stockholder Matters and Issuer Purchases of Equity Securities |
27 |
|
Item 6. |
Selected Financial Data |
29 |
|
Item 7. |
Management’s Discussion and Analysis of Financial Condition and Results of Operations of Janus Henderson Group plc |
31 |
|
Item 7A. |
Quantitative and Qualitative Disclosures about Market Risk |
56 |
|
Item 8. |
Financial Statements and Supplementary Data |
59 |
|
Item 9. |
Changes in and Disagreements with Accountants on Accounting and Financial Disclosure |
125 |
|
Item 9A. |
Controls and Procedures |
125 |
|
Item 9B. |
Other Information |
125 |
|
|
|
|
|
|
PART III |
|
|
Item 10. |
Directors, Executive Officers and Corporate Governance |
125 |
|
Item 11. |
Executive Compensation |
135 |
|
Item 12. |
Security Ownership of Certain Beneficial Owners and Management and Related Stockholder Matters |
150 |
|
Item 13. |
Certain Relationships and Related Transactions, and Director Independence |
155 |
|
Item 14. |
Principal Accountant Fees and Services |
159 |
|
|
|
|
|
|
PART IV |
|
|
Item 15. |
Exhibits and Financial Statement Schedules |
160 |
|
Item 16. |
Form 10-K Summary |
167 |
|
|
Signatures |
168 |
PART I
FORWARD-LOOKING STATEMENTS
Certain statements in this Annual Report on Form 10-K contain “forward-looking statements” within the meaning of the federal securities laws, including the Private Securities Litigation Reform Act of 1995, as amended, Section 21E of the Securities Exchange Act of 1934 (“Exchange Act”), as amended, and Section 27A of the Securities Act of 1933, as amended (“Securities Act”). Such forward-looking statements involve known and unknown risks, uncertainties, assumptions and other factors which may cause the actual results, performance or achievements of Janus Henderson Group plc (the “Company”) and its consolidated subsidiaries (collectively, the “Group” or “JHG”) to be materially different from any future results, performance or achievements expressed or implied by such forward-looking statements and future results could differ materially from historical performance. Statements preceded by, followed by or that otherwise include the words “believes”, “expects”, “anticipates”, “intends”, “projects”, “estimates”, “plans”, “may increase”, “may fluctuate”, “forecast”, “seeks”, “targets”, “outlook” and similar words and expressions and future or conditional verbs such as “will”, “should”, “would”, “may”, “could” and variations or negatives of these words, are generally forward-looking in nature and not historical facts. Any statements that refer to expectations or other characterizations of future events, circumstances or results are forward-looking statements. These statements are based on the beliefs and assumptions of Company management based on information currently available to management.
Various risks, uncertainties, assumptions and factors that could cause future results to differ materially from those expressed by the forward-looking statements included in this Annual Report on Form 10-K include, but are not limited to, risks, uncertainties, assumptions and factors specified in the Company’s prospectus dated March 21, 2017, as filed with the Securities and Exchange Commission (“SEC”) pursuant to Rule 424(b) under the Securities Act of 1933, as amended (File No. 333-216824) (the “Prospectus”) and this Annual Report on Form 10-K included under headings such as “Risk Factors”, “Management’s Discussion and Analysis of Financial Condition and Results of Operations of Janus Henderson Group plc”, and “Quantitative and Qualitative Disclosures about Market Risk”, and in other filings and furnishings made by the Company with the SEC from time to time. In light of these risks, uncertainties, assumptions and factors, the forward-looking events discussed in this Annual Report on Form 10-K may not occur. In particular, any discussion of potential merger synergies is forward looking and uncertain. Forward-looking statements by their nature address matters that are, to different degrees, subject to numerous assumptions and known and unknown risks and uncertainties, which change over time and are beyond the control of the Company and its management. You are cautioned not to place undue reliance on these forward-looking statements, which speak only as of the date stated, or if no date is stated, as of the date of this Annual Report on Form 10-K. The Company does not assume any duty and does not undertake to update forward-looking statements, to report events or to report the occurrence of unanticipated events, whether as a result of new information, future developments or otherwise, should circumstances change, nor does the Company intend to do so, except as otherwise required by securities and other applicable laws and regulations.
ITEM 1. BUSINESS
Janus Henderson Group plc (“JHG” or “the Group”), a company incorporated and registered in Jersey, Channel Islands, is an independent global asset manager, specializing in active investment across all major asset classes.
On May 30, 2017 (the “Closing Date”), JHG (previously Henderson Group plc (“Henderson”)) completed a merger of equals with Janus Capital Group Inc. (“JCG”) (the “Merger”). As a result of the Merger, JCG and its consolidated subsidiaries became subsidiaries of JHG.
JHG is a client-focused global business with over 2,300 employees worldwide, and assets under management (“AUM”) of $370.8 billion as of December 31, 2017. JHG has operations in North America, the United Kingdom (“UK”), Continental Europe, Latin America, Asia and Australia. JHG focuses on active fund management by investment managers with unique individual perspectives, who are free to implement their own investment views, within a strong risk management framework.
JHG manages a broad range of actively managed investment products for institutional and retail investors across five capabilities: Equities, Quantitative Equities, Fixed Income, Multi-Asset and Alternatives.
Clients entrust money to JHG — either their own or money they manage for their clients — and expect the Group to deliver the benefits specified in their mandate or by the prospectus for the fund in which they invest. JHG measures the amount of these funds as AUM. Growth in AUM is a key objective of the Group. AUM increases or decreases primarily depending on its ability to attract and retain client investments, and on investment performance, market and currency movements. To the extent that the Group invests in new asset management teams or businesses or divests from existing ones, this is also reflected in AUM.
Clients pay a management fee, which is usually calculated by reference to a percentage of AUM. Certain investment products are also subject to performance fees, which vary based on a product’s relative performance as compared to a benchmark index and the level of assets subject to such fees. As of December 31, 2017, performance fees were generated from a diverse group of funds and accounts. Management and performance fees are the primary drivers of the Group’s revenue. JHG believes that the more diverse the range of investment strategies from which management and performance fees are derived, the more successful its business model will be.
Investment Offerings
Equities
The Group offers a wide range of equity strategies encompassing different geographic focuses and investment styles. The equity teams include those with a global perspective, those with a regional focus — U.S., Europe, Asia and Australia — and those invested in specialist sectors. These teams generally apply processes based on fundamental research and bottom-up stock picking.
Quantitative Equities
The Intech Investment Management LLC (“Intech”) business applies advanced mathematics and systematic portfolio rebalancing intended to harness the volatility of movements in stock prices — a reliable source of excess returns and risk control. With more than 30 years of volatility expertise, the Intech team employs a distinctive quantitative approach based on observations of actual price movements, not on subjective forecasts of companies’ future performance.
Fixed Income
JHG’s Fixed Income teams provide coverage across the asset class, applying a wide range of innovative and differentiated techniques. These teams include those adopting global unconstrained approaches through to those with more focused mandates — based in the United States (“U.S.”), Europe, Asia and Australia. The capabilities of these teams can be accessed through individual strategies and are combined where appropriate to form multi-strategy offerings.
Multi-Asset
JHG Multi-Asset includes teams in the U.S. and UK. In the U.S., the team manages Global Asset Allocation strategies. In the UK, JHG has asset allocation specialists, traditional multi-manager investors and those focused on alternative asset classes.
Alternatives
JHG Alternatives includes teams with different areas of focus and approach. Diversified Alternatives brings together a cross-asset class combination of alpha generation, risk management and efficient beta replication strategies. These include Multi-Strategy, Liquid Alternatives, Agriculture and Global Commodities/Managed Futures, while other strategies focus on Absolute Return, Volatility and Tail Risk. Additionally, the management of the Group’s direct UK commercial property offering is sub advised to TH Real Estate.
Distribution
Distribution Channels
JHG distributes its products through three channels: intermediary, institutional and self-directed. Each channel is discussed below.
Intermediary Channel
The intermediary channel distributes mutual funds and exchange-traded funds (“ETFs”) through financial intermediaries including banks, broker-dealers, financial advisors, UK Open Ended Investment Companies (“OEICs”), Société d’Investissement À Capital Variable (“SICAV”), fund platforms and discretionary wealth managers. Significant investments have been made to grow the Company’s presence in the financial advisor subchannel, including increasing the number of external and internal wholesalers, enhancing the Company’s technology platform and recruiting highly seasoned client relationship managers. At December 31, 2017, assets in the intermediary channel totaled $164.1 billion, or 44% of total Group assets.
Institutional Channel
The institutional channel serves corporations, endowments, pension funds, foundations, Taft-Hartley funds, public fund clients and sovereign entities, with distribution direct to the plan sponsor and through consultants. At December 31, 2017, assets in the institutional channel totaled $144.7 billion, or 39% of total Group assets.
Self-Directed Channel
The self-directed channel serves existing individual investors who invest in JHG products through a mutual fund supermarket or directly with JHG. Exchange-traded notes (“ETNs”) associated with VelocityShares are also part of the self-directed channel. At December 31, 2017, assets in the self-directed channel totaled $62.0 billion, or 17% of total Group assets.
While JHG seeks to leverage its global model where possible, it also recognizes the importance of tailoring its services to the needs of clients in different regions. For this reason, JHG maintains a local presence in most of the markets in which it operates and provides investment material that takes into account local customs, preferences and language needs. JHG has a global distribution team of over 600 client-facing staff.
JHG’s brand centers on the proposition of Knowledge. Shared, which leverages the Group’s deep pool of intellectual capital to deliver investment thought leadership and transparency to clients, thereby building and strengthening trusted relationships.
Products and Services
The Group’s global product team maintains oversight of a broad range of products, including locally domiciled pooled funds in the U.S., the UK, Luxembourg, Japan, Singapore and Australia, hedge funds, segregated mandates and closed-ended vehicles. The team provides governance for all funds and strategies, and gauges the suitability of new offerings as well as ensuring that existing products remain suited to the clients to which they are marketed.
Intellectual Property
JHG has used, registered, and/or applied to register certain trademarks, service marks and trade names to distinguish the Group’s sponsored investment products and services from those of its competitors in the jurisdictions in which it operates, including the U.S., the UK, the European Union (“EU”), Australia, China, Japan and Singapore. These trademarks, service marks and trade names are important to JHG and, accordingly, the company enforces its trademark, service mark and trade name rights. The Group’s brand has been, and continues to be, extremely well received both in the asset management industry and with clients.
Seasonality
JHG’s revenue streams are not seasonal in nature, with management fees and other income generally accruing evenly through the year. Performance fees are recognized when the prescribed performance hurdles have been achieved and it is probable that the fee will be earned as a result. The hurdles coincide with the underlying fund year ends. Given the uncertain nature of performance fees, they tend to fluctuate from period to period. Finance income includes interest received and investment income. While interest received accrues over the year, investment income, which includes movements in seed capital investments, can fluctuate period to period. This fluctuation depends upon how that particular investment performs each month.
Competition
The investment management industry is relatively mature and saturated with competitors that provide services similar to JHG. As such, JHG encounters significant competition in all areas of its business. JHG competes with other investment managers, mutual fund advisers, brokerage and investment banking firms, insurance companies, hedge funds, venture capitalists, banks and other financial institutions, many of which are larger, have proprietary access to certain distribution channels, have a broader range of product choices and investment capabilities, and have greater capital resources. Additionally, the marketplace for investment products is rapidly changing, investors are becoming more sophisticated, the demand for and access to investment advice and information is becoming more widespread, passive investment strategies are becoming more prevalent, and more investors are demanding investment vehicles that are customized to their individual requirements.
JHG believes its ability to successfully compete in the investment management industry significantly depends upon its ability to achieve consistently strong investment performance, provide exceptional client service and strategic partnerships, and develop and innovate products that will best serve its clients.
Regulation
The investment management industry is subject to extensive federal, state and international laws and regulations intended to benefit and protect the shareholders of investment products such as those managed by JHG and advisory clients of JHG. The costs of complying with such laws and regulations have significantly increased and may continue to contribute significantly to the costs of doing business as a global investment adviser. These laws and regulations generally grant supervisory agencies broad administrative powers, including the power to limit or restrict the conduct of businesses and to impose sanctions for failure to comply with laws and regulations. Possible consequences for failure to comply include, but are not limited to, voiding of investment advisory and subadvisory agreements, the suspension of individual employees (particularly investment management and sales personnel), limitations on engaging in certain lines of business for specified periods of time, revocation of registrations, disgorgement of profits, and imposition of censures and fines. Further, failure to comply with such laws and regulations may provide the basis for civil litigation that may also result in significant costs and reputational harm to JHG.
U.S. Regulation
Certain of JHG’s U.S. subsidiaries are subject to laws and regulations from a number of government agencies and regulatory bodies, including, but not limited to, the SEC, the U.S. Department of Labor (“DOL”), the Financial Industry Regulatory Authority (“FINRA”) and the U.S. Commodity Futures Trading Commission (“CFTC”).
Investment Advisers Act of 1940
Certain subsidiaries of JHG are registered investment advisers under the Investment Advisers Act of 1940, as amended (the “Investment Advisers Act”) and, as such, are regulated by the SEC. The Investment Advisers Act requires registered investment advisers to comply with numerous and pervasive obligations, including, among others, recordkeeping requirements, operational procedures, registration and reporting requirements, and disclosure obligations. Certain subsidiaries of JHG are also registered with regulatory authorities in various countries and states, and thus are subject to the oversight and regulation by such countries’ and states’ regulatory agencies.
Investment Company Act of 1940
Certain of JHG’s subsidiaries act as the adviser or subadviser to mutual funds and ETFs, which are registered with the SEC pursuant to the Investment Company Act of 1940, as amended (the “1940 Act”). Certain of JHG’s subsidiaries also serve as adviser or subadviser to investment products that are not required to be registered under the 1940 Act. As an adviser or subadviser to a registered investment company, these subsidiaries must comply with the requirements of the 1940 Act and related regulations, including, among others, requirements relating to operations, fees charged, sales, accounting, recordkeeping, disclosure and governance. In addition, the adviser or subadviser to a registered investment company generally has obligations with respect to the qualification of the registered investment company under the Internal Revenue Code of 1986, as amended (the “Code”).
Broker-Dealer Regulations
JHG’s limited purpose broker-dealer subsidiary, Janus Distributors LLC (“JD”), is registered with the SEC under the Exchange Act and is a member of FINRA, the securities industry’s domestic self-regulatory organization. JD is the general distributor and agent for the sale and distribution of shares of domestic mutual funds that are directly advised or serviced by certain of JHG’s subsidiaries, as well as the distribution of certain commingled funds and exchange-traded products
(“ETPs”). The SEC imposes various requirements on JD’s operations, including disclosure, recordkeeping and accounting. FINRA has established conduct rules for all securities transactions among broker-dealers and private investors, trading rules for the over-the-counter markets and operational rules for its member firms. The SEC and FINRA also impose net capital requirements on registered broker-dealers.
JD is subject to regulation under state law. The federal securities laws prohibit states from imposing substantive requirements on broker-dealers that exceed those under federal law. This does not preclude the states from imposing registration requirements on broker-dealers that operate within their jurisdiction or from sanctioning broker-dealers and their employees for engaging in misconduct.
ERISA
Certain JHG subsidiaries are also subject to the Employee Retirement Income Security Act of 1974, as amended (“ERISA”), and related regulations to the extent they are considered “fiduciaries” under ERISA with respect to some of their clients. ERISA-related provisions of the Code and regulations issued by the DOL impose duties on persons who are fiduciaries under ERISA and prohibit some transactions involving the assets of each ERISA plan that is a client of a JHG subsidiary as well as some transactions by the fiduciaries (and several other related parties) to such plans.
CFTC
The CFTC has regulations that require certain JHG subsidiaries to register as a commodity pool operator (“CPO”) and commodity trading adviser (“CTA”) and become a member of the National Futures Association (“NFA”) in connection with the operation of certain of the Company’s products. The regulations generally impose certain registration, reporting and disclosure requirements on CPOs, CTAs and products that utilize futures, swaps and other derivatives that are subject to CFTC regulation. The CFTC or NFA may institute proceedings to enforce applicable rules and regulations, and violations may result in fines, censure or the termination of CPO and/or CTA registration and NFA membership.
Dodd-Frank Wall Street Reform and Consumer Protection Act
The Dodd-Frank Wall Street Reform and Consumer Protection Act (the “Dodd-Frank Act”) was signed into law in July 2010. The Dodd-Frank Act established enhanced regulatory requirements for non-bank financial institutions designated as “systemically important” by the Financial Stability Oversight Council (“FSOC”). Subsequently, in April 2012, the FSOC issued a final rule and interpretive guidance related to the process by which it will designate non-bank financial companies as systemically important financial institutions (“SIFI”). Certain non-bank financial companies have since been designated as SIFIs, and additional non-bank financial companies, including large asset management companies, may be designated as SIFIs in the future. If JHG were designated a SIFI, it would be subject to enhanced prudential measures, which could include capital and liquidity requirements, leverage limits, enhanced public disclosures and risk management requirements, annual stress testing by the Federal Reserve, credit exposure and concentration limits, and supervisory and other requirements. These heightened regulatory requirements could adversely affect the Company’s business and operations. JHG is not a designated SIFI.
International Regulation
UK
The Financial Conduct Authority (“FCA”) regulates JHG and certain of its subsidiaries and products and services it offers in the UK. FCA authorization is required to conduct any investment management related business in the UK under the Financial Services and Markets Act 2000 (the
“FSMA”). The FCA’s rules and guidance under that act govern a firm’s capital resources requirements, senior management arrangements, systems and controls, conduct of business, and interaction with clients and the markets. The FCA also regulates the design and manufacture of investment funds intended for public distribution and, on a more limited basis, those that are for investment by professional investors.
Europe
In addition to the above, certain of the Group’s UK-regulated entities must comply with a range of EU regulatory measures. Some of these apply directly to UK firms while others have been implemented through member states’ law. They include the EU Markets in Financial Instruments Directive (“MiFID”). MiFID regulates the provision of investment services and conduct of investment activities throughout the European Economic Area. MiFID establishes detailed requirements for the governance, organization and conduct of business of investment firms and regulated markets. It also includes pre- and post-trade transparency requirements for equity markets and extensive transaction reporting requirements. These requirements were substantially revised and extended to non-equities from January 3, 2018, as a result of the implementation of the revised MiFID. The Markets in Financial Instruments Directive II (“MiFID II”) will have a substantial impact on the EU financial services sector, including asset managers. The UK has adopted the MiFID rules into national legislation, principally via the FSMA and the FCA rules. The other EU member states in which JHG has a presence have also implemented MiFID in their local legal and regulatory regimes.
The EU’s Alternative Investment Fund Managers Directive (“AIFMD”), was required to be transposed into EU member state law by July 2013 with a transitional period until July 2014. AIFMD regulates managers of, and service providers to, alternative investment funds (“AIFs”) that are domiciled and offered in the EU and that are not authorized as retail funds under the Undertakings for Collective Investment in Transferable Securities Directive. JHG has two subsidiaries regulated as Alternative Investment Fund Managers. The AIFMD also regulates the marketing within the EU of all AIFs, including those domiciled outside the EU. In general, AIFMD has a staged implementation up to 2018. Compliance with the AIFMD’s requirements may restrict AIF marketing and imposes compliance obligations in the form of remuneration policies, capital requirements, reporting requirements, leverage oversight, valuation, stakes in EU companies, the domicile, duties and liability of custodians and liquidity management.
UCITS are investment funds regulated at the EU level under the UCITS Directive V (“UCITS V”). UCITS are capable of being freely marketed throughout the EU on the basis of a single authorization in a member state — so-called passporting. UCITS V covers a range of matters relating to UCITS including the fund structure and domicile of UCITS, service providers to UCITS and marketing arrangements.
Luxembourg
A JHG subsidiary, Henderson Management S.A. (“HMSA”), is authorized and regulated in Luxembourg by the Commission de Surveillance du Secteur Financier as a UCITS Management Company. Two umbrella funds, Henderson Horizon Fund and Henderson Gartmore Fund, have appointed HMSA as their management company. Henderson Horizon Fund and Henderson Gartmore Fund are OEICs incorporated under the laws of Luxembourg in the form of an SICAV authorized as a UCITS.
Singapore
In Singapore, the Group’s subsidiary is subject to, among others, the Securities and Futures Act, the Financial Advisers Act and the subsidiary legislation promulgated pursuant to these acts, which are
administered by the Monetary Authority of Singapore. JHG’s asset management subsidiary and its employees conducting regulated activities specified in the Securities and Futures Act and/or the Financial Advisers Act are required to be licensed with the Monetary Authority of Singapore.
Australia
In Australia, JHG’s subsidiaries are subject to various Australian federal and state laws and are regulated by the Australian Securities and Investments Commission (“ASIC”). ASIC regulates companies, financial markets and financial services in Australia. ASIC imposes certain conditions on licensed financial services organizations that apply to the Group’s subsidiaries, including requirements relating to capital resources, operational capability and controls. As JHG’s chess depository interests (“CDIs”) are quoted and traded on the financial market operated by the Australian Securities Exchange (“ASX”), Henderson is also required to comply with the ASX listing rules and the ASX Principles.
Hong Kong
In Hong Kong, JHG’s subsidiary is subject to the Securities and Futures Ordinance (“SFO”), and its subsidiary legislation, which governs the securities and futures markets and regulates, among other things, offers of investments to the public and provides for the licensing of dealing in securities and asset management activities and intermediaries. This legislation is administered by the Securities and Futures Commission (“SFC”). The SFC is also empowered under the SFO to establish standards for compliance as well as codes and guidelines. JHG’s subsidiaries and its employees conducting any of the regulated activities specified in the SFO are required to be licensed with the SFC, and are subject to the rules, codes and guidelines issued by the SFC from time to time.
Japan
In Japan, the Group’s subsidiary is subject to the Financial Instruments and Exchange Act and the Act on Investment Trusts and Investment Corporations. These laws are administered and enforced by the Japanese Financial Services Agency, which establishes standards for compliance, including capital adequacy and financial soundness requirements, customer protection requirements and conduct of business rules.
These regulatory agencies have broad supervisory and disciplinary powers, including, among others, the power to temporarily or permanently revoke the authorization to conduct regulated business, suspend registered employees, and censure and fine both regulated businesses and their registered employees.
Many of the non-U.S. securities exchanges and regulatory authorities have imposed rules (and others may impose rules) relating to capital requirements applicable to JHG’s foreign subsidiaries. These rules, which specify minimum capital requirements, are designed to measure general financial integrity and liquidity, and require that a minimum amount of assets be kept in relatively liquid form.
Other
The Group’s operations in Taiwan and Ireland are regulated by the Financial Supervisory Commission of Taiwan and the Central Bank of Ireland, respectively.
Employees
As of December 31, 2017, JHG had 2,356 full-time equivalent employees. None of JHG’s employees are represented by a labor union.
Available Information
Copies of JHG’s filings with the SEC can be obtained from the SEC’s Public Reference Room at 100 F Street, N.E., Washington, DC 20549. Information can be obtained about the operation of the Public Reference Room by calling the SEC at (800) SEC-0330. The SEC also maintains an Internet site that contains reports, proxy and information statements, and other information regarding issuers that file electronically with the SEC at http://www.sec.gov.
JHG makes available free of charge its annual reports on Form 10-K, quarterly reports on Form 10-Q and current reports on Form 8-K and amendments thereto as soon as reasonably practical after such filing has been made with the SEC. Reports may be obtained through the Investor Relations section of JHG’s website (http://en-us.janushenderson.com). The contents of JHG’s website are not incorporated herein for any purpose.
JHG’s Officer Code of Ethics for Chief Executive Officers and Senior Financial Officers (including its Chief Executive Officers, Chief Financial Officer and Chief Accounting Officer) (the “Officer Code”); Corporate Code of Business Conduct for all employees; corporate governance guidelines; and the charters of key committees of the Board of Directors (including the Audit, Compensation, and Nominating and Corporate Governance committees) are available on the Investor Relations section of JHG’s website (http://www.snl.com/irw/corporateprofile/4147331). Any future amendments to or waivers of the Officer Code will be posted to the Investor Relations section of JHG’s website.
Corporate Information
JHG is a public limited company incorporated in Jersey, Channel Islands and tax resident in the UK Its principal business address is 201 Bishopsgate, London, EC2M 3AE, United Kingdom and its telephone number is +44 (0)20 7818 1818.
JHG is a “foreign private issuer” as defined in Rule 3b-4 promulgated by the SEC under the Exchange Act and in Rule 405 under the Securities Act. As a result, it is eligible to file its annual reports pursuant to Section 13 of the Exchange Act on Form 20-F (in lieu of Form 10-K) and to file its interim reports on Form 6-K (in lieu of Forms 10-Q and 8-K). However, JHG has elected to file its annual and interim reports on Forms 10-K, 10-Q and 8-K, including any instructions therein that relate specifically to foreign private issuers.
Pursuant to Rule 3a12-3 under the Exchange Act regarding foreign private issuers, the proxy solicitations of JHG are not subject to the disclosure and procedural requirements of Regulation 14A under the Exchange Act, and transactions in the JHG’s equity securities by its officers, directors and significant shareholders are exempt from the reporting and liability provisions of Section 16 of the Exchange Act.
Additional Financial Information
See additional financial information about geographical areas in Part II, Item 8, Financial Statements and Supplementary Data, Note 20 — Geographic Information.
ITEM 1A. RISK FACTORS
JHG faces numerous risks, uncertainties and other factors that are substantial and inherent to its business, including market and investment performance risks, business and strategic risks, operational and technology risks, legal and regulatory risks, risks related to taxes and Jersey company risks. The following are significant factors that could affect JHG’s business.
Market and Investment Performance Risks
JHG’s results of operations and financial condition are primarily dependent on the value, composition and relative investment performance of its investment products.
Any decrease in the value, relative investment performance or amount of AUM will cause a decline in revenue and negatively impact operating results and the financial condition of JHG. AUM may decline for various reasons, many of which are not under the control of JHG.
Factors that could cause AUM and revenue to decline include the following:
· Declines in equity markets. JHG’s AUM are concentrated in the U.S. and European equity markets. Equity securities may decline in value as a result of many factors, including an issuer’s actual or perceived financial condition and growth prospects, investor perception of an industry or sector, changes in currency exchange rates, changes in regulations and geopolitical and economic risks. Declines in the equity markets as a whole, or in the market segments in which JHG investment products are concentrated, may cause AUM to decrease.
· Declines in fixed income markets. Fixed income investment products may decline in value as a result of many factors, principally increases in interest rates, changes in currency exchange rates, changes in relative yield among instruments with different maturities, geopolitical and general economic risks, available liquidity in the markets in which a security trades, an issuer’s actual or perceived creditworthiness, or an issuer’s ability to meet its obligations.
· Relative investment performance. JHG’s investment products are often judged on their performance as compared to benchmark indices or peer groups, as well as being judged on an absolute return basis. Any period of underperformance of investment products relative to peers may result in the loss of existing assets and affect the ability of JHG to attract new assets. In addition, as of December 31, 2017 approximately 17% of JHG’s AUM were subject to performance fees. Performance fees are based either on each product’s investment performance as compared to an established benchmark index or on its positive absolute return over a specified period of time. If JHG investment products subject to performance fees underperform their respective benchmark index or produce a negative absolute return for a defined period, the revenue and thus results of operations and financial condition of JHG may be adversely affected. In addition, performance fees subject JHG’s revenue to increased volatility. Further, certain JHG U.S. mutual fund contracts, representing approximately 12% of JHG’s AUM at December 31, 2017, are subject to fulcrum performance fees and as a result, performance fees earned can be negative as well as positive.
JHG’s revenue and profitability would be adversely affected by any reduction in assets under management as a result of redemptions and other withdrawals from the funds and accounts managed.
Redemptions or withdrawals may be caused by investors (in response to adverse market conditions or pursuit of other investment opportunities or as a consequence of damage to JHG’s reputation, among other factors) reducing their investments in funds and accounts in general or in the market segments on which JHG focuses; investors taking profits from their investments; poor investment performance of the funds and accounts managed by JHG; and portfolio risk characteristics, which could cause investors to move assets to other investment managers. Poor performance relative to
competing products provided by other investment management firms tends to result in decreased sales, increased redemptions of fund shares and the loss of or reduction in AUM in private institutional accounts, with corresponding decreases in revenue. Failure of the JHG funds and accounts to perform well could, therefore, have a material adverse effect on the results of operations and financial condition of the Group.
Changes in the value of seeded investment products could affect JHG’s non-operating income or earnings and could increase the volatility of its earnings.
JHG has a significant seed portfolio and periodically adds new investment strategies to its investment product offerings, and provides the initial cash investment or “seeding” to facilitate the launch of the product. JHG may also provide substantial supplemental capital to an existing investment product in order to accelerate the growth of a strategy and attract outside investment in the product. A decline in the valuation of these seeded investments could negatively impact JHG’s earnings and financial condition.
Disruption to the operations of third parties whose functions are integral to the Group’s ETNs and ETFs platforms, collectively referred to as ETPs, may adversely affect the prices at which ETPs trade, particularly during periods of market volatility.
The trading price of an ETPs shares fluctuates continuously throughout trading hours. While an ETPs creation/redemption feature and the arbitrage mechanism are designed to make it more likely that the ETP’s shares normally will trade at prices close to the ETFs net asset value (“NAV”), exchange prices may deviate significantly from the ETPs NAV. ETP market prices are subject to numerous potential risks, including trading halts invoked by a stock exchange, inability or unwillingness of market markers, authorized participants, settlement systems or other market participants to perform functions necessary for an ETPs arbitrage mechanism to function effectively, or significant market volatility. If market events lead to instances where ETPs trade at prices that deviate significantly from an ETPs NAV, or trading halts are invoked by the relevant stock exchange or market, investors may lose confidence in ETP products and redeem their holdings, which may cause AUM, revenue and earnings to decline.
Illiquidity in certain securities in which JHG invests may negatively impact the financial condition of the Group’s investment products, and may impede the ability of JHG funds to effect redemptions.
JHG is exposed to the risk that some of its funds or mandates invest in certain securities or other assets in which the secondary trading market is illiquid or in which there is no secondary trading market at all. Illiquidity may occur with respect to the securities of a specific issuer, of issuers within a specific industry or sector, of issuers within a specific geographic region or regions, with respect to an asset class or an investment type, or with respect to the market as a whole. An illiquid trading market may increase market volatility and may make it impossible for funds or mandates to sell investments promptly without suffering a loss. This may have an adverse impact on the investment performance of such funds and mandates and on the AUM, revenues and results of operations of JHG.
Investors in certain funds managed by JHG have contractual terms that provide for a shorter notice period than the time period during which these funds may be able to sell underlying investments within the fund. This liquidity mismatch may be exacerbated during periods of market illiquidity and, in circumstances in which there are high levels of investor redemptions, it may be necessary for JHG to impose restrictions on redeeming investors or suspend redemptions. Such actions may increase the risk of legal claims by investors, regulatory investigation and/or fines and adversely affect the reputation of JHG.
JHG could be adversely impacted by changes in assumptions used in calculating pension assets and liabilities.
JHG provides retirement benefits for its current and former employees in the UK through the Janus Henderson Group Pension Scheme (the “UK Pension Scheme”). The UK Pension Scheme operates a number of defined benefit sections, which closed to new entrants on November 15, 1999, and a money purchase section. As of December 31, 2014, the UK Pension Scheme had a funding deficit of £39.2 million on a technical provisions basis. The Group has agreed with the trustees of the UK Pension Scheme to make contributions of $11.4 million (£8.4 million) per year for four years beginning in 2017 to recover the deficit. JHG may be required to increase its contributions in the future to cover any increased funding shortfall and/or expenses in the UK Pension Scheme, which could adversely impact JHG’s results and financial condition.
The following issues could adversely affect the funding of the defined benefits under the UK Pension Scheme and materially affect JHG’s funding obligations: (i) poorer than anticipated investment performance of pension fund investments; (ii) the trustees of the UK Pension Scheme switching investment strategy to one with a lower weighting of return-seeking assets; (iii) changes in the corporate bond yields which are used in the measurement of the UK Pension Scheme’s liabilities; (iv) longer life expectancy (which will make pensions payable for longer and therefore more expensive to provide, whether paid directly from the UK Pension Scheme or secured by the purchase of annuities); (v) adverse annuity rates (which tend, in particular, to depend on prevailing interest rates and life expectancy), as these will make it more expensive to secure pensions with an insurance company; (vi) a change in the actuarial assumptions by reference to which JHG’s contributions are assessed, for example changes to assumptions for long term price inflation; (vii) any increase in the risk-based levy assessed by and payable to the Pension Protection Fund by the UK Pension Scheme; (viii) other events occurring which make past service benefits more expensive than predicted in the actuarial assumptions by reference to which JHG’s past contributions were assessed; (ix) changes to the regulatory regime for funding defined benefit pension schemes in the UK; and (x) the UK Pensions Regulator exercising its power to trigger a winding up of the UK Pension Scheme thereby triggering a buy-out debt on the employers or the UK Pensions Regulator using its powers under the Pensions Act 2004 to make other members of the JHG group liable for any deficit in the UK Pension Scheme’s funding (although, in practice, it is assumed that the Pensions Regulator would be unlikely to exercise these powers while JHG continues to fund the UK Pension Scheme appropriately).
The global scope of JHG’s business subjects the Group to currency exchange rate risk that may adversely impact revenue and income.
JHG generates a substantial portion of its revenue in pounds sterling, euro and Australian dollars. As a result, JHG is subject to foreign currency exchange risk relative to the USD, JHG’s financial reporting currency, through its non-U.S. operations. Fluctuations in the exchange rates to the U.S. dollar may affect JHG’s financial results from one period to the next. In addition, the Group has risk associated with the foreign exchange revaluation of balances held by certain subsidiaries for which the local currency is different from the Group’s functional currency.
JHG could be impacted by counterparty or client defaults.
In periods of significant market volatility, the deteriorating financial condition of one financial institution may materially and adversely impact the performance of others. JHG, and the funds and accounts it manages, have exposure to many different counterparties, and routinely execute transactions with counterparties across the financial industry. JHG, and the funds and accounts it manages, may be exposed to credit, operational or other risk in the event of a default by a counterparty or client, or in the event of other unrelated systemic market failures.
Business and Strategic Risks
JHG may fail to successfully implement a strategy for the combined business, which could negatively impact the Group’s assets under management, results of operations and financial condition.
Through the combination of JCG and Henderson, the Group intends to establish an independent, active asset manager with a globally relevant brand, footprint, investment proposition and client service. No assurance can be given that the Group will successfully achieve this objective or that this objective will lead to increased revenue and net income, or to the creation of shareholder value. The failure to successfully implement a strategy for JHG could adversely affect the Group’s AUM, results of operations and financial condition.
JHG operates in a highly competitive environment and revenue from fees may be reduced.
The investment management business is highly competitive. In addition, established firms as well as new entrants to the asset management industry have, in recent years, expanded their application of technology, including through the use of robo-advisers, in providing services to clients. JHG’s traditional fee structures may be subject to downward pressure due to these factors. Moreover, in recent years there has been a trend toward lower fees in the investment management industry, as evidenced by the movement toward passively managed mutual funds and the growth of lower cost funds such as exchange traded, smart beta and quant funds. Fees for actively managed investment products may come under increased pressure if such products fail to outperform returns for comparable passively managed products or as a consequence of regulatory intervention. Fee reductions on existing or future new business as well as changes in regulations pertaining to fees could adversely affect the Group’s results of operations and financial condition. Additionally, JHG will compete with investment management companies on the basis of investment performance, fees, diversity of products, distribution capability, reputation and the ability to develop new investment products to meet the changing needs of investors. Failure to adequately compete could adversely affect the Group’s assets under management, results of operations and financial condition.
The Group’s results are dependent on its ability to attract and retain key personnel.
The investment management business is highly dependent on the ability to attract, retain and motivate highly skilled and often highly specialized technical, executive, sales and investment management personnel. The market for qualified investment and sales professionals is extremely competitive and is characterized by the frequent movement of portfolio managers, analysts and salespeople among different firms. Any changes to management structure, shifts in corporate culture, changes to corporate governance authority, or adjustments or reductions to compensation could affect the Group’s ability to retain key personnel and could result in legal claims. If JHG is unable to retain key personnel, particularly those personnel responsible for managing client funds that account for a high proportion of JHG’s revenue, it could adversely affect the Group’s AUM, results of operations and financial condition.
The Group is dependent upon third-party distribution channels to access clients and potential clients.
JHG’s ability to market and distribute its investment products is significantly dependent on access to the client base of insurance companies, defined contribution plan administrators, securities firms, broker-dealers, financial advisors, multi-managers, banks and other distribution channels. These companies generally offer their clients various investment products in addition to, and competitive with, products offered by JHG. In addition, JHG’s existing relationships with third-party distributors and access to new distributors could be adversely affected by recent consolidation within the financial services industry. Consolidation may result in increased distribution costs, a reduction in the
number of third parties distributing JHG’s investment products or increased competition to access third-party distribution channels. The inability to access clients through third-party distribution channels could adversely affect the Group’s business prospects, AUM, results of operations and financial condition.
The global scope of JHG’s business subjects the Group to market-specific political, economic and other risks that may adversely impact the Group’s revenue and income generated overseas.
The Group’s global portfolios and revenue derived from managing these portfolios are subject to significant risks of loss as a result of political, economic, and diplomatic developments, currency fluctuations, social instability, changes in governmental policies, expropriation, nationalization, asset confiscation and changes in legislation related to non-U.S. ownership. Political events in any country or region could result in significant declines in equity and/or fixed income securities exposed to such a country or region and, to the extent that JHG has a concentration of AUM in such a country or region could result in a material adverse effect on the AUM, results of operations and financial condition of the combined company. In addition, international trading markets, particularly in some emerging market countries, are often smaller, less liquid, less regulated and significantly more volatile than those in the U.S. As the Group’s business grows in non-U.S. markets, any ongoing and future business, political, economic or social unrest affecting these markets may have a negative impact on the long-term investment climate in these and other areas and, as a result, on JHG’s AUM and the corresponding revenue and income generated from these markets may be negatively affected.
Harm to JHG’s reputation or poor investment performance of JHG’s products could reduce the level of assets under management or affect sales, potentially negatively impacting the Group’s revenue and net income. JHG’s reputation is critical to the success of the Group.
JHG believes that its brand name is well received both in the asset management industry and with its clients, reflecting the fact that the brand, like the business, is based in part on trust and confidence. If the reputation of JHG is harmed, existing clients may reduce amounts held in, or withdraw entirely from, funds advised by JHG, or funds may terminate or reduce AUM under their management agreements with JHG, which could reduce the amount of AUM of the Group and cause the Group to suffer a corresponding loss in revenue and income. The investment performance of JHG, along with achieving and maintaining superior distribution and client services, is also critical to the success of the business. Strong investment performance has historically stimulated sales of JHG investment products. Poor investment performance as compared to third-party benchmarks or competitive products has in the past, and could in the future, lead to a decrease in sales of investment products managed by JHG and stimulate redemptions from existing products, generally lowering the overall level of AUM and reducing management fees. No assurance can be given that past or present investment performance in the investment products JHG manages will be indicative of future performance. Any poor investment performance may negatively impact the revenue and net income of JHG. The reputation of JHG could also be damaged by factors such as litigation, regulatory action, loss of key personnel, misconduct, operational failures (including any failures during the integration process), mismanagement, loss of client data, fraud (by employees or third parties), failure to manage conflicts of interest or satisfy fiduciary responsibilities, and negative publicity or press speculation (whether or not any such allegations or claims are valid or ultimately disproved, dismissed or withdrawn). Reputational harm or poor investment performance may cause JHG to lose current clients and it may be unable to continue to attract new clients or develop new business. If JHG fails to address, or appears to fail to address, successfully and promptly the underlying causes of any reputational harm or poor investment performance, it may be unsuccessful
in repairing any existing harm to its reputation or performance and the Group’s future business prospects would likely be affected.
JHG has significant goodwill and intangible assets that are subject to impairment.
At December 31, 2017, JHG’s goodwill and intangible assets totaled $4.7 billion. The value of these assets may not be realized for a variety of reasons, including, but not limited to, significant redemptions, loss of clients, damage to brand name and unfavorable economic conditions. JHG has recorded goodwill and intangible asset impairments in the past and could incur similar charges in the future. Under accounting pronouncements generally accepted in the United States of America (“GAAP”), goodwill and intangible assets with indefinite lives are not amortized but are tested for impairment annually or more often if an event or circumstance indicates that an impairment loss may have been incurred. Other intangible assets with finite lives are amortized on a straight-line basis over their estimated useful lives and reviewed for impairment whenever there is an indication of impairment. Should such reviews indicate impairment, a reduction of the carrying value of the intangible asset could occur, resulting in a charge that may, in turn, adversely affect JHG’s AUM, results of operations and financial condition.
JHG’s businesses are dependent on investment management agreements that are subject to termination, non-renewal or reductions in fees.
JHG derives revenue from investment management agreements with investment funds, institutional and other investors. With respect to investment management agreements with U.S. mutual funds, these agreements may be terminated by either party with notice, or in the event of an “assignment” (as defined in the Investment Company Act), and must be approved and renewed annually by the independent members of each fund’s board of directors or trustees or its shareowners, as required by law. In addition, the board of directors or trustees of certain investment funds and institutional and other investors generally may terminate their investment management agreements upon written notice for any reason and without penalty. Such U.S. mutual funds, investments funds or other investors may choose to exercise such termination rights as a result of the uncertainty caused by the Merger or if the employees with whom they have a relationship leave the business during or following the integration process. The termination of or failure to renew one or more of these agreements or the reduction of the fee rates applicable to such agreements could have a material adverse effect on the Group’s AUM, results of operations and financial condition.
Integration efforts related to the Merger are ongoing and JHG may face significant challenges in implementing such integration.
Certain integration processes are complex, time-consuming and ongoing and the Group may face significant challenges implementing such integration in a timely manner.
Failure to properly address conflicts of interest could harm JHG’s reputation, business and results of operations.
JHG’s business will require continuously managing actual and potential conflicts of interest, including situations where the Group’s services to a particular client conflict, or are perceived to conflict, with the interests of another client or those of JHG. The risk of actual or potential conflicts of interest occurring may be increased as a result of the Merger and it is possible that conflicts between aspects of Janus’s and Henderson’s existing businesses will be identified during the integration process. The willingness of clients to enter into transactions in which such a conflict might arise may be affected if the Group fails, or appears to fail, to deal appropriately with conflicts of interest. In addition, potential or perceived conflicts could give rise to litigation or regulatory enforcement actions.
Operational and Technology Risks
JHG could be subject to losses and reputational harm if the Group, or its agents, fail to properly safeguard sensitive and confidential information or as a result of cyberattacks.
JHG will be dependent on the continued effectiveness of its information and cyber security policies, procedures and capabilities to protect its computer and telecommunications systems and the data that resides in or is transmitted through such systems.
As part of JHG’s normal operations, the Group maintains and transmits confidential information about its clients and employees as well as proprietary information relating to its business operations. JHG maintains a system of internal controls designed to provide reasonable assurance that fraudulent activity, including misappropriation of assets, fraudulent financial reporting and unauthorized access to sensitive or confidential data, is either prevented or detected on a timely basis. Nevertheless, all technology systems remain vulnerable to unauthorized access and may be corrupted by cyberattacks, computer viruses or other malicious software code, the nature of which threats are constantly evolving and becoming increasingly sophisticated. In addition, authorized persons could inadvertently or intentionally release confidential or proprietary information. Although JHG takes precautions to password protect and encrypt its mobile electronic hardware, if such hardware is stolen, misplaced or left unattended, it may become vulnerable to hacking or other unauthorized use, creating a possible security risk and resulting in potentially costly actions by JHG. Breach or other failure of JHG’s technology systems, including those of third parties with which the Group does business, or failure to timely and effectively identify and respond to any such breach or failure, could result in the loss of valuable information, liability for stolen assets or information, remediation costs to repair damage caused by the incident, additional security costs to mitigate against future incidents and litigation costs resulting from the incident. Moreover, loss of confidential customer identification information could harm JHG’s reputation, result in the termination of contracts by the Group’s existing customers and subject the Group to liability under laws that protect confidential personal data, resulting in increased costs or loss of revenue. The increasing prevalence and sophistication of cyberattacks generally and the heightened profile of JHG as a result of its increased scale and breadth of global activities may result in an increase in the volume and sophistication of cyberattacks on JHG specifically. This may increase the amount of investment that the Group will need to make to minimize the risk of harm to its business and potentially increase the risk that, despite such investment, the Group will be a victim of a successful cyberattack. Recent well-publicized security breaches at other companies have exposed failings by companies to keep pace with the threats posed by cyberattackers and have led to enhanced government and regulatory scrutiny of the measures taken by companies to protect against cyberattacks, and may in the future result in heightened cyber security requirements, including additional regulatory expectations for oversight of vendors and service providers which could lead to increased costs or fines or public censure which could lead to a damaged reputation and loss of customers (and a decrease in AUM, lower revenue and reduced net income) as a result.
Intech’s investment process is highly dependent on key employees and proprietary software.
Intech’s investment process (which relates to approximately 13% of JHG’s AUM as of December 31, 2017) is based on complex and proprietary mathematical models that seek to outperform various indices by capitalizing on the volatility in stock price movements while controlling trading costs and overall risk relative to the index. The maintenance of such models for current products and the development of new products is highly dependent on certain key Intech employees. If Intech is unable to retain key personnel or properly transition key personnel responsibilities to others, if the mathematical investment strategies developed by Intech fail to produce the intended results, or if errors occur in the development or implementation of Intech’s mathematical models, Intech may not be able to maintain its historical level of investment performance, which could adversely affect JHG’s
AUM, results of operations and financial condition and could also result in legal claims against JHG or regulatory investigations in respect of its operations.
Failure to establish adequate controls and risk management policies, the circumvention of controls and policies, or fraud as well as failure to maintain adequate infrastructure or failures in operational or risk management processes and systems could have an adverse effect on the Group’s assets under management, results of operation and financial condition.
JHG has a comprehensive risk management process and will continue to enhance various controls, procedures, policies and systems to monitor and manage risks to its business; however, there can be no assurances that such controls, procedures, policies and systems will successfully identify and manage internal and external risks to the business. JHG is subject to the risk that its employees, contractors or other third parties may deliberately seek to circumvent established controls to commit fraud or act in ways that are inconsistent with the Group’s controls, policies and procedures (including insider trading). Any operational errors or negligence by the employees of, or others acting on behalf of, JHG or weaknesses in the internal controls over those processes could result in losses for JHG, a requirement for JHG to compensate clients for losses suffered and/or regulatory fines. Persistent or repeated attempts involving conflicts of interests, circumvention of policies and controls, fraud or insider trading could have a materially adverse impact on JHG’s reputation and could lead to costly regulatory inquiries.
The JHG business is also highly dependent on the integrity, security and reliability of its information technology systems and infrastructure. If any of the critical systems or infrastructure do not operate properly or are disabled, the ability of JHG to perform effective investment management on behalf of its clients could be impaired. In addition, the failure to maintain an infrastructure commensurate with the size and scope of JHG’s business, including any expansion, could impede the Group’s productivity and growth, which could negatively impact AUM, results of operations and financial condition.
JHG’s infrastructure, including its technological capacity, data centers and office space, will be vital to the operations and competitiveness of its business. The failure to maintain an infrastructure commensurate with the increased size and scope of JHG’s business, including any expansion, could impede the Group’s productivity and growth, which could negatively impact assets under management, results of operations and financial condition, and increase operational risk.
Insurance may not be available on a cost-effective basis to help protect JHG from potential liabilities.
JHG faces the inherent risk of liability related to litigation from clients, third-party vendors or others. To help protect against these potential liabilities, JHG has purchased insurance in amounts, and against risks, that JHG considers appropriate, where such insurance is available at prices it deems acceptable. There can be no assurance, however, that a claim or claims will be covered by insurance or, if covered, will not exceed the limits of available insurance coverage, that any insurer will remain solvent and will meet its obligations to provide JHG with coverage or that insurance coverage will continue to be available with sufficient limits at a reasonable cost. Insurance costs are impacted by market conditions and the risk profile of the insured, and may increase significantly over relatively short periods. In addition, certain insurance coverage may not be available or may only be available at prohibitive costs. Renewals of insurance policies may expose JHG to additional costs through higher premiums or the assumption of higher deductibles or co-insurance liability.
JHG’s business may be vulnerable to failures of support systems and client service functions provided by third-party vendors.
JHG’s client service capabilities as well as its ability to obtain prompt and accurate securities pricing information and to process client transactions and reports will be significantly dependent on communication and information systems and services provided by third-party vendors. The ability to consistently and reliably obtain securities pricing information, process client transactions and provide reports and other client services to the shareholders of funds and other investment products managed by JHG are essential to the Group’s operations. Any delays, errors or inaccuracies in obtaining pricing information, processing client transactions or providing reports, and any other inadequacies in other client service functions could impact client relationships, result in financial loss and potentially give rise to regulatory action and claims against JHG. A failure of third-party systems or services could adversely affect JHG’s AUM, results of operations and financial condition.
JHG depends on third-party service providers and other key vendors for various fund administration, accounting, custody, risk analytics, market data, market indices and transfer agent roles, and other distribution and operational needs. If JHG’s third-party service providers or other key vendors fail to fulfill their obligations, experience service interruptions or otherwise provide inadequate service, it could lead to operational and regulatory problems, including with respect to certain of the Group’s products, which could result in losses, enforcement actions, or reputational harm and which could negatively impact the Group’s, AUM, results of operations and financial condition.
Failure to maintain adequate business continuity plans could have a material adverse impact on JHG and its products.
Significant portions of JHG’s business operations and those of its critical third-party service providers will be concentrated in a few geographic areas, including the UK, U.S., Luxembourg and Australia. Should JHG, or any of its critical service providers, experience a significant local or regional disaster or other business continuity problem, the Group’s continued success will depend in part on the safety and availability of its personnel, its office facilities, and the proper functioning of its computer, telecommunication and other related systems and operations. The failure by JHG, or any of its critical service providers, to maintain updated adequate business continuity plans, including backup facilities, could impede the Group’s ability to operate in the event of a disruption. This could negatively impact the Group’s AUM, results of operations and financial condition. JHG has developed various backup systems and contingency plans but no assurance can be given that they will be adequate in all circumstances that could arise or that material interruptions and disruptions will not occur. In addition, JHG will rely to varying degrees on outside vendors for disaster contingency support, and, notwithstanding any due diligence or oversight carried out by JHG, no assurance can be given that these vendors will be able to perform in an adequate and timely manner. If JHG, or any of its critical service providers, is unable to respond adequately to such an event in a timely manner, the Group may be unable to continue its business operations, which could lead to a damaged reputation and loss of customers, resulting in a decrease in AUM, lower revenue and reduced net income.
JHG’s indebtedness could adversely affect its financial condition and results of operations.
JHG’s indebtedness could limit its ability to obtain additional financing for working capital, capital expenditures, acquisitions, debt servicing requirements or other purposes. Debt servicing requirements will increase JHG’s vulnerability to adverse economic, market and industry conditions; limit JHG’s flexibility in planning for or reacting to changes in business operations or to the asset management industry overall; and place JHG at a disadvantage in relation to competitors that have lower debt levels. Any or all of the above events and factors could adversely affect JHG’s AUM, results of operations and financial condition.
Legal and Regulatory Risks
JHG is periodically involved in various legal proceedings and regulatory matters and may be involved in such proceedings in the future.
JHG and its employees are periodically involved in various legal proceedings and regulatory investigations. Among other things, such matters may result in fines, censure, suspension of personnel and revocation of licenses. Any of these outcomes could adversely affect JHG’s AUM, results of operations and financial condition. Additionally, JHG and its employees have received and may receive in the future requests for information in connection with certain investigations or proceedings from various governmental and regulatory authorities. These investigations or proceedings may result in increased costs or reputational harm to the Group, which may lower sales and increase redemptions.
JHG operates in an industry that is highly regulated in most countries, and any enforcement action or adverse changes in the laws or regulations governing its business could adversely affect its results of operations or financial condition.
Like all investment management firms, JHG’s activities are highly regulated in almost all countries in which it conducts business. The Group is subject to regulation in the U.S., the UK, Europe, Australia and in other international markets, including regulation by the SEC, FINRA, the CFTC, the NFA, the Australian Securities and Investments Commission in Australia, and the FCA in the UK, Subsidiaries operating in the EU are subject to various EU Directives, which are implemented by member state national legislation. JHG’s operations elsewhere in the world are regulated by similar regulatory organizations.
Laws and regulations applied at the international, national, state or provincial and local level generally grant governmental agencies and industry self-regulatory authorities broad administrative discretion over JHG’s activities, including the power to limit or restrict its business activities, conduct examinations, risk assessments, investigations and capital adequacy reviews, and impose remedial programs to address perceived deficiencies. As a result of regulatory oversight, JHG could face requirements which negatively impact the way in which it conducts business, increase compliance costs, impose additional capital requirements and/or involve enforcement actions which could lead to sanctions up to and including the revocation of licenses to operate certain businesses, the suspension or expulsion from a particular jurisdiction or market of any of its business organizations or key personnel, or the imposition of fines and censures on it or its employees. Judgments or findings of wrongdoing by regulatory or governmental authorities, or in private litigation against JHG, could affect its reputation, increase its costs of doing business and/or negatively impact revenues, any of which could have an adverse impact on JHG’s results of operations or financial condition.
JHG may also be adversely affected as a result of new or revised legislation or regulations, or by changes in the interpretation or enforcement of existing laws and regulations. The costs and burdens of compliance with these and other current and future reporting and operational requirements and regulations have increased significantly and may continue to increase the cost of offering mutual funds and other investment products and services, which could adversely affect JHG’s AUM, results of operations and financial condition.
The regulatory environment in which JHG operates frequently changes and has seen a significant increase in regulation in recent years. Various changes in laws and regulations have been enacted or otherwise developed in multiple jurisdictions globally and various other proposals remain under consideration by legislators, regulators, and other government officials and other public policy commentators. Certain enacted provisions and certain other proposals are potentially far reaching and, depending upon their implementation, could have a material impact on JHG’s business. JHG
may be adversely affected as a result of the new or revised legislation or regulations or by changes in the interpretation or enforcement of existing laws and regulations.
Proposed Changes in the U.S. Regulatory Framework
In the U.S., the government and other institutions have taken action, and may continue to take further action, in response to the volatility in the global financial markets. For example, the Dodd-Frank Act was signed into law in July 2010. Certain provisions have required JHG, and other provisions will or may require JHG, to change and or impose new limitations on the manner in which it conducts business and has increased regulatory burdens and related compliance costs. Rulemaking is still ongoing for the Dodd-Frank Act and any further actions could include new rules and requirements that may be applicable to JHG, the effect of which could have additional adverse consequences to JHG’s business and results of operations.
Regulators also continue to examine the different aspects of the asset management industry. For example, in December 2014, the Chairperson of the SEC announced a comprehensive agenda for regulatory change governing the U.S. asset management industry and directed SEC staff to develop a five-part series of new regulations addressing the topics of enhanced portfolio reporting, liquidity risk management, leverage and use of derivatives, adviser wind up and stress testing for funds and advisers. This resulted in new regulations regarding enhanced portfolio reporting (the Investment Company Reporting Modernization Act) and liquidity risk management (Liquidity Risk Management Rule). These new industry rules can be expected to add additional reporting, operational and compliance costs and may affect the development of new products. JHG believes these proposals could increase operational and compliance costs. It is unclear whether any of the former SEC Chairperson’s other initiatives will result in any new rulemaking.
The DOL has adopted regulations, effective June 9, 2017 (with the delay of some provisions until July 1, 2019), that will treat as fiduciaries any person who provides investment advice or recommendations to employee benefit plans (plan fiduciaries, plan participants and plan beneficiaries) and, Individual Retirement Accounts (“IRAs”) owners. The new regulations, when fully implemented, will have wide-ranging consequences for JHG and its U.S. distribution partners and product lines. Under the new rules, firms and individuals who recommend financial products to retirement investors would be required to act in the best interest of the investor and, to receive variable compensation, would be required to enter into a contract with clients and produce complex disclosure documents intended to highlight financial conflicts of interest that may arise from the compensation the financial adviser receives from firms like JHG.
With the commencement of President Trump’s new administration, the regulatory moratorium imposed by President Trump on January 20, 2017, the possibility for the repeal of aspects of the Dodd-Frank Act, delay of portions of the DOL’s fiduciary rule and other deregulation, and other political uncertainty in the U.S. following the 2016 Presidential and Congressional elections, the regulatory environment in the U.S. may experience increased volatility. At this time, it is not possible to determine the impact such reforms would have on JHG’s business.
Proposed Changes in the European Union Regulatory Framework
The EU has promulgated or is considering various new or revised directives pertaining to financial services, including investment managers. Such directives are progressing at various stages, and have been, are being, or will or would be implemented by national legislation in member states. MiFID II is an example of such regulation, which seeks to promote a single market for wholesale and retail transactions in financial instruments. MiFID II, which came into effect on January 3, 2018, addresses the conduct of business rules for intermediaries providing investment services and the effective, efficient and safe operation of financial markets. Key elements of MiFID II in relation to
investor protection measures include changes to the extent to which retrocessions may be paid and the use of trading commissions to fund research. Such regulatory changes will have a direct impact on the revenue of JHG’s asset management business as they reduce JHG’s ability to utilize commissions to pay for research services which will result in operational changes and increased costs allocated to research services.
Various regulators promulgated or are considering other new disclosure or suitability requirements pertaining to the distribution of investment funds and other investment products or services, including enhanced standards and requirements pertaining to disclosures made to retail investors at the point of sale. As with the Dodd-Frank Act, the Group does not believe implementation of these directives will fundamentally change the asset management industry or cause JHG to reconsider its fundamental strategy, but certain provisions may require JHG to change or impose new limitations on the manner in which it conducts business and may result in increased fee and margin pressure from clients. They also have increased regulatory burdens and compliance costs, and will or may continue to do so. Certain provisions, such as MiFID II, may have unintended adverse consequences on the liquidity or structure of the financial markets. Similar developments are being implemented or considered in other jurisdictions where JHG does business; such developments could have similar effects.
The full impact of potential legal and regulatory changes or possible enforcement proceedings on the JHG business cannot be predicted. Such changes have imposed, and may continue to impose, new compliance costs and/or capital requirements, including costs related to information technology systems, or may impact JHG in other ways that could have an adverse impact on JHG’s results of operations or financial condition. Similarly, regulatory enforcement actions which impose significant penalties or compliance obligations or which result in significant reputational harm could have similar adverse effects on JHG. Moreover, certain legal or regulatory changes could require JHG to modify its strategies, businesses or operations, and it may incur other new constraints or costs, including the investment of significant management time and resources in order to satisfy new regulatory requirements or to compete in a changed business environment. In recent years, certain regulatory developments have also added pressures regarding fee levels. In addition, the 2016 presidential election in the U.S., and recent elections in Europe, have created additional uncertainty as to the future regulatory environment and how it may impact JHG.
To the extent that existing or future regulations affecting the sale of JHG products and services or investment strategies cause or contribute to reduced sales or increased redemptions of its products, impair the investment performance of its products or impact its product mix, JHG’s aggregate assets under management, results of operations or financial condition might be adversely affected.
JHG may have increased regulatory capital requirements imposed on it by regulators, which could negatively impact the Group’s ability to return capital or pay dividends to shareholders or its results of operations and financial condition.
JHG’s regulators typically have broad discretion to impose increased regulatory capital requirements on the regulated entities in their respective groups. It is possible that the regulatory capital requirements that JHG’s business is subject to currently may be subject to change and could increase. The imposition of increased regulatory capital requirements could negatively impact the Group’s ability to return capital or pay dividends to shareholders, restrict its ability to make future acquisitions or, should the Company be required to raise additional capital, negatively impact its results of operations and financial condition.
Failure to comply with client contractual requirements and/or investment guidelines could negatively impact JHG’s assets under management, results of operations and financial condition.
Many of the investment management agreements under which JHG manages assets or provides services will specify investment guidelines or requirements that the Group will be required to observe in the provision of its services. Laws and regulations will also impose similar requirements for certain accounts. A failure to follow these guidelines or requirements could result in damage to the Group’s reputation or in clients seeking to recover losses, withdrawing their assets or terminating their contracts, any one of which could cause revenues and profitability to decline. In addition breach of these investment guidelines or requirements could result in regulatory investigation, censure and/or fine. The risk of breach of such investment guidelines or requirements may be increased during the integration process as the businesses of Janus and Henderson are combined.
The UK electorate voted in favor of a UK exit from the EU in a referendum, which could adversely impact JHG’s business, results of operations and financial condition.
The UK Government held an “in-or-out” referendum in June 2016 on the UK’s membership in the EU. The UK electorate voted in favor of a UK exit from the EU (“Brexit”). The UK is still negotiating with EU governing bodies to determine the terms of the UK’s exit from the EU. At present, it is not possible to predict the outcome of those negotiations or the future relationship the UK will have with the EU. However, JHG remains headquartered in the UK and conducts business in Europe through subsidiaries and branches in the EU as well as conducting cross-border business into the EU from the UK. Depending on the terms of Brexit, JHG could face additional costs, including possibly additional taxation, and other challenges, including new impediments to conducting EU business and costs of restructuring and other changes to facilitate continuing European business activities.
UK asset management firms could lose their current level of access to the single EU market and, as a result of Brexit, JHG may incur additional costs due to having to locate more activities within the EU. A decline in trade between the UK and EU could affect the attractiveness of the UK as a global investment center and could have a detrimental impact on UK economic growth. Although JHG has a diverse international customer base, its results could be adversely affected by the market impacts of reduced UK economic growth and greater volatility in the pound sterling. There could also be changes to UK and EU immigration policies as a result of Brexit, which could lead to restrictions on the free movement of investment and support staff between the UK and the EU.
Any of the foregoing factors could have a material adverse effect on JHG’s business, results of operations or financial condition.
JHG may be subject to claims of lack of suitability.
If clients of JHG suffer losses on funds or investment mandates managed by the Group, they may seek compensation from JHG on the basis of allegations that the funds and/or investment mandates were not suitable for such clients or that the fund prospectuses or other marketing materials contained material errors or were misleading. Despite the controls relating to disclosure in fund prospectuses and marketing materials, it is possible that such action may be successful, which in turn could adversely affect the business, financial condition and results of operations of the Group. Any claim for lack of suitability may also result in regulatory investigation, censure and/or fine and may damage the reputation of JHG.
As a foreign private issuer, JHG is not subject to certain U.S. securities law disclosure requirements that apply to a domestic U.S. issuer, which may limit the information publicly available to our shareholders.
As a foreign private issuer, JHG is not required to comply with all of the periodic disclosure and current reporting requirements of the Exchange Act and therefore there may be less publicly available information about the company than if it were a U.S. domestic issuer. For example, JHG is not subject to the proxy rules in the U.S. and disclosure with respect to its annual meetings will be governed by Jersey law and ASX requirements. In addition, JHG’s officers, directors and significant shareholders are exempt from the reporting and “short-swing” profit recovery provisions of Section 16 of the Exchange Act and the rules thereunder. Therefore, JHG’s shareholders may not know on a timely basis when the company’s officers, directors and significant shareholders purchase or sell shares.
Risks Related to Taxes
Additional tax liabilities could have a material impact on the Group’s financial condition, results of operations and/or liquidity.
JHG operates in a number of territories, and will accordingly be subject to tax in several jurisdictions. The tax rules to which JHG are subject to tax are complex, and the Group as a whole, must make judgments (including certain judgments based on external advice) as to the interpretation and application of these rules. The tax affairs of the Group will in the ordinary course be reviewed by tax authorities, which may disagree with certain positions that JHG has taken, or that members of the Group have taken or will take in the future, and assess additional taxes. JHG regularly assesses the likely outcomes of such tax inquiries, investigations or audits in order to determine the appropriateness of their respective tax provisions. However, there can be no assurance that JHG will accurately predict the outcomes of these inquiries, investigations or audits, and the actual outcomes of these inquiries, investigations or audits could have a material impact on the Group’s financial results.
Changes to tax laws could adversely affect JHG.
Any change in tax law, interpretation or practice, or in the terms of tax treaties, in a jurisdiction where the Group is subject to tax could increase the amount of tax payable by the Group. On December 22, 2017, the Tax Cuts and Jobs Act, (the “Act”), was signed into law. The Act enacts broad changes to the existing U.S. federal income tax code, including reducing the federal corporate income tax rate from 35% to 21%, amongst many other complex provisions. The ultimate impact of such tax reforms may differ from our current estimates due to changes in interpretations and assumptions made by us as well as the issuance of any further regulations or guidance that may alter the operation of the U.S. federal income tax code. Various uncertainties also exist in terms of how U.S. states and any foreign countries within which the Group operate will react to these U.S. federal income tax reforms. The overall impact of the Act on the Group’s future financial results is subject to uncertainties and the Group’s financial results could be adversely impacted by certain other aspects of the Act.
The IRS may assert that JHG is to be treated as a domestic corporation or otherwise subject to certain adverse consequences for U.S. federal income tax purposes.
Although JHG is a public limited company incorporated in Jersey, Channel Islands and tax resident in the UK, the U.S. Internal Revenue Services (the “IRS”) may assert that JHG, as a result of the Merger, should be treated as a U.S. corporation (and, therefore, a U.S. tax resident) for U.S. federal
income tax purposes pursuant to section 7874 of the U.S. Internal Revenue Code of 1986, as amended (“Section 7874”).
Section 7874 provides that if, following an acquisition of a U.S. corporation by a non-U.S. corporation, at least 80% of the acquiring non-U.S. corporation’s stock (by vote or value) is considered to be held by former shareholders of the U.S. corporation by reason of holding stock of such U.S. corporation (such percentage referred to as the “ownership percentage” and such test referred to as the “80% ownership test”), and the “expanded affiliated group” which includes the acquiring non-U.S. corporation does not have substantial business activities in the country in which the acquiring non-U.S. corporation is created or organized, then the non-U.S. corporation would be treated as a U.S. corporation for U.S. federal income tax purposes even though it is a corporation created and organized outside the U.S.
JHG does not believe that the 80% ownership test was satisfied as a result of the Merger. If the 80% ownership test were satisfied and, as a result, JHG were treated as a U.S. corporation for U.S. federal income tax purposes, JHG could be liable for substantial additional U.S. federal income tax on its operations and income. Additionally, if JHG were treated as a U.S. corporation for U.S. federal income tax purposes, non-U.S. JHG shareholders would generally be subject to U.S. withholding tax on the gross amount of any dividends paid by JHG to such shareholders.
Section 7874 also provides that if, following an acquisition of a U.S. corporation by a non-U.S. corporation, the ownership percentage is equal to or greater than 60% but less than 80% (such test the “60% ownership test”), then the U.S. corporation and its affiliates could be prohibited from using their foreign tax credits or other U.S. federal tax attributes to offset the income or gain recognized by reason of the transfer of property to a non-U.S. related person or any income received or accrued by reason of a license of any property by such U.S. entity to a non-U.S. related person. Further, certain JCG stock compensation held directly or indirectly by management prior to the Merger would be subject to an excise tax at a rate equal to 15%. In addition, under U.S. Treasury temporary regulations, JHG’s ability to integrate certain non-U.S. operations or to access cash earned by non-U.S. subsidiaries may be limited. JHG does not believe that the 60% ownership test was satisfied as a result of the Merger.
Because there is only limited guidance on the manner in which the ownership percentage is to be determined, there can be no assurance that the IRS will agree with the position that JHG is to be treated as a non-U.S. corporation or that JHG is not to be subject to the other adverse U.S. federal income tax consequences associated with satisfying the 60% ownership test.
Jersey Company Risks
JHG’s ordinary shares are governed by the laws of Jersey, Channel Islands, which may not provide the level of legal certainty and transparency afforded by incorporation in a U.S. state.
JHG is organized under the laws of Jersey, Channel Islands, a British crown dependency that is an island located off the coast of Normandy, France. Jersey is not a member of the EU. Jersey, Channel Islands legislation regarding companies is largely based on English corporate law principles. However, there can be no assurance that the laws of Jersey, Channel Islands, will not change in the future or that it will serve to protect investors in a similar fashion afforded under corporate law principles in the U.S., which could adversely affect the rights of investors.
U.S. shareholders may not be able to enforce civil liabilities against JHG.
Certain of JHG’s directors and executive officers are not residents of the U.S. A substantial portion of the assets of such persons are located outside the U.S. As a result, it may not be possible for investors to effect service of process within the U.S. upon such persons.
Judgments of U.S. courts may not be directly enforceable outside of the U.S. and the enforcement of judgments of U.S. courts outside of the U.S. may be subject to limitations. Investors may also have difficulties pursuing an original action brought in a court in a jurisdiction outside the U.S. for liabilities under the securities laws of the U.S.
ITEM 1B. UNRESOLVED STAFF COMMENTS
None.
ITEM 2. PROPERTIES
JHG has 31 offices across the UK, Europe, North America, Asia and Australia. JHG’s corporate headquarters is located in London, where it occupies approximately 107,000 square feet on a long-term lease which expires in 2028. JHG also has significant operations in Denver, Colorado occupying approximately 217,000 square feet of office space in two separate locations. The two leases in Denver, Colorado expire in 2018 and 2025. The remaining 28 offices total approximately 125,000 square feet and are all leased. In the opinion of management, the space and equipment leased by the Group are adequate for existing operating needs.
ITEM 3. LEGAL PROCEEDINGS
From time to time, JHG may become involved in various lawsuits and legal proceedings which arise in the ordinary course of business. Litigation is subject to inherent uncertainties, and an adverse result in these or other matters may arise from time to time that may harm JHG’s business. JHG is currently not aware of any such legal proceedings or claims that it believes will have, individually or in the aggregate, a material adverse effect on its AUM, financial condition or operating results.
ITEM 4. MINE SAFETY DISCLOSURES
Not applicable.
PART II
ITEM 5. MARKET FOR REGISTRANT’S COMMON EQUITY, RELATED STOCKHOLDER MATTERS AND ISSUER PURCHASES OF EQUITY SECURITIES
JHG Common Stock
Post-Merger, JHG’s common stock is traded on the New York Stock Exchange (the “NYSE”) (symbol: JHG). Prior to the Merger, Henderson Group plc shares were listed on the London Stock Exchange. The following table presents the high and low sale prices as reported on the appropriate market for each completed quarter in 2017 and 2016.
|
|
|
2017 |
| |||||
|
Quarter |
|
|
High |
|
Low |
| ||
|
|
|
|
|
|
| |||
|
First |
|
£ |
2.45 |
|
£ |
2.12 |
| |
|
Second (pre-merger) |
|
£ |
2.44 |
|
£ |
2.26 |
| |
|
Second (post-merger) |
|
$ |
33.99 |
|
$ |
30.60 |
| |
|
Third |
|
$ |
35.77 |
|
$ |
31.60 |
| |
|
Fourth |
|
$ |
38.47 |
|
$ |
34.52 |
| |
|
|
|
2016 |
| |||||
|
Quarter |
|
|
High |
|
Low |
| ||
|
|
|
|
|
|
| |||
|
First |
|
£ |
3.10 |
|
£ |
2.15 |
| |
|
Second |
|
£ |
2.69 |
|
£ |
1.95 |
| |
|
Third |
|
£ |
2.54 |
|
£ |
1.98 |
| |
|
Fourth |
|
£ |
2.71 |
|
£ |
2.19 |
| |
On April 26, 2017, Henderson redenominated its ordinary shares from Great British pound (“GBP”) to USD, resulting in a change in par value from £0.125 to $0.1547 per share. Also on April 26, 2017, the shareholders approved a 10-to-1 share consolidation, which took effect on May 30, 2017. Refer to the share redenomination and consolidation section within Note 2 — Summary of Significant Accounting Policies for additional information.
The following graph illustrates the cumulative total shareholder return (rounded to the nearest whole dollar) of JHG’s common stock over the five-year period ending December 29, 2017, the last trading day of 2017, and compares it to the cumulative total return on the Standard and Poor’s (“S&P”) 500 Index and the S&P Diversified Financials Index. The comparison assumes a $100 investment on December 31, 2012, in JHG’s common stock and in each of the foregoing indices and assumes
reinvestment of dividends, if any. This data is not intended to forecast future performance of JHG’s common stock.

On December 31, 2017, there were approximately 47,324 holders of record of JHG’s common stock.
Dividends
The payment of cash dividends is within the discretion of JHG’s Board of Directors and depends on many factors, including, but not limited to, JHG’s results of operations, financial condition, capital requirements, restrictions imposed by financing arrangements, general business conditions and legal requirements. Dividends are subject to quarterly declaration by JHG’s Board of Directors.
The following cash dividends were declared and paid during 2017:
|
Dividend |
|
Date |
|
Dividends paid |
|
|
| |||
|
per share |
|
declared |
|
(in millions) |
|
Date paid |
| |||
|
|
|
|
|
|
|
|
| |||
|
£ |
0.0730 |
|
February 9, 2017 |
|
$ |
102.6 |
|
|
May 19, 2017 |
|
|
£ |
0.0185 |
|
April 19, 2017 |
|
$ |
26.0 |
|
|
May 19, 2017 |
|
|
$ |
0.3200 |
|
August 7, 2017 |
|
$ |
63.7 |
|
|
September 1, 2017 |
|
|
$ |
0.3200 |
|
November 8, 2017 |
|
$ |
63.7 |
|
|
December 1, 2017 |
|
JHG declared dividends of £0.104 per share during 2016.
On February 5, 2018, JHG’s Board of Directors declared a fourth quarter 2017 cash dividend of $0.32 per share. The dividend will be paid on March 2, 2018, to shareholders of record at the close of business on February 16, 2018.
Common Stock Purchases
Some of the Group’s executives and employees receive rights over JHG ordinary shares as part of their remuneration arrangements and employee entitlements. These entitlements may be satisfied
either by the transfer of existing ordinary shares acquired on-market or by the issue of ordinary shares. The following table presents JHG ordinary shares purchased on-market by month during 2017 in satisfaction of employee awards and entitlements.
|
|
|
Total |
|
|
|
Total number of shares |
|
Approximate dollar value of |
| ||||
|
|
|
number of |
|
Average |
|
purchased as part of |
|
shares that may yet |
| ||||
|
|
|
shares |
|
price paid per |
|
publicly announced |
|
be purchased under the |
| ||||
|
Period |
|
|
purchased |
|
share |
|
programs |
|
programs (end of month) |
| |||
|
|
|
|
|
|
|
|
|
|
| ||||
|
January |
|
1,046,305 |
|
$ |
2.36 |
|
|
— |
|
|
— |
| |
|
February |
|
1,126,364 |
|
2.28 |
|
|
— |
|
|
— |
| ||
|
March |
|
7,898,665 |
|
2.29 |
|
|
— |
|
|
— |
| ||
|
April |
|
2,463,300 |
|
2.41 |
|
|
— |
|
|
— |
| ||
|
May |
|
40,398 |
|
30.85 |
|
|
— |
|
|
— |
| ||
|
June |
|
165,577 |
|
26.80 |
|
|
— |
|
|
— |
| ||
|
July |
|
754 |
|
25.15 |
|
|
— |
|
|
— |
| ||
|
August |
|
94,394 |
|
26.99 |
|
|
— |
|
|
— |
| ||
|
September |
|
19,711 |
|
33.15 |
|
|
— |
|
|
— |
| ||
|
October |
|
9,595 |
|
34.07 |
|
|
— |
|
|
— |
| ||
|
November |
|
104,508 |
|
27.52 |
|
|
— |
|
|
— |
| ||
|
December |
|
16,775 |
|
37.28 |
|
|
— |
|
|
— |
| ||
|
|
|
|
|
|
|
|
|
|
|
|
| ||
|
Total |
|
12,986,346 |
|
$ |
3.22 |
|
|
— |
|
|
|
| |
At the Annual General Meeting held on April 26, 2017, shareholders authorized JHG to make on-market purchases of up to 10% of the issued share capital of the Group at completion of the Merger. Shareholders will be asked to renew this authority at the 2018 Annual General Meeting. The Group did not make any on-market or off-market share purchases during 2017 in connection with any share buy-back program and as at the date of this report, there were no current on-market or off-market buy-backs of the Group’s securities.
ITEM 6. SELECTED FINANCIAL DATA
The selected financial data below was derived from the Group’s consolidated financial statements and should be read in conjunction with Part II, Item 7, Management’s Discussion and Analysis of Financial Condition and Results of Operations of JHG, and Part II, Item 8, Financial Statements and Supplementary Data. The selected financial data presents four years of data prepared in accordance with GAAP. Selected financial data for 2013 is only available in International Financial Reporting
Standards (“IFRS”) and cannot be provided on a restated basis without unreasonable effort or expense. The Group has limited ability to convert the data from IFRS to GAAP.
|
|
|
Year ended December 31, |
| ||||||||||
|
|
|
2017 (1) |
|
2016 |
|
2015 |
|
2014 |
| ||||
|
|
|
(dollars in millions, except per share data and |
| ||||||||||
|
|
|
operating data) |
| ||||||||||
|
|
|
|
|
|
|
|
|
|
| ||||
|
Consolidated income statement: |
|
|
|
|
|
|
|
|
| ||||
|
Operating revenues |
|
$ |
1,743.7 |
|
$ |
999.9 |
|
$ |
1,155.1 |
|
$ |
1,105.7 |
|
|
Operating expenses |
|
1,301.4 |
|
767.8 |
|
837.8 |
|
807.2 |
| ||||
|
Operating income |
|
442.3 |
|
232.1 |
|
317.3 |
|
298.5 |
| ||||
|
Interest expense (2) |
|
(11.9 |
) |
(6.6 |
) |
(20.1 |
) |
(19.3 |
) | ||||
|
Investment gains (losses), net (3) |
|
18.0 |
|
(11.7 |
) |
39.7 |
|
285.9 |
| ||||
|
Other non-operating income (expenses), net |
|
(1.0 |
) |
(1.9 |
) |
0.6 |
|
(1.5 |
) | ||||
|
Income tax benefit (provision) (4) |
|
211.0 |
|
(34.6 |
) |
(6.1 |
) |
(52.6 |
) | ||||
|
Net income |
|
658.4 |
|
177.3 |
|
331.4 |
|
511.0 |
| ||||
|
Net loss (income) attributable to |
|
|
|
|
|
|
|
|
| ||||
|
noncontrolling interests (5) |
|
(2.9 |
) |
11.7 |
|
(1.6 |
) |
(7.7 |
) | ||||
|
Net income attributable to JHG |
|
$ |
655.5 |
|
$ |
189.0 |
|
$ |
329.8 |
|
$ |
503.3 |
|
|
|
|
|
|
|
|
|
|
|
| ||||
|
Earnings per share attributable to JHG common shareholders: |
|
|
|
|
|
|
|
|
| ||||
|
Diluted |
|
$ |
3.93 |
|
$ |
1.66 |
|
$ |
2.78 |
|
$ |
4.21 |
|
|
Weighted-average diluted common |
|
|
|
|
|
|
|
|
| ||||
|
shares outstanding (in millions) |
|
162.3 |
|
1,111.1 |
|
1,154.5 |
|
1,154.4 |
| ||||
|
|
|
|
|
|
|
|
|
|
| ||||
|
Dividends declared and paid per share: |
|
|
|
|
|
|
|
|
| ||||
|
GBP |
|
£ |
0.0915 |
|
£ |
0.1040 |
|
£ |
0.0950 |
|
£ |
0.0845 |
|
|
USD |
|
$ |
0.6400 |
|
$ |
— |
|
$ |
— |
|
$ |
— |
|
|
|
|
|
|
|
|
|
|
|
| ||||
|
Consolidated balance sheet (as of December 31): |
|
|
|
|
|
|
|
|
| ||||
|
Total assets |
|
$ |
7,272.7 |
|
$ |
2,433.4 |
|
$ |
2,835.2 |
|
$ |
2,840.5 |
|
|
Long-term debt (including current portion) |
|
$ |
379.2 |
|
$ |
— |
|
$ |
220.9 |
|
$ |
233.0 |
|
|
Deferred income taxes, net |
|
$ |
752.6 |
|
$ |
70.7 |
|
$ |
86.3 |
|
$ |
87.5 |
|
|
Other non-current liabilities |
|
$ |
99.6 |
|
$ |
39.0 |
|
$ |
49.4 |
|
$ |
52.6 |
|
|
Redeemable noncontrolling interests (6) |
|
$ |
190.3 |
|
$ |
158.0 |
|
$ |
82.9 |
|
$ |
4.4 |
|
|
Cash flow: |
|
|
|
|
|
|
|
|
| ||||
|
Cash flows provided by operating activities |
|
$ |
444.1 |
|
$ |
235.1 |
|
$ |
388.9 |
|
$ |
226.8 |
|
|
Operating data (in billions): |
|
|
|
|
|
|
|
|
| ||||
|
Ending AUM |
|
$ |
370.8 |
|
$ |
124.7 |
|
$ |
135.6 |
|
$ |
126.5 |
|
|
Average AUM |
|
$ |
262.1 |
|
$ |
129.4 |
|
$ |
127.7 |
|
$ |
121.2 |
|
(1) Data presented for the year ended December 31, 2017, includes the impact of the Merger starting from the Closing Date and thus is not comparable to results presented in the prior periods, which only relate to Henderson. Refer to Item 8 — Financial Statements and Supplementary Data, Note 4 — Acquisitions for additional information on the Merger.
(2) The Group repaid its 7.25% Senior Notes due 2016 (the “2016 Senior Notes”) in March 2016 thus interest expense decreased in 2016 compared to 2015 and 2014.
(3) The Group sold its property business for a gain of $245.3 million and a share in a joint venture in 2014.The Group’s share in the joint venture was sold in 2015 and an $18.9 million gain was recognized.
(4) The Group’s income tax provision in 2015 was extraordinarily low primarily due to one-off tax benefits, which included a reduction in the UK tax rate, tax benefits arising from the exercise of stock-based compensation awards and the settlement of tax positions with the UK tax authorities. The Group’s income tax provision in 2017 includes a one-time tax benefit of $340.7 million related to new U.S. tax legislation.
(5) The Group’s net loss (income) attributable to noncontrolling interests in 2015 and 2014 is primarily due to its investment in private equity seed investments.
(6) The increase in redeemable noncontrolling interest in 2016 is primarily due to an increase in third-party ownership in seed capital.
ITEM 7. MANAGEMENT’S DISCUSSION AND ANALYSIS OF FINANCIAL CONDITION AND RESULTS OF OPERATIONS OF JHG
Business Overview
JHG is an independent global asset manager, specializing in active investment across all major asset classes. JHG actively manages a broad range of investment products for institutional and retail investors across five capabilities: Equities, Quantitative Equities, Fixed Income, Multi-Asset and Alternatives.
On the Closing Date, JCG and Henderson completed a merger of equals. As a result of the Merger, JCG and its consolidated subsidiaries became subsidiaries of Henderson, which was renamed to Janus Henderson Group plc. For purposes of this section, each reference to the “Group” or “JHG” refers to Janus Henderson Group plc and its consolidated subsidiaries.
Segment Considerations
JHG is a global asset manager and manages a range of investment products, operating across various product lines, distribution channels and geographic regions. However, information is reported to the chief operating decision-makers, the Co-Chief Executive Officers (“Co-CEOs”), on an aggregated basis. Strategic and financial management decisions are determined centrally by the Co-CEOs and, on this basis, the Group operates as a single segment investment management business.
Revenue
Revenue primarily consists of management fees and performance fees. Management fees are generally based upon a percentage of the market value of AUM and are calculated using either the daily, month-end or quarter-end average asset balance in accordance with contractual agreements. Accordingly, fluctuations in the financial markets have a direct effect on the Group’s operating results. Additionally, AUM may outperform or underperform the financial markets and therefore may fluctuate in varying degrees from that of the general market.
Performance fees are specified in certain fund and client contracts and are based on investment performance either on an absolute basis or compared to an established index over a specified period of time. This is often subject to a hurdle rate. Performance fees are recognized at the end of the contractual period (typically monthly, quarterly or annually) if the stated performance criteria are achieved. Certain fund and client contracts allow for negative performance fees where there is underperformance against the relevant index.
2017 SUMMARY
2017 Highlights
· Completion of the Merger with JCG on May 30, 2017. Integration efforts are ahead of expectations, setting the foundations for future growth.
· Improvements to investment performance and minimal disruption to clients and investment teams.
· Increase of AUM to $370.8 billion, up 16% from December 31, 2016 on a pro forma basis.
· Strong revenue and profitability growth with significant improvement in operating margin. 2017 diluted earnings per share of $3.93, or $2.48 on a pro forma adjusted basis. Refer to the Non-GAAP Financial Measures section for information on adjusted non-GAAP figures.
· Forecasted cost synergies of $110 million at time of merger have since been raised to $125 million, with approximately $90 million in annualized run rate cost synergies realized as of December 31, 2017.
· Announcement of expansion into the U.S. of our long-standing strategic partnership with BNP Paribas Securities Services (“BNP Paribas”), supporting the Group’s global operating model.
Financial Summary
Results are reported on a GAAP basis. Adjusted non-GAAP figures are presented in the Non-GAAP Financial Measures section.
Revenue for the year ended December 31, 2017 was $1,743.7 million, an increase of $743.8 million, or 74%, from December 31, 2016. This increase was driven primarily by legacy JCG revenues of $680.8 million in 2017. Average AUM (excluding JCG) increased by 6% and positively affected management fees during 2017, compared to 2016. Performance fees improved in 2017 by $55.4 million compared to 2016, which contributed to the increase in revenue. These increases are partially offset by lower average management fee margins and adverse foreign currency translation.
Total operating expenses for the year ended December 31, 2017 were $1,301.4 million, an increase of $533.6 million, or 69%, compared to operating expenses for the year ended December 31, 2016. Legacy JCG operations contributed $405.0 million to operating expenses in 2017 and total deal and integration costs in 2017 contributed $126.2 million.
Operating income for the year ended December 31, 2017, was $442.3 million, an increase of $210.2 million, or 91%, compared to the year ended December 31, 2016. The Group’s operating margin was 25.4% in 2017, compared to 23.2% in 2016. Legacy JCG operations contributed $275.8 million to operating income in the year ended December 31, 2017. This was partially offset by an increase of $110.5 million of deal and integration costs related to the Merger and a reduction in expenditures year-over-year as the Group concentrated on integration.
Net income attributable to JHG in the year ended December 31, 2017 was $655.5 million, an increase of $466.5 million, or 247%, compared to the year ended December 31, 2016. During the year ended December 31, 2017, the Group recorded a one-time tax benefit of $340.7 million due to changes in U.S. tax laws. Legacy JCG operations contributed $173.1 million to net income attributable to JHG in 2017. Performance fees improved in 2017 and contributed $55.4 million to the year-over-year change. These increases were partially offset by deal and integration costs related to the Merger.
Investment Performance of Assets Under Management
The following table is a summary of investment performance as of December 31, 2017:
|
Percentage of assets under management outperforming benchmark (1) |
|
|
1 year |
|
3 years |
|
5 years |
|
|
|
|
|
|
|
| |
|
Equities |
|
64% |
|
60% |
|
67% | |
|
Fixed Income |
|
93% |
|
95% |
|
98% | |
|
Quantitative Equities |
|
90% |
|
27% |
|
87% | |
|
Multi-Asset |
|
86% |
|
87% |
|
89% | |
|
Alternatives |
|
93% |
|
76% |
|
100% | |
|
Total Group |
|
76% |
|
66% |
|
79% | |
(1) Includes JCG performance.
Assets Under Management
The Group’s AUM as of December 31, 2017, was $370.8 billion, an increase of $246.1 billion, or 197% from December 31, 2016, driven primarily by net acquisitions of $205.8 billion representing JCG’s AUM of $206.5 billion, offset by disposals of $0.7 billion. Positive market movements in the period contributed $31.7 billion and the weakening of the USD resulted in favorable foreign exchange movements of $11.6 billion. This was partially offset by net outflows of $3.0 billion, which includes flows from JCG from the Closing Date.
During 2017, the USD weakened against all major currencies. As of December 31, 2017, approximately 36% of the Group’s AUM was non-USD denominated, resulting in a favorable currency effect, particularly in products exposed to GBP.
JHG’s ETNs are not included within the AUM as JHG is not the named adviser or subadviser to ETNs. ETN assets totaled $4.0 billion as of December 31, 2017.
Asset and flows by capability for the years ended December 31, 2017, 2016 and 2015 (includes JCG activity from the Closing Date), are as follows (in billions):
|
|
|
Closing AUM |
|
|
|
|
|
|
|
|
|
|
|
|
|
Closing AUM |
| ||||||||||||||||||||
|
|
|
Dec. 31, |
|
|
|
|
|
Net sales |
|
|
|
|
|
Acquisitions & |
|
Dec. 31, |
| ||||||||||||||||||||
|
|
|
2016 (1) |
|
Sales |
|
Redemptions (2) |
|
(redemptions) |
|
Markets |
|
FX (3) |
|
disposals |
|
2017 |
| ||||||||||||||||||||
|
|
|
|
|
|
|
|
|
|
|
|
|
|
|
|
|
|
| ||||||||||||||||||||
|
By capability |
|
|
|
|
|
|
|
|
|
|
|
|
|
|
|
|
|
|
|
|
|
|
|
|
|
|
|
|
| ||||||||
|
Equities |
|
|
$ |
63.6 |
|
|
$ |
32.6 |
|
|
$ |
(32.6 |
) |
|
|
$ |
— |
|
|
|
$ |
21.2 |
|
|
$ |
5.2 |
|
|
$ |
99.7 |
|
|
|
$ |
189.7 |
|
|
|
Fixed Income |
|
|
34.7 |
|
|
17.2 |
|
|
(15.7 |
) |
|
|
1.5 |
|
|
|
1.5 |
|
|
3.8 |
|
|
38.6 |
|
|
|
80.1 |
|
| ||||||||
|
Quantitative Equities |
|
|
— |
|
|
1.6 |
|
|
(5.2 |
) |
|
|
(3.6 |
) |
|
|
5.4 |
|
|
0.1 |
|
|
48.0 |
|
|
|
49.9 |
|
| ||||||||
|
Multi-Asset |
|
|
9.0 |
|
|
2.8 |
|
|
(3.8 |
) |
|
|
(1.0 |
) |
|
|
2.7 |
|
|
0.9 |
|
|
20.0 |
|
|
|
31.6 |
|
| ||||||||
|
Alternatives |
|
|
17.4 |
|
|
7.7 |
|
|
(7.6 |
) |
|
|
0.1 |
|
|
|
0.9 |
|
|
1.6 |
|
|
(0.5 |
) |
|
|
19.5 |
|
| ||||||||
|
TOTAL |
|
|
$ |
124.7 |
|
|
$ |
61.9 |
|
|
$ |
(64.9 |
) |
|
|
$ |
(3.0 |
) |
|
|
$ |
31.7 |
|
|
$ |
11.6 |
|
|
$ |
205.8 |
|
|
|
$ |
370.8 |
|
|
|
|
|
Closing AUM |
|
|
|
|
|
|
|
|
|
|
|
|
|
Closing AUM |
| ||||||||||||||||||||
|
|
|
Dec. 31, |
|
|
|
|
|
Net sales |
|
|
|
|
|
Acquisitions & |
|
Dec. 31, |
| ||||||||||||||||||||
|
|
|
2015 (1) |
|
Sales |
|
Redemptions (2) |
|
(redemptions) |
|
Markets |
|
FX (3) |
|
disposals |
|
2016 (1) |
| ||||||||||||||||||||
|
|
|
|
|
|
|
|
|
|
|
|
|
|
|
|
|
|
| ||||||||||||||||||||
|
By capability |
|
|
|
|
|
|
|
|
|
|
|
|
|
|
|
|
|
|
|
|
|
|
|
|
|
|
|
|
| ||||||||
|
Equities |
|
|
$ |
68.6 |
|
|
$ |
16.2 |
|
|
$ |
(19.9 |
) |
|
|
$ |
(3.7 |
) |
|
|
$ |
3.0 |
|
|
$ |
(4.3 |
) |
|
$ |
— |
|
|
|
$ |
63.6 |
|
|
|
Fixed Income |
|
|
36.5 |
|
|
10.6 |
|
|
(10.5 |
) |
|
|
0.1 |
|
|
|
2.7 |
|
|
(4.6 |
) |
|
— |
|
|
|
34.7 |
|
| ||||||||
|
Multi-Asset |
|
|
10.4 |
|
|
0.6 |
|
|
(1.4 |
) |
|
|
(0.8 |
) |
|
|
1.1 |
|
|
(1.7 |
) |
|
— |
|
|
|
9.0 |
|
| ||||||||
|
Alternatives |
|
|
20.1 |
|
|
7.7 |
|
|
(8.5 |
) |
|
|
(0.8 |
) |
|
|
— |
|
|
(1.9 |
) |
|
— |
|
|
|
17.4 |
|
| ||||||||
|
TOTAL |
|
|
$ |
135.6 |
|
|
$ |
35.1 |
|
|
$ |
(40.3 |
) |
|
|
$ |
(5.2 |
) |
|
|
$ |
6.8 |
|
|
$ |
(12.5 |
) |
|
$ |
— |
|
|
|
$ |
124.7 |
|
|
|
|
|
Closing AUM |
|
|
|
|
|
|
|
|
|
|
|
|
|
Closing AUM |
| ||||||||||||||||||||
|
|
|
Dec. 31, |
|
|
|
|
|
Net sales |
|
|
|
|
|
Acquisitions & |
|
Dec. 31, |
| ||||||||||||||||||||
|
|
|
2014 (1) |
|
Sales |
|
Redemptions (2) |
|
(redemptions) |
|
Markets |
|
FX (3) |
|
disposals |
|
2015 (1) |
| ||||||||||||||||||||
|
|
|
|
|
|
|
|
|
|
|
|
|
|
|
|
|
|
| ||||||||||||||||||||
|
|
|
|
|
|
|
|
|
|
|
|
|
|
|
|
|
|
| ||||||||||||||||||||
|
By capability |
|
|
|
|
|
|
|
|
|
|
|
|
|
|
|
|
|
|
|
|
|
|
|
|
|
|
|
|
| ||||||||
|
Equities |
|
|
$ |
60.7 |
|
|
$ |
22.8 |
|
|
$ |
(16.1 |
) |
|
|
$ |
6.7 |
|
|
|
$ |
3.9 |
|
|
$ |
(2.8 |
) |
|
$ |
0.1 |
|
|
|
$ |
68.6 |
|
|
|
Fixed Income |
|
|
29.9 |
|
|
13.8 |
|
|
(11.4 |
) |
|
|
2.4 |
|
|
|
(0.2 |
) |
|
(1.8 |
) |
|
6.2 |
|
|
|
36.5 |
|
| ||||||||
|
Multi-Asset |
|
|
11.3 |
|
|
1.0 |
|
|
(1.5 |
) |
|
|
(0.5 |
) |
|
|
0.2 |
|
|
(0.6 |
) |
|
— |
|
|
|
10.4 |
|
| ||||||||
|
Alternatives |
|
|
24.6 |
|
|
10.5 |
|
|
(6.2 |
) |
|
|
4.3 |
|
|
|
0.4 |
|
|
(0.9 |
) |
|
(8.3 |
) |
|
|
20.1 |
|
| ||||||||
|
TOTAL |
|
|
$ |
126.5 |
|
|
$ |
48.1 |
|
|
$ |
(35.2 |
) |
|
|
$ |
12.9 |
|
|
|
$ |
4.3 |
|
|
$ |
(6.1 |
) |
|
$ |
(2.0 |
) |
|
|
$ |
135.6 |
|
|
(1) AUM as of December 31, 2016, 2015 and 2014 has been reclassified between capabilities following the completion of the Merger.
(2) Redemptions include the impact of client transfers which could cause a positive balance on occasion.
(3) FX reflects movements in AUM resulting from changes in foreign currency rates as non-USD denominated AUM is translated into USD.
Closing Assets Under Management
The following table presents the closing AUM, split by client type and client location as of December 31, 2017 (in billions):
|
|
|
Closing AUM |
| ||||
|
By client type |
|
|
December 31, 2017 |
| |||
|
|
|
|
| ||||
|
Intermediary |
|
|
$ |
164.1 |
|
| |
|
Institutional |
|
|
144.7 |
|
| ||
|
Self-directed |
|
|
62.0 |
|
| ||
|
Total |
|
|
$ |
370.8 |
|
| |
|
|
|
Closing AUM |
| ||||
|
By client location |
|
|
December 31, 2017 |
| |||
|
|
|
|
| ||||
|
Americas |
|
|
$ |
192.8 |
|
| |
|
EMEA |
|
|
120.2 |
|
| ||
|
Asia-Pacific |
|
|
57.8 |
|
| ||
|
Total |
|
|
$ |
370.8 |
|
| |
Valuation of Assets Under Management
The fair value of AUM is based on the value of the underlying cash and investment securities of the funds, trusts and segregated mandates. A significant proportion of these securities are listed or quoted on a recognized securities exchange or market and are regularly traded thereon; these investments are valued based on unadjusted quoted market prices. Investments including, but not limited to, over-the-counter derivative contracts, (which are dealt in or through a clearing firm), exchange or financial institution will be valued by reference to the most recent official settlement price quoted by the appointed market vendor and in the event no price is available from this source,
a broker quotation may be used. Physical property held is valued monthly by a specialist independent appraiser.
When a readily ascertainable market value does not exist for an investment, the fair value is calculated based on the expected cash flows of its underlying net asset base, taking into account applicable discount rates and other factors. Judgment is used to ascertain if a formerly active market has become inactive and in determining fair values when markets have become inactive. The Fair Value Pricing Committee is responsible for determining or approving these unquoted prices, which are reported to those charged with governance of the funds and trusts. For funds that invest in markets that are closed at their valuation point, an assessment is made daily to determine whether a fair value pricing adjustment is required to the fund’s valuation. This may be due to significant market movements in other correlated open markets, scheduled market closures or unscheduled market closures as a result of natural disaster or government intervention.
For legacy Henderson funds, third-party administrators hold a key role in the collection and validation of prices used in the valuation of the securities. Daily price validation is completed using techniques such as day-on-day tolerance movements, invariant prices, excessive movement checks and intra-vendor tolerance checks. The JHG Data Management Team performs oversight of this process and completes annual due diligence on the processes of third parties.
For legacy JCG funds, the Group performs a number of procedures to validate the pricing received from third-party providers. For actively traded equity securities, prices are received daily from both a primary and secondary vendor. For fixed income securities, prices are received daily from a primary vendor and weekly from a secondary vendor. Prices from the primary and secondary vendors are compared to identify any discrepancies. In the event of a discrepancy, a price challenge may be issued to both vendors. Securities with significant day to day price changes require additional research, which may include a review of all news pertaining to the issue and issuer and any corporate actions. All fixed income prices are reviewed by JHG’s fixed income trading desk to incorporate market activity information available to JHG’s traders. In the event the traders have received price indications from market makers for a particular issue, this information is transmitted to the pricing vendors.
JHG leverages the expertise of its fund management teams across the business to cross-invest assets and create value for its clients. Where cross investment occurs, assets and flows are identified and the duplication is removed.
Results of Operations
Operating Revenues
|
|
|
Year ended December 31, |
|
2017 vs. |
|
2016 vs. |
| |||||||
|
|
|
2017 |
|
2016 |
|
2015 |
|
2016 |
|
2015 |
| |||
|
|
|
|
|
|
|
|
|
|
|
|
| |||
|
Revenue (in millions): |
|
|
|
|
|
|
|
|
|
|
| |||
|
Management fees |
|
$ |
1,465.1 |
|
$ |
867.8 |
|
$ |
914.7 |
|
68.8 |
% |
(5.1 |
)% |
|
Performance fees |
|
103.9 |
|
54.8 |
|
150.8 |
|
89.6 |
% |
(63.7 |
)% | |||
|
Shareowner servicing fees |
|
71.5 |
|
— |
|
— |
|
n/m* |
|
n/m* |
| |||
|
Other revenue |
|
103.2 |
|
77.3 |
|
89.6 |
|
33.5 |
% |
(13.7 |
)% | |||
|
Total revenue |
|
$ |
1,743.7 |
|
$ |
999.9 |
|
$ |
1,155.1 |
|
74.4 |
% |
(13.4 |
)% |
* n/m — Not meaningful
Management fees
Management fees increased by $597.3 million, or 68.8%, during the year ended December 31, 2017, compared to the same period in 2016 with the inclusion of seven months of legacy JCG management fees of $584.9 million as the largest driver. Average AUM (excluding JCG) increased by 6% and positively affected management fees during the year ended December 31, 2017, compared to the same period in 2016. Positive market movements contributed $80.2 million to the increase in management fees over the year. These increases are partially offset by the effect of adverse foreign currency translations ($11.0) million, net outflows causing a decrease in management fees ($50.3) million, and lower average gross fee margins. Lower margins are primarily from a change in product mix (i.e., switch in share classes as a result of the Retail Distribution Review within Europe to a lower fee share class), and are partially offset by a decrease in distribution expenses.
Management fees decreased by $46.9 million, or (5.1%), from 2015 to 2016, despite average AUM increasing by 1.3% year-over-year. Although average institutional AUM increased by 6.1%, average retail AUM decreased by 1.5% resulting in a mix shift from higher margin retail fees to lower margin institutional fees. In addition, management fee margins decreased due to the share class change as explained above. As a result, distribution costs also fell during the period.
The impact of foreign currency fluctuations, markets and 2016 outflows caused a net decrease in management fees, which was partially offset by a net favorable full year impact of 2015 inflows and the full year favorable impact of acquisitions.
Performance fees
Performance fees are derived across a number of product ranges. Pooled fund and segregated mandate performance fees are recognized on a quarterly or annual basis, while mutual fund performance fees are recognized on a monthly basis. Performance fees by product type consisted of the following for the years ended December 31, 2017, 2016 and 2015 (in millions):
|
|
|
Year ended December 31, |
|
2017 vs. |
|
2016 vs. |
| |||||||
|
|
|
2017 |
|
2016 |
|
2015 |
|
2016 |
|
2015 |
| |||
|
|
|
|
|
|
|
|
|
|
|
|
| |||
|
Performance fees (in millions): |
|
|
|
|
|
|
|
|
|
|
| |||
|
SICAVs |
|
$ |
49.1 |
|
$ |
18.1 |
|
$ |
72.7 |
|
171.3 |
% |
(75.1 |
)% |
|
UK OEICs & Unit Trusts |
|
22.8 |
|
8.6 |
|
18.1 |
|
165.1 |
% |
(52.5 |
)% | |||
|
Offshore Absolute Return |
|
8.2 |
|
13.6 |
|
38.1 |
|
(39.7 |
)% |
(64.3 |
)% | |||
|
Segregated Mandates |
|
17.8 |
|
8.2 |
|
5.9 |
|
117.1 |
% |
39.0 |
% | |||
|
Private Accounts |
|
13.2 |
|
— |
|
— |
|
n/m* |
|
n/m* |
| |||
|
Investment Trusts |
|
11.8 |
|
4.6 |
|
14.4 |
|
156.5 |
% |
(68.1 |
)% | |||
|
Mutual Funds |
|
(19.5 |
) |
— |
|
— |
|
n/m* |
|
n/m* |
| |||
|
Other |
|
0.5 |
|
1.7 |
|
1.6 |
|
(70.6 |
)% |
6.3 |
% | |||
|
Total performance fees |
|
$ |
103.9 |
|
$ |
54.8 |
|
$ |
150.8 |
|
89.6 |
% |
(63.7 |
)% |
* n/m — Not meaningful
Performance fees increased by $49.1 million, or 89.6%, during the year ended December 31, 2017, compared to the same period in 2016. The increase for the year ended December 31, 2017, compared to the same period in 2016, was primarily due to an increase in SICAV performance fees. Performance fees for UK OEICs and Unit Trusts also increased in the period. These increases are partially offset by $6.3 million of net negative performance fees related to legacy JCG.
For the year ended December 31, 2016, performance fees decreased by $96.0 million compared to 2015, primarily due to lower SICAV fees which for long-only funds typically only pay out a performance fee if relative and absolute performance is positive. Offshore Absolute Return fees decreased by 64.3% in 2016 compared to 2015 primarily due to lower performance fees on pooled hedge funds.
The following table outlines performance fees by product type and includes information on fees earned, number of funds generating performance fees, AUM generating performance fees, number of funds eligible to earn performance fees, AUM with an un-crystalized performance fee, performance fee participation rate, performance fee frequency and performance fee methodology (dollars in millions, except where noted):
|
|
|
|
|
|
|
|
|
Segregated |
|
|
|
|
|
|
| |||||||
|
|
|
|
|
|
|
|
|
Mandates / |
|
|
|
|
|
|
| |||||||
|
|
|
|
|
|
|
|
|
Managed |
|
|
|
|
|
|
| |||||||
|
|
|
|
|
|
|
Offshore |
|
CDO / Private |
|
|
|
|
|
|
| |||||||
|
|
|
|
|
|
|
Absolute |
|
Equity / |
|
|
|
|
|
|
| |||||||
|
|
|
UK OEICs & |
|
|
|
Return |
|
Property / |
|
Investment |
|
Australia |
|
U.S. Mutual |
| |||||||
|
|
|
Unit Trusts |
|
SICAVs |
|
Funds |
|
Other |
|
Trusts |
|
MIS |
|
Funds |
| |||||||
|
|
|
|
|
|
|
|
|
|
|
|
|
|
|
|
| |||||||
|
Performance fees — Year ended December 31, 2017 |
|
$ |
22.8 |
|
$ |
49.2 |
|
$ |
8.2 |
|
$ |
31.4 |
|
$ |
11.8 |
|
$ |
— |
|
$ |
(19.5) |
|
|
Performance fees — Year ended December 31, 2016 |
|
$ |
8.6 |
|
$ |
18.1 |
|
$ |
13.6 |
|
$ |
9.2 |
|
$ |
4.6 |
|
$ |
0.7 |
|
$ |
— |
|
|
Performance fees — Year ended December 31, 2015 |
|
$ |
18.1 |
|
$ |
72.7 |
|
$ |
38.1 |
|
$ |
7.5 |
|
$ |
14.4 |
|
$ |
— |
|
$ |
— |
|
|
Number of funds generating performance fees in FY17 (1) |
|
|
3 |
|
|
18 |
|
|
24 |
|
|
72 |
|
|
5 |
|
|
— |
|
|
13 |
|
|
Number of funds generating performance fees in FY16 (1) |
|
|
3 |
|
|
14 |
|
|
16 |
|
|
14 |
|
|
3 |
|
|
2 |
|
|
— |
|
|
Number of funds generating performance fees in FY15 (1) |
|
|
5 |
|
|
13 |
|
|
22 |
|
|
30 |
|
|
8 |
|
|
— |
|
|
— |
|
|
AUM December 31, 2017 generating FY17 performance fees (in billions) |
|
$ |
3.1 |
|
$ |
11.7 |
|
$ |
1.9 |
|
$ |
36.3 |
|
$ |
2.8 |
|
$ |
— |
|
$ |
43.0 |
|
|
AUM December 31, 2016 generating FY16 performance fees (in billions) |
|
$ |
2.4 |
|
$ |
5.2 |
|
$ |
1.4 |
|
$ |
4.7 |
|
$ |
1.1 |
|
$ |
0.1 |
|
$ |
— |
|
|
AUM December 31, 2015 generating FY15 performance fees (in billions) |
|
$ |
1.9 |
|
$ |
12.4 |
|
$ |
2.3 |
|
$ |
5.7 |
|
$ |
3.1 |
|
$ |
— |
|
$ |
— |
|
|
Number of funds eligible to earn performance fees at December 31, 2017 |
|
|
4 |
|
|
25 |
|
|
21 |
|
|
76 |
|
|
8 |
|
|
2 |
|
|
19 |
|
|
Number of funds eligible to earn performance fees at December 31, 2016 |
|
|
4 |
|
|
26 |
|
|
22 |
|
|
45 |
|
|
8 |
|
|
2 |
|
|
— |
|
|
Number of funds eligible to earn performance fees at December 31, 2015 |
|
|
5 |
|
|
26 |
|
|
29 |
|
|
54 |
|
|
8 |
|
|
2 |
|
|
— |
|
|
AUM December 31, 2017 with an un-crystallized performance fee at December 31, 2017, vesting in 2018 (in billions) (2) |
|
$ |
3.5 |
|
$ |
11.9 |
|
$ |
0.3 |
|
$ |
n/a |
|
$ |
1.8 |
|
$ |
— |
|
$ |
n/a |
|
|
AUM December 31, 2016 with an un-crystallized performance fee at December 31, 2016, vesting in 2017 (in billions) (2) |
|
$ |
2.3 |
|
$ |
3.1 |
|
$ |
1.3 |
|
$ |
n/a |
|
$ |
0.6 |
|
$ |
n/a |
|
$ |
n/a |
|
|
AUM December 31, 2015 with an un-crystallized performance fee at December 31, 2015, vesting in 2016 (in billions) (2) |
|
$ |
1.4 |
|
$ |
7.6 |
|
$ |
1.9 |
|
$ |
n/a |
|
$ |
1.6 |
|
$ |
— |
|
$ |
n/a |
|
|
Performance fee participation rate percentage (3) |
|
15%-20% |
|
10%-20% |
|
10%-20% |
|
5%-28% |
|
15% |
|
15% |
|
+/ – 15% |
| |||||||
|
|
|
|
|
|
|
|
|
Quarterly, |
|
|
|
|
|
|
| |||||||
|
|
|
|
|
Annually |
|
|
|
Semi- |
|
|
|
|
|
|
| |||||||
|
|
|
|
|
and |
|
|
|
Annually and |
|
|
|
Semi- |
|
|
| |||||||
|
Performance fee frequency |
|
Quarterly |
|
Quarterly |
|
Annually |
|
Annually |
|
Annually |
|
Annually |
|
Monthly |
| |||||||
|
|
|
Relative / |
|
|
|
|
|
|
|
|
|
|
|
|
| |||||||
|
|
|
Absolute |
|
Relative |
|
Absolute |
|
|
|
Relative |
|
Relative |
|
Relative |
| |||||||
|
Performance fee methodology (4) |
|
plus HWM |
|
plus HWM |
|
plus HWM |
|
Bespoke |
|
plus HWM |
|
plus HWM |
|
plus HWM |
| |||||||
(1) For Offshore Absolute Return Funds this excludes funds earning a performance fee on redemption and only includes those with a period end crystallization date.
(2) Reflects the total AUM of all funds with a Performance Fee opportunity at any point in the relevant year.
(3) Participation rate reflects JHG’s share of outperformance.
(4) Relative performance is measured versus applicable benchmarks, and is subject to a High Water Mark (HWM) for relevant funds.
Shareowner servicing fees
Shareowner servicing fees are primarily composed of mutual fund servicing fees, such as transfer agent fees. The activity in the year ended December 31, 2017 relates to legacy JCG.
Adoption of updated revenue recognition guidance, particularly relating to principal-agent considerations, will significantly increase shareowner servicing fees in 2018 and onward. The Group anticipates recognizing approximately $97 million in additional shareowner servicing fees on an annualized basis, with a corresponding amount recognized as distribution expenses based on respective annualized figures in 2017. For further discussion, refer to Item 8. Financial Statements and Supplementary Data, Note 3 — Recent Accounting Pronouncements.
Other revenue
Other revenue increased by $25.9 million during the year ended December 31, 2017, compared to the year ended December 31, 2016. Legacy JCG was the largest driver contributing $30.7 million to the year ended December 31, 2017. The increase due to legacy JCG was partially offset by unfavorable foreign currency translation and a $2.4 million reduction in relation to OEIC trading, primarily due to reduced trading in the UK Property Fund.
Other revenue decreased $12.3 million during the year ended December 31, 2016, compared to 2015, of which $10.1 million is due to the adverse impact of translation of non-USD denominated income.
Operating Expenses
|
|
|
Year ended December 31, |
|
2017 vs. |
|
2016 vs. |
| |||||||
|
|
|
2017 |
|
2016 |
|
2015 |
|
2016 |
|
2015 |
| |||
|
|
|
|
|
|
|
|
|
|
|
|
| |||
|
Operating expenses (in millions): |
|
|
|
|
|
|
|
|
|
|
| |||
|
Employee compensation and benefits |
|
$ |
543.3 |
|
$ |
273.5 |
|
$ |
317.1 |
|
98.6 |
% |
(13.7 |
)% |
|
Long-term incentive plans |
|
150.8 |
|
87.5 |
|
85.9 |
|
72.3 |
% |
1.9 |
% | |||
|
Distribution expenses |
|
277.3 |
|
209.1 |
|
235.6 |
|
32.6 |
% |
(11.2 |
)% | |||
|
Investment administration |
|
43.8 |
|
46.2 |
|
48.3 |
|
(5.2 |
)% |
(4.3 |
)% | |||
|
Marketing |
|
31.2 |
|
13.9 |
|
14.2 |
|
124.5 |
% |
(2.1 |
)% | |||
|
General, administrative and occupancy |
|
202.2 |
|
109.8 |
|
113.3 |
|
84.2 |
% |
(3.1 |
)% | |||
|
Depreciation and amortization |
|
52.8 |
|
27.8 |
|
23.4 |
|
89.9 |
% |
18.8 |
% | |||
|
Total operating expenses |
|
$ |
1,301.4 |
|
$ |
767.8 |
|
$ |
837.8 |
|
69.5 |
% |
(8.4 |
)% |
Employee compensation and benefits
During the year ended December 31, 2017, employee compensation and benefits increased $269.8 million compared to the year ended December 31, 2016. This increase was primarily driven by the inclusion of legacy JCG, which contributed $190.9 million to the year ended December 31, 2017. Deal and integration costs of $47.5 million for the year ended December 31, 2017, also contributed to the year-over-year variance. The year ended December 31, 2017 was also impacted by favorable foreign currency translation of $10.7 million.
During the year ended December 31, 2016, employee compensation and benefits decreased $43.6 million, compared to 2015, which was primarily driven by the favorable impact of translation of non-USD denominated expenses of $35.9 million. Fixed staff costs increased by $19.4 million, primarily due to a full-year impact of the Perennial acquisition offset by lower bonus costs of $27.1 million largely reflecting weaker business performance.
Long-term incentive plans
Long-term incentive plans increased $63.3 million during the year ended December 31, 2017, compared to the year ended December 31, 2016. The increase was primarily driven by legacy JCG, which contributed $52.4 million in the year ended December 31, 2017. In addition, deal and integration costs of $17.0 million for the year ended December 31, 2017 contributed to the year-over-year variance. These increases were offset by a $4.4 million decrease in social security expenses, driven by lower vesting outcome for the Long-Term Incentive Plan (“LTIP”) 2014, and vesting of the final Employee Share Ownership Plan (“ESOP”) matching award in the previous year. Favorable foreign currency translation of $3.4 million also benefited the year ended December 31, 2017.
Long-term incentive plans increased by $1.6 million from 2015 to 2016. The increase was primarily due to $11.3 million of higher amortization of bonus deferrals which were in turn a function of increasing bonus awards throughout the last three years. This was partially offset by lower social security costs on award vestings as a result of a decrease in share price and by the favorable impact of translation of non-USD denominated expense of $9.7 million.
Distribution expenses
Distribution expenses are paid to financial intermediaries for the distribution of JHG’s retail investment products and are typically calculated based on the amount of the intermediary sourced AUM. For the year ended December 31, 2017, distribution expenses increased by $68.2 million. The increase was primarily driven by JCG, which contributed $80.4 million in the year ended December 31, 2017. The remaining change for the year ended December 31, 2017, was due to the UK OEIC and SICAV product mix, as discussed in the Management fees section.
For the year ended December 31, 2016, distribution expenses decreased by $26.5 million, which was mainly due to product mix and lower average Retail AUM, partially offset by one-time adjustments.
Adoption of updated revenue recognition guidance, particularly relating to principal-agent considerations, will significantly increase distribution expenses in 2018 and onward. The Group anticipates recognizing approximately $97 million in additional distribution expense on an annualized basis, with a corresponding amount recognized as shareowner services based on respective annualized figures in 2017. For further discussion, refer to Item 8. Financial Statements and Supplementary Data, Note 3 — Recent Accounting Pronouncements.
Investment administration
Investment administration expenses, which represent back-office operations, decreased $2.4 million during the year ended December 31, 2017, compared to the same period in 2016. The decrease was primarily due to favorable foreign currency translation of $1.8 million for the year ended December 31, 2017.
On October 19, 2017, the Group signed an agreement with BNP Paribas which is expected to close in March 2018. Under the agreement, BNP Paribas will assume responsibility for the majority of JHG’s back-office (including fund administration and fund accounting), middle-office and custody functions in the U.S. As a result of the agreement, the Group currently estimates investment administration expense savings of approximately $8 million in 2018.
Marketing
Marketing expenses for the year ended December 31, 2017, increased by $17.3 million, compared to the year ended December 31, 2016. The increase was primarily driven by legacy JCG and
Merger-related costs. Expenses in relation to the Merger increased $5.5 million during the year ended December 31, 2017. Legacy JCG contributed $13.0 million to the year ended December 31, 2017. These increases were partially offset by favorable foreign currency translation for the year ended December 31, 2017.
General, administrative and occupancy
General, administrative and occupancy expenses increased by $92.4 million during the year ended December 31, 2017, compared to the year ended December 31, 2016. Deal and integration costs related to the Merger, including legal and advisory fees, contributed $49.6 million to the year ended December 31, 2017. Legacy JCG (exclusive of deal and integration costs) contributed $56.9 million to the year ended December 31, 2017. The year ended December 31, 2017, benefited from a $6.9 million credit in relation to a sales tax refund dating from April 2013 and a $4.3 million favorable foreign currency translation.
During the year ended December 31, 2016, general, administrative and occupancy decreased by $3.5 million compared to 2015. The Group was impacted by foreign currency translation in the amount of $19.6 million and other favorable variances included one-off legal and professional costs incurred in 2015. This was offset by deal costs associated with the Merger and increases in information technology costs.
In 2018, the Group will begin incurring research costs associated with MiFID II. MiFID II is legislative framework that is intended to strengthen investor protection and improve the functioning of financial markets making them more efficient, resilient and transparent. Currently, the Group’s estimate of 2018 MiFID II research costs is approximately $19 million.
Depreciation and amortization
Depreciation and amortization expense increased by $25.0 million during the year ended December 31, 2017, compared to 2016. This was primarily due to amortization of intangibles recognized as a result of the Merger.
During the year ended December 31, 2016, amortization and depreciation expense increased by $4.4 million compared to 2015, primarily due to the impairment of intangibles in relation to contracts from the disposal of the Volantis UK Small Cap alternative team assets in 2017.
Non-Operating Income and Expenses
|
|
|
Year ended December 31, |
|
2017 vs. |
|
2016 vs. |
| |||||||
|
|
|
2017 |
|
2016 |
|
2015 |
|
2016 |
|
2015 |
| |||
|
|
|
|
|
|
|
|
|
|
|
|
| |||
|
Non-operating income and expenses (in millions): |
|
|
|
|
|
|
|
|
|
|
| |||
|
Interest expense |
|
$ |
(11.9 |
) |
$ |
(6.6 |
) |
$ |
(20.1 |
) |
80.3 |
% |
(67.2 |
)% |
|
Investment gains (losses), net |
|
18.0 |
|
(11.7 |
) |
39.7 |
|
253.8 |
% |
(129.5 |
)% | |||
|
Other non-operating income (expenses), net |
|
(1.0 |
) |
(1.9 |
) |
0.6 |
|
(47.4 |
)% |
416.7 |
% | |||
|
Income tax provision |
|
211.0 |
|
(34.6 |
) |
(6.1 |
) |
709.8 |
% |
467.2 |
% | |||
Interest expense
Interest expense increased by $5.3 million during the year ended December 31, 2017, compared to the year ended December 31, 2016. As a result of the Merger, the Group recognized interest expense on the 0.750% Convertible Senior Notes due 2018 (the “2018 Convertible Notes”) with a principal value of $116.6 million and the 4.875% Senior Notes due 2025 (“2025 Senior Notes”) with a principal value of $300.0 million.
During the year ended December 31, 2016, interest expense decreased by $13.5 million compared to 2015, following the repayment of the 2016 Senior Notes in March 2016 and a favorable translation impact of $2.3 million.
Investment gains (losses), net
The components of investment gains (losses), net for the years ended December 31, 2017, 2016 and 2015, are as follows (in millions):
|
|
|
Year ended December 31, |
|
2017 vs. |
|
2016 vs. |
| |||||||
|
|
|
2017 |
|
2016 |
|
2015 |
|
2016 |
|
2015 |
| |||
|
|
|
|
|
|
|
|
|
|
|
|
| |||
|
Investment gains (losses), net (in millions): |
|
|
|
|
|
|
|
|
|
|
| |||
|
Gain (loss) on investment securities and derivatives |
|
$ |
4.0 |
|
$ |
(12.4 |
) |
$ |
18.3 |
|
(132.3 |
)% |
(167.8 |
)% |
|
Gain on sale of equity method investments |
|
— |
|
— |
|
18.9 |
|
n/m* |
|
n/m* |
| |||
|
Gain on sale of Volantis |
|
10.2 |
|
— |
|
— |
|
n/m* |
|
n/m* |
| |||
|
Other |
|
3.8 |
|
0.7 |
|
2.5 |
|
442.9 |
% |
(72.0 |
)% | |||
|
Investment gains (losses), net |
|
$ |
18.0 |
|
$ |
(11.7 |
) |
$ |
39.7 |
|
253.8 |
% |
(129.5 |
)% |
* n/m — Not meaningful
Investment gains (losses), net improved $29.7 million during the year ended December 31, 2017 compared to 2016. Legacy JCG contributed $1.8 million to the year ended December 31, 2017. The year ended December 31, 2017, was also impacted by the sale of Volantis, which resulted in the recognition of a $10.2 million gain. The remaining variance for the year ended December 31, 2017 is due to fair value adjustments associated with investment securities and derivatives.
Investment gains in 2015 primarily represent a gain on sale of equity method investments of $18.9 million which related to the disposal of the TIAA Henderson Real Estate Limited (“THRE”) joint venture and a gain on sale of available for sale investments of $18.3 million on the disposal of the property fund seed capital investments. In addition in 2016, the Group recorded an unrealized loss on a legacy Asian private equity investment of $17.7 million, mainly as a result of macro-economic issues in India.
Income Tax Provision
The Group’s effective tax rates for the years ended December 31, 2017, 2016 and 2015, are as follows:
|
|
|
Year ended December 31, |
| ||||
|
|
|
2017 |
|
2016 |
|
2015 |
|
|
|
|
|
|
|
|
|
|
|
Effective tax rate |
|
(47.1 |
)% |
16.3 |
% |
1.8 |
% |
On December 22, 2017, the U.S. enacted the Tax Cuts and Jobs Act (the “Act”). The Act includes a number of changes to existing U.S. tax laws that impact JHG, most notably a permanent reduction in the U.S. corporate income tax rate from 35 percent to 21 percent for tax years beginning after December 31, 2017. In accordance with ASC Topic 740, Income Taxes, JHG recognized the income tax effects of the Act in its 2017 financial statements, the reporting period in which the Act was signed into law. As a result of this rate change, JHG’s deferred tax assets and liabilities were revalued to account for the estimated future impact of the lower federal corporate income tax rate. The revaluation resulted in a non-cash tax benefit of $345.4 million. In addition, an estimate of the one-time mandatory tax on earnings of certain foreign subsidiaries that were previously tax deferred of $4.7 million was recorded. These estimates are determined in accordance with recently issued
SEC issued guidance provided in Staff Accounting Bulletin No. 118, Income Tax Accounting Implications of the Tax Cuts and Jobs Act (“SAB 118”) allowing taxpayers to record a reasonable estimate of the impact of the U.S. legislation. In accordance with SAB 118, the actual impact from the Act may vary from the estimated amounts.
The benefit of the Act’s rate change in 2017 is partially offset by the inclusion of the U.S. based JCG entities for the seven months after the Merger at the higher U.S. tax rates than the UK statutory rate, the predominant driver for 2016.
For the year ended December 31, 2016, the Group’s effective tax rate increased to 16.3% from 1.8% for the year ended December 31, 2015. The increase in the effective tax rate was due to a number of 2015 tax benefits that either did not occur in 2016 or did not occur at the same level in 2016 and changes in the Group’s global mix of pre-tax profits and business growth in higher tax jurisdictions.
During 2016, tax legislation enacted in the UK to reduce the corporation tax rate in future years resulted in a $4.0 million net non-cash benefit (2015: $8.1 million benefit) related to the revaluation of certain deferred tax assets and liabilities. The UK corporation tax rate decreased from 20% to 19% with effect from April 1, 2017 and then to 17% with effect from April 1, 2020.
The Group anticipates its annual statutory tax rate will be in the 21% to 23% range in 2018.
Non-GAAP Financial Measures
JHG reports its financial results in accordance with GAAP. However, in the opinion of JHG management, the profitability of the Group and its ongoing operations is best evaluated using additional non-GAAP financial measures. Management uses these performance measures to evaluate the business and adjusted values are consistent with internal management reporting.
JHG pro forma results
The table below reflects the JHG pro forma combined results for the year ended December 31, 2017, as though the Merger had occurred on January 1, 2017.
|
|
|
Year ended |
|
|
|
|
|
|
|
Year ended |
| |||
|
|
|
December 31, |
|
|
|
JCG January |
|
|
|
December 31, |
| |||
|
|
|
2017 — JHG |
|
|
|
2017 — May |
|
|
|
2017 — JHG |
| |||
|
|
|
Statutory |
|
|
|
2017 |
|
|
|
Pro Forma |
| |||
|
|
|
|
|
|
|
|
|
|
|
|
| |||
|
|
|
|
|
|
|
|
|
|
|
|
| |||
|
Revenue: |
|
|
|
|
|
|
|
|
|
|
| |||
|
Management fees |
|
$ |
1,465.1 |
|
|
|
$ |
388.4 |
|
|
|
$ |
1,853.5 |
|
|
Performance fees |
|
103.9 |
|
|
|
(19.2 |
) |
|
|
84.7 |
| |||
|
Shareowner servicing fees |
|
71.5 |
|
|
|
48.2 |
|
|
|
119.7 |
| |||
|
Other revenue |
|
103.2 |
|
|
|
21.5 |
|
|
|
124.7 |
| |||
|
Total revenue |
|
1,743.7 |
|
|
|
438.9 |
|
|
|
2,182.6 |
| |||
|
Operating expenses: |
|
|
|
|
|
|
|
|
|
|
| |||
|
Employee compensation and benefits |
|
543.3 |
|
|
|
155.0 |
|
|
|
698.3 |
| |||
|
Long-term incentive plans |
|
150.8 |
|
|
|
32.0 |
|
|
|
182.8 |
| |||
|
Distribution expenses |
|
277.3 |
|
|
|
57.2 |
|
|
|
334.5 |
| |||
|
Investment administration |
|
43.8 |
|
|
|
— |
|
|
|
43.8 |
| |||
|
Marketing |
|
31.2 |
|
|
|
31.6 |
|
|
|
62.8 |
| |||
|
General, administrative and occupancy |
|
202.2 |
|
|
|
62.3 |
|
|
|
264.5 |
| |||
|
Depreciation and amortization |
|
52.8 |
|
|
|
13.9 |
|
|
|
66.7 |
| |||
|
Total operating expenses |
|
1,301.4 |
|
|
|
352.0 |
|
|
|
1,653.4 |
| |||
|
Operating income |
|
442.3 |
|
|
|
86.9 |
|
|
|
529.2 |
| |||
|
Interest expense |
|
(11.9 |
) |
|
|
(6.8 |
) |
|
|
(18.7 |
) | |||
|
Investment gains, net |
|
18.0 |
|
|
|
1.5 |
|
|
|
19.5 |
| |||
|
Other non-operating (expense) income |
|
(1.0 |
) |
|
|
1.5 |
|
|
|
0.5 |
| |||
|
Income before taxes |
|
447.4 |
|
|
|
83.1 |
|
|
|
530.5 |
| |||
|
Income tax provision |
|
211.0 |
|
|
|
(31.4 |
) |
|
|
179.6 |
| |||
|
Net income |
|
658.4 |
|
|
|
51.7 |
|
|
|
710.1 |
| |||
|
Net (income) attributable to noncontrolling interests |
|
(2.9 |
) |
|
|
(2.6 |
) |
|
|
(5.5 |
) | |||
|
Net income attributable to JHG |
|
$ |
655.5 |
|
|
|
$ |
49.1 |
|
|
|
$ |
704.6 |
|
Alternative performance measures
The following is a reconciliation of pro forma revenue, pro forma operating income, pro forma net income attributable to JHG and pro forma diluted earnings per share to adjusted pro forma revenue, adjusted pro forma operating income, adjusted pro forma net income attributable to JHG and adjusted pro forma diluted earnings per share for the year ended December 31, 2017 (in millions, except per share and operating margin data):
|
|
|
|
Year ended |
| |
|
|
|
|
December 31, |
| |
|
|
|
|
2017 |
| |
|
|
|
|
|
| |
|
|
|
|
|
| |
|
Reconciliation of pro forma revenue to adjusted pro forma revenue |
|
|
|
| |
|
Pro forma revenue |
|
|
$ |
2,182.6 |
|
|
Distribution expenses (1) |
|
|
(334.5 |
) | |
|
Adjusted pro forma revenue |
|
|
$ |
1,848.1 |
|
|
|
|
|
|
|
|
|
Reconciliation of pro forma operating income to adjusted pro forma operating income |
|
|
|
| |
|
Pro forma operating income |
|
|
$ |
529.2 |
|
|
Employee compensation and benefits (2) |
|
|
54.1 |
| |
|
Long-term incentive plans (2) |
|
|
17.6 |
| |
|
Marketing (2) |
|
|
28.9 |
| |
|
General, administrative and occupancy (2) |
|
|
65.8 |
| |
|
Depreciation and amortization (3) |
|
|
36.3 |
| |
|
Adjusted pro forma operating income
|
|
|
$ |
731.9 |
|
|
Pro forma operating margin (4) |
|
|
24.2 |
% | |
|
Adjusted pro forma operating margin (5) |
|
|
39.6 |
% | |
|
Reconciliation of pro forma net income attributable to JHG to adjusted pro forma net income attributable to JHG |
|
|
|
| |
|
Pro forma net income attributable to JHG |
|
|
$ |
704.6 |
|
|
Employee compensation and benefits (2) |
|
|
54.1 |
| |
|
Long-term incentive plans (2) |
|
|
17.6 |
| |
|
Marketing (2) |
|
|
28.9 |
| |
|
General, administrative and occupancy (2) |
|
|
65.8 |
| |
|
Depreciation and amortization (2)(3) |
|
|
36.3 |
| |
|
Interest expense (6) |
|
|
2.7 |
| |
|
Investment gains (losses), net (7) |
|
|
(13.2 |
) | |
|
Other non-operating income (expenses), net (6) |
|
|
1.7 |
| |
|
Income tax provision (8) |
|
|
(394.1 |
) | |
|
Adjusted pro forma net income attributable to JHG |
|
|
504.4 |
| |
|
Less: allocation of earnings to participating stock-based awards |
|
|
(14.2 |
) | |
|
Adjusted pro forma net income attributable to JHG common shareholders |
|
|
$ |
490.2 |
|
|
|
|
|
|
|
|
|
Weighted-average common shares outstanding — diluted (two class) |
|
|
197.9 |
| |
|
Pro forma diluted earnings per share (two class) (9) |
|
|
$ |
3.46 |
|
|
Adjusted pro forma diluted earnings per share (two class) (10) |
|
|
$ |
2.48 |
|
(1) Distribution expenses are paid to financial intermediaries for the distribution of JHG’s investment products. JHG management believes that the deduction of third-party distribution, service and advisory expenses from revenue in the computation of net revenue reflects the nature of these
expenses as revenue-sharing activities, as these costs are passed through to external parties that perform functions on behalf of, and distribute, the Group’s managed AUM.
(2) Adjustments primarily represent deal and integration costs in relation to the Merger, including severance costs, legal costs, consulting fees and write-down of legacy IT systems. JHG management believes these costs do not represent the ongoing operations of the Group.
(3) Investment management contracts have been identified as a separately identifiable intangible asset arising on the acquisition of subsidiaries and businesses. Such contracts are recognized at the net present value of the expected future cash flows arising from the contracts at the date of acquisition. For segregated mandate contracts, the intangible asset is amortized on a straight-line basis over the expected life of the contracts. JHG management believes these non-cash and acquisition-related costs do not represent the ongoing operations of the Group.
(4) Pro forma operating margin is pro forma operating income divided by pro forma revenue.
(5) Adjusted pro forma operating margin is adjusted pro forma operating income divided by adjusted pro forma revenue.
(6) Adjustments primarily represent fair value movements on options issued to Dai-ichi, deferred consideration costs associated with acquisitions prior to the Merger and increased debt expense as a consequence of the fair value uplift on debt due to acquisition accounting. JHG management believes these costs do not represent the ongoing operations of the Group.
(7) Adjustment primarily relates to the gain recognized on disposal of the alternative UK small cap team (“Volantis team”) on April 1, 2017 and adjustments related to deferred consideration costs for prior acquisitions. JHG management believes these gains do not represent the ongoing operation of the Group.
(8) The tax impact of the adjustments is calculated based on the U.S. or foreign statutory tax rate as they relate to each adjustment; certain adjustments are either not taxable or not tax-deductible. In addition, the adjustment includes the impact of U.S. tax legislation passed in December 2017.
(9) Pro forma diluted earnings per share is pro forma net income attributable to JHG common shareholders divided by weighted-average diluted common shares outstanding.
(10) Adjusted pro forma diluted earnings per share is adjusted pro forma net income attributable to JHG common shareholders divided by weighted-average diluted common shares outstanding.
Liquidity and Capital Resources
JHG’s capital structure, together with available cash balances, cash flows generated from operations, and further capital and credit market activities, if necessary, should provide the Group with sufficient resources to meet present and future cash needs, including operating and other obligations as they fall due and anticipated future capital requirements.
The following table summarizes key balance sheet data relating to JHG’s liquidity and capital resources as of December 31, 2017 and 2016 (in millions):
|
|
|
Year ended |
| ||||
|
|
|
December 31, |
| ||||
|
|
|
2017 |
|
2016 |
| ||
|
|
|
|
|
|
| ||
|
Cash and cash equivalents held by the Group |
|
$ |
754.2 |
|
$ |
279.0 |
|
|
Investment securities held by the Group |
|
$ |
280.4 |
|
$ |
79.6 |
|
|
Fees and other receivables |
|
$ |
419.6 |
|
$ |
165.5 |
|
|
Debt |
|
$ |
379.2 |
|
$ |
— |
|
Cash and cash equivalents consist primarily of cash at banks held in money market funds. Cash and cash equivalents held by consolidated variable interest entities (‘‘VIEs’’) and consolidated voting rights entities (‘‘VREs’’) are not available for general corporate purposes and have been excluded from the table above.
Investment securities held by the Group represents seeded investment products (exclusive of consolidated VIEs and VREs), investments related to deferred compensation plans and other less significant investments.
The Group believes that existing cash and cash from operations should be sufficient to satisfy its short-term capital requirements. Expected short-term uses of cash include ordinary operating expenditures, seed capital investments, 2018 Convertible Notes principal, interest and redemption payments, dividend payments, income tax payments, contingent consideration payments, defined benefit pension plan contributions and integration costs in relation to the Merger. JHG may also use available cash for other general corporate purposes and acquisitions.
Cash Flows
A summary of cash flow data for the years ended December 31, 2017, 2016 and 2015, is as follows (in millions):
|
|
|
Year ended December 31, |
| |||||||
|
|
|
2017 |
|
2016 |
|
2015 |
| |||
|
|
|
|
|
|
|
|
| |||
|
Cash flows provided by (used for): |
|
|
|
|
|
|
| |||
|
Operating activities |
|
$ |
444.1 |
|
$ |
235.1 |
|
$ |
388.9 |
|
|
Investing activities |
|
519.5 |
|
(108.3 |
) |
56.8 |
| |||
|
Financing activities |
|
(504.7 |
) |
(338.6 |
) |
(221.5 |
) | |||
|
Effect of exchange rate changes on cash and cash equivalents |
|
12.1 |
|
(48.7 |
) |
(19.0 |
) | |||
|
Net change in cash and cash equivalents |
|
471.0 |
|
(260.5 |
) |
205.2 |
| |||
|
Cash balance at beginning of year |
|
323.2 |
|
583.7 |
|
378.5 |
| |||
|
Cash balance at end of year |
|
$ |
794.2 |
|
$ |
323.2 |
|
$ |
583.7 |
|
Operating Activities
Fluctuations in operating cash flows are attributable to changes in net income and working capital items, which can vary from period to period based on the amount and timing of cash receipts and payments.
Investing Activities
Cash provided by (used for) investing activities for the years ended December 31, 2017, 2016 and 2015, is as follows (in millions):
|
|
|
Year ended December 31, |
| |||||||
|
|
|
2017 |
|
2016 |
|
2015 |
| |||
|
|
|
|
|
|
|
|
| |||
|
Cash acquired from acquisition of JCG |
|
$ |
417.2 |
|
$ |
— |
|
$ |
— |
|
|
Acquisition of subsidiaries, net of cash acquired |
|
— |
|
— |
|
(57.8 |
) | |||
|
Proceeds from: |
|
|
|
|
|
|
| |||
|
Investment securities — VIEs, net |
|
122.4 |
|
— |
|
— |
| |||
|
Investment securities — seed capital, net |
|
26.5 |
|
31.6 |
|
14.9 |
| |||
|
Purchases of: |
|
|
|
|
|
|
| |||
|
Investment securities — VIEs, net |
|
— |
|
(76.6 |
) |
(9.3 |
) | |||
|
Property, equipment and software |
|
(17.7 |
) |
(14.2 |
) |
(12.1 |
) | |||
|
Investment income received by consolidated funds |
|
7.9 |
|
6.5 |
|
— |
| |||
|
Cash movement on deconsolidation of consolidated funds |
|
(11.2 |
) |
(8.4 |
) |
— |
| |||
|
Net cash paid on settled hedges |
|
(23.7 |
) |
(47.9 |
) |
— |
| |||
|
Proceeds from sale of interests in equity-method investments |
|
— |
|
— |
|
122.7 |
| |||
|
Other |
|
(1.9 |
) |
0.7 |
|
(1.6 |
) | |||
|
Cash provided by (used for) investing activities |
|
$ |
519.5 |
|
$ |
(108.3 |
) |
$ |
56.8 |
|
Cash inflows from investing activities in 2017 were primarily driven by the Group acquiring cash of $417.2 million in respect of the Merger, along with the Group receiving proceeds from disposal of investments within consolidated VIEs of $122.4 million and redemptions of seed capital investment securities of $26.5 million. JHG periodically adds new investment strategies to its investment product offerings by providing the initial cash investment or seeding. The primary purpose of seeded investment products is to generate an investment performance track record in a product to attract third-party investors. JHG may redeem invested seed capital for a variety of reasons, including when third-party investments in the relevant product are sufficient to sustain the investment strategy. These increases are partially offset by net cash paid to settle derivatives used in JHG’s economic hedge program, and purchases of property, equipment and software.
In 2016, the Group’s consolidated VIEs purchased investment securities of $76.6 million and paid $47.9 million on settled hedges, offset by the proceeds of disposal of seed capital investment securities of $31.6 million. In 2015, the Group received $122.7 million from the sale of the Group’s investment in THRE; this was partially offset by $57.8 million of cash outflows in respect of consideration paid for the acquisitions of Perennial and 90 West.
Financing Activities
Cash used for financing activities for the years ended December 31, 2017, 2016 and 2015, is as follows (in millions):
|
|
|
Year ended December 31, |
| |||||||
|
|
|
2017 |
|
2016 |
|
2015 |
| |||
|
|
|
|
|
|
|
|
| |||
|
Proceeds from settlement of convertible note hedge |
|
$ |
59.3 |
|
$ |
— |
|
$ |
— |
|
|
Settlement of stock warrant |
|
(47.8 |
) |
— |
|
— |
| |||
|
Proceeds from issuance of options |
|
25.7 |
|
— |
|
— |
| |||
|
Proceeds from stock-based compensation plans |
|
6.0 |
|
11.0 |
|
15.6 |
| |||
|
Purchase of common stock for stock-based compensation plans |
|
(52.1 |
) |
(54.3 |
) |
(96.3 |
) | |||
|
Dividends paid to shareholders |
|
(256.0 |
) |
(157.5 |
) |
(161.0 |
) | |||
|
Repurchase of common stock as part of share repurchase program |
|
— |
|
— |
|
(38.2 |
) | |||
|
Repayment of long-term debt |
|
(92.5 |
) |
(203.4 |
) |
— |
| |||
|
Third-party sales (redemptions) in consolidated seeded investment products, net |
|
(141.4 |
) |
65.6 |
|
58.4 |
| |||
|
Other |
|
(5.9 |
) |
— |
|
— |
| |||
|
|
|
|
|
|
|
|
| |||
|
Cash used for financing activities |
|
$ |
(504.7 |
) |
$ |
(338.6 |
) |
$ |
(221.5 |
) |
Cash outflows from financing activities in 2017 were primarily due to $256.0 million of dividends paid to JHG shareholders, third-party redemptions in consolidated seeded investment products of $141.4 million and payments of $92.5 million to satisfy early conversion notices in relation to the 2018 Convertible Notes. Settlement of the conversion notices, which included principal and the conversion feature, were wholly settled in cash.
Other Sources of Liquidity
At December 31, 2017, JHG had a $200 million, unsecured, revolving credit facility (“Credit Facility”) with Bank of America Merrill Lynch International Limited, as coordinator, book runner and mandated lead arranger. The Credit Facility includes an option for JHG to request an increase to the overall amount of the Credit Facility of up to an additional $50.0 million. The Credit Facility had a maturity date of February 16, 2022, with two one-year extension options that can be exercised at the discretion of JHG with the lender’s consent on the first and second anniversary of the date of the agreement, respectively. On the first anniversary of the date of the agreement, the Group exercised the option to extend the term of the Credit Facility by one year. The revised maturity date of the Credit Facility is February 16, 2023.
The Credit Facility became effective on the Closing Date and may be used for general corporate purposes. The Credit Facility bears interest on borrowings outstanding at the relevant interbank offer rate plus a spread.
The Credit Facility contains a financial covenant with respect to leverage. The financing leverage ratio cannot exceed 3.00x EBITDA. At the latest practicable date before the date of this report, JHG was in compliance with all covenants and there were no borrowings under the Credit Facility.
Regulatory Capital
JHG is subject to regulatory oversight by the SEC, FINRA, the U.S. CFTC, the FCA and other international regulatory bodies. The Group ensures it is compliant with its regulatory obligations at all
times. The Group’s main capital requirement relates to the FCA-supervised regulatory group (a sub-group of JHG), comprising Henderson Group Holdings Asset Management Limited, all of its subsidiaries and Janus Capital International Limited (“JCIL”). JCIL is included on the basis of an Article 134 relationship under the Banking Consolidation Directive. The combined capital requirement is £275.3 million ($372.4 million), resulting in capital above the regulatory group’s regulatory requirement of £44.1 million ($59.7 million) as of December 31, 2017, based upon internal calculations and excluding unaudited current period profits. Capital requirements in other jurisdictions are not significant.
Contractual Obligations
The following table presents contractual obligations and associated maturities at December 31, 2017 (in millions):
|
|
|
Less than |
|
|
|
|
|
More than |
| ||||
|
|
|
1 year |
|
1 to 3 years |
|
3 to 5 years |
|
5 years |
| ||||
|
|
|
|
|
|
|
|
|
|
| ||||
|
Debt |
|
$ |
97.6 |
|
$ |
— |
|
$ |
— |
|
$ |
300.0 |
|
|
Interest payments |
|
14.7 |
|
29.3 |
|
29.3 |
|
37.7 |
| ||||
|
Capital leases |
|
1.3 |
|
1.8 |
|
— |
|
— |
| ||||
|
Operating leases |
|
34.5 |
|
59.1 |
|
50.8 |
|
84.5 |
| ||||
|
|
|
|
|
|
|
|
|
|
| ||||
|
Total |
|
$ |
148.1 |
|
$ |
90.2 |
|
$ |
80.1 |
|
$ |
422.2 |
|
Debt maturing in less than one year represents the fair value of the liability and equity components of the 2018 Convertible Notes as of December 31, 2017. Debt maturing in more than five years represents the principal value of the 2025 Senior Notes.
Short-Term Liquidity Requirements
Convertible Notes
Upon closing of the Merger, JHG fully and unconditionally guaranteed the obligations of JCG under its 2018 Convertible Notes, which pay interest at 0.750% semiannually on January 15 and July 15 of each year and mature on July 15, 2018.
Holders of the 2018 Convertible Notes may convert the notes during a particular calendar quarter if the last reported sale price of JHG’s common stock is greater than or equal to 130% of the applicable conversion price for at least 20 trading days during a period of 30 consecutive trading days ending on the last trading day of the preceding quarter. As of January 1, 2018, the 2018 Convertible Notes met the conversion criteria and are convertible during the first quarter of 2018 at a conversion rate of 45.1535 shares of JHG common stock per $1,000 principal amount of the 2018 Convertible Notes, which is equivalent to a conversion price of approximately $22.15 per share of common stock.
During the year ended December 31, 2017, $59.1 million of principal was redeemed and settled with $92.5 million of cash. As of December 31, 2017, the remaining principal value of the 2018 Convertible Notes was $57.5 million. During the period from January 1, 2018 to February 22, 2018, an additional $22.5 million in principal was redeemed and settled with cash for a total cash outlay of $39.1 million, and additional conversion notices amounting to $25.4 million in principal had been received. JHG intends to settle the conversion notices with cash during the first quarter of 2018.
Options Sold to Dai-Ichi
On the Closing Date of the Merger, JHG sold 20 tranches of conditional options to Dai-ichi Life Holdings Inc. (“Dai-ichi”), with each tranche allowing Dai-ichi to purchase 500,000 JHG ordinary
shares at a strike price of £29.972 per share (the terms of such options having been adjusted in accordance with the terms of the Dai-ichi Option Agreement to take account of the effect of the share consolidation). Refer to Note 2 — Summary of Significant Accounting Policies for additional information on the share consolidation. The cash consideration received for the options was £19.8 million ($25.7 million). As of December 31, 2017, the fair value of the options was $26.1 million. The options can be exercised by Dai-ichi during the period from the Closing Date of the Merger until October 3, 2018.
Common Stock Purchases
Some of the Group’s executives and employees receive rights over JHG ordinary shares as part of their remuneration arrangements and employee entitlements. These entitlements may be satisfied either by the transfer of existing ordinary shares acquired on-market or by the issue of ordinary shares. See Part 2, Item 5, Market for Registrant’s Common Equity, Related Stockholder Matters and Issuer Purchases of Equity Securities — Common Stock Purchases.
At the Annual General Meeting held on April 26, 2017, shareholders authorized JHG to make on-market purchases of up to 10% of the issued share capital of the Group at completion of the Merger. Shareholders will be asked to renew this authority at the 2018 Annual General Meeting. The Group did not make any on-market or off-market share purchases during 2017 in connection with any share buy-back program and as of the date of this report, there were no current on-market or off-market buy-backs of the Group’s securities.
Dividends
The payment of cash dividends is within the discretion of the Group’s Board of Directors and depends on many factors, including, but not limited to, the Group’s results of operations, financial condition, capital requirements, general business conditions and legal requirements. From the Closing Date, the Group intends to declare dividends quarterly in USD. Prior to this, the Group declared dividends in GBP on a semi-annual basis, with an extraordinary first quarter 2017 dividend declared on April 19, 2017.
Dividends declared and paid during the year ended December 31, 2017, representing the final 2016 and quarterly 2017 dividends were:
|
Dividend |
|
|
|
Dividends paid |
|
|
| ||
|
per share |
|
Date declared |
|
(in millions) |
|
Date paid |
| ||
|
|
|
|
|
|
|
|
|
| |
|
£ |
0.0730 |
|
February 9, 2017 |
|
$ |
102.6 |
|
May 19, 2017 |
|
|
£ |
0.0185 |
|
April 19, 2017 |
|
$ |
26.0 |
|
May 19, 2017 |
|
|
$ |
0.3200 |
|
August 7, 2017 |
|
$ |
63.7 |
|
September 1, 2017 |
|
|
$ |
0.3200 |
|
November 8, 2017 |
|
$ |
63.7 |
|
December 1, 2017 |
|
On February 5, 2018, JHG’s Board of Directors declared a fourth quarter 2017 cash dividend of $0.32 per share. The dividend will be paid on March 2, 2018, to shareholders of record at the close of business on February 16, 2018.The Board of Directors will review the numerous factors mentioned above when determining the first quarter 2018 dividend.
Long-Term Liquidity Requirements
Expected long-term commitments as of December 31, 2017, include principal and interest payments related to the 2025 Senior Notes, operating and capital lease payments, defined benefit pension plan contributions, Perkins and Intech senior profits interests awards, Intech appreciation rights and phantom interests, Intech non-controlling interests and contingent consideration related to the acquisitions of Geneva, Perennial, VelocityShares and Kapstream. JHG expects to fund its long-term
commitments with existing cash, cash generated from operations or by accessing capital and credit markets as necessary.
2025 Senior Notes
Upon closing of the Merger, JHG fully and unconditionally guaranteed JCG’s obligations under its 2025 Senior Notes. The 2025 Senior Notes have a principal of $300.0 million principal in issue, which pay interest at 4.875% semiannually on February 1 and August 1 of each year, and mature on August 1, 2025.
Perkins Senior Profits Interests Awards
Perkins became a wholly owned subsidiary of the Group as a result of the Merger.
On November 18, 2013, Perkins granted senior profits interests awards designed to retain and incentivize key employees to grow the business. These awards fully vest on December 31, 2018, with the holders entitled to a total of 10% of Perkins’ annual taxable income. The entitlement to a percentage of Perkins’ annual taxable income over the vesting period is tiered and starts at 2% in 2015 and increases 2% each year thereafter until reaching 10% in 2019 after fully vesting on December 31, 2018. In addition, these awards have a formula-driven terminal value based on Perkins’ revenue. JHG can call and terminate any or all of the awards on December 31, 2018, and each year thereafter. Holders of such interests can require JHG to purchase the interests in exchange for the then-applicable formula price on December 31, 2018. The senior profits interests awards are also subject to termination at premiums or discounts to the formula at the option of JHG or certain employees, as applicable, upon certain corporate or employment-related events affecting Perkins or certain employees.
Intech
Intech became a subsidiary of the Group as a result of the Merger.
Intech ownership interests held by a founding member, representing approximately 1.1% aggregate ownership of Intech, provide this founding member with an entitlement to retain his remaining Intech interest until his death and provide the option to require JHG to purchase the ownership interests of Intech at fair value.
Intech has granted long-term incentive awards to retain and incentivize employees. The awards consist of appreciation rights, profits interests and phantom interests, and are designed to give recipients an equity-like stake in Intech. The grant date fair value of the appreciation rights is being amortized on a graded basis over the 10-year vesting period. The awards are exercisable upon termination of employment from Intech to the extent vested. The profits interests and phantom interests awards entitle recipients to 9.2% of Intech’s pre-incentive profits.
Contingent Consideration
The total maximum contingent amount payable related to Perennial and Geneva over the entire contingent consideration period is $47.0 million and $70.4 million, respectively, as of December 31, 2017. For additional details of the contingent consideration in relation to the acquisition of Perennial and Geneva, please refer to Note 9 — Fair Value Measurements.
As a result of the Merger, the Group is also committed to contingent consideration payments in respect of the historic JCG acquisitions of Kapstream and VelocityShares.
The outstanding Kapstream contingent cash consideration in respect to the initial acquisition of a 51% controlling interest is payable in the third quarter of 2018 if certain Kapstream AUM reach defined targets as of July 1, 2018. As of December 31, 2017, the total maximum payment remaining is $4.1 million.
On January 31, 2017, JCG acquired the remaining 49% voting interest in Kapstream. The transaction included contingent consideration of up to $43.8 million. The contingent consideration will be payable in three equal installments on the first, second and third anniversary dates of the acquisition if certain revenue targets are reached and it is indexed to the performance of the premier share class of the Kapstream Absolute Return Income Fund. On January 31, 2018, the first anniversary of the acquisition, Kapstream reached defined revenue targets and the Group paid $15.3 million in February 2018.
Outstanding contingent cash payments in relation to the historic acquisition of VelocityShares are contingent on certain VelocityShares’ ETPs reaching defined net revenue targets on the third and fourth anniversaries of the acquisition (in November 2017 and November 2018, respectively). VelocityShares ETPs reached defined net revenue targets in November 2017, the third anniversary of the acquisition, and the Group paid contingent consideration of $3.6 million in January 2018. As of December 31, 2017, the remaining maximum payment for the fourth and final contingent consideration payment is $8.0 million.
Defined Benefit Pension Plan
The Group’s latest triennial valuation of its defined benefit pension plan resulted in a deficit on a technical provision’s basis of $39.2 million (£29.0 million). The Group agreed with the trustees of the plan to make contributions of $11.4 million (£8.4 million) per year for four years beginning in 2017 to recover the deficit.
Off-Balance Sheet Arrangements
Other than certain lease agreements, JHG is not party to any off-balance sheet arrangements that may provide, or require the Group to provide, financing, liquidity, market or credit risk support that is not reflected in JHG’s consolidated financial statements. Refer to the contractual obligations table for future obligations associated with operating leases.
CRITICAL ACCOUNTING POLICIES AND ESTIMATES
The Group’s consolidated financial statements and accompanying notes have been prepared in accordance with GAAP. The preparation of financial statements in conformity with GAAP requires management to make estimates and assumptions that affect the reported amounts of assets and liabilities and the disclosure of contingent assets and liabilities at the date of the financial statements, and the reported amounts of revenues and expenses during the reporting periods.
The Group continually evaluates the accounting policies and estimates used to prepare the consolidated financial statements. In general, management’s estimates are based on historical experience, information from third party professionals, as appropriate, and various other assumptions that are believed to be reasonable under current facts and circumstances. Actual results could differ from those estimates made by management. The Group’s critical accounting policies and estimates relate to the areas of investment securities, contingent consideration, goodwill and intangible assets, retirement benefit plans, and income taxes.
Valuation of Investment Securities
The Group records investment securities and classifies them as trading or available-for-sale at fair value. Fair value is generally determined using observable market data based on recent trading activity. Where observable market data is unavailable due to a lack of trading activity, the Group uses internally developed models to estimate fair value and independent third parties to validate assumptions, when appropriate. Estimating fair value requires significant management judgment, including benchmarking to similar instruments with observable market data and applying appropriate discounts that reflect differences between the securities that the Group is valuing and the selected benchmark. Any variation in the assumptions used to approximate fair value could have a material adverse effect on JHG’s Consolidated Balance Sheets and results of operations.
The Group periodically evaluates the carrying value of equity method investments and investment securities classified as available-for-sale for potential impairment. In determining if an impairment exists, the Group considers the duration, extent and circumstances of any decline in fair value. Where a fall in the value of an investment is prolonged or significant, it is considered an indication of impairment.
JHG evaluates the securities in an unrealized loss position in the available-for-sale portfolio for other than temporary impairment (“OTTI”) on the basis of the duration of the decline in value of the security and severity of that decline as well as the Group’s intent and ability to hold these securities for a period of time sufficient to allow for any anticipated recovery in the market value. For equity method investments, if circumstances indicate that an OTTI may exist, the investments are evaluated using market values where available, or the expected future cash flows of the investment.
If it is determined that the impairment on a security is other than temporary, the investment is written down to fair value. An impairment loss equal to the difference between the carrying value of the security and its fair value is recognized as an impairment charge within investment gains (losses), net in JHG’s Consolidated Statements of Comprehensive Income. For available-for-sale investments, any amounts previously recognized in other comprehensive income in respect of cumulative changes in fair value are taken to net income on impairment.
There were no impairment charges recognized on investment securities for the years ended December 31, 2017, 2016 or 2015.
Contingent Consideration
Contingent consideration, resulting from business combinations, is recognized at fair value at the acquisition date as part of the business combination and discounted where the time value of money is material. The determination of the fair value is based on discounted cash flows, with the key assumptions being the probability of meeting each performance target and the discount factor applied. When the contingent consideration meets the definition of a financial liability, it is subsequently remeasured to fair value at each reporting date through net income. Finance charges, where discounting has been applied, are also recognized through net income.
Accounting for Goodwill and Intangible Assets
The recognition and measurement of goodwill and intangible assets requires significant management estimates and judgment, including the valuation and expected life determination in connection with the initial purchase price allocation and the ongoing evaluation for impairment. The judgment exercised by management in arriving at these valuations includes the selection of market growth rates, fund flow assumptions, expected margins and costs.
Goodwill represents the excess of cost over the fair value of the identifiable net assets of acquired companies and is not amortized.
Indefinite-lived intangible assets primarily represent trademarks and investment management agreements. Investment management agreements without a contractual termination date are classified as indefinite lived intangible assets based upon the following: (i) there is no legal or statutory limitation on the contract period to manage these investment products; (ii) the Group expects to, and has the ability to operate these investment products indefinitely; (iii) the investment products have multiple investors and are not reliant on an individual investor or small group of investors for their continued operation; (iv) the current competitive environment does not indicate a finite life; and (v) there is a high likelihood of continued renewal based on historical experience. The assumption that investment management agreements are indefinite-lived assets is reviewed at least annually or more frequently if facts and circumstances indicate that the useful life is no longer indefinite.
Definite-lived intangible assets represent certain other investment management contracts, which are amortized over their estimated lives using the straight line method. The estimated lives of the definite-lived contracts held vary and range from three years to eight years.
Impairment Testing
Indefinite-lived intangible assets are tested for impairment by comparing the fair value of the assets to their recorded values
Goodwill and indefinite-lived intangible assets are tested for impairment annually (or more frequently if changes in circumstances indicate that carrying values may be impaired). The Group may first assess goodwill and indefinite-lived intangible assets for qualitative factors to determine whether it is necessary to perform a quantitative impairment test. The qualitative analysis considers entity-specific and macroeconomic factors and their potential impact on the key assumptions used in the determination of the fair value of the reporting unit or indefinite-lived intangible asset. A quantitative impairment test is performed if the results of the qualitative assessment indicate that it is more likely than not that the fair value of the related reporting unit is less than its carrying value or an indefinite-lived intangible asset is impaired, or if a qualitative assessment is not performed.
The quantitative goodwill impairment test requires goodwill impairments to be measured on the basis of the fair value of the reporting unit relative to the reporting unit’s carrying amount.
The quantitative indefinite-lived intangible assets impairment test compares the fair value of the asset to its carrying value. If the carrying value is higher than the fair value, impairment is recognized in the amount of the difference in values.
The Group performed its annual impairment tests for goodwill and indefinite-lived intangible assets as of October 1, 2017. The Group elected to perform a qualitative assessment of the valuation of goodwill and indefinite-lived intangible assets and concluded it is more likely than not that the fair values of the Group’s reporting unit and the specific intangible assets exceed their carrying values. The Group subsequently monitors market conditions and their potential impact on the assumptions used in the annual tests of fair value to determine whether circumstances have changed that would more likely than not reduce the fair value of the Group’s reporting unit below its carrying value, or indicate that indefinite-lived intangible assets might be impaired. The Group considered, among other things, changes in AUM and weighted-average cost of capital by assessing whether these changes would impact the reasonableness of the assumptions used in impairment tests as of October 1, 2017. The Group also monitored fluctuations of JHG’s common stock per share price to evaluate the Group’s market capitalization relative to the reporting unit as a whole. Subsequent to October 1, 2017, there were no impairments to goodwill or indefinite-lived intangible assets as no events occurred or circumstances changed that would indicate these assets might be impaired.
Definite-lived intangible assets are tested for impairment only when there are indications of impairment. There were no indicators of impairment or impairment charges recognized on definite-lived intangible assets during the years ended December 31, 2017, 2016 or 2015.
Retirement Benefit Plans
The Group provides employees with retirement benefits through both defined benefit and defined contribution plans.
The defined benefit obligation is determined annually by independent qualified actuaries using the projected unit credit method and is measured at the present value of the estimated future cash outflows using a discount rate based on AA rated corporate bond yields of appropriate duration. The plan assets are recognized at fair value. The funded status of the defined benefit pension plan, (the “plan”), being the resulting surplus or deficit of defined benefit assets less liabilities, is recognized in the Consolidated Balance Sheets, net of any taxes that would be deducted at source.
Actuarial gains and losses arise as a result of differences between actual experience and actuarial assumptions. The “10% corridor” method for recognizing actuarial gains and losses has been adopted by the Group. This means that cumulative actuarial gains or losses up to an amount equal to 10% of the higher of the liabilities and the assets of the scheme (the “corridor”) have no immediate impact on net income and are instead recognized through other comprehensive income. Cumulative gains or losses greater than this corridor are amortized to net income over the average remaining future working lifetime of the active members in the plan.
Net periodic benefit cost is recorded as a component of net income in the Consolidated Statements of Comprehensive Income and includes service cost, interest cost and the expected return on plan assets.
The costs of, and period end obligations under, defined benefit pension plans are determined using actuarial valuations. The actuarial valuation involves making a number of assumptions including those related to the discount rate, the expected rate of return on assets, future salary increases, mortality rates and future pension increases. Due to the long-term nature of these plans, such estimates are subject to significant uncertainty.
The below table shows the movement in funded status that would result from certain sensitivity changes (in millions):
|
|
|
Decrease in |
| |||
|
|
|
funded status at |
| |||
|
|
|
December 31, 2017 |
| |||
|
|
|
|
| |||
|
Discount rate: – 0.1% |
|
|
$ |
(13.6) |
|
|
|
Inflation: +0.1% |
|
|
$ |
(4.1) |
|
|
|
Life expectancy: +1 year at age 65 |
|
|
$ |
(21.6) |
|
|
|
Market value of return seeking portfolio falls 25% |
|
|
$ |
(48.7) |
|
|
Income Taxes
The Group operates in several countries, states and other taxing jurisdictions through various subsidiaries and branches, and must allocate income, expenses and earnings under the various laws and regulations of each of these taxing jurisdictions. Accordingly, the provision for income taxes represents the total estimate of the liability that the Group has incurred for doing business each year in all of the locations. Annually the Group files tax returns that represent filing positions within each jurisdiction and settles return liabilities. Each jurisdiction has the right to audit those returns and may take different positions with respect to income and expense allocations and taxable earnings determinations. Because the determinations of the annual provisions are subject to judgments and
estimates, it is possible that actual results will vary from those recognized in the Consolidated Financial Statements. As a result, it is likely that additions to, or reductions of, income tax expense will occur each year for prior reporting periods as actual tax returns and tax audits are settled.
In the assessment of uncertain tax positions, significant management judgment is required to estimate the range of possible outcomes and determine the probability, on a more likely than not basis, of favorable or unfavorable tax outcomes and the potential interest and penalties related to such unfavorable outcomes. Actual future tax consequences on settlement of the Group’s uncertain tax positions may be materially different to management’s current estimates.
Deferred tax assets, net of any associated valuation allowance, have been recognized based on management’s belief that taxable income of the appropriate character, more likely than not, will be sufficient to realize the benefits of these assets over time. In the event that actual results differ from expectations, or if historical trends of positive operating income changes, the Group may be required to record a valuation allowance on some or all of these deferred tax assets, which may have a significant effect on the financial condition and results of operations of the Group. In assessing whether a valuation allowance should be established against a deferred income tax asset, the Group considers the nature, frequency and severity of recent losses, forecasts of future profitability, the duration of statutory carryback and carryforward periods, among other factors.
ITEM 7A. QUANTITATIVE AND QUALITATIVE DISCLOSURES ABOUT MARKET RISK
The following information describes the key aspects of certain items for which the Group is exposed to market risk.
Management Fees
Management fee revenues are generally based upon a percentage of the market value of AUM and are calculated as a percentage of either the daily, month end or quarter end average asset balance in accordance with contractual agreements. Accordingly, fluctuations in the financial markets have a direct effect on the Group’s operating results. Although fluctuations in the financial markets have a direct effect on the Group’s operating results, AUM may outperform or underperform the financial markets. As such, quantifying the impact of correlation between AUM and the Group’s operating results may be misleading.
Performance Fees
Performance fee revenue is derived from a number of funds and clients. As a result, the Group’s revenues are subject to volatility beyond market based fluctuations discussed in the management fees section above. Performance fees are specified in certain fund and clients contracts and are based on investment performance either on an absolute basis or compared to an established index over a specified period of time. This is often subject to a hurdle rate. Performance fees are recognized at the end of the contractual period (typically monthly, quarterly or annually) if the stated performance criteria are achieved. The Group’s performance fees are dependent on internal performance and market trends and will therefore be subject to year on year volatility. The Group recognized performance fees of $103.9 million, $54.8 million and $150.8 million for the years ended December 31, 2017, 2016 and 2015, respectively. At December 31, 2017 and 2016, $64.8 billion and $36.6 billion of AUM were subject to performance fees, respectively.
Investment Securities
At December 31, 2017, the Group was exposed to market price risk as a result of investment securities on its Consolidated Balance Sheet. The following is a summary of the effect that a
hypothetical 10% increase or decrease in market prices would have on JHG’s investment securities subject to market price fluctuations as of December 31, 2017 (in millions):
|
|
|
|
|
Fair value |
|
Fair value |
| |||||||
|
|
|
|
|
assuming a 10% |
|
assuming a 10% |
| |||||||
|
|
|
Fair value |
|
increase |
|
decrease |
| |||||||
|
|
|
|
|
|
|
|
| |||||||
|
Investment securities: |
|
|
|
|
|
|
| |||||||
|
Trading |
|
$ |
678.1 |
|
|
$ |
745.9 |
|
|
|
$ |
610.3 |
|
|
|
Available-for-sale |
|
22.0 |
|
|
|
24.2 |
|
|
|
|
19.8 |
|
| |
|
Total investment securities |
|
$ |
700.1 |
|
|
$ |
770.1 |
|
|
|
$ |
630.1 |
|
|
Certain investment securities include debt securities that contribute to the achievement of defined investment objectives. Debt securities are exposed to interest rate risk and credit risk. Movement in interest rates would be reflected in the value of the securities; refer to the quantitative analysis above.
Derivative Instruments
The Group maintains an economic hedge program that uses derivative instruments to mitigate market volatility of certain seeded investments. Market fluctuations are mitigated using derivative instruments including futures, credit default swaps, index swaps and total return swaps. The Group also operates a rolling program of foreign currency forward contracts to mitigate the non-functional currency exposures arising from certain seed capital investments. The Group was party to the following derivative instruments as of December 31, 2017 and 2016 (in millions):
|
|
|
December 31, 2017 |
|
December 31, 2016 |
| ||||||||
|
|
|
Notional |
|
Fair |
|
Notional |
|
Fair |
| ||||
|
|
|
value |
|
value |
|
value |
|
value |
| ||||
|
|
|
|
|
|
|
|
|
|
| ||||
|
Futures |
|
$ |
190.6 |
|
$ |
(1.3 |
) |
$ |
14.7 |
|
$ |
— |
|
|
Credit default swaps |
|
$ |
117.5 |
|
$ |
(3.0 |
) |
$ |
— |
|
$ |
— |
|
|
Index swaps |
|
$ |
76.7 |
|
$ |
(2.1 |
) |
$ |
34.2 |
|
$ |
(0.8 |
) |
|
Total return swaps |
|
$ |
70.3 |
|
$ |
(1.0 |
) |
$ |
59.5 |
|
$ |
(1.1 |
) |
|
Foreign currency forward contacts |
|
$ |
118.8 |
|
$ |
(1.8 |
) |
$ |
170.1 |
|
$ |
(3.2 |
) |
Changes in fair value of derivative instruments are recognized in investment gains (losses), net in JHG’s Consolidated Statements of Comprehensive Income. Changes in fair value of foreign currency forward contracts designated as hedges for accounting purposes are recognized in accumulated other comprehensive income under net investment hedge accounting.
Foreign Currency Exchange Sensitivity
Foreign currency risk is the risk that the Group will sustain losses through adverse movements in foreign currency exchange rates, where the Group transacts in currencies different to an entity’s functional currency.
As the Group’s functional currency is USD, the Group is exposed to foreign currency risk through its exposure to non-USD income, expenses, assets and liabilities of its overseas subsidiaries as well as net assets and liabilities denominated in a currency other than USD. The currency exposure is managed by monitoring foreign currency positions. The Group uses foreign currency forward contracts to reduce or eliminate the currency exposure on certain individual transactions. The Group also seeks to use natural hedges to reduce exposure. Where there is a mismatch on material currency flows and the timing is reasonably certain, the positions are actively hedged.
The following table illustrates the impact of the below currencies weakening by 10% on all unhedged financial assets and liabilities denominated in currencies material to the Group other than USD (in millions):
|
|
|
December 31, 2017 |
|
December 31, 2016 |
| ||||||||
|
|
|
|
|
Other |
|
|
|
Other |
| ||||
|
|
|
|
|
comprehensive |
|
|
|
comprehensive |
| ||||
|
|
|
Net income |
|
income |
|
Net income |
|
income |
| ||||
|
|
|
attributable to |
|
attributable to |
|
attributable to |
|
attributable to |
| ||||
|
|
|
JHG |
|
JHG |
|
JHG |
|
JHG |
| ||||
|
|
|
|
|
|
|
|
|
|
| ||||
|
Great British pound |
|
$ |
(19.5) |
|
$ |
150.0 |
|
$ |
— |
|
$ |
— |
|
|
Singapore dollar |
|
$ |
(0.2) |
|
$ |
2.6 |
|
$ |
(0.1) |
|
$ |
2.2 |
|
|
Australian dollar |
|
$ |
— |
|
$ |
30.0 |
|
$ |
2.6 |
|
$ |
(0.7) |
|
|
Japanese yen |
|
$ |
0.4 |
|
$ |
0.4 |
|
$ |
(0.3) |
|
$ |
0.4 |
|
|
Euro |
|
$ |
16.4 |
|
$ |
2.0 |
|
$ |
(17.6) |
|
$ |
1.9 |
|
|
USD |
|
$ |
— |
|
$ |
— |
|
$ |
17.2 |
|
$ |
5.8 |
|
Amounts as of December 31, 2016 are based on the Group having a functional currency of GBP during the year.
ITEM 8. FINANCIAL STATEMENTS AND SUPPLEMENTARY DATA
Index to Financial Statements
|
|
Page |
|
Financial Statements: |
|
|
Reports of Independent Registered Public Accounting Firm — PricewaterhouseCoopers LLP |
60 |
|
Consolidated Balance Sheets as of December 31, 2017 and 2016 |
61 |
|
Consolidated Statements of Comprehensive Income for the Years Ended December 31, 2017, 2016 and 2015 |
62 |
|
Consolidated Statements of Cash Flows for the Years Ended December 31, 2017, 2016 and 2015 |
63 |
|
Consolidated Statements of Changes in Equity for the Years Ended December 31, 2017, 2016 and 2015 |
64 |
|
Notes to Consolidated Financial Statements |
65 |
|
|
|
|
Financial Statement Schedules: |
|
|
All schedules are omitted because they are not applicable or are insignificant, or the required information is shown in the consolidated financial statements or notes thereto. |
|

REPORT OF INDEPENDENT REGISTERED PUBLIC ACCOUNTING FIRM
To the Board of Directors and Shareholders of Janus Henderson Group plc
Opinion on the Financial Statements
We have audited the accompanying consolidated balance sheets of Janus Henderson Group plc and its subsidiaries as of December 31, 2017 and December 31, 2016, and the related consolidated statements of comprehensive income, consolidated statements of cash flows, and consolidated statements of changes in equity for each of the three years in the period ended December 31, 2017, including the related notes (collectively referred to as the ‘‘consolidated financial statements’’). In our opinion, the consolidated financial statements present fairly, in all material respects, the financial position of the Company as of December 31, 2017 and December 31, 2016, and the results of their operations and their cash flows for each of the three years in the period ended December 31, 2017 in conformity with accounting principles generally accepted in the United States of America.
Basis for Opinion
These consolidated financial statements are the responsibility of the Company’s management. Our responsibility is to express an opinion on the Company’s consolidated financial statements based on our audits. We are a public accounting firm registered with the Public Company Accounting Oversight Board (United States) (“PCAOB”) and are required to be independent with respect to the Company in accordance with the U.S. federal securities laws and the applicable rules and regulations of the Securities and Exchange Commission and the PCAOB.
We conducted our audits of these consolidated financial statements in accordance with the standards of the PCAOB. Those standards require that we plan and perform the audit to obtain reasonable assurance about whether the consolidated financial statements are free of material misstatement, whether due to error or fraud.
Our audits included performing procedures to assess the risks of material misstatement of the consolidated financial statements, whether due to error or fraud, and performing procedures that respond to those risks. Such procedures included examining, on a test basis, evidence regarding the amounts and disclosures in the consolidated financial statements. Our audits also included evaluating the accounting principles used and significant estimates made by management, as well as evaluating the overall presentation of the consolidated financial statements. We believe that our audits provide a reasonable basis for our opinion.
/s/ PricewaterhouseCoopers LLP
London, UK
27 February 2018
We have served as the Company’s auditor since 2014.
JANUS HENDERSON GROUP PLC
CONSOLIDATED BALANCE SHEETS
(Dollars in Millions, Except Share Data)
|
|
|
December 31, |
|
December 31, | ||||||
|
|
|
2017 |
|
|
2016 |
| ||||
|
|
|
|
|
|
|
|
|
|
|
|
|
ASSETS |
|
|
|
|
|
|
|
|
|
|
|
Current assets: |
|
|
|
|
|
|
|
|
|
|
|
Cash and cash equivalents |
|
|
$ |
760.1 |
|
|
|
$ |
279.0 |
|
|
Investment securities |
|
|
|
280.4 |
|
|
|
|
79.6 |
|
|
Fees and other receivables |
|
|
|
419.6 |
|
|
|
|
165.5 |
|
|
OEIC and unit trust receivables |
|
|
|
239.9 |
|
|
|
|
142.1 |
|
|
Assets of consolidated VIEs: |
|
|
|
|
|
|
|
|
|
|
|
Cash and cash equivalents |
|
|
|
34.1 |
|
|
|
|
44.2 |
|
|
Investment securities |
|
|
|
419.7 |
|
|
|
|
313.7 |
|
|
Other current assets |
|
|
|
12.9 |
|
|
|
|
8.1 |
|
|
Other current assets |
|
|
|
75.9 |
|
|
|
|
28.5 |
|
|
Total current assets |
|
|
|
2,242.6 |
|
|
|
|
1,060.7 |
|
|
Non-current assets: |
|
|
|
|
|
|
|
|
|
|
|
Property, equipment and software, net |
|
|
|
70.6 |
|
|
|
|
41.2 |
|
|
Intangible assets, net |
|
|
|
3,204.8 |
|
|
|
|
401.3 |
|
|
Goodwill |
|
|
|
1,533.9 |
|
|
|
|
741.5 |
|
|
Retirement benefit asset, net |
|
|
|
199.3 |
|
|
|
|
180.2 |
|
|
Other non-current assets |
|
|
|
21.5 |
|
|
|
|
8.5 |
|
|
Total assets |
|
|
$ |
7,272.7 |
|
|
|
$ |
2,433.4 |
|
|
LIABILITIES |
|
|
|
|
|
|
|
|
|
|
|
Current liabilities: |
|
|
|
|
|
|
|
|
|
|
|
Accounts payable and accrued liabilities |
|
|
$ |
292.9 |
|
|
|
$ |
141.7 |
|
|
Current portion of accrued compensation, benefits and staff costs |
|
|
|
398.7 |
|
|
|
|
147.0 |
|
|
Current portion of long-term debt |
|
|
|
57.2 |
|
|
|
|
— |
|
|
OEIC and unit trust payables |
|
|
|
234.8 |
|
|
|
|
137.9 |
|
|
Liabilities of consolidated VIEs: |
|
|
|
|
|
|
|
|
|
|
|
Accounts payable and accrued liabilities |
|
|
|
21.5 |
|
|
|
|
26.2 |
|
|
Total current liabilities |
|
|
|
1,005.1 |
|
|
|
|
452.8 |
|
|
Non-current liabilities: |
|
|
|
|
|
|
|
|
|
|
|
Accrued compensation, benefits and staff costs |
|
|
|
23.0 |
|
|
|
|
8.7 |
|
|
Long-term debt |
|
|
|
322.0 |
|
|
|
|
— |
|
|
Deferred tax liabilities, net |
|
|
|
752.6 |
|
|
|
|
70.7 |
|
|
Retirement benefit obligations, net |
|
|
|
4.6 |
|
|
|
|
11.9 |
|
|
Other non-current liabilities |
|
|
|
99.6 |
|
|
|
|
39.0 |
|
|
Total liabilities |
|
|
|
2,206.9 |
|
|
|
|
583.1 |
|
|
Commitments and contingencies (See Note 18) |
|
|
|
|
|
|
|
|
|
|
|
REDEEMABLE NONCONTROLLING INTERESTS |
|
|
|
190.3 |
|
|
|
|
158.0 |
|
|
EQUITY |
|
|
|
|
|
|
|
|
|
|
|
Common stock ($1.50 par and £0.125 par, 480,000,000 and 2,194,910,776 shares authorized; 200,406,138 and 1,131,842,109 shares issued and outstanding, respectively) |
|
|
|
300.6 |
|
|
|
|
234.4 |
|
|
Additional paid-in-capital |
|
|
|
3,842.9 |
|
|
|
|
1,237.9 |
|
|
Treasury shares (4,071,284 and 38,848,749 shares held, respectively) |
|
|
|
(155.8 |
) |
|
|
|
(155.1 |
) |
|
Accumulated other comprehensive loss, net of tax |
|
|
|
(301.8 |
) |
|
|
|
(434.5 |
) |
|
Retained earnings |
|
|
|
1,151.4 |
|
|
|
|
764.8 |
|
|
Total shareholders’ equity |
|
|
|
4,837.3 |
|
|
|
|
1,647.5 |
|
|
Nonredeemable noncontrolling interests |
|
|
|
38.2 |
|
|
|
|
44.8 |
|
|
Total equity |
|
|
|
4,875.5 |
|
|
|
|
1,692.3 |
|
|
Total liabilities, redeemable noncontrolling interests and equity |
|
|
$ |
7,272.7 |
|
|
|
$ |
2,433.4 |
|
The accompanying notes are an integral part of these consolidated financial statements.
JANUS HENDERSON GROUP PLC
CONSOLIDATED STATEMENTS OF COMPREHENSIVE INCOME
(Dollars in Millions, Except per Share Data)
|
|
|
Year ended December 31, |
| |||||||
|
|
|
2017 |
|
2016 |
|
2015 |
| |||
|
|
|
|
|
|
|
|
|
|
|
|
|
Revenue: |
|
|
|
|
|
|
|
|
|
|
|
Management fees |
|
$ |
1,465.1 |
|
$ |
867.8 |
|
$ |
914.7 |
|
|
Performance fees |
|
|
103.9 |
|
|
54.8 |
|
|
150.8 |
|
|
Shareowner servicing fees |
|
|
71.5 |
|
|
— |
|
|
— |
|
|
Other revenue |
|
|
103.2 |
|
|
77.3 |
|
|
89.6 |
|
|
Total revenue |
|
|
1,743.7 |
|
|
999.9 |
|
|
1,155.1 |
|
|
Operating expenses: |
|
|
|
|
|
|
|
|
|
|
|
Employee compensation and benefits |
|
|
543.3 |
|
|
273.5 |
|
|
317.1 |
|
|
Long-term incentive plans |
|
|
150.8 |
|
|
87.5 |
|
|
85.9 |
|
|
Distribution expenses |
|
|
277.3 |
|
|
209.1 |
|
|
235.6 |
|
|
Investment administration |
|
|
43.8 |
|
|
46.2 |
|
|
48.3 |
|
|
Marketing |
|
|
31.2 |
|
|
13.9 |
|
|
14.2 |
|
|
General, administrative and occupancy |
|
|
202.2 |
|
|
109.8 |
|
|
113.3 |
|
|
Depreciation and amortization |
|
|
52.8 |
|
|
27.8 |
|
|
23.4 |
|
|
Total operating expenses |
|
|
1,301.4 |
|
|
767.8 |
|
|
837.8 |
|
|
Operating income |
|
|
442.3 |
|
|
232.1 |
|
|
317.3 |
|
|
Interest expense |
|
|
(11.9 |
) |
|
(6.6 |
) |
|
(20.1 |
) |
|
Investment gains (losses), net |
|
|
18.0 |
|
|
(11.7 |
) |
|
39.7 |
|
|
Other non-operating income (expenses), net |
|
|
(1.0 |
) |
|
(1.9 |
) |
|
0.6 |
|
|
Income before taxes |
|
|
447.4 |
|
|
211.9 |
|
|
337.5 |
|
|
Income tax provision |
|
|
211.0 |
|
|
(34.6 |
) |
|
(6.1 |
) |
|
Net income |
|
|
658.4 |
|
|
177.3 |
|
|
331.4 |
|
|
Net loss (income) attributable to noncontrolling interests |
|
|
(2.9 |
) |
|
11.7 |
|
|
(1.6 |
) |
|
Net income attributable to JHG |
|
$ |
655.5 |
|
$ |
189.0 |
|
$ |
329.8 |
|
|
Earnings per share attributable to JHG common shareholders: |
|
|
|
|
|
|
|
|
|
|
|
Basic |
|
$ |
3.97 |
|
$ |
1.69 |
|
$ |
2.93 |
|
|
Diluted |
|
$ |
3.93 |
|
$ |
1.66 |
|
$ |
2.78 |
|
|
Other comprehensive income (loss), net of tax: |
|
|
|
|
|
|
|
|
|
|
|
Foreign currency translation gains (losses) |
|
$ |
125.0 |
|
$ |
(247.1 |
) |
$ |
(94.5 |
) |
|
Net unrealized losses on available-for-sale securities |
|
|
(2.0 |
) |
|
(0.4 |
) |
|
(13.3 |
) |
|
Actuarial gains (losses) |
|
|
(11.1 |
) |
|
15.0 |
|
|
(0.7 |
) |
|
Other comprehensive income (loss), net of tax |
|
|
111.9 |
|
|
(232.5 |
) |
|
(108.5 |
) |
|
Other comprehensive loss (income) attributable to noncontrolling interests |
|
|
20.8 |
|
|
(12.4 |
) |
|
0.4 |
|
|
Other comprehensive income (loss) attributable to JHG |
|
$ |
132.7 |
|
$ |
(244.9 |
) |
$ |
(108.1 |
) |
|
Total comprehensive income (loss) |
|
$ |
770.3 |
|
$ |
(55.2 |
) |
$ |
222.9 |
|
|
Total comprehensive loss (income) attributable to noncontrolling interests |
|
|
17.9 |
|
|
(0.7 |
) |
|
(1.2 |
) |
|
Total comprehensive income (loss) attributable to JHG |
|
$ |
788.2 |
|
$ |
(55.9 |
) |
$ |
221.7 |
|
The accompanying notes are an integral part of these consolidated financial statements.
JANUS HENDERSON GROUP PLC
CONSOLIDATED STATEMENTS OF CASH FLOWS
(Dollars in Millions)
|
|
|
Year ended December 31, |
| |||||||
|
|
|
2017 |
|
2016 |
|
2015 |
| |||
|
|
|
|
|
|
|
|
| |||
|
CASH FLOWS PROVIDED BY (USED FOR): |
|
|
|
|
|
|
| |||
|
Operating activities: |
|
|
|
|
|
|
| |||
|
Net income |
|
$ |
658.4 |
|
$ |
177.3 |
|
$ |
331.4 |
|
|
Adjustments to reconcile net income to net cash provided by operating activities: |
|
|
|
|
|
|
| |||
|
Depreciation and amortization |
|
52.8 |
|
27.8 |
|
23.4 |
| |||
|
Deferred income taxes |
|
(355.6 |
) |
2.0 |
|
(8.1 |
) | |||
|
Stock-based compensation plan expense |
|
67.4 |
|
37.3 |
|
43.6 |
| |||
|
Gains (losses) from equity-method investments, net |
|
0.6 |
|
3.1 |
|
(17.9 |
) | |||
|
Investment gains (losses), net |
|
(18.0 |
) |
(1.2 |
) |
(16.8 |
) | |||
|
Contributions to pension plans in excess of costs recognized |
|
(20.9 |
) |
(4.6 |
) |
(3.7 |
) | |||
|
Other, net |
|
7.2 |
|
18.1 |
|
2.3 |
| |||
|
Changes in operating assets and liabilities: |
|
|
|
|
|
|
| |||
|
OEIC and unit trust receivables and payables |
|
(0.9 |
) |
(4.4 |
) |
— |
| |||
|
Other assets |
|
(117.8 |
) |
(6.1 |
) |
43.8 |
| |||
|
Other accruals and liabilities |
|
170.9 |
|
(14.2 |
) |
(9.1 |
) | |||
|
Net operating activities |
|
444.1 |
|
235.1 |
|
388.9 |
| |||
|
Investing activities: |
|
|
|
|
|
|
| |||
|
Cash acquired from acquisition of JCG |
|
417.2 |
|
— |
|
— |
| |||
|
Acquisition of subsidiaries, net of cash acquired |
|
— |
|
— |
|
(57.8 |
) | |||
|
Proceeds from: |
|
|
|
|
|
|
| |||
|
Investment securities — VIEs, net |
|
122.4 |
|
— |
|
— |
| |||
|
Investment securities — seed capital, net |
|
26.5 |
|
31.6 |
|
14.9 |
| |||
|
Purchases of: |
|
|
|
|
|
|
| |||
|
Investment securities — VIEs, net |
|
— |
|
(76.6 |
) |
(9.3 |
) | |||
|
Property, equipment and software |
|
(17.7 |
) |
(14.2 |
) |
(12.1 |
) | |||
|
Intangibles |
|
— |
|
— |
|
(4.0 |
) | |||
|
Investment income received by consolidated funds |
|
7.9 |
|
6.5 |
|
— |
| |||
|
Cash movement on deconsolidation of consolidated funds |
|
(11.2 |
) |
(8.4 |
) |
— |
| |||
|
Net cash paid on settled hedges |
|
(23.7 |
) |
(47.9 |
) |
— |
| |||
|
Dividends received from equity-method investments |
|
0.2 |
|
0.7 |
|
2.4 |
| |||
|
Dividends attributable to noncontrolling interests |
|
(2.6 |
) |
— |
|
— |
| |||
|
Proceeds from sale of interests in equity-method investments, net |
|
— |
|
— |
|
122.7 |
| |||
|
Proceeds from sale of Volantis |
|
0.5 |
|
— |
|
— |
| |||
|
Net investing activities |
|
519.5 |
|
(108.3 |
) |
56.8 |
| |||
|
Financing activities: |
|
|
|
|
|
|
| |||
|
Settlement of convertible note hedge |
|
59.3 |
|
— |
|
— |
| |||
|
Settlement of stock warrant |
|
(47.8 |
) |
— |
|
— |
| |||
|
Proceeds from issuance of options |
|
25.7 |
|
— |
|
— |
| |||
|
Proceeds from stock-based compensation plans |
|
6.0 |
|
11.0 |
|
15.6 |
| |||
|
Purchase of common stock for stock-based compensation plans |
|
(52.1 |
) |
(54.3 |
) |
(96.3 |
) | |||
|
Dividends paid to shareholders |
|
(256.0 |
) |
(157.5 |
) |
(161.0 |
) | |||
|
Repurchase of common stock |
|
— |
|
— |
|
(38.2 |
) | |||
|
Repayment of long-term debt |
|
(92.5 |
) |
(203.4 |
) |
— |
| |||
|
Distributions to noncontrolling interests |
|
(5.0 |
) |
— |
|
— |
| |||
|
Third-party sales (redemptions) in consolidated seeded investment products, net |
|
(141.4 |
) |
65.6 |
|
58.4 |
| |||
|
Principal payments under capital lease obligations |
|
(0.9 |
) |
— |
|
— |
| |||
|
Net financing activities |
|
(504.7 |
) |
(338.6 |
) |
(221.5 |
) | |||
|
Cash and cash equivalents: |
|
|
|
|
|
|
| |||
|
Effect of foreign exchange rate changes |
|
12.1 |
|
(48.7 |
) |
(19.0 |
) | |||
|
Net change |
|
471.0 |
|
(260.5 |
) |
205.2 |
| |||
|
At beginning of year |
|
323.2 |
|
583.7 |
|
378.5 |
| |||
|
At end of year |
|
$ |
794.2 |
|
$ |
323.2 |
|
$ |
583.7 |
|
|
Supplemental cash flow information: |
|
|
|
|
|
|
| |||
|
Cash paid for interest |
|
$ |
8.0 |
|
$ |
7.3 |
|
$ |
16.7 |
|
|
Cash paid for income taxes, net of refunds |
|
$ |
113.1 |
|
$ |
40.7 |
|
$ |
14.4 |
|
|
Reconciliation of cash and cash equivalents: |
|
|
|
|
|
|
| |||
|
Cash and cash equivalents |
|
$ |
760.1 |
|
$ |
279.0 |
|
$ |
530.9 |
|
|
Cash and cash equivalents held in consolidated VIEs |
|
34.1 |
|
44.2 |
|
52.8 |
| |||
|
Total cash and cash equivalents |
|
$ |
794.2 |
|
$ |
323.2 |
|
$ |
583.7 |
|
The accompanying notes are an integral part of these consolidated financial statements.
JANUS HENDERSON GROUP PLC
CONSOLIDATED STATEMENTS OF CHANGES IN EQUITY
(Amounts in Millions)
|
|
|
|
|
|
|
|
|
|
|
Accumulated |
|
|
|
|
|
|
|
| ||||||||||
|
|
|
Number |
|
|
|
Additional |
|
|
|
other |
|
|
|
Nonredeemable |
|
|
|
| ||||||||||
|
|
|
of |
|
Common |
|
paid-in |
|
Treasury |
|
comprehensive |
|
Retained |
|
noncontrolling |
|
|
Total |
| ||||||||||
|
|
|
shares |
|
stock |
|
capital |
|
Shares |
|
loss |
|
earnings |
|
interests |
|
|
equity |
| ||||||||||
|
|
|
|
|
|
|
|
|
|
|
|
|
|
|
|
|
|
|
|
|
|
|
|
|
|
| |||
|
Balance at December 31, 2014 |
|
1,139.2 |
|
$ |
235.8 |
|
$ |
1,231.8 |
|
$ |
(156.6 |
) |
|
$ |
(81.5 |
) |
|
$ |
652.0 |
|
|
$ |
42.9 |
|
|
$ |
1,924.4 |
|
|
Net income |
|
— |
|
|
— |
|
|
— |
|
|
— |
|
|
|
— |
|
|
|
329.8 |
|
|
|
1.6 |
|
|
|
331.4 |
|
|
Other comprehensive income (loss) |
|
— |
|
|
— |
|
|
— |
|
|
— |
|
|
|
(108.1 |
) |
|
|
— |
|
|
|
(0.4 |
) |
|
|
(108.5 |
) |
|
Dividends paid to shareholders |
|
— |
|
|
— |
|
|
— |
|
|
— |
|
|
|
— |
|
|
|
(161.0 |
) |
|
|
— |
|
|
|
(161.0 |
) |
|
Purchase of common stock for stock-based compensation plans |
|
— |
|
|
— |
|
|
— |
|
|
(96.3 |
) |
|
|
— |
|
|
|
— |
|
|
|
— |
|
|
|
(96.3 |
) |
|
Vesting of stock-based compensation plans |
|
— |
|
|
— |
|
|
— |
|
|
84.0 |
|
|
|
— |
|
|
|
(84.0 |
) |
|
|
— |
|
|
|
— |
|
|
Issuance of common stock for stock-based compensation plans |
|
1.6 |
|
|
0.3 |
|
|
6.1 |
|
|
(6.4 |
) |
|
|
— |
|
|
|
— |
|
|
|
— |
|
|
|
— |
|
|
Stock-based compensation plan expense |
|
— |
|
|
— |
|
|
— |
|
|
— |
|
|
|
— |
|
|
|
43.6 |
|
|
|
— |
|
|
|
43.6 |
|
|
Proceeds from stock-based compensation plans |
|
— |
|
|
— |
|
|
— |
|
|
— |
|
|
|
— |
|
|
|
15.6 |
|
|
|
— |
|
|
|
15.6 |
|
|
Repurchase of common stock |
|
(9.0 |
) |
|
(1.7 |
) |
|
— |
|
|
— |
|
|
|
— |
|
|
|
(36.5 |
) |
|
|
— |
|
|
|
(38.2 |
) |
|
|
|
|
|
|
|
|
|
|
|
|
|
|
|
|
|
|
|
|
|
|
|
|
|
|
|
|
|
|
|
|
|
|
|
|
|
|
|
|
|
|
|
|
|
|
|
|
|
|
|
|
|
|
|
|
|
|
|
|
|
Balance at December 31, 2015 |
|
1,131.8 |
|
|
234.4 |
|
|
1,237.9 |
|
|
(175.3 |
) |
|
|
(189.6 |
) |
|
|
759.5 |
|
|
|
44.1 |
|
|
|
1,911.0 |
|
|
Net income |
|
— |
|
|
— |
|
|
— |
|
|
— |
|
|
|
— |
|
|
|
189.0 |
|
|
|
(11.7 |
) |
|
|
177.3 |
|
|
Other comprehensive income (loss) |
|
— |
|
|
— |
|
|
— |
|
|
— |
|
|
|
(244.9 |
) |
|
|
— |
|
|
|
12.4 |
|
|
|
(232.5 |
) |
|
Dividends paid to shareholders |
|
— |
|
|
— |
|
|
— |
|
|
— |
|
|
|
— |
|
|
|
(157.5 |
) |
|
|
— |
|
|
|
(157.5 |
) |
|
Purchase of common stock for stock-based compensation plans |
|
— |
|
|
— |
|
|
— |
|
|
(54.3 |
) |
|
|
— |
|
|
|
— |
|
|
|
— |
|
|
|
(54.3 |
) |
|
Vesting of stock-based compensation plans |
|
— |
|
|
— |
|
|
— |
|
|
74.5 |
|
|
|
— |
|
|
|
(74.5 |
) |
|
|
— |
|
|
|
— |
|
|
Stock-based compensation plan expense |
|
— |
|
|
— |
|
|
— |
|
|
— |
|
|
|
— |
|
|
|
37.3 |
|
|
|
— |
|
|
|
37.3 |
|
|
Proceeds from stock-based compensation plans |
|
— |
|
|
— |
|
|
— |
|
|
— |
|
|
|
— |
|
|
|
11.0 |
|
|
|
— |
|
|
|
11.0 |
|
|
|
|
|
|
|
|
|
|
|
|
|
|
|
|
|
|
|
|
|
|
|
|
|
|
|
|
|
|
|
|
|
|
|
|
|
|
|
|
|
|
|
|
|
|
|
|
|
|
|
|
|
|
|
|
|
|
|
|
|
|
Balance at December 31, 2016 |
|
1,131.8 |
|
|
234.4 |
|
|
1,237.9 |
|
|
(155.1 |
) |
|
|
(434.5 |
) |
|
|
764.8 |
|
|
|
44.8 |
|
|
|
1,692.3 |
|
|
Share consolidation |
|
(1,018.6 |
) |
|
— |
|
|
— |
|
|
— |
|
|
|
— |
|
|
|
— |
|
|
|
— |
|
|
|
— |
|
|
Net income |
|
— |
|
|
— |
|
|
— |
|
|
— |
|
|
|
— |
|
|
|
655.5 |
|
|
|
1.5 |
|
|
|
657.0 |
|
|
Other comprehensive income (loss) |
|
— |
|
|
— |
|
|
— |
|
|
— |
|
|
|
132.7 |
|
|
|
— |
|
|
|
(20.8 |
) |
|
|
111.9 |
|
|
Dividends paid to shareholders |
|
— |
|
|
— |
|
|
0.1 |
|
|
— |
|
|
|
— |
|
|
|
(256.0 |
) |
|
|
— |
|
|
|
(255.9 |
) |
|
Distributions to noncontrolling interests |
|
— |
|
|
— |
|
|
— |
|
|
— |
|
|
|
— |
|
|
|
— |
|
|
|
(0.6 |
) |
|
|
(0.6 |
) |
|
Derivative instruments acquired on acquisition |
|
— |
|
|
— |
|
|
31.4 |
|
|
— |
|
|
|
— |
|
|
|
— |
|
|
|
— |
|
|
|
31.4 |
|
|
NCI recognized on acquisition of JCG |
|
— |
|
|
— |
|
|
— |
|
|
— |
|
|
|
— |
|
|
|
— |
|
|
|
13.3 |
|
|
|
13.3 |
|
|
Fair value adjustments to redeemable noncontrolling interests |
|
— |
|
|
— |
|
|
— |
|
|
— |
|
|
|
— |
|
|
|
(0.4 |
) |
|
|
— |
|
|
|
(0.4 |
) |
|
Adjust consideration for post combination services under unvested stock-based compensation plans |
|
— |
|
|
— |
|
|
(51.8 |
) |
|
— |
|
|
|
— |
|
|
|
— |
|
|
|
— |
|
|
|
(51.8 |
) |
|
Redemptions of convertible debt and settlement of derivative instruments |
|
— |
|
|
— |
|
|
(22.3 |
) |
|
— |
|
|
|
— |
|
|
|
— |
|
|
|
— |
|
|
|
(22.3 |
) |
|
Tax impact of convertible debt redemptions and settlement of derivative instruments |
|
— |
|
|
— |
|
|
(2.7 |
) |
|
— |
|
|
|
— |
|
|
|
— |
|
|
|
— |
|
|
|
(2.7 |
) |
|
Purchase of common stock for stock- based compensation plans |
|
— |
|
|
— |
|
|
— |
|
|
(52.1 |
) |
|
|
— |
|
|
|
— |
|
|
|
— |
|
|
|
(52.1 |
) |
|
Issuance of common stock |
|
87.2 |
|
|
130.8 |
|
|
2,551.2 |
|
|
— |
|
|
|
— |
|
|
|
— |
|
|
|
— |
|
|
|
2,682.0 |
|
|
Redenomination and reduction of par value of stock |
|
— |
|
|
(64.6 |
) |
|
64.6 |
|
|
— |
|
|
|
— |
|
|
|
— |
|
|
|
— |
|
|
|
— |
|
|
Vesting of stock-based compensation plans |
|
— |
|
|
— |
|
|
(29.0 |
) |
|
51.4 |
|
|
|
— |
|
|
|
(22.4 |
) |
|
|
— |
|
|
|
— |
|
|
Stock-based compensation plan expense |
|
— |
|
|
— |
|
|
57.5 |
|
|
— |
|
|
|
— |
|
|
|
9.9 |
|
|
|
— |
|
|
|
67.4 |
|
|
Proceeds from stock-based compensation plans |
|
— |
|
|
— |
|
|
6.0 |
|
|
— |
|
|
|
— |
|
|
|
— |
|
|
|
— |
|
|
|
6.0 |
|
|
|
|
|
|
|
|
|
|
|
|
|
|
|
|
|
|
|
|
|
|
|
|
|
|
|
|
|
|
|
|
|
|
|
|
|
|
|
|
|
|
|
|
|
|
|
|
|
|
|
|
|
|
|
|
|
|
|
|
|
|
Balance at December 31, 2017 |
|
200.4 |
|
$ |
300.6 |
|
$ |
3,842.9 |
|
$ |
(155.8 |
) |
|
$ |
(301.8 |
) |
|
$ |
1,151.4 |
|
|
$ |
38.2 |
|
|
$ |
4,875.5 |
|
The accompanying notes are an integral part of these consolidated financial statements.
JANUS HENDERSON GROUP PLC
NOTES TO THE CONSOLIDATED FINANCIAL STATEMENTS
Note 1 — Description of the Business
The Group is an independent global asset manager, specializing in active investment across all major asset classes. JHG actively manages a broad range of investment products for institutional and retail investors across five capabilities: Equities, Quantitative Equities, Fixed Income, Multi-Asset and Alternatives.
On the Closing Date, JCG and Henderson completed the Merger. As a result of the Merger, JCG and its consolidated subsidiaries became subsidiaries of Henderson, which was renamed to Janus Henderson Group plc. See Note 4 — Acquisitions, for more information on the Merger.
JHG is a public limited company incorporated in Jersey, Channel Islands, and is tax resident and domiciled in the UK. JHG’s ordinary shares are traded on the NYSE and the Company’s CDIs are traded on the ASX.
Note 2 — Summary of Significant Accounting Policies
Basis of Presentation
The consolidated financial statements have been prepared according to GAAP. The Group’s consolidated financial statements include all majority owned subsidiaries and consolidated seeded investment products, and intercompany accounts and transactions have been eliminated in consolidation. Events subsequent to the balance sheet date have been evaluated for inclusion in the accompanying consolidated financial statements through the issuance date.
Prior to the Merger, Henderson’s functional currency was GBP. After consideration of numerous factors, such as the denomination of the shares, payment of dividends, and the Group’s main economic environment, management concluded that the post-Merger functional currency of JHG is USD. All values are rounded to the nearest $100,000 USD, except when otherwise indicated.
Certain balances from prior years have been reclassified in order to conform to the current year presentation. This has included reclassifications between line items within the investing cash flow category of the Consolidated Statements of Cash Flows.
Accounting Estimates
The preparation of consolidated financial statements in conformity with GAAP requires management to make estimates and assumptions that affect the reported amounts of assets and liabilities, the disclosure of contingent assets and liabilities at the date of the consolidated financial statements, and the reported amounts of revenues and expenses during the reporting period. Actual results could differ from those estimates and the differences could be material. JHG’s significant estimates relate to investment securities, acquisition accounting, goodwill and intangible assets, retirement benefit assets and obligations, contingent consideration, equity compensation and income taxes.
Segment Information
JHG is a global asset manager and manages a range of investment products, operating across various product lines, distribution channels and geographic regions. However, information is reported to the chief operating decision-makers, the Co-CEOs, on an aggregated basis. Strategic and financial management decisions are determined centrally by the Co-CEOs and, on this basis, the Group operates as a single segment investment management business.
Consolidation of Investment Products
The Group performs periodic consolidation analyses of its seeded investment products to determine if the product is a VIE or a voting rights entity (“VRE”). Factors considered in this assessment include the entity’s legal organization, the entity’s capital structure and equity ownership, and any de facto agent implications of the Group’s involvement with the entity. Investment products that are determined to be VIEs are consolidated if the Group is the primary beneficiary of the entity. VREs are consolidated if the Group holds the majority voting interest. Upon the occurrence of certain events (such as contributions and redemptions, either by JHG or third parties, or amendments to the governing documents of the Group’s investment products), management reviews and reconsiders its previous conclusion regarding the status of an entity as a VIE or a VRE. Additionally, management continually reconsiders whether JHG is considered a VIE’s primary beneficiary, and thus consolidates such entity.
Variable Interest Entities
Certain investment products for which a controlling financial interest is achieved through arrangements that do not involve or are not directly linked to voting interests are considered VIEs. JHG reviews factors, including whether or not (i) the entity has equity that is sufficient to permit it to finance its activities without additional subordinated support from other parties and (ii) the equity holders at risk have the obligation to absorb losses, the right to receive residual returns and the right to direct the activities of the product that most significantly impact the entity’s economic performance, to determine if the investment product is a VIE. The Group re-evaluates such factors as facts and circumstances change.
The Group consolidates a VIE if JHG is the VIE’s primary beneficiary. The primary beneficiary of a VIE is defined as the variable interest holder that has a controlling financial interest in the VIE. A controlling financial interest is defined as (i) the power to direct the activities of the VIE that most significantly impact its economic performance and (ii) the obligation to absorb losses of the entity or the right to receive benefits from the entity that potentially could be significant to the VIE.
JHG is the manager of various types of seeded investment products, which may be considered VIEs. The Group’s involvement in financing the operations of the VIEs is generally limited to its investments in the entities.
VIEs are generally subject to consolidation by the Company at lower ownership percentages compared to the 50% threshold applied to VREs and are also subject to specific disclosure requirements.
Voting Rights Entities
The Group consolidates seeded investment products accounted for as VREs when it is considered to control such products, which generally exists if JHG has a greater than 50% voting equity interest.
Property, Equipment and Software
Property, equipment and software is recorded at cost. Depreciation is recorded using the straight-line method over the estimated useful life of the related assets (or the lease term, if shorter). Depreciation expense totaled $24.6 million, $8.2 million and $7.9 million for the years ended
December 31, 2017, 2016 and 2015, respectively. Property, equipment and software are summarized as follows (in millions):
|
|
|
Depreciation |
|
December 31, |
| ||||
|
|
|
period |
|
2017 |
|
2016 |
| ||
|
|
|
|
|
|
|
|
| ||
|
Furniture, fixtures and computer equipment |
|
3-10 years |
|
$ |
31.9 |
|
$ |
17.5 |
|
|
Leasehold improvements |
|
Over the shorter of 20 years or the period of the lease |
|
29.8 |
|
21.1 |
| ||
|
Computer software |
|
3-7 years |
|
58.3 |
|
35.6 |
| ||
|
Property, equipment and software, gross |
|
|
|
$ |
120.0 |
|
$ |
74.2 |
|
|
Accumulated depreciation |
|
|
|
(49.4 |
) |
(33.0 |
) | ||
|
Property, equipment and software, net |
|
|
|
$ |
70.6 |
|
$ |
41.2 |
|
Internally generated software is recorded at cost and depreciated over its estimated useful life. Internal and external costs incurred in connection with researching or obtaining software for internal use are expensed as incurred during the preliminary project stage, as are training and maintenance costs. Internal and external costs incurred for internal use software during the application development stage are capitalized until such time that the software is substantially complete and ready for its intended use. Application development stage costs are depreciated on a straight-line basis over the estimated useful life of the software.
JHG evaluates its property, equipment and software assets for impairment whenever events or changes in circumstances indicate that the carrying amount of an asset may not be recoverable. The evaluation is based on an estimate of the future cash flows expected to result from the use of the asset and its eventual disposal. If expected future undiscounted cash flows are less than the carrying amount of the asset, an impairment loss is recognized in an amount equal to the excess of the carrying amount of the asset over the fair value of the asset. There were no impairments of property, equipment and software for the years ended December 31, 2017, 2016 and 2015.
Deferred Commissions
Initial sales commissions paid to and received from financial intermediaries on sales of certain wholesale products are deferred and amortized over various periods, not exceeding four years. The amortization period is based on the average expected life of the product on which the commission is received. Deferred commissions are recognized as components of other current assets, and of accounts payable and of accrued liabilities on the Consolidated Balance Sheets.
Equity Method Investments
The Group’s investment in equity method investees, where the Group does not control the investee but can exert significant influence over the financial and operating policies (generally considered to be ownership between 20% and 50%), as well as in joint ventures where there is joint control (and in both cases, where it is not the primary beneficiary of a VIE), are accounted for using the equity method of accounting.
Investments are initially recognized at cost when purchased for cash, or at the fair value of shares received where acquired as part of a wider transaction. The investments are subsequently carried at cost adjusted for the Group’s share of net income or loss and other changes in comprehensive income of the equity method investee, less any dividends or distributions received by the Group. The Consolidated Statements of Comprehensive Income includes the Group’s share of net income or
loss for the year, or period of ownership, if shorter, within other non-operating income (expenses), net.
Financial Instruments
Financial assets are recognized at fair value in the Consolidated Balance Sheets when the Group becomes party to the contractual provisions of an instrument. The fair value recognized is adjusted for transaction costs, except for financial assets classified as trading where transaction costs are recognized immediately in net income. Financial assets are derecognized when the rights to receive cash flows from the investments have expired or where they have been transferred and the Group has also transferred substantially all the risks and reward of ownership.
Purchases and sales of financial assets are recognized at the trade date. Delivery and settlement terms are usually determined by established practices in the market concerned.
Debt securities, equity securities and holdings in pooled funds are designated as either trading or available-for-sale and are measured at subsequent reporting dates at fair value. The Group determines the classification of its financial assets on initial recognition.
Unrealized gains and losses represent the difference between the fair value of the financial asset at the reporting date and cost or, if these have been previously revalued, the fair value at the last reporting date. Realized gains and losses on financial assets are calculated as the difference between the net sales proceeds and cost or amortized cost using the specific identification method.
Financial liabilities, excluding deferred consideration, derivatives, fund deferral liabilities and redeemable noncontrolling interests in consolidated funds which are stated at fair value, are stated at amortized cost using the effective interest rate method. Financial liabilities stated at amortized cost include the Group’s long term debt. Amortized cost is calculated by taking into account any issue costs and any discount or premium on settlement. Financial liabilities cease to be recognized when the obligation under the liability has been discharged or cancelled or has expired.
Trading Securities
Financial assets classified as trading are carried on the Group’s Consolidated Balance Sheets at fair value. These comprise: the Group’s manager box position representing the Group’s holding in various OEICs and unit trusts used to cover any net shortfall in units created or liquidated for clients after the funds are priced; investments in the Group’s fund products held by employee benefit trusts; certain investments in unconsolidated seed capital investments; and certain investments in consolidated funds. Gains and losses arising from changes in the fair value of financial assets classified as trading securities are included within investments gains (losses), net in the Consolidated Statements of Comprehensive Income. Where investments in the Group’s fund products are held against outstanding deferred compensation liabilities, any movement in the fair value of these assets and corresponding movements in the deferred compensation liability are recognized in the Consolidated Statements of Comprehensive Income.
Available-for-Sale Securities
Financial assets classified as available-for-sale consist of certain unconsolidated seed capital investments and certain investments in consolidated funds. Available-for-sale securities are carried at fair value on the Consolidated Balance Sheets, with changes in fair value recorded as a component of other comprehensive income within the Group’s Consolidated Statements of Comprehensive Income until realized. When an asset is disposed of, the cumulative change in fair value, previously recognized in other comprehensive income, is reclassified to net income in the current accounting period.
Seeded Investment Products
The Group periodically adds new investment strategies to its investment product offerings by providing the initial cash investment or “seeding.” The primary purpose of seeded investment products is to generate an investment performance track record in a product to attract third-party investors. JHG’s initial investment in a new product represents 100% ownership in that product. Seeded investment products are initially consolidated and the individual securities within the portfolio are accounted for as trading securities. The change in fair value of seeded investment products is recorded in investment gains (losses), net on JHG’s Consolidated Statements of Comprehensive Income. Noncontrolling interests in seeded investment products represent third-party ownership interests and are part of investment securities on JHG’s Consolidated Balance Sheets. These assets are not available for general corporate purposes and may be redeemed by the third parties at any time.
Refer to the consolidation discussion in this note for information regarding the consolidation of certain seeded investment products.
JHG may redeem invested seed capital for a variety of reasons, including when third-party investments in the relevant product are sufficient to sustain the given investment strategy. The length of time JCG holds a majority interest in a product varies based on a number of factors, including, but not limited to, market demand, market conditions and investment performance.
Investments in Advised Mutual Funds and Investments Related to the Economic Hedging of Deferred Compensation
JHG grants mutual fund share awards to employees that are indexed to certain funds managed by JHG. Upon vesting, participants receive the value of the mutual fund share awards adjusted for gains or losses attributable to the mutual funds to which the award was indexed, subject to tax withholding, or participants receive shares in the mutual fund. When investments in the Group’s fund products are purchased and held against deferred compensation liabilities, any movement in the fair value of the assets and corresponding movements in the deferred compensation liability are recognized in the Consolidated Statements of Comprehensive Income.
The Group maintains deferred compensation plans for certain highly compensated employees and members of its Board of Directors. Eligible participants may defer a portion of their compensation and have the ability to earn a return by indexing their deferrals to mutual funds managed by the Group and its subsidiaries. The Group makes no contributions to the plan. To protect against market variability of the liability, the Group creates an economic hedge by investing in mutual funds that are consistent with the deferred amounts and mutual fund elections of the participants. Such investments remain assets of JHG. Changes in market value of the liability to participants are recognized as long-term incentive compensation in JHG’s Consolidated Statements of Comprehensive Income, and changes in the market value of the mutual fund securities are recognized in investment gains (losses), net on JHG’s Consolidated Statements of Comprehensive Income.
Impairment Evaluation
The Group periodically evaluates the carrying value of equity method investments and investment securities classified as available-for-sale for potential impairment. In determining if an impairment exists, the Group considers the duration, extent and circumstances of any decline in fair value. Where a fall in the value of an investment is prolonged or significant, it is considered an indication of impairment.
The Group evaluates the securities in an unrealized loss position in the available for sale portfolio for OTTI on the basis of the duration of the decline in value of the security and severity of that decline
as well as the Group’s intent and ability to hold these securities for a period of time sufficient to allow for any anticipated recovery in the market value. For equity method investments, if circumstances indicate that an OTTI may exist, the investments are evaluated using market values where available, or the expected future cash flows of the investment.
If it is determined that the impairment on an equity security is other than temporary, the investment is written down to fair value. An impairment loss equal to the difference between the carrying value of the security and its fair value is recognized as an impairment charge within investment gains (losses), net in the Group’s Consolidated Statements of Comprehensive Income. For available-for-sale investments, any amounts previously recognized in other comprehensive income in respect of cumulative changes in fair value are taken to net income on impairment.
No impairment charges were recognized on investment securities for the years ended December 31, 2017, 2016 and 2015.
Trade Receivables
Trade receivables, which generally have 30 day payment terms, are initially recognized at fair value, normally equivalent to the invoice amount. When the time value of money is material, the fair value is discounted. Provision for specific doubtful accounts is made when there is evidence that the Group may not be able to recover balances in full. Balances are written off when the receivable amount is deemed uncollectable.
OEIC and Unit Trust Receivables and Payables
OEIC and unit trust receivables and payables are in relation to the purchase of units/shares (by investors) and the liquidation of units/shares (owned by trustees). The amounts are dependent on the level of trading and fund switches in the four working days leading up to the end of the period. Since they are held with different counterparties, the amounts are presented gross on the Group’s Consolidated Balance Sheets.
Cash and Cash Equivalents
Cash and cash equivalents primarily consist of cash held at banks, on demand deposits, highly liquid short term government securities and investments in money market instruments with a maturity date of three months or less. Cash balances maintained by consolidated VREs are not considered legally restricted and are included in cash and cash equivalents on the Consolidated Balance Sheets. Cash balances held by consolidated VIEs are disclosed separately as a component of assets of consolidated VIEs on the Consolidated Balance Sheets.
Derivative Instruments
The Group may, from time to time, use derivative financial instruments to mitigate price, interest rate, foreign currency and credit risk. The Group does not designate derivative instruments as hedges for accounting purposes, with the exception of certain foreign currency forward contracts used for net investment hedging.
Derivative instruments are measured at fair value and classified as either other current assets or accounts payable and accrued liabilities on the Group’s Consolidated Balance Sheets. Changes in the fair value of derivative instruments are recorded within investment gains (losses), net in the Group’s Consolidated Statements of Comprehensive Income. Changes in fair value of foreign currency forward contracts designated as hedges for accounting purposes are recognized in accumulated other comprehensive income under net investment hedge accounting.
The Group’s consolidated seed investments may also be party to derivative instruments. These derivative instruments are disclosed separately from the Group’s corporate derivative instruments. Refer to Note 6 — Investment Securities.
Noncontrolling Interests and Redeemable Noncontrolling Interests
Noncontrolling interests that are not subject to redemption rights are classified in permanent equity. Redeemable noncontrolling interests are classified outside of permanent equity on the Consolidated Balance Sheets and are measured at the estimated fair value as of the balance sheet date. Noncontrolling interests in consolidated seed investments are classified as redeemable noncontrolling interests where there is an obligation on the fund to repurchase units at the investor’s request. Refer to Note 13 — Noncontrolling Interests for further information.
Fair Value Measurements
Fair value is the price that would be received to sell an asset or transfer a liability in an orderly transaction between market participants at the measurement date. The fair value of financial instruments traded in active markets (such as publicly traded securities and derivatives) is based on quoted market prices at the reporting date. The quoted market price used for financial instruments is the last traded market price for both financial assets and financial liabilities where the last traded price falls within the bid ask spread. In circumstances where the last traded price is not within the bid ask spread, management will determine the point within the bid ask spread that is most representative of fair value current bid price. The fair value of financial instruments that are not traded in an active market is determined using valuation techniques commonly used by market participants, including the use of comparable recent arm’s length transactions, discounted cash flow analysis and option pricing models. Estimating fair value requires significant management judgment, including benchmarking to similar instruments with observable market data and applying appropriate discounts that reflect differences between the securities that the Group is valuing and the selected benchmark.
Measurements of fair value are classified within a hierarchy that prioritizes the inputs to valuation techniques used to measure fair value based on whether the inputs to those valuation techniques are observable or unobservable.
The valuation hierarchy contains three levels:
· Level 1 — Valuation inputs are unadjusted quoted market prices for identical assets or liabilities in active markets.
· Level 2 — Valuation inputs are quoted market prices for identical assets or liabilities in markets that are not active, quoted market prices for similar assets and liabilities in active markets, and other observable inputs directly or indirectly related to the asset or liability being measured.
· Level 3 — Valuation inputs are unobservable and significant to the fair value measurement.
The valuation of an asset or liability may involve inputs from more than one level of the hierarchy. The level in the fair value hierarchy within which a fair value measurement in its entirety falls is determined based on the lowest level input that is significant to the fair value measurement.
Level 1 Fair Value Measurements
JHG’s Level 1 fair value measurements consist mostly of seeded investment products, investments in advised mutual funds, cash equivalents and investments related to deferred compensation plans with quoted market prices in active markets. The fair value level of consolidated seeded investment products is determined by the underlying securities of the product. The fair value level of
unconsolidated seeded investment products is determined using the respective NAV of each product.
Level 2 Fair Value Measurements
JHG’s Level 2 fair value measurements consist mostly of consolidated seeded investment products and JHG’s long-term debt. The fair value of consolidated seeded investment products is determined by the underlying securities of the product. The fair value of JHG’s long-term debt is determined using broker quotes and recent trading activity, which are considered Level 2 inputs.
Level 3 Fair Value Measurements
JHG’s assets and liabilities measured at Level 3 are primarily private equity investments, redeemable noncontrolling interests, contingent deferred consideration and deferred compensation liabilities which are held against investments in the Group’s fund products, where the significant valuation inputs are unobservable.
Private equity investments are valued using a combination of the enterprise value / EBITDA multiple method and the discounted cash flow method. Significant unobservable inputs include discount rates, EBITDA multiple, and price-earnings ratio, taking into account management’s experience and knowledge of market conditions of the specific industries.
The fair value of redeemable noncontrolling interests in consolidated funds is primarily driven by the fair value of the investments in consolidated funds. Details of inputs used to calculate the fair value of contingent deferred consideration can be found in Note 9 — Fair Value Measurements.
Nonrecurring Fair Value Measurements
Nonrecurring Level 3 fair value measurements include goodwill and intangible assets. The Group measures the fair value of goodwill and intangible assets on initial recognition using discounted cash flow analysis that requires assumptions regarding projected future earnings and discount rates. Because of the significance of the unobservable inputs in the fair value measurements of these assets and liabilities, such measurements are classified as Level 3. See the ‘Goodwill and Intangible Assets, net’ accounting policy set forth within Note 2 — Summary of Significant Accounting Policies for further information.
Income Taxes
The Group provides for current tax expense according to the tax laws in each jurisdiction in which it operates, using tax rates and laws that have been enacted by the Balance Sheet date.
Deferred income tax assets and liabilities are recorded for temporary differences between the financial statement and income tax basis of assets and liabilities as measured by the enacted income tax rates that may be in effect when these differences reverse. The effect of changes in tax rates on the Group’s deferred tax assets and liabilities is recognized as income tax within net income in the period that includes the enactment date. Significant management judgment is required in developing the Group’s provision for income taxes, including the valuation allowances that might be required against deferred tax assets and the evaluation of unrecognized tax benefits resulting from uncertain tax positions taken or expected to be taken in a tax return.
The Group periodically assesses the recoverability of its deferred tax assets and the need for valuation allowances on these assets. The Group makes these assessments based on the weight of available evidence regarding possible sources of future taxable income and estimates relating to the future performance of the business that results in taxable income.
In evaluating uncertain tax positions, the Group considers the probability that the tax benefit can be sustained on examination by a taxing authority on the basis of its technical merits (‘the recognition threshold’). For tax positions meeting this threshold, the amount recognized in the financial statements is the benefit expected to be realized upon settlement with the taxing authority on the basis of a cumulative-probability assessment of the possible outcomes. For tax positions not meeting the recognition threshold, no financial statement benefit is recognized. The Group recognizes the accrual of interest and penalties on uncertain tax positions as a component of the income tax provision.
Revenue Recognition
Revenue includes management fees and performance fees, net of rebates. Management fees are recognized in the accounting period in which the associated investment management service is provided. Performance fees for all fund ranges and separate accounts are recognized on crystallization and are therefore accounted for when the prescribed performance hurdles are achieved and it is probable that a fee will be collected as a result. There are no performance fee contracts where revenue can be reversed or clawed back. There are no cumulative revenues recognized that would be reversed if all of the existing investments became worthless.
Management fees are generally based upon a percentage of the market value of AUM and are calculated as a percentage of either the daily, month-end or quarter-end average asset balance in accordance with contractual agreements. Performance fees are specified in certain fund and client contracts and are based on investment performance either on an absolute basis or compared to an established index over a specified period of time. This is often subject to a hurdle rate.
Management fees are primarily received monthly or quarterly while performance fees are usually received monthly, quarterly or annually by the Group, although the frequency of receipt varies between agreements. Management and performance fee revenue not yet received is recognized within fees and other receivables in the Consolidated Balance Sheets.
U.S. Mutual Fund Performance Fees
The investment management fee paid by each U.S. mutual fund subject to a performance fee is the base management fee plus or minus a performance fee adjustment as determined by the relative investment performance of the fund compared to a specified benchmark index. Under the performance-based fee structure, the investment advisory fee paid by each fund consists of two components: (1) a base fee calculated by applying the contractual fixed rate of the advisory fee to the fund’s average daily net assets during the previous month, plus or minus (2) a performance fee adjustment calculated by applying a variable rate of up to 0.15% to the fund’s average daily net assets during the performance measurement period. The performance measurement period begins as a trailing period ranging from 12 to 18 months, and each subsequent month is added to each successive performance measurement period until a 36-month period is achieved. At that point, the measurement period becomes a rolling 36-month period.
When current fund net assets vary from fund net assets over the performance measurement period, the performance fee adjustment, as a percentage of fund current assets, may vary significantly. Under circumstances involving underperformance by a rapidly shrinking fund, the dollar amount of the negative performance fee adjustment could be more than the dollar amount of the positive base fee.
The addition of performance fees to all funds without such fees is subject to the approval of both a majority of the shareholders of such Funds and the Funds’ Independent Board of Trustees.
Commissions
Commissions on management fees are accounted for on an accrual basis and are recognized in the accounting period in which the associated management fee is earned.
Operating Expenses
Operating expenses are accrued and recognized as incurred.
Stock-Based Compensation
The Group issues stock-based awards to employees, all of which are classified as equity settled stock-based payments. Equity settled stock-based payments are measured at the fair value of the shares at the grant date. The awards are expensed, with a corresponding increase in reserves, on either a straight-line basis or a graded basis (depending on vesting conditions) over the vesting period. Forfeitures are recognized as they occur.
The grant date fair value for stock options is determined using the Black-Scholes option pricing model, and the grant date fair value of restricted stock is determined from the market price on the date of grant. The Black-Scholes model requires management to determine certain variables; the assumptions used in the Black-Scholes option pricing model include dividend yield, expected volatility, risk free interest rate and expected life. The dividend yield and expected volatility are determined using historical Group data. The risk free interest rate for options granted is based on the three year UK treasury coupon at the time of the grant. The expected life of the stock options is the same as the service conditions applicable to all Group awards.
The Group generally uses the Monte Carlo model to determine the fair value of performance-based awards. The assumptions used in the Monte Carlo model include dividend yield, share price volatility and discount rate.
The Group had $9.9 million and $37.3 million of stock-based compensation costs and nil and $11.0 million of proceeds from stock-based compensation plans included in retained earnings during the years ended December 31, 2017 and 2016, respectively. Prior to the Group’s Extraordinary General Meeting (“EGM”) on April 26, 2017, the Group’s articles of association did not allow the Group to recognize these items in additional paid-in-capital. A change in the Group’s articles of association was approved at the EGM and from April 26, 2017, all costs in relation to stock-based compensation will be recognized in additional paid-in-capital. The accumulated balance in relation to stock-based compensation plans within retained earnings as of December 31, 2017 and 2016, was $(105.4) million and $(92.9) million, respectively.
Earnings Per Share
Basic earnings per share attributable to JHG shareholders is calculated by dividing net income (adjusted for the allocation of earnings to participating restricted stock awards) by the weighted average number of shares outstanding. JHG has calculated earnings per share using the two class method. There are some participating restricted stock awards which are paid non forfeitable dividends. Under the two class method, net income attributable to JHG is adjusted for the allocation of earnings to participating restricted stock awards.
Diluted earnings per share is calculated in a similar way to basic earnings per share, but is adjusted for the effect of potential common shares unless they are anti-dilutive.
Contingent Consideration
Contingent consideration, resulting from business combinations, is recognized at fair value at the acquisition date as part of the business combination and discounted where the time value of money is material. The determination of the fair value is based on discounted cash flows, with the key assumptions being the probability of meeting each performance target and the discount factor applied. When the contingent consideration meets the definition of a financial liability, it is subsequently remeasured to fair value at each reporting date through net income. Finance charges, where discounting has been applied, are also recognized through net income. See Note 9 — Fair Value Measurement for further information about contingent consideration on acquisitions taking place during the reporting period.
Goodwill and Intangible Assets, Net
Goodwill represents the excess of cost over the fair value of the identifiable net assets of acquired companies and is capitalized in the Consolidated Balance Sheets.
Intangible assets consist primarily of investment management contracts and trademarks acquired as part of business combinations. Investment management contracts have been identified as separately identifiable intangible assets arising on the acquisition of subsidiaries or businesses. Such contracts are recognized at the present value of the expected future cash flows of the investment management contracts at the date of acquisition. Investment management contracts may be classified as either indefinite lived investment management contracts or finite lived client relationships.
Indefinite-lived intangible assets comprise of investment management agreements where the agreements are with investment companies themselves and not with underlying investors. Such contracts are typically renewed indefinitely and therefore the Group considers the contract life to be indefinite and, as a result, the contracts are not amortized. Definite lived intangible assets comprise of investment management agreements where the agreements are with the underlying investor.
Indefinite-lived intangible assets and goodwill are not amortized. Finite-lived client relationships are amortized on a straight-line basis over their remaining useful lives.
Goodwill is reviewed for impairment annually or more frequently if changes in circumstances indicate that the carrying value may be impaired. The Group has determined that it has one reporting unit for goodwill impairment testing purposes, which is consistent with internal management reporting and management’s oversight of operations. The Group may first assess goodwill for qualitative factors to determine whether it is necessary to perform a quantitative impairment test. The qualitative analysis considers entity-specific and macroeconomic factors and their potential impact on the key assumptions used in the determination of the fair value of the reporting unit. A quantitative impairment test is performed if the results of the qualitative assessment indicate that it is more likely than not that the fair value of the related reporting unit is less than its carrying value, or if a qualitative assessment is not performed.
Where the fair value is less than the carrying amount, an impairment is recognized. Any impairment is recognized immediately through net income and cannot subsequently be reversed.
Intangible assets subject to amortization are tested for impairment whenever events or circumstances indicate that the carrying value may not be recoverable and indefinite-lived assets are tested for impairment annually or more frequently if changes in circumstances indicate that the carrying value may be impaired.
Goodwill and intangible assets require significant management estimates and judgment, including the valuation and expected life determination in connection with the initial purchase price allocation and the ongoing evaluation for impairment.
Foreign Currency
Transactions in foreign currencies are recorded at the appropriate exchange rate prevailing at the date of the transaction. Foreign currency monetary balances at the reporting date are converted at the prevailing exchange rate. Foreign currency non-monetary balances carried at fair value or cost are translated at the rates prevailing at the date when the fair value or cost is determined. Gains and losses arising on retranslation are recognized as a component of net income, except for available for sale financial assets where the unhedged changes in fair value are recognized in other comprehensive income.
On consolidation, the assets and liabilities of the Group’s operations whose functional currency is not USD are translated at exchange rates prevailing at the reporting date. Income and expense items are recognized at an average monthly exchange rate. Exchange differences arising, if any, are taken through other comprehensive income to accumulated other comprehensive income. Where net investment hedge accounting is applied using foreign currency forward contracts, the fair value movement on these contracts is also recognized within accumulated other comprehensive income. In the period in which an operation is disposed of, translation differences previously recognized in accumulated other comprehensive income are recognized as a component of net income.
Post Employment Retirement Benefits
The Group provides employees with retirement benefits through both defined benefit and defined contribution plans. The assets of these plans are held separately from the Group’s general assets, in trustee administered funds.
Contributions to the defined contribution plan are expensed to employee compensation and benefits on the Consolidated Statements of Comprehensive Income when they become payable.
Defined benefit obligations and the cost of providing benefits are determined annually by independent qualified actuaries using the projected unit credit method. The Group’s annual measurement date of the defined benefit plan is December 31. The defined benefit obligation is measured as the present value of the estimated future cash outflows using a discount rate based on AA rated corporate bond yields of appropriate duration. The plan assets are recognized at fair value. The funded status of the defined benefit pension plans (the resulting surplus or deficit of defined benefit assets less liabilities) is recognized in the Consolidated Balance Sheets, net of any taxes that would be deducted at source.
Actuarial gains and losses arise as a result of the difference between actual experience and actuarial assumptions. The ‘10% corridor’ method for recognizing actuarial gains and losses has been adopted by the Group. This means that cumulative actuarial gains or losses up to an amount equal to 10% of the higher of the liabilities or assets of the scheme (‘the corridor’) have no immediate impact on net income and are instead recognized through other comprehensive income. Cumulative gains or losses greater than the corridor are amortized to net income over the average remaining future working lifetime of the active members in the plan.
Net periodic benefit cost is recorded as a component of net income in the Consolidated Statements of Comprehensive Income and includes service cost, interest cost, expected return on plan assets and any actuarial gains and losses previously recognized as a component of other comprehensive income which have been amortized in the period. Net periodic benefit costs are recognized as an operating expense.
See Note 15 — Retirement Benefit Plans for further discussion of the Group’s pension plans.
Common Stock
JHG’s common stock, par value $1.50 per share is classified as equity instruments. Equity shares issued by JHG are recorded at the fair value of the proceeds received or the market price on the day of issue. Direct issue costs, net of tax, are deducted from additional paid-in-capital within equity.
Treasury shares held are equity shares of JHG acquired by or issued to employee benefit trusts. Treasury shares held are recorded at cost and are deducted from equity. No gain or loss is recognized in the Consolidated Statements of Comprehensive Income on the purchase, issue, sale or cancellation of JHG’s own equity shares.
Share Redenomination and Consolidation
On April 26, 2017, Henderson redenominated its ordinary shares from GBP to USD, resulting in a change in par value from £0.125 to $0.1547 per share. At that time, Henderson had 1,131,842,110 shares in issue and as a result the ordinary share nominal capital became $175.1 million. The difference between the revised ordinary share nominal capital balance of $175.1 million and the previously stated ordinary share nominal capital balance of $234.4 million (converted at the historic exchange rate rather than the rate required for the redenomination under Jersey company law) was recognized as a component of additional paid-in-capital. Consequently, the additional paid-in-capital balance was adjusted from $1,237.9 million to $1,297.2 million.
Additionally, in accordance with a special resolution passed by the shareholders on May 3, 2017, the par value of the shares of Henderson was reduced to $0.15 per share, from $0.1547 per share, and the total ordinary share nominal capital became $169.8 million. In accordance with that resolution, the reduction in the total ordinary share nominal capital of $5.3 million was credited to the additional paid-in-capital account, which moved from $1,297.2 million to $1,302.5 million.
On April 26, 2017, the shareholders approved a 10-to-1 share consolidation, which took effect on May 30, 2017. As a result of the share consolidation, the number of shares in issue was reduced by a factor of 10, and the par value of the shares became $1.50.
Note 3 — Recent Accounting Pronouncements
Revenue Recognition
In May 2014, the Financial Accounting Standards Board (“FASB”) issued a new revenue recognition standard. The standard’s core principle is that a company will recognize revenue to depict the transfer of goods or services to customers in an amount that reflects the consideration to which the entity expects to be entitled in exchange for those goods or services. In addition, the standard specifies the accounting for certain costs to obtain or fulfill a contract with a customer and expands disclosure requirements for revenue recognition. The revenue standard is effective for annual reporting periods beginning after December 15, 2017, including interim periods within that reporting period. The Company is evaluating the effect of adopting this new accounting standard, including the amending Accounting Standards Update (“ASU”). Management reviewed the terms and conditions of its revenue contracts and does not expect a significant change in the timing of revenue recognition for its management fees, performance fees, servicing fees and its other revenue upon adoption of the new guidance. However, the Group’s evaluation is not complete.
In March 2016, the FASB issued an amendment to its principal-versus-agent guidance in the FASB’s new revenue standard. The key provisions of the amendment are assessing the nature of the entity’s promise to the customer, identifying the specified goods or services, and applying the control principle and indicators of control. The amendment is effective for annual reporting periods beginning
after December 15, 2017, including interim periods within those annual reporting periods. In addition, entities are required to adopt the amendment by using the same transition method they used to adopt the new revenue standard. The Company’s principal-versus-agent assessment focused on treatment of distribution fees collected from mutual fund assets and whether such fees should be reported as revenue (1) on a gross basis or (2) on a net basis, where such fees are reduced by distribution fees paid by the Company to intermediaries. Currently, certain distribution fees are presented on a gross basis, while others are presented on a net basis, with respective presentations dictated by the terms of the underlying distribution agreements. Presentation of distribution fees will be made on a gross basis upon adoption of the accounting guidance. The Company currently expects such presentation to increase annual revenue by approximately $97 million with a corresponding increase in annual expense based on respective annualized figures in 2017. The guidance will be adopted on a retrospective basis. The retrospective basis will require the restatement of prior period revenue and expense amounts, but will not impact operating income or net income figures.
Financial Instruments
In January 2016, the FASB issued amendments to its financial instruments standard, including changes relating to the accounting for equity investments and the presentation and disclosure requirements for financial instruments. Under the amended guidance, all equity investments in unconsolidated entities (other than those accounted for using the equity method of accounting) will generally be measured at fair value through earnings. There will no longer be an available-for-sale classification (changes in fair value reported in other comprehensive income) for equity securities with readily determinable fair values. The amended guidance also requires financial assets and financial liabilities to be presented separately in the notes to the consolidated financial statements, grouped by measurement category (e.g., fair value, amortized cost, lower of cost or market value) and form of financial asset (e.g., loans, securities). The standard is effective for fiscal years beginning after December 15, 2017, including interim periods within those fiscal years.
As of December 31, 2017, the Group has available-for-sale investment securities that have been measured at fair value through other comprehensive income. Upon adoption of the standard in 2018, changes in fair value related to these securities will be recorded to investment gains (losses), net on JHG’s Consolidated Statements of Comprehensive Income. In addition, a cumulative effect adjustment will be recorded to the 2018 retained earnings beginning balance to remove the accumulated balance in other comprehensive income. Adoption of the standard will not have a material impact on JHG’s results of operations or cash flows.
Leases
In February 2016, the FASB issued a new standard on accounting for leases. The new standard represents a significant change to lease accounting and introduces a lessee model that brings most leases on to the balance sheet. The standard also aligns certain of the underlying principles of the new lessor model with those in the FASB’s new revenue recognition standard. Furthermore, the new standard addresses other concerns related to the current leases model. The standard is effective for calendar periods beginning after December 15, 2018. The Group is evaluating the effect of adopting this new accounting standard.
Statement of Cash Flows
In August 2016, the FASB issued an ASU to clarify guidance on the classification of certain cash receipts and cash payments in the statements of cash flows. The FASB issued the ASU with the intent of reducing diversity in practice regarding eight types of cash flows. The ASU is effective for annual reporting periods beginning after December 15, 2017, including interim periods within those
annual reporting periods. Management does not expect the adoption to have a material impact on the Consolidated Statements of Cash Flows.
In November 2016, the FASB issued an ASU to clarify guidance on the classification and presentation of restricted cash in the statements of cash flows. The ASU is effective for annual reporting periods beginning after December 15, 2017, including interim periods within those annual reporting periods. Management does not expect the adoption to have a material impact on the Consolidated Statements of Cash Flows.
Goodwill Impairment Testing
In January 2017, the FASB issued an ASU which simplifies the accounting for goodwill impairments by eliminating step two from the goodwill impairment test. The ASU requires goodwill impairments to be measured on the basis of the fair value of the reporting unit relative to the reporting unit’s carrying amount rather than on the basis of the implied amount of goodwill relative to the goodwill balance of the reporting unit. The ASU is effective for annual and interim impairment tests for periods beginning after December 15, 2021. Early adoption is allowed for annual and interim impairment tests occurring after January 1, 2017. The Group early adopted the guidance effective January 1, 2017, and applied the guidance to its annual impairment tests in 2017.
Hedge Accounting
In August 2017, the FASB issued an ASU that amends hedge accounting. The ASU expands the strategies eligible for hedge accounting, changes how companies assess hedge effectiveness and will require new disclosures and presentation. The ASU is effective on January 1, 2019, for calendar year-end companies; however, early adoption is permitted. The Group is evaluating the effect of adopting this new accounting standard.
Retirement Benefit Plans
In March 2017, the FASB issued an ASU that requires the bifurcation of net periodic pension costs. The service cost component will be presented with other employee compensation costs in operating income, while the other components of net periodic pension costs will be presented separately outside of operations. The guidance is effective for annual reporting periods beginning after December 15, 2017, and interim periods within that reporting period. The Group anticipates reclassifying approximately $2.7 million of other components excluding service costs outside of operating expenses on an annualized basis.
Note 4 — Acquisitions
Merger with JCG
On the Closing Date, pursuant to the Agreement and Plan of Merger dated as of October 3, 2016 (the “Merger Agreement”), by and among JCG, a Delaware corporation, Henderson, a company incorporated in Jersey, and Horizon Orbit Corp., a Delaware corporation and a direct and wholly owned subsidiary of Henderson (“Merger Sub”), Merger Sub merged with and into JCG, with JCG surviving such merger as a direct and wholly owned subsidiary of Henderson. Upon closing of the Merger, Henderson became the parent holding company for the combined group and was renamed Janus Henderson Group plc.
Upon closing of the Merger, holders of JCG common stock received 0.47190 fully paid and non-assessable JHG ordinary shares with a par value of $1.50 per share (the “Ordinary Shares”) for each share of JCG common stock held, plus cash in lieu of any fractional shares based on prevailing market prices. Effective immediately prior to the closing of the Merger, Henderson
implemented a share consolidation of ordinary shares at a ratio of one Ordinary Share (or CDI, as applicable) for every 10 ordinary shares (or CDIs, as applicable) outstanding.
The fair value of consideration transferred to JCG common stockholders was $2,630.2 million, representing 87.2 million shares of JHG transferred at a share price of $30.75 each as of the Closing Date, adjusted for a post-combination stock-based compensation charge for unvested shares in relation to JCG share plans.
The issuance of JHG shares in connection with the Merger was registered under the Securities Act of 1933, as amended, pursuant to JHG’s registration statement on Form F- 4 (File No. 333- 216824) filed with the SEC on March 20, 2017 (the “Registration Statement”).
Fair Values of Assets Acquired and Liabilities Assumed
Preliminary estimates of fair values of the assets acquired and liabilities assumed were based on information available as of the closing of the Merger. The Group evaluated the underlying inputs and assumptions used in its valuations and finalized its purchase price allocation as of December 31, 2017. Certain adjustments were recorded to goodwill, deferred tax liabilities, other non-current liabilities and noncontrolling interests.
The final allocation of the consideration transferred to the assets acquired and liabilities assumed are presented in the following table (in millions):
|
|
|
Preliminary purchase |
|
|
|
|
|
Final purchase |
| |||||||
|
|
|
price allocation |
|
Adjustments |
|
price allocation |
| |||||||||
|
|
|
|
|
|
|
|
| |||||||||
|
Assets: |
|
|
|
|
|
|
| |||||||||
|
Cash and cash equivalents |
|
$ |
417.2 |
|
$ |
— |
|
$ |
417.2 |
| ||||||
|
Investment securities |
|
270.4 |
|
— |
|
270.4 |
| |||||||||
|
Fees and other receivables |
|
133.7 |
|
— |
|
133.7 |
| |||||||||
|
Other current assets, net |
|
119.4 |
|
— |
|
119.4 |
| |||||||||
|
Property, equipment and software |
|
32.3 |
|
— |
|
32.3 |
| |||||||||
|
Intangible assets |
|
2,785.0 |
|
— |
|
2,785.0 |
| |||||||||
|
Goodwill |
|
697.9 |
|
28.6 |
|
726.5 |
| |||||||||
|
Other non-current assets, net |
|
10.6 |
|
|
|
10.6 |
| |||||||||
|
Liabilities: |
|
|
|
|
|
|
| |||||||||
|
Long-term debt |
|
481.8 |
|
— |
|
481.8 |
| |||||||||
|
Deferred tax liabilities |
|
1,025.6 |
|
8.7 |
|
1,034.3 |
| |||||||||
|
Accounts payable and accrued liabilities |
|
243.8 |
|
— |
|
243.8 |
| |||||||||
|
Other non-current liabilities |
|
55.2 |
|
0.8 |
|
56.0 |
| |||||||||
|
Noncontrolling interests |
|
59.4 |
|
(10.4 |
) |
49.0 |
| |||||||||
|
Net assets acquired |
|
$ |
2,600.7 |
|
$ |
29.5 |
|
$ |
2,630.2 |
| ||||||
Goodwill
Goodwill primarily represents the value JHG expects to obtain from growth opportunities and synergies for the combined operations. Goodwill is not deductible for tax purposes.
Intangible Assets
Acquired intangible assets include the value of investment advisory agreements for mutual funds, separate accounts and ETPs. Also included are the values of acquired trademarks, which include trademarks for Janus Capital Management LLC, Intech, Kapstream, Perkins and VelocityShares.
Acquired intangible assets and their weighted-average estimated useful lives are presented in the following table (in millions):
|
|
|
|
|
Useful |
| |
|
|
|
|
|
life (weighted- |
| |
|
|
|
Fair value |
|
average in years) |
| |
|
|
|
|
|
|
| |
|
Investment management contracts: |
|
|
|
|
| |
|
Mutual funds |
|
$ |
2,155.0 |
|
Indefinite |
|
|
Separate accounts |
|
202.0 |
|
15 |
| |
|
ETNs |
|
33.0 |
|
15 |
| |
|
ETFs |
|
14.0 |
|
Indefinite |
| |
|
Trademarks |
|
381.0 |
|
Indefinite |
| |
|
Total |
|
$ |
2,785.0 |
|
|
|
Debt
The fair value of JHG’s debt was valued using broker quotes and recent trading activity, which are considered fair value Level 2 inputs.
The acquired 2018 Convertible Notes may be wholly or partially settled in cash, and thereby the liability and conversion feature components are accounted for separately. The $115.2 million liability component at the Closing Date was determined by discounting future contractual cash flows at a 1.9% rate, which is consistent with the estimated market interest rate for similar senior notes with no conversion option. The liability component will accrete up to the face value of $116.6 million, through interest expense, over the remaining term of the notes. The $42.9 million equity component was determined as the difference between the liability component and the fair value of the 2018 Convertible Notes at the Closing Date.
The 2025 Senior Notes were recorded at their fair value of $323.7 million at the time of the Merger. The 2025 Senior Notes include unamortized debt premium, net at December 31, 2017, of $22.0 million, which will be amortized over the remaining life of the 2025 Senior Notes through interest expense. The unamortized debt premium is recorded as a liability within long-term debt on JHG’s Consolidated Balance Sheets.
Deferred Tax Liabilities, Net
Deferred income taxes primarily relate to deferred income tax balances acquired from JCG and the deferred tax impact of fair value adjustments to the assets and liabilities acquired from JCG, including intangible assets and long-term debt. Deferred income taxes were provisionally estimated based on statutory tax rates in the jurisdictions of the legal entities where the acquired assets and liabilities are taxed. Tax rates used are continually assessed, and updates to deferred income tax estimates are based on any changes to provisional valuations of the related assets and liabilities and refinement of the effective tax rates, which could result in changes to these provisional values.
Pro Forma Results of Operations
The following table presents summarized unaudited supplemental pro forma operating results as if the Merger had occurred at the beginning of each of the periods presented (in millions):
|
|
|
Year ended December 31, |
| |||||||
|
|
|
2017 |
|
2016 |
|
2015 |
| |||
|
|
|
|
|
|
|
|
| |||
|
Revenue |
|
$ |
2,182.6 |
|
$ |
2,010.6 |
|
$ |
2,231.3 |
|
|
Net income attributable to JHG |
|
$ |
704.6 |
|
$ |
336.2 |
|
$ |
485.6 |
|
JCG Results of Operations
Unaudited revenue (inclusive of revenue from certain mandates transferred to JCG from Henderson after the Merger) and net income of JCG from the Closing Date through the end of December 31, 2017, included in JHG’s Consolidated Statements of Comprehensive Income are presented in the following table (in millions):
|
|
|
Closing Date — |
| |||
|
|
|
December 31, 2017 |
| |||
|
|
|
|
|
| ||
|
Revenue |
|
$ |
752.9 |
| ||
|
Net income attributable to JCG |
|
$ |
354.0 |
| ||
Options
On the Closing Date of the Merger, JHG sold 20 tranches of conditional options to Dai-ichi, with each tranche allowing Dai-ichi to purchase 500,000 JHG ordinary shares at a strike price of £29.972 per share (the terms of such options having been adjusted in accordance with the terms of the Dai-ichi Option Agreement to take account of the effect of the share consolidation). The cash consideration received for the options was £19.8 million ($25.7 million). The options can be exercised by Dai-ichi during the period from the Closing Date of the Merger until October 3, 2018. As of December 31, 2017, the fair value of the options was $26.1 million.
Contingent Consideration
Acquisitions prior to the Merger included contingent consideration. Refer to Note 9 — Fair Value Measurements for a detailed discussion of the terms of the contingent consideration.
Note 5 — Consolidation
Variable Interest Entities
Consolidated Variable Interest Entities
JHG’s consolidated VIEs as of December 31, 2017, include certain consolidated seeded investment products in which the Group has an investment and acts as the investment manager. The assets of these VIEs are not available to JHG or the creditors of JHG. JHG may not, under any circumstances, access cash and cash equivalents held by consolidated VIEs to use in its operating activities or otherwise. In addition, the investors in these VIEs have no recourse to the credit of the Group.
Consolidated VIE assets and liabilities, presented after intercompany eliminations, at December 31, 2017 and 2016, are as follows (in millions):
|
|
|
December 31, |
|
December 31, |
| ||||||||
|
|
|
2017 |
|
2016 |
|
| |||||||
|
|
|
|
|
|
| ||||||||
|
Investment securities |
|
$ |
419.7 |
|
$ |
313.7 |
| ||||||
|
Cash and cash equivalents |
|
34.1 |
|
44.2 |
| ||||||||
|
Other current assets |
|
12.9 |
|
8.1 |
| ||||||||
|
Accounts payable and accrued liabilities |
|
(21.5 |
) |
(26.2 |
) | ||||||||
|
|
|
|
|
|
| ||||||||
|
Total |
|
445.2 |
|
339.8 |
| ||||||||
|
Redeemable noncontrolling interests in consolidated VIEs |
|
(168.3 |
) |
(158.0 |
) | ||||||||
|
Nonredeemable noncontrolling interests in consolidated VIEs |
|
(24.9 |
) |
(44.8 |
) | ||||||||
|
JHG’s net interest in consolidated VIEs |
|
$ |
252.0 |
|
$ |
137.0 |
| ||||||
Unconsolidated Variable Interest Entities
At December 31, 2017 and 2016, JHG’s carrying value of investment securities included on the Consolidated Balance Sheets pertaining to unconsolidated VIEs was $6.2 million and nil, respectively. JHG’s total exposure to unconsolidated VIEs represents the value of its economic ownership interest in the investment securities.
Voting Rights Entities
Consolidated Voting Rights Entities
The following table presents the balances related to consolidated VREs that were recorded on JHG’s Consolidated Balance Sheets, including JHG’s net interest in these products (in millions):
|
|
|
December 31, |
|
December 31, |
| ||||||||
|
|
|
2017 |
|
2016 |
|
| |||||||
|
|
|
|
|
|
| ||||||||
|
Investment securities |
|
$ |
18.9 |
|
$ |
5.1 |
| ||||||
|
Cash and cash equivalents |
|
5.9 |
|
— |
| ||||||||
|
Other current assets |
|
0.6 |
|
— |
| ||||||||
|
Accounts payable and accrued liabilities |
|
(2.2 |
) |
— |
| ||||||||
|
Total |
|
23.2 |
|
5.1 |
| ||||||||
|
Redeemable noncontrolling interests in consolidated VREs |
|
(6.6 |
) |
— |
| ||||||||
|
JHG’s net interest in consolidated VREs |
|
$ |
16.6 |
|
$ |
5.1 |
| ||||||
JHG’s total exposure to consolidated VREs represents the value of its economic ownership interest in these seeded investment products. JHG may not, under any circumstances, access cash and cash equivalents held by consolidated VREs to use in its operating activities or for any other purpose.
Unconsolidated Variable Rights Entities
At December 31, 2017 and 2016, JHG’s carrying value of investment securities included on the Consolidated Balance Sheets pertaining to unconsolidated VREs was $50.0 million and $4.9 million, respectively. JHG’s total exposure to unconsolidated VIEs represents the value of its economic ownership interest in the investment securities.
Note 6 — Investment Securities
JHG’s investment securities as of December 31, 2017 and 2016, are summarized as follows (in millions):
|
|
|
December 31, |
| ||||
|
|
|
2017 |
|
2016 |
| ||
|
|
|
|
|
|
| ||
|
Trading securities: |
|
|
|
|
| ||
|
Seeded investment products: |
|
|
|
|
| ||
|
Consolidated VIEs |
|
$ |
402.8 |
|
$ |
288.0 |
|
|
Consolidated VREs |
|
18.9 |
|
5.1 |
| ||
|
Unconsolidated VIEs and VREs |
|
51.1 |
|
4.5 |
| ||
|
Separate accounts |
|
75.6 |
|
— |
| ||
|
Pooled investment funds |
|
27.5 |
|
— |
| ||
|
Total seeded investment products |
|
575.9 |
|
297.6 |
| ||
|
Investments related to deferred compensation plans |
|
94.0 |
|
66.5 |
| ||
|
Other investments |
|
8.2 |
|
3.1 |
| ||
|
|
|
|
|
|
| ||
|
Total trading securities |
|
678.1 |
|
367.2 |
| ||
|
Available-for-sale securities: |
|
|
|
|
| ||
|
Seeded investment products: |
|
|
|
|
| ||
|
Consolidated VIEs |
|
16.9 |
|
25.7 |
| ||
|
Unconsolidated VIEs and VREs |
|
5.1 |
|
0.4 |
| ||
|
Total available-for-sale securities |
|
22.0 |
|
26.1 |
| ||
|
|
|
|
|
|
| ||
|
Total investment securities |
|
$ |
700.1 |
|
$ |
393.3 |
|
Trading Securities
Net unrealized gains (losses) on trading securities held as of December 31, 2017, 2016 and 2015, are summarized as follows (in millions):
|
|
|
Year ended December 31, |
| |||||||
|
|
|
2017 |
|
2016 |
|
2015 |
| |||
|
|
|
|
|
|
|
|
| |||
|
Trading securities still held at period end |
|
$ |
25.2 |
|
$ |
8.4 |
|
$ |
(5.6 |
) |
Available-for-Sale Securities
The following is a summary of available-for-sale securities as of December 31, 2017 and 2016 (in millions):
|
|
|
|
|
Gross |
|
|
|
|
| ||||||||||
|
|
|
|
|
unrealized |
|
Foreign |
|
|
| ||||||||||
|
|
|
|
|
investment |
|
currency |
|
|
| ||||||||||
|
|
|
Cost |
|
Gains |
|
Losses |
|
translation |
|
Fair value |
| ||||||||
|
|
|
|
|
|
|
|
|
|
|
|
| ||||||||
|
December 31, 2017: |
|
|
|
|
|
|
|
|
|
|
| ||||||||
|
Available-for-sale securities |
|
$ |
18.5 |
|
$ |
2.7 |
|
$ |
— |
|
|
$ |
0.8 |
|
|
$ |
22.0 |
|
|
|
December 31, 2016: |
|
|
|
|
|
|
|
|
|
|
|
|
|
|
|
|
| ||
|
Available-for-sale securities |
|
$ |
15.1 |
|
$ |
3.4 |
|
$ |
— |
|
|
$ |
7.6 |
|
|
$ |
26.1 |
|
|
Derivative Instruments
JHG maintains an economic hedge program that uses derivative instruments to hedge against market volatility of certain seeded investments by using index and commodity futures (“futures”), credit default swaps, index swaps and total return swaps (“TRSs”). Certain foreign currency exposures associated with the Group’s seeded investment products are also hedged by using foreign currency forward contracts.
JHG was party to the following derivative instruments as of December 31, 2017 and 2016 (in millions):
|
|
|
Notional Value |
| ||||
|
|
|
December 31, |
|
December 31, | |||
|
|
|
2017 |
|
2016 | |||
|
|
|
|
|
|
|
|
|
|
Futures |
|
$ |
190.6 |
|
$ |
14.7 |
|
|
Credit default swaps |
|
117.5 |
|
— |
| ||
|
Index swaps |
|
76.7 |
|
34.2 |
| ||
|
Total return swaps |
|
70.3 |
|
59.5 |
| ||
|
Foreign currency forward contracts |
|
118.8 |
|
170.1 |
| ||
The derivative instruments are not designated as hedges for accounting purposes, with the exception of foreign currency forward contracts used for net investment hedging. Changes in fair value of the futures, index swaps, TRSs and credit default swaps are recognized in investment gains (losses), net in JHG’s Consolidated Statements of Comprehensive Income. Changes in the fair value of the foreign currency forward contracts designated as hedges for accounting purposes are recognized in other comprehensive income (loss), net of tax on JHG’s Consolidated Statements of Comprehensive Income.
The value of the individual derivative contracts are recognized on a gross basis and included in other current assets or accounts payable and accrued liabilities on the Consolidated Balance Sheets. The Group has entered into netting arrangements with certain counterparties. The impacts of any potential netting are shown below.
The following tables illustrate the effect of offsetting derivative instruments on JHG’s Consolidated Balance Sheets as of December 31, 2017 and 2016 (in millions):
|
|
|
December 31, 2017 | ||||||||||||||||||
|
|
|
|
|
Gross amounts |
|
Gross amounts |
|
|
| |||||||||||
|
|
|
|
|
offset by |
|
offset by |
|
|
| |||||||||||
|
|
|
|
|
derivative |
|
cash collateral |
|
|
| |||||||||||
|
|
|
Gross amounts |
|
instruments |
|
pledged |
|
Net amounts | ||||||||||||
|
|
|
|
|
|
|
|
|
|
| |||||||||||
|
Assets: |
|
|
|
|
|
|
|
|
| |||||||||||
|
Futures |
|
|
$ |
0.9 |
|
|
|
$ |
(0.9 |
) |
|
|
$ |
— |
|
|
|
$ |
— |
|
|
|
|
|
|
|
|
|
|
|
|
|
|
|
|
|
|
|
|
|
|
|
|
Total assets |
|
|
$ |
0.9 |
|
|
|
$ |
(0.9 |
) |
|
|
$ |
— |
|
|
|
$ |
— |
|
|
Liabilities: |
|
|
|
|
|
|
|
|
|
|
|
|
|
|
|
|
|
|
|
|
|
Futures |
|
|
$ |
(2.2 |
) |
|
|
$ |
0.9 |
|
|
|
$ |
— |
|
|
|
$ |
(1.3 |
) |
|
Foreign currency forward contracts |
|
|
|
(1.8 |
) |
|
|
|
— |
|
|
|
|
0.9 |
|
|
|
|
(0.9 |
) |
|
Total return swaps |
|
|
|
(1.0 |
) |
|
|
|
— |
|
|
|
|
1.0 |
|
|
|
|
— |
|
|
Index swaps |
|
|
|
(2.1 |
) |
|
|
|
— |
|
|
|
|
2.1 |
|
|
|
|
— |
|
|
Credit default swaps |
|
|
|
(3.0 |
) |
|
|
|
— |
|
|
|
|
0.9 |
|
|
|
|
(2.1 |
) |
|
Total liabilities |
|
|
$ |
(10.1 |
) |
|
|
$ |
0.9 |
|
|
|
$ |
4.9 |
|
|
|
$ |
(4.3 |
) |
|
|
|
December 31, 2016 | ||||||||||||||||||
|
|
|
|
|
Gross amounts |
|
Gross amounts |
|
|
| |||||||||||
|
|
|
|
|
offset by |
|
offset by |
|
|
| |||||||||||
|
|
|
|
|
derivative |
|
cash collateral |
|
|
| |||||||||||
|
|
|
Gross amounts |
|
instruments |
|
pledged |
|
Net amounts | ||||||||||||
|
|
|
|
|
|
|
|
|
|
| |||||||||||
|
Liabilities: |
|
|
|
|
|
|
|
|
| |||||||||||
|
Total return swaps |
|
|
$ |
(1.1 |
) |
|
|
$ |
— |
|
|
|
$ |
1.1 |
|
|
|
$ |
— |
|
|
Index swaps |
|
|
|
(0.8 |
) |
|
|
|
— |
|
|
|
|
0.5 |
|
|
|
|
(0.3 |
) |
|
Foreign currency forward contracts |
|
|
|
(3.2 |
) |
|
|
|
— |
|
|
|
|
— |
|
|
|
|
(3.2 |
) |
|
|
|
|
|
|
|
|
|
|
|
|
|
|
|
|
|
|
|
|
|
|
|
Total liabilities |
|
|
$ |
(5.1 |
) |
|
|
$ |
— |
|
|
|
$ |
1.6 |
|
|
|
$ |
(3.5 |
) |
The Group recognized the following net foreign currency translation gains (losses) on hedged seed investments denominated in currencies other than the Group’s functional currency and net gains (losses) associated with foreign currency forward contracts under net investment hedge accounting for the years ended December 31, 2017, 2016 and 2015 (in millions):
|
|
|
Year ended December 31, |
| |||||||
|
|
|
2017 |
|
2016 |
|
2015 |
| |||
|
|
|
|
|
|
|
|
| |||
|
Foreign currency translation |
|
$ |
(3.2 |
) |
$ |
29.6 |
|
$ |
3.5 |
|
|
Foreign currency forward contracts |
|
3.2 |
|
(29.6 |
) |
(3.5 |
) | |||
|
|
|
|
|
|
|
|
| |||
|
Total |
|
$ |
— |
|
$ |
— |
|
$ |
— |
|
The foreign currency translation gains and losses on foreign currency forward contracts associated with the net investment hedge are recognized in other comprehensive income (loss), net of tax in JHG’s Consolidated Statements of Comprehensive Income.
Derivative Instruments in Consolidated Seeded Investment Products
Certain of the Group’s consolidated seeded investment products utilize derivative instruments to contribute to the achievement of defined investment objectives. These derivative instruments are classified within other current assets or accounts payable and accrued liabilities on JHG’s Consolidated Balance Sheets. Gains and losses on these derivative instruments are classified within investment gains (losses), net in JHG’s Consolidated Statements of Comprehensive Income.
JHG’s consolidated seeded investment products were party to the following derivative instruments as of December 31, 2017 and 2016 (in millions):
|
|
|
Notional Value | |||||||||
|
|
|
December 31, |
|
December 31, | |||||||
|
|
|
2017 |
|
2016 | |||||||
|
|
|
|
|
|
|
|
|
|
|
|
|
|
Futures |
|
|
$ |
241.2 |
|
|
|
$ |
22.3 |
|
|
|
Contracts for differences |
|
|
|
10.2 |
|
|
|
|
9.2 |
|
|
|
Credit default swaps |
|
|
|
15.0 |
|
|
|
|
1.8 |
|
|
|
Total return swaps |
|
|
|
36.7 |
|
|
|
|
— |
|
|
|
Interest rate swaps |
|
|
|
58.3 |
|
|
|
|
8.3 |
|
|
|
Options |
|
|
|
144.3 |
|
|
|
|
184.8 |
|
|
|
Swaptions |
|
|
|
2.7 |
|
|
|
|
1.7 |
|
|
|
Foreign currency forward contracts |
|
|
|
135.9 |
|
|
|
|
120.0 |
|
|
The following table illustrates the effect of offsetting derivative instruments within consolidated seeded investment products on JHG’s Consolidated Balance Sheets as of December 31, 2017 (in millions):
|
|
|
December 31, 2017 |
| ||||||||||||||||||
|
|
|
|
|
Gross amounts |
|
|
|
|
| ||||||||||||
|
|
|
|
|
offset by |
|
Gross amounts |
|
|
| ||||||||||||
|
|
|
|
|
derivative |
|
offset by |
|
|
| ||||||||||||
|
|
|
Gross amounts |
|
instruments |
|
cash collateral |
|
Net amounts |
| ||||||||||||
|
|
|
|
|
|
|
|
|
|
| ||||||||||||
|
Assets: |
|
|
|
|
|
|
|
|
|
|
|
|
|
|
|
|
| ||||
|
Futures |
|
|
$ |
3.3 |
|
|
|
$ |
(1.7 |
) |
|
|
$ |
— |
|
|
|
$ |
1.6 |
|
|
|
Contracts for differences |
|
|
0.1 |
|
|
|
— |
|
|
|
— |
|
|
|
0.1 |
|
| ||||
|
Interest rate swaps |
|
|
0.2 |
|
|
|
(0.1 |
) |
|
|
— |
|
|
|
0.1 |
|
| ||||
|
Total return swaps |
|
|
0.1 |
|
|
|
— |
|
|
|
— |
|
|
|
0.1 |
|
| ||||
|
Credit default swaps |
|
|
0.1 |
|
|
|
(0.1 |
) |
|
|
— |
|
|
|
— |
|
| ||||
|
Options |
|
|
1.5 |
|
|
|
(0.3 |
) |
|
|
— |
|
|
|
1.2 |
|
| ||||
|
Swaptions |
|
|
0.1 |
|
|
|
— |
|
|
|
— |
|
|
|
0.1 |
|
| ||||
|
Foreign currency forward contracts |
|
|
1.1 |
|
|
|
(0.4 |
) |
|
|
2.3 |
|
|
|
3.0 |
|
| ||||
|
Total |
|
|
$ |
6.5 |
|
|
|
$ |
(2.6 |
) |
|
|
$ |
2.3 |
|
|
|
$ |
6.2 |
|
|
|
|
|
|
|
|
|
|
|
|
|
|
|
|
|
|
|
|
|
|
|
|
|
|
Liabilities: |
|
|
|
|
|
|
|
|
|
|
|
|
|
|
|
|
| ||||
|
Futures |
|
|
$ |
(1.7 |
) |
|
|
$ |
1.7 |
|
|
|
$ |
— |
|
|
|
$ |
— |
|
|
|
Interest rate swaps |
|
|
(0.2 |
) |
|
|
0.1 |
|
|
|
— |
|
|
|
(0.1 |
) |
| ||||
|
Credit default swaps |
|
|
(1.0 |
) |
|
|
0.1 |
|
|
|
— |
|
|
|
(0.9 |
) |
| ||||
|
Options |
|
|
(0.2 |
) |
|
|
0.2 |
|
|
|
— |
|
|
|
— |
|
| ||||
|
Foreign currency forward contracts |
|
|
(1.2 |
) |
|
|
0.4 |
|
|
|
(0.1 |
) |
|
|
(0.9 |
) |
| ||||
|
|
|
|
|
|
|
|
|
|
|
|
|
|
|
|
|
|
| ||||
|
Total |
|
|
$ |
(4.3 |
) |
|
|
$ |
2.5 |
|
|
|
$ |
(0.1 |
) |
|
|
$ |
(1.9 |
) |
|
The following table illustrates the effect of offsetting derivative instruments within consolidated seeded investment products on JHG’s Consolidated Balance Sheets as of December 31, 2016 (in millions):
|
|
|
December 31, 2016 |
| ||||||||||||||||||
|
|
|
|
|
Gross amounts |
|
|
|
|
| ||||||||||||
|
|
|
|
|
offset by |
|
Gross amounts |
|
|
| ||||||||||||
|
|
|
|
|
derivative |
|
offset by |
|
|
| ||||||||||||
|
|
|
Gross amounts |
|
instruments |
|
cash collateral |
|
Net amounts |
| ||||||||||||
|
|
|
|
|
|
|
|
|
|
| ||||||||||||
|
Assets: |
|
|
|
|
|
|
|
|
|
|
|
|
|
|
|
|
| ||||
|
Futures |
|
|
$ |
0.6 |
|
|
|
$ |
(0.1 |
) |
|
|
$ |
— |
|
|
|
$ |
0.5 |
|
|
|
Contracts for differences |
|
|
0.3 |
|
|
|
(0.1 |
) |
|
|
— |
|
|
|
0.2 |
|
| ||||
|
Interest rate swaps |
|
|
0.1 |
|
|
|
(0.1 |
) |
|
|
— |
|
|
|
— |
|
| ||||
|
Options |
|
|
3.1 |
|
|
|
(1.2 |
) |
|
|
— |
|
|
|
1.9 |
|
| ||||
|
Foreign currency forward contracts |
|
|
0.4 |
|
|
|
— |
|
|
|
(0.4 |
) |
|
|
— |
|
| ||||
|
|
|
|
|
|
|
|
|
|
|
|
|
|
|
|
|
|
| ||||
|
Total assets |
|
|
$ |
4.5 |
|
|
|
$ |
(1.5 |
) |
|
|
$ |
(0.4 |
) |
|
|
$ |
2.6 |
|
|
|
Liabilities: |
|
|
|
|
|
|
|
|
|
|
|
|
|
|
|
|
| ||||
|
Futures |
|
|
$ |
(0.1 |
) |
|
|
$ |
0.1 |
|
|
|
$ |
— |
|
|
|
$ |
— |
|
|
|
Contracts for differences |
|
|
(0.1 |
) |
|
|
0.1 |
|
|
|
— |
|
|
|
— |
|
| ||||
|
Interest rate swaps |
|
|
(0.1 |
) |
|
|
0.1 |
|
|
|
— |
|
|
|
— |
|
| ||||
|
Credit default swaps |
|
|
(0.1 |
) |
|
|
— |
|
|
|
— |
|
|
|
(0.1 |
) |
| ||||
|
Options |
|
|
(1.2 |
) |
|
|
1.2 |
|
|
|
— |
|
|
|
— |
|
| ||||
|
Foreign currency forward contracts |
|
|
(2.4 |
) |
|
|
— |
|
|
|
0.3 |
|
|
|
(2.1 |
) |
| ||||
|
|
|
|
|
|
|
|
|
|
|
|
|
|
|
|
|
|
| ||||
|
Total liabilities |
|
|
$ |
(4.0 |
) |
|
|
$ |
1.5 |
|
|
|
$ |
0.3 |
|
|
|
$ |
(2.2 |
) |
|
As of December 31, 2017 and 2016, certain consolidated seeded investment products sold credit protection through the use of credit default swap contracts. The contracts provide alternative credit risk exposure to individual companies and countries outside of traditional bond markets. The terms of the credit default swap contracts range from one to five years.
As sellers in credit default swap contracts, the consolidated seeded investment products would be required to pay the notional value of a referenced debt obligation to the counterparty in the event of a default on the debt obligation by the issuer. The notional value represents the estimated maximum potential undiscounted amount of future payments required upon the occurrence of a credit default event. As of December 31, 2017 and 2016, the notional values of the agreements totaled $4.0 million and nil, respectively. The credit default swap contracts include recourse provisions that allow for recovery of a certain percentage of amounts paid upon the occurrence of a credit default event. As of December 31, 2017 and 2016, the fair value of the credit default swap contracts selling protection was $0.1 million and nil respectively.
Investment Gains (Losses), Net
Investment gains (losses), net on JHG’s Consolidated Statements of Comprehensive Income included the following for the years ended December 31, 2017, 2016 and 2015 (in millions):
|
|
|
Year ended December 31, |
| |||||||
|
|
|
2017 |
|
2016 |
|
2015 |
| |||
|
|
|
|
|
|
|
|
| |||
|
Seeded investment products |
|
$ |
26.0 |
|
$ |
0.5 |
|
$ |
17.3 |
|
|
Fair value movements on derivatives |
|
(22.0 |
) |
(12.9 |
) |
1.0 |
| |||
|
Gain on sale of equity method investments |
|
— |
|
— |
|
18.9 |
| |||
|
Gain on sale of Volantis |
|
10.2 |
|
— |
|
— |
| |||
|
Other |
|
3.8 |
|
0.7 |
|
2.5 |
| |||
|
Investment gains (losses), net |
|
$ |
18.0 |
|
$ |
(11.7 |
) |
$ |
39.7 |
|
Purchases, Sales, Settlements and Maturities
Cash flows related to investment securities for the years ended December 31, 2017, 2016 and 2015, are summarized as follows (in millions):
|
|
|
Year ended December 31, |
| |||||||||||||||||||||||||
|
|
|
2017 |
|
|
|
2016 |
|
|
|
2015 |
| |||||||||||||||||
|
|
|
|
|
|
Sales, |
|
|
|
|
|
|
|
Sales, |
|
|
|
|
|
|
|
Sales, |
| ||||||
|
|
|
Purchases |
|
|
settlements |
|
|
|
Purchases |
|
|
|
settlements |
|
|
|
Purchases |
|
|
|
settlements |
| ||||||
|
|
|
and |
|
|
and |
|
|
|
and |
|
|
|
and |
|
|
|
and |
|
|
|
and |
| ||||||
|
|
|
settlements |
|
|
maturities |
|
|
|
settlements |
|
|
|
maturities |
|
|
|
settlements |
|
|
|
maturities |
| ||||||
|
|
|
|
|
|
|
|
|
|
|
|
|
|
|
|
|
|
|
|
|
|
|
| ||||||
|
Trading securities |
|
$ |
(792.3 |
) |
|
$ |
931.0 |
|
|
|
$ |
(81.6 |
) |
|
|
$ |
5.0 |
|
|
|
$ |
(40.3 |
) |
|
|
$ |
5.3 |
|
|
Available-for-sale securities |
|
(35.2 |
) |
|
45.4 |
|
|
|
— |
|
|
|
31.6 |
|
|
|
— |
|
|
|
40.6 |
| ||||||
|
Total cash flows |
|
$ |
(827.5 |
) |
|
$ |
976.4 |
|
|
|
$ |
(81.6 |
) |
|
|
$ |
36.6 |
|
|
|
$ |
(40.3 |
) |
|
|
$ |
45.9 |
|
Note 7 — Goodwill and Intangible Assets
JHG’s goodwill and intangible assets are summarized below (in millions):
|
|
|
|
|
|
|
|
|
|
|
|
|
|
|
Foreign |
|
|
|
|
| |||||
|
|
|
December 31, |
|
|
|
|
|
|
|
|
|
|
|
currency |
|
|
|
December 31, |
| |||||
|
|
|
2016 |
|
|
|
Merger |
|
|
|
Amortization |
|
|
|
translation |
|
|
|
2017 |
| |||||
|
|
|
|
|
|
|
|
|
|
|
|
|
|
|
|
|
|
|
|
| |||||
|
Indefinite-lived intangible assets: |
|
|
|
|
|
|
|
|
|
|
|
|
|
|
|
|
|
|
| |||||
|
Investment management agreements |
|
$ |
334.8 |
|
|
|
$ |
2,169.0 |
|
|
|
$ |
— |
|
|
|
$ |
40.1 |
|
|
|
$ |
2,543.9 |
|
|
Trademarks |
|
— |
|
|
|
381.0 |
|
|
|
— |
|
|
|
0.2 |
|
|
|
381.2 |
| |||||
|
Definite-lived intangible assets: |
|
|
|
|
|
|
|
|
|
|
|
|
|
|
|
|
|
|
| |||||
|
Client relationships |
|
126.9 |
|
|
|
235.0 |
|
|
|
— |
|
|
|
7.5 |
|
|
|
369.4 |
| |||||
|
Accumulated amortization |
|
(60.4 |
) |
|
|
— |
|
|
|
(22.9 |
) |
|
|
(6.4 |
) |
|
|
(89.7 |
) | |||||
|
Net intangible assets |
|
$ |
401.3 |
|
|
|
$ |
2,785.0 |
|
|
|
$ |
(22.9 |
) |
|
|
$ |
41.4 |
|
|
|
$ |
3,204.8 |
|
|
Goodwill |
|
$ |
741.5 |
|
|
|
$ |
726.5 |
|
|
|
$ |
— |
|
|
|
$ |
65.9 |
|
|
|
$ |
1,533.9 |
|
Indefinite-lived intangible assets represent certain investment management contracts where the Group expects both the renewal of the contracts and the cash flows generated by them to continue indefinitely. Trademarks primarily relate to JCG and were acquired as a result of the Merger. Definite-lived intangible assets represent client relationships, which are amortized over their estimated lives using the straight-line method. The estimated weighted-average life of the client relationships is approximately 13 years.
The opening goodwill balance originates from the various acquisitions the Group has undertaken. The Merger goodwill balance represents goodwill recorded at the Closing Date of the Merger. Refer to Note 4 — Acquisitions, for additional information on goodwill and intangible assets acquired from the Merger.
Foreign currency translation movements in the table primarily relate to the translation of the intangible assets and goodwill balances denominated in non-USD currencies to the Group’s functional and presentational currency of USD using the closing foreign currency exchange rate at the end of each reporting period.
Expected future amortization expense related to definite-lived intangible assets is summarized below (in millions):
|
Year ended December 31, |
|
|
Amount |
| |
|
|
|
|
|
| |
|
2018 |
|
$ |
29.7 |
| |
|
2019 |
|
29.7 |
| ||
|
2020 |
|
29.7 |
| ||
|
2021 |
|
26.8 |
| ||
|
2022 |
|
18.3 |
| ||
|
Thereafter |
|
145.5 |
| ||
|
Total |
|
$ |
279.7 |
| |
Impairment Testing
The Group elected to perform a qualitative assessment of the valuation of goodwill and indefinite-lived intangible assets for its 2017 impairment test and concluded it is more likely than not that the fair values of the Group’s reporting unit and the specific intangible assets exceed their carrying values.
The 2016 impairment test of indefinite-lived intangible assets indicated an impairment loss of $4.9 million which was recognized within depreciation and amortization on the Group’s Consolidated Statement of Comprehensive Income for the year ended December 31, 2016. No goodwill impairment losses were identified during the 2015 impairment test.
Definite-lived intangible assets are tested for impairment if there is an indication of impairment. No indicators of impairment were identified.
Note 8 — Equity Method Investments
Equity method investments of $5.9 million and $0.2 million were recognized on the Group’s Consolidated Balance Sheets within ‘other non-current assets’ as at December 31, 2017 and 2016, respectively.
The Group holds interests in the following equity method investments including joint ventures managed through shareholder agreements with third-party investors, accounted for under the equity method:
|
|
|
Country of |
|
|
|
|
|
|
|
|
|
|
incorporation |
|
|
|
2017 |
|
2016 |
|
|
|
|
and principal |
|
Functional |
|
Percentage |
|
Percentage |
|
|
|
|
place of operation |
|
Currency |
|
Owned |
|
Owned |
|
|
|
|
|
|
|
|
|
|
|
|
|
Long Tail Alpha |
|
USA |
|
USD |
|
20% |
|
20% |
|
|
Optimum Investment Management Limited |
|
UK |
|
GBP |
|
50% |
|
50% |
|
|
Northern Pines Henderson Capital GP LLC |
|
USA |
|
USD |
|
—% |
|
50% |
|
|
Northern Pines Henderson Capital LLC |
|
USA |
|
USD |
|
—% |
|
50% |
|
The Group’s share of net loss from equity method investments recognized within net income was $0.6 million and $3.1 million at December 31, 2017 and 2016, respectively. During 2016, the Group received a share of profit from its equity method investments of $0.7 million. An impairment loss of $3.8 million was also recognized in relation to the Group’s shareholding in Northern Pines as a result of the decision to wind up this joint venture.
Note 9 — Fair Value Measurements
The following table presents assets, liabilities and redeemable noncontrolling interests presented in the consolidated financial statements or disclosed in the notes to the consolidated financial statements at fair value on a recurring basis as of December 31, 2017 (in millions):
|
|
|
Fair value measurements using: |
|
|
| ||||||||||||||
|
|
|
Quoted prices in |
|
|
|
|
|
|
| ||||||||||
|
|
|
active markets for |
|
|
|
|
|
|
| ||||||||||
|
|
|
identical assets |
|
Significant other |
|
Significant |
|
|
| ||||||||||
|
|
|
and liabilities |
|
observable inputs |
|
unobservable inputs |
|
|
| ||||||||||
|
|
|
(Level 1) |
|
(Level 2) |
|
(Level 3) |
|
Total |
| ||||||||||
|
|
|
|
|
|
|
|
|
|
| ||||||||||
|
Assets: |
|
|
|
|
|
|
|
|
|
|
|
|
|
|
| ||||
|
Cash equivalents |
|
|
$ |
422.5 |
|
|
|
$ |
— |
|
|
|
$ |
— |
|
|
$ |
422.5 |
|
|
Investment securities: |
|
|
|
|
|
|
|
|
|
|
|
|
|
|
| ||||
|
Consolidated VIEs — trading |
|
|
114.1 |
|
|
|
251.4 |
|
|
|
37.3 |
|
|
402.8 |
| ||||
|
Other — trading |
|
|
180.6 |
|
|
|
94.5 |
|
|
|
0.2 |
|
|
275.3 |
| ||||
|
Consolidated VIEs — available-for-sale |
|
|
16.9 |
|
|
|
— |
|
|
|
— |
|
|
16.9 |
| ||||
|
Other — available-for-sale |
|
|
5.1 |
|
|
|
— |
|
|
|
— |
|
|
5.1 |
| ||||
|
Total investment securities |
|
|
316.7 |
|
|
|
345.9 |
|
|
|
37.5 |
|
|
700.1 |
| ||||
|
Seed hedge derivatives |
|
|
0.9 |
|
|
|
— |
|
|
|
— |
|
|
0.9 |
| ||||
|
Derivatives in consolidated seeded investment products |
|
|
2.9 |
|
|
|
3.6 |
|
|
|
— |
|
|
6.5 |
| ||||
|
Contingent consideration |
|
|
— |
|
|
|
— |
|
|
|
9.0 |
|
|
9.0 |
| ||||
|
Total assets |
|
|
$ |
743.0 |
|
|
|
$ |
349.5 |
|
|
|
$ |
46.5 |
|
|
$ |
1,139.0 |
|
|
|
|
|
|
|
|
|
|
|
|
|
|
|
|
|
|
|
|
|
|
|
Liabilities: |
|
|
|
|
|
|
|
|
|
|
|
|
|
|
| ||||
|
Derivatives in consolidated seeded investment products |
|
|
$ |
1.8 |
|
|
|
$ |
2.5 |
|
|
|
$ |
— |
|
|
$ |
4.3 |
|
|
Financial liabilities in consolidated seeded investment |
|
|
|
|
|
|
|
|
|
|
|
|
|
|
| ||||
|
products |
|
|
11.6 |
|
|
|
— |
|
|
|
— |
|
|
11.6 |
| ||||
|
Seed hedge derivatives |
|
|
5.9 |
|
|
|
4.2 |
|
|
|
— |
|
|
10.1 |
| ||||
|
Current portion of long-term debt (1) |
|
|
— |
|
|
|
57.3 |
|
|
|
— |
|
|
57.3 |
| ||||
|
Long-term debt (1) |
|
|
— |
|
|
|
323.4 |
|
|
|
— |
|
|
323.4 |
| ||||
|
Deferred bonuses |
|
|
— |
|
|
|
— |
|
|
|
64.7 |
|
|
64.7 |
| ||||
|
Contingent consideration |
|
|
— |
|
|
|
— |
|
|
|
76.6 |
|
|
76.6 |
| ||||
|
Dai-ichi options |
|
|
— |
|
|
|
— |
|
|
|
26.1 |
|
|
26.1 |
| ||||
|
Total liabilities |
|
|
$ |
19.3 |
|
|
|
$ |
387.4 |
|
|
|
$ |
167.4 |
|
|
$ |
574.1 |
|
|
Redeemable noncontrolling interests: |
|
|
|
|
|
|
|
|
|
|
|
|
|
|
| ||||
|
Consolidated seeded investment products |
|
|
$ |
— |
|
|
|
$ |
— |
|
|
|
$ |
174.9 |
|
|
$ |
174.9 |
|
|
Intech |
|
|
— |
|
|
|
— |
|
|
|
15.4 |
|
|
15.4 |
| ||||
|
|
|
|
|
|
|
|
|
|
|
|
|
|
|
|
| ||||
|
Total redeemable noncontrolling interests |
|
|
$ |
— |
|
|
|
$ |
— |
|
|
|
$ |
190.3 |
|
|
$ |
190.3 |
|
(1) Carried at amortized cost and disclosed at fair value.
The following table presents assets, liabilities and redeemable noncontrolling interests presented in the consolidated financial statements or disclosed in the notes to the consolidated financial statements at fair value on a recurring basis as of December 31, 2016 (in millions):
|
|
|
Fair value measurements using: |
|
| ||||||||||||||
|
|
|
Quoted prices in |
|
|
|
|
|
| ||||||||||
|
|
|
active markets for |
|
|
|
|
|
| ||||||||||
|
|
|
identical assets |
|
Significant other |
|
Significant |
|
| ||||||||||
|
|
|
and liabilities |
|
observable inputs |
|
unobservable inputs |
|
| ||||||||||
|
|
|
(Level 1) |
|
(Level 2) |
|
(Level 3) |
|
Total | ||||||||||
|
|
|
|
|
|
|
|
|
| ||||||||||
|
Assets: |
|
|
|
|
|
|
|
|
|
|
|
|
|
| ||||
|
Investment securities: |
|
|
|
|
|
|
|
|
|
|
|
|
|
| ||||
|
Consolidated VIEs — trading |
|
|
$ |
128.2 |
|
|
|
$ |
117.1 |
|
|
|
$ |
42.7 |
|
|
$ |
288.0 |
|
Other — trading |
|
|
66.1 |
|
|
|
13.1 |
|
|
|
— |
|
|
79.2 | ||||
|
Consolidated VIEs — available-for-sale |
|
|
20.3 |
|
|
|
5.4 |
|
|
|
— |
|
|
25.7 | ||||
|
Other — available-for-sale |
|
|
0.4 |
|
|
|
— |
|
|
|
— |
|
|
0.4 | ||||
|
Total investment securities |
|
|
215.0 |
|
|
|
135.6 |
|
|
|
42.7 |
|
|
393.3 | ||||
|
Derivatives in consolidated seeded investment products |
|
|
3.4 |
|
|
|
0.6 |
|
|
|
— |
|
|
4.0 | ||||
|
Total assets |
|
|
$ |
218.4 |
|
|
|
$ |
136.2 |
|
|
|
$ |
42.7 |
|
|
$ |
397.3 |
|
Liabilities: |
|
|
|
|
|
|
|
|
|
|
|
|
|
| ||||
|
Derivatives in consolidated seeded investment products |
|
|
$ |
1.3 |
|
|
|
$ |
2.2 |
|
|
|
$ |
— |
|
|
$ |
3.5 |
|
Financial liabilities in consolidated seeded investment products |
|
|
16.2 |
|
|
|
— |
|
|
|
— |
|
|
16.2 | ||||
|
Contingent consideration |
|
|
— |
|
|
|
— |
|
|
|
25.5 |
|
|
25.5 | ||||
|
Deferred bonuses |
|
|
— |
|
|
|
— |
|
|
|
42.9 |
|
|
42.9 | ||||
|
Seed hedge derivatives |
|
|
— |
|
|
|
5.1 |
|
|
|
— |
|
|
5.1 | ||||
|
Total liabilities |
|
|
$ |
17.5 |
|
|
|
$ |
7.3 |
|
|
|
$ |
68.4 |
|
|
$ |
93.2 |
|
Total redeemable noncontrolling interests in consolidated seeded investment products |
|
|
$ |
— |
|
|
|
$ |
— |
|
|
|
$ |
158.0 |
|
|
$ |
158.0 |
Level 1 Fair Value Measurements
JHG’s Level 1 fair value measurements consist mostly of seeded investment products, investments in advised mutual funds, cash equivalents and investments related to deferred compensation plans with quoted market prices in active markets. The fair value level of consolidated seeded investment products is determined by the underlying securities of the product. The fair value level of unconsolidated seeded investment products is determined using the respective NAV of each product.
Level 2 Fair Value Measurements
JHG’s Level 2 fair value measurements consist mostly of consolidated seeded investment products and JHG’s long-term debt. The fair value of consolidated seeded investment products is determined by the underlying securities of the product. The fair value of JHG’s long-term debt is determined using broker quotes and recent trading activity, which are considered Level 2 inputs.
Level 3 Fair Value Measurements
Investment Products
As of December 31, 2017, and December 31, 2016, certain securities within consolidated VIEs were valued using significant unobservable inputs, resulting in Level 3 classification.
Disposal of Volantis
On April 1, 2017, the Group completed the sale of Volantis. Consideration for the sale was a 10% share of the management and performance fees generated by Volantis for a period of three years.
The fair value of the Volantis contingent consideration is estimated at each reporting date by forecasting revenues over the contingency period of three years. Significant unobservable inputs used in the valuation are limited to forecast revenues, which factor in expected growth in AUM based on performance and industry trends. Increases in forecast revenue increase the fair value of the consideration, while decreases in forecast revenue decrease the fair value. The forecasted share of revenues is then discounted back to the valuation date using an 11.8% discount rate. As of December 31, 2017, the fair value of the Volantis contingent consideration asset was $9.0 million.
Contingent Consideration
Acquisition of Geneva
The consideration payable on the acquisition of Geneva Capital Management LLC (“Geneva”) in 2014 included two contingent tranches of up to $45.4 million and $25.0 million, payable over six years. There was a $3.0 million fair value adjustment in the year ended December 31, 2017. As of December 31, 2017 and 2016, the contingent consideration had a fair value of $19.3 million and $20.3 million, respectively, and was included in other non-current liabilities on JHG’s Consolidated Balance Sheets.
The fair value of the Geneva contingent consideration is estimated at each reporting date by forecasting revenue, as defined by the sale and purchase agreement, over the contingency period and by determining whether targets will be met. Significant unobservable inputs used in the valuation are limited to forecast revenues, which factor in expected growth in AUM based on performance and industry trends.
Acquisition of Perennial
The consideration payable on the acquisition of Perennial Fixed Interest Partners Pty Ltd and Perennial Growth Management Pty Ltd (together “Perennial”) included contingent consideration payable in 2017 and 2019 if revenues of the Perennial equities business meet certain targets. The total maximum payment over the remaining contingent consideration period is $5.9 million as of December 31, 2017. In addition, there is a maximum amount of $41.2 million payable in two tranches in 2019 and 2020, which have employee service conditions attached (“earn-out”). The earn-out is accrued over the service period as compensation expense and is based on net management fee revenue. Fair value adjustments to the consideration during the year ended December 31, 2017, resulted in a $1.8 million decrease to the liability. As of December 31, 2017 and 2016, the contingent consideration and earn-out had a combined fair value of $7.0 million and $5.2 million, respectively, which is included in other non-current liabilities on JHG’s Consolidated Balance Sheets.
The fair value of the Perennial contingent consideration and earn-out is calculated at each reporting date by forecasting Perennial revenues over the contingency period and determining whether the
forecasted amounts meet the defined targets. The significant unobservable input used in the valuation is forecasted revenue.
Acquisition of Kapstream
JCG’s acquisition of Kapstream was a two-stage acquisition. The original acquisition of 51% in July 2015 had contingent consideration payable at 18 and 36 months after acquisition if certain Kapstream AUM reach defined targets.
The purchase of the remaining 49% had contingent consideration of up to $43.8 million. Payment of the contingent consideration is subject to all Kapstream products and certain products advised by the Group, reaching defined revenue targets on the first, second and third anniversaries of January 31, 2017. The contingent consideration will be payable in three equal installments on the anniversary dates and is indexed to the performance of the premier share class of the Kapstream Absolute Return Income Fund. Upon achieving the defined revenue targets, the holders receive the value of the contingent consideration adjusted for gains or losses attributable to the mutual fund to which the contingent consideration is indexed, subject to tax withholding. On January 31, 2018, the first anniversary of the acquisition, Kapstream reached defined revenue targets and the Group paid $15.3 million in February 2018.
No fair value adjustment was necessary in the year ended December 31, 2017. As of December 31, 2017, the aggregate contingent consideration had a fair value of $44.2 million; $18.8 million is included in accounts payable and accrued liabilities, and $25.4 million is included in other non-current liabilities on JHG’s Consolidated Balance Sheets. As of December 31, 2017, the total maximum payment over the remaining contingent consideration period (first, second and third anniversaries) is $48.6 million. The total maximum payment includes fair value adjustments associated with the consideration, which is indexed to the performance of a certain fund.
The fair value of the Kapstream contingent consideration is calculated at each reporting date by forecasting certain Kapstream AUM or defined revenue over the contingency period and determining whether the forecasted amounts meet the defined targets. Significant unobservable inputs used in the valuation are limited to forecasted Kapstream AUM and performance against defined revenue targets.
Acquisition of VelocityShares
JCG’s acquisition of VelocityShares in 2014 included contingent consideration. The remaining contingent consideration is payable on the third and fourth anniversaries of the acquisition, in amounts up to $8.0 million each. The payments are contingent on certain VelocityShares’ ETPs reaching defined net revenue targets. VelocityShares ETPs reached defined net revenue targets in November 2017, the third anniversary of the acquisition, and the Group paid contingent consideration of $3.6 million in January 2018. The total remaining maximum payment for the fourth and final contingent consideration payment is $8.0 million.
Fair value adjustments to the consideration during the year ended December 31, 2017, resulted in a $0.8 million decrease to the liability. As of December 31, 2017, the contingent consideration had a fair value of $6.1 million. The fair value is included in accounts payable and accrued liabilities on JHG’s Consolidated Balance Sheets.
The fair value of the VelocityShares contingent consideration is calculated at each reporting date by forecasting net ETP revenue, as defined by the purchase agreement, over the contingency period and by determining whether net forecasted ETP revenue targets are achieved. Significant unobservable inputs used in the valuation are considered non-public data and limited to forecasted gross revenues and certain expense items, which are deducted from these revenues.
Deferred Bonuses
Deferred bonuses represent liabilities to employees over the vesting period that will be settled by investments in JHG products.
Dai-ichi Options
As of December 31, 2017, the fair value of the options sold to Dai-ichi was $26.1 million. The fair value was determined using a Black-Scholes option pricing model. The Black-Scholes model requires management to estimate certain variables, primarily the volatility of the underlying shares. Changes in the fair value of the options are recognized in other non-operating income (expense), net in JHG’s Consolidated Statements of Comprehensive Income.
Redeemable Noncontrolling Interests in Intech
Intech became a subsidiary of the Group as a result of the Merger. Redeemable noncontrolling interests in Intech are measured at fair value on a quarterly basis or more frequently if events or circumstances indicate that a material change in the fair value of Intech has occurred. The fair value of Intech is determined using a valuation methodology that incorporates observable metrics from publicly traded peer companies as valuation comparables and adjustments related to investment performance and changes in AUM.
Redeemable Noncontrolling Interests in Consolidated Seeded Investment Products
Redeemable noncontrolling interests in consolidated seeded investment products are measured at fair value. Their fair values are primarily driven by the fair value of the investments in consolidated funds. The fair value of redeemable noncontrolling interests may also fluctuate from period to period based on changes in the Group’s relative ownership percentage of seed investments.
Changes in Fair Value
Changes in fair value of JHG’s Level 3 assets for the years ended December 31, 2017 and 2016, are as follows (in millions):
|
|
|
Year ended |
| ||||
|
|
|
December 31, |
| ||||
|
|
|
2017 |
|
2016 |
| ||
|
|
|
|
|
|
| ||
|
Beginning of year fair value |
|
$ |
42.7 |
|
$ |
58.2 |
|
|
Balance acquired from the Merger |
|
3.0 |
|
— |
| ||
|
Additions |
|
10.9 |
|
0.4 |
| ||
|
Settlements |
|
(11.5 |
) |
— |
| ||
|
Transfers to Level 2 |
|
(1.1 |
) |
— |
| ||
|
Movement recognized in net income |
|
2.2 |
|
(17.5 |
) | ||
|
Movements recognized in other comprehensive income |
|
0.2 |
|
10.4 |
| ||
|
Foreign currency translation |
|
0.1 |
|
(8.8 |
) | ||
|
|
|
|
|
|
| ||
|
End of year fair value |
|
$ |
46.5 |
|
$ |
42.7 |
|
Changes in fair value of JHG’s individual Level 3 liabilities and redeemable noncontrolling interests for the years ended December 31, 2017 and 2016, are as follows (in millions):
|
|
|
|
|
|
|
|
|
|
|
|
|
|
|
|
|
|
|
|
|
|
|
|
|
|
|
|
|
|
|
|
|
|
|
|
|
|
|
|
Year ended December 31, | |||||||||||||||||||||||||||||||||
|
|
|
2017 |
|
2016 | |||||||||||||||||||||||||||||||
|
|
|
|
|
|
|
|
|
Redeemable |
|
|
|
|
|
Redeemable | |||||||||||||||||||||
|
|
|
Contingent |
|
Deferred |
|
Dai-ichi |
|
noncontrolling |
|
Contingent |
|
Deferred |
|
noncontrolling | |||||||||||||||||||||
|
|
|
consideration |
|
bonuses |
|
option |
|
interests |
|
consideration |
|
bonuses |
|
interests | |||||||||||||||||||||
|
|
|
|
|
|
|
|
|
|
|
|
|
|
|
|
|
|
|
|
|
|
|
|
|
|
|
|
|
| |||||||
|
Beginning of year fair value |
|
|
$ |
25.5 |
|
|
|
$ |
42.9 |
|
|
|
$ |
— |
|
|
|
$ |
158.0 |
|
|
|
$ |
19.5 |
|
|
|
$ |
35.7 |
|
|
|
$ |
82.9 |
|
|
Balances acquired from the Merger |
|
|
45.4 |
|
|
|
— |
|
|
|
— |
|
|
|
35.8 |
|
|
|
— |
|
|
|
— |
|
|
|
— |
| |||||||
|
Additions |
|
|
— |
|
|
|
— |
|
|
|
25.7 |
|
|
|
— |
|
|
|
10.0 |
|
|
|
— |
|
|
|
— |
| |||||||
|
Changes in ownership |
|
|
— |
|
|
|
— |
|
|
|
— |
|
|
|
3.7 |
|
|
|
— |
|
|
|
— |
|
|
|
61.7 |
| |||||||
|
Net movement in bonus deferrals |
|
|
— |
|
|
|
19.4 |
|
|
|
— |
|
|
|
— |
|
|
|
— |
|
|
|
14.2 |
|
|
|
— |
| |||||||
|
Fair value adjustments |
|
|
3.0 |
|
|
|
— |
|
|
|
(0.6 |
) |
|
|
2.0 |
|
|
|
— |
|
|
|
— |
|
|
|
— |
| |||||||
|
Unrealized gains (losses) |
|
|
— |
|
|
|
— |
|
|
|
— |
|
|
|
(11.0 |
) |
|
|
— |
|
|
|
— |
|
|
|
35.3 |
| |||||||
|
Amortization of Intech appreciation rights |
|
|
— |
|
|
|
— |
|
|
|
— |
|
|
|
2.3 |
|
|
|
— |
|
|
|
— |
|
|
|
— |
| |||||||
|
Distributions |
|
|
— |
|
|
|
— |
|
|
|
— |
|
|
|
(0.3 |
) |
|
|
— |
|
|
|
— |
|
|
|
— |
| |||||||
|
Foreign currency translation |
|
|
2.7 |
|
|
|
2.4 |
|
|
|
1.0 |
|
|
|
(0.2 |
) |
|
|
(4.0 |
) |
|
|
(7.0 |
) |
|
|
(21.9 |
) | |||||||
|
|
|
|
|
|
|
|
|
|
|
|
|
|
|
|
|
|
|
|
|
|
|
|
|
|
|
|
|
| |||||||
|
End of year fair value |
|
|
$ |
76.6 |
|
|
|
$ |
64.7 |
|
|
|
$ |
26.1 |
|
|
|
$ |
190.3 |
|
|
|
$ |
25.5 |
|
|
|
$ |
42.9 |
|
|
|
$ |
158.0 |
|
Significant Unobservable Inputs
Valuation techniques and significant unobservable inputs used in the valuation of JHG’s material Level 3 asset, the Group’s private equity investment included within consolidated VIEs, as of December 31, 2017, and December 31, 2016, are as follows (in millions):
|
|
|
|
|
|
|
Significant |
|
| ||
|
|
|
Fair |
|
Valuation |
|
unobservable |
|
Range | ||
|
As of December 31, 2017 |
|
|
value |
|
technique |
|
inputs |
|
(weighted-average) | |
|
|
|
|
|
|
|
|
|
| ||
|
Investment securities of consolidated VIEs — trading |
|
$ |
37.3 |
|
Discounted cash flow |
|
Discount rate |
|
12.0%-15.0% (14.3)% | |
|
|
|
|
|
EBITDA multiple |
|
11.6-15.1 (14.3) | ||||
|
|
|
|
|
|
|
Price-earnings ratio |
|
22.6-61.3 (52.4) | ||
|
|
|
|
|
|
|
|
|
| ||
|
|
|
|
|
|
|
Significant |
|
| ||
|
|
|
Fair |
|
Valuation |
|
unobservable |
|
Range | ||
|
As of December 31, 2016 |
|
|
value |
|
technique |
|
inputs |
|
(weighted-average) | |
|
|
|
|
|
|
|
|
|
| ||
|
Investment securities of consolidated VIEs — trading |
|
$ |
42.7 |
|
Discounted cash flow |
|
Discount rate |
|
12.0%-30.0% (16.3)% | |
|
|
|
|
|
EBITDA multiple |
|
8.7-11.0 (9.1) | ||||
|
|
|
|
|
|
|
Price-earnings ratio |
|
17.2-24.0 (18.4) | ||
Nonrecurring Fair Value Measurements
Nonrecurring Level 3 fair value measurements include goodwill and intangible assets. The Group measures the fair value of goodwill and intangible assets on initial recognition using discounted cash flow analysis that requires assumptions regarding projected future earnings and discount rates. Due to the significance of the unobservable inputs in the fair value measurements of these assets, such measurements are classified as Level 3. Goodwill and intangible assets were part of the preliminary allocation of the consideration transferred to the assets acquired and liabilities assumed from the Merger. Refer to Note 4 — Acquisitions for additional information.
Transfers between Fair Value Levels
The underlying securities of funds and separate accounts may trade on a foreign stock exchange. In some cases, the closing price of such securities may be adjusted to capture the effects of any post-closing activity affecting the markets in which they trade. Security prices are adjusted based upon historical impacts for similar post-close activity. These adjustments result in the securities being classified as Level 2 and may also result in movements of securities between Level 1 and Level 2.
Transfers are recognized at the end of each reporting period. Transfers from Level 3 to Level 2 were $1.1 million for the year ended December 31, 2017. There were no transfers between Level 1 and Level 2 for the year ended December 31, 2017.
Note 10 — Debt
Debt as of December 31, 2017 and 2016, consisted of the following (in millions):
|
|
|
December 31, |
|
December 31, | ||||||||
|
|
|
2017 |
|
2016 | ||||||||
|
|
|
Carrying |
|
Fair |
|
Carrying |
|
Fair | ||||
|
|
|
value |
|
value |
|
value |
|
value | ||||
|
|
|
|
|
|
|
|
|
| ||||
|
4.875% Senior Notes due 2025 |
|
$ |
322.0 |
|
$ |
323.4 |
|
$ |
— |
|
$ |
— |
|
0.750% Convertible Senior Notes due 2018 |
|
57.2 |
|
57.3 |
|
— |
|
— | ||||
|
|
|
|
|
|
|
|
|
| ||||
|
Total debt |
|
379.2 |
|
380.7 |
|
— |
|
— | ||||
|
Less: Current portion of long-term debt |
|
57.2 |
|
57.3 |
|
— |
|
— | ||||
|
|
|
|
|
|
|
|
|
| ||||
|
Total long-term debt |
|
$ |
322.0 |
|
$ |
323.4 |
|
$ |
— |
|
$ |
— |
4.875% Senior Notes Due 2025
As a result of the Merger, the Group assumed 2025 Senior Notes with a principal value of $300.0 million, which pay interest at 4.875% semiannually on February 1 and August 1 of each year and mature on August 1, 2025. The 2025 Senior Notes were recorded at their fair value of $323.7 million at the time of the Merger. The 2025 Senior Notes include unamortized debt premium, net at December 31, 2017, of $22.0 million, which will be amortized over the remaining life of the 2025 Senior Notes. The unamortized debt premium is recorded as a liability within long-term debt on JHG’s Consolidated Balance Sheets.
0.750% Convertible Senior Notes Due 2018
As a result of the Merger, the Group assumed 2018 Convertible Notes with a principal value of $116.6 million. The 2018 Convertible Notes pay interest at 0.750% semiannually on January 15 and July 15 of each year and mature on July 15, 2018. The 2018 Convertible Notes had a fair value of $158.1 million at the time of the Merger. The 2018 Convertible Notes may be wholly or partially settled in cash at the election of JHG and thereby the liability and conversion feature components of the 2018 Convertible Notes were accounted for separately. The $115.2 million liability component at the Closing Date was determined by discounting future contractual cash flows at a 1.9% rate, which is consistent with the estimated market interest rate for similar senior notes with no conversion option. The $42.9 million equity component was determined as the difference between the liability component and the fair value of 2018 Convertible Notes at the Closing Date. The fair value as of December 31, 2017, in the table above represents the fair value of the liability component. Upon closing of the Merger, JHG fully and unconditionally guaranteed the obligations of JCG in relation to the 2018 Convertible Notes and 2025 Senior Notes.
Holders of the 2018 Convertible Notes may convert the notes during a particular calendar quarter if the last reported sale price of JHG’s common stock is greater than or equal to 130% of the applicable conversion price for at least 20 trading days during a period of 30 consecutive trading days ending on the last trading day of the preceding quarter. During the year ended December 31, 2017, $59.1 million of principal was redeemed and settled with cash for a total cash outlay of $92.5 million. Additional conversion notices were received in 2018; refer to Note 22 — Subsequent Events for additional information. As of December 31, 2017, the face value of the 2018 Convertible Notes was $57.5 million. As of January 1, 2018, the 2018 Convertible Notes met the conversion criteria and are convertible during the first quarter 2018 at a conversion rate of 45.1535 shares of JHG common stock per $1,000 principal amount of the 2018 Convertible Notes, which is equivalent to a conversion price of approximately $22.15 per share of common stock.
Convertible Note Hedge and Warrants
Prior to the Merger, JCG entered into convertible note hedge and warrant transactions. The instruments were intended to reduce the potential for future dilution to shareholders by effectively increasing the initial conversion price of the 2018 Convertible Notes. The convertible note hedge and warrants were terminated by the Group in June 2017, and JHG received $59.3 million and paid $47.8 million to settle the contracts. The net proceeds from the settlements were recorded in additional paid-in-capital on the Group’s Consolidated Balance Sheets.
7.25% Senior Notes due 2016
In March 2011, Henderson issued £150.0 million ($240.4 million) of 2016 Senior Notes which were unsecured, unrated and repayable in full on March 24, 2016. The 2016 Senior Notes paid interest at 7.25% semi-annually on March 24 and September 24. The interest on the 2016 Senior Notes was amortized over the five year term to interest expense in the Consolidated Statements of Comprehensive Income. The 2016 Senior Notes were repaid in full at their maturity on March 24, 2016.
The Group was in compliance with all covenants attached to the 2016 Senior Notes up to the date of repayment. The covenants included the requirement to provide notice of any actual or potential default event and the preparation of audited accounts for each accounting period.
Credit Facility
At December 31, 2017, JHG had a $200 million, unsecured, revolving credit facility (“Credit Facility”) with Bank of America Merrill Lynch International Limited, as coordinator, book runner and mandated lead arranger. JHG and its subsidiaries can use the Credit Facility for general corporate purposes. The rate of interest for each interest period is the aggregate of the applicable margin, which is based on JHG’s long-term credit rating and the London Interbank Offered Rate (“LIBOR”); the Euro Interbank Offered Rate (“EURIBOR”) in relation to any loan in euro (“EUR”); or in relation to any loan in Australian dollar (“AUD”), the benchmark rate for that currency. JHG is required to pay a quarterly commitment fee on any unused portion of the Credit Facility, which is also based on JHG’s long-term credit rating. Under the Credit Facility, the financing leverage ratio cannot exceed 3.00x EBITDA. At December 31, 2017, JHG was in compliance with all covenants, and there were no borrowings under the Credit Facility at December 31, 2017, or from inception of the Credit Facility. The Credit Facility had a maturity date of February 16, 2022, with two one-year extension options that can be exercised at the discretion of JHG with the lender’s consent on the first and second anniversary of the date of the agreement, respectively. On the first anniversary of the date of the agreement, the Group exercised the option to extend the term of the Credit Facility by one year. The revised maturity date of the Credit Facility is February 16, 2023.
Note 11 — Income Taxes
The components of the Group’s provision for income taxes for the years ended December 31, 2017, 2016 and 2015, are as follows (in millions):
|
|
|
Year ended December 31, |
| |||||||
|
|
|
2017 |
|
2016 |
|
2015 |
| |||
|
|
|
|
|
|
|
|
| |||
|
Current: |
|
|
|
|
|
|
| |||
|
UK |
|
$ |
51.5 |
|
$ |
30.3 |
|
$ |
3.5 |
|
|
U.S. including state and local |
|
83.1 |
|
1.1 |
|
4.3 |
| |||
|
International |
|
10.0 |
|
1.2 |
|
6.4 |
| |||
|
|
|
|
|
|
|
|
| |||
|
Total current income taxes |
|
144.6 |
|
32.6 |
|
14.2 |
| |||
|
Deferred: |
|
|
|
|
|
|
| |||
|
UK |
|
0.3 |
|
(2.2 |
) |
(5.6 |
) | |||
|
U.S. including state and local |
|
(354.4 |
) |
3.0 |
|
(2.1 |
) | |||
|
International |
|
(1.5 |
) |
1.2 |
|
(0.4 |
) | |||
|
Total deferred income taxes (benefits) |
|
(355.6 |
) |
2.0 |
|
(8.1 |
) | |||
|
|
|
|
|
|
|
|
| |||
|
Total income tax expense |
|
$ |
(211.0 |
) |
$ |
34.6 |
|
$ |
6.1 |
|
The components of the Group’s total income before taxes for the years ended December 31, 2017, 2016 and 2015, are as follows (in millions):
|
|
|
Year ended December 31, |
| |||||||
|
|
|
2017 |
|
2016 |
|
2015 |
| |||
|
|
|
|
|
|
|
|
| |||
|
UK |
|
$ |
229.0 |
|
$ |
180.9 |
|
$ |
201.0 |
|
|
U.S. |
|
190.5 |
|
(0.1 |
) |
7.8 |
| |||
|
International |
|
27.9 |
|
31.1 |
|
128.7 |
| |||
|
Total income before taxes |
|
$ |
447.4 |
|
$ |
211.9 |
|
$ |
337.5 |
|
The Group’s top holding company is tax resident in the UK and is subject to the tax laws and regulations of that country. The following is a reconciliation between the UK statutory corporation tax rate and the effective tax rate on the Group’s income from operations.
|
|
|
Year ended |
| ||||
|
|
|
December 31, |
| ||||
|
|
|
2017 |
|
2016 |
|
2015 |
|
|
|
|
|
|
|
|
|
|
|
UK statutory corporation tax rate |
|
19.3 |
% |
20.0 |
% |
20.3 |
% |
|
Effect of foreign tax rates |
|
7.4 |
|
(1.1 |
) |
(5.9 |
) |
|
Impact of Property disposal (1) |
|
— |
|
— |
|
(2.3 |
) |
|
Equity-based compensation |
|
0.2 |
|
(3.4 |
) |
(3.7 |
) |
|
Finalization of positions with HMRC (2) |
|
0.3 |
|
(0.8 |
) |
(3.1 |
) |
|
Tax adjustments |
|
0.7 |
|
0.6 |
|
0.3 |
|
|
Non-deductible costs associated with the Merger |
|
1.2 |
|
0.8 |
|
— |
|
|
Impact of changes in statutory tax rates on deferred taxes |
|
(77.4 |
) |
(1.9 |
) |
(2.4 |
) |
|
Taxes applicable to prior years |
|
(0.4 |
) |
0.9 |
|
(1.0 |
) |
|
Other, net |
|
1.7 |
|
0.1 |
|
(0.3 |
) |
|
|
|
|
|
|
|
|
|
|
Effective income tax rate, controlling interest |
|
(47.0 |
)% |
15.2 |
% |
1.9 |
% |
|
Net income attributable to noncontrolling interests |
|
(0.1 |
) |
1.1 |
|
(0.1 |
) |
|
|
|
|
|
|
|
|
|
|
Total effective income tax rate |
|
(47.1 |
)% |
16.3 |
% |
1.8 |
% |
(1) This incorporates the tax impact of the disposal of THRE during 2015.
(2) Her Majesty’s Revenue and Customs (‘HMRC’), tax authority of the UK.
The Group operates in several taxing jurisdictions around the world, each with its own statutory tax rate and set of tax laws and regulations. As a result, the future blended average statutory tax rate is dependent on changes to such laws and regulations and the mix of profits and losses of the Group’s subsidiaries. The Group’s blended average statutory tax rate increased subsequent to the Merger with JCG.
Tax Legislation
The Group has significant tax expense and tax current and deferred payable impact associated with the Act enacted on December 22, 2017, which resulted in an income tax benefit of $340.7 million. The Act includes significant changes to the U.S. corporate income tax system: it reduces the U.S. federal corporate tax rate from 35.0% to 21.0% as of January 1, 2018; it shifts the U.S. to a modified territorial tax regime which requires companies to pay a one-time mandatory tax on earnings of certain foreign subsidiaries that were previously tax deferred; and it creates new taxes on certain foreign-sourced earnings. Income tax effects resulting from changes in tax laws are accounted for by the Group in accordance with the authoritative guidance, which requires that these tax effects be recognized in the period in which the law is enacted and the effects are recorded as a component of provision for income taxes from continuing operations.
On December 22, 2017, the SEC issued guidance under Staff Accounting Bulletin No. 118, Income Tax Accounting Implications of the Tax Cuts and Jobs Act (“SAB 118”) directing taxpayers to consider the impact of the Act as “provisional” when they do not have the necessary information available, prepared or analyzed (including computations) in reasonable detail to complete their accounting for the change in tax law. In accordance with SAB 118, the estimated income tax benefit of $340.7 million represents the Group’s best estimate based on interpretation of the Act as the Group is still accumulating data to finalize the underlying calculations, or in certain cases, the U.S. Treasury is expected to issue further guidance on the application of certain provisions of the Act. In accordance with SAB 118, the additional estimated income tax benefit related to the revaluation of deferred tax assets and liabilities of $345.4 million and tax expense related to the one-time tax on the previously deferred earnings of foreign subsidiaries of $4.7m is considered provisional and will be finalized before December 22, 2018.
During 2016, tax legislation enacted in the UK to reduce the corporation tax rate in future years resulted in a $4.0 million net non cash benefit (2015: $8.1 million benefit) related to the revaluation of certain deferred tax assets and liabilities. The UK corporation tax rate reduced from 20% to 19% with effect from April 1, 2017 and then to 17% with effect from April 1, 2020.
Deferred Taxes
The significant components of the Group’s deferred tax assets and liabilities as of December 31, 2017 and 2016, are as follows (in millions):
|
|
|
December 31, |
| ||||
|
|
|
2017 |
|
2016 |
| ||
|
|
|
|
|
|
| ||
|
Deferred tax assets: |
|
|
|
|
| ||
|
Compensation and staff benefits |
|
$ |
55.2 |
|
$ |
16.5 |
|
|
Loss carryforwards |
|
59.4 |
|
18.8 |
| ||
|
Accrued liabilities |
|
2.2 |
|
1.1 |
| ||
|
Debt premium |
|
6.2 |
|
— |
| ||
|
Other |
|
7.9 |
|
1.2 |
| ||
|
|
|
|
|
|
| ||
|
Gross deferred tax assets |
|
130.9 |
|
37.6 |
| ||
|
Valuation allowance |
|
(57.2 |
) |
(18.8 |
) | ||
|
|
|
|
|
|
| ||
|
Deferred tax assets, net of valuation allowance |
|
$ |
73.7 |
|
$ |
18.8 |
|
|
Deferred tax liabilities: |
|
|
|
|
| ||
|
Retirement benefits |
|
$ |
(24.4 |
) |
$ |
(19.2 |
) |
|
Goodwill and acquired intangible assets |
|
(795.4 |
) |
(59.2 |
) | ||
|
Other |
|
(6.5 |
) |
(2.8 |
) | ||
|
Gross deferred tax liabilities |
|
(826.3 |
) |
(81.2 |
) | ||
|
|
|
|
|
|
| ||
|
Net deferred tax (liabilities) |
|
$ |
(752.6 |
) |
$ |
(62.4 |
) |
Deferred tax assets and liabilities that relate to the same jurisdiction are recorded net on the Group’s Consolidated Balance Sheets as non-current balances and as of December 31, 2017 and 2016, are as follows (in millions):
|
|
|
December 31, |
| ||||
|
|
|
2017 |
|
2016 |
| ||
|
|
|
|
|
|
| ||
|
Deferred tax assets, net (included in other non-current assets) |
|
$ |
— |
|
$ |
8.3 |
|
|
Deferred tax liabilities, net |
|
(752.6 |
) |
(70.7 |
) | ||
|
Net deferred tax (liabilities) |
|
$ |
(752.6 |
) |
$ |
(62.4 |
) |
A valuation allowance has been established against the deferred tax assets related to the Group’s tax loss carryforward where a history of losses in the respective tax jurisdiction makes it unlikely that the deferred tax asset will be realized or where it is unlikely that the Group would generate sufficient taxable income of the appropriate character to realize the full benefit of the deferred tax asset. The valuation allowance for deferred tax assets increased by $38.4 million in 2017. The increase is primarily attributable to foreign net operating losses and capital losses.
The Group has made no provision for income taxes on undistributed earnings of foreign subsidiaries as most dividends distributed by foreign subsidiaries to their direct parent and ultimately to the Group’s top holding company attract no additional tax. The U.S subsidiaries evaluated liquidity requirements in the U.S. and the capital requirements of the Group’s foreign subsidiaries and concluded that foreign earnings be indefinitely reinvested.
Unrecognized Tax Benefits
The Group operates in several tax jurisdictions and a number of years may elapse before an uncertain tax position, for which the Group has unrecognized tax benefits, is finally resolved. A reconciliation of the beginning and ending liability for the years ended December 31, 2017, 2016 and 2015, is as follows (in millions):
|
|
|
Year ended December 31, |
| |||||||
|
|
|
2017 |
|
2016 |
|
2015 |
| |||
|
|
|
|
|
|
|
|
| |||
|
Balance, as of January 1 |
|
$ |
2.5 |
|
$ |
18.4 |
|
$ |
19.1 |
|
|
Balance acquired from the Merger |
|
5.0 |
|
— |
|
— |
| |||
|
Additions for tax positions of current year |
|
3.4 |
|
— |
|
1.0 |
| |||
|
Additions/(reduction) for tax positions of prior years |
|
0.8 |
|
— |
|
(0.6 |
) | |||
|
Reduction due to settlement with taxing authorities |
|
(0.9 |
) |
(13.1 |
) |
— |
| |||
|
Reduction due to statute expirations |
|
(0.9 |
) |
— |
|
— |
| |||
|
Foreign currency translation |
|
0.3 |
|
(2.8 |
) |
(1.1 |
) | |||
|
Balance, as of December 31 |
|
$ |
10.2 |
|
$ |
2.5 |
|
$ |
18.4 |
|
The entire unrecognized tax benefits, if recognized, would favorably affect the Group’s effective tax rate in future periods.
The Group recognizes interest and penalties on uncertain tax positions as a component of the income tax provision. At December 31, 2017, 2016 and 2015 the total accrued interest balance relating to uncertain tax positions was $1.5 million, $0.7 million and $1.2 million, respectively. Potential penalties at December 31, 2017, 2016 and 2015 were insignificant and have not been accrued.
The Group is subject to U.S. federal income tax, state and local income tax, UK income tax and income tax in several other jurisdictions, all of which can be examined by the relevant taxing authorities. For the Group’s major tax jurisdictions, the tax years that remain open to examination by the taxing authorities at December 31, 2017 are 2014 and onwards for U.S. Federal tax and a number of State tax. A handful of States have open years from 2008 and onwards. The tax years from 2015 and onwards remain open for the UK.
The Internal Revenue Service (“IRS”) is examining the Henderson U.S. federal tax filing for the year ended December 31, 2014. In addition, a number of tax years from 2005 onwards remain open for a limited number of subsidiaries in the UK while cases involving other taxpayers are being litigated through the judicial system, the results of which will resolve the Group’s position for these open years. While examination outcomes are subject to significant uncertainty, they are not expected to be material as the Group has recognized a tax benefit only for those positions that meet the more likely than not recognition threshold. It is reasonably possible that the total amounts of unrecognized tax benefits will change within the next 12 months due to completion of tax authorities’ exams or the expiration of statutes of limitations. Management estimates that the existing liability for uncertain tax positions could decrease by approximately $1.1 million within the next 12 months, ignoring changes due to foreign currency translation.
Note 12 — Other Financial Statement Captions
Other current assets on JHG’s Consolidated Balance Sheets at December 31, 2017 and 2016, are composed of the following (in millions):
|
|
|
December 31, |
| ||||
|
|
|
2017 |
|
2016 |
| ||
|
|
|
|
|
|
| ||
|
Prepaid expenses |
|
$ |
24.1 |
|
$ |
10.8 |
|
|
Deferred acquisition costs |
|
0.6 |
|
3.3 |
| ||
|
Current corporation tax |
|
3.5 |
|
0.9 |
| ||
|
Other current assets |
|
47.7 |
|
13.5 |
| ||
|
Total other current assets |
|
$ |
75.9 |
|
$ |
28.5 |
|
Other non-current assets on the Consolidated Balance Sheets of $21.5 million as of December 31, 2017, primarily relate to deferred consideration for Volantis and equity-method investments. The $8.5 million balance as of December 31, 2016, primarily relates to deferred tax assets.
Accounts payable and accrued liabilities on JHG’s Consolidated Balance Sheets at December 31, 2017 and 2016, comprise the following (in millions):
|
|
|
December 31, |
| ||||
|
|
|
2017 |
|
2016 |
| ||
|
|
|
|
|
|
| ||
|
Accrued commissions |
|
$ |
44.4 |
|
$ |
41.0 |
|
|
Accrued rebates |
|
24.4 |
|
23.4 |
| ||
|
Other accrued liabilities |
|
48.0 |
|
41.9 |
| ||
|
Total other accrued liabilities |
|
$ |
116.8 |
|
$ |
106.3 |
|
|
Current corporation tax |
|
33.7 |
|
17.6 |
| ||
|
Contingent consideration |
|
24.9 |
|
— |
| ||
|
Dai-ichi option |
|
26.1 |
|
— |
| ||
|
Derivatives |
|
10.5 |
|
— |
| ||
|
Other current liabilities |
|
80.9 |
|
17.8 |
| ||
|
Total accounts payable and accrued liabilities |
|
$ |
292.9 |
|
$ |
141.7 |
|
Other non-current liabilities on JHG’s Consolidated Balance Sheets at December 31, 2017 and 2016, comprise the following (in millions):
|
|
|
December 31, |
| ||||
|
|
|
2017 |
|
2016 |
| ||
|
|
|
|
|
|
| ||
|
Non-current tax liabilities |
|
$ |
13.7 |
|
$ |
2.1 |
|
|
Other creditors |
|
20.7 |
|
— |
| ||
|
Deferred consideration |
|
26.2 |
|
25.5 |
| ||
|
Other non-current accrued liabilities |
|
39.0 |
|
11.4 |
| ||
|
Total other non-current liabilities |
|
$ |
99.6 |
|
$ |
39.0 |
|
Other creditors included within other non-current liabilities primarily comprise the non current portion of onerous lease obligations as of December 31, 2017 and 2016. As a result of historic acquisitions, the Group became party to three material operating leases in respect of 1 Knightsbridge Green, London, 8 Lancelot Place, London and Rex House, Queen Street, London. At the reporting date, the lease in respect of 1 Knightsbridge Green had expired and the onerous leases in respect of the other two offices run for a further period of six years and nine years respectively. At the cease use
date of these properties a loss contingency, net of expected sub lease rental income, was recognized in respect of these properties as an accrued liability on the Group’s Consolidated Balance Sheets at the net present value of the net expected future cash outflows.
Other non-current accrued liabilities primarily represent deferred consideration payable on the acquisition of Geneva and Perennial.
Note 13 — Noncontrolling Interests
Redeemable Noncontrolling Interests
Redeemable noncontrolling interests as of December 31, 2017 and 2016, consisted of the following (in millions):
|
|
|
December 31, |
| ||||
|
|
|
2017 |
|
2016 |
| ||
|
|
|
|
|
|
| ||
|
Consolidated seeded investment products |
|
$ |
174.9 |
|
$ |
158.0 |
|
|
Intech: |
|
|
|
|
| ||
|
Appreciation rights |
|
11.0 |
|
— |
| ||
|
Founding member ownership interests |
|
4.4 |
|
— |
| ||
|
Total redeemable noncontrolling interests |
|
$ |
190.3 |
|
$ |
158.0 |
|
Consolidated Seeded Investment Products
Noncontrolling interests in consolidated seeded investment products are classified as redeemable noncontrolling interests when there is an obligation to repurchase units at the investor’s request. Redeemable noncontrolling interests in consolidated seed investment products may fluctuate from period to period and are impacted by changes in JHG’s relative ownership, changes in the amount of third-party investment in seeded products and volatility in the market value of the seeded products’ underlying securities. Third-party redemption of investments is redeemed from the respective product’s net assets and cannot be redeemed from the assets of other seeded products or from the assets of JHG.
The following table presents the movement in redeemable noncontrolling interests in consolidated seeded investment products for the years ended December 31, 2017, 2016 and 2015 (in millions):
|
|
|
Year ended December 31, |
| |||||||
|
|
|
2017 |
|
2016 |
|
2015 |
| |||
|
|
|
|
|
|
|
|
| |||
|
Opening balance |
|
$ |
158.0 |
|
$ |
82.9 |
|
$ |
4.4 |
|
|
Balance acquired from the Merger |
|
23.2 |
|
— |
|
— |
| |||
|
Changes in market value |
|
(9.8 |
) |
35.3 |
|
(5.9 |
) | |||
|
Changes in ownership |
|
3.7 |
|
61.7 |
|
84.5 |
| |||
|
Foreign currency translation |
|
(0.2 |
) |
(21.9 |
) |
(0.1 |
) | |||
|
Closing balance |
|
$ |
174.9 |
|
$ |
158.0 |
|
$ |
82.9 |
|
Changes in ownership reflect third-party investment in consolidated seeded investment products, additional seed capital investment or seed capital redemptions.
Intech
Intech became a subsidiary of the Group as a result of the Merger. Intech ownership interests held by a founding member had an estimated fair value of $4.4 million as of December 31, 2017, representing an approximate 1.1% ownership of Intech. This founding member is entitled to retain his remaining Intech interests until his death and has the option to require JHG to purchase his ownership interests of Intech at fair value.
Intech appreciation rights are being amortized on a graded vesting method over the respective vesting period. The appreciation rights are exercisable upon termination of employment from Intech to the extent vested. Upon exercise, the appreciation rights are settled in Intech equity.
Nonredeemable Noncontrolling Interests
Nonredeemable noncontrolling interests as of December 31, 2017 and 2016, are as follows (in millions):
|
|
|
December 31, |
| ||||
|
|
|
2017 |
|
2016 |
| ||
|
|
|
|
|
|
| ||
|
Nonredeemable noncontrolling interests in: |
|
|
|
|
| ||
|
Seed capital investments |
|
$ |
24.9 |
|
$ |
44.8 |
|
|
Intech |
|
13.3 |
|
— |
| ||
|
Total nonredeemable noncontrolling interests |
|
$ |
38.2 |
|
$ |
44.8 |
|
Note 14 — Long-Term Incentive Compensation
The Group operates the following stock-based compensation plans: Restricted Share Plan, Employee Share Ownership Plan, Long-Term Incentive Plan, Deferred Equity Plan, Buy As You Earn Share Plan, Company Share Option Plan, Executive Shared Ownership Plan, Sharesave Plan, Restricted Stock Awards, Price Vesting Units, Mutual Fund Share Awards and Profits Interests and Other Awards. Further details on the material plans in operation during 2017 are set out below:
Deferred Equity Plan (“DEP”)
Employees who receive cash-based incentive awards over a preset threshold, have an element deferred. The deferred awards are deferred into the Company’s shares, or into Group managed funds. The DEP trustee purchases Company shares and units or shares in Group managed funds and holds them in trust. Awards are deferred for up to three years and vest in three equal tranches if employees satisfy employment conditions at each vesting date
The expense of deferred short-term incentive awards is recognized in net income over the period of deferral on a graded basis, the fair value of which is determined by prevailing share price or unit price at grant date.
Restricted Share Plan (“RSP”)
The RSP allows employees to receive shares in the Group for nil consideration at a future point, usually after three years, and are recognized in net income on a graded basis. The awards are typically granted for staff recruitment and retention purposes — all awards have employment conditions and larger awards generally have performance hurdles. The Compensation Committee approves all awards to Code Staff (employees who perform a significant influence function, senior management and individuals whose professional activities could have a material impact on a firm’s risk profile), any awards over £500,000 and award vestings that exceed £50,000. The fair value of the shares granted is the average intra trading price of the preceding five business days.
Buy As You Earn Share Plan (“BAYE”)
The BAYE is a HMRC approved plan. Eligible employees purchase shares in the Group by investing monthly, up to £150 (annual limit £1,800), which is deducted from their gross salary. For each share purchased (‘partnership share’), for no additional payment, two free matching shares are awarded. Matching shares will be forfeited if purchased shares are withdrawn from the trust within one year.
The non-UK version of the BAYE operates on a similar basis to that of the UK, but each purchased share is matched with one partnership share, which is not subject to forfeiture.
Sharesave Plan (“SAYE”)
The SAYE is a HMRC approved plan. UK employees may participate in more than one scheme but only up to a maximum of £500 per month across all schemes. Employees who participate in the SAYE contribute a monthly amount from their net salary to a savings account. The SAYE vesting period is three years for UK employees.
At the end of the three year vesting period, the employees in the 2017 SAYE can exercise their share options using the funds in their savings account, to subscribe for shares at a pre-set price. The pre-set price was £18.40 per share for 2017 (2016 SAYE: £20.60 and 2015 SAYE: £22.70), a 20% discount to the average share price five business days prior to the award. Employees have up to six months after the three year vesting period to exercise their options and subscribe for shares. Forfeiture provisions apply in the case of approved and unapproved leavers.
The U.S. Employee Share Purchase Plan (‘ESPP’) operates on the same principles as the UK SAYE, but has a two year savings period and a lower discount at 15%. In 2017, ESPP was not offered to U.S. employees. The pre-set option price of prior year awards were $31.20 for 2016 ESPP and $35.50 for 2015 ESPP. Employees may participate in more than one plan, but only up to a plan maximum of $312.50 per month across all plans.
Company Share Option Plan (“CSOP”)
CSOP is a HMRC approved share option plan with the maximum value of unvested options at any time limited to £30,000 for UK employees. No such restrictions apply for overseas employees. Employees can buy Group shares after a three year vesting period at an option price fixed at the start of the scheme. There are no Group performance conditions attached to the options, only employment conditions that must be satisfied, and the exercise period is two years, while U.S. employees have three months to exercise. Executive Directors are not eligible to participate in the CSOP, but they may hold awards made prior to their executive appointment. The CSOP plans are valued using the Black Scholes Option Pricing Model and recognized in net income on a straight line basis. The 2017 CSOP option price was £22.80 (2016 CSOP: £26.10 and 2015 CSOP: £28.48). The 2014 CSOP became exercisable for UK employees in April 2017; the option price was £26.71. The 2015 CSOP became available to exercise for U.S. employees in April 2017 as the U.S. CSOP is a two year plan.
Executive Shared Ownership Plan (“ExSOP”)
The ExSOP is an employee share ownership plan and is aimed at encouraging employee share ownership at middle management level. Executive Directors do not participate in the ExSOP.
Certain employees are invited to acquire jointly, with an employee benefit trust, the beneficial interest in a number of Company shares under the terms of a joint ownership agreement (‘JOA’). Under a JOA, the employee will benefit from any growth in value in excess of a hurdle price fixed at the time of the award subject to employment conditions being satisfied on the vesting date.
The ExSOP scheme is valued using the Black Scholes Option Pricing Model and is recognized in net income on a straight line basis. For the 2017 ExSOP, the market price at grant was £22.62 (ExSOP 2016: £25.00 and ExSOP 2015: £28.21) per share. The hurdle price was set at £24.90 (2016: £28.45 and 2015: £31.05) per share. The shares have a three year vesting period with a subsequent two year exercise period. The 2014 ExSOP became exercisable for employees in April 2017 with a market price at grant of £26.81 and a hurdle price at £29.22.
Restricted Stock Awards (“RSA”)
Restricted Stock Awards are generally issued as part of annual variable compensation and for recruitment and retention purposes in accordance with Amended and Restated 2010 LTI Plan, the JCG 2005 Long Term Incentive Stock Plan and the 2012 EIA Plan. Awards generally vest over a three- or four-year period.
Price-Vesting Units
JCG granted 137,178 price-vesting units to its Chief Executive Officer on December 31, 2014, valued at $2.2 million. At the Closing Date, the price-vesting units were converted to JHG price-vesting units with a value of $2.3 million and were measured based on operating profit margin performance and converted into a time-based award vesting on December 31, 2017. On December 31, 2017, 75,634 price-vesting units vested.
JCG granted 138,901 price-vesting units to its Chief Executive Officer on December 31, 2015, valued at $1.9 million. These price-vesting units may or may not vest in whole or in part, three years after the date of grant, depending on JHG’s three-year Total Shareholder Return (“TSR”) performance relative to a peer group during the vesting period. At the Closing Date, the price-vesting units were converted to 65,548 JHG price-vesting units with a value of $2.0 million. The performance criteria will remain in place post-Merger through the life of the price-vesting units.
JCG granted 134,666 price-vesting units to its Chief Executive Officer on December 31, 2016, valued at $1.8 million. These price-vesting units may or may not vest in whole or in part, three years after the date of grant, depending on JHG’s three-year TSR performance relative to a peer group during the vesting period. At the Closing Date, the price-vesting units were converted to 63,549 JHG price-vesting units with a value of $2.0 million. The performance criteria will remain in place post-Merger through the life of the price-vesting units.
Mutual Fund Share Awards (“MFSA”)
Mutual Fund Share Awards are generally issued as part of annual variable compensation and for recruitment and retention purposes. At December 31, 2017, the cost basis of unvested mutual fund share awards totaled $57.8 million ($49.8 million are time-based and $8.0 million are performance-based). The awards are indexed to certain mutual funds managed by the Group. Upon vesting, participants receive the value of the award adjusted for gains or losses attributable to the mutual funds to which the award was indexed, subject to tax withholding. Time-based awards generally vest four years from the grant date. The performance-based mutual fund share awards vest five years after the grant date if certain performance criteria are achieved.
Perkins Senior Profits Interests Awards
On November 18, 2013, Perkins granted senior profits interests awards, which fully vest on December 31, 2018, and are entitled to a total of 10% of Perkins’ annual taxable income. The entitlement to a percentage of Perkins’ annual taxable income over the vesting period is tiered and starts at 2% in 2015 and increases 2% each year thereafter until reaching 10% after fully vesting on December 31, 2018. In addition, these awards have a formula-driven terminal value based on Perkins’ revenue. JHG can call and terminate any or all of the awards on December 31, 2018, and each year thereafter. Holders of such interests can require JHG to purchase the interests in exchange for the then-applicable formula price on December 31, 2018. The senior profits interests are also subject to termination at premiums or discounts to the formula at the option of JHG or certain employees, as applicable, upon certain corporate or employment-related events affecting Perkins or certain employees. As of December 31, 2017, the formula-driven value was zero and there was no liability on JHG’s Consolidated Balance Sheets.
Intech Long-Term Incentive Awards
In October 2014, Intech granted long-term incentive awards to retain and incentivize employees. The awards consisted of appreciation rights, profits interests and phantom interests, and are designed to give recipients and equity-like stake in Intech. Upon the Closing Date of the Merger, the appreciation rights had fair value of $13.3 million which is being amortized on a graded basis over the 10-year vesting schedule. The appreciation rights are exercisable upon termination of employment from Intech and to the extent vested. Upon exercise, the appreciation rights are settled in Intech equity.
The profits interests and phantom interests awards entitle recipients to 9.2% of Intech’s pre-incentive profits.
Additional appreciation rights were granted in February 2015 and March 2016. Upon the closing date of the Merger, the 2015 and 2016 appreciation rights had fair value of $0.9 million and $1.8 million, respectively, which is being amortized on a graded basis over the remaining vesting schedule. The appreciation rights are exercisable upon termination of employment from Intech and to the extent vested. Upon exercise, the appreciation rights are settled in Intech equity.
The fair values of the appreciation rights were estimated using the Black-Scholes option pricing model with the following assumptions:
|
|
|
Assumptions | |||||||
|
|
|
October 2014 |
|
February 2015 |
|
March 2016 | |||
|
|
|
grant |
|
grant |
|
grant | |||
|
|
|
|
|
|
|
| |||
|
Dividend yield |
|
1.98% |
|
2.56% |
|
2.89% | |||
|
Expected volatility |
|
34% |
|
30% |
|
28% | |||
|
Risk-free interest rate |
|
2.53% |
|
1.81% |
|
1.93% | |||
|
Expected life (in years) |
|
12 |
|
6 |
|
6 | |||
|
Grant date fair value (in millions) |
|
$ |
23.2 |
|
$ |
2.0 |
|
$ |
2.6 |
|
Merger date fair value (in millions) |
|
$ |
13.3 |
|
$ |
0.9 |
|
$ |
1.8 |
The dividend yield and expected volatility were determined using historical data from publicly traded peers. The risk-free interest rate for the 2014 grant is based on the 10-year U.S. Treasury note at the time of the grant while the risk-free interest rates for the 2015 and 2016 grants are based on the average of the five-year and seven-year U.S. Treasury notes at the time of the grant. The expected life of the appreciation rights was estimated based upon the assumption that recipients terminate upon vesting and exercise a certain percentage of their rights each year over the following four years.
Intech profits interests and phantom interests entitle holders to periodic distributions of a portion of Intech operating income. Distributions are made during employment and, for profits interests, post-employment for up to 10 years. Phantom interests are entitled to a one-time distribution at termination of employment. Compensation expense for post-employment distributions is based upon the present value of expected future distributions and will be recognized pro rata over the 10-year vesting schedule for profits interests and five years for phantom interests. The present value of these payments was determined using a 2% discount rate, which represents the interest rate on a 20-year U.S. Treasury note. As of December 31, 2017, the total undiscounted estimated post-employment payments for profits interests and phantom interests was $49.8 million (the majority will not be paid until 10 to 20 years after the grant date). The estimated post-employment payments will be evaluated and adjusted quarterly, as necessary, with changes recorded in results of operations. As of December 31, 2017, the carrying value of the liability associated with the Intech profits interests and phantom interests was $13.6 million and is included in other non-current assets on JHG’s Consolidated Balance Sheets.
Long-Term Incentive Plan (“LTIP”)
LTIP awards provide selected employees restricted shares or nil cost options that have employment and performance conditions. Employees who have been awarded such options have five years to exercise their options following the three year vesting period for 2013 LTIP and five and four years to exercise their options following the three and four year vesting periods (respectively) for 2014 LTIP.
For 2014 LTIP, if the Group TSR is between the 50th and 75th percentiles, the amount vesting will increase on a linear basis. The Compensation Committee must also be satisfied the Group TSR reflects the underlying performance of the Group. The performance hurdle was 95% relative to Group TSR and 5% on risk and sustainability metrics. Employees must also satisfy employment conditions at each anniversary date for the shares to vest.
Two-thirds of the 2015 and 2016 LTIP can be exercised from the end of year three and one-third from the end of year four.
The 2015 and 2016 LTIP award vesting and release of the award are subject to performance against the following performance conditions measured (as appropriate) over, or at the end of, the relevant three or four year performance period (in respect of the first and second tranche of the award respectively):
|
2015 and 2016 awards criteria (pre-Merger) |
|
Weighting |
|
|
|
|
|
|
|
Market conditions |
|
|
|
|
FTSE 350 |
|
25% |
|
|
ASX 100 |
|
25% |
|
|
Non-Market |
|
|
|
|
Net Fund Flows Condition |
|
15% |
|
|
Investment Performance Condition |
|
15% |
|
|
Operating Margin Condition |
|
10% |
|
|
People Strategy Condition |
|
10% |
|
Following the completion of the Merger with JCG, the Compensation Committee reviewed the performance metrics under the existing LTIP plans and proposed changes to ensure that the metrics remain relevant and appropriate for the objectives and goals of the combined Group. 2014 LTIP vesting conditions remain unchanged and the existing performance metrics were measured as at May 30, 2017 to determine the appropriate level of vesting. The vested portion of the 2015 and 2016 LTIP awards remain subject to the original metrics (measured at the Merger completion date) while the new criteria were applied to the unvested portion:
|
2015 and 2016 awards criteria (post-Merger) |
|
Weighting |
|
|
|
|
|
|
|
Market conditions |
|
|
|
|
Relative TSR |
|
50% |
|
|
Non-Market |
|
|
|
|
Relative investment performance |
|
25% |
|
|
Relative net income before tax growth |
|
25% |
|
In respect of the first tranche of the award, an additional holding period of two years shall apply commencing on the relevant vesting date, during which time the participant may not sell, pledge, charge, assign, dispose of or otherwise transfer ownership of the underlying share pertaining to the award, other than to meet mandatory liabilities to tax and/or social security contributions. In respect of the second tranche of the award, an additional holding period of one year shall apply commencing on the relevant vesting date with similar conditions.
The performance period for the first tranche of 2014 LTIP was completed on December 31, 2016 and 3% of awards vested in April 2017. The performance period for the second tranche of 2014 LTIP was completed on December 31, 2017 and 3% of awards will vest in April 2018. The Monte Carlo model was used to value the options of the 2015 and 2016 plans.
The performance period for the first tranche of 2015 LTIP was completed on December 31, 2017. 25% of the pre-Merger awards and 74.6% of the post-Merger awards will vest in April 2018.
The components of the Group’s long-term incentive compensation expense for the years ended December 31, 2017, 2016 and 2015 are summarized as follows (in millions):
|
|
|
Year ended December 31, |
| |||||||
|
|
|
2017 |
|
2016 |
|
2015 |
| |||
|
|
|
|
|
|
|
|
| |||
|
DEP |
|
$ |
17.6 |
|
$ |
17.5 |
|
$ |
18.6 |
|
|
LTIP |
|
6.4 |
|
7.5 |
|
8.7 |
| |||
|
RSP |
|
3.4 |
|
5.1 |
|
8.3 |
| |||
|
BAYE |
|
3.2 |
|
3.0 |
|
2.9 |
| |||
|
ExSOP |
|
1.5 |
|
1.9 |
|
2.0 |
| |||
|
CSOP |
|
1.1 |
|
1.4 |
|
1.7 |
| |||
|
SAYE |
|
0.8 |
|
0.7 |
|
0.8 |
| |||
|
RSA |
|
32.8 |
|
— |
|
— |
| |||
|
ESOP |
|
— |
|
0.2 |
|
0.6 |
| |||
|
Stock-based payments expense |
|
66.8 |
|
37.3 |
|
43.6 |
| |||
|
DEP Funds — liability settled |
|
41.4 |
|
35.0 |
|
24.6 |
| |||
|
MFSA — liability settled |
|
20.7 |
|
— |
|
— |
| |||
|
Profits interests and other |
|
12.3 |
|
— |
|
— |
| |||
|
Social Security costs |
|
10.3 |
|
13.2 |
|
16.5 |
| |||
|
Total charge to the Consolidated Statements of Comprehensive Income |
|
$ |
151.5 |
|
$ |
85.5 |
|
$ |
84.7 |
|
At December 31, 2017, unrecognized and unearned compensation, based on vesting outcomes as of December 31, 2017 on the 2017 LTIP, and the weighted-average number of years over which the compensation cost will be recognized is summarized as follows (in millions):
|
|
|
Unrecognized |
|
Weighted- |
| |||
|
|
|
compensation |
|
average years |
| |||
|
|
|
|
|
|
| |||
|
DEP |
|
|
$ |
11.8 |
|
|
1.4 |
|
|
LTIP |
|
|
11.9 |
|
|
1.4 |
| |
|
RSP |
|
|
8.4 |
|
|
1.9 |
| |
|
BAYE |
|
|
1.0 |
|
|
0.6 |
| |
|
ExSOP |
|
|
1.9 |
|
|
1.7 |
| |
|
CSOP |
|
|
2.9 |
|
|
1.8 |
| |
|
SAYE |
|
|
3.4 |
|
|
2.2 |
| |
|
RSA |
|
|
49.0 |
|
|
2.7 |
| |
|
Stock-based payments expense |
|
|
90.3 |
|
|
2.2 |
| |
|
DEP Funds — Liability settled |
|
|
29.7 |
|
|
1.4 |
| |
|
MFSA — liability settled |
|
|
21.5 |
|
|
2.4 |
| |
|
Profits interests and other |
|
|
37.9 |
|
|
6.2 |
| |
|
Social Security costs |
|
|
19.2 |
|
|
1.0 |
| |
|
Total remaining charge to the Consolidated Statements of Comprehensive Income |
|
|
$ |
198.6 |
|
|
2.7 |
|
The Group generally grants annual long-term incentive awards in March and April in relation to annual awards but also throughout the year due to seasonality of performance fee bonuses.
Stock Options
Stock options were granted to employees in 2017, 2016 and 2015. The fair value of stock options granted to the Group’s employees in 2017 was estimated on the date of each grant using the Black-Scholes option pricing model and a Monte Carlo Model, with the following assumptions:
Black-Scholes Options Pricing Model
|
|
|
Year ended December 31, |
| ||||||||||||||||
|
|
|
2017 |
|
2016 |
| ||||||||||||||
|
|
|
CSOP |
|
U.S. CSOP |
|
ExSOP |
|
SAYE |
|
CSOP |
|
U.S. CSOP |
|
ExSOP |
|
SAYE |
|
U.S. SAYE |
|
|
|
|
|
|
|
|
|
|
|
|
|
|
|
|
|
|
|
|
|
|
|
Fair value of options granted (pence) |
|
33.43 |
|
32.81 |
|
27.78 |
|
75.28 |
|
33.51 |
|
27.01 |
|
27.40 |
|
58.49 |
|
64.71 |
|
|
Assumptions: |
|
|
|
|
|
|
|
|
|
|
|
|
|
|
|
|
|
|
|
|
Dividend yield |
|
4.64 |
% |
4.64 |
% |
4.64 |
% |
3.99 |
% |
4.12 |
% |
4.12 |
% |
4.12 |
% |
3.98 |
% |
3.98 |
% |
|
Expected volatility |
|
32.41 |
% |
35.19 |
% |
32.41 |
% |
32.13 |
% |
30.26 |
% |
29.67 |
% |
30.26 |
% |
29.72 |
% |
29.35 |
% |
|
Risk-free interest rate |
|
0.27 |
% |
0.16 |
% |
0.27 |
% |
0.19 |
% |
0.58 |
% |
0.45 |
% |
0.58 |
% |
0.53 |
% |
0.40 |
% |
|
Expected life (years) |
|
3 |
|
2 |
|
3 |
|
3 |
|
3 |
|
2 |
|
3 |
|
3 |
|
2 |
|
Monte Carlo Model — LTIP 2015
|
|
|
Year ended December 31, 2017 |
| ||||
|
|
|
% Allocation |
|
|
|
|
|
|
|
|
of award |
|
Tranche 1 |
|
Tranche 2 |
|
|
|
|
|
|
|
|
|
|
|
Fair Values: |
|
|
|
|
|
|
|
|
Relative TSR |
|
50% |
|
118.96p |
|
124.11p |
|
|
Relative investment performance |
|
25% |
|
209.76p |
|
206.59p |
|
|
Relative net income before tax growth |
|
25% |
|
209.76p |
|
206.59p |
|
|
Assumptions: |
|
|
|
|
|
|
|
|
Date of grant |
|
|
|
May 1, 2015 |
|
May 1, 2015 |
|
|
Start of performance period |
|
|
|
January 1, 2015 |
|
January 1, 2015 |
|
|
End of performance period |
|
|
|
December 31, 2017 |
|
December 31, 2018 |
|
|
Vesting date |
|
|
|
May 1, 2018 |
|
May 1, 2019 |
|
|
Date of modification (“DoM”) |
|
|
|
May 1, 2017 |
|
May 1, 2017 |
|
|
Share price at DoM |
|
|
|
233.7p |
|
233.7p |
|
|
Risk free discount rate |
|
|
|
0.1% pa |
|
0.1%pa |
|
|
Dividend yield |
|
|
|
4.5% pa |
|
4.5% pa |
|
|
Share price volatility in GBP |
|
|
|
30% pa |
|
30% pa |
|
|
Holding period adjustment |
|
|
|
9.0% |
|
6.2% |
|
|
Percentage based on pre-modification performance conditions |
|
|
|
80% |
|
60% |
|
Monte Carlo Model — LTIP 2016
|
|
|
Year Ended December 31, 2017 |
| ||||
|
|
|
% allocation |
|
|
|
|
|
|
|
|
of award |
|
Tranche 1 |
|
Tranche 2 |
|
|
|
|
|
|
|
|
|
|
|
Fair values: |
|
|
|
|
|
|
|
|
Relative TSR |
|
50% |
|
120.98p |
|
123.64p |
|
|
Relative investment performance |
|
25% |
|
200.42p |
|
197.39p |
|
|
Relative net income before tax growth |
|
25% |
|
200.42p |
|
197.39p |
|
|
Assumptions: |
|
|
|
|
|
|
|
|
Date of grant |
|
|
|
May 1, 2016 |
|
May 1, 2016 |
|
|
Start of performance period |
|
|
|
January 1, 2016 |
|
January 1, 2016 |
|
|
End of performance period |
|
|
|
December 31, 2018 |
|
December 31, 2019 |
|
|
Vesting date |
|
|
|
March 24, 2019 |
|
March 24, 2020 |
|
|
Date of modification (“DoM”) |
|
|
|
May 30, 2017 |
|
May 30, 2017 |
|
|
Share price at DoM |
|
|
|
233.7p |
|
233.7p |
|
|
Risk free discount rate |
|
|
|
0.1% pa |
|
0.1%pa |
|
|
Dividend yield |
|
|
|
4.5% pa |
|
4.5% pa |
|
|
Share price volatility in GBP |
|
|
|
30% pa |
|
30% pa |
|
|
Holding period adjustment |
|
|
|
9.0% |
|
6.2% |
|
Expected volatility was determined using an average of Henderson’s historical volatility. Expected life was determined using the vesting periods of each grant. The risk-free interest rate for periods within the contractual life of the options is based on the UK Treasury 3 year coupon rate and 2 year coupon rate respectively at grant date.
The table below summarizes the Group’s outstanding options, exercisable options and options vested or expected to vest for the years ended December 31, 2017, 2016 and 2015:
|
|
|
2017 |
|
2016 |
|
2015 |
| |||||||||
|
|
|
|
|
Weighted- |
|
|
|
Weighted- |
|
|
|
Weighted- |
| |||
|
|
|
|
|
average |
|
|
|
average |
|
|
|
average |
| |||
|
|
|
Shares |
|
price |
|
Shares |
|
price |
|
Shares |
|
price |
| |||
|
|
|
|
|
|
|
|
|
|
|
|
|
|
| |||
|
Outstanding at January 1 |
|
45,560,242 |
|
$ |
1.97 |
|
43,890,407 |
|
£ |
1.34 |
|
50,187,980 |
|
£ |
0.93 |
|
|
Share consolidation |
|
(41,004,619 |
) |
$ |
19.82 |
|
— |
|
£ |
— |
|
— |
|
£ |
— |
|
|
Acquired from Merger |
|
92,949 |
|
$ |
18.76 |
|
— |
|
£ |
— |
|
— |
|
£ |
— |
|
|
Granted |
|
2,042,321 |
|
$ |
13.66 |
|
16,251,758 |
|
£ |
1.53 |
|
15,375,429 |
|
£ |
1.70 |
|
|
Exercised |
|
(404,735 |
) |
$ |
20.32 |
|
(11,039,274 |
) |
£ |
0.73 |
|
(12,818,494 |
) |
£ |
0.79 |
|
|
Forfeited |
|
(1,966,452 |
) |
$ |
7.41 |
|
(3,542,649 |
) |
£ |
1.81 |
|
(8,854,508 |
) |
£ |
0.45 |
|
|
Outstanding at December 31 |
|
4,319,706 |
|
$ |
22.55 |
|
45,560,242 |
|
£ |
1.53 |
|
43,890,407 |
|
£ |
1.34 |
|
|
Exercisable (1) |
|
663,342 |
|
$ |
34.67 |
|
5,014,642 |
|
£ |
0.87 |
|
2,419,325 |
|
£ |
0.66 |
|
|
Vested or expected to vest |
|
2,999,811 |
|
$ |
15.57 |
|
24,849,673 |
|
£ |
0.44 |
|
39,184,673 |
|
£ |
1.13 |
|
Included in the above table is the Group’s nil cost LTIP options which constitute the majority of forfeitures.
(1) The number of exercisable options represents instruments for which all vesting criteria have been satisfied and whose exercise price was below the closing price of the Group’s common stock as of the end of the period.
The following table summarizes the intrinsic value of exercised, outstanding and exercisable options at December 31, 2017, 2016 and 2015 (in millions):
|
|
|
December 31, |
| |||||||
|
|
|
2017 |
|
2016 |
|
2015 |
| |||
|
|
|
|
|
|
|
|
| |||
|
Exercised |
|
$ |
2.8 |
|
£ |
18.9 |
|
£ |
26.7 |
|
|
Outstanding |
|
$ |
15.9 |
|
£ |
47.7 |
|
£ |
77.0 |
|
|
Exercisable |
|
$ |
3.9 |
|
£ |
7.5 |
|
£ |
5.9 |
|
Deferred Equity Plan
The table below summarizes DEP unvested stock awards for the years ended December 31, 2017, 2016 and 2015:
|
|
|
2017 |
|
2016 |
|
2015 |
| |||||||||
|
|
|
|
|
Weighted- |
|
|
|
Weighted- |
|
|
|
Weighted- |
| |||
|
|
|
|
|
average |
|
|
|
average |
|
|
|
average |
| |||
|
|
|
Shares |
|
price |
|
Shares |
|
price |
|
Shares |
|
price |
| |||
|
|
|
|
|
|
|
|
|
|
|
|
|
|
| |||
|
Outstanding at January 1 |
|
16,466,630 |
|
$ |
3.17 |
|
26,653,694 |
|
£ |
1.79 |
|
39,546,315 |
|
£ |
1.44 |
|
|
Share consolidation |
|
(14,825,509 |
) |
$ |
31.64 |
|
— |
|
£ |
— |
|
— |
|
£ |
— |
|
|
Adjustment |
|
1,275 |
|
$ |
15.43 |
|
— |
|
£ |
— |
|
8,210 |
|
£ |
2.18 |
|
|
Granted |
|
919,967 |
|
$ |
31.40 |
|
9,134,443 |
|
£ |
2.47 |
|
6,742,546 |
|
£ |
2.82 |
|
|
Exercised |
|
(873,810 |
) |
$ |
31.33 |
|
(16,862,324 |
) |
£ |
1.63 |
|
(18,464,223 |
) |
£ |
1.40 |
|
|
Forfeited |
|
(246,462 |
) |
$ |
28.06 |
|
(2,459,183 |
) |
£ |
1.59 |
|
(1,179,154 |
) |
£ |
2.05 |
|
|
Unvested at December 31 |
|
1,442,091 |
|
$ |
32.36 |
|
16,466,630 |
|
£ |
2.46 |
|
26,653,694 |
|
£ |
1.79 |
|
Restricted Stock Awards
The table below summarizes unvested restricted stock awards for the year ended December 31, 2017:
|
|
|
2017 |
| |||
|
|
|
|
|
Weighted- |
| |
|
|
|
|
|
average |
| |
|
|
|
Shares |
|
price |
| |
|
|
|
|
|
|
| |
|
Outstanding at January 1 |
|
— |
|
$ |
— |
|
|
Acquired from the Merger |
|
4,068,619 |
|
$ |
30.72 |
|
|
Granted |
|
73,982 |
|
$ |
35.08 |
|
|
Exercised |
|
(444,884 |
) |
$ |
30.73 |
|
|
Forfeited |
|
(160,496 |
) |
$ |
30.72 |
|
|
Unvested at December 31 |
|
3,537,221 |
|
$ |
30.81 |
|
Note 15 — Retirement Benefit Plans
Defined Contribution Plans
The Group operates two separate defined contribution retirement benefit plans; a 401(k) plan for U.S. employees and a separate plan for international employees.
Substantially all U.S. full-time employees of JHG are eligible to participate in a company-sponsored 401(k) plan. During the year ended December 31, 2017, JHG matched 5.0% of employee-eligible
compensation in the 401(k) Plan. Expenses related to the 401(k) plan are included in employee compensation and benefits on JHG’s Consolidated Statements of Comprehensive Income and were $8.6 million during the year ended December 31, 2017. The assets of the plan are held separately from those of the Group in trustee administered funds.
Substantially all non-U.S. full-time employees of JHG are eligible to participate in company-sponsored defined contribution plans. The total amounts charged to the Consolidated Statements of Comprehensive Income for the years ended December 31, 2017, 2016 and 2015 in respect of the non-U.S. defined contribution plan was $11.8 million, $11.6 million and $11.7 million, respectively, which represents contributions paid or payable to this plan by the Group.
Defined Benefit Plans
The main defined benefit pension plan sponsored by the Group is the defined benefit section of the Janus Henderson Group UK Pension Scheme (“JHGPS” or the “Plan”), previously the Henderson Group Pension Scheme, which closed to new members on November 15, 1999. The JHGPS is funded by contributions to a separately administered fund.
Benefits in the defined benefit section of the JHGPS are based on service and final salary. The plan is approved by HMRC for tax purposes and is operated separately from the Group and managed by an independent Trustee board. The Trustee is responsible for payment of the benefits and management of the JHGPS assets. The Group also has a contractual obligation to provide certain members of the JHGPS with additional defined benefits on an unfunded basis.
The JHGPS is subject to UK regulations, which require the Group and the Trustee to agree to a funding strategy and contribution schedule for the scheme.
The Group’s latest triennial valuation of the JHGPS has resulted in a deficit on a technical provisions basis of $39.2 million (£29.0 million). The Group agreed with the trustees of the plan to make contributions of $11.4 million (£8.4 million) per year for four years starting from 2017 to recover the deficit.
Plan assets and benefit obligations
The Plan assets and defined benefit obligations of the JHGPS and the unapproved pension plan were valued as of December 31, 2017. The Group’s plan assets, benefit obligations and funded status as at the December 31 measurement date are as follows (in millions):
|
|
|
December 31, |
| ||||
|
|
|
2017 |
|
2016 |
| ||
|
|
|
|
|
|
| ||
|
Change in plan assets: |
|
|
|
|
| ||
|
Fair value of plan assets as of January 1 |
|
$ |
877.3 |
|
$ |
877.2 |
|
|
Return on plan assets |
|
34.8 |
|
183.3 |
| ||
|
Employer contributions |
|
20.5 |
|
3.0 |
| ||
|
Benefits paid |
|
(13.8 |
) |
(30.8 |
) | ||
|
Settlements |
|
(58.6 |
) |
— |
| ||
|
Foreign currency translation |
|
81.6 |
|
(155.4 |
) | ||
|
Fair value of plan assets as of December 31 |
|
941.8 |
|
877.3 |
| ||
|
Change in benefit obligation: |
|
|
|
|
| ||
|
Benefit obligation as of January 1 |
|
(679.2 |
) |
(674.5 |
) | ||
|
Service cost |
|
(1.2 |
) |
(1.2 |
) | ||
|
Interest cost |
|
(19.2 |
) |
(22.6 |
) | ||
|
Settlements |
|
58.6 |
|
— |
| ||
|
Benefits paid |
|
13.8 |
|
30.8 |
| ||
|
Actuarial loss |
|
(29.8 |
) |
(131.6 |
) | ||
|
Foreign currency translation |
|
(62.1 |
) |
119.9 |
| ||
|
Benefit obligation as of December 31 |
|
(719.1 |
) |
(679.2 |
) | ||
|
Funded status as at year end |
|
222.7 |
|
198.1 |
| ||
|
Tax at source |
|
(28.0 |
) |
(29.8 |
) | ||
|
Net retirement benefit asset recognized in the Consolidated Balance Sheets |
|
$ |
194.7 |
|
$ |
168.3 |
|
Amounts recognized on the Consolidated Balance Sheet, net of tax at source as at December 31, 2017 and 2016, consist of the following (in millions):
|
|
|
December 31, |
| ||||
|
|
|
2017 |
|
2016 |
| ||
|
|
|
|
|
|
| ||
|
Retirement benefit assets recognized in the Consolidated Balance Sheets: |
|
|
|
|
| ||
|
Janus Henderson Group UK Pension Scheme |
|
$ |
199.3 |
|
$ |
180.2 |
|
|
Retirement benefit obligations recognized in the Consolidated Balance Sheets: |
|
|
|
|
| ||
|
Janus Henderson Group unapproved pension scheme |
|
(4.6 |
) |
(11.9 |
) | ||
|
Net retirement benefit asset recognized in the Consolidated Balance Sheets: |
|
$ |
194.7 |
|
$ |
168.3 |
|
The following key assumptions were used in determining the defined benefit obligation as at December 31, 2017 and 2016:
|
|
|
December 31, |
| ||
|
|
|
2017 |
|
2016 |
|
|
|
|
|
|
|
|
|
Discount rate |
|
2.6 |
% |
2.9 |
% |
|
Inflation — salaries |
|
2.5 |
% |
2.5 |
% |
|
Inflation — RPI |
|
3.1 |
% |
3.2 |
% |
|
Inflation — CPI |
|
2.0 |
% |
2.1 |
% |
|
Pension increases (RPI capped at 5% p.a.) |
|
3.0 |
% |
3.0 |
% |
|
Pension increases (RPI capped at 2.5% p.a.) |
|
2.1 |
% |
2.1 |
% |
|
Life expectancy of male aged 60 at accounting date |
|
28.3 |
|
28.6 |
|
|
Life expectancy of male aged 60 in 15 years time |
|
29.4 |
|
29.9 |
|
The discount rate applied to the plan obligations is based on AA-rated corporate bond yields with similar maturities.
Plan assets
The fair values of the JHGPS plan assets as at December 31, 2017 and 2016, by major asset class, are as follows (in millions):
|
|
|
December 31, |
| ||||
|
|
|
2017 |
|
2016 |
| ||
|
|
|
|
|
|
| ||
|
Cash and cash equivalents |
|
$ |
10.8 |
|
$ |
3.9 |
|
|
Money market instruments |
|
1.7 |
|
— |
| ||
|
Forward foreign exchange contracts |
|
0.4 |
|
(0.8 |
) | ||
|
Bond assets |
|
745.2 |
|
694.0 |
| ||
|
Equity investments |
|
183.7 |
|
180.2 |
| ||
|
Total assets at fair value |
|
$ |
941.8 |
|
$ |
877.3 |
|
As of December 31, 2017, $231.1 million of JHGPS assets were held in JHG managed funds.
The assets of the JHGPS are allocated to a growth portfolio and to bond assets. The majority of the growth portfolio is invested in pooled diversified funds, with the objective of achieving a level of growth greater than the bond portfolio. The bond portfolio is managed on a segregated basis, with the primary objective of meeting the cash flows as they mature.
The strategic allocation as at December 31, 2017 and 2016 was broadly 25% growth portfolio and 75% bond assets.
As of December 31, 2017, $232.8 million of the JHGPS plan assets held were classified as Level 2 in the fair value hierarchy, with the remainder classified as Level 1.
The following table shows a reconciliation of the beginning and ending fair value measurement for Level 3 assets (in millions):
|
|
|
December 31, |
| ||||
|
|
|
2017 |
|
2016 |
| ||
|
|
|
|
|
|
| ||
|
Fair value of Level 3 assets at beginning of year |
|
$ |
— |
|
$ |
0.4 |
|
|
Losses recognized in the period |
|
— |
|
(0.3 |
) | ||
|
Purchases, sales and settlements, net |
|
— |
|
(0.1 |
) | ||
|
Fair value of Level 3 assets at end of year |
|
$ |
— |
|
$ |
— |
|
The expected rate of return on assets for the financial period ending December 31, 2017 was 2.6% p.a. based on financial conditions as at December 31, 2016 (2016: 3.4% p.a.). This rate is derived by taking the weighted average of the long-term expected rate of return on each of the asset classes in JHGPS’s target asset allocation. The expected rate of return has been determined based on yields on either long-dated government bonds or relevant corporate bonds, dependent on the class of asset in question, adjusted where appropriate based on the individual characteristics of each asset class.
Actuarial gains and losses
Cumulative amounts recognized in accumulated other comprehensive income and the actuarial gain, net of tax deducted at source, credited to other comprehensive income for the years ended December 31, 2017 and 2016 are shown below (in millions):
|
|
|
December 31, |
| ||||
|
|
|
2017 |
|
2016 |
| ||
|
|
|
|
|
|
| ||
|
Opening accumulated unamortized actuarial gain |
|
$ |
32.1 |
|
$ |
17.1 |
|
|
Current year actuarial gain (loss) |
|
(15.3 |
) |
26.1 |
| ||
|
Tax at source on current year actuarial gain (loss) |
|
4.7 |
|
(11.1 |
) | ||
|
Release of actuarial gain due to settlement event |
|
(1.6 |
) |
— |
| ||
|
Release of tax at source due to settlement event |
|
1.1 |
|
— |
| ||
|
Closing accumulated unamortized actuarial gain |
|
$ |
21.0 |
|
$ |
32.1 |
|
No actuarial gains were amortized from accumulated other comprehensive income during the year ended December 31, 2017 (2016: nil). No actuarial gains are expected to be amortized from accumulated other comprehensive income into net periodic benefit cost during 2018.
Net periodic benefit cost
The components of net periodic benefit cost in respect of defined benefit plans for the years ended December 31, 2017, 2016 and 2015 include the following (in millions):
|
|
|
December 31, |
| |||||||
|
|
|
2017 |
|
2016 |
|
2015 |
| |||
|
|
|
|
|
|
|
|
| |||
|
Service cost |
|
$ |
(1.2 |
) |
$ |
(1.2 |
) |
$ |
(1.5 |
) |
|
Settlement gain |
|
1.6 |
|
— |
|
— |
| |||
|
Interest cost |
|
(19.2 |
) |
(22.6 |
) |
(25.8 |
) | |||
|
Expected return on plan assets |
|
20.3 |
|
25.6 |
|
27.8 |
| |||
|
Net periodic benefit credit |
|
1.5 |
|
1.8 |
|
0.5 |
| |||
|
Contributions to money purchase section |
|
(7.4 |
) |
(7.5 |
) |
(8.1 |
) | |||
|
Total cost |
|
$ |
(5.9 |
) |
$ |
(5.7 |
) |
$ |
(7.6 |
) |
The following key assumptions were used in determining the net periodic benefit cost for the years ended December 31, 2017, 2016 and 2015 (in millions):
|
|
|
December 31, |
| ||||
|
|
|
2017 |
|
2016 |
|
2015 |
|
|
|
|
|
|
|
|
|
|
|
Discount rate |
|
2.9 |
% |
3.8 |
% |
3.6 |
% |
|
Inflation — salaries |
|
2.5 |
% |
2.5 |
% |
2.5 |
% |
|
Inflation — RPI |
|
3.2 |
% |
3.0 |
% |
3.1 |
% |
|
Inflation — CPI |
|
2.1 |
% |
2.0 |
% |
2.1 |
% |
|
Pension increases (RPI capped at 5% p.a.) |
|
3.0 |
% |
2.9 |
% |
3.0 |
% |
|
Pension increases (RPI capped at 2.5% p.a.) |
|
2.1 |
% |
2.0 |
% |
2.1 |
% |
|
Expected return on plan assets |
|
2.6 |
% |
3.4 |
% |
3.2 |
% |
|
Amortization period for net actuarial gains/losses at beginning of the year |
|
11.0 |
|
11.0 |
|
11.0 |
|
Cash flows
Employer contributions of $20.5 million were paid in relation to the Group’s defined benefit pension plans during 2017 (excluding credits to members’ Money Purchase accounts). The Group expects to contribute approximately $12.9 million to the JHGPS (excluding credits to members’ Money purchase accounts) in the year ended December 31, 2018. This includes the additional contributions agreed with the Trustees.
The expected future benefit payments for the Group’s pension plan are as follows (in millions):
|
2018 |
|
$ |
17.6 |
|
|
2019 |
|
$ |
19.3 |
|
|
2020 |
|
$ |
19.9 |
|
|
2021 |
|
$ |
21.6 |
|
|
2022 |
|
$ |
23.3 |
|
|
2023-2027 |
|
$ |
134.5 |
|
Note 16 — Accumulated Other Comprehensive Loss
Changes in accumulated other comprehensive loss, net of tax, for the years ended December 31, 2017 and 2016, are as follows (in millions):
|
|
|
Year ended December 31, |
| ||||||||||||||||||||||
|
|
|
2017 |
|
2016 |
| ||||||||||||||||||||
|
|
|
|
|
Available- |
|
Retirement |
|
|
|
|
|
Available- |
|
Retirement |
|
|
| ||||||||
|
|
|
Foreign |
|
for-sale |
|
benefit |
|
|
|
Foreign |
|
for-sale |
|
benefit |
|
|
| ||||||||
|
|
|
currency |
|
securities |
|
asset, net |
|
Total |
|
currency |
|
securities |
|
asset, net |
|
Total |
| ||||||||
|
|
|
|
|
|
|
|
|
|
|
|
|
|
|
|
|
|
| ||||||||
|
Beginning balance |
|
$ |
(471.3 |
) |
$ |
4.7 |
|
$ |
32.1 |
|
$ |
(434.5 |
) |
$ |
(211.8 |
) |
$ |
5.1 |
|
$ |
17.1 |
|
$ |
(189.6 |
) |
|
Other comprehensive income (loss) before reclassifications |
|
125.0 |
|
1.9 |
|
(10.6 |
) |
116.3 |
|
(247.1 |
) |
0.8 |
|
15.0 |
|
(231.3 |
) | ||||||||
|
Amounts reclassified from accumulated other comprehensive income (loss) |
|
— |
|
(3.9 |
) |
(0.5 |
) |
(4.4 |
) |
— |
|
(1.2 |
) |
— |
|
(1.2 |
) | ||||||||
|
Total other comprehensive income (loss) |
|
125.0 |
|
(2.0 |
) |
(11.1 |
) |
111.9 |
|
(247.1 |
) |
(0.4 |
) |
15.0 |
|
(232.5 |
) | ||||||||
|
Less: other comprehensive loss (income) attributable to noncontrolling interests |
|
21.0 |
|
(0.2 |
) |
— |
|
20.8 |
|
(12.4 |
) |
— |
|
— |
|
(12.4 |
) | ||||||||
|
Ending balance |
|
$ |
(325.3 |
) |
$ |
2.5 |
|
$ |
21.0 |
|
$ |
(301.8 |
) |
$ |
(471.3 |
) |
$ |
4.7 |
|
$ |
32.1 |
|
$ |
(434.5 |
) |
The components of other comprehensive income (loss), net of tax for the years ended December 31, 2017, 2016 and 2015, are as follows (in millions):
|
|
|
Pre-tax |
|
Tax |
|
Net |
| |||
|
Year ended December 31, 2017 |
|
amount |
|
expense |
|
amount |
| |||
|
|
|
|
|
|
|
|
| |||
|
Net unrealized losses on available-for-sale securities |
|
$ |
1.9 |
|
$ |
— |
|
$ |
1.9 |
|
|
Foreign currency translation adjustments |
|
125.0 |
|
— |
|
125.0 |
| |||
|
Retirement benefit asset, net |
|
(10.2 |
) |
(0.4 |
) |
(10.6 |
) | |||
|
Reclassifications to net income |
|
(4.4 |
) |
— |
|
(4.4 |
) | |||
|
Total other comprehensive income |
|
$ |
112.3 |
|
$ |
(0.4 |
) |
$ |
111.9 |
|
|
|
|
Pre-tax |
|
Tax |
|
Net |
| |||
|
Year ended December 31, 2016 |
|
amount |
|
benefit |
|
amount |
| |||
|
|
|
|
|
|
|
|
| |||
|
Net unrealized gains on available-for-sale securities |
|
$ |
0.8 |
|
$ |
— |
|
$ |
0.8 |
|
|
Foreign currency translation adjustments |
|
(247.4 |
) |
0.3 |
|
(247.1 |
) | |||
|
Retirement benefit asset, net |
|
14.7 |
|
0.3 |
|
15.0 |
| |||
|
Reclassifications to net income |
|
(1.2 |
) |
— |
|
(1.2 |
) | |||
|
Total other comprehensive income loss |
|
$ |
(233.1 |
) |
$ |
0.6 |
|
$ |
(232.5 |
) |
|
|
|
Pre-tax |
|
Tax |
|
Net |
| |||
|
Year ended December 31, 2015 |
|
amount |
|
expense |
|
amount |
| |||
|
|
|
|
|
|
|
|
| |||
|
Net unrealized gains on available-for-sale securities |
|
$ |
1.4 |
|
$ |
— |
|
$ |
1.4 |
|
|
Foreign currency translation adjustments |
|
(94.5 |
) |
— |
|
(94.5 |
) | |||
|
Retirement benefit asset, net |
|
(0.5 |
) |
(0.2 |
) |
(0.7 |
) | |||
|
Reclassifications to net income |
|
(14.7 |
) |
— |
|
(14.7 |
) | |||
|
Total other comprehensive income loss |
|
$ |
(108.3 |
) |
$ |
(0.2 |
) |
$ |
(108.5 |
) |
Note 17 — Earnings and Dividends Per Share
Earnings Per Share
The following is a summary of the earnings per share calculation for the years ended December 31, 2017, 2016 and 2015 (in millions, except per share data):
|
|
|
Year ended December 31, |
| |||||||
|
|
|
2017 |
|
2016 |
|
2015 |
| |||
|
|
|
|
|
|
|
|
| |||
|
Net income attributable to JHG |
|
$ |
655.5 |
|
$ |
189.0 |
|
$ |
329.8 |
|
|
Less: Allocation of earnings to participating stock-based awards |
|
(17.3 |
) |
(4.5 |
) |
(9.0 |
) | |||
|
Net income attributable to JHG common shareholders |
|
$ |
638.2 |
|
$ |
184.5 |
|
$ |
320.8 |
|
|
Weighted-average common shares outstanding — basic |
|
160.7 |
|
109.1 |
|
109.3 |
| |||
|
Dilutive effect of non-participating stock-based awards |
|
1.6 |
|
2.0 |
|
6.1 |
| |||
|
Weighted-average diluted common shares outstanding — diluted |
|
162.3 |
|
111.1 |
|
115.4 |
| |||
|
Earnings per share: |
|
|
|
|
|
|
| |||
|
Basic |
|
$ |
3.97 |
|
$ |
1.69 |
|
$ |
2.93 |
|
|
Diluted (two class) |
|
$ |
3.93 |
|
$ |
1.66 |
|
$ |
2.78 |
|
The share numbers in the table above have been updated to reflect the share consolidation on April 26, 2017. Refer to Note 2 — Summary of Significant Accounting Policies, for additional information on the share consolidation. The potential dilutive effect of redemptions of the Group’s 2018 Convertible Notes has been excluded from the calculations above. Redemptions to date have been settled wholly in cash, and the Group has the ability and intent to settle future redemptions wholly in cash.
The following instruments are anti-dilutive and have not been included in the weighted-average diluted shares outstanding calculation (in millions):
|
|
|
Year ended |
| ||||
|
|
|
December 31, |
| ||||
|
|
|
2017 |
|
2016 |
|
2015 |
|
|
|
|
|
|
|
|
|
|
|
Unvested nonparticipating stock awards |
|
0.8 |
|
7.8 |
|
1.9 |
|
|
Dai-ichi options |
|
10.0 |
|
— |
|
— |
|
Dividends Per Share
The payment of cash dividends is within the discretion of JHG’s Board of Directors and depends on many factors, including, but not limited to, the Group’s results of operations, financial condition, capital requirements, and general business conditions and legal requirements. From the Closing Date, the Group intends to declare dividends quarterly in USD; prior to the Merger, the Group declared dividends in GBP on a semi-annual basis, with an extraordinary first quarter 2017 dividend declared on April 19, 2017.
The following is a summary of cash dividends declared and paid for the years ended December 31, 2017, 2016 and 2015, in GBP and USD:
|
|
|
Year ended December 31, |
| |||||||
|
|
|
2017 |
|
2016 |
|
2015 |
| |||
|
|
|
|
|
|
|
|
| |||
|
Dividends paid per share — pre-Merger — in GBP |
|
£ |
0.0915 |
|
£ |
0.1040 |
|
£ |
0.0950 |
|
|
Dividends paid per share — post-Merger — in USD |
|
$ |
0.6400 |
|
$ |
— |
|
$ |
— |
|
The pre-Merger share numbers in the table above have not been updated to reflect the share consolidation on April 26, 2017. Refer to Note 2 — ‘Summary of Significant Accounting Policies’, for additional information on the share consolidation.
Note 18 — Commitments and Contingencies
Commitments and contingencies may arise in the normal course of business. Commitments and contingencies as of December 31, 2017 are discussed below.
Operating and Capital Leases
As of December 31, 2017, future minimum rental commitments under non-cancelable operating and capital leases are as follows (in millions):
|
Year ended December 31, |
|
Amount |
| |
|
|
|
|
| |
|
2018 |
|
$ |
35.8 |
|
|
2019 |
|
31.9 |
| |
|
2020 |
|
29.0 |
| |
|
2021 |
|
26.4 |
| |
|
2022 |
|
24.4 |
| |
|
Thereafter |
|
84.5 |
| |
|
Total |
|
$ |
232.0 |
|
Litigation and Other Regulatory Matters
JHG is periodically involved in various legal proceedings and other regulatory matters. Although there can be no assurances, based on information currently available, management believes that it is probable that the ultimate outcome of matters that are pending or threatened will not have a material effect on JHG’s consolidated financial statements.
Note 19 — Related Party Transactions
Disclosures relating to equity method investments and the Group pension scheme can be found in Note 8 and Note 15 respectively. Transactions between JHG and its controlled subsidiaries have been eliminated on consolidation and are not disclosed in this note.
Certain managed funds are deemed to be related parties of the Group under the related party guidance. The Group earns fees from the funds for which it acts as investment manager and the balance sheet includes amount due from these managed funds.
During the years ended December 31, 2017, 2016 and 2015, the Group recognized revenues of $1,473.5 million, $885.0 million and $1,082.8 million, respectively, from the funds it manages that are related parties and not consolidated, in the Consolidated Statements of Comprehensive Income.
The following table reflects amounts in the Consolidated Balance Sheets relating to fees receivable from managed funds which are deemed to be related parties (in millions):
|
|
|
Year ended |
| ||||
|
|
|
December 31, |
| ||||
|
|
|
2017 |
|
2016 |
| ||
|
|
|
|
|
|
| ||
|
12b-1 plan fees (1) |
|
$ |
12.1 |
|
$ |
— |
|
|
|
|
As of December 31 |
| ||||
|
|
|
2017 |
|
2016 |
| ||
|
|
|
|
|
|
| ||
|
Accrued income |
|
$ |
261.6 |
|
$ |
130.8 |
|
|
Accounts receivable |
|
39.8 |
|
3.1 |
| ||
(1) The annual marketing or distribution fees on a mutual fund.
Dai-ichi is a significant shareholder of the Group. Investment management fees (included in the revenue figure above) for the years ended December 31, 2017 and 2016, were $11.0 million and nil, respectively.
Seed investments held in managed funds are disclosed in Note 5 — Consolidation.
Note 20 — Geographic Information
The following summary provides information concerning the Group’s principal geographic areas for the years ended and as of December 31, 2017, 2016 and 2015 (in millions):
|
|
|
Year ended December 31, |
| |||||||
|
Operating revenues |
|
2017 |
|
2016 |
|
2015 |
| |||
|
|
|
|
|
|
|
|
| |||
|
U.S. |
|
$ |
703.8 |
|
$ |
172.1 |
|
$ |
172.0 |
|
|
UK |
|
653.2 |
|
518.4 |
|
699.7 |
| |||
|
Luxembourg |
|
280.9 |
|
282.7 |
|
273.5 |
| |||
|
International |
|
105.8 |
|
26.7 |
|
9.9 |
| |||
|
Total |
|
$ |
1,743.7 |
|
$ |
999.9 |
|
$ |
1,155.1 |
|
Operating revenues are attributed to countries based on the location in which revenues are earned.
|
|
|
As of |
| ||||
|
|
|
December 31, |
| ||||
|
Long-lived assets |
|
2017 |
|
2016 |
| ||
|
|
|
|
|
|
| ||
|
UK |
|
$ |
397.0 |
|
$ |
321.9 |
|
|
U.S. |
|
2,629.8 |
|
54.0 |
| ||
|
Australia |
|
245.1 |
|
— |
| ||
|
Other |
|
3.5 |
|
25.4 |
| ||
|
Total |
|
$ |
3,175.4 |
|
$ |
401.3 |
|
Long-lived assets include property, equipment, software and intangible assets.
Note 21 — Selected Quarterly Financial Data (Unaudited)
|
|
|
2017 |
| |||||||||||||
|
|
|
First |
|
Second |
|
Third |
|
Fourth |
|
Full |
| |||||
|
(in millions, except per share amounts) |
|
quarter |
|
quarter |
|
quarter |
|
quarter |
|
year |
| |||||
|
|
|
|
|
|
|
|
|
|
|
|
| |||||
|
Operating revenue |
|
$ |
229.5 |
|
$ |
384.8 |
|
$ |
537.4 |
|
$ |
592.0 |
|
$ |
1,743.7 |
|
|
Operating income |
|
50.8 |
|
56.7 |
|
138.2 |
|
196.6 |
|
442.3 |
| |||||
|
Net income |
|
42.6 |
|
41.5 |
|
102.2 |
|
472.1 |
|
658.4 |
| |||||
|
Net income attributable to noncontrolling |
|
|
|
|
|
|
|
|
|
|
| |||||
|
interests |
|
— |
|
0.2 |
|
(2.7 |
) |
(0.4 |
) |
(2.9 |
) | |||||
|
Net income attributable to JHG |
|
42.6 |
|
41.7 |
|
99.5 |
|
471.7 |
|
655.5 |
| |||||
|
Basic earnings per share attributable to JHG |
|
|
|
|
|
|
|
|
|
|
| |||||
|
common shareholders |
|
$ |
0.38 |
|
$ |
0.29 |
|
$ |
0.49 |
|
$ |
2.34 |
|
$ |
3.97 |
|
|
Diluted earnings per share attributable to |
|
|
|
|
|
|
|
|
|
|
| |||||
|
JHG common shareholders |
|
$ |
0.38 |
|
$ |
0.28 |
|
$ |
0.49 |
|
$ |
2.32 |
|
$ |
3.93 |
|
|
|
|
2016 |
| |||||||||||||
|
|
|
First |
|
Second |
|
Third |
|
Fourth |
|
Full |
| |||||
|
(in millions, except per share amounts) |
|
quarter |
|
quarter |
|
quarter |
|
quarter |
|
year |
| |||||
|
|
|
|
|
|
|
|
|
|
|
|
| |||||
|
Operating revenue |
|
$ |
254.4 |
|
$ |
257.1 |
|
$ |
245.0 |
|
$ |
243.4 |
|
$ |
999.9 |
|
|
Operating income |
|
65.6 |
|
56.4 |
|
64.1 |
|
46.0 |
|
232.1 |
| |||||
|
Net income |
|
54.6 |
|
40.2 |
|
53.6 |
|
28.9 |
|
177.3 |
| |||||
|
Net income attributable to noncontrolling |
|
|
|
|
|
|
|
|
|
|
| |||||
|
interests |
|
(3.1 |
) |
6.1 |
|
(0.2 |
) |
8.9 |
|
11.7 |
| |||||
|
Net income attributable to JHG |
|
51.5 |
|
46.3 |
|
53.4 |
|
37.8 |
|
189.0 |
| |||||
|
Basic earnings per share attributable to JHG |
|
|
|
|
|
|
|
|
|
|
| |||||
|
common shareholders |
|
$ |
0.46 |
|
$ |
0.42 |
|
$ |
0.48 |
|
$ |
0.34 |
|
$ |
1.69 |
|
|
Diluted earnings per share attributable to JHG |
|
|
|
|
|
|
|
|
|
|
| |||||
|
common shareholders |
|
$ |
0.44 |
|
$ |
0.40 |
|
$ |
0.46 |
|
$ |
0.33 |
|
$ |
1.66 |
|
Note 22 — Subsequent Events
BNP Paribas Securities Services
On October 19, 2017, the Group signed an agreement with BNP Paribas. BNP Paribas will assume responsibility for the majority of JHG’s back-office (including fund administration and fund accounting), middle-office and custody functions in the U.S. BNP Paribas will pay JHG net consideration of approximately $36 million for the operations upon closing, which is anticipated for March 2018.
0.750% Convertible Senior Notes Due 2018
Holders of the 2018 Convertible Notes may convert the notes during a particular calendar quarter if the last reported sale price of JHG’s common stock is greater than or equal to 130% of the applicable conversion price for at least 20 trading days during a period of 30 consecutive trading days ending on the last trading day of the preceding quarter. As of January 1, 2018, the 2018 Convertible Notes met the conversion criteria and are convertible during the first quarter 2018 at a conversion rate of 45.1535 shares of JHG common stock per $1,000 principal amount of the 2018 Convertible Notes, which is equivalent to a conversion price of approximately $22.15 per share of common stock.
During the period from January 1, 2018 to February 22, 2018, an additional $22.5 million in principal was redeemed and settled with cash for a total cash outlay of $39.1 million, and additional
conversion notices amounting to $25.4 million in principal had been received. JHG intends to settle the conversion notices with cash during the first quarter 2018.
Dividend
On February 5, 2018, JHG’s Board of Directors declared a fourth quarter 2017 cash dividend of $0.32 per share. The dividend will be paid on March 2, 2018, to shareholders of record at the close of business on February 16, 2018.
ITEM 9. CHANGES IN AND DISAGREEMENTS WITH ACCOUNTANTS ON ACCOUNTING AND FINANCIAL DISCLOSURE
None.
ITEM 9A. CONTROLS AND PROCEDURES
Evaluation of Disclosure Controls and Procedures
As of December 31, 2017, JHG’s management evaluated the effectiveness of the design and operation of its disclosure controls and procedures (as such term is defined in Rules 13a-15(e) and 15d-15(e) under the Exchange Act). Disclosure controls and procedures include, without limitation, controls and procedures designed to ensure that information required to be disclosed by the Group in the reports that it files or submits under the Exchange Act is accumulated and communicated to the Group’s management, including its principal executive and principal financial officers, or persons performing similar functions, as appropriate to allow timely decisions regarding required disclosure. Disclosure controls and procedures are designed by the Group to ensure that it records, processes, summarizes and reports in a timely manner the information it must disclose in reports that it files with or submits to the SEC. Richard M. Weil, Co-Chief Executive Officer, Andrew J. Formica, Co-Chief Executive Officer, and Roger Thompson, Chief Financial Officer, reviewed and participated in management’s evaluation of the disclosure controls and procedures. Based on this evaluation, Mr. Weil, Mr. Formica and Mr. Thompson concluded that as of the date of their evaluation, JHG’s disclosure controls and procedures were effective.
Management’s Annual Report on Internal Control Over Financial Reporting
This Annual Report on Form 10-K does not include a report of management’s assessment regarding internal control over financial reporting or an attestation report of the Company’s registered public accounting firm due to a transition period established by rules of the SEC for newly public companies.
Changes in Internal Control Over Financial Reporting
There were no changes in JHG’s internal control over financial reporting (as that term is defined in Rule 13a-15(f) under the Exchange Act), that occurred during the fiscal quarter ended December 31, 2017 that have materially affected, or are reasonably likely to materially affect, JHG’s internal control over financial reporting.
ITEM 9B. OTHER INFORMATION
None.
PART III
Item 10. DIRECTORS, EXECUTIVE OFFICERS AND CORPORATE GOVERNANCE
Item 10 of Part III of Form 10-K requires registrants to furnish the information required by the following items of Regulations S-K, Part 400: Items 401 (Directors, Executive Officers, Promoters and Control Persons), 405 (Compliance with Section 16(a) of the Exchange Act), 406 (Code of Ethics) and 407(c)(3) (Material Changes to Procedures for Shareholder Nomination of Directors), (d)(4) (Names of audit committee members) and (d)(5) (Audit Committee Financial Expert). Because the Company is a ‘‘foreign private issuer’’ as defined by Rule 3b-4 under the Securities Exchange of 1934, as amended, it is not required to comply with Section 16(a) of the Exchange Act. Accordingly, the Company has not provided the information called for in Item 405.
Directors
Richard Gillingwater, Glenn Schafer, Andrew Formica, Richard Weil, Sarah Arkle, Kalpana Desai, Jeffrey Diermeier, Kevin Dolan, Eugene Flood, Jr., Lawrence Kochard, Angela Seymour-Jackson, Tatsusaburo Yamamoto are the current directors of the Company, holding office until the 2018 annual general meeting or until their successors are elected and qualify. Ages shown below are as of February 22, 2018.
Sarah Arkle | Age 61
Independent Non-Executive Director since May 2017. Ms Arkle was a Non-Executive Director of Henderson Group from September 2012 to May 2017 and is currently the Chair of the Board Risk Committee and member of the Audit Committee and Nominating and Governance Committee.
Experience
Ms Arkle has been in the financial industry for over 34 years. She joined Allied Dunbar Asset Management in 1983 which became Threadneedle in 1994. She was Vice Chairman of Threadneedle until the end of July 2012 and was Chief Investment Officer until December 2010, a role she held for 10 years. Previously, Ms Arkle worked at the Far Eastern stockbroker WI Carr (Overseas) Limited and was an advisor to the South Yorkshire Pension Fund. Ms Arkle is currently a Non-Executive Director of Foreign & Colonial Investment Trust plc and Chair of J.P. Morgan Emerging Markets Investment Trust plc. Ms Arkle has also been a member of the Royal Commission of the Great Exhibition of 1851 Finance Committee since January 2017. Ms. Arkle holds an MA in Management Studies from Cambridge University and is an associate of the Institute of Chartered Secretaries and Administrators.
Ms Arkle’s qualifications to serve on the Board include her over 34 years of asset management experience as a fund manager, chief investment officer and as vice chairman of Threadneedle. The Board also takes into consideration her experience and contribution as a legacy non-executive director of Henderson Group plc from 2012 to May 2017.
Kalpana Desai | Age 50
Independent Non-Executive Director since May 2017. Ms Desai was a Non-Executive Director of Henderson Group from October 2015 to May 2017 and is currently a member of the Audit Committee and Nominating and Governance Committee.
Experience
Ms Desai has over 30 years of international advisory and investment banking experience, primarily gained in the Asia-Pacific region. Until 2013, Ms Desai was Head of Macquarie Capital Asia, the investment banking division of Macquarie Group Limited, headquartered in Australia. Prior to this, she was Head of the Asia-Pacific Mergers & Acquisitions Group and a Managing Director from 2001 in the investment banking division of Bank of America Merrill Lynch based in Hong Kong. Earlier, Ms Desai worked in the corporate finance divisions of Barclays de Zoete Wedd in London and Hong Kong and at J. Henry Schroder Wagg in London, having started her career in the financial services division of Coopers & Lybrand Consulting in London. She was a member of the Takeovers and Mergers Panel of the Securities and Futures Commission in Hong Kong from 2007 to 2014. She is currently a Non-Executive Director of Canaccord Genuity Group Inc., headquartered in Canada. Ms Desai has a BSc in Economics from the London School of Economics and Political Science and qualified as a Chartered Accountant (ACA) at PricewaterhouseCoopers in London in 1991.
Ms Desai’s qualifications to serve on the Board include her over 30 years of international advisory and investment banking experience, primarily gained in the Asia-Pacific region, including her experience gained as Head of the Asia-Pacific Mergers & Acquisitions Group and a Managing Director from 2001 in the investment banking division of Bank of America Merrill Lynch based in Hong Kong. The Board also takes into consideration Ms Desai’s qualification as a Chartered Accountant (ACA).
Jeffrey Diermeier | Age 65
Independent Non-Executive Director since May 2017. Mr Diermeier was an Independent Director of Janus Capital Group from March 2008 to May 2017 and is currently the Chair of the Board Audit Committee and member of the Nominating and Governance Committee and the Risk Committee.
Experience
Mr Diermeier is a Director of the University of Wisconsin Foundation, a non-profit fundraising and endowment management organization, and former Chairman of its Investment Committee. In January 2011, Mr Diermeier became a Director of Adams Street Partners, a private equity firm located in Chicago. Between 2010 and 2017 he was a co-owner and Chairman of L.B. White Company, a heating equipment manufacturer. He is also a minority owner of Stairway Partners, LLC, a registered investment adviser located in Chicago, and was an advisory board member from 2005 to December 2012. He was a Trustee of the Board of the Financial Accounting Foundation, which oversees the Financial Accounting Standards Board and the Government Accounting Standards Board, from January 2009 to December 2015 and Chairman of the Trustees from November 2012 to December 2015. From 2005 until January 2009, he served as President and Chief Executive Officer of the CFA Institute, a non-profit educational organization for investment professionals in Charlottesville, Virginia, and previously in a number of capacities in the global asset management division of UBS and predecessor organisations, primarily Brinson Partners, Inc., beginning as an Equity Analyst and culminating as its Global Chief Investment Officer from 2000 to 2004. Mr Diermeier holds the Chartered Financial Analyst designation. Mr Diermeier has a BBA in Finance and Investments from the University of Wisconsin — Madison and an MBA in Finance and Investments from the University of Wisconsin — Madison.
Mr Diermeier’s qualifications to serve on the Board include extensive oversight experience related to financial reporting and corporate governance standards as a trustee of the Board of the Financial Accounting Foundation, CFA Institute experience, mutual fund and investment adviser oversight experience while at UBS, corporate oversight as a member of several boards of directors and committees, and his general executive management experience at UBS and its predecessor entity.
Kevin Dolan | Age 64
Independent Non-Executive Director since May 2017. Mr Dolan was a Non-Executive Director of Henderson Group from September 2011 to May 2017 and is currently a member of the Nominating and Governance Committee and Risk Committee.
Experience
Mr Dolan has been in the financial services industry for 36 years and has extensive experience in M&A transactions, both in Europe and the U.S. Mr Dolan has held various executive positions, including as Chief Executive of the Asset Management Division of Bank of Ireland Group and Chief Executive of Edmond de Rothschild Asset Management. He spent 10 years with the AXA Group where he was Chief Executive Officer of AXA Investment Managers Paris, and Global Deputy Chief Executive Officer of AXA Investment Management. He was Chief Executive of La Fayette Investment
Management in London from 2006 until 2009. Mr Dolan was a Director of Meeschaert Gestion Privée until 2015, is the founding partner of Anafin LLC, and a senior advisor to One Peak Partners. Mr Dolan has a BS in Business Administration from Georgetown University.
Mr Dolan’s qualifications to serve on the Board include his over 36 years’ experience in the financial industry, notably his chief executive experience at La Fayette Investment Management, Bank of Ireland Group and with Edmond de Rothschild Asset Management and AXA Group. The Board also takes into consideration his experience and contribution as a legacy non-executive director of Henderson Group plc from 2011 to May 2017.
Eugene Flood Jr. | Age 62
Independent Non-Executive Director since May 2017. Mr Flood was a Non-Executive Director of Janus Capital Group from January 2014 to May 2017 and is currently a member of the Nominating and Governance Committee, Risk Committee and Audit Committee.
Experience
Currently, Mr Flood also serves as Chairman of the advisory board for the Institute for Global Health and Infectious Diseases at the University of North Carolina Chapel Hill; is a Trustee of the Financial Accounting Foundation; and, has been a Director of the Research Corporation for Science Advancement since 2015. Previously, Mr Flood served as a Director of The Foundation for the Carolinas from 2012 to 2015. He was Executive Vice President of TIAA-CREF from 2011 until his retirement in 2012, serving on the CREF Board of Trustees and the TIAA-CREF Mutual Fund Board of Trustees for seven years, and chairing the Investment Committee. Prior to joining TIAA-CREF as an executive in 2011, Mr Flood spent 12 years with Smith Breeden Associates, a North Carolina-based fixed income asset manager, as President and Chief Executive Officer. Mr Flood also served with Morgan Stanley in a range of trading and investment positions from 1987 to 1999 and was an Assistant Professor of Finance at Stanford Business School from 1982 to 1987. Mr Flood earned a Bachelor of Arts degree in economics from Harvard University and a PhD in economics from the Massachusetts Institute of Technology.
Mr Flood Jr’s qualifications to serve on the Board include his extensive investment management, mutual fund and investment adviser experience as a trustee for CREF and TIAA-CREF, his senior management experience with Smith Breeden Associates and Morgan Stanley, and his economic-focused academic background. The Board also takes into account that Mr Flood has a Ph.D. in Economics from the Massachusetts Institute of Technology.
Andrew Formica | Age 46
Co-Chief Executive Officer and Executive Director since May 2017.
Experience
Andrew Formica is Co-Chief Executive of Janus Henderson and has been an Executive Director since May 2017. Mr Formica was Chief Executive and an Executive Director of Henderson Group from November 2008 to May 2017. He has been with Henderson since 1998 and in the fund management industry since 1993. Mr Formica has held various senior roles with Henderson and he has been a member of the executive committee since 2004. Prior to being appointed Chief Executive, he served as Joint Managing Director of the Listed Assets business (from September 2006) and as Head of Equities (from September 2004). In the early part of his career, he was an equity manager and analyst for Henderson. Mr Formica was a director of TIAA Henderson Real Estate Limited from April 2014 to July 2015. Mr Formica is the deputy chairman of the board of The Investment Association and has served as a non-executive director of Hammerson plc since
November 2015. Mr Formica received a B Econ and MA in Economics from Macquarie University and a MBA from London Business School. He is a Fellow of the Institute of Actuaries in both the UK and Australia. Mr Formica has 25 years of financial industry experience.
Mr Formica’s qualifications to serve on the Board include his current role as co-CEO of the Company in addition to his 25 years of funds management experience gained with Henderson Group prior to the merger, including his role as Chief Executive and an Executive Director of Henderson Group from November 2008 to May 2017.
Richard Gillingwater | Age 61
Non-Executive Director and Chairman since May 2017. He was a Non-Executive Director of the Henderson Group Board from February 2013 to May 2017, taking the position of Chairman in May 2013. He is currently the Chair of the Nominating and Governance Committee and a member of the Compensation Committee.
Experience
Mr Gillingwater started his career in investment banking in 1980 at Kleinwort Benson, where he spent ten years. After this he moved to BZW and, in due course, became joint Head of Corporate Finance. BZW was taken over by Credit Suisse First Boston and he ultimately became Chairman of European Investment Banking at Credit Suisse First Boston. In 2003, he was asked by the UK Government to found and become the Chief Executive and later, Chairman of the Shareholder Executive. In 2007, he became Dean of Cass Business School which role he held until 2012.In his Non Executive career, Mr Gillingwater has been Chairman of CDC Group plc and has also been a Non-Executive Director of P&O, Debenhams, Tomkins, Qinetiq Group, Kidde, Hiscox Ltd and Wm Morrison Supermarkets plc. Mr Gillingwater is Chairman of SSE plc and Non Executive Director of Helical plc. Mr Gillingwater holds an MA in Law, St Edmund Hall, Oxford University and a MBA from the International Institute for Management Development (IMD) in Lausanne. Mr Gillingwater is a qualified solicitor.
Mr Gillingwater’s qualifications to serve on the Board include his broad industry experience as Chairman of European Investment Banking at Credit Suisse First Boston, Chairman of the Shareholder Executive and Dean of the Cass Business School, in addition to his extensive experience as a non-executive director of a number of other high profile publicly listed companies, including as Chairman of Henderson Group from May 2013 to May 2017.
Lawrence Kochard | Age 61
Independent Non-Executive Director since May 2017. Mr Kochard was an Independent Director of Janus Capital Group from March 2008 to May 2017 and is currently the Chair of the Compensation Committee and a member of the Nominating and Governance Committee.
Experience
Mr Kochard is Chief Investment Officer at Makena Capital Management. Until January 2018, he was the Chief Executive Officer and Chief Investment Officer of the University of Virginia Investment Management Company. Mr Kochard has served as a Director of the Virginia Commonwealth University Investment Management Company since 2015, as a Director and the Chair of the Investment Committee for the Virginia Environmental Endowment since 2013 and a Member of the Investment Advisory Committee of the Virginia Retirement System since March 2011, serving as Chair since 2017. He previously served as the Chairman of the College of William & Mary Investment Committee from 2005 to October 2011. From 2004 to 2010, he was the Chief Investment Officer for Georgetown University, and from 2001 to 2004 was Managing Director of Equity and
Hedge Fund Investments for the Virginia Retirement System. Mr Kochard worked as an Assistant Professor of Finance at the McIntire School of Commerce at the University of Virginia from 1999 to 2001. He started his career in financial analysis and planning, corporate finance and capital markets for E.I. DuPont de Nemours and Company, Fannie Mae and The Goldman Sachs Group, Inc. Mr Kochard holds the Chartered Financial Analyst designation and a Ph.D. in economics from the University of Virginia.
Mr Kochard’s qualifications to serve on the Board include his extensive experience related to investment management, investment adviser oversight, general executive management and his economic-focused academic background while a senior executive officer on the investment teams of University of Virginia, Georgetown University, Virginia Retirement System, Fannie Mae, and The Goldman Sachs Group. The Board also takes into account that Mr Kochard has a Ph.D. in Economics from the University of Virginia.
Glenn Schafer | Age 68
Vice-Chairman and Independent Non-Executive Director since May 2017. Mr Schafer was a Director of Janus Capital Group from December 2007 to May 2017, taking the position of Chairman in April 2012. He is a member of the Compensation Committee and the Nominating and Governance Committee.
Experience
Mr Schafer serves as a Director of GeoOptics LLC, a weather satellite manufacturer. Mr Schafer served as a Director of the Michigan State University Foundation from 2004 to 2014. Mr Shafer was Vice Chairman of Pacific Life Insurance Company (Pacific Life) from April 2005 until his retirement in December 2005; a member of Pacific Life’s Board of Directors and President of Pacific Life from 1995 to 2005; and, Executive Vice President and Chief Financial Officer of Pacific Life from 1991 to 1995. From 2006 to 2007, he served on the Board of Directors for Scottish Re Group. Between 2006 and 2017 Mr Schafer was a Director of Genesis Healthcare, Inc., the successor company resulting from the merger with Skilled Healthcare Group, Inc. to which Mr Schafer was a director. Mr Schafer also served as a Director of Mercury General Corporation, an insurance holding company, between 2015 up until his resignation in February 2018. Mr Schafer has a BS from Michigan State University and an MBA from the University of Detroit.
Mr Schafer’s qualifications to serve on the Board include his extensive accounting and financial experience as a former Chief Financial Officer at Pacific Life, investment and capital management experience as a senior executive and board member of Pacific Life, corporate oversight experience as a member of several boards of directors and committees, including as Chairman of Janus Capital Group from April 2012 to May 2017 and his general executive management experience gained as a senior executive and board member of Pacific Life.
Angela Seymour-Jackson | Age 51
Independent Non-Executive Director of Janus Henderson since May 2017. Ms Seymour-Jackson was a Non-Executive Director of Henderson Group from January 2014 to May 2017 and is currently a member of the Compensation Committee and the Nominating and Governance Committee. She also chairs Henderson Global Holdings Asset Management Limited (a holding company of the legacy Henderson Group).
Experience
Ms Seymour-Jackson has over 25 years’ experience in retail financial services. She has held various senior marketing and distribution roles in Norwich Union Insurance, General Accident Insurance, CGU plc and Aviva. She was Chief Executive Officer of RAC Motoring Services Limited from 2010 until 2012. She joined Aegon UK in May 2012 and was appointed Managing Director of the Workplace Solutions Division in December 2012. Ms Seymour-Jackson was a Senior Advisor to Lloyds Banking Group (insurance) until October 2017. She is a Non-Executive Director of Rentokil Initial plc, Page Group plc and esure Group plc, and is also Deputy Chair and Senior Independent Director at Gocompare.com Group plc. Ms. Seymour-Jackson has a BA (Hons) in French and European Studies from the University of East Anglia, a diploma from the Chartered Institute of Marketing and an MSc in Marketing.
Ms Seymour-Jackson’s qualifications to serve on the Board include her extensive background in retail financial services including her experience gained in various senior marketing and distribution roles at Norwich Union Insurance, CGU plc and Aviva UK Life as well as her senior executive experience at RAC Motoring Services Limited and Aegon UK. The Board also takes into consideration her experience and contribution as a non-executive director of Henderson Group from January 2014 to May 2017.
Richard Weil | Age 54
Co-Chief Executive Officer and Executive Director since May 2017.
Experience
Richard Weil is Co-Chief Executive Officer of Janus Henderson and also serves as a member of the Board. In this role, Mr Weil, in conjunction with Andrew Formica, is responsible for the strategic direction and overall day-to-day management of the firm. He also co-leads the firm’s executive committee. He has held this position since the merger of Janus Capital Group and Henderson Global Investors in May 2017. Prior to this, Mr Weil was Chief Executive Officer of Janus, a position he had held since joining the firm in 2010. Prior to this, Mr Weil spent 15 years with PIMCO where most recently he served as the global head of PIMCO Advisory, a member of PIMCO’s executive committee, and a member of the board of trustees of the PIMCO Funds. Previous to his appointment as global head of PIMCO Advisory, he served as chief operating officer of PIMCO, a position he held for 10 years, in which time he successfully led the development of PIMCO’s global business and founded their German operations. Mr Weil also previously served as PIMCO Advisors L.P.’s general counsel. Prior to joining PIMCO in 1996, Mr Weil was with Bankers Trust Global Asset Management and Simpson Thacher & Bartlett LLP in New York. Mr Weil earned his bachelor of arts degree in economics from Duke University and his juris doctorate from the University of Chicago Law School. He has 24 years of financial industry experience.
Mr Weil’s qualifications to serve on the Board include his current role as co-CEO of the Company in addition to his extensive business and legal experience in the investment management industry, his general executive management experience as a senior executive officer at PIMCO and as a lawyer
at Simpson Thacher & Bartlett LLP. The Board also considered his extensive experience in the development and oversight of global company operations including his experience gained as Chief Executive Officer of Janus Capital Group from 2010 to May 2017.
Tatsusaburo Yamamoto | Age 53
Independent Non-Executive Director since May 2017. Mr Yamamoto was an Independent Director of Janus Capital Group from July 2015 to May 2017 and is currently a member of the Nominating and Governance Committee.
Experience
Mr Yamamoto is currently Managing Executive Officer, Corporate Planning Unit, of The Dai-ichi Life Holdings, Inc. (Dai-ichi Life) and has worked in many different capacities for Dai-ichi Life over his 29 year career with the firm. Prior to his current role, Mr Yamamoto served as Executive Officer at the Asset Management Business Unit of Dai-ichi Life and the Investment Planning Department of Dai-ichi Life Insurance Company, Limited. Mr Yamamoto was appointed to the Janus Capital Group Board after being designated by Dai-ichi Life as its representative for appointment to the Board. This right was granted to Dai-ichi Life as a result of the Investment and Strategic Cooperation Agreement (the Agreement) between Dai-ichi Life and Janus Capital Group. In connection with the Agreement, Mr Yamamoto has previously worked with the Janus management as a member of the strategic alliance coordination committee, which sought to further the goals of the strategic alliance and enhance product distribution opportunities. Mr Yamamoto has a Bachelor of Arts in Economics from WASEDA University.
Mr Yamamoto’s qualifications to serve on the Board include his extensive experience in the financial services industry outside of the U.S. and his roles in management in the investment planning, asset management and international business management departments of The Dai-ichi Life Insurance Company, Limited (“Dai-ichi Life Insurance”) including as Deputy CEO of Dai-ichi Life Insurance Vietnam and Managing Director of Dai-ichi Life Insurance (Asia Pacific). The Board also considered his experience and familiarity with the Company’s management team.
Executive Officers
The current executive officers of the Company are as follows:
|
Name |
|
|
Title |
|
Age (1) |
|
|
|
|
|
|
|
| |
|
Andrew Formica |
|
Co-Chief Executive Officer |
|
46 |
| |
|
Richard Weil |
|
Co-Chief Executive Officer |
|
54 |
| |
|
Roger Thompson |
|
Chief Financial Officer |
|
50 |
| |
|
Enrique Chang |
|
Chief Investment Officer |
|
55 |
| |
|
Phil Wagstaff |
|
Global Head of Distribution |
|
54 |
| |
(1) Ages shown are as of February 22, 2018.
The principal occupation of the current executive officers of the Company is shown in the table above supplemented by the following information, except with respect to Messrs. Formica and Weil, whose previous experience is described above regarding the Company’s directors.
Roger Thompson is Chief Financial Officer at Janus Henderson, a position he has held, as part of the Henderson team, since 2013. He is a member of the executive committee. Mr. Thompson joined Henderson from J.P. Morgan Asset Management where most recently he was global chief operating officer and was previously head of UK and prior to that, international CFO. Mr. Thompson held a broad range of roles at J.P. Morgan and worked internationally, spending time in Tokyo, Singapore and Hong Kong. He trained as an accountant with PricewaterhouseCoopers. Mr. Thompson graduated with a BA (Hons) in accountancy and economics from Exeter University. He is also a chartered accountant and has 26 years of financial industry experience.
Enrique Chang is Global Chief Investment Officer at Janus Henderson, a position he has held since the merger of Janus and Henderson in 2017. Prior to the merger, Mr. Chang was President, Head of Investments at JCG. In his current role, he leads Janus Henderson’s global investment team. Mr. Chang is also a Portfolio Manager on the Janus Henderson Global Allocation strategies and a member of the Janus Henderson executive committee. He previously served as chief investment officer and executive vice president for American Century Investments. Mr. Chang joined American Century in 2006 and was named CIO in January 2007. Additionally, he was a director of the corporate board. Mr. Chang was also a member of the firm’s asset allocation committee and investment management senior leadership team. He previously was the CIO responsible for global and non-U.S. equity. Before American Century, Mr. Chang was president and chief investment officer for Munder Capital Management. Earlier in his career, he held a number of senior investment management positions at Vantage Global Advisor, J&W Seligman and Co., and General Reinsurance Corp. Mr. Chang earned a bachelor of arts degree in mathematics from Fairleigh Dickinson University, and an MBA in finance/quantitative analysis, and an MS in statistics and operations research, from New York University. He has 30 years of financial industry experience.
Phil Wagstaff is Global Head of Distribution at Janus Henderson Investors, a position he has held since the merger of Janus and Henderson in 2017. Mr. Wagstaff has been member of the executive committee, as part of the Henderson team, since 2012. He joined Henderson in 2012 as global head of distribution, responsible for all distribution businesses including retail, institutional and hedge funds. Prior to Henderson he was global head of distribution at Gartmore Investment Management and prior to that was managing director of UK retail at both New Star Asset Management and M&G Investments. Mr. Wagstaff graduated with a BA (Hons) accounting from the University of Central Lancashire and has 31 years of financial industry experience.
Officer Code of Ethics
Our Officer Code of Ethics for the Co-CEOs and Senior Financial Officers (including our Co-CEOs, Chief Financial Officer, and Chief Accounting Officer (the “Officer Code”) is available on our website at http://www.janushenderson.com/group under Governance policies and statements. Any amendments to or waivers of the Officer Code will be disclosed on our website in the same location.
Director Nomination Process and Diversity
We believe that in order for the Board to effectively guide JHG to sustained, long-term success, it must be composed of individuals with sophistication and experience in the many disciplines that strengthen our business. We sell our products to intermediary, institutional, and self-directed clients. To best serve these clients and our shareholders, we seek to ensure that the Board consists of directors who are highly sophisticated in, among other disciplines, domestic and international investment and asset management, finance, economic policy, and the legal and accounting regulations that impact our business. We also believe that the Board should include directors with experience managing, overseeing or advising comparable companies in our industry at the chief executive officer and/or the director level.
The Nominating and Corporate Governance Committee (“Nominating Committee”) does not have a formal ongoing process for identifying and evaluating director nominees; however, when vacancies on the Board are expected, or a need for a particular expertise has been identified, it is expected the Nominating Committee may engage appropriate search firms to assist in identifying director candidates. The Nominating Committee ensures that each director nominee satisfies at least the criteria set forth in the Governance Guidelines and considers and evaluates the individual background and qualifications of each director nominee and the extent to which such background and qualifications might benefit the Company based on the size and composition of the Board of Directors at the time. In identifying director nominees, the Nominating Committee will seek talented and experienced candidates with professional backgrounds who support a balance of knowledge, experience, skills, expertise, and diversity appropriate for the Board as a whole.
The Board believes that it currently constituted by members that collectively possess diverse knowledge and experience in the disciplines that strengthen JHG’s business. Prior to nominating a new director candidate, the Nominating Committee will consider the collective experience of the existing Board members and based on that evaluation, the Nominating Committee is expected to nominate individuals who it believes will enhance the Board’s ability to serve the Company’s shareholders as a result of that experience and expertise. Although the Board does not currently have a policy specifically addressing director diversity, the Nominating Committee, guided by the Nominating Committee’s charter, is expected to assess and consider the diversity of the Board and the effectiveness of its diversity prior to nominating any additional Board candidates.
Corporate Governance
The Board has established corporate governance measures substantially in compliance with requirements of the NYSE. These include Corporate Governance Guidelines, charters for each of the standing Audit Committee, Compensation Committee and Nominating and Governance Committee, and a Code of Conduct applying to all directors, officers and employees. Each of these documents is published on the Company’s corporate website: http://www.janushenderson.com/group.
Because the Company is a foreign private issuer as defined in SEC rules, it is not required to comply with all NYSE corporate governance requirements as they apply to U.S. domestic companies listed on the NYSE. The Company’s corporate governance practices, however, do not differ in any significant way from those requirements, except that whereas the NYSE rules require that shareholders be given the opportunity to vote on equity compensation plans and material revisions thereto, with limited exceptions, under relevant ASX rules individual grants under those plans do not require shareholder approval unless they involve the issue of securities to a related party of the issuer (such as a director) or a person whose relationship with the company or a related party is such that ASX considers that approval should be obtained. The Company’s corporate governance practices comply with applicable requirements of the SEC.
Audit Committee
The members of the Audit Committee are Jeffrey Diermeier, Eugene Flood Jr., Sarah Arkle and Kalpana Desai, each of whom is independent under the standards established by the Board and the NYSE. Mr. Diermeier is Chairman of the Audit Committee.
Audit Committee Financial Expert
The Board has determined that each member of the Audit Committee meets the accounting or related financial management expertise requirements of the NYSE and that Jeffrey Diermeier and Kalpana Desai qualify as “audit Committee financial experts” under applicable SEC regulations. No
member of the Audit Committee serves on an audit committee of more than two public companies in addition to Janus Henderson.
Item 11. EXECUTIVE COMPENSATION
Because the Company is a foreign private issuer, it is responding to this Item 11 as permitted by Item 402(a) (1) of SEC Regulation S-K under the Exchange Act.
Compensation Principles
Our compensation policies focus on linking pay with performance and in driving long-term shareholder returns, while appropriately managing risk. In doing so, the Compensation Committee and the Board recognize that our compensation policies and practices must enable the Group to attract, motivate and retain exceptional people, while aligning their interests with those of shareholders.
The key drivers of our compensation philosophy are:
· Attract and retain individuals critical to the long-term success of the Company by providing total reward opportunities which, subject to performance, are competitive within our defined markets,
· Maintain an appropriate balance between both fixed and variable pay, and short and long-term elements of compensation, in order to prudently manage risk taking and to align pay with the Company’s strategic objectives and time horizons,
· Reinforce a strong performance culture through rewards which are differentiated based on Company, division, team and individual performance,
· Align management interests with those of the Company’s shareholders and clients by delivering a significant portion of annual compensation in shares of Janus Henderson stock and units of Janus Henderson funds,
· Ensure that reward-related processes are compliant with industry regulations and legislation, consistent with market practice and include effective risk management controls.
The Company’s compensation principles are reinforced through an appropriate balance of the following compensation elements:
|
Base Pay |
Attracts and retains employees with the personal attributes, skills and experience required to deliver long-term value for shareholders and clients.
|
|
Benefits and Pension |
Competitive, cost- and tax-effective benefits that are geared toward the promotion of employee wellbeing, and retirement/pension arrangements that contribute to recruitment and retention and help employees build wealth for their retirement years, and do not create an unacceptable level of financial risk or cost to the Company.
|
|
Variable incentive |
Rewards performance on an annual basis, by reference to the Company’s investment, financial, and strategic performance, as well as individual contributions. The total annual variable incentive award is delivered in:
· Short Term Incentive (STI) compensation — unrestricted cash or, where regulatory requirements dictate, retained shares/fund units which are immediately vested, but which must be held for a minimum period (currently 6 months)
· Long Term Incentive (LTI) compensation — a material proportion of the variable incentive compensation is delivered as long term incentive compensation. These incentives reinforce superior long-term business performance and further align the interests of our employees, shareholders and clients by providing a vehicle for an element of incentive award to be deferred over a 3-year period and delivered either in:
· Shares in Janus Henderson Group plc; or · Subject to satisfaction of specific company share ownership criteria, or where prescribed by relevant remuneration regulations, in shares/units of Janus Henderson funds;
Under the co-CEO framework, an element of total variable incentive is delivered in performance shares, providing a further link to Company performance over a forward looking three-year period.
|
2017 Executive Compensation
Janus Henderson is an active investment manager that knows success can only be secured when passionate, empowered employees relentlessly pursue excellence in investment returns, client service and financial results. Following the Merger, the Board decided that the combined talents of both legacy CEOs would be needed to support a smooth integration for our clients and long-term growth of our people-focused business. While the co-CEO structure is uncommon, Messrs. Formica and Weil are an effective team. Given the nature of our business and the changing environment internally and externally, the Board believes the current management structure is both appropriate and beneficial for Janus Henderson.
As part of its evaluation of the co-CEO structure following the Merger, the Compensation Committee attempted to balance:
· U.S. and UK market competitive compensation practices, given that these are the Company’s primary labour markets for talent;
· Formula-based quantitative measurement conventions that are favoured by many of our shareholders.
The Compensation Committee has agreed to use a scorecard approach to drive decisions around co-CEO compensation decisions and to maintain strong alignment of co-CEO compensation with Company performance. In addition to implementing the scorecard approach, following the Merger, the Compensation Committee determined to:
· maintain the current base salaries of Messrs. Formica and Weil;
· align the total compensation opportunities for the co-CEOs; and
· ensure that each co-CEO’s total compensation is competitive and appropriately reflects the size and complexity of the combined group.
Total Compensation
The following table contains information about the compensation earned during 2017 by Messrs. Formica and Weil, individually, and the non-CEO Executive Officers as a group, for services to Janus Henderson during 2017. To reflect the timing of the completion of the Merger, Mr. Formica’s incentive award for 2017 was prorated, with his award for the first five months prior to the Merger being determined under arrangements approved under legacy Henderson’s remuneration policy, and the award opportunity for the subsequent seven-month period being determined in line with the new scorecard framework outlined below.
For performance year 2018 and beyond, Mr. Formica’s variable compensation will be determined wholly in line with the new methodology for the combined firm and hence, Mr. Formica and Mr. Weil’s compensation will be aligned in 2018, subject to equivalent performance and contribution.
|
|
|
|
Variable Comp (LTI) (4) |
Total 2017 |
Benefits |
| ||
|
|
Base |
Variable |
|
Restricted |
Performance |
Variable |
and |
|
|
Executive Officer (1) |
Salary (2) |
Comp (STI) (3) |
Funds (5) |
Shares |
Shares |
Comp |
Pension (6) |
Other (7) |
|
|
($) |
($) |
($) |
($) |
($) |
($) |
($) |
($) |
|
Andrew Formica, Co-CEO |
573,500 |
3,493,000 |
1,746,500 |
0 |
1,746,500 |
6,986,000 |
71,984 |
0 |
|
Richard M. Weil, Co-CEO |
575,000 |
3,976,000 |
|
1,988,000 |
1,988,000 |
7,952,000 |
40,836 |
484,910 |
|
Other Executive Officers |
1,447,290 |
5,687,953 |
3,326,530 |
2,664,223 |
0 |
11,678,705 |
130,591 |
249,658 |
Notes:
All non-USD amounts in this schedule are stated in USD on the basis of the average FX rate for 2017 (GBP 1.28883: $1.0 USD).
(1) The Other Executive Officers are Roger Thompson (Chief Financial Officer), Enrique Chang (Global Chief Investment Officer) and Phil Wagstaff (Global Head of Distribution).
(2) Base pay is disclosed at rate as of 31 December 2017. Mr. Weil was paid $239,584 and Mr. Chang was paid $208,334 in base salary prior to Merger. Mr. Formica’s base salary of GBP £445,000 is converted to USD $573,500 at the above FX rate.
(3) The amount of variable incentive remuneration awarded in respect of the 2017 performance year and not subject to deferral, including any amounts delivered in the form of retained units/retained shares to satisfy regulatory requirements.
(4) The amount of variable incentive remuneration awarded in respect of the 2017 performance year which is subject to deferral, either under company policy or where mandated by regulatory requirements. Such amounts may be delivered in the form of shares/units in Janus Henderson funds, restricted shares or performance shares. Awards vest and are realised over a 3 year deferral period (restricted share and restricted funds) or at the end of a 3 year performance period (performance shares).
(5) Under internal policy, provided specified JHG shareholding requirements are satisfied, individuals are able to elect for a proportion of their deferred remuneration to be delivered in the form of Janus Henderson funds (subject to the same vesting dates and conditions as would have applied to deferred share awards). In this regard, the following elections were applied:
— Mr Formica — 100% of his RSU award in JHG funds
— Mr Weil — 100% of his RSU awards in JHG funds
— Mr Chang — at least 50% of his RSU award in JHG funds
— Mr Wagstaff — 75% of his RSU in JHG funds
— Mr Thompson — 50% of his RSU in JHG funds.
(6) Pension and Benefits amounts shown include the following;
a. For Messrs. Formica, Wagstaff and Thompson; contributions into the Company’s defined contribution pension plan, currently 10.5% of base pay. Per the HMRC pension limits (Lifetime Allowance and Annual Allowance), individuals are entitled to elect to take a cash alternative which is set at 9% of base pay such that the cost to the Company (taking into account employers’ social security contributions on cash allowances matches the cost had further contributions been made to the scheme). Messrs. Formica, Thompson and Wagstaff have elected to take the cash alternative prior to 2017 and the total pension allowances paid to these individuals during 2017 were £49,736, £32,175 and £33,750 respectively (USD 64,101, USD 41,468 and USD43,498 respectively)
b. For Messrs Weil and Chang; amount includes 401(k) match contributions up to 5% of eligible compensation (capped at $270,000 per the IRS annual compensation limit) and $924 each for a one-time ESOP award.
(7) Amounts shown in ‘Other’ include dividends on ESOP and unvested shares. Mr. Weil’s amount includes $172,240 in dividends and $312,670 in relocation benefits per Company policy as a result of his 2017 move to the U.K from the U.S.
The Scorecard Approach to co-CEO Compensation
The scorecard approach combines the elements that the Compensation Committee believes are the best components from the legacy Janus and Henderson compensation programs and is designed to align the co-CEOs’ compensation with Company performance, which the Compensation Committee believes drives long-term value for shareholders and clients. The scorecard utilized following the Merger in May 2017 is based upon the same factors used by the Company to evaluate its business. The performance measures and weighting used are as follows:
· Deliver investment excellence for clients (30% weighting, measured based on 3-year investment performance relative to benchmark);
· Drive financial results for shareholders (40% weighting, measured based on revenue growth, total net flows, and growth in net income before taxes); and
· Drive strategic results for long-term success for clients and shareholders (30% weighting, measured based on execution of strategic initiatives such as; leading integration efforts, delivering exceptional client service, and achieving operational excellence).
Setting Total Variable Compensation Target
The Compensation Committee determined it was appropriate for the co-CEOs to be paid under the same structure and with similar total compensation opportunity, given how critical both of these individuals are to the successful integration and growth of Janus Henderson. To reflect the timing of the completion of the Merger, Mr. Formica’s incentive award for 2017 was prorated, with his award for the first five months prior to the Merger being determined under arrangements approved under legacy Henderson’s remuneration policy, and the award opportunity for the subsequent seven-month period being determined in line with the new framework outlined in this section.
Under the agreed compensation framework, which was disclosed to the market in August 2017, the variable incentive compensation for the co-CEOs is determined by multiplying a target incentive award by a multiplier (between 0% and 200%). This multiplier is determined by reference to the outcome of a scorecard of pre-determined measures (investment performance, financial results and strategic results).
To establish the target incentive award, the Compensation Committee considered the merged Company’s revenue and total assets under management (AUM) compared to the revenue and total
AUM of a select peer group of companies, as well as relative performance against the peer group shown below.
|
Janus Henderson’s Public Company Peer Group | |
|
Affiliated Managers Group, Inc. |
Legg Mason, Inc. |
|
AllianceBernstein Holding L.P. |
Old Mutual Asset Management |
|
Ameriprise Financial, Inc. |
T. Rowe Price Group, Inc. |
|
Eaton Vance Corp. |
Schroders Investment Management |
|
Federated Investors, Inc. |
Standard Life Aberdeen plc |
|
Franklin Resources, Inc. |
Waddell & Reed Financial, Inc. |
|
Invesco Ltd. |
|
This is to ensure that the target incentive opportunity reflects competitive pay practices of other asset management firms in the principal markets where the Company does business and competes for executive talent. The Compensation Committee also compared the complexity of the merged Company’s business to the same peer group. Based on its analysis and guidance from the Compensation Committee’s Compensation Consultants, the Compensation Committee established a target annual incentive opportunity for each of Mr. Formica and Mr. Weil of $5.60 million.
Compensation Committee Decisions about co-CEO Pay
Evaluating co-CEO and Business Performance
Having established the total variable compensation target amount for each of Mr. Formica and Mr. Weil, the Compensation Committee completed a rigorous assessment of co-CEO performance relative to the specific 2017 investment, financial, and strategic objectives mentioned above and described in more detail below. The Compensation Committee assigned a weighting to each of the three categories of objectives to identify for shareholders how their relative importance relates to the Company’s overall success, and, therefore, to shareholder value. The Compensation Committee then rated co-CEO performance (as a team, and not individually) against each of these factors to determine an overall performance multiplier.
The Compensation Committee’s evaluation of co-CEO performance involved:
(i) requesting each co-CEO to complete a comprehensive self-assessment;
(ii) using the table below to identify a performance multiplier for each of the performance measures in the scorecard; and
(iii) determining an overall performance multiplier for each area of evaluation in consideration of actual performance and the assigned weights.
|
Performance |
|
|
|
Multiplier |
|
|
|
Range |
|
Ranges of the Compensation Committee’s Evaluation of Performance |
|
0.0 to 0.5 |
|
Significant decline in absolute performance year-over-year |
|
0.6 to 1.0 |
|
Slight decline to flat in absolute performance year-over-year |
|
1.1 to 1.5 |
|
Slight to moderate increase in absolute performance year-over-year |
|
1.6 to 2.0 |
|
Significant increase in absolute performance year-over-year |
The Compensation Committee’s determination of a performance multiplier range for each of the weighted objectives was determined by reviewing:
· The Company’s year-over-year absolute results for relevant performance measures;
· The Company’s relative percentile ranking for each such measure as compared with the Company’s Public Company Peer Group; and
· With respect to the strategic results objectives, other factors that the Compensation Committee deemed important in evaluating co-CEO performance, including progress in realizing Merger-related synergies, executing the Company’s multi-year strategic initiatives, financial market conditions, and the prevailing risk and control environment.
Evaluation of Results
Below are the highlights of the results from each area of evaluation (Investment Excellence, Financial Results, and Strategic Results) that the Compensation Committee took into account when determining co-CEO compensation for 2017.
Investment Excellence (30% of Total)
For 2017, 30% of the co-CEO’s variable compensation award was dependent on delivering investment excellence. The co-CEO’s performance multiplier for this area is 100% formulaic and calculated using the percentage of AUM performing above benchmarks on a 3-year basis.
On an AUM-weighted basis, over the 3 year investment period (ending 31 December 2017) 66% of the Company’s total AUM outperformed its respective benchmark, resulting in a performance multiplier range for the co-CEOs in the range of 1.6 to 2.0.
Financial Results (40% of Total)
The Compensation Committee applied a formulaic approach when determining 50% of the financial results component of the scorecard, and a subjective approach for the other 50%.
Formulaic (50% of Financial Results; 20% of Total)
The relative rankings with respect to certain objective financial measures that the Compensation Committee determines to be key indicators of the Company’s financial performance are evaluated each year. In 2017, the Compensation Committee reviewed the 1-year relative financial results of the Company as compared to the Public Company Peer Group shown on page 137 and established a performance multiplier for the co-CEOs of 0.6 to 1.0.
Subjective (50% of Financial Results; 20% of Total)
The other half of the financial results performance measure is subjectively evaluated based on the following three components, weighted evenly:
|
Profit and loss results |
Adjusted operating income in 2017 of $732 million increased 30% year-over-year, driven by strong revenue growth in management fees and performance fees, as well as the positive impact of cost synergy realization from the Merger. |
|
|
|
|
|
2017 adjusted operating margin of 39.6% increased from 33.9% in 2016. |
|
|
|
|
Merger-related cost |
Executed run rate realised synergies of $85 million comprised primarily of compensation savings, as well as some non-compensation savings. |
|
|
|
|
|
Increased cost synergy target to $125 million from the originally stated $110 million |
|
|
|
|
Balance sheet quality |
Balance sheet continues to be strong with $1.5 billion of cash and marketable securities and $379 million of outstanding debt (Balance Sheet metrics reflect values as of 31 December, 2017) |
|
|
|
|
|
In 2017, the firm reduced the principal amount of debt outstanding by $59 million, as a result of the early conversion of approximately 51% of the outstanding 2018 Convertible Senior Notes. |
The co-CEOs received a performance multiplier of 1.0 to 1.5 on the subjective element of the financial results. Based on the average of the formulaic and the subjective analyses, the Compensation Committee assigned the co-CEOs a performance multiplier for the financial results area of 1.0 to 1.5.
Strategic Results (30% of Total)
For this area, the Compensation Committee considered the co-CEO performance across a broad range of strategic factors including:
· Lead a successful integration effort following the Merger
· Focus on delivery of investment returns with minimal disruption due to the Merger
· Ensure delivery of excellent client service and maximize distribution opportunities
· Continue to strengthen infrastructure/improve operational excellence
· Ensure we have a strong and stable leadership team
In 2017, the Compensation Committee considered the following outcomes when determining the performance multiplier for the strategic results area:
|
Merger & Integration | ||
|
1. |
Successfully closed the Merger | |
|
|
a. |
78 U.S. Mutual funds merged or approved new advisory agreements |
|
|
b. |
Rebranded approximately: 10,000 items of literature, 4,000 fund factsheets, 330+ institutional client reports, 70 websites, and 27 offices |
|
2. |
Integration is tracking ahead of expectations; during 2017 the cost synergy target was increased to $125 million from the originally stated $110 million. | |
|
3. |
Extended strategic partnership with BNP Paribas through the outsourcing of the firm’s back office, middle office and custody functions in the U.S. | |
|
Client Relationships | ||
|
1. |
Response from clients since the Merger has been extremely supportive | |
|
2. |
In 2017 the firm gained market share in the U.S. Intermediary Channel among its equity strategies, as its equity mutual fund business outpaced the industry’s organic growth by 180 basis points. | |
|
3. |
Achieved good global traction in the Institutional channel across a diverse breadth of strategies — the 10 largest net inflows for the year were sourced from 9 different strategies. | |
|
4. |
Positive early signs of revenue synergies | |
|
|
a. |
Dai-ichi completed a $500 million incremental investment into legacy-Henderson products |
|
|
b. |
Global Equity Income was the top selling U.S. mutual fund, and we are seeing increasing. opportunities with clients of the respective ‘legacy-firms’ investing in multiple strategies. |
|
|
c. |
Consultants and institutional clients across the globe are taking the firm off of ‘watch lists’. |
|
People and Culture | ||
|
1. |
The Company continues to invest in people and is particularly focused on building a common culture that drives success, embodying an ethos of Knowledge. Shared. | |
|
2. |
Investment teams have come together well, with minimal disruption through the Merger, demonstrating the resilience of our team. | |
|
3. |
Employees are shifting focus from integration, toward initiatives that position the firm for future growth. | |
Based on its analysis of the above factors and using the table below, the Compensation Committee assigned a performance multiplier for the co-CEOs of 1.6 to 2.0 for the strategic results area.
Overall Performance Multiplier (applied to the Total Variable Compensation Target)
Based on a thorough evaluation of 2017 investment performance, financial and strategic results, the Compensation Committee established the cumulative “Overall Performance Multiplier” range of 1.0 to 1.5 as shown in the table below. The overall performance multiplier is applied to the Total Variable Compensation Target in order to calculate 2017 incentive compensation for the co-CEOs.
|
|
|
Performance |
| |
|
Scorecard Performance Measures |
|
|
Multiplier Range |
|
|
Investment Excellence (30%) |
|
1.6 to 2.0 |
| |
|
Financial Results (40%) |
|
1.0 to 1.5 |
| |
|
Strategic Results (30%) |
|
1.6 to 2.0 |
| |
|
Overall Performance Multiplier (100%) |
|
1.0 to 1.5 |
| |
Compensation Elements
Below is a summary of the compensation elements of executive compensation as seen in the Total Compensation table on page 137, which provides the specific detail regarding what the Company’s executives were paid in 2017.
Base Salary
Base salary represents a relatively small proportion of the co-CEOs’ and other executive officers’ compensation and salary increases are rare, as the Compensation Committee believes management should receive a significant portion of their compensation as variable compensation as it better correlates to Company performance.
Variable Compensation
The Compensation Committee emphasizes variable compensation as the primary element of the co-CEOs’ and other executive officers’ compensation program. Variable compensation is awarded in the form of cash (short term incentive) and a mix of equity awards (long term incentive). For the co-CEOs:
· 50% of the variable compensation award delivered as cash (1), and ensures that the Compensation Committee is able to provide appropriate short-term incentives for the executives, which is an important retention element of our overall compensation philosophy.
· The remaining 50% of the variable compensation award is delivered in the form of:
· time-based restricted shares in Janus Henderson and/or shares or units in Janus Henderson funds which vest over a 3-year period;
· performance shares which vest subject to achievement of relevant performance conditions after a 3-year performance period.
These elements reinforce a longer-term focus and more directly aligns the interests of the co-CEOs with the shareholders and with clients.
For the non-CEO executive officers, awards are delivered in a mix of cash (1) and restricted shares/ restricted funds. The cash portion of the 2017 variable compensation awards ranged from 45-56%
(1) To satisfy remuneration code requirements, this includes an element of retained units/shares which are immediately vested but must be held for a minimum period of 6 months.
and the restricted shares/restricted funds portion ranged from 44-55%. Further detail on the award types is set out below:
|
Restricted Stock Awards (RSAs) and Restricted Stock Units (RSUs) |
A substantial portion of variable compensation is deferred into RSAs and RSUs on an annual basis. These awards are subject to 3- year vesting schedules. In some instances, dividends are paid on unvested shares and these are included in the Total Compensation Table on page 137.
|
|
Vesting of restricted stock awards may accelerate under certain circumstances, such as if the executive dies or becomes disabled or retires. Certain awards may contain a provision that allows for the vesting schedule to be accelerated upon a termination following a change in control.
| |
|
Mutual Fund Awards |
A substantial portion of variable compensation is also deferred into Mutual Fund Awards on an annual basis. These awards are typically subject to 3- or 4-year vesting schedules.
|
|
|
Vesting of mutual fund awards may accelerate under certain circumstances, such as if the executive dies or becomes disabled or retires. Certain awards may contain a provision that allows for the vesting schedule to be accelerated upon a termination following a change in control.
|
|
Performance Stock Units (PSUs) |
Performance stock units (PSUs) were granted exclusively to the co-CEOs in respect of the 2017 performance year. These PSU awards vest upon the achievement of the Company’s 3-year total shareholder return being at or above a specific ranking among its peer group as of the end of the 3-year performance period (December 31, 2020 in the case of the 2017 PSU awards). Further information about the 2017 PSUs is outlined below. |
Performance Stock Units
For each of the co-CEOs, 25% of variable incentive remuneration was awarded in the form of PSUs, with the number of share units subject to the award being calculated by reference to the NYSE mid market price on the day immediately preceding the date of grant. The potential payout ranges from zero to 200% of the number of units initially granted, as follows:
· The Minimum payout is earned if the Company’s 3-Year TSR is at or above the 10th percentile ranking.
· Target payout of 100% is earned if the Company’s 3-Year TSR is at the 50th percentile.
· Maximum payout is earned if the Company’s 3-Year TSA is at or above the 90th percentile ranking.
· A payout cannot exceed 400% of the initial grant value.
· Even if the Company’s 3-Year TSR on a relative basis is above the peer group median, if the Company’s 3-Year TSR on an absolute basis is negative, a payout cannot exceed 100% of the number of units initially granted.
· The 2017 PSU Awards have a one-year holding period following vesting, and dividends are not paid on unvested PSU awards.
· The vesting of these awards may accelerate under certain circumstances, such as if the executive dies, becomes disabled or retires. Certain awards may contain a provision that allows for the vesting schedule to be accelerated upon a termination following a change in control.
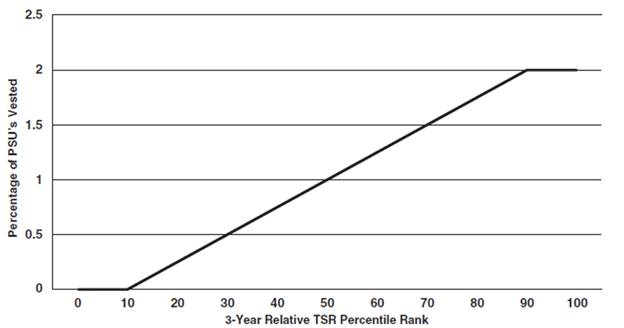
LTI Awards Granted in Consideration of 2017 Performance
In February 2018, the following LTI awards will be granted to the co-CEOs and other executive officers:
|
|
|
|
|
|
|
% of |
|
|
|
|
|
|
|
|
face value |
Vesting |
|
|
|
|
|
|
|
that would |
determined |
|
|
|
Basis of |
|
Number |
Face value |
vest at |
by |
|
|
Type of |
award |
Share |
of units |
of award |
threshold |
performance |
|
Executive Officer |
award |
(% of salary) |
price ($) (4) |
granted |
($’000) |
performance |
over |
|
Andrew Formica |
RSU (1)(3) |
|
|
|
0 |
|
|
|
PSU (2) |
305% |
35.38 |
49,364 |
1,746,500 |
1,746,500 |
3 years | |
|
MFU (1) |
305% |
35.38 |
49,364 |
1,746,500 |
1,746,500 |
| |
|
Richard M. Weil |
RSU |
346% |
35.38 |
56,190 |
1,988,000 |
1,988,000 |
|
|
PSU (2) |
346% |
35.38 |
56,190 |
1,988,000 |
1,988,000 |
3 years | |
|
Other Executive Officers |
RSU (1) |
184% |
35.38 |
75,303 |
2,664,223 |
2,664,223 |
|
|
MFU (3) |
230% |
35.38 |
94,023 |
3,326,530 |
3,326,530 |
|
Notes:
(1) For Mr Formica/Other Executives, the split between RSUs and MFUs reflects a combination of:
a. satisfaction of mandatory regulatory requirements; and
b. internal policy for allowing individuals to elect for a proportion of deferred awards to be delivered in funds, subject to satisfaction of minimum JHG shareholding requirements.
(2) PSUs equal to 25% of total variable pay, vesting after a 3 year period, subject to a TSR based multiplier (which can be between 0 and 200%). Only the co-CEOs receive an element of their variable pay in this form.
(3) Executives are able to elect for a certain proportion of their deferred compensation to be delivered in the form of shares/units or in JHG funds, subject to minimum JHG shareholding requirements.
(4) Represents the Fair Market Value of $35.38 (calculated as the average high $35.61 and low $35.15) on 22 February 2018. The actual FMV will be determined on the grant date of 28 February 2018 as required by ASC Topic 718.
LTI Awards Vested in 2017
The table below shows the details of awards that vested during 2017.
|
|
|
LTIP Awards |
LTI Awards | |||||||
|
|
|
|
|
|
|
|
Value of |
|
|
|
|
|
|
|
|
|
|
Face |
dividends |
|
Number of |
|
|
|
|
|
|
|
|
value of |
accrued |
|
share |
Value |
|
|
|
No of |
No of |
No of |
Vesting |
vested |
on |
Total |
acquired |
realised |
|
|
|
options |
options |
options |
share |
award |
vested |
vested |
on |
on |
|
Name |
Award type |
granted |
vesting |
lapsed |
price ($) |
(S) |
shares |
value |
vesting (#) |
vesting ($) |
|
Andrew Formica |
LTIP 2014 (tranche 2) (1) |
26,333 |
790 |
25,543 |
34.10 |
26,939 |
3,065 |
30,004 |
|
|
|
|
LTIP 2015 (tranche 1) (2) |
50,125 |
17,343 |
32,782 |
34.10 |
591,405 |
0 |
591,405 |
|
|
|
Richard M. Weil |
PSU 2014 (3) |
|
|
|
|
|
|
|
75,634 |
2,909,640 |
|
|
RSA 2013 |
|
|
|
|
|
|
|
11,532 |
443,636 |
|
|
RSA 2014 |
|
|
|
|
|
|
|
16,184 |
622,598 |
|
|
RSA 2015 |
|
|
|
|
|
|
|
16,237 |
624,637 |
|
|
RSA 2016 |
|
|
|
|
|
|
|
15,677 |
603,094 |
|
Other Executive Officers |
LTIP 2014 (tranche 2) (1) |
23,416 |
702 |
22,714 |
34.10 |
23,955 |
2,726 |
26,680 |
|
|
|
|
LTIP 2015 (tranche 1) (2) |
41,484 |
14,353 |
27,131 |
34.10 |
489,453 |
0 |
489,453 |
|
|
|
|
RSA 2013 |
|
|
|
|
|
|
|
56,244 |
1,465,988 |
|
|
RSA 2014 |
|
|
|
|
|
|
|
11,916 |
310,600 |
|
|
RSA 2015 |
|
|
|
|
|
|
|
9,279 |
241,855 |
|
|
RSA 2016 |
|
|
|
|
|
|
|
20,061 |
522,873 |
Notes:
(1) LTIP 2014 failed to meet its primary performance condition (relative TSR against the FTSE General Financials Index) which accounted for 95% of the vesting criteria. Of the remaining 5%, which was measured against Risk and Sustainability metrics, the Committee awarded 3% out of the 5% available to reflect legacy risk and control issues which were identified and deemed to correspond to performance period. Participants were entitled to receive dividend equivalents on vested shares under this plan cycle.
(2) The performance period for the first tranche of LTIP 2015 (2/3 of the original award granted) ended on 31 December 2017 and was determined to have vested at 34.6%* reflective of:
a. For the period pre-Merger, both the Investment Performance (15%) and People Strategy (10%) measures were achieved in full with the TSR (equally vs FTSE and ASX), Operating Margin and Flows Measures falling below minimum vesting threshold, hence an overall outcome of 25% for the pre-merger period (29 months)
b. For the period post Merger the outcomes were as follows:
i. TSR — ranked 58th percentile against the global peer group — vesting contribution of 73.8% (36.9% out of 50% attributable to this measure);
ii. Investment Performance — 66% of funds outperforming at the 3 year point — vesting contribution of 80% (20% out of 25% attributable to this measure);
iii. Relative NIBT growth* — ranked 62nd percentile against the global peer group — vesting contribution of 70.8% (17.7% out of 50% attributable to this measure);
iv. Aggregate vesting for period post Merger = 74.6%*
c. Aggregate vesting for plan over pre- and post Merger periods = 34.6% (29 months at 25% and 7 months at 74.6%)
(3) Mr Weil’s 2014 PSU award vested at a multiplier of 116.84%. This PSU was subject to a 3-year cliff vesting based on the following operating income margin (OIM) hurdles; if 3-year OIM was 24% or less, 0% of the PSUs vest, if 3-year OIM was 28% then 100% of the PSUs vest, and if 3-year OIM was greater than or equal to 32% then 200% of the PSUs vest. As a result of the Change of Control, the Performance was measured on 3/31/2017 at 116.84%.
Service Agreements and Change in Control Arrangements with Executive Officers
The Group remains party to service agreements with Mr Formica, Mr Thompson and Mr Wagstaff that were entered into prior to the Merger which make provision for certain payments in lieu of
* Ranking subject to confirmation of annual earnings for Eaton Vance and Schroder’s Investment Management.
12 months’ notice upon termination and other benefits. The change in control agreement with Mr Weil that was entered into prior to the Merger provides for a payment and accelerated vesting upon termination without cause or for “good reason” (as those terms are defined in the agreement) within 24 months following a change in control, including the Merger. The foregoing is a summary only and does not propose to be a complete description of the terms and provisions of these service agreements and change in control agreements. This description is subject to and qualified in its entirety by reference to the full text of the service agreements with Mr Formica, Mr Thompson and Mr Wagstaff, which are incorporated by reference in Item 15 as Exhibits 10.23, 10.29 and 10.30 and the full text of the change in control agreement with Mr Weil which is incorporated by reference in Item 15 as Exhibit 10.22 to this Annual Report on Form 10-K. The change in control agreement with Mr Chang that was entered into prior to the Merger has since been terminated.
Non-Executive Director Compensation
The following chart shows the compensation that each non-executive director was paid for his or her services in calendar year 2017:
|
|
|
Fees |
|
|
|
|
|
|
| |
|
|
|
Earned or |
|
Stock |
|
All Other |
|
|
| |
|
|
|
Paid in |
|
Awards |
|
Compensation |
|
|
| |
|
Name |
|
|
Cash ($) (1) |
|
($) (2) |
|
($) (3) |
|
Total ($) |
|
|
|
|
|
|
|
|
|
|
|
| |
|
Richard Gillingwater |
|
258,143 |
|
91,667 |
|
0 |
|
349,810 |
| |
|
Glenn S. Schafer |
|
189,583 |
|
91,667 |
|
17,158 |
|
298,409 |
| |
|
Sarah Arkle |
|
161,860 |
|
91,667 |
|
0 |
|
253,527 |
| |
|
Kalpana Desai |
|
109,739 |
|
91,667 |
|
0 |
|
201,406 |
| |
|
Jeffrey J. Diermeier, Director |
|
110,000 |
|
91,667 |
|
10,790 |
|
212,457 |
| |
|
Kevin Dolan |
|
109,739 |
|
91,667 |
|
0 |
|
201,406 |
| |
|
Eugene Flood, Jr., Director |
|
88,333 |
|
91,667 |
|
2,435 |
|
182,435 |
| |
|
Lawrence E. Kochard, Director |
|
97,500 |
|
91,667 |
|
39,433 |
|
228,600 |
| |
|
Angela Seymour-Jackson |
|
135,193 |
|
91,667 |
|
0 |
|
226,860 |
| |
|
Tatsusaburo Yamamoto, Director |
|
0 |
|
0 |
|
0 |
|
0 |
| |
Notes:
(1) Amounts represent the annual cash retainers for serving as members of the Board of Directors, including non-executive Chairman and committee membership retainers, which, prior to the Merger, were paid:
a. monthly to legacy Henderson directors; and
b. paid in a lump sum on May 1 of each year for legacy JCG (except for the Chairman, who was paid quarterly).
On May 30, all legacy members of the JCG board of directors were paid 1/12 of their retainers under the legacy JCG board fee retainer structure (including 1/12 of their stock fee retainer which was paid in cash). Beginning on June 1, 2017, all members of the Janus Henderson board of directors began earning their retainer fees under a new payment structure which is now paid in arrears in quarterly increments.
(2) Amounts represent the value of JHG shares awarded for the 2017-2018 annual stock retainer.
(3) “All Other Compensation” includes the following:
|
|
|
|
|
Dividends on |
|
|
|
|
| |
|
|
|
|
|
unvested |
|
Dividends on |
|
|
| |
|
|
|
|
|
restricted |
|
unvested |
|
|
| |
|
|
|
|
|
stock |
|
restricted |
|
|
| |
|
Name |
|
Other (1) |
|
pre-Merger ($) |
|
stock units ($) (2) |
|
Total |
| |
|
|
|
|
|
|
|
|
|
|
|
|
|
|
|
|
|
|
|
|
|
|
|
|
|
Richard Gillingwater |
|
0 |
|
0 |
|
0 |
|
0 |
| |
|
Glenn S. Schafer |
|
510 |
|
858 |
|
15,790 |
|
17,158 |
| |
|
Sarah Arkle |
|
0 |
|
0 |
|
0 |
|
0 |
| |
|
Kalpana Desai |
|
0 |
|
0 |
|
0 |
|
0 |
| |
|
Jeffrey J. Diermeier |
|
0 |
|
2,369 |
|
8,421 |
|
10,790 |
| |
|
Kevin Dolan |
|
0 |
|
0 |
|
0 |
|
0 |
| |
|
Eugene Flood, Jr |
|
0 |
|
2,435 |
|
0 |
|
2,435 |
| |
|
Lawrence E. Kochard |
|
0 |
|
0 |
|
39,433 |
|
39,433 |
| |
|
Angela Seymour-Jackson |
|
0 |
|
0 |
|
0 |
|
0 |
| |
|
Tatsusaburo Yamamoto |
|
0 |
|
0 |
|
0 |
|
0 |
| |
(1) The amount includes the membership fees for identity theft protection services paid by the Company on behalf of the director.
(2) This amount represents the value of dividend equivalents awarded in the form of Restricted Stock Units in 2017 on all grants deferred under the Director Deferred Fee Plan. The restricted stock units held by each independent director as of December 31, 2017, are as follows: Mr. Diermeier holds 7,682 restricted stock units; Mr. Kochard holds 36,313 restricted stock units; and Mr. Schafer holds 14,495 restricted stock units.
Interests in Group Shares
The following table shows the interests in Group shares, both unvested shares held pursuant to Group share plans and beneficially owned, by Executive Directors and other named executives. The table also shows the movement in those holdings during 2017.
|
|
|
|
|
|
|
|
|
|
|
|
|
|
|
Vested in |
|
|
|
| ||
|
|
|
|
|
|
|
Interest at |
|
|
|
Vested |
|
Vested |
|
previous |
|
|
|
Interest at | ||
|
|
|
|
|
|
|
December 31, |
|
|
|
2017 not |
|
2017 and |
|
years and |
|
|
|
December 31, | ||
|
|
|
Plan |
|
Type |
|
2016 (1)(2) |
|
Awarded |
|
exercised |
|
exercised |
|
exercised |
|
Lapsed |
|
2017 | ||
|
|
|
|
|
|
|
|
|
|
|
|
|
|
|
|
|
|
|
| ||
|
|
|
|
|
|
|
|
|
|
|
|
|
|
|
|
|
|
|
| ||
|
Andrew Formica |
|
SAYE |
|
Options |
|
816 |
|
489 |
|
|
|
420 |
|
|
|
|
|
|
885 |
|
|
|
|
BAYE |
|
Shares |
|
6,632 |
|
605 |
|
|
|
|
|
|
|
|
|
|
7,234 |
|
|
|
|
LTI |
|
Shares |
|
0 |
|
39,580 |
|
|
|
|
|
|
|
|
|
|
39,580 |
|
|
|
|
LTIP |
|
Options |
|
238,187 |
|
0 |
|
|
|
1,580 |
|
|
|
119,995 |
|
|
116,610 |
|
|
Total outstanding interests in Janus |
|
|
|
|
|
|
|
|
|
|
|
|
|
|
|
|
|
|
|
|
|
Henderson share schemes |
|
|
|
|
|
|
|
|
|
|
|
|
|
|
|
|
|
|
164,309 |
|
|
Total shares held outright outside Janus |
|
|
|
|
|
|
|
|
|
|
|
|
|
|
|
|
|
|
|
|
|
Henderson share schemes |
|
|
|
|
|
|
|
|
|
|
|
|
|
|
|
|
|
|
367,137 |
|
|
Total interests in Janus Henderson |
|
|
|
|
|
|
|
|
|
|
|
|
|
|
|
|
|
|
531,446 |
|
|
|
|
|
|
|
|
|
|
|
|
|
|
|
|
|
|
|
|
|
|
|
|
Dick Weil |
|
RSA |
|
Shares |
|
155,316 |
|
0 |
|
|
|
|
|
|
|
59,630 |
|
|
95,686 |
|
|
|
|
PSU (3) |
|
Shares |
|
229,794 |
|
0 |
|
|
|
|
|
|
|
100,697 |
|
|
129,097 |
|
|
|
|
ESOP |
|
Shares |
|
366 |
|
42 |
|
|
|
|
|
|
|
|
|
|
408 |
|
|
Total outstanding interests in Janus |
|
|
|
|
|
|
|
|
|
|
|
|
|
|
|
|
|
|
|
|
|
Henderson share schemes |
|
|
|
|
|
|
|
|
|
|
|
|
|
|
|
|
|
|
225,191 |
|
|
Total shares held outright outside Janus |
|
|
|
|
|
|
|
|
|
|
|
|
|
|
|
|
|
|
|
|
|
Henderson share schemes |
|
|
|
|
|
|
|
|
|
|
|
|
|
|
|
|
|
|
872,972 |
|
|
Total interests in Janus Henderson |
|
|
|
|
|
|
|
|
|
|
|
|
|
|
|
|
|
|
1,098,163 |
|
|
|
|
|
|
|
|
|
|
|
|
|
|
|
|
|
|
|
|
|
|
|
|
|
|
|
|
|
|
|
|
|
|
|
|
|
|
|
|
|
|
|
|
|
|
Roger Thompson |
|
SAYE |
|
Options |
|
841 |
|
978 |
|
|
|
841 |
|
|
|
|
|
|
978 |
|
|
|
|
BAYE |
|
Shares |
|
757 |
|
296 |
|
|
|
|
|
|
|
|
|
|
1,053 |
|
|
|
|
DEP/ESOP |
|
Shares |
|
8,654 |
|
5,315 |
|
|
|
4,211 |
|
|
|
|
|
|
9,758 |
|
|
|
|
LTIP |
|
Options |
|
146,995 |
|
0 |
|
745 |
|
|
|
|
|
56,705 |
|
|
90,289 |
|
|
|
|
RSP |
|
Shares |
|
0 |
|
19,185 |
|
|
|
|
|
|
|
|
|
|
19,185 |
|
|
Total outstanding interests in Janus |
|
|
|
|
|
|
|
|
|
|
|
|
|
|
|
|
|
|
|
|
|
Henderson share schemes |
|
|
|
|
|
|
|
|
|
|
|
|
|
|
|
|
|
|
121,263 |
|
|
Total shares held outright outside Janus |
|
|
|
|
|
|
|
|
|
|
|
|
|
|
|
|
|
|
|
|
|
Henderson share schemes |
|
|
|
|
|
|
|
|
|
|
|
|
|
|
|
|
|
|
23,342 |
|
|
Total interests in Janus Henderson |
|
|
|
|
|
|
|
|
|
|
|
|
|
|
|
|
|
|
144,605 |
|
|
|
|
|
|
|
|
|
|
|
|
|
|
|
|
|
|
|
|
|
|
|
|
Enrique Chang |
|
RSA |
|
Shares |
|
188,157 |
|
62,037 |
|
|
|
|
|
|
|
97,500 |
|
|
152,694 |
|
|
|
|
ESOP |
|
Shares |
|
0 |
|
30 |
|
|
|
|
|
|
|
|
|
|
30 |
|
|
Total outstanding interests in Janus |
|
|
|
|
|
|
|
|
|
|
|
|
|
|
|
|
|
|
|
|
|
Henderson share schemes |
|
|
|
|
|
|
|
|
|
|
|
|
|
|
|
|
|
|
152,724 |
|
|
Total shares held outright outside Janus |
|
|
|
|
|
|
|
|
|
|
|
|
|
|
|
|
|
|
|
|
|
Henderson share schemes |
|
|
|
|
|
|
|
|
|
|
|
|
|
|
|
|
|
|
193,616 |
|
|
Total interests in Janus Henderson |
|
|
|
|
|
|
|
|
|
|
|
|
|
|
|
|
|
|
346,340 |
|
|
|
|
|
|
|
|
|
|
|
|
|
|
|
|
|
|
|
|
|
|
|
|
|
|
|
|
|
|
|
|
|
|
|
|
|
|
|
|
|
|
|
|
|
|
Phil Wagstaff |
|
SAYE |
|
Options |
|
857 |
|
489 |
|
|
|
420 |
|
|
|
|
|
|
925 |
|
|
|
|
BAYE |
|
Shares |
|
2,317 |
|
351 |
|
|
|
|
|
|
|
|
|
|
2,666 |
|
|
|
|
DEP/ESOP |
|
Shares |
|
16,350 |
|
15,292 |
|
|
|
7,994 |
|
|
|
|
|
|
23,648 |
|
|
|
|
LTIP |
|
Options |
|
87,981 |
|
0 |
|
|
|
660 |
|
|
|
45,327 |
|
|
41,994 |
|
|
|
|
RSP |
|
Shares |
|
154,547 |
|
18,088 |
|
|
|
62,135 |
|
|
|
31,067 |
|
|
79,432 |
|
|
Total outstanding interests in Janus |
|
|
|
|
|
|
|
|
|
|
|
|
|
|
|
|
|
|
|
|
|
Henderson share schemes |
|
|
|
|
|
|
|
|
|
|
|
|
|
|
|
|
|
|
148,665 |
|
|
Total shares held outright outside Janus |
|
|
|
|
|
|
|
|
|
|
|
|
|
|
|
|
|
|
|
|
|
Henderson share schemes |
|
|
|
|
|
|
|
|
|
|
|
|
|
|
|
|
|
|
17,168 |
|
|
Total interests in Janus Henderson |
|
|
|
|
|
|
|
|
|
|
|
|
|
|
|
|
|
|
165,833 |
|
Notes:
(1) For Messrs Formica, Thompson and Wagstaff, interets as of 31 December 2016 reflect the post consolidation holdings (after 1 for 10 conversion into Janus Henderson shares) and may reflect small/fractional rounding differences from the figures reported in 2017
(2) For Messrs Weil and Chang, interests as of December 31, 2016 reflect the post merger amounts after applying the conversion rate of 0.4719 per share.
(3) For Mr Weil, total PSU interest at 31 December 2016 includes the share reduction from 100% of target of –21,064 and the share increase from 100% of target of 10,899 related to the 2013 and 2014 awards based on performance calculation, respectively.
Compensation Committee Interlocks and Insider Participation
Sarah Arkle, Kevin Dolan and Angela Seymour-Jackson served as members of the legacy Henderson Group plc Compensation Committee between 1 January 2017 until the Merger, following which the Compensation Committee of Janus Henderson Group was comprised of Lawrence Kochard, Richard Gillingwater, Glenn Schafer and Angela Seymour-Jackson. No member of the Compensation Committee was an officer or employee of the Company or any of its subsidiaries during fiscal year 2017, and no member of the Compensation Committee was formerly an officer of the Company or any of its subsidiaries or was a party to any disclosable related person transaction involving the Company for the same period. During fiscal year 2017, none of the executive officers of the Company served on the board of directors or on the compensation committee of any other entity that has or had executive officers serving as a member of the board of directors or Compensation Committee of the Company.
Information responding to Item 407(e)(5) of SEC Regulation S-K is omitted because the Company is a “foreign private issuer” as defined in SEC Rule 3b-4 under the Exchange Act.
Item 12. SECURITY OWNERSHIP OF CERTAIN BENEFICIAL OWNERS AND MANAGEMENT AND RELATED STOCKHOLDER MATTERS
Stock Ownership of Certain Beneficial Owners and Management
The table below sets forth information regarding beneficial ownership of our outstanding common stock as of February 22, 2018, by (i) beneficial owners of more than five percent of our outstanding common stock who have publicly disclosed their ownership; (ii) each executive officer (defined below) and each member of our Board of Directors; and (iii) all of our executive officers and directors as a group. The Company has no knowledge of any arrangement that would at a subsequent date result in a change in control of the Company.
|
|
|
Shares of Common Stock | |||
|
|
|
Beneficially Owned (1) | |||
|
Name |
|
|
Number |
|
Percentage |
|
|
|
|
|
|
|
|
|
|
|
|
| |
|
Dai-ichi Life Holdings, Inc. (2) |
|
31,574,756 |
|
15.0 | |
|
The Vanguard Group Inc. (3) |
|
15,776,124 |
|
7.87 | |
|
BlackRock, Inc (4) |
|
11,583,878 |
|
5.8 | |
|
Richard Gillingwater, Chairman of the Board of Directors |
|
6,187 |
|
* | |
|
Glenn S. Schafer, Deputy Chairman of the Board of Directors (5) |
|
31,112 |
|
* | |
|
Andrew Formica, Co-CEO and Director |
|
374,386 |
|
* | |
|
Richard Weil, Co-CEO and Director |
|
906,180 |
|
* | |
|
Sarah Arkle, Director |
|
3,420 |
|
* | |
|
Kalpana Desai, Director |
|
5,729 |
|
* | |
|
Jeffrey Diermeier, Director (5) |
|
60,740 |
|
* | |
|
Kevin Dolan, Director |
|
1,928 |
|
* | |
|
Eugene Flood, Jr., Director |
|
15,181 |
|
* | |
|
Lawrence Kochard, Director (5) |
|
38,566 |
|
* | |
|
Angela Seymour-Jackson, Director |
|
2,462 |
|
* | |
|
Tatsusaburo Yamamoto, Director |
|
— |
|
* | |
|
Roger Thompson, Chief Financial Officer |
|
29,142 |
|
* | |
|
Enrique Chang, Chief Investment Officer |
|
320,397 |
|
* | |
|
Phil Wagstaff, Global Head of Distribution |
|
30,439 |
|
* | |
|
All Directors and Executive Officers as a Group (15 Persons) |
|
1,823,932 |
|
* | |
* Less than one percent of the outstanding shares.
Unless otherwise stated below, the principal address of each person is: c/o Janus Henderson Group plc, 201 Bishopsgate, London EC2M 3AE.
(1) Ownership, both direct and indirect, is based on the number of shares outstanding as of February 22, 2018, including unvested restricted stock units and DEP shares that will vest within 60 days of February 22, 2018 and any shares that may be acquired upon the exercise of options within 60 days of February 22, 2018. The holders have sole voting and dispositive power over the shares except as otherwise noted in the footnotes below. Amounts shown for officers include shares of restricted stock, shares held indirectly through Janus Henderson’s ESOP (over which the person named has no investment power) and restricted shares held indirectly through Janus Henderson’s BAYE over which the holder has voting power: Mr. Chang holds 95,928 restricted shares and 30 ESOP Shares and Mr. Weil holds 95,686 restricted shares and 409 ESOP shares. Mr Formica holds 5,976 restricted BAYE shares, 1,273 unrestricted BAYE shares and zero DEP shares. Mr Thompson holds 526 restricted BAYE shares, 542 unrestricted BAYE shares and 4,732 DEP shares. Mr Wagstaff holds 1,741 restricted BAYE shares, 937 unrestricted BAYE shares, and 10,593 DEP shares.
(2) Information regarding beneficial ownership of the shares by Dai-ichi Life is included herein based on a Form 13D/A filed with the SEC on February 8, 2018, relating to such shares beneficially owned as of February 6, 2018. The address of Dai-ichi Life is 13-1, Yurakucho 1-Chome, Chiyoda-ku, Tokyo, 100-8411 Japan. Represents 21,574,756 shares outstanding and 10,000,000 shares issuable upon the exercise of the conditional options granted pursuant to the Option Agreement, dated as of October 3, 2016, between Dai-ichi Life Holdings, Inc. and the Company.
(3) Information regarding beneficial ownership of the shares by The Vanguard Group Inc. (“Vanguard”) is based on a Schedule 13G filed with the SEC on February 7, 2018, relating to such shares beneficially owned as of December 31, 2017. Such report provides that Vanguard is the beneficial owner of all the shares, and has sole dispositive power with respect to 15,705,790 shares and sole voting power with respect to 61,605 shares. Vanguard’s address is 100 Vanguard Boulevard, Malvern, Pennsylvania 19355.
(4) Information regarding beneficial ownership of the shares by BlackRock, Inc. (“BlackRock”), is based on a Schedule 13G filed with the SEC on January 31, 2018, relating to such shares beneficially owned as of December 31, 2017. Such report provides that BlackRock is beneficial owner of and has sole dispositive power with respect to all shares and sole voting power with respect to 11,288,900 shares. BlackRock’s address is 55 East 52nd Street, New York, NY 10055.
(5) Includes restricted stock units held by certain directors. Such restricted stock units do not have any voting rights, are entitled to dividend equivalents, and will be paid in shares of Company common stock upon voluntary termination of service as a director, all in accordance with the Director Deferred Fee Plan and the Company’s long-term incentive (“LTI”) stock plans. The restricted stock units represented in the amounts shown are as follows: Mr Diermeier — 7,682 units; Mr Kochard — 36,313 units; and Mr Schafer — 14,495 units.
Equity Compensation Plan Information
The following table presents information, determined as of February 22, 2018, about outstanding awards and shares remaining available for issuance under the Company’s equity-based LTI plans:
|
|
|
|
|
|
|
Number of |
| |
|
|
|
|
|
|
|
securities |
| |
|
|
|
|
|
|
|
remaining |
| |
|
|
|
Number of |
|
|
|
available for |
| |
|
|
|
securities |
|
|
|
future |
| |
|
|
|
to be |
|
|
|
issuance |
| |
|
|
|
issued |
|
|
|
under equity |
| |
|
|
|
upon |
|
|
|
compensation |
| |
|
|
|
exercise of |
|
|
|
plans |
| |
|
|
|
outstanding |
|
Weighted-average |
|
(excluding |
| |
|
|
|
options, |
|
exercise price of |
|
securities |
| |
|
|
|
warrants |
|
outstanding |
|
reflected in |
| |
|
|
|
and rights |
|
options, warrants |
|
column (a)) |
| |
|
Plan Category |
|
|
(a)(#) |
|
and rights ($) (b) |
|
(c)(#) |
|
|
|
|
|
|
|
|
|
|
|
|
|
|
|
|
|
|
|
| |
|
|
|
|
|
|
|
|
| |
|
Equity comp plans approved by shareholders (1) |
|
929,970 |
|
— (2) |
|
— (3) |
| |
|
Equity comp plans not approved by shareholders (4) |
|
92,949 |
|
$18.76 |
|
4,344,169 |
| |
|
Total (5) |
|
1,022,919 |
|
$18.76 |
|
4,344,169 (6) |
| |
(1) Includes the legacy Henderson Group plc Long Term Incentive Plan (“LTIP”).
(2) There is no exercise price associated with the outstanding LTIP.
(3) No securities are reserved for issuance under the legacy LTIP as the Company does not intend to issue any further awards under this compensation plan.
(4) Includes Janus Capital Group Inc.’s 1998 Long Term Incentive Plan and 2005 Long Term Incentive Plan that were previously approved by Janus shareholders and were assumed by the Company as part of the Merger, however the Company does not intend to make any new awards under these legacy plans. Also consists of the following ongoing plans assumed by the Company pursuant to the Merger that may result in new awards:
Janus Henderson Group plc 2010 Long Term Incentive Stock Plan
(i) Introduction
The Janus Henderson Group plc Second Amended and Restated 2010 Long Term Incentive Stock Plan (the 2010 LTI Plan) is intended to allow employees, directors and consultants of the Company and its subsidiaries to acquire or increase equity ownership in the Company, thereby strengthening their commitment to the success of the Company and stimulating their efforts on behalf of the Company, and to assist the Company and its subsidiaries in attracting new employees, directors and consultants and retaining existing employees, directors and consultants. The 2010 LTI Plan also is intended to optimize the profitability and growth of the Company through incentives which are consistent with the Company’s goals; to provide employees, directors and consultants with an incentive for excellence in individual performance; and to promote teamwork among employees, directors and consultants.
(ii) Duration
Unless the Board determines to terminate the plan earlier, the 2010 LTI Plan will remain in effect until the earlier of (a) all ordinary shares subject to the plan have been purchased or acquired according to the plan’s provisions or (b) April 24, 2025.
(ii) Eligibility
All employees, directors and consultants performing services for the Company or its subsidiaries.
(iii) Types of awards
Restricted Stock
Represents shares of Janus Henderson Group common stock that are issued subject to restrictions on transfer and vesting requirements. The recipient has the same rights as a Janus Henderson shareholder and the stock is subject to a minimum vesting period of at least twelve months.
Restricted Stock Units
Provides the participant the right to receive a payment based on the value of a share of Janus Henderson common stock. The Compensation Committee determines vesting requirements, restrictions and conditions to payment and awards are payable in cash, shares of Janus Henderson common stock or a combination of both and may be granted with related dividend equivalent rights and subject to a minimum vesting period of at least twelve months.
Performance Share Units
Provides the participant the right to receive a payment based on the value of a share of Janus common stock. The Compensation Committee determines vesting requirements, restrictions and conditions to payment, awards are granted with performance hurdles to vest and are payable in cash, shares of Janus Henderson common stock or a combination of both and subject to a minimum vesting period of at least twelve months. No dividends are payable on unvested units.
Stock Options
Entitles the participant, upon exercise and payment of the applicable exercise price, to receive the number of shares of Janus Henderson common stock underlying the portion of the stock option so exercised. Either non-qualified stock options or incentive stock options can be awarded and the exercise price of any stock option granted may not be less than the fair market value of Janus Henderson common stock on the date the option is granted. The exercise price may be paid in cash, in shares of Janus Henderson common stock, through a cashless exercise or as otherwise permitted by the Compensation Committee.
The Compensation Committee can determine the terms (including vesting and forfeiture) of each stock option grant at the time of the grant. Awards are subject to a minimum vesting period of at least twelve months.
Stock Appreciation Rights (SAR)
Entitles the participant, upon settlement, to receive a payment (in cash or in shares of Janus Henderson common stock) based on the excess of the fair market value of a share of Janus Henderson common stock over the strike price of the SAR. The strike price may not be less than the fair market value of a share of Janus Henderson common stock on the date of grant and awards are payable in cash, shares of Janus Henderson common stock or a combination of both.
The Compensation Committee determines vesting requirements, payment and other terms and awards are subject to a minimum vesting period of at least twelve months (unless purchased for fair market value or granted to an independent director, subject to a combined 5% cap on such purchased or director).
Stock Awards
Represents shares of Janus Henderson common stock that are issued free of transfer restrictions and forfeiture conditions. They may be granted for past services in lieu of bonus or other cash compensation (together with any director awards, subject to a 5% cap) and the participant is entitled to all the rights of a Janus Henderson shareholder.
(iii) Change of Control
Except as otherwise provided in an individual award agreement or determined by the Compensation Committee at the time an award is granted, if a Change of Control (as defined in the 2010 LTIP) occurs, each award will remain outstanding and will continue to vest in accordance with its terms following the Change of Control (as defined in the 2010 LTIP), subject to equitable adjustment in connection with the Change of Control. If the participant’s employment is terminated by the Company without Cause or by the participant for Good Reason (each as defined in the 2010 LTI Plan or the award agreement) during the 24-month period following such Change of Control, then on the date of such termination (i) any outstanding award will become fully vested and exercisable, (ii) the restrictions, payment conditions, and forfeiture conditions applicable to any such award will lapse, and (iii) any performance conditions imposed with respect to such awards will be deemed to be fully achieved at target levels.
Janus Henderson Group plc 2012 Employment Inducement Award Plan
(i) Introduction
The Janus Henderson Group plc Second Amended and Restated 2012 Employment Inducement Award Plan (the 2012 EIA) is intended to assist the Company and its subsidiaries in attracting new employees, and to allow new employees of the Company and its subsidiaries to acquire equity ownership in the Company, thereby strengthening their commitment to the success of the Company and stimulating their efforts on behalf of the Company. The 2012 EIA also is intended to optimize the profitability and growth of the Company through incentives which are consistent with the Company’s goals; to provide new employees with an incentive for excellence in individual performance and to promote teamwork among employees.
(ii) Duration
Unless the Board determines to terminate the plan earlier, the 2012 EIA will remain in effect until all ordinary shares subject to the plan have been purchased or acquired according to the plan’s provisions.
(iii) Eligibility
In accordance with the NYSE rules, the 2012 EIA only permits awards to newly hired employees of the Company or its subsidiaries to induce them to become employed by a Janus Henderson entity. Any award granted under the 2012 EIA Plan requires the issuance of a press release and NYSE notification of the additional shares being issued. The 2012 EIA is not frequently used for long-term incentive awards.
(iii) Types of awards
Under the 2012 EIA, the Company may award Restricted Stock, Restricted Stock Units, Performance Share Units, Stock Options and Stock Appreciation Rights on substantially the same terms as summarized above for the 2010 LTIP, except there is no minimum vesting period applicable to the 2012 EIA.
(iv) Change of Control
Except as otherwise provided in an individual award agreement or determined by the Compensation Committee at the time an award is granted, if a Change of Control (as defined in the 2012 EIA) occurs, each award will remain outstanding and will continue to vest in accordance with its terms following the Change of Control (as defined in the 2012 EIA), subject to equitable adjustment in connection with the Change of Control. If the participant’s employment is terminated by the Company without Cause or by the participant for Good Reason (each as defined in the 2012 EIA or the award agreement) during the 24-month period following such Change of Control, then on the date of such termination (i) any outstanding award will become fully vested and exercisable, (ii) the restrictions, payment conditions, and forfeiture conditions applicable to any such award will lapse, and (iii) any performance conditions imposed with respect to such awards will be deemed to be fully achieved at target levels.
(5) Weighted average remaining term for outstanding stock options as of February 22, 2018 was 1.17 years.
(6) As of February 22, 2018, approximately 1,577,256 stock options and 1,128 shares of restricted stock were available for future issuance under the 2005 LTI Plan, and zero (0) shares of common stock were available for future issuance under the 1998 Plan. As of February 22, 2018, approximately 2,393,440 shares were available for future issuance under the 2010 LTIP (including 258,194 reserved shares representing 200% of Dick Weil’s 2015 and 2016 PSU awards). Also, the Company had 2,709,512 shares of unvested restricted stock and restricted stock unit awards outstanding as of February 22, 2018 (including 129,097 unvested shares representing 100% of Dick Weil’s 2015 and 2016 PSU awards).
Item 13. CERTAIN RELATIONSHIPS AND RELATED TRANSACTIONS, AND DIRECTOR INDEPENDENCE
Related Party Transaction Policy
Our related party transaction approval policy provides that related party transactions must be pre-approved by the Audit Committee. Related party transactions include any financial transaction, arrangement, or relationship (including any indebtedness or guarantee of indebtedness) or any series of similar transactions, arrangements, or relationships in which the Company was or is to be a participant and the amount involved exceeds $120,000, and in which any related person had or will have a direct or indirect material interest. Our related party transaction approval policy is part of our Corporate Code of Business Conduct available on our website at http://www.janushenderson.com/group under “About Janus Henderson” link, “Board Committees”.
Related Party Transactions
Certain of the directors and executive officers, as well as their immediate family members, from time to time may invest their personal funds in JHG mutual funds on substantially the same terms and conditions as other similarly situated investors in these mutual funds who are neither directors nor employees of Janus.
Other than as disclosed below, no JHG director or member of senior management has or has had (i) any material interest in any transaction with JHG or any of its subsidiaries or (ii) any interest in any transaction which is or was unusual in its nature or conditions or is or was significant to the business of JHG and which was effected by JHG or any of its subsidiaries in the preceding three financial years. There are no outstanding loans or guarantees provided by JHG or any of its subsidiaries for the benefit of JHG directors or senior management during this period.
In April 2012, a subsidiary of JHG entered into an agreement with Marketing in Partnership Limited, a company in which Dorothy Helen Wagstaff, the spouse of Phil Wagstaff, JHG’s Global Head of Distribution, is a significant shareholder and a director. Under the terms of the agreement, Marketing in Partnership Limited provides event management, promotion and marketing services to JHG. Under the agreement, JHG paid Marketing in Partnership Limited aggregate consideration of £632,000 in 2015, £465,000 in 2016 and £660,000 in 2017.
Amended and Restated Investment and Strategic Cooperation Agreement
On October 3, 2016 Henderson, JCG and Dai-ichi entered into an Amended and Restated Investment and Strategic Cooperation Agreement (the “Amended Investment and Cooperation Agreement”). Following the effective time of the Merger, JHG succeeded to the rights and obligations of JCG under the Amended Investment and Cooperation Agreement.
Ownership Limit
Dai-ichi has agreed not to acquire more than 20% of the issued and outstanding shares of JHG, (“the ownership limit”), and to reduce its percentage ownership to the ownership limit should its percentage ownership exceed the ownership limit at any time.
Invested Assets; Distribution
Under the terms of the Amended Investment and Cooperation Agreement, subject to certain conditions, Dai-ichi has agreed to maintain investments in investment products of JHG and its affiliates of not less than $2 billion and, no later than 12 months following the effective time of the Merger, cause additional cash in the amount of up to $500 million to be invested in new investment products of JHG and its affiliates, which will be determined based on good faith discussions between JHG and Dai-ichi. A certain proportion of Dai-ichi’s investments will continue to be held in seed capital investments. In addition, JHG and Dai-ichi have agreed to cooperate in good faith and use commercially reasonable efforts to sell investment products through each other’s distribution channels.
Board Designation Right
Dai-ichi has the right to designate a Dai-ichi Representative for appointment to JHG’s board of directors until such right is terminated in accordance with the terms of the Amended Investment and Cooperation Agreement. Dai-ichi’s right to designate a Dai-ichi Representative may be terminated under certain circumstances set forth in the Amended Investment and Cooperation Agreement, and in particular is dependent on Dai-ichi maintaining a shareholding in JHG above the applicable percentage (as described below).
Standstill Restrictions
Dai-ichi is subject to certain standstill restrictions and, subject to certain exceptions, cannot, in each case without the consent of JHG’s board of directors, among other things, initiate tender or exchange offers for securities of JHG or its subsidiaries, seek the nomination or election of any individual as a director of JHG (other than Dai-ichi’s right to designate the Dai-ichi Representative as described above), participate in any recapitalization, restructuring, liquidation, dissolution or other similar extraordinary transaction with respect to JHG or its subsidiaries, acquire or obtain any economic interest in securities of JHG (other than the acquisition of up to 20% of the issued and outstanding shares of JHG as permitted by the Amended Investment and Cooperation Agreement) or dispose any shares of JHG in an unsolicited tender offer (other than under certain circumstances as permitted by the Amended Investment and Cooperation Agreement). In addition, the standstill restrictions are suspended if Dai-ichi owns less than 3% of the issued and outstanding shares of JHG and, with certain exceptions, terminated upon change of control of JHG.
Transfer Restrictions
Dai-ichi is subject to certain limitations on its ability to transfer its JHG shares and cannot, without JHG’s consent, transfer its shares within three years of the date of the Amended Investment and Cooperation Agreement, except that it may transfer its shares to the extent necessary to comply with applicable law, effectively binding written or oral administrative guidance from a governmental authority in Japan or an order by such a governmental authority, upon an insolvency event with respect to either JHG or Dai-ichi, upon certain events of financial distress with respect to Dai-ichi or JHG, or where certain conditions in relation to the nature of the proposed transfer set forth in the Amended Investment and Cooperation Agreement are met. JHG is generally entitled to a right of first
offer or a right of first refusal, depending on the nature of the proposed transfer, with respect to Dai-ichi’s proposed transfer of its JHG shares.
Preemptive Rights
In the event that JHG proposes to issue new JHG shares, for so long as Dai-ichi maintains its shareholding in JHG at the level immediately after the effective time of the Merger (subject to dilution in certain circumstance) (the “applicable percentage”), Dai-ichi has the right to purchase up to such number of JHG shares that would allow Dai-ichi to maintain a percentage ownership of the issued and outstanding JHG shares that is, after giving effect to the issuance of the new securities, no less than the percentage ownership Dai-ichi had prior to such issuance. Dai-ichi is entitled to exercise its preemptive rights in respect of JHG’s issuance of new securities to provide equity compensation for employment for its directors, officers or employees only if such issuance would cause Dai-ichi’s percentage ownership to decrease to less than the applicable percentage. In each case, Dai-ichi does not have preemptive rights to the extent that an issuance of the additional JHG shares to Dai-ichi would require approval of the shareholders of JHG pursuant to Rule 312 of the New York Stock Exchange Listed Company Manual or any successor rule thereof or ASX Listing Rule 7.1 or any successor rule thereof, unless such approval has been obtained.
Registration Rights
At any time following the effective time of the Merger, and without limiting the restrictions on transfers described above, Dai-ichi will be entitled to customary registration rights, including the right to require JHG to file up to two registration statements to register JHG shares owned by Dai-ichi (the “Registrable Shares”), and unlimited prospectus supplements in connection with any take-down from an effective shelf registration statement. In addition, Dai-ichi has certain “piggyback” registration rights with respect to the Registrable Shares to participate in certain securities offerings by JHG.
Termination
The Amended Investment and Cooperation Agreement may be terminated by either JHG or Dai-ichi under specified circumstances, including if (i) there is an insolvency event with respect to the other party, (ii) if such termination is necessary to comply with applicable law, effectively binding written or oral administrative guidance from a governmental authority or an order by a governmental authority, (iii) there is a material uncured breach of the Amended Investment and Cooperation Agreement by the other party, (iv) during any consecutive five business day period, Dai-ichi owns less than the applicable percentage of the issued and outstanding shares of JHG (subject to certain exceptions), or (v) JHG terminates Dai-ichi’s right to designate a Dai-ichi Representative to JHG’s board of directors. In addition, each of JHG and Dai-ichi may terminate the Amended Investment and Cooperation Agreement following the third anniversary of the date of the Merger, upon 90-days written notice to the other party (which notice may not be given prior to the third anniversary of the date of the Merger).
The Amended Investment and Cooperation Agreement may be terminated by JHG if there is a change in Japanese generally accepted accounting principles or other applicable accounting principles that would significantly increase the burden to JHG in complying with its obligations to furnish certain financial and operating information to Dai-ichi, or if JHG or any of its affiliates becomes subject to direct regulation by, or sanctions from, any Japanese governmental authority that it would not be subject to in the absence of the strategic alliance.
The Amended Investment and Cooperation Agreement may also be terminated by Dai-ichi if JHG informs Dai-ichi that it is unable to comply with its obligations to furnish certain financial and operating information or there is a change in applicable law in Japan that requires Dai-ichi to receive
information that it is not already receiving from JHG, such inability to comply or change in applicable law would or would reasonably be expected to result in Dai-ichi being in violation of applicable law, and the parties following good faith discussions are unable to agree on appropriate changes to JHG’s obligations to furnish certain information that would avoid Dai-ichi being in violation of applicable law. Dai-ichi may also terminate the Amended Investment and Cooperation Agreement if (i) its percentage ownership has been diluted to less than the applicable percentage of the issued and outstanding JHG shares due to JHG’s issuance of new securities and Dai-ichi was unable to prevent such dilution by exercising its preemptive rights, using commercially reasonable efforts to purchase shares on the open market or, following the effective time of the Merger, exercising its remaining options under the Option Agreement or (ii) Dai-ichi or any of its affiliates becomes subject to direct regulation by, or sanctions from, any governmental authority (other than a Japanese, Jersey, U.K., Australian or U.S. governmental authority) that it would not be subject to in the absence of the strategic alliance.
Option Agreement
On October 3, 2016, Henderson and Dai-ichi entered into an option agreement (the “Option Agreement”), pursuant to which, upon closing of the Merger, JHG granted Dai-ichi: (i) 11 tranches of conditional options with each tranche allowing Dai-ichi to subscribe for or purchase 500,000 JHG shares at a strike price of 2,997.2 pence per share (the terms of such options having been adjusted in accordance with the terms of the Option Agreement to take account of the effect of the share consolidation), and (ii) nine tranches of conditional options with each tranche allowing Dai-ichi to subscribe for or purchase 500,000 JHG shares at a strike price of 2,997.2 pence per share (the terms of such options having been adjusted in accordance with the terms of the Option Agreement to take account of the effect of the share consolidation). The options are exercisable by Dai-ichi for a period measured as the two-year period ending on the 24-month anniversary of the date of the Option Agreement. Dai-ichi paid £19,778,800.00 for the options. The Option Agreement will terminate if, among other things, the Amended Investment and Cooperation Agreement is terminated.
Voting and Support Agreement
On October 3, 2016, Henderson, JCG and Dai-ichi entered into a voting and support agreement (the “Voting and Support Agreement”), pursuant to which, among other things, Dai-ichi agreed to vote the shares of JCG common stock held by it in support of the Merger. The Voting and Support Agreement terminated on its terms at the effective time of the Merger
As of February 22, 2018, Dai-ichi beneficially owned, in the aggregate, 31,574,756 shares of JHG common stock, which represented approximately 15.0% of the issued and outstanding shares of JHG common stock on such date.
For a discussion of related party transactions as defined in U.S. GAAP, see Note 19 to the Financial Statements (Item 8) above.
Board of Directors Independence Determination
The Board of Directors has established criteria for determining if a director is independent from management. These criteria follow the director independence criteria contained in the NYSE Listing Standards and are identified in our Corporate Governance Guidelines (“Governance Guidelines”) available on the Company’s website at http://www.janushenderson.com/group under “About Janus Henderson” link, “Board Committees”. In determining the independence of the directors, the Board reviewed and considered all relationships between each director (and any member of his or her immediate family) and the Company. Based on that review and the Company’s independence
criteria, the Board affirmatively determined that all directors are independent directors except for Messrs. Weil and Formica, our Co-CEOs. In addition, all members of the Audit, Compensation, Nominating and Corporate Governance, and Risk Committees are independent.
Item 14. PRINCIPAL ACCOUNTING FEES AND SERVICES
Fees Incurred by Janus Henderson for PricewaterhouseCoopers
The following table shows the fees paid or accrued by the Group and its consolidated funds for audit and other services provided by PricewaterhouseCoopers for fiscal years ending December 31, 2017 and 2016, respectively:
|
|
|
2017 ($) |
|
2016 ($) | |
|
|
|
|
|
|
|
|
|
|
|
|
| |
|
Audit Fees (1) |
|
2,748,000 |
|
976,943 | |
|
Audit-Related Fees (2) |
|
696,200 |
|
54,870 | |
|
Tax Fees (3) |
|
198,800 |
|
— | |
|
All Other Fees (4) |
|
1,642,310 |
|
2,342,173 | |
|
Total |
|
5,285,310 |
|
3,373,986 | |
(1) Audit services consisted of the audit of the Company’s consolidated financial statements included in its Annual Report on Form 10-K, reviews of the condensed consolidated financial statements included in its quarterly reports on Form 10-Q and other audit services that are normally provided in connection with statutory or regulatory filings.
(2) Audit-related fees consisted of financial accounting and SEC reporting consultations, issuance of consent letters, audit of the Company’s benefit plans, and other audit services not required by statute or regulation.
(3) Tax compliance fees consisted of tax return filings for certain foreign jurisdictions, assistance with tax audits and miscellaneous state and federal income tax-related issues.
(4) Primarily consists of services provided in relation to the Merger
The Audit Committee has determined that the provision of the services described above is compatible with maintaining the independence of PricewaterhouseCoopers.
Audit Committee Approval Policies and Procedures
All services performed by PricewaterhouseCoopers were approved in accordance with the approval policy and procedures adopted by the Audit Committee. This policy describes the permitted audit, audit-related, tax, and other services (collectively, the “Disclosure Categories”) that our independent auditor may perform. The policy requires that a description of the services expected to be performed by our independent auditor in each of the Disclosure Categories be presented to the Audit Committee for approval and cannot commence until such approval has been granted. Normally, approval is provided at regularly scheduled meetings. However, as previously mentioned the authority to grant specific preapproval between meetings, as necessary, has been delegated to the Chairman of the Audit Committee. The Chairman must update the Audit Committee at the next regularly scheduled meeting of any services that were granted specific approval.
In addition, although not required by the rules and regulations of the SEC, the Audit Committee generally approves a narrow range of fees associated with each proposed service. Providing a range of fees for a service incorporates appropriate oversight and control of the independent auditor relationship, while permitting the Company to receive immediate assistance from the independent auditor when time is of the essence.
At each meeting, the Audit Committee reviews the status of services and fees incurred year-to-date against the original approved services and the forecast of remaining services and fees for the fiscal year
PART IV
ITEM 15. EXHIBITS AND FINANCIAL STATEMENT SCHEDULES
(a) List of Documents Filed as Part of This Report
(1) Financial Statements
The financial statements and related notes, together with the report of PricewaterhouseCoopers LLP dated February 27, 2018, appear in Part II, Item 8, Financial Statements and Supplementary Data.
(2) Financial Statement Schedules
No financial statement schedules are required.
(3) List of Exhibits
(b) Exhibits
The Company has incorporated by reference herein certain exhibits as specified below pursuant to Rule 12b-32 under the Exchange Act.
(2) Plan of acquisition, reorganization, arrangement, liquidation or succession
2.1 Agreement and Plan of Merger, dated October 3, 2016, by and among Janus Capital Group Inc., Henderson Group plc and Horizon Orbit Corp, is hereby incorporated by reference from Exhibit 2.1 to JCG’s Current Report on Form 8-K, dated October 3, 2016 (File No. 001-15253)
(3) Articles of Incorporation and Bylaws
3.1.1 Memorandum of Association of Janus Henderson Group plc, is hereby incorporated by reference from Exhibit 3.1 to JHG’s Current Report on Form 8-K, dated May 30, 2017
3.1.2 Articles of Association of Janus Henderson Group plc, is hereby incorporated by reference from Exhibit 3.2 to JHG’s Current Report on Form 8-K, dated May 30, 2017
(4) Instruments Defining the Rights of Security Holders, Including Indentures
4.1 Indenture dated as of November 6, 2001 (the “Base Indenture”), between Janus Capital Group Inc. and The Bank of New York Trust Company N.A. (as successor to The Chase Manhattan Bank), is hereby incorporated by reference from Exhibit 4.1 to JCG’s Current Report on Form 8-K, dated November 6, 2001 (File No. 001-15253)
4.1.1 Third Supplemental Indenture to the Base Indenture, dated as of June 19, 2013, between Janus Capital Group Inc. and The Bank of New York Mellon Trust Company N.A., is hereby incorporated by reference from Exhibit 4.5.4 to JCG’s Annual Report on Form 10-K for the year ended December 31, 2013 (File No. 001-15253)
4.1.2 Fourth Supplemental Indenture to the Base Indenture, dated as of May 30, 2017, among Janus Capital Group Inc., Henderson Group plc and The Bank of New York Mellon Trust Company N.A., is hereby incorporated by reference from Exhibit 4.3 to JHG’s Current Report on Form 8-K, dated May 30, 2017
4.1.3 Officers’ Certificate pursuant to the Base Indenture establishing the terms of the 2018 Convertible Notes, is hereby incorporated by reference from Exhibit 4.10.1 to JCG’s Annual Report on Form 10-K for the year ended December 31, 2013 (File No. 001-15253)
4.1.4 Fifth Supplemental Indenture to the Base Indenture, dated as of May 30, 2017, among Janus Capital Group Inc., Henderson Group plc and The Bank of New York Mellon Trust Company N.A., is hereby incorporated by reference from Exhibit 4.5 to JHG’s Current Report on Form 8-K, dated May 30, 2017
4.1.5 Sixth Supplemental Indenture to the Base Indenture, dated as of February 27, 2018, among Janus Capital Group Inc., Janus Henderson Group plc and The Bank of New York Mellon Trust Company N.A. is attached to this Form-10-K as Exhibit 4.1.5.
4.2 Form of 2018 Convertible Notes, is hereby incorporated by reference from Exhibit 4.10.1 to JCG’s Annual Report on Form 10-K for the year ended December 31, 2013 (File No. 001-15253)
4.3 Form of Global Notes for the 2025 Senior Notes, is hereby incorporated by reference from Exhibit 4.2 to JCG’s Current Report on Form 8-K, dated July 31, 2015 (File No. 001-15253)
(10) Material Contracts
10.1 Facility Agreement, dated 16 February 2017, for US$200,000,000 Revolving Credit Facility for Henderson Group plc arranged by Bank of America Merrill Lynch International Limited as Coordinator, Bookrunner and Mandated Lead Arranger with Bank of America Merrill Lynch International Limited as Facility Agent, is hereby incorporated by reference from Exhibit 1.1 to JHG’s Current Report on Form 8-K, dated May 30, 2017
10.2 Form of Instrument of Indemnity, is hereby incorporated by reference from Exhibit 10.16 to JHG’s Registration Statement on Form F-4, filed on March 20, 2017 (File No. 333-216824)
10.3 Second Amended and Restated 2010 Long-Term Incentive Stock Plan, effective May 30, 2017, is hereby incorporated by reference from Exhibit 4.12 to JHG’s Registration Statement on Form S-8, filed on May 31, 2017 (File No. 333-218365)*
10.4 Second Amended and Restated 2005 Long Term Incentive Stock Plan, effective May 30, 2017, is hereby incorporated by reference from Exhibit 4.11 to JHG’s Registration Statement on Form S-8, filed on May 31, 2017 (File No. 333-218365)*
10.5 Second Amended and Restated 2012 Employment Inducement Award Plan, effective May 30, 2017, is hereby incorporated by reference from Exhibit 4.9 to JHG’s Registration Statement on Form S-8, filed on May 31, 2017 (File No. 333-218365)*
10.6 Second Amended and Restated Employee Stock Purchase Plan, effective May 30, 2017, is hereby incorporated by reference from Exhibit 4.13 to JHG’s Registration Statement on Form S-8, filed on May 31, 2017 (File No. 333-218365)
10.7 Janus Henderson Group plc Fourth Amended and Restated Mutual Fund Share Investment Plan, effective May 30, 2017, is hereby incorporated by reference from Exhibit 10.7 to JHG’s Form 10-Q, filed on August 8, 2017 (File No. 001-38103)*
10.8 Janus Henderson Group plc Amended and Restated 2013 Management Incentive Compensation Plan, effective January 1, 2013, is hereby incorporated by reference from Exhibit 10.8 to JHG’s Form 10-Q, filed on August 8, 2017 (File No. 001-38103)*
10.9 Janus Henderson Group plc Second Amended and Restated Income Deferral Program, effective May 30, 2017, is hereby incorporated by reference from Exhibit 10.9 to JHG’s Form 10-Q, filed on August 8, 2017 (File No. 001-38103)*
10.10 Janus Henderson Group plc Fourth Amended and Restated Director Deferred Fee Plan, effective May 30, 2017, is hereby incorporated by reference from Exhibit 10.10 to JHG’s Form 10-Q, filed on August 8, 2017 (File No. 001-38103)*
10.11 Henderson Group plc Long Term Incentive Plan (LTIP), is hereby incorporated by reference from Exhibit 10.7 to JHG’s Registration Statement on Form F-4 filed on March, 20, 2017 (File No. 333-216824)*
10.12 Henderson Group Sharesave Scheme, is hereby incorporated by reference from Exhibit 10.8 to JHG’s Registration Statement on Form F-4 filed on March, 20, 2017 (File No. 333-216824)*
10.13 The Henderson Executive Shared Ownership Plan (ExSOP), is hereby incorporated by reference from Exhibit 10.9 to JHG’s Registration Statement on Form F-4 filed on March, 20, 2017 (File No. 333-216824)*
10.14 Rules of the Henderson Group plc Deferred Equity Plan (DEP), is hereby incorporated by reference from Exhibit 10.10 to Registrant’s Registration Statement on Form F-4 filed on March, 20, 2017 (File No. 333-216824)*
10.15 Trust Deed of the Henderson Buy-As-You-Earn Plan (BAYE), is hereby incorporated by reference from Exhibit 10.11 to JHG’s Registration Statement on Form F-4 filed on March, 20, 2017 (File No. 333-216824)*
10.16 The Henderson Group plc Company Share Option Plan, is hereby incorporated by reference from Exhibit 10.12 to JHG’s Registration Statement on Form F-4 filed on March, 20, 2017 (File No. 333-216824)*
10.17 Rules of the Henderson Group plc International Buy as Your Earn Plan (International BAYE), is hereby incorporated by reference from Exhibit 10.13 to JHG’s Registration Statement on Form F-4 filed on March, 20, 2017 (File No. 333-216824)*
10.18 Henderson Group plc Restricted Share Plan, is hereby incorporated by reference from Exhibit 10.14 to JHG’s Registration Statement on Form F-4 filed on March, 20, 2017 (File No. 333-216824)*
10.19 Janus Capital Group Inc. 401(k) and Employee Stock Ownership Plan, as amended and restated, effective January 1, 2014, is hereby incorporated by reference from Exhibit 10.8 to JCG’s Annual Report on Form 10-K for the year ended December 31, 2014 (File No. 001-15253)
10.19.1 Amendment No. 1 to Janus 401(k) Plan, effective January 1, 2014, is hereby incorporated by reference from Exhibit 10.9 to JCG’s Annual Report on Form 10-K for the year ended December 31, 2014 (File No. 001-15253)
10.19.2 Amendment No. 2 to Janus 401(k) Plan, effective January 1, 2015, is hereby incorporated by reference from Exhibit 10.9.2 to JCG’s Annual Report on Form 10-K for the year ended December 31, 2015 (File No. 001-15253)
10.19.3 Amendment No. 3 to Janus 401(k) Plan, effective January 1, 2016, is hereby incorporated by reference from Exhibit 10.9.3 to JCG’s Annual Report on Form 10-K for the year ended December 31, 2015 (File No. 001-15253)
10.19.4 Amendment No. 4 to Janus 401(k) Plan, effective September 1 2016, is hereby incorporated by reference from Exhibit 10.9.4 to JCG’s Annual Report on Form 10-K for the year ended December 31, 2016 (File No. 001-15253)
10.19.5 Amendment No. 5 to Janus 401(k) Plan, effective September 1, 2016, is hereby incorporated by reference from Exhibit 10.9.5 to JCG’s Annual Report on Form 10-K for the year ended December 31, 2016 (File No. 001-15253)
10.19.6 Amendment No. 6 to Janus 401(k) Plan, effective August 31, 2016, is hereby incorporated by reference from Exhibit 10.9.6 to JCG’s Annual Report on Form 10-K for the year ended December 31, 2016 (File No. 001-15253)
10.19.7 Amendment No. 7 to Janus 401(k) Plan, effective July 1, 2017, is attached to this Annual Report on Form 10-K as Exhibit 10.19.7
10.19.8 Amendment No. 8 to Janus 401(k) Plan, effective December 28, 2017, is attached to this Annual Report on Form 10-K as Exhibit 10.19.8
10.20.1 Form of Long-Term Incentive Acceptance Form with Appendix A (Restricted Stock), effective for awards granted to executive officers in 2009, is hereby incorporated by reference from Exhibit 10.17.2 to JCG’s Annual Report on Form 10-K for the year ended December 31, 2008 (File No. 001-15253)*
10.20.2 Form of Long-Term Incentive Acceptance Form with Appendix A (Restricted Stock), effective for awards granted to executive officers in 2010, is hereby incorporated by reference from Exhibit 10.17.3 to JCG’s Annual Report on Form 10-K for the year ended December 31, 2009 (File No. 001-15253)*
10.20.3 Form of Long-Term Incentive Acceptance Form for Restricted Stock, effective for awards granted to executive officers in 2011, is hereby incorporated by reference from Exhibit 10.17.5 to JCG’s Annual Report on Form 10-K for the year ended December 31, 2010 (File No. 001-15253)*
10.20.4 Form of Long-Term Incentive Acceptance Form for Restricted Stock, effective for awards granted to executive officers in 2012, is hereby incorporated by reference from Exhibit 10.16.4 to JCG’s Annual Report on Form 10-K for the year ended December 31, 2011 (File No. 001-15253)*
10.20.5 Form of Long-Term Incentive Acceptance Form for Restricted Stock, effective for awards granted to executive officers in 2013, is hereby incorporated by reference from Exhibit 10.16.5 to JCG’s Annual Report on Form 10-K for the year ended December 31, 2012 (File No. 001-15253)*
10.20.6 Form of Performance Share Unit Award, effective for awards granted to Richard M. Weil in 2014, is hereby incorporated by reference from Exhibit 10.13.7 to JCG’s Annual Report on Form 10-K for the year ended December 31, 2014 (File No. 001-15253)*
10.20.7 Form of Performance Share Unit Award, effective for awards granted to Richard M. Weil in 2015, is hereby incorporated by reference from Exhibit 10.13.8 to JCG’s Annual Report on Form 10-K for the year ended December 31, 2015 (File No. 001-15253)*
10.20.8 Form of Performance Share Unit Award, effective for awards granted to the Company’s Chief Executive Officer Richard M. Weil in 2016 , is hereby incorporated by reference from Exhibit 10.13.9 to JCG’s Annual Report on Form 10-K for the year ended December 31, 2016 (File No. 001-15253)*
10.21 Offer letter for Richard M. Weil dated January 6, 2010, is hereby incorporated by reference from Exhibit 10.30 to JCG’s Annual Report on Form 10-K for the year ended December 31, 2009 (File No. 001-15253)*
10.22 Change in Control Agreement by and between Janus Capital Group Inc. and Richard M. Weil, dated February 1, 2010, is hereby incorporated by reference from Exhibit 10.2 to JCG’s Form 8-K, dated February 4, 2010 (File No. 001-15253)*
10.23 Service Agreement between [Henderson Group plc] and Andrew Formica, effective from November 5, 2008, is hereby incorporated by reference from Exhibit 10.4 to JHG’s Registration Statement on Form F-4, filed on March 20, 2017 (File No. 333-216824)*
10.24 Summary of Janus Henderson Group plc Non-Executive Director Compensation Program effective May 30, 2017, is attached to this Form 10-K as Exhibit 10.24
10.25 Janus Henderson Group Global Remuneration Policy Statement, is attached to this Annual Report on Form 10-K as Exhibit 10.25*
10.26 Amended and Restated Investment and Strategic Cooperation Agreement, dated October 3, 2016, by and among Henderson Group plc, Janus Capital Group Inc. and Dai-ichi Life Holdings, Inc., is hereby incorporated by reference from Exhibit 10.1 to JHG’s Registration Statement on Form F-4, filed on March 20, 2017 (File No. 333-216824)
10.27 Voting and Support Agreement, dated October 3, 2016, by and among Henderson Group plc, Janus Capital Group Inc. and Dai-ichi Life Holdings, Inc., is hereby incorporated by reference from Exhibit 10.2 to JHG’s Registration Statement on Form F-4, filed on March 20, 2017 (File No. 333-216824)
10.28 Option Agreement, dated as of October 3, 2016, by and between Henderson Group plc and Dai-ichi Life Holdings, Inc., is hereby incorporated by reference from Exhibit 10.3 to JHG’s Registration Statement on Form F-4, filed on March 20, 2017 (File No. 333-216824)
10.29 Service Agreement between Henderson Group plc and Roger Thompson, effective from June 26, 2013, is hereby incorporated by reference from Exhibit 10.5 to JHG’s Registration Statement on Form F-4, filed on March 20, 2017 (File No. 333-216824)*
10.30 Service Agreement between Henderson Group plc and Philip Wagstaff, effective from February 22, 2017, is hereby incorporated by reference from Exhibit 10.6 to JHG’s Registration Statement on Form F-4, filed on March 20, 2017 (File No. 333-216824)*
10.31 Change in Control Agreement by and between Enrique Chang and Janus Management Holdings Corporation, dated October 24, 2016, is hereby incorporated by reference from Exhibit 10.22 to JCG’s Form 10-K/A, dated March 10, 2017 (File No. 001-15253)*
10.32 Long-Term Incentive Award Acceptance Form with Appendix A (Terms of Restricted Stock Unit Award), Appendix B (Additional Terms of Restricted Stock Unit Award) and Appendix C (Forfeiture and Clawback) effective August 11, 2017 is attached to this Annual Report on Form 10-K as Exhibit 10.32*
*Compensatory plan or agreement.
(12) Statements Re: Computation of Ratios
12.1 The Computation of Ratio of Earnings to Fixed Charges prepared pursuant to Item 601(b)(12) of Regulation S-K is attached to this Annual Report on Form 10-K as Exhibit 12.1
(21) Subsidiaries of the Company
21.1 The List of the Subsidiaries of the Company prepared pursuant to Item 601(b)(21) of Regulation S-K is attached to this Annual Report on Form 10-K as Exhibit 21.1
(23) Consents of Experts and Counsel
23.1 The Consent of Independent Registered Public Accounting Firm prepared pursuant to Item 601(b)(23) of Regulation S-K is attached to this Annual Report on Form 10-K as Exhibit 23.1
(24) Power of Attorney
24.1 Power of Attorney (included as a part of the Signature pages to this report).
(31) Rule 13a-14(a)/15d-14(a) Certifications
31.1 Certification of Richard M. Weil, Co-Chief Executive Officer of Registrant
31.2 Certification of Andrew J. Formica, Co-Chief Executive Officer of Registrant
31.3 Certification of Roger Thompson, Executive Vice President and Chief Financial Officer of Registrant
(32) Section 1350 Certificates
32.1 Certification of Richard M. Weil, Co-Chief Executive Officer of Registrant, pursuant to 18 U.S.C. Section 1350, as adopted pursuant to Section 906 of the Sarbanes-Oxley Act of 2002
32.2 Certification of Andrew J. Formica, Co-Chief Executive Officer of Registrant, pursuant to 18 U.S.C. Section 1350, as adopted pursuant to Section 906 of the Sarbanes Oxley Act of 2002
32.3 Certification of Roger Thompson, Executive Vice President and Chief Financial Officer of Registrant, pursuant to 18 U.S.C. Section 1350, as adopted pursuant to Section 906 of the Sarbanes Oxley Act of 2002
(100) XBRL Exhibits
101.INS XBRL Insurance Document
101.SCH XBRL Taxonomy Extension Schema Document
101.CAL XBRL Taxonomy Extension Calculation Linkbase Document
101.DEF XBRL Taxonomy Extension Definition Linkbase Document
101.LAB XBRL Taxonomy Extension Label Linkbase Document
101.PRE XBRL Taxonomy Extension Presentation Linkbase Document
(c) Exhibits
JANUS HENDERSON GROUP
2017 FORM 10-K ANNUAL REPORT
INDEX TO EXHIBITS
|
|
|
|
|
Regulation S-K | |
|
|
|
|
|
Item 601(b) | |
|
Exhibit No. |
|
Document |
|
Exhibit No. | |
|
4. |
1.5 |
|
Sixth Supplemental Indenture to the Base Indenture, dated as of February 27, 2018, among Janus Capital Group Inc., Janus Henderson Group plc and The Bank of New York Mellon Trust Company N.A. is attached to this Form-10-K as Exhibit 4.1.5. |
|
4 |
|
|
|
|
|
|
|
|
10. |
19.7 |
|
Amendment No. 7 to Janus 401(k) Plan, effective July 1, 2017, is attached to this Annual Report on Form 10-K as Exhibit 10.19.7 |
|
10 |
|
|
|
|
|
|
|
|
10. |
19.8 |
|
Amendment No. 8 to Janus 401(k) Plan, effective December 28, 2017, is attached to this Annual Report on Form 10-K as Exhibit 10.19.8 |
|
10 |
|
|
|
|
|
|
|
|
10. |
24 |
|
Summary of Janus Henderson Group plc Non-Executive Director Compensation Program effective May 30, 2017 |
|
10 |
|
|
|
|
|
|
|
|
10. |
25 |
|
Janus Henderson Group Global Remuneration Policy Statement |
|
10 |
|
|
|
|
|
|
|
|
10. |
32 |
|
Long-Term Incentive Award Acceptance Form with Appendix A (Terms of Restricted Stock Unit Award), Appendix B (Additional Terms of Restricted Stock Unit Award) and Appendix C (Forfeiture and Clawback) effective August 11, 2017 is attached to this Annual Report on Form 10-K as Exhibit 10.32* |
|
10 |
|
|
|
|
|
|
|
|
12. |
1 |
|
The Computation of Ratio of Earnings to Fixed Charges prepared pursuant to Item 601(b)(12) of Regulation S-K |
|
12 |
|
|
|
|
|
|
|
|
21. |
1 |
|
The List of the Subsidiaries of the Company prepared pursuant to Item 601(b)(21) of Regulation S-K |
|
21 |
|
|
|
|
|
|
|
|
23. |
1 |
|
The Consent of Independent Registered Public Accounting Firm — PricewaterhouseCoopers LLP |
|
23 |
|
|
|
|
|
|
|
|
24. |
1 |
|
Power of Attorney (included as a part of the Signature pages to this report). |
|
24 |
|
|
|
|
|
|
|
|
31. |
1 |
|
Certification of Richard M. Weil, Co-Chief Executive Officer of Registrant |
|
31 |
|
|
|
|
|
|
|
|
31. |
2 |
|
Certification of Andrew J. Formica, Co-Chief Executive Officer of Registrant |
|
31 |
|
|
|
|
|
|
|
|
31. |
3 |
|
Certification of Roger Thompson, Chief Financial Officer of Registrant |
|
31 |
|
|
|
|
|
|
|
|
32. |
1 |
|
Certification of Richard M. Weil, Co-Chief Executive Officer of Registrant, pursuant to 18 U.S.C. Section 1350, as adopted pursuant to Section 906 of the Sarbanes-Oxley Act of 2002 |
|
32 |
|
|
|
|
|
|
|
|
32. |
2 |
|
Certification of Andrew J. Formica, Co-Chief Executive Officer of Registrant, pursuant to 18 U.S.C. Section 1350, as adopted pursuant to Section 906 of the Sarbanes-Oxley Act of 2002 |
|
32 |
|
|
|
|
|
Regulation S-K | |
|
|
|
|
|
Item 601(b) | |
|
Exhibit No. |
|
Document |
|
Exhibit No. | |
|
32. |
3 |
|
Certification of Roger Thompson, Executive Vice President and Chief Financial Officer of Registrant, pursuant to 18 U.S.C. Section 1350, as adopted pursuant to Section 906 of the Sarbanes-Oxley Act of 2002 |
|
32 |
|
|
|
|
|
|
|
|
101. |
INS |
|
XBRL Insurance Document |
|
101 |
|
|
|
|
|
|
|
|
101. |
SCH |
|
XBRL Taxonomy Extension Schema Document |
|
101 |
|
|
|
|
|
|
|
|
101. |
CAL |
|
XBRL Taxonomy Extension Calculation Linkbase Document |
|
101 |
|
|
|
|
|
|
|
|
101. |
DEF |
|
XBRL Taxonomy Extension Definition Linkbase Document |
|
101 |
|
|
|
|
|
|
|
|
101. |
LAB |
|
XBRL Taxonomy Extension Label Linkbase Document |
|
101 |
|
|
|
|
|
|
|
|
101. |
PRE |
|
XBRL Taxonomy Extension Presentation Linkbase Document |
|
101 |
|
|
|
|
|
| |
|
ITEM 16. FORM 10-K SUMMARY |
|
| |||
|
|
|
|
|
| |
|
None. |
|
|
|
| |
Signatures
Pursuant to the requirements of Section 13 or 15(d) of the Securities Exchange Act of 1934, the Registrant has duly caused this report to be signed on its behalf by the undersigned, thereunto duly authorized.
|
|
Janus Henderson Group plc | |
|
|
| |
|
|
| |
|
|
By: |
/s/ RICHARD WEIL |
|
|
|
Richard Weil |
|
|
|
Co-Chief Executive Officer |
February 27, 2018
Known all persons by these presents, that each person whose signatures appear below, hereby constitute and appoint Andrew Formica, Richard Weil and Jacqui Irvine, and each of them individually (with full power to act alone), as their true and lawful attorneys-in-fact and agents to sign and execute and file with the Securities Exchange Commission on behalf of the undersigned, any amendments to Janus Henderson Group plc’s Annual Report on Form 10-K for the year ended December 31, 2017, and any instrument or document filed as part of, as an exhibit to, or in connection with any amendment, and each of the undersigned does hereby ratify and confirm as his or her own act and deed all that said attorneys shall lawfully do or cause to be done by virtue thereof.
Pursuant to the requirements of the Securities Exchange Act of 1934, this report has been signed below by the following persons on behalf of the Registrant and in the capacities indicated on February 27, 2018.
|
Signature/Name |
|
Title |
|
|
|
|
|
|
|
/s/ RICHARD GILLINGWATER |
|
Chairman of the Board |
|
|
Richard Gillingwater |
|
|
|
|
|
|
|
|
|
/s/ GLENN SCHAFER |
|
Deputy Chairman of the Board |
|
|
Glenn Schafer |
|
|
|
|
|
|
|
|
|
/s/ RICHARD WEIL |
|
Director and Co-Chief Executive Officer |
|
|
Richard Weil |
|
(Co-Principal Executive Officer) |
|
|
|
|
|
|
|
/s/ ANDREW FORMICA |
|
Director and Co-Chief Executive Officer |
|
|
Andrew Formica |
|
(Co-Principal Executive Officer) |
|
|
|
|
|
|
|
/s/ ROGER THOMPSON |
|
Executive Vice President and Chief Financial Officer |
|
|
Roger Thompson |
|
(Principal Financial Officer) |
|
|
Signature/Name |
|
Title |
|
|
|
|
|
|
|
/s/ BRENNAN HUGHES |
|
Senior Vice President, Chief Accounting Officer and Treasurer |
|
|
Brennan Hughes |
|
(Principal Accounting Officer) |
|
|
|
|
|
|
|
/s/ SARAH ARKLE |
|
Director |
|
|
Sarah Arkle |
|
|
|
|
|
|
|
|
|
/s/ KALPANA DESAI |
|
Director |
|
|
Kalpana Desai |
|
|
|
|
|
|
|
|
|
/s/ JEFFREY DIERMEIER |
|
Director |
|
|
Jeffrey Diermeier |
|
|
|
|
|
|
|
|
|
/s/ KEVIN DOLAN |
|
Director |
|
|
Kevin Dolan |
|
|
|
|
|
|
|
|
|
/s/ EUGENE FLOOD JR |
|
Director |
|
|
Eugene Flood Jr |
|
|
|
|
|
|
|
|
|
/s/ LAWRENCE KOCHARD |
|
Director |
|
|
Lawrence Kochard |
|
|
|
|
|
|
|
|
|
/s/ ANGELA SEYMOUR-JACKSON |
|
Director |
|
|
Angela Seymour-Jackson |
|
|
|
|
|
|
|
|
|
/s/ TATSUSABURO YAMAMOTO |
|
Director |
|
|
Tatsusaburo Yamamoto |
|
|
|
Exhibit 10.25
Global Remuneration Policy Statement (GRPS)
Summary of Janus Henderson Group Plc Remuneration Policy
Janus Henderson (‘the Group’) operates a single Remuneration Policy which applies in its entirety to all Group entities and employees including the executive and international populations, unless local laws or regulations set more rigorous requirements for any aspect, in which case the higher standards apply.
The Group considers that a successful remuneration policy should be sufficiently flexible to take account of future changes in the Group’s business environment and remuneration practice and therefore the Group’s policy is subject to change from time to time. The policy is reviewed on an annual basis to ensure that it remains aligned with evolving business strategy and changes in the markets in which we operate, is consistent with best practice, promotes sound and effective risk management and is compliant with applicable regulations.
The policy is implemented through the following components of remuneration and contractual arrangements, each having a specific role in achieving the Group’s remuneration objectives:
· Basic Salary
· Benefits
· Short-term incentives including annual bonuses
· Long-term incentives
· Employee share plans
Reward Philosophy, Strategy & Policy
Reward Policy
The Group has an established remuneration framework which, within the boundaries set by the Board’s Risk Appetite Statement, is designed to be market competitive, motivate employees to improve individual and corporate performance, retain key employees and align employee actions with the interests of clients and shareholders. This framework and associated policy is overseen by the Compensation Committee (‘the Committee’), taking into account the guidelines set down by the Financial Conduct Authority (FCA), the UK regulatory body, on executive pay and remuneration practices, together with other remuneration legislation or regulations applicable to other territories in which the Group operates.
Reward Philosophy & Strategy
Our remuneration philosophy and strategy is designed to:
· provide total reward opportunities which, subject to performance, are competitive within our defined markets both in terms of quantum and structure, and reflect individual contribution to business performance and sound risk management;
· attract and retain individuals critical to the long term success of the Group;
· maintain an appropriate balance between both fixed and variable pay, and short and long term elements of remuneration, in order to minimise the prudently manage risk taking and to align with the Group’s strategic objectives and time horizons;
· reinforce a strong performance culture through rewards which are differentiated based on Group, division, team and individual performance;
· align management interests with those of the Group’s shareholders and clients by delivering a significant portion of annual remuneration in shares of Janus Henderson stock and units of Janus Henderson funds;
· encourage wider employee share ownership to reinforce the alignment between the interests of employees, shareholders and clients and enable employees to share in the wealth creation of the business;
· ensure that reward related processes are compliant with industry regulations and legislation, consistent with market practice and include effective risk management controls.
![]()
Pay Mix
The Committee takes into account, when determining remuneration awards, the need to ensure an appropriate ratio between fixed and variable components to ensure that Janus Henderson can operate a fully flexible incentive policy. This includes the payment of no bonuses should performance of the firm and/or the individual require this. Within this policy, base salary levels are designed to be both market competitive and sufficient so that employees do not become totally dependent on their variable compensation, so we are not bound to pay a bonus if it is inappropriate to do so.
The Group does not operate specific ratios (maxima or minima) but is guided by external pay comparisons, managing fixed and variable compensation in line with market and by reference to individual performance.
Annual incentive arrangements
For the vast majority of employees the Group operates short term incentive plans, to reward performance and align participant and shareholder interests, which are discretionary in nature, but are typically underpinned by funding frameworks which:
· guide management and the Committee in terms of funding quantum;
· provide directional guidance to employees in terms of the required performance metrics and standards; and
· provide the relevant performance benchmarks to further the alignment of performance (as measured against these metrics and standards) with the individual’s variable reward.
All variable incentive funding decisions are determined by the Committee, (and are reviewed by the Board of HGHAML as governing body for the Group’s regulated businesses), taking into account:
· recommendations of Management;
· an independent risk assessment provided by the Chief Risk Officer (CRO) which takes into account a range of risk and compliance related factors including items reported to the Board Risk Committee (BRC) in the Strategic Risk Report. Recommendations from this risk assessment may lead to a downward adjustment on variable incentive funding;
· progress against business financial and strategic goals;
· other financial and non-financial factors which the Committee believe are relevant in assessing the underlying financial and overall performance of the Group; and
· the impact of the proposed funding decisions against an overall compensation ratio framework.
The funding frameworks are largely discretionary in nature under which annual incentive awards are delivered to participating staff. The frameworks take the form of indicative, but non-contractual, funding formulae based on relevant financial and non-financial metrics which are typically set as part of annual business planning and budgeting cycles. The primary short term incentive arrangement is called the Partnership Profit Pool (covering 96% of staff within the Group) and is constructed as a ‘profit share’ arrangement with the pool being initially set as a (discretionary) share of Pre-Incentive Operating Income (PIOI) between shareholders and employees. Further general features of the funding frameworks are as follows:
· the quantum derived under the relevant funding framework may be adjusted at the discretion of Management/the Committee;
· the co-CEOs, CRO and co-Heads of HR review and sign-off both proposed allocations to divisions within Janus Henderson and, on an exceptions basis, allocations to individuals;
· a separate sub-committee (the ‘Code Staff Compensation Committee’ — ‘CSCC’) also reviews, on behalf of the Committee, all remuneration proposals relating to individuals classified as Code and/or Identified Staff under the FCA, AIFMD and UCITS Remuneration Codes. The CSCC, which comprises of representatives from the Investment Management, Assurance and Human Resources divisions, provides a regular report to the Committee in relation to any remuneration recommendations for this cadre for approval by the Committee;
· the CSCC also reviews, on behalf of the Janus Henderson Executive Committee, all remuneration proposals from the context of operational errors and/or breaches to internal risk and control polices. The CSCC, reviews a range of data indicative of errors and breaches, highlighting relevant case details to management
for consideration during the annual performance rating and remuneration allocation processes and may recommend relevant adjustments to both performance rating and/or incentive awards to reflect the nature of issues identified from a materiality (both quantitative and qualitative) and culpability perspective;
· allocations to individuals are made on a discretionary basis by relevant line managers and business heads, by reference to overall individual performance as determined in line with our performance management processes, and are subject to internal consistency check processes.
· outcomes under the plans (both at the individual level and in aggregate) are subject to risk adjustment processes (as outlined below).
· all awards are subject to the Group’s standard deferral arrangements (see below), with the non-deferred portion being delivered in cash and, where appropriate, restricted units, in the first quarter after the end of the relevant Performance Year.
The Group operates a small number of legacy contractual and formulaic arrangements which predominantly relate back to contractual arrangements carried over following historic acquisitions. These arrangements are subject to risk adjustment processes and standard Group deferral mechanisms (and where appropriate, deferral arrangements mandated by relevant regulation).
A market standard sales commission arrangement is operated for distribution staff in the US.
Performance fee incentives
The Group receives performance fees in relation to certain funds depending on outperformance of the fund against pre-determined benchmarks and shares these performance fees, on a discretionary basis, with fund managers of the relevant funds — such awards may be made in addition to allocations under the annual incentive frameworks set out above. Performance Fee bonus awards form part of the aggregate funding of the Investment Management Profit Pool and direct allocation of these bonuses will be phased out by the end of 2019 with incentive awards for performance fee generation being included within the aggregate discretionary bonus funding.
Performance Fee incentives are subject to the same risk adjustment, review and deferral principles that apply to the discretionary funding frameworks. They are allocated on a discretionary, individual by individual basis, by the relevant lead fund manager, to individuals working on the relevant fund or to individuals who provide additional material input or support to the operation of the fund, with proposed allocations being subject to approval by senior management and control function heads.
Co-CEO framework
A framework for the co-CEOs utilizes a scorecard which the Committee believes incorporates the best components from the legacy Janus and Henderson compensation programs and is designed to align the co-CEOs’ compensation with Company performance, which the Committee believes drives long-term value for shareholders and clients. The scorecard utilized following the Merger in May 2017 is based upon the same factors used by the Company to evaluate its business. The performance measures and weighting used are as follows:
· 30% - Deliver investment excellence for clients (measured based on 3-year investment performance relative to benchmark);
· 40% - Drive financial results for shareholders (measured based on revenue growth, total net flows, and growth in net income before taxes); and
· 30% - Drive strategic results for long-term success for clients and shareholders (measured based on execution of strategic initiatives such as; leading integration efforts, delivering exceptional client service, and achieving operational excellence).
Under the agreed compensation framework, the variable incentive compensation for the co-CEOs is determined by multiplying a target incentive award by a multiplier (between 0% and 200%). This multiplier is determined by reference to the outcome of a scorecard of pre-determined measures as described above.
To establish the target incentive award, the Committee considered the merged Company’s revenue and total assets under management (AUM) compared to the revenue and total AUM of a select peer group of companies to ensure that the target incentive opportunity reflects competitive pay practices of other asset management firms in the principal markets in which we do business and compete for executive talent.
Other Long term and employee Share Ownership Awards
The Group operates other incentive remuneration plans designed to incentivise long term performance and behaviours and align employees with shareholders via exposure to Group shares including:
Restricted Share Plan - used for 2 separate purposes:
· a mechanism to provide Buyout Awards for new hires to compensate them for the forfeiture of deferred awards from their previous employer arising from commencement of their employment with the Group;
· incentive awards to existing staff in certain circumstances, with such awards vesting subject to achievement of material performance conditions.
Long Term Incentive - A plan designed to encourage acquisition of/increase in equity ownership in the Group,
(LTI) thereby strengthening commitment, effort and reward for excellence in individual performance; attraction and retention of new hires, with a view to optimizing Group profitability and growth. Awards are time vested (typically 2-4 years) and are not subject to performance conditions
The Group also operates voluntary all employee shares plans including Buy As You Earn (BAYE) and Sharesave (SAYE) in which staff can participate within approved contribution guidelines to encourage employees to become shareholders in the Group.
Deferral arrangements
All staff at Janus Henderson are subject to mandatory deferral arrangements which apply to all variable incentive remuneration (excluding the sales commission arrangement for distribution staff in the US), in excess of specified thresholds (or as appropriate as mandated by regulation e.g. AIFMD/UCITS). Deferred awards are delivered under the Deferred Equity Plan (DEP), Long Term Incentive (LTI) or Mutual Fund Award (MFA) plan in the form of Group shares or interests in Janus Henderson funds, vesting in three equal tranches over a 3 year period. Forfeiture provisions apply to employees who cease employment with the Group, other than in prescribed circumstances, during the vesting period. Furthermore, malus and/or clawback provisions apply under the majority of these plans at the discretion of the Committee under which the Committee have the power to vary or lapse individual unvested awards, or clawback vested awards, in specified circumstances.
Where required by regulation, a proportion of both deferred and non-deferred incentive remuneration is delivered, where practicable, in relevant shares/units of underlying funds.
The Deferral Policy is reviewed annually by the Committee to ensure that it remains aligned with:
· Janus Henderson’s business strategy, associated time horizons and risk appetite;
· competitive practice in the sectors and jurisdictions in which the Group operates;
· emerging regulatory practice.
Risk adjustment
The Risk and Compliance teams provide regulatory compliance and risk management advice/input into the design of the Group incentive plans, the Group Remuneration Policy, the determination of short-term incentives (including, annual incentive pools and allocations, performance fee incentive allocations) and, on an exceptions basis, the annual appraisal process and the vesting of deferred and long term incentive plans.
Remuneration decisions are made in the context of the Group’s Risk Appetite Statement which sets out the risk envelope within which activities may be undertaken (a separate RAS is also maintained by the Board of HGHAML). Control function input includes:
· regular review of Remuneration Policy to ensure that it is aligned with the Risk Appetite Statement, complies with the spirit of relevant regulatory requirements and has sufficient references to the Group’s ability and intention to apply risk adjustments as appropriate;
· independent advice and risk/compliance metrics to the Board Risk Committee (BRC) which in turn provides assurance to the Committee in relation to the appropriateness of plan design and metrics from a risk management perspective;
· capture of all risk related incidents and Compliance breaches and provision of relevant data to inform relevant oversight and governing bodies, (including the Executive Committee, the BRC, the Investment Performance and Risk Committee, the Operational Risk and Performance Committee, the Errors and Breaches Forum and the Compensation Committee);
· production of an annual report to the BRC/Remuneration Committee providing an overall assessment of risk management relative to the Risk Appetite Statement(s), and making recommendations in relation to the impact on proposed incentive pool funding and LTIP vesting;
· the approval of bonus funding at the divisional level, taking into account the incidence, patterns, size of risk events during the relevant Performance Year and the attitude and culture of risk management;
· a specific annual review is also undertaken to consider proposed incentive allocations at the individual level against the inventory of risk, compliance and disciplinary related events with risk adjustments being applied where appropriate. Similar processes also apply to performance fee incentives which may be awarded throughout the year.
Identification of Code/Identified Staff
A rigorous 6 monthly review is conducted by the CSCC, to ensure that the list of Code/Identified Staff remains current. The Code/Identified staff list is approved annually by the Committee.
The following categories of employee/Executive have been identified as Code/Identified Staff:
|
|
|
FCA |
|
AIFMD |
|
UCITS |
|
Executive and Non-Executive Directors of JHG |
|
Yes |
|
|
|
|
|
Executive and Non-Executive Directors of HGHAML |
|
Yes |
|
Yes |
|
Yes |
|
Other members of the Janus Henderson Executive Committee |
|
Yes |
|
Yes |
|
Yes |
|
Significant Influence Functions (SIFs), including Heads of APAC and North America, and the Heads of Risk, Compliance, Internal Audit, Information Technology, Human Resources, Tax and Group Finance |
|
Yes |
|
Yes |
|
Yes |
|
Control Functions – senior staff responsible for risk management, compliance and internal audit for the AIFMs/UCITS. |
|
|
|
Yes |
|
Yes |
|
Other individuals as satisfying the qualitative and quantitative criteria for the identification of Material Risk Takers (MRTs) asset out in the EBA Regulatory Technical Standard (RTS) |
|
Yes |
|
|
|
|
|
Members of other key governing bodies and committees, including: |
|
|
|
|
|
|
|
· Boards of the AIFMs; |
|
|
|
Yes |
|
Yes |
|
· Boards of UCITs |
|
|
|
|
|
Yes |
|
· Global Strategic Product Committee; |
|
|
|
Yes |
|
Yes |
|
· Investment Performance and Risk Committee; |
|
|
|
Yes |
|
Yes |
|
· Investment Strategy Group |
|
|
|
Yes |
|
Yes |
|
Staff responsible for heading portfolio management, administration and marketing for the AIFMs/UCITs |
|
|
|
Yes |
|
Yes |
|
Lead Fund Managers and other investment management professionals who are deemed to have a material impact on the risk profile of the AIF or UCITS funds that they manage |
|
|
|
Yes |
|
Yes |
|
Staff in the same remuneration bracket as risk takers and senior management whose activities have a material impact on the risk profile of an AIF or UCITS fund |
|
Yes |
|
Yes |
|
Yes |
Other key Remuneration Code principles
Risk management and risk tolerance
The following features of remuneration policy/practices promote sound and effective risk management and discourage risk-taking in excess of the firm’s levels of tolerated risk:
· the CRO and BRC maintain and regularly update the Risk Appetite Statement(s), monitoring incidents, performance and behaviours in line with the RAS, making recommendations to the Committee in respect of any issues or incidents that require adjustment at the aggregate funding or individual allocation level;
· the Remuneration Policy is reviewed by the CRO to ensure it complies with regulatory and other requirements, particularly with regard to sound risk management and the ability to apply risk adjustments;
· Investment Performance and fund construction is monitored by the independent Investment Risk team to ensure that the latter is aligned, at all times, with investors’ reasonable expectations based on the investment objectives for the relevant fund and any other material (including marketing material) presented to investors;
· the Operational Risk team monitor any operational risk related losses;
· the CRO is also involved in the review and design of remuneration plans;
· in the case of fund managers, deferrals of performance fee and other incentive awards are typically made into the funds they manage, thereby aligning their interests explicitly with those of the investors in the funds.
Supporting business strategy, objectives, values and long-term interests
The following factors are relevant in ensuring remuneration policy is aligned with business strategy, objectives, values, sound risk management and long-term interests:
· base salary is targeted at market competitive rates and is set at a quantum which is deemed sufficient to minimise reliance on variable incentive award, thereby mitigating excessive risk taking;
· the Group operates discretionary short term incentive arrangements under which:
· allocations at the individual level are aligned with overall individual performance assessments;
· aggregate allocations also reflect the performance of the Group and the divisions and teams in which an individual works;
· the individual’s own performance is assessed both against achievement of personal objectives (the ‘what’) and performance against the Group’s core values (the ‘how’);
· the short term incentive funding arrangements are largely driven by sharing profits between shareholders and employees, creating direct alignment with the success and profitability of the Group;
· Senior Management/the Committee exercise their discretion in determining incentive funding levels, by reference to their view of the underlying performance of the business.
· the Group shares performance fees (on a discretionary basis) with its fund managers, providing a direct link with the performance of the funds they manage and the returns that investors receive, thereby increasing the alignment between employees and investors;
· The Group operates material deferral mechanisms (up to 60% of variable remuneration) under which deferred awards are primarily delivered in the form of Group shares and or interests in Janus Henderson funds/products, reinforcing the alignment between the employee, the Group and shareholder/investor interests;
· in addition to deferral arrangements, the Group encourages share ownership throughout the employee base via all employee share ownership mechanisms (e.g. BAYE and SAYE);
· all material variable remuneration plans contain malus and clawback provisions to ensure that awards can be adjusted or reversed over the long term to reflect detrimental issues or circumstances that arise beyond the date of award or vesting;
· Mandatory shareholding requirements apply under which Executive Directors (Non-Executive Directors) are required to acquire and hold shares with a value at least equal to 300% of base salary (for NEDs, minimum of shares with a face value at date of acquisition of $300k).
Conflicts of interest
Oversight of reward, management of conflicts of interest and the link between risk and reward is achieved through a combination of:
· effective remuneration design;
· the oversight of the Remuneration Committee and the ExCo in ensuring appropriate and, where necessary, independent oversight of both remuneration policy and outcomes.
The Group also operates an Ethics and Conflicts Committee, chaired by the co-CEO to identify conflicts of interest wherever they arise within the business, and to ensure that such risks are removed, or mitigated by management by virtue of complementary internal processes and supervisory activities. The Ethics and Conflicts Committee reviews reward mechanisms and issues on at least an annual basis.
Governance
Our governance processes ensure robust oversight of reward, effective management of any potential conflict of interests and reflect the need to link remuneration decisions with our risk appetite. The governance of Janus Henderson’s remuneration is managed through various bodies:
· Human Resources and the ExCo oversee remuneration policies and procedures approved by the Committee;
· the BRC looks at the risk appetite, tolerance and risk management for Janus Henderson and feeds its views into the remuneration decision making process, including the submission of a risk report to the Committee for consideration;
· Human Resources are responsible for supporting and sending any information to the Committee, which is the highest level decision making body for remuneration.
The Committee is responsible for ensuring they take into consideration financial and non-financial criteria, risk and compliance reports, and any other relevant information in making decisions around remuneration, and sets an overall framework within which overall compensation costs are managed.
In addition, the Committee has significant powers to vary or lapse individual unvested awards in cases of poor risk management, where results have been misstated, where there has been a material downturn in financial performance, or where there has been serious misconduct.
Remuneration and capital
The firm’s variable remuneration is directly linked to profits generated in the current year, reflecting the firm’s ability to pay. Variable funding arrangements are largely discretionary such that management have the ability to
reduce levels appropriately should a downside scenario occur. Schemes will only deliver value in the context of the firm generating sufficient profits thereby strengthening its capital base.
Funding metrics for the incentive schemes are proposed by Management and reviewed approved by the Committee on an annual basis. The key financial metrics and primary and individual performance metrics taken into account are:
Key Funding metrics:
· Pre-Incentive Operating Income (PIOI)
· 1-, 3-, and 5-year investment performance track record
· gross performance fees
· gross and net sales
and additionally, for the co-CEO frameworks
· revenue growth,
· total net flows,
· growth in net income before taxes, and
· strategic results
Key individual performance metrics:
· Profitability - contribution to overall profitability of the firm;
· Performance – investment performance and risk adjusted returns delivered on behalf of clients;
· Partnership – wider contribution to overall Group performance including alignment with the Group’s purpose and aims and core values (putting clients first, acting like an owner, succeeding as a team).
· Personal contribution against individual objectives in line with the Group’s purpose and aims.
The discretionary nature of the majority of the funding frameworks means that the Committee is able to determine pool funding within agreed compensation frameworks and compensation ratios and has the power to adjust the pools (even to zero) if it determines to reflect its view of the underlying financial position of the firm.
Performance assessment
The Group operates an annual appraisal process on a global basis, under which staff set (jointly with management), and are measured against:
· both financial and non- financial objectives and metrics,
· specific behavioural competencies including compliance, risk management and TCF provisions and confirmation that the appraisee demonstrates an appropriate level of risk and compliance management in accordance with the Group’s policies and procedures.
· achievement of both personal objectives (the ‘what’) and performance against the Group’s core values and guiding principles (the ‘how’).
Line Managers are required to undertake reviews of performance at least annually. In conjunction with Business Unit and Function Heads, the Human Resources department analyse and calibrate performance ratings across the Group to ensure that ratings have been applied consistently and performance has been effectively differentiated. For all staff, discretionary variable remuneration decisions take into account the individual’s performance appraisal rating. This is a ‘guidance based’ approach with no specific rules which constrain individual line manager discretion, although this is reviewed as part of the HR and CE allocation review mechanisms.
The CRO provides oversight and commentary during this process on how risks have been managed and, as appropriate, may make recommendations for adjusting performance ratings.
Anti-avoidance and anti-hedging
All Code/Identified Staff in receipt of performance based awards are required to certify that they will not use personal hedging strategies, or take out insurance contracts, that undermine the risk alignment that is intended by the award of deferred remuneration. This is monitored through Janus Henderson’s rules with regard to personal share dealing/financial contracts and is monitored by Compliance.
Guaranteed bonus and buy out awards
The Group complies with the principles of the FCA Remuneration Code in relation to Guaranteed Bonuses in that guaranteed variable remuneration is only awarded in cases where:
· it is exceptional;
· it occurs in the context of hiring new staff;
· the firm has a sound and strong capital base; and
· it is limited to the first year of service.
Buying out deferred bonuses is permitted subject to, as far as possible, the timing, delivery mechanism (i.e. shares or cash) and amounts paid out being set to match the former arrangements (quantum and vesting schedule) including, where relevant, applicable performance conditions associated with the forfeited awards.
Exhibit 31.1
CERTIFICATION
I, Richard M. Weil, certify that:
1. I have reviewed this annual report on Form 10-K of Janus Henderson Group plc.;
2. Based on my knowledge, this report does not contain any untrue statement of a material fact or omit to state a material fact necessary to make the statements made, in light of the circumstances under which such statements were made, not misleading with respect to the period covered by this report;
3. Based on my knowledge, the financial statements, and other financial information included in this report, fairly present in all material respects the financial condition, results of operations and cash flows of the registrant as of, and for, the periods presented in this report;
4. The registrant’s other certifying officers and I are responsible for establishing and maintaining disclosure controls and procedures (as defined in Exchange Act Rules 13a-15(e) and 15d-15(e)) and have:
a) Designed such disclosure controls and procedures, or caused such disclosure controls and procedures to be designed under our supervision, to ensure that material information relating to the registrant, including its consolidated subsidiaries, is made known to us by others within those entities, particularly during the period in which this report is being prepared;
b) Evaluated the effectiveness of the registrant’s disclosure controls and procedures and presented in this report our conclusions about the effectiveness of the disclosure controls and procedures, as of the end of the period covered by this report based on such evaluation; and
c) Disclosed in this report any change in the registrant’s internal control over financial reporting that occurred during the registrant’s most recent fiscal quarter (the registrant’s fourth fiscal quarter in the case of an annual report) that has materially affected, or is reasonably likely to materially affect, the registrant’s internal control over financial reporting; and
5. The registrant’s other certifying officers and I have disclosed, based on our most recent evaluation of internal control over financial reporting, to the registrant’s auditors and the audit committee of the registrant’s board of directors (or persons performing the equivalent functions):
a) All significant deficiencies and material weaknesses in the design or operation of internal control over financial reporting which are reasonably likely to adversely affect the registrant’s ability to record, process, summarize and report financial information; and
b) Any fraud, whether or not material, that involves management or other employees who have a significant role in the registrant’s internal control over financial reporting.
|
/s/ RICHARD M. WEIL
|
|
|
Richard M. Weil |
|
|
Co-Chief Executive Officer |
|
Date: February 27, 2018
A signed original of this written statement required by Section 302 has been provided to Janus Henderson Group plc and will be retained by Janus Henderson Group plc and furnished to the Securities and Exchange Commission or its staff upon request.
Exhibit 31.2
CERTIFICATION
I, Andrew J. Formica, certify that:
1. I have reviewed this annual report on Form 10-K of Janus Henderson Group plc.;
2. Based on my knowledge, this report does not contain any untrue statement of a material fact or omit to state a material fact necessary to make the statements made, in light of the circumstances under which such statements were made, not misleading with respect to the period covered by this report;
3. Based on my knowledge, the financial statements, and other financial information included in this report, fairly present in all material respects the financial condition, results of operations and cash flows of the registrant as of, and for, the periods presented in this report;
4. The registrant’s other certifying officers and I are responsible for establishing and maintaining disclosure controls and procedures (as defined in Exchange Act Rules 13a-15(e) and 15d-15(e)) and have:
a) Designed such disclosure controls and procedures, or caused such disclosure controls and procedures to be designed under our supervision, to ensure that material information relating to the registrant, including its consolidated subsidiaries, is made known to us by others within those entities, particularly during the period in which this report is being prepared;
b) Evaluated the effectiveness of the registrant’s disclosure controls and procedures and presented in this report our conclusions about the effectiveness of the disclosure controls and procedures, as of the end of the period covered by this report based on such evaluation; and
c) Disclosed in this report any change in the registrant’s internal control over financial reporting that occurred during the registrant’s most recent fiscal quarter (the registrant’s fourth fiscal quarter in the case of an annual report) that has materially affected, or is reasonably likely to materially affect, the registrant’s internal control over financial reporting; and
5. The registrant’s other certifying officers and I have disclosed, based on our most recent evaluation of internal control over financial reporting, to the registrant’s auditors and the audit committee of the registrant’s board of directors (or persons performing the equivalent functions):
a) All significant deficiencies and material weaknesses in the design or operation of internal control over financial reporting which are reasonably likely to adversely affect the registrant’s ability to record, process, summarize and report financial information; and
b) Any fraud, whether or not material, that involves management or other employees who have a significant role in the registrant’s internal control over financial reporting.
|
/s/ ANDREW J. FORMICA
|
|
|
Andrew J. Formica |
|
|
Co-Chief Executive Officer |
|
Date: February 27, 2018
A signed original of this written statement required by Section 302 has been provided to Janus Henderson Group plc and will be retained by Janus Henderson Group plc and furnished to the Securities and Exchange Commission or its staff upon request.
Exhibit 31.3
CERTIFICATION
I, Roger Thompson, certify that:
1. I have reviewed this annual report on Form 10-K of Janus Henderson Group plc.;
2. Based on my knowledge, this report does not contain any untrue statement of a material fact or omit to state a material fact necessary to make the statements made, in light of the circumstances under which such statements were made, not misleading with respect to the period covered by this report;
3. Based on my knowledge, the financial statements, and other financial information included in this report, fairly present in all material respects the financial condition, results of operations and cash flows of the registrant as of, and for, the periods presented in this report;
4. The registrant’s other certifying officers and I are responsible for establishing and maintaining disclosure controls and procedures (as defined in Exchange Act Rules 13a-15(e) and 15d-15(e)) and have:
a) Designed such disclosure controls and procedures, or caused such disclosure controls and procedures to be designed under our supervision, to ensure that material information relating to the registrant, including its consolidated subsidiaries, is made known to us by others within those entities, particularly during the period in which this report is being prepared;
b) Evaluated the effectiveness of the registrant’s disclosure controls and procedures and presented in this report our conclusions about the effectiveness of the disclosure controls and procedures, as of the end of the period covered by this report based on such evaluation; and
c) Disclosed in this report any change in the registrant’s internal control over financial reporting that occurred during the registrant’s most recent fiscal quarter (the registrant’s fourth fiscal quarter in the case of an annual report) that has materially affected, or is reasonably likely to materially affect, the registrant’s internal control over financial reporting; and
5. The registrant’s other certifying officers and I have disclosed, based on our most recent evaluation of internal control over financial reporting, to the registrant’s auditors and the audit committee of the registrant’s board of directors (or persons performing the equivalent functions):
a) All significant deficiencies and material weaknesses in the design or operation of internal control over financial reporting which are reasonably likely to adversely affect the registrant’s ability to record, process, summarize and report financial information; and
b) Any fraud, whether or not material, that involves management or other employees who have a significant role in the registrant’s internal control over financial reporting.
|
/s/ ROGER THOMPSON
|
|
|
Roger Thompson |
|
|
Chief Financial Officer |
|
Date: February 27, 2018
A signed original of this written statement required by Section 302 has been provided to Janus Henderson Group plc and will be retained by Janus Henderson Group plc and furnished to the Securities and Exchange Commission or its staff upon request.
Exhibit 32.1
CERTIFICATION PURSUANT TO 18 U.S.C. SECTION 1350, AS ADOPTED PURSUANT TO
SECTION 906 OF THE SARBANES-OXLEY ACT OF 2002
In connection with the annual report of Janus Henderson Group plc on Form 10-K for the year ended December 31, 2017, as filed with the Securities and Exchange Commission on the date hereof (the “Report”), I, Richard M. Weil, Co-Chief Executive Officer of Janus Henderson Group plc, certify, pursuant to 18 U.S.C. Section 1350, as adopted pursuant to Section 906 of the Sarbanes-Oxley Act of 2002, that:
1. The report fully complies with the requirements of Section 13(a) or 15(d) of the Securities Exchange Act of 1934; and
2. The information contained in the report fairly presents, in all material respects, the financial condition and results of operations of Janus Henderson Group plc.
|
/s/ RICHARD M. WEIL
|
|
|
Richard M. Weil |
|
|
Co-Chief Executive Officer |
|
Date: February 27, 2018
A signed original of this written statement required by Section 906 has been provided to Janus Henderson Group plc and will be retained by Janus Henderson Group plc and furnished to the Securities and Exchange Commission or its staff upon request.
Exhibit 32.2
CERTIFICATION PURSUANT TO 18 U.S.C. SECTION 1350, AS ADOPTED PURSUANT TO
SECTION 906 OF THE SARBANES-OXLEY ACT OF 2002
In connection with the annual report of Janus Henderson Group plc on Form 10-K for the year ended December 31, 2017, as filed with the Securities and Exchange Commission on the date hereof (the “Report”), I, Andrew J. Formica, Co-Chief Executive Officer of Janus Henderson Group plc, certify, pursuant to 18 U.S.C. Section 1350, as adopted pursuant to Section 906 of the Sarbanes-Oxley Act of 2002, that:
1. The report fully complies with the requirements of Section 13(a) or 15(d) of the Securities Exchange Act of 1934; and
2. The information contained in the report fairly presents, in all material respects, the financial condition and results of operations of Janus Henderson Group plc.
|
/s/ ANDREW J. FORMICA
|
|
|
Andrew J. Formica |
|
|
Co-Chief Executive Officer |
|
Date: February 27, 2018
A signed original of this written statement required by Section 906 has been provided to Janus Henderson Group plc and will be retained by Janus Henderson Group plc and furnished to the Securities and Exchange Commission or its staff upon request.
Exhibit 32.3
CERTIFICATION PURSUANT TO 18 U.S.C. SECTION 1350, AS ADOPTED PURSUANT TO
SECTION 906 OF THE SARBANES-OXLEY ACT OF 2002
In connection with the annual report of Janus Henderson Group plc on Form 10-K for the year ended December 31, 2017, as filed with the Securities and Exchange Commission on the date hereof (the “Report”), I, Roger Thompson, Chief Financial Officer of Janus Henderson Group plc, certify, pursuant to 18 U.S.C. Section 1350, as adopted pursuant to Section 906 of the Sarbanes-Oxley Act of 2002, that:
1. The report fully complies with the requirements of Section 13(a) or 15(d) of the Securities Exchange Act of 1934; and
2. The information contained in the report fairly presents, in all material respects, the financial condition and results of operations of Janus Henderson Group plc.
|
/s/ ROGER THOMPSON
|
|
|
Roger Thompson |
|
|
Chief Financial Officer |
|
Date: February 27, 2018
A signed original of this written statement required by Section 906 has been provided to Janus Henderson Group plc and will be retained by Janus Henderson Group plc and furnished to the Securities and Exchange Commission or its staff upon request.
[Intentionally Left Blank]
[Intentionally Left Blank]
|
OTHER INFORMATION |
|
|
|
|
Shareholder information |
|
As at 23 February 2018
Total number of holders of shares, CDIs, UK DIs and their voting rights
The issued share capital of Janus Henderson Group plc consisted of 200,406,138 shares held by 48,702 security holders. This included: 87,930,892 shares, held by CHESS Depositary Nominees Pty Limited (CDN), quoted on the ASX in the form of CHESS Depositary Interests (CDIs) and held by 43,805 CDI holders; and, 4,651,088 UK depositary interests (UK DIs), each representing an entitlement to one underlying Janus Henderson ordinary share and held by 3,928 UK DI holders either through CREST or via the Janus Henderson Corporate Sponsored Nominee Facility. Each registered holder of shares present in person (or by proxy, attorney or representative) at a meeting of shareholders has one vote on a vote taken by a show of hands, and one vote for each fully paid share held on a vote taken on a poll. CDI holders can instruct CDN to appoint a proxy on their behalf and can direct the proxy how to vote on the basis of one vote per person taken by a show of hands, and one vote per CDI on a vote taken on a poll.
Securities subject to voluntary escrow
21,574,756 ordinary shares are currently held by Dai-ichi Life Holdings, Inc. (Dai-ichi). Under the Amended and Restated Investment and Strategic Cooperation Agreement between Dai-ichi and the Company, subject to certain limited exceptions, Dai-ichi may not transfer these shares without Janus Henderson’s written consent during the period up to and including 3 October 2019.
Twenty largest share/CDI/UK DI holders
|
|
Shares/CDIs/ |
% of issued | |
|
|
UK DIs |
capital | |
|
1 |
CEDE & Co |
105,412,259 |
52.60 |
|
2 |
HSBC Custody Nominees (Australia) Limited |
19,196,600 |
9.58 |
|
3 |
J.P. Morgan Nominees Australia Limited |
16,324,142 |
8.15 |
|
4 |
National Nominees Limited |
8,260,866 |
4.12 |
|
5 |
Citicorp Nominees Pty Limited |
6,518,731 |
3.25 |
|
6 |
BNP Paribas Nominees Pty Limited <Agency Lending DRP A/C> |
4,979,520 |
2.48 |
|
7 |
BNP Paribas Nominees Pty Limited <DRP> |
4,042,327 |
2.02 |
|
8 |
Citicorp Nominees Pty Limited <Colonial First State Inv A/C> |
2,691,658 |
1.34 |
|
9 |
HSBC Custody Nominees (Australia) Limited <NT-Comnwlth Super Corp A/C> |
2,476,086 |
1.24 |
|
10 |
Computershare Investor Services Nominee Account <CR2 Class> |
1,823,763 |
0.91 |
|
11 |
Hargreaves Lansdown (Nominees) Limited |
1,093,073 |
0.55 |
|
12 |
CS Third Nominees Pty Limited <HSBC Cust Nom AU Ltd 13 A/C> |
697,334 |
0.35 |
|
13 |
Warbont Nominees Pty Limited <Unpaid Entrepot A/C> |
632,596 |
0.32 |
|
14 |
BNP Paribas Nominees (NZ) Limited <DRP> |
601,447 |
0.30 |
|
15 |
Computershare Company Nominees Limited |
545,814 |
0.27 |
|
16 |
Avanteos Investments Limited <Encircle IMA A/C> |
352,131 |
0.18 |
|
17 |
AMP Life Limited |
340,380 |
0.17 |
|
18 |
Bond Street Custodians Limited <COCKEJ – F01832 A/C> |
309,552 |
0.15 |
|
19 |
HSBC Global Custody Nominees (UK) Limited |
294,706 |
0.15 |
|
20 |
UBS Nominees Pty Limited |
285,000 |
0.14 |
|
Top 20 total |
176,877,985 |
88.3 | |
|
Total shares |
200,406,138 |
100.00 | |
|
|
|
| |
|
Distribution of share/CDI/UK DI holdings |
|
| |
|
|
|
Number of | |
|
Categories |
|
holders | |
|
1–1,000 |
|
45,229 | |
|
1,001–5,000 |
|
3,054 | |
|
5,001–10,000 |
|
237 | |
|
10,001–100,000 |
|
141 | |
|
100,001 and over |
|
47 | |
|
Total |
|
48,702 | |
2,007 share/CDI/UK DI holders held less than a marketable parcel (being A$500 worth) of shares/CDIs/UK DIs i.e. fewer than 12 shares/CDIs/ UK DIs.
Janus Henderson Group plc Annual Report 2017
|
Stock exchange listings Janus Henderson Group plc is listed on the NYSE and its CDIs are quoted on the ASX.
Substantial shareholders Details of the Company’s substantial shareholders are set out in the ‘Stock Ownership of Certain Beneficial Owners and Management’ section, Item 12 Part III of the Form 10-K, on page 150.
Total number of options over unissued shares There were 2,085,999 options over unissued ordinary shares in the Company held by 774 option holders.
Restricted securities None of the shares/CDIs on issue are “restricted securities” as defined in the ASX Listing Rules.
Buyback There is no current on-market buyback of ordinary shares on the NYSE or CDIs on the ASX. The Company had authority to buy back ordinary shares and CDIs but did not utilise that authority during 2017.
Additional information regarding shares acquired on-market in satisfaction of employee awards and entitlements is set out on page 28 of Item 5 on Part II on Form 10-K. |
|
Company Secretary Jacqui Irvine
Principal place of business in the United Kingdom 201 Bishopsgate, London EC2M 3AE Phone: +44 (0) 20 7818 1818
Registered office in Jersey 47 Esplanade, St Helier, Jersey JE1 0BD
Registered office in Australia Level 5, Deutsche Bank Place, 126 Phillip Street, Sydney NSW 2000 Phone: +61 (0) 2 9230 4000
|
|
Locations of share registries Australia Janus Henderson Group Share Registry, GPO Box 4578, Melbourne VIC 3001 Phone: 1300 137 981 or +61 (0) 3 9415 4081 Fax: +61 (0) 3 9473 2500
Jersey Janus Henderson Group Share Registry, Queensway House, Hilgrove Street, St Helier, Jersey JE1 1ES Phone: +44 (0) 1534 281842 Fax: +44 (0) 370 873 5851
New Zealand Janus Henderson Group Share Registry, Private Bag 92119, Auckland 1142 Phone: 0800 888 017 Fax: +64 (0) 9 488 8787
United States Janus Henderson Group Transfer Agent, P.O. Box 43078, Providence, RI, 02940-3078 Phone: +1 866 638 5573 or +1 781 575 2374
Shareholders: webqueries@computershare.com
CDI holders: webqueries@computershare.com.au
DI/CSN holders: webqueries@computershare.co.uk
Website www.janushenderson.com/ir |
Janus Henderson Group plc Annual Report 2017
|
OTHER INFORMATION |
Two-year financial and performance summary
(Pro forma adjusted; unaudited)
|
|
FY17 |
FY16 |
|
|
US$m |
US$m |
|
Adjusted revenue |
|
|
|
Management fees |
1,853.5 |
1,746.0 |
|
Performance fees |
84.7 |
18.2 |
|
Shareowner servicing fees |
119.7 |
113.4 |
|
Other revenue |
124.7 |
133.0 |
|
Total revenue |
2,182.6 |
2,010.6 |
|
Distribution expenses |
(334.5) |
(342.1) |
|
Total revenue, net of distribution expenses |
1,848.1 |
1,668.5 |
|
Operating expenses |
|
|
|
Employee compensation and benefits |
(644.2) |
(611.2) |
|
Long-term incentive plans |
(165.2) |
(169.6) |
|
Investment administration |
(43.8) |
(46.2) |
|
Marketing |
(33.9) |
(36.0) |
|
General, administrative and occupancy |
(198.7) |
(209.5) |
|
Depreciation and amortisation |
(30.4) |
(30.9) |
|
Total operating expenses |
(1,116.2) |
(1,103.4) |
|
Adjusted operating income |
731.9 |
565.1 |
|
Interest expense |
(16.0) |
(21.4) |
|
Investment gains (losses), net |
6.3 |
(14.2) |
|
Other non-operating income (expenses), net |
2.2 |
7.8 |
|
Income before taxes |
724.4 |
537.3 |
|
Income tax provision |
(214.5) |
(143.8) |
|
Net income |
509.9 |
393.5 |
|
Net (income)/loss attributable to noncontrolling interests |
(5.5) |
6.5 |
|
Net income attributable to JHG |
504.4 |
400.0 |
|
Less: allocation of earnings to participating stock-based awards |
(14.2) |
(11.9) |
|
Net income attributable to JHG common shareholders |
490.2 |
388.1 |
|
Key Performance Indicators |
|
|
|
Adjusted operating margin (%) |
39.6 |
33.9 |
|
Adjusted compensation ratio (%) |
43.8 |
46.8 |
|
Number of full-time employees and equivalents |
2,356 |
– |
|
Assets under management (AUM) at year end (US$bn) |
370.8 |
319.2 |
|
Average AUM (US$bn) |
346.5 |
318.3 |
|
Net Management fee margin (bps) |
44.7 |
45.0 |
|
Basic and diluted earnings per share (EPS) |
|
|
|
Basic weighted-average shares outstanding (m) |
196.3 |
196.3 |
|
Diluted weighted-average shares outstanding (m) |
197.9 |
200.3 |
|
Adjusted basic earnings per share (US$) |
2.50 |
1.98 |
|
Adjusted diluted earnings per share (US$) |
2.48 |
1.94 |
|
Dividend per share (US$)1 |
1.20 |
– |
|
Investment performance2 |
|
|
|
Percentage of AUM outperforming benchmark over one year (%) |
76 |
40 |
|
Percentage of AUM outperforming benchmark over three years (%) |
66 |
56 |
|
Percentage of AUM outperforming benchmark over five years (%) |
79 |
77 |
Notes
n Data presents pro forma net flows, assets under management, and results of Janus Henderson Group as if the merger had occurred at the beginning of the period shown.
n See adjusted financial measures reconciliation on Form 10-K pages 43 and 44 for additional information.
1. 2017 includes a hypothetical per share dividend for Janus Henderson Group plc for 1Q17. The amount is derived by taking the sum of the cash dividends each legacy firm paid to its respective shareholders (for legacy Janus that was US$20.3m and for legacy Henderson that was US$26.9m), divided by the number of shares outstanding as at 30 May 2017 (approximately 200.4m). USD/GBP 1.3017.
2. Outperformance is measured based on composite performance gross of fees vs primary benchmark, except where a strategy has no benchmark index or corresponding composite in which case the most relevant metric is used: (1) composite gross of fees vs zero for absolute return strategies, (2) fund net of fees vs primary index or (3) fund net of fees vs Morningstar peer group average or median. Non-discretionary and separately managed account assets are included with a corresponding composite where applicable. Cash management vehicles, ETFs, Managed CDOs, Private Equity funds and custom non-discretionary accounts with no corresponding composite are excluded from the analysis. Excluded assets represent 4% of AUM as at 31 Dec 2016 and 3% of AUM as at 31 Dec 2017. Capabilities defined by Janus Henderson.
Janus Henderson Group plc Annual Report 2017
|
|
|
|
Past performance is no guarantee of future results. Investing involves risk, including the possible loss of principal and fluctuation of value. |
|
|
|
|
|
Forward-looking information |
|
|
|
|
|
This presentation includes statements concerning potential future events involving Janus Henderson Group plc that could differ materially from the events that actually occur. The differences could be caused by a number of factors including those factors identified in Janus Henderson Group’s Registration Statement, on file with the Securities and Exchange Commission (Commission file no. 333-216824) and its 2017 Form 10-K, including those that appear under headings such as “Risk Factors” and “Management’s Discussion and Analysis of Financial Condition and Results of Operations.” Many of these factors are beyond the control of the company and its management. Any forward-looking statements contained in this presentation are as of the date on which such statements were made. The company assumes no duty to update them, even if experience, unexpected events, or future changes make it clear that any projected results expressed or implied therein will not be realised. |
|
|
|
|
|
Annualised, pro forma, projected and estimated numbers are used for illustrative purposes only, are not forecasts and may not reflect actual results. |
|
|
|
|
|
No public offer |
|
|
|
|
|
The information, statements and opinions contained in this presentation do not constitute a public offer under any applicable legislation or an offer to sell or solicitation of any offer to buy any securities or financial instruments or any advice or recommendation with respect to such securities or other financial instruments. |
|
|
|
|
|
Not all products or services are available in all jurisdictions. |
|
|
|
|
|
Mutual funds in the US are distributed by Janus Henderson Distributors. |
|
|
|
|
|
Please consider the charges, risks, expenses and investment objectives carefully before investing. For a US fund prospectus or, if available, a summary prospectus containing this and other information, please contact your investment professional or call 800.668.0434. Read it carefully before you invest or send money. |
|
|
|
|
|
Janus Henderson, Janus, Henderson, Janus Henderson Labs, AlphaGen, Perkins and Intech are trademarks of Janus Henderson Investors. © Janus Henderson Investors. The name Janus Henderson Investors includes HGI Group Limited, Henderson Global Investors (Brand Management) Sarl and Janus International Holding LLC. |
|
|
|
|
|
|
|
|
This document is printed on Magno Satin, a paper containing fibre sourced from well managed, responsible, FSC® certified forests. The pulp used in this product is bleached using an elemental chlorine free (ECF) process. |
|
|
|
|
|
100% of the inks used are vegetable oil based, 95% of press chemicals are recycled for further use and, on average 99% of any waste associated with this production will be recycled. |
|
|
|
|
|
Printed by Park Communications. |
|
|
|
|
|
Park is an EMAS certified company and its Environmental Management System is certified to ISO 14001. |
|
|
|
|
|
Design and production by CONRAN DESIGN GROUP |
|

201 Bishopsgate, London EC2M 3AE