Attached files
| file | filename |
|---|---|
| EX-99.1 - EX-99.1 - TRANSATLANTIC PETROLEUM LTD. | tat-ex991_6.htm |
| 8-K - 8-K. - TRANSATLANTIC PETROLEUM LTD. | tat-8k_20180321.htm |

2017 Earnings call Bahar Central Production Facility PRESENTATION Exhibit 99.2
disclaimer Outlooks, projections, estimates, targets and business plans in this presentation or any related subsequent discussions are forward-looking statements. Actual future results, including TransAtlantic Petroleum Ltd.’s own production growth and mix; financial results; the amount and mix of capital expenditures; resource additions and recoveries; finding and development costs; project and drilling plans, timing, costs, and capacities; marketing process; access to capital; revenue enhancements and cost efficiencies; industry margins; margin enhancements and integration benefits; and the impact of technology could differ materially due to a number of factors. These include market prices for natural gas, natural gas liquids and oil products; estimates of reserves and economic assumptions; the ability to produce and transport natural gas, natural gas liquids and oil; the results of exploration and development drilling and related activities; economic conditions in the countries and provinces in which we carry on business, especially economic slowdowns; actions by governmental authorities, receipt of required approvals, increases in taxes, legislative and regulatory initiatives relating to fracture stimulation activities, changes in environmental and other regulations, and renegotiations of contracts; political uncertainty, including actions by insurgent groups or other conflict; the negotiation and closing of material contracts; shortages of drilling rigs, equipment or oilfield services; and other factors discussed here and under the heading “Risk Factors" in our Annual Report on Form 10-K for the year ended December 31, 2017, which is available on our website at www.transatlanticpetroleum.com and at www.sec.gov. See also TransAtlantic’s audited financial statements and the accompanying management discussion and analysis. Forward-looking statements are based on management’s knowledge and reasonable expectations on the date hereof, and we assume no duty to update these statements contained in our Form 10-K as of any future date, except as required by law. The information set forth in this presentation does not constitute an offer, solicitation or recommendation to sell or an offer to buy any securities of TransAtlantic. The information published herein is provided for informational purposes only. TransAtlantic makes no representation that the information and opinions expressed herein are accurate, complete or current. The information contained herein is current as of the date hereof, but may become outdated or subsequently may change. Nothing contained herein constitutes financial, legal, tax, or other advice. The SEC requires oil and gas companies, in their filings with the SEC, to disclose proved reserves that a company has demonstrated by actual production or conclusive formation tests to be economically and legally producible under existing economic and operating conditions. We may use the terms “estimated ultimate recovery,” “EUR,” “probable,” “possible,” and “non-proven” reserves, “prospective resources” or “upside” or other descriptions of volumes of resources or reserves potentially recoverable through additional drilling or recovery techniques. These estimates are by their nature more speculative than estimates of proved reserves and accordingly are subject to substantially greater risk of actually being realized by TransAtlantic. There is no certainty that any portion of estimated prospective resources will be discovered. If discovered, there is no certainty that it will be commercially viable to produce any portion of the estimated prospective resources. This presentation includes 1P, 2P, and 3P reserves based on a reserve report prepared by Degolyer & MacNaughton as of December 31, 2017 using forward strip pricing (“YE2017 D&M Strip-Pricing Reserve Report”) and a reserve report prepared by Degolyer & MacNaughton as of December 31, 2017 using SEC pricing (“YE2017 D&M SEC Reserve Report”). 1P reserves refer to proved reserves. 2P reserves refer to proved reserves plus probable reserves. 3P reserves refer to proved reserves plus probable reserves plus possible reserves. Proved reserves are those quantities of oil and natural gas, which, by analysis of geoscience and engineering data, can be estimated with reasonable certainty to be economically producible, from a given date forward, from known reservoirs, and under existing economic conditions, operating methods, and government regulations, prior to the time at which contracts providing the right to operate expire, unless evidence indicates that renewal is reasonably certain, regardless of whether deterministic or probabilistic methods are used for the estimation. The project to extract the hydrocarbons must have commenced or the operator must be reasonably certain that it will commence the project within a reasonable time. Probable reserves are inherently imprecise. When producing an estimate of the amount of oil and natural gas that is recoverable from a particular reservoir, an estimated quantity of probable reserves is an estimate of those additional reserves that are less certain to be recovered than proved reserves but which, together with proved reserves, are as likely as not to be recovered. When deterministic methods are used, it is as likely as not that actual remaining quantities recovered will exceed the sum of estimated proved plus probable reserves. When probabilistic methods are used, there should be at least a 50% probability that the actual quantities recovered will equal or exceed the proved plus probable reserves estimates. Possible reserves are also inherently imprecise. When producing an estimate of the amount of oil and natural gas that is recoverable from a particular reservoir, an estimated quantity of possible reserves is an estimate that might be achieved, but only under more favorable circumstances than are likely. When deterministic methods are used, the total quantities ultimately recovered from a project have a low probability of exceeding proved plus probable plus possible reserves. When probabilistic methods are used, there should be at least a 10% probability that the total quantities ultimately recovered will equal or exceed the proved plus probable plus possible reserves estimates.
Disclaimer (cont.) This presentation also includes prospective resource estimates from the Netherland, Sewell & Associates, Inc. Prospective Resource Report dated as of May 31, 2017 (“May 2017 NSAI Prospective Resource Report”) and the DeGloyer and MacNaughton Prospective Resource Report dated as of December 31, 2017 (“December 2017 D&M Prospective Resource Report”). Prospective resources are not the same as reserves or contingent resources. Prospective resources are those quantities of oil and gas estimated, as of a given date, to be potentially recoverable from undiscovered accumulations by application of future development projects. Prospective resources have both an associated chance of discovery and a chance of development. There is no certainty that any portion of the resources will be discovered. If discovered, there is no certainty that it will be commercially viable to produce any portion of the resources. Risks associated with the estimate of prospective resources contained in this presentation include, but are not limited to: The Thrace Basin Centered Gas Accumulation (“Thrace BCGA”) play is in the early exploration and delineation cycle with limited well control and limited fracture stimulation and testing data. Prospects evaluated in the May 2017 NSAI Prospective Resource Report are developed largely using seismic interpretation. Limited well control data is available to support the prospects. The volumes associated with the May 2017 NSAI Prospective Resource Report are all the unrisked high estimate, meaning there is no more than a 10% probability that the volumes discovered will exceed the estimate. There is no long-term well production performance from the Thrace BCGA or the May 2017 NSAI Prospective Resource Report prospects to establish a production type curve specific to the prospect, thereby requiring use of analogue information to establish development plans and to confirm the chance of commerciality. Recovery efficiencies are uncertain given the absence of site specific long-term well production performance data. The limited deep drilling carried out in the Thrace Basin and Bulgaria provides limited visibility on future costs to drill, frac and complete deep development wells to exploit prospects in those regions and the associated impact on the chance of commerciality. Although oil and gas activity has been underway for many decades in Turkey, as activity levels increase, timelines may increase to achieve government and local landowner approvals. Note on PV10 and PV20: The present value of estimated future net revenues is an estimate of future net revenues from a property at the date indicated, without giving effect to derivative financial instrument activities, after deducting production and ad valorem taxes, future capital costs, abandonment costs and operating expenses, but before deducting future federal income taxes. The PV10 future net revenues have been discounted at an annual rate of 10% and the PV20 future net revenues have been discounted at an annual rate of 20% to determine their “present value.” The present value is shown to indicate the effect of time on the value of the net revenue stream and should not be construed as being the fair market value of the properties or the oil and natural gas reserves TransAtlantic owns. Estimates have been made using constant oil and natural gas prices and operating and capital costs at the date indicated, at its acquisition date, or as otherwise indicated. We believe that the present value of estimated future net revenues before income taxes, while not a financial measure in accordance with GAAP, is an important financial measure used by investors and independent oil and natural gas producers for evaluating the relative significance of oil and natural gas properties and acquisitions because the tax characteristics of comparable companies can differ materially. PV10 and PV20 are not measures of financial or operating performance under GAAP. Neither PV10 nor PV20 should be considered as an alternative to the Standardized Measure as defined under GAAP. The Standardized Measure represents the PV10 after giving effect to income taxes. Note on BOE: BOE (barrel of oil equivalent) is derived by converting natural gas to oil in the ratio of six thousand cubic feet (MCF) of natural gas to one barrel (bbl) of oil. BOE may be misleading, particularly if used in isolation. A BOE conversion ratio of 6 Mcf:1 bbl is based on an energy equivalency conversion method primarily applicable at the burner tip and does not represent a value equivalency at the wellhead.
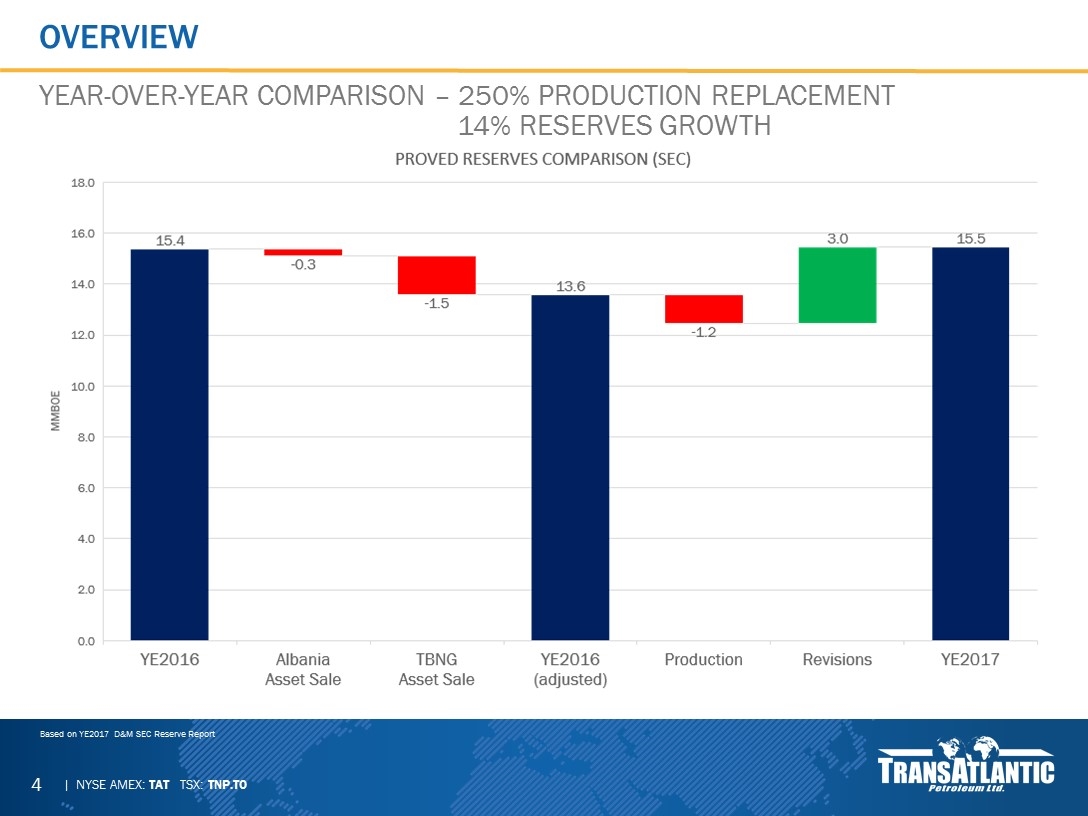
Overview YEAR-OVER-YEAR COMPARISON – 250% Production replacement 14% Reserves Growth Based on YE2017 D&M SEC Reserve Report
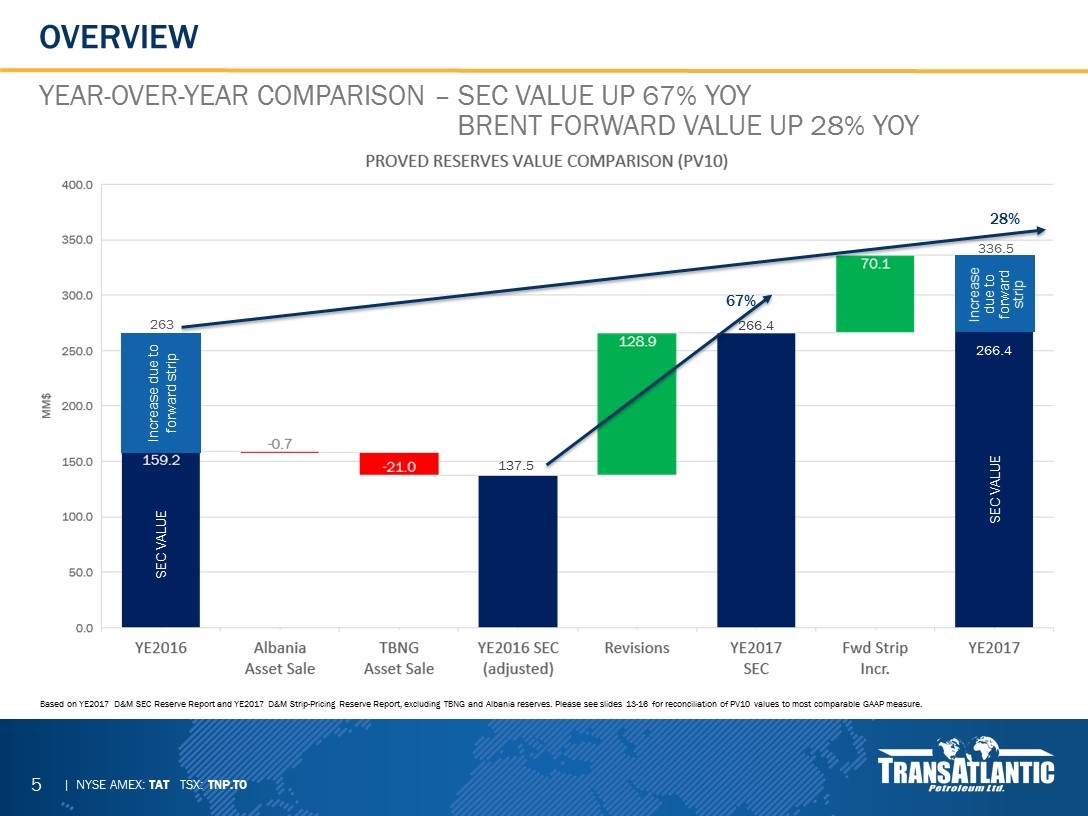
Overview YEAR-OVER-YEAR COMPARISON – SEC VALUE UP 67% YOY brent forward value up 28% yoy Based on YE2017 D&M SEC Reserve Report and YE2017 D&M Strip-Pricing Reserve Report, excluding TBNG and Albania reserves. Please see slides 13-16 for reconciliation of PV10 values to most comparable GAAP measure. 67% 28% 263 Increase due to forward strip SEC VALUE Increase due to forward strip 266.4 336.5 SEC VALUE 137.5 266.4
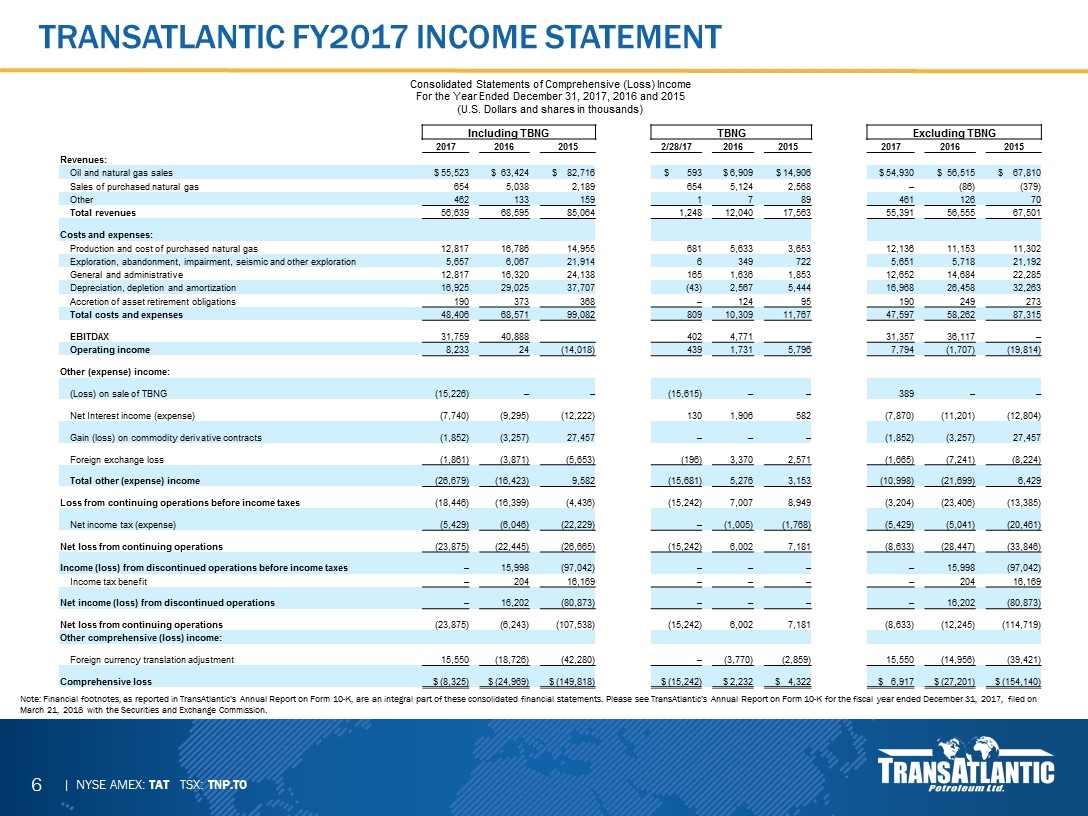
Transatlantic fy2017 income statement Note: Financial footnotes, as reported in TransAtlantic’s Annual Report on Form 10-K, are an integral part of these consolidated financial statements. Please see TransAtlantic’s Annual Report on Form 10-K for the fiscal year ended December 31, 2017, filed on March 21, 2018 with the Securities and Exchange Commission. Consolidated Statements of Comprehensive (Loss) Income For the Year Ended December 31, 2017, 2016 and 2015 (U.S. Dollars and shares in thousands) Including TBNG TBNG Excluding TBNG 2017 2016 2015 2/28/17 2016 2015 2017 2016 2015 Revenues: Oil and natural gas sales $ 55,523 $ 63,424 $ 82,716 $ 593 $ 6,909 $ 14,906 $ 54,930 $ 56,515 $ 67,810 Sales of purchased natural gas 654 5,038 2,189 654 5,124 2,568 – (86) (379) Other 462 133 159 1 7 89 461 126 70 Total revenues 56,639 68,595 85,064 1,248 12,040 17,563 55,391 56,555 67,501 Costs and expenses: Production and cost of purchased natural gas 12,817 16,786 14,955 681 5,633 3,653 12,136 11,153 11,302 Exploration, abandonment, impairment, seismic and other exploration 5,657 6,067 21,914 6 349 722 5,651 5,718 21,192 General and administrative 12,817 16,320 24,138 165 1,636 1,853 12,652 14,684 22,285 Depreciation, depletion and amortization 16,925 29,025 37,707 (43) 2,567 5,444 16,968 26,458 32,263 Accretion of asset retirement obligations 190 373 368 – 124 95 190 249 273 Total costs and expenses 48,406 68,571 99,082 809 10,309 11,767 47,597 58,262 87,315 EBITDAX 31,759 40,888 402 4,771 31,357 36,117 – Operating income 8,233 24 (14,018) 439 1,731 5,796 7,794 (1,707) (19,814) Other (expense) income: (Loss) on sale of TBNG (15,226) – – (15,615) – – 389 – – Net Interest income (expense) (7,740) (9,295) (12,222) 130 1,906 582 (7,870) (11,201) (12,804) Gain (loss) on commodity derivative contracts (1,852) (3,257) 27,457 – – – (1,852) (3,257) 27,457 Foreign exchange loss (1,861) (3,871) (5,653) (196) 3,370 2,571 (1,665) (7,241) (8,224) Total other (expense) income (26,679) (16,423) 9,582 (15,681) 5,276 3,153 (10,998) (21,699) 6,429 Loss from continuing operations before income taxes (18,446) (16,399) (4,436) (15,242) 7,007 8,949 (3,204) (23,406) (13,385) Net income tax (expense) (5,429) (6,046) (22,229) – (1,005) (1,768) (5,429) (5,041) (20,461) Net loss from continuing operations (23,875) (22,445) (26,665) (15,242) 6,002 7,181 (8,633) (28,447) (33,846) Income (loss) from discontinued operations before income taxes – 15,998 (97,042) – – – – 15,998 (97,042) Income tax benefit – 204 16,169 – – – – 204 16,169 Net income (loss) from discontinued operations – 16,202 (80,873) – – – – 16,202 (80,873) Net loss from continuing operations (23,875) (6,243) (107,538) (15,242) 6,002 7,181 (8,633) (12,245) (114,719) Other comprehensive (loss) income: Foreign currency translation adjustment 15,550 (18,726) (42,280) – (3,770) (2,859) 15,550 (14,956) (39,421) Comprehensive loss $ (8,325) $ (24,969) $ (149,818) $ (15,242) $ 2,232 $ 4,322 $ 6,917 $ (27,201) $ (154,140)
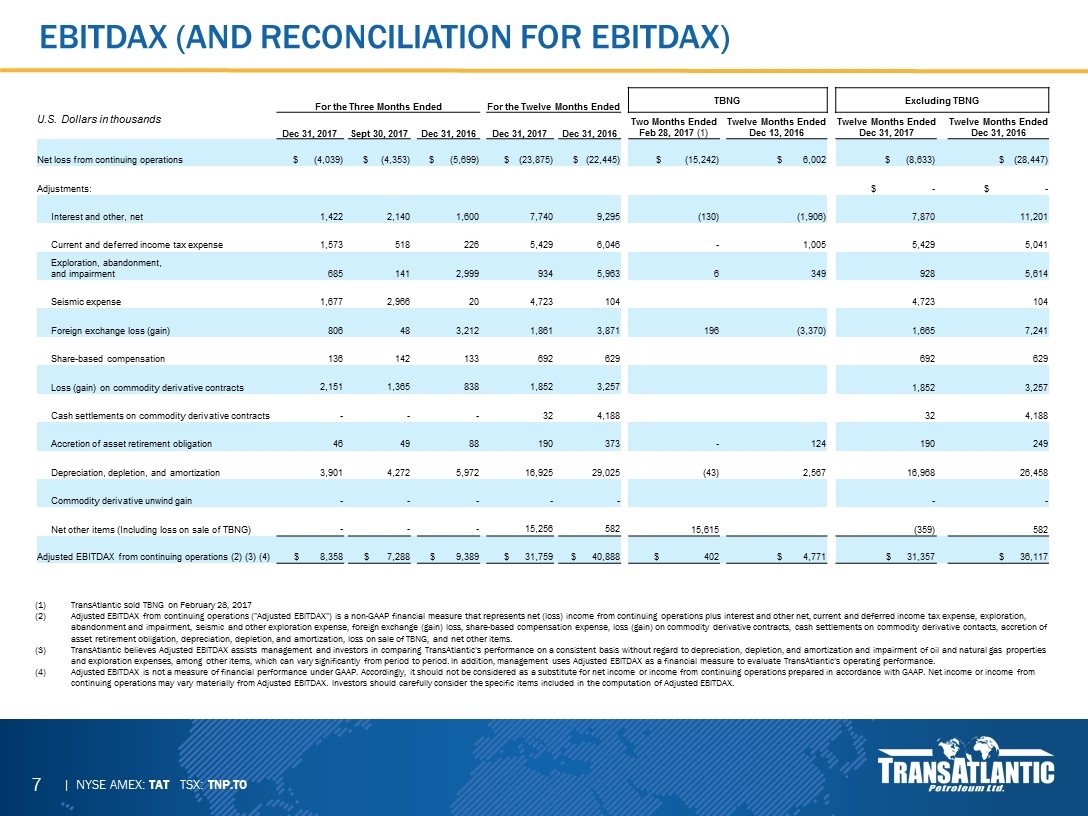
Ebitdax (and reconciliation for ebitdax) For the Three Months Ended For the Twelve Months Ended TBNG Excluding TBNG U.S. Dollars in thousands Dec 31, 2017 Sept 30, 2017 Dec 31, 2016 Dec 31, 2017 Dec 31, 2016 Two Months Ended Feb 28, 2017 (1) Twelve Months Ended Dec 13, 2016 Twelve Months Ended Dec 31, 2017 Twelve Months Ended Dec 31, 2016 Net loss from continuing operations $ (4,039) $ (4,353) $ (5,699) $ (23,875) $ (22,445) $ (15,242) $ 6,002 $ (8,633) $ (28,447) Adjustments: $ - $ - Interest and other, net 1,422 2,140 1,600 7,740 9,295 (130) (1,906) 7,870 11,201 Current and deferred income tax expense 1,573 518 226 5,429 6,046 - 1,005 5,429 5,041 Exploration, abandonment, and impairment 685 141 2,999 934 5,963 6 349 928 5,614 Seismic expense 1,677 2,966 20 4,723 104 4,723 104 Foreign exchange loss (gain) 806 48 3,212 1,861 3,871 196 (3,370) 1,665 7,241 Share-based compensation 136 142 133 692 629 692 629 Loss (gain) on commodity derivative contracts 2,151 1,365 838 1,852 3,257 1,852 3,257 Cash settlements on commodity derivative contracts - - - 32 4,188 32 4,188 Accretion of asset retirement obligation 46 49 88 190 373 - 124 190 249 Depreciation, depletion, and amortization 3,901 4,272 5,972 16,925 29,025 (43) 2,567 16,968 26,458 Commodity derivative unwind gain - - - - - - - Net other items (Including loss on sale of TBNG) - - - 15,256 582 15,615 (359) 582 Adjusted EBITDAX from continuing operations (2) (3) (4) $ 8,358 $ 7,288 $ 9,389 $ 31,759 $ 40,888 $ 402 $ 4,771 $ 31,357 $ 36,117 TransAtlantic sold TBNG on February 28, 2017 Adjusted EBITDAX from continuing operations ("Adjusted EBITDAX") is a non-GAAP financial measure that represents net (loss) income from continuing operations plus interest and other net, current and deferred income tax expense, exploration, abandonment and impairment, seismic and other exploration expense, foreign exchange (gain) loss, share-based compensation expense, loss (gain) on commodity derivative contracts, cash settlements on commodity derivative contacts, accretion of asset retirement obligation, depreciation, depletion, and amortization, loss on sale of TBNG, and net other items. TransAtlantic believes Adjusted EBITDAX assists management and investors in comparing TransAtlantic's performance on a consistent basis without regard to depreciation, depletion, and amortization and impairment of oil and natural gas properties and exploration expenses, among other items, which can vary significantly from period to period. In addition, management uses Adjusted EBITDAX as a financial measure to evaluate TransAtlantic's operating performance. Adjusted EBITDAX is not a measure of financial performance under GAAP. Accordingly, it should not be considered as a substitute for net income or income from continuing operations prepared in accordance with GAAP. Net income or income from continuing operations may vary materially from Adjusted EBITDAX. Investors should carefully consider the specific items included in the computation of Adjusted EBITDAX.
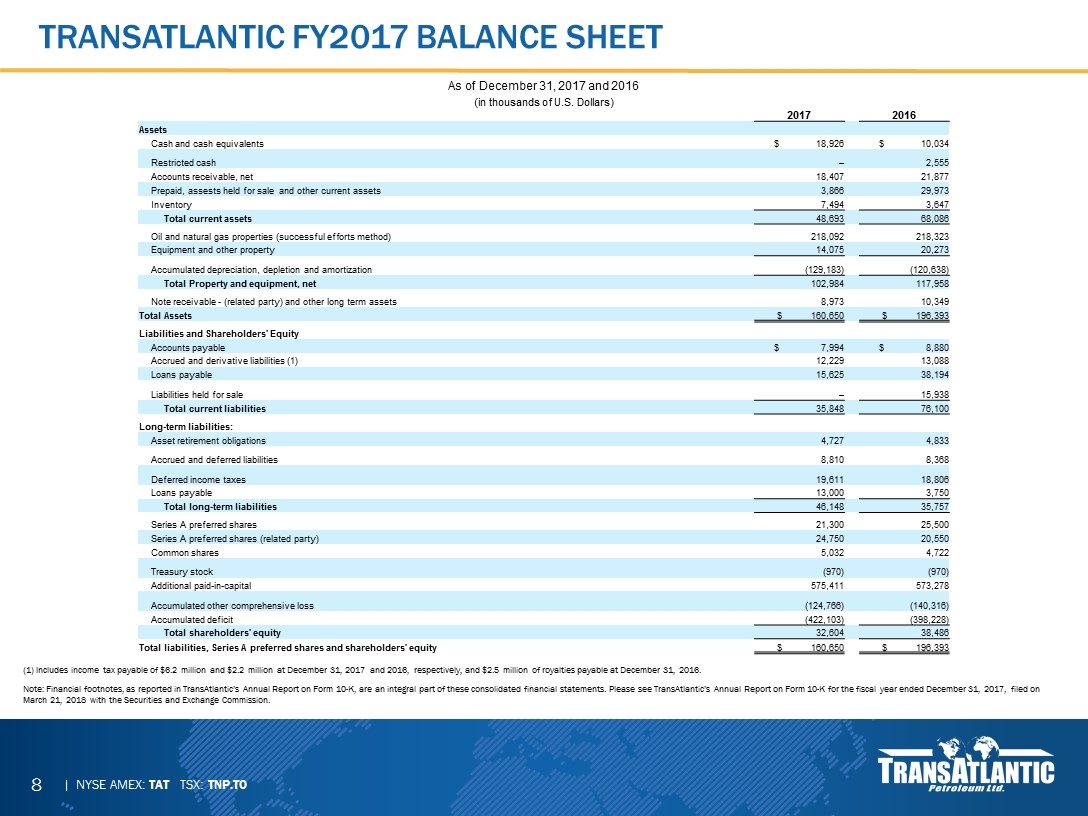
Transatlantic fy2017 balance sheet As of December 31, 2017 and 2016 (in thousands of U.S. Dollars) 2017 2016 Assets Cash and cash equivalents $ 18,926 $ 10,034 Restricted cash – 2,555 Accounts receivable, net 18,407 21,877 Prepaid, assests held for sale and other current assets 3,866 29,973 Inventory 7,494 3,647 Total current assets 48,693 68,086 Oil and natural gas properties (successful efforts method) 218,092 218,323 Equipment and other property 14,075 20,273 Accumulated depreciation, depletion and amortization (129,183) (120,638) Total Property and equipment, net 102,984 117,958 Note receivable - (related party) and other long term assets 8,973 10,349 Total Assets $ 160,650 $ 196,393 Liabilities and Shareholders' Equity Accounts payable $ 7,994 $ 8,880 Accrued and derivative liabilities (1) 12,229 13,088 Loans payable 15,625 38,194 Liabilities held for sale – 15,938 Total current liabilities 35,848 76,100 Long-term liabilities: Asset retirement obligations 4,727 4,833 Accrued and deferred liabilities 8,810 8,368 Deferred income taxes 19,611 18,806 Loans payable 13,000 3,750 Total long-term liabilities 46,148 35,757 Series A preferred shares 21,300 25,500 Series A preferred shares (related party) 24,750 20,550 Common shares 5,032 4,722 Treasury stock (970) (970) Additional paid-in-capital 575,411 573,278 Accumulated other comprehensive loss (124,766) (140,316) Accumulated deficit (422,103) (398,228) Total shareholders' equity 32,604 38,486 Total liabilities, Series A preferred shares and shareholders' equity $ 160,650 $ 196,393 (1) Includes income tax payable of $6.2 million and $2.2 million at December 31, 2017 and 2016, respectively, and $2.5 million of royalties payable at December 31, 2016. Note: Financial footnotes, as reported in TransAtlantic’s Annual Report on Form 10-K, are an integral part of these consolidated financial statements. Please see TransAtlantic’s Annual Report on Form 10-K for the fiscal year ended December 31, 2017, filed on March 21, 2018 with the Securities and Exchange Commission.
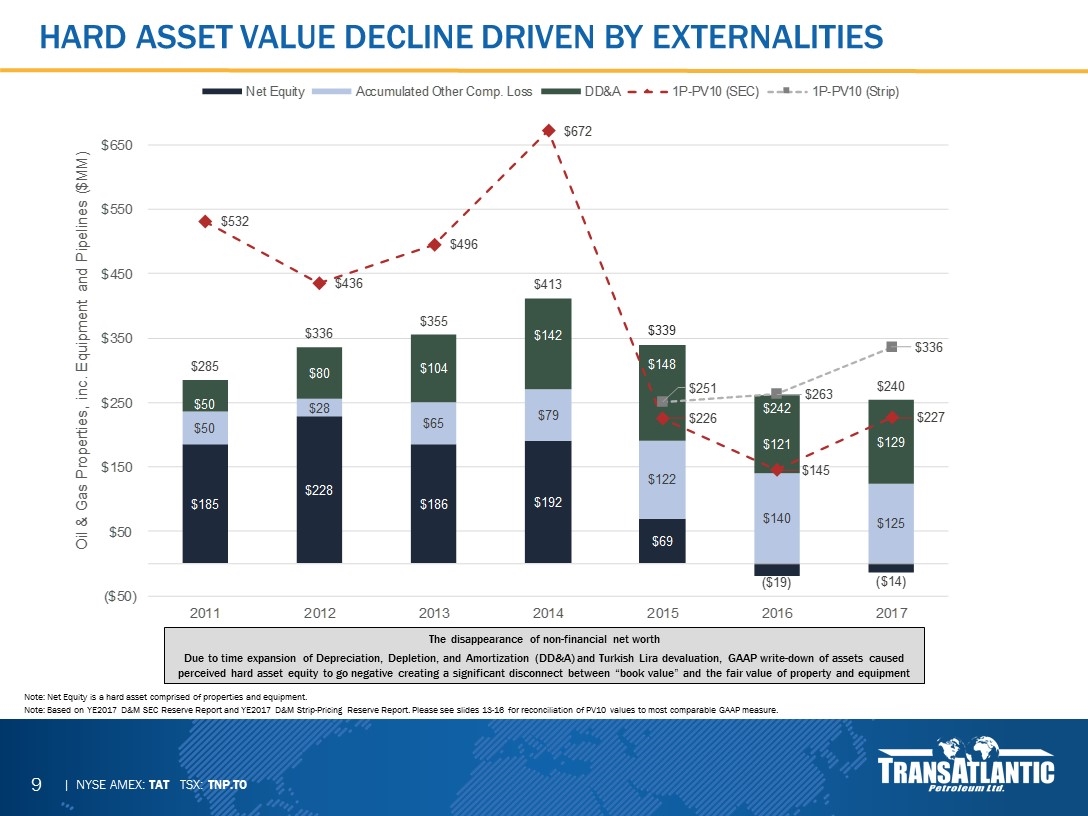
Note: Net Equity is a hard asset comprised of properties and equipment. Note: Based on YE2017 D&M SEC Reserve Report and YE2017 D&M Strip-Pricing Reserve Report. Please see slides 13-16 for reconciliation of PV10 values to most comparable GAAP measure. Hard asset value decline driven by externalities The disappearance of non-financial net worth Due to time expansion of Depreciation, Depletion, and Amortization (DD&A) and Turkish Lira devaluation, GAAP write-down of assets caused perceived hard asset equity to go negative creating a significant disconnect between “book value” and the fair value of property and equipment
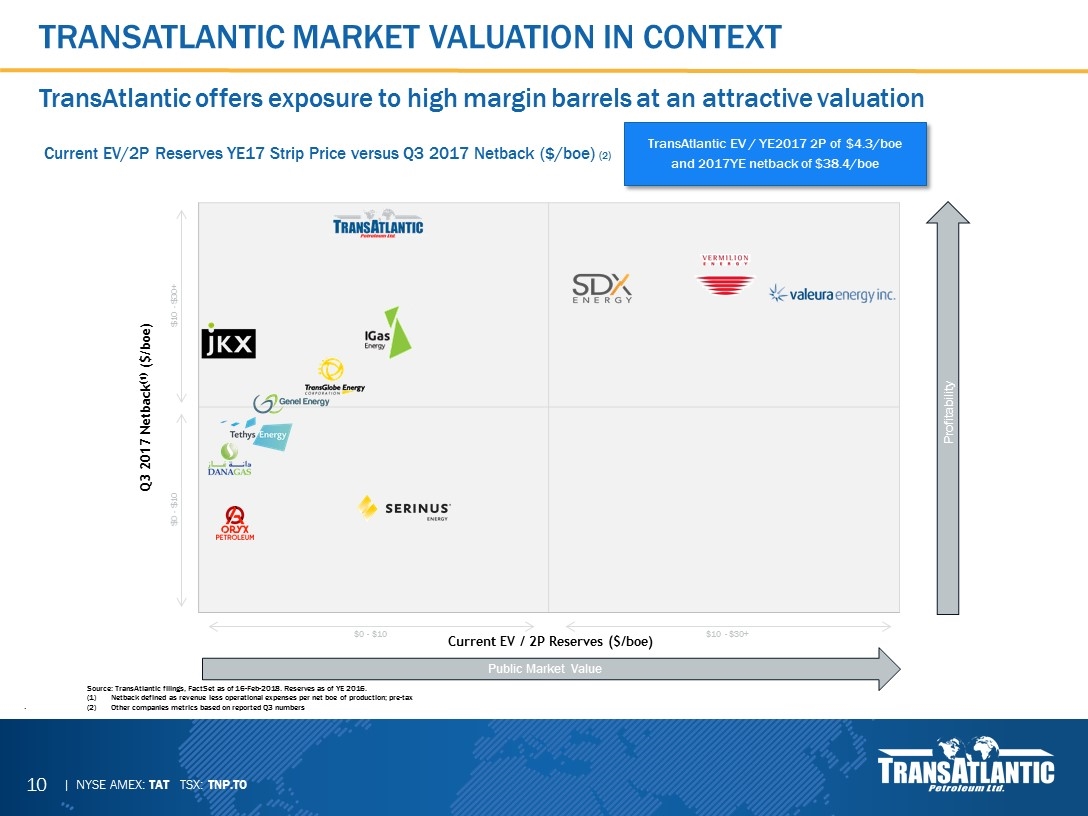
TransAtlantic Market Valuation in Context . TransAtlantic offers exposure to high margin barrels at an attractive valuation Source: TransAtlantic filings, FactSet as of 16-Feb-2018. Reserves as of YE 2016. Netback defined as revenue less operational expenses per net boe of production; pre-tax Other companies metrics based on reported Q3 numbers Current EV/2P Reserves YE17 Strip Price versus Q3 2017 Netback ($/boe) (2) $0 - $10 Current EV / 2P Reserves ($/boe) Q3 2017 Netback(1) ($/boe) Profitability Public Market Value $10 - $30+ $0 - $10 $10 - $30+ TransAtlantic EV / YE2017 2P of $4.3/boe and 2017YE netback of $38.4/boe
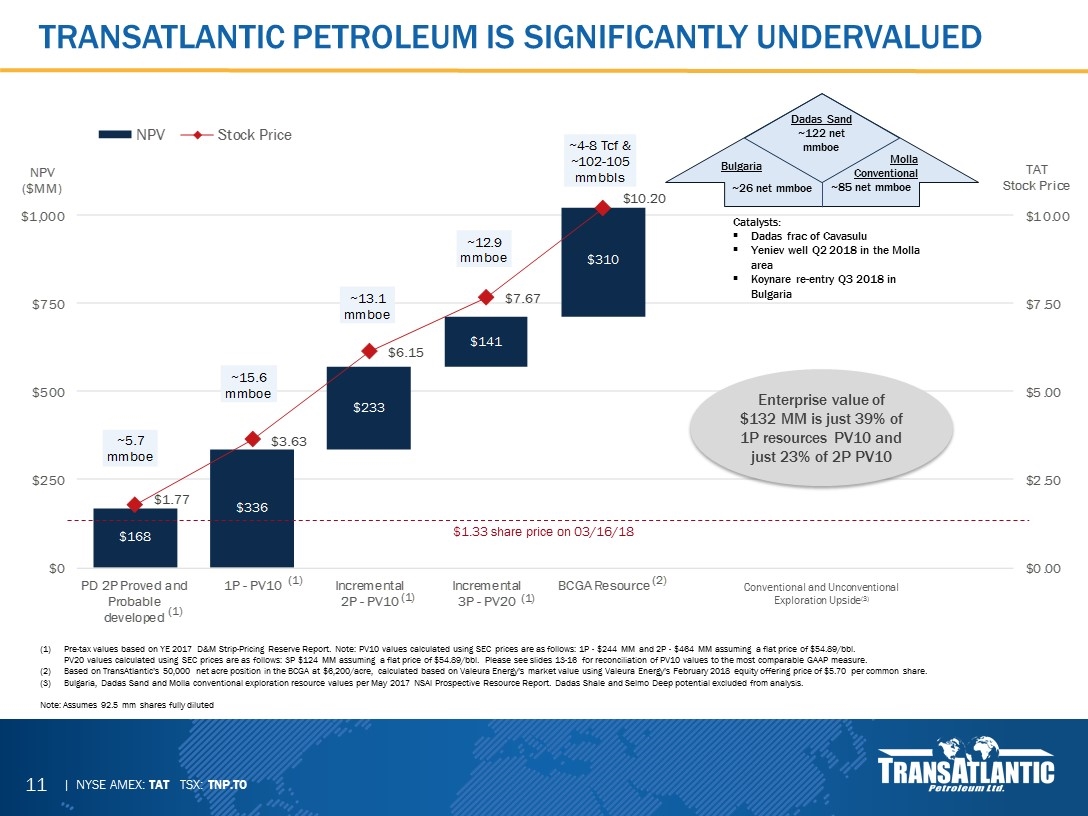
Transatlantic petroleum is significantly undervalued Pre-tax values based on YE 2017 D&M Strip-Pricing Reserve Report. Note: PV10 values calculated using SEC prices are as follows: 1P - $244 MM and 2P - $464 MM assuming a flat price of $54.89/bbl. PV20 values calculated using SEC prices are as follows: 3P $124 MM assuming a flat price of $54.89/bbl. Please see slides 13-16 for reconciliation of PV10 values to the most comparable GAAP measure. Based on TransAtlantic’s 50,000 net acre position in the BCGA at $6,200/acre, calculated based on Valeura Energy’s market value using Valeura Energy’s February 2018 equity offering price of $5.70 per common share. Bulgaria, Dadas Sand and Molla conventional exploration resource values per May 2017 NSAI Prospective Resource Report. Dadas Shale and Selmo Deep potential excluded from analysis. Note: Assumes 92.5 mm shares fully diluted Catalysts: Dadas frac of Cavasulu Yeniev well Q2 2018 in the Molla area Koynare re-entry Q3 2018 in Bulgaria Bulgaria ~26 net mmboe Molla Conventional ~85 net mmboe Dadas Sand ~122 net mmboe Conventional and Unconventional Exploration Upside(3) Enterprise value of $132 MM is just 39% of 1P resources PV10 and just 23% of 2P PV10 $1.33 share price on 03/16/18
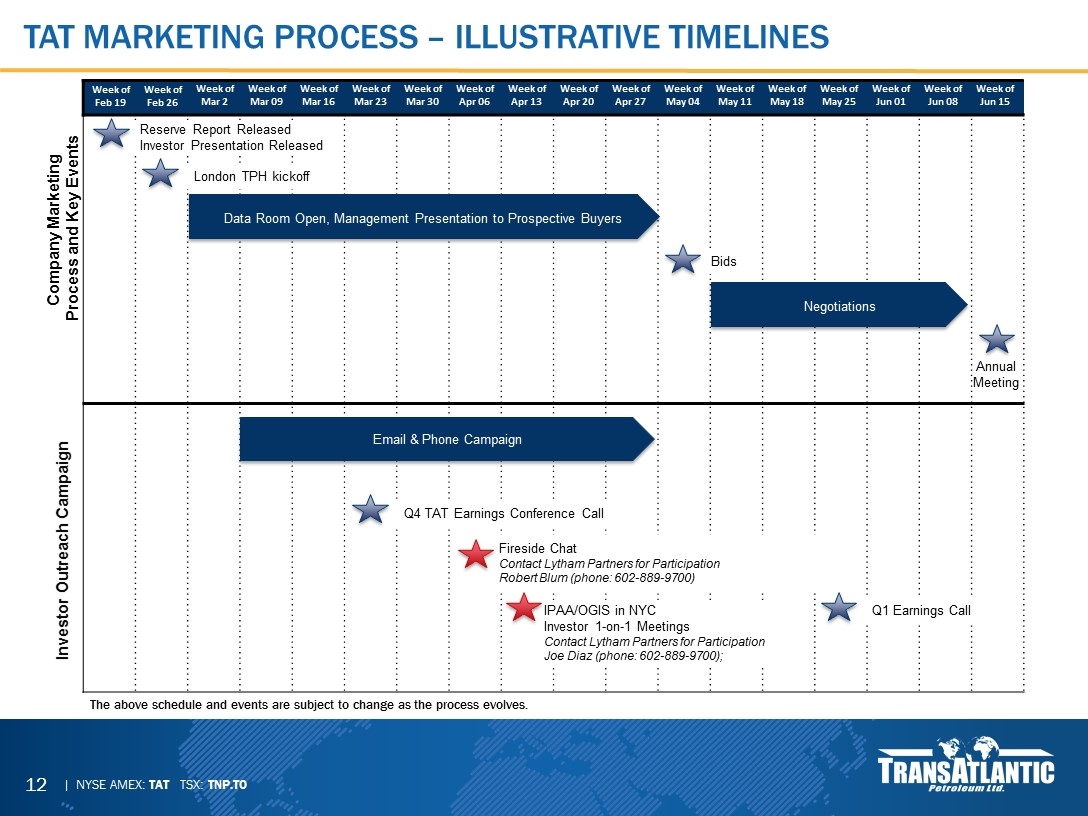
Tat marketing process – Illustrative timelines Week of Mar 2 Week of Mar 16 Week of Mar 09 Week of Mar 23 Week of Mar 30 Week of Apr 06 Week of Apr 13 Week of Apr 20 Week of Apr 27 Week of May 04 Week of May 11 Week of May 18 Week of May 25 Week of Jun 01 Week of Jun 08 Week of Jun 15 Company Marketing Process and Key Events Investor Outreach Campaign Week of Feb 19 Week of Feb 26 Reserve Report Released Investor Presentation Released London TPH kickoff Data Room Open, Management Presentation to Prospective Buyers Negotiations Bids Annual Meeting IPAA/OGIS in NYC Investor 1-on-1 Meetings Contact Lytham Partners for Participation Joe Diaz (phone: 602-889-9700); Email & Phone Campaign Q4 TAT Earnings Conference Call Fireside Chat Contact Lytham Partners for Participation Robert Blum (phone: 602-889-9700) Q1 Earnings Call The above schedule and events are subject to change as the process evolves.
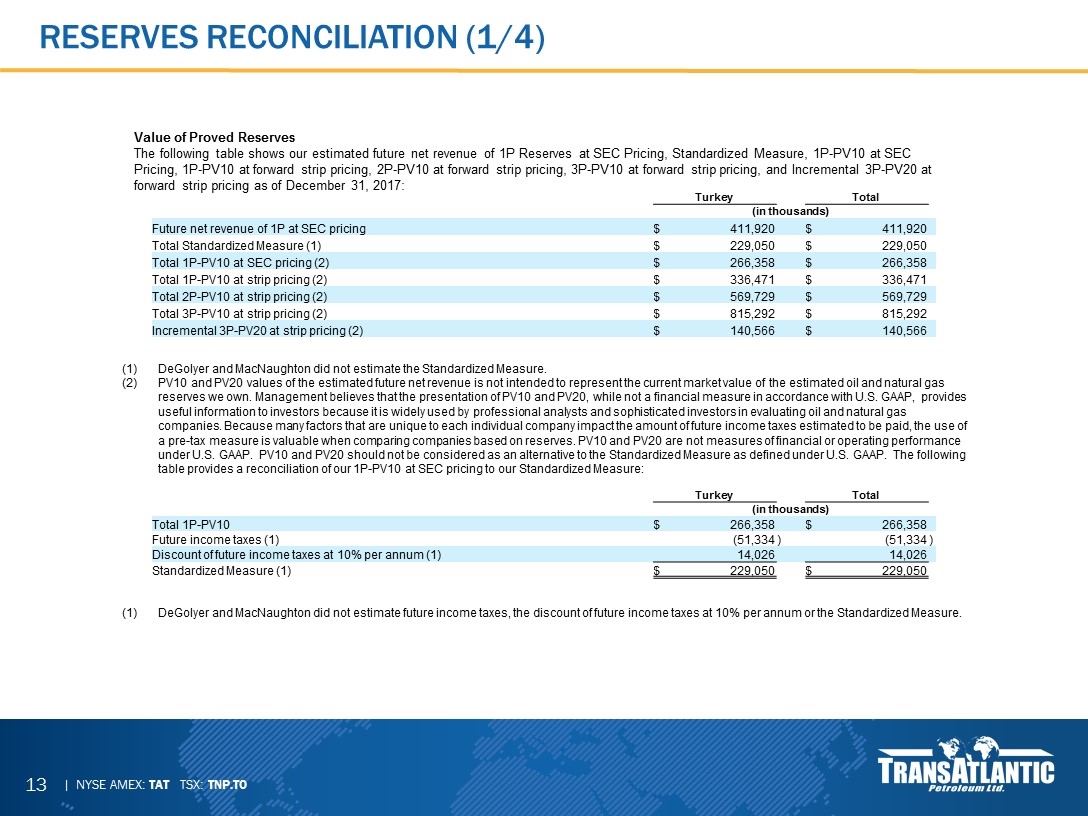
Reserves Reconciliation (1/4) DeGolyer and MacNaughton did not estimate the Standardized Measure. PV10 and PV20 values of the estimated future net revenue is not intended to represent the current market value of the estimated oil and natural gas reserves we own. Management believes that the presentation of PV10 and PV20, while not a financial measure in accordance with U.S. GAAP, provides useful information to investors because it is widely used by professional analysts and sophisticated investors in evaluating oil and natural gas companies. Because many factors that are unique to each individual company impact the amount of future income taxes estimated to be paid, the use of a pre-tax measure is valuable when comparing companies based on reserves. PV10 and PV20 are not measures of financial or operating performance under U.S. GAAP. PV10 and PV20 should not be considered as an alternative to the Standardized Measure as defined under U.S. GAAP. The following table provides a reconciliation of our 1P-PV10 at SEC pricing to our Standardized Measure: Value of Proved Reserves The following table shows our estimated future net revenue of 1P Reserves at SEC Pricing, Standardized Measure, 1P-PV10 at SEC Pricing, 1P-PV10 at forward strip pricing, 2P-PV10 at forward strip pricing, 3P-PV10 at forward strip pricing, and Incremental 3P-PV20 at forward strip pricing as of December 31, 2017: Turkey Total (in thousands) Future net revenue of 1P at SEC pricing $ 411,920 $ 411,920 Total Standardized Measure (1) $ 229,050 $ 229,050 Total 1P-PV10 at SEC pricing (2) $ 266,358 $ 266,358 Total 1P-PV10 at strip pricing (2) $ 336,471 $ 336,471 Total 2P-PV10 at strip pricing (2) $ 569,729 $ 569,729 Total 3P-PV10 at strip pricing (2) $ 815,292 $ 815,292 Incremental 3P-PV20 at strip pricing (2) $ 140,566 $ 140,566 DeGolyer and MacNaughton did not estimate future income taxes, the discount of future income taxes at 10% per annum or the Standardized Measure. Turkey Total (in thousands) Total 1P-PV10 $ 266,358 $ 266,358 Future income taxes (1) (51,334 ) (51,334 ) Discount of future income taxes at 10% per annum (1) 14,026 14,026 Standardized Measure (1) $ 229,050 $ 229,050
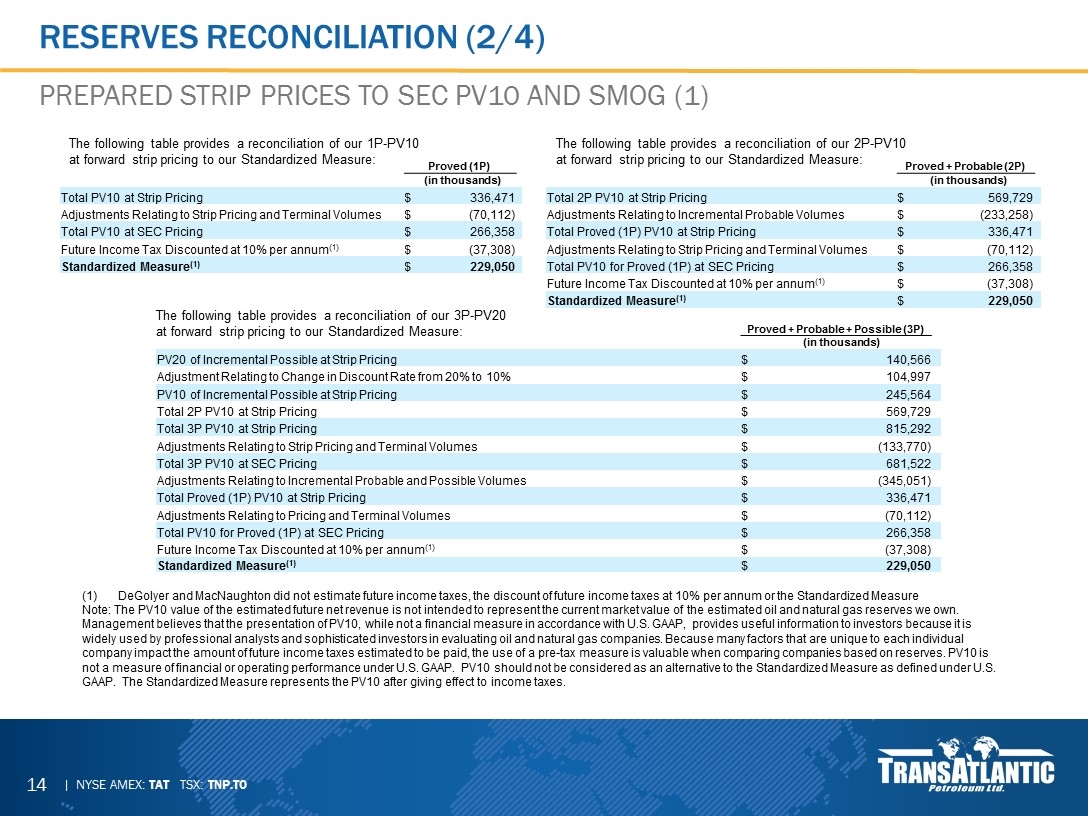
Reserves Reconciliation (2/4) Prepared Strip Prices to SEC PV10 and SMOG (1) DeGolyer and MacNaughton did not estimate future income taxes, the discount of future income taxes at 10% per annum or the Standardized Measure Note: The PV10 value of the estimated future net revenue is not intended to represent the current market value of the estimated oil and natural gas reserves we own. Management believes that the presentation of PV10, while not a financial measure in accordance with U.S. GAAP, provides useful information to investors because it is widely used by professional analysts and sophisticated investors in evaluating oil and natural gas companies. Because many factors that are unique to each individual company impact the amount of future income taxes estimated to be paid, the use of a pre-tax measure is valuable when comparing companies based on reserves. PV10 is not a measure of financial or operating performance under U.S. GAAP. PV10 should not be considered as an alternative to the Standardized Measure as defined under U.S. GAAP. The Standardized Measure represents the PV10 after giving effect to income taxes. Proved (1P) (in thousands) Total PV10 at Strip Pricing $ 336,471 Adjustments Relating to Strip Pricing and Terminal Volumes $ (70,112) Total PV10 at SEC Pricing $ 266,358 Future Income Tax Discounted at 10% per annum(1) $ (37,308) Standardized Measure(1) $ 229,050 Proved + Probable (2P) (in thousands) Total 2P PV10 at Strip Pricing $ 569,729 Adjustments Relating to Incremental Probable Volumes $ (233,258) Total Proved (1P) PV10 at Strip Pricing $ 336,471 Adjustments Relating to Strip Pricing and Terminal Volumes $ (70,112) Total PV10 for Proved (1P) at SEC Pricing $ 266,358 Future Income Tax Discounted at 10% per annum(1) $ (37,308) Standardized Measure(1) $ 229,050 Proved + Probable + Possible (3P) (in thousands) PV20 of Incremental Possible at Strip Pricing $ 140,566 Adjustment Relating to Change in Discount Rate from 20% to 10% $ 104,997 PV10 of Incremental Possible at Strip Pricing $ 245,564 Total 2P PV10 at Strip Pricing $ 569,729 Total 3P PV10 at Strip Pricing $ 815,292 Adjustments Relating to Strip Pricing and Terminal Volumes $ (133,770) Total 3P PV10 at SEC Pricing $ 681,522 Adjustments Relating to Incremental Probable and Possible Volumes $ (345,051) Total Proved (1P) PV10 at Strip Pricing $ 336,471 Adjustments Relating to Pricing and Terminal Volumes $ (70,112) Total PV10 for Proved (1P) at SEC Pricing $ 266,358 Future Income Tax Discounted at 10% per annum(1) $ (37,308) Standardized Measure(1) $ 229,050 The following table provides a reconciliation of our 1P-PV10 at forward strip pricing to our Standardized Measure: The following table provides a reconciliation of our 2P-PV10 at forward strip pricing to our Standardized Measure: The following table provides a reconciliation of our 3P-PV20 at forward strip pricing to our Standardized Measure:
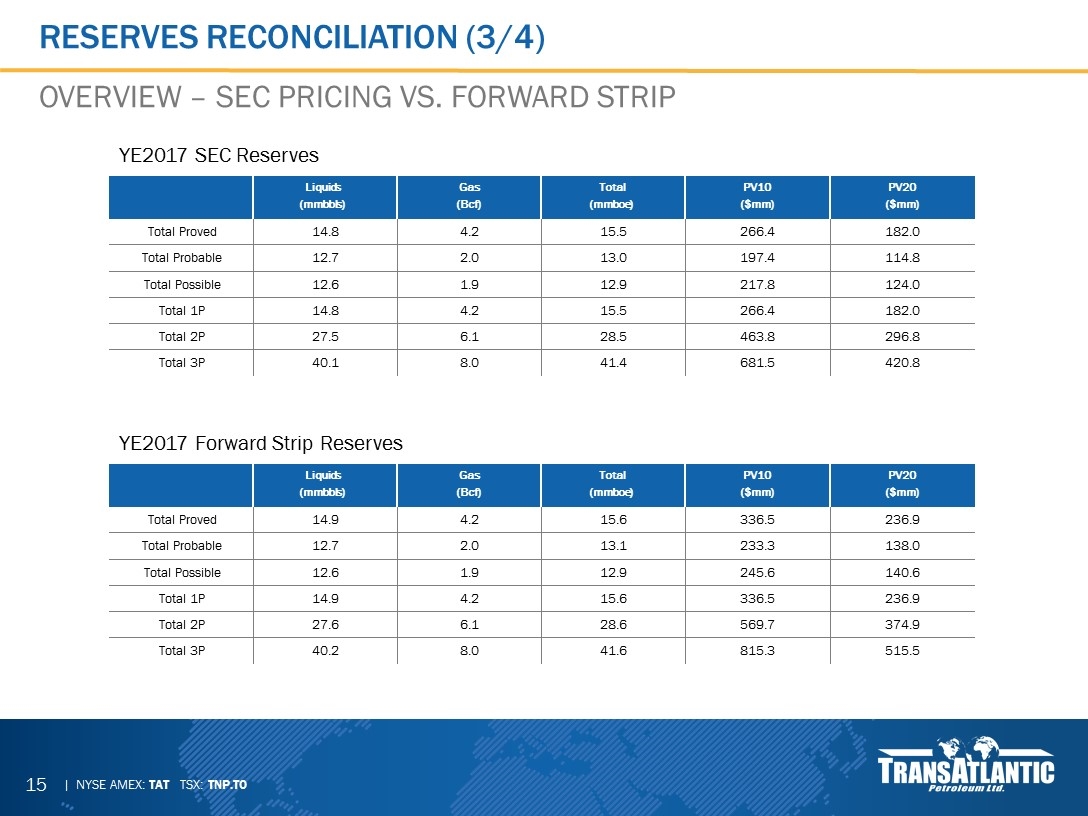
Reserves Reconciliation (3/4) Overview – SEC Pricing vs. Forward Strip YE2017 SEC Reserves YE2017 Forward Strip Reserves Liquids Gas Total PV10 PV20 (mmbbls) (Bcf) (mmboe) ($mm) ($mm) Total Proved 14.8 4.2 15.5 266.4 182.0 Total Probable 12.7 2.0 13.0 197.4 114.8 Total Possible 12.6 1.9 12.9 217.8 124.0 Total 1P 14.8 4.2 15.5 266.4 182.0 Total 2P 27.5 6.1 28.5 463.8 296.8 Total 3P 40.1 8.0 41.4 681.5 420.8 Liquids Gas Total PV10 PV20 (mmbbls) (Bcf) (mmboe) ($mm) ($mm) Total Proved 14.9 4.2 15.6 336.5 236.9 Total Probable 12.7 2.0 13.1 233.3 138.0 Total Possible 12.6 1.9 12.9 245.6 140.6 Total 1P 14.9 4.2 15.6 336.5 236.9 Total 2P 27.6 6.1 28.6 569.7 374.9 Total 3P 40.2 8.0 41.6 815.3 515.5
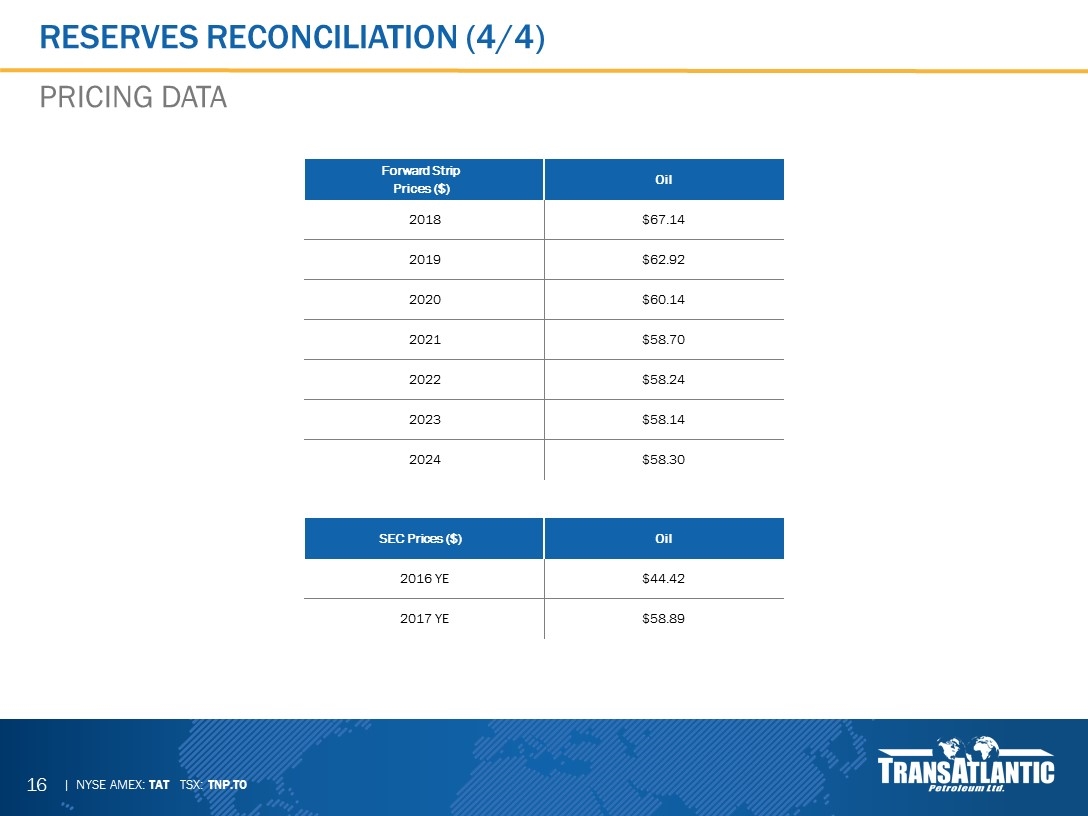
Reserves Reconciliation (4/4) Pricing Data Forward Strip Prices ($) Oil 2018 $67.14 2019 $62.92 2020 $60.14 2021 $58.70 2022 $58.24 2023 $58.14 2024 $58.30 SEC Prices ($) Oil 2016 YE $44.42 2017 YE $58.89
Selmo Thank You
