Attached files
| file | filename |
|---|---|
| EX-32.1 - EX-32.1 - Altair Engineering Inc. | d503331dex321.htm |
| EX-31.2 - EX-31.2 - Altair Engineering Inc. | d503331dex312.htm |
| EX-31.1 - EX-31.1 - Altair Engineering Inc. | d503331dex311.htm |
| EX-23.1 - EX-23.1 - Altair Engineering Inc. | d503331dex231.htm |
| EX-21.1 - EX-21.1 - Altair Engineering Inc. | d503331dex211.htm |
Table of Contents
UNITED STATES
SECURITIES AND EXCHANGE COMMISSION
Washington, D.C. 20549
FORM 10-K
(Mark One)
| ☒ | ANNUAL REPORT PURSUANT TO SECTION 13 OR 15(d) OF THE SECURITIES EXCHANGE ACT OF 1934 |
For the fiscal year ended December 31, 2017
or
| ☐ | TRANSITION REPORT PURSUANT TO SECTION 13 OR 15(d) OF THE SECURITIES EXCHANGE ACT OF 1934 |
Commission file number 001-38263
ALTAIR ENGINEERING INC.
(Exact name of registrant as specified in its charter)
| Delaware | 38-2591828 | |
| (State or other jurisdiction of incorporation or organization) |
(I.R.S. Employer Identification No.) | |
| 1820 East Big Beaver Road, Troy, Michigan | 48083 | |
| (Address of principal executive offices) | (Zip Code) | |
248-614-2400
(Registrant’s telephone number, including area code)
Securities registered pursuant to Section 12(b) of the Act:
| Class A Common Stock, $0.0001 par value per share |
The NASDAQ Stock Market LLC | |
| (Title of each class) | (Name of exchange on which registered) |
Securities registered pursuant to Section 12(g) of the Act:
None
(Title of class)
Indicate by a check mark if the registrant is a well-known seasoned issuer, as defined in Rule 405 of the Securities Act. Yes ☐ No ☒
Indicate by a check mark if the registrant is not required to file reports pursuant to Section 13 or 15(d) of the Act. Yes ☐ No ☒
Indicate by a check mark whether the registrant (1) has filed all reports required to be filed by Section 13 or 15(d) of the Securities Exchange Act of 1934 during the preceding 12 months (or for such shorter period that the registrant was required to file such reports), and (2) has been subject to such filing requirements for the past 90 days. Yes ☒ No ☐
Indicate by check mark whether the registrant has submitted electronically and posted on its corporate Website, if any, every Interactive Data File required to be submitted and posted pursuant to Rule 405 of Regulation S-T (§232.405 of this chapter) during the preceding 12 months (or for such shorter period that the registrant was required to submit and post such files). Yes ☒ No ☐
Indicate by a check mark if disclosure of delinquent filers pursuant to Item 405 of Regulation S-K (§229.405 of this chapter) is not contained herein and will not be contained, to the best of the registrant’s knowledge, in definitive proxy or information statements incorporated by reference in PART III of this Form 10-K, or any amendment to this Form 10-K. ☐
Indicate by a check mark whether the registrant is a large accelerated filer, an accelerated filer, a non-accelerated filer, a smaller reporting company, or an emerging growth company. See the definitions of “large accelerated filer,” “accelerated filer,” “smaller reporting company,” and “emerging growth company” in Rule 12b-2 of the Exchange Act. ☐
(Check one):
| Large accelerated filer | ☐ | Accelerated filer | ☐ | |||
| Non-accelerated filer | ☒ (Do not check if a smaller reporting company) | Smaller reporting company | ☐ | |||
| Emerging growth company | ☒ | |||||
If an emerging growth company, indicate by check mark if the registrant has elected not to use the extended transition period for complying with any new or revised financial accounting standards provided pursuant to Section 13(a) of the Exchange Act.
Indicate by a check mark whether the registrant is a shell company (as defined in Rule 12b-2 of the Act). Yes ☐ No ☒
The aggregate market value of the voting and non-voting common stock held by non-affiliates of the registrant, based upon the closing sale price of a share of the registrant’s Class A common stock on December 29, 2017 as reported on the NASDAQ stock market, was $636.5 million. The registrant has elected to use December 29, 2017, which was the last business day of the registrant’s most recently completed fiscal year, as the calculation date because on June 30, 2017 (the last business day of the registrant’s most recently completed second fiscal quarter), the registrant was a privately-held company. Shares of the registrant’s Class A common stock and Class B common stock held by each executive officer, director, and each other person who may be deemed to be an affiliate of the registrant, have been excluded from this computation. This determination of affiliate status is not necessarily a conclusive determination for other purposes.
On December 31, 2017, there were 26,725,484 shares of the registrant’s Class A common stock outstanding and 36,507,676 shares of the registrant’s Class B common stock outstanding.
Documents Incorporated By Reference:
Portions of the registrant’s Proxy Statement relating to the 2018 Annual Meeting of Stockholders, scheduled to be filed with the Securities and Exchange Commission within 120 days after the end of the registrant’s fiscal year ended December 31, 2017, are incorporated by reference into Part III of this Annual Report on Form 10-K.
Table of Contents
ALTAIR ENGINEERING INC.
Annual Report on Form 10-K for the Fiscal Year Ended December 31, 2017
1
Table of Contents
CAUTIONARY NOTE REGARDING FORWARD-LOOKING STATEMENTS
This annual report on Form 10-K contains forward-looking statements made pursuant to the safe harbor provisions of the Private Securities Litigation Reform Act of 1995 under Section 27A of the Securities Act of 1933, as amended, and Section 21E of the Securities Exchange Act of 1934, as amended. Forward-looking statements include statements with respect to our beliefs, plans, objectives, goals, expectations, anticipations, assumptions, estimates, intentions and future performance, and involve known and unknown risks, uncertainties and other factors, which may be beyond our control, and which may cause our actual results, performance or achievements to be materially different from future results, performance or achievements expressed or implied by such forward-looking statements. All statements other than statements of historical fact are statements that could be forward-looking statements. You can identify these forward-looking statements through our use of words such as “may,” “can,” “anticipate,” “assume,” “should,” “indicate,” “would,” “believe,” “contemplate,” “expect,” “seek,” “estimate,” “continue,” “plan,” “point to,” “project,” “predict,” “could,” “intend,” “target,” “potential” and other similar words and expressions of the future.
There are a number of important factors that could cause the actual results to differ materially from those expressed in any forward-looking statement made by us. These factors include, but are not limited to:
| • | our ability to acquire new customers because of the difficulty in predicting our software sales cycles; |
| • | reduced spending on product design and development activities by our customers; |
| • | our dependence on annual renewals of our software licenses; |
| • | our ability to maintain or protect our intellectual property; |
| • | our ability to retain key executive members; |
| • | our ability to internally develop new inventions and intellectual property; |
| • | demand for our software by customers other than simulation engineering specialists and in additional industry verticals; |
| • | acceptance of our business model by investors; |
| • | our susceptibility to factors affecting the automotive industry where we derive a substantial portion of our revenues |
| • | the accuracy of our estimates regarding expenses and capital requirements; and |
| • | the significant quarterly fluctuations of our results. |
The foregoing does not represent an exhaustive list of matters that may be covered by the forward-looking statements contained herein or risk factors that we are faced with that may cause our actual results to differ from those anticipated in our forward-looking statements. Please see “Risk factors” in this Annual Report on Form 10-K under Part I, Item 1A, for additional risks which could adversely impact our business and financial performance.
All forward-looking statements are expressly qualified in their entirety by this cautionary notice. You are cautioned not to place undue reliance on any forward-looking statements, which speak only as of the date of this report or the date of the document incorporated by reference into this report. We have no obligation, and expressly disclaim any obligation, to update, revise or correct any of the forward-looking statements, whether as a result of new information, future events or otherwise. We have expressed our expectations, beliefs and projections in good faith and we believe they have a reasonable basis. However, we cannot assure you that our expectations, beliefs or projections will result or be achieved or accomplished.
2
Table of Contents
PART I
| Item 1. | Business |
General
Altair Engineering Inc. (“Altair,” the “Company,” “we,” “us” or “our”) is a leading provider of enterprise-class engineering software enabling innovation across the entire product lifecycle from concept design to in-service operation. Our vision is to transform product design and organizational decision making by applying simulation, optimization and high performance computing throughout product lifecycles.
Our simulation-driven approach to innovation is powered by our broad portfolio of high-fidelity and high-performance physics solvers. Our integrated suite of software optimizes design performance across multiple disciplines encompassing structures, motion, fluids, thermal management, electromagnetics, system modeling, and embedded systems, while also providing data analytics and true-to-life visualization and rendering.
We believe a critical component of our success has been our company culture, based on our core values of innovation, envisioning the future, communicating honestly and broadly, seeking technology and business firsts, and embracing diversity. This culture is important because it helps attract and retain top people, encourages innovation and teamwork, and enhances our focus on achieving Altair’s corporate objectives.
Products
Our software enables customers to enhance product performance, compress development time, and reduce costs. Our thirty-year heritage is in solving some of the most challenging design problems faced by engineers and scientists. Altair is also a leading provider of high performance computing, or HPC, workflow tools which empower our customers to explore designs in ways not possible in traditional computing environments. We believe we are unique in the industry for the depth and breadth of our engineering application software offerings combined with our domain expertise and proprietary technology for harnessing HPC and cloud infrastructures.
Our primary users are highly educated and technical engineers, commonly referred to as simulation specialists. We predominantly reach customers with simulation specialists through Altair’s experienced, direct sales force, especially in industries requiring highly engineered products, such as automotive, aerospace, heavy machinery, rail and ship design. To enable concept engineering driven by simulation we make our physics solvers more accessible to designers, who may be less technical and not expert in simulation, by wrapping them in powerful, yet simple interfaces. We are increasing our use of indirect channels to more efficiently address a broader set of customers in consumer products, electronics, energy and other industries.
Altair pioneered a patented units-based subscription licensing model for software and other digital content. This units-based subscription licensing model allows flexible and shared access to all of our offerings, along with over 150 partner products. Our customers license a pool of units for their organizations giving individual users access to our entire portfolio of software applications as well as our growing portfolio of partner products. We believe our units-based subscription licensing model lowers barriers to adoption, creates broad engagement, encourages users to work within our ecosystem, and increases revenue. This, in turn, helps drive our recurring software license rate which has been on average approximately 88% over the past five years. Each year approximately 60% of new software revenue comes from expansion within existing customers.
Software products
Altair’s software products, available under our HyperWorks, solidThinking, Altair PBS, and Carriots suites, represent a comprehensive, open architecture computer-aided engineering, or CAE, simulation platform. We believe our products offer the industry’s broadest set of technologies to design and optimize high performance, efficient, and innovative products. Our products are categorized by:
| • | Solvers & Optimization; |
| • | Modeling & Visualization; |
| • | Industrial & Concept Design; |
| • | Internet of Things; and |
| • | HPC. |
3
Table of Contents
Solvers & optimization
Solvers are mathematical software “engines” that use advanced computational algorithms to predict physical performance. Optimization leverages solvers to derive the most efficient solutions to meet desired complex multi-objective requirements.
Altair’s solvers are a comprehensive set of fast, scalable and reliable physics solvers that can solve complex problems in linear and non-linear mechanics, fluid dynamics, electromagnetics, motion, systems and manufacturing simulation.
Altair’s optimization technology is a key differentiator and spans our product offering. Our focus on optimization combined with multiphysics and multi-domain simulation has changed product development, and we believe customers using our technologies can gain a sustainable competitive advantage by developing better products in less time.
Modeling & visualization
Modeling & visualization tools allow for advanced physics attributes to be modeled and rendered on top of object geometry in high fidelity. These tools are becoming more design-centric and relevant earlier in the development process.
Industrial & concept design
Industrial & concept design tools that generate early concepts to address requirements for ergonomics, aesthetics, performance, and manufacturing feasibility. These tools are simulation-driven and, we believe, emerging as a market force eclipsing traditional computer-aided design, or CAD.
Internet of Things
Tools to develop new Internet of Things, or IoT, enabled products, including device and data management, system level and full three dimensional, or 3D, digital twin simulation, and exploration, predictive analysis, optimization, and visualization of in-service performance. We expect our tools for multidisciplinary simulation and development to become increasingly important for product design. Our software is used to design and optimize IoT devices and connectivity, and for modeling in-service product performance.
We believe Altair’s math and systems solutions are unique for their openness, usability, and ability to provide signal-based and physical modeling from “0D” to “3D” all within our units-based subscription licensing model. A truly simulation-driven design process means that simulation models support decision making in each stage of the product development process. To support this, models need to be multidisciplinary and may include mechanics, electrical and electronics, and software among other technical elements, and must encompass a scope of products ranging from components to IoT-enabled “systems of systems”. Varying degrees of fidelity aid the process where computational requirements or data availability might otherwise prove to be obstacles.
We believe a key strength to Altair’s math and systems solutions is allowing development organizations to move seamlessly in this multi-discipline, multi-component, multi-detail space while integrating models from various authoring tools. With a broad range of multi-physics solvers based on an open-system approach, a strong set of model reduction techniques can be employed toward IoT-enabled product development which can then be carried forward into device management and application development on the Carriots platform.
High-performance computing
HPC software applications designed to streamline the workflow management of compute-intensive tasks including solvers, optimization, modeling, visualization and analytics in fields such as Product Lifecycle Management, or PLM, weather modeling, bio-informatics and electronic design analysis.
Altair’s HPC offerings support engineers and scientists across a wide range of industries including automotive, aerospace, academia, energy, electronic design automation, defense, and weather. Altair PBS Works is our secure workload management suite to improve HPC performance and reliability in on-premise, cloud, and hybrid environments.
Our simulation technology users are moving to ever-larger models to achieve higher-fidelity results for more realistic simulations. As these models are computationally intensive, they require special equipment and cloud access for deeper design exploration and optimization. We believe HPC addresses the performance needs of our users and is critical to companies and research organizations working on complex, simulation-intensive design problems.
Altair Partner Alliance
The Altair Partner Alliance, or APA, provides access to a broad spectrum of complementary software products using customers’ existing HyperWorks Units. They can download and use partner product applications on-demand. This constantly growing portfolio extends their simulation and design capabilities to help create better products faster.
4
Table of Contents
Software products in the APA include technologies ranging from computational fluid dynamics and fatigue to manufacturing process simulation and cost estimation, with applications specific to industry verticals including marine, motorcycles, aerospace, chemicals, and architecture. Altair plans to continue to add valuable third-party software solutions to the HyperWorks platform to empower innovation with comprehensive enterprise analytic tools.
Software related services
To ensure customer success and deepen our relationships with them, we engage with our customers to provide services related to our software including consulting, training, and implementation services, especially when applying optimization. We provide clients with technical services throughout their entire product development lifecycle including design, engineering, and development. Altair’s headquarters includes an industrial design studio, a prototype shop, and test facilities. We have expertise designing and working with controls, power electronics, traditional and composite structures, and total system level development in the automotive, aerospace, consumer products and other markets.
Implementation and custom software services are available to help customers leverage their investment in Altair’s software to streamline CAE workflows and solve specialized industry vertical engineering problems. We work closely with our clients to increase organizational efficiency and decision making by tailoring these solutions to a client’s own environment and processes.
We believe the unique combination of our broad industry domain knowledge and software expertise has enabled Altair to enhance and replace customers’ legacy applications, integrate our software applications with client business systems, develop clean-sheet designs or custom software solutions, and transform their product development processes.
Client Engineering Services
Altair provides Client Engineering Services, to support our customers with long-term ongoing product design and development expertise. This has the benefit of embedding us within customers, deepening our understanding of their processes, and allowing us to more quickly perceive trends in the overall market. Our presence at our customers’ sites helps us to better tailor our software products’ R&D and sales initiatives.
We operate our CES business by hiring engineers for placement at a customer site for specific customer-directed assignments. We employ and pay the engineers only for the duration of the placement.
We concentrate on placing simulation specialists, industrial designers, design engineers, materials experts, development and test engineers, manufacturing engineers and information technology specialists. As a leader in the simulation market, Altair attracts high caliber talent from around the world. CES is focused on placements that align strategically with customer usage of our software. We have a strong recruiting operation with over ten sourcing specialists who identify, attract, vet, and hire technical professionals for our in-house and customer needs. We maintain a candidate database of over 80,000 highly qualified engineers and designers. Our CES candidates and placed employees are valuable sources of talent acquisition for Altair’s other business segments.
Research and development
Our research and development efforts are focused on enhancing the functionality, breadth and scalability of our software, addressing new use cases, and developing additional innovative simulation technologies. Timely development of new products is essential to maintaining our competitive position, and we release new versions of our software on a regular basis.
Customer feedback, combined with our roadmap, enables us to deliver long-term value and stay ahead of market trends. The majority of product enhancements and new capabilities added to our platform over the years have been developed internally, with acquisitions used to augment our capabilities with strategic technology.
Our research and development initiatives foster a culture of innovation within the organization, helping us attract and retain a highly motivated team. Altair’s research and development team consists of approximately 980 people worldwide. Most of our research and development team is based in Michigan and India; however, we also maintain research and development centers with specific technical expertise in other geographies. Research and development expenses were $93.2 million, $71.3 million, and $62.8 million in 2017, 2016 and 2015, respectively.
From time-to-time, we incubate related technologies developed by our employees. For example, we developed and patented next-generation solid-state lighting technology as a result of an internal initiative. We commercialized this technology under our toggled subsidiary, which generated $6.6 million in revenue in the twelve-month period ending December 31, 2017. WEYV, a mobile application that brings our patented units-based business model to digital content distribution and delivery, was released commercially in December 2017.
5
Table of Contents
Our research and development efforts relating to our software focus on five areas:
| • | Solvers & Optimization: Solvers are mathematical software “engines” that use advanced computational algorithms to simulate physics. Altair initially specialized in structural simulation, and now continuously develops our portfolio of solvers to simulate fluid dynamics, high and low frequency electromagnetics, mechanical systems, electronic controls and more. Altair also invests to “couple” our solvers to simulate multiple physics domains simultaneously, and is considered a world leader in the development of optimization technology, which drives solvers to find solutions to complex multi-objective design problems. R&D is also conducted to leverage high-performance computing technology for these compute intensive applications. Solver and optimization development is conducted by researchers with advanced degrees in engineering, physics, computer science and mathematics. |
| • | Modeling & Visualization: The graphical applications used to construct and visualize simulation models require continuous R&D in the areas of data structures, computational methods, graphics, geometric modeling, mesh generation, and user interface design. Altair’s modeling tools are becoming more design-centric and are adopting some of the capabilities of traditional CAD while leveraging simulation and optimization technology to drive design decisions rather than just simulate designs. Specific areas of R&D include handling large scale models of highly detailed and complex products, developing new methods to derive design geometry from optimizations, and unifying the modeling environment for multi-physics simulation. Adapting modeling and visualization technology for cloud deployment is also an area of active development as is supporting virtual and augmented reality hardware. |
| • | Industrial & Concept Design: Simulation-driven design requires tools to generate early concepts addressing requirements for ergonomics, aesthetics, performance, and manufacturing feasibility. These tools are simulation-driven, and we believe, emerging as a market force eclipsing traditional CAD. We believe Inspire is key to the democratization of simulation capabilities across large groups of designers and engineers who are not simulation specialists. Significant investment continues toward making the Inspire environment capable of providing most early design stage simulation needs. We expect to further integrate the visualization capabilities of Evolve and Thea Render across Altair’s product suites. The development teams for Industrial & Concept Design products include deep experience with industrial design processes and manufacturing methods. |
| • | IoT: The Internet of Things requires tools to enable development of products that sense, collect, and communicate information. Our IoT toolsets perform device and data management, system level and full 3D digital twin simulation, and allow exploration, predictive analysis, optimization, and visualization of in-service performance. Carriots, including our cloud data analytics technology, makes our tools for multidisciplinary simulation and development increasingly important for product design and in-service operating data. Designed for visualizing and exploring large data sets, we are currently enhancing Carriots to facilitate deployment of analytics apps by third party developers and linked to IoT stacks. |
Compose, Activate, and Embed support product development for the IoT through a math-based programming environment, multidisciplinary system modeling, and control system development and are an important ongoing research and development effort. We support our own high level matrix-based numerical computing language, as well as Python and Tcl, in an interactive programming environment for all types of math operations. We expect to add more language and library support, broaden the math libraries, and integrate these products more deeply with Altair’s other software.
| • | HPC: Altair’s acquisition and development of HPC software complements our compute intensive simulation and optimization technology. While investments continue in the core workload management technology, new areas of R&D include innovative workload simulation and resource optimization, a cloud-based user interface to facilitate the deployment and administration of HPC clusters, and the development of new web-based job submission, monitoring and management tools. The HPC development teams work closely with the modeling and visualization teams and IoT Analytics teams to ensure that Altair’s overall technology portfolio interoperates effectively and shares a common infrastructure and user experience. |
In order to maintain and extend our technology leadership and competitive position, we intend to continue devoting significant effort to our research and development activities.
Sales
We serve customers in the product lifecycle management, or PLM, market. Rising expectations of end-market customers, new manufacturing methods such as 3D printing, the ability to design and process composites and new materials, combined with more powerful math-based computational technologies, are expanding the application of simulation across many industry verticals and throughout product life-cycles. CAE software offers companies opportunities to achieve better, lower cost products with fewer physical prototypes and tests, and reduces the time required to bring products to market. We are also expanding our market reach to a broader set of customers in the Internet of Things, or IoT, and analytics market without experience in simulation and HPC.
We take our products to market in different combinations, through several packaged offerings, each having defined channels and pricing strategies. The product “suites” are HyperWorks, solidThinking, Altair PBS Works and Carriots.
6
Table of Contents
Product suites
HyperWorks
HyperWorks is a suite of software products which primarily targets simulation specialists and some test engineers at large enterprises, and users with deep technical needs at small and medium sized companies. HyperWorks Units, or HWUs, are an embodiment of our patented units-based subscription licensing model, and provide access to all of Altair’s more than 30 software products including those available in our solidThinking, Altair PBS Works, and Carriots suites, and all of the more than 150 APA products.
HyperWorks represents the majority of Altair’s revenue. To sell HyperWorks we primarily engage with our customers through our direct global sales force. Our sales teams interact with key information technology, or IT, decision makers, engage deeply with users of our products by leveraging a team of Altair’s technical specialists, and work with user-group managers and executives to ensure they are maximizing the utility of our HyperWorks suite. Resellers of HyperWorks are mainly in APAC and Eastern Europe. They are managed by our direct field offices.
solidThinking
solidThinking is a more recent suite offering, a subset of our HyperWorks products focused on industrial design, concept engineering, manufacturing feasibility, and model-based design. solidThinking primarily targets designers, engineers and architects at small and medium enterprises. Historically, solidThinking has been offered under a traditional licensing model. We are currently transitioning to a units-based subscription licensing model similar to HyperWorks.
solidThinking Inc. is a wholly owned subsidiary of Altair, created to market this suite through resellers who provide sales and first line support for these customers.
Altair PBS Works
Altair PBS Works is a suite of three products including, Altair PBS Professional, Altair PBS Access, and Altair PBS Cloud, targeting IT professionals, engineers, and scientists at commercial enterprises, universities and research institutes. Altair PBS Works optimizes the use of HPC to design products, predict weather, perform drug discovery research, calculate financial risk, and support other compute intensive work. Altair PBS Works licensing and support is generally on a per node and per user subscription basis.
Altair PBS Works is sold by Altair’s global strategic sales force with sales overlay support from Altair HPC sales specialists and application engineers. Some major HPC hardware companies bundle Altair PBS Works on new HPC computer systems. We offer Altair PBS Professional as both an open source and a commercial solution. Commercial sites generally license the commercial version along with support. However, many universities, government agencies and small commercial sites prefer the open source version as their work often needs to be freely available for societal benefit. Large government and research installations generally still purchase support and often pay for specific development.
In September 2017, the Company acquired Runtime Design Automation, or Runtime. Runtime complements Altair’s PBS Works suite of products for comprehensive, secure workload management for HPC and cloud environments and has solutions to manage highly complex workflows. We believe both Runtime and PBS Works deliver innovative and mission critical technology to optimize the use of HPC for compute-intensive applications. PBS Works targets product design, weather prediction, oil exploration and bio-informatics, and Runtime primarily serves customers in Electronic Design Automation, or EDA.
Carriots
In May 2017, the Company acquired Carriots S.L, or Carriots. Carriots helps customers enable their products to communicate via numerous standard protocols, perform device and data management, visualize and analyze big data, develop applications, and perform digital twin simulations. Carriots is an end-to-end and open architecture IoT platform. It complements Altair’s other product suites to provide a comprehensive solution for customers to design and implement IoT enabled products. The solution is designed with Altair’s open philosophy to facilitate seamless integration of its platform elements within customer enterprises to share data and communicate with multiple Enterprise Resource Planning, or ERP, simulation and communication systems.
Carriots is sold by our direct sales force, supported by an overlay team, to customers where we have longstanding relationships as well as to customers in some markets new to Altair. We also sell through resellers and implementation consultants who sell and support Carriots in markets where they are strong.
Carriots Analytics is designed to easily embed in other software products to provide analytics capabilities. We work with other software companies to implement Carriots Analytics in their applications focused on vertical domains where these companies have deep experience and customer relationships.
7
Table of Contents
Direct and indirect sales channels
Direct sales channels
Approximately 90% of our 2017 software revenue was generated through our direct global sales force. Our direct sales force is responsible for developing new customers, ensuring high recurring rates from our existing customers, and expanding the use of Altair and partner products within customers’ environments through continuous training, support, and consulting engagements. Each of our field sales professionals are supported by technical specialists with deep knowledge of our products and the broader product development domain. We believe this approach differentiates Altair from our competitors, as our focus on establishing a strong working relationship with the user community has led to expanded usage of Altair and partner products. Our direct sales force is organized by geographic regions, consisting of Americas, EMEA, and APAC.
Indirect sales channels
Approximately 9% of our 2017 software revenue was generated through our growing network of indirect channel partners and resellers. These companies are central to Altair’s software sales growth strategy by expanding our market reach to small and medium-sized customers. As of December 31, 2017, we had approximately 300 reseller and original equipment manufacturer, or OEM, relationships, including over 180 solidThinking resellers, primarily added in the last three years, and over 120 HyperWorks and Altair PBS resellers and OEMs. We are increasing our use of indirect channels in an effort to address a broader set of customers in consumer products, electronics, energy and other industries and expect the share of indirect channel sales to increase in the coming years.
To enable concept engineering driven by simulation we make our physics solvers more accessible to designers, who may be less technical and not expert in simulation, by wrapping them in powerful, yet simple interfaces. In addition to being available under the HyperWorks suite, these products are sold through resellers worldwide under the solidThinking brand.
solidThinking is sold by over 180 resellers worldwide. The solidThinking resellers in the Americas and EMEA are managed by the solidThinking corporate team, while in APAC these resellers are managed by Altair field offices. This channel is relatively new and beginning to produce meaningful results.
We have OEM arrangements for Altair PBS Works with most of the major HPC hardware companies when they sell new computer systems. We believe these arrangements reduce competition, grow our market share and improve sales efficiency.
Carriots is sold and supported by resellers and implementation consultants in markets where they are strong and have vertical domain expertise outside of Altair’s traditional manufacturing base. In addition to being available under HyperWorks, Carriots Analytics goes to market through OEM and strategic relationships worldwide including third party software companies seeking to embed analytics capabilities into their applications. We have established several key alliances in the utility and smart building controls markets.
Marketing
Altair’s global marketing team of approximately 65 people is focused on generating new business opportunities by driving awareness, deepening customer engagement, and developing content specific to technical fields and industry verticals. Our corporate marketing programs include social media, earned media, and publications including Concept to Reality magazine, blogs, white papers and case studies. Our regional marketing program supports working relationships with our user community through education, participation in local industry events, Altair technical conferences, and webinars.
We provide marketing support to our ecosystem of resellers and third-party technology partners on both a corporate and regional level.
In 2017 our online activities included approximately:
| • | 327,000 resource library video views; |
| • | 40,500 self-service training sessions; |
| • | 27,000 webinar registrations; |
| • | 48,000 software downloads; |
| • | 2.5 million website visitors; and |
| • | 93,000 social media followers. |
Approximately 7,400 customers and prospects attended Altair’s user conferences in 2017.
8
Table of Contents
In order to continue to drive growth and extend our market position, we intend to continue to invest significant resources into our marketing initiatives.
Customers
As of December 31, 2017, we had tens of thousands of users across approximately 5,000 customers worldwide. Our customers are primarily large manufacturing enterprises. We have a growing presence in small and mid-size companies and compete in markets beyond manufacturing including Architecture/Engineering/Construction, or AEC, energy, life and earth sciences, and government entities. In 2017, we generated 37%, 32% and 31% of our total billings from customers in the Americas, APAC, and EMEA, respectively. None of our customers accounted for more than 10% of our 2017 billings. Billings consists of our total revenue plus the change in our deferred revenue in a given period and is discussed under Key metrics included in Part II, Item 6, Selected Financial Data of this Annual Report on Form 10-K.
Automotive and aerospace combined account for over 50% of our 2017 software billings, including 15 out of 15 of the world’s leading automotive manufacturers and 10 out of 10 of the world’s leading aerospace manufacturers. Other important industries include heavy machinery, rail and ship design, energy, government, life and earth sciences, and consumer electronics. No single customer, nor any of our approximately 300 resellers and OEMS, accounted for more than 3% of our 2017 software billings.
For a summary of our financial information by geographic location, see Note 19 of Notes to consolidated financial statements in Item 15, Part IV of this Annual Report on Form 10-K, which is incorporated by reference.
Competition
The market for CAE software is highly fragmented but has been undergoing significant consolidation. Our primary competitors include Dassault Systèmes, Siemens, Ansys and MSC Software, a Hexagon company. Dassault and Siemens are large public companies, with significant financial resources, which have historically focused on CAD and product data management. More recently, these two companies have been investing in simulation software via acquisitions. Ansys and MSC are focused on CAE. In addition to these competitors, we compete with many smaller companies offering CAE software applications.
We believe the breadth and depth of Altair’s software offering is unique in the PLM industry. We also believe no single competitor addresses our entire solution set. Our integrated suite of software optimizes design performance across multiple disciplines encompassing structures (including crashworthiness and safety), motion, fluids, thermal management, electromagnetics, system modeling and embedded systems, while also providing data analytics and true-to-life visualization and rendering. The HyperWorks Units model further extends this advantage with a growing APA marketplace of third party software.
Our simulation solutions including modeling, visualization and solvers are noted in the market for their ability to handle large and complex models. Our software applications deliver high performance and high scalability, including massive parallelization, which is extremely important in the CAE market. Altair is a leader in integrating optimization technology across all our products including multi-disciplinary applications.
To ensure customer success and deepen our relationships with them, we engage with our customers to provide consulting, implementation services, training, and support, especially when applying optimization. We believe these services, combined with our ability to leverage HPC as the industry transitions to cloud computing, positions us for future success.
We compete on a variety of factors including the breadth, depth, performance, and quality of our technical solutions. We believe our patented units-based subscription licensing model provides us with a competitive advantage by lowering barriers to adoption, creating broad engagement, and encouraging users to work within our ecosystem.
Intellectual property
We believe that our intellectual property rights are valuable and important to our business. We actively protect our investment in technology through establishment and enforcement of intellectual property rights. We protect our intellectual property through a combination of patent, copyright, trademark and trade secret protections, confidentiality procedures, and contractual provisions. The nature and extent of legal protection associated with each such intellectual property right depends on, among other things, the type of intellectual property right and the given jurisdiction in which such right arises.
As of December 31, 2017, we, inclusive of our wholly-owned subsidiaries, have 165 issued patents and more than 80 published patent applications worldwide. These patents and patent applications seek to protect proprietary inventions relevant to our business. We intend to pursue additional patent protection to the extent we believe it would be beneficial and cost effective. Additionally, we are the registered holder of a variety of trademarks and domain names that include “Altair” and similar variations.
Nonetheless, our intellectual property rights may not be successfully asserted in the future or may be invalidated, circumvented or challenged. In addition, the laws and enforcement of the laws of various countries where our products are distributed do not protect our intellectual property rights to the same extent as United States laws. Our inability to assert or enforce our intellectual property rights could harm our business.
9
Table of Contents
From time to time, we receive claims alleging infringement of a third party’s intellectual property rights, including patents. Disputes involving our intellectual property rights or those of another party have in the past and may in the future lead to, among other things, costly litigation, diversion of time, money and resources to develop or obtain non-infringing products, or delay product distribution. Any significant impairment of our core intellectual property rights could harm our business or our ability to compete.
Our products are licensed to users pursuant to signed license agreements or ‘click through’ agreements containing restrictions on use, duplication, disclosure, and transfer. Cloud based products and associated services are provided to users pursuant to online or signed terms of service agreements containing appropriate restrictions on access and use.
We are unable to measure the full extent to which piracy of our software products exists. We believe, however, that software piracy is and can be expected to be a persistent problem that negatively impacts our revenue and financial results. We believe that our predominant subscription based business model combined with the change from desktop to cloud based computing will shift the incentives and means by which software is pirated.
In addition, through various licensing arrangements, we receive certain rights to intellectual property of others. We expect to maintain current licensing arrangements and to secure additional licensing arrangements in the future, as needed and to the extent available on reasonable terms and conditions, to support continued development and sales of our products and services. Some of these licensing arrangements require or may require royalty payments and other licensing fees. The amount of these payments and fees may depend on various factors, including but not limited to: the structure of royalty payments, offsetting considerations, if any, and the degree of use of the licensed technology.
Employees
As of December 31, 2017, we had over 2,000 in-house employees and over 400 on-site Client Engineering Service employees globally. Over two-thirds of our employees are located in the United States, India, France, Germany and China. None of our employees in the United States are represented by a labor organization or are party to any collective bargaining arrangement. In certain of the European countries in which we operate, we are subject to, and comply with, local labor law requirements in relation to the establishment of works councils. We are often required to consult and seek the consent or advice of these works councils. We have never experienced a work stoppage and we believe our employee relations are good.
Acquisitions
We acquired 20 companies or strategic technologies since 1996, including 12 in the last three years. These acquisitions brought strategic IP assets, and approximately 200 developers with expertise in disciplines ranging from electronics, material science, crash and safety to industrial design and rendering. Products which are commercially available as a result of these acquisitions include Click2Extrude, Altair PBS Professional, Radioss, Evolve, Acusolve, SimLab, Embed, Click2Cast, Multi-scale Designer, FEKO, FLUX, WinProp, Thea Render, Modeliis, Carriots, and ESAComp.
Our most recent acquisitions include the following:
| • | Runtime: In September 2017, we acquired Runtime Design Automation, which complements Altair’s PBS Works™ suite of products for comprehensive, secure workload management for HPS and cloud environments and has solutions to manage highly complex workflows. PBS Works targets product design, weather prediction, oil exploration and bio-informatics, and Runtime primarily serves customers in electronic design automation. |
| • | MODELiiS: In May 2017, we acquired strategic software technology from MODELiiS, a supplier of electronic design automation software for circuit modeling, system design and simulation tools, with solutions geared towards the Internet of Things (“IoT”), autonomous vehicles, and complex hybrid systems. |
| • | Carriots: In May 2017, we acquired Carriots S.L., an IoT Cloud platform that allows easy development of new IoT enabled products. Carriots complements Altair’s other product suites to provide a comprehensive solution for customers to design and implement IoT enabled products. |
| • | CEDRAT: In April 2016, we acquired CEDRAT S.A., which is in the field of simulating low-frequency electromagnetics and thermal simulations for electric motor design. The acquisition of CEDRAT and its Flux technology complements Altair’s broad software coverage, including Altair’s comprehensive set of solvers for the rapidly growing electromagnetic market. |
For further information about our acquisitions, see Note 4 of the Notes to consolidated financial statements in Item 15, Part IV of this Annual Report on Form 10-K.
10
Table of Contents
Seasonal variations
We have experienced and expect to continue to experience seasonal variations in the timing of customers’ purchases of our software and services. Many customers make purchase decisions based on their fiscal year budgets, which often coincide with the calendar year. These seasonal trends materially affect the timing of our cash flows, as license fees become due at the time the license term commences based upon agreed payment terms that customers may not adhere to. As a result, new and renewal licenses have been concentrated in the first and fourth quarter of the year, and our cash flows from operations have been highest late in the first quarter and early in the second quarter of the succeeding fiscal year.
Backlog
We generally enter into single year term-based software licensing subscription contracts for our solutions. The timing of our invoices to the customer is a negotiated term and thus varies among our subscription contracts. For multi-year agreements, it is common to invoice an initial amount at contract signing followed by subsequent annual invoices. At any point in the contract term, there can be amounts that we have not yet been contractually able to invoice. Until such time as these amounts are invoiced, they are not recorded in revenues, deferred revenue or elsewhere in our consolidated financial statements and are considered by us to be backlog. As we generally enter into single year subscription contracts for our platform, backlog is not significant.
Segments
We have identified two reportable segments: Software and Client Engineering Services. For additional information about our reportable segments, see Note 19 of the Notes to consolidated financial statements in Item 15, Part IV of this Annual Report on Form 10-K, which is incorporated by reference.
Corporate information
We were incorporated in Michigan in 1985 and became a Delaware company in October 2017. Our principal executive offices are located at 1820 E. Big Beaver Road, Troy, Michigan 48083.
Unless the context otherwise requires, the terms “Altair,” “the Company,” “we,” “us” and “our” in this Annual Report on Form 10-K refers to Altair Engineering Inc. and its subsidiaries. The Altair design logo and the marks “OptiStruct,” “RADIOSS,” “AcuSolve,” “FEKO,” “Flux,” “WinProp,” “Multiscale Designer,” “HyperStudy,” “HyperMesh,” “HyperView,” “SimLab,” “HyperCrash,” “HyperGraph,” “Inspire,” “solidThinking Evolve,” “Thea Render,” “Click2Cast,” “Click2Extrude,” “Click2Form,” “Carriots,” “solidThinking Compose,” “solidThinking Activate,” “solidThinking Embed,” “Altair PBS Works,” “Altair PBS Professional,” “Altair PBS Cloud,” “MotionView,” “MotionSolve,” “Altair PBS Access” and our other registered or common law trade names, trademarks or service marks appearing in this Annual Report on Form 10-K are our property.
Available information
We file annual reports on Form 10-K, quarterly reports on Form 10-Q, current reports on Form 8-K, proxy and information statements and amendments to reports filed or furnished pursuant to Sections 13(a), 14 and 15(d) of the Securities Exchange Act of 1934, as amended. The public may obtain these filings at the Securities and Exchange Commission Public Reference Room at 100 F Street, NE, Washington, DC 20549 or by calling the SEC at 1-800-SEC-0330. The SEC also maintains a website at http://www.sec.gov that contains reports, proxy and information statements and other information regarding Altair Engineering Inc. and other companies that file materials with the SEC electronically. Copies of Altair’s reports on Form 10-K, Forms 10-Q and Forms 8-K, may be obtained, free of charge, electronically through our internet website, http://investor.altair.com under the Financials tab.
Our website is www.altair.com. Investors and others should note that we announce material financial information to investors using press releases, SEC filings and public conference calls. The information contained on our website is not incorporated by reference into this Annual Report on Form 10-K or in any other report or document we file with the SEC.
11
Table of Contents
An investment in our Class A common stock involves a high degree of risk. You should carefully consider the risks and uncertainties described below, together with all the other information in this Annual Report on Form 10-K, including “Management’s Discussion and Analysis of Financial Condition and Results of Operations” and the consolidated financial statements and the related notes. If any of the following risks actually occurs, our business, reputation, financial condition, results of operations, revenue, and future prospects could be seriously harmed. Unless otherwise indicated, references to our business being seriously harmed in these risk factors will include harm to our business, reputation, financial condition, results of operations, revenue, and future prospects.
Risks relating to our business and industry
We have experienced significant revenue growth and we may fail to sustain that growth rate or may not grow in the future.
We were founded in 1985 and launched our first commercial software in 1990. Our growth has primarily been attributed to the increasing reliance of manufacturers on our simulation and optimization software to support development of their products and designs. Revenue from our software segment has historically constituted a significant portion of our total revenue. Our revenue growth could decline over time as a result of a number of factors, including increasing competition from smaller entities and well-established, larger organizations, limited ability to, or our decision not to, increase pricing, contraction of our overall market or our failure to capitalize on growth opportunities. Other factors include managing our global organization, revenues generated outside the United States that are subject to adverse currency fluctuations and uncertain international geopolitical landscapes. Accordingly, we may not achieve similar growth rates in future periods, and you should not rely on our historical revenue growth as an indication of our future revenue or revenue growth.
If we cannot maintain our company culture of innovation, teamwork, and communication our business may be harmed.
We believe that a critical component to our success has been our company culture, which is based on our core values of innovation, envisioning the future, communicating honestly and broadly, seeking technology and business firsts, and embracing diversity. We have invested substantial time and resources in building a company embodying this culture. As we develop the infrastructure of a public company and continue to grow, we may find it difficult to maintain these valuable aspects of our corporate culture. Any failure to preserve our culture could negatively impact our future success, including our ability to attract and retain personnel, encourage innovation and teamwork, and effectively focus on and pursue our corporate objectives.
If our existing customers or users do not increase their usage of our software, or we do not add new customers, the growth of our business may be harmed.
Our software includes a multitude of broad and deep design, simulation, optimization, and analysis applications and functionalities.
Our future success depends, in part, on our ability to increase the:
| • | number of customers and users accessing our software; |
| • | usage of our software to address expanding design, engineering, computing and analytical needs; and/or |
| • | number of our applications and functionalities accessed by users and customers through our licensing model. |
In addition, through our Altair Partner Alliance, or APA, our customers have access to additional software offered by independent third parties, without the need to enter into additional license agreements.
If we fail to increase the number of customers or users and/or application usage among existing users of our software and the software of our APA partners, our ability to license additional software will be adversely affected, which would harm our operating results and financial condition.
Our ability to acquire new customers is difficult to predict because our software sales cycle can be long.
Our ability to increase revenue and maintain or increase profitability depends, in part, on widespread acceptance of our software by mid- to- large-size organizations worldwide. We face long, costly, and unpredictable sales cycles. As a result of the variability and length of the sales cycle, we have only a limited ability to forecast the timing of sales. A delay in or failure to complete sales could harm our business and financial results, and could cause our financial results to vary significantly from period to period. Our sales cycle varies widely, reflecting differences in potential customers’ decision-making processes, procurement requirements and budget cycles, and is subject to significant risks over which we have little or no control, including:
| • | longstanding use of competing products and hesitancy to change; |
| • | customers’ budgetary constraints and priorities; |
12
Table of Contents
| • | timing of customers’ budget cycles; |
| • | need by some customers for lengthy evaluations; |
| • | hesitation to adopt new processes and technologies; |
| • | length and timing of customers’ approval processes; and |
| • | development of software by our competitors perceived to be equivalent or superior to our software. |
To the extent any of the foregoing occur, our average sales cycle may increase and we may have difficulty acquiring new customers.
Reduced spending on product design and development activities by our customers may negatively affect our revenues.
Our revenues are largely dependent on our customers’ overall product design and development activities, particularly demand from mid- to- large-size organizations worldwide and their supplier base. The licensing of our software is discretionary. Our customers may reduce their research and development budgets, which could cause them to reduce, defer, or forego licensing of our software. To the extent licensing of our software is perceived by existing and potential customers to be extraneous to their needs, our revenue may be negatively affected by our customers’ delays or reductions in product development research and development spending. Customers may delay or cancel software licensing or seek to lower their costs. Deterioration in the demand for product design and development software for any reason would harm our business, operating results, and financial condition in the future.
Our business largely depends on annual renewals of our software licenses.
We typically license our software to our customers on an annual basis. In order for us to maintain or improve our operating results, it is important that our customers renew and/or increase the amount of software licensed on an annual basis. Customer renewal rates may be affected by a number of factors, including:
| • | our pricing or license term and those of our competitors; |
| • | our reputation for performance and reliability; |
| • | new product releases by us or our competitors; |
| • | customer satisfaction with our software or support; |
| • | consolidation within our customer base; |
| • | availability of comparable software from our competitors; |
| • | effects of global or industry specific economic conditions; |
| • | our customers’ ability to continue their operations and spending levels; and |
| • | other factors, a number of which are beyond our control. |
If our customers fail to renew their licenses or renew on terms that are less beneficial to us, our renewal rates may decline or fluctuate, which may harm our business.
We believe our future success will depend, in part, on the growth in demand for our software by customers other than simulation engineering specialists and in additional industry verticals.
Historically, our customers have been simulation engineering specialists. To enable concept engineering, driven by simulation, we make our physics solvers more accessible to designers by wrapping them in powerful simple interfaces. We believe our future success will depend, in part, on growth in demand for our software by these designers, which could be negatively impacted by the lack of:
| • | continued and/or growing reliance on software to optimize and accelerate the design process; |
| • | adoption of simulation technology by designers other than simulation engineering specialists; |
| • | continued proliferation of mobility, large data sets, cloud computing and IoT; |
| • | our ability to predict demands of designers other than simulation engineering specialists and achieve market acceptance of our products within these additional areas and customer bases or in additional industry verticals; or |
| • | our ability to respond to changes in the competitive landscape, including whether our competitors establish more widely adopted products for designers other than simulation engineering specialists. |
If some or all of this software does not achieve widespread adoption, our revenues and profits may be adversely affected.
13
Table of Contents
We face significant competition, which may adversely affect our ability to add new customers, retain existing customers, and grow our business.
The market for CAE software is highly fragmented but has been undergoing significant consolidation. Our primary competitors include Dassault Systèmes, Siemens, Ansys and MSC Software, a Hexagon company. Dassault and Siemens are large public companies, with significant financial resources, which have historically focused on CAD and product data management. More recently, these two companies have been investing in simulation software through acquisitions. Ansys and MSC are focused on CAE. In addition to these competitors, we compete with many smaller companies offering CAE software applications.
A significant number of companies have developed or are developing software and services that currently, or in the future may, compete with some or all of our software and services. We may also face competition from participants in adjacent markets, including two-dimensional, or 2D, and 3D, CAD, and broader PLM competitors that may enter our markets by leveraging related technologies and partnering with or acquiring other companies.
The principal competitive factors in our industry include:
| • | breadth, depth and integration of software; |
| • | domain expertise of sales and technical support personnel; |
| • | consistent global support; |
| • | performance and reliability; and |
| • | price. |
Many of our current and potential competitors have longer-term and more extensive relationships with our existing and potential customers that provide them with an advantage in competing for business with those customers. They may be able to devote greater resources to the development and improvement of their offerings than we can. These competitors could incorporate additional functionality into their competing products from their wider product offerings or leverage their commercial relationships in a manner that uses product bundling or closed technology platforms to discourage enterprises from purchasing our applications.
Many existing and potential competitors enjoy competitive advantages over us, such as:
| • | larger sales and marketing budgets and resources; |
| • | access to larger customer bases, which often provide incumbency advantages; |
| • | broader global distribution and presence; |
| • | greater resources to make acquisitions; |
| • | the ability to bundle competitive offerings with other software and services; |
| • | greater brand recognition; |
| • | lower labor and development costs; |
| • | greater levels of aggregate investment in research and development; |
| • | larger and more mature intellectual property portfolios; and |
| • | greater financial, technical, management and other resources. |
These competitive pressures in our markets or our failure to compete effectively may result in fewer customers, price reductions, licensing of fewer units, increased sales and marketing expenses, reduced revenue and gross profits and loss of market share. Any failure to address these factors could harm our business.
Because we derive a substantial portion of our revenues from customers in the automotive industry, we are susceptible to factors affecting this industry.
The automotive industry accounted for approximately 50% of our total revenue for the year ended December 31, 2017. An adverse occurrence, including industry slowdown, recession, political instability, costly or constraining regulations, excessive inflation, prolonged disruptions in one or more of our customers’ production schedules or labor disturbances, that results in significant decline in the volume of sales in this industry, or in an overall downturn in the business and operations of our customers in this industry, could adversely affect our business.
The automotive industry is highly cyclical in nature and sensitive to changes in general economic conditions, consumer preferences and interest rates. Any weakness in demand in this industry, the insolvency of a manufacturer or suppliers, or constriction of credit markets may cause our automotive customers to reduce their amount of software licensed or services requested or request discounts or extended payment terms, any of which may cause fluctuations or a decrease in our revenues and timing of cash flows.
14
Table of Contents
Our quarterly results may fluctuate significantly and may not fully reflect the underlying performance of our business.
Our quarterly results of operations and our key metrics, including billings, Adjusted EBITDA and Free Cash Flow may vary significantly in the future. Period-to-period comparisons of our operating results may not be meaningful. The results of any one quarter should not be relied upon as an indication of future performance. Our quarterly financial results and key metrics may fluctuate as a result of a variety of factors including:
| • | our ability to retain and/or increase sales to existing customers at various times; |
| • | our ability to attract new customers; |
| • | the addition or loss of large customers, including through their acquisitions or industry consolidations; |
| • | the timing of recognition of revenues; |
| • | the amount and timing of billings; |
| • | the amount and timing of operating expenses and capital expenditures; |
| • | significant security breaches, technical difficulties or unforeseen interruptions to the functionality of our software; |
| • | the number of new employees added; |
| • | the amount and timing of billing for professional services engagements; |
| • | the timing and success of new products, features, enhancements or functionalities introduced by us or our competitors; |
| • | changes in our pricing policies or those of our competitors; |
| • | changes in the competitive dynamics of our industry, including consolidation among competitors; |
| • | the timing of expenses related to the development or acquisition of technology; |
| • | any future charges for impairment of goodwill from acquired companies; |
| • | extraordinary expenses such as litigation or other dispute-related settlement payments; |
| • | the impact of new accounting pronouncements; and |
| • | general economic conditions. |
Billings have historically been highest in the first and fourth quarters of any calendar year and may vary in future quarters. This seasonality or the occurrence of any of the factors above may cause our results of operations to vary and our financial statements may not fully reflect the underlying performance of our business.
In addition, we may choose to grow our business for the long-term rather than to optimize for profitability or cash flows for a particular shorter-term period. If our quarterly results of operations fall below the expectations of investors or securities analysts the price of our Class A common stock could decline and we could face lawsuits, including securities class action suits.
Seasonal variations in the purchasing patterns of our customers may lead to fluctuations in the timing of our cash flows.
We have experienced and expect to continue to experience seasonal variations in the timing of customers’ purchases of our software and services. Many customers make purchase decisions based on their fiscal year budgets, which often coincide with the calendar year. These seasonal trends materially affect the timing of our cash flows, as license fees become due at the time the license term commences based upon agreed payment terms that customers may not adhere to. As a result, new and renewal licenses have been concentrated in the first and fourth quarter of the year, and our cash flows from operations have been highest late in the first quarter and early in the second quarter of the succeeding fiscal year.
In connection with the preparation of our consolidated financial statements in recent years, we and our independent registered public accounting firm identified material weaknesses in our internal control over financial reporting. If we are not able to remediate the material weaknesses and otherwise maintain an effective system of internal control over financial reporting, the reliability of our financial reporting, investor confidence in us and the value of our common stock could be adversely affected.
As a public company, we are required to maintain internal control over financial reporting and to report any material weaknesses in such internal controls. Section 404 of SOX, or Section 404, requires that we evaluate and determine the effectiveness of our internal controls over financial reporting and, beginning with our annual report for the year ending December 31, 2018, provide a management report on internal control over financial reporting. A material weakness is a deficiency, or combination of deficiencies, in internal control over financial reporting such that there is a reasonable possibility that a material misstatement of annual or interim financial statements will not be prevented or detected and corrected on a timely basis.
15
Table of Contents
In connection with the preparation of fiscal years 2015, 2016 and 2017 financial statements, we and our independent registered public accounting firm identified two material weaknesses in our internal controls over financial reporting. The first material weakness pertained to controls over accounting for income taxes. Specifically, that: (i) certain misstatements were either not identified by management or were not identified timely by management; and (ii) additional technical resources were necessary to enable timely and sufficient review controls over accounting for income taxes. We have taken steps to remediate this by hiring additional technical resources and increasing management review and oversight over the income tax process.
The second material weakness pertained to our internal controls over the financial statement close process were not designed to be precise enough to detect a material error in the financial statements in a timely manner. Specifically, certain misstatements were either not identified by management or were not identified timely by management. We have taken steps to remediate this material weakness, by hiring additional personnel and increasing management review and oversight over the financial statement close process.
If our steps are insufficient to successfully remediate the material weaknesses and otherwise establish and maintain an effective system of internal control over financial reporting, the reliability of our financial reporting, investor confidence in us and the value of our common stock could be materially and adversely affected. The process of designing and implementing internal control over financial reporting required to comply with Section 404 will be time consuming, costly and complicated. Our independent registered public accounting firm was not engaged to audit the effectiveness of our internal control over financial reporting. We may discover other control deficiencies in the future, and we cannot assure you that we will not have a material weakness in future periods.
Effective internal control over financial reporting is necessary for us to provide reliable and timely financial reports and, together with adequate disclosure controls and procedures, are designed to reasonably detect and prevent fraud. Any failure to implement required new or improved controls, or difficulties encountered in their implementation could cause us to fail to meet our reporting obligations.
For as long as we are an “emerging growth company” under the Jumpstart Our Business Startups Act of 2012, or the JOBS Act, our independent registered public accounting firm will not be required to attest to the effectiveness of our internal control over financial reporting pursuant to Section 404. We will remain an emerging growth company until the earliest of (i) the end of the fiscal year in which the market value of our common stock that is held by non-affiliates exceeds $700 million as of June 30, (ii) the end of the fiscal year in which we have total annual gross revenues of $1.07 billion or more during such fiscal year, (iii) the date on which we issue more than $1.0 billion in non-convertible debt in a three-year period or (iv) December 31, 2022. The market value of common stock held by non-affiliates may be greater than $700 million by June 30, 2018. Should this occur, we will no longer qualify for the various exemptions available to emerging growth companies, including the exemption from the auditor attestation requirement under Section 404(b), as of December 31, 2018. An independent assessment of the effectiveness of our internal control over financial reporting could detect problems that our management’s assessment might not. Undetected material weaknesses in our internal control over financial reporting could lead to financial statement restatements and require us to incur the expense of remediation.
Fluctuations in foreign currency exchange rates could result in declines in our reported revenue and operating results.
As a result of our international activities, we have revenue, expenses, cash, accounts receivable and payment obligations denominated in foreign currencies including Euros, British Pounds Sterling, Indian Rupees, Japanese Yen, and Chinese Yuan. Foreign currency risk arises primarily from the net difference between non-United States dollar receipts from customers and non-United States dollar operating expenses. The value of foreign currencies against the United States dollar can fluctuate significantly, and those fluctuations may occur quickly. We cannot predict the impact of future foreign currency fluctuations.
Further strengthening of the United States dollar could cause our software to become relatively more expensive to some of our customers leading to decreased sales and a reduction in billings and revenue not denominated in United States dollars. A reduction in revenue or an increase in operating expenses due to fluctuations in foreign currency exchange rates could have an adverse effect on our financial condition and operating results. Such foreign currency exchange rate fluctuations may make it more difficult to detect underlying trends in our business and operating results.
We do not currently, and do not have plans to, engage in currency hedging activities to limit the risk of exchange rate fluctuations. In the future, we may use derivative instruments, such as foreign currency forward and option contracts, to hedge certain exposures to fluctuations in foreign currency exchange rates. The use of such hedging activities may not offset any or more than a portion of the adverse financial effects of unfavorable movements in foreign exchange rates over the limited time the hedges are in place, and the cost of those hedging techniques may have a significant negative impact on our operating results. The use of hedging instruments may introduce additional risks if we are unable to structure effective hedges with such instruments. If we are not able to successfully manage or hedge against the risks associated with currency fluctuations, our financial condition and operating results could be adversely affected.
16
Table of Contents
If we fail to attract new or retain existing third party independent software vendors to participate in the APA, we may not be able to grow the APA program.
The APA program allows our customers to use third party software that may be unrelated to our software, without the need to enter into additional license agreements. The APA program results in increased revenues through revenue sharing, and encourages users to stay within the Altair software ecosystem. If third party software providers are unwilling to join the APA on appropriate terms, including agreeing with our revenue share allocations, or if we are unable to retain our current APA participants, we may not be able to grow the APA program.
Licensing of our solidThinking software is dependent on performance of our distributors and resellers.
We have historically licensed our software primarily through our direct sales force. Our solidThinking offerings are primarily licensed through a recently expanded network of distributors and resellers. If these distributors and resellers become unstable, financially insolvent, or otherwise do not perform as we expect, our revenue growth derived from solidThinking could be negatively impacted.
If we fail to adapt to technology changes our software may become less marketable, less competitive, or obsolete.
Our success depends in part on our ability to:
| • | anticipate customer needs; |
| • | foresee changes in technology, including to cloud-enabled hardware, software, networking, browser and database technologies; |
| • | differentiate our software; |
| • | maintain operability of our software with changing technology standards; and |
| • | develop or acquire additional or complementary technologies. |
We may not be able to develop or market new or enhanced software in a timely manner, which could result in our software becoming less marketable, less competitive, or obsolete.
We believe our long-term value as a company will be greater if we focus on growth, which may negatively impact our profitability in the near term.
Part of our business strategy is to focus on our long-term growth. As a result, our profitability may be lower in the near term than it would be if our strategy was to maximize short-term profitability. Expanding our research and development efforts, sales and marketing efforts, infrastructure and other such investments may not ultimately grow our business or cause higher long-term profitability. If we are ultimately unable to achieve greater profitability at the level anticipated by analysts and our stockholders, our Class A common stock price may decline.
Our research and development may not generate revenue or yield expected benefits.
A key element of our strategy is to invest significantly in research and development to create new software and enhance our existing software to address additional applications and serve new markets. Research and development projects can be technically challenging and expensive, and there may be delays between the time we incur expenses and the time we are able to generate revenue, if any. Anticipated customer demand for any software we may develop could decrease after the development cycle has commenced, and we could be unable to avoid costs associated with the development of any such software. If we expend a significant amount of resources on research and development and our efforts do not lead to the timely introduction or improvement of software that is competitive in our current or future markets, it could harm our business.
Our continued innovation may not generate revenue or yield expected benefits.
As a business focused on innovation, we expect to continue developing new software and products both internally and through acquisitions. These offerings may focus either on our existing markets or other markets in which we see opportunities. We may not receive revenue from these investments sufficient to either grow our business or cover the related development or acquisition costs.
If we lose our senior executives, we may be unable to achieve our business objectives.
We currently depend on the continued services and performance of James Scapa, our chief executive officer, and other senior executives. Many members of this executive team have served the Company for more than 15 years, with Mr. Scapa having served since our founding in 1985. Loss of Mr. Scapa’s services or those of other senior executives could delay or prevent the achievement of our business objectives.
If we are unable to attract and retain key personnel, we may be unable to achieve our business objectives.
Our business is dependent on our ability to attract and retain highly skilled software engineers, salespeople, and support teams. There is significant industry competition for these individuals. We have many employees whose equity awards in our company are fully vested and may increase their personal wealth after giving effect to our offering, which could affect their decision to remain with the Company. Failure to attract or retain key personnel could delay or prevent the achievement of our business objectives.
17
Table of Contents
Defects or errors in our software could result in loss of revenue or harm to our reputation.
Our software is complex and, despite extensive testing and quality control, may contain undetected or perceived bugs, defects, errors, or failures. From time to time we have found defects or errors in our software and we may discover additional defects in the future. We may not find defects or errors in new or enhanced software before release and these defects or errors may not be discovered by us or our customers until after they have used the software. We have in the past issued, and may in the future need to issue, corrective releases or updates of our software to remedy bugs, defects and errors or failures. The occurrence of any real or perceived bugs, defects, errors, or failures could result in:
| • | lost or delayed market acceptance of our software; |
| • | delays in payment to us by customers; |
| • | injury to our reputation; |
| • | diversion of our resources; |
| • | loss of competitive position; |
| • | claims by customers for losses sustained by them; |
| • | breach of contract claims or related liabilities; |
| • | increased customer support expenses or financial concessions; and |
| • | increased insurance costs. |
Any of these problems could have a material adverse effect on our business, financial position, results of operations and cash flows.
Acquisitions may dilute our stockholders, disrupt our core business, divert our resources, or require significant management attention.
Most of our software has been developed internally with acquisitions used to augment our capabilities. We may not effectively identify, evaluate, integrate, or use acquired technology or personnel from future acquisitions, or accurately forecast the financial impact of an acquisition, including accounting charges.
After the completion of an acquisition, it is possible that our valuation of such acquisition for purchase price allocation purposes may change compared to initial expectations and result in unanticipated write-offs or charges, impairment of our goodwill, or a material change to the fair value of the assets and liabilities associated with a particular acquisition.
We may pay cash, incur debt, or issue equity securities to fund an acquisition. The payment of cash will decrease available cash. The incurrence of debt would likely increase our fixed obligations and could subject us to restrictive covenants or obligations. The issuance of equity securities would likely be dilutive to our stockholders. We may also incur unanticipated liabilities as a result of acquiring companies. Future acquisition activity may disrupt our core business, divert our resources, or require significant management attention.
Failure to protect and enforce our proprietary technology and intellectual property rights could substantially harm our business.
The success of our business depends, in part, on our ability to protect and enforce our proprietary technology and intellectual property rights, including our trade secrets, patents, trademarks, copyrights, and other intellectual property. We attempt to protect our intellectual property under trade secret, patent, trademark, and copyright laws. Despite our efforts, we may not be able to protect our proprietary technology and intellectual property rights, if we are unable to enforce our rights or if we do not detect unauthorized use of our intellectual property. It may be possible for unauthorized third parties to copy our technology and use information that we regard as proprietary to create products and services that compete with ours. Provisions in our licenses protect against unauthorized use, copying, transfer and disclosure of our technology, but such provisions may be difficult to enforce or are unenforceable under the laws of certain jurisdictions and countries. The laws of some countries do not protect proprietary rights to the same extent as the laws of the United States. Our international activities expose us to unauthorized copying and use of our technology and proprietary information.
We primarily rely on our unpatented proprietary technology and trade secrets. Despite our efforts to protect our proprietary technology and trade secrets, unauthorized parties may attempt to misappropriate, reverse engineer or otherwise obtain and use them. The contractual provisions that we enter into with employees, consultants, partners, vendors and customers may not be sufficient to prevent unauthorized use or disclosure of our proprietary technology or trade secrets and may not provide an adequate remedy in the event of unauthorized use or disclosure of our proprietary technology or trade secrets.
18
Table of Contents
Policing unauthorized use of our technologies, software and intellectual property is difficult, expensive and time-consuming, particularly in countries where the laws may not be as protective of intellectual property rights as those in the United States and where mechanisms for enforcement of intellectual property rights may be weak. We may be unable to detect or determine the extent of any unauthorized use or infringement of our software, technologies or intellectual property rights.
From time to time, we may need to engage in litigation or other administrative proceedings to protect our intellectual property rights or to defend against allegations by third parties that we have infringed or misappropriated their intellectual property rights, including in connection with requests for indemnification by our customers who may face such claims. We have been approached and may be approached in the future by certain of our customers to indemnify them against third party intellectual property claims. Litigation and/or any requests for indemnification by our customers could result in substantial costs and diversion of resources and could negatively affect our business and revenue. If we are unable to protect and enforce our intellectual property rights, our business may be harmed.
Intellectual property disputes could result in significant costs and harm our business.
Intellectual property disputes may occur in the markets in which we compete. Many of our competitors are large companies with significant intellectual property portfolios, which they may use to assert claims of infringement, misappropriation or other violations of intellectual property rights against us, or our customers. Any allegation of infringement, misappropriation or other violation of intellectual property rights by a third party, even those without merit, could cause us to incur substantial costs defending against the claim, could distract our management from our business, and could cause uncertainty among our customers or prospective customers, all of which could have an adverse effect on our business or revenue. We are currently engaged in ongoing litigation with MSC, a competitor of ours, who brought suit against us in 2007 alleging misappropriation of trade secrets, breach of confidentiality and other employment-related claims. A jury returned a verdict against us in April 2014. After a successful challenge by us in November 2014, this verdict was partially vacated except for damages for $425,000 related to certain employment matters and the court ordered a new trial on damages for the trade secrets claims. On August 21, 2017, the court granted Altair’s motion to strike the testimony of MSC’s damage expert. On October 11, 2017, the court mooted the remaining pre-trial motions and allowed us to file a motion for summary judgment on the issue of whether MSC can prove damages. On December 13, 2017, the court granted us summary judgment and dismissed MSC’s claim of trade secret misappropriation. On January 5, 2018, MSC filed a notice of appeal of the final judgement entered on December 13, 2017 and prior orders in this action to the Sixth Circuit Court of Appeals. On January 19, 2018, Altair filed a cross-appeal. No briefing schedule or argument date has been set by the Appeals Court. We cannot be certain of the outcome of this matter. We agreed to indemnify our employees named in the MSC litigation.
Our agreements may include provisions that require us to indemnify others for losses suffered or incurred as a result of our infringement of a third party’s intellectual property rights infringement, including certain of our employees and customers.
An adverse outcome of a dispute or an indemnity claim may require us to:
| • | pay substantial damages; |
| • | cease licensing our software or portions of it; |
| • | develop non-infringing technologies; |
| • | acquire or license non-infringing technologies; and |
| • | make substantial indemnification payments. |
Any of the foregoing or other damages could harm our business, decrease our revenue, increase our expenses or negatively impact our cash flow.
Security breaches, computer malware, computer hacking attacks and other security incidents could harm our business, reputation, brand and operating results.
Security incidents have become more prevalent across industries and may occur on our systems. Security incidents may be caused by, or result in but are not limited to, security breaches, computer malware or malicious software, computer hacking, unauthorized access to confidential information, denial of service attacks, security system control failures in our own systems or from vendors we use, email phishing, software vulnerabilities, social engineering, sabotage and drive-by downloads. Such security incidents, whether intentional or otherwise, may result from actions of hackers, criminals, nation states, vendors, employees or customers.
We may experience disruptions, data loss, outages and other performance problems on our systems due to service attacks, unauthorized access or other security related incidents. Any security breach or loss of system control caused by hacking, which involves efforts to gain unauthorized access to information or systems, or to cause intentional malfunctions or loss, modification or corruption of data, software, hardware or other computer equipment and the inadvertent transmission of computer malware could harm our business.
19
Table of Contents
In addition, our software stores and transmits customers’ confidential business information in our facilities and on our equipment, networks and corporate systems. Security incidents could expose us to litigation, remediation costs, increased costs for security measures, loss of revenue, damage to our reputation and potential liability. Our customer data and corporate systems and security measures may be compromised due to the actions of outside parties, employee error, malfeasance, capacity constraints, a combination of these or otherwise and, as a result, an unauthorized party may obtain access to our data or our customers’ data. Outside parties may attempt to fraudulently induce our employees to disclose sensitive information in order to gain access to our customers’ data or our information. We must continuously examine and modify our security controls and business policies to address new threats, the use of new devices and technologies, and these efforts may be costly or distracting.
Because the techniques used to obtain unauthorized access, disable or degrade service, or sabotage systems change frequently or may be designed to remain dormant until a predetermined event and often are not recognized until launched against a target, we may be unable to anticipate these techniques or implement sufficient control measures to defend against these techniques. Though it is difficult to determine what harm may directly result from any specific incident or breach, any failure to maintain confidentiality, availability, integrity, performance and reliability of our systems and infrastructure may harm our reputation and our ability to retain existing customers and attract new customers. If an actual or perceived security incident occurs, the market perception of the effectiveness of our security controls could be harmed, our brand and reputation could be damaged, we could lose customers, and we could suffer financial exposure due to such events or in connection with remediation efforts, investigation costs, regulatory fines and changed security control, system architecture and system protection measures.
Adverse global conditions, including economic uncertainty, may negatively impact our financial results.
Global conditions, including the effects of the outcome of the United Kingdom’s referendum on membership in the European Union or any negative financial impacts affecting United States corporations operating on a global basis as a result of tax reform or changes to existing trade agreements or tax conventions, could adversely impact our business in a number of ways, including longer sales cycles, lower prices for our software license fees, reduced licensing renewals or foreign currency fluctuations.
During challenging economic times our customers may be unable or unwilling to make timely payments to us, which could cause us to incur increased bad debt expenses. Our customers may unilaterally extend the payment terms of our invoices, adversely affecting our short-term or long-term cash flows.
International operations expose us to risks inherent in international activities.
Operating in international markets requires significant resources and management attention and subjects us to regulatory, economic and political risks that are different from those in the United States. We face risks in doing business internationally that could adversely affect our business, including:
| • | the need to localize and adapt our software for specific countries, including translation into foreign languages and associated expenses; |
| • | foreign exchange risk; |
| • | import and export restrictions and changes in trade regulation, including uncertainty regarding renegotiation of international trade agreements and partnerships; |
| • | sales and customer service challenges associated with operating in different countries; |
| • | enhanced difficulties of integrating any foreign acquisitions; |
| • | difficulties in staffing and managing foreign operations and working with foreign partners; |
| • | different pricing environments, longer sales cycles, longer accounts receivable payment cycles, and collections issues; |
| • | compliance challenges related to the complexity of multiple, conflicting and changing governmental laws and regulations, including the Foreign Corrupt Practices Act of 1977, or the FCPA, employment, ownership, tax, privacy and data protection laws and regulations; |
| • | limitations on enforcement of intellectual property rights; |
| • | more restrictive or otherwise unfavorable government regulations; |
| • | increased financial accounting and reporting burdens and complexities; |
| • | restrictions on the transfer of funds; |
| • | withholding and other tax obligations on remittance and other payments made by our subsidiaries; and |
| • | unstable regional, economic and political conditions. |
20
Table of Contents
Our inability to manage any of these risks successfully, or to comply with these laws and regulations, could reduce our sales and harm our business.
We may lose customers if our software does not work seamlessly with our customers’ existing software.
Our customers may use our software, which in many instances has been designed to seamlessly interface with software from some of our competitors, together with their own software and software they license from third parties. If our software ceases to work seamlessly with our customers’ existing software applications, we may lose customers.
Our customers use our software and services to design and develop their products, which when built and used may expose us to claims.
Many of our customers use our software and services, together with software and services from other third parties and their own resources, to assist in the design and development of products intended to be used in a commercial setting. To the extent our customers design or develop a product that results in potential liability, including product liability, we may be included in resulting litigation. We may be subject to litigation defense costs or be subject to potential judgments or settlement costs for which we may not be fully covered by insurance, which would result in an increase of our expenses.
We also license our software on Altair branded computer hardware, which we acquire from an original equipment manufacturer, which we refer to as an OEM, exposing us to potential liability for the hardware, such as product liability. To the extent this liability is greater than the warranty and liability protection from our OEM, we may incur additional expenses, which may be significant.
If we fail to educate and train our users regarding the use and benefits of our software, we may not generate additional revenue.
Our software is complex and highly technical. We continually educate and train our existing and potential users regarding the depth, breadth, and benefits of our software including through classroom and online training. If these users do not receive education and training regarding the use and benefits of our software, or the education and training is ineffective, they may not increase their usage of our software. We incur costs of training directly related to this activity prior to generating additional revenue, if any.
If we are unable to match engineers to open positions in our CES business or are otherwise unable to grow our CES business, our revenue could be adversely affected.
We operate our client engineering services business by hiring engineers for placement at a customer site for specific customer-directed assignments and pay them only for the duration of the placement. The success of this business is dependent upon our ability to recruit and retain highly skilled, qualified engineers to meet the requirements of our customers and to maintain ongoing relationships with these customers. Our CES business constituted approximately 15% of our total revenues for each of the years ended December 31, 2015 and 2016, and 14% of our total revenues for the year ended December 31, 2017. Some of our customers operate their engineering personnel needs through managed service providers, or MSPs. A significant percentage of the engineers we place, either directly or through MSPs, are with U.S.-based customers and are citizens of countries other than the United States. In the event these engineers are unable to enter into, or remain in, the United States legally, we may be unable to match engineers with the appropriate skill sets matched to open customer positions. If we are unable to attract highly skilled, qualified engineers because of competitive factors or immigration laws, or otherwise fail to match engineers to open customer positions, our revenue may be adversely affected.
Our sales to United States government agencies and their suppliers may be subject to reporting and compliance requirements.
Our customers include agencies of the United States government and their suppliers of products and services. These customers may procure our software and services through United States government mandated procurement regulations. Because of United States government reporting and compliance requirements we may incur unexpected costs. United States government agencies and their suppliers may have statutory, contractual or other legal rights to terminate contracts for convenience or due to a default, and any such termination may adversely affect our future operating results.
Our sales to non-United States government agencies and their suppliers may be subject to reporting and compliance requirements.
Our customers include agencies of various non-United States governments and their suppliers of products and services. These customers procure our software and services through various governments’ mandated procurement regulations. Because of governmental reporting and compliance requirements we may incur unexpected costs. Government agencies and their suppliers may have statutory, contractual or other legal rights to terminate contracts for convenience or due to a default, and any such termination may adversely affect our future operating results.
We may require additional capital to support our business, which may not be available on acceptable terms.
We expect to continue to make investments in our business, which may require us to raise additional funds. We may raise these funds through either equity or debt financings. Issuances of equity or convertible debt securities may significantly dilute stockholders and any new equity securities could have rights, preferences and privileges superior to those holders of our Class A common stock. In addition to the restrictions under our current credit agreement, any future debt
21
Table of Contents
financings could contain restrictive covenants relating to our capital raising activities and other financial and operational matters, which may make it more difficult for us to obtain additional capital, manage our business and pursue business opportunities, including potential acquisitions.
We may not be able to obtain additional financing on terms favorable to us. If we are unable to obtain adequate financing or financing on terms satisfactory to us when we require it, our ability to continue to support our growth, develop new software or add capabilities and enhancements to our existing software and respond to business challenges could be significantly impaired, and our business may be adversely affected.
Our loan agreements contain operating and financial covenants that may restrict our business and financing activities.
Upon closing of our IPO, we entered into a new credit agreement, which provides for an initial aggregate commitment amount of $100 million, with a sublimit for the issuance of letters of credit of up to $5 million and a sublimit for swing line loans of up to $5 million and matures on October 18, 2022 (the “2017 Credit Agreement”). Our 2017 Credit Agreement is unconditionally guaranteed by us and all existing and subsequently acquired controlled domestic subsidiaries. It is also collateralized by a first priority, perfected security interest in, and mortgages on, substantially all of our tangible assets. The Credit Agreement contains operating financial restrictions and covenants, including liens, limitations on indebtedness, fundamental changes, limitations on guarantees, limitations on sales of assets and sales of receivables, dividends, distributions and other restricted payments, transactions with affiliates, prepayment of indebtedness and limitations on loans and investments in each case subject to certain exceptions. In addition, the 2017 Credit Agreement contains financial covenants relating to maintaining a minimum interest coverage ratio of 3.0 to 1.0 and maximum leverage ratio of 3.0 to 1.0, as defined in the 2017 Credit Agreement The restrictions and covenants in the 2017 Credit Agreement, as well as those contained in any future debt financing agreements that we may enter into, may restrict our ability to finance our operations and engage in, expand or otherwise pursue our business activities and strategies. Our ability to comply with these covenants and restrictions may be affected by events beyond our control, and breaches of these covenants and restrictions could result in a default under the loan agreement and any future financing agreements that we may enter into.
We operate internationally and must comply with employment and related laws in various countries, which may, in turn, result in unexpected expenses.
We are subject to a variety of domestic and foreign employment laws, including those related to safety, discrimination, whistle-blowing, employment of illegal aliens, classification of employees, wages, statutory benefits, and severance payments. Such laws are subject to change as a result of judicial decisions or otherwise, and there can be no assurance that we will not be found to have violated any such laws in the future. Such violations could lead to the assessment of significant fines against us by federal, state or foreign regulatory authorities or to the award of damages claims, including severance payments, against us in judicial or administrative proceedings by employees or former employees, any of which would reduce our net income or increase our net loss.
Changes in government trade, immigration or currency policies may harm our business.
We operate our business globally in multiple countries that have policies and regulations relating to trade, immigration and currency, which may change. Governments may change their trade policies by withdrawing from negotiations on new trade policies, renegotiating existing trade agreements, imposing tariffs or imposing other trade restrictions or barriers. Any such changes may result in:
| • | changes in currency exchange rates; |
| • | changes in political or economic conditions; |
| • | import or export licensing requirements or other restrictions on technology imports and exports; |
| • | laws and business practices favoring local companies; |
| • | changes in diplomatic and trade relationships; |
| • | modification of existing or implementation of new tariffs; |
| • | imposition or increase of trade barriers; or |
| • | establishment of new trade or currency restrictions. |
Any of these changes, changes in immigration policies, government intervention in currency valuation or other government policy changes may adversely impact our ability to sell software and services, which could, in turn, harm our revenues and our business. We are headquartered in the United States and may be particularly impacted by changes affecting the United States.
Our use of open source technology could impose limitations on our ability to commercialize our software.
We use open source software in some of our software and expect to continue to use open source software in the future. Although we monitor our use of open source software to avoid subjecting our software to conditions we do not intend, we may face allegations from others alleging ownership of, or seeking to enforce the terms of, an open source license, including by demanding release of the
22
Table of Contents
open source software, derivative works, or our proprietary source code that was developed using such software. These allegations could also result in litigation. The terms of many open source licenses have not been interpreted by United States courts. There is a risk that these licenses could be construed in a way that could impose unanticipated conditions or restrictions on our ability to commercialize our software. In such an event, we may be required to seek licenses from third parties to continue commercially offering our software, to make our proprietary code generally available in source code form, to re-engineer our software or to discontinue the sale of our software if re-engineering could not be accomplished on a timely basis, any of which could adversely affect our business and revenue.
The use of open source software subjects us to a number of other risks and challenges. Open source software is subject to further development or modification by anyone. Others may develop such software to be competitive with or no longer useful by us. It is also possible for competitors to develop their own solutions using open source software, potentially reducing the demand for our software. If we are unable to successfully address these challenges, our business and operating results may be adversely affected and our development costs may increase.
We currently open source certain of our software and may open source other software in the future, which could have an adverse effect on our revenues and expenses.
We offer a portion of our Altair PBS workload management software in an open source version to generate additional usage and broaden user-community development and enhancement of the software. We offer related software and services on a paid basis. We believe increased usage of open source software leads to increased purchases of these related paid offerings. We may offer additional software on an open source basis in the future. There is no assurance that the incremental revenues from related paid offerings will outweigh the lost revenues and incurred expenses attributable to the open sourced software.
Our revenue mix may vary over time, which could harm our gross margin and operating results.
Our revenue mix may vary over time due to a number of factors, including the mix of term-based licenses and perpetual licenses. Due to the differing revenue recognition policies applicable to our term-based licenses, perpetual licenses and professional services, shifts in the mix between subscription and perpetual licenses from quarter to quarter, or increases or decreases in revenue derived from our professional engineering services, which have lower gross margins than our software services, could produce substantial variation in revenues recognized even if our billings remain consistent. Our gross margins and operating results could be harmed by changes in revenue mix and costs, together with other factors, including: entry into new markets or growth in lower margin markets; entry into markets with different pricing and cost structures; pricing discounts; and increased price competition. Any one of these factors or the cumulative effects of certain of these factors may result in significant fluctuations in our gross margin and operating results. This variability and unpredictability could result in our failure to meet internal expectations or those of securities analysts or investors for a particular period. If we fail to meet or exceed such expectations for these or any other reasons, the market price of our common stock could decline.
The estimates of market opportunity and forecasts of market growth included in our periodic reports or other public disclosures may prove to be inaccurate, and even if the market in which we compete achieves the forecasted growth, our business could fail to grow at similar rates, if at all.
Market opportunity estimates and growth forecasts included in our periodic reports or other public disclosures, including those we have generated ourselves, are subject to significant uncertainty and are based on assumptions and estimates that may not prove to be accurate. Even if the market in which we compete meets the size estimates and growth forecasted in our periodic reports or other public disclosures, our business could fail to grow for a variety of reasons, which would adversely affect our results of operations.
We are subject to governmental export and import controls that could impair our ability to compete in international markets due to licensing requirements and subject us to liability if we are not in compliance with applicable laws.
Our software, services and hardware are subject to export control and import laws and regulations. As a company headquartered in the United States we are subject to regulations, including the International Traffic in Arms Regulations, or ITAR, and Export Administration Regulations, or EAR, United States Customs regulations and various economic and trade sanctions regulations administered by the United States Treasury Department’s Office of Foreign Assets Controls presenting further risk of unexpected reporting and compliance costs. Compliance with these regulations may also prevent and restrict us from deriving revenue from potential customers in certain geographic locations for certain of our technologies.
If we fail to comply with these laws and regulations, we and certain of our employees could be subject to substantial civil or criminal penalties, including the possible loss of export or import privileges, fines which may be imposed on us and responsible employees or managers and, in extreme cases, the incarceration of responsible employees or managers. Obtaining the necessary authorizations, including any required license, for a particular sale may be time-consuming, is not guaranteed and may result in the delay or loss of sales opportunities. In addition, changes in our software or changes in applicable export or import regulations may create delays in the introduction and sale of our software in international markets, prevent our customers with international operations from deploying our software or, in some cases, prevent the export or import of our software to certain countries, governments or persons altogether.
23
Table of Contents
We incorporate encryption technology into portions of our software. Various countries regulate the import of certain encryption technology, including through import permitting and licensing requirements, and have enacted laws that could limit our ability to distribute our software or could limit our customers’ ability to implement our software in those countries. Encrypted software and the underlying technology may also be subject to export control restrictions. Governmental regulation of encryption technology and regulation of imports or exports of encryption products, or our failure to obtain required import or export approval for our software, when applicable, could harm our international sales and adversely affect our revenue. Compliance with applicable regulatory requirements regarding the export of our software, including with respect to new releases of our software, may create delays in the introduction of our software in international markets, prevent our customers with international operations from deploying our software throughout their globally-distributed systems or, in some cases, prevent the export of our software to some countries altogether.
United States export control laws and economic sanction programs prohibit the shipment of certain software and services to countries, governments and persons that are subject to United States economic embargoes and trade sanctions. Any violations of such economic embargoes and trade sanction regulations could have negative consequences, including government investigations, penalties and reputational harm.
Any change in export or import regulations, economic sanctions or related legislation, shift in the enforcement or scope of existing regulations, or change in the countries, governments, persons or technologies targeted by such regulations, could result in decreased use of our software by, or in our decreased ability to export or license our software to, existing or potential customers with international operations. Any decreased use of our software or limitation on our ability to export or license our software could adversely affect our business.
Our business is subject to a wide range of laws and regulations, and our failure to comply with those laws and regulations could harm our business.
Our business is subject to regulation by various federal, state, local and foreign governmental agencies, including agencies responsible for monitoring and enforcing employment and labor laws, workplace safety, environmental laws, privacy and data protection laws, anti-bribery laws, import and export controls, federal securities laws and tax laws and regulations. In certain foreign jurisdictions, these regulatory requirements may be more stringent than those in the United States. These laws and regulations are subject to change over time and thus we must continue to monitor and dedicate resources to ensure continued compliance. Non-compliance with applicable regulations or requirements could subject us to investigations, sanctions, mandatory product recalls, enforcement actions, disgorgement of profits, fines, damages, civil and criminal penalties or injunctions. If any governmental sanctions are imposed, or if we do not prevail in any possible civil or criminal litigation, our business, operating results, and financial condition could be materially adversely affected. In addition, responding to any action will likely result in a significant diversion of management’s attention and resources and an increase in professional fees. Enforcement actions and sanctions could harm our business, operating results and financial condition.
If we or any of our employees violate the United States Foreign Corrupt Practices Act, the U.K. Bribery Act or similar anti-bribery laws we could be adversely affected.
The United States Foreign Corrupt Practices Act, or FCPA, the U.K. Bribery Act and similar anti-bribery laws generally prohibit companies and their intermediaries from authorizing, offering or providing, directly or indirectly, improper payments or benefits for the purpose of obtaining or retaining business to government officials, political parties and private-sector recipients. United States based companies are required to maintain records that accurately and fairly represent their transactions and have an adequate system of internal accounting controls. We operate in areas of the world that potentially experience corruption by government officials to some degree and, in certain circumstances, compliance with anti-bribery laws may conflict with local customs and practices. We cannot assure that our employees, resellers or distributors will not engage in prohibited conduct. If we are found to be in violation of the FCPA, the U.K. Bribery Act or other anti-bribery laws we could suffer criminal or civil penalties or other sanctions.
Business interruptions could adversely affect our business.
Our operations and our customers are vulnerable to interruptions by fire, flood, earthquake, power loss, telecommunications failure, terrorist attacks, wars and other events beyond our control. A catastrophic event that results in the destruction of any of our critical business or information technology systems could severely affect our ability to conduct normal business operations, including system interruptions, reputational harm, delays in our software development, breaches of data security and loss of critical data.
We rely on our network and third-party infrastructure and applications, internal technology systems, and our websites for our development, marketing, operational support, hosted services and sales activities. If these systems were to fail or be negatively impacted as a result of a natural disaster or other event, our ability to deliver software and training to our customers could be impaired.
24
Table of Contents
Our business interruption insurance may not be sufficient to compensate us fully for losses or damages that may occur as a result of these events, if at all.
Our reported financial results may be adversely affected by changes in accounting principles generally accepted in the United States.
GAAP are subject to interpretation by the Financial Accounting Standards Board, or FASB, the United States Securities and Exchange Commission, or the SEC, and various bodies formed to promulgate and interpret appropriate accounting principles. A change in these principles or interpretations could have a significant effect on our reported financial results for periods prior and subsequent to such change. We will need to comply with the FASB issued Accounting Standards Update No. 2014-09, Revenue from Contracts with Customers. This standard outlines a single comprehensive model for entities to use in accounting for revenue arising from contracts with customers and supersedes most existing revenue recognition guidance under GAAP. The core principle of the guidance is that an entity should recognize revenue when it transfers promised goods or services to customers in an amount that reflects the consideration to which the company expects to be entitled in exchange for those goods and services. We expect the timing of revenue recognition to be accelerated because we anticipate that license revenue will be recognized at a point in time, rather than over time, which is our current practice. Generally, the license revenue component of an arrangement represents a significant portion of the overall fair value of a software arrangement. While we continue to assess the potential impacts, under the new standards there is the potential for significant impacts on the consolidated financial statements.
The application of this new guidance may result in a change in the timing and pattern of revenue recognition including the retrospective recognition of revenue in historical periods that may negatively affect our future revenue trend, which, despite no change in associated cash flows, could have a material adverse effect on our net income (loss). The adoption of new standards may potentially require enhancements or changes in our systems and will require significant time and cost on behalf of our financial management.
As an “emerging growth company” the JOBS Act allows us an extended transition period for complying with new and revised accounting standards that have different effective dates for public and private companies until the earlier of the date (i) we are no longer an emerging growth company, or (ii) affirmatively and irrevocably opt out of the extended transition period provided in the JOBS Act. We have elected to use this extended transition period under the JOBS Act, including with respect to ASU 2014-09.
We cannot predict the impact of all of the future changes to accounting principles or our accounting policies on our consolidated financial statements going forward, which could have a significant effect on our reported financial results, and could affect the reporting of transactions completed before the announcement of the change. In addition, if we were to change our critical accounting estimates, including those related to the recognition of license revenue and other revenue sources, our operating results could be significantly affected.
If our goodwill or intangible assets become impaired, we may be required to record a significant charge to earnings, which could harm our business.
Under GAAP, we review our intangible assets for impairment when events or changes in circumstances indicate the carrying value may not be recoverable. Goodwill is required to be tested for impairment at least annually. As of December 31, 2017 and 2016, respectively, we had $62.7 million and $36.6 million of goodwill and $24.5 million and $11.2 million of other intangible assets—net. An adverse change in market conditions, particularly if such change has the effect of changing one of our critical assumptions or estimates, could result in a change to the estimation of fair value that could result in an impairment charge.
We have significant deferred tax assets in the United States, which we will not use in future taxable periods.
As of December 31, 2017 and 2016, we had gross deferred tax assets, or DTAs, of $73.6 million and $75.0 million, respectively, primarily related to tax credits, share-based compensation, deferred revenue, and capitalized research and development expenses. We are entitled to a United States federal tax deduction when non-qualified stock options, or NSOs, are exercised. In connection with our IPO, a significant number of NSOs were exercised resulting in a tax deduction for United States income tax purposes. This deduction, in conjunction with our other expected deferred tax asset reversals, resulted in our needing to establish a valuation allowance for $47.0 million in 2017 for the United States DTAs. Our ability to utilize any net operating losses or tax credits may be limited under provisions of the Internal Revenue Code of 1986, or the Code, if we undergo an ownership change after our IPO (generally defined as a greater than 50-percentage-point cumulative change, by value, in the equity ownership of certain stockholders over a rolling three-year period). We may also be unable to realize our tax credit carryforwards as they begin to expire in 2018.
If our global tax methodology is challenged our tax expense may increase.
As a global business headquartered in the United States, we are required to pay tax in a number of different countries, exposing us to transfer pricing and other adjustments. Transfer pricing refers to the methodology of allocating revenue and expenses for tax purposes to particular countries. Taxing authorities may challenge our transfer pricing methodology, which if successful could increase our professional expenses and result in one-time tax charges, a higher worldwide effective tax rate, reduced cash flows, and lower overall profitability of our operations.
25
Table of Contents
Our tax expense could be impacted depending on the applicability of withholding and other taxes including taxes on software licenses and related intercompany transactions under the tax laws of jurisdictions in which we have business operations. Our future income taxes may fluctuate if our earnings are either lower in countries that have low statutory tax rates or higher in countries that have high statutory tax rates. We are subject to review and audit by the United States and other taxing authorities. Any review or audit could increase our professional expenses and, if determined adversely, could result in unexpected costs.
Sales and use, value-added and similar tax laws and rates vary by jurisdiction. Any of these jurisdictions may assert that such taxes are applicable, which could result in tax assessments, penalties and interest.
New legislation or tax-reform policies that would change U.S. or foreign taxation of international business activities, including uncertainties in the interpretation and application of the 2017 Tax Cuts and Jobs Act, could materially affect our tax obligations and effective tax rate.
We are subject to income tax in the numerous jurisdictions in which we operate. Reforming the taxation of international businesses has been a priority for politicians, and a wide variety of potential changes have been proposed. Some proposals, several of which have been enacted, impose incremental taxes on gross revenue, regardless of profitability. Furthermore, it is reasonable to expect that global taxing authorities will be reviewing current legislation for potential modifications in reaction to the implementation of the 2017 Tax Cuts and Jobs Act (the “Tax Act”) in the U.S. Due to the large and expanding scale of our international business activities, any changes in the taxation of such activities may increase our worldwide effective tax rate and the amount of taxes we pay and seriously harm our business.
In the U.S., the Tax Act enacted on December 22, 2017 significantly affected U.S. tax law by changing how the U.S. imposes income tax on multinational corporations. The U.S. Department of Treasury has broad authority to issue regulations and interpretative guidance that may significantly impact how we will apply the law and impact our results of operations in the period issued.
The Tax Act requires complex computations not previously provided in U.S. tax law. As such, the application of accounting guidance for such items is currently uncertain. Further, compliance with the Tax Act and the accounting for such provisions require accumulation of information not previously required or regularly produced. As additional regulatory guidance is issued by the applicable taxing authorities, as accounting treatment is clarified, as we perform additional analysis on the application of the law, and as we refine estimates in calculating the effect, our final analysis, which will be recorded in the period completed, may be different from our current provisional amounts, which could materially affect our tax obligations and effective tax rate.
In addition to our software, we manufacture, distribute and sell products, which may expose us to product liability claims, product recalls, and warranty claims that could be expensive and harm our business.
We manufacture, distribute and sell products through two wholly owned subsidiaries, Altair Product Design, Inc., which we refer to as APD, and Ilumisys, Inc. doing business as toggled and which we refer to in this annual report as toggled. Generally, APD supports our customers with engineering and design services, which may include the fabrication of equipment and prototypes that are sold to businesses but not sold to consumers. From time to time, certain customers may contract directly with us for services similar to those provided by APD. toggled designs, sources through contract manufacturers, and assembles in our own facilities LED lighting and related products for sale to consumers and businesses.
To the extent these products do not perform as expected, cause injury or death or are otherwise unsuitable for usage, we may be held liable for claims, including product liability and other claims. A product liability claim, any product recalls or an excessive warranty claim, whether arising from defects in design or manufacture or otherwise could negatively affect our APD or toggled sales or require a change in the design or manufacturing process of these products, any of which may harm our reputation and business.
Failure to protect and enforce toggled’s proprietary technology and intellectual property rights could substantially harm toggled’s lighting business.
Part of the success of toggled’s lighting business depends on our ability to protect and enforce toggled’s proprietary rights, including its patents, trademarks, copyrights, trade secrets and other intellectual property rights. As of December 31, 2017, toggled had 141 issued patents and 45 published patent applications worldwide. We attempt to protect toggled’s intellectual property under patent, trademark, copyright, and trade secret laws. However, the steps we take to protect its intellectual property may be inadequate. We will not be able to protect toggled’s intellectual property if we are unable to enforce its rights or if we do not detect unauthorized use of its intellectual property. It may be possible for unauthorized third parties to copy toggled’s technology and use information that it regards as proprietary to create products that compete with toggled’s products. Some license provisions protecting against unauthorized use, copying, transfer and disclosure of toggled’s technology may be unenforceable under the laws of certain jurisdictions and foreign countries. Further, the laws of some countries do not protect proprietary rights to the same extent as the laws of the United States.
26
Table of Contents
The process of obtaining patent protection is uncertain, expensive and time-consuming, and we may not be able to prosecute all necessary or desirable patent applications at a reasonable cost or in a timely manner. In addition, issuance of a patent does not guarantee that we have an absolute right to practice our patented technology, or that we have the right to exclude others from practicing our patented technology. As a result, we may not be able to obtain adequate patent protection or to enforce our issued patents effectively.
From time to time, toggled enforces its patents and other intellectual property rights including through initiating litigation. Any such litigation could result in substantial costs and diversion of resources and could negatively affect toggled’s business, operating results, financial condition and cash flows. If toggled is unable to protect toggled’s intellectual property rights, its business, operating results and financial condition will be harmed.
Assertions by third parties of infringement or other violations by toggled of their intellectual property rights, or other lawsuits brought against toggled, could result in significant costs and substantially harm toggled’s business.
Patent and other intellectual property disputes are common in the markets in which toggled competes. Some of toggled’s competitors, own large numbers of patents, copyrights, trademarks and trade secrets, which they may use to assert claims of infringement, misappropriation or other violations of intellectual property rights against toggled or its customers. As the number of patents and competitors in this market increases, allegations of infringement, misappropriation and other violations of intellectual property rights may increase. Any allegation of infringement, misappropriation or other violation of intellectual property rights by a third party, even those without merit, could cause toggled to incur substantial costs and resources defending against the claim, which could have an adverse effect on toggled’s business.
Some of our businesses may collect personal information and are subject to privacy laws.
Companies that collect personal information are required to comply with the privacy laws adopted by United States and various state and foreign governments, including member states of the European Union. These privacy laws regulate the collection, use, storage, disclosure and security of data, such as names, email addresses and, in some jurisdictions, Internet Protocol addresses, that may be used to identify or locate an individual, including a customer or an employee.
Our Company includes the WEYV business, a consumer music and content service, which in the course of providing its service directly to consumers, collects and stores consumer information. Currently we expect to operate WEYV only within the United States and are only subject to the United States privacy laws. To the extent we expand our WEYV offering beyond the United States we will need to comply with the privacy laws of every country in which we operate. Some of our other products may collect personal data and would also be subject to these privacy laws.
These laws and regulations may require us to implement privacy and security policies, permit end-customers to access, correct and delete personal information stored or maintained by us, inform individuals of security breaches that affect their personal information, and, in some cases, obtain individuals’ consent to use personally identifiable information for certain purposes. Governments could require that any personally identifiable information collected in a country not be disseminated outside of that country. We also may find it necessary or desirable to join industry or other self-regulatory bodies or other information security, or data protection, related organizations that require compliance with their rules pertaining to information security and data protection. We may agree to be bound by additional contractual obligations relating to our collection, use and disclosure of personal, financial and other data. Our failure to comply with these privacy laws or any actual or suspected security incident may result in governmental actions, fines and non-monetary penalties, which may harm our business.
Proposed or new legislation and regulations could significantly affect our business. The new European General Data Protection Regulation, or GDPR, will take effect in May 2018 and will apply to all of our business conducted in Europe. Generally accepted compliance policies and processes are not yet well established, and could impose significant new requirements on how we collect, process and transfer personal data, as well as impose significant fines for non-compliance. Compliance with GDPR or changes in privacy and information security laws and standards in European Union member states or other countries in which we transact our business may result in significant expense due to increased investment in technology and the development of new operational processes and failure to comply with GDPR may harm our business.
Risks related to ownership of our Class A common stock
An active public trading market for our Class A common stock may not be sustained.
Prior to our initial public offering in the fourth quarter of 2017, there had been no public market or active private market for trading shares of our Class A common stock. Our Class A common stock is listed on the Nasdaq Global Select Market under the symbol “ALTR.” However, we cannot assure you that an active trading market will be sustained. The lack of an active market may impair your ability to sell your shares at the time you wish to sell them or at a price that you consider reasonable. The lack of an active
27
Table of Contents
market may also reduce the price of shares of Class A common stock. An inactive market may impair our ability to raise capital by selling shares and our ability to use our capital stock to acquire other companies or technologies. We cannot predict the prices at which our Class A common stock will trade.
Our Class A common stock has only recently become publicly traded, and the market price of our Class A common stock may be volatile.
The market price of our Class A common stock may fluctuate substantially depending on a number of factors, many of which are beyond our control and may not be related to our operating performance. These fluctuations could cause you to lose all or part of your investment in our Class A common stock, since you might not be able to sell your shares at or above the price you paid for our Class A common stock. Factors that could cause fluctuations in the market price of our Class A common stock include the following:
| • | price and volume fluctuations in the overall stock market from time to time, including as a result of trends in the economy as a whole; |
| • | volatility in the market prices and trading volumes of technology stocks; |
| • | changes in operating performance and stock market valuations of other technology companies generally, or those in our industry in particular; |
| • | the expiration of market stand-off or contractual lock-up agreements and sales of shares of our Class A common stock by us or our stockholders; |
| • | the volume of shares of our Class A common stock available for public sale; |
| • | additional shares of our Class A common stock being sold into the market by our existing stockholders, or the anticipation of such sales, including sales of our Class A common stock upon exercise of outstanding options or upon conversion of our Class B common stock into shares of Class A common stock; |
| • | failure of financial analysts to maintain coverage of us, changes in financial estimates by any analysts who follow our company, or our failure to meet these estimates or the expectations of investors; |
| • | the financial projections we may provide to the public, any changes in these projections or our failure to meet these projections; |
| • | announcements by us or our competitors of new software or new or terminated significant contracts, commercial relationships or capital commitments; |
| • | public analyst or investor reaction to our press releases, other public announcements and filings with the SEC; |
| • | rumors and market speculation involving us or other companies in our industry; |
| • | actual or anticipated changes or fluctuations in our operating results; |
| • | actual or anticipated developments in our business, our customers’ businesses, or our competitors’ businesses or the competitive landscape generally; |
| • | litigation involving us, our industry or both, or investigations by regulators into our operations or those of our competitors; |
| • | developments or disputes concerning our intellectual property or our solutions, or third party proprietary rights; |
| • | announced or completed acquisitions of businesses or technologies by us or our competitors; |
| • | new laws or regulations or new interpretations of existing laws or regulations applicable to our business; |
| • | changes in accounting standards, policies, guidelines, interpretations or principles; |
| • | any major changes in our management or our board of directors; |
| • | general economic conditions and slow or negative growth of our markets; and |
| • | other events or factors, including those resulting from war, incidents of terrorism or responses to these events. |
In addition, the stock market in general, and the market for technology companies in particular, have experienced extreme price and volume fluctuations that have often been unrelated or disproportionate to the operating performance of those companies. Broad market and industry factors may affect the market price of our Class A common stock, regardless of our actual operating
28
Table of Contents
performance. In the past, following periods of volatility in the overall market and the market prices of a particular company’s securities, securities class action litigation has often been instituted against that company. We may become the target of this type of litigation in the future. Securities litigation, if instituted against us, could result in substantial costs and divert our management’s attention and resources from our business.
We do not intend to pay dividends in the foreseeable future. As a result, your ability to achieve a return on your investment will depend on appreciation in the price of our Class A common stock.
We have never declared or paid any cash dividends on our Class A common stock. We currently intend to retain all available funds and any future earnings for use in the operation of our business and do not anticipate paying any dividends on our Class A common stock in the foreseeable future. Any determination to pay dividends in the future will be at the discretion of our board of directors. Consequently, your only opportunity to achieve a return on your investment in our company will be if the market price of our Class A common stock appreciates and you sell your shares at a profit. There is no guarantee that the price of our Class A common stock that will prevail in the market will ever exceed the price that you paid.
Our management team has limited experience managing a public company.
Most members of our management team have limited experience managing a publicly-traded company, interacting with public company investors, and complying with laws pertaining to public companies. Our management team may not successfully or efficiently manage our transition to being a public company subject to significant regulatory oversight and reporting obligations under the federal securities laws and the continuous scrutiny of securities analysts and investors. These new obligations and constituents will require significant attention from our senior management and could divert their attention away from the day-to-day management of our business, which could adversely affect our business, financial condition, and operating results.
We are incurring increased costs and devote additional management time as a result of operating as a public company.
As a public company, we are incurring legal, accounting and other expenses that we did not incur as a private company. We are subject to the reporting requirements of the Securities Exchange Act of 1934, as amended, or the Exchange Act, and are required to comply with the applicable requirements of the Sarbanes-Oxley Act of 2002, or SOX, and the Dodd-Frank Wall Street Reform and Consumer Protection Act, or Dodd-Frank, as well as rules and regulations subsequently implemented by the SEC and the Nasdaq Global Select Market, including the establishment and maintenance of effective disclosure and financial controls and changes in corporate governance practices. We expect that compliance with these requirements will increase our legal and financial compliance costs and will make some activities more time consuming and costly. In addition, we expect that our management and other personnel will need to divert attention from operational and other business matters to devote additional time to these public company requirements. In particular, we expect to incur additional expenses and devote additional management effort toward ensuring compliance with the requirements of Section 404 of SOX, which will increase when we are no longer an emerging growth company, as defined by the JOBS Act. We will remain an emerging growth company until the earliest of (i) the end of the fiscal year in which the market value of our common stock that is held by non-affiliates exceeds $700.0 million as of June 30, (ii) the end of the fiscal year in which we have total annual gross revenues of $1.07 billion or more during such fiscal year, (iii) the date on which we issue more than $1.0 billion in non-convertible debt in a three-year period or (iv) December 31, 2022. Although we have already hired additional employees to help comply with these requirements, we may need to further expand our legal and finance departments in the future, particularly after we are no longer an emerging growth company, which will increase our costs and expenses.
If we fail to maintain effective internal controls, we may not be able to report financial results accurately or on a timely basis, or to detect fraud, which could have a material adverse effect on our business or share price.
Effective internal controls are necessary for us to provide reasonable assurance with respect to our financial reports and to effectively prevent financial fraud. Pursuant to SOX, we will be required to periodically evaluate the effectiveness of the design and operation of our internal controls. Internal controls over financial reporting may not prevent or detect misstatements because of inherent limitations, including the possibility of human error or collusion, the circumvention or overriding of controls, or fraud. If we fail to maintain an effective system of internal controls, our business and operating results could be harmed, and we could fail to meet our reporting obligations, which could have a material adverse effect on our business and our share price.
As a public company, we are required to maintain internal controls over financial reporting and to report any material weaknesses in such internal controls. Section 404 of SOX requires annual management assessments of the effectiveness of our internal controls over financial reporting beginning with our Annual Report for the year ending December 31, 2018. We are in the process of designing, implementing, and testing the internal control over financial reporting required to comply with this obligation, which is time consuming, costly, and complicated. We have identified material weaknesses in our internal controls over financial reporting for the fiscal years ended December 31, 2015, 2016 and 2017. If we identify material weaknesses in our internal control over financial reporting in the future or if we are unable to successfully remediate the identified material weaknesses or, if we are unable to comply with the requirements of Section 404 in a timely manner or assert that our internal control over financial reporting is effective, investors may lose confidence in the accuracy and completeness of our financial reports and the market price of our Class A common stock could be negatively affected, and we could become subject to investigations by the stock exchange on which our securities are listed, the SEC, or other regulatory authorities, which could require additional financial and management resources.
29
Table of Contents
We are an emerging growth company and we cannot be certain if (i) the reduced disclosure requirements or (ii) extended transition periods for complying with new or revised accounting standards applicable to emerging growth companies will make our common stock less attractive to investors.
We qualify as an emerging growth company. Under the JOBS Act, emerging growth companies can delay adopting new or revised accounting standards until such time as those standards apply to private companies. Under the JOBS Act, emerging growth companies can delay adopting new or revised accounting standards issued subsequent to the enactment of the JOBS Act until such time as those standards apply to private companies. We have elected to use this extended transition period for complying with new or revised accounting standards that have different effective dates for public and private companies until the earlier of the date we (i) are no longer an emerging growth company, or (ii) affirmatively and irrevocably opt out of the extended transition period provided in the JOBS Act. As a result, our financial statements may not be comparable to companies that comply with new or revised accounting pronouncements as of public company effective dates.
For as long as we continue to be an emerging growth company, we intend to take advantage of certain exemptions from various reporting requirements that are applicable to other public companies including, but not limited to, reduced disclosure obligations regarding executive compensation in our periodic reports and proxy statements and exemptions from the requirements of holding a nonbinding advisory vote on executive compensation and stockholder approval of any golden parachute payments not previously approved. We cannot predict if investors will find our common stock less attractive because we will rely on these exemptions. If some investors find our common stock less attractive as a result, there may be a less active trading market for our common stock and our stock price may be more volatile.
We will remain an emerging growth company until the earliest of (i) the end of the fiscal year in which the market value of our common stock that is held by non-affiliates exceeds $700.0 million as of June 30, (ii) the end of the fiscal year in which we have total annual gross revenues of $1.07 billion or more during such fiscal year, (iii) the date on which we issue more than $1.0 billion in non-convertible debt in a three-year period or (iv) December 31, 2022.
We cannot predict the impact our capital structure may have on our stock price.
In July 2017, S&P Dow Jones, a provider of widely followed stock indices, announced that companies with multiple share classes, such as ours, will not be eligible for inclusion in certain of their indices. As a result, our Class A common stock will likely not be eligible for these stock indices. Additionally, FTSE Russell, another provider of widely followed stock indices, recently stated that it plans to require new constituents of its indices to have at least five percent of their voting rights in the hands of public stockholders. Many investment funds are precluded from investing in companies that are not included in such indices, and these funds would be unable to purchase our Class A common stock. We cannot assure you that other stock indices will not take a similar approach to S&P Dow Jones or FTSE Russell in the future. Exclusion from indices could make our Class A common stock less attractive to investors and, as a result, the market price of our Class A common stock could be adversely affected.
If financial or industry analysts do not publish research or reports about our business or if they issue inaccurate or unfavorable commentary or downgrade our Class A common stock, our stock price and trading volume could decline.
The trading market for our Class A common stock will be influenced by the research and reports that industry or financial analysts publish about us or our business. We do not control these analysts or the content and opinions included in their reports. As a new public company, we may be slow to attract research coverage, and the analysts who publish information about our Class A common stock will have had relatively little experience with our company, which could affect their ability to accurately forecast our results and make it more likely that we fail to meet their estimates. In the event we obtain industry or financial analyst coverage, if any of the analysts who cover us issue an inaccurate or unfavorable opinion regarding our stock price, our stock price would likely decline. In addition, the stock prices of many companies in the technology industry have declined significantly after those companies have failed to meet, or often times exceeded, the financial guidance publicly announced by the companies or the expectations of analysts. If our financial results fail to meet, or significantly exceed, our announced guidance or the expectations of analysts or public investors, analysts could downgrade our Class A common stock or publish unfavorable research about us. If one or more of these analysts cease coverage of our company or fail to publish reports on us regularly, we could lose visibility in the financial markets, which in turn could cause our stock price or trading volume to decline.
Future sales of substantial amounts of our Class A common stock may cause our stock price to decline.
Future sales of a substantial number of shares of our Class A common stock, particularly sales by our directors, executive officers and significant stockholders could adversely affect the market price of our Class A common stock and may make it more difficult to sell Class A common stock at a time and price that you deem appropriate. As of December 31, 2017, we had an aggregate of 26,725,484 shares of Class A common stock and 36,507,676 shares of Class B common stock outstanding.
All of the shares of Class A common stock sold in our initial public offering are freely tradable without restrictions or further registration under the Securities Act of 1933, as amended, or the Securities Act, except for any shares held by our affiliates as defined in Rule 144 under the Securities Act.
30
Table of Contents
A substantial majority our outstanding shares of common stock outstanding prior to our initial public offering are currently restricted from resale as a result of market standoff and “lock-up” agreements.
These shares will become available to be sold in the second quarter of 2018. Shares held by directors, executive officers and other affiliates will be subject to volume limitations under Rule 144 under the Securities Act and various vesting agreements. In addition, the underwriters may, in their sole discretion, release all or some portion of the shares subject to market standoff or lock-up agreements prior to the expiration of the lock-up period. Sales of a substantial number of such shares upon expiration of the market standoff and lock-up agreements, or the perception that such sales may occur, or early release of these agreements, could cause our market price to fall or make it more difficult for you to sell your Class A common stock at a time and price that you deem appropriate.
We registered the offer and sale of an aggregate of approximately 15,948,252 shares of Class A common stock that have been issued or reserved for future issuance under our equity compensation plans on a Form S-8 registration statement. These shares can be freely sold in the public market upon issuance, subject to the market standoff or lock-up agreements or unless they are held by “affiliates,” as that term is defined in Rule 144 of the Securities Act. If the holders of these shares choose to sell a large number of shares, they could adversely affect the market price for our Class A common stock.
We may also issue shares of our Class A common stock or securities convertible into shares of our Class A common stock from time to time in connection with a financing, acquisition, investment or otherwise. Any such issuance could result in substantial dilution to our existing stockholders and cause the trading price of our Class A common stock to decline.
The dual class structure of our common stock has the effect of concentrating voting control with certain stockholders who hold shares of our Class B common stock, including our founders, certain of our directors and executive officers and affiliates, who hold in the aggregate approximately 95% of the voting power of our capital stock. This will limit or preclude your ability to influence corporate matters, including the election of directors, amendments of our organizational documents, and any merger, consolidation, sale of all or substantially all of our assets, or other major corporate transaction requiring stockholder approval.
Our Class B common stock was granted ten votes per share, and our Class A common stock has one vote per share. Our Class B stockholders, including our founders, certain of our directors and executive officers, and affiliates, hold, in the aggregate approximately 95% of the voting power of our capital stock. The ten-to-one voting ratio between our Class B and Class A common stock, results in the holders of our Class B common stock collectively controlling a majority of the combined voting power of our common stock and therefore being able to control all matters submitted to our stockholders for approval until 2029, or upon the occurrence of a triggering event at which time all shares of our Class B common stock will automatically convert into shares of our Class A common stock, or on an earlier date, as set forth in our Delaware certificate of incorporation.
This concentrated control will limit or preclude your ability to influence corporate matters for the foreseeable future, including the election of directors, amendments of our organizational documents, and any merger, consolidation, sale of all or substantially all of our assets, or other major corporate transaction requiring stockholder approval. In addition, this may prevent or discourage unsolicited acquisition proposals or offers for our capital stock that you may feel are in your best interest as one of our stockholders.
Future transfers by holders of our Class B common stock will generally result in those shares converting to Class A common stock, subject to the specific exceptions set forth in our Delaware certificate of incorporation, such as certain transfers effected for estate planning purposes and between or among our founders. The conversion of Class B common stock to Class A common stock will have the effect, over time, of increasing the relative voting power of those holders of Class B common stock who retain their shares in the long-term.
Certain provisions in our charter documents and Delaware law could prevent an acquisition of our company, limit attempts by our stockholders to replace or remove members of our board of directors or current management and may adversely affect the market price of our Class A common stock.
Our Delaware certificate of incorporation and bylaws contain provisions that could delay or prevent a change in control of our company that stockholders may consider favorable, including transactions in which stockholders might otherwise receive a premium for their shares. These provisions may also prevent or delay attempts by stockholders to replace or remove our current management or members of our board of directors. These provisions include:
| • | providing for a dual class common stock structure for 12 years following the completion of our IPO; |
| • | providing for a classified board of directors with staggered three-year terms, which could delay the ability of stockholders to change the membership of a majority of our board of directors; |
| • | authorizing our board of directors to issue shares of preferred stock and to determine the price and other terms of those shares, including preferences and voting rights, without stockholder approval; |
31
Table of Contents
| • | the requirement that a special meeting of stockholders may be called only by the chairman of our board of directors, our chief executive officer, our president, or a majority vote of our board of directors, which could delay the ability of our stockholders to force consideration of a proposal or to take action, including the removal of directors; |
| • | requiring the affirmative vote of holders of at least 66 2/3% of the voting power of all of the then outstanding shares of the voting stock, voting together as a single class, to adopt, amend, or repeal provisions of (i) our certificate of incorporation relating to the issuance of preferred stock without stockholder approval, voting rights of our Class A common stock and our Class B common stock, and management of our business, and (ii) our bylaws relating to the ability of stockholders to call a special meeting and amending our bylaws in their entirety, which may inhibit the ability of an acquirer to effect such amendments to facilitate an unsolicited takeover attempt; |
| • | the ability of our board of directors, by majority vote, to amend our bylaws, which may allow our board of directors to take additional actions to prevent an unsolicited takeover and inhibit the ability of an acquirer to amend our bylaws to facilitate an unsolicited takeover attempt; and |
| • | requiring advance notice procedures with which stockholders must comply to nominate candidates to our board of directors or to propose matters to be acted upon at a stockholders’ meeting, which may discourage or deter a potential acquirer from conducting a solicitation of proxies to elect the acquirer’s own slate of directors or otherwise attempting to obtain control of us. |
In addition, as a Delaware corporation, we are subject to Section 203 of the Delaware General Corporation Law. These provisions may prohibit large stockholders, in particular those owning 15% or more of our outstanding voting stock, from merging or combining with us for a certain period of time.
These and other provisions in our certificate of incorporation, our bylaws and under Delaware law could discourage potential takeover attempts, reduce the price that investors might be willing to pay for shares of our Class A common stock in the future and result in the market price being lower than it would be without these provisions.
Item 1B. Unresolved Staff Comments
None.
Our corporate headquarters are located in Troy, Michigan. We own our corporate headquarters facility consisting of 132,900 square feet of office space. In addition, we maintain 17 domestic offices some of which are subject to master leases or subleases with multiyear lease terms in Alabama, California, Massachusetts, New York, North Carolina, Texas, Virginia, Washington, and Wisconsin. We maintain an office in Arizona which is leased under an annual lease.
In 2016, we acquired an undeveloped parcel of land adjacent to our headquarters, which we expect to develop over the next few years. In 2010, we acquired 136,000 square feet of industrial space in Troy, Michigan that is now used as the headquarters of our wholly-owned subsidiary toggled. We plan to sell this facility and move toggled into our corporate headquarters building.
We maintain 52 international offices in Australia, Austria, Brazil, Canada, China, Finland, France, Germany, Greece, India, Israel, Italy, Japan, Malaysia, Mexico, Singapore, South Africa, South Korea, Spain, Sweden, Taiwan, the United Kingdom and Vietnam. We lease all of our international facilities and do not own any real property outside of the United States. We expect to add facilities as we grow our employee base and expand geographically. We believe that our facilities are adequate to meet our needs for the immediate future, and that, should it be needed, suitable additional space will be available to accommodate expansion of our operations.
From time to time, we may be subject to legal proceedings and claims in the ordinary course of business. We have received, and may in the future continue to receive, claims from third parties asserting, among other things, infringement of their intellectual property rights. Future litigation may be necessary to defend ourselves, our partners and our customers by determining the scope, enforceability and validity of third party proprietary rights, or to establish and enforce our proprietary rights. The results of any current or future litigation cannot be predicted with certainty and regardless of the outcome, litigation can have an adverse impact on us because of defense and settlement costs, diversion of management resources and other factors.
Litigation
On July 5, 2007, MSC Software Corporation, or MSC, filed a lawsuit against us and certain of our named employees in the United States District Court for the Eastern District of Michigan, asserting, among other things, that we and certain of our employees misappropriated alleged trade secrets that certain of our employees breached contractual non-solicitation and confidentiality obligations owed to MSC and that we tortiously interfered with MSC’s contractual relations with these employees. In April 2014, a
32
Table of Contents
jury returned a $26.1 million verdict against us on three trade secrets claims and a tortious interference claim as well as against certain of our employees for breach of contractual obligations to MSC. In November 2014, this verdict was partially vacated except for damages of $425,000 related to the employment matters, and the Court ordered a new trial on damages for the trade secrets claims. On August 21, 2017, the court granted Altair’s motion to strike the testimony of MSC’s damage expert. On October 11, 2017, the court mooted the remaining pre-trial motions and allowed us to file a motion for summary judgment on the issue of whether MSC can prove damages. On December 13, 2017, the court granted Altair’s motion for summary judgment and dismissed MSC’s claim of trade secret misappropriation. On January 5, 2018, MSC filed a notice of appeal of the final judgment entered on December 13, 2017 and prior orders in this action to the Sixth Circuit Court of Appeals. On January 19, 2018, Altair filed a cross-appeal. No briefing schedule or argument date has been set by the Appeals Court.
We can express no opinion regarding the ultimate resolution of this matter. Litigation is inherently uncertain, and any judgment or injunctive relief entered against us or any adverse settlement could negatively affect our business, results of operations and financial condition.
Item 4. Mine Safety Disclosures
Not applicable.
33
Table of Contents
PART II
Item 5. Market for Registrant’s Common Equity, Related Stockholder Matters and Issuer Purchases of Equity Securities
Market Information for Common Stock
Our Class A common stock began trading on the Nasdaq Global Select Market under the symbol “ALTR” on November 1, 2017. Prior to that date, there was no public trading market for our Class A common stock.
The following table sets forth for the indicated periods the high and low sales prices of our Class A common stock as reported by the Nasdaq Global Select Market since our initial public offering, or IPO:
| High | Low | |||||||
| Year ended December 31, 2017 |
||||||||
| Fourth quarter (beginning November 1, 2017) |
$ | 25.59 | $ | 16.55 | ||||
Our Class B common stock is not listed nor traded on any stock exchange.
Holders
As of December 31, 2017, there were 474 registered stockholders of record of our Class A common stock, 5 registered stockholders of record of our Class B common stock, and we believe a substantially greater number of beneficial owners who hold shares through brokers, banks or other nominees.
Dividends
We have never declared or paid any cash dividends on our common stock. We currently intend to retain all available funds and any future earnings for use in the operation of our business and do not anticipate paying any dividends on our common stock in the foreseeable future. The terms of our 2017 Credit Facility also restrict our ability to pay dividends, and we may also enter into credit agreements or other borrowing arrangements in the future that will restrict our ability to declare or pay cash dividends on our capital stock. Any future determination regarding the declaration and payment of dividends, if any, will be at the discretion of our board of directors and will depend on then-existing conditions, including our financial condition, operating results, contractual restrictions, capital requirements, business prospects, and other factors our board of directors may deem relevant. There can be no assurance that any dividends will be paid in the future.
Use of Proceeds
On October 31, 2017, the Registration Statement on Form S-1 (File No. 333-220710) for our initial public offering was declared effective by the SEC. On November 3, 2017, we closed the initial public offering and sold 9,865,004 shares of our Class A common stock at a public offering price of $13.00 per share for an aggregate offering price of approximately $128.2 million.
The remainder of the information required by this item regarding the use of our IPO proceeds has been omitted pursuant to SEC rules because such information has not changed since our last periodic report was filed.
Unregistered Sales of Equity Securities
None.
34
Table of Contents
Performance Graph
The following shall not be deemed “filed” for purposes of Section 18 of the Securities Exchange Act of 1934, as amended, or incorporated by reference into any of our other filings under the Securities Exchange Act of 1934, as amended, or the Securities Act of 1933, as amended.
The graph below compares the cumulative total stockholder return on our Class A common stock with the cumulative total return on the Nasdaq Composite Index and the Nasdaq Computer Index. The graph assumes $100 was invested at the market close on November 1, 2017, which was our initial trading day, in our Class A common stock, the Nasdaq Composite Index and the Nasdaq Computer Index.
Data for the Nasdaq Composite Index and the Nasdaq Computer Index assumes reinvestment of dividends. The offering price of our Class A common stock in our IPO, which had a closing stock price of $18.31, was $13.00 per share.
The comparisons in the graph below are based upon historical data and are not indicative of, nor intended to forecast, future performance of our Class A common stock.
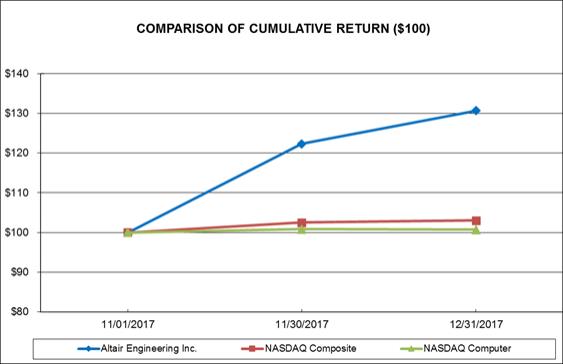
35
Table of Contents
Item 6. Selected Financial Data
The following tables summarize the consolidated financial data for our business. You should read this summary of consolidated financial data in conjunction with the “Management’s Discussion and Analysis of Financial Condition and Results of Operations” and our consolidated financial statements and related notes included elsewhere in this Annual Report on Form 10-K. We derived the consolidated statements of operations data for the years ended December 31, 2017, 2016 and 2015, and the consolidated balance sheet data as of December 31, 2017 and 2016, from our audited consolidated financial statements included elsewhere in this Annual Report on Form 10-K. Our historical results are not necessarily indicative of the results that may be expected in the future. The summary consolidated financial data in this section are not intended to replace our consolidated financial statements and the related notes, and are qualified in their entirety by the consolidated financial statements and related notes included elsewhere in this Annual Report on Form 10-K.
| Year ended December 31, | ||||||||||||
| (in thousands, except share data) | 2017 | 2016 | 2015 | |||||||||
| Consolidated statements of operations data: |
||||||||||||
| Revenue: |
||||||||||||
| Software |
$ | 244,817 | $ | 223,818 | $ | 205,567 | ||||||
| Software related services |
35,397 | 35,770 | 37,294 | |||||||||
|
|
|
|
|
|
|
|||||||
| Total software |
280,214 | 259,588 | 242,861 | |||||||||
| Client engineering services |
46,510 | 47,702 | 45,075 | |||||||||
| Other |
6,609 | 5,950 | 6,193 | |||||||||
|
|
|
|
|
|
|
|||||||
| Total revenue |
333,333 | 313,240 | 294,129 | |||||||||
|
|
|
|
|
|
|
|||||||
| Cost of revenue: |
||||||||||||
| Software(1) |
36,360 | 31,962 | 27,406 | |||||||||
| Software related services |
26,888 | 27,653 | 30,079 | |||||||||
|
|
|
|
|
|
|
|||||||
| Total software |
63,248 | 59,615 | 57,485 | |||||||||
| Client engineering services |
38,131 | 38,106 | 36,081 | |||||||||
| Other |
5,212 | 4,879 | 5,642 | |||||||||
|
|
|
|
|
|
|
|||||||
| Total cost of revenue |
106,591 | 102,600 | 99,208 | |||||||||
|
|
|
|
|
|
|
|||||||
| Gross profit |
226,742 | 210,640 | 194,921 | |||||||||
| Operating expenses: |
||||||||||||
| Research and development(1) |
93,234 | 71,325 | 62,777 | |||||||||
| Sales and marketing(1) |
79,958 | 66,086 | 63,080 | |||||||||
| General and administrative(1) |
87,979 | 57,202 | 54,069 | |||||||||
| Amortization of intangible assets |
5,448 | 3,322 | 2,624 | |||||||||
| Other operating income |
(6,620 | ) | (2,742 | ) | (2,576 | ) | ||||||
|
|
|
|
|
|
|
|||||||
| Total operating expenses |
259,999 | 195,193 | 179,974 | |||||||||
|
|
|
|
|
|
|
|||||||
| Operating (loss) income |
(33,257 | ) | 15,447 | 14,947 | ||||||||
| Interest expense |
2,160 | 2,265 | 2,416 | |||||||||
| Other expense (income), net |
994 | (520 | ) | 782 | ||||||||
|
|
|
|
|
|
|
|||||||
| (Loss) income before income taxes |
(36,411 | ) | 13,702 | 11,749 | ||||||||
| Income tax expense |
62,996 | 3,539 | 818 | |||||||||
|
|
|
|
|
|
|
|||||||
| Net (loss) income |
$ | (99,407 | ) | $ | 10,163 | $ | 10,931 | |||||
|
|
|
|
|
|
|
|||||||
| (Loss) income per share: |
||||||||||||
| Net (loss) income per share attributable to common stockholders, basic(2) |
$ | (1.89 | ) | $ | 0.21 | $ | 0.23 | |||||
| Net (loss) income per share attributable to common stockholders, diluted(2) |
$ | (1.89 | ) | $ | 0.18 | $ | 0.19 | |||||
| Weighted average shares outstanding: |
||||||||||||
| Weighted average number of shares used in computing net (loss) income per share, basic(2) |
52,466 | 48,852 | 46,609 | |||||||||
| Weighted average number of shares used in computing net (loss) income per share, diluted(2) |
52,466 | 57,856 | 58,709 | |||||||||
| Other financial information: |
||||||||||||
| Net cash provided by operating activities |
$ | 16,431 | $ | 21,385 | $ | 10,838 | ||||||
| (1) | Includes stock-based compensation expense as follows: |
36
Table of Contents
| Year ended December 31, | ||||||||||||
| (in thousands) | 2017 | 2016 | 2015 | |||||||||
| Cost of revenue—software |
$ | 350 | $ | 22 | $ | 44 | ||||||
| Research and development |
12,540 | 1,370 | 149 | |||||||||
| Sales and marketing |
7,693 | 775 | 109 | |||||||||
| General and administrative |
26,698 | 2,965 | 295 | |||||||||
|
|
|
|
|
|
|
|||||||
| Total stock-based compensation expense |
$ | 47,281 | $ | 5,132 | $ | 597 | ||||||
|
|
|
|
|
|
|
|||||||
| (2) | See Note 14 to our consolidated financial statements for an explanation of the method used to calculate basic and diluted net (loss) income per share attributable to common stockholders. |
| As of December 31, | ||||||||||||
| (in thousands) | 2017 | 2016 | 2015 | |||||||||
| Consolidated balance sheet data: |
||||||||||||
| Cash and cash equivalents |
$ | 39,213 | $ | 16,874 | $ | 13,756 | ||||||
| Working capital |
$ | (53,575 | ) | $ | (52,902 | ) | $ | (55,097 | ) | |||
| Total assets |
$ | 287,871 | $ | 250,776 | $ | 221,850 | ||||||
| Deferred revenue, current and non-current |
$ | 139,762 | $ | 113,929 | $ | 106,516 | ||||||
| Debt |
$ | 410 | $ | 85,241 | $ | 83,177 | ||||||
| Total stockholders’ equity (deficit) |
$ | 60,591 | $ | (34,653 | ) | $ | (42,039 | ) | ||||
Key metrics
We monitor the following key non-GAAP, (United States generally accepted accounting principles), financial and operating metrics to help us evaluate our business, measure our performance, identify trends affecting our business, formulate business plans and make strategic decisions. In addition to our results determined in accordance with GAAP, we believe the following non-GAAP financial and operating metrics are useful in evaluating our operating performance.
Billings. Billings consists of our total revenue plus the change in our deferred revenue in a given period. As we generally bill our customers at the time of sale, but typically recognize a majority of the related revenue ratably over time, management believes that Billings is a meaningful way to measure and monitor our ability to provide our business with the working capital generated by upfront payments from our customers. While we believe that billings provides valuable insight into the cash that will be generated from sales of our software and services, this metric may vary from period-to-period for a number of reasons including the impact of changes in foreign currency exchange rates and the potential impact of acquisitions. See the section entitled “Reconciliation of non-GAAP financial measures” for a reconciliation of Billings to revenue, the most directly comparable financial measure calculated in accordance with GAAP.
Our Billings were as follows:
| Year ended December 31, | ||||||||||||
| (in thousands) | 2017 | 2016 | 2015 | |||||||||
| Billings |
$ | 359,166 | $ | 320,653 | $ | 297,358 | ||||||
Adjusted EBITDA. We define Adjusted EBITDA as net (loss) income adjusted for income tax expense (benefit), interest expense, interest income and other, depreciation and amortization, stock-based compensation expense, restructuring charges, asset impairment charges and other special items as determined by management. We believe that Adjusted EBITDA is a meaningful measure of performance as it is commonly utilized by us and the investment community to analyze operating performance in our industry. See the section entitled “Reconciliation of non-GAAP financial measures” for a reconciliation of Adjusted EBITDA to net (loss) income, the most directly comparable financial measure calculated in accordance with GAAP.
37
Table of Contents
Our Adjusted EBITDA was as follows:
| Year ended December 31, | ||||||||||||
| (in thousands) | 2017 | 2016 | 2015 | |||||||||
| Adjusted EBITDA |
$ | 22,517 | $ | 30,830 | $ | 22,949 | ||||||
Free Cash Flow. Free Cash Flow is a non-GAAP financial measure that we calculate as cash flow provided by operating activities less capital expenditures. We believe that Free Cash Flow is useful in analyzing our ability to service and repay debt, when applicable, and return value directly to stockholders. See the section entitled “Reconciliation of non-GAAP financial measures” for a reconciliation of Free Cash Flow to net cash provided by operating activities, the most directly comparable financial measure calculated in accordance with GAAP.
Our Free Cash Flow was as follows:
| Year ended December 31, | ||||||||||||
| (in thousands) | 2017 | 2016 | 2015 | |||||||||
| Free Cash Flow |
$ | 8,569 | $ | 11,941 | $ | 5,605 | ||||||
Recurring Software License Rate. A key factor to our success is our recurring software license rate which we measure through billings, primarily derived from annual renewals of our existing subscription customer agreements. We calculate our recurring software license rate for a particular period by dividing (i) the sum of software term-based license billings, software license maintenance billings, and 20% of software perpetual license billings which we believe approximates maintenance as an element of the arrangement by (ii) the total software license billings including all term-based, maintenance, and perpetual license billings from all customers for that period. For the years ended December 31, 2017, 2016 and 2015, our recurring software license rate was 89%, 90% and 88%, respectively.
These non-GAAP financial measures reflect an additional way of viewing aspects of our business that, when viewed with our GAAP results and the accompanying reconciliations to corresponding GAAP financial measures included in the tables below, may provide a more complete understanding of factors and trends affecting our business. These non-GAAP financial measures should not be relied upon to the exclusion of GAAP financial measures and are by definition an incomplete understanding of the Company and must be considered in conjunction with GAAP measures.
We believe that the non-GAAP measures disclosed herein are only useful as an additional tool to help management and investors make informed decisions about our financial and operating performance and liquidity. By definition, non-GAAP measures do not give a full understanding of the Company. To be truly valuable, they must be used in conjunction with the comparable GAAP measures. In addition, non-GAAP financial measures are not standardized. It may not be possible to compare these financial measures with other companies’ non-GAAP financial measures having the same or similar names. We strongly encourage investors to review our consolidated financial statements and the notes thereto in their entirety and not to rely on any single financial measure.
Reconciliation of non-GAAP financial measures
The following tables provide reconciliations of revenue to Billings, net (loss) income to Adjusted EBITDA and net cash provided by operating activities to Free Cash Flow:
Billings
| Year ended December 31, | ||||||||||||
| (in thousands) | 2017 | 2016 | 2015 | |||||||||
| Revenue |
$ | 333,333 | $ | 313,240 | $ | 294,129 | ||||||
| Ending deferred revenue |
139,762 | 113,929 | 106,516 | |||||||||
| Beginning deferred revenue |
(113,929 | ) | (106,516 | ) | (103,287 | ) | ||||||
|
|
|
|
|
|
|
|||||||
| Billings |
$ | 359,166 | $ | 320,653 | $ | 297,358 | ||||||
|
|
|
|
|
|
|
|||||||
38
Table of Contents
Adjusted EBITDA
| Year Ended December 31, | ||||||||||||
| (in thousands) | 2017 | 2016 | 2015 | |||||||||
| Net (loss) income |
$ | (99,407 | ) | $ | 10,163 | $ | 10,931 | |||||
| Income tax expense |
62,996 | 3,539 | 818 | |||||||||
| Stock-based compensation |
47,281 | 5,132 | 597 | |||||||||
| Interest expense |
2,160 | 2,265 | 2,416 | |||||||||
| Interest income and other(1) |
(2,260 | ) | (249 | ) | (191 | ) | ||||||
| Depreciation and amortization |
11,747 | 9,980 | 8,378 | |||||||||
|
|
|
|
|
|
|
|||||||
| Adjusted EBITDA |
$ | 22,517 | $ | 30,830 | $ | 22,949 | ||||||
|
|
|
|
|
|
|
|||||||
| (1) | Includes a non-recurring adjustment for a change in estimated legal expenses resulting in $2.0 million of income for the year ended December 31, 2017. |
Free Cash Flow
| Year ended December 31, | ||||||||||||
| (in thousands) | 2017 | 2016 | 2015 | |||||||||
| Net cash provided by operating activities |
$ | 16,091 | $ | 21,385 | $ | 10,838 | ||||||
| Capital expenditures |
(7,522 | ) | (9,444 | ) | (5,233 | ) | ||||||
|
|
|
|
|
|
|
|||||||
| Free Cash Flow |
$ | 8,569 | $ | 11,941 | $ | 5,605 | ||||||
|
|
|
|
|
|
|
|||||||
39
Table of Contents
Item 7. Management’s Discussion and Analysis of Financial Condition and Results of Operations
The following discussion and analysis of our financial condition and results of operations should be read in conjunction with our audited consolidated financial statements (and notes thereto) for the year ended December 31, 2017 included elsewhere in this Annual Report on Form 10-K. This discussion contains forward-looking statements that involve risks and uncertainties. Our actual results could differ materially from those discussed below. Factors that could cause or contribute to such differences include, but are not limited to, those identified below and those discussed in “Risk factors” and “Cautionary Note Regarding Forward-Looking Statements” included elsewhere in this Annual Report on Form 10-K.
Overview
We are a leading provider of enterprise-class engineering software enabling innovation across the entire product lifecycle from concept design to in-service operation. Our simulation-driven approach to innovation is powered by our broad portfolio of high-fidelity and high-performance physics solvers. Our integrated suite of software optimizes design performance across multiple disciplines encompassing structures, motion, fluids, thermal management, electromagnetics, system modeling and embedded systems, while also providing data analytics and true-to-life visualization and rendering.
Our engineering and design platform offers a wide range of multi-disciplinary computer aided engineering, or CAE, solutions which we believe is one of the most innovative and comprehensive offerings available in the market. To ensure customer success and deepen our relationships with them, we engage with our customers to provide consulting, implementation services, training, and support, especially when applying optimization. We participate in five software categories related to CAE and high-performance computing, or HPC:
| • | Solvers & Optimization; |
| • | Modeling & Visualization; |
| • | Industrial & Concept Design; |
| • | Internet of Things, or IoT; and |
| • | HPC. |
Altair also provides client engineering services, or CES, to support our customers with long-term ongoing product design and development expertise. This has the benefit of embedding us within customers, deepening our understanding of their processes, and allowing us to more quickly perceive trends in the overall market. Our presence at our customers’ sites helps us to better tailor our software products’ research and development, or R&D, and sales initiatives.
We had total revenue of $333.3 million, $313.2 million and $294.1 million for the years ended December 31, 2017, 2016 and 2015, respectively, reflecting year-over-year increases of 6% and 7%. We had a net loss of $99.4 million for the year ended December 31, 2017, and generated net income of $10.2 million and $10.9 million for the years ended December 31, 2016 and 2015, respectively.
Our business model
We pioneered a patented units-based licensing subscription model for software and other digital content. Our customers license a pool of units for their organizations, which allows individual users within the organization to have flexible and shared access to our entire portfolio of software applications, along with over 150 partner products. We believe our units-based subscription licensing model lowers barriers to adoption, creates broad engagement, encourages users to work within our ecosystem, and increases revenue. This, in turn, helps drive our recurring software license rate which has been on average approximately 88% over the past five years. Each year approximately 60% of new revenue comes from expansion within existing customers.
Initial public offering
On November 3, 2017, we closed our initial public offering and sold 9,865,004 shares of our Class A common stock at a public offering price of $13.00 per share for an aggregate offering price of approximately $128.2 million. We received net proceeds of $114.4 million, after deducting underwriting discounts, commissions and offering expenses.
Factors affecting our performance
We believe that our future success will depend on many factors, including those described below. While these areas present significant opportunity, they also present risks that we must manage to achieve successful results. If we are unable to address these challenges, our business, operating results and prospects could be harmed. See Part I, Item 1A. – Risk Factors included elsewhere in this Annual Report on Form 10-K.
40
Table of Contents
Seasonality and quarterly results
Our billings have historically been highest in the first and fourth quarters of any calendar year and may vary in future quarters. The timing of recording billings and the corresponding effect on our cash flows may vary due to the seasonality of the purchasing patterns of our customers. In addition, the timing of the recognition of revenue, the amount and timing of operating expenses, including employee compensation, sales and marketing activities, and capital expenditures, may vary from quarter-to-quarter which may cause our reported results to fluctuate significantly. In addition, we may choose to grow our business for the long-term rather than to optimize for profitability or cash flows for a particular shorter-term period. This seasonality or the occurrence of any of the factors above may cause our results of operations to vary and our financial statements may not fully reflect the underlying performance of our business.
Foreign currency fluctuations
Because of our substantial international operations, we are exposed to foreign currency risks that arise from our normal business operations, as well as our transactions that are denominated in foreign currencies, including the Euro, British Pound Sterling, Indian Rupee, Japanese Yen, and Chinese Yuan. To present the changes in our underlying business without regard to the impact of currency fluctuations, we evaluate certain of our operating results both on an as reported basis, as well as on a constant currency basis.
Constant currency amounts exclude the effect of foreign currency fluctuations on our reported results. Our comparative financial results were impacted by fluctuations in the value of the United States dollar relative to other currencies during the year ended December 31, 2017, as compared to the year ended December 31, 2016. To present this information, the results for 2017 for entities whose functional currency is a currency other than the United States dollar were converted to United States dollars at rates that were in effect for 2016. These adjusted amounts are then compared to our current period reported amounts to provide operationally driven variances in our results.
The effects of currency fluctuations on our Revenue and Adjusted EBITDA are reflected in the table below. Amounts in brackets indicate a net adverse impact from currency fluctuations.
| (in thousands) | Year ended December 31, 2017 |
|||
| Revenue |
$ | 967 | ||
| Adjusted EBITDA |
$ | (474 | ) | |
Expanded use of our software applications
Our ability to grow our revenue is affected, in part, by the pace at which our customers continue to expand their use of our design, simulation, optimization and analysis applications and the degree to which prospective customers realize the benefit of using our software applications. To grow our presence within our customers and attract new customers, we devote substantial sales and marketing resources to drive increased adoption across our existing customers and encourage new customers to commence using our software. As a result of this “land and expand” business model, we expect to generate additional revenue from our current and future customer base. To the extent our sales and marketing efforts do not translate into customer retention or expansion, or if we do not allocate those expenses efficiently, our financial performance may be adversely affected. Therefore, our financial performance will depend in part on the degree to which our “land and expand” strategies are successful.
Investments for growth
We have made and plan to continue to make investments for long-term growth, including investments in our ongoing research and development activities seeking to create new software and to enhance our existing applications to address emerging technology trends and additional customer needs. Generally, the development of new or improved applications in our software can result in the expansion of our user base within an organization and a potential increase in revenue over time, although the expenditures associated with such developments may adversely affect our performance in the near term. We intend to continue to invest resources in sales and marketing, by further expanding our sales teams and increasing our marketing activities. Our ability to continue to grow revenue from our current and potential customer base is dependent, in part, upon the success of our current and future research and development and sales and marketing activities.
Business segments
We have identified two reportable segments: Software and Client Engineering Services:
41
Table of Contents
| • | Software—our Software segment includes software and software related services. The software component of this segment includes our portfolio of software products including our solvers and optimization technology products, modeling and visualization tools, industrial and concept design tools, IoT platform and analytics tools, and high-performance computing, or HPC, software applications, as well as support and the complementary software products we offer through our Altair Partner Alliance, or APA. The APA includes technologies ranging from computational fluid dynamics and fatigue to manufacturing process simulation and cost estimation. The software related services component of this segment includes consulting, implementation services, and training focused on product design and development expertise and analysis from the component level up to complete product engineering. |
| • | Client Engineering Services—our client engineering services, or CES, segment provides client engineering services to support our customers with long-term, ongoing product design and development expertise. We operate our CES business by hiring engineers for placement at a customer site for specific customer-directed assignments. We employ and pay the engineers only for the duration of the placement. |
Our other businesses which do not meet the criteria to be separate reportable segments are combined and reported as “Other” which represents innovative services and products, including toggled, our LED lighting business. toggled is focused on developing and selling next-generation solid state lighting technology along with communication and control protocols based on our intellectual property for the direct replacement of fluorescent light tubes with LED lamps. Other businesses combined within Other include our WEYV business, a consumer music and content service, and potential services and product concepts that are still in their development stages.
For additional information about our reportable segments and other businesses, see Note 19 in the Notes to consolidated financial statements in Item 15, Part IV of this Annual Report on Form 10-K.
Components of results of operations
Revenue
We primarily derive revenue from our units-based subscription licensing model for software and other digital content, other software licensing, and software related services. Our CES business derives revenue from providing engineers to support our customers’ long-term, ongoing product design and development projects.
Software segment
Software segment revenue consists of revenue from software licenses and software related services including consulting, implementation services, training, and support.
Software
Software revenue is principally comprised of subscription license agreements, typically with 12-month terms, which include maintenance and support. Software revenue is also comprised of perpetual license agreements, and associated maintenance and support agreements. We generally recognize software license revenue ratably over the period of the arrangement. Each year approximately 60% of our new revenue comes from expansion within existing customers.
Software related services
Software related services includes consulting, implementation services and training. Our software related services team is comprised of almost 700 highly technical people globally. We focus on establishing a strong working relationship with the user community allowing us to offer guidance and expertise throughout their product creation process. We generally recognize revenue for software related services on a time and materials or, for fixed price arrangements, on a proportional performance basis.
Client engineering services segment
We provide CES to support our customers with long-term, ongoing product design and development expertise. We operate our CES business by hiring engineers for placement at a customer site for specific customer-directed assignments. We employ and pay the engineers only for the duration of the placement.
Our CES business generates revenue from placing simulation specialists, industrial designers, design engineers, materials experts, development and test engineers, manufacturing engineers and information technology specialists on-site with our customers in businesses operating in the virtual simulation, product design and development, software development, and high-performance computing spaces. We recognize CES revenue based upon hours worked and contractually agreed-upon hourly rates.
The average CES assignment was 1.5 years during the period from 2011 through 2017, with a current average length of service for all CES employees of 1.9 years. As of December 31, 2017, 53% of CES employees were in their assignments for over two years. The terms of our CES arrangements generally provide that our customers pay us within 30 days of invoice. The amount and timing of CES revenue depends on our customers demand for engineering services and the number of available qualified employees to service our customers’ needs.
42
Table of Contents
Other
Our Other revenue consists primarily of revenue related to our LED lighting business operated out of our wholly-owned subsidiary, toggled. toggled designs, sources through contract manufacturers, and assembles in our own facilities, LED lighting and related products for sale to consumers and businesses. We also generate revenue through royalties from licensing our technology to third party manufacturers and resellers.
Cost of revenue
Software segment
Cost of software revenue consists of expenses related to software licensing and customer support. Significant expenses include employee related costs for support team members, travel costs, and royalties for third-party software products available to customers through our products or as part of our APA.
Software
Cost of software revenue consists of the cost of personnel and related costs such as salaries, benefits, bonuses and stock-based compensation, travel expenses and certain data center and facility costs and substantially all royalty expenses.
Software related services
Cost of software related services revenue consists of the cost of personnel and related costs such as salaries, benefits, bonuses and stock-based compensation, travel expenses and certain data center and facility costs.
Cost of client engineering services
Cost of engineering services revenue consists primarily of employee compensation costs. We operate our CES business by hiring engineers for placement at a customer site for specific customer-directed assignments. We employ and pay the engineers only for the duration of the placement.
Cost of other
Cost of other revenue includes the cost of LED lighting products and freight related to products sold to retail and commercial sales channels and third-party royalty expense related to our WEYV business.
Operating expenses
Operating expenses, as defined and discussed below, support all the products and services that we provide to our customers and, as a result, they are presented in an aggregate total.
Research and development
Research and development expenses consist primarily of expenses of our development team, including salaries, benefits, bonuses, stock-based compensation expense and allocated overhead costs. Our research and development efforts are focused on enhancing the functionality, breadth and scalability of our software, addressing new use cases, and developing additional innovative simulation technologies. Timely development of new products is essential to maintaining our competitive position, and we release new versions of our software on a regular basis. All software development costs are expensed as incurred as our current software development process is essentially completed concurrent with the establishment of technological feasibility.
Sales and marketing
Sales and marketing expenses consist primarily of the cost of personnel and related costs associated with our sales and marketing staff, including salaries, benefits, bonuses, commissions and stock-based compensation, and costs relating to our marketing and business development programs including trade shows and events. We intend to continue to invest resources in our sales and marketing initiatives to drive growth and extend our market position.
General and administrative
General and administrative expenses consist of personnel costs and related expenses for executive, finance, legal, human resources, recruiting, and employee-related information technology and administrative personnel, including salaries, benefits, bonuses and stock-based compensation expense, professional fees for external legal, accounting, facilities, recruiting and other consulting services, allocated overhead costs, and legal settlements.
43
Table of Contents
Amortization of intangible assets
Amortization of intangible assets consists primarily of amortization of intangibles associated with acquisitions. We expect to incur additional amortization expenses resulting from future strategic acquisitions.
Other operating income
Other operating income consists primarily of government subsidies, primarily in France, in the form of grant income associated with certain of our research and development activities.
Interest expense
Interest expense consists of interest expense on our outstanding indebtedness and accretion of interest expense on debt issuance costs.
Other expense (income), net
Other expense (income), net is comprised primarily of foreign currency exchange gains and losses generated from the settlement and remeasurement of transactions denominated in currencies other than the functional currency of our operating units.
Income tax expense
Income tax expense is comprised primarily of income taxes related to United States, foreign, and state jurisdictions in which we conduct business. We record interest and penalties related to income tax matters as income tax expense. We expect the amount of income tax expense, if any, to vary each reporting period depending upon fluctuations in our income. We have substantial United States tax credit carryforwards which, if not utilized, will begin to expire in 2018. The ability to utilize these tax credit carryforwards is highly dependent upon our ability to generate taxable income in the United States in the future.
Our future effective annual tax rate may be materially impacted by the amount of benefits and charges from tax amounts associated with our foreign earnings that are taxed at rates different from the federal statutory rate, changes in valuation allowances, level of profit before tax, accounting for uncertain tax positions, stock-based compensation, business combinations, closure of statute of limitations, or settlements of tax audits, and changes in tax laws including United States tax law changes that were enacted in December 2017, and change how United States multinational companies are taxed on foreign subsidiary earnings. A significant amount of our earnings is generated in the EMEA and APAC regions. Our future effective tax rates may be adversely affected to the extent earnings are lower than anticipated in countries where we have lower statutory tax rates or we repatriate certain foreign earnings on which United States taxes have not previously been provided.
As of December 31, 2017 and 2016, we had gross deferred tax assets, or DTAs, of $73.6 million and $75.0 million, respectively, primarily related to tax credits, share-based compensation, deferred revenue, and capitalized research and development expenses. We are also entitled to a United States federal tax deduction when non-qualified stock options, or NSOs, are exercised. In connection with our IPO, a significant number of our NSOs were exercised, resulting in a tax deduction for United States income tax purposes. This deduction, in conjunction with other expected exercises of NSOs and deferred tax asset reversals, resulted in our needing to establish a valuation allowance for $47.0 million in 2017 for the United States DTAs. Our ability to utilize any net operating losses or tax credits may be limited under provisions of the Code if we undergo an ownership change after our IPO (generally defined as a greater than 50-percentage point cumulative change (by value) in the equity ownership of certain stockholders over a rolling three-year period). We may also be unable to realize our tax credit carryforwards as they begin to expire in 2018.
Based on the evidence available including a lack of taxable earnings in the United States, we recorded a valuation allowance against substantially all of our net deferred tax assets in the United States. If a change in judgment regarding this valuation allowance were to occur in the future, we will record a potentially material deferred tax benefit, which could result in a favorable impact on our effective tax rate in that period. The utilization of tax attributes to offset taxable income reduces the amount of deferred tax assets subject to a valuation allowance.
The enactment of the Tax Cuts and Jobs Act (the “Tax Act”) in the United States on December 22, 2017, significantly revised the U.S. corporate income tax by, among other things, lowering corporate income tax rates from 35% to 21% and imposing a one-time transition tax on deemed repatriated earnings of foreign subsidiaries. Pursuant to the guidance within SEC Staff Accounting Bulletin No. 118 (“SAB 118”), as of December 31, 2017, we recognized the provisional effects of the enactment of the Tax Act for which measurement could be reasonably estimated. Although we continue to analyze certain aspects of the Tax Act and refine its assessment, the ultimate impact of the Tax Act may differ from these estimates due to our continued analysis or further regulatory guidance that may be issued as a result of the Tax Act. Pursuant to SAB 118, adjustments to the provisional amounts recorded by the Company as of December 31, 2017, that are identified within a subsequent measurement period of up to one year from the enactment date, will be included as an adjustment to tax expense from continuing operations in the period the amounts are determined.
44
Table of Contents
We remeasured certain U.S. deferred tax assets and liabilities based on the rates at which they are expected to reverse in the future, which is generally 21%. However, we are still analyzing certain aspects of the Tax Act and refining our calculations, which could potentially affect the measurement of these balances or potentially give rise to new deferred tax amounts. The provisional amount recorded related to the remeasurement of net deferred tax assets and deferred tax liabilities was a net tax charge of $15.4 million, which was fully offset by an adjustment to the valuation allowance. Additionally, we recorded a deferred tax benefit of $1.3 million for the reduction of a deferred tax liability related to an indefinite lived intangible asset. The Tax Act did not change our judgment regarding the realizability of these net deferred tax assets.
The one-time transition tax is based on our total post-1986 earnings and profits (“E&P”) that were previously deferred from U.S. income taxes and for which no deferred taxes were recorded since we previously claimed the indefinite reinvestment assertion exception on these earnings. In December 2017, we recorded a provisional amount for our one-time transition tax liability of $4.2 million, net of foreign tax credits. We have not yet completed our calculation of the total post-1986 E&P and associated foreign tax credits for these foreign subsidiaries. Further, the transition tax is based in part on the amount of those earnings held in cash and other specified assets. This amount may change when we finalize the calculation of post-1986 foreign E&P previously deferred from U.S. federal taxation, and finalize the amounts held in cash or other specified assets. We anticipate that additional guidance and clarification regarding the implementation of the transition tax will be issued by federal and state taxing authorities and our estimate is, therefore, subject to future refinement. No additional income taxes (other than those related to the foreign earnings inclusion taxable under the transition tax) have been provided for any remaining undistributed foreign earnings not subject to the transition tax, or any additional outside basis difference inherent in these entities, as these amounts provisionally continue to be indefinitely reinvested in foreign operations. We continue to apply ASC 740 based on the provisions of the tax laws that were in effect immediately prior to the Tax Act being enacted since we cannot complete our analysis of whether a change in our indefinite reinvestment assertion would occur until additional guidance is available and the transition tax liability computation is complete.
Additional guidance is likely to be issued providing further clarification on the application of the Tax Act. Further, it is reasonable to expect that global taxing authorities will be reviewing current legislation for potential modifications in reaction to the implementation of the U.S. legislation. This additional guidance, along with the potential for additional global tax legislation changes, could have a material adverse impact on our net income and cash flow by impacting significant deductions or income inclusions.
45
Table of Contents
Results of operations
The following table sets forth our results of operations and certain financial data for the years ended December 31, 2017, 2016 and 2015:
| Year ended December 31, | ||||||||||||
| (in thousands) | 2017 | 2016 | 2015 | |||||||||
| Revenue: |
||||||||||||
| Software |
$ | 244,817 | $ | 223,818 | $ | 205,567 | ||||||
| Software related services |
35,397 | 35,770 | 37,294 | |||||||||
|
|
|
|
|
|
|
|||||||
| Total software |
280,214 | 259,588 | 242,861 | |||||||||
| Client engineering services |
46,510 | 47,702 | 45,075 | |||||||||
| Other |
6,609 | 5,950 | 6,193 | |||||||||
|
|
|
|
|
|
|
|||||||
| Total revenue |
333,333 | 313,240 | 294,129 | |||||||||
|
|
|
|
|
|
|
|||||||
| Cost of revenue: |
||||||||||||
| Software |
36,360 | 31,962 | 27,406 | |||||||||
| Software related services |
26,888 | 27,653 | 30,079 | |||||||||
|
|
|
|
|
|
|
|||||||
| Total software |
63,248 | 59,615 | 57,485 | |||||||||
| Client engineering services |
38,131 | 38,106 | 36,081 | |||||||||
| Other |
5,212 | 4,879 | 5,642 | |||||||||
|
|
|
|
|
|
|
|||||||
| Total cost of revenue |
106,591 | 102,600 | 99,208 | |||||||||
|
|
|
|
|
|
|
|||||||
| Gross profit |
226,742 | 210,640 | 194,921 | |||||||||
| Operating expenses: |
||||||||||||
| Research and development |
93,234 | 71,325 | 62,777 | |||||||||
| Sales and marketing |
79,958 | 66,086 | 63,080 | |||||||||
| General and administrative |
87,979 | 57,202 | 54,069 | |||||||||
| Amortization of intangible assets |
5,448 | 3,322 | 2,624 | |||||||||
| Other operating income |
(6,620 | ) | (2,742 | ) | (2,576 | ) | ||||||
|
|
|
|
|
|
|
|||||||
| Total operating expenses |
259,999 | 195,193 | 179,974 | |||||||||
|
|
|
|
|
|
|
|||||||
| Operating (loss) income |
(33,257 | ) | 15,447 | 14,947 | ||||||||
| Interest expense |
2,160 | 2,265 | 2,416 | |||||||||
| Other expense (income), net |
994 | (520 | ) | 782 | ||||||||
|
|
|
|
|
|
|
|||||||
| (Loss) income before income taxes |
(36,411 | ) | 13,702 | 11,749 | ||||||||
| Income tax expense |
62,996 | 3,539 | 818 | |||||||||
|
|
|
|
|
|
|
|||||||
| Net (loss) income |
$ | (99,407 | ) | $ | 10,163 | $ | 10,931 | |||||
|
|
|
|
|
|
|
|||||||
| Other financial information: |
||||||||||||
| Billings(1) |
$ | 359,166 | $ | 320,653 | $ | 297,358 | ||||||
| Adjusted EBITDA(2) |
$ | 22,517 | $ | 30,830 | $ | 22,949 | ||||||
| Net cash provided by operating activities |
$ | 16,091 | $ | 21,385 | $ | 10,838 | ||||||
| Free Cash Flow(3) |
$ | 8,569 | $ | 11,941 | $ | 5,605 | ||||||
| (1) | Billings consists of our total revenue plus the change in our deferred revenue. For more information about Billings and our other non-GAAP financial measures and reconciliations of our non-GAAP financial measures to the most directly comparable financial measures calculated and presented in accordance with GAAP, see Item 6, Selected Financial Data of this Annual Report on Form 10-K. |
| (2) | We define Adjusted EBITDA as net (loss) income adjusted for income tax expense (benefit), interest expense, interest income and other, depreciation and amortization, stock-based compensation expense, restructuring charges, asset impairment charges and other special items as determined by management. For more information about Adjusted EBITDA and our other non-GAAP financial measures and reconciliations of our non-GAAP financial measures to the most directly comparable financial measure calculated and presented in accordance with GAAP, see Item 6, Selected Financial Data of this Annual Report on Form 10-K. |
| (3) | We define Free Cash Flow as net cash provided by operating activities less capital expenditures. For a reconciliation of Free Cash Flow, see Reconciliation of non-GAAP financial measures in Item 6, Selected Financial Data of this Annual Report on Form 10-K. |
46
Table of Contents
The following table sets forth our revenue growth on a constant currency basis for the year ended December 31, 2017 compared to the year ended December 31, 2016:
| Year ended December 31, |
Change | Constant currency change(1) |
||||||||||||||
| (dollars in thousands) | 2017 | 2016 | % | % | ||||||||||||
| Revenue: |
||||||||||||||||
| Software |
$ | 244,817 | $ | 223,818 | 9% | 9% | ||||||||||
| Software related services |
35,397 | 35,770 | (1% | ) | (1% | ) | ||||||||||
|
|
|
|
|
|||||||||||||
| Total software |
280,214 | 259,588 | 8% | 8% | ||||||||||||
| Client engineering services |
46,510 | 47,702 | (3% | ) | (3% | ) | ||||||||||
| Other |
6,609 | 5,950 | 11% | 11% | ||||||||||||
|
|
|
|
|
|||||||||||||
| Total revenue |
$ | 333,333 | $ | 313,240 | 6% | 6% | ||||||||||
|
|
|
|
|
|||||||||||||
| (1) | The results for entities whose functional currency is a currency other than the United States dollar were converted to United States dollars at rates that were in effect for the corresponding period of the prior year. |
Years ended December 31, 2017 and 2016
Revenue
Total revenue increased by $20.1 million, or 6%, for the year ended December 31, 2017, as compared to the year ended December 31, 2016. This increase was primarily attributable to an increase in subscription and software revenue.
Software segment
Software
| Year ended December 31, |
Change | |||||||||||||||
| (dollars in thousands) | 2017 | 2016 | $ | % | ||||||||||||
| Software revenue |
$ | 244,817 | $ | 223,818 | $ | 20,999 | 9% | |||||||||
| As a percent of software segment revenue |
87% | 86% | ||||||||||||||
| As a percent of consolidated revenue |
73% | 71% | ||||||||||||||
The 9% increase in our software revenue for the year ended December 31, 2017, as compared to the year ended December 31, 2016, was primarily the result of an expansion in the number of units licensed by our existing customers under renewed software license agreements and, to a lesser extent, licensing of units to new customers pursuant to new software license agreements. This increase in software revenue occurred across all regions with the largest increase derived from Europe.
Software related services
| Year ended December 31, |
Change | |||||||||||||||
| (dollars in thousands) | 2017 | 2016 | $ | % | ||||||||||||
| Software related services revenue |
$ | 35,397 | $ | 35,770 | $ | (373 | ) | (1% | ) | |||||||
| As a percent of software segment revenue |
13% | 14% | ||||||||||||||
| As a percent of consolidated revenue |
11% | 11% | ||||||||||||||
Software related services revenue decreased $0.4 million, or 1%, for the year ended December 31, 2017, as compared to the year ended December 31, 2016.
Client engineering services segment
| Year ended December 31, |
Change | |||||||||||||||
| (dollars in thousands) | 2017 | 2016 | $ | % | ||||||||||||
| Client engineering services revenue |
$ | 46,510 | $ | 47,702 | $ | (1,192 | ) | (3% | ) | |||||||
| As a percent of consolidated revenue |
14% | 15% | ||||||||||||||
47
Table of Contents
CES revenue decreased $1.2 million, or 3%, for the year ended December 31, 2017, as compared to the year ended December 31, 2016. CES business revenue decreased as we filled fewer open positions.
Other
| Year ended December 31, |
Change | |||||||||||||||
| (dollars in thousands) | 2017 | 2016 | $ | % | ||||||||||||
| Other revenue |
$ | 6,609 | $ | 5,950 | $ | 659 | 11% | |||||||||
| As a percent of consolidated revenue |
2% | 2% | ||||||||||||||
The 11% increase in other revenue for the year ended December 31, 2017, as compared to the year ended December 31, 2016, was primarily due to increased sales and royalties from our lighting technology.
Cost of revenue
Software segment
Software
| Year ended December 31, |
Change | |||||||||||||||
| (dollars in thousands) | 2017 | 2016 | $ | % | ||||||||||||
| Cost of software revenue |
$ | 36,360 | $ | 31,962 | $ | 4,398 | 14% | |||||||||
| As a percent of software revenue |
15% | 14% | ||||||||||||||
| As a percent of consolidated revenue |
11% | 10% | ||||||||||||||
Cost of software revenue increased by $4.4 million, or 14%, for the year ended December 31, 2017, as compared to the year ended December 31, 2016. This increase was primarily attributable to higher employee costs of $2.3 million as a result of annual compensation adjustments and the addition of new personnel in connection with acquisitions, an increase in travel expense of $0.6 million, increased stock-based compensation expense of $0.3 million and increased third party royalty costs of $0.7 million for software programs.
Software related services
| Year ended December 31, |
Change | |||||||||||||||
| (dollars in thousands) | 2017 | 2016 | $ | % | ||||||||||||
| Cost of software related services revenue |
$ | 26,888 | $ | 27,653 | $ | (765 | ) | (3% | ) | |||||||
| As a percent of software related services revenue |
76% | 77% | ||||||||||||||
| As a percent of consolidated revenue |
8% | 9% | ||||||||||||||
Cost of software related services revenue decreased by $0.8 million, or 3%, for the year ended December 31, 2017, as compared to the year ended December 31, 2016, primarily related to a decrease in software related services revenue.
Client engineering services segment
| Year ended December 31, |
Change | |||||||||||||||
| (dollars in thousands) | 2017 | 2016 | $ | % | ||||||||||||
| Cost of client engineering services revenue |
$ | 38,131 | $ | 38,106 | $ | 25 | — % | |||||||||
| As a percent of client engineering services segment revenue |
82% | 80% | ||||||||||||||
| As a percent of consolidated revenue |
11% | 12% | ||||||||||||||
Cost of CES revenue was consistent for the year ended December 31, 2017, as compared to the year ended December 31, 2016. However, margins in our CES business were lower in 2017 due to increased salary costs relative to customer approved bill rates for certain positions.
48
Table of Contents
Other
| Year ended December 31, |
Change | |||||||||||||||
| (dollars in thousands) | 2017 | 2016 | $ | % | ||||||||||||
| Cost of other revenue |
$ | 5,212 | $ | 4,879 | $ | 333 | 7% | |||||||||
| As a percent of other revenue |
79% | 82% | ||||||||||||||
| As a percent of consolidated revenue |
2% | 2% | ||||||||||||||
Cost of other revenue increased by $0.3 million, or 7%, for the year ended December 31, 2017, as compared to the year ended December 31, 2016. This was due to an increase in third party royalty expense associated with launch of WEYV, partially offset by a decrease in manufacturing costs from negotiated reductions in pricing from suppliers for the LED lighting business.
Gross profit
| Year ended December 31, |
Change | |||||||||||||||
| (dollars in thousands) | 2017 | 2016 | $ | % | ||||||||||||
| Gross profit |
$ | 226,742 | $ | 210,640 | $ | 16,102 | 8% | |||||||||
| As a percent of consolidated revenue |
68% | 67% | ||||||||||||||
Gross profit increased by $16.1 million, or 8%, for the year ended December 31, 2017, as compared to the year ended December 31, 2016. This increase in gross profit was primarily attributable to the growth of our software revenue of $21.0 million driven by the expansion in the number of units purchased by our existing customers and, to a lesser extent, sales to new customers. The increase in revenue was partially offset by the increase in cost of revenue as described above.
Operating expenses
Operating expenses, as discussed below, support all products and services that we provide to our customers and, as a result, they are reported and discussed here in an aggregate total.
Research and development
| Year ended December 31, |
Change | |||||||||||||||
| (dollars in thousands) | 2017 | 2016 | $ | % | ||||||||||||
| Research and development |
$ | 93,234 | $ | 71,325 | $ | 21,909 | 31% | |||||||||
| As a percent of consolidated revenue |
28% | 23% | ||||||||||||||
Research and development expenses increased by $21.9 million, or 31%, for the year ended December 31, 2017, as compared to the year ended December 31, 2016. This increase was attributable to higher employee costs of $9.9 million resulting from an increase in our headcount, primarily due to acquisitions and annual compensation adjustments. In addition, stock-based compensation expense increased by $11.2 million for the year ended December 31, 2017, as compared to the year ended December 31, 2016, due to the increased value of our shares of common stock. Excluding the impact of stock-based compensation, research and development expenses increased by 15%, from $70.0 million to $80.7 million for the years ended December 31, 2016 and 2017, respectively.
Sales and marketing
| Year ended December 31, |
Change | |||||||||||||||
| (dollars in thousands) | 2017 | 2016 | $ | % | ||||||||||||
| Sales and marketing |
$ | 79,958 | $ | 66,086 | $ | 13,872 | 21% | |||||||||
| As a percent of consolidated revenue |
24% | 21% | ||||||||||||||
Sales and marketing expenses increased by $13.9 million, or 21%, for the year ended December 31, 2017, as compared to the year ended December 31, 2016. Employee compensation costs increased $4.4 million, sales and marketing campaigns to support our direct sales force increased $1.0 million, and travel and trade show related expense increased $1.4 million during the year ended December 31, 2017, as compared to the prior year. In addition, stock-based compensation expense increased by $6.9 million for the year ended December 31, 2017, as compared to the year ended December 31, 2016, due to the increased value of our shares of common stock. Excluding the impact of stock-based compensation, sales and marketing expenses increased by 11%, from $65.3 million to $72.3 million for the years ended December 31, 2016 and 2017, respectively.
49
Table of Contents
General and administrative
| Year ended December 31, |
Change | |||||||||||||||
| (dollars in thousands) | 2017 | 2016 | $ | % | ||||||||||||
| General and administrative |
$ | 87,979 | $ | 57,202 | $ | 30,777 | 54% | |||||||||
| As a percent of consolidated revenue |
26% | 18% | ||||||||||||||
General and administrative expenses increased by $30.8 million, or 54%, for the year ended December 31, 2017, as compared to the year ended December 31, 2016. Employee compensation cost increased $2.7 million, software maintenance expense increased $1.3 million, rent expense increased $1.3 million from new leases and facilities acquired, and professional services increased $1.2 million primarily due to additional costs of being a public company during the year ended December 31, 2017, as compared to the prior year. In addition, stock-based compensation expense increased by $23.7 million for the year ended December 31, 2017, as compared to the year ended December 31, 2016, due to the increased value of our shares of common stock. Excluding the impact of stock-based compensation, general and administrative expenses increased by 13%, from $54.2 million to $61.3 million for the years ended December 31, 2016 and 2017, respectively.
Amortization of intangible assets
| Year ended December 31, |
Change | |||||||||||||||
| (dollars in thousands) | 2017 | 2016 | $ | % | ||||||||||||
| Amortization of intangible assets |
$ | 5,448 | $ | 3,322 | $ | 2,126 | 64% | |||||||||
| As a percent of consolidated revenue |
2% | 1% | ||||||||||||||
Amortization of intangible assets increased by $2.1 million, or 64%, for the year ended December 31, 2017, as compared to the year ended December 31, 2016. This increase was attributable to the amortization of intangible assets associated with acquisitions completed during the year ended December 31, 2017, and a full year of amortization related to acquisitions completed during the year ended December 31, 2016.
Other operating income
| Year ended December 31, |
Change | |||||||||||||||
| (dollars in thousands) | 2017 | 2016 | $ | % | ||||||||||||
| Other operating income |
$ | (6,620 | ) | $ | (2,742 | ) | $ | 3,878 | 141% | |||||||
| As a percent of consolidated revenue |
2% | 1% | ||||||||||||||
Other operating income increased by $3.9 million, or 141%, for the year ended December 31, 2017, as compared to the year ended December 31, 2016. This increase was due to a non-recurring adjustment of $2.0 million for a change in estimated legal expenses during the year ended December 31, 2017, and an increase in government subsidies, primarily in France, in the form of grant income, including refundable R&D credits.
Interest expense
| Year ended December 31, |
Change | |||||||||||||||
| (dollars in thousands) | 2017 | 2016 | $ | % | ||||||||||||
| Interest expense |
$ | 2,160 | $ | 2,265 | $ | (105 | ) | (5% | ) | |||||||
| As a percent of consolidated revenue |
1% | 1% | ||||||||||||||
Interest expense decreased by $0.1 million, or 5%, for the year ended December 31, 2017, as compared to the year ended December 31, 2016. The decrease in interest costs was due to paying off the term loan and line-of-credit with IPO proceeds in the fourth quarter of 2017.
50
Table of Contents
Other expense (income), net
| Year ended December 31, |
Change | |||||||||||||||
| (dollars in thousands) | 2017 | 2016 | $ | % | ||||||||||||
| Other expense (income), net |
$ | 994 | $ | (520 | ) | $ | 1,514 | NM | ||||||||
| As a percent of consolidated revenue |
— % | — % | ||||||||||||||
Other expense (income), net increased by $1.5 million for the year ended December 31, 2017, as compared to the year ended December 31, 2016. This increase was due to fluctuations in the United States dollar relative to other functional currencies during the year ended December 31, 2017, as compared to the prior year.
Income tax expense
| Year ended December 31, |
Change | |||||||||||||||
| (dollars in thousands) | 2017 | 2016 | $ | % | ||||||||||||
| Income tax expense |
$ | 62,996 | $ | 3,539 | $ | 59,457 | NM | |||||||||
Income tax expense increased by $59.5 million for the year ended December 31, 2017, as compared to the year ended December 31, 2016. This increase is primarily due to a $47.0 million increase in tax expense related to the recording of a valuation allowance on the U.S. deferred tax assets, a $15.4 million increase due to the remeasurement of net deferred tax assets and liabilities as part of the Tax Act, an $8.8 million increase due to nondeductible stock-based compensation, a $4.2 million increase due to the one-time transition tax and a $1.0 million increase in foreign income taxes at rates other than the federal statutory rate, partially offset by a $17.5 million decrease in pre-tax income mainly in the United States. See Note 13 in the Notes to consolidated financial statements in Item 15, Part IV of this Annual Report on Form 10-K.
Net (loss) income
| Year ended December 31, |
Change | |||||||||||||||
| (dollars in thousands) | 2017 | 2016 | $ | % | ||||||||||||
| Net (loss) income |
$ | (99,407 | ) | $ | 10,163 | $ | (109,570 | ) | NM | |||||||
Net income decreased by $109.6 million resulting in a net loss of $99.4 million for the year ended December 31, 2017, as compared to net income of $10.2 million for the year ended December 31, 2016. This decrease in net income was primarily attributable to a valuation allowance on our deferred tax assets of $47.4 million, increased stock-based compensation expense of $42.1 million and increased cost of revenue which related to higher employee related costs and royalty share payments to our partners for the year ended December 31, 2017. Operating expenses increased primarily due to annual employee cost adjustments, employees who joined us in connection with acquisitions in 2017, and a full year of compensation expense for employees who joined in connection with acquisitions completed in 2016. These increased costs are partially offset by increased revenue in the Software segment.
Years ended December 31, 2016 and 2015
Revenue
Total revenue increased by $19.1 million, or 6%, for the year ended December 31, 2016, as compared to the year ended December 31, 2015. This increase was primarily attributable to an increase in software revenue of $18.3 million, or 9%, for the same period, partially offset by a decrease in software related services revenue of $1.5 million, or 4%. Our CES revenue also increased by $2.6 million, or 6% for the year ended December 31, 2016, as compared to the corresponding prior year.
51
Table of Contents
Software segment
Software
| Year ended December 31, |
Change | |||||||||||||||
| (dollars in thousands) | 2016 | 2015 | $ | % | ||||||||||||
| Software revenue |
$ | 223,818 | $ | 205,567 | $ | 18,251 | 9% | |||||||||
| As a percent of software segment revenue |
86% | 85% | ||||||||||||||
| As a percent of consolidated revenue |
71% | 70% | ||||||||||||||
The 9% increase in our software revenue for the year ended December 31, 2016, as compared to the year ended December 31, 2015, was primarily the result of an expansion in the number of units licensed by our existing customers under renewed software license agreements and, to a lesser extent, licensing of units to new customers pursuant to new software license agreements. This increase in software revenue occurred across the Americas, EMEA and APAC.
Software related services
| Year ended December 31, |
Change | |||||||||||||||
| (dollars in thousands) | 2016 | 2015 | $ | % | ||||||||||||
| Software related services revenue |
$ | 35,770 | $ | 37,294 | $ | (1,524 | ) | (4% | ) | |||||||
| As a percent of software segment revenue |
14% | 15% | ||||||||||||||
| As a percent of consolidated revenue |
11% | 13% | ||||||||||||||
The 4% decrease in our software related services revenue for the year ended December 31, 2016, as compared to the year ended December 31, 2015, was primarily the result of our continued focus on higher-value projects aligned with our software.
Client engineering services segment
| Year ended December 31, |
Change | |||||||||||||||
| (dollars in thousands) | 2016 | 2015 | $ | % | ||||||||||||
| Client engineering services revenue |
$ | 47,702 | $ | 45,075 | $ | 2,627 | 6% | |||||||||
| As a percent of consolidated revenue |
15% | 15% | ||||||||||||||
The 6% increase in our CES revenue for the year ended December 31, 2016, as compared to the year ended December 31, 2015, was primarily due to an increase in demand for our consulting services and corresponding higher billable headcount placements during the period. Our headcount in the CES business increased 4% in 2016, as compared to the prior year.
Other
| Year ended December 31, |
Change | |||||||||||||||
| (dollars in thousands) | 2016 | 2015 | $ | % | ||||||||||||
| Other revenue |
$ | 5,950 | $ | 6,193 | $ | (243 | ) | (4% | ) | |||||||
| As a percent of consolidated revenue |
2% | 2% | ||||||||||||||
Other revenue for the year ended December 31, 2015, included $2.0 million of revenue related to royalties from our licensing of intellectual property technology that did not reoccur in the year ended December 31, 2016. Excluding the impact of these royalties, our other revenue increased 42% for the year ended December 31, 2016, as compared to the prior year. This increase in our other revenue was primarily due to an increase in demand for LED lighting and increased royalties received from licensing our technology to third party manufacturers and resellers.
52
Table of Contents
Cost of revenue
Software segment
Software
| Year ended December 31, |
Change | |||||||||||||||
| (dollars in thousands) | 2016 | 2015 | $ | % | ||||||||||||
| Cost of software revenue |
$ | 31,962 | $ | 27,406 | $ | 4,556 | 17% | |||||||||
| As a percent of software revenue |
14% | 13% | ||||||||||||||
| As a percent of consolidated revenue |
10% | 9% | ||||||||||||||
Cost of software revenue increased by $4.6 million, or 17%, for the year ended December 31, 2016, as compared to the year ended December 31, 2015, primarily attributable to a $3.3 million increase in employee compensation costs, and increased third party royalty costs of $0.7 million for software programs we include in our APA program.
Software related services
| Year ended December 31, |
Change | |||||||||||||||
| (dollars in thousands) | 2016 | 2015 | $ | % | ||||||||||||
| Cost of software related services revenue |
$ | 27,653 | $ | 30,079 | $ | (2,426 | ) | (8% | ) | |||||||
| As a percent of software related services revenue |
77% | 81% | ||||||||||||||
| As a percent of consolidated revenue |
9% | 10% | ||||||||||||||
Cost of software related services revenue decreased by $2.4 million, or 8%, for the year ended December 31, 2016, as compared to the year ended December 31, 2015, primarily related to a reorganization of personnel and the corresponding decrease in software related services revenue and our continued focus on higher-value projects aligned with our software.
Client engineering services segment
| Year ended December 31, |
Change | |||||||||||||||
| (dollars in thousands) | 2016 | 2015 | $ | % | ||||||||||||
| Cost of client engineering services revenue |
$ | 38,106 | $ | 36,081 | $ | 2,025 | 6% | |||||||||
| As a percent of client engineering services segment revenue |
80% | 80% | ||||||||||||||
| As a percent of consolidated revenue |
12% | 12% | ||||||||||||||
Cost of CES revenue increased by $2.0 million, or 6%, for the year ended December 31, 2016, as compared to the year ended December 31, 2015. This increase was primarily due to compensation expenses associated with a larger number of placements to meet customer demand.
Other
| Year ended December 31, |
Change | |||||||||||||||
| (dollars in thousands) | 2016 | 2015 | $ | % | ||||||||||||
| Cost of other revenue |
$ | 4,879 | $ | 5,642 | $ | (763 | ) | (14% | ) | |||||||
| As a percent of other revenue |
82% | 91% | ||||||||||||||
| As a percent of consolidated revenue |
2% | 2% | ||||||||||||||
Cost of other revenue decreased by $0.8 million, or 14%, for the year ended December 31, 2016, as compared to the year ended December 31, 2015. This decrease was primarily due to our introduction of new products that have a lower cost of manufacturing.
53
Table of Contents
Gross profit
| Year ended December 31, |
Change | |||||||||||||||
| (dollars in thousands) | 2016 | 2015 | $ | % | ||||||||||||
| Gross profit |
$ | 210,640 | $ | 194,921 | $ | 15,719 | 8% | |||||||||
| As a percent of consolidated revenue |
67% | 66% | ||||||||||||||
Gross profit increased by $15.7 million, or 8%, for the year ended December 31, 2016, as compared to the year ended December 31, 2015. This increase in gross profit was primarily attributable to the growth of our software revenue of $18.3 million driven by the expansion in the number of units purchased by our existing customers and, to a lesser extent, sales to new customers. Gross profit margin increased to 67% in the year ended December 31, 2016, from 66% in the year ended December 31, 2015.
Operating expenses
Operating expenses, as discussed below, support all products and services that we provide to our customers and, as a result, they are reported and discussed here in an aggregate total.
Research and development
| Year ended December 31, |
Change | |||||||||||||||
| (dollars in thousands) | 2016 | 2015 | $ | % | ||||||||||||
| Research and development |
$ | 71,325 | $ | 62,777 | $ | 8,548 | 14% | |||||||||
| As a percent of consolidated revenue |
23% | 21% | ||||||||||||||
Research and development expenses increased by $8.5 million, or 14%, for the year ended December 31, 2016, as compared to the year ended December 31, 2015. This increase was attributable to an increase in employee costs of $6.2 million resulting from an increase in our headcount in 2016, primarily due to acquisitions and annual compensation adjustments. In addition, the share-based compensation expense component of our research and development expense increased during the year ended December 31, 2016, by $1.2 million as compared to the corresponding prior year primarily due to the increased value of our shares of common stock. Excluding the impact of stock-based compensation, research and development costs increased by 12% from $62.6 million to $70.0 million for the years ended December 31, 2015 and 2016, respectively.
Sales and marketing
| Year ended December 31, |
Change | |||||||||||||||
| (dollars in thousands) | 2016 | 2015 | $ | % | ||||||||||||
| Sales and marketing |
$ | 66,086 | $ | 63,080 | $ | 3,006 | 5% | |||||||||
| As a percent of consolidated revenue |
21% | 21% | ||||||||||||||
Sales and marketing expenses increased by $3.0 million, or 5%, for the year ended December 31, 2016, as compared to the year ended December 31, 2015. This increase was primarily attributable to a $2.4 million increase in employee compensation costs, including stock-based compensation and a $0.7 million increase in our sales and marketing campaigns to support our direct sales force.
General and administrative
| Year ended December 31, |
Change | |||||||||||||||
| (dollars in thousands) | 2016 | 2015 | $ | % | ||||||||||||
| General and administrative |
$ | 57,202 | $ | 54,069 | $ | 3,133 | 6% | |||||||||
| As a percent of consolidated revenue |
18% | 18% | ||||||||||||||
General and administrative expenses increased by $3.1 million, or 6%, for the year ended December 31, 2016, as compared to the year ended December 31, 2015. This increase was primarily attributable to a $2.7 million increase in share-based compensation expense. These expenses were partially offset by decreases in professional services expenses primarily related to a decline in legal costs for outstanding legal matters. Excluding the impact of stock-based compensation, general and administrative expenses increased by 1%, from $53.8 million to $54.2 million for the years ended December 31, 2015 and 2016, respectively.
54
Table of Contents
Amortization of intangible assets
| Year ended December 31, |
Change | |||||||||||||||
| (dollars in thousands) | 2016 | 2015 | $ | % | ||||||||||||
| Amortization of intangible assets |
$ | 3,322 | $ | 2,624 | $ | 698 | 27% | |||||||||
| As a percent of consolidated revenue |
1% | 1% | ||||||||||||||
Amortization of intangible assets increased by $0.7 million, or 27%, for the year ended December 31, 2016, as compared to the year ended December 31, 2015. This increase was attributable to the amortization of intangible assets associated with acquisitions completed during the year ended December 31, 2016, and a full year of amortization related to acquisitions completed during the year ended December 31, 2015.
Other operating income
| Year ended December 31, |
Change | |||||||||||||||
| (dollars in thousands) | 2016 | 2015 | $ | % | ||||||||||||
| Other operating income |
$ | (2,742) | $ | (2,576) | $ | 166 | 6% | |||||||||
| As a percent of consolidated revenue |
(1)% | (1)% | ||||||||||||||
Other operating income increased by $0.2 million, or 6%, for the year ended December 31, 2016, as compared to the year ended December 31, 2015. This increase was primarily attributable to an increase in government subsidies, primarily in France, in the form of grant income associated with certain of our research and development activities.
Interest expense
| Year ended December 31, |
Change | |||||||||||||||
| (dollars in thousands) | 2016 | 2015 | $ | % | ||||||||||||
| Interest expense |
$ | 2,265 | $ | 2,416 | $ | (151 | ) | (6% | ) | |||||||
| As a percent of consolidated revenue |
1% | 1% | ||||||||||||||
Interest expense decreased by $0.2 million, or 6%, for the year ended December 31, 2016, as compared to the year ended December 31, 2015. This decrease was due to a reduction in our interest expense related to our credit agreement as a result of a partial debt repayment and the use of lower cost short-term borrowing contracts related to our line of credit borrowings.
Other expense (income), net
| Year ended December 31, |
Change | |||||||||||||||
| (dollars in thousands) | 2016 | 2015 | $ | % | ||||||||||||
| Other expense (income), net |
$ | (520 | ) | $ | 782 | $ | (1,302 | ) | NM | |||||||
| As a percent of consolidated revenue |
— % | — % | ||||||||||||||
Other expense (income), net decreased by $1.3 million for the year ended December 31, 2016, as compared to the year ended December 31, 2015. This decrease was due to fluctuations in the United States dollar relative to other functional currencies during the year ended December 31, 2016, compared to the prior year.
Income tax expense
| Year ended December 31, |
Change | |||||||||||||||
| (dollars in thousands) | 2016 | 2015 | $ | % | ||||||||||||
| Income tax expense |
$ | 3,539 | $ | 818 | $ | 2,721 | 333% | |||||||||
Income tax expense increased by $2.7 million for the year ended December 31, 2016, as compared to the year ended December 31, 2015. This increase was primarily due to a $1.8 million increase in tax expense related to nondeductible stock-based compensation, a $0.8 million increase in the expense related to an increase in pre-tax income related to foreign operations, partially offset by certain tax deductions and credits and foreign income taxes at rates other than the federal statutory rates. See Note 13 in the Notes to consolidated financial statements in Item 15, Part IV of this Annual Report on Form 10-K.
55
Table of Contents
Net income
| Year ended December 31, |
Change | |||||||||||||||
| (dollars in thousands) | 2016 | 2015 | $ | % | ||||||||||||
| Net income |
$ | 10,163 | $ | 10,931 | $ | (768 | ) | (7% | ) | |||||||
Net income decreased by $0.8 million, or 7%, for the year ended December 31, 2016, as compared to the year ended December 31, 2015. This decrease in Net income was primarily attributable to increased stock-based compensation expense of $4.5 million and increased cost of revenue which related to higher employee related costs and royalty share payments to our partners for the year ended December 31, 2016. Operating expenses increased primarily due to annual employee cost adjustments and for those employees who joined us in connection with acquisitions in 2016, and a full year of compensation expense related to those employees who joined in connection with acquisitions completed in 2015. These increased costs are mostly offset by increased revenue in all segments with the largest increase in the Software segment.
Non-GAAP financial measures
In analyzing and planning for our business, we supplement our use of GAAP financial measures with non-GAAP financial measures, including Billings as a liquidity measure, Adjusted EBITDA as a performance measure and Free Cash Flow as a liquidity measure.
Billings. Billings consists of our total revenue plus the change in our deferred revenue in a given period. As we generally bill our customers at the time of sale, but typically recognize a majority of the related revenue ratably over time, management believes that Billings is a meaningful way to measure and monitor our ability to provide our business with the working capital generated by upfront payments from our customers. While we believe that billings provides valuable insight into the cash that will be generated from sales of our software and services, this metric may vary from period-to-period for a number of reasons including the impact of changes in foreign currency exchange rates and the potential impact of acquisitions. See Part II, Item 6, Selected Financial Data for information regarding the limitations of using Billings as a financial measure and for a reconciliation of Billings to revenue, the most directly comparable financial measure calculated in accordance with GAAP.
Our Billings were as follows:
| Year ended December 31, | 2016 to 2017 Change |
2015 to 2016 Change |
||||||||||||||||||
| (in thousands, except percentages) | 2017 | 2016 | 2015 | % | % | |||||||||||||||
| Billings |
$ | 359,166 | $ | 320,653 | $ | 297,358 | 12% | 8% | ||||||||||||
Billings increased by $38.5 million, or 12%, for the year ended December 31, 2017, as compared to the year ended December 31, 2016. This increase in Billings was attributable to a 15% increase in Software segment billings equaling $39.0 million.
Billings increased by $23.3 million, or 8%, for the year ended December 31, 2016 as compared to the year ended December 31, 2015. This increase in Billings was primarily attributable to an 8% increase in Software segment billings equaling $20.9 million, with the remaining increase in the CES segment and our other businesses.
Adjusted EBITDA. We define Adjusted EBITDA as net (loss) income adjusted for income tax expense (benefit), interest expense, interest income and other, depreciation and amortization, stock-based compensation expense, restructuring charges, asset impairment charges and other special items as determined by management. We believe that Adjusted EBITDA is a meaningful measure of performance as it is commonly utilized by us and the investment community to analyze operating performance in our industry. See Part II, Item 6, Selected Financial Data for information regarding the limitations of using Adjusted EBITDA as a financial measure and for a reconciliation of Adjusted EBITDA to net (loss) income, the most directly comparable financial measure calculated in accordance with GAAP.
56
Table of Contents
Our Adjusted EBITDA was as follows:
| Year ended December 31, | 2016 to 2017 Change |
2015 to 2016 Change |
||||||||||||||||||
| (in thousands, except percentages) | 2017 | 2016 | 2015 | % | % | |||||||||||||||
| Adjusted EBITDA |
$ | 22,517 | $ | 30,830 | $ | 22,949 | (27)% | 34% | ||||||||||||
Adjusted EBITDA decreased by $8.3 million, or 27%, for the year ended December 31, 2017, as compared to the year ended December 31, 2016. This decrease in Adjusted EBITDA was primarily attributable to the Software segment. The increase in revenue was offset by the increase in operating expenses for the year ended December 31, 2017. The increase in operating expenses was primarily related to annual employee cost adjustments and increased headcount from acquisitions in 2016 and 2017.
Adjusted EBITDA increased by $7.9 million, or 34%, for the year ended December 31, 2016 as compared to the year ended December 31, 2015. This increase in Adjusted EBITDA was primarily attributable to increases in all segments with the largest increase in the Software segment. The increase in revenue more than offset the increase in cost of revenue which related to higher employee related costs and royalty share payments to our partners for the year ended December 31, 2016. The increase in operating expenses was primarily related to annual employee cost adjustments and for those employees who joined us in connection with acquisitions in 2016 and a full year of compensation expense related to those employees who joined us in connection with acquisitions completed in 2015.
Free Cash Flow. Free Cash Flow is a non-GAAP financial measure that we calculate as cash flow provided by operating activities less capital expenditures. We believe that Free Cash Flow is useful in analyzing our ability to service and repay debt and return value directly to stockholders. See Part II, Item 6, Selected Financial Data for information regarding the limitations of using Free Cash Flow as a financial measure and for a reconciliation of Free Cash Flow to net cash provided by operating activities, the most directly comparable financial measure calculated in accordance with GAAP.
Our Free Cash Flow was as follows:
| Year ended December 31, | 2016 to 2017 Change |
2015 to 2016 Change |
||||||||||||||||||
| (in thousands, except percentages) | 2017 | 2016 | 2015 | % | % | |||||||||||||||
| Net cash provided by operating activities |
$ | 16,091 | $ | 21,385 | $ | 10,838 | (25% | ) | 97% | |||||||||||
| Free Cash Flow |
$ | 8,569 | $ | 11,941 | $ | 5,605 | (28% | ) | 113% | |||||||||||
Free Cash Flow decreased by $3.4 million, or 28%, for the year ended December 31, 2017, as compared to year ended December 31, 2016. This decrease in Free Cash Flow was attributable to a decrease in net cash from operating activities of $5.3 million which primarily reflects a $6.0 million increase in accounts receivable, along with net changes to our working capital position.
Free Cash Flow increased by $6.3 million, or 113%, for the year ended December 31, 2016 as compared to the year ended December 31, 2015. This increase in Free Cash Flow was primarily attributable to the increase in net cash from operating activities of $10.5 million, which was partially offset by an increase of $4.2 million in capital expenditures. Net cash from operating activities increased primarily due to higher net income, adjusted for non-cash items and changes in working capital. The capital expenditures increase included a $4.0 million capital expenditure for the purchase of land adjacent to our corporate headquarters. Excluding this land purchase, our capital expenditures were consistent with the prior year and our Free Cash Flow would have increased by $10.3 million.
Recurring Software License Rate. A key factor to our success is our recurring software license rate which we measure through billings, primarily derived from annual renewals of our existing subscription customer agreements. We calculate our recurring software license rate for a particular period by dividing (i) the sum of software term-based license billings, software license maintenance billings, and 20% of software perpetual license billings which we believe approximates maintenance as an element of the arrangement by (ii) the total software license billings including all term-based, maintenance, and perpetual license billings from all customers for that period. For the years ended December 31, 2017, 2016 and 2015, our recurring software license rate was 89%, 90% and 88%, respectively.
Liquidity and capital resources
Our principal sources of liquidity have been the net payments received from global customers using our software and services as well as our periodic draws on our credit facilities. We believe that funds generated from operations, with cash and cash equivalents and the amounts available to us to borrow under our credit facility will be sufficient to meet our anticipated cash needs for at least the next 12 months.
57
Table of Contents
Revolving credit facility
On October 19, 2017, we entered into an amended and restated credit agreement with Altair Engineering Inc., as borrower, JPMorgan Chase Bank, N.A., as the lead arranger, sole book runner, the administrative agent, swingline lender and letter of credit issuer, and a syndicate of lenders (“2017 Credit Agreement”). The 2017 Credit Agreement became effective on satisfaction of certain conditions including the closing of the Company’s IPO and provides for an initial aggregate commitment amount of $100.0 million, with a sublimit for the issuance of letters of credit of up to $5.0 million and a sublimit for swingline loans of up to $5.0 million. The 2017 Credit Agreement matures on October 18, 2022.
The 2017 Credit Agreement allows us to request that the aggregate commitments under the 2017 Credit Agreement be increased by up to $50.0 million for a total of $150.0 million, subject to certain conditions, by obtaining additional commitments from the existing lenders or by causing a person acceptable to the administrative agent to become a lender (in each case subject to the terms and conditions set forth in the 2017 Credit Agreement).
As of December 31, 2017, we had no outstanding borrowings under the 2017 Credit Agreement and there was $100.0 million available for future borrowing. The 2017 Credit Agreement is available for general corporate purposes, including working capital, capital expenditures, and permitted acquisitions.
The 2017 Credit Agreement is secured by collateral including (i) substantially all of the Company’s properties and assets, and the properties and assets of the Company’s domestic subsidiaries but excluding any patents, copyrights, patent applications or copyright applications or any trade secrets or software products and (ii) pledges of the equity interests in all present and future domestic subsidiaries (subject to certain exceptions as provided for under the 2017 Credit Agreement). The Company’s direct and indirect domestic subsidiaries are guarantors of all of the obligations under the 2017 Credit Agreement. In addition, the 2017 Credit Agreement contains financial covenants relating to maintaining a minimum interest coverage ratio of 3.0 to 1.0 and maximum leverage ratio of 3.0 to 1.0, as defined in the 2017 Credit Agreement. At December 31, 2017, we were in compliance with all financial covenants. For additional information about the 2017 Credit Agreement, see Note 7 in the Notes to consolidated financial statements in Item 15, Part IV of this Annual Report on Form 10-K.
Secured credit agreement
Prior to entering into the 2017 Credit Agreement, the Company’s credit agreement consisted of a $65.0 million term loan (“Term Loan A”) and a $60.0 million revolving commitment (“2016 Revolving Credit Facility”) including a $5.0 million swingline subfacility, and a letter of credit subfacility (collectively, the “Secured Credit Agreement”.)
At December 31, 2016, there was $57.5 million outstanding under Term Loan A at an interest rate of 2.6% based on the LIBO rate and the applicable margin. The Company was required to make quarterly principal payments on Term Loan A of $2.5 million in 2017, 2018 and March 2019. Any outstanding principal balance was to be paid in full on the maturity date of April 18, 2019.
At December 31, 2016, the Company had $27.4 million outstanding under the 2016 Revolving Credit Facility and there was $32.6 million available for future borrowing. The 2016 Revolving Credit Facility was available for general corporate purposes, including working capital, capital expenditures, and permitted acquisitions. All borrowings under the 2016 Revolving Credit Facility were due on the termination date in April 2019. The weighted-average interest rate on borrowings under the 2016 Revolving Credit Facility was 2.6% for the year ended December 31, 2016.
On November 3, 2017, in connection with the completion of our IPO, we repaid in full all outstanding debt under the Secured Credit Agreement. We paid a total of approximately $93.1 million, which included outstanding principal, interest, and other nominal costs. Upon the repayment of the Secured Credit Agreement, all unamortized debt issuance costs were recorded as interest expense.
Cash flows
As of December 31, 2017 and 2016, respectively, we had an aggregate of cash and cash equivalents of $39.2 million and $16.9 million, which we held for working capital purposes and capital expenditures. At December 31, 2017 and 2016, respectively, $20.1 million and $1.6 million of this aggregate amount was held in the United States and $17.5 million and $14.2 million was held in the APAC and EMEA regions with the remainder held in Canada, Mexico, and South America.
There are no significant restrictions on the ability of our subsidiaries to pay dividends or make other distributions to Altair. Based on our current liquidity needs and repatriation strategies, we expect that we can manage our global liquidity needs without material adverse cash tax implications. The recent changes in U.S. tax law could materially affect our tax obligations. For further discussion, please see “Item 1A. Risk Factors – New legislations or tax-reform policies that would change U.S. or foreign taxation of international business activities, including uncertainties in the interpretation and application of the 2017 Tax Cuts and Jobs Act, could materially affect our tax obligations and effective tax rate.”
58
Table of Contents
The following table summarizes our cash flows for the periods indicated:
| Year ended December 31, | ||||||||||||
| (in thousands) | 2017 | 2016 | 2015 | |||||||||
| Net cash provided by operating activities |
$ | 16,091 | $ | 21,385 | $ | 10,838 | ||||||
| Net cash used in investing activities |
(24,851 | ) | (16,033 | ) | (8,030 | ) | ||||||
| Net cash provided by (used in) financing activities |
29,558 | (1,864 | ) | (4,697 | ) | |||||||
| Effect of exchange rate changes on cash, cash equivalents and restricted cash |
1,641 | (362 | ) | (1,639 | ) | |||||||
|
|
|
|
|
|
|
|||||||
| Net increase (decrease) in cash, cash equivalents and restricted cash |
$ | 22,439 | $ | 3,126 | $ | (3,528 | ) | |||||
|
|
|
|
|
|
|
|||||||
Net cash provided by operating activities
Net cash provided by operating activities for the year ended December 31, 2017 was $16.1 million which reflects a decrease of $5.3 million compared to the year ended December 31, 2016. This decrease primarily reflects a $6.0 million increase in accounts receivable, along with net changes to our working capital position, for the year ended December 31, 2017, as compared to the year ended December 31, 2016.
Net cash provided by operating activities for the year ended December 31, 2016 was $21.4 million which reflects an increase of $10.5 million compared to the year ended December 31, 2015. This increase primarily reflects a $3.1 million improvement in deferred taxes along, with net changes to our working capital position, as compared to the prior year.
Net cash used in investing activities
Net cash used in investing activities for the year ended December 31, 2017 was $24.9 million which reflects an increase in cash used of $8.8 million compared to the year ended December 31, 2016. This increase was the result of an increase in cash payments for business acquisitions in the year ended December 31, 2017, as compared to the year ended December 31, 2016.
Net cash used in investing activities for the year ended December 31, 2016 was $16.0 million which reflects an increase in cash used of $8.0 million compared to the year ended December 31, 2015. This reflects a $4.0 million purchase of real property adjacent to our corporate headquarters. The remaining $4.0 million primarily relates to increased use of cash for acquisitions.
Net cash provided by (used in) financing activities
Net cash provided by financing activities for the year ended December 31, 2017 was $29.6 million, which reflects an increase in cash provided of $31.4 million compared to the year ended December 31, 2016. We received aggregate proceeds of $119.3 million from our IPO, net of underwriters’ discounts and commissions. We paid offering costs for our IPO of $4.6 million and we had an increase in net debt payments of $87.3 million for the year ended December 31, 2017 compared to the year ended December 31, 2016 resulting from the use of IPO proceeds to pay off our prior term loan and line of credit.
Net cash used in financing activities for the year ended December 31, 2016 was $1.9 million which reflects a decrease in cash used of $2.8 million compared to the year ended December 31, 2015. This reflects a $4.8 million decrease in net debt payments compared to the prior year partially offset by a $1.3 million increase in redemptions of our common stock, and a $0.7 million return of capital in the year ended December 31, 2016.
Effect of exchange rate changes on cash, cash equivalents and restricted cash
The positive effect of exchange rate changes on cash, cash equivalents and restricted cash for the year ended December 31, 2017, increased $2.0 million from the year ended December 31, 2016, primarily due to currency fluctuations in the Euro.
The adverse effect of exchange rate changes on cash, cash equivalents and restricted cash for the year ended December 31, 2016 decreased by $1.3 million as compared to the prior year due to the decreased effect from fluctuations in foreign currency exchange rates.
59
Table of Contents
Commitments and contractual obligations
Our principal commitments and contractual obligations at December 31, 2017 consisted of obligations under operating leases for our office facilities and other debt obligations. As of December 31, 2017, the future non-cancelable minimum lease payments under these obligations, and our future non-cancelable minimum payments under our other contractual obligations, were as follows:
| Payments due by period | ||||||||||||||||||||
| (in thousands) | Total | Less than 1 year |
1-3 years |
3-5 years |
More than 5 years |
|||||||||||||||
| Operating lease obligations |
$ | 27,854 | $ | 8,946 | $ | 11,716 | $ | 4,825 | $ | 2,367 | ||||||||||
| Long-term debt obligations (excluding interest) |
203 | 126 | 77 | — | — | |||||||||||||||
| Capital lease obligations |
207 | 106 | 96 | 5 | — | |||||||||||||||
| Royalties |
628 | 448 | 180 | — | — | |||||||||||||||
| Related parties |
119 | 119 | — | — | — | |||||||||||||||
| Other long-term liabilities |
17,670 | 15,254 | 2,316 | 100 | — | |||||||||||||||
|
|
|
|
|
|
|
|
|
|
|
|||||||||||
| Total |
$ | 46,681 | $ | 24,999 | $ | 14,385 | $ | 4,930 | $ | 2,367 | ||||||||||
|
|
|
|
|
|
|
|
|
|
|
|||||||||||
This table does not include contractual obligations associated with our pension and post-retirement benefit plans. As of December 31, 2017, we had recognized a net benefit liability of $8.0 million. For additional information on pension and other post-retirement benefits, including expected benefit payments for the next 10 years, see Note 15 in the Notes to consolidated financial statements included elsewhere in this Annual Report on Form 10-K.
The table also does not include liabilities associated with uncertain tax positions due to the high degree of uncertainty regarding the future cash outflows associated with these amounts. For additional discussion of uncertain tax positions, see Note 13 in the Notes to consolidated financial statements included elsewhere in this Annual Report on Form 10-K.
Off-balance sheet arrangements
Through December 31, 2017, we did not have any relationships with unconsolidated organizations or financial partnerships, such as structured finance or special purpose entities that would have been established for the purpose of facilitating off-balance sheet arrangements or other contractually narrow or limited purposes.
Critical accounting policies and estimates
Our management’s discussion and analysis of our financial condition and results of operations is based on our financial statements, which have been prepared in accordance with GAAP. The preparation of these financial statements requires us to make estimates and assumptions that affect the reported amounts of assets and liabilities and the disclosure of contingent assets and liabilities at the date of the financial statements, as well as the reported revenues generated and expenses incurred during the reporting periods. Our estimates are based on our historical experience and on various other factors that we believe are reasonable under the circumstances, the results of which form the basis for making judgments about the carrying value of assets and liabilities that are not readily apparent from other sources. Actual results may differ from these estimates under different assumptions or conditions. We believe that the accounting policies discussed below are critical to understanding our historical and future performance, as these policies relate to the more significant areas involving management’s judgments and estimates. For further discussion on our significant accounting policies, see Note 2 in the Notes to consolidated financial statements in Item 15, Part IV of this Annual Report on Form 10-K.
Revenue recognition
We generate revenue from our Software and CES segments and our other businesses. Revenue is recognized when persuasive evidence of an agreement exists, delivery has occurred or services have been rendered, the fee is fixed or determinable, and collection of the fee is probable or reasonably assured.
Software
Software revenue includes product revenue from software product licensing arrangements consisting of software and software maintenance and support in the form of post-contract customer support, or PCS.
Our software products are sold to customers primarily through our patented units-based subscription licensing model through a term-based software licensing and to a lesser degree, perpetual software licensing. This units-based subscription licensing model allows customers to license a pool of units for their organizations, providing individual users flexible access to our entire portfolio of software applications as well as to our growing portfolio of partner products. These arrangements are referred to as “unit” arrangements. Units are a fixed means of measuring usage. The amount of software usage is limited by the number of the units licensed by the customer. Revenue from these arrangements is fixed (based on the units licensed) and is not based on actual customer usage of each software product.
60
Table of Contents
Software product license arrangements may include PCS and professional services, such as consulting, implementation services, training, and support, which represent multiple-element arrangements. We have analyzed the elements included in our multiple element arrangements and have determined that we do not have vendor-specific objective evidence, or VSOE, of fair value to allocate revenue to our software products license, PCS, and professional services including consulting, implementation services, training and support. Revenue from the software products licenses, including perpetual licenses, PCS and professional services, if applicable, are considered to be one accounting unit and, once all services have commenced, are recognized ratably over the remaining period of the arrangement which consists of the longer of the contractual service term or PCS term. If the professional services are essential to the functionality of the software products, then revenue recognition does not commence until such services are completed.
Our term-based software license arrangements typically have a term of 12 months and include PCS, including the right to receive unspecified software upgrades, when and if available during the license term. We do not charge separately for PCS. Revenues for software licenses sold on a term-based model basis are recognized ratably over the term of the license arrangement, once all other revenue recognition criteria have been met.
We also sell perpetual licenses to certain of our customers. We do not have VSOE of fair value for the PCS, which is sold along with the perpetual licenses. As a result, revenue from these perpetual arrangements is recognized ratably over the initial PCS term.
Software related services
Software related services revenue is derived from our consulting, implementation services and training for product design and development projects.
Software services are provided to customers on a time and materials or fixed-price basis. We recognize software services revenue for time and materials contracts based upon hours worked and contractually agreed-upon hourly rates. Revenue from fixed-price engagements is recognized using the proportional performance method based on the ratio of costs incurred, to the total estimated project costs. Project costs are based on standard rates, which vary by the consultant’s professional level, plus all direct expenses incurred to complete the engagement that are not reimbursed by the client. Project costs are typically expensed as incurred. The use of the proportional performance method is dependent upon management’s ability to reliably estimate the costs to complete a project. We use historical experience as a basis for future estimates to complete current projects. Additionally, we believe that costs are the best available measure of performance. If the costs to complete a project are not estimable or the completion is uncertain, the revenue is recognized upon completion of the services.
Client engineering services
CES revenue is derived from our hiring of engineers for placement at a customer site for specific customer-directed assignments. These engineers are hired and paid only for the duration of the placement. We recognize client engineering services revenue based upon hours worked and contractually agreed-upon hourly rates.
Other
Other revenue is derived from the sale of LED products for the replacement of fluorescent tubes. Revenue from the sale of LED products for the replacement of fluorescent tubes is recognized when all revenue recognition criteria stated above are met, which is generally when the products are transferred to resellers or to end customers. We recognize revenues from royalties for licensing our technology when received.
Goodwill and indefinite-lived intangible assets
In accordance with ASC Topic 360, we assess the carrying value of goodwill each year, based on weighting estimates of future cash flows from the reporting units or estimates of the market value of the reporting units, based on comparable companies. We also perform impairment analyses whenever events or circumstances indicate that goodwill or certain intangibles may be impaired. These estimates of future discounted cash flows are based upon historical results, adjusted to reflect our best estimate of future market and operating conditions. Historically, actual results have occasionally differed from our estimated future cash flow estimates. In the future, actual results may differ materially from these estimates. In addition, the comparable companies used to establish market value for our reporting units is based on management’s judgment.
The timing and size of any future impairment charges involves the application of our estimates and judgment and could result in the impairment of all, or substantially all, of our goodwill or intangible assets.
61
Table of Contents
Stock-based compensation
Stock-based compensation expense, consisting of stock options expected to be settled by issuing shares of our common stock, are recorded as equity awards. The fair value of these awards on the date of grant is measured using the Black-Scholes option pricing model.
Our use of the Black-Scholes option pricing model requires the input of highly subjective assumptions, including the fair value of our underlying common stock, expected term of the option, expected volatility of the price of our common stock, risk-free interest rates, and expected dividend yield. The assumptions used in our option pricing model represent management’s best estimates. These estimates involve inherent uncertainties and the application of management’s judgment. If factors change and different assumptions are used, our stock-based compensation expense could be materially different in the future.
These assumptions and estimates are as follows:
| • | Fair value of common stock. Due to the absence of an active market for our common stock prior to our IPO, our board of directors, with the assistance of a third-party valuation specialist, determined the fair value of our common stock. The valuation methodology included estimates and assumptions including forecasts of future cash flows that require significant judgments. These valuations considered a number of objective and subjective factors, including our actual operating and financial performance, external market conditions, performance of comparable publicly traded companies, comparable transactions, business developments, likelihood of achieving a liquidity event, such as an initial public offering or sale, and common stock transactions, among other factors. Prior to the IPO, we utilized methodologies in accordance with the framework of the American Institute of Certified Public Accountants’ Technical Practice Aid, Valuation of Privately-Held Company Equity Securities issued as Compensation, to estimate the fair value of our common stock. Significant changes to the key assumptions used in the valuations could result in different fair values of our common stock at each valuation date. |
| • | Expected term. The expected term of employee stock options represents the weighted-average period that the stock options are expected to remain outstanding. To determine the expected term, we generally apply the simplified approach in which the expected term of an award is presumed to be the mid-point between the vesting date and the expiration date of the award as we do not have sufficient historical exercise data to provide a reasonable basis for an estimate of expected term. |
| • | Risk-free interest rate. We base the risk-free interest rate on the yields of United States Treasury securities with maturities approximately equal to the term of employee stock option awards. |
| • | Expected volatility. As we do not have a long trading history for our common stock as a new public company, the expected volatility for our common stock was estimated by taking the average historic price volatility for industry peers based on daily price observations over a period equivalent to the expected term of the stock option awards. Industry peers consist of several public companies in our industry which are either similar in size, stage of life cycle or financial leverage. |
Our forfeiture rate is based on actual forfeitures.
We will continue to use judgment in evaluating the assumptions related to our stock-based compensation on a prospective basis although the judgments surrounding fair value of common stock are no longer applicable as a public company going forward. As we continue to accumulate additional data related to our common stock, we may have refinements to our estimates, which could materially impact our future stock-based compensation expense.
Employee stock-based awards, consisting of stock options with repurchase features that allow them to be settled in cash at a purchase price that is less than the current fair value are considered liability-based awards. These awards are initially recorded at fair value and remeasured to fair value at the end of each reporting period until settled.
Our 2001 ISO and NQSO Plan was terminated in 2011. Options granted under the 2001 ISO and NQSO Plan were accounted for as liability awards as the terms of the awards could require or allow repurchase of the shares at amounts different than fair value. We made the accounting policy election to use the intrinsic value method of accounting to determine stock-based compensation liabilities for these awards. During the quarter ended June 30, 2017, in accordance with ASC 718 as we no longer met the definition of a nonpublic entity, we changed our accounting policy to measure the fair value of our liability awards using the Black-Scholes option pricing model. The impact of the change in accounting policy was not material to the financial statements.
The 2001 ISO and NQSO Plan also included stock-based compensation liability for our Class A redeemable common shares outstanding resulting from our call feature with a purchase price that may be set at less than the fair market value at the redemption date. We utilized the fair value of the outstanding Class A redeemable common shares to determine the stock-based compensation liabilities for these redeemable common shares.
As a result of our IPO in the fourth quarter 2017, the call feature terminated which resulted in the liability associated with our Class A redeemable common shares and the liability associated with stock options outstanding under the 2001 ISO and NQSO Plan to be reclassified to equity as of December 31, 2017, in accordance with ASC 718.
62
Table of Contents
Accounting for income taxes
We utilize the asset and liability method of accounting for income taxes in accordance with ASC Topic 740, Accounting for Income Taxes. Under this method, deferred tax assets and liabilities are determined based on differences between the financial reporting and tax bases of assets and liabilities. Deferred tax assets and liabilities are measured using the enacted tax rates and statutes that will be in effect when those differences are expected to reverse. Deferred tax assets can result from unused operating losses, research and development credits, foreign tax credit carryforwards, and deductions recorded for financial statement purposes prior to them being deductible on a tax return. Valuation allowances are provided against net deferred tax assets if, based upon the available evidence, it is more likely than not that some or all of the deferred tax assets will not be realized. The ultimate realization of deferred tax assets is dependent upon the generation of future taxable income and the reversal of taxable temporary differences. We consider, among other available information, scheduled reversals of deferred tax liabilities, projected future taxable income, limitations on the availability of tax credit carryforwards, and other evidence assessing the potential realization of deferred tax assets. Adjustments to the valuation allowance are included in the tax provision in our consolidated statements of operations in the period they become known or can be estimated.
Significant management judgment is required in determining any valuation allowance recorded against deferred tax assets and liabilities. The valuation allowance is based on our estimates of taxable income for jurisdictions in which we operate and the period over which our deferred tax assets may be recoverable. Historically, we have had substantial United States tax credit carryforwards which, if not utilized, will begin to expire in 2018. The ability to utilize these DTAs is highly dependent upon our ability to generate taxable income in the United States in the future.
We apply a more-likely-than-not recognition threshold to our accounting for tax uncertainties. We review all of our tax positions and make determinations as to whether our tax positions are more likely than not to be sustained upon examination by the relevant taxing authorities. Only those benefits that have a greater than fifty percent likelihood of being sustained upon examination by taxing authorities are recognized. Interest and penalties related to uncertain tax positions are recorded in income tax expense (benefit) in the consolidated statements of operations.
JOBS Act Accounting Election
We are an emerging growth company, as defined in the Jumpstart Our Business Startups Act of 2012, or the JOBS Act. Under the JOBS Act, emerging growth companies can delay adopting new or revised accounting standards issued subsequent to the enactment of the JOBS Act until such time as those standards apply to private companies. We have elected to use this extended transition period for complying with new or revised accounting standards that have different effective dates for public and private companies until the earlier of the date we (i) are no longer an emerging growth company or (ii) affirmatively and irrevocably opt out of the extended transition period provided in the JOBS Act. As a result, our financial statements may not be comparable to companies that comply with new or revised accounting pronouncements as of public company effective dates.
Recently issued accounting pronouncements
For information regarding recent accounting guidance and the impact of this guidance on our consolidated financial statements, see Note 2 of the Notes to consolidated financial statements in Item 15, Part IV of this Annual Report on Form 10-K, which is incorporated by reference.
Item 7A. Quantitative and Qualitative Disclosures About Market Risk
We are exposed to certain global market risks, including foreign currency exchange risk and interest rate risk associated with our debt.
Interest Rate Risk
We are exposed to market risks in the ordinary course of our business. These risks primarily include interest rate sensitivities. As of December 31, 2017 and 2016, we had cash, cash equivalents and restricted cash of $39.6 million and $17.1 million, respectively, consisting primarily of bank deposits and money market funds. As of December 31, 2017, we had no amounts outstanding under our 2017 Credit Agreement. As of December 31, 2016, we had $57.5 million outstanding on Term Loan A and $27.4 million outstanding on our Revolving Credit Facility. Such interest-bearing instruments carry a degree of interest rate risk; however, historical fluctuations of interest expense have not been significant.
Interest rate risk relates to the gain/increase or loss/decrease we could incur on our debt balances and interest expense associated with changes in interest rates. It is our policy not to enter into derivative instruments for speculative purposes, and therefore, we hold no derivative instruments for trading purposes.
63
Table of Contents
Foreign Currency Risk
As a result of our substantial international operations, we are exposed to foreign currency risks that arise from our normal business operations, including in connection with our transactions that are denominated in foreign currencies. In addition, we translate sales and financial results denominated in foreign currencies into United States dollars for purposes of our consolidated financial statements. As a result, appreciation of the United States dollar against these foreign currencies generally will have a negative impact on our reported revenue and operating income while depreciation of the United States dollar against these foreign currencies will generally have a positive effect on reported revenue and operating income.
To date, we have not entered into any foreign currency hedging contracts, since exchange rate fluctuations have not had a material impact on our operating results and cash flows. Based on our current international structure, we do not plan on engaging in hedging activities in the near future.
Item 8. Financial Statements and Supplementary Data.
The financial statements required by this Item 8 are included in our consolidated financial statements and set forth in the pages indicated in Part IV, Item 15(a) of this Annual Report on Form 10-K and are incorporated herein by reference. The supplementary financial information required by this Item 8 is included in Note 20 of the Notes to consolidated financial statements and set forth in the pages indicated in Part IV, Item 15(a) of this Annual Report on Form 10-K, and is incorporated herein by reference.
Item 9. Changes in and Disagreements with Accountants on Accounting and Financial Disclosure.
None.
Item 9A. Controls and Procedures.
Evaluation of Disclosure Controls and Procedures.
Under the supervision and with the participation of our management, including the Chief Executive Officer and Chief Financial Officer, we have evaluated the effectiveness of our disclosure controls and procedures as defined in Rule 13(a)-15(e) under the Exchange Act as of the end of the period covered by this report. Based on that evaluation, the Chief Executive Officer and Chief Financial Officer have concluded that these disclosure controls and procedures were not effective as of December 31, 2017 due to material weaknesses in our internal controls over the financial statement close process and the accounting for income taxes.
We have performed additional analyses and other procedures to enable management to conclude that, notwithstanding the existence of the material weaknesses, the consolidated financial statements included in this Form 10-K present fairly, in all material respects, our financial position, results of operations and cash flows for the periods presented in conformity with GAAP. Additionally, corrective actions continue to address the material weaknesses in our internal controls.
Changes in Internal Control Over Financial Reporting.
There was no change in our internal control over financial reporting (as defined in Rules 13a-15(f) and 15d-15(f) under the Exchange Act) that occurred during the fourth quarter ended December 31, 2017, that has materially affected, or is reasonably likely to materially affect, our internal control over financial reporting
Management’s Report on Internal Control over Financial Reporting
This Annual Report on Form 10-K does not include a report of management’s assessment regarding internal control over financial reporting or an attestation report of our independent registered public accounting firm due to a transition period established by the rules of the SEC for newly public companies.
64
Table of Contents
Inherent Limitations on Effectiveness of Controls.
Our management, including our principal executive officer and principal financial officer, do not expect that our disclosure controls or our internal control over financial reporting will prevent all errors and all fraud. A control system, no matter how well conceived and operated, can provide only reasonable, not absolute, assurance that the objectives of the control system are met. Because of the inherent limitations in all control systems, no evaluation of controls can provide absolute assurance that all control issues and instances of fraud, if any, have been detected. These inherent limitations include the realities that judgments in decision-making can be faulty, and that breakdowns can occur because of a simple error or mistake. Additionally, controls can be circumvented by the individual acts of some persons, by collusion of two or more people or by management override of the controls. The design of any system of controls is also based in part upon certain assumptions about the likelihood of future events, and there can be no assurance that any design will succeed in achieving its stated goals under all potential future conditions; over time, controls may become inadequate because of changes in conditions, or the degree of compliance with policies or procedures may deteriorate. Because of the inherent limitations in a control system, misstatements due to error or fraud may occur and not be detected.
None.
PART III
Item 10. Directors, Executive Officers and Corporate Governance.
The information called for by this item will be set forth in our Proxy Statement for the 2018 Annual Meeting of Stockholders to be filed with the SEC within 120 days of the fiscal year ended December 31, 2017, or Proxy Statement, and is incorporated herein by reference.
Item 11. Executive Compensation.
The information called for by this item will be set forth in our Proxy Statement and is incorporated herein by reference.
Item 12. Security Ownership of Certain Beneficial Owners and Management and Related Stockholder Matters.
The information required by this item will be set forth in our Proxy Statement and is incorporated herein by reference.
Item 13. Certain Relationships and Related Transactions, and Director Independence.
The information required by this item will be set forth in our Proxy Statement and is incorporated herein by reference.
Item 14. Principal Accountant Fees and Services.
The information required by this item will be set forth in our Proxy Statement and is incorporated herein by reference.
65
Table of Contents
PART IV
Item 15. Exhibits, Financial Statement Schedules.
(a) Documents Filed as Part of This Annual Report on Form 10-K:
| (1) | Financial Statements: The following consolidated financial statements and reports of independent registered account firm are filed as part of this report: |
| Page | ||||
| 67 | ||||
| 68 | ||||
| 69 | ||||
| 70 | ||||
| 71 | ||||
| 72 | ||||
| 73 | ||||
| (2) | Financial Statement Schedule: The following financial statement schedule is filed as part of this report and should be read in conjunction with the consolidated financial statements. |
Schedule II – Valuation and Qualifying Accounts
(in thousands)
| Balance at beginning of year |
Additions | Deductions | Balance at end of year |
|||||||||||||
| Allowance for Doubtful Accounts |
||||||||||||||||
| Year ended December 31, 2017 |
$ | 565 | $ | 610 | $ | (377 | ) | $ | 798 | |||||||
| Year ended December 31, 2016 |
$ | 937 | $ | 291 | $ | (663 | ) | $ | 565 | |||||||
| Year ended December 31, 2015 |
$ | 1,439 | $ | 145 | $ | (647 | ) | $ | 937 | |||||||
Schedules not listed above have been omitted because they are not applicable, are not required or the information required to be set forth therein in included in the consolidated financial statements or notes thereto.
| (3) | Exhibits: The exhibits listing in the accompanying Exhibit Index immediately following the financial statements are filed as part of, or incorporated by reference into, this Annual Report on Form 10-K. |
(b) Exhibits: See Item 15(a)(3) as set forth above.
(c) Financial Statement Schedules: See Item 15(a)(2) as set forth above.
66
Table of Contents
Report of Independent Registered Public Accounting Firm
To the Board of Directors and Stockholders of Altair Engineering Inc.
Opinion on the Financial Statements
We have audited the accompanying consolidated balance sheets of Altair Engineering Inc. and subsidiaries (the Company) as of December 31, 2017 and 2016, the related consolidated statements of operations, comprehensive (loss) income, changes in stockholders’ equity (deficit) and cash flows for each of the three years in the period ended December 31, 2017, and the related notes and financial statement schedule listed in the Index at Item 15(a) (collectively referred to as the “financial statements”). In our opinion, the financial statements present fairly, in all material respects, the financial position of the Company at December 31, 2017 and 2016, and the results of its operations and its cash flows for each of the three years in the period ended December 31, 2017, in conformity with U.S. generally accepted accounting principles.
Basis for Opinion
These financial statements are the responsibility of the Company’s management. Our responsibility is to express an opinion on the Company’s financial statements based on our audits. We are a public accounting firm registered with the Public Company Accounting Oversight Board (United States) (PCAOB) and are required to be independent with respect to the Company in accordance with the U.S. federal securities laws and the applicable rules and regulations of the Securities and Exchange Commission and the PCAOB.
We conducted our audits in accordance with the standards of the PCAOB. Those standards require that we plan and perform the audit to obtain reasonable assurance about whether the financial statements are free of material misstatement, whether due to error or fraud. The Company is not required to have, nor were we engaged to perform, an audit of its internal control over financial reporting. As part of our audits we are required to obtain an understanding of internal control over financial reporting but not for the purpose of expressing an opinion on the effectiveness of the Company’s internal control over financial reporting. Accordingly, we express no such opinion.
Our audits included performing procedures to assess the risks of material misstatement of the financial statements, whether due to error or fraud, and performing procedures that respond to those risks. Such procedures included examining, on a test basis, evidence regarding the amounts and disclosures in the financial statements. Our audits also included evaluating the accounting principles used and significant estimates made by management, as well as evaluating the overall presentation of the financial statements. We believe that our audits provide a reasonable basis for our opinion.
/s/ Ernst & Young LLP
We have served as the Company’s auditor since 2015.
Detroit, Michigan
March 21, 2018
67
Table of Contents
Altair Engineering Inc. and subsidiaries
| December 31, | ||||||||
| (in thousands) | 2017 | 2016 | ||||||
| CURRENT ASSETS: |
||||||||
| Cash and cash equivalents |
$ | 39,213 | $ | 16,874 | ||||
| Accounts receivable, net |
86,635 | 70,498 | ||||||
| Inventory, net |
1,980 | 1,227 | ||||||
| Income tax receivable |
6,054 | 9,069 | ||||||
| Prepaid expenses and other current assets |
10,006 | 7,435 | ||||||
|
|
|
|
|
|||||
| Total current assets |
143,888 | 105,103 | ||||||
| Property and equipment, net |
31,446 | 29,708 | ||||||
| Goodwill |
62,706 | 36,625 | ||||||
| Other intangible assets, net |
24,461 | 11,168 | ||||||
| Deferred tax assets |
8,351 | 62,896 | ||||||
| Other long-term assets |
17,019 | 5,276 | ||||||
|
|
|
|
|
|||||
| TOTAL ASSETS |
$ | 287,871 | $ | 250,776 | ||||
|
|
|
|
|
|||||
| LIABILITIES, MEZZANINE EQUITY AND STOCKHOLDERS’ EQUITY (DEFICIT) |
||||||||
| CURRENT LIABILITIES: |
||||||||
| Current portion of long-term debt |
$ | 232 | $ | 10,435 | ||||
| Accounts payable |
4,880 | 5,009 | ||||||
| Accrued compensation and benefits |
26,560 | 22,955 | ||||||
| Obligations for acquisition of businesses |
13,925 | 2,649 | ||||||
| Other accrued expenses and current liabilities |
21,744 | 16,296 | ||||||
| Deferred revenue |
130,122 | 100,661 | ||||||
|
|
|
|
|
|||||
| Total current liabilities |
197,463 | 158,005 | ||||||
| Long-term debt, net of current portion |
178 | 74,806 | ||||||
| Deferred revenue, non-current |
9,640 | 13,268 | ||||||
| Stock-based compensation awards |
— | 22,236 | ||||||
| Other long-term liabilities |
17,647 | 17,114 | ||||||
|
|
|
|
|
|||||
| TOTAL LIABILITIES |
224,928 | 285,429 | ||||||
|
|
|
|
|
|||||
| Commitments and contingencies |
||||||||
| MEZZANINE EQUITY |
2,352 | — | ||||||
| STOCKHOLDERS’ EQUITY (DEFICIT): |
||||||||
| Preferred stock ($0.0001 par value), authorized 45,000 shares, none issued and outstanding as of December 31, 2017; none authorized, issued or outstanding as of December 31, 2016 |
— | — | ||||||
| Common stock ($0.0001 par value) |
||||||||
| Class A common stock, authorized 513,797 shares, issued and outstanding 26,725 as of December 31, 2017; authorized 76,000 shares, issued and outstanding 8,900 as of December 31, 2016 |
2 | 1 | ||||||
| Class B common stock, authorized 41,203 shares, issued and outstanding 36,508 as of December 31, 2017; authorized 44,000 shares, issued and outstanding 41,204 as of December 31, 2016 |
4 | 4 | ||||||
| Additional paid-in capital |
232,156 | 39,688 | ||||||
| Accumulated deficit |
(166,499 | ) | (67,092 | ) | ||||
| Accumulated other comprehensive loss |
(5,072 | ) | (7,264 | ) | ||||
|
|
|
|
|
|||||
| Total Altair Engineering Inc. stockholders’ equity (deficit) |
60,591 | (34,663 | ) | |||||
| Noncontrolling interest |
— | 10 | ||||||
|
|
|
|
|
|||||
| TOTAL STOCKHOLDERS’ EQUITY (DEFICIT) |
60,591 | (34,653 | ) | |||||
|
|
|
|
|
|||||
| TOTAL LIABILITIES, MEZZANINE EQUITY AND STOCKHOLDERS’ EQUITY (DEFICIT) |
$ | 287,871 | $ | 250,776 | ||||
|
|
|
|
|
|||||
See accompanying notes to consolidated financial statements.
68
Table of Contents
Altair Engineering Inc. and subsidiaries
Consolidated statements of operations
| Year ended December 31, | ||||||||||||
| (in thousands, except per share data) | 2017 | 2016 | 2015 | |||||||||
| Revenue: |
||||||||||||
| Software |
$ | 244,817 | $ | 223,818 | $ | 205,567 | ||||||
| Software related services |
35,397 | 35,770 | 37,294 | |||||||||
|
|
|
|
|
|
|
|||||||
| Total software |
280,214 | 259,588 | 242,861 | |||||||||
| Client engineering services |
46,510 | 47,702 | 45,075 | |||||||||
| Other |
6,609 | 5,950 | 6,193 | |||||||||
|
|
|
|
|
|
|
|||||||
| Total revenue |
333,333 | 313,240 | 294,129 | |||||||||
|
|
|
|
|
|
|
|||||||
| Cost of revenue: |
||||||||||||
| Software |
36,360 | 31,962 | 27,406 | |||||||||
| Software related services |
26,888 | 27,653 | 30,079 | |||||||||
|
|
|
|
|
|
|
|||||||
| Total software |
63,248 | 59,615 | 57,485 | |||||||||
| Client engineering services |
38,131 | 38,106 | 36,081 | |||||||||
| Other |
5,212 | 4,879 | 5,642 | |||||||||
|
|
|
|
|
|
|
|||||||
| Total cost of revenue |
106,591 | 102,600 | 99,208 | |||||||||
|
|
|
|
|
|
|
|||||||
| Gross profit |
226,742 | 210,640 | 194,921 | |||||||||
| Operating expenses: |
||||||||||||
| Research and development |
93,234 | 71,325 | 62,777 | |||||||||
| Sales and marketing |
79,958 | 66,086 | 63,080 | |||||||||
| General and administrative |
87,979 | 57,202 | 54,069 | |||||||||
| Amortization of intangible assets |
5,448 | 3,322 | 2,624 | |||||||||
| Other operating income |
(6,620 | ) | (2,742 | ) | (2,576 | ) | ||||||
|
|
|
|
|
|
|
|||||||
| Total operating expenses |
259,999 | 195,193 | 179,974 | |||||||||
|
|
|
|
|
|
|
|||||||
| Operating (loss) income |
(33,257 | ) | 15,447 | 14,947 | ||||||||
| Interest expense |
2,160 | 2,265 | 2,416 | |||||||||
| Other expense (income), net |
994 | (520 | ) | 782 | ||||||||
|
|
|
|
|
|
|
|||||||
| (Loss) income before income taxes |
(36,411 | ) | 13,702 | 11,749 | ||||||||
| Income tax expense |
62,996 | 3,539 | 818 | |||||||||
|
|
|
|
|
|
|
|||||||
| Net (loss) income |
$ | (99,407 | ) | $ | 10,163 | $ | 10,931 | |||||
|
|
|
|
|
|
|
|||||||
| (Loss) income per share: |
||||||||||||
| Net (loss) income per share attributable to common stockholders, basic |
$ | (1.89 | ) | $ | 0.21 | $ | 0.23 | |||||
| Net (loss) income per share attributable to common stockholders, diluted |
$ | (1.89 | ) | $ | 0.18 | $ | 0.19 | |||||
| Weighted average shares outstanding: |
||||||||||||
| Weighted average number of shares used in computing net (loss) income per share, basic |
52,466 | 48,852 | 46,609 | |||||||||
| Weighted average number of shares used in computing net (loss) income per share, diluted |
52,466 | 57,856 | 58,709 | |||||||||
See accompanying notes to consolidated financial statements.
69
Table of Contents
Altair Engineering Inc. and subsidiaries
Consolidated statements of comprehensive (loss) income
| Year ended December 31, | ||||||||||||
| (in thousands) | 2017 | 2016 | 2015 | |||||||||
| Net (loss) income |
$ | (99,407 | ) | $ | 10,163 | $ | 10,931 | |||||
| Other comprehensive income (loss), net of tax: |
||||||||||||
| Foreign currency translation (net of tax effect of $0, $(60) and $953, respectively) |
2,351 | 20 | (2,115 | ) | ||||||||
| Retirement related benefit plans (net of tax effect of $0, $195 and $(36), respectively) |
(159 | ) | (576 | ) | (253 | ) | ||||||
|
|
|
|
|
|
|
|||||||
| Total other comprehensive income (loss) |
2,192 | (556 | ) | (2,368 | ) | |||||||
|
|
|
|
|
|
|
|||||||
| Comprehensive (loss) income |
(97,215 | ) | 9,607 | 8,563 | ||||||||
| Less: comprehensive loss attributable to noncontrolling interest |
— | — | (1 | ) | ||||||||
|
|
|
|
|
|
|
|||||||
| Comprehensive (loss) income attributable to Altair Engineering Inc. |
$ | (97,215 | ) | $ | 9,607 | $ | 8,564 | |||||
|
|
|
|
|
|
|
|||||||
See accompanying notes to consolidated financial statements.
70
Table of Contents
Altair Engineering Inc. and subsidiaries
Consolidated statements of changes in stockholders’ equity (deficit)
| Common stock(1) | Accumulated | Total Altair Engineering |
||||||||||||||||||||||||||||||||||||||
| (in thousands, except share data) | Class A voting | Class B voting | Additional paid-in |
Accumulated | other comprehensive |
Inc. stockholders’ |
Non- controlling |
Total stockholders’ |
||||||||||||||||||||||||||||||||
| Shares | Amount | Shares | Amount | capital | deficit | loss | equity (deficit) | interest | equity (deficit) | |||||||||||||||||||||||||||||||
| Balance at January 1, 2015 |
4,284 | $ | 1 | 41,564 | $ | 4 | $ | 41,525 | $ | (87,461 | ) | $ | (4,341 | ) | $ | (50,272 | ) | $ | 11 | $ | (50,261 | ) | ||||||||||||||||||
| Net income |
— | — | — | — | — | 10,931 | — | 10,931 | — | 10,931 | ||||||||||||||||||||||||||||||
| Issuance of common stock |
1,728 | — | 200 | — | 1,036 | — | — | 1,036 | — | 1,036 | ||||||||||||||||||||||||||||||
| Stock redemptions |
(264 | ) | — | (84 | ) | — | (1,221 | ) | — | — | (1,221 | ) | — | (1,221 | ) | |||||||||||||||||||||||||
| Return of capital |
— | — | — | — | — | (725 | ) | — | (725 | ) | — | (725 | ) | |||||||||||||||||||||||||||
| Stock-based compensation |
— | — | — | — | 569 | — | — | 569 | — | 569 | ||||||||||||||||||||||||||||||
| Foreign currency translation, net of tax |
— | — | — | — | — | — | (2,114 | ) | (2,114 | ) | (1 | ) | (2,115 | ) | ||||||||||||||||||||||||||
| Retirement related benefit plans, net of tax |
— | — | — | — | — | — | (253 | ) | (253 | ) | — | (253 | ) | |||||||||||||||||||||||||||
|
|
|
|
|
|
|
|
|
|
|
|
|
|
|
|
|
|
|
|
|
|||||||||||||||||||||
| Balance at December 31, 2015 |
5,748 | 1 | 41,680 | 4 | 41,909 | (77,255 | ) | (6,708 | ) | (42,049 | ) | 10 | (42,039 | ) | ||||||||||||||||||||||||||
| Net income |
— | — | — | — | — | 10,163 | — | 10,163 | — | 10,163 | ||||||||||||||||||||||||||||||
| Issuance of common |
3,484 | — | — | — | 456 | — | — | 456 | — | 456 | ||||||||||||||||||||||||||||||
| Stock redemptions |
(332 | ) | — | (476 | ) | — | (3,291 | ) | — | — | (3,291 | ) | — | (3,291 | ) | |||||||||||||||||||||||||
| Stock-based compensation |
— | — | — | — | 614 | — | — | 614 | — | 614 | ||||||||||||||||||||||||||||||
| Foreign currency translation, net of tax |
— | — | — | — | — | — | 20 | 20 | — | 20 | ||||||||||||||||||||||||||||||
| Retirement related benefit plans, net of tax |
— | — | — | — | — | — | (576 | ) | (576 | ) | — | (576 | ) | |||||||||||||||||||||||||||
|
|
|
|
|
|
|
|
|
|
|
|
|
|
|
|
|
|
|
|
|
|||||||||||||||||||||
| Balance at December 31, 2016 |
8,900 | 1 | 41,204 | 4 | 39,688 | (67,092 | ) | (7,264 | ) | (34,663 | ) | 10 | (34,653 | ) | ||||||||||||||||||||||||||
| Net loss |
— | — | — | — | — | (99,407 | ) | — | (99,407 | ) | — | (99,407 | ) | |||||||||||||||||||||||||||
| Initial public offering, net of issuance costs of $4,830 |
13,800 | 1 | (2,200 | ) | — | 114,437 | — | — | 114,438 | — | 114,438 | |||||||||||||||||||||||||||||
| Shares converted upon Delaware incorporation |
2,496 | — | (2,496 | ) | — | — | — | — | — | — | — | |||||||||||||||||||||||||||||
| 2001 ISO Plan modification |
— | — | — | — | 66,510 | — | — | 66,510 | — | 66,510 | ||||||||||||||||||||||||||||||
| Issuance of common stock for acquisitions |
988 | — | — | — | 8,712 | — | — | 8,712 | — | 8,712 | ||||||||||||||||||||||||||||||
| Exercise of stock options |
541 | — | — | — | 1,792 | — | — | 1,792 | — | 1,792 | ||||||||||||||||||||||||||||||
| Purchase of noncontrolling interests |
— | — | — | — | (19 | ) | — | — | (19 | ) | (10 | ) | (29 | ) | ||||||||||||||||||||||||||
| Amortization of mezzanine equity |
— | — | — | — | (8 | ) | — | — | (8 | ) | — | (8 | ) | |||||||||||||||||||||||||||
| Stock-based compensation |
— | — | — | — | 1,044 | — | — | 1,044 | — | 1,044 | ||||||||||||||||||||||||||||||
| Foreign currency translation, net of tax |
— | — | — | — | — | — | 2,351 | 2,351 | — | 2,351 | ||||||||||||||||||||||||||||||
| Retirement related benefit plans, net of tax |
— | — | — | — | — | — | (159 | ) | (159 | ) | — | (159 | ) | |||||||||||||||||||||||||||
|
|
|
|
|
|
|
|
|
|
|
|
|
|
|
|
|
|
|
|
|
|||||||||||||||||||||
| Balance at December 31, 2017 |
26,725 | $ | 2 | 36,508 | $ | 4 | $ | 232,156 | $ | (166,499 | ) | $ | (5,072 | ) | $ | 60,591 | $ | — | $ | 60,591 | ||||||||||||||||||||
|
|
|
|
|
|
|
|
|
|
|
|
|
|
|
|
|
|
|
|
|
|||||||||||||||||||||
| (1) | All references to Common stock refer to the Company’s currently existing Class A and Class B shares following the Recapitalization as described in Note 10. |
See accompanying notes to consolidated financial statements.
71
Table of Contents
Altair Engineering Inc. and subsidiaries
Consolidated statements of cash flows
| Year Ended December 31, | ||||||||||||
| (in thousands) | 2017 | 2016 | 2015 | |||||||||
| OPERATING ACTIVITIES: |
||||||||||||
| Net (loss) income |
$ | (99,407 | ) | $ | 10,163 | $ | 10,931 | |||||
| Adjustments to reconcile net (loss) income to net cash provided by operating activities: |
||||||||||||
| Depreciation and amortization |
11,747 | 9,980 | 8,378 | |||||||||
| Provision for bad debt |
610 | 291 | 145 | |||||||||
| Write-down of inventory to net realizable value |
270 | 179 | 1,003 | |||||||||
| Stock-based compensation expense |
47,281 | 5,132 | 597 | |||||||||
| Deferred income taxes |
52,571 | (6,076 | ) | (9,131 | ) | |||||||
| Other, net |
28 | 86 | 124 | |||||||||
| Changes in assets and liabilities: |
||||||||||||
| Accounts receivable |
(10,397 | ) | (4,397 | ) | (8,120 | ) | ||||||
| Prepaid expenses and other current assets |
1,559 | (2,337 | ) | (5,115 | ) | |||||||
| Other long-term assets |
(11,288 | ) | (930 | ) | (1,526 | ) | ||||||
| Accounts payable |
(1,087 | ) | (1,321 | ) | 558 | |||||||
| Accrued compensation and benefits |
2,060 | 2,366 | 2,006 | |||||||||
| Other accrued expenses and current liabilities |
6,207 | (1,173 | ) | 2,488 | ||||||||
| Deferred revenue |
15,937 | 9,422 | 8,500 | |||||||||
|
|
|
|
|
|
|
|||||||
| Net cash provided by operating activities |
16,091 | 21,385 | 10,838 | |||||||||
|
|
|
|
|
|
|
|||||||
| INVESTING ACTIVITIES: |
||||||||||||
| Payments for acquisition of businesses |
(15,582 | ) | (6,499 | ) | (2,757 | ) | ||||||
| Capital expenditures |
(7,522 | ) | (9,444 | ) | (5,233 | ) | ||||||
| Payments for acquisition of developed technology |
(2,120 | ) | (154 | ) | — | |||||||
| Other investing activities, net |
373 | 64 | (40 | ) | ||||||||
|
|
|
|
|
|
|
|||||||
| Net cash used in investing activities |
(24,851 | ) | (16,033 | ) | (8,030 | ) | ||||||
|
|
|
|
|
|
|
|||||||
| FINANCING ACTIVITIES: |
||||||||||||
| Payments on revolving commitment |
(154,187 | ) | (136,087 | ) | (91,673 | ) | ||||||
| Borrowings under revolving commitment |
126,832 | 151,928 | 103,186 | |||||||||
| Proceeds from issuance of Class A common stock in initial public offering, net of underwriting commissions |
119,268 | — | — | |||||||||
| Principal payments on long-term debt |
(59,869 | ) | (16,232 | ) | (15,950 | ) | ||||||
| Payments for IPO offering costs |
(4,644 | ) | — | — | ||||||||
| Proceeds from issuance of common stock |
1,792 | 456 | 291 | |||||||||
| Proceeds from issuance of debt |
1,541 | 2,030 | 1,248 | |||||||||
| Payments for redemption of common stock |
(1,045 | ) | (3,049 | ) | (1,744 | ) | ||||||
| Payment for return of capital |
— | (725 | ) | — | ||||||||
| Other financing activities |
(130 | ) | (185 | ) | (55 | ) | ||||||
|
|
|
|
|
|
|
|||||||
| Net cash provided by (used in) financing activities |
29,558 | (1,864 | ) | (4,697 | ) | |||||||
|
|
|
|
|
|
|
|||||||
| Effect of exchange rate changes on cash, cash equivalents and restricted cash |
1,641 | (362 | ) | (1,639 | ) | |||||||
|
|
|
|
|
|
|
|||||||
| Net increase (decrease) in cash, cash equivalents and restricted cash |
22,439 | 3,126 | (3,528 | ) | ||||||||
| Cash, cash equivalents and restricted cash at beginning of year |
17,139 | 14,013 | 17,541 | |||||||||
|
|
|
|
|
|
|
|||||||
| Cash, cash equivalents and restricted cash at end of period |
$ | 39,578 | $ | 17,139 | $ | 14,013 | ||||||
|
|
|
|
|
|
|
|||||||
| Supplemental disclosures of cash flow: |
||||||||||||
| Interest paid |
$ | 2,092 | $ | 2,190 | $ | 2,261 | ||||||
| Income taxes paid |
$ | 5,893 | $ | 5,909 | $ | 5,626 | ||||||
| Supplemental disclosure of non-cash investing and financing activities: |
||||||||||||
| Promissory notes issued and deferred payment obligations for acquisitions |
$ | 12,352 | $ | 4,182 | $ | 750 | ||||||
| Issuance of common stock in connection with acquisitions |
$ | 8,712 | $ | — | $ | 745 | ||||||
| Issuance of common stock with put rights |
$ | 2,352 | $ | — | $ | — | ||||||
| Property and equipment and developed technology in accounts payable, other accrued expenses and current liabilities, and other liabilities |
$ | 582 | $ | 1,777 | $ | 178 | ||||||
| Initial public offering costs in accounts payable |
$ | 186 | $ | — | $ | — | ||||||
| Capital leases |
$ | 124 | $ | 129 | $ | 270 | ||||||
| Notes issued for stock redemptions |
$ | — | $ | 807 | $ | 753 | ||||||
| Obligations for return of capital in other current liabilities |
$ | — | $ | — | $ | 725 | ||||||
See accompanying notes to consolidated financial statements.
72
Table of Contents
Altair Engineering Inc. and subsidiaries
Notes to consolidated financial statements
1. Description of business
Altair Engineering Inc. (“Altair” or the “Company”) incorporated in the state of Michigan in 1985 and became a Delaware corporation in October 2017. The Company is a provider of enterprise-class engineering software enabling innovation across the entire product lifecycle from concept design to in-service operation. The Company is based in Troy, Michigan.
The Company’s simulation-driven approach to innovation is powered by its broad portfolio of high-fidelity and high-performance physics solvers. The Company’s integrated suite of software optimizes design performance across multiple disciplines including structures, motion, fluids, thermal management, electromagnetics, system modeling and embedded systems, while also providing data analytics and true-to-life visualization and rendering.
Altair’s engineering and design platform offers a wide range of multi-disciplinary computer aided engineering (“CAE”) solutions. The Company engages with its customers to provide consulting, training, and support, especially when applying optimization.
Altair also provides Client Engineering Services to support its customers with long-term ongoing product design and development expertise. This has the benefit of embedding the Company within customers, deepening its understanding of their processes, and allowing the Company to more quickly perceive trends in the overall market, helping the Company to better tailor its research and development and sales initiatives. The Company hires simulation specialists, industrial designers, design engineers, materials experts, development and test specialists, manufacturing engineers and information technology specialists for placement at a customer site for specific customer-directed assignments.
Initial public offering
In November 2017, the Company closed its initial public offering (“IPO”), in which the Company issued and sold 9,865,004 shares of Class A common stock inclusive of the underwriters’ option to purchase additional shares that was exercised in full. The price per share to the public was $13.00. The Company received aggregate proceeds of $119.3 million from the IPO, net of underwriters’ discounts and commissions, before deducting offering costs of approximately $4.8 million.
The IPO also included the sale of 3,934,996 shares of Class A common stock by certain stockholders, giving effect to the conversion of 2,200,000 shares of the Company’s Class B common stock into an equivalent number of shares of Class A common stock, and 1,734,996 stock options for Class A common stock exercised by the Company’s chief executive officer. The Company did not receive any proceeds from the sale of shares of Class A common stock by the selling stockholders.
2. Summary of significant accounting policies
Principles of consolidation
The accompanying consolidated financial statements have been prepared using accounting principles generally accepted in the United States of America (“GAAP”). The consolidated financial statements include the results of the Company and its controlled subsidiaries. Third-party holdings of equity interests in the Company’s subsidiaries that are less than controlled represent noncontrolling interests. Intercompany accounts and transactions have been eliminated in the consolidated financial statements.
Reclassifications
Certain prior period amounts included in the 2016 consolidated balance sheet and 2016 consolidated statement of cash flows have been reclassified to conform to the current year presentation.
In the accompanying consolidated balance sheet as of December 31, 2016, Obligations for acquisition of businesses has been reclassified out of Other accrued expenses and current liabilities. Note 8 – Other liabilities has been adjusted accordingly. This reclassification had no effect on Total current liabilities.
In the accompanying consolidated statement of cash flows for the year ended December 31, 2016, Payments for acquisition of developed technology has been reclassified out of Other investing activities. This reclassification had no effect on Net cash used in investing activities.
73
Table of Contents
Use of estimates
The preparation of the consolidated financial statements in conformity with GAAP requires management to make estimates and assumptions that affect the reported amounts of assets and liabilities, and disclosures of contingent assets and liabilities at the date of the financial statements, and reported amounts of revenue and expenses during the reporting periods. On an ongoing basis, management evaluates its significant estimates including provision for doubtful accounts, tax valuation allowances, liabilities for uncertain tax provisions, impairment of goodwill and intangible assets, retirement obligations, useful lives of intangible assets, revenue for fixed price contracts, valuation of common stock, and stock-based compensation. Actual results could differ from those estimates.
Delaware Conversion
On October 5, 2017, the Company became a Delaware corporation and effected a four-for-one stock split of its common stock. On the effective date of the Company becoming a Delaware corporation, (i) each share of outstanding common stock was increased to four shares of common stock, par value $0.0001 per share, (ii) the number of shares of common stock issuable under each outstanding option to purchase common stock was increased on a four-for-one basis, (iii) the exercise price of each outstanding option to purchase common stock was reduced on a four-for-one basis, and (iv) the redemption price of each outstanding put option was reduced on a four-for-one basis. All share and per share information referenced throughout the consolidated financial statements and notes thereto have been retroactively adjusted to reflect this stock split.
In connection with the Company becoming a Delaware corporation, 2,495,752 shares of Class B common stock, held by holders of less than 3% of Class B common stock immediately prior to the conversion, converted into Class A common stock.
Pursuant to the Company’s Delaware certificate of incorporation, the Company’s authorized capital consists of 513,796,572 shares of Class A common stock, 41,203,428 shares of Class B common stock and 45,000,000 shares of preferred stock.
Foreign currency translation
The functional currency of the Company’s foreign subsidiaries is their respective local currency. The assets and liabilities of the subsidiaries are translated to U.S. dollars at the exchange rate on the balance sheet date. Equity balances and transactions are translated using historical exchange rates. Revenues and expenses are translated at the average exchange rate during the period. Translation adjustments arising from the use of differing exchange rates from period to period are recorded as a component of accumulated other comprehensive loss within stockholders’ equity.
All assets and liabilities denominated in a currency other than the functional currency are remeasured into the functional currency with gains and losses recognized in foreign currency losses, net, in the consolidated statements of operations. The Company has no transactions which hedge purchase commitments and no intercompany balances which are designated as being of a long-term investment in nature.
Revenue recognition
The Company generates revenue from the following sources: (1) Software; (2) Client engineering services; and (3) Other. Revenue is recognized when persuasive evidence of an agreement exists, delivery has occurred or services have been rendered, the fee is fixed or determinable, and collection of the fee is probable or reasonably assured. Certain transactions require that government imposed taxes be assessed to the customer. The Company presents revenue net of such government imposed taxes.
Software revenue
Software component
Software revenue includes product revenue from software product licensing arrangements, related services consisting of software maintenance and support in the form of post-contract customer support (“PCS”), and professional services such as consulting and training services. Software products are sold to customers primarily under a term-based software licensing model and to a lesser degree, perpetual software licenses. Software revenue also includes consulting services from product design and development projects.
Most term-based software license agreements include the Company’s patented units-based subscription model which allows customers to license a pool of units for their organizations, providing individual users flexible access to the Company’s entire portfolio of software applications as well as to its growing portfolio of partner products. The amount of software usage is limited by the number of the units licensed by the customer. Revenue from these arrangements is fixed (based on the units licensed) and is not based on actual customer usage of each software product.
Software product license arrangements may include PCS and professional services, such as consulting and training services, which represent multiple-element arrangements. The Company has analyzed the elements included in its multiple element arrangements and has determined that it does not have vendor-specific objective evidence (“VSOE”) of fair value to allocate revenue to its software products license, PCS, and professional services including consulting and training. For arrangements that have two or more elements such as software, PCS or professional services for which the Company has not established VSOE of fair value, the Company uses the combined services approach to recognize revenue for these transactions. Under the combined services approach, revenue from the software product licenses, including perpetual licenses, PCS and professional services, if applicable, are considered to be one
74
Table of Contents
accounting unit and, once the software has been delivered and the provision of each undelivered service has commenced, are recognized ratably over the remaining period of the arrangement which consists of the longer of the PCS period, or the period the professional services are expected to be performed. If the professional services are essential to the functionality of the software products, then revenue recognition does not commence until such services are completed. In transactions with resellers, the Company contracts only with the reseller, in which pricing, length of licenses and support services are agreed upon. The reseller negotiates the price charged and length of licenses and support service directly with its customer.
The term-based software license arrangements typically have a duration of 12 months and include PCS, including the right to receive unspecified software upgrades, when and if available during the license term. The Company does not charge separately for PCS. Revenues for software licenses sold on a term-based model are recognized ratably over the term of the license arrangement, once all other revenue recognition criteria have been met.
The Company also sells perpetual licenses to its customers. The Company does not have VSOE of fair value for PCS, which is sold along with the perpetual licenses. As a result, revenue from these arrangements is recognized ratably over the initial PCS term.
Software related services component
Consulting services from product design and development projects are provided to customers on a time-and-materials (“T&M”) or fixed-price basis. Altair recognizes software services revenue for T&M contracts based upon hours worked and contractually agreed-upon hourly rates. Revenue from fixed-price engagements is recognized using the proportional performance method based on the ratio of costs incurred, to the total estimated project costs. Project costs are based on standard rates, which vary by the consultant’s professional level, plus all direct expenses incurred to complete the engagement that are not reimbursed by the client. Project costs are typically expensed as incurred. The use of the proportional performance method is dependent upon management’s ability to reliably estimate the costs to complete a project. The Company uses historical experience as a basis for future estimates to complete current projects. Additionally, the Company believes that costs are the best available measure of performance. If the costs to complete a project are not estimable or the completion is uncertain, the revenue is recognized upon completion of the services.
Client engineering services revenue
Client engineering services revenue are derived from professional services for staffing primarily representing engineers located at a customer site. These professional services are provided to customers on a T&M basis. The Company recognizes engineering services revenue for T&M contracts based upon hours worked and contractually agreed-upon hourly rates.
Other revenue
Other revenue includes product revenue from the sale of LED products for the replacement of fluorescent tubes. Revenue from the sale of LED products for the replacement of fluorescent tubes is recognized when all revenue recognition criteria stated above are met, which is generally when the products are delivered to resellers or to end customers. Sales returns, which reduce revenue and cost of revenue, are estimated using historical experience.
Cost of revenue
Cost of software
Cost of software revenue consist of expenses related to software licensing and customer support. Significant expenses include employee related costs for support team members, travel costs, and royalties for third-party software products available to customers through the Company’s products or as part of the Company’s Partner Alliance Program.
Cost of client engineering services
Cost of engineering services revenue consist primarily of employee compensation costs.
Cost of other
Cost of other revenue includes the cost of LED lighting products and freight related to products sold to retail and commercial sales channels and third-party royalty expense related to the Company’s WEYV business.
Deferred revenue
Deferred revenue consists of customer billings or payments received in advance of the recognition of revenue and is recognized as revenue when revenue recognition criteria are met.
75
Table of Contents
Cash, cash equivalents and restricted cash
The Company considers all highly liquid investments with original or remaining maturities of 90 days or less at the date of purchase to be cash equivalents. Cash and cash equivalents are recorded at cost, which approximates fair value.
Restricted cash is included in other long-term assets on the consolidated balance sheets. The following table provides a reconciliation of cash, cash equivalents and restricted cash reported in the consolidated balance sheets that sum to the total of the amounts reported in the consolidated statements of cash flows (in thousands):
| December 31, | ||||||||
| 2017 | 2016 | |||||||
| Cash and cash equivalents |
$ | 39,213 | $ | 16,874 | ||||
| Restricted cash included in other long-term assets |
365 | 265 | ||||||
|
|
|
|
|
|||||
| Total cash, cash equivalents, and restricted cash shown in the statement of cash flows |
$ | 39,578 | $ | 17,139 | ||||
|
|
|
|
|
|||||
Restricted cash represents amounts required for a contractual agreement with an insurer for the payment of potential health insurance claims, and term deposits for bank guarantees.
Accounts receivable, net
An allowance for doubtful accounts is recorded when amounts are determined to be uncollectible based on specific identification of customer circumstances, age of the receivable and other available information. Accounts are written off when it becomes apparent that such amounts will not be collected. Generally, the Company does not require collateral or charge interest on accounts receivable. Accounts receivable were reported net of an allowance for doubtful accounts of $0.8 million and $0.6 million at December 31, 2017 and 2016, respectively. Activity in the allowance for doubtful accounts was as follows (in thousands):
| For the year ended December 31, | ||||||||||||
| 2017 | 2016 | 2015 | ||||||||||
| Balance, beginning of year |
$ | (565 | ) | $ | (937 | ) | $ | (1,439 | ) | |||
| Provision charged to expense |
(610 | ) | (291 | ) | (145 | ) | ||||||
| Write-offs, net of recoveries |
414 | 638 | 536 | |||||||||
| Effects of foreign currency translation |
(37 | ) | 25 | 111 | ||||||||
|
|
|
|
|
|
|
|||||||
| Balance, end of year |
$ | (798 | ) | $ | (565 | ) | $ | (937 | ) | |||
|
|
|
|
|
|
|
|||||||
Concentrations of credit risk
The Company’s financial instruments that are potentially subject to concentrations of credit risk consist primarily of cash and trade receivables. The risk with respect to trade receivables is partially mitigated by the diversity, both by geography and by industry, of the Company’s customer base. The Company’s accounts receivable are derived from sales to a large number of direct customers and resellers around the world. Sales to customers within the automotive industry accounted for 50%, 50% and 51%, respectively, of the Company’s 2017, 2016 and 2015 revenue, with no other industry representing more than 10% of revenue. No individual customer accounted for 10% or more of revenue in the years ended December 31, 2017, 2016 or 2015.
Inventory
Inventory is stated at the lower of cost and net realizable value. Cost is determined using the first-in, first-out method. Net realizable value is the estimated selling prices in the ordinary course of business, less reasonable predictable costs of completion, disposal and transportation. The valuation of inventory requires management to estimate excess inventory as well as inventory that is not of saleable quality. The determination of obsolete or excess inventory requires management to estimate market conditions and future demand for the Company’s products.
Inventory consisted of the following (in thousands):
| December 31, | ||||||||
| 2017 | 2016 | |||||||
| Raw materials |
$ | — | $ | 52 | ||||
| Finished goods |
1,980 | 1,175 | ||||||
|
|
|
|
|
|||||
| Total inventory – net |
$ | 1,980 | $ | 1,227 | ||||
|
|
|
|
|
|||||
76
Table of Contents
Property and equipment, net
Property and equipment are stated at cost, less accumulated depreciation and amortization. Equipment held under capital leases are stated at the present value of minimum lease payments less accumulated amortization. Depreciation is calculated using the straight-line method over the estimated useful lives of the assets. Leasehold improvements and assets acquired under capital leases are amortized over the lease term or the estimated useful life of the related asset or improvement, whichever is shorter.
Expenditures for maintenance and repairs are charged to expense in the period incurred. Major expenditures for betterments are capitalized when they meet the criteria for capitalization. When assets are retired or otherwise disposed of, the cost and accumulated depreciation are removed from the accounts and any resulting gain or loss is reflected in the consolidated statements of operations in the period realized.
Software development costs
Software development costs incurred prior to the establishment of technological feasibility are expensed as incurred. Technological feasibility is established upon the completion of a detailed program design. Capitalization of software development costs begins upon the establishment of technological feasibility and ends when the product is available for general release. Generally, the time between the establishment of technological feasibility and commercial release of software is short. As such, all internal software development costs have been expensed as incurred and included in research and development expense in the accompanying consolidated statements of operations.
Impairment of long-lived assets
Long-lived assets, such as property and equipment, and definite-lived intangible assets, including developed technology, and customer relationships, are reviewed for impairment whenever events or changes in circumstances indicate that the carrying amount of an asset may not be recoverable. If circumstances require a long-lived asset or asset group to be tested for possible impairment, the Company compares the undiscounted future cash flows expected to be generated by that asset or asset group to its carrying amount. If the carrying amount of the long-lived asset or asset group is not recoverable on an undiscounted cash flow basis, an impairment charge is recognized to the extent that the carrying amount exceeds its fair value. Fair value is determined through various valuation techniques, including discounted cash flow models and third-party independent appraisals. No impairment losses were recognized in 2017, 2016, or 2015.
Goodwill and other indefinite-lived intangible assets
Goodwill represents the excess of the consideration transferred for an acquired entity over the estimated fair values of the net tangible assets and the identifiable assets acquired. As described in Note 4—Acquisitions, the Company has recorded goodwill in connection with certain acquisitions. Goodwill and other indefinite-lived intangible assets are not amortized, but rather are reviewed for impairment annually or more frequently if facts or circumstances indicate that its carrying value may not be recoverable.
The Company has determined that there is one reporting unit with goodwill subject to goodwill impairment testing. An entity has the option to perform a qualitative assessment to determine whether it is more likely than not that the fair value of the reporting unit is less than its carrying amount prior to performing the quantitative two-step impairment test. The qualitative assessment evaluates various events and circumstances, such as macro-economic conditions, industry and market conditions, cost factors, relevant events and financial trends that may impact a reporting unit’s fair value. If it is determined that the estimated fair value of the reporting unit is more likely than not less than its carrying amount, including goodwill, the two-step goodwill impairment test is required. Otherwise, no further analysis would be required.
If the two-step impairment test for goodwill is deemed necessary, this quantitative impairment analysis compares the fair value of the Company’s reporting unit to its related carrying value. If the fair value of the reporting unit is less than its carrying amount, an indication of goodwill impairment exists and the Company must perform step two of the impairment test. Under step two, an impairment loss is recognized for any excess of the carrying amount of the reporting unit’s goodwill over the implied fair value of that goodwill. The implied fair value of goodwill is determined by allocating the fair value of the reporting unit in a manner similar to a purchase price allocation and the residual fair value after this allocation is the implied fair value of the reporting unit goodwill. Fair value of the reporting units is determined using an income approach. The income approach is based on projected debt-free cash flows which are discounted to the present value using discount factors that consider the timing and risk of cash flows. The Company also takes into consideration a multiple of earnings valuation technique. The Company believes that this approach is appropriate because it provides a reasonable estimate of the price that would be received to sell the reporting unit in an orderly transaction between market participants at the measurement date. While there are inherent uncertainties related to the assumptions used in this analysis, the Company believes that this approach provides a reasonable estimate of fair value. If the fair value of the reporting unit exceeds its carrying amount, step two does not need to be performed.
77
Table of Contents
The Company performs its annual impairment review of goodwill in the fourth quarter of each year and when a triggering event occurs between annual impairment dates. For 2017, 2016 and 2015, the Company performed a qualitative assessment of goodwill and determined that it was not more likely than not that the fair value of its reporting unit with goodwill was less than the carrying amounts. Accordingly, the Company determined that its goodwill was not impaired.
Receivable for R&D credit
The French government provides a research and development (“R&D”) tax credit known as Credit Impôt Recherche, or CIR, in order to encourage Companies to invest in R&D. The tax credit is deductible from the French income tax and any excess is carried forward for three years. After three years, any unused credit may be reimbursed to the Company by the French government. As of December 31, 2017, the Company had approximately $10.2 million receivable from the French government related to CIR, of which $3.3 million is recorded in income tax receivable and the remaining $6.9 million is recorded in other long-term assets. CIR is subject to customary audit by the French tax authorities.
Valuation of common stock prior to IPO
Due to the absence of an active market for the Company’s common stock prior to the Company’s IPO in the fourth quarter of 2017, the Board of Directors, with the assistance of a third-party valuation specialist, determined the fair value of the Company’s common stock. The valuation methodology included estimates and assumptions including forecasts of future cash flows that required significant judgments. These valuations considered a number of objective and subjective factors, including the Company’s actual operating and financial performance, external market conditions, performance of comparable publicly traded companies, comparable transactions, business developments, likelihood of achieving a liquidity event, such as an initial public offering or sale, and common stock transactions, among other factors. The Company utilized methodologies in accordance with the framework of the American Institute of Certified Public Accountants’ Technical Practice Aid, Valuation of Privately-Held Company Equity Securities issued as Compensation, to estimate the fair value of its common stock. Significant changes to the key assumptions used in the valuations could have resulted in different fair values of the Company’s common stock at each valuation date.
Derivative financial instruments
The Company may use derivative financial instruments, primarily interest rate swap contracts, to hedge its exposure to interest rate risk. Such derivative financial instruments are initially recorded at fair value on the date on which a derivative contract is entered into and are subsequently remeasured to fair value at period end. Any gains or losses arising from changes in fair value on derivative contracts during the year are recorded in other expense (income), net in the consolidated statement of operations. Hedge accounting has not been applied.
Income taxes
The Company accounts for income taxes under the asset and liability method. Deferred tax assets and liabilities are recognized for the future tax consequences attributable to differences between the financial statement carrying amounts of existing assets and liabilities and their respective tax bases and for operating loss and tax credit carryforwards. Deferred tax assets and liabilities are measured using enacted tax rates expected to apply to taxable income in the years in which those temporary differences are expected to be recovered or settled. The effect of a change in tax rates on deferred tax assets and liabilities is recognized in income in the period that includes the enactment date. The Company records net deferred tax assets to the extent it believes that these assets will more likely than not be realized. These deferred tax assets are subject to periodic assessments as to recoverability and if it is determined that it is more likely than not that the benefits will not be realized, valuation allowances are recorded which increase the provision for income taxes. In making such determination, the Company considers all available positive and negative evidence, including historical taxable income, projected future taxable income, the expected timing and reversal of existing temporary differences and tax planning strategies. If based upon the evidence, it is more likely than not that the deferred tax asset will not be realized, a valuation allowance is recorded. A valuation allowance is recognized to reduce deferred tax assets to the amount that management believes is more likely than not to be realized.
The Company applies a more-likely-than-not recognition threshold to its accounting for tax uncertainties. The Company reviews all of its tax positions and makes determinations as to whether its tax positions are more likely than not to be sustained upon examination by the relevant taxing authorities. Only those benefits that have a greater than fifty percent likelihood of being sustained upon examination by taxing authorities are recognized. Interest and penalties related to uncertain tax positions are recorded in the provision for income taxes in the consolidated statements of operations.
78
Table of Contents
Research and development costs
Research and development costs are expensed as incurred. Research and development expenses consist primarily of salaries and benefits of research and development employees and costs incurred related to the development of new software products and significant enhancements and engineering changes to existing software products.
Advertising costs
Advertising costs are expensed as incurred. Advertising expenses were $3.5 million, $2.5 million and $2.2 million for the years ended December 31, 2017, 2016, and 2015, respectively.
Mezzanine equity
In 2017, the Company issued 200,000 shares of Class A common stock to a third party as partial consideration for the purchase of developed technology. These shares have a put right that can be exercised by the holder five years from date of purchase at $12.50 per share that requires the shares to be recorded at fair value and classified as mezzanine equity in the consolidated balance sheet. As of December 31, 2017, the Company concluded that it is no longer probable that the put option will be exercised as the put value is substantially below market value and subsequent adjustment is not required.
Classification of the of instrument shall remain as mezzanine equity until one of the following three events take place; 1) shares are sold on open market; 2) a redemption feature lapses; or 3) there is a modification of the terms of the instrument. As none of these events have taken place as of December 31, 2017, the classification remains as mezzanine equity.
Stock-based compensation
Employee stock-based awards, consisting of stock options expected to be settled by issuing shares of Class A common stock, are recorded as equity awards. The fair value of these awards on the date of grant is measured using the Black-Scholes option pricing model. The Company expenses the grant date fair value of its time-vested stock options subject to graded vesting using the straight-line method over the applicable service period.
Employee stock-based awards, which consisted of stock options with repurchase features that allowed them to be settled in cash at a purchase price that was less than the current fair value were considered liability-based awards. These awards were initially recorded at fair value and remeasured to fair value at the end of each reporting period until settled. During the quarter ended June 30, 2017, the Company changed its accounting policy to measure the fair value of its liability awards using the Black-Scholes option pricing model as a result of the Company no longer meeting the definition of a non-public entity. The impact of the change in accounting policy was immaterial to the financial statements. Upon IPO effectiveness in the fourth quarter of 2017, the repurchase feature was terminated and resulted in a modification of the option awards and these options were accounted for as equity awards post the Company’s IPO.
Recent accounting guidance
Accounting standards adopted
The Company adopted Accounting Standards Update, “ASU” No. 2015-11, Inventory: Simplifying the Measurement of Inventory, on January 1, 2017. This update amended existing guidance to require an entity to measure inventory within the scope at the lower of cost and net realizable value. Net realizable value is the estimated selling prices in the ordinary course of business, less reasonable predictable costs of completion, disposal and transportation. The adoption did not have a material effect on the Company’s consolidated financial statements.
The Company early adopted ASU No. 2016-09, Employee Share-Based Payment Accounting, on October 1, 2017. ASU 2016-09 simplifies various aspects related to how share-based payments are accounted for and presented in the financial statements. On a prospective basis the Company recognizes excess tax benefits or deficiencies on vesting or settlement of awards as discrete items within income tax benefit or provision within net income (loss) and the related cash flows classified within operating activities. With respect to forfeiture accounting policy election, the Company elected to account for forfeitures as they occur, adopted on a modified retrospective basis. The election to account for forfeitures as they occur did not have a material effect on the Company’s consolidated financial statements.
The Company early adopted ASU No. 2016-16, Income Taxes (Topic 740): Intra-Entity Transfers of Assets Other Than Inventory, on January 1, 2017. Previous guidance required the tax effects from intra-entity asset transfers to be deferred until the asset is sold to a third party or recovered through use. ASU 2016-16 eliminates this deferral for all intra-entity asset transfers other than inventory. The adoption did not have a material effect on the Company’s consolidated financial statements.
The Company early adopted ASU No. 2017-01, Business Combinations (Topic 805): Clarifying the Definition of a Business, on January 1, 2017. This update revised the definition of a business to assist entities with evaluating whether a set of transferred assets and activities is a business. The adoption did not have a material effect on the Company’s consolidated financial statements.
79
Table of Contents
Accounting standards not yet adopted
Revenue Recognition—In May 2014, the Financial Accounting Standards Board, or “FASB”, issued ASU No. 2014-09, Revenue from Contracts with Customers. This standard outlines a single comprehensive model for entities to use in accounting for revenue arising from contracts with customers and supersedes most existing revenue recognition guidance under GAAP. The core principle of the guidance is that an entity should recognize revenue when it transfers promised goods or services to customers in an amount that reflects the consideration to which the company expects to be entitled in exchange for those goods or services. ASU 2014-09 also requires enhanced disclosures about the nature, amount, timing, and uncertainty of revenues and cash flows arising from contracts with customers. Entities have the option of using either a full retrospective or a modified retrospective approach for the adoption of the new standard. In August 2015, the FASB issued ASU 2015-14, Revenue from Contracts with Customers: Deferral of the Effective Date that defers the effective date of ASU 2014-09 for all entities by one year for public business entities. This ASU is effective for fiscal years beginning after December 15, 2017, including interim periods within that reporting period. For all other entities, including emerging growth companies, this ASU is effective for fiscal years beginning after December 15, 2018, and interim periods within annual periods beginning after December 15, 2019. Early adoption is permitted.
Under existing GAAP, the Company does not have vendor-specific objective evidence (“VSOE”) of fair value for post-contract customer support (“PCS”) sold along with software products licenses; therefore, revenues for the software products licenses (including perpetual licenses), PCS and professional services, if applicable, are considered to be one accounting unit and, once all services have commenced, are recognized ratably over the remaining period of the arrangement (the longer of the contractual service term or PCS term). Under ASU 2014-09, the concept of assessing VSOE has been eliminated and the Company must estimate a fair value associated with each performance obligation within an arrangement. As a result, the Company expects the timing of revenue recognition to be accelerated because it anticipates that license revenue will be recognized at a point in time, rather than over time, which is its current practice. Generally, the license revenue component of an arrangement represents a significant portion of the overall fair value of a software arrangement. As a result, the Company expects the impact of adopting ASU 2014-09 to have a significant impact on the consolidated financial statements. The Company has elected to adopt this standard effective on January 1, 2019 using a modified retrospective approach. The Company is currently evaluating the impact this standard will have on its consolidated financial statements.
Financial Instruments—In January 2016, the FASB issued ASU No. 2016-01, Financial Instruments—Overall: Recognition and Measurement of Financial Assets and Financial Liabilities. This standard affects the accounting for equity instruments, financial liabilities under the fair value option and the presentation and disclosure requirements of financial instruments. ASU 2016-01 is effective in the first quarter of 2019. The Company is evaluating the impact of the adoption of ASU 2016-01 on its financial statements and related disclosures.
Leases—In February 2016, the FASB issued ASU No. 2016-02, Leases (Topic 842). This standard amends various aspects of existing accounting guidance for leases, including the recognition of a right-of-use asset and a lease liability on the balance sheet for all leases with terms longer than 12 months. Leases will be classified as either finance or operating, with classification affecting the pattern of expense recognition in the income statement. This standard also introduces new disclosure requirements for leasing arrangements. ASU 2016-02 is effective for fiscal years beginning after December 15, 2018, including interim periods within those fiscal years for public business entities. For all other entities, including emerging growth companies, ASU 2016-02 is effective for fiscal years beginning after December 15, 2019, and interim periods within fiscal years beginning after December 15, 2020. Early adoption is permitted. The new standard must be adopted using a modified retrospective approach, and provides for certain practical expedients. The Company is evaluating the impact of the adoption of ASU 2016-02 on its financial statements and related disclosures.
Cash Classification—In August 2016, the FASB issued ASU No. 2016-15, Statement of Cash Flows (Topic 230): Classification of Certain Cash Receipts and Cash Payments, to improve financial reporting in regard to how certain transactions are classified in the statement of cash flows. ASU 2016-15 provides guidance for targeted changes with respect to how cash receipts and cash payments are classified in the statements of cash flows, with the objective of reducing diversity in practice. ASU 2016-15 is effective for interim and annual periods beginning after December 15, 2017, for public business entities. For all other entities, including emerging growth companies, ASU 2016-15 is effective for fiscal years beginning after December 15, 2018, and interim periods within fiscal years beginning after December 15, 2019. Early adoption is permitted. The Company is evaluating the impact of the adoption of ASU No. 2016-15 on its financial statements and related disclosures.
Goodwill Impairment—In January 2017, the FASB issued ASU No. 2017-04, Intangibles – Goodwill and Other (Topic 350): Simplifying the Test for Goodwill Impairment, which simplifies accounting for goodwill impairments by eliminating step two from the goodwill impairment test. This guidance is effective for annual or interim goodwill impairment tests in fiscal years beginning after December 15, 2019, for public business entities that are Securities and Exchange Commission (SEC) filers, and December 15, 2020, for public business entities that are not SEC filers. For all other entities, including emerging growth companies, ASU 2017-04 is effective for annual or interim goodwill impairment tests in fiscal years beginning after December 15, 2021. Early adoption is permitted for interim and annual goodwill impairment tests performed on testing dates after January 1, 2017. The new standard must be applied on a prospective basis. The adoption of this guidance is not expected to have a material impact on the Company’s consolidated financial statements.
80
Table of Contents
Retirement Benefits – In March 2017, the FASB issued ASU 2017-07, Compensation – Retirement Benefits (Topic 715): Improving the Presentation of Net Periodic Pension Cost and Net Periodic Postretirement Benefit Cost. This ASU requires that an employer report the service cost component in the same line item or items as other compensation costs arising from services rendered by the pertinent employees during the period. The other components of net benefit cost are required to be presented in the income statement separately from the service cost component. The new guidance is effective for public business entities for annual reporting periods, and interim reporting periods within those annual periods, beginning after December 15, 2017. For all other entities, including emerging growth companies, ASU 2017-07 is effective for annual periods beginning after December 15, 2018, and interim periods within annual periods beginning after December 15, 2019. Early adoption is permitted as of the beginning of an annual period. The adoption of this guidance is not expected to have a material impact on the Company’s consolidated financial statements.
Stock Compensation – In May 2017, the FASB issued ASU 2017-09, Compensation – Stock Compensation (Topic 718): Scope of Modification Accounting. This ASU amends the guidance about which changes to the terms or conditions of a share-based payment award require an entity to apply modification accounting in Topic 718. The new guidance is effective for annual reporting periods, and interim reporting periods within those annual periods, beginning after December 15, 2017. Early adoption is permitted for interim or annual periods. The Company is evaluating the impact of the adoption of ASU No. 2017-09 on its financial statements and related disclosures.
Derivatives and Hedging – In August 2017, the FASB issued ASU 2017-12, Derivatives and Hedging (Topic 815): Targeted Improvements to Accounting for Hedging Activities. This ASU amends the guidance with the objective of improving the financial reporting of hedging relationships to better portray the economic results of an entity’s risk management activities in its financial statements. In addition, this ASU amends the current guidance to simplify the application of the hedge accounting guidance. For public business entities, the amendments are effective for annual reporting periods, and interim reporting periods within those annual periods, beginning after December 15, 2018. For all other entities, including emerging growth companies, the amendments are effective for fiscal years beginning after December 15, 2019, and interim periods within fiscal years beginning after December 15, 2020. Early adoption is permitted. The Company is currently evaluating the impact of the new guidance on its consolidated financial statements.
3. Fair value measurements
The accounting guidance for fair value, among other things, defines fair value, establishes a consistent framework for measuring fair value and expands disclosure for each major asset and liability category measured at fair value on either a recurring or nonrecurring basis. Fair value is defined as the price that would be received to sell an asset or paid to transfer a liability (an exit price) in an orderly transaction between market participants at the reporting date. The framework for measuring fair value consists of a three-level valuation hierarchy that prioritizes the inputs to valuation techniques used to measure fair value based upon whether such inputs are observable or unobservable. Observable inputs reflect market data obtained from independent sources, while unobservable inputs reflect market assumptions made by the reporting entity. The three-level hierarchy for the inputs to valuation techniques is briefly summarized as follows:
| Level 1— |
Quoted prices in active markets for identical assets and liabilities at the measurement date; | |
| Level 2— |
Observable inputs, other than the quoted prices in active markets, that are observable either directly or indirectly; and | |
| Level 3— |
Unobservable inputs in which there is little or no market data, which require the reporting entity to develop its own assumptions. | |
An asset’s or liability’s fair value measurement level within the fair value hierarchy is based on the lowest level of any input that is significant to the fair value measurement. Valuation techniques used need to maximize the use of observable inputs and minimize the use of unobservable inputs.
81
Table of Contents
Items measured at fair value on a recurring basis
The following table sets forth a summary of the changes in the fair value of the Company’s Level 3 financial liabilities (in thousands):
| Liability for Class A redeemable common shares |
Liability for stock-based compensation awards |
|||||||
| Balance at December 31, 2015 |
6,692 | 11,033 | ||||||
| Shares issued upon exercise of stock options |
1,841 | — | ||||||
| Repurchase of shares |
(79 | ) | — | |||||
| Exercise of stock options |
— | (2,084 | ) | |||||
| Forfeitures of stock options |
— | (110 | ) | |||||
| Change in fair value |
2,178 | 2,765 | ||||||
|
|
|
|
|
|||||
| Balance at December 31, 2016 |
10,632 | 11,604 | ||||||
| Exercise of stock options |
432 | (411 | ) | |||||
| Forfeitures of stock options |
— | (157 | ) | |||||
| Change in fair value |
19,223 | 25,191 | ||||||
| Modification to stock options as a result of the Company’s IPO(1) |
(30,287 | ) | (36,227 | ) | ||||
|
|
|
|
|
|||||
| Balance at December 31, 2017 |
$ | — | $ | — | ||||
|
|
|
|
|
|||||
| (1) | As a result of the Company’s IPO in the fourth quarter of 2017, the call feature terminated which resulted in the $66.5 million liability valued immediately prior to the IPO associated with the Company’s Class A redeemable common shares and with the stock options outstanding under the 2001 ISO and NQSO Plan to be reclassified to equity in the fourth quarter of 2017 in accordance with ASC 718. |
The carrying value of cash and cash equivalents, accounts receivable and accounts payable approximate fair value due to their short maturities. Interest on the Company’s long-term debt is at a variable rate, and as such the debt obligation outstanding approximates fair value.
The carrying value of the Company’s derivative financial instruments are measured at fair value on a recurring basis. The fair value of derivatives is determined based on inputs derived from or corroborated by observable market data pertaining to relevant interest rates and is considered a level 2 fair value measurement. See Note 9—Financial instruments for additional information regarding the use and fair value of derivatives.
4. Acquisitions
Runtime Design Automation
On September 28, 2017, the Company acquired 100% of the shares of Runtime Design Automation (“Runtime”) for a total of $19.4 million in cash, of which $9.4 million is payable one year from the acquisition date, which includes a $0.7 million working capital adjustment, and 708,000 shares of the Company’s Class A common stock. Runtime complements Altair’s PBS Works™ suite of products for comprehensive, secure workload management for HPS and cloud environments and has solutions to manage highly complex workflows. PBS Works targets product design, weather prediction, oil exploration and bio-informatics, and Runtime primarily serves customers in electronic design automation.
The following table summarizes the consideration transferred to acquire Runtime and the amounts of identified assets acquired and liabilities assumed at the acquisition date (in thousands):
| Fair value of consideration transferred |
$ | 25,691 | ||
|
|
|
|||
| Recognized amounts of identifiable assets acquired and liabilities assumed: |
||||
| Cash |
564 | |||
| Accounts receivable |
2,257 | |||
| Deferred tax assets |
1,713 | |||
| Other assets |
257 | |||
| Trade names |
440 | |||
| Developed technology (4-year life) |
7,870 | |||
| Customer relationships (7-year life) |
2,490 | |||
| Accounts payable and other liabilities |
(1,000 | ) | ||
| Deferred revenue |
(1,925 | ) | ||
| Deferred tax liabilities |
(4,454 | ) | ||
|
|
|
|||
| Total net identifiable assets acquired and liabilities assumed |
8,212 | |||
|
|
|
|||
| Goodwill |
$ | 17,479 | ||
|
|
|
Goodwill is primarily attributable to synergies expected to arise after the acquisition and is not deductible for tax purposes.
82
Table of Contents
Carriots S.L.
In May 2017, the Company acquired 100% of the shares of Carriots S.L. (“Carriots”) for $3.6 million cash, $2.7 million notes payable, and 80,000 shares of the Company’s Class A common stock. Carriots is an Internet of Things (“IoT”) Cloud platform that allows easy development of new IoT enabled products. Carriots complements Altair’s other product suites to provide a comprehensive solution for customers to design and implement IoT enabled products.
The following table summarizes the consideration transferred to acquire Carriots and the amounts of identified assets acquired and liabilities assumed at the acquisition date (in thousands):
| Fair value of consideration transferred |
$ | 6,657 | ||
|
|
|
|||
| Recognized amounts of identifiable assets acquired and liabilities assumed: |
||||
| Deferred tax assets |
394 | |||
| Other assets |
472 | |||
| Trade names |
252 | |||
| Developed technology (4-year life) |
1,317 | |||
| Customer relationships (7-year life) |
296 | |||
| Accounts payable and other liabilities |
(1,015 | ) | ||
|
|
|
|||
| Total net identifiable assets acquired and liabilities assumed |
1,716 | |||
|
|
|
|||
| Goodwill |
$ | 4,941 | ||
|
|
|
Goodwill is primarily attributable to synergies expected to arise after the acquisition and is not deductible for tax purposes.
CEDRAT S.A.
In April 2016, the Company completed the acquisition of all of the common shares of CEDRAT S.A. (“CEDRAT”) for $3.7 million in cash and $1.4 million in a note payable. CEDRAT is in the field of simulating low-frequency electromagnetics and thermal simulations for electric motor design. The acquisition of CEDRAT and its Flux technology complements Altair’s broad software coverage, including Altair’s comprehensive set of solvers for the rapidly growing electromagnetic market.
The following table summarizes the consideration transferred to acquire CEDRAT and the amounts of identified assets acquired and liabilities assumed at the acquisition date (in thousands):
| Fair value of consideration transferred |
$ | 5,122 | ||
|
|
|
|||
| Recognized amounts of identifiable assets acquired and liabilities assumed: |
||||
| Cash |
$ | 363 | ||
| Accounts receivable |
542 | |||
| Income tax receivable |
995 | |||
| Other assets |
206 | |||
| Trade names |
269 | |||
| Developed technology (4-year life) |
1,085 | |||
| Customer relationships (7-year life) |
938 | |||
| Accounts payable and other liabilities |
(2,742 | ) | ||
| Deferred revenue |
(290 | ) | ||
|
|
|
|||
| Total net identifiable assets acquired and liabilities assumed |
1,366 | |||
|
|
|
|||
| Goodwill(1) |
$ | 3,756 | ||
|
|
|
| (1) | The goodwill included $3.5 million that was tax deductible. |
Other business acquisitions
During the years ended December 31, 2017, 2016 and 2015, the Company completed other business acquisitions that were individually and in the aggregate insignificant. The Company has accounted for all of its acquisitions using the acquisition method. The operating results of each acquisition have been included in the consolidated financial statements since the respective dates of acquisition.
83
Table of Contents
The combined purchase price related to the 2017 acquisitions, excluding Runtime and Carriots, was not material.
The combined purchase price related to the 2016 acquisitions, excluding CEDRAT, was $6.0 million, which consisted of cash of $3.1 million and notes payable of $2.9 million. The total consideration transferred was allocated to assets and liabilities of each acquisition based on management’s estimates of the fair values of the assets acquired and liabilities assumed. The allocation included $2.3 million to intangibles, consisting of developed technology, customer relationships, and trade names and $4.1 million to goodwill. There was no taxable goodwill associated with the Company’s other 2016 acquisitions.
The combined consideration transferred related to the 2015 acquisitions was $4.4 million, which consisted of cash of $2.9 million, equity of $0.7 million and notes of $0.8 million. The total consideration transferred was allocated to assets and liabilities of each acquisition based on management’s estimates of the fair values of the assets acquired and liabilities assumed. The allocation included $1.9 million to intangibles, consisting of developed technology, customer relationships, and trade names and $2.9 million to goodwill, of which $1.0 million was tax deductible.
For each of its acquisitions the Company engaged a third-party valuation firm to assist the Company in valuing certain assets and liabilities acquired.
5. Property and equipment, net
Property and equipment consists of the following (in thousands):
| Estimated useful lives |
December 31, | |||||||||||
| 2017 | 2016 | |||||||||||
| Land |
Indefinite | $ | 7,994 | $ | 7,994 | |||||||
| Building and improvements |
5-39 years | 15,185 | 14,956 | |||||||||
| Computer equipment and software |
3-5 years | 32,103 | 27,461 | |||||||||
| Office furniture and equipment |
5-15 years | 6,751 | 5,306 | |||||||||
| Leasehold improvements |
(1) | 6,467 | 5,397 | |||||||||
|
|
|
|
|
|||||||||
| Total property and equipment |
68,500 | (2) | 61,114 | (2) | ||||||||
| Less: accumulated depreciation and amortization |
37,054 | 31,406 | ||||||||||
|
|
|
|
|
|||||||||
| Property and equipment, net |
$ | 31,446 | $ | 29,708 | ||||||||
|
|
|
|
|
|||||||||
| (1) | Shorter of lease term or estimated useful life, generally ranging from five to ten years. |
| (2) | Equipment under capital lease obligations had an original carrying value of approximately $1.1 million and $1.4 million at December 31, 2017 and 2016, respectively. |
In November 2016, the Company purchased land adjacent to Altair’s corporate headquarters for future expansion of the Company’s facilities for $4.0 million.
Depreciation expense, including amortization of assets under capital lease, was $6.3 million, $6.7 million and $5.8 million for the years ended December 31, 2017, 2016 and 2015, respectively.
6. Goodwill and other intangible assets
Goodwill
The changes in the carrying amount of goodwill, which is attributable to the Software reporting segment, are as follows (in thousands):
| Balance at December 31, 2014 |
$ | 28,859 | ||
| Acquisitions |
2,897 | |||
| Effects of foreign currency translation |
(2,516 | ) | ||
|
|
|
|||
| Balance at December 31, 2015 |
29,240 | |||
| Acquisitions |
7,855 | |||
| Effects of foreign currency translation |
(470 | ) | ||
|
|
|
|||
| Balance at December 31, 2016 |
36,625 | |||
| Acquisitions |
22,420 | |||
| Effects of foreign currency translation |
3,661 | |||
|
|
|
|||
| Balance at December 31, 2017 |
$ | 62,706 | ||
|
|
|
84
Table of Contents
Other intangible assets
A summary of other intangible assets is shown below (in thousands):
| December 31, 2017 | ||||||||||||||||
| Weighted average amortization period |
Gross carrying amount |
Accumulated amortization |
Net carrying amount |
|||||||||||||
| Definite-lived intangible assets: |
||||||||||||||||
| Developed technology |
4 years | $ | 25,947 | $ | 9,909 | $ | 16,038 | |||||||||
| Customer relationships |
7 years | 11,794 | 6,195 | 5,599 | ||||||||||||
| Noncompete agreements |
5 years | 824 | 824 | — | ||||||||||||
| Other intangibles |
10 years | 143 | 57 | 86 | ||||||||||||
|
|
|
|
|
|
|
|||||||||||
| Total definite-lived intangible assets |
38,708 | 16,985 | 21,723 | |||||||||||||
|
|
|
|
|
|
|
|||||||||||
| Indefinite-lived intangible assets: |
||||||||||||||||
| Trade names |
2,738 | 2,738 | ||||||||||||||
|
|
|
|
|
|
|
|||||||||||
| Total other intangible assets |
$ | 41,446 | $ | 16,985 | $ | 24,461 | ||||||||||
|
|
|
|
|
|
|
|||||||||||
| December 31, 2016 | ||||||||||||||||
| Weighted average amortization period |
Gross carrying amount |
Accumulated amortization |
Net carrying amount |
|||||||||||||
| Definite-lived intangible assets: |
||||||||||||||||
| Developed technology |
4 years | $ | 10,631 | $ | 5,034 | $ | 5,597 | |||||||||
| Customer relationships |
7 years | 8,646 | 4,977 | 3,669 | ||||||||||||
| Noncompete agreements |
5 years | 824 | 824 | — | ||||||||||||
| Other intangibles |
10 years | 117 | 40 | 77 | ||||||||||||
|
|
|
|
|
|
|
|||||||||||
| Total definite-lived intangible assets |
20,218 | 10,875 | 9,343 | |||||||||||||
|
|
|
|
|
|
|
|||||||||||
| Indefinite-lived intangible assets: |
||||||||||||||||
| Trade names |
1,825 | 1,825 | ||||||||||||||
|
|
|
|
|
|
|
|||||||||||
| Total other intangible assets |
$ | 22,043 | $ | 10,875 | $ | 11,168 | ||||||||||
|
|
|
|
|
|
|
|||||||||||
Amortization expense related to amortizing intangible assets was $5.4 million, $3.3 million and $2.6 million for the years ended December 31, 2017, 2016 and 2015, respectively.
Estimated amortization expense for the next five years as of December 31, 2017 is as follows (in thousands):
| Year ending | ||||
| December 31, 2018 |
$ | 6,692 | ||
| December 31, 2019 |
$ | 5,653 | ||
| December 31, 2020 |
$ | 5,015 | ||
| December 31, 2021 |
$ | 2,931 | ||
| December 31, 2022 |
$ | 639 | ||
85
Table of Contents
7. Debt
The carrying value of debt is as follows (in thousands):
| December 31, | ||||||||
| 2017 | 2016 | |||||||
| Prior Credit Agreement: |
||||||||
| Revolving Credit Facility |
$ | — | $ | 27,355 | ||||
| Term Loan A |
— | 57,500 | ||||||
| Obligations held under capital leases (Note 18) |
207 | 196 | ||||||
| Other borrowings |
203 | 330 | ||||||
|
|
|
|
|
|||||
| Total debt |
410 | 85,381 | ||||||
| Less: unamortized debt issuance costs |
— | 140 | ||||||
| Less: current portion of long-term debt |
232 | 10,435 | ||||||
|
|
|
|
|
|||||
| Long-term debt, net of current portion |
$ | 178 | $ | 74,806 | ||||
|
|
|
|
|
|||||
Credit agreement
Revolving credit facility
On October 19, 2017, the Company entered into an amended and restated credit agreement with Altair Engineering Inc., as borrower, JPMorgan Chase Bank, N.A., as the lead arranger, sole book runner, the administrative agent, swingline lender and letter of credit issuer, and a syndicate of lenders (“2017 Credit Agreement”). The 2017 Credit Agreement became effective on satisfaction of certain conditions including the closing of the Company’s IPO and provides for an initial aggregate commitment amount of $100.0 million, with a sublimit for the issuance of letters of credit of up to $5.0 million and a sublimit for swingline loans of up to $5.0 million. The 2017 Credit Agreement matures on October 18, 2022.
The 2017 Credit Agreement allows the Company to request that the aggregate commitments under the 2017 Credit Agreement be increased by up to $50.0 million for a total of $150.0 million, subject to certain conditions, by obtaining additional commitments from the existing lenders or by causing a person acceptable to the administrative agent to become a lender (in each case subject to the terms and conditions set forth in the 2017 Credit Agreement).
As of December 31, 2017, the Company had no outstanding borrowings under the 2017 Credit Agreement and there was $100.0 million available for future borrowing. The 2017 Credit Agreement is available for general corporate purposes, including working capital, capital expenditures, and permitted acquisitions.
Borrowings under the 2017 Credit Agreement bear interest at a rate per annum equal to an agreed upon applicable margin plus, at the Company’s option, either the Alternate Base Rate (defined as the greatest of (1) the Prime Rate (as defined in the 2017 Credit Agreement) in effect on such day, (2) the Federal Funds Effective Rate (as defined in the 2017 Credit Agreement) in effect on such day plus 1/2 of 1.00% or (3) the Adjusted LIBO Rate (as defined in the 2017 Credit Agreement) for a one month interest period on such day (or if such day is not a business day, the immediately preceding business day) plus 1.00%) or the Adjusted LIBO Rate. The applicable margin for borrowings under the 2017 Credit Agreement is based on the Company’s most recently tested consolidated total net leverage ratio and will vary from (a) in the case of Eurodollar loans, 1.25% to 2.00%, and (b) in the case of ABR loans or swingline loans, 0.25% to 1.00%.
The Company pays a commitment fee ranging from 0.15% to 0.30% on the unused portion of the 2017 Credit Agreement.
Collateral and guarantees
The 2017 Credit Agreement is secured by collateral including (i) substantially all of the Company’s properties and assets, and the properties and assets of the Company’s domestic subsidiaries but excluding any patents, copyrights, patent applications or copyright applications or any trade secrets or software products and (ii) pledges of the equity interests in all present and future domestic subsidiaries (subject to certain exceptions as provided for under the 2017 Credit Agreement). The Company’s direct and indirect domestic subsidiaries are guarantors of all of the obligations under the 2017 Credit Agreement.
Debt covenants
The 2017 Credit Agreement requires the Company to maintain the following financial covenants:
| • | Maximum Net Leverage Ratio: Commencing with the fiscal quarter ending December 31, 2017 and on the last day of each fiscal quarter thereafter, the Company on a consolidated basis will not permit the ratio of total indebtedness (net of unrestricted domestic cash in excess of $20.0 million) to EBITDA, as such terms are defined in the 2017 Credit Agreement, for the rolling four quarter period ending on such date to be greater than 3.00 to 1.00 as of the last day of each fiscal quarter. |
| • | Consolidated Interest Coverage Ratio: Commencing with the fiscal quarter ending December 31, 2017 and on the last day of each fiscal quarter thereafter, the Company on a consolidated basis will not permit the ratio of (x) EBITDA to (y) cash Consolidated Interest Expense, as such terms are defined in the 2017 Credit Agreement, in each case for the rolling four quarter period ending on such date, to be less than 3.00 to 1.00 as of the last day of each fiscal quarter. |
86
Table of Contents
At December 31, 2017, the Company was in compliance with all such financial covenants.
Prior credit agreement
Prior to entering into the 2017 Credit Agreement, the Company’s credit agreement consisted of a $65.0 million term loan (“Term Loan A”) and a $60.0 million revolving commitment (“2016 Revolving Credit Facility”) including a $5.0 million swingline subfacility, and a letter of credit subfacility (collectively, the “Secured Credit Agreement”.)
At December 31, 2016, there was $57.5 million outstanding under Term Loan A at an interest rate of 2.6% based on the LIBO rate and the applicable margin. The Company was required to make quarterly principal payments on Term Loan A of $2.5 million in 2017, 2018 and March 2019. Any outstanding principal balance was to be paid in full on the maturity date of April 18, 2019.
At December 31, 2016, the Company had $27.4 million outstanding under the 2016 Revolving Credit Facility and there was $32.6 million available for future borrowing. The 2016 Revolving Credit Facility was available for general corporate purposes, including working capital, capital expenditures, and permitted acquisitions. All borrowings under the 2016 Revolving Credit Facility were due on the termination date in April 2019. The weighted-average interest rate on borrowings under the 2016 Revolving Credit Facility was 2.6% for the year ended December 31, 2016.
On November 3, 2017, in connection with the completion of the Company’s IPO, the Company repaid in full all outstanding debt under the Secured Credit Agreement. The Company paid a total of approximately $93.1 million, which included outstanding principal, interest, and other nominal costs. Upon the repayment of the Secured Credit Agreement, all unamortized debt issuance costs were recorded as interest expense.
Other
The Company has available overdraft and line of credit facilities in several countries in which it operates. These credit facilities are with various domestic and international banks and are at quoted market rates. At both December 31, 2017 and 2016, the Company had $3.5 million of availability under these facilities and there were no outstanding commitments.
Scheduled maturities of long-term debt
At December 31, 2017, future maturities of long-term debt, excluding capital leases, were as follows (in thousands):
| Year ending December 31, | ||||
| 2018 |
$ | 126 | ||
| 2019 |
77 | |||
| 2020 |
— | |||
| 2021 |
— | |||
| 2022 |
— | |||
|
|
|
|||
| Total |
$ | 203 | ||
|
|
|
|||
8. Other liabilities
The following table provides the details of other accrued expenses and current liabilities (in thousands):
| December 31, | ||||||||
| 2017 | 2016 | |||||||
| Accrued VAT |
$ | 3,916 | $ | 3,928 | ||||
| Income taxes payable |
3,724 | 2,156 | ||||||
| Accrued professional fees |
2,500 | 1,389 | ||||||
| Accrued royalties |
2,037 | 1,583 | ||||||
| Non-income tax liabilities |
1,343 | 739 | ||||||
| Defined contribution plan liabilities |
1,274 | 1,139 | ||||||
| Billings in excess of cost |
832 | 1,021 | ||||||
| Related party liabilities |
119 | 1,045 | ||||||
| Other current liabilities |
5,999 | 3,296 | ||||||
|
|
|
|
|
|||||
| Total |
$ | 21,744 | $ | 16,296 | ||||
|
|
|
|
|
|||||
87
Table of Contents
The following table provides the details of other long-term liabilities (in thousands):
| December 31, | ||||||||
| 2017 | 2016 | |||||||
| Pension and other post retirement liabilities |
$ | 7,670 | $ | 5,959 | ||||
| Deferred tax liabilities |
1,620 | 1,379 | ||||||
| Other liabilities |
8,357 | 9,776 | ||||||
|
|
|
|
|
|||||
| Total |
$ | 17,647 | $ | 17,114 | ||||
|
|
|
|
|
|||||
9. Financial instruments
The Company is exposed to certain financial market risks related to its ongoing business operations. The primary risks the Company manages through derivative financial instruments and hedging activities are foreign currency exchange rate risk and interest rate risk. Derivative financial instruments and hedging activities can be utilized to protect the Company’s cash flow from adverse movements in foreign currency exchange rates and to manage interest costs. Although the Company is exposed to credit loss in the event of nonperformance by the counterparty to the derivative financial instruments, the Company attempts to limit this exposure by entering into agreements directly with major financial institutions that meet the Company’s credit standards and that are expected to fully satisfy their obligations under the contracts.
Interest rate swaps
Interest rate exposures are reviewed periodically and the Company may enter into interest rate swap agreements to manage its exposure. The Company’s exposure to interest rate risk arises primarily from changes in the LIBO rate. The Company will hold these derivatives for economic purposes but does not designate these derivatives to obtain hedge accounting treatment. As such, gains or losses on these contracts (including contracts that do not qualify for hedge accounting under ASC 815), are reported in earnings immediately as Other expense (income), net. These contracts limit exposure to changes in interest payments associated with variable rate debt. However, as the change in the fair value of the interest rate swaps is impacted by both realized and unrealized gains and losses on the contracts, the amount recognized in earnings may not offset the changes in the variability of interest expense during a given period.
As of December 31, 2017, and 2016, the Company had an interest rate swap outstanding with a $4.5 million notional value. This interest rate swap matures on December 23, 2019.
Foreign currency derivatives
The Company sells its products (and incurs costs) in countries throughout the world. As a result, it is exposed to fluctuations in foreign currency exchange rates. Foreign currency exposures are reviewed on a periodic basis and any natural offsets are considered prior to entering into a derivative financial instrument. The Company could enter into foreign exchange contracts to hedge portions of its foreign currency denominated forecasted revenues, purchases and the subsequent cash flows after considering natural offsets within the consolidated group. The Company will hold these derivatives for economic purposes but does not designate these derivatives to obtain hedge accounting treatment. As such, gains or losses on these contracts (including contracts that do not qualify for hedge accounting under ASC 815), are reported in earnings immediately and are substantially offset by the effect of the revaluation of the underlying foreign currency denominated transactions. There were no foreign exchange contracts outstanding at December 31, 2017 or 2016.
Derivative instruments
As of December 31, 2017 and 2016, the fair value of the Company’s derivative instruments included in other long-term liabilities was a liability of $0.2 million and $0.3 million, respectively.
Credit-risk-related contingent features
The Company has entered into International Swaps and Derivatives Association (“ISDA”) agreements with its significant derivative counterparty. These agreements provide bilateral netting and offsetting of accounts that are in a liability position with those that are in an asset position. These agreements do not require the Company to maintain a minimum credit rating in order to be in compliance and do not contain any margin call provisions or collateral requirements that could be triggered by derivative instruments in a net liability position. As of December 31, 2017, the Company had not and was not required to post any collateral to support its derivatives in a liability position.
88
Table of Contents
10. Stockholders’ equity
Preferred stock
As of December 31, 2017, the Company had authorized 45,000,000 shares of preferred stock, par value $0.0001, of which no shares were issued or outstanding. The Board of Directors has the authority to issue the preferred stock in one or more series and to fix rights, preferences, privileges, and restrictions, including dividends and the number of shares constituting any series or the designation of such series, without any further vote or action by the stockholders.
Common stock
As of December 31, 2017, the Company had authorized 513,796,572 shares of Class A common stock, par value $0.0001, and 41,203,428 shares of Class B common stock, par value $0.0001. The rights of the holders of Class A common stock and Class B common stock are identical, except with respect to voting and conversion rights. Each share of Class A common stock is entitled to one vote per share. Each share of Class B common stock is entitled to ten votes per share and is convertible into one share of Class A common stock.
The holders of Class A and Class B common stock are entitled to dividends at the sole discretion of the Board of Directors. No common stock dividends were declared or paid in 2017, 2016 or 2015.
Recapitalization
On April 3, 2017, the Company completed a recapitalization (the “Recapitalization”) of its capital stock by filing a certificate of amendment to its articles of incorporation with the State of Michigan pursuant to which: (i) each share of the Company’s Class A voting common stock, or old Class A shares, automatically converted into one share of new Class B voting common stock entitled to ten votes per share; and (ii) each share of the Company’s Class B non-voting common stock, or old Class B shares, automatically converted into one share of new Class A voting common stock entitled to one vote per share, in each case, without any further action on the part of the holders thereof.
Subsequent to the Recapitalization, the Company’s authorized common stock consists of 76,000,000 shares of no par, Class A common stock and 44,000,000 shares of no par, Class B common stock.
Prior to the Recapitalization, the Company’s authorized common stock consisted of 99,279,884 shares of no par, Class A Voting Common Stock and 25,153,872 shares of no par, Class B Nonvoting Common Stock. Each class of common stock had equal and identical rights, preferences and limitations, other than voting. The holders of old Class A common stock were entitled to one vote per share on all matters submitted to the stockholders for a vote and holders of old Class B common stock had no voting rights.
Other
In October 2015, the Company acquired Altair Bellingham, LLC from significant stockholders of the Company for cash of $0.7 million, which was paid in February 2016. This transaction was reported as a return of capital for the year ended December 31, 2015.
11. Stock-based compensation
2001 stock-based compensation plans
Nonqualified stock option plan
In 2001, the Company established the Nonqualified Stock Option Plan (“NSO Plan”) under which 6,441,972 stock options with an exercise price of $.000025 remain outstanding at December 31, 2017. The NSO Plan was terminated in 2003. Stock options under the NSO plan were immediately vested and have a contractual term of 35 years from the date of grant. The outstanding awards will continue to be governed by their existing terms under the NSO Plan. The NSO Plan is accounted for as an equity plan.
89
Table of Contents
The following table summarizes the stock option activity under the NSO Plan:
| Number of options | Weighted average exercise price per share |
Weighted average remaining contractual term (years) |
||||||||||
| Outstanding at January 1, 2017 |
6,458,472 | $ | 0.000025 | 20 years | ||||||||
| Granted |
— | — | ||||||||||
| Exercised |
(16,500 | ) | $ | — | ||||||||
| Forfeited |
— | $ | — | |||||||||
|
|
|
|||||||||||
| Outstanding at December 31, 2017 |
6,441,972 | $ | 0.000025 | 19 years | ||||||||
|
|
|
|||||||||||
| Exercisable at December 31, 2017 |
6,441,972 | $ | 0.000025 | 19 years | ||||||||
Incentive and nonqualified stock-based plan
Also in 2001, the Company established the Incentive and Nonqualified Stock-based Plan (“ISO Plan”) which was terminated in 2011 and was authorized to issue nonqualified stock options (“NQSO”) and incentive stock options (“ISO”) totaling 11,153,872 shares of Class A common stock. The NQSO grants could be issued at less than the fair market value at date of grant under the terms of the ISO Plan, while ISO grants were issued at a price equal to or greater than the fair market value at date of grant. Options generally vest over a two to three-year period. All options have a contractual term of ten years from the date of grant. At December 31, 2017 and 2016, there were 888,864 and 2,972,744 options outstanding, respectively, under the ISO Plan.
Until the effective date of the Company’s IPO, options granted under the ISO Plan were accounted for as liability awards as the terms of the awards could require or allow repurchase of the shares at amounts different than fair value. The Company made the accounting policy election to use the intrinsic value method of accounting to determine stock-based compensation liabilities for these awards. During the quarter ended June 30, 2017, the Company changed its accounting policy to measure the fair value of its liability awards using the Black-Scholes option pricing model as a result of the Company no longer meeting the definition of a non-public entity. The impact of the change in accounting policy was immaterial to the financial statements.
The ISO Plan also included stock-based compensation liability for 2,340,596 of Class A shares outstanding at December 31, 2016, resulting from the Company’s call feature with an exercise price that may be set at less than the fair market value at date of grant under the terms of the ISO Plan. The Company utilized the fair value of the outstanding Class A shares to determine the stock-based compensation liabilities for these shares, based on the respective dates.
As a result of the Company’s IPO in the fourth quarter 2017, the call feature terminated which resulted in the $66.5 million liability valued immediately prior to the IPO associated with the Company’s Class A redeemable common shares and with the stock options outstanding under the 2001 ISO and NQSO Plan to be reclassified to equity as of December 31, 2017 in accordance with ASC 718.
The following table summarizes the stock option activity under the 2001 Stock-based compensation plans for the periods indicated as follows:
| Number of options |
Weighted average exercise price per share |
Weighted average remaining contractual term (years) |
||||||||||
| Outstanding at January 1, 2017 |
2,972,744 | $ | 0.64 | 3.4 | ||||||||
| Granted |
— | — | ||||||||||
| Exercised(1) |
(2,070,916 | ) | $ | 0.63 | ||||||||
| Forfeited |
(12,964 | ) | $ | 0.53 | ||||||||
|
|
|
|||||||||||
| Outstanding at December 31, 2017 |
888,864 | $ | 0.67 | 2.5 | ||||||||
|
|
|
|||||||||||
| Exercisable at December 31, 2017 |
888,864 | $ | 0.67 | 2.5 | ||||||||
| (1) | Includes 1.7 million stock options exercised in connection with the Company’s IPO. |
The total intrinsic value of the ISO Plan stock options exercised during the years ended December 31, 2017 and 2016 was $25.6 million and $2.7 million, respectively.
2012 stock-based compensation plans
During 2012, the Company established the 2012 Incentive and Nonqualified Stock Option Plan (“2012 Plan”) which permits the issuance of 5,200,000 shares of Class A common stock for the grant of nonqualified stock options (“NQSO”) and incentive stock options (“ISO”) for management, other employees, and board members of the Company. The options are issued at a price equal to or greater than fair market value at date of grant. All options have a contractual term of 10 years from date of grant.
90
Table of Contents
The 2012 Plan is accounted for as an equity plan. For those options expected to vest, compensation expense is recognized on a straight-line basis over a four-year period, the total requisite service period of the awards. Compensation expense related to the 2012 Plan was $0.7 million, $0.6 million and $0.6 million for the years ended December 31, 2017, 2016 and 2015, respectively.
The following table summarizes the stock option activity under the 2012 Plan for the periods indicated as follows:
| Number of options |
Weighted average exercise price per share |
Weighted average remaining contractual term (years) |
||||||||||
| Outstanding at January 1, 2017 |
1,797,252 | $ | 3.13 | 7.5 | ||||||||
| Granted |
608,948 | $ | 5.18 | |||||||||
| Exercised |
(189,492 | ) | $ | 2.60 | ||||||||
| Forfeited |
(33,581 | ) | $ | 3.89 | ||||||||
|
|
|
|||||||||||
| Outstanding at December 31, 2017 |
2,183,127 | $ | 3.74 | 7.3 | ||||||||
|
|
|
|||||||||||
| Exercisable at December 31, 2017 |
1,240,692 | $ | 3.01 | 6.2 | ||||||||
Total compensation cost related to nonvested awards not yet recognized as of December 31, 2017 totaled $1.5 million, and is expected to be recognized over a weighted average period of 2.8 years.
The Company measures the fair value of its equity awards on the date of grant using the Black-Scholes option pricing model. This valuation model requires the Company to make certain estimates and assumptions, including assumptions related to the expected price volatility of the Company’s stock, the period under which the options will be outstanding, the rate of return on risk-free investments, and the expected dividend yield for the Company’s stock.
The weighted average assumptions used in the Black-Scholes option pricing model used to calculate the fair value of options granted during the years ended December 31, 2017, 2016 and 2015 are as follows:
| 2017 grants | 2016 grants | 2015 grants | ||||||||||
| Weighted average grant date fair value per share |
$ | 1.86-$1.94 | $ | 1.42-$1.65 | $ | 1.43 | ||||||
| Expected volatility |
34% | 37% | 37% | |||||||||
| Expected term (in years) |
5.75-6.25 | 5.75-6.25 | 6.25 | |||||||||
| Risk-free interest rate |
2.02% | 1.37%-1.79% | 1.98% | |||||||||
| Expected dividend yield |
0% | 0% | 0% | |||||||||
Prior to the IPO, the Company’s equity value was estimated utilizing a combination of the Discounted Cash Flow Method under the Income Approach, the Guideline Public Company Method, and the Transaction Method under the Market Approach. The equity value is used to derive the fair value per share which is used as an input in the Black Scholes option pricing model. The estimated volatility was derived using the historical volatility of the returns of comparable publicly traded companies. The risk-free rate was based on U.S. Treasury zero-coupon yield curves with a remaining term equal to the expected term of the option. The Company has not historically paid dividends and does not anticipate paying cash dividends in the foreseeable future. The Company used the simplified method to determine expected term.
Other
In connection with the acquisition of Runtime Design Automation (“RTDA”), all outstanding stock options of RTDA became fully vested and exercisable prior to the date of consummation which represents an acceleration to full vesting of all unvested stock options as of the date of the business combination.
The accounting treatment for the outstanding stock options in the context of the business combination is to allocate the fair market value of RTDA’s options at the date of consummation attributable to pre-combination service to the aggregate merger consideration. The difference between the fair market value of the replacement awards and the amount allocable to pre-combination service was considered a post-combination expense to the Company after the consummation date.
The estimated post combination expense to the Company as a result of the business combination was approximately $2.0 million which was immediately expensed in the post combination financial statements in the third quarter of 2017, as there were no further service conditions. The Company determined that the Black-Scholes model was an appropriate valuation model for the employee share options as all of RTDA’s stock options had only service conditions.
91
Table of Contents
The stock-based compensation expense was recorded as follows (in thousands):
| Year ended December 31, | ||||||||||||
| 2017 | 2016 | 2015 | ||||||||||
| Cost of revenue-software |
$ | 350 | $ | 22 | $ | 44 | ||||||
| Research and development |
12,540 | 1,370 | 149 | |||||||||
| Sales and marketing |
7,693 | 775 | 109 | |||||||||
| General and administrative |
26,698 | 2,965 | 295 | |||||||||
|
|
|
|
|
|
|
|||||||
| Total stock-based compensation expense |
$ | 47,281 | $ | 5,132 | $ | 597 | ||||||
|
|
|
|
|
|
|
|||||||
On September 27, 2017, the Company’s board of directors adopted the 2017 Equity Incentive Plan (“2017 Plan”), and the 2017 Plan was approved by the Company’s stockholders. The 2017 Plan became effective on October 30, 2017, which was one business day prior to the effective date of the Company’s IPO. The 2017 Plan provides for the grant of incentive stock options to the Company’s employees and any parent and subsidiary corporations’ employees, and for the grant of nonstatutory stock options, stock appreciation rights, restricted stock, restricted stock units, performance units, performance shares, other cash-based awards and other stock-based awards to the Company’s employees, directors and consultants and the Company’s parent, subsidiary, and affiliate corporations’ employees and consultants. The 2017 Plan has 6,207,976 authorized shares of the Company’s Class A common stock reserved for issuance. No issuances have been made under the 2017 Plan as of December 31, 2017.
12. Other expense (income), net
Other expense (income), net consists of the following (in thousands):
| Year ended December 31, | ||||||||||||
| 2017 | 2016 | 2015 | ||||||||||
| Foreign exchange (gain) loss |
$ | 1,254 | $ | (271 | ) | $ | 973 | |||||
| Other |
(260 | ) | (249 | ) | (191 | ) | ||||||
|
|
|
|
|
|
|
|||||||
| Other expense (income), net |
$ | 994 | $ | (520 | ) | $ | 782 | |||||
|
|
|
|
|
|
|
|||||||
13. Income taxes
The components of (loss) income before income taxes are as follows (in thousands):
| Year ended December 31, | ||||||||||||
| 2017 | 2016 | 2015 | ||||||||||
| U.S. |
$ | (49,761 | ) | $ | (2,225 | ) | $ | (6,861 | ) | |||
| Non-U.S. |
13,350 | 15,927 | 18,610 | |||||||||
|
|
|
|
|
|
|
|||||||
| $(36,411) | $13,702 | $11,749 | ||||||||||
|
|
|
|
|
|
|
|||||||
The significant components of the income tax expense are as follows (in thousands):
| Year ended December 31, | ||||||||||||
| 2017 | 2016 | 2015 | ||||||||||
| Current |
||||||||||||
| U.S. Federal |
$ | — | $ | — | $ | — | ||||||
| Non-U.S. |
10,290 | 9,413 | 9,893 | |||||||||
| U.S. State and Local |
135 | 202 | 56 | |||||||||
|
|
|
|
|
|
|
|||||||
| Total current |
10,425 | 9,615 | 9,949 | |||||||||
|
|
|
|
|
|
|
|||||||
| Deferred |
||||||||||||
| U.S. Federal |
54,130 | (5,358 | ) | (8,445 | ) | |||||||
| Non-U.S. |
(1,306 | ) | (610 | ) | (587 | ) | ||||||
| U.S. State and Local |
(253 | ) | (108 | ) | (99 | ) | ||||||
|
|
|
|
|
|
|
|||||||
| Total deferred |
52,571 | (6,076 | ) | (9,131 | ) | |||||||
|
|
|
|
|
|
|
|||||||
| Income tax expense |
$ | 62,996 | $ | 3,539 | $ | 818 | ||||||
|
|
|
|
|
|
|
|||||||
92
Table of Contents
The reconciliation of income taxes calculated at the U.S. Federal statutory income tax rate of 35% to income tax expense is as follows (in thousands):
| Year ended December 31, | ||||||||||||
| 2017 | 2016 | 2015 | ||||||||||
| Income taxes at U.S. federal statutory rate |
$ | (12,744 | ) | $ | 4,796 | $ | 4,117 | |||||
| Foreign income taxes at rates other than the federal statutory rate |
373 | (584 | ) | (10 | ) | |||||||
| U.S. state and local income taxes, net of U.S. federal tax benefit |
(155 | ) | 94 | (47 | ) | |||||||
| U.S. Tax Cut and Jobs Act: transition tax, net of foreign tax credits |
4,187 | — | — | |||||||||
| Change in valuation allowance |
47,429 | — | — | |||||||||
| Foreign withholding taxes |
4,181 | 4,235 | 3,790 | |||||||||
| Foreign dividends |
— | 5,077 | 4,152 | |||||||||
| U.S. foreign tax credit |
(4,154 | ) | (8,786 | ) | (9,808 | ) | ||||||
| Research and development tax credit |
(2,999 | ) | (2,696 | ) | (1,608 | ) | ||||||
| Domestic production activities deduction |
— | (840 | ) | (833 | ) | |||||||
| Non-deductible stock-based compensation |
10,871 | 2,064 | 234 | |||||||||
| Meals & entertainment |
358 | 235 | 258 | |||||||||
| Other |
(163 | ) | (91 | ) | 125 | |||||||
| Deferred tax on investment in subsidiary |
— | (264 | ) | (214 | ) | |||||||
| Uncertain tax position |
446 | 299 | 662 | |||||||||
| Tax law changes |
15,366 | — | — | |||||||||
|
|
|
|
|
|
|
|||||||
| Income tax expense |
$ | 62,996 | $ | 3,539 | $ | 818 | ||||||
|
|
|
|
|
|
|
|||||||
The effective tax rate for the year ended December 31, 2017, as compared to December 31, 2016, was impacted by increased tax expense of approximately $15.4 million due to the enactment of the Tax Cuts and Jobs Act (the “Tax Act”) in the United States on December 22, 2017, entirely offset by a valuation allowance. The Tax Act significantly revises the U.S. corporate income tax by, among other things, lowering corporate income tax rates and imposing a one-time transition tax on deemed repatriated earnings of foreign subsidiaries. The impact was primarily the result of increased tax expense due to the one-time transition tax with an offset of foreign tax credits amounting to $4.2 million, and a valuation allowance in the amount of $47.0 million recorded against the net deferred tax assets in the U.S.
The enactment of the Tax Cuts and Jobs Act (the “Tax Act”) in the United States on December 22, 2017, significantly revises the U.S. corporate income tax by, among other things, lowering corporate income tax rates from 35% to 21% and imposing a one-time transition tax on deemed repatriated earnings of foreign subsidiaries. Pursuant to the guidance within SEC Staff Accounting Bulletin No. 118 (“SAB 118”), as of December 31, 2017, the Company recognized the provisional effects of the enactment of the Tax Act for which measurement could be reasonably estimated. Although the Company continues to analyze certain aspects of the Tax Act and refine its assessment, the ultimate impact of the Tax Act may differ from these estimates due to the Company’s continued analysis, or further regulatory guidance that may be issued as a result of the Tax Act. Pursuant to SAB 118, adjustments to the provisional amounts recorded by the Company as of December 31, 2017, that are identified within a subsequent measurement period of up to one year from the enactment date, will be included as an adjustment to tax expense from continuing operations in the period the amounts are determined.
The Company remeasured certain U.S. deferred tax assets and liabilities based on the rates at which they are expected to reverse in the future, which is generally 21%. However, the Company is still analyzing certain aspects of the Tax Act and refining its calculations, which could potentially affect the measurement of these balances or potentially give rise to new deferred tax amounts. The provisional amount recorded related to the remeasurement of net deferred tax assets and deferred tax liabilities was a net tax charge of $15.4 million, which was fully offset by an adjustment to the valuation allowance. Additionally, the Company recorded a deferred tax benefit of $1.3 million for the reduction of a deferred tax liability related to an indefinite-lived intangible asset. The Tax Act did not change the Company’s judgment regarding the realizability of these net deferred tax assets.
The one-time transition tax is based on the Company’s total post-1986 earnings and profits (“E&P”) that were previously deferred from U.S. income taxes and for which no deferred taxes were recorded since the Company previously claimed the indefinite reinvestment assertion exception on these earnings. In December 2017, the Company recorded a provisional amount for its one-time transition tax liability of $4.2 million, net of foreign tax credits. The Company has not yet completed its calculation of the total post-1986 E&P and associated foreign tax credits for these foreign subsidiaries. Further, the transition tax is based in part on the amount of those earnings held in cash and other specified assets. This amount may change when the Company finalizes the calculation of post-1986 foreign E&P previously deferred from U.S. federal taxation, and finalizes the amounts held in cash or other specified assets. The Company anticipates that additional guidance and clarification regarding the implementation of the transition tax will be issued by federal and state taxing authorities and the Company’s estimate is, therefore, subject to future refinement.
93
Table of Contents
Deferred income tax assets and liabilities result from differences in the basis of assets and liabilities for tax and financial statements purposes. The approximate tax effect of each type of temporary difference, and operating losses and tax credit carryforwards that give rise to a significant portion of the deferred tax assets and liabilities are as follows (in thousands):
| December 31, | ||||||||
| 2017 | 2016 | |||||||
| Deferred tax assets: |
||||||||
| Deferred revenue |
$ | 19,569 | $ | 16,966 | ||||
| Net operating loss carryforwards |
7,601 | 3,550 | ||||||
| Tax credit carryforwards |
22,191 | 17,839 | ||||||
| Stock-based compensation |
8,922 | 15,825 | ||||||
| Capitalized research and development |
8,798 | 12,492 | ||||||
| Accrued expenses |
648 | 1,775 | ||||||
| Employee benefits |
3,931 | 3,995 | ||||||
| Other |
1,905 | 2,527 | ||||||
|
|
|
|
|
|||||
| Total gross deferred tax assets |
73,565 | 74,969 | ||||||
| Less: valuation allowances |
(54,331 | ) | (4,153 | ) | ||||
|
|
|
|
|
|||||
| Net deferred tax assets(1) |
19,234 | 70,816 | ||||||
| Deferred tax liabilities: |
||||||||
| Prepaid royalties |
6,925 | 5,821 | ||||||
| Property and equipment and intangibles |
4,567 | 2,394 | ||||||
| Deferred tax on investment in subsidiary |
272 | 272 | ||||||
| Other |
739 | 812 | ||||||
|
|
|
|
|
|||||
| Total deferred tax liabilities |
12,503 | 9,299 | ||||||
|
|
|
|
|
|||||
| Total net deferred tax assets |
$ | 6,731 | $ | 61,517 | ||||
|
|
|
|
|
|||||
| (1) | Reflects gross amount before jurisdictional netting of deferred tax assets and liabilities. |
The Company’s accounting for the indefinite reinvestment assertion is incomplete. However, a reasonable estimate of book and tax basis was calculated, and the Company made a provisional assertion. In general, it is the practice and intention of the Company to repatriate previously taxed earnings and to reinvest all other earnings of its non-U.S. subsidiaries. As part of the Tax Act, the Company incurred U.S. tax on substantially all of the earnings of its non-U.S. subsidiaries as part of the one-time transition tax. This tax increased the Company’s previously taxed earnings and will allow for the repatriation of the majority of its foreign earnings without any residual U.S. federal tax. This assertion is subject to change as additional information is gathered to precisely compute the book and tax basis of the Company’s non-U.S. subsidiaries.
The following table summarizes the changes to the valuation allowance balance at December 31, 2017, 2016 and 2015 (in thousands):
| December 31, | ||||||||||||
| 2017 | 2016 | 2015 | ||||||||||
| Beginning balance |
$ | 4,153 | $ | 2,452 | $ | 2,858 | ||||||
| Additions charged to expense |
47,429 | 177 | — | |||||||||
| Deductions |
— | (207 | ) | (270 | ) | |||||||
| Other |
2,749 | 1,731 | (136 | ) | ||||||||
|
|
|
|
|
|
|
|||||||
| Ending balance |
$ | 54,331 | $ | 4,153 | $ | 2,452 | ||||||
|
|
|
|
|
|
|
|||||||
Additions charged to expense for 2017 of $47.4 million are primarily related to the recording of a valuation allowance against the Company’s U.S. deferred tax assets. In evaluating the need for a valuation allowance, Altair considered the large U.S. federal tax deduction that resulted when non-qualified stock options were exercised in connection with the Company’s IPO in November 2017, and expected NSO exercises and determined that it was not more likely than not that the U.S. deferred tax assets would be realized.
94
Table of Contents
The following table summarizes the amount and expiration dates of operating loss and tax credit carryforwards at December 31, 2017 (in thousands):
| Expiration dates | Amounts | |||||||
| U.S. general business credits and loss carryforwards |
2018-2037 | $ | 24,564 | |||||
| Foreign loss carryforwards |
indefinite | 2,879 | ||||||
| U.S. foreign tax credits |
2027 | 2,349 | ||||||
|
|
|
|||||||
| Total operating loss and tax credit carryforwards |
$ | 29,792 | ||||||
|
|
|
|||||||
A reconciliation of the beginning and ending amounts of unrecognized tax benefits is as follows (in thousands):
| Year ended December 31, | ||||||||||||
| 2017 | 2016 | 2015 | ||||||||||
| Unrecognized tax benefits—January 1 |
$ | 5,604 | $ | 5,305 | $ | 4,712 | ||||||
| Increase in unrecognized tax benefits as a result of: |
||||||||||||
| Additions for tax positions of current period |
634 | 299 | 826 | |||||||||
| Reductions for tax positions of prior periods |
(81 | ) | — | (233 | ) | |||||||
|
|
|
|
|
|
|
|||||||
| Unrecognized tax benefits—December 31 |
$ | 6,157 | $ | 5,604 | $ | 5,305 | ||||||
|
|
|
|
|
|
|
|||||||
At December 31, 2017, the Company had $6.2 million of gross unrecognized tax benefits that if recognized would affect the effective tax rate and adjustments to other tax accounts, primarily deferred taxes. It is reasonably possible that a change in the Company’s gross unrecognized tax benefits may occur in the next twelve months; however, it is not possible to reasonably estimate the effect this may have upon the gross unrecognized tax benefits.
The Company operates globally but considers its more significant tax jurisdictions to include the United States, India, Germany, Japan, and China. India has tax years open for examination from 2005 through 2016. All other significant jurisdictions have open tax years from 2013 through 2016.
The Company records interest and penalties with respect to unrecognized tax benefits as a component of the provision for income taxes. For the years ended December 31, 2017 and 2016, accrued interest and penalties related to unrecognized tax benefits were insignificant. For the year ended December 31, 2015, accrued interest and penalties related to unrecognized tax benefits were $0.1 million.
14. (Loss) income per share
Basic (loss) income per share attributable to common stockholders is computed using the weighted average number of shares of common stock outstanding for the period, excluding stock options. Diluted (loss) income per share attributable to common stockholders is based upon the weighted average number of shares of common stock outstanding for the period and potentially dilutive common shares, including the effect of stock options under the treasury stock method. The following table sets forth the computation of the numerators and denominators used in the basic and diluted (loss) income per share amounts (in thousands, except per share data):
| Year ended December 31, | ||||||||||||
| 2017 | 2016 | 2015 | ||||||||||
| Numerator: |
||||||||||||
| Net (loss) income |
$ | (99,407 | ) | $ | 10,163 | $ | 10,931 | |||||
|
|
|
|
|
|
|
|||||||
| Denominator: |
||||||||||||
| Denominator for basic (loss) income per share—weighted average shares |
52,466 | 48,852 | 46,609 | |||||||||
| Effect of dilutive securities, stock options |
— | 9,004 | 12,100 | |||||||||
|
|
|
|
|
|
|
|||||||
| Denominator for dilutive (loss) income per share |
52,466 | 57,856 | 58,709 | |||||||||
|
|
|
|
|
|
|
|||||||
| Net (loss) income per share attributable to common stockholders, basic |
$ | (1.89 | ) | $ | 0.21 | $ | 0.23 | |||||
|
|
|
|
|
|
|
|||||||
| Net (loss) income per share attributable to common stockholders, diluted |
$ | (1.89 | ) | $ | 0.18 | $ | 0.19 | |||||
|
|
|
|
|
|
|
|||||||
The computation of diluted (loss) income per share does not include shares that are anti-dilutive under the treasury stock method because their exercise prices are higher than the average fair value of the Company’s stock during the year. For the year ended December 31, 2017, there were 10.2 million potentially anti-dilutive shares, which were excluded from the computation of (loss) income per share. For the year ended December 31, 2016, there were no anti-dilutive shares excluded from the computation of (loss) income per share. For the year ended December 31, 2015, there were 0.8 million potentially anti-dilutive shares, which were excluded from the computation of (loss) income per share.
95
Table of Contents
15. Retirement benefits
The Company sponsors a 401(k)-profit sharing plan (the “Plan”) for all eligible U.S. employees. This Plan allows eligible employees to contribute up to 80% of their compensation to the Plan. The Company makes discretionary matching contributions to the Plan provided the employee is employed on the last day of the year. Such discretionary contributions vest ratably over five years of service. The Company’s contributions to the Plan were $1.1 million, $1.1 million and $0.9 million for the years ended December 31, 2017, 2016 and 2015, respectively.
The Company also participates in government-mandated retirement and/or termination indemnity plans, benefiting certain non-U.S. employees. Termination benefits are generally lump sum payments based upon an individual’s years of credited service and annual salary at retirement. These plans are generally unfunded and employees receive payments at the time of retirement or termination under applicable labor laws or agreements. The amount of net benefit cost recorded in the consolidated statements of operations for these plans was $1.2 million, $0.9 million and $0.6 million in 2017, 2016 and 2015, respectively. The amount of benefits paid under these plans was $0.2 million, $0.2 million and $0.1 million in 2017, 2016 and 2015, respectively. The accumulated benefit obligation, unlike the projected benefit obligation, does not reflect expected benefit increases from future salary levels, and was $5.5 million and $3.0 million at December 31, 2017 and 2016, respectively, under these plans. The liability for pension benefits representing the projected benefit obligation, net of plan assets of $0.9 million and $0.7 million, under these plans was $8.0 million and $6.3 million at December 31, 2017 and 2016, respectively. A summary of the components of the pension benefits obligation recorded in the consolidated balance sheets are as follows (in thousands):
| December 31, | ||||||||
| 2017 | 2016 | |||||||
| Accrued compensation and benefits |
$ | 368 | $ | 332 | ||||
| Other long-term liabilities |
7,670 | 5,959 | ||||||
|
|
|
|
|
|||||
| $ | 8,038 | $ | 6,291 | |||||
|
|
|
|
|
|||||
The estimated future benefit payments, which reflect expected future service, that are expected to be paid for each of the next five years are as follows (in thousands):
| Year ending | ||||
| December 31, 2018 |
$ | 393 | ||
| December 31, 2019 |
$ | 282 | ||
| December 31, 2020 |
$ | 342 | ||
| December 31, 2021 |
$ | 211 | ||
| December 31, 2022 |
$ | 261 | ||
| Next five years |
$ | 2,217 | ||
96
Table of Contents
16. Accumulated other comprehensive loss
The components of accumulated other comprehensive loss are as follows (in thousands):
| Foreign currency translation |
Retirement related benefit plans |
Total | ||||||||||
| Balance at December 31, 2014 |
$ | (3,631 | ) | $ | (710 | ) | $ | (4,341 | ) | |||
| Other comprehensive loss before reclassification |
(3,068 | ) | (217 | ) | (3,285 | ) | ||||||
| Tax effects |
953 | (36 | ) | 917 | ||||||||
|
|
|
|
|
|
|
|||||||
| Other comprehensive loss |
(2,115 | ) | (253 | ) | (2,368 | ) | ||||||
| Less: Other comprehensive income (loss) attributable to noncontrolling interest |
(1 | ) | — | (1 | ) | |||||||
|
|
|
|
|
|
|
|||||||
| Balance at December 31, 2015 |
(5,745 | ) | (963 | ) | (6,708 | ) | ||||||
| Other comprehensive loss before reclassification |
80 | (771 | ) | (691 | ) | |||||||
| Tax effects |
(60 | ) | 195 | 135 | ||||||||
|
|
|
|
|
|
|
|||||||
| Other comprehensive income (loss) |
20 | (576 | ) | (556 | ) | |||||||
| Balance at December 31, 2016 |
(5,725 | ) | (1,539 | ) | (7,264 | ) | ||||||
| Other comprehensive income (loss) before reclassification |
2,351 | (213 | ) | 2,138 | ||||||||
| Amounts reclassified from accumulated other comprehensive loss |
— | 54 | 54 | |||||||||
| Tax effects |
— | — | — | |||||||||
|
|
|
|
|
|
|
|||||||
| Other comprehensive income (loss) |
2,351 | (159 | ) | 2,192 | ||||||||
|
|
|
|
|
|
|
|||||||
| Balance at December 31, 2017 |
$ | (3,374 | ) | $ | (1,698 | ) | $ | (5,072 | ) | |||
|
|
|
|
|
|
|
|||||||
17. Related party transactions
In February 2017, the Company purchased the noncontrolling interest in a consolidated subsidiary from a founder stockholder for an aggregate purchase price of $29 thousand.
In January 2016, the Company redeemed 350,400 shares of Class A common stock from founder stockholders for an aggregate purchase price of $1.3 million payable in twelve equal monthly installments.
In June 2016, the Company redeemed 137,268 shares of Class A common stock from a related party for an aggregate purchase price of $0.5 million payable in two equal installments.
In December 2016, the Company redeemed 59,108 shares of Class A common stock from a related party for an aggregate purchase price of $0.3 million payable in twelve equal monthly installments.
In December 2016, the Company redeemed 113,388 shares of Class B common stock from a founder stockholder for an aggregate purchase price of $0.6 million payable in nine equal monthly installments.
In October 2015, the Company acquired Altair Bellingham, LLC from significant stockholders of the Company for cash of $0.7 million, which was paid in February 2016.
In 2015, the Company redeemed 200,000 shares of Class A common stock for an aggregate purchase price of $0.7 million payable in equal monthly installments of principal and interest over three years.
At December 31, 2017 and 2016, respectively, the Company had obligations to related parties for the redemptions summarized above in the amounts of $0.1 million and $1.0 million recorded in other accrued expenses and current liabilities, and nil and $0.1 million recorded in other long-term liabilities.
At December 31, 2017 and 2016, respectively, the Company had receivables from an equity investment for $0.5 million and $0.2 million recorded in other long-term assets.
18. Commitments and contingencies
MSC Litigation
In July 2007, MSC Software Corporation filed a lawsuit against the Company alleging misappropriation of trade secrets, breach of confidentiality and other claims. On April 10, 2014, a jury returned a verdict against the Company. The Company challenged the verdict and on November 13, 2014, a judge vacated all but $0.4 million of the judgment and ordered a new trial on damages. On August 21, 2017, the court granted Altair’s motion to strike the testimony of MSC’s damage expert and on October 11, 2017, the court mooted the remaining pre-trial motions and allowed the Company to file a motion for summary judgment
97
Table of Contents
on the issue of whether MSC can prove damages. On December 13, 2017, the court granted Altair’s motion for summary judgment and dismissed MSC’s claim of trade secret misappropriation. On January 5, 2018, MSC filed a notice of appeal of the final judgment entered on December 13, 2017 and prior orders in this action to the Sixth Circuit Court of Appeals. On January 19, 2018, Altair filed a cross-appeal. No briefing schedule or argument date has been set by the Appeals Court. The Company cannot be certain of the outcome of this matter. The Company has estimated and recorded a liability for the probable loss.
Legal proceedings
From time to time, the Company may be subject to legal proceedings and claims in the ordinary course of business. The Company has received, and may in the future continue to receive, claims from third parties asserting, among other things, infringement of their intellectual property rights. Future litigation may be necessary to defend the Company, its partners and its customers by determining the scope, enforceability and validity of third party proprietary rights, or to establish and enforce the Company’s proprietary rights. The results of any current or future litigation cannot be predicted with certainty and regardless of the outcome, litigation can have an adverse impact on the Company because of defense and settlement costs, diversion of management resources and other factors.
Royalty agreements
The Company has entered into various renewable, nonexclusive license agreements under which the Company has been granted access to the licensor’s technology and the right to sell or use the technology in the Company’s products. Royalties are payable to developers of the software at various rates and amounts, which generally are based upon unit sales or revenue. Royalty fees were $9.3 million, $7.9 million, and $7.1 million for the years ended December 31, 2017, 2016 and 2015, respectively, and are reported in Cost of revenue-software and Cost of revenue—other.
Leases
The Company leases office space, vehicles, and computer equipment. Such leases, some of which are noncancelable, are set to expire at various dates. Certain of these lease arrangements contain escalation clauses whereby monthly rent increases over time.
The future minimum annual lease payments under noncancelable operating leases with an initial term in excess of one year and future minimum capital lease payments at December 31, 2017, are as follows (in thousands):
| Capital leases |
Operating leases |
|||||||
| Year Ending December 31, |
||||||||
| 2018 |
$ | 106 | $ | 8,946 | ||||
| 2019 |
60 | 6,919 | ||||||
| 2020 |
36 | 4,797 | ||||||
| 2021 |
5 | 2,892 | ||||||
| 2022 |
— | 1,933 | ||||||
| Thereafter |
— | 2,367 | ||||||
|
|
|
|
|
|||||
| Total minimum lease payments |
207 | $ | 27,854 | |||||
|
|
|
|||||||
| Less: current installments under capital lease obligations |
106 | |||||||
|
|
|
|||||||
| Total long-term portion |
$ | 101 | ||||||
|
|
|
|||||||
Rent expense for operating leases was $9.9 million, $8.5 million and $7.7 million for the years ended December 31, 2017, 2016 and 2015, respectively.
19. Segment information
The Company defines its operating segments as components of its business where separate financial information is available and used by the chief operating decision maker (“CODM”) in deciding how to allocate resources to its segments and in assessing performance. The Company’s CODM is its Chief Executive Officer.
The Company has identified two reportable segments for financial reporting purposes: Software and Client Engineering Services. The primary measure of segment operating performance is Adjusted EBITDA, which is defined as net (loss) income adjusted for income tax expense (benefit), interest expense, interest income and other, depreciation and amortization, stock-based compensation expense, restructuring charges, asset impairment charges and other special items as determined by management. Adjusted EBITDA includes an allocation of corporate headquarters costs.
98
Table of Contents
The Software reportable segment derives revenue from the sale and lease of licenses for software products focused on the development and application of simulation technology to synthesize and optimize designs, processes and decisions for improved business performance. The Software segment also derives revenue from software support, upgrades, training and consulting services focused on product design and development expertise and analysis support from the component level up to complete product engineering at any stage of the lifecycle.
The Client Engineering Services reportable segment provides support to its customers with long-term ongoing product design and development expertise in its market segments of Solvers & Optimization, Modeling & Visualization, Industrial and Concept Design, and high-performance computing. The Company hires simulation specialists, industrial designers, design engineers, materials experts, development and test specialists, manufacturing engineers and information technology specialists for placement at customer sites for specific customer-directed assignments.
The “All other” represents innovative services and products, including toggled®, the Company’s LED lighting business. toggled® is focused on developing and selling next-generation solid state lighting technology along with communication and control protocols based on intellectual property for the direct replacement of fluorescent light tubes with LED lamps. Potential services and product concepts that are still in their development stages are also included in “All other.”
Inter-segment sales are not significant for any period presented. The CODM does not review asset information by segment when assessing performance, therefore no asset information is provided for reportable segments. The accounting policies of the segments are the same as those described in Note 2—Summary of significant accounting policies. The following tables are in thousands:
| Year ended December 31, 2017 | Software | CES | All other | Total | ||||||||||||
| Revenue |
$ | 280,214 | $ | 46,510 | $ | 6,609 | $ | 333,333 | ||||||||
| Adjusted EBITDA |
$ | 22,864 | $ | 4,966 | $ | (5,313 | ) | $ | 22,517 | |||||||
| Year ended December 31, 2016 | Software | CES | All other | Total | ||||||||||||
| Revenue |
$ | 259,588 | $ | 47,702 | $ | 5,950 | $ | 313,240 | ||||||||
| Adjusted EBITDA |
$ | 29,411 | $ | 5,425 | $ | (4,006 | ) | $ | 30,830 | |||||||
| Year ended December 31, 2015 | Software | CES | All other | Total | ||||||||||||
| Revenue |
$ | 242,861 | $ | 45,075 | $ | 6,193 | $ | 294,129 | ||||||||
| Adjusted EBITDA |
$ | 23,149 | $ | 4,776 | $ | (4,976 | ) | $ | 22,949 | |||||||
| Year ended December 31, | ||||||||||||
| 2017 | 2016 | 2015 | ||||||||||
| Reconciliation of Adjusted EBITDA to GAAP (Loss) income before income taxes: |
||||||||||||
| Adjusted EBITDA |
$ | 22,517 | $ | 30,830 | $ | 22,949 | ||||||
| Stock-based compensation expense |
(47,281 | ) | (5,132 | ) | (597 | ) | ||||||
| Interest expense |
(2,160 | ) | (2,265 | ) | (2,416 | ) | ||||||
| Interest income and other(1) |
2,260 | 249 | 191 | |||||||||
| Depreciation and amortization |
(11,747 | ) | (9,980 | ) | (8,378 | ) | ||||||
|
|
|
|
|
|
|
|||||||
| (Loss) income before income taxes |
$ | (36,411 | ) | $ | 13,702 | $ | 11,749 | |||||
|
|
|
|
|
|
|
|||||||
| (1) | Includes a non-recurring adjustment for a change in estimated legal expenses resulting in $2.0 million of income for the year ended December 31, 2017. |
99
Table of Contents
Revenue is attributed to geographic areas based on the country of origin. The following table provides sales to external customers and long-lived assets for each of the geographic areas in which the Company operates (in thousands):
| Revenue | Long-lived assets(1) | |||||||||||||||||||
| Year ended December 31, | December 31, | |||||||||||||||||||
| 2017 | 2016 | 2015 | 2017 | 2016 | ||||||||||||||||
| United States |
$ | 142,679 | $ | 139,079 | $ | 130,791 | $ | 38,729 | $ | 25,901 | ||||||||||
| Other countries |
6,404 | 6,032 | 4,841 | 116 | 120 | |||||||||||||||
|
|
|
|
|
|
|
|
|
|
|
|||||||||||
| Total Americas |
149,083 | 145,111 | 135,632 | 38,845 | 26,021 | |||||||||||||||
|
|
|
|
|
|
|
|
|
|
|
|||||||||||
| Germany |
43,751 | 39,470 | 37,549 | 2,802 | 2,660 | |||||||||||||||
| France |
18,128 | 15,729 | 14,057 | 2,176 | 2,175 | |||||||||||||||
| Other countries |
40,050 | 34,909 | 35,933 | 4,534 | 4,317 | |||||||||||||||
|
|
|
|
|
|
|
|
|
|
|
|||||||||||
| Total Europe, Middle East and Africa |
101,929 | 90,108 | 87,539 | 9,512 | 9,152 | |||||||||||||||
|
|
|
|
|
|
|
|
|
|
|
|||||||||||
| Japan |
33,686 | 33,198 | 26,795 | 2,237 | 879 | |||||||||||||||
| Other countries |
48,635 | 44,823 | 44,163 | 2,574 | 2,999 | |||||||||||||||
|
|
|
|
|
|
|
|
|
|
|
|||||||||||
| Total Asia Pacific |
82,321 | 78,021 | 70,958 | 4,811 | 3,878 | |||||||||||||||
|
|
|
|
|
|
|
|
|
|
|
|||||||||||
| Total |
$ | 333,333 | $ | 313,240 | $ | 294,129 | $ | 53,168 | $ | 39,051 | ||||||||||
|
|
|
|
|
|
|
|
|
|
|
|||||||||||
| (1) | Includes property and equipment, net and definite-lived intangible assets, net. |
20. Supplemental quarterly financial information (unaudited)
The following tables set forth selected unaudited quarterly information. The information for each of these quarters has been prepared on the same basis as the audited annual consolidated financial statements and, in the opinion of management, includes all adjustments, which consist only of normal recurring adjustments, necessary for the fair presentation of the results of operations for these periods in accordance with GAAP. This data should be read in conjunction with the Company’s audited consolidated financial statements and related notes. These quarterly operating results are not necessarily indicative of the Company’s operating results for a full year or any future period.
| Three months ended | ||||||||||||||||
| (in thousands, except per share data) | March 31, 2017 |
June 30, 2017 |
September 30, 2017 |
December 31, 2017 |
||||||||||||
| Total revenue |
$ | 76,882 | $ | 81,646 | $ | 84,938 | $ | 89,867 | ||||||||
| Gross profit |
$ | 50,128 | $ | 54,728 | $ | 58,636 | $ | 63,250 | ||||||||
| Operating loss |
$ | (1,990 | ) | $ | (7,158 | ) | $ | (20,928 | ) | $ | (3,181 | ) | ||||
| Net loss |
$ | (2,188 | ) | $ | (7,246 | ) | $ | (29,626 | ) | $ | (60,347 | ) | ||||
| Loss per share, basic |
$ | (0.04 | ) | $ | (0.14 | ) | $ | (0.59 | ) | $ | (1.03 | ) | ||||
| Loss per share, diluted |
$ | (0.04 | ) | $ | (0.14 | ) | $ | (0.59 | ) | $ | (1.03 | ) | ||||
| Three months ended | ||||||||||||||||
| (in thousands, except per share data) | March 31, 2016 |
June 30, 2016 |
September 30, 2016 |
December 31, 2016 |
||||||||||||
| Total revenue |
$ | 74,829 | $ | 77,511 | $ | 78,052 | $ | 82,848 | ||||||||
| Gross profit |
$ | 49,411 | $ | 52,171 | $ | 52,431 | $ | 56,627 | ||||||||
| Operating income |
$ | 3,632 | $ | 3,615 | $ | 224 | $ | 7,976 | ||||||||
| Net income |
$ | 1,481 | $ | 2,472 | $ | 314 | $ | 5,896 | ||||||||
| Earnings per share, basic |
$ | 0.03 | $ | 0.05 | $ | 0.01 | $ | 0.12 | ||||||||
| Earnings per share, diluted |
$ | 0.03 | $ | 0.04 | $ | 0.01 | $ | 0.10 | ||||||||
In the second, third and fourth quarters of 2017, the Company recognized stock-based compensation expense of $11.2 million, $25.3 million, and $8.0 million, respectively.
100
Table of Contents
Income tax expense increased by $56.6 million for the quarter ended December 31, 2017. This increase is primarily due to a $47.0 million increase in tax expense related to the recording of a valuation allowance on the U.S. deferred tax assets, a $15.4 million increase due to the remeasurement of net deferred tax assets and liabilities as part of the Tax Act offset by other tax accounting benefits in the U.S. in the quarter.
101
Table of Contents
102
Table of Contents
| 31.2 |
Certification of the Chief Financial Officer of Altair Engineering Inc. pursuant to Rule 13a-14(a)/Rule 15d-14(a) under the Securities Exchange Act of 1934, as amended | X | ||||
| 32.1** |
Certification of the Chief Executive Officer and Chief Financial Officer of Altair Engineering Inc. pursuant to 18 U.S.C. Section 1350, as adopted pursuant to Section 906 of the Sarbanes-Oxley Act of 2002 | X | ||||
| EX-101.INS |
XBRL INSTANCE DOCUMENT | X | ||||
| EX-101.SCH |
XBRL TAXONOMY EXTENSION SCHEMA DOCUMENT | X | ||||
| EX-101.CAL |
XBRL TAXONOMY EXTENSION CALCULATION LINKBASE | X | ||||
| EX-101.LAB |
XBRL TAXONOMY EXTENSION LABELS LINKBASE | X | ||||
| EX-101.PRE |
XBRL TAXONOMY EXTENSION PRESENTATION LINKBASE | X | ||||
| + | Indicates management contract or compensatory plan. |
| ** | The certifications furnished in Exhibit 32.1 hereto are deemed to accompany this Annual Report on Form 10-K and will not be deemed “filed” for purposes of Section 18 of the Securities Exchange Act of 1934, as amended, except to the extent that the registrant specifically incorporates it by reference. |
None.
103
Table of Contents
SIGNATURES
Pursuant to the requirements of Section 13 or 15(d) of the Securities Exchange Act of 1934, the registrant has duly caused this report to be signed on its behalf by the undersigned, thereunto duly authorized.
| ALTAIR ENGINEERING INC. | ||||||||
| Date: March 21, 2018 | By: |
/s/ James Scapa | ||||||
| James R. Scapa | ||||||||
| Chief Executive Officer (Principal Executive Officer) | ||||||||
| Date: March 21, 2018 | By: |
/s/ Howard N. Morof | ||||||
| Howard N. Morof | ||||||||
| Chief Financial Officer (Principal Financial and Accounting Officer) | ||||||||
POWER OF ATTORNEY
KNOW ALL PERSONS BY THESE PRESENTS, that each person whose signature appears below constitutes and appoints James R. Scapa and Howard N. Morof, jointly and severally, his or her true and lawful attorneys-in-fact and agent, each with the power of substitution, for him in any and all capacities, to sign any amendments to this report, and to file the same, with exhibits thereto and other documents in connection therewith, with the Securities and Exchange Commission, hereby ratifying and confirming all that each of said attorneys-in-fact, or his substitute or substitutes, may do or cause to be done by virtue hereof.
Pursuant to the requirements of the Securities Exchange Act of 1934, this report has been signed below by the following persons on behalf of the registrant in the capacities and on the dates indicated.
| Name |
Title |
Date | ||
| /s/ James Scapa James R. Scapa |
Chief Executive Officer and Director (Principal Executive Officer) |
March 21, 2018 | ||
| /s/ Howard N. Morof Howard N. Morof |
Chief Financial Officer (Principal Financial and Accounting Officer) |
March 21, 2018 | ||
| /s/ James E. Brancheau James E. Brancheau |
Director | March 21, 2018 | ||
| /s/ Stephen Earhart Stephen Earhart |
Director | March 21, 2018 | ||
| /s/ Trace Harris Trace Harris |
Director | March 21, 2018 | ||
| /s/ Jan Kowal Jan Kowal |
Director | March 21, 2018 | ||
| /s/ Richard Hart Richard Hart |
Director | March 21, 2018 | ||
104