Attached files
| file | filename |
|---|---|
| EX-99.1 - EX-99.1 - LAUREATE EDUCATION, INC. | a18-8561_1ex99d1.htm |
| 8-K - 8-K - LAUREATE EDUCATION, INC. | a18-8561_18k.htm |
This presentation includes statements that express Laureate's opinions, expectations, beliefs, plans, objectives, assumptions or projections regarding future events or future results and therefore are, or may be deemed to be, "forward-looking statements" within the meaning of the federal securities laws, which involve risks and uncertainties. Laureate’s actual results may vary significantly from the results anticipated in these forward-looking statements. You can identify forward-looking statements because they contain words such as ‘‘believes,’’ ‘‘expects,’’ ‘‘may,’’ ‘‘will,’’ ‘‘should,’’ ‘‘seeks,’’ ‘‘approximately,’’ ‘‘intends,’’ ‘‘plans,’’ ‘‘estimates’’ or ‘‘anticipates’’ or similar expressions that concern our strategy, plans or intentions. All statements we make relating to guidance (including, but not limited to, total enrollments, revenue, Adjusted EBITDA, costs, expenditures (including capital expenditures), interest expense, cash flows, earnings per share, runrates and growth rates), our hedging strategy, potential asset sales, currency rates and financial results, and all statements we make related to the conversion of the Series A Preferred Stock and the expansion of our EiP initiative, are forward-looking statements. In addition, we, through our senior management, from time to time make forward-looking public statements concerning our expected future operations and performance and other developments. All of these forward-looking statements are subject to risks and uncertainties that may change at any time, and, therefore, our actual results may differ materially from those we expected. We derive most of our forward-looking statements from our operating budgets and forecasts, which are based upon many detailed assumptions. While we believe that our assumptions are reasonable, we caution that it is very difficult to predict the impact of known factors, and, of course, it is impossible for us to anticipate all factors that could affect our actual results. Important factors that could cause actual results to differ materially from our expectations are disclosed in our Annual Report on Form 10-K filed with the U.S. Securities and Exchange Commission (“SEC”) on March 20, 2018, and other filings made with the SEC. These forward-looking statements speak only as of the time of this presentation and we do not undertake to publicly update or revise them, whether as a result of new information, future events or otherwise, except as required by law. In addition, this presentation contains various operating data, including market share and market position, that are based on internal company data and management estimates. While management believes our internal company research is reliable and the definitions of our markets which are used herein are appropriate, neither such research nor these definitions have been verified by an independent source and there are inherent challenges and limitations involved in compiling data across various geographies and from various sources, including those discussed under “Market and Industry Data” in Laureate’s filings with the SEC. Presentation of Non-GAAP Measures This presentation contains certain non-GAAP measures which are provided to assist in an understanding of the business and performance of Laureate Education Inc. These measures should always be considered in conjunction with the appropriate GAAP measure. Reconciliations of non-GAAP measures to the relevant GAAP measures are provided in the appendix to this presentation in the financial tables and our SEC filings.
SUMMARY OVERVIEW
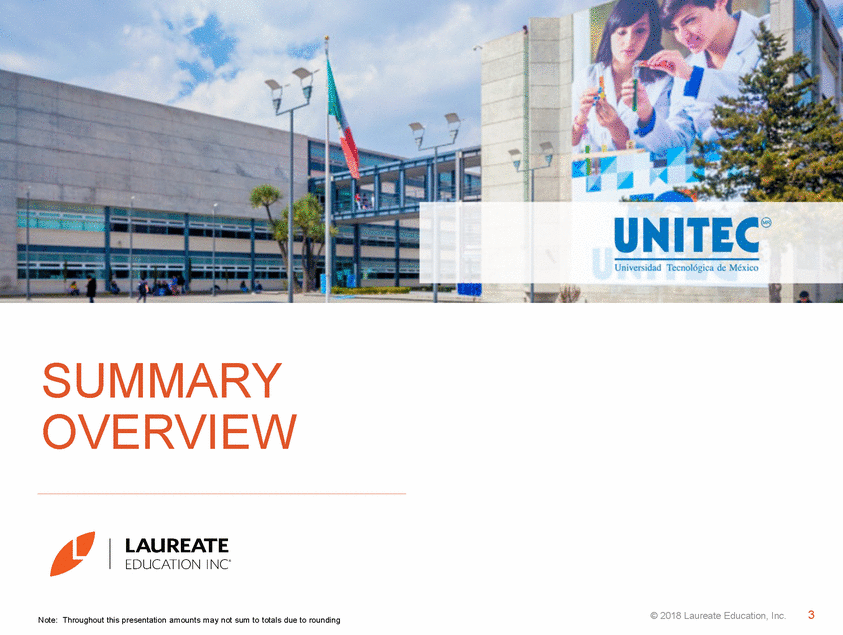
Record Revenue and Earnings Growth and Margin expansion across Campus-based Segments 10%+ Adjusted EBITDA organic constant currency growth for 3rd year in a row Significant Portfolio Simplification through $650M of asset divestitures 30% Reduction in Net Debt Leverage to 3.1x post benefit of asset divestitures Operational Excellence Initiatives focused in 2018 on Free Cash Flow generation Reaffirming Full Year 2018 Guidance
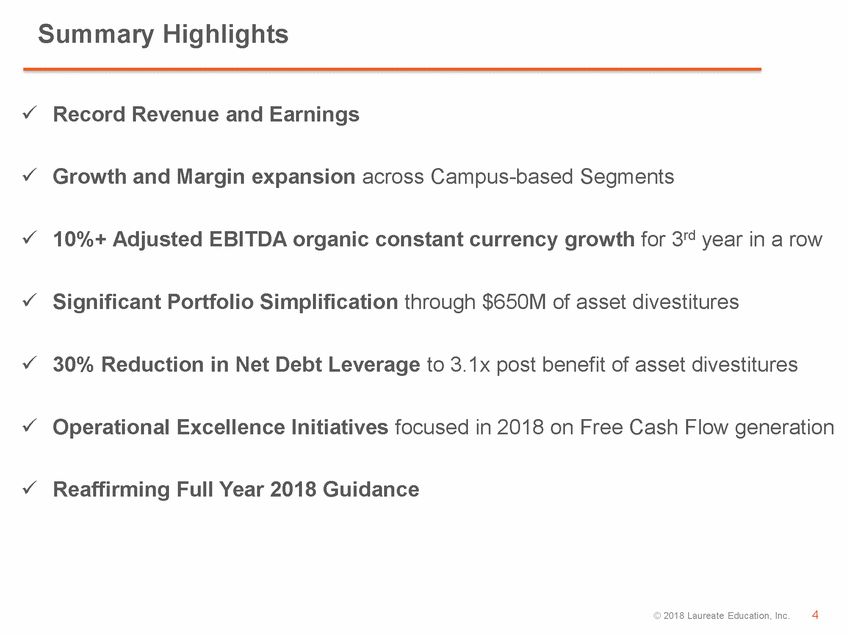
Total EnrollmentsRevenue (millions) 1,009K 1,043K 1,068K $4,030 $4,102 $4,378 2015 20162017 201520162017 Adjusted EBITDA (millions)Adjusted EBITDA Margin $832 19.0% $674 $739 16.7% 18.0% 201520162017 2015 2016 2017 Note: 2015 and 2016 shown pro forma for sale of Switzerland and France business units in 2016 © 2018 Laureate Education, Inc.5
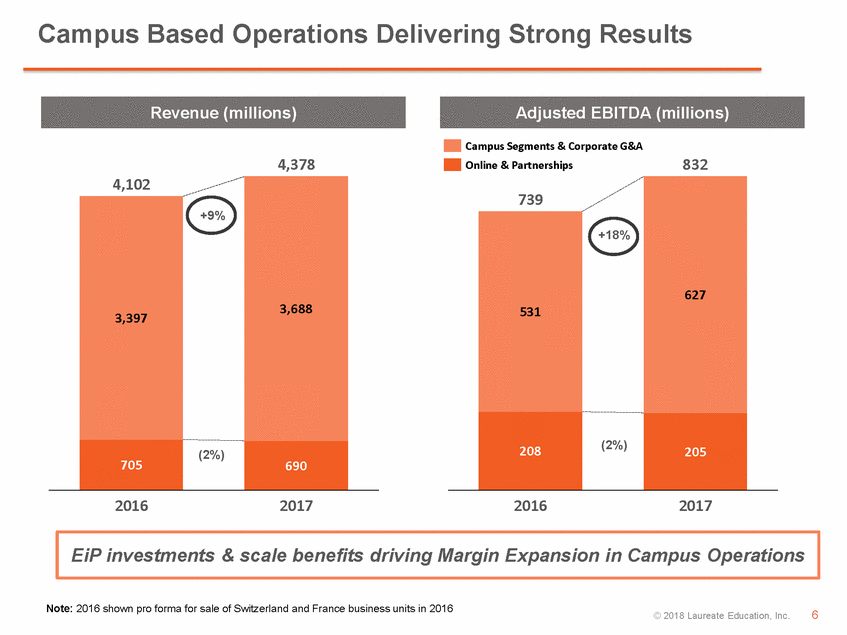
Revenue (millions) Adjusted EBITDA (millions) 4,378 Campus Segments & Corporate G&A 739 627 531 +18% 208 (2%) 205 832 2016 2017 20162017 EiP investments & scale benefits driving Margin Expansion in Campus Operations Note: 2016 shown pro forma for sale of Switzerland and France business units in 2016 © 2018 Laureate Education, Inc.6
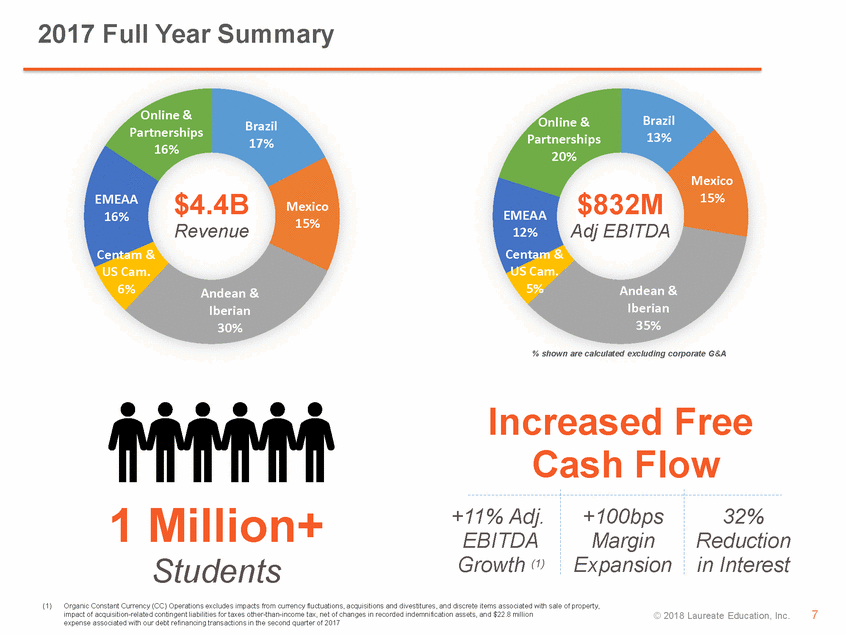
Online & Partnerships 16% Brazil 17% Online & Partnerships 20% Brazil 13% Mexico EMEAA 16% Centam & US Cam. 6% $4.4B Revenue Andean & Iberian 30% Mexico 15% EMEAA 12% Centam & 5% $832M Adj EBITDA Andean & Iberian 35% 15% % shown are calculated excluding corporate G&A Increased Free Cash Flow 1Million+ Students +11% Adj. EBITDA Growth (1) +100bps Margin Expansion 32% Reduction in Interest (1)Organic Constant Currency (CC) Operations excludes impacts from currency fluctuations, acquisitions and divestitures, and discrete items associated with sale of property, impact of acquisition-related contingent liabilities for taxes other-than-income tax, net of changes in recorded indemnification assets, and $22.8 million expense associated with our debt refinancing transactions in the second quarter of 2017 © 2018 Laureate Education, Inc.7
Q4 ANDFULL YEAR PERFORMANCE RESULTS © 2018 Laureate Education, Inc.8
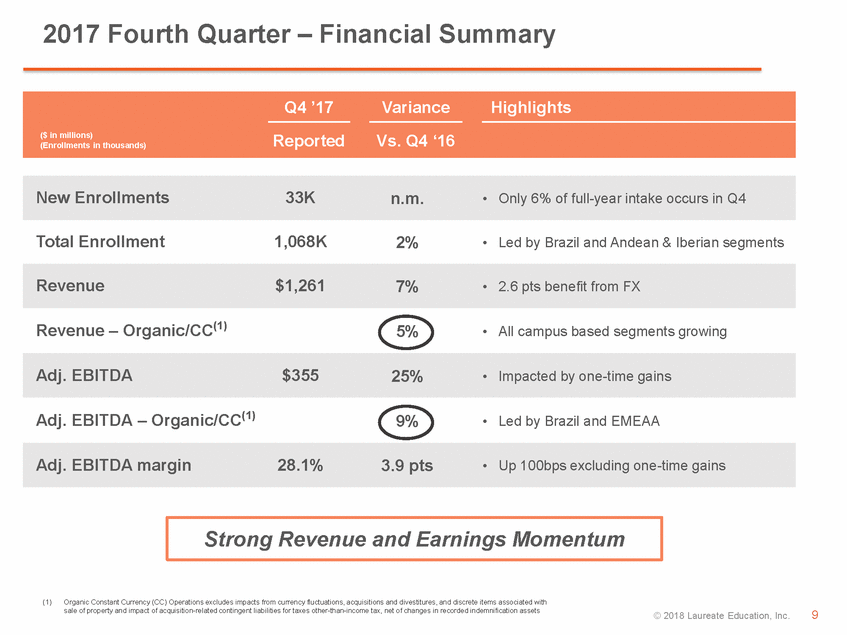
Strong Revenue and Earnings Momentum (1)Organic Constant Currency (CC) Operations excludes impacts from currency fluctuations, acquisitions and divestitures, and discrete items associated with sale of property and impact of acquisition-related contingent liabilities for taxes other-than-income tax, net of changes in recorded indemnification assets © 2018 Laureate Education, Inc.9
(Enrollments in thousands) FY ‘17 New Enrollments (NE) FY ‘17Organic Vs. FY ‘16 Total Enrollments (TE) at 12/31/XXHighlights FY ‘17Organic Vs. FY ‘16 Brazil15011%2715%• NE DL(1) up 54%, face-to-face up 6% Mexico107(1%)2140%• 4-5k lower NE from Q3 Earthquake Andean & Iberian (unfavorably impacted by new HE Law) Central Am. & U.S. Campuses454%692% EMEAA Online & Partnerships35(11%)64(7%) • Walden NE contributing (4 pts), plus planned mix shift Laureate Total5152%1,0682% Total Enrollments up single digit in Campus-Based Segments (1) Distance Learning © 2018 Laureate Education, Inc.10
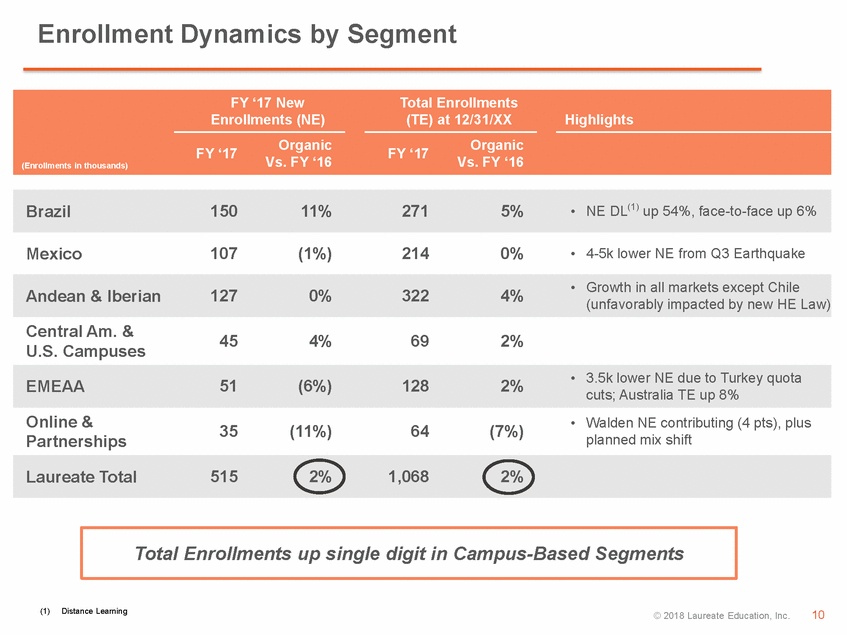
RevenueAdj. EBITDAHighlights ($ millions)4Q ‘17 Organic/CC Vs. Q4 ’16 (1) Ti Vs. Q4 ’16 Timing Adj (2) 4Q ‘17 Organic/CC Vs. Q4 ’16 (1) Vs. Q4 ’16 Timing Adj (2) Brazil2182%7368% Mexico1949%3%6923%2% Andean & Iberian3843%8%120(9%)8% Central Am. & U.S. Camp.739%10(15%) • Margin gains from new operating model roll-out and timing of expenses • Double digit growth in Peru • Impacted by one U.S. campus school being sold markets Online & Partnerships169(3%)59(1%) Corporate & Eliminations(5)n.m.(46)(28%) • Restructuring, consulting and other expansion ex. one-times Earnings Growing at 2x the pace of Revenue (1)Organic Constant Currency (CC) Operations excludes impacts from currency fluctuations, acquisitions and divestitures, and discrete items associated with sale of property and impact of acquisition-related contingent liabilities for taxes other-than-income tax, net of changes in recorded indemnification assets (2)Organic CC results further adjusted for timing items as detailed in the Appendix © 2018 Laureate Education, Inc.11
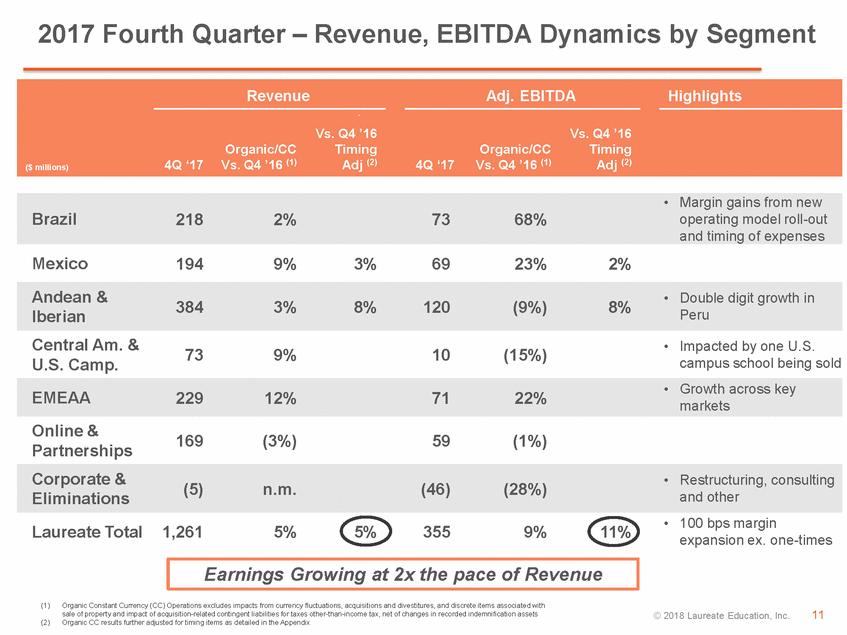
Q4 ’17Variance Vs. Q4 ’16Highlights ($ in millions)Reported$% Net Income of $201M boosted by $138M one-time gain due to U.S. Tax reform Note: See Appendix for detailed Income Statement © 2018 Laureate Education, Inc.12
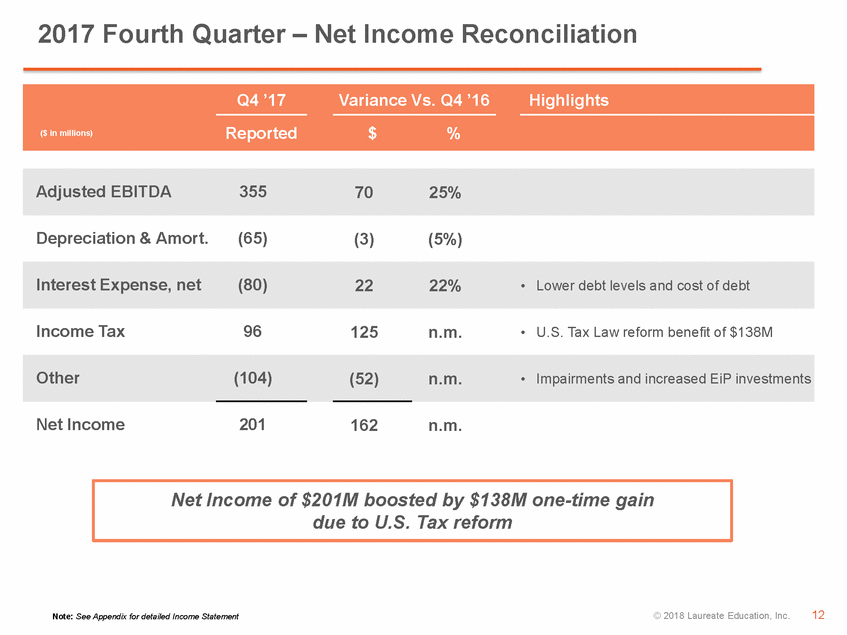
100 bps Margin Improvement due primarily to Productivity Initiatives & Scale
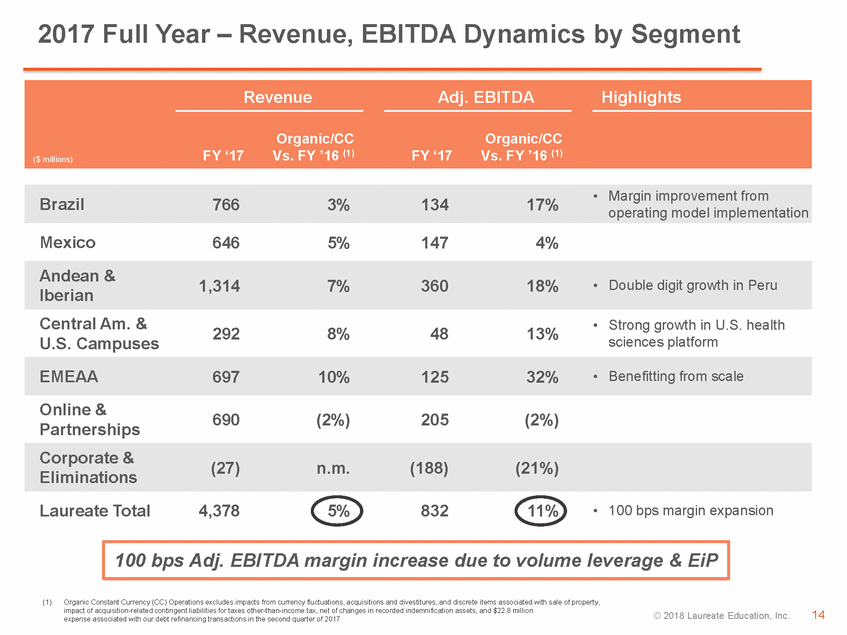
RevenueAdj. EBITDAHighlights ($ millions)FY ‘17 Organic/CC Vs. FY ’16 (1)FY ‘17 Organic/CC Vs. FY ’16 (1) Brazil7663%13417% Mexico6465%1474% Andean & Iberian1,3147%36018%• Double digit growth in Peru Central Am. & U.S. Campuses2928%4813% • Strong growth in U.S. health sciences platform EMEAA69710%12532%• Benefitting from scale Online & Partnerships690(2%)205(2%) Corporate & Eliminations(27)n.m.(188)(21%) Laureate Total4,3785%83211%• 100 bps margin expansion 100 bps Adj. EBITDA margin increase due to volume leverage & EiP
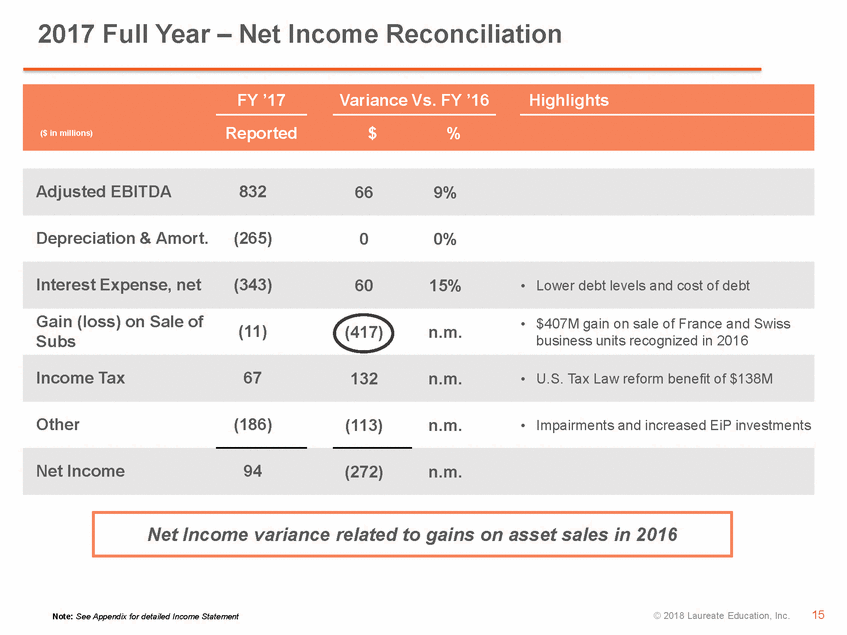
FY ’17Variance Vs. FY ’16Highlights ($ in millions)Reported$% Adjusted EBITDA 832 66 9% Depreciation & Amort. (265) 0 0% Interest Expense, net (343) 60 15%• Lower debt levels and cost of debt Gain (loss) on Sale of Subs (11) (417) n.m.• $407M gain on sale of France and business units recognized in 2016 Income Tax 67 132 n.m.• U.S. Tax Law reform benefit of $13 Other (186) (113) n.m.• Impairments and increased EiP inv Net Income 94 (272) n.m. 8M estments Net Income variance related to gains on asset sales in 2016
CAPITAL STRUCTURE
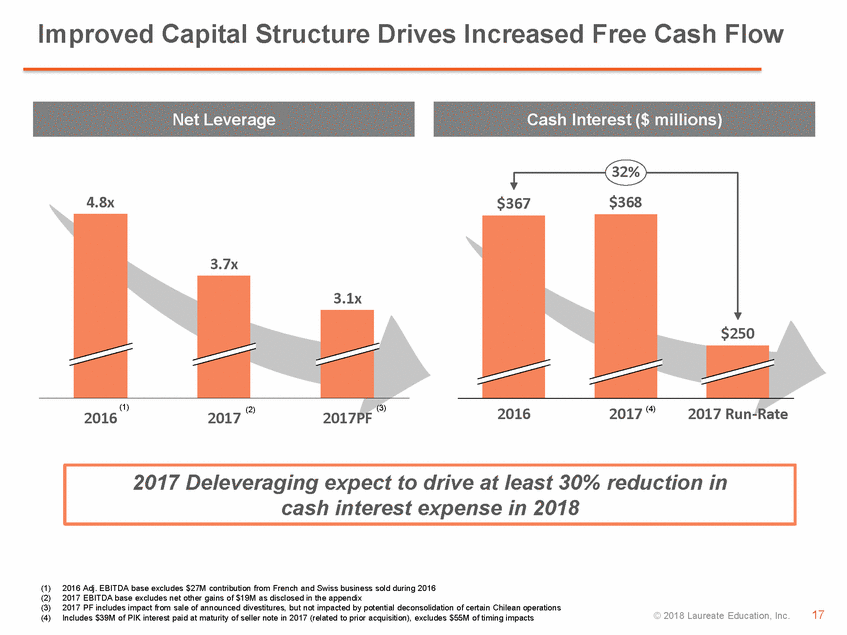
Net LeverageCash Interest ($ millions) 4.8x 32% $367$368 3.7x 3.1x $250 (1) (2) (3)(4) 201620172017PF 20162017 2017 Run-Rate 2017 Deleveraging expect to drive at least 30% reduction in cash interest expense in 2018 (1) 2016 Adj. EBITDA base excludes $27M contribution from French and Swiss business sold during 2016 (2) 2017 EBITDA base excludes net other gains of $19M as disclosed in the appendix (3) 2017 PF includes impact from sale of announced divestitures, but not impacted by potential deconsolidation of certain Chilean operations
B / (W) Vs. ($ millions)FY ’17FY ’16Highlights Adj. EBITDA (excl. $23M Debt Refi)85589 Δ Working Capital/Other2250 Cash Taxes(130)(1) Capital Expenditures (1) (283)(50)• 6.5% of Revenue – up 100bps YoY EiP Initiatives(115)(36)• Approx. $50M due to severance for EiP Wave 2 Unlevered Free Cash Flow34853• 18% growth vs. 2016 Debt Refinancing Cost(88)(88)• Includes $23M of debt refinancing transaction fees plus call premiums Cash Interest(423)(56)• $55M due to timing of cash interest related to revised payment schedule FCF including EiP Investment(163)(92) 2017 Unlevered Free Cash Flow up 18% Vs. 2016 to 8% of Revenue
2018 OUTLOOK
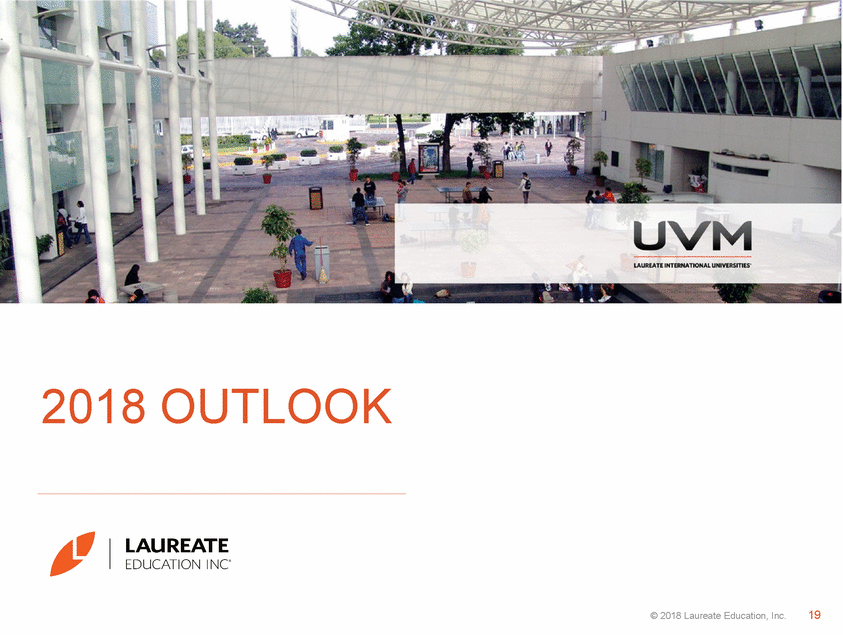
(1) Guidance shown for FY 2018 is pro forma assuming full year 2018 impact from announced asset divestitures and deconsolidation of certain Chilean entities – See Appendix for further details (2) Free Cash Flow defined as operating cash flow less capital expenditures Reaffirming FY 2018 guidance provided during Investor Day Note: An outlook for 2017 net income and reconciliation of the forward-looking 2017 Adjusted EBITDA outlook to net income are not being provided as the company does not currently have sufficient data to accurately estimate the variables and individual adjustments for such outlook and reconciliation. © 2018 Laureate Education, Inc.20
APPENDIX © 2018 Laureate Education, Inc.21
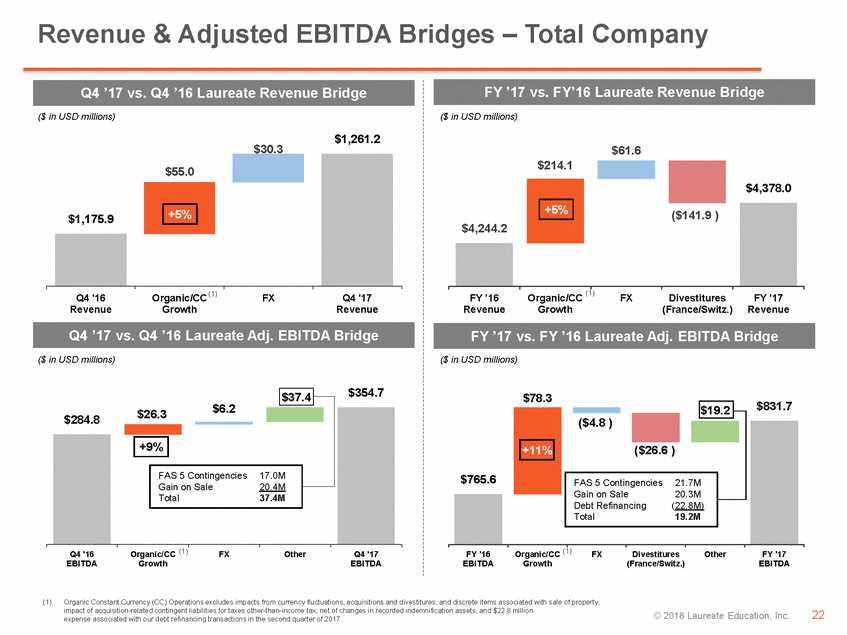
Q4 ’17 vs. Q4 ’16 Laureate Revenue Bridge FY ’17 vs. FY’16 Laureate Revenue Bridge ($ in USD millions) ($ in USD millions) $1,175.9 $55.0 +5% $30.3 $4,244.2 $214.1 +5% $61.6 ($141.9 ) $4,378.0 Q4 ’17 vs. Q4 ’16 Laureate Adj. EBITDA Bridge FY ’17 vs. FY ’16 Laureate Adj. EBITDA Bridge ($ in USD millions) ($ in USD millions) $284.8 $26.3$6.2 +9% $37.4 $354.7 $78.3 +11% ($4.8 ) ($26.6 ) $19.2 $831.7 FAS 5 Contingencies 17.0M Gain on Sale 20.4M Total 37.4M $765.6 FAS 5 Contingencies 21.7M Gain on Sale 20.3M Debt Refinancing(22.8M) Total 19.2M (1)Organic Constant Currency (CC) Operations excludes impacts from currency fluctuations, acquisitions and divestitures, and discrete items associated with sale of property, impact of acquisition-related contingent liabilities for taxes other-than-income tax, net of changes in recorded indemnification assets, and $22.8 million expense associated with our debt refinancing transactions in the second quarter of 2017 © 2018 Laureate Education, Inc.22
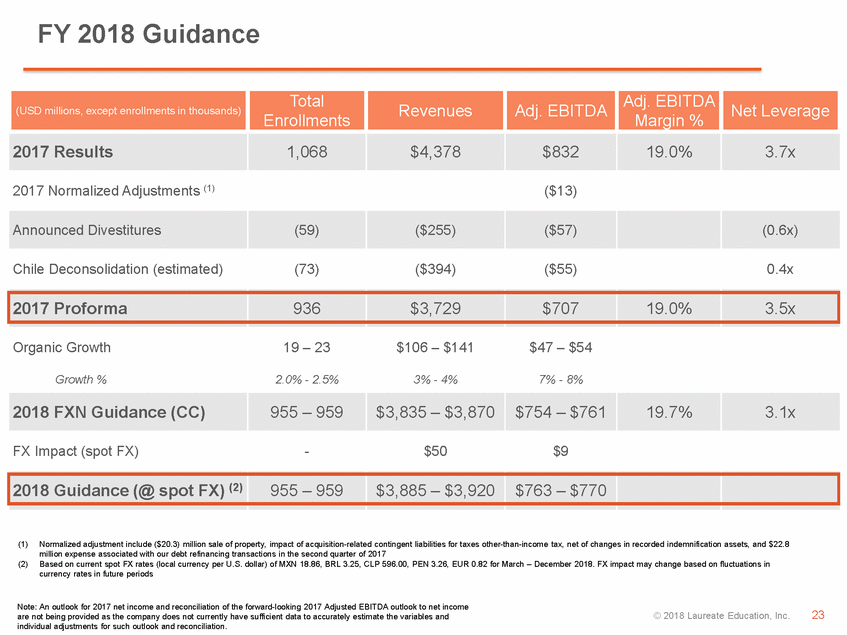
(1) Normalized adjustment include ($20.3) million sale of property, impact of acquisition-related contingent liabilities for taxes other-than-income tax, net of changes in recorded indemnification assets, and $22.8 million expense associated with our debt refinancing transactions in the second quarter of 2017 (2) Based on current spot FX rates (local currency per U.S. dollar) of MXN 18.86, BRL 3.25, CLP 596.00, PEN 3.26, EUR 0.82 for March – December 2018. FX impact may change based on fluctuations in currency rates in future periods
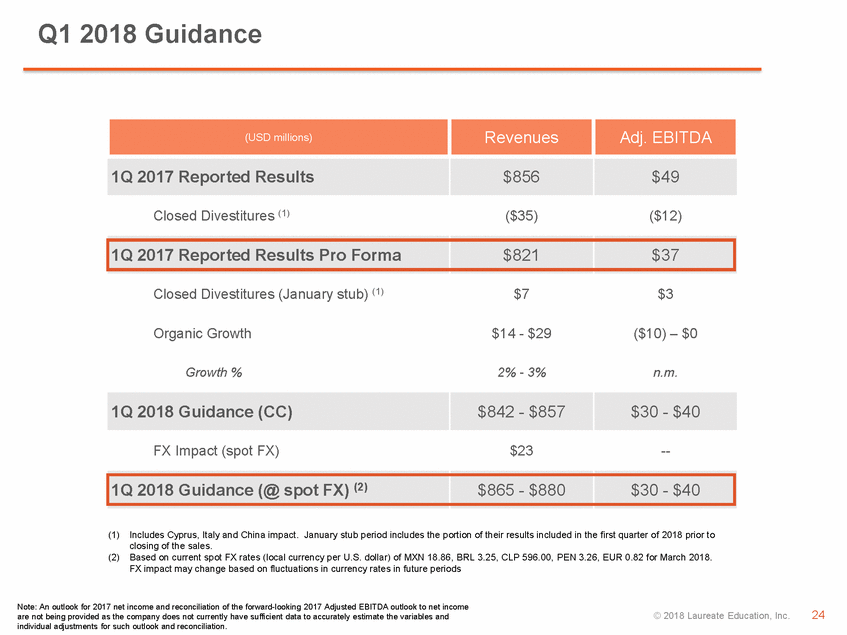
(1) Includes Cyprus, Italy and China impact. January stub period includes the portion of their results included in the first quarter of 2018 prior to closing of the sales. (2) Based on current spot FX rates (local currency per U.S. dollar) of MXN 18.86, BRL 3.25, CLP 596.00, PEN 3.26, EUR 0.82 for March 2018. FX impact may change based on fluctuations in currency rates in future periods
Segment Results Overview
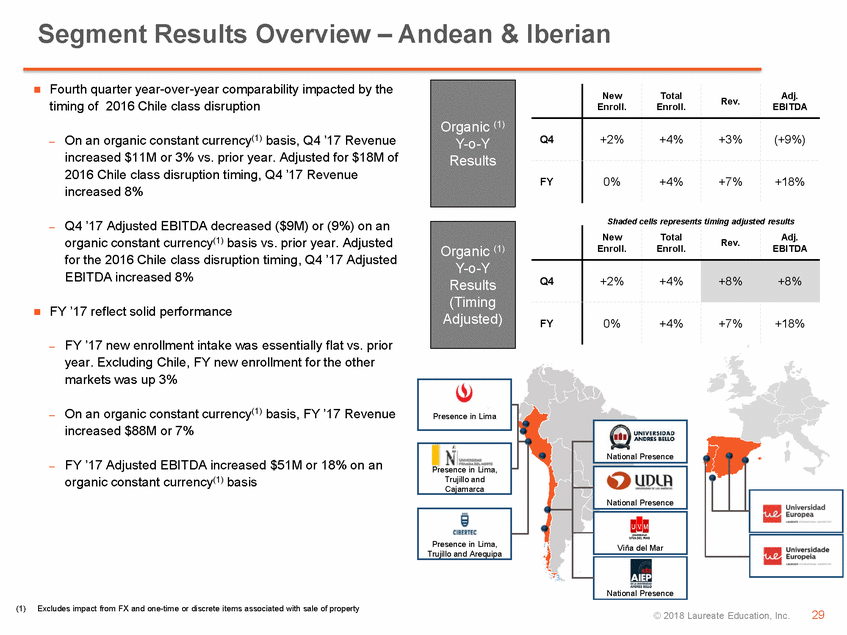
Timing adjusted results presented on the following segment pages include the following impacts: •Mexico: Magnitude 7.1 earthquake struck on September 19th with its epicenter in Puebla, which heavily impacted Mexico City as well as 7 other Mexican states –Delaying classes and shifting of Revenue from Q3 to Q4 2017, plus additional expenses for repairs •Chile: Student class disruptions in Q2 2016 –Shifting Revenue from Q2 to Q3 & Q4 2016 (prior year) Favorable/(Unfavorable)Revenue Timing ItemsAdj. EBITDA Timing Items Enrollment timing: EMEAA shifted new enrollments intake of 1,600 students from Q4 in 2016 to Q3 in 2017 due to timing intake at one institution; see EMEAA segment page that follows for timing adjusted enrollment results
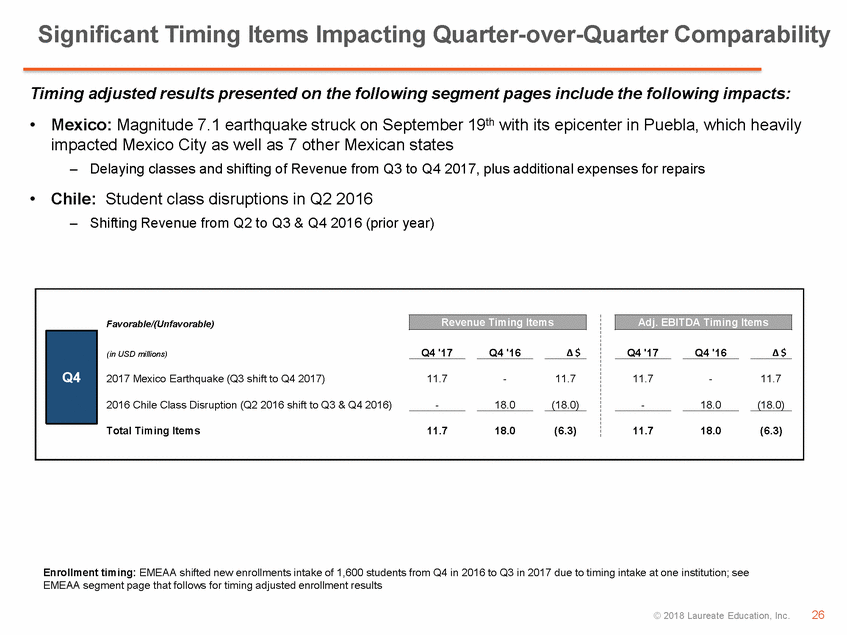
Fourth quarter results reflect strong secondary intake (especially in distance learning – DL), and actions taken in the fourth quarter to implement the common operating model in Brazil – On an organic constant currency(1) basis, Q4 ’17 Revenue increased $4M or 2% vs. prior year – Q4 ’17 Adjusted EBITDA increased $22M or 68% vs. prior year, on an organic constant currency(1) basis, benefitted by operational efficiencies implemented through the common operating model as well as timing items FY’17 results reflect strong performance in enrollments with mix impacting growth in revenue per student – On an organic constant currency(1) basis, FY ’17 Revenue increased $22M or 3% vs. prior year – FY ’17 Adjusted EBITDA increased $16M or 17% vs. prior year on an organic constant currency(1) basis Organic (1) Y-o-Y Results Salvador Natal / Mossoró João Pessoa ManausJaboatão dos Guararapes São PauloRio de Janeiro São Paulo São Paulo New Enroll. Total Enroll. Rev. Adj. EBITDA Q4 +27% +5% +2% +68% FY +11% +5% +3% +17% (1) Excludes impact from FX and one-time or discrete items associated with contingencies related to prior acquisitions. Porto Alegre Porto Alegre © 2018 Laureate Education, Inc.27
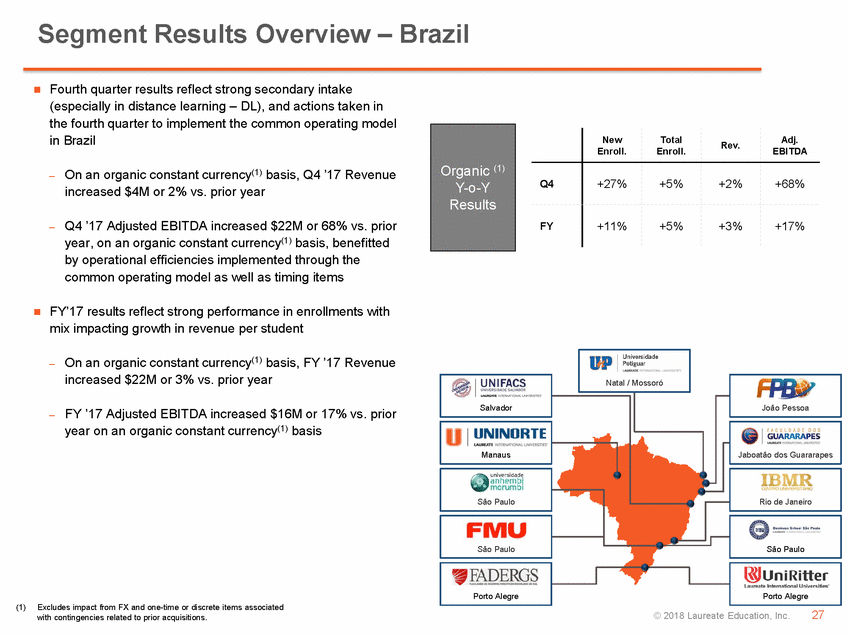
Fourth quarter results were impacted by the September 19th earthquake, which resulted in an estimated loss of 4,000 – 5,000 total enrollments for 2H 2017 – On an organic constant currency(1) basis, Q4 ’17 Revenue increased $16M or 9%. Adjusted for $12M in favorable revenue timing, Q4 ’17 revenue increased 3% New Enroll. Total Enroll. Rev. Adj. EBITDA Q4 (42%) 0% +9% +23% FY (1%) 0% +5% 4% – Q4 ’17 Adjusted EBITDA increased $13M or 23%, on an organic constant currency(1) basis. Adjusted for $12M of favorable timing, Q4 ’17 Adjusted EBITDA increased 2% FY ’17 results reflect the impact from the earthquake as well as lower levels of consumer sentiment in Mexico – On an organic constant currency(1) basis, FY ’17 Revenue increased $29M or 5% – FY ’17 Adjusted EBITDA increased $6M or 4% on an organic constant currency(1) basis, impacted by additional expenses related to the earthquake and investments in marketing Organic (1) Y-o-Y Results (Timing Adjusted) Shaded cells represents timing adjusted results New Enroll. Total Enroll. Rev. Adj. EBITDA Q4 (42%) 0% +3% 2% FY (1%) 0% +5% +4% (1) Excludes impact from FX National Presence © 2018 Laureate Education, Inc.28
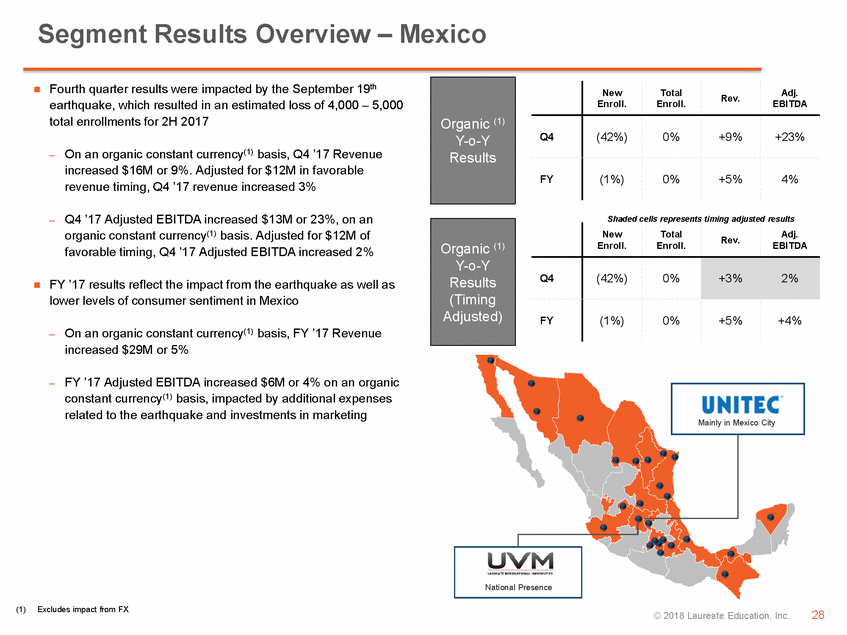
Fourth quarter year-over-year comparability impacted by the timing of 2016 Chile class disruption – On an organic constant currency(1) basis, Q4 ’17 Revenue increased $11M or 3% vs. prior year. Adjusted for $18M of 2016 Chile class disruption timing, Q4 ’17 Revenue increased 8% New Enroll. Total Enroll. Rev. Adj. EBITDA Q4 +2% +4% +3% (+9%) FY 0% +4% +7% +18% – Q4 ’17 Adjusted EBITDA decreased ($9M) or (9%) on an organic constant currency(1) basis vs. prior year. Adjusted for the 2016 Chile class disruption timing, Q4 ’17 Adjusted EBITDA increased 8% FY ’17 reflect solid performance – FY ’17 new enrollment intake was essentially flat vs. prior year. Excluding Chile, FY new enrollment for the other markets was up 3% – On an organic constant currency(1) basis, FY ’17 Revenue increased $88M or 7% – FY ’17 Adjusted EBITDA increased $51M or 18% on an organic constant currency(1) basis Organic (1) Y-o-Y Results (Timing Adjusted) Presence in Lima Presence in Lima, Trujillo and Cajamarca Shaded cells represents timing adjusted results New Enroll. Total Enroll. Rev. Adj. EBITDA Q4 +2% +4% +8% +8% FY 0% +4% +7% +18% National Presence Presence in Lima, Trujillo and Arequipa Viña del Mar (1) Excludes impact from FX and one-time or discrete items associated with sale of property National Presence © 2018 Laureate Education, Inc.29
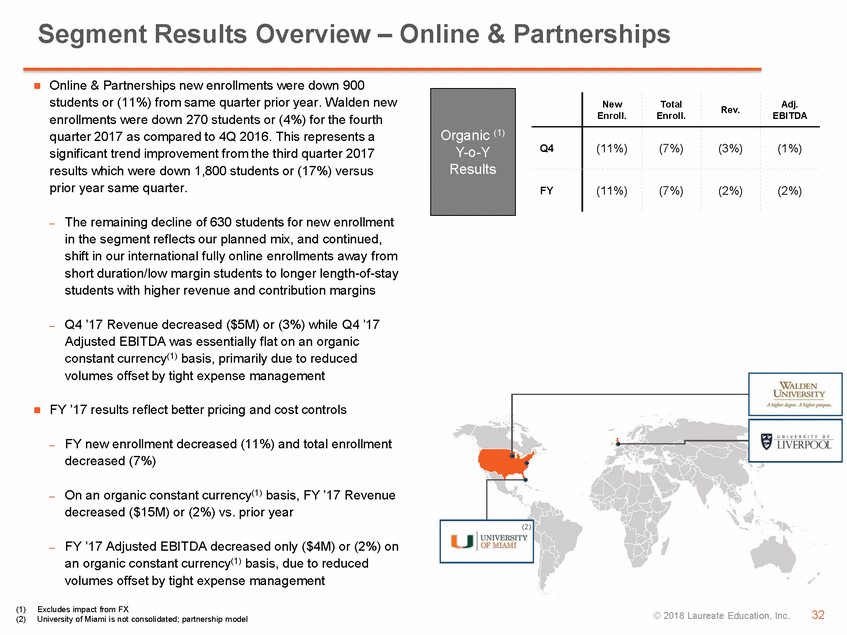
New Enroll. Total Enroll. Rev. Adj. EBITDA Q4 +3% +2% +9% (15%) FY +4% +2% +8% 13% – On an organic constant currency(2) basis, Q4 ’17 Revenue increased $6M or 9% vs. prior year – Q4 ’17 Adjusted EBITDA decreased ($2M) or (15%) vs. prior year, on an organic constant currency(2) basis due to weaker performance in one of the smaller U.S. campus based institutions that is being divested FY ’17 results reflect low single digit enrollment growth driving mid-high single digit revenue growth, with faster growth in the higher price point markets. Margins have improved through scaling of smaller assets in the segment – On an organic constant currency(2) basis, FY ’17 Revenue increased $22M or 8% vs. prior year – FY ’17 Adjusted EBITDA increased $6M or 13% vs. prior year on an organic constant currency(2) basis (1) Includes Kendall College and NewSchool of Architecture & Design (not shown in map) (2) Excludes impact from FX Organic (2) Y-o-Y Results
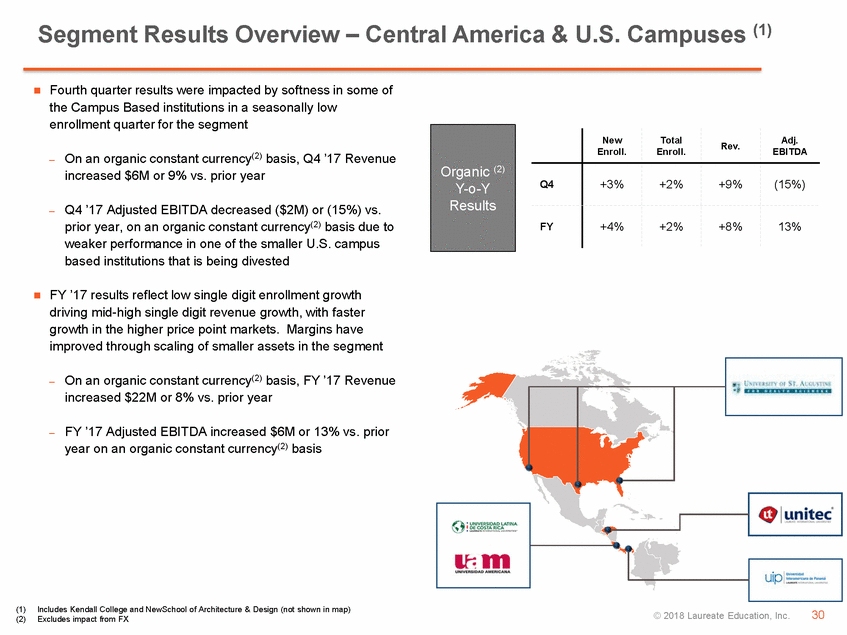
Q4 financial results remain strong and follow previous quarter’s performance – Q4 new enrollment intake decreased (34%) vs. prior year impacted by timing and the quota reduction of approx. 3,500 students in Turkey. Adjusted for timing and excluding Turkey, new enrollments grew 9% or 400 students as compared to same quarter prior year – On an organic constant currency(1) basis, Q4 ’17 Revenue increased $25M or 12% vs. prior year – Q4 ’17 Adjusted EBITDA increased $13M or 22% on an organic constant currency(1) basis vs. prior year FY results reflect strong revenue performance and margin expansion from scale benefits – On an organic constant currency(1) basis, FY ’17 Revenue increased $65M or 10% vs. prior year – FY ’17 Adjusted EBITDA increased $32M or 32% on an organic constant currency(1) basis vs. prior year due to robust margin expansion Organic (1) Y-o-Y Results Organic (1) Y-o-Y Results (Timing Adjusted) New Enroll. Total Enroll. Rev. Adj. EBITDA Q4 (34%) +2% +12% 22% FY (6%) +2% +10% 32% New Enroll. Total Enroll. Rev. Adj. EBITDA Q4 (22%) +2% +12% 22% FY (6%) +2% +10% 32% Colleges of Excellence (1) Excludes impacts from FX and 2016 Divestitures. © 2018 Laureate Education, Inc.31
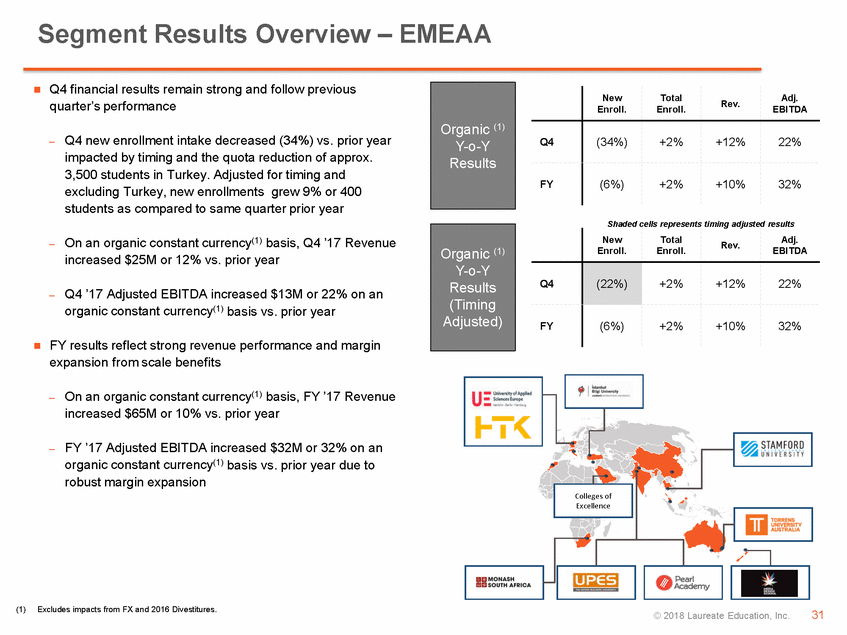
New Enroll. Total Enroll. Rev. Adj. EBITDA Q4 (11%) (7%) (3%) (1%) FY (11%) (7%) (2%) (2%) – The remaining decline of 630 students for new enrollment in the segment reflects our planned mix, and continued, shift in our international fully online enrollments away from short duration/low margin students to longer length-of-stay students with higher revenue and contribution margins – Q4 ’17 Revenue decreased ($5M) or (3%) while Q4 ’17 Adjusted EBITDA was essentially flat on an organic constant currency(1) basis, primarily due to reduced volumes offset by tight expense management FY ’17 results reflect better pricing and cost controls – FY new enrollment decreased (11%) and total enrollment decreased (7%) – On an organic constant currency(1) basis, FY ’17 Revenue decreased ($15M) or (2%) vs. prior year – FY ’17 Adjusted EBITDA decreased only ($4M) or (2%) on an organic constant currency(1) basis, due to reduced volumes offset by tight expense management (1) Excludes impact from FX (2) University of Miami is not consolidated; partnership model Organic (1) Y-o-Y Results (2) © 2018 Laureate Education, Inc.32
Other Information

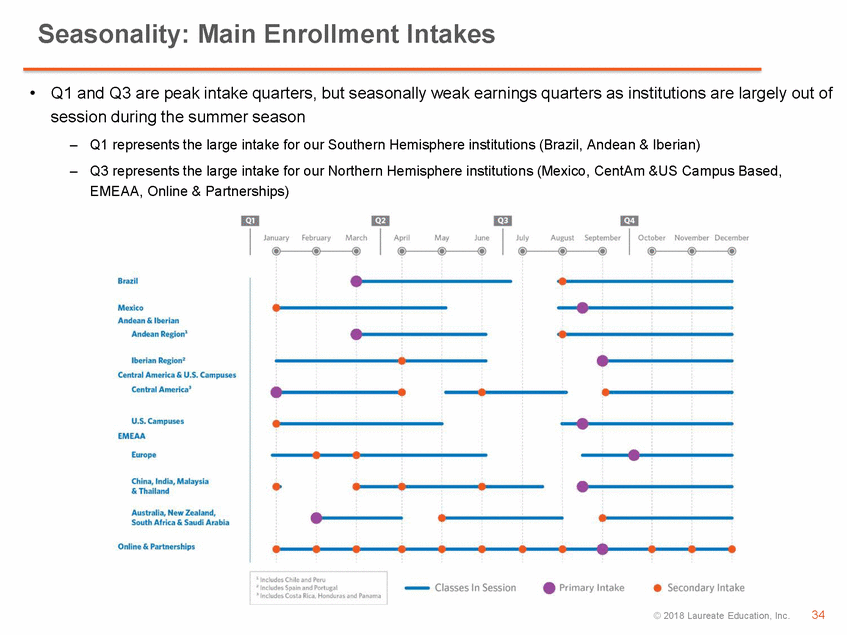
•Q1 and Q3 are peak intake quarters, but seasonally weak earnings quarters as institutions are largely out of session during the summer season –Q1 represents the large intake for our Southern Hemisphere institutions (Brazil, Andean & Iberian) –Q3 represents the large intake for our Northern Hemisphere institutions (Mexico, CentAm &US Campus Based, EMEAA, Online & Partnerships)
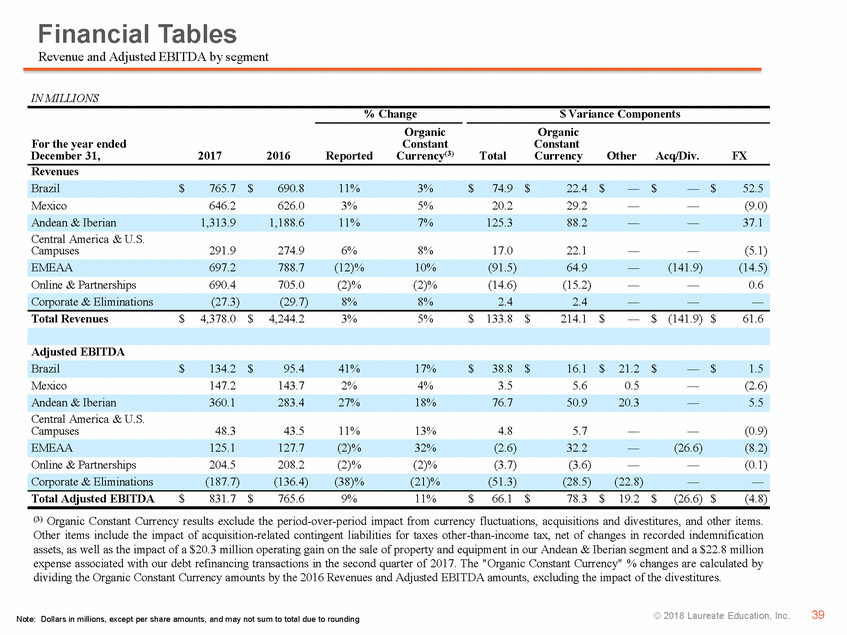
•Large intake cycles at end of Q1 (Southern Hemisphere) and end of Q3 (Northern Hemisphere) drive seasonality of earnings (Q2 and Q4 are our strongest earnings quarters) Revenue SeasonalityAdj. EBITDA Seasonality 20% 21% 21% 20% 28% 30% 29% 29% 22% 23% 22% 22% 30% 27% 28% 29% 42% 46% 40% 41% 42% 32% 37% 43% 7% 5% 10% 6% 17% 9% 13% 10% Q1 Q2 Q3 Q4 Q1 Q2 Q3 Q4 2014201520162017 2014201520162017 New Enrollments SeasonalityFactors Affecting Seasonality 43% 47% 45% 44% 37% 35% 35% 36% Intake cycles – Q1 Southern Hemisphere 14% 11% 12% 13% 7% 7% 7% 6% – Q3 Northern Hemisphere Academic calendar Q1 Q2 Q3 Q4 FX trends 2014201520162017
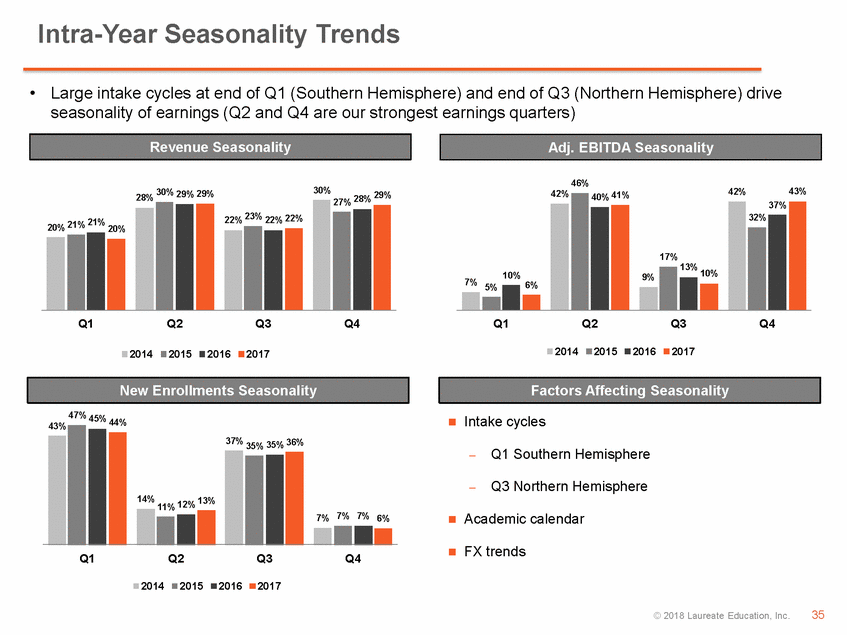
Financial Tables

For the three months endedFor the year ended December 31,December 31, IN MILLIONS20172016Change2017(1) 2016Change Accretion of Series A convertible redeemable preferred stock and other redeemable noncontrolling interests and equity$(106.3) $(4.8) $(101.5)$(298.5) $(1.5) $(297.0) Net income (loss) available to common stockholders $89.5 $36.5 $53.0 $(207.0) $370.3 $(577.3) Basic and diluted earnings (loss) per share: Basic weighted average shares outstanding 187.3 133.3 54.0 172.4 133.3 39.1 Dilutive weighted average shares outstanding 187.8 134.5 53.3 172.4 134.4 38.0 Basic earnings (loss) per share $0.48 $0.27 $0.21 $(1.20) $2.78 $(3.98) (1) Financial results for 2017 as compared to 2016 were affected by the sale of two business units in France and Switzerland (EMEAA segment) during 2016.
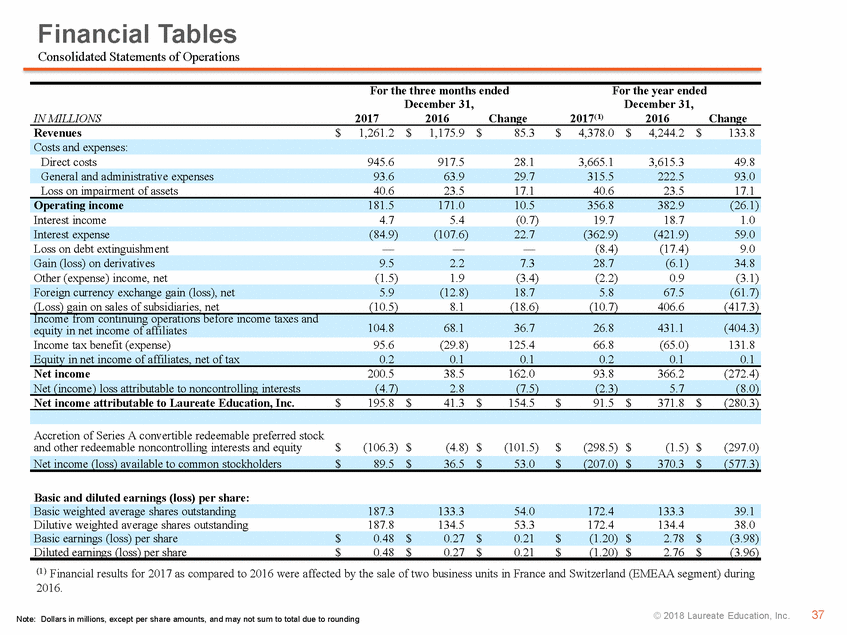
IN MILLIONS % Change$ Variance Components For the quarter ended December 31,20172016Reported Organic Constant Currency(2)Total Organic Constant CurrencyOtherAcq/Div.FX (2) Organic Constant Currency results exclude the period-over-period impact from currency fluctuations, acquisitions and divestitures, and other items. Other items include the impact of acquisition-related contingent liabilities for taxes other-than-income tax, net of changes in recorded indemnification assets, as well as the impact of a $20.3 million operating gain on the sale of property and equipment in our Andean & Iberian segment. The "Organic Constant Currency" % changes are calculated by dividing the Organic Constant Currency amounts by the 2016 Revenues and Adjusted EBITDA amounts.
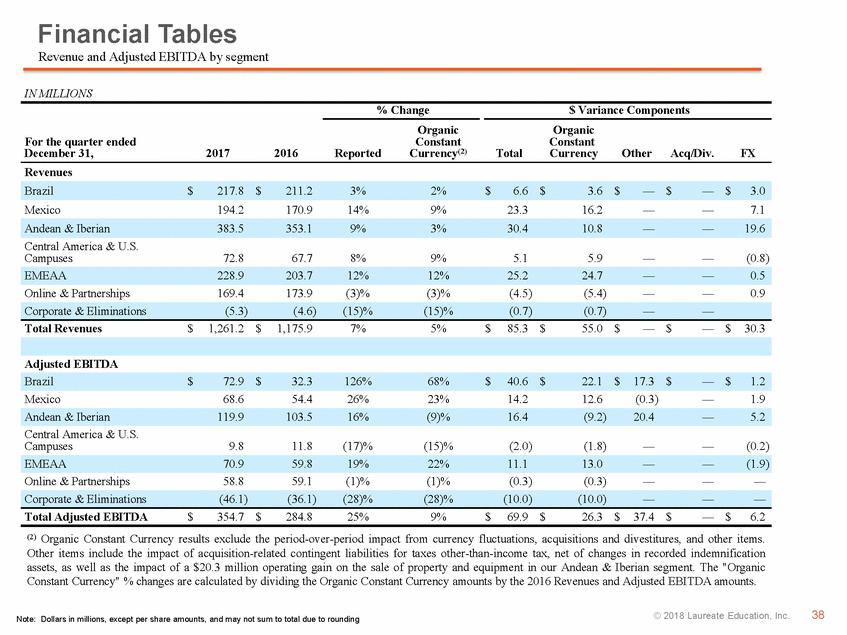
IN MILLIONS % Change$ Variance Components (3) Organic Constant Currency results exclude the period-over-period impact from currency fluctuations, acquisitions and divestitures, and other items. Other items include the impact of acquisition-related contingent liabilities for taxes other-than-income tax, net of changes in recorded indemnification assets, as well as the impact of a $20.3 million operating gain on the sale of property and equipment in our Andean & Iberian segment and a $22.8 million expense associated with our debt refinancing transactions in the second quarter of 2017. The "Organic Constant Currency" % changes are calculated by dividing the Organic Constant Currency amounts by the 2016 Revenues and Adjusted EBITDA amounts, excluding the impact of the divestitures.
[LOGO]
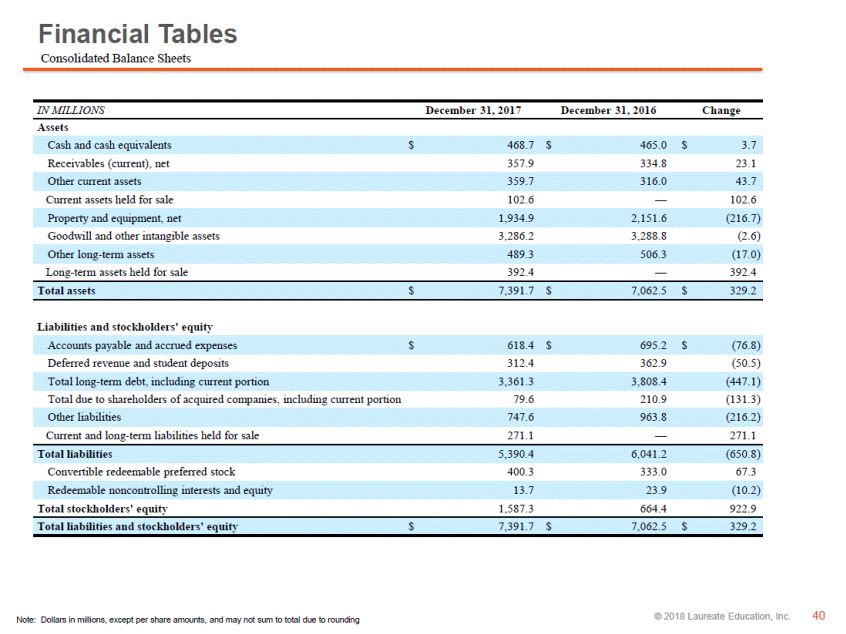
For the year ended December 31, Liquidity (including Undrawn Revolver) $ 801.7 $ 790.0 $ 11.7
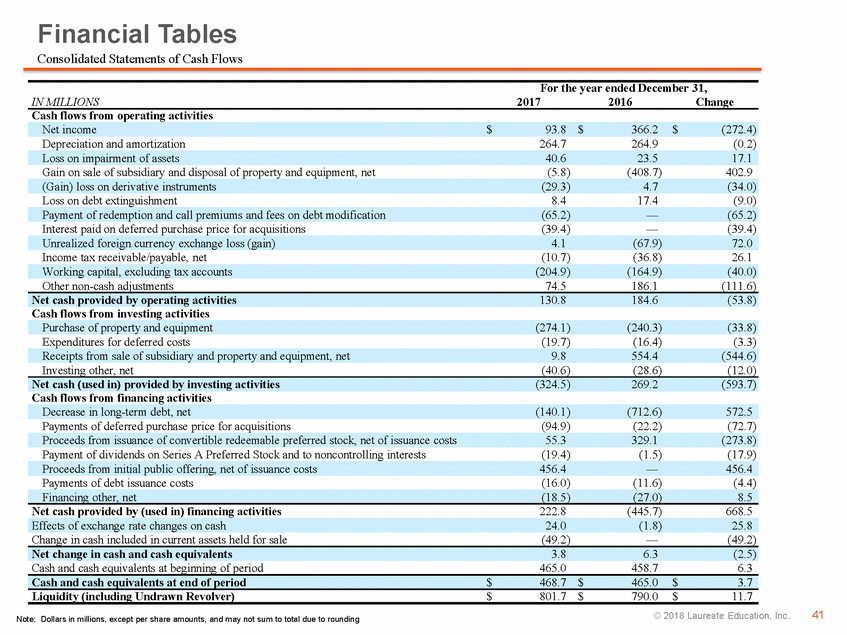
For the three months ended For the year ended December 31, December 31, 20172016Change 2017 2016 Change (4) Represents non-cash, share-based compensation expense pursuant to the provisions of ASC Topic 718. (5) Represents non-cash charges related to impairments of long-lived assets. (6) EiP implementation expenses are related to our enterprise-wide initiative to optimize and standardize our processes, creating vertical integration of procurement, information technology, finance, accounting and human resources. The first wave of EiP began in 2014 and was substantially completed in 2017, and includes the establishment of regional SSOs around the world, as well as improvements to our system of internal controls over financial reporting. Given the success of the first wave of EiP, we have expanded the initiative into other back-and mid-office areas, as well as certain student-facing activities, in order to generate additional efficiencies and create a more efficient organizational structure. Also included in EiP are certain non-recurring costs incurred in connection with the planned divestitures.
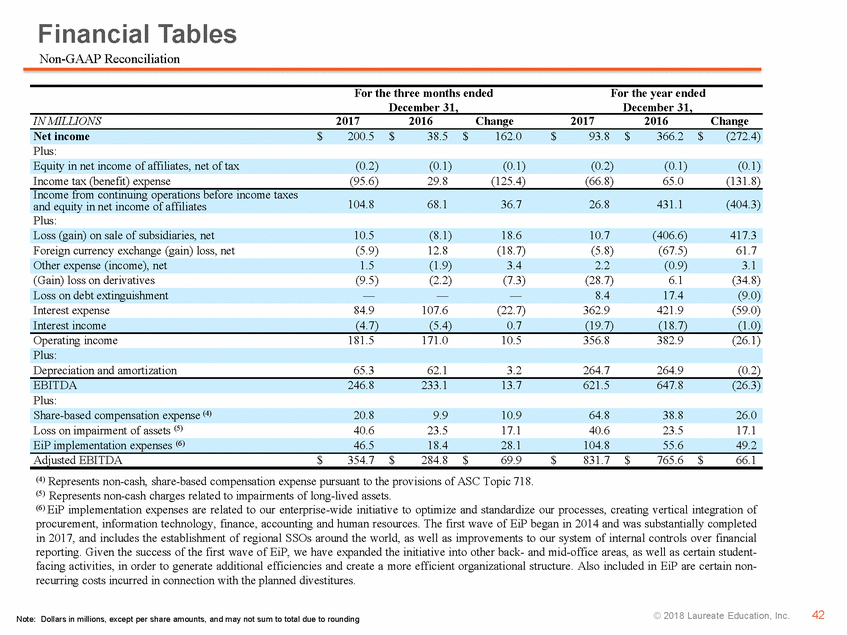
HERE FOR GOOD
