Attached files
| file | filename |
|---|---|
| EX-32.2 - EXHIBIT 32.2 - Vuzix Corp | tv488149_ex32-2.htm |
| EX-32.1 - EXHIBIT 32.1 - Vuzix Corp | tv488149_ex32-1.htm |
| EX-31.2 - EXHIBIT 31.2 - Vuzix Corp | tv488149_ex31-2.htm |
| EX-31.1 - EXHIBIT 31.1 - Vuzix Corp | tv488149_ex31-1.htm |
| EX-23.1 - EXHIBIT 23.1 - Vuzix Corp | tv488149_ex23-1.htm |
UNITED STATES SECURITIES AND EXCHANGE COMMISSION
Washington, D.C. 20549
FORM 10-K
| þ | ANNUAL REPORT PURSUANT TO SECTION 13 OR 15(d) OF THE SECURITIES EXCHANGE ACT OF 1934 |
For the fiscal year ended December 31, 2017
| ¨ | TRANSITION REPORT PURSUANT TO SECTION 13 OR 15(d) OF THE SECURITIES EXCHANGE ACT OF 1934 |
Commission file number: 001-35955
Vuzix Corporation
( Exact name of registrant as specified in its charter )
| Delaware (State of incorporation) 25 Hendrix Road, Suite A West Henrietta, New York (Address of principal executive office) |
04-3392453 (I.R.S. employer identification no.) 14586 (Zip code) |
(585) 359-5900
(Registrant’s telephone number including area code)
Securities registered pursuant to Section 12(b) of the Act: common stock, par value $0.001 per share
Securities registered pursuant to Section 12(g) of the Act:
warrants to purchase common stock
Indicate by check mark if the registrant is a well-known seasoned issuer, as defined in Rule 405 of the Securities Act. Yes ¨ No þ
Indicate by check mark if the registrant is not required to file reports pursuant to Section 13 or Section 15(d) of the Exchange Act. Yes ¨ No þ
Indicate by check mark whether the registrant: (1) has filed all reports required to be filed by Section 13 or 15(d) of the Securities Exchange Act of 1934 during the preceding 12 months (or for such shorter period that the registrant was required to file such reports), and (2) has been subject to such filing requirements for the past 90 days. Yes þ No ¨
Indicate by check mark whether the registrant has submitted electronically and posted on its corporate Web site, if any, every Interactive Data File required to be submitted and posted pursuant to Rule 405 of Regulation S-T during the preceding 12 months (or for such shorter period that the registrant was required to submit and post such files). Yes þ No ¨
Indicate by check mark if disclosure of delinquent filers pursuant to Item 405 of Regulation S-K is not contained herein, and will not be contained, to the best of registrant’s knowledge, in definitive proxy or information statements incorporated by reference into Part III of this Form 10-K or any amendment to this Form 10-K. ¨
Indicate by check mark whether the registrant is a large accelerated filer, an accelerated filer, a non-accelerated filer, a smaller reporting company, or emerging growth company. See the definitions of “large accelerated filer,” “accelerated filer,” “smaller reporting company,” and “emerging growth company in Rule 12b-2 of the Exchange Act. (Check one):
| Large accelerated filer ¨ | Accelerated filer þ | Non-accelerated filer ¨ (Do not check if a smaller reporting company) |
Smaller
reporting company ¨
Emerging growth company ¨ |
If an emerging growth company, indicate by check mark if the registrant has elected not to use the extended transition period for complying with any new or revised financial accounting standards provided pursuant to Section 13(a) of the Exchange Act. ¨
Indicate by check mark whether the registrant is a shell company (as defined in Rule 12b-2 of the Exchange Act). Yes ¨ No þ
The aggregate market value of the voting and non-voting common equity of the registrant held by non-affiliates as of June 30, 2017 was approximately $111,187,000 (based on the closing price of the common stock of $6.55 per share on that date, as reported on the NASDAQ Capital Market and, for purposes of this computation only, the assumption that all of the registrant’s directors and executive officers are affiliates and that beneficial holders of 10% or more of the outstanding common stock are affiliates).
As of March 16, 2018, there were 27,301,203 shares of the registrant’s common stock outstanding.
DOCUMENTS INCORPORATED BY REFERENCE
Part III of this Form 10-K incorporates by reference portions of the registrant’s proxy statement for its 2018 annual meeting of stockholders.
TABLE OF CONTENTS
ii
FORWARD-LOOKING STATEMENTS
This annual report includes forward-looking statements within the meaning of the safe harbor provisions of the Private Securities Litigation Reform Act of 1995. These statements are based on our management’s beliefs and assumptions and on information currently available to our management. The forward-looking statements are contained principally under the headings “Risk Factors,” “Management’s Discussion and Analysis of Financial Condition and Results of Operations,” and “Business.” Forward-looking statements contained in this Annual Report on Form 10-K include, but are not limited to, statements concerning:
| · | trends in our operating expenses, including personnel costs, research and development expense, sales and marketing expense, and general and administrative expense; |
| · | the effect of competitors and competition in our markets; |
| · | our wearable products and their market acceptance and future potential; |
| · | our ability to develop, timely introduce and effectively manage the introduction of new products and services or improve our existing products and services; |
| · | expected technological advances by us or by third parties and our ability to leverage them; |
| · | our ability to attract and retain customers. |
| · | our ability to accurately forecast consumer demand and adequately manage inventory; |
| · | our ability to deliver an adequate supply of product to meet demand; |
| · | our ability to maintain and promote our brand and expand brand awareness; |
| · | our ability to detect, prevent, or fix defects in our products; |
| · | our reliance on third-party suppliers, contract manufacturers and logistics providers and our limited control over such parties; |
| · | trends in revenue, costs of revenue, and gross margin and our possible or assumed future results of operations; |
| · | our ability to attract and retain highly skilled employees; |
| · | the impact of foreign currency exchange rates; |
| · | the effect of future regulations; |
| · | the sufficiency of our existing cash and cash equivalent balances and cash flow from operations to meet our working capital and capital expenditure needs for at least the next 12 months; and |
| · | general market, political, economic and business conditions. |
All statements in this annual report that are not historical facts are forward-looking statements. We may, in some cases, use terms such as “anticipates,” “believes,” “could,” “estimates,” “expects,” “intends,” “may,” “plans,” “potential,” “predicts,” “projects,” “should,” “will,” “would” or similar expressions that convey uncertainty of future events or outcomes to identify forward-looking statements.
Forward-looking statements are made based on management’s beliefs, estimates and opinions on the date the statements are made and we undertake no obligation to update forward-looking statements if these beliefs, estimates and opinions or other circumstances should change, except as may be required by applicable law. Although we believe that the expectations reflected in the forward-looking statements are reasonable, we cannot guarantee future results, levels of activity, performance or achievements.
PART I
| Item 1. | Business |
Company Overview
We are engaged in the design, manufacture, marketing and sale of augmented reality wearable display devices also referred to as head mounted displays (or HMDs, but also known as Video Eyewear, near-eye displays, near-eye virtual displays), in the form of Smart Glasses and Augmented Reality (AR) glasses. Our AR wearable display devices are worn like eyeglasses and contain varying features such as built-in video screens and audio. These devices also often include cameras, sensors, and a computer, that enable the user to view and interact with video and digital content, such as movies, computer data, the Internet or video games. Our AR wearable display products provide virtual large high-resolution screens and present a virtual image to the user through our proprietary optics and projection engines. Using these optics and displays, our AR wearable display devices provide a virtual image that appears to the wearer similar in size to the image from a typical smart phone screen at arm’s length away, all the way to models that offer wall-sized home theatre screens. Our virtual imaging products integrate microdisplay technology with our advanced optics to produce compact high-resolution display engines, less than half an inch diagonally, which when viewed through our eyeglasses products create virtual images that appear comparable in size to that of a computer monitor or a large-screen television.
1
Our Smart Glasses are designed to work standalone or as a peripheral to the smartphone and have many of the same capabilities of the smartphone itself, allowing them to be used as a hands-free wearable computer. Our products can be used as a wearable substitute for large-screen televisions, desktop computer monitors or tablets. Additionally, our Smart Glasses models allow users to utilize many smartphone applications while keeping their smartphones in a pocket or purse. Users of mobile devices sometime employ tablets and smartphones to replace their personal computer or console game systems while they are outside their homes or offices. Our wearable display products enable users of these mobile devices to effectively view the entire screen on a small, eyeglass-like device allowing real world interaction while viewing the screen.
We believe some of the most promising future uses of wearable displays are Smart Glasses and AR glasses where virtual 2D and 3D computer-generated objects and information are superimposed to enhance real-world views. This see-through capability is accomplished using a see-through optic, built around our waveguide intellectual property or digitally with a forward-looking camera. Our wearable displays can also be used for AR applications, in which the wearer has their real-world view augmented with computer generated information or graphics as is typical in either consumer or enterprise applications.
In the past, see-through HMDs displayed the real world using semi-transparent mirrors placed in front of the user’s eyes. These HMDs were large and bulky and as a result, they had little mass-market appeal. We have developed thin optics, called waveguides, that are fully see-through and enable miniature display engines to be mounted in the temples of the HMD which allows the form factor of the Smart Glasses to be comparable to conventional eyeglasses. Our Smart Glasses and AR Glasses are designed for all day use cases and are small enough to fit in a user’s pocket or purse.
With hands free wearable computers like our M300 and M100 Smart Glasses, the user can merge virtual information with the real world, known as AR. With this capability, we have the potential to penetrate many new markets in the consumer and enterprise markets. An example of AR is the yellow “first down” line seen in television broadcasts of American football games, in which the line the offensive team must cross to achieve a first down is superimposed on the field itself. The real-world elements are the football field and players; the virtual element is the yellow line. We believe see-through wearable displays will enable this kind of experience on Smart Glasses running their own native AR applications, virtually anywhere and anytime. Our Smart Glasses product line can run these kinds of applications natively as they have much of the capabilities of a smartphone built into them, including running full operating systems like Alphabet (Google) Inc.’s Android.
Our waveguide and display engine products enable our original equipment manufacturer (OEM) customers to develop and market improved wearable products that are mobile so that people have immediate access to information and can experience new forms of communications, entertainment, and social media content.
We believe that our waveguide optics and display engines offer a number of significant advantages over other wearable display solutions, including higher contrast, greater power efficiency, less weight, more compact size, and high brightness images for use outdoors. We also believe that our waveguide optics give us a substantial advantage over other competitors’ optics, including other waveguides because it allows us to produce optics that are fully transparent when off, along with the high brightness required for AR and enterprise Smart Glasses applications.
We believe that a key growth area for us is the consumer electronic OEM market. Our potential channels to this market include supplying mass production of waveguide optics and display engines to select third parties to use in their products. We believe that our waveguides and compact display engine technologies are a key differentiator for enabling next generation AR and Smart Glasses hardware for the consumer and enterprise segments because they allow us to make HMDs nearly indistinguishable from regular eyeglasses.
We have developed our own intellectual property portfolio that includes patents, over 20 years of manufacturing know-how, and proprietary processes, materials and equipment to create high performance waveguides and near-eye display products. We believe our technology, intellectual property portfolio and position in the marketplace give us a leadership position in AR and Smart Glasses products and waveguide optics and display engine technology.
Our History
Historically, we have focused on three markets: the consumer markets for gaming, entertainment and mobile video, smart glasses products for enterprise, and rugged mobile displays for defense markets. We introduced our first HMD products over 20 years ago and we have offered numerous product models and versions with ever advancing features and capabilities that have served the three markets. In June 2012, we sold the assets that produced products and provided services to military organizations and defense organizations. Accordingly, we now focus primarily on the enterprise markets and consumer entertainment.
We produce both monocular and binocular wearable displays devices that may be simple video viewers that are not “smart” and others with integrated computers. In early 2014, we started selling M100 Smart Glasses, a new category of smart wearable displays that is aimed at enterprise customers. The M100 includes a wearable computer and has much of the capabilities of a smartphone including wireless internet access, GPS, Android OS and more, and are worn like a pair of glasses.
2
In December 2015, we began shipping the Vuzix iWear Video Headphones (iWear) which included partial support for Virtual Reality (VR) applications. The binocular iWear is worn like a pair of headphones and features dual HD Displays and revolutionary nano-optics that provide the equivalent experience of a 125" home television from 10 feet and allow the wearer to play games, interact with apps, watch 2D, 3D and 360°VR movies and even fly drones. iWear is completely portable and battery-driven so that the user can enjoy it at home or on-the-go. In early 2017, we decided to discontinue further production of iWear due to competitive market conditions in the VR HMD marketplace. We expect to sell our remaining stock throughout 2018.
At CES in January 2016, we introduced a new prototype model of our monocular Smart Glasses products: the M300 Smart Glasses. The M300 represents our next generation Smart Glasses model with significantly improved ergonomics and technical features, all in a ruggedized form designed specifically for enterprise and industrial use. The M300 Smart Glasses can connect to the cloud to deliver digital content directly to and from the job site and connecting it “overlaid” onto the real world.
In January 2018, we introduced our Vuzix Blade™ (The Blade) Smart Glasses at CES 2018. The Vuzix Blade received 4 innovation awards at CES and was named “Best of CES” by several notable media firms including TIME, Rolling Stone, CNET, Fox News, Tom’s Guide and TechRadar. The Blade provides a wearable AR smart display with a see-through viewing experience utilizing Vuzix' proprietary waveguide optics and Cobra II display engine. Using the Vuzix Blade is like having a computer or smartphone screen information right in front of the user, wherever they go and is designed to allow the user to keep their phone in their pocket. The lightweight (less than 2.8 oz) Blade Smart Glasses are the first smart glasses featuring style, performance and advanced see-through waveguide optics for hands-free computing and connectivity. The Blade is ideal for mobile applications including social media, navigation, artificial intelligence (AI) and HD photography and videography as well as a AR wearable display for the enterprise sector. The Blade also is designed to integrate with AI engines and will ship out of the box with Amazon Alexa, an intelligent personal assistant featuring AI. It is capable of voice interaction, making to-do lists, setting alarms, streaming podcasts, playing audiobooks, taking pictures and providing weather, traffic, and other real-time information.
Overall Strategy
Our goal is to establish and maintain a leadership position as a worldwide supplier of wearable displays including AR glasses and Smart Glasses solutions. We intend to offer our products across major markets, platforms and applications. We strive to be an innovator in designing wearable display devices that can enable mobile video viewing, general entertainment, social media, enterprise productivity hands-free enhancements and most importantly, AR applications.
To maintain and enhance our position as a leading provider of wearable display products for AR, video viewing and smart glasses, we seek to:
| · | improve brand name recognition; | |
| · | provide excellent products and service; | |
| · | develop products based on our unique technology for both specialized and large enterprise and consumer markets; | |
| · | broaden and develop strategic relationships and partnerships; | |
| · | offer to sell our products or license our technology to third party companies that would incorporate and sell them as a new product with their own brand name (OEM partners); | |
| · | promote and enhance development of third party software that can take advantage of our products, including offering apps and software through our own “app store”; | |
| · | communicate the advantages of our proprietary waveguide optics and display engine technologies to the relevant customers in target market sectors and encourage their adoption through demonstrations and incorporation in the offerings of world-class companies; | |
| · | reduce production and overhead costs by further outsourcing while moving to higher margin product offerings; | |
| · | extend our innovative and proprietary technology leadership; | |
| · | enhance and protect our intellectual property portfolio; | |
| · | establish multiple revenue sources; | |
| · | attract and retain highly qualified personnel; and | |
| · |
build and maintain strong product design capabilities. |
Our strategy is also to create leadership position as a worldwide supplier of waveguide optics and virtual imaging technology solutions for applications in high growth segments of the consumer, enterprise and commercial electronics industry by capitalizing on our experience and expertise in wearable displays and the move to AR Smart Glasses for delivering AI, entertainment, work, social media and other applications. We aim to provide waveguides, display engines and complementary optics to enable OEM customers to serve a variety of markets with new enhanced display electronic products. Some key elements of our OEM strategy to achieve these objectives include the following:
3
| · | Develop OEM and mass production partnerships in the consumer AR Smart Glasses market. As consumer mobile electronics markets transition to AR glasses, Vuzix technology is positioned well to address the requirements of this segment. Developing customer partners is key to establishing Vuzix as the market leader for next generation display technologies for the consumer AR Smart Glasses market. In addition, executing on mass production partnerships will position us to capture a market predicted to experience significant growth through the 2020s. |
| · | Strengthen our technology leadership. As the first to exploit waveguides with miniature display engines, we believe that we enjoy a significant advantage in bringing this technology to the OEM market. By continuing to invest in research and development, and protecting our intellectual property, we expect to further develop performance improvements and provide a competitive edge for our customers who integrate our displays into their end products. |
| · | Optimize waveguide manufacturing efficiencies while protecting proprietary processes. We intend to further improve our manufacturing yields and lower costs by way of increased automation as well as equipment upgrades. We intend to retain the waveguide design and final mold replication related processes in-house, where we have a core competency and manufacturing expertise. We also believe that by keeping these processes under tight control we can better protect our proprietary technology and process know-how. We believe that this strategy will also enhance our ability to continue to optimize and customize processes and devices to meet customer needs. |
| · | Build and maintain strong design capabilities. We employ in-house design capabilities supplemented by outsourced design services. Building and maintaining this capability allows us to reduce engineering costs, accelerate the design process and enhance design accuracy to respond to our customers' needs as new markets develop. Given these capabilities, we continue to look for opportunities to add value to our displays to increase revenue. |
| · | Leverage strategic relationships. External relationships serve an important role in our research and development efforts. Our relationships with suppliers, equipment vendors, contract research groups, external design companies, customer and corporate partners, all enhance our overall research and development effort and bring us new ideas and solutions. |
The Market
The wireless and entertainment industry has evolved considerably, and continues to do so. The mobile phone has evolved into a ubiquitous, location-aware, smart mobile computing device. Mobile technology is redefining the way people interact with their world, both at work and play, and it has become an essential lifestyle management and entertainment tool personalized to users’ unique needs. We believe that interactive AR content and AI cloud services will significantly change the way mobile products are used and how content is delivered to the user. We believe head worn wearable displays that are hands free and can connect the digital world to the real world have the ability to change the entire paradigm and future of the computing industry. We believe AR based wearable display and Smart Glasses can enable new experiences that cannot be experienced in any other way.
Current mobile display technology is almost universally based on direct view screens. These displays for mobility purposes are designed to be small and make portability easy. At the same time, these displays must be held by the user and, depending upon their size, can be difficult for these displays to produce human readable high-resolution content without magnification zooming, which reduces screen resolution, or they must be held at a reasonably close reading distance. Our products are aimed at solving these problems by creating hands-free virtual large screens that are interactive and fit in tiny packages (eyeglasses). Head-wearable displays may block out surroundings for a fully immersive experience, or be designed to "see-through" or "see-around" the user's surroundings. They may contain one (monocular) or two (binocular) displays. We have leveraged our experience in developing wearable display products over the last 20 years and believe this experience will allow us to more rapidly introduce wearable displays suitable for specialized and mass market consumer AR and Smart Glasses applications than our competitors.
Our business for the last five years has focused on enterprise and industrial markets and the mobile consumer entertainment markets. The demand for head worn wearable displays in these markets is being driven by such factors as:
| · | Increasing demand for Internet, social media, and cloud services’ access “anywhere, anytime”; | |
| · | An increasing number of hands-free enterprise, commercial and medical applications for which our products are well suited and, when wearable display products are employed for these use cases, a significant ROI is typically achieved; | |
| · | We believe the growing use of AR applications will drive the need for a head worn wearable display solutions to replace the need to hold up handheld devices to use the applications; | |
| · | We believe applications like the AR Kit and AR Core from Apple and Google are driving this new experience in the mobile space. But the Smart Phone is unnatural and difficult form factor by which to experience AR. We believe that AR Smart Glasses are needed to deliver this experience correctly; and | |
| · | More users are migrating a greater portion of their entertainments and information gathering time to mobile devices. We believe that our Virtual Display technologies can significantly increase user satisfaction and allow for wide spread AR adoption and applications. |
Target Markets
Our target markets and applications by major sector are:
4
Enterprise
Our Smart Glasses products are currently focused on the enterprise, industrial and medical markets. These Smart Glasses products run native Android applications within the glasses that, for example, allow them to stream video in real-time, which is very useful for many enterprise applications. We believe that a wide variety of commercial and industrial markets offer significant opportunities for our products due to increasing demand for instant data accessibility in mobile workplace environments and due to the benefit of hands-free mobile displays to enhance visual performance and worker productivity. Our Smart Glasses are being used for numerous applications including: remote camera viewfinder displays and wearable computer displays, viewing of wireless sensor data, quality assurance and assembly check list, providing hands-free access to manuals and other information and for on-site, in-the-field maintenance, warehouse pick and place, servicing, routine quality assurance inspection, real-time viewing of remote images, training and education. Further, Smart Glasses can be used to enhance vision for many people with visual impairments. We have built an eco-system of Value Added Resellers (VARs), established a growing number of system integrators and have garnered infrastructure support from leading mobile device management companies.
Consumer
We believe that the most significant driver of the longer term wearable display market is the growing consumer demand for mobile access to larger volumes of information and entertainment in smaller and wearable packages. We believe that there is an increasing demand for high-resolution, wearable displays to enjoy content such as videos, movies, entertainment, social media, and the Internet in mobile environments. This desire for mobility has resulted in the development of mobile video personal viewer products in three general categories: (i) immersive Video Eyewear headset-application platforms such as accessories for gaming, video viewing and VR computers; (ii) AR electronic viewers incorporated in products such as data glasses and personal viewers for cell phones; and (iii) smart glasses for enterprise.
We also believe that there is a need for wearable display devices for use with desktop or belt-worn computers, consoles, tablets and other gaming products. We believe that viewing mobile device gaming on smaller direct view screens is not a satisfactory experience for many consumers when compared to laptop computers and gaming consoles. Both VR and AR are difficult to implement using traditional desktop computer monitors and televisions but can be successfully implemented with appropriately equipped wearable displays. Many of our wearable display products can enable both AR and VR applications for the end user.
We also believe that there is a growing need for active smart phone users to be able to keep their phones in their pocket and at the same time allow location-aware content from the web merged with the real world. For example, while a user walks down the street, they could get directions and a Yelp score for the restaurant they are looking at; all within the view of their glasses. All of this can be achieved by leaving the phone in their pocket.
As we manufacture our waveguides and display engines in higher volumes at reduced costs and capitalize on our waveguide manufacturing technology, we believe that our products will be increasingly well-positioned to compete with other see-through optics and displays and cell phone size displays in the rapidly growing consumer market, particularly as demand expands for sophisticated mobile personal viewers offering higher resolution and better image quality for AR and Smart Glasses applications. We believe our waveguide and display engine technology addresses the critical performance parameters for next generation AR products, including higher brightness, sharper resolution, true see-through capabilities, compact size, lower power consumption and longer life.
AR for all Markets
We offer smart wearable display products that enable development and deployment of AR applications. AR Smart Glasses enable its wearer to see computer-generated information, graphics or images projected into the real-world environment or upon an object that the user is observing. Thus, whether in the warehouse, on the factory floor, or in-the-field, users while wearing the AR Smart Glasses may access a manual, tutorial, or image that is connected to the task at hand which will assist them in completing that task, while also viewing their current surroundings and nearby objects.
We anticipate AR applications will be employed in the following areas:
| · | Field service, warehousing, and maintenance; | |
| · | Quality assurance; | |
| · | Inspections in the field or on the plant floor; | |
| · | Task support for industrial, manufacturing and medical applications; | |
| · | Advanced navigation both for the enterprise and consumer markets; | |
| · | Social networking; | |
| · | Location and scene based entertainment and education applications; | |
| · | Cloud based AI services delivery; | |
| · | Mobile commerce and visual search applications; and | |
| · | Real time language translation. |
Additional possible applications of AR-enabled Smart Glasses for consumer use include hands-free alerts, messaging, location and context aware information and social interaction.
5
Products
We now produce and sell two main types of wearable display products: AR Smart Glasses for a variety of enterprise and commercial users and applications, including AR; and Video Viewing glasses, for on-the-go users as mobile displays for entertainment and gaming. Our products are available with varying features, including with and without integrated computer processors, and are offered as either monocular or binocular display systems. Our AR Smart Glasses have many of the capabilities of a smartphone such as cameras and computer processors that can allow applications to be run directly in the AR Smart Glasses, enabling cloud connected applications through a wireless link directly with the glasses. We believe we provide one of the broadest range of wearable display products for AR and Smart Glasses available in the market and that our products contain some of the most advanced electronics, ergonomics, and optics for their respective target markets and uses. Our products include:
Binocular Wearable Display Products
Our binocular wearable display products offered over the last 10 years have included several models with differing native resolutions, virtual screen sizes and various interface options before we standardized our current digital video interfaces. Our binocular wearable displays products contain two microdisplays (a separate display for each eye), typically mounted in a frame attached to eyeglass-style temples or stereo headphones. These products enable mobile and hands-free private viewing of video content on screens that simulate home theater-sized screens, all of which support 3D video applications. These products can be employed as mobile high-resolution displays with products such as smartphones with video output capability, laptop computers, tablet computers, portable DVD/Blu-Ray players, game consoles and personal digital media/video players. Our current model, the iWear Video Headphones, which was first released in December 2015 is being phased out and will be discontinued during 2018. Our focus is now on waveguide based AR products which can produce many of the same functions as iWear but in a more “eyeglass” framework.
Monocular Wearable Display Products
Monocular products, due to their single eye display, are best used for push notifications and “information snacking”. Typically, monocular products have smaller fields of view that result in less information display capability and no stereoscopic 3D or depth information.
In early 2014, we began selling our first monocular pair of Smart Glasses, the M100, which was designed for the enterprise, industrial, commercial and medical markets. The Vuzix M100 Smart Glasses are an Android-based wearable computer, enhanced with a wearable monocular display and onboard processor and wireless connectivity capabilities designed primarily for commercial, professional, and industrial users. Vuzix M100 Smart Glasses serve up the digital world “hands free”, offering access to information, data collection and more. The M100 provides enhancements to existing workflows and opens new opportunities in industrial, medical, retail, supply chain, remote help desk, and many more aspects of customers’ businesses. An integrated head tracking, GPS system, camera and speech recognition gives versatility to navigate and use the M100 in almost any working environment. Its pre-installed apps can be used to record and playback still pictures and video, track timed events, manage a user’s calendar, link to a phone and more.
At the January 2017 CES tradeshow, we introduced the second generation pre-production model of our monocular Smart Glasses product, the M300, with significantly improved ergonomics, ruggedness and technical features. The M300 is a ruggedized form designed specifically for enterprise and industrial use. The M300 entered volume production and became commercially available in spring 2017. The second model, the M3000 was honored at CES 2017 for its innovative design and engineering, and is our next-generation waveguide based AR Smart Glasses for the enterprise sector. The M3000 features improved display resolution and employs our advanced waveguide optics and Cobra II projector engine that allow see-through operation for more advanced AR applications. The M3000 uses many of the same components as the new M300 and we expect to begin commercial production of it by fall 2018. Both of these smart glasses can connect to the cloud to deliver digital content directly to and from the job site and connecting it “overlaid” onto the real world.
We introduced the Blade Smart Sunglasses as a monocular system at CES 2018. We believe the Vuzix Blade™ is the natural evolution of AR glasses providing the user with the wide range of features and capabilities in a natural glasses form factor that we believe people will want to wear. From basic text messaging and answering the phone to overlaying mapping directions, menus, weather, events, stocks, video conferencing, sports updates, social feeds, bio-metrics and more, right in front of the user, literally. The intuitive and feature packed Vuzix Blade OS allows the user to simply and intuitively navigate via simple swipes and taps, or leverage voice controls and external AI systems. This allows users to leave their phones in their pockets for most functions and adds the ability to connect the information being presented to the real world, including that from cloud based AI platforms such as Amazon Alexa. We believe the Blade Smart Glasses is the first natural step to replacing the smart phone with a ubiquitous wearable device for all.
While the Vuzix M300 smart glasses are the device of choice in many enterprise deployments, there is a sector of business, especially B2C, in which the form factor is a deterrent. Visual appearance and portability are crucial requirements when it comes to servicing retail customers in big box retail chains, supermarkets, restaurants, department stores, and other client facing work environments. The Vuzix Blade with its fashionable form factor and all-day wear-ability fills this gap. For the enterprise user, the Vuzix Blade will pair with the smart phone or connect directly to a Wi-Fi network, allowing for custom secure industrial applications. Although not as powerful as the stand alone Vuzix M300 smart glasses, we expect the Vuzix Blade to open new and organic growth opportunities within the enterprise space.
We are currently also developing a binocular AR Smart Glasses product with 3D and stereo cameras that we expect to introduce sometime in 2019. Future AR Smart Glasses versions will include increased resolutions and fields of view, more powerful computers and our thin waveguide see-through optics.
6
AR Products
AR wearable displays provide the user a live, direct or indirect, view of a physical, real-world environment whose elements are “augmented” by computer generated sensory input such as sound, video, graphics or GPS data. Such systems also contain head tracking technology, which enables the user to look around the environment being viewed by moving his or her head which in turn sends that information back to the computer which then adjusts the computer-generated AR image accordingly. AR wearable displays typically include built-in cameras that can be used to overlay images connected to the real world as well as measure and track gestures and the physical environment of the AR wearer.
Our AR Smart Glasses are an intelligent wearable computing system specifically designed to enable computing and connecting AR cloud/internet of things information and AI to the real world. The embedded cameras in our Smart Glasses are used for recording and/or seeing the real world. Input and control of our smart glasses consist of using the wirelessly connected smartphone, gesture sensor, speech recognition voice control, a series of built in sensors for head motion and in some cases gesture sensors. We are building an eco-system of developers around these smart glasses and anticipate that most of the software being developed can be used on future generations of our smart glasses. Cloud or internet-connected Smart Glasses applications are being created for manufacturing, medical, field maintenance and repair, training, gaming and social media uses for both our monocular and binocular Smart Glasses product lines.
Applications for Smart Glasses
VUZIX Basics™ is a new product line offering that we introduced in December 2017. Vuzix Basics are essential out-of-the-box applications optimized for use with the growing lineup of Vuzix AR Smart Glasses, including the Vuzix M300 industrial smart glasses and the Vuzix Blade. VUZIX Basics™ are standard applications, designed to be simple to get started, simple to use, and apps we believe can immediately provide the fundamental benefits of Smart Glasses to novice and expert users alike.
The first application in the platform, VUZIX Basics Video, provides remote telepresence capabilities, otherwise known as see-what-I-see video collaboration, enabling an operator, mechanic, field technician or consultant to communicate in a hands-free manner with a remote expert to drive “just in time” video support of a process or repair. VUZIX Basics Video enables clients to multiply their expert workforce, eliminate the high costs of travel, improve customer service levels and equipment operation and accelerate knowledge transfer and training. We believe the launch of VUZIX Basics Video addresses an underserved portion of the enterprise space by providing an affordable and standard solution for expert collaboration to companies worldwide. We are planning to develop several more VUZIX Basics applications around work instructions and plant floor operations. VUZIX Basics application are being offered on a subscription basis.
App Store for Smart Glasses
We also have an App Store on our websites where users can download and purchase Smart Glasses applications, including third party apps. We are fostering the development of an ecosystem of third party developers to offer applications and trials for their smart glasses apps, and many will be sold on an industry common revenue share model. The Vuzix third party developer community will be able leverage the open Android platform of the Vuzix M300 and the Vuzix Blade to bring new and creative ideas to life. Supported by Vuzix’ new App Store, developers can offer or sell their applications to all Vuzix Smart Glasses users, expanding into an ecosystem of AR applications for real world use today. The App store supports free, onetime fee, and paid subscription monetization models.
Waveguide Optics and Design Reference Kits
We selectively offer waveguide optics and related coupling optics combined with our compact Cobra II display engine to form a see-through display module. We sell our waveguide optic design reference kits to select qualified potential OEMs/ODMs, which include a Cobra II projector, waveguide optics and associated electronics, to help these customers evaluate our technologies and to assist their efforts to build and test new products incorporating our proprietary solutions.
We have shipped these customized modules to numerous customers, some of which may soon incorporate our products into their own commercial products. Our strategy for addressing the consumer mass market includes developing partnerships with both select consumer companies and select high volume production manufacturing companies.
Custom Solutions and Engineering Solutions
We have in the past provided fully integrated wearable display systems, including head mounted displays, human computer interface devices, near-eye display related engineering services and wearable computers to commercial, industrial and defense customers. As a result of the sale our defense division in June 2012, we no longer pursue general engineering services work with defense or security organizations.
In February 2017 we entered into a development agreement with Toshiba to create a customized Window-based USB-C Type C AR Smart Glasses offering for Toshiba, which is a derivative product of the Vuzix M300 Smart Glasses. Throughout 2017 our design teams created an entirely new Vuzix product for Toshiba. We have delivered hundreds of engineering and development units and have begun volume manufacturing for Toshiba to fulfill their initial orders under our 3-year supply agreement, which was previously announced by Vuzix in December 2017.
7
Product Development
We believe that continued introduction of new products in our target markets is essential to our growth. Our products tend to have two to three-year life cycles. We have assembled a group of highly skilled engineers who work internally as well as with external consultants and our customers to continue our product development efforts. Our primary development efforts are focused on waveguide optics (and their manufacture), projection engines, displays, low-power electronic designs, firmware and wearable software, and the design and ergonomics of wearable displays. Our display product development efforts are focused towards continually enhancing the resolution, performance and manufacturability of our display products. During 2017, 2016 and 2015, we invested $6,706,690, $6,947,878 and $3,595,437, respectively, on research and development activities. We expect to increase our research and development expenditures in the future and as our revenues grow. We have also acquired and licensed technologies developed by third parties and we may continue to do so in the future.
Technology
We believe that it is important to make substantial investments in research and development to maintain our competitive advantage. The development and procurement of intellectual property rights relating to our technologies is a key aspect of our business strategy. We believe that it is now technologically feasible to improve upon the weight, ergonomics, optical performance, see-through capabilities, luminance, power efficiency, compactness, field of view and resolution of the current generation of virtual displays and display components. “Early technology adopters” have been the majority of the purchasers of our consumer wearable display products to date and similarly within the enterprise customer base for our Smart Glasses. However, our near-eye virtual display technology has been gradually improving in performance and we believe is starting to meet the high expectations of both the enterprise and the consumer mass markets with respect to screen resolution, computer power, image size and ergonomics. We expect to continue to improve our products through our ongoing research and development and advancements made by our third-party suppliers of key components.
We also develop intellectual property through our ongoing performance under engineering service contracts. We intend to continue to pursue select development contracts for applications that enhance our waveguide optics and other display technology. Our policy is to retain our proprietary rights with respect to the principal commercial applications of our technology under any engineering services work we perform, whenever possible. However, in certain circumstances where the end finished product may be co-branded with the OEM, we may offer the OEM customer exclusivity, for a product or for a geography for a limited period, as we our doing with Toshiba Client Solutions, who received a 12 month product exclusivity for that particular smart glasses model, which is co-branded, subject to their purchase of minimum quantities.
We believe that the range of our proprietary technologies gives us a significant competitive advantage. Our technologies relate to advanced optics systems including passive and active see-through imaging waveguides; micro-projection display engines; high resolution scanning displays; motion tracking systems; and specialized software drivers and applications for video eyewear displays. We also have a portfolio of trade secrets and expertise in nano-imprinting using quartz mold substrates, nano structure embossing, and engineering tool sets for the design and manufacturing of diffractive waveguide optics.
We believe that display engines are also important for commercializing wearable displays. We have developed a proprietary micro digital light processing (DLP) based engine called the Cobra II and are working on laser modulated and LED engines designed specifically for our waveguide optics solutions. These next generation waveguides and display engines have allowed us to shrink the entire assembly to fit in the space available in a typical off-the-shelf pair of sports sunglasses. We anticipate launching several new waveguide based products in 2018 and beyond, with the first being our CES 2018 Innovation Award winning Blade Smart Glasses.
We entered into a technology license agreement with Nokia Corporation in August 2011 for their Exit Pupil Expanding (EPE) optics technology. This agreement was amended in October 2017 to allow us more flexibility with sub-licensing and preferable royalty terms. Under these agreements, we perform on-going research and development on the EPE optics and are expected to manufacture and bring to market components and products containing the licensed technology. In addition, we will provide Nokia with the ability to purchase products and components which incorporate the licensed technology. The EPE technology is an important foundation of our diffraction based waveguide optics technology.
In October 2017 we acquired certain IP and patent applications from the inventor/seller related to holographic optics and display engines for “image and wave field projection through a diffusive media”. This technology is still in active development with a goal of creating functional demonstrator models within 24 months.
Major technologies that we employ in our products include:
Microdisplay optics represent a significant cost of goods for both us and our competitors. This cost is a function of the physical size of the microdisplay and the cost of the supporting optics. Smaller microdisplays are less expensive to produce but they require larger and more sophisticated optics to make solutions that have no user adjustments, large fields of view and very low distortion specifications. Larger displays require less magnification and less complex optics, but these optics become very bulky and the displays are significantly more expensive to manufacture. To improve our wearable display’s fashion and ergonomics, we are developing thin and lightweight optics that can be integrated with very small microdisplays that we expect will closely match conventional eyewear frames in size and weight. These new optics and displays provide what we believe are significantly improved ergonomics compared to competing wearable display solutions.
8
See-Through Waveguides: We have developed a range of patents and patents pending around our see-through waveguides. We are developing passive, dynamic and diffractive optics based waveguides that are the basis for some of our future slim wearable display AR and smart glasses products. Our dynamic waveguides use index modulated liquid crystal material to switch beam steering gratings built in a thin glass window to scan an image into the user’s eye. We are also developing passive optical display engines that use the approximately 1.2 mm thick see-through blade of glass or plastic waveguide with an ultra-compact micro display engine to magnify and focus the light from a display into a user’s eye. The development goal with these waveguides is to create AR based wearable displays that will appear to others as practically indistinguishable from today’s conventional sunglasses by most every measure, including comfort, size, weight and ergonomics.
Custom Display Engines: We have patents and patents pending on modulated laser based display engines and IP around micro DLP display engines. Our Cobra II micro DLP engine is one of the smallest volume engines built around DLPs. We are also performing research and development work on laser engines to drive scanned images into holograms, with the goal of such systems to offer next generation waveguides capable of 100 plus degree fields of view. Both the display engine and waveguide optic combine into a single monolithic design that we believe will enable us to produce low cost, HD resolution displays in a form factor that will be integrated into frames similar in size to ordinary sunglasses. Our upcoming M3000 Smart Glasses and Blade Smart Glasses will both utilize the Cobra II DLP engine and latest waveguide optics.
Nanoimprinting: We continue to develop a portfolio of trade secrets and expertise in nanoimprinting used in our waveguide optics. We believe these technologies are essential to the production of our approximately 1.2 mm thick see-through lenses which we believe are the cornerstone to making fashionable eyeglass-styled Smart Glasses. We have developed technology for waveguide design and production including: tool design and creation; custom designed software for grating structures and layout; lithography processes; high index low shrinkage polymers and other materials; mold treatments, automation equipment and test/QA processes and procedures, to name a few.
System level Engineering: To design wearable display solutions that are the size of conventional eyeglasses requires an integrated approach. No single piece of technology can stand on its own. Vuzix engineering teams work together to integrate optics, electronics, displays, industrial design and more to solve some of the biggest challenges in the wearable display engineering chain. The level of integration between these disciplines is significant and has resulted in new intellectual properties for Vuzix that we believe set us ahead of the competition. All of these items need to be taken into account individually and as a whole to create designs that allow the technology to “disappear” in a pair of glasses.
Patents and other Intellectual Property
We have an intellectual property policy which has as its objectives: (i) the development of new intellectual property to further our intellectual property position in relation to personal display technology; and (ii) the maintenance and protection of our valuable trade secrets and know-how. We seek to further achieve these objectives through the education and training of our engineering staff and the adoption of appropriate systems, policies and procedures for the creation, identification and protection of intellectual property.
Our general practice is to file patent applications for our technology in the United States, Europe, Japan, and in additional countries, including Canada and China for inventions which we believe have the greatest potential. We file and prosecute our patent applications in pursuit of the most extensive fields of protection possible including, where appropriate, the application of the relevant technology to the broader display industry.
We believe that our intellectual property portfolio, coupled with our key supplier relationships and accumulated experience in the personal display field, gives us an advantage over potential competitors. We also believe our copyrights, trademarks, and patents are critical to our success, and we intend to maintain and protect these. We also rely on proprietary technology, trade secrets, and know-how which are not patented. To protect our rights in these areas, we require all employees and, where appropriate, contractors, consultants, advisors and collaborators, to enter into confidentiality, invention assignment and non-competition agreements.
Our technologies enable us to provide low-cost, small form factor, high-resolution wearable display products. To protect our technologies, we have developed a patent portfolio which currently consists of 63 issued U.S. and foreign patents and 46 pending U.S. and foreign patent applications. We are also currently preparing several invention disclosures for the purposes of submitting design and utility patent applications. Our U.S. and foreign patents expire on various dates from May 13, 2017 to July 6, 2041. In addition, in connection with our sale of our defense division in 2012, we received a worldwide, royalty free, assignable grant-back license to all the patents and other intellectual property sold for use in the manufacture and sale of products in the consumer markets.
In addition to our various patents, we have 6 registered U.S. trademarks and 41 trademark registrations worldwide.
Competitors and Competitive Advantage
The near-eye or personal display and mobile device industry in which we operate is highly competitive and evolving rapidly. We compete against both direct view display technology in smart phones and tablets and wearable display technology. We believe that the principal competitive factors in the personal display industry include image size, image quality, image resolution, power efficiency, manufacturing cost, weight and dimension, feature implementation, AR capabilities, ergonomics, style, hands free capabilities and, finally, the interactive capabilities of the overall display system.
9
Many of our competitors’ products for mobile use are based on direct view display systems in which the user views the display device, or screen, directly without magnification. These products have several disadvantages compared to near-eye virtual displays and our wearable display products. If the screens are large enough to read a full conventional internet page or HD video without external magnification or image zooming, the products must be large and bulky, such as laptops, tablets, personal computers. If the displays are small, such as those incorporated in smartphones and smart watches, the screens can be difficult to read when displaying higher resolution content. Despite the limitations of direct view personal displays, smartphones, smart watches and other wearables are being produced in ever increasing volumes by a number of manufacturers, including Google (Alphabet), Sony, Blackberry, Samsung Electronics Co., Ltd., LG Electronics, Apple Inc., Microsoft, Garmin, Fitbit, focused firms, and many others. The displays on the latest smart phone and tablets are larger and very high resolution and thanks to touch zoom-in capabilities and improved internet content formatting are proving effective as mobile direct view personal displays for a variety of applications, including many that were once considered applications where Video Eyewear was superior. We expect that these large and well-funded companies, as well as newer entrants into the marketplace, will make products that are competitive with ours based on improvements to their existing direct view display technologies or on new technologies. Examples of new display technology include foldable displays, e-ink, flexible OMLEDs, see-through LCD displays and laser scanners and projectors.
Aside from direct view displays, we also have competitors who produce near eye personal displays, or wearable displays. For the past decade most of these products were mainly low-resolution, bulky in size, poor ergonomically, costly, and heavy in their power requirements. Additionally, the introduction of smart phone holders in goggle-worn systems like the Samsung Gear VR, Google Daydream, and other manufacturers, provide yet another view for users to get a very large screen experience from a 5” to 6” smart phone screen, but using the phone this way causes it to lose most of its functionality as a smart phone.
Competition - Binocular Video Viewer Wearable Display Products
Vuzix competitors in the binocular wearable display space using microdisplays either include or have included Carl Zeiss, Seiko Epson (Epson), Sony, Avegant, Osterhout Design Group (ODG), and Fat Shark. Many of these firms have discontinued their efforts while others have introduced VR viewers themselves. We believe these competitive products have received limited customer acceptance due to their bulky and non-user-friendly designs as video viewers but have become more acceptable for immersive VR experiences. There are a number of smaller companies that have products that have competed using binocular display modules (BDM) produced by Kopin Corporation as an OEM. Other companies that have stated their intention to enter this market when their product development is complete with either finished products or components with optics and display engines are Lumus and Microvision Corporation.
As an alternative to microdisplay based head worn display systems, most manufacturers have moved to using larger display panels that are typically found in smart phones. A Facebook unit, Oculus has been shipping its large field of view VR goggle HMD called the Oculus Rift since 2016. HTC that same year introduced it higher-end VR system called the HTC Vive. Sony after dropping their HMZ video viewer product, released on October 2016 its PlayStation VR goggle system specifically for its PlayStation 4 game console. All three companies have announced new improved VR goggles systems for 2018 with improved performance and reduced pricing.
Additionally, numerous manufacturers now offer head worn goggle attachments for smart phones that are designed to be used for VR applications. These devices contain simple optics that allow the user to insert their smart phone into the device and view their phone screen very close to their eyes and can offer an inexpensive way for owners of compatible smart phones to experience virtual reality. These products are generally priced under $100 and include a wireless controller to allow the wearer to navigate and play VR games. We believe all these units are very bulky relative to the wearer’s head, offer limited, but improving resolution to each eye, and often have less than clear optical performance across their viewing area. While acceptable for VR games and 360 videos, they are less than satisfactory as a big-screen video viewer or computer display due to ‘screen-door’ and other optical distortions. We expect that, as the market grows and matures and as the technology becomes more refined, more companies may compete with us.
Another product incorporating recently developed technology is a handheld projector that utilizes micro-displays and optics to project digital images onto any nearby viewing surface, such as a wall. These devices are referred to as pocket projectors or pico projectors and are designed to overcome the limitations of the native small screen on smartphones and other mobile devices. Pico projectors use either liquid crystal on silicon displays (LCOS) or color lasers to create their image. We believe pico projectors have had higher unit sales to date than wearable display primarily because of their cost advantage and higher resolutions.
Competition – AR Glasses
In the AR markets, there are few competitors with most of this market currently pointed at the high-end and researcher markets. Companies either offering products or intending to do so in this area include the Microsoft Hololens, Meta, ODG, Sony, Epson, Atheer, Darqri, Magic Leap and CastAR. Today many of these products are fairly bulky and tethered to an external controller. Many are being sold as AR Smart Glasses and are currently targeted at enterprise and academic researchers. The most complete and functional systems today are Hololens and the ODG products and these systems cost of $2,000 - $3,500 per unit. Microsoft has indicated they are working on their next version of Hololens, expected in 2019.
10
Magic Leap, a well-funded startup has announced its intention to release developer versions of its Magic Leap One creator edition in late 2018 at an expected price of over $1500. Further, industry bloggers have speculated that companies such as Apple and Google may offer or support AR wearable display products in the future, but, to date, no specific product launch details have been officially announced.
Competition - Monocular Smart Glasses and Wearable Display Products
Although several companies produce monocular wearable displays, we believe that sales of their products to date have been limited. To date, the market opportunity for monocular products other than night vision products has been limited primarily to trial tests and smaller rollouts in enterprise markets rather than broad commercial volume purchases. Competitors in these markets have or include Liteye Systems, Inc., Lumus, Shimadzu Corporation, Sony, Kopin, Zebra Technologies (inclusive of business unit formerly part of Motorola), Creative Display Systems, Brother, Google, Garmin, BAE Systems, Six-15 Technologies, LLC (the purchaser of our defense division), Lenovo, Optinvent, Realwear, Rockwell and Collins, Inc.. Google’s wearable display device, named Google Glass, was a headset product with similar form and function to our M100 Smart Glasses. In 2015, Google stopped selling its first version of Glass and then launched a refreshed version called Glass Enterprise. Several Japanese electronics companies including Hitachi, Murata, Sony, Westunitis, and Olympus have or had announced monocular smart glass systems for industry. There are also several Chinese based companies that have been showing monocular smart glasses products, including Lenovo but their sales activities thus far have been somewhat limited and focused on Asia. We expect that we will encounter competition in the future from major consumer electronics companies and suppliers of imaging and information products for defense applications.
There is competition in all classes of products manufactured by us, including from divisions of large companies and many small companies. Our sales do not represent a significant share of the market for any class of products. The principal points of competition for these products include, among other factors: price, product performance, the availability of supporting applications, the experience and brand name of the particular company and history of its dealings in such products. We believe that our monocular products match or exceed the display products currently offered by our competitors.
Sales and Marketing
Sales
Our strategy is to sell our products and components both directly and through distributors and value added resellers (VARs) and on a select basis to OEMs. As a result, we have distinct strategies for the sales of our products.
In the Smart Glasses and AR markets, we are currently focused on the enterprise space and as such are building strategic marketing relationships with software firms to address and support enterprise customers. We are in parallel developing a VAR network with leading companies in various vertical markets from warehousing to field service to medical. As these VARs finish their value added software and services offerings, we expect them to roll out their finished solutions to their customer base. Some VARs, after qualification, are being designated a Vuzix Industrial Partner or VIP. Such VIP partners gain early access to our new Smart Glasses hardware, receive first access to the initial commercial shipments, and get access to co-marketing support, discounts and much more. We are also supporting select larger key accounts with our in-house direct sales team. For our smart glasses, we are also developing an ecosystem with application developers from around the world. We have introduced our own hosted application store where our Smart Glass customers can download and purchase applications and software developer kits. We have and continue to host developer “hackathon” events with partner companies like NTT docomo.
We currently sell our products internationally through resellers, online stores and various Vuzix operated web stores in Europe and Japan. Our international focus is currently on Japan and the EU. In Japan, we have a branch sales and service office in Tokyo, and a small warehouse outside of Tokyo. We employ two full-time staff in Japan. We have a wholly owned subsidiary, Vuzix (Europe) Limited, through which we conduct our business in the EU and Middle Eastern markets. Resellers in 50 countries placed orders with us during the last two years. We maintain a small European sales office in Oxford, England staffed by two sales consultants as well as a further sales consultant who is located in Spain. For customer support and warehousing, we have contracted with a third-party end user technical support firm and fulfillment center to service our customers in the EU.
We intend to primarily provide our waveguide and miniature display engine modules and optics components to select OEMs to incorporate into their branded products and sell through their own well-established distribution channels. An OEM/ODM design cycle typically requires between 6 and 18 months, depending on the uniqueness of the market, and the complexity of the end product. Because our waveguides and display engines are the main functional component that defines the imaging as well as look and feel of many of our potential OEM customers' end products, we intend to work closely with these customers to provide technical assistance throughout their product evaluation and any eventual integration process.
11
We believe that the technical nature of our potential OEM products such as waveguides and display projectors with microdisplays, demands close relationships with such customers. Our sales and marketing staff, assisted by our technical staff and senior management, visit prospective and existing customers worldwide on a regular basis. We believe these contacts are vital to the development of a close, long-term working relationship with our OEM customers, and in obtaining regular forecasts, market updates and information regarding technical and market trends. We also participate in industry specific trade shows and conferences.
Marketing
Our marketing and sales group in conjunction with external firms is responsible for product management, planning, advertising, marketing communications, and public relations. We have both internal and external public relations efforts in the U.S. and UK. We also employ marketing firms to help prepare brochures, packaging, tradeshow messaging and advertising campaigns, again focused on either the consumer or enterprise markets. Most of our products are currently sold under the Vuzix brand name. Toshiba’s AR100, based on our M300 Smart Glasses is our first co-branded product. We seek to have Vuzix become known as one of the premier suppliers of wearable display products for video viewing, smart and AR glasses. We plan to undertake specific marketing activities as needed, including, but not limited to:
| · | product reviews, case studies and promotions in trade publications; |
| · | case studies on successful enterprise uses of Smart Glasses and AR; |
| · | product and technology views for our website and social media; |
| · | enhancement and maintenance of our Website, Web Store and Social Media sites; |
| · | internet and web page advertising and targeted emails; |
| · | public relations; and |
| · | trade shows and event sponsorships. |
Consumer Marketing
We engage in select marketing efforts that are intended to drive customers to our products and to grow awareness of our AR Smart Glasses and wearable displays in general. Public relations and product videos are an important aspect of our marketing and we intend to continue to distribute samples of our products to key industry participants. We intend to focus our marketing efforts for the next 12 months on:
| · | distinguishing our AR Smart Glasses products from current competitors and by offering products with superior performance and advanced optics to those of our competitors; |
| · | working with third party software developers to support the unique capabilities of our new products; and |
| · | creating brand awareness with the press and general public of Vuzix and its products, with particular emphasis on our new forthcoming waveguide based products. |
Our wearable display products are currently primarily sold directly to consumers and at times through select specialty retailers and online retailers such as Amazon, and through third party North American distributors including D&H. Our monocular Smart Glasses are sold through valued added resellers, direct to end customers, and through our webstore. Our website, www.vuzix.com is an important part of our direct sales efforts.
Engineering Services and OEM Products
We primarily respond to sales inquiries for our engineering services programs and OEM component requests directly and usually in response to inbound inquiries. We do not typically offer “works for hire” services at Vuzix but rather offer our services to opportunities that could result in advancing our technology or end up in a long-term supply or OEM relationship. We believe we have established a solid reputation for quality, performance and innovation for wearable virtual display systems that will be attractive to many types of commercial users that want to leverage our services and products within their businesses. Our design and engineering staff are actively involved with customers during all phases of prototype design through production by providing engineering data, up-to-date product application notes, regular follow-up and technical assistance.
Post CES 2018 we have received an influx of inbound requests for engagement related to our proprietary waveguide optics and miniature display engines from some of the world’s largest consumer and mobile electronics firms. We are now engaged with a list of major consumer electronic companies that have started building and/or are currently evaluating hardware designs and product roadmaps which incorporate Vuzix’ waveguide optics technology. Our business strategy is to commercialize our waveguide and display engine technologies and products to permit select ODMs and OEMs to integrate and embed our technology and products in a way that best matches their unique capabilities and timeline for bringing their products to market.
12
Manufacturing
We purchase product components from our suppliers, engage third party contract manufacturing firms to perform electronic circuit board and cable assemblies, and have the final assembly of our products done primarily in China at our contract manufacturer there. In the past we have built products ourselves in our Rochester, New York based facility. We are experienced in the successful production of our products in moderate volumes. We expect to only perform, at most the final assembly of our new AR Smart Glasses products ourselves on a test or start-up basis before considering a move offshore, however we expect to manufacture all our waveguide optics at our West Henrietta, New York facility. We believe that using outsourced manufacturing enables greater scale and flexibility at lower costs than establishing our own manufacturing facilities. We evaluate our current contract manufacturers and component suppliers on an ongoing basis, including whether or not to utilize new or alternative contract manufacturers or component suppliers.
We currently purchase almost all of the microdisplays used in our products from Kopin, Texas Instruments and Omnivision. Our relationship with these microdisplay suppliers is generally on a purchase order basis and none have a contractual obligation to provide adequate supply or acceptable pricing to us on a long-term basis. We have operated this way successfully for over a decade with these suppliers. Our Cobra II display engine is based on our proprietary design and is exclusively manufactured for us by a firm in Asia and it incorporates a DLP engine from Texas Instruments. We expect to have a formal supply agreement in place soon. We generally procure our other non-microdisplay components and products from our vendors on a purchase order basis without any long-term commitments. Many of the raw materials used in our components are standard to the consumer electronics industry. We provide forecasts that allow our contract manufacturers to stock component parts and other materials and plan capacity. Our contract manufacturers procure raw materials in volumes consistent with our forecasts, manufacture and/or assemble the products and perform tests according to our specifications. In some cases we procure some specific components and either sell them or consign them to our contract manufacturers. Products are either shipped to our customers or shipped to our West Henrietta, New York headquarters to be inventoried as finished goods. We currently use several Asian manufacturing sources, where we have located some of our tooling.
While we do not manufacture our components, we own the tooling that is used to make our custom components. Some of our accessory products are sourced from third parties as finished goods. We typically have them print our Vuzix brand name on these products if they are co-branded. Such, third party products represented less than 5% of our sales in last three fiscal years.
Our manufacturing is not currently subject to seasonal variations, but in the future, depending on our customers' product mix, we may be affected by seasonal fluctuations which could affect working capital demands.
We work with a third-party fulfillment partner in the EU that deliver our products to customers in Europe, the Middle East, and Africa, which allows us to reduce order fulfillment time, reduce shipping costs, and improve inventory flexibility.
Backlog
There is a relatively short cycle between order and shipment of our sales. Most purchase orders we receive are subject to rescheduling or cancellation by the customer with no or limited penalties. In regards to sales of custom products and waveguides to our OEM customers, we believe that the backlog metric is of limited utility in predicting future sales because all these OEM customers operate on a ship-to-order basis. Therefore, we believe at this time that backlog information is not material to the understanding of our business.
Employees
As of March 16, 2018, we had 61 full-time employees in North America: 6 in sales and marketing, distribution, and customer service; 31 in research and development and engineering services support; 12 in manufacturing, operations and purchasing; 1 in quality assurance; 1 in investor relations; and 10 in accounting, management, IT, and administration. We also work with a group of sub-contractors, mainly for industrial and mechanical design assistance in the Rochester, New York area. To further our waveguide research development, we work with various commercial and academic researchers in the United States and Finland. In Japan, we have 2 full-time employees and in the Europe we have 2 full-time contractors in England and 1 in Spain to manage our European sales and marketing activities.
Information about Geographic Revenue
Information about geographic revenue is described in Note 17, “Geographic and Other Financial Information” in the notes to our consolidated financial statements.
History - Corporate
We were incorporated in Delaware in 1997 as VR Acquisition Corp. In 1997, we acquired substantially all of the assets of Forte Technologies, Inc. (Forte), which was engaged in the manufacture and sale of Virtual Reality headsets and the development of related technologies. Forte was originally owned and controlled by Kopin, our main current microdisplay supplier. Most of the technologies developed by Forte are now owned and used by us.
13
Reference in this report to “Vuzix”, the “Company”, “we,” “us,” “our” and similar words refer to Vuzix Corporation and its wholly-owned subsidiaries.
| Item 1A | Risk Factors |
An investment in our securities involves a high degree of risk. An investor should carefully consider the risks described below, together with all of the other information included in this annual report, before making an investment decision. Our business, financial condition or results of operations could suffer as a result of these risks. In that case, the market value of our securities could decline, and an investor may lose all or part of his or her investment.
Risks Related to Our Business
We have incurred net losses since our inception and may continue to incur losses.
We reported a net loss of $19,663,502 for the year ended December 31, 2017, we reported a net loss of $19,250,082 for the year ended December 31, 2016, and we reported a net loss of $13,427,478 for the year ended December 31, 2015. We have an accumulated deficit of $96,472,452 as of December 31, 2017 and had an accumulated deficit of $76,838,950 as of December 31, 2016.
We may not achieve or maintain profitability in the future. We will need to increase sales in order to achieve and maintain profitability. In addition, we expect that our expenses relating to product development and research, sales and marketing, as well as our general and administrative costs, may increase. If we do not soon achieve and maintain profitability, our financial condition will ultimately be materially and adversely affected and we would eventually be required to raise additional capital. We may not be able to raise any necessary capital on commercially reasonable terms or at all. If we fail to achieve or maintain profitability on a quarterly or annual basis within the timeframe expected by investors, the market price of our common stock may decline.
In preparing our consolidated financial statements, our management determined that our disclosure controls and procedures and internal controls over financial reporting were effective as of December 31, 2017 but were ineffective as of December 31, 2016 and 2015.
Our management is responsible for establishing and maintaining adequate internal control over our financial reporting, as defined in Rule 13a-15(f) under the Securities Exchange Act of 1934, as amended (the “Exchange Act”). As of December 31, 2017 our management has determined that our disclosure controls and procedures and internal control over financial reporting were effective. As of December 31, 2016, our management has determined that our disclosure controls and procedures and internal control over financial reporting, while extensively remediated in 2016, had not been in operation long enough to demonstrate the repeatability and sustainability of their effectiveness in all areas. Accordingly, management concluded that material weaknesses continued to exist as of December 31, 2016.
If other material weaknesses or significant deficiencies in our internal controls are discovered or occur, we may fail to meet our future reporting obligations on a timely basis, our consolidated financial statements may contain material misstatements, we could be required to restate our prior period financial results, our operating results may be harmed, and we may be subject to class action litigation. Any failure to address the ineffectiveness of our disclosure controls and procedures could also adversely affect the results of the periodic management evaluations regarding the effectiveness of our internal control over financial reporting and our disclosure controls and procedures that are required to be included in our annual report on Form 10-K. Internal control deficiencies and ineffective disclosure controls and procedures could also cause investors to lose confidence in our reported financial information. We can give no assurance yet that all the measures we have taken will, on a permanent and sustainable basis, remediate the material weaknesses in our disclosure controls and procedures or that any other material weaknesses or restatements of financial results will not arise in the future due to a failure to maintain adequate internal control over financial reporting or adequate disclosure controls and procedures or circumvention of these controls. In addition, those controls and procedures may not be adequate to prevent or identify irregularities or errors or to facilitate the fair presentation of our consolidated financial statements.
We operate in a highly competitive market and the size, resources and brand name of some of our competitors may allow them to compete more effectively than we can, which could result in a loss of our market share and a decrease in our revenue and profitability.
The market for head worn display devices, including AR and Smart Glasses, is highly competitive. Further, we expect competition to intensify in the future as existing competitors introduce new and more competitive offerings alongside their existing products, and as new market entrants introduce new products into our markets. We compete against established, well-known diversified consumer electronics manufacturers such as Samsung Electronics Co., Sony Corporation, LG Electronics (LGE), HTC, Lenovo, and large software and other products companies such as Google, Microsoft, Facebook and Snap. Many of our current competitors have substantial market share, diversified product lines, well-established supply and distribution systems, strong worldwide brand recognition and greater financial, marketing, research and development and other resources than we do. In addition, many of our existing and potential competitors enjoy substantial competitive advantages, such as:
14
| · | longer operating histories; |
| · | the capacity to leverage their sales efforts and marketing expenditures across a broader portfolio of products; |
| · | broader distribution and established relationships with channel partners; |
| · | access to larger established customer bases and known branding; |
| · | greater resources to fund research and development and to make acquisitions; |
| · | larger intellectual property portfolios; and |
| · | the ability to bundle competitive offerings with other products and services. |
Moreover, smartphones, tablets and new wearable devices with ever growing larger video display screens and computing power have significantly improved the mobile personal computing experience. In the future, the manufacturers of these devices, such as Apple Inc., Samsung, LGE, Fitbit, Google, Snap, Garmin, Facebook, Microsoft and others may design or develop products similar to ours. In addition to competition or potential competition from large, established companies, new companies may emerge and offer competitive products. Increased competition may result in pricing pressures and reduced profit margins and may impede our ability to increase the sales of our products, any of which could substantially harm our business and results of operations.
Our lack of long-term purchase orders and commitments from our customers may lead to a rapid decline in our sales.
All of our customers issue purchase orders solely at their own discretion, often shortly before the requested date of shipment. Our customers are generally able to cancel orders (without penalty) or delay the delivery of products on relatively short notice. In addition, our current customers may decide not to purchase products from us for any reason. If those customers do not continue to purchase our products, our sales volume could decline rapidly with little or no warning.
We cannot currently rely on long-term purchase orders or commitments to protect us from the negative financial effects of a decline in demand for our products. We typically plan our production and inventory levels based on internal forecasts of customer demand, which are highly unpredictable and can fluctuate substantially. Our OEM customers are required to give us rolling forecasts and issue non-cancellable purchase orders but they have options to reschedule or pay cancellation fees. The uncertainty of product orders makes it difficult for us to forecast our sales and allocate our resources in a manner consistent with our actual sales. Moreover, our expense levels and the amounts we invest in capital equipment and new product development costs are based in part on our expectations of future sales and, if our expectations regarding future sales are inaccurate, we may be unable to reduce costs in a timely manner to adjust for sales shortfalls. Furthermore, because we have historically often depended on a small number of customers for the majority of our sales, the ramifications of these risks is greater than if we had a greater number of customers. As a result of our lack of long-term purchase orders and purchase commitments, we may experience a rapid decline in our sales.
As a result of these and other factors, investors should not rely on our revenues and our operating results for any one quarter or year as an indication of our future revenues or operating results. If our quarterly revenues or results of operations fall below expectations of investors or public market analysts, the price of our common stock could fall substantially.
If we do not effectively maintain and further develop our sales channels for our products, including developing and supporting our retail sales channel, value added resellers (VARs) and distributors, our business could be harmed.
We depend upon effective sales channels to assist us in reaching the customers who are the ultimate purchasers of our Video Eyewear and Smart Glass products. In the United States, we primarily sell our products directly from our in-house sales team, our website, VARs and for our more consumer focused products through a mix of specialty retailers and online stores, some of which we reach certain U.S. markets through distributors. In international markets, we primarily sell directly to consumers, enterprises, VARs or occasionally through distributors who in turn sell to local retailers.
Our distributors and VARs generally offer products from several different manufacturers. Accordingly, we are at risk that these distributors and VARs may give higher priority to selling other companies’ products. If we were to lose the services of a distributor or VAR, we might need to find another in that area, and there can be no assurance of our ability to do so in a timely manner or on favorable terms. Further, our distributors can at times build inventories in anticipation of future sales, and if such sales do not occur as rapidly as they anticipate, our distributors will decrease the size of their future product orders. We are also subject to the risks of our distributors and VARs encountering financial difficulties, which could impede their effectiveness and also expose us to financial risk if they are unable to pay for the products they purchase from us. Any reduction in sales by our current distributors or VARs, loss of key distributors and VARs or decrease in revenue from our distributors and VARs could adversely affect our revenue, operating results and financial condition.
15
Our future growth and profitability may be adversely affected if our marketing initiatives are not effective in generating sufficient levels of brand awareness.
Our future growth and profitability from our consumer and enterprise products will depend in large part upon the effectiveness and efficiency of our marketing efforts, including our ability to:
| · | create awareness of our brand and products; |
| · | convert consumer awareness into actual product purchases; |
| · | effectively manage marketing costs (including creative and media) in order to maintain acceptable operating margins and return on marketing investment; |
| · | successfully offer to sell our products or license our technology to third party companies for sale under their own brand name as OEM partners; |
Our planned marketing expenditures may not result in increased total sales or generate sufficient levels of product and brand name awareness. We may not be able to manage our marketing expenditures on a cost-effective basis.
If we fail to accurately forecast seasonal demand for our consumer Video Eyewear products, our results of operations for the entire fiscal year may be materially adversely affected.
Historically, a high percentage of our consumer Video Eyewear product annual sales have been attributable to the winter holiday selling season. Like many manufacturers of consumer electronics products, we must make merchandising and inventory decisions for the winter holiday selling season well in advance of actual sales. Further compounding the difficulty of this forecasting are other fluctuations in demand for the consumer electronics products that work with our Video Eyewear products, often due to the same seasonal influences, as well as technological advances and new models which are often introduced later in the calendar year. Inaccurate projections of demand or deviations in the demand for our products may cause large fluctuations in our fourth quarter results and could have a material adverse effect on our results of operations for the entire fiscal year.
In contrast, a substantial portion of our expenses are personnel related and include salaries, stock-based compensation, benefits and research and development expenses, which are not seasonal in nature. Accordingly, in the event of revenue shortfalls, we are generally unable to mitigate the negative impact on our results from operations in the short term.
Our products require ongoing research and development and we may experience technical problems or delays, which could lead our business to fail.
Our research and development efforts remain subject to all of the risks associated with the development of new products based on emerging and innovative technologies, including, for example, unexpected technical problems or the possible insufficiency of funds for completing development of these products. If we experience technical problems or delays, further improvements in our products and the introduction of future products could be delayed, and we could incur significant additional expenses and our business may fail.
We depend on advances in technology by other companies and if those advances do not materialize, some of our anticipated new products could be delayed or cancelled.
We rely on and will continue to rely on technologies (including microdisplays) that are developed and produced by other companies. The commercial success of certain of our planned future products will depend in part on advances in these and other technologies by other companies. We may, from time to time, contract with and support companies developing key technologies in order to accelerate the development of them for our specific uses. Such activities might not result in useful technologies or components for us. We are attempting to mitigate this risk by exploring ways to develop our own microdisplay technologies using LED and laser scanning displays, but there can be no assurance that we will be successful in doing so.
If we fail to keep pace with changing technologies or are unable to anticipate customer preferences, our business and results of operations may be materially adversely affected.
Rapidly changing customer requirements, evolving technologies and industry standards characterize the consumer electronics, mobile devises, smart phone, and display industries. To achieve our goals, we need to enhance our existing products and develop and market new products that keep pace with continuing changes in industry standards, requirements and customer preferences.
Our success depends on our ability to identify and originate product trends as well as to anticipate and react to changing customer demands in a timely manner. If we are unable to introduce new products or novel technologies in a timely manner or our new products or technologies are not accepted by customers, our competitors may introduce more attractive products, which could hurt our competitive position. Our new products might not receive customer acceptance if customer preferences shift to other products, and our future success depends in part on our ability to anticipate and respond to these changes. Failure to anticipate and respond in a timely manner to changing customer preferences could lead to, among other things, lower revenue and excess inventory levels.
16
If microdisplay-based personal displays do not gain some reasonable level of acceptance in the market for mobile displays, our business strategy may fail.
The mobile display market is dominated by displays larger than one-inch, most of which are based on direct view liquid crystal display, or LCD and organic light emitting display, or OLED technology. A number of companies have made and continue to make substantial investments in, and are conducting research to improve characteristics of, small direct view LCDs. Many of the leading manufacturers of these larger direct view LCDs, including LG Electronics, Royal Philips Electronics, Samsung Electronics Co., Ltd., Sony Corporation, HiMax, Omnivision, Citizen, and Sharp Corporation, are large, established companies with global marketing capabilities, widespread brand recognition and extensive financial resources. Advances in direct view LCD and OLED technology or other technologies may overcome their current limitations and permit them to remain or become more attractive technologies for personal viewing applications, which could limit the potential market for our Video Eyewear technology and cause our business strategy to fail.
Another product incorporating recently developed technology is a handheld projector that utilizes microdisplays and optics to project digital images onto any nearby viewing surface, such as a wall. These devices are referred to as pocket projectors or Pico projectors and are designed to overcome the limitations of the native small screen on smartphones and other mobile devices. As a result, we view Pico projector as a competitive alternative to our mobile displays. Pico projectors use either liquid crystal on silicon displays (LCOS), digital light processing displays (DLP) or color lasers to create their image. To date, we believe Pico projectors have had higher unit sales than Video Eyewear primarily because of their cost advantage, which results from their requiring only a single display. Pico projectors have recently been incorporated into cellular phones in an effort to produce a shareable large screen that is easier to view.
Recently introduced head worn goggle attachments for smart phones, like the Samsung Gear VR, the Carl Zeiss VR One and the Google Cardboard can offer an inexpensive way for owners of compatible smart phones to experience virtual reality by taking advantage of the smart phone’s display. These systems require pre-formatted video content and simple optics, to allow the wearer to view the screens less than 1” for the wearer’s eyes.
It is difficult to assess or predict with any certainty the potential size, timing and viability of market opportunities for our microdisplay-based Video Eyewear products or their level of market acceptance. Market acceptance of Video Eyewear technology will depend, in part, upon consumer acceptance of near-to-eye displays and upon microdisplay technology providing benefits comparable to or greater than those provided by alternative direct view display technology at a competitive price. Video Eyewear products work best when used close to the eye, which may not be acceptable to consumers. Such acceptance may depend on the relative complexity, reliability, usefulness and cost-effectiveness of our near-eye display products compared to other display products available in the market or that may be developed by our competitors. In addition, our products are not designed for a shared experience amongst multiple viewers at the same time. Potential customers may be reluctant to adopt our Video Eyewear products because of concerns surrounding perceived risks relating to use and the fact that it is a new technology. If consumers fail to accept near-to-eye displays in the numbers we anticipate or as soon as we anticipate, the sales of our Video Eyewear products and our results of operations would be adversely affected and our business strategy may fail.
There are a number of competing providers of microdisplay-based personal display technology, including smart glasses, and we may fail to capture a substantial portion of the personal display market.
In addition to competing with direct view displays, we also compete with microdisplay-based personal display technologies that have been developed by other companies. Our primary personal display competitors include Carl Zeiss, Inc., Sony, Epson, Google, Brother International, 5DT Inc., eMagin Corporation, Facebook (Oculus VR), Avegant, Kopin Corporation, Lenovo, HTC, MicroVision, Inc., Lumus Ltd., Kaiser Electro Optics Inc., ODG, Toshiba, Razer, Garmin, Optinvent, HTC Value, LGE, and Accupix of Korea. Samsung since September 2014 has been shipping a head worn goggle frame, called the Gear VR which allow users to mount their smart phones inside it to create an Oculus content compatible immersive VR system. There are similar smart phone mounting and viewing systems now available from a variety of manufactures ranging from simple ones like the Google Cardboard and their latest Daydream smart phone holder, which can turn compatible android phones into a display device complete with an interactive controller for VR content. Numerous other start-up companies have announced their intentions to offer AR smart glass and VR products and developer kits in the near future. Further, industry blogs have speculated that companies such as Apple may offer or support VR and AR Video Eyewear products in the near future. Microsoft in 2015 introduced its Hololens project, a head worn AR smart glass helmet with transparent holographic optics. Another new company, Magic Leap says it is working on a head-mounted virtual display system for AR applications, which they intend to begin shipping in 2018.
The Gear VR, Zeiss VR One, and even Google Daydream and Cardboard utilize the wearer’s existing smart phone rather than microdisplays, which reduces the cost of these VR systems substantially, assuming the customer already owns the compatible smart phone. Such systems can be also be used for playing games and watching videos, making them a competitive and lower cost alternative to our iWear Video Eyewear products for big screen viewing on a smart phone. Most of our competitors have greater financial, marketing, distribution and technical resources than we do. Moreover, our competitors may succeed in developing new microdisplay-based personal display technologies and near-eye products that are more affordable or have more or more desirable features than our technology. If our products are unable to capture a reasonable portion of the personal display market, our business strategy may fail.
17
Our business and products are subject to government regulation and we may incur additional compliance costs or, if we fail to comply with applicable regulations, may incur fines or be forced to suspend or cease operations.
Our products must comply with certain requirements of the U.S. Federal Communications Commission (FCC) regulating electromagnetic radiation in order to be sold in the United States and with comparable requirements of the regulatory authorities of the European Union, or EU, Japan, China and other jurisdictions in order to be sold in those jurisdictions. Our AR smart glasses products include wireless radios and receivers which require additional emission testing. We are also subject to various environmental laws and governmental regulations related to toxic, volatile, and other hazardous chemicals used in the third party components incorporated into our products, including the Restriction of Certain Hazardous Substances Directive, or RoHS and the EU Waste Electrical and Electronic Equipment Directive, or the WEEE Directive, as well as the implementing legislation of the EU member states. This directive restricts the distribution of products within the EU that exceed very low maximum concentration amounts of certain substances, including lead. Similar laws and regulations have been passed or are pending in China, Japan, and numerous countries around the world and may be enacted in other regions, including in the United States, and we are, or may in the future be, subject to these laws and regulations.
We believe that all our current products comply with the regulations of the jurisdictions in which they are sold. From time to time, our products are subject to new domestic and international requirements. Compliance with regulations enacted in the future could substantially increase our cost of doing business or otherwise have a material adverse effect on our results of operations and our business. Any inability by us to comply with regulations in the future could result in the imposition of fines or in the suspension or cessation of our operations or sales in the applicable jurisdictions. Any such inability by us to comply with regulations may also result in our not being permitted, or limit our ability to ship our products, which would adversely affect our revenue and ability to achieve or maintain profitability.
Although we have policies and procedures in place requiring our contract manufacturers and major component suppliers to comply with the RoHS Directive requirements, we cannot provide assurance that our manufacturers and suppliers consistently comply with these requirements. In addition, if there are changes to these or other laws (or their interpretation) or if new similar laws are passed in other jurisdictions, we may be required to re-engineer our products to use components compatible with these regulations. This re-engineering and component substitution could result in additional costs to us or disrupt our operations or logistics.
The WEEE Directive requires electronic goods producers to be responsible for the collection, recycling and treatment of such products. Changes in interpretation of the directive may cause us to incur costs or have additional regulatory requirements to meet in the future in order to comply with this directive, or with any similar laws adopted in other jurisdictions. Our failure to comply with past, present and future similar laws could result in reduced sales of our products, substantial product inventory write-offs, reputational damage, penalties and other sanctions, which could harm our business and financial condition. We also expect that our products will be affected by new environmental laws and regulations on an ongoing basis. To date, our expenditures for environmental compliance have not had a material impact on our results of operations or cash flows and, although we cannot predict the future impact of such laws or regulations, they will likely result in additional costs and may increase penalties associated with violations or require us to change the content of our products or how they are manufactured, which could have a material adverse effect on our business and financial condition.
Our products may be subject to future health and safety regulations that could increase our development and production costs.
Products incorporating microdisplays and wearable computers could become subject to new health and safety regulations that would reduce our ability to commercialize these near-eye display products. Compliance with any such new regulations could increase our cost to develop and produce products using the microdisplay display engine and adversely affect our financial results.
Regulations related to conflict minerals may cause us to incur additional expenses and could limit the supply and increase the costs of certain materials used in the manufacturing of our products.
As a public company, we are subject to requirements under the Dodd-Frank Wall Street Reform and Consumer Protection Act of 2010, or the Dodd-Frank Act, that require us to determine, disclose and report whether or not our products contain conflict minerals. The implementation of these new requirements could adversely affect the sourcing, availability and pricing of the materials used in the manufacture of components used in our products. In addition, we have and will continue to incur additional costs to comply with the disclosure requirements, including costs related to conducting diligence procedures to determine the sources of conflict minerals that may be used or necessary to the production of our products and, if applicable, potential changes to products, processes or sources of supply as a consequence of such verification activities. We also may face reputational harm if we determine that certain of our products contain minerals not determined to be conflict free or if we are unable to alter our products, processes or sources of supply to avoid such materials.
Our products will likely experience declining unit prices and we may not be able to offset that decline with production cost decreases or higher unit sales.
In the markets in which we compete, prices of established consumer electronics display and mobile products tend to decline significantly over time or new enhanced versions are introduced frequently every 12 to 24 months. In order to maintain adequate product profit margins over the long term, we believe that we will need to continuously develop product enhancements and new technologies that will either slow price declines of our products or reduce the cost of producing and delivering our products. While we anticipate many opportunities to reduce production costs over time, we may not be able to reduce our component costs. We expect to attempt to offset the anticipated decrease in our average selling price by introducing new products, increasing our sales volumes or adjusting our product mix. If we fail to do so, our results of operations will be materially and adversely affected.
18
If we cannot obtain and maintain appropriate patent and other intellectual property rights protection for our technology, our business will suffer.
The value of our personal display, AR Smart Glasses and related technologies is dependent on our ability to secure and maintain appropriate patent and other intellectual property rights protection. We intend to continue to pursue additional patent protection for our new products and technology. Although we own many patents covering our technology that have already been issued, we may not be able to obtain additional patents for which we apply, our patents may be found invalid if challenged and our patents may not afford the degree of protection that we desire or require.
Any patent or trademark owned by us may be challenged and invalidated or circumvented. Patents may not issue from any of our pending or future patent applications. Any claims and issued patents or pending patent applications may not be broad or strong enough to adequately protect our business. Effective intellectual property protection may be unavailable or limited in certain foreign countries.
Unauthorized parties may attempt to copy or otherwise use aspects of our processes and products that we regard as proprietary. Policing unauthorized use of our proprietary information and technology is difficult and can be costly, and our efforts to do so may not prevent misappropriation of our technologies. We may become engaged in litigation to protect or enforce our patent and other intellectual property rights or in International Trade Commission proceedings to abate the importation of goods that would compete unfairly with our products and, if unsuccessful, these actions could result in the loss of patent or other intellectual property rights protection for the key technologies on which our business strategy depends.
We rely in part on unpatented proprietary technology, and others may independently develop the same or similar technology or otherwise obtain access to our unpatented technology. We require employees, consultants, financial advisors, suppliers and strategic partners to enter into confidentiality agreements, but these agreements may not provide sufficient protection for our trade secrets, know-how or other proprietary information
Our products could infringe on the intellectual property rights of others.
Companies in the consumer electronics, wireless communications, semiconductor and display industries steadfastly pursue and protect intellectual property rights. This has resulted in considerable and costly litigation to determine the validity of patents and claims by third parties of infringement of patents or other intellectual property rights. Our products could be found to infringe on the intellectual property rights of others. Other companies may hold or obtain patents or inventions or other proprietary rights in technology necessary for our business. Periodically, other companies inquire about our products and technology in their attempts to assess whether we violate their intellectual property rights. If we are forced to defend against infringement claims, we may face costly litigation, diversion of technical and management personnel, and product shipment delays, even if the allegations of infringement are unwarranted. If there is a successful claim of infringement against us and we are unable to develop non-infringing technology or license the infringed or similar technology on a timely basis, or if we are required to cease using one or more of our business or product names due to a successful trademark infringement claim against us, it could adversely affect our business.
Our intellectual property rights and proprietary rights may not adequately protect our products.
Our commercial success will depend substantially on our ability to obtain patents and other intellectual property rights and maintain adequate legal protection for our products in the United States and other countries. We will be able to protect our intellectual property from unauthorized use by third parties only to the extent that these assets are covered by valid and enforceable patents, trademarks, copyrights or other intellectual property rights, or are effectively maintained as trade secrets. As of the date of this filing, we have 63 issued U.S. and foreign patents and 46 pending U.S. and foreign patent applications. We apply for patents covering our products, services, technologies and designs, as we deem appropriate. We may fail to apply for patents on important products, services, technologies or designs in a timely fashion, or at all. We do not know whether any of our patent applications will result in the issuance of any patents. Even if patents are issued, they may not be sufficient to protect our products, services, technologies, or designs. Our existing and future patents may not be sufficiently broad to prevent others from developing competing products, services technologies, or designs. Intellectual property protection and patent rights outside of the United States are even less predictable. As a result, the validity and enforceability of patents cannot be predicted with certainty. Moreover, we cannot be certain whether:
| · | we were the first to conceive of or invent the inventions covered by each of our issued patents and pending patent applications; | |
| · | we were the first to reduce to practice inventions covered by each of our issued patents and pending patent applications; | |
| · | we were the first to file patent applications for these inventions; | |
| · | others will independently develop similar or alternative products, technologies, services or designs or duplicate any of our products, technologies, services or designs; | |
| · | any patents issued to us will provide us with any competitive advantages, or will be challenged by third parties; | |
| · | we will develop additional proprietary products, services, technologies or designs that are patentable; or | |
| · | the patents of others will have an adverse effect on our business. |
19
The patents we own or license and those that may be issued to us in the future may be challenged, invalidated, rendered unenforceable or circumvented, and the rights granted under any issued patents may not provide us with proprietary protection or competitive advantages. Moreover, third parties could practice our inventions in territories where we do not have patent protection or in territories where they could obtain a compulsory license to our technology where patented. Such third parties may then try to import products made using our inventions into the United States or other territories. We cannot ensure that any of our pending patent applications will result in issued patents, or even if issued, predict the breadth, validity and enforceability of the claims upheld in our and other companies’ patents.
We have registered and applied to register certain of our trademarks in several jurisdictions worldwide. In some jurisdictions where we have applied to register our trademarks, other applications or registrations exist for the same, similar or otherwise related products or services. If we are not successful in arguing that there is no likelihood of confusion between our marks and the marks that are the subject of the other applications or registrations owned by third parties, our applications may be denied, preventing us from obtaining trademark registrations and adequate protection for our marks in the relevant jurisdictions, which could impact our ability to build our brand identity and market our products and services in those jurisdictions. Whether or not our application is denied, third parties may claim that our trademarks infringe their rights. As a result, we could be forced to pay significant settlement costs or cease the use of these trademarks and associated elements of our brand in the United States or other jurisdictions.
Even in those jurisdictions where we are able to register our trademarks, competitors may adopt or apply to register similar trademarks to ours, may register domain names that mimic ours or incorporate our trademarks, or may purchase keywords that are identical or confusingly similar to our brand names as terms in Internet search engine advertising programs, which could impede our ability to build our brand identity and lead to confusion among potential customers of our products and services. If we are not successful in proving that we have prior rights in our marks and arguing that there is a likelihood of confusion between our marks and the marks of these third parties, our inability to prevent these third parties from use may negatively impact the strength, value and effectiveness of our brand names and our ability to market our products and prevent consumer confusion.
The laws of certain countries do not protect intellectual property and proprietary rights to the same extent as the laws of the United States and, therefore, in certain jurisdictions, we may be unable to protect our products, services, technologies and designs adequately against unauthorized third-party copying, infringement or use, which could adversely affect our competitive position. To protect or enforce our intellectual property rights, we may initiate proceedings or litigation against third parties. Such proceedings or litigation may be necessary to protect our trade secrets or know-how, products, technologies, designs, brands, reputation, likeness, authorship works or other intellectual property rights. Such proceedings or litigation also may be necessary to determine the enforceability, scope and validity of the proprietary rights of others. Any proceedings or lawsuits that we initiate could be expensive, take significant time and divert management’s attention from other business concerns. Additionally, we may provoke third parties to assert claims against us. These claims could invalidate or narrow the scope of our own intellectual property rights. We may not prevail in any proceedings or lawsuits that we initiate and the damages or other remedies awarded, if any, may be commercially valuable. The occurrence of any of these events may adversely affect our business, financial condition and operating results.
If we lose our rights under our third-party technology licenses, our operations could be adversely affected.
Our business depends in part on technology rights and software licensed from third parties. We could lose our exclusivity or other rights to use the technology under our licenses if we fail to comply with the terms and performance requirements of the licenses. In addition, certain licensors may terminate a license upon our breach and have the right to consent to sublicense arrangements. If we were to lose our rights under any of these licenses, or if we were unable to obtain required consents to future sublicenses, we could lose a competitive advantage in the market, and may even lose the ability to commercialize certain products or technologies completely. Either of these results could substantially decrease our revenues.
If our customers are not satisfied with our technical support, firmware or software updates on some of our products, they may choose not to purchase our products, either of which would adversely impact our business and operating results.
Our business relies, in part, on our customers’ satisfaction with the technical support and firmware software updates we provide to support our products. If we fail to provide technical support services that are responsive, satisfy our customers’ expectations and resolve issues that they encounter with our products, customers may choose not to purchase additional products and we may face brand and reputational harm, which could adversely affect our operating results.
We may be subject to product liability or warranty claims that could result in significant direct or indirect costs, or we could experience greater returns from our resellers and end customers than expected, which could harm our business and operating results.
We generally provide a one-year warranty on all of our consumer and enterprise products, except in the European Union, or EU, where we are required to provide a two-year warranty on our consumer targeted products. The occurrence of any material defects in our products could make us liable for damages and warranty claims in excess of our current warranty reserves. In addition, we could incur significant costs to correct any defects, warranty claims or other problems, including costs related to product recalls. Any negative publicity related to the perceived quality and safety of our products could affect our brand image, decrease retailer, distributor and customer demand, and adversely affect our operating results and financial condition. Also, while our warranty is limited to repairs and returns, warranty claims may result in litigation, the occurrence of which could adversely affect our business and operating results.
20
Our dependence on sales to VARs, resellers, and distributors increases the risks of managing our supply chain and may result in excess inventory or inventory shortages.
We expect the majority of our various reseller relationships for our Video Eyewear and Smart Glasses products and their accessories could involve them taking inventory positions and reselling to multiple customers. Under some typical distributor relationships, we would not recognize revenue until the distributors sell the product through to their end user customers and receive payment thereon; however, at this time we do not currently enter into these types of arrangements. Our distributor and VAR relationships may reduce our ability to forecast sales and increase risks to our business. Since our distributors and VARs would act as intermediaries between us and the end user customers or resellers, we would be required to rely on our distributors to accurately report inventory levels and production forecasts. This may require us to manage a more complex supply chain and monitor the financial condition and credit worthiness of our distributors and VARs and their major end user customers. Our failure to manage one or more of these risks could result in excess inventory or shortages that could adversely impact our operating results and financial condition.
Our operating results may be adversely impacted by worldwide political and economic uncertainties and specific conditions in the markets we address.
Any worsening of global economic and financial conditions could materially adversely affect (i) our ability to raise, or the cost of, needed capital, and (ii) demand for our current and future products. We cannot predict the timing, strength, or duration of any economic slowdown or subsequent economic recovery, worldwide, or in the display industry.
Our results of operations may suffer if we are not able to successfully manage our increasing exposure to foreign exchange rate risks.
A substantial majority of our sales and cost of components are denominated in U.S. dollars. As our business grows, both our sales and production costs may increasingly be denominated in other currencies. Where such sales or production costs are denominated in other currencies, they are converted to U.S. dollars for the purpose of calculating any sales or costs to us. Our sales may decrease as a result of any appreciation of the U.S. dollar against these other currencies.
The majority of our current expenditures are incurred in U.S. dollars and many of our components come from countries that currently peg their currency against the U.S. dollar. If the pegged exchange rates changes adversely or is allowed to float up, additional U.S. dollars will be required to fund our purchases of these components.
Although we do not currently enter into currency option contracts or engage in other hedging activities, we may do so in the future. There is no assurance that we will undertake any such hedging activities or that, if we do so, they will be successful in reducing the risks to us of our exposure to foreign currency fluctuations.
Due to our significant level of international operations, including the use of foreign contract manufactures, we are subject to international operational, financial, legal and political risks which could harm our operating results.
We purchase product components from our suppliers, engage third party contract manufacturing firms to perform electronic circuit board and cable assemblies. While in the past we have performed the final assembly of our products ourselves in our Rochester, New York facility, and we did so for the start of our M100 Smart Glasses production, our M300 Smart Glasses and iWear units are assembled in China. We expect to continue to have final assembly of most of our products performed externally; however, we intend to use our new West Henrietta, New York facility primarily for the production of waveguides and their related display engines. Some final assembly initial production runs of new products may also continue at our Henrietta plant. Accordingly, a substantial part of our operations, including manufacturing of certain components used in our products, are outside of the United States and many of our customers and suppliers have some or all of their operations in countries other than the United States. Risks associated with our doing business outside of the United States include:
| · | compliance burdens and costs with a wide variety of foreign laws and regulations, particularly labor, environmental and other laws and regulations that govern our operations in those countries; |
| · | legal uncertainties regarding foreign taxes, tariffs, border taxes, quotas, export controls, export licenses, import controls and other trade barriers; |
| · | economic instability and high levels of inflation in the countries of our suppliers and customers, particularly in the Asia-Pacific region, causing delays or reductions in orders for their products and therefore our sales; |
| · | political instability in the countries in which our suppliers operate, particularly in China, Korea and Taiwan; |
| · | changes or volatility in currency exchange rates; |
| · | difficulties in collecting accounts receivable and longer accounts receivable payment cycles; and |
| · | potentially adverse tax consequences. |
21
Any of these factors could harm our own, our suppliers’ and our customers’ international operations and businesses and impair our and/or their ability to continue expanding into international markets.
We could be adversely affected by violations of the U.S. Foreign Corrupt Practices Act, the U.K. Bribery Act or similar anti-bribery laws in other jurisdictions in which we operate.
The global nature of our business and the significance of our international revenue create various domestic and local regulatory challenges and subject us to risks associated with our international operations. We operate in areas of the world that experience corruption by government officials to some degree and, in certain circumstances, compliance with anti-bribery and anticorruption laws may conflict with local customs and practices. Our global operations require us to import and export to and from several countries, which geographically expands our compliance obligations. In addition, changes in such laws could result in increased regulatory requirements and compliance costs which could adversely affect our business, financial condition and results of operations.
The U.S. Foreign Corrupt Practices Act (FCPA) the U.K. Bribery Act 2010 (U.K. Bribery Act) and similar anti-bribery and anticorruption laws in other jurisdictions generally prohibit U.S.-based companies and their intermediaries from making improper payments to non-U.S. officials for the purpose of obtaining or retaining business, directing business to another, or securing an advantage. In addition, U.S. public companies are required to maintain records that accurately and fairly represent their transactions and have an adequate system of internal accounting controls. Under the FCPA, U.S. companies may be held liable for the corrupt actions taken by directors, officers, employees, agents, or other strategic or local partners or representatives. As such, if we or our intermediaries fail to comply with the requirements of the FCPA or similar legislation, governmental authorities in the United States and elsewhere could seek to impose substantial civil and/or criminal fines and penalties which could have a material adverse effect on our business, reputation, operating results and financial condition.
We are subject to governmental export and import controls and economic sanctions laws that could subject us to liability and impair our ability to compete in international markets.
The U.S. and various foreign governments have imposed controls, export license requirements and restrictions on the import or export of some technologies. Our products are subject to U.S. export controls, including the Commerce Department’s Export Administration Regulations and various economic and trade sanctions regulations established by the Treasury Department’s Office of Foreign Assets Controls, and exports of our products must be made in compliance with these laws. Furthermore, U.S. export control laws and economic sanctions prohibit the provision of products and services to countries, governments, and persons targeted by U.S. sanctions. Even though we take precautions to prevent our products from being provided to targets of U.S. sanctions, our products, including our firmware updates, could be provided to those targets or provided by our customers despite such precautions. Any such provision could have negative consequences, including government investigations, penalties and reputational harm. Our failure to obtain required import or export approval for our products could harm our international and domestic sales and adversely affect our revenue.
22
The SEC is conducting an informal inquiry relating to us.
On May 24, 2016, we received a letter from the SEC, dated May 19, 2016, notifying us that the SEC is conducting an informal inquiry relating to us, and requesting that we produce certain documents relating to our internal control over financial reporting. We have produced the requested documents and thus far have not received requests for additional information. If, in connection with this informal inquiry, the SEC determines to take action against us, our financial position could be adversely affected.
Any significant disruption to our ecommerce business could result in lost sales.
Our sales through our ecommerce channel have been growing. Sales through vuzix.com and our related EU, UK and Japanese web stores generally have higher profit margins than sales through resellers and distributors. Online sales are subject to a number of risks. System interruptions or delays could cause potential customers to fail to purchase our products and could harm our brand. The operation of our direct to consumer ecommerce business through vuzix.com depends on our ability to maintain the efficient and uninterrupted operation of online order-taking and fulfillment operations. Our ecommerce operations subject us to certain risks that could have an adverse effect on our operating results, including risks related to the computer systems that operate our website and related support systems, such as system failures, viruses, denial of services attacks, computer hackers and similar disruptions. If we are unable to continually add software and hardware, effectively upgrade our systems and network infrastructure and take other steps to improve the efficiency of our systems, system interruptions or delays could occur that adversely affect our operating results.
We utilize third party vendors for our customer-facing ecommerce technology, portions of our order management system and fulfillment internationally. We depend on our technology vendors to manage “up-time” of the front-end ecommerce store, manage the intake of our orders, and export orders for fulfillment. Any failure on the part of our third party ecommerce vendors or in our ability to transition third party services effectively could result in lost sales and harm our business.
Failure to adequately protect customer data could harm our brand and our reputation in the marketplace.
Changing regulations and laws governing the Internet, data privacy, data protection and ecommerce transactions (including taxation, pricing and electronic communications) could impede the growth of our ecommerce business, increase our cost of doing business and limit our ability to collect and use information collected from our customers. Further, new regulations limiting our ability to collect, use and disclose customer data, or imposing additional requirements with respect to the retention and security of customer data, could limit our marketing activities and could adversely affect our business and financial condition.
In connection with our ecommerce services, we process, store and transmit customer data. We also collect customer data through certain marketing activities. Failure to prevent or mitigate data loss or other security breaches, including breaches of our vendors’ technology and systems, could expose us or our customers to a risk of loss or misuse of such information, adversely affect our operating results, result in litigation or potential liability for us and otherwise harm our business. Further, we are subject to general business regulations and laws, as well as regulations and laws specifically governing the Internet, ecommerce and electronic devices and new interpretations of these laws, may adversely affect our ability to conduct our ecommerce business.
Cybersecurity risks could adversely affect our business and disrupt our operations.
The threats to network and data security are increasingly diverse and sophisticated. Despite our efforts and processes to prevent breaches, our devices, as well as our servers, computer systems, and those of third parties that we use in our operations are vulnerable to cybersecurity risks, including cyber-attacks such as viruses and worms, phishing attacks, denial-of-service attacks, physical or electronic break-ins, employee theft or misuse, and similar disruptions from unauthorized tampering with our servers and computer systems or those of third parties that we use in our operations, which could lead to interruptions, delays, loss of critical data, unauthorized access to user data, and loss of consumer confidence. In addition, we may be the target of email scams that attempt to acquire personal information or company assets. Despite our efforts to create security barriers to such threats, we may not be able to entirely mitigate these risks. Any cyber-attack that attempts to obtain our or our users’ data and assets, disrupt our service, or otherwise access our systems, or those of third parties we use, if successful, could adversely affect our business, operating results, and financial condition, be expensive to remedy, and damage our reputation. In addition, any such breaches may result in negative publicity, adversely affect our brand, decrease demand for our products and services, and adversely affect our operating results and financial condition.
We may lose the services of key management personnel and may not be able to attract and retain other necessary personnel.
Changes in our management could have an adverse effect on our business, and in particular while our staff is relatively small. We are dependent upon the active participation of several key management personnel, including Paul J. Travers, our President and Chief Executive Officer. Mr. Travers is critical to the strategic direction and overall management of our company as well as our research and development process. The loss of Mr. Travers could adversely affect our business, financial condition and operating results. We do not carry key person life insurance on any of our senior management or other key personnel other than our CEO. Our Executive Vice President and Chief Financial Officer, Grant Russell, a Canadian citizen, currently has his principal residence in Vancouver, Canada and a second residence in West Henrietta, New York. If he becomes unable to legally or efficiently travel to and work in the United States, his ability to perform some of his duties could be materially adversely affected.
We will need to hire and retain highly skilled technical personnel as employees and as independent contractors in order to develop our products. The competition for highly skilled technical, managerial and other personnel is at times intense. Our recruiting and retention success is substantially dependent on our ability to offer competitive salaries and benefits to our employees. We must compete with companies that possess greater financial and other resources than we do and that may be more attractive to potential employees and contractors. To be competitive, we may have to increase the compensation, bonuses, stock options and other fringe benefits we offer to employees in order to attract and retain such personnel. The costs of retaining or attracting new personnel may have a material adverse effect on our business and operating results. If we fail to attract and retain the technical and managerial personnel we need to be successful, our business, operating results and financial condition could be materially adversely affected.
23
Our failure to effectively manage growth could harm our business.
We intend to expand the number and types of products we sell. We will need to replace and regularly introduce on a timely basis new products and technologies, enhance existing products, and effectively stimulate customer demand for new products and upgraded versions of our existing products.
The replacement and expansion of our products places a significant strain on our management, operations and engineering resources. Specifically, the areas that are strained most by these activities include the following:
| · | New Product Launch: With the growth of our product portfolio, we will experience increased complexity in coordinating product development, manufacturing, and shipping. As this complexity increases, it places a strain on our ability to accurately coordinate the commercial launch of our products with adequate supply to meet anticipated customer demand and effectively market to stimulate demand and market acceptance. We have experienced delays in the past. If we are unable to scale and improve our product launch coordination, we could frustrate our customers and lose possible retail shelf space and product sales; |
| · | Existing Products Impacted by New Introductions: The introduction of new products or product enhancements may shorten the life cycle of our existing products, or replace sales of some of our current products, thereby offsetting the benefit of even a successful product introduction, and may cause customers to defer purchasing our existing products in anticipation of the new products and potentially lead to challenges in managing inventory of existing products. We may also provide price protection to some of our retailers as a result of our new product introductions. If we fail to effectively manage new product introductions, our revenue and profitability may be harmed; and |
| · | Forecasting, Planning and Supply Chain Logistics: With the growth of our product portfolio, we will experience increased complexity in forecasting customer demand, in planning for production, and in transportation and logistics management. If we are unable to scale and improve our forecasting, planning, production, and logistics management, we could frustrate our customers, lose product sales or accumulate excess inventory. |
Our facilities and information systems and those of our key suppliers could be damaged as a result of disasters or unpredictable events, which could have an adverse effect on our business operations.
We operate the majority of our business from one location in the West Henrietta, a suburb of the Rochester, New York area. We also rely on third party manufacturing plants in Asia and third party logistics, sales and marketing facilities in Japan and England, and in other parts of the world to provide key components of our products and services. If major disasters such as earthquakes, fires, floods, wars, terrorist attacks, computer viruses, transportation disasters or other events occur in any of these locations, or our information systems or communications network or those of any of our key component suppliers breaks down or operates improperly as a result of such events, our facilities or those of our key suppliers may be seriously damaged, and we may have to stop or delay production and shipment of our products. We may also incur expenses relating to such damages. If production or shipment of our products or components is stopped or delayed or if we incur any increased expenses as a result of damage to our facilities, our business, operating results and financial condition could be materially adversely affected.
Risks Related to Manufacturing
We do not manufacture our own microdisplays, one of the key components of our AR Smart Glasses and near-eye display products, and we may not be able to obtain the microdisplays we need.
We do not currently own or operate any manufacturing facilities for microdisplays, one of the key components in our products. Certain other components and services necessary for the manufacture of our products are available from only a limited number of sources, and other components and services are only available from a single source. We currently purchase almost all of the microdisplays used in our Smart Glasses products from Kopin or Texas Instruments. Our relationship with these companies generally is on a purchase order basis and neither firm has a contractual obligation to provide adequate supply or acceptable pricing to us on a long-term basis. Either firm could discontinue sourcing merchandise for us at any time. If one or both of these firms were to discontinue its relationships with us, or discontinue providing specific products to us, and we are unable to contract with a new supplier that can meet our requirements, or if they or such other supplier were to suffer a disruption in their production, we could experience disruption of our inventory flow, a decrease in sales and the possible need to redesign our products. Any such event could disrupt our operations and have an adverse effect on our business, financial condition and results of operations. Recently, several new LCOS and alternative OLED suppliers have begun offering microdisplays suitable for use in our products. These manufacturers include Syndiant, HiMax, eMagin, Silicon Microdisplay, Sony, Citizen and others. With new tooling and electronics, any one of these alternative displays could be incorporated into our products but our costs of production could be higher, they may offer less performance, and make our products too costly and less desirable.
If we lose access to components from a particular supplier, or experience a significant disruption in the supply of products and components from a current supplier, we may be unable to locate alternative suppliers of comparable quality at an acceptable price, or at all, and our business could be materially and adversely affected. In addition, if we experience a significant increase in demand for our products, our suppliers might not have the capacity or elect to meet our needs as they allocate components to other customers. Identifying a suitable supplier is an involved process that requires us to become satisfied with the supplier’s quality control, responsiveness and service, financial stability and labor and other ethical practices, and if we seek to source materials from new suppliers there can be no assurance that we could do so in a manner that does not disrupt the manufacture and sale of our products. Our reliance on a single or limited number of suppliers involves a number of additional risks, including risks related to:
24
| · | supplier capacity constraints; |
| · | price increases; |
| · | timely delivery; |
| · | component quality; |
| · | failure of a key supplier to remain in business and adjust to market conditions; |
| · | delays in, or the inability to execute on, a supplier roadmap for components and technologies; and |
| · | natural disasters, fire, acts of terrorism or other catastrophic events. |
Our inability to obtain sufficient quantities of high quality components or services on a timely basis could result in future manufacturing delays, increased costs and ultimately in reduced or delayed sales or lost orders which could materially and adversely affect our operating results.
We do not control our contract manufacturers or suppliers, or require them to comply with a formal code of conduct, and actions that they might take could harm our reputation and sales.
We do not control our contract manufacturers or suppliers, including their labor, environmental or other practices, or require them to comply with a formal code of conduct. Though we conduct periodic visits to some of our contract manufacturers and suppliers, these visits are not so frequent or thorough enough to detect non-compliance with applicable laws and good industry practices. A violation of labor, environmental or other laws by our contract manufacturers or suppliers, or a failure of these parties to follow ethical business practices, could lead to negative publicity and harm our reputation. In addition, we may choose to seek alternative manufacturers or suppliers if these violations or failures were to occur. Identifying and qualifying new manufacturers or suppliers can be time consuming and we might not be able to substitute suitable alternatives in a timely manner or at an acceptable cost. Other consumer products companies have faced significant criticism for the actions of their manufacturers and suppliers, and we could face such criticism ourselves. Any of these events could adversely affect our brand, harm our reputation, reduce demand for our products and harm our ability to meet demand if we need to identify alternative manufacturers or suppliers.
We depend on third parties to provide integrated circuit chip sets and other critical components for use in our products.
We do not manufacture the integrated circuit chip sets, optics, microdisplays, backlights, printed circuit boards or other electronic components which are used in our products. Instead, we purchase them from third party suppliers or rely on third party independent contractors for these integrated circuit chip sets and other critical components, some of which are customized or specially made for us. We also may use third parties to assemble all or portions of our products. Some of these third party contractors and suppliers are small companies with limited financial resources. If any of these third party contractors or suppliers were unable or unwilling to supply these integrated circuit chip sets or other critical components to us, we would be unable to manufacture and sell our products until a suitable replacement supplier could be found. We cannot assure investors that a replacement third party contractor or supplier could be found on reasonable terms or in a timely manner. Any interruption in our ability to manufacture and distribute our products could cause our display business to be unsuccessful.
The consumer electronics industry is subject to significant fluctuations in the availability of components. If we do not properly anticipate the need for critical components, we may be unable to meet the demands of our customers and end-users on a timely basis.
The availability of certain of the components that we require to produce our AR Smart Glasses and other near-eye display products may decrease. As the availability of components decreases, the cost of acquiring those components ordinarily increases. High growth product categories such as the consumer electronics and mobile phone markets have experienced chronic shortages of components during periods of exceptionally high demand. If we do not properly anticipate the need for or procure critical components, we may pay higher prices for those components, our gross margins may decrease and we may be unable to meet the demands of our customers and end-users, which could reduce our competitiveness, cause a decline in our market share and have a material adverse effect on our results of operations.
Unanticipated disruptions in our operations or slowdowns by our suppliers, distributors and shipping companies could adversely affect our ability to deliver our products and service our customers.
Our ability to provide high quality customer service, process and fulfill orders and manage inventory depends on the efficient, timely and uninterrupted performance of our manufacturing and distribution facilities and our management information systems and the facilities and systems of our third party suppliers, distributors and shipping companies.
25
Any material disruption or slowdown in the operation of our manufacturing and distribution facilities or our management information systems, or comparable disruptions or slowdowns suffered by our principal suppliers, distributors or shippers could cause delays in our ability to receive, process and fulfill customer orders and may cause orders to be canceled, lost or delivered late, goods to be returned or receipt of goods to be refused. If any of these events occur, our sales and operating results could be materially and adversely affected.
Risks Related to Our Common Stock
Additional stock offerings in the future may dilute then existing stockholders’ percentage ownership of our company.
Given our plans and expectations that we may need additional capital, we may need to issue additional shares of common stock or securities convertible or exercisable for shares of common stock, including convertible preferred stock, convertible notes, stock options or warrants. The issuance of additional securities in the future will dilute the percentage ownership of then existing stockholders.
The rights of holders of common stock may be impaired by the possible future issuance of additional preferred stock.
Our board of directors has the right, without approval of the holders of our common stock, to issue additional preferred stock with voting, dividend, conversion, liquidation and other rights which could adversely affect the voting power and equity interest of the holders of common stock, which could be issued with the right to more than one vote per share, and could be utilized as a method of discouraging, delaying or preventing a change of control. The possible negative impact on takeover attempts could adversely affect the price of our common stock. Although we have no present intention to issue any shares of preferred stock other than the Series A Preferred Stock currently outstanding or to create any additional series of preferred stock, we may issue these shares in the future.
We have not paid dividends in the past and do not expect to pay dividends in the future on our common stock.
We have never paid cash dividends on our common stock and do not anticipate paying cash dividends in the foreseeable future. The payment of dividends on our common stock will depend on earnings, financial condition, debt covenants in place, and other business and economic factors affecting us at such time as our board of directors may consider relevant. If we do not pay dividends, our common stock may be less valuable because a return on a stockholders’ investment will only occur if our stock price appreciates. In addition, the holder of our outstanding shares of Series A Preferred Stock is entitled to certain dividends prior to payments of dividends to holders of common stock.
If securities analysts do not publish research or publish inaccurate or unfavorable research about our business, our stock price and trading volume could decline.
The trading market for our common stock depends in part on the research and reports that securities or industry analysts publish about us or our business. If one or more of the analysts who cover us downgrade our stock or publish inaccurate or unfavorable research about our business, our stock price would likely decline. Securities analysts have only recently commenced research coverage on us. If one or more of these analysts cease coverage of our company or fail to publish reports on us regularly, demand for our stock could decrease, which might cause our stock price and trading volume to decline.
Our issuance of common stock upon conversion of convertible notes or preferred stock or exercise of warrants or options may depress the price of our common stock.
As of March 16, 2018, we have issued and outstanding 27,301,203 shares of common stock, 49,626 shares of Series A Preferred Stock convertible into 4,962,600 shares of common stock, warrants to purchase 2,369,912 shares of common stock, and options to purchase 1,510,244 shares of common stock. The issuance of shares of common stock upon conversion of preferred stock, or exercise of outstanding warrants or options could result in substantial dilution to our stockholders, which may have a negative effect on the price of our common stock.
The interests of the holder of our Series A Preferred Stock, which holds shares representing approximately 15% of the voting power of our stock and has the right to nominate and elect two directors, may conflict with the interests of our other stockholders.
On January 2, 2015, we entered into and closed a Series A Preferred Stock Purchase Agreement, pursuant to which we issued and sold to Intel Corporation (the “Series A Purchaser”) 49,626 shares of Series A Preferred Stock. Each share of Series A Preferred Stock is convertible into 100 shares of common stock and votes on an as-converted basis with the common stock. As of the date of this filing, the shares issuable upon conversion of the Series A Preferred Stock represent approximately 15% of the total voting power of our outstanding stock. The Series A Purchaser may vote these shares with respect to any matter submitted to stockholders for a vote. In addition, the Series A Purchaser is entitled to nominate and elect two additional directors to the Company’s Board of Directors (the “Board Election Right”), one of whom is required to qualify as an “independent” director, as that term is used in applicable exchange listing rules. The Series A Purchaser has not yet exercised the Board Election Right, but if it does so, the Series A Purchaser will have increased influence over matters considered by the Board of Directors. The Series A Purchaser may exercise its stockholder rights in a way that it believes is in its best interests, which may conflict with the interests of our other stockholders. Pursuant to a letter we received from the Series A Purchaser on November 10, 2016, the Series A Purchaser stated, among other things, that for the time being they would continue to refrain from designating any directors to the Vuzix board and would not exercise its board observer rights and that the Company should not provide them with any board materials or correspondence.
26
The Series A Purchaser has notified us that it no longer desires to pursue a strategic relationship with us.
The shares of common stock issuable upon conversion of the outstanding shares of Series A Preferred Stock currently represent approximately 15% of our outstanding common stock on an as-converted basis. On November 10, 2016, we received a letter from the Series A Purchaser stating that it had been evaluating its alternatives with respect to its significant investment in and strategic relationship with us and that it has concluded that it no longer desires to pursue a strategic relationship with us. While the Series A Purchaser stated it had high regard for the Company’s team and its technology, the technology did not fit into its strategic plans. Furthermore, the Series A Purchaser added that it wanted to work with us to undertake an orderly disposition of its stock, subject to pricing and other conditions, that would minimize disruption in the markets, although it has not made any final decisions regarding its stock or the timing of a disposition. Resale of such conversion shares by the Series A Purchaser may depress the price of our common stock.
Our stock price may be volatile in the future.
The trading price of our common stock has been subject to wide fluctuations in response to quarter-to-quarter variations in results of operations, announcements of technological innovations or new products by us or our competitors, general conditions in the wireless communications, semiconductor and display markets, changes in earnings estimates by analysts or other events or factors. In addition, the public stock markets recently have experienced extreme price and trading volatility. This volatility has significantly affected the market prices of securities of many technology companies for reasons frequently unrelated to the operating performance of the specific companies. These broad market fluctuations may adversely affect the market price of our common stock.
| Item 1B. | Unresolved Staff Comments |
None.
| Item 2. | Properties |
We lease approximately 29,000 square feet as our main facility at 25 Hendrix Road, West Henrietta, New York, 14586. This facility houses our office, R&D and manufacturing space under an operating lease for the facility that we began occupying in October 2015. The base rent contractual payment obligations under this operating lease is $396,961 per year. The lease has an original five-year term with an option by the Company to renew for two additional three-year terms at pre-agreed to lease rates. We believe that our Rochester facility is in good operating condition and currently adequately serves our needs; however, we expect to exercise our option to take another 9,000 square feet in our adjacent unit in August 2018.
In Oxford, England, we rent 400 square feet of office space at a cost of approximately $10,900 per year. We lease this location pursuant to a renewable two-year lease which is scheduled to expire on September 29, 2019.
In Tokyo, Japan, we rent 175 square feet of office space at a cost of approximately $25,000 per year. We lease this location pursuant to a renewable one-year lease which is scheduled to expire on March 1, 2018.
| Item 3. | Legal Proceedings |
We are not currently involved in any pending legal proceeding or litigation and we are not aware of any such proceedings contemplated by or against us.
| Item 4. | Mine Safety Disclosures |
Not applicable.
PART II
| Item 5. | Market for Registrant’s Common Equity, Related Stockholder Matters and Issuer Purchases of Equity Securities |
Market for our Common Stock
Our common stock is listed on the NASDAQ Capital Market under the symbol “VUZI”.
The following table sets forth, for the fiscal quarters indicated, the high and low sales prices for our common stock as quoted on NASDAQ.
27
| Vuzix Stock Prices | Low | High | ||||||
| Fiscal Quarters | ||||||||
| First 2017 | $ | 5.45 | $ | 7.55 | ||||
| Second 2017 | 5.28 | 6.60 | ||||||
| Third 2017 | 5.45 | 7.00 | ||||||
| Fourth 2017 | 4.60 | 6.95 | ||||||
| Vuzix Stock Prices | Low | High | ||||||
| Fiscal Quarters | ||||||||
| First 2016 | $ | 5.00 | $ | 7.81 | ||||
| Second 2016 | 4.32 | 7.55 | ||||||
| Third 2016 | 6.35 | 9.69 | ||||||
| Fourth 2016 | 5.85 | 8.75 | ||||||
Company Stock Performance
The following graph shows a five-year comparison of cumulative total shareholder return for the Company, the NASDAQ US Benchmark TR Index and the S&P 500 Information Technology index. The graph assumes $100 was invested in each of the Company’s common stock, the NASDAQ Composite Index and the S&P 500 Information Technology index on December 31, 2012. Data points on the graph are annual. Note that historical price performance is not necessarily indicative of future performance.
28
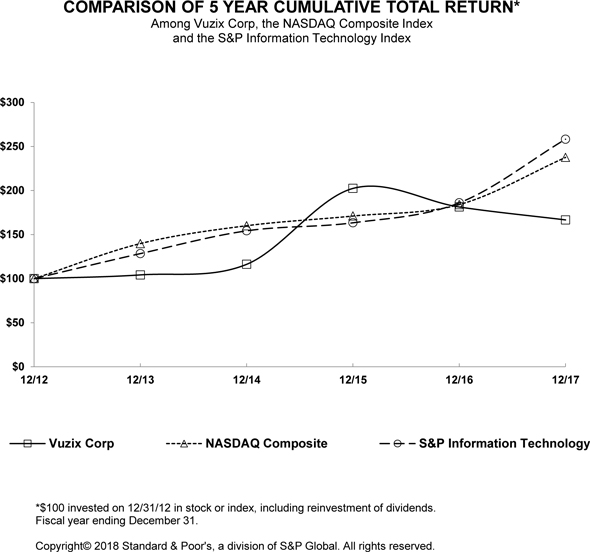
Holders of Record
As of March 16, 2018, there were 49 holders of record of our common stock.
Dividends
We have not historically and currently do not pay dividends on our outstanding common stock. The declaration of any future dividends and, if declared, the amount of any such dividends, will be subject to our actual future earnings, capital requirements, regulatory restrictions, debt covenants, other contractual restrictions and at the discretion of our Board of Directors. Our Board of Directors may take into account such matters as general business conditions, our financial condition and results of operations, our capital requirements, our prospects and such other factors as our Board of Directors may deem relevant.
Shares of Series A Preferred stock are entitled to receive dividends at a rate of 6% per year, compounded quarterly and payable in cash or in kind, at our discretion.
29
Issuer Purchases of Equity Securities
We did not purchase equity securities that are registered under Section 12 of the Exchange Act during the year ended December 31, 2017.
Unregistered Sales of Equity Securities and use of Proceeds
Sales of Unregistered Securities - None
Equity Compensation Plan Information
The following table provides information about our equity compensation plans as of December 31, 2017.
| Number of Securities to | Weighted Average | |||||||||||
| be Issued Upon Exercise | Exercise Price of | Number of Securities | ||||||||||
| of Outstanding Options, | Outstanding Options, | Remaining Available for | ||||||||||
| Plan Category | Warrants and Rights | Warrants and Rights | Future Issuance (1) | |||||||||
| Equity compensation plans approved by security holders | 1,510,244 | $ | 5.04 | 1,045,143 | ||||||||
| Equity compensation plans not approved by security holders | — | — | — | |||||||||
| Total | 1,510,244 | $ | 5.04 | 1,045,143 | ||||||||
| (1) | The amount appearing under “Number of securities remaining available for future issuance” includes shares available under our 2014 Equity Incentive Plan. The 2014 Plan has an “evergreen provision”, under which the maximum number of shares of common stock that may be issued under the 2014 Plan automatically increases each time the Company issues additional shares of common stock so that the total number of shares issuable thereunder at all times equals 10% of the then outstanding shares of common stock, unless in any case the Board of Directors adopts a resolution providing that the number of shares issuable under the 2014 Plan not be so increased. |
| Item 6. | Selected Financial Data |
We derived the selected consolidated statements of operations data for 2017, 2016 and 2015 and the selected consolidated balance sheet data as of December 31, 2017 and 2016 from our audited consolidated financial statements included elsewhere in this Annual Report on Form 10-K. The consolidated statements of operations data for 2014 and 2013, and the consolidated balance sheet data as of December 31, 2015 , 2014 and 2013 are derived from consolidated financial statements that are not included in this Annual Report on Form 10-K. Our historical results are not necessarily indicative of the results that may be expected in the future. You should read this data together with our “Management’s Discussion and Analysis of Financial Condition and Results of Operations” and the consolidated financial statements and related notes included elsewhere in this Annual Report on Form 10-K.
30
| For Years Ended December 31, | ||||||||||||||||||||
| 2017 | 2016 | 2015 | 2014 | 2013 | ||||||||||||||||
| Sales of Products | $ | 4,548,689 | $ | 1,987,878 | $ | 2,544,153 | $ | 2,474,559 | $ | 1,856,806 | ||||||||||
| Sales of Engineering Services | 989,064 | 139,500 | 205,831 | 557,517 | 532,247 | |||||||||||||||
| Total Sales | 5,537,753 | 2,127,378 | 2,749,984 | 3,032,076 | 2,389,053 | |||||||||||||||
| Cost of Sales — Products | 5,269,900 | 3,251,906 | 2,101,466 | 1,884,678 | 1,354,909 | |||||||||||||||
| Cost of Sales — Engineering Services | 944,451 | 39,060 | 82,332 | 217,233 | 227,186 | |||||||||||||||
| Total Cost of Sales | 6,214,351 | 3,290,966 | 2,183,798 | 2,101,911 | 1,582,095 | |||||||||||||||
| Gross Profit (Loss) (exclusive of depreciation shown separately below) | (676,598 | ) | (1,163,588 | ) | 566,186 | 930,165 | 806,958 | |||||||||||||
| Operating Expenses: | ||||||||||||||||||||
| Research and Development | 6,706,690 | 6,947,878 | 3,595,437 | 1,752,560 | 1,751,397 | |||||||||||||||
| Selling and Marketing | 3,694,913 | 3,394,580 | 1,798,041 | 1,232,520 | 1,091,514 | |||||||||||||||
| General and Administrative | 6,126,335 | 5,114,139 | 6,120,101 | 2,593,384 | 2,165,341 | |||||||||||||||
| Depreciation and Amortization | 998,528 | 770,668 | 380,841 | 279,317 | 377,840 | |||||||||||||||
| Loss on Inventory Valuation | 1,151,482 | 1,124,401 | — | — | — | |||||||||||||||
| Impairment of Patents and Trademarks | — | 20,506 | 13,222 | 104,716 | 73,423 | |||||||||||||||
| Total Operating Expenses | 18,677,948 | 17,372,172 | 11,907,642 | 5,962,497 | 5,459,515 | |||||||||||||||
| Loss from Operations | (19,354,546 | ) | (18,535,760 | ) | (11,341,456 | ) | (5,032,332 | ) | (4,652,557 | ) | ||||||||||
| Other Income (Expense) | (278,956 | ) | (714,322 | ) | (2,086,022 | ) | (2,836,526 | ) | (5,493,671 | ) | ||||||||||
| Loss Before Provision for Income Taxes | (19,633,502 | ) | (19,250,082 | ) | (13,427,478 | ) | (7,868,858 | ) | (10,146,228 | ) | ||||||||||
| Provision for Income Taxes | — | — | — | — | — | |||||||||||||||
| Net Loss | (19,633,502 | ) | (19,250,082 | ) | (13,427,478 | ) | (7,868,858 | ) | (10,146,228 | ) | ||||||||||
| Preferred Stock Dividends | (1,714,934 | ) | (1,620,048 | ) | (1,514,081 | ) | — | — | ||||||||||||
| Loss Attributable to Common Stockholders | $ | (21,348,436 | ) | $ | (20,870,130 | ) | $ | (14,941,559 | ) | $ | (7,868,858 | ) | $ | (10,146,228 | ) | |||||
| Basic and Diluted Loss per Share | $ | (1.02 | ) | $ | (1.23 | ) | $ | (0.97 | ) | $ | (0.75 | ) | $ | (1.69 | ) | |||||
| Weighted-average Shares Outstanding – Basic and Diluted | 21,013,907 | 16,908,544 | 15,408,724 | 10,476,971 | 5,988,595 | |||||||||||||||
| As of December 31, | ||||||||||||||||||||
| 2017 | 2016 | 2015 | 2014 | 2013 | ||||||||||||||||
| Consolidated Balance Sheet Data: | ||||||||||||||||||||
| Cash, cash equivalents, and marketable securities | $ | 14,889,636 | $ | 14,533,944 | $ | 11,877,058 | $ | 84,967 | $ | 310,140 | ||||||||||
| Working capital | 15,807,364 | 13,808,094 | 14,728,089 | (1,427,139 | ) | (1,981,232 | ) | |||||||||||||
| Total assets | 26,833,253 | 22,345,260 | 19,562,629 | 3,700,162 | 2,862,121 | |||||||||||||||
| Total long-term liabilities | 18,331 | 201,464 | 1,667,636 | 14,711,585 | 12,239,559 | |||||||||||||||
| Retained earnings (accumulated deficit) | (96,472,452 | ) | (76,838,950 | ) | (57,588,868 | ) | (44,161,390 | ) | (36,292,532 | ) | ||||||||||
| Total stockholders’ equity (deficit) | 21,379,713 | 17,721,837 | 16,092,871 | (14,398,011 | ) | (13,038,293 | ) | |||||||||||||
31
| Item 7. | Management’s Discussion and Analysis of Financial Condition and Results of Operations |
The following discussion and analysis of financial condition and results of operations should be read in conjunction with our financial statements and related notes appearing elsewhere in this annual report. In addition to historical information, the following discussion and analysis includes forward looking statements that involve risks, uncertainties and assumptions. Our actual results and the timing of events could differ materially from those anticipated in these forward looking statements as a result of a variety of factors, including those discussed in “Risk Factors” and elsewhere in this annual report. See the discussion under “Forward Looking Statements” beginning on page 1 of this annual report.
Overview
We are engaged in the design, manufacture, marketing and sale of wearable display devices also referred to as head mounted displays (or HMDs), in the form of AR glasses, Video Headphones and Smart Glasses. Our wearable display products are referred to as Video Eyewear, head mounted wearable displays, video glasses, personal viewers, near-eye virtual displays, and near-eye displays or NEDs. Our wearable display products provide virtual large high-resolution screens, fit in a user’s pocket or purse and can be viewed practically anywhere, anytime. Some of these models can also be used for AR and light virtual reality applications, in which the wearer is either immersed in a computer generated world or has their real world view augmented with computer generated information or graphics. We produce and sell two main types of wearable display products: Smart Glasses for a variety of enterprise and commercial users and applications, including AR; and Video Viewing glasses, for on-the-go users as mobile displays for entertainment and gaming, as well as support for stepping into virtual worlds, simulations, and gaming. Our products are available with varying features, including with and without applications running computer processors, and are offered as either monocular or binocular display systems.
With respect to our Smart Glasses and AR products we are focused on the enterprise, industrial, commercial, and medical markets while our Video Eyewear products are sold in the consumer markets and are targeted at applications including video viewing and gaming. All of the mobile display and mobile electronics markets in which we compete have been subject to rapid technological change over the last decade including the rapid adoption of tablets, larger screen sizes and display resolutions along with declining prices on mobile phones and other computing devices, and as a result we must continue to improve our products’ performance and lower our costs. We believe our intellectual property portfolio gives us a leadership position in microdisplay projection engines, waveguides, ergonomics, packaging, and optical systems.
Critical Accounting Policies and Significant Developments and Estimates
The discussion and analysis of our financial condition and results of operations are based on our consolidated financial statements and related notes appearing elsewhere in this annual report. The preparation of these statements in conformity with generally accepted accounting principles requires the appropriate application of certain accounting policies, many of which require us to make estimates and assumptions about future events and their impact on amounts reported in our consolidated financial statements, including the statement of operations, balance sheet, cash flow and related notes. We continually evaluate our estimates used in the preparation of our consolidated financial statements, including those related to revenue recognition, bad debts, inventories, warranty reserves, product warranty, carrying value of long-lived assets, derivatives, valuation of stock compensation awards, and income taxes. We base our estimates on historical experience and on various other assumptions that are believed to be reasonable under the circumstances, the results of which form the basis for making judgments about carrying values of assets and liabilities that are not apparent from other sources. Since future events and their impact cannot be determined with certainty, the actual results will likely differ from our estimates. Such differences could be material to the consolidated financial statements.
We believe that our application of accounting policies, and the estimates inherently required therein, are reasonable. We periodically reevaluate these accounting policies and estimates, and make adjustments when facts and circumstances dictate a change. Historically, we have found our application of accounting policies to be appropriate, and actual results have not differed materially from those determined using necessary estimates.
Our accounting policies are more fully described in the notes to our consolidated financial statements included in this annual report on Form 10-K. The critical accounting policies, judgments and estimates that we believe have the most significant effect on our financial statements are:
| · | Valuation of inventories; | |
| · | Carrying value of long-lived assets; |
32
| · | Software development costs; | |
| · | Revenue recognition; | |
| · | Product warranty; | |
| · | Derivatives and fair value measurements; | |
| · | Stock-based compensation; and | |
| · | Income taxes. |
Valuation of Inventories
Inventory is stated at the lower of cost or net realizable value, with cost determined on a weighted average first-in, first-out method. Inventory includes purchased parts and components, work in process and finished goods. Provisions for excess, obsolete or slow moving inventory are recorded after periodic evaluation of historical sales, current economic trends, forecasted sales, estimated product life cycles and estimated inventory levels. Purchasing practices, electronic component obsolescence, accuracy of sales and production forecasts, introduction of new products, product life cycles, product support and foreign regulations governing hazardous materials are the factors that contribute to inventory valuation risks. Exposure to inventory valuation risks is managed by maintaining safety stocks, minimum purchase lots, managing product and end-of-life issues brought on by aging components or new product introductions, and by utilizing certain inventory minimization strategies such as vendor-managed inventories. The accounting estimate related to valuation of inventories is considered a “critical accounting estimate” because it is susceptible to changes from period-to-period due to the requirement for management to make estimates relative to each of the underlying factors, ranging from purchasing to sales, production, and after-sale support. If actual demand, market conditions or product life cycles differ from estimates, inventory adjustments to lower market values would result in a reduction to the carrying value of inventory, an increase in inventory write-offs and a decrease to gross margins. The Company wrote down to net realizable value all of its component and finished goods inventory related to its iWear Video Headphones resulting from the decision in early 2017 to reduce the suggested retail selling price to a price below the cost. The write down provision totaled $1,124,401 and represents the estimated net realizable of such existing inventory, net of the costs of completion of components and work in progress. In the third quarter of 2017, an additional provision was recorded in the amount of $1,151,482. This provision has been included in Operating Expenses on the Consolidated Statements of Operations.
Carrying Value of Long-Lived Assets
If facts and circumstances indicate that a long-lived asset, including a products’ mold tooling and equipment, may be impaired, the carrying value is reviewed in accordance with FASB ASC Topic 360-10 Accounting for the Impairment or Disposal of Long-Lived Assets. If this review indicates that the carrying value of the asset will not be recovered as determined based on projected undiscounted cash flows related to the asset over its remaining life, the carrying value of the asset is reduced to its estimated fair value. Impairment losses are dependent on a number of factors such as general economic trends and major technology advances, and thus could be significantly different than historical results. No impairment charges on tooling and equipment were recorded in 2017, 2016 or 2015.
We perform a valuation of our patents and trademark assets when events or circumstances indicate their carrying amounts may be unrecoverable. There was no impairment charge recorded in 2017. We recorded an impairment charge of $20,506 representing cost of $44,371, less accumulated amortization of $23,865 in 2016, and an impairment charge of $13,222 representing cost of $21,954, less accumulated amortization of $8,732 in 2015 regarding our abandoned patents and trademarks. The value of the remaining intellectual property, such as patents and trademarks, were valued (net of accumulated amortization) at $535,461 as of December 31, 2016, because management believes that its value is recoverable.
Software Development Costs
The Company capitalizes the costs of obtaining and developing its software once technological feasibility has been determined by management. Such costs are accumulated and capitalized. These projects could take several years to complete. The capitalized costs are then amortized over 3 to 5 years on a straight-line basis. Unsuccessful or discontinued software projects are written off and expensed in the fiscal period where the application is abandoned or discontinued. The value of the unamortized software development costs remaining were valued (net of accumulated amortization) at $408,723 as of December 31, 2017, because management believes that its value is recoverable.
Revenue Recognition
We recognize revenue from product sales in accordance with FASB ASC Topic 605 Revenue Recognition. Product sales represent the majority of our revenue and there have been no material changes in or inflation in our product pricing over the past three fiscal years. We recognize revenue from these product sales when persuasive evidence of an arrangement exists, delivery has occurred or services have been provided, the sale price is fixed or determinable, and collectability is reasonably assured. Additionally, we sell our products on terms which transfer title and risk of loss at a specified location, typically shipping point. Accordingly, revenue recognition from product sales occurs when all factors are met, including transfer of title and risk of loss, which typically occurs upon shipment by us. If these conditions are not met, we will defer the revenue recognition until such time as these conditions have been satisfied. We collect and remit sales taxes in certain jurisdictions and report revenue net of any associated sales taxes. We also sell certain products through distributors who are granted limited rights of return for stock balancing against purchases made within a prior 90 day period, including downward price adjustments on any existing inventory. The provision for product returns and price adjustments is assessed for adequacy both at the time of sale and at each quarter end and is based on recent historical experience and known customer claims.
33
Revenue from any engineering consulting and other services is recognized at the time the services are rendered. For our longer-term development contracts, which to date have all been firm, fixed-priced contracts, we recognize revenue on the percentage-of-completion method. Under this method income is recognized as work on contracts progresses, but estimated losses on contracts in progress are charged to operations immediately. To date, all of our longer-term development contracts have been less than one calendar year in duration. We generally submit invoices for our work under these contracts on a monthly basis. The percentage-of-completion is determined using the cost-to-cost method.
We recognize software license revenue under ASC 985-605 Software Revenue Recognition and under ASC 605-25 Revenue Arrangements with Multiple Deliverables, and related interpretations, as amended. Licensed software may be sold as a stand-alone element, with other software elements, or in conjunction with hardware products. When our products consist of more than one element, the product is considered to be a multiple element arrangement (MEA). When sold as a stand-alone element, the revenue is recognized upon shipment as discussed above. When sold as part of a MEA, revenue from the licensed software is recognized when the product with its embedded software is shipped to the customer.
For either a single element transaction or a MEA, the Company allocates consideration to all deliverables based on their relative stand-alone selling prices. Amendments to ASC 605-25 establish a hierarchy to determine the stand-alone selling price as follows:
| · | Vendor Specific Objective Evidence of the fair value (VSOE); | |
| · | Third Party Evidence (TPE); and | |
| · | Best Estimate of the Selling Price (ESP) |
Sales which constitute a MEA are accounted for by determining if the elements can be accounted for as separate accounting units, and if so, by applying values to those units, per the hierarchy above. If VSOE is not available, management estimates the fair selling price using historical pricing for similar items, in conjunction with current pricing and discount policies.
Revenue from licensed software is recognized upon shipment and in accordance with industry-specific software recognition accounting guidance. Software updates that will be provided free of charge are evaluated on a case-by-case basis to determine whether they meet the definition of an upgrade and create a multiple element arrangement.
Fees charged to customers for post-contract Technical Support are recognized ratably over the term of the contract. Costs related to maintenance obligations are expensed as incurred.
Product Warranty
Warranty obligations are generally incurred in connection with the sale of our products. The warranty period for these products is generally one year except in European countries where it is two years. Warranty costs are accrued, to the extent that they are not recoverable from third party manufacturers, for the estimated cost to repair or replace products for the balance of the warranty periods. We provide for the costs of expected future warranty claims at the time of product shipment or over-builds to cover replacements. The adequacy of the provision is assessed at each quarter end and is based on historical experience of warranty claims and costs. The costs incurred to provide for these warranty obligations are estimated and recorded as an accrued liability at the time of sale. Future warranty costs are estimated based on historical performance rates and related costs to repair given products. The accounting estimate related to product warranty is considered a “critical accounting estimate” because judgment is exercised in determining future estimated warranty costs. Should actual performance rates or repair costs differ from estimates, revision to the estimated warranty liability would be required.
Derivatives and Fair Value Measurements
FASB ASC Topic 820 Fair Value Measurements and Disclosures (ASC 820) defines fair value, establishes a framework for measuring fair value in generally accepted accounting principles, and expands disclosures about fair value measurements. ASC 820 clarifies that fair value is an exit price, representing the amount that would be received to sell an asset or paid to transfer a liability in an orderly transaction between market participants. ASC 820 permits an entity to measure certain financial assets and financial liabilities at fair value with changes in fair value recognized in earnings each period. In accordance with ASC 815-10-25 Derivatives and Hedging we measured the derivative liability using a Monte Carlo Options Lattice pricing model at their issuance date and subsequently as they are remeasured. Accordingly, at the end of each quarterly reporting date, the derivative fair market value is remeasured and adjusted to current market value. Derivatives that have more than one year remaining in their life are shown as long term.
Significant unobservable inputs are used in the fair value measurement of the Company’s derivative liability. The primary input factors driving the economic or fair value of the derivatives warrants and convertible notes are the stock price of the Company’s shares, the price volatility of the shares, reset events, and exercise behavior. An important valuation input factor used in determining fair value was the expected volatility of observed share prices and the probability of projected resets in warrant exercise and note conversion prices from financing before each security’s maturity. For exercise behavior, the Company assumed that without a target price of 2 times the projected reset price or higher, the holders of the warrants and convertible notes would hold to maturity. In determining the fair value of the derivatives it was assumed that the Company’s business would be conducted as a going concern and that holding to maturity was reasonable. Further, the January 2, 2015 Series A Preferred financing reduced the expected probability to near zero for price resets from financing events.
34
ASC 820 establishes a fair value hierarchy which prioritizes the inputs to valuation techniques used to measure fair value. Level 1 inputs are quoted prices in active markets for identical assets or liabilities. Level 2 inputs are inputs other than quoted prices included in Level 1 that are directly or indirectly observable for the asset or liability. Such inputs include quoted prices in active markets for similar assets and liabilities, quoted prices for identical or similar assets or liabilities in markets that are not active, inputs other than quoted prices that are observable for the asset or liability, or inputs derived principally from or corroborated by observable market data by correlation or other means. Level 3 inputs are unobservable inputs based on our own assumptions used to measure assets and liabilities at fair value.
Stock Compensation Expense
Our Board of Directors approves grants of stock options to employees to purchase our common stock. Stock compensation expense is recorded based upon the estimated fair value of the stock option at the date of grant. The Company uses the Black-Scholes Merton option pricing model to estimate the fair value of stock options granted subsequent to the adoption of ASC Topic 718. The application of this pricing model involves assumptions that are judgmental and sensitive in the determination of compensation expense. The fair market value of our common stock on the date of each option grant is determined based on the most recent quoted sales price on our primary trading stock exchange, currently the NASDAQ Capital Market.
Income Taxes
We have historically incurred domestic operating losses from both a financial reporting and tax return standpoint. Accordingly, we provide deferred income tax assets and liabilities based on the estimated future tax effects of differences between the financial and tax bases of assets and liabilities based on currently enacted tax laws. Any future recorded value of our deferred tax assets will be dependent upon our ability to generate taxable income in the jurisdictions in which we operate. These assets consist primarily of credit carry-forwards and net operating loss carry-forwards and the future tax effects of temporary differences between balances recorded for financial statement purposes and for tax return purposes. A valuation allowance is established for deferred tax assets in amounts for which realization is not considered more likely than not to occur. The accounting estimate related to income taxes is considered a “critical accounting estimate” because judgment is exercised in estimating future taxable income, including prudent and feasible tax planning strategies, and in assessing the need for any valuation allowance. To date, we have determined a 100% valuation allowance is required and accordingly no deferred tax asset has been reflected in our consolidated financial statements. In the event that it should be determined that all or part of a deferred tax asset in the future is more likely than not to be realized, an adjustment (reduction) of the valuation allowance would increase income to be recognized in the period such determination was made.
In addition, the calculation of our deferred taxes involves dealing with uncertainties in the application of complex tax regulations. As a result we recognize liabilities for uncertain tax positions based on the two-step process prescribed within the interpretation. The first step is to evaluate the tax position for recognition by determining if the weight of available evidence indicates that it is more likely than not that the position will be sustained on audit, including resolution of related appeals or litigation processes, if any. The second step requires us to estimate and measure the tax benefit as the largest amount that is more than 50% likely of being realized upon ultimate settlement. It is inherently difficult and subjective to estimate such amounts, as this requires us to determine the probability of various possible outcomes. We re-evaluate these uncertain tax positions on a quarterly basis. This evaluation is based on factors including, but not limited to, changes in facts or circumstances, changes in tax law, effectively settled issues under audit and new audit activity. Such a change in recognition or measurement would result in the recognition of a tax benefit or an additional charge to the tax provision in the period. The Company currently has no uncertain tax positions.
Off Balance Sheet Arrangements
We do not have any off-balance sheet arrangements that have, or are reasonably likely to have, an effect on our financial condition, financial statements, revenues or expenses.
Recent Accounting Pronouncements
In July 2017, the FASB issued ASU 2017-11, Earnings Per Share (Topic 260), Distinguishing Liabilities from Equity (Topic 480), Derivatives and Hedging (Topic 815).This ASU requires that when determining whether certain financial instruments should be classified as liabilities or equity instruments, an entity should not consider the down round feature. The ASU also recharacterizes as a scope exception the indefinite deferral available to private companies with mandatorily redeemable financial instrument and certain noncontrolling interests, which does not have an accounting effect but addresses navigational concerns within the FASB Accounting Standards Codification. The provisions of the ASU related to down rounds are effective for public business entities for fiscal years, and interim periods within those fiscal years, beginning after December 15, 2018. We do not expect the implementation of this standard to have a material effect on our financial statements.
In May 2017, the Financial Accounting Standards Board (FASB) issued ASU 2017-09, Compensation - Stock Compensation (Topic 718): Scope of Modification Accounting, which provides guidance about which changes to the terms or conditions of a share-based payment award require an entity to apply modification accounting in Topic 718. The new standard is effective for annual reporting periods, including interim periods within those annual periods, beginning after December 15, 2017. Early adoption is permitted. We do not expect the adoption of ASU 2017-09 to have a material impact on our consolidated financial statements and related disclosures because we do not anticipate any changes to our share-based payment plans.
In November 2016, the Financial Accounting Standards Board (FASB) issued Accounting Standards Update 2016-18 (ASU 2016-18), Restricted Cash. The standard requires restricted cash and cash equivalents to be included with cash and cash equivalents on the statement of cash flows. The new standard is effective for fiscal years, and interim periods within those fiscal years, beginning after December 15, 2017, with early adoption permitted. The new guidance shall be applied using a retrospective approach. We do not expect the implementation of this standard to have a material effect on our financial statements.
35
In February 2016, the FASB issued Accounting Standards Update 2016-02 (ASU 2016-02), Leases (Topic 842). ASU 2016-02 requires lessees to recognize a right-of-use asset and lease liability in the balance sheet for all leases, including operating leases, with terms of more than twelve months. Recognition, measurement and presentation of expenses and cash flows from a lease by a lessee have not significantly changed from previous guidance. The amendments also require qualitative disclosures along with specific quantitative disclosures. The new guidance will be effective for fiscal years beginning after December 15, 2018, and interim periods within those years, with early adoption permitted. The amendments must be applied on a modified retrospective basis. We anticipate the adoption of this standard will have a material impact on our financial statements. While we are continuing to assess all the potential impacts of the standard, we currently believe the most significant impact relates to our accounting for our office lease. Under the new guidance, the net present value of the obligation for our office lease will appear on the balance sheet. Currently, it is classified as an operating lease and payments are expensed in the period incurred.
In May 2014, the FASB issued Accounting Standards Update No. 2014-09 (Topic 606) "Revenue from Contracts with Customers." Topic 606 supersedes the revenue recognition requirements in Topic 605 “Revenue Recognition” (Topic 605), and requires entities to recognize revenues when control of the promised goods or services is transferred to customers at an amount that reflects the consideration to which the entity expects to be entitled to in exchange for those goods or services. We adopted Topic 606 as of January 1, 2018 using the modified retrospective transition method. Results for reporting periods beginning after January 1, 2018 will be presented under Topic 606, while prior period amounts are not adjusted and continue to be reported in accordance with our historic accounting treatment under Topic 605. We recorded a net increase to opening retained earnings of less than $100,000, net of tax, as of January 1, 2018 due to the cumulative impact of adopting Topic 606, with the impact primarily related to our post contract support (PCS deferred revenue).
Recently Adopted Accounting Pronouncements
In March 2016, the FASB issued ASU No. 2016-09 Compensation - Stock Compensation (Topic 718): Improvements to Employee Share-Based Payment Accounting which amends the current stock compensation guidance. The amendments simplify the accounting for the taxes related to stock based compensation, including adjustments to how excess tax benefits and a company's payments for tax withholdings should be classified. Under this new guidance, entities must elect whether to account for forfeitures of share-based payments by (1) recognizing forfeitures of awards as they occur or (2) apply an estimated forfeiture rate, as is currently required. The standard is effective for fiscal periods beginning after December 15, 2016. We have adopted this standard for the year ended December 31, 2017 and have elected to account for forfeitures as they occur. The adoption of this standard did not have a material impact on our consolidated financial statements.
In November 2015, the FASB issued Accounting Standards Update (“ASU”) No. 2015-17, Income Taxes (Topic 740): Balance Sheet Classification of Deferred Taxes. ASU 2015-17 simplifies the presentation of deferred income taxes by requiring that deferred tax liabilities and assets be classified as noncurrent in a classified statement of financial position. The standard is effective for financial statements issued for annual periods beginning after December 15, 2016, and interim periods within those annual periods and may be applied either prospectively to all deferred tax liabilities and assets or retrospectively to all periods presented. We have adopted this standard for the year ended December 31, 2017 on a prospective basis; therefore, all deferred tax assets and liabilities have been classified as noncurrent in the accompanying Consolidated Balance Sheets. Noncurrent deferred tax assets and noncurrent deferred tax liabilities are included in other assets and other long-term liabilities, respectively, in the accompanying Consolidated Balance Sheets. As of December 31, 2017, the Company had a full valuation allowance against all net deferred tax assets, as such the adoption of this standard did not have a material impact on our consolidated financial statements.
There are no other recent accounting pronouncements that are expected to have a material impact on the consolidated financial statements.
Results of Operations for Fiscal Years Ended December 31, 2017 and December 31, 2016
The following table compares the Company’s consolidated statements of operations data for the years ended December 31, 2017 and 2016.
| Years Ended December 31, | ||||||||||||||||
| 2017 | 2016 | Dollar Change | % Increase (Decrease) | |||||||||||||
| Sales: | ||||||||||||||||
| Sales of Products | $ | 4,548,689 | $ | 1,987,878 | $ | 2,560,811 | 129 | % | ||||||||
| Sales of Engineering Services | 989,064 | 139,500 | 849,564 | 609 | % | |||||||||||
| Total Sales | 5,537,753 | 2,127,378 | 3,410,375 | 160 | % | |||||||||||
| Cost of Sales: | ||||||||||||||||
| Cost of Sales — Products | 5,269,900 | 3,251,906 | 2,017,994 | 62 | % | |||||||||||
| Cost of Sales — Engineering Services | 944,451 | 39,060 | 905,391 | 2,318 | % | |||||||||||
| Total Cost of Sales | 6,214,351 | 3,290,966 | 2,923,385 | 89 | % | |||||||||||
| Gross Profit (Loss) (exclusive of depreciation shown separately below) | (676,598 | ) | (1,163,588 | ) | 486,990 | 42 | % | |||||||||
| Gross Margin % | (12 | )% | (55 | )% | ||||||||||||
| Operating Expenses: | ||||||||||||||||
| Research and Development | 6,706,690 | 6,947,878 | (241,188 | ) | (3 | )% | ||||||||||
| Selling and Marketing | 3,694,913 | 3,394,580 | 300,333 | 9 | % | |||||||||||
| General and Administrative | 6,126,335 | 5,114,139 | 1,012,196 | 20 | % | |||||||||||
| Depreciation and Amortization | 998,528 | 770,668 | 227,860 | 30 | % | |||||||||||
| Loss on Inventory Revaluation | 1,151,482 | 1,124,401 | 27,081 | 2 | % | |||||||||||
| Impairment of Patents and Trademarks | - | 20,506 | (20,506 | ) | (100 | )% | ||||||||||
| Loss from Operations | (19,354,546 | ) | (18,535,760 | ) | (818,786 | ) | (4 | )% | ||||||||
| Other Income (Expense) | ||||||||||||||||
| Investment Income | 58,530 | 26,693 | 31,837 | 119 | % | |||||||||||
| Other Taxes | (28,363 | ) | (52,271 | ) | 23,908 | 46 | % | |||||||||
| Foreign Exchange Loss | (65,248 | ) | (33,079 | ) | (32,169 | ) | (97 | )% | ||||||||
| Gain (Loss) on Derivative Valuation | 20,204 | 34,744 | (14,540 | ) | (42 | )% | ||||||||||
| Loss on Fixed Asset Disposal | (585 | ) | (25,890 | ) | 25,305 | 98 | % | |||||||||
| Amortization of Senior Term Debt Discount | (155,760 | ) | (486,856 | ) | 331,096 | 68 | % | |||||||||
| Amortization of Deferred Financing Costs | (19,500 | ) | (46,574 | ) | 27,074 | 58 | % | |||||||||
| Interest Expense | (88,234 | ) | (131,089 | ) | 42,855 | 33 | % | |||||||||
| Total Other Income (Expense) | (278,956 | ) | (714,322 | ) | 435,366 | 61 | % | |||||||||
| Loss Before Provision for Income Taxes | (19,633,502 | ) | (19,250,082 | ) | (383,420 | ) | (2 | )% | ||||||||
| Provision for Income Taxes | — | —— | — | — | ||||||||||||
| Net Loss | $ | (19,633,502 | ) | $ | (19,250,082 | ) | $ | (383,420 | ) | (2 | )% | |||||
36
Sales. There was an overall increase in product sales for the year ended December 31, 2017 over the same period in 2016 of $3,410,375 or 160%. The following table reflects the major components of our sales:
| 2017 | % of Sales | 2016 | % of Sales | Dollar Change | % Increase (Decrease) | |||||||||||||||||||
| Sales of Smart Glasses | $ | 3,840,300 | 69 | % | $ | 1,433,729 | 67 | % | $ | 2,406,571 | 168 | % | ||||||||||||
| Sales of Video Eyewear | 296,752 | 5 | % | 395,053 | 19 | % | (98,301 | ) | (25 | )% | ||||||||||||||
| Sales of Waveguide Components | 351,056 | 6 | % | 109,754 | 5 | % | 241,302 | 220 | % | |||||||||||||||
| Sales Freight out | 60,581 | 1 | % | 49,342 | 2 | % | 11,239 | 23 | % | |||||||||||||||
| Sales of Engineering Services | 989,064 | 18 | % | 139,500 | 7 | % | 849,564 | 609 | % | |||||||||||||||
| Total Sales | $ | 5,537,753 | 100 | % | $ | 2,127,378 | 100 | % | $ | 3,410,375 | 160 | % | ||||||||||||
The 168% increase in Smart Glasses 2017 sales was primarily the result of the volume production release and commencement of sales of the M300 Smart Glasses. M300 sales increased 495% for the year ended December 31, 2017 as compared to the prior 2016 period when the M300 was just commencing its early developer only sales. Sales of our original M100 Smart Glasses, which represented 18% of 2017 Smart Glasses revenues, decreased by 24% in 2017 over the same 2016 period as customers moved over to the newer M300. Our iWear Video Headphones sales were down 25% for the year ended December 31, 2017 as compared to the same period in 2016. This overall revenue decrease was primarily the result of much lower selling prices for the year ended December 31, 2017 versus the same period in 2016. Sales of waveguide systems in the 2017 period were related to two new programs with tier-1 consumer electronics firms and others versus a smaller single program in the comparable 2016 period.
Sales of engineering services for the period increased to $989,064 from $139,500 in 2016, due to work on the Toshiba smart glasses development program that commenced in February 2017. The amount recorded for the year ended December 31, 2017, represents accrued billings recognized on a percentage-of-completion basis.
Cost of Sales and Gross Profit (Loss). Cost of product revenues and engineering services is comprised of materials, components, labor, warranty costs, freight costs, manufacturing overhead, software royalties, and the non-cash amortization of software development costs related to the production of our products and rendering engineering services. The following table reflects the components of our cost of goods sold for products:
37
| Component of Cost of Sales | Year Ended December 31, 2017 | As % Related Sales | Year Ended December 31, 2016 | As % of Related Sales | Dollar Change | |||||||||||||||
| Product Cost of Sales | $ | 3,152,729 | 69 | % | $ | 1,473,277 | 74 | % | $ | 1,679,452 | ||||||||||
| Freight Costs | 610,228 | 13 | % | 482,010 | 24 | % | 128,218 | |||||||||||||
| Manufacturing Overhead | 886,593 | 19 | % | 795,835 | 40 | % | 90,758 | |||||||||||||
| Warranty Costs | 283,402 | 6 | % | 80,395 | 4 | % | 203,007 | |||||||||||||
| Amortization of Software Costs | 214,837 | 5 | % | 286,450 | 14 | % | (71,613 | ) | ||||||||||||
| Software Royalties | 122,111 | 3 | % | 133,939 | 7 | % | (11,828 | ) | ||||||||||||
| Total Cost of Sales – Products | $ | 5,269,900 | 116 | % | $ | 3,251,906 | 164 | % | $ | 2,017,994 | ||||||||||
| Gross Profit (Loss) – Product Sales | $ | (721,211 | ) | (16 | )% | $ | (1,264,028 | ) | (64 | )% | $ | 542,817 | ||||||||
For the year ended December 31, 2017, we reported a reduced gross loss from product sales as compared to the prior year’s period. On a direct product cost of sales only basis, product direct costs were 69% of sales for the 2017 period versus 74% for the same year’s period in 2016. These product costs, while improved for 2017 as a percentage of sales, were negatively impacted by four main factors: (i) the near zero margin being earned on our written down iWear Video Headphones sales, which are now effectively being sold at their net realizable value, pursuant to our write-down at end of fiscal 2016 and again as of September 30, 2017; (ii) higher startup M300 manufacturing costs, a product not offered in the 2016 comparative period; (iii) an increase in the inventory obsolescence provisions related to our first M300 smart glasses production runs and the move from our contract manufacturer’s California site to their China facility; and (iv) the provision of additional obsolescence provisions resulting from cable and component quality issues, and lower initial production yields of the M300 and its accessories, some of which were deemed not saleable. Most of these factors occurred in the first 6 months of 2017. As a result, we have increased our provisions for possible future warranty costs to 8% versus 4% of products sales in the same period of 2016. Manufacturing Overhead costs rose as a result of additional staff in the area over the 2016 period. Freight costs rose in absolute dollar terms in 2017 versus the 2016 period, but decreased as a percentage of product sales to 13% from 24% in 2016.
Costs for engineering services accrued for the year ended December 31, 2017 represent direct project costs as well as the reclassification of internal research and development wage costs related to the Toshiba engineering program, plus accruals for the expected overall program’s completion costs as a percentage of accrued expenses. There was only one small project in the 2016 period, however we earned substantially more in gross profit in 2016 than we have earned on the larger Toshiba 2017 project.
Research and Development. Our research and development expenses consist primarily of compensation costs for personnel, related stock compensation expenses, third party services, purchase of research supplies and materials, and consulting fees related to research and development costs. Software development expenses prior to establishing technical feasibility before final development and ongoing maintenance that are not capitalized are included in research and development costs.
| 2017 | % of Sales | 2016 | % of Sales | Dollar Change | % Increase (Decrease) | |||||||||||||||||||
| Research and Development | $ | 6,706,690 | 121 | % | $ | 6,947,878 | 327 | % | $ | (241,188 | ) | (3 | )% | |||||||||||
Comparing research and development costs for the year ended December 31, 2017 versus the same period in 2016, there was a decrease in project development and research costs of $241,188 primarily related to the fact that the new M300 Smart Glasses entered into production in early 2017 as compared to 2016 when they were in active development; an overall net increase in 2017 salary, benefits and stock compensation expenses of $302,228, primarily the result of additional R&D staff versus the same period in 2016, and that was offset by a $743,489 reclassification of internal salary costs to cost of sales for engineering services related to the Toshiba engineering services project; and an increase of $840,824 in external research related to additional use of software contractors for the M300 and Blade Smart Glasses and consulting fees related to our optics and waveguide research.
Selling and Marketing. Selling and marketing costs consist of trade show costs, advertising, travel costs, sales staff compensation costs including stock compensation expense, consulting fees, PR agency fees, website costs and sales commissions paid to full-time staff and outside consultants.
| 2017 | % of Sales | 2016 | % of Sales | Dollar Change | % Increase (Decrease) | |||||||||||||||||||
| Selling and Marketing | $ | 3,694,913 | 67 | % | $ | 3,394,580 | 160 | % | $ | 300,333 | 9 | % | ||||||||||||
38
These costs increased overall due to the following factors: higher salary, commissions, benefits and stock compensation expenses related to new staff additions totaling $222,310 in North America; a net increase of $106,263 in advertising costs, consisting mainly of an increase of $386,150 in product sample costs, increased trade show costs of $18,899, less a decrease of $305,364 in marketing agency fees and reduced spending on product videos; a $40,770 increase in computer and software subscription expenses; and a $61,537 decrease in website maintenance and development costs.
General and Administrative. General and administrative costs include professional fees, investor relations (IR) costs including shares and warrants issued for IR services, salaries and related stock compensation, travel costs, office and rental costs.
| 2017 | % of Sales | 2016 | % of Sales | Dollar Change | % Increase (Decrease) | |||||||||||||||||||
| General and Administrative | $ | 6,126,335 | 111 | % | $ | 5,114,139 | 240 | % | $ | 1,012,196 | 20 | % | ||||||||||||
General and administrative costs were $6,126,335 for the year ended December 31, 2017 as compared to $5,114,139 for the year ended December 31, 2016, an increase of $1,012,196 or 20%. These costs were higher overall primarily because of: increased salary and stock compensation costs of $998,488 due to the hiring of new accounting and internal IR personnel and the Company’s new COO; an increase of $42,836 in hiring expenses for new accounting staff; an increase of $145,658 in board and stock compensation costs due an increase in the number of external board members from 3 to 4; a $39,725 increase in IT consulting fees; a $65,707 increase in auditor fees; a $63,366 increase in travel costs; a $26,961 increase in bad debt expense; and partially offset by reduced spending of $428,359 for IR and stockholder communications activities.
Depreciation and Amortization. Depreciation and amortization expense for the year ended December 31, 2017 was $998,528 as compared to $770,668 in the same period in 2016, an increase of $227,860. The increase in depreciation and amortization expense is due to new investments in depreciable assets over the last two years.
Loss on Inventory Revaluation. There was a loss on inventory revaluation for the year ended December 31, 2017 of $1,151,482 as compared to $1,124,401 in the same period in 2016. These write-downs are the result of management’s decision in early 2017 to reduce the suggested retail selling price of its iWear Video Eyewear inventory on hand and again in September 2017 to a price well below the product’s cost.
Other Income (Expense). Total other expense was $278,956 for the year ended December 31, 2017 compared to an expense of $714,322 in the same period in 2016, a reduction of $435,366. The overall decrease in these other expenses was primarily due to reduced costs of $358,170 for the amortization of senior term debt discounts and deferred financing costs for the 2017 period as compared to 2016 period, and a related reduction in interest expense of $42,855 and $31,837 in investment income. All of the senior term debt was converted to common stock prior to its maturity on June 3, 2017.
Provision for Income Taxes. There were no provisions for income taxes in 2017 or 2016.
39
Results of Operations for Fiscal Years Ended December 31, 2016 and December 31, 2015
The following table compares the Company’s consolidated statements of operations data for the years ended December 31, 2016 and 2015.
| Years Ended December 31, | ||||||||||||||||
| 2016 | 2015 | Dollar Change | % Increase (Decrease) | |||||||||||||
| Sales of Products | $ | 1,987,878 | $ | 2,544,153 | $ | (556,275 | ) | (22 | )% | |||||||
| Sales of Engineering Services | 139,500 | 205,831 | (66,331 | ) | (32 | )% | ||||||||||
| Total Sales | 2,127,378 | 2,749,984 | (622,606 | ) | (23 | )% | ||||||||||
| Cost of Sales — Products | 3,251,906 | 2,101,466 | 1,150,440 | 55 | % | |||||||||||
| Cost of Sales — Engineering Services | 39,060 | 82,332 | (43,272 | ) | (53 | )% | ||||||||||
| Total Cost of Sales | 3,290,966 | 2,183,798 | 1,107,168 | 51 | % | |||||||||||
| Gross Profit (Loss) (exclusive of depreciation shown separately below) | (1,163,588 | ) | 566,186 | (1,729,774 | ) | (306 | )% | |||||||||
| Gross Margin % | (55 | )% | 21 | % | (76 | )% | ||||||||||
| Operating Expenses: | ||||||||||||||||
| Research and Development | 6,947,878 | 3,595,437 | 3,352,441 | 93 | % | |||||||||||
| Selling and Marketing | 3,394,580 | 1,798,041 | 1,596,539 | 89 | % | |||||||||||
| General and Administrative | 5,114,139 | 6,120,101 | (1,005,962 | ) | (16 | )% | ||||||||||
| Depreciation and Amortization | 770,668 | 380,841 | 389,827 | 102 | % | |||||||||||
| Loss on Inventory Valuation | 1,124,401 | - | 1,124,401 | 100 | % | |||||||||||
| Impairment of Patents and Trademarks | 20,506 | 13,222 | 7,284 | 55 | % | |||||||||||
| Loss from Operations | (18,535,760 | ) | (11,341,456 | ) | (7,194,304 | ) | 63 | % | ||||||||
| Other Income (Expense) | ||||||||||||||||
| Other Taxes | (52,271 | ) | (54,432 | ) | 2,161 | (4 | )% | |||||||||
| Foreign Exchange Loss | (33,079 | ) | (277 | ) | (32,802 | ) | (100 | )% | ||||||||
| Loss on Asset Disposal | (25,890 | ) | — | (25,890 | ) | (100 | )% | |||||||||
| Interest Income and Gain on Debt Conversions and Extinguishment | 26,693 | 20,790 | 5,903 | 28 | % | |||||||||||
| Gain (Loss) on Derivative Valuation | 34,744 | (1,098,465 | ) | 1,133,209 | 103 | % | ||||||||||
| Amortization of Senior Term Debt Discount | (486,856 | ) | (751,968 | ) | 265,112 | (35 | )% | |||||||||
| Amortization of Deferred Financing Costs | (46,574 | ) | (46,447 | ) | (127 | ) | 0 | % | ||||||||
| Interest Expense | (131,089 | ) | (155,223 | ) | 24,134 | (16 | )% | |||||||||
| Total Other Income (Expense) | (714,322 | ) | (2,086,022 | ) | 1,371,700 | (66 | )% | |||||||||
| Loss Before Provision for Income Taxes | (19,250,082 | ) | (13,427,478 | ) | (5,822,604 | ) | 43 | % | ||||||||
| Provision for Income Taxes | — | — | — | — | ||||||||||||
| Net Loss | $ | (19,250,082 | ) | $ | (13,427,478 | ) | $ | (5,822,604 | ) | 43 | % | |||||
40
Sales. There was an overall decrease in sales for the year ended December 31, 2016 over the same period in 2015 of $622,606 or 23%. The following table reflects the major components of our sales:
| 2016 | % of Sales | 2015 | % of Sales | Dollar Change | % Increase (Decrease) | |||||||||||||||||||
| Sales of Smart Glasses | $ | 1,433,729 | 68 | % | $ | 1,912,960 | 70 | % | $ | (479,231 | ) | (25 | )% | |||||||||||
| Sales of Video Eyewear | 395,052 | 18 | % | 211,257 | 8 | % | 183,795 | 87 | % | |||||||||||||||
| Sales of Waveguide Components | 109,754 | 5 | % | 385,385 | 14 | % | (275,631 | ) | (72 | )% | ||||||||||||||
| Sales Freight out | 49,343 | 2 | % | 34,551 | 1 | % | 14,792 | 43 | % | |||||||||||||||
| Sales of Engineering Services | 139,500 | 7 | % | 205,831 | 7 | % | (66,331 | ) | (32 | )% | ||||||||||||||
| Total Sales | $ | 2,127,378 | 100 | % | $ | 2,749,984 | 100 | % | $ | (622,606 | ) | (23 | )% | |||||||||||
The decrease in Smart Glasses was primarily the result of a 25% decrease in sales of the M100 Smart Glasses. After the announcement of the new M300 at CES in January 2016, many customers delayed further purchases of our Smart Glasses until we commenced shipping the M300 Smart Glasses. Pre-orders for the new M300, including migration packages, are included primarily as deferred revenues and will not be recognized as revenues until those orders shipped to the customer. Our iWear Video Headphones sales were 18% of product revenues for the year ended December 31, 2016 versus nil in the same period in 2015 when it was not yet available. Revenues from this product line were constrained throughout most of 2016 due to production difficulties. For the 2015 comparative period, approximately 8% of revenues came from the Wrap AR series of Video Eyewear products which was discontinued in the summer of 2015, whereas no such product revenues were reported in the 2016 period. Sales of waveguide related components were 5% of total sales versus 14% in the prior period, partially due to customers awaiting shipments of the next generation of waveguides.
Cost of Sales and Gross Profit (Loss). Cost of product revenues and engineering services is comprised of materials, components, labor, warranty costs, freight costs, manufacturing overhead, software royalties, and the non-cash amortization of software development costs related to the production of our products and rendering engineering services. The following table reflects the components of our cost of goods sold for products:
| Component of Cost of Sales | Year Ended December 31, 2016 | As % Related Sales | Year Ended December 31, 2015 | As % of Related Sales | Dollar Change | |||||||||||||||
| Product Cost of Sales | $ | 1,473,277 | 74 | % | $ | 917,620 | 36 | % | $ | 555,657 | ||||||||||
| Freight Costs | 482,010 | 24 | % | 250,981 | 10 | % | 231,029 | |||||||||||||
| Manufacturing Overhead | 795,835 | 40 | % | 410,149 | 16 | % | 385,686 | |||||||||||||
| Warranty Costs | 80,395 | 4 | % | 92,236 | 4 | % | (11,841 | ) | ||||||||||||
| Amortization of Software Costs | 286,450 | 14 | % | 286,450 | 11 | % | - | |||||||||||||
| Software Royalties | 133,939 | 7 | % | 144,030 | 6 | % | (10,091 | ) | ||||||||||||
| Total Cost of Sales – Products | $ | 3,251,906 | 164 | % | $ | 2,101,466 | 83 | % | $ | 1,150,440 | ||||||||||
| Gross Profit (Loss) – Product Sales | $ | (1,264,028 | ) | (64 | )% | $ | 442,687 | 17 | % | $ | (1,706,715 | ) | ||||||||
The decreased net gross profit (loss) percentage earned in the year ended December 31, 2016, as compared to the same period in 2015 was primarily the result of lower sales levels to absorb many of our relatively fixed manufacturing overheads and amortization costs and the fact that we earn significantly lower gross margins on iWear as compared to our Smart Glasses and prior Wrap AR products. Production issues and product shortages contributed to a negative margin on iWear for 2016. Manufacturing overhead costs increased primarily due to increased salaries and production labor costs of $198,862, with over half related to iWear rework costing; increased rent and utility cost allocations of $162,293 due to our larger plant, resulted in an increase of $361,155 from 2015. Freight costs of $482,010 were substantially higher for the 2016 period as compared to $250,981 in 2015. As our new iWear product is bulkier and heavier and ships in a larger retail package than our prior products, the costs of air shipments became prohibitive material given that production volumes from China increased from 2015.
41
Research and Development. Our research and development expenses consist primarily of compensation costs for personnel, related stock compensation expenses, third party services, purchase of research supplies and materials, and consulting fees related to research and development costs. Software development expenses to determine technical feasibility before final development and ongoing maintenance that are not capitalized are included in research and development costs.
| 2016 | % of Sales | 2015 | % of Sales | Dollar Change | % Increase (Decrease) | |||||||||||||||||||
| Research and Development | $ | 6,947,878 | 327 | % | $ | 3,595,437 | 131 | % | $ | 3,352,441 | 93 | % | ||||||||||||
Comparing research and development costs for the year ended December 31, 2016 versus the same period in 2015, there was an increase in 2016 salary, benefits and stock compensation expenses of $1,040,841, primarily the result of additional R&D staff versus the same period in 2015; a $131,654 reduction in new staff recruitment fees; an increase in project development and research costs of $1,937,091 primarily related to the new product development for the M300 Smart Glasses and to a smaller extent the M3000, with the majority of these amounts being spent on outside contractors who assisted in the development work; an increase in $208,665 in rent and utility costs related to the expanded R&D portion of our new corporate facilities; an increase of $231,773 in external research related consulting fees for optics and waveguide research; and an $11,612 increase in travel costs related to our outside production contractor and development contractors.
Selling and Marketing. Selling and marketing costs consist of trade show costs, advertising, travel costs, sales staff compensation costs including stock compensation expense, consulting fees, PR agency fees, website costs and sales commissions paid to full-time staff and outside consultants.
| 2016 | % of Sales | 2015 | % of Sales | Dollar Change | % Increase (Decrease) | |||||||||||||||||||
| Selling and Marketing | $ | 3,394,580 | 160 | % | $ | 1,798,041 | 65 | % | $ | 1,596,539 | 89 | % | ||||||||||||
These costs increased overall due to the following factors: higher salary, commissions, benefits and stock compensation expenses related to new staff additions totaling $418,180 in both North America and Europe; increased trade show costs of $402,380 due to larger exhibit booth sizes and show rentals and attendance at several additional major trade shows during 2016 versus 2015; increased public relations and video production costs of $340,761 due to the hiring of an additional PR and marketing service firm as compared to the 2015 period and the production of 4 new product videos in 2016; a $144,319 increase in website costs including additions to our main new corporate and European websites; a $92,093 increase in travel costs; and a $42,736 increase in rent and utility costs.
General and Administrative. General and administrative costs include professional fees, investor relations (IR) costs including shares and warrants issued for IR services, salaries and related stock compensation, travel costs, office and rental costs.
| 2016 | % of Sales | 2015 | % of Sales | Dollar Change | % Increase (Decrease) | |||||||||||||||||||
| General and Administrative | $ | 5,114,139 | 240 | % | $ | 6,120,101 | 223 | % | $ | (1,005,962 | ) | (16 | )% | |||||||||||
General and administrative costs were $5,114,139 for the year ended December 31, 2016 as compared to $6,120,101 for the year ended December 31, 2015, a decrease of $1,005,962 or 16%. These costs were lower overall primarily because of: lower compensation expense related to stock awards totaling $1,375,000 to our officers and directors awarded in January 2015, partially offset by an increase in incentive bonuses of $302,500; a $56,267 decrease in travel costs; $84,727 decrease in legal fees, primarily related to a stock award made to our attorneys in January 2015; a $217,303 increase in accounting and audit fees, with the majority of the change being for Sarbanes-Oxley Section 404 consultants retained to assist management in designing and implementing improvements in our financial reporting controls and accruals for expected additional external audit fees, as compared to the same period in 2015 when no such consultants were retained.
Depreciation and Amortization. Depreciation and amortization expense for the year ended December 31, 2016 was $770,668 as compared to $380,841 in the same period in 2015, an increase of $389,827. The increase in depreciation and amortization expense is due to new investments in depreciable assets during 2016.
Loss on Inventory Valuation. There was a loss on inventory valuation for the year ended December 31, 2016 of $1,124,401 as compared to nil in the same period in 2015. This write-down was the result of management’s decision in early 2017 to reduce the suggested retail selling price of its iWear Video Eyewear inventory on hand to a price below the product’s cost.
Other Income (Expense). Total other expense was $714,322 for the year ended December 31, 2016 compared to an expense of $2,086,022 in the same period in 2015, a reduction of $1,371,700. The overall reduction in these other expenses was primarily the result of a profit of $34,744 on the derivative liability mark-to-market revaluation for the 2016 period versus a loss of $1,098,465 for the 2015 period, and a reduction of $264,985 in senior debt discount and amortization for the 2016 period versus 2015, and lower interest expense of $24,134, both due primarily to ongoing debt conversions.
42
Provision for Income Taxes. There were no provisions for income taxes in 2016 or 2015.
Liquidity and Capital Resources
As of December 31, 2017, we had cash and cash equivalents of $14,899,636, an increase of $355,692 from $14,533,944 as of December 31, 2016.
At December 31, 2017, we had current assets of $21,242,573 compared to current liabilities of $5,435,209 which resulted in a working capital position of $15,807,364. As at December 31, 2016, we had a working capital position of $13,808,094. Our current liabilities are comprised principally of accounts payable and accrued expenses.
Operating Activities. We used $16,465,706 of cash for operating activities in 2017 compared to $14,396,964 in 2016. In addition to the net loss adjusted for non-cash items, working capital operating uses for 2017 resulted from a $2,352,581 increase in inventory, a $870,858 increase in accounts receivable, a $497,784 increase in accrued project revenue, a $401,748 decrease in unearned revenues, a $321,250 decrease in accrued compensation, and a $2,640,584 increase in accounts payable. The major working capital operating items for 2016 resulted from a $426,521 increase in inventory, a $440,091 increase in unearned revenue, and $290,000 increase in accrued compensation. The major working capital operating items for 2015 resulted from a $2,437,149 increase in inventory and a $1,276,132 reduction in accounts payable.
Investing Activities. Investing activities used $2,689,425 of cash for 2017 as compared to a use of $2,186,303 for the same period in 2016. In 2017, we used $1,681,258 of cash primarily for waveguide production equipment, new product tooling, additional manufacturing and R&D equipment, and new computer equipment and software as compared to $2,039,299 of cash used in 2016 primarily for the completion of our new clean room, new product tooling, and new projection optics tooling and additional manufacturing and R&D equipment. In 2015, $1,892,831 of cash was used for the purchase of lease improvements and equipment for our new office and manufacturing facility as well as additions to product tooling. The costs of registering our intellectual property rights and purchases thereof and licences were $599,444 in 2017, $147,004 in 2016 and $191,908 in 2015. In 2017, we invested $408,723 in software development costs related to our products, as compared to nil in 2016 and 2015.
Financing Activities. We generated $19,510,823 of cash from financing activities in 2017 as compared to generating $19,240,153 of cash from financing activities in 2016. During the year ended December 31, 2017, the primary sources of cash from financing activities were the proceeds of $21,128,502 from the sale of 3,566,116 common shares in public offerings in August and December 2017, less their combined direct offering costs of $1,617,679. During the year ended December 31, 2016, the primary sources of cash from financing activities were the proceeds of $21,112,500 from the sale of 3,150,000 common shares in public offerings in July and November 2016, less their combined direct offering costs of $1,874,485 and the cash proceeds of $60,750 from warrant exercises. During the year ended December 31, 2015, the primary sources of cash from financing activities were the proceeds of $24,813,000 from the sale of Series A Preferred Stock on January 2, 2015 to Intel Corporation, less direct offering costs of $214,169 and the cash proceeds of $1,272,627 from warrant exercises.
Capital Resources. As of December 31, 2017, we had cash and cash equivalents of $14,889,636, an increase of $355,692 from $14,533,944 as of December 31, 2016. Our cash and cash equivalents as of December 31, 2017 does not include our receipt of net proceeds of approximately $28 million from the financing that we completed in January 2018.
The Company incurred annual net losses of $19,633,502 in 2017 and $19,250,082 in 2016, and has an accumulated deficit of $96,472,452 as of December 31, 2017. The Company will need to grow its business and product sales significantly to become profitable and self-sustaining on a cash flow basis or it will be required to raise new capital.
The Company’s cash requirements are primarily for funding operating losses, working capital, research and development, and capital expenditures. Our cash requirements related to funding operating losses depend on numerous factors, including new product development activities, our ability to commercialize our products, our products’ timely market acceptance, selling prices and gross margins, and other factors. Historically, the Company has met its cash needs by the sale of equity, borrowings under notes, and sales of convertible debt. During 2017 we sold 3,566,116 common shares in public offerings in August and December resulting in net proceeds of $19,510,823. During 2017 all of the Company’s convertible senior secured notes payable were converted to shares of common stock before their maturity on June 3, 2017. On January 29, 2018 we closed a public offering of 3,000,000 shares of common stock and 1,200,000 warrants resulting in net proceeds of approximately $28,000,000 after estimated offering expenses.
We believe our existing cash and cash equivalent balances will be sufficient to meet our working capital and capital expenditure needs for at least the next twelve months. We will continue to invest in our research and development, IP portfolio, and new products offerings. Our future capital requirements may vary materially from those currently planned and will depend on many factors, including our levels of revenue, the timing and extent of spending on research and development efforts and other business initiatives, the expansion of sales and marketing activities, the timing of new product introductions, market acceptance of our products, acquisitions, and overall economic conditions. To the extent that current and anticipated future sources of liquidity are insufficient to fund our future business activities and requirements, we may be required to seek additional equity or debt financing. If the Company raises additional equity funds by these methods, the ownership interests of existing shareholders may be diluted. The amount of such dilution could increase due to the issuance of new warrants or securities with other dilutive characteristics, such as full ratchet anti-dilution clauses or price resets. The incurrence of debt financing would result in debt service obligations and the instruments governing such debt could provide for operating and financing covenants that would restrict our future operations. However, there can be no assurance that we will be able to raise capital in the future or that if we raise additional capital it will be sufficient to execute our business plans in the future.
43
Contractual Obligations
The following is a summary of our contractual payment obligations for operating leases as of December 31, 2017:
| Contractual Obligations | Total | Less than 1 Year | 1-3 Years | 3-5 Years | More than 5 Years | |||||||||||||||
| Operating Lease Obligations | $ | 1,178,746 | $ | 411,135 | $ | 767,611 | - | - | ||||||||||||
| Open Purchase Obligations | 7,000,000 | 7,000,000 | - | - | - |
| Item 7A. | Quantitative and Qualitative Disclosures about Market Risk. |
We invest our excess cash in short-term highly rate corporate debt instruments or commercial paper, which bear lower levels of relative risk. We believe that the effect, if any, of reasonably possible near-term changes in interest rates on our financial position, results of operations and cash flows should not be material to our cash flows or income. It is possible that interest rate movements would increase our unrecognized gain or loss on interest rate securities. Our portfolio of marketable debt securities is subject to interest rate risk although our intent is to hold securities until maturity. The credit rating of our investments may be affected by the underlying financial health of the guarantors of our investments. Our investment policy generally directs our investment managers to select investments to achieve the following goals: principal preservation, adequate liquidity, and return.
We are exposed to changes in foreign currency exchange rates primarily through our translation of our foreign subsidiary’s financial positions, results of operations, and transaction gains and losses as a result of non-U.S. dollar denominated cash flows related to business activities in Asia and the United Kingdom, and remeasurement of U.S. dollars to the functional currency of our foreign subsidiaries. We are also exposed to the effects of exchange rates in the purchase of certain raw materials whose price is in U.S. dollars but the price on future purchases is subject to change based on the relationship of the Japanese Yen to the U.S. dollar. We do not currently hedge our foreign currency exchange rate risk. We estimate that any market risk associated with our international operations is unlikely to have a material adverse effect on our business, financial condition or results of operation.
| Item 8. | Financial Statements and Supplementary Data |
The information required by this item is incorporated herein by reference to pages F-1 through F-29 of this annual report and is indexed under Item 15(a)(1) and (2).
| Item 9. | Changes in and Disagreements with Accountants on Accounting and Financial Disclosure |
None.
| Item 9A. | Controls and Procedures |
The information contained in this section covers management’s evaluation of our disclosure controls and procedures and our assessment of our internal control over financial reporting as of December 31, 2017.
| (a) | Evaluation of Disclosure Controls and Procedures |
Our management, including our Chief Executive Officer and Chief Financial Officer, evaluated the effectiveness of our disclosure controls and procedures as of the end of the period covered by this annual report as required by Rule 13a-15 under the Securities Exchange Act of 1934, as amended (the “Exchange Act”). Disclosure controls and procedures are those controls and other procedures that are designed to ensure that information required to be disclosed in reports filed or submitted under the Exchange Act is properly recorded, processed, summarized, and reported, within the time periods specified by the rules and forms promulgated by the SEC. Disclosure controls and procedures include, without limitation, controls and procedures designed to ensure that such information is properly accumulated and communicated to management, including our Chief Executive Officer and Chief Financial Officer, as appropriate, to allow timely decisions regarding required disclosure. As a result of this evaluation, our Chief Executive Officer and Chief Financial Officer concluded that as of December 31, 2017, our disclosure controls and procedures were effective.
44
| (b) | Management’s Annual Report on Internal Control Over Financial Reporting |
Our management is responsible for establishing and maintaining adequate “internal control over financial reporting,” as defined in Rule 13a-15(f) and 15d-15(f) under the Exchange Act. Our system of internal control over financial reporting is a process designed to provide reasonable assurance regarding the reliability of financial reporting and the preparation of consolidated financial statements for external reporting purposes in accordance with US GAAP.
Our internal control over financial reporting includes those policies and procedures that: (a) pertain to the maintenance of records that, in reasonable detail, accurately and fairly reflect the transactions and dispositions of our assets; (b) provide reasonable assurance that transactions are recorded as necessary to permit preparation of consolidated financial statements in accordance with US GAAP, and that our receipts and expenditures are being made only in accordance with authorizations of our management and directors; and (c) provide reasonable assurance regarding prevention or timely detection of unauthorized use, acquisition, or disposition of our assets that could have a material effect on the consolidated financial statements.
Our management, with the participation of our Chief Executive Officer and Chief Financial Officer, evaluated the effectiveness of our internal control over financial reporting as of December 31, 2017, and they concluded that our internal control over financial reporting was effective as of December 31, 2017. In making this assessment, we utilized the criteria set forth by the Committee of Sponsoring Organizations of the Treadway Commission (“COSO”) in Internal Control — Integrated Framework (2013).
The company’s independent registered public accounting firm, Freed Maxick CPAs, P.C., who audited the consolidated financial statements included in this Annual Report on Form 10-K has issued an attestation report on the effectiveness of the management’s internal control over financial reporting as of December 31, 2017. This report states that the internal control over financial reporting was effective and appears on page F-2 of this Annual Report on Form 10-K.
| (c) | Limitations on the Effectiveness of Controls. |
Because of its inherent limitations, internal control over financial reporting, no matter how well conceived or operated, can only provide reasonable assurance, not absolute assurance, that the objectives of the control system are met. Such controls may not prevent or detect every misstatement. Also, projections of any evaluation of effectiveness to future periods are subject to the risk that controls may become inadequate because of changes in conditions, or that the degree of compliance with the policies or procedures may deteriorate.
| (d) | Change in Internal Control Over Financial Reporting |
As reported in our assessment of the effectiveness of our internal control over financial reporting as of December 31, 2016, included in “Item 9A. Controls and Procedures” of our Annual Report on Form 10-K for the year ended December 31, 2016, our internal control over inventory was considered ineffective as of that date as a result of certain material weaknesses. The material weaknesses that existed over inventory related to (i) ineffective procedures and controls over inventory valuation; (ii) insufficient procedures over consigned inventory with our 3rd party contract manufacturers; and (iii) inadequate procedures to maintain up to date unit costs and bill of materials.
In the fourth quarter of 2016, we implemented new controls to remediate the material weakness stated above, however, management concluded those controls had not been operating effectively for a sufficient number of periods to demonstrate sustainability. These controls have continued to operate throughout the year ended December 31, 2017. Management has further tested these controls during the year ended December 31, 2017 and found them to have continued to be effective. Accordingly, management has concluded that, as of December 31, 2017, this material weakness has been remediated.
Except as noted above, no change in our internal control over financial reporting (as defined in Rule 13a-15(f) under the Exchange Act) occurred during the three months ended December 31, 2017 that has materially affected, or is likely to materially affect, our internal control over financial reporting.
45
| Item 9B. | Other Information |
None.
PART III
| Item 10. | Directors, Executive Officers and Corporate Governance |
The information required by this item will be presented in our definitive proxy statement not later than 120 days after the end of the fiscal year covered by this annual report and is incorporated in this annual report by reference thereto.
| Item 11. | Executive Compensation |
The information required by this item will be presented in our definitive proxy statement not later than 120 days after the end of the fiscal year covered by this annual report and is incorporated in this annual report by reference thereto, except, however, the section entitled “Compensation Committee Report” shall not be deemed to be “soliciting material” or to be filed with the Securities and Exchange Commission or subject to Regulation 14A or 14C, or to the liabilities of Section 18 of the Exchange Act of 1934, as amended.
| Item 12. | Security Ownership of Certain Beneficial Owners and Management and Related Stockholder Matters |
The information required by this item will be presented in our definitive proxy statement not later than 120 days after the end of the fiscal year covered by this annual report and is incorporated in this annual report by reference thereto.
| Item 13. | Certain Relationships and Related Transactions, and Director Independence |
The information required by this item will be presented in our definitive proxy statement not later than 120 days after the end of the fiscal year covered by this annual report and is incorporated in this annual report by reference thereto.
| Item 14. | Principal Accounting Fees and Services |
The information required by this item will be presented in our definitive proxy statement not later than 120 days after the end of the fiscal year covered by this annual report and is incorporated in this annual report by reference thereto.
46
PART IV
| Item 15. | Exhibits and Financial Statement Schedules |
| (a) | The following documents are filed as part of this report |
(1) Financial Statements
(2) Financial Statement Schedules
Schedule II – Valuation and Qualifying Accounts
Schedules other than the one listed above have been omitted because of the absence of conditions under which they are required or because the required information is included in the consolidated financial statements or the notes thereto.
(3) Exhibits
A list of exhibits filed with this annual report is set forth in the Exhibit Index and is incorporated in this Item 15(a)(3) by reference.
47
VUZIX CORPORATION
INDEX TO CONSOLIDATED FINANCIAL STATEMENTS
| F-1 |
Report of Independent Registered Public Accounting Firm
Board of Directors and Stockholders
Vuzix Corporation
Rochester, New York
Opinions on the Financial Statements and Internal Control Over Financial Reporting
We have audited the accompanying consolidated balance sheets of Vuzix Corporation and subsidiary (the Company) as of December 31, 2017 and 2016, and the related consolidated statements of changes stockholders' equity, operations, and cash flows for each of the three years in the period ended December 31, 2017, and the related notes and schedules (collectively, the financial statements). We also have audited the Company’s internal control over financial reporting as of December 31, 2017, based on criteria established in Internal Control — Integrated Framework issued by the Committee of Sponsoring Organizations of the Treadway Commission in 2013.
In our opinion, the financial statements referred to above present fairly, in all material respects, the financial position of the Company as of December 31, 2017 and 2016, and the results of its operations and its cash flows for each of the years in the three-year period ended December 31, 2017, in conformity with accounting principles generally accepted in the United States of America. Also in our opinion, the Company maintained, in all material respects, effective internal control over financial reporting as of December 31, 2017, based on criteria established in Internal Control — Integrated Framework issued by the Committee of Sponsoring Organizations of the Treadway Commission in 2013.
Basis for Opinions
The Company's management is responsible for these financial statements, for maintaining effective internal control over financial reporting, and for its assessment of the effectiveness of internal control over financial reporting, included in the accompanying Annual Report on Internal Control Over Financial Reporting. Our responsibility is to express an opinion on the Company's financial statements and an opinion on the company's internal control over financial reporting based on our audits. We are a public accounting firm registered with the Public Company Accounting Oversight Board (United States) (PCAOB) and are required to be independent with respect to the Company in accordance with U.S. federal securities laws and the applicable rules and regulations of the Securities and Exchange Commission and the PCAOB.
We conducted our audits in accordance with the standards of the PCAOB. Those standards require that we plan and perform the audits to obtain reasonable assurance about whether the financial statements are free of material misstatement, whether due to error or fraud, and whether effective internal control over financial reporting was maintained in all material respects.
Our audits of the financial statements included performing procedures to assess the risks of material misstatement of the financial statements, whether due to error or fraud, and performing procedures that respond to those risks. Such procedures included examining, on a test basis, evidence regarding the amounts and disclosures in the financial statements. Our audits also included evaluating the accounting principles used and significant estimates made by management, as well as evaluating the overall presentation of the financial statements. Our audit of internal control over financial reporting included obtaining an understanding of internal control over financial reporting, assessing the risk that a material weakness exists, and testing and evaluating the design and operating effectiveness of internal control based on the assessed risk. Our audits also included performing such other procedures as we considered necessary in the circumstances. We believe that our audits provide a reasonable basis for our opinions.
Definition and Limitations of Internal Control Over Financial Reporting
A company's internal control over financial reporting is a process designed to provide reasonable assurance regarding the reliability of financial reporting and the preparation of financial statements for external purposes in accordance with generally accepted accounting principles. A company's internal control over financial reporting includes those policies and procedures that (1) pertain to the maintenance of records that, in reasonable detail, accurately and fairly reflect the transactions and dispositions of the assets of the company; (2) provide reasonable assurance that transactions are recorded as necessary to permit preparation of financial statements in accordance with generally accepted accounting principles, and that receipts and expenditures of the company are being made only in accordance with authorizations of management and directors of the company; and (3) provide reasonable assurance regarding prevention or timely detection of unauthorized acquisition, use or disposition of the company's assets that could have a material effect on the financial statements.
Because of its inherent limitations, internal control over financial reporting may not prevent or detect misstatements. Also, projections of any evaluation of effectiveness to future periods are subject to the risk that controls may become inadequate because of changes in conditions, or that the degree of compliance with the policies or procedures may deteriorate.
/s/ Freed Maxick CPAs, P.C.
We have served as the Company's auditor since 2014.
Rochester, New York
March 16, 2018
| F-2 |
CONSOLIDATED BALANCE SHEETS
| December 31, | December 31, | |||||||
| 2017 | 2016 | |||||||
| ASSETS | ||||||||
| Current Assets | ||||||||
| Cash and Cash Equivalents | $ | 14,889,636 | $ | 14,533,944 | ||||
| Accounts Receivable, Net | 974,172 | 103,314 | ||||||
| Accrued Project Revenue | 497,784 | - | ||||||
| Inventories, Net | 3,852,317 | 2,651,218 | ||||||
| Manufacturing Vendor Prepayments | 154,717 | 144,168 | ||||||
| Prepaid Expenses and Other Assets | 873,947 | 797,409 | ||||||
| Total Current Assets | 21,242,573 | 18,230,053 | ||||||
| Long-Term Assets | ||||||||
| Fixed Assets, Net | 4,124,466 | 3,364,908 | ||||||
| Patents and Trademarks, Net | 813,774 | 535,461 | ||||||
| Software Development Costs, Net | 408,723 | 214,838 | ||||||
| Licenses, Net | 243,717 | - | ||||||
| Total Assets | $ | 26,833,253 | $ | 22,345,260 | ||||
| LIABILITIES AND STOCKHOLDERS’ EQUITY | ||||||||
| Current Liabilities | ||||||||
| Accounts Payable | $ | 3,726,056 | $ | 1,085,472 | ||||
| Current Portion of Long-term Debt, Net of discounts | - | 1,416,480 | ||||||
| Customer Deposits | 73,462 | 66,162 | ||||||
| Unearned Revenue | 107,824 | 509,572 | ||||||
| Accrued Expenses | 1,371,440 | 1,331,983 | ||||||
| Derivative Liability | 152,927 | - | ||||||
| Income and Other Taxes Payable | 3,500 | 12,290 | ||||||
| Total Current Liabilities | 5,435,209 | 4,421,959 | ||||||
| Long-Term Liabilities | ||||||||
| Derivative Liability | - | 173,131 | ||||||
| Accrued Expenses | 18,331 | 28,333 | ||||||
| Total Long-Term Liabilities | 18,331 | 201,464 | ||||||
| Total Liabilities | 5,453,540 | 4,623,423 | ||||||
| Stockholders’ Equity | ||||||||
| Preferred Stock — $.001 Par Value, 5,000,000 Shares Authorized; 49,626 and 49,626 Shares Issued and Outstanding December 31, 2017 and 2016. | 50 | 50 | ||||||
| Common Stock — $.001 Par Value, 100,000,000 Shares Authorized December 31, 2017 and 2016; 24,276,275 and 19,569,247 Shares Issued and Outstanding December 31, 2017 and 2016, respectively. | 24,276 | 19,569 | ||||||
| Additional Paid-in Capital | 117,827,839 | 94,541,168 | ||||||
| Accumulated Deficit | (96,472,452 | ) | (76,838,950 | ) | ||||
| Total Stockholders’ Equity | 21,379,713 | 17,721,837 | ||||||
| Total Liabilities and Stockholders’ Equity | $ | 26,833,253 | $ | 22,345,260 | ||||
The accompanying notes are an integral part of these consolidated financial statements.
| F-3 |
CONSOLIDATED STATEMENTS OF CHANGES IN STOCKHOLDERS’ EQUITY
| Preferred Stock | Common Stock | Additional | Accumulated | |||||||||||||||||||||||||
| Shares | Amount | Shares | Amount | Paid-in Capital | Deficit | Total | ||||||||||||||||||||||
| Balance — December 31, 2014 | - | $ | - | 11,295,387 | $ | 11,296 | $ | 29,752,083 | $ | (44,161,390 | ) | $ | (14,398,011 | ) | ||||||||||||||
| Stock Issued for Services | - | - | 120,837 | 121 | 676,544 | - | 676,665 | |||||||||||||||||||||
| Conversion of Note Payable and Accrued Interest | - | - | 210,000 | 210 | 472,290 | - | 472,500 | |||||||||||||||||||||
| Exercise of Warrants | - | - | 4,128,271 | 4,128 | 1,268,498 | - | 1,272,626 | |||||||||||||||||||||
| Warrants Issued for Services | - | - | - | - | 260,373 | - | 260,373 | |||||||||||||||||||||
| Stock Compensation Expense | - | - | - | - | 568,848 | - | 568,848 | |||||||||||||||||||||
| Common Stock Awards to Officers, Directors And Law Firm | - | - | 325,000 | 325 | 1,669,375 | - | 1,669,700 | |||||||||||||||||||||
| Proceeds from Preferred Stock Offering | 49,626 | 50 | - | - | 24,812,950 | - | 24,813,000 | |||||||||||||||||||||
| Direct Costs of Preferred Stock Offering | - | - | - | - | (214,169 | ) | - | (214,169 | ) | |||||||||||||||||||
| Reclass Fair Value of Derivative Liability upon Waiver of Certain Anti-Dilutive Provisions | - | - | - | - | 8,736,412 | - | 8,736,412 | |||||||||||||||||||||
| Reclass Fair Value of Note Derivative Liability upon Waiver of Certain Anti-Dilutive Provisions | - | - | - | - | 2,806,942 | - | 2,806,942 | |||||||||||||||||||||
| Reclass Fair Value of Warrant Derivative Liability upon Exercise | - | - | - | - | 2,855,463 | - | 2,855,463 | |||||||||||||||||||||
| Exercise of Stock Options | - | - | 8,456 | 8 | (8 | ) | - | |||||||||||||||||||||
| 2015 Net Loss | - | - | - | - | - | (13,427,478 | ) | (13,427,478 | ) | |||||||||||||||||||
| Balance — December 31, 2015 | 49,626 | $ | 50 | 16,087,951 | $ | 16,088 | $ | 73,665,601 | $ | (57,588,868 | ) | $ | 16,092,871 | |||||||||||||||
| Exercise of Warrants | - | - | 96,620 | 97 | 60,654 | - | 60,751 | |||||||||||||||||||||
| Reclass Fair Value of Warrant Derivative Liability upon Exercise | - | - | - | - | 32,911 | - | 32,911 | |||||||||||||||||||||
| Conversion of Notes Payable and Accrued Interest | - | - | 152,016 | 152 | 341,884 | - | 342,036 | |||||||||||||||||||||
| Stock Issued for Services | - | - | 32,578 | 32 | 173,993 | - | 174,025 | |||||||||||||||||||||
| Stock Compensation Expense | - | - | - | - | 756,928 | - | 756,928 | |||||||||||||||||||||
| Common Stock Awards to Directors | - | - | 40,000 | 40 | 241,260 | - | 241,300 | |||||||||||||||||||||
| Proceeds from Common Stock Offerings | - | - | 3,150,000 | 3,150 | 21,109,350 | - | 21,112,500 | |||||||||||||||||||||
| Direct Costs of Common Stock Offerings | - | - | - | - | (1,874,485 | ) | - | (1,874,485 | ) | |||||||||||||||||||
| Exercise of Stock Options | - | - | 10,082 | 10 | 33,072 | - | 33,082 | |||||||||||||||||||||
| 2016 Net Loss | - | - | - | - | - | (19,250,082 | ) | (19,250,082 | ) | |||||||||||||||||||
| Balance — December 31, 2016 | 49,626 | $ | 50 | 19,569,247 | $ | 19,569 | $ | 94,541,168 | $ | (76,838,950 | ) | $ | 17,721,837 | |||||||||||||||
| Exercise of Warrants | - | - | 168,203 | 168 | (168 | ) | - | - | ||||||||||||||||||||
| Conversion of Notes Payable and Accrued Interest | - | - | 827,237 | 827 | 1,860,456 | - | 1,861,283 | |||||||||||||||||||||
| Stock Issued for Services | - | - | 41,543 | 42 | 228,708 | - | 228,750 | |||||||||||||||||||||
| Stock Compensation Expense | - | - | 16,668 | 17 | 1,355,505 | - | 1,355,522 | |||||||||||||||||||||
| Common Stock Awards to Directors | - | - | 50,000 | 50 | 334,950 | - | 335,000 | |||||||||||||||||||||
| Proceeds from Common Stock Offerings | - | - | 3,566,116 | 3,566 | 21,124,936 | - | 21,128,502 | |||||||||||||||||||||
| Direct Costs of Common Stock Offerings | - | - | - | - | (1,617,679 | ) | - | (1,617,679 | ) | |||||||||||||||||||
| Exercise of Stock Options | - | - | 37,261 | 37 | (37 | ) | - | - | ||||||||||||||||||||
| 2017 Net Loss | - | - | - | - | - | (19,633,502 | ) | (19,633,502 | ) | |||||||||||||||||||
| Balance — December 31, 2017 | 49,626 | $ | 50 | 24,276,275 | $ | 24,276 | $ | 117,827,839 | $ | (96,472,452 | ) | $ | 21,379,713 | |||||||||||||||
The accompanying notes are an integral part of these consolidated financial statements.
| F-4 |
CONSOLIDATED STATEMENTS OF OPERATIONS
| For Years Ended December 31, | ||||||||||||
| 2017 | 2016 | 2015 | ||||||||||
| Sales: | ||||||||||||
| Sales of Products | $ | 4,548,689 | $ | 1,987,878 | $ | 2,544,153 | ||||||
| Sales of Engineering Services | 989,064 | 139,500 | 205,831 | |||||||||
| Total Sales | 5,537,753 | 2,127,378 | 2,749,984 | |||||||||
| Cost of Sales: | ||||||||||||
| Cost of Sales — Products | 5,269,900 | 3,251,906 | 2,101,466 | |||||||||
| Cost of Sales — Engineering Services | 944,451 | 39,060 | 82,332 | |||||||||
| Total Cost of Sales | 6,214,351 | 3,290,966 | 2,183,798 | |||||||||
| Gross Profit (Loss) (exclusive of depreciation shown separately below) | (676,598 | ) | (1,163,588 | ) | 566,186 | |||||||
| Operating Expenses: | ||||||||||||
| Research and Development | 6,706,690 | 6,947,878 | 3,595,437 | |||||||||
| Selling and Marketing | 3,694,913 | 3,394,580 | 1,798,041 | |||||||||
| General and Administrative | 6,126,335 | 5,114,139 | 6,120,101 | |||||||||
| Depreciation and Amortization | 998,528 | 770,668 | 380,841 | |||||||||
| Loss on Inventory Revaluation | 1,151,482 | 1,124,401 | - | |||||||||
| Impairment of Patents and Trademarks | - | 20,506 | 13,222 | |||||||||
| Total Operating Expenses: | 18,677,948 | 17,372,172 | 11,907,642 | |||||||||
| Loss from Operations | (19,354,546 | ) | (18,535,760 | ) | (11,341,456 | ) | ||||||
| Other Income (Expense) | ||||||||||||
| Investment Income | 58,530 | 26,693 | 20,790 | |||||||||
| Other Taxes | (28,363 | ) | (52,271 | ) | (54,432 | ) | ||||||
| Foreign Exchange Loss | (65,248 | ) | (33,079 | ) | (277 | ) | ||||||
| Gain (Loss) on Derivative Valuation | 20,204 | 34,744 | (1,098,465 | ) | ||||||||
| Loss on Fixed Asset Disposal | (585 | ) | (25,890 | ) | - | |||||||
| Amortization of Senior Term Debt Discounts | (155,760 | ) | (486,856 | ) | (751,968 | ) | ||||||
| Amortization of Deferred Financing Costs | (19,500 | ) | (46,574 | ) | (46,447 | ) | ||||||
| Interest Expense | (88,234 | ) | (131,089 | ) | (155,223 | ) | ||||||
| Total Other Income (Expense) | (278,956 | ) | (714,322 | ) | (2,086,022 | ) | ||||||
| Loss Before Provision for Income Taxes | (19,633,502 | ) | (19,250,082 | ) | (13,427,478 | ) | ||||||
| Provision for Income Taxes | — | — | — | |||||||||
| Net Loss | (19,633,502 | ) | (19,250,082 | ) | (13,427,478 | ) | ||||||
| Preferred Stock Dividends | (1,714,934 | ) | (1,620,048 | ) | (1,514,081 | ) | ||||||
| Loss Attributable to Common Stockholders | $ | (21,348,436 | ) | $ | (20,870,130 | ) | $ | (14,941,559 | ) | |||
| Basic and Diluted Loss per Share | $ | (1.02 | ) | $ | (1.23 | ) | $ | (0.97 | ) | |||
| Weighted-average Shares Outstanding – Basic and Diluted | 21,013,907 | 16,908,544 | 15,408,724 | |||||||||
The accompanying notes are an integral part of these consolidated financial statements.
| F-5 |
CONDENSED CONSOLIDATED STATEMENTS OF CASH FLOWS
| For the Years Ended | ||||||||||||
| December 31, | ||||||||||||
| 2017 | 2016 | 2015 | ||||||||||
| Cash Flows from Operating Activities | ||||||||||||
| Net Loss | $ | (19,633,502 | ) | $ | (19,250,082 | ) | $ | (13,427,478 | ) | |||
| Non-Cash Adjustments: | ||||||||||||
| Depreciation and Amortization | 998,528 | 770,668 | 380,841 | |||||||||
| Amortization of Software Development Costs in Cost of Sales - Products | 214,838 | 286,450 | 286,450 | |||||||||
| Impairment of Patents and Trademarks | - | 20,506 | 13,222 | |||||||||
| Common Stock Awards Compensation Expense | 267,750 | 146,050 | 1,669,700 | |||||||||
| Loss on Disposal of Fixed Assets | 585 | 25,890 | - | |||||||||
| Stock-Based Option Compensation Expense | 1,355,522 | 756,928 | 568,848 | |||||||||
| Amortization of Term Debt Discount | 155,760 | 486,856 | 751,968 | |||||||||
| Amortization of Debt Issuance Costs | 19,500 | 46,574 | 46,447 | |||||||||
| Common Stock and Warrants Issued for Services | 228,750 | 174,026 | 1,057,074 | |||||||||
| (Gain) Loss on Derivative Revaluation | (20,204 | ) | (34,744 | ) | 1,098,465 | |||||||
| Loss on Inventory Revaluation | 1,151,482 | 1,124,401 | - | |||||||||
| (Increase) Decrease in Operating Assets: | ||||||||||||
| Accounts Receivable | (870,858 | ) | 222,380 | 57,839 | ||||||||
| Accrued Project Revenue | (497,784 | ) | - | - | ||||||||
| Inventories | (2,352,581 | ) | (426,521 | ) | (2,437,149 | ) | ||||||
| Vendor Prepayments | (10,549 | ) | 225,243 | (213,320 | ) | |||||||
| Prepaid Expenses and Other Assets | (9,288 | ) | (78,389 | ) | (306,078 | ) | ||||||
| Increase (Decrease) in Operating Liabilities: | ||||||||||||
| Accounts Payable | 2,640,584 | 178,037 | (1,276,132 | ) | ||||||||
| Accrued Expense | 554,832 | 31,909 | 143,830 | |||||||||
| Customer Deposits | 7,300 | 38,315 | (92,703 | ) | ||||||||
| Unearned Revenue | (401,748 | ) | 440,091 | 16,078 | ||||||||
| Income and Other Taxes Payable | (8,790 | ) | 5,217 | (28,085 | ) | |||||||
| Accrued Compensation | (321,250 | ) | 290,000 | (70,067 | ) | |||||||
| Accrued Interest & Long-Term Accrued Interest Converted | 65,417 | 123,231 | 92,171 | |||||||||
| Net Cash Flows Used in Operating Activities | (16,465,706 | ) | (14,396,964 | ) | (11,668,079 | ) | ||||||
| Cash Flows from Investing Activities: | ||||||||||||
| Purchases of Fixed Assets | (1,681,258 | ) | (2,039,299 | ) | (1,892,831 | ) | ||||||
| Investments in Licenses, Patents and Trademarks | (599,444 | ) | (147,004 | ) | (191,908 | ) | ||||||
| Investments in Software Development | (408,723 | ) | - | - | ||||||||
| Net Cash Used in Investing Activities | (2,689,425 | ) | (2,186,303 | ) | (2,084,739 | ) | ||||||
| Cash Flows from Financing Activities: | ||||||||||||
| Proceeds from Exercise of Warrants | - | 60,750 | 1,272,627 | |||||||||
| Repayment of Capital Leases | - | - | (16,882 | ) | ||||||||
| Repayment of Long-Term Debt and Notes Payable | - | (76,875 | ) | (197,167 | ) | |||||||
| Proceeds from Preferred Stock Offering | - | - | 24,813,000 | |||||||||
| Issuance Costs on Preferred Stock Offering | - | - | (214,169 | ) | ||||||||
| Proceeds from Common Stock Offerings | 21,128,502 | 21,112,500 | - | |||||||||
| Issuance Costs on Common Stock Offerings | (1,617,679 | ) | (1,874,485 | ) | - | |||||||
| Net Change in Lines of Credit | - | - | (112,500 | ) | ||||||||
| Proceeds from Exercise of Stock Options | - | 18,263 | - | |||||||||
| Net Cash Flows Provided by Financing Activities | 19,510,823 | 19,240,153 | 25,544,909 | |||||||||
| Net Increase in Cash and Cash Equivalents | 355,692 | 2,656,886 | 11,792,091 | |||||||||
| Cash and Cash Equivalents — Beginning of Period | 14,533,944 | 11,877,058 | 84,967 | |||||||||
| Cash and Cash Equivalents — End of Period | $ | 14,889,636 | $ | 14,533,944 | $ | 11,877,058 | ||||||
| Supplemental Disclosures | ||||||||||||
| Interest Paid in Cash | $ | 22,814 | $ | 7,696 | $ | 41,194 | ||||||
| Common Stock and Warrants Issued for Services | $ | 228,750 | $ | 174,026 | $ | 936,937 | ||||||
| Conversion of Term Debt and Accrued Interest into Common Stock | $ | 1,861,283 | $ | 342,036 | $ | 472,500 | ||||||
| Reclassification of Derivative Liability to Paid-In Capital upon Waiver of Certain Anti-Dilutive Provisions of Warrants and Convertible Debt | $ | - | $ | - | $ | 11,543,354 | ||||||
| Reclassification of Derivative Liability Upon Warrant Exercises | $ | - | $ | 32,911 | $ | 2,855,463 | ||||||
| Receivable from Stock Option Exercise | $ | - | $ | 14,820 | - | |||||||
The accompanying notes are an integral part of these consolidated financial statements.
| F-6 |
NOTES TO CONSOLIDATED FINANCIAL STATEMENTS
Note 1 — Summary of Significant Accounting Policies
Operations
Vuzix Corporation (the Company) was formed in 1997 under the laws of the State of Delaware and maintains its corporate offices in Rochester, New York. The Company is engaged in the design, manufacture, marketing and sale of wearable display devices, that are generally worn like eyeglasses, and are also referred to as head mounted displays (or HMDs), in the form of Augmented Reality (AR) glasses and Smart Glasses. Our wearable display products provide virtual large high-resolution screens, fit in a user’s pocket or purse and can be viewed practically anywhere, anytime. We produce and sell two main types of wearable display products: Smart Glasses for a variety of enterprise and commercial users and applications, including AR; and Video Viewing glasses, for on-the-go users as mobile displays for entertainment and social media use. Our products are available with varying features, including with and without applications running computer processors, and are offered as either monocular or binocular display systems.
Principles of Consolidation
The consolidated financial statements include the accounts of the Company and its wholly owned subsidiary, Vuzix Europe. All significant inter-company transactions have been eliminated. Certain prior year amounts have been reclassified to be consistent with current year presentation.
Segment Data, Geographic Information and Significant Customers
The Company is not organized by market and is managed and operated as one business. A single management team that reports to the chief operating decision maker comprehensively manages the entire business. The Company does not operate any material separate lines of business or separate business entities. Accordingly, the Company does not accumulate discrete information, other than product revenue and material costs, with respect to separate product lines and does not have separately reportable segments as defined by FASB ASC Topic 280, “Disclosures about Segments of an Enterprise and Related Information”.
Refer to Note 17 — Geographic Financial Information, Significant Customers and other financial information.
| F-7 |
VUZIX CORPORATION
NOTES TO CONSOLIDATED FINANCIAL STATEMENTS — (Continued)
Foreign Currency Transactions
The British Pound is the functional currency of the Company’s foreign subsidiary. Transactions are recorded at the functional currency of each subsidiary. Gains and losses arising upon settlement of foreign currency transactions are included in the determination of net loss. The financial statements of the foreign subsidiary are translated to the US dollar at each reporting date. The cumulative translation adjustment at December 31, 2017, 2016 and 2015 was not material, as well as from inception of UK subsidiary.
Use of Estimates
The preparation of the consolidated financial statements in conformity with accounting principles generally accepted in the United States requires management to make estimates and assumptions that affect the reported amounts of assets and liabilities and disclosure of contingent assets and liabilities at year end and the reported amounts of revenue and expenses during the reporting period. Actual results could differ from those estimates.
Concentration of Credit Risk
The Company maintains its cash in bank deposit accounts, which at times may exceed federally insured limits.
Cash and Cash Equivalents
Cash and cash equivalents can include highly liquid investments with original maturities of three months or less.
Fair Value of Financial Instruments
The Company’s financial instruments primarily consists of cash and cash equivalents, accounts receivable, accounts payable, long-term debt, customer deposits, accrued expenses, and income taxes payable.
As of the consolidated balance sheet dates, the estimated fair values of the financial instruments were not materially different from their carrying values as presented due to both the short maturities of these instruments and that the interest rates on borrowing approximate those that would have been available for loans for similar remaining maturity and risk profiles.
Accounts Receivable
The Company carries its trade accounts receivable at invoice amount less an allowance for doubtful accounts. The Company establishes an allowance for uncollectible trade accounts receivable based on the age of outstanding invoices and management’s evaluation of collectability of outstanding balances. These provisions are established when the aging of outstanding amounts exceeds allowable terms and are re-evaluated at each quarter end for adequacy. In determining the adequacy of the provision, the Company considers known uncollectible or at risk receivables. There was an allowance of $29,960 as of December 31, 2017. There was no allowance for doubtful accounts as of December 31, 2016. The Company does not accrue interest on a past due accounts receivable unless it goes into collection.
Accrued Project Revenue
The Company carries its accrued project revenue based on the percentage of completion on the project measured using the input method based upon costs incurred to-date as a percentage of total expected costs to complete the project.
Inventories
Inventories are valued at the lower of cost or net realizable value using the weighted average first-in, first-out method. The Company includes labor and overhead costs in its inventory valuation costing. The Company records provisions for excess, obsolete or slow moving inventory based on changes in customer demand, technology developments or other economic factors. The Company’s products have product life cycles that range on average from two to three years currently. At both the product introduction and product discontinuation stage, there is a higher degree of risk of inventory obsolescence. The provision for obsolete and excess inventory is evaluated for adequacy at each quarter end. The estimate of the provision for obsolete and excess inventory is partially based on expected future product sales, which are difficult to forecast for certain products.
| F-8 |
VUZIX CORPORATION
NOTES TO CONSOLIDATED FINANCIAL STATEMENTS — (Continued)
Revenue Recognition
The Company recognizes revenue from product sales in accordance with Financial Accounting Standards Board (“FASB”) Accounting Standards Codification (“ASC”) Topic 605 “Revenue Recognition”. Product sales represent the majority of the Company’s revenue. The Company recognizes revenue from these product sales when persuasive evidence of an arrangement exists, delivery has occurred, the sale price is fixed or determinable, and collectability is reasonably assured. The Company sells its products on terms which transfer title and risk of loss at a specified location, typically shipping point. Accordingly, revenue recognition from product sales occurs when all factors are met. If these conditions are not met, the Company will defer revenue recognition until such time as these conditions have been satisfied. The Company collects and remits sales taxes in certain jurisdictions and reports revenue net of any associated sales taxes. The Company also sells certain products through distributors who are granted limited rights of return for stock balancing against purchases made within a prior 90 day period, including downward price adjustments that the Company implements on any existing inventory. The provision for product returns and price adjustments is assessed for adequacy both at the time of sale and at each quarter end and is based on recent historical experience and known customer claims and was not material as of December 31, 2017, 2016 or 2015.
Revenue from any engineering consulting and other services is recognized at the time the services are rendered. The Company accounts for its longer-term development contracts, which to date have all been firm fixed-priced contracts, on the percentage-of-completion method, whereby income is recognized as work on contracts progresses, but estimated losses on contracts in progress are charged to operations immediately. The percentage-of-completion is determined using the cost-to-cost method. To date, all such contracts have been less than one calendar year in duration.
The Company recognizes software license revenue under ASC 985-605 “Software Revenue Recognition” and under ASC 605-25 “Revenue Arrangements with Multiple Deliverables”, and related interpretations, as amended.
Licensed software may be sold as a stand-alone element, with other software elements, or in conjunction with hardware products. When the Company’s products consist of more than one element, the product is considered to be a multiple element arrangement (MEA). When sold as a stand-alone element, the revenue is recognized upon shipment as discussed above. When sold as part of a MEA, revenue from the licensed software is recognized when the product with this embedded software is shipped to the customer.
For either a single element transaction or a MEA, the Company allocates consideration to all deliverables based on their relative stand-alone selling prices. Amendments to ASC 605-25 establish a hierarchy to determine the stand-alone selling price as follows:
| · | Vendor Specific Objective Evidence of the fair value (VSOE); | |
| · | Third Party Evidence (TPE); and | |
| · | Best Estimate of the Selling Price (BESP) |
Sales which constitute a MEA are accounted for by determining if the elements can be accounted for as separate accounting units, and if so, by applying values to those units, per the hierarchy above. If VSOE is not available, management estimates the fair selling price using historical pricing for similar items, in conjunction with current pricing and discount policies.
Revenue from licensed software is recognized upon shipment and in accordance with industry-specific software recognition accounting guidance. Software updates that will be provided free of charge are evaluated on a case-by-case basis to determine whether they meet the definition of an upgrade and create a multiple element arrangement. The consideration allocated to the unspecified software upgrade rights and non-software services is deferred and recognized ratably over the 24-month estimated life of the devices. The Company’s BESP for the unspecified software upgrade right and non-software services is $25 per unit for the M300 and M100 Smart Glass and had been $40 for M100 software developer kits, which became free in Fall 2015 and therefore no new amounts are being deferred related to developer kits.
Refer to Recent Accounting Pronouncements later in this Note for the expected future impact of updated FASB accounting guidance.
| F-9 |
VUZIX CORPORATION
NOTES TO CONSOLIDATED FINANCIAL STATEMENTS — (Continued)
Unearned Revenue
These amounts represent deferred revenue against unfulfilled deliverables of multiple-element products, including unspecified post-delivery support and software updates.
Cost of Product Revenues
Cost of product revenue includes the direct and allocated indirect costs of products sold to customers. Direct costs include labor, materials, reserves for estimated warranty expenses, and other costs incurred directly, or charged to us by our contract manufacturers in the manufacture of these products. Indirect costs include labor, manufacturing overhead, and other costs associated with operating our manufacturing capabilities and capacity. Manufacturing overhead includes the costs of procuring, inspecting and storing material, facility and other costs, and is allocated to cost of product revenue based on the proportion of indirect labor which supported production activities. The cost of product revenue can fluctuate significantly from period to period, depending on the product mix and volume, the level of manufacturing overhead expense and the volume of direct material purchased.
Cost of Engineering Services Revenues
Cost of contract revenue includes both the direct and allocated indirect costs of performing on contracts and producing prototype units. Direct costs include labor, materials and other costs incurred directly in producing prototype units and product deliveries or performing on a contract. Indirect costs include labor and other costs associated with operating our research and development department based on the level of effort supporting the development activity. Cost of contract revenue is determined by the level of direct and indirect costs incurred, which can fluctuate substantially from period to period.
Fixed Assets
Fixed assets are stated at cost. Depreciation of fixed assets is provided for using the straight-line method over the following estimated useful lives:
| Computers and Purchased Software | 3 years |
| Leasehold Improvements | Lesser of expected life or lease term |
| Manufacturing Equipment | 5 years |
| Tooling | 3 years |
| Furniture and Equipment | 5 years |
Repairs and maintenance costs are expensed as incurred. Asset betterments are capitalized and depreciated over their expected useful life.
Patents and Trademarks
The Company capitalizes the costs of obtaining its patents and registration of trademarks. Such costs are accumulated and capitalized during the filing periods, which can take several years to complete. Successful applications that result in the granting of a patent or trademark are then amortized over 15 years on a straight-line basis. Unsuccessful applications are written off and expensed in the fiscal period where the application is abandoned or discontinued.
| F-10 |
VUZIX CORPORATION
NOTES TO CONSOLIDATED FINANCIAL STATEMENTS — (Continued)
Software Development Costs
The Company capitalizes the costs of obtaining or developing its software once technological feasibility has been determined by management. Such costs are accumulated and capitalized and projects can take several years to complete. Unsuccessful or discontinued software projects are written off and expensed in the fiscal period where the software development effort is abandoned or discontinued. Costs incurred internally in researching and developing a computer software product are charged to expense until technological feasibility has been established for the product. Once technological feasibility is established, all software costs are capitalized until the product is available for general release to customers. Judgment is required in determining when technological feasibility of a product is established. Once the product is available for general release, accumulated costs are amortized over the life of the asset. The amortization of these costs is included in cost of revenue over the estimated life of the products, which currently is estimated as 3 years using a straight-line basis.
Licenses
The Company capitalizes the costs of acquiring licenses and prepaid royalties. They are amortized on either a per unit basis or straight line over the life of the license. In some cases, future royalties are subject to annual limits.
Long-Lived Assets
The Company at least annually assesses all of its long-lived assets for impairment when events or circumstances indicate their carrying amounts may not be recoverable, in accordance with FASB ASC Topic 360-10, “Accounting for the Impairment or Disposal of Long-Lived Assets.” There was no impairment charge in 2017. In 2016, an impairment charge of $20,506 was recorded related to abandoned patents and trademarks. In 2015, an impairment charge of $13,222 was recorded related to abandoned patents and trademarks.
Research and Development
Research and development costs are expensed as incurred consistent with the guidance of FASB ASC Topic 730, “Research and Development,” and include employee related costs, office expenses, third party design and engineering services, and new product prototyping costs. Costs incurred internally in researching and developing a computer software product are charged to expense until technological feasibility has been established for the product.
Shipping and Handling Costs
Amounts charged to customers and costs incurred by the Company related to shipping and handling are included in net sales and cost of sales, respectively.
| F-11 |
VUZIX CORPORATION
NOTES TO CONSOLIDATED FINANCIAL STATEMENTS — (Continued)
Provision for Future Warranty Costs
The Company provides for the estimated returns under warranty and the costs of fulfilling our obligations under product warranties at the time the related revenue is recognized. The Company estimates the costs based on historical and projected product failure rates, historical and projected repair costs, and knowledge of specific product failures (if any). The specific warranty terms and conditions vary depending upon the country in which we do business, but generally include parts and labor over a period generally ranging from one to two years from the date of product shipment. The Company provides a reserve for expected future warranty returns at the time of product shipment or produces over-builds to cover replacements. We regularly reevaluate our estimates to assess the adequacy of the recorded warranty liabilities and adjust the amounts as necessary each quarter end, based on historical experience of warranty claims and costs.
Customer Deposits
Customer deposits represent money the Company has received in advance of providing a product or engineering services to a customer. All such deposits are short term in nature as the Company delivers the product, unfulfilled portions or engineering services to the customer before the end of its next annual fiscal period. These deposits are credited to the customer against product deliveries or at the completion of the customer’s order.
Advertising
Advertising costs are expensed as incurred and recorded in “Selling and Marketing” in the Consolidated Statements of Operations. Advertising expense for the years ended December 31, 2017, 2016 and 2015 amounted to $1,386,977, $1,279,998 and $432,325, respectively.
Income Taxes
The Company accounts for income taxes in accordance with FASB ASC Topic 740-10, “Income Taxes.” Accordingly, the Company provides deferred income tax assets and liabilities based on the estimated future tax effects of differences between the financial and tax bases of assets and liabilities based on currently enacted tax laws. A valuation allowance is established for deferred tax assets in amounts for which realization is not considered more likely than not to occur.
The Company reports any interest and penalties accrued relating to uncertain income tax positions as a component of the income tax provision.
Net Loss Per Share
Basic earnings per share is computed by dividing the net income (loss) less accrued dividends on any outstanding preferred stock by the weighted average number of common shares outstanding for the period. Diluted earnings per share calculations reflect the assumed exercise of all dilutive employee stock options and warrants applying the treasury stock method promulgated by FASB ASC Topic 260, “Earnings Per Share” and the conversion of any outstanding convertible preferred shares or notes payable that are-in-the-money, applying the as-if-converted method. However, if the assumed exercise of stock options and warrants and the conversion of any preferred shares or convertible notes payable are anti-dilutive, basic and diluted earnings per share are the same for all periods. As a result of the net losses generated in 2017, 2016 and 2015, all outstanding instruments would be antidilutive. As of December 31, 2017, 2016 and 2015, there were 7,657,756, 7,227,738 and 7,475,623 respectively, of common stock share equivalents potentially issuable under convertible debt agreements, options, conversion of preferred shares (excluding accrued dividends), and warrants that could potentially dilute basic earnings per share in the future.
| F-12 |
VUZIX CORPORATION
NOTES TO CONSOLIDATED FINANCIAL STATEMENTS — (Continued)
Stock-Based Compensation Expense
The Company accounts for share-based compensation to employees and directors in accordance with FASB ASC Topic 718 “Compensation Stock Expense,” which requires that compensation expense be recognized in the consolidated financial statements for share-based awards based on the grant-date fair value using a Black-Scholes valuation model of those awards. The Company uses the fair market value of our common stock on the date of each option grant based on the market price of the Company’s common shares. Stock-based compensation expense includes estimates of forfeitures, option lives, and stock price volatility, and is recognized over the requisite service period of the awards on a straight-line or graded vesting basis, which is generally commensurate with the vesting term. Stock-based compensation expense associated with stock option grants for the years ended December 31, 2017, 2016 and 2015 was $ 1,355,522, $756,928 and $568,848, respectively. The Company issues new shares upon stock option exercises.
Derivative Liability and Fair Value Measurements
FASB ASC Topic 820, “Fair Value Measurements and Disclosures” defines fair value, establishes a framework for measuring fair value in generally accepted accounting principles, and expands disclosures about fair value measurements. ASC 820 clarifies that fair value is an exit price, representing the amount that would be received to sell an asset or paid to transfer a liability in an orderly transaction between market participants. ASC 820 permits an entity to measure certain financial assets and financial liabilities at fair value with changes in fair value recognized in earnings each period. In accordance with ASC 815-10-25 Derivatives and Hedging we measured the derivative liabilities using a Monte Carlo Options Lattice pricing model at their issuance date and at each subsequent reporting date. Accordingly, at the end of each quarterly reporting date, the derivative fair market value is remeasured and adjusted to current market value. Derivatives that have more than one year remaining in their life are shown as long term.
Significant unobservable inputs are used in the fair value measurement of the Company’s derivative liability. The primary input factors driving the economic or fair value of the derivative liabilities related to the warrants and convertible notes are the stock price of the Company’s shares, the price volatility of the shares, reset events, and exercise behavior. An important valuation input factor used in determining fair value was the expected volatility of observed share prices and the probability of projected resets in warrant exercise and note conversion prices from financing events before each security’s maturity. For exercise behavior, the Company assumed that without a target price of 2 times the projected reset price or higher, the holders of the warrants and convertible notes would hold to maturity. In determining the fair value of the derivatives it was assumed that the Company’s business would be conducted as a going concern and that holding to maturity was reasonable. Further, the January 2, 2015 Series A Preferred financing reduced the expected probability to near zero for price resets from financing events.
Fair value is defined as the price that would be received to sell an asset or paid to transfer a liability in an orderly transaction between market participants at the measurement date. ASC Topic 820 establishes a three-tier fair value hierarchy which prioritizes the inputs used in measuring fair value. The hierarchy gives the highest priority to unadjusted quoted prices in active markets for identical assets or liabilities (level 1 measurements) and the lowest priority to unobservable inputs (level 3 measurements). These tiers include:
| o | Level 1, defined as observable inputs such as quoted prices for identical instruments in active markets; | |
| o | Level 2, defined as inputs other than quoted prices in active markets that are either directly or indirectly observable such as quoted prices for similar instruments in active markets or quoted prices for identical or similar instruments in markets that are not active; and | |
| o | Level 3, defined as unobservable inputs in which little or no market data exists, therefore requiring an entity to develop its own assumptions, such as valuations derived from valuation techniques in which one or more significant inputs or significant value drivers are unobservable. |
| F-13 |
VUZIX CORPORATION
NOTES TO CONSOLIDATED FINANCIAL STATEMENTS — (Continued)
Recent Accounting Pronouncements
In July 2017, the FASB issued ASU 2017-11, Earnings Per Share (Topic 260), Distinguishing Liabilities from Equity (Topic 480), Derivatives and Hedging (Topic 815).This ASU requires that when determining whether certain financial instruments should be classified as liabilities or equity instruments, an entity should not consider the down round feature. The ASU also recharacterizes as a scope exception the indefinite deferral available to private companies with mandatorily redeemable financial instrument and certain noncontrolling interests, which does not have an accounting effect but addresses navigational concerns within the FASB Accounting Standards Codification. The provisions of the ASU related to down rounds are effective for public business entities for fiscal years, and interim periods within those fiscal years, beginning after December 15, 2018. We do not expect the implementation of this standard to have a material effect on our financial statements.
In May 2017, the Financial Accounting Standards Board (FASB) issued ASU 2017-09, Compensation - Stock Compensation (Topic 718): Scope of Modification Accounting, which provides guidance about which changes to the terms or conditions of a share-based payment award require an entity to apply modification accounting in Topic 718. The new standard is effective for annual reporting periods, including interim periods within those annual periods, beginning after December 15, 2017. Early adoption is permitted. We do not expect the adoption of ASU 2017-09 to have a material impact on our consolidated financial statements and related disclosures because we do not anticipate any changes to our share-based payment plans.
In November 2016, the Financial Accounting Standards Board (FASB) issued Accounting Standards Update 2016-18 (ASU 2016-18), Restricted Cash. The standard requires restricted cash and cash equivalents to be included with cash and cash equivalents on the statement of cash flows. The new standard is effective for fiscal years, and interim periods within those fiscal years, beginning after December 15, 2017, with early adoption permitted. The new guidance shall be applied using a retrospective approach. We do not expect the implementation of this standard to have a material effect on our financial statements.
In February 2016, the FASB issued Accounting Standards Update 2016-02 (ASU 2016-02), Leases (Topic 842). ASU 2016-02 requires lessees to recognize a right-of-use asset and lease liability in the balance sheet for all leases, including operating leases, with terms of more than twelve months. Recognition, measurement and presentation of expenses and cash flows from a lease by a lessee have not significantly changed from previous guidance. The amendments also require qualitative disclosures along with specific quantitative disclosures. The new guidance will be effective for fiscal years beginning after December 15, 2018, and interim periods within those years, with early adoption permitted. The amendments must be applied on a modified retrospective basis. We anticipate the adoption of this standard will have a material impact on our financial statements. While we are continuing to assess all the potential impacts of the standard, we currently believe the most significant impact relates to our accounting for our office lease. Under the new guidance, the net present value of the obligation for our office lease will appear on the balance sheet. Currently, it is classified as an operating lease and payments are expensed in the periods incurred.
In May 2014, the FASB issued Accounting Standards Update No. 2014-09 (Topic 606) "Revenue from Contracts with Customers." Topic 606 supersedes the revenue recognition requirements in Topic 605 “Revenue Recognition” (Topic 605), and requires entities to recognize revenues when control of the promised goods or services is transferred to customers at an amount that reflects the consideration to which the entity expects to be entitled to in exchange for those goods or services. We adopted Topic 606 as of January 1, 2018 using the modified retrospective transition method. Results for reporting periods beginning after January 1, 2018 will be presented under Topic 606, while prior period amounts are not adjusted and continue to be reported in accordance with our historic accounting treatment under Topic 605. We recorded a net increase to opening retained earnings of less than $100,000, net of tax, as of January 1, 2018 due to the cumulative impact of adopting Topic 606, with the impact primarily related to our post contract support (PCS deferred revenue).
| F-14 |
VUZIX CORPORATION
NOTES TO CONSOLIDATED FINANCIAL STATEMENTS — (Continued)
Recently Adopted Accounting Pronouncements
In March 2016, the FASB issued ASU No. 2016-09 Compensation - Stock Compensation (Topic 718): Improvements to Employee Share-Based Payment Accounting which amends the current stock compensation guidance. The amendments simplify the accounting for the taxes related to stock based compensation, including adjustments to how excess tax benefits and a company's payments for tax withholdings should be classified. Under this new guidance, entities must elect whether to account for forfeitures of share-based payments by (1) recognizing forfeitures of awards as they occur or (2) apply an estimated forfeiture rate, as is currently required. The standard is effective for fiscal periods beginning after December 15, 2016. We have adopted this standard for the year ended December 31, 2017 and have elected to account for forfeitures as they occur. The adoption of this standard did not have a material impact on our consolidated financial statements.
In November 2015, the FASB issued Accounting Standards Update (“ASU”) No. 2015-17, Income Taxes (Topic 740): Balance Sheet Classification of Deferred Taxes. ASU 2015-17 simplifies the presentation of deferred income taxes by requiring that deferred tax liabilities and assets be classified as noncurrent in a classified statement of financial position. The standard is effective for financial statements issued for annual periods beginning after December 15, 2016, and interim periods within those annual periods and may be applied either prospectively to all deferred tax liabilities and assets or retrospectively to all periods presented. We have adopted this standard for the year ended December 31, 2017 on a prospective basis; therefore, all deferred tax assets and liabilities have been classified as noncurrent in the accompanying Consolidated Balance Sheets. Noncurrent deferred tax assets and noncurrent deferred tax liabilities are included in other assets and other long-term liabilities, respectively, in the accompanying Consolidated Balance Sheets. As of December 31, 2017, the Company had a full valuation allowance against all net deferred tax assets, as such the adoption of this standard did not have a material impact on our consolidated financial statements.
There are no other recent accounting pronouncements that are expected to have a material impact on the consolidated financial statements.
Note 2 — Inventories, Net
Inventories consisted of the following:
| December 31, 2017 | December 31, 2016 | |||||||
| Purchased Parts and Components | $ | 1,669,209 | $ | 1,990,026 | ||||
| Work in Process | 25,090 | 454,120 | ||||||
| Finished Goods | 2,994,342 | 831,069 | ||||||
| Less: Reserve for Obsolescence | (836,324 | ) | (623,997 | ) | ||||
| Net | $ | 3,852,317 | $ | 2,651,218 | ||||
In addition to its normal Reserve for Obsolescence provision, the Company wrote-down to net realizable value all of its component and finished goods inventory related to its iWear Video Headphones, as well as accrued all related contractual obligations, resulting from the decision in the third quarter of 2017 to further reduce the suggested retail selling price to a price below the cost. The loss totaled $1,151,482 for the year ended December 31, 2017 and reduced the carrying value of such inventory to its estimated net realizable value, net of the costs of completion of components and work in progress. As of December 31, 2016, the Company wrote-down to net realizable value all of its component and finished goods inventory related to its iWear Video Headphones resulting from the decision in early 2017 to reduce the suggested retail selling price to a price below the cost. The write down for that 2016 period totaled $1,124,401 and reduced the carrying value of such inventory to its estimated net realizable value, net of the costs of completion of components and work in progress. These provisions have been included in Operating Expenses on the Consolidated Statement of Operations.
| F-15 |
VUZIX CORPORATION
NOTES TO CONSOLIDATED FINANCIAL STATEMENTS — (Continued)
Note 3 — Fixed Assets, Net
Fixed Assets consisted of the following:
| December 31, 2017 | December 31, 2016 | |||||||
| Tooling and Manufacturing Equipment | $ | 3,965,251 | $ | 2,702,468 | ||||
| Leaseholds | 443,332 | 403,737 | ||||||
| Computers and Purchased Software | 646,272 | 585,795 | ||||||
| Furniture and Equipment | 1,322,405 | 1,359,522 | ||||||
| 6,377,260 | 5,051,522 | |||||||
| Less: Accumulated Depreciation | (2,252,794 | ) | (1,686,614 | ) | ||||
| Fixed Assets, Net | $ | 4,124,466 | $ | 3,364,908 | ||||
Total depreciation expense for fixed assets for the years ended December 31, 2017, 2016 and 2015 was $921,113, $663,934 and $294,363, respectively.
Note 4 — Patents and Trademarks, Net
| December 31, 2017 | December 31, 2016 | |||||||
| Patents and Trademarks | $ | 1,325,905 | $ | 970,178 | ||||
| Less: Accumulated Amortization | (512,131 | ) | (434,717 | ) | ||||
| Patents and Trademarks, Net | $ | 813,774 | $ | 535,461 | ||||
Total amortization expense for patents and trademarks for the years ended December 31, 2017, 2016 and 2015 was $77,415, $106,734 and $86,478, respectively. The estimated aggregate annual amortization expense for each of the next five fiscal years is approximately $88,000. We recorded an impairment charge of $20,506 representing cost of $44,371, less accumulated amortization of $23,865 for the year ended December 31, 2016. We recorded an impairment charge of $13,222 representing cost of $21,954, less accumulated amortization of $8,732 for the year ended December 31, 2015 regarding our abandoned patents and trademarks. We recorded no patent impairment charges for the year ended December 31, 2017.
| F-16 |
VUZIX CORPORATION
NOTES TO CONSOLIDATED FINANCIAL STATEMENTS — (Continued)
Note 5 — Software Development Costs, Net
| December 31, 2017 | December 31, 2016 | |||||||
| Software Development Costs | $ | 859,351 | $ | 859,351 | ||||
| Less: Accumulated Amortization | (859,351 | ) | (644,513 | ) | ||||
| Additions | 408,723 | — | ||||||
| Software Development Costs, Net | $ | 408,723 | $ | 214,838 | ||||
Total amortization expense for capitalized software development costs for the years ended December 31, 2017, 2016 and 2015 was $214,838, $286,450 and $286,450, respectively. These costs are being amortized over 3 years and have been included in Cost of Sales – Products in the Consolidated Statement of Operations. The software development was completed in September 2014 and was fully amortized as of September 30, 2017. During the year ended December 31, 2017 new software development related costs totaling $408,723 were capitalized.
Note 6 — Licenses, Net
| December 31, 2017 | December 31, 2016 | |||||||
| Licenses | $ | 243,717 | $ | — | ||||
| Less: Accumulated Amortization | - | — | ||||||
| Licenses, Net | $ | 243,717 | $ | — | ||||
The Company acquired two licenses in 2017. The first related to the renegotiation of an existing license at a cost of $114,967, which will result in lower royalty rates being paid by the Company over the next 10 years. This license will take effect as of January 1, 2018.
The Company entered into Technology Acquisition Agreement where it acquired all the seller's right, title and interest in certain Transferred Intellectual Property (IP). Pursuant to the agreement, the Company paid approximately $75,702 as reimbursement of related patent application costs incurred by the seller to date, which are included in Patents and Trademarks. The Company also issued 25,000 shares, valued at $128,750, upon the closing and will issue (i) a further 25,000 shares after the Company has successfully developed a working demonstrator system utilizing the IP; and (ii) 50,000 shares once the Company completes the successful commercialization of products containing the IP for sale in the marketplace. The Company estimates that it will take up to 24 months and approximately $200,000 in new R&D spending to achieve the first development milestone of a functional demonstrator model.
There was no amortization expense related to licenses in the years ended December 31, 2017, 2016 and 2015.
Note 7 — Accrued Expenses
Accrued expenses consisted of the following:
| December 31, 2017 | December 31, 2016 | |||||||
| Accrued Wages and Related Costs | $ | 163,305 | $ | 119,472 | ||||
| Accrued Compensation | 327,469 | 648,720 | ||||||
| Accrued Professional Services | 531,728 | 137,099 | ||||||
| Accrued Warranty Obligations | 167,503 | 41,132 | ||||||
| Accrued Interest | 171,435 | 375,560 | ||||||
| Other Accrued Expenses | 10,000 | 10,000 | ||||||
| Total | $ | 1,371,440 | $ | 1,331,983 | ||||
| F-17 |
VUZIX CORPORATION
NOTES TO CONSOLIDATED FINANCIAL STATEMENTS — (Continued)
Included in the above accrued compensation are amounts owed to officers of the Company for services rendered that remain outstanding primarily for 2016 and prior years. The amounts are not subject to a fixed repayment schedule and they bear interest at a rate of 8% per year, compounding monthly. The related interest amounts on the unpaid accrued officer compensation included in Accrued Interest were $171,435 and $141,645, respectively, at December 31, 2017 and December 31, 2016.
The Company has warranty obligations in connection with the sale of certain of its products. The warranty period for its products is generally one year except in certain European countries where it is two years for some of our products. The costs incurred to provide for these warranty obligations are estimated and recorded as an accrued liability at the time of sale. The Company estimates its future warranty costs based on product-based historical performance rates and related costs to repair.
The changes in the Company’s accrued warranty obligations for the years ended December 31, 2017, 2016 and 2015 were as follows:
| Accrued Warranty Obligations at December 31, 2014 | $ | 39,624 | ||
| Reductions for Settling Warranties | (67,858 | ) | ||
| Warranty Issued During Year | 92,236 | |||
| Accrued Warranty Obligations at December 31, 2015 | 64,002 | |||
| Reductions for Settling Warranties | (103,265 | ) | ||
| Warranty Issued During Year | 80,395 | |||
| Accrued Warranty Obligations at December 31, 2016 | 41,132 | |||
| Reductions for Settling Warranties | (157,035 | ) | ||
| Warranty Issued During Year | 283,406 | |||
| Accrued Warranty Obligations at December 31, 2017 | $ | 167,503 |
Note 8 — Derivative Liability and Fair Value Measurements
The Company recognized a derivative liability for the warrants to purchase shares of its common stock issued in connection with the equity offering and related debt conversions on August 5, 2013. These warrants have a cashless exercise provision and an exercise price that is subject to adjustment in the event of subsequent equity sales at a lower purchase price (subject to certain exceptions) along with full-ratchet anti-dilution provisions. In accordance with ASC 815-10-25 Derivatives and Hedging we measured the derivative liability using a Monte Carlo Options Lattice pricing model at the warrants’ life/ maturity issuance date and subsequently remeasured the liability on each reporting date.
Accordingly, at the end of each quarterly reporting date the derivative fair market value is remeasured and adjusted to current market value. As at December 31, 2017 and 2016 a total of 38,100 warrants were outstanding that contained a full-ratchet anti-dilution provision. In connection with the Series A Private Placement on January 2, 2015 (see Note 11), holders of approximately 86% of outstanding warrants issued by the Company in its public offering and in connection with the conversion by certain holders of the Company’s outstanding debt in connection with the Company’s public offering (collectively, the “Public Offering Warrants”) agreed to irrevocably waive their rights to anti-dilution protection under Section 2(b) of the Public Offering Warrants in the event the Company issues additional securities at a per share price lower than the exercise price of the Public Offering Warrants (the “Public Offering Warrant Waiver”). As a result, the related derivative liability was reversed to zero and reclassified into stockholders’ equity under Additional Paid-In Capital.
The Company recognized a derivative liability during the year ended December 31, 2014 for the $3,000,000 of senior convertible notes with a conversion price that is subject to adjustment in the event of subsequent equity sales at a lower purchase price (subject to certain exceptions). In accordance with ASC 815-10-25, we measured the derivative liability of this embedded conversion option using a Monte Carlo Options Lattice pricing model at the June 3, 2014 issuance date as $1,938,988. The value of the derivative liability at issuance was recorded as a discount against the notes in the Long-Term Debt section of the balance sheet. Accordingly, at the end of each quarterly reporting date, the derivative fair market value was remeasured and adjusted to current market value.
In connection with the Series A Private Placement on January 2, 2015, each of the holders of notes issued by the Company on June 3, 2014 (the “June 2014 Notes”) agreed to irrevocably waive their rights to anti-dilution protection under Section 5(b) of the June 2014 Notes in the event the Company issues additional securities at a per share price lower than the conversion price of the June 2014 Notes (the “June 2014 Note Waiver”). As a result this derivative liability was reversed to zero and reclassified into stockholders’ equity under Additional Paid-In Capital.
| F-18 |
VUZIX CORPORATION
NOTES TO CONSOLIDATED FINANCIAL STATEMENTS — (Continued)
We measure certain financial instruments at fair value on a recurring basis. Assets and liabilities measured at fair value on a recurring basis are as follows at December 31, 2017 and 2016:
| 2017: | Total | Level 1 | Level 2 | Level 3 | ||||||||||||
| Warrant Liability | $ | 152,927 | $ | — | $ | — | $ | 152,927 | ||||||||
| Total liabilities measured at fair value (Current Liabilities) | $ | 152,927 | $ | — | $ | — | $ | 152,927 | ||||||||
| 2016: | Total | Level 1 | Level 2 | Level 3 | ||||||||||||
| Warrant Liability | $ | 173,131 | $ | — | $ | — | $ | 173,131 | ||||||||
| Total liabilities measured at fair value (Long-Term) | $ | 173,131 | $ | — | $ | — | $ | 173,131 | ||||||||
Changes in the fair value of the warrant liability were as follows:
| Fair value – December 31, 2014 | $ | 13,541,138 | ||
| Reclassification of warrant exercises to Additional Paid-in Capital | (2,855,463 | ) | ||
| Change in fair value for the period of warrant derivative liability | 1,098,465 | |||
| Reclassification of embedded debt conversion price adjustment provision liability to Additional Paid-in Capital upon waiver of certain anti-dilutive provisions | (2,806,942 | ) | ||
| Reclassification of warrant exercise price adjustment provision liability to Additional Paid-in Capital upon waiver of certain anti-dilutive provisions | (8,736,412 | ) | ||
| Fair value – December 31, 2015 | 240,786 | |||
| Reclassification of warrant exercises to Additional Paid-in Capital | (32,911 | ) | ||
| Change in fair value for the period of warrant derivative liability | (34,744 | ) | ||
| Fair value – December 31, 2016 | 173,131 | |||
| Reclassification of warrant exercises to Additional Paid-in Capital | — | |||
| Change in fair value for the period of warrant derivative liability | (20,204 | ) | ||
| Fair value – December 31, 2017 | $ | 152,927 |
The Monte Carlo Options Lattice pricing model was used to estimate the fair value of warrants outstanding and reflected the following assumptions:
| December 31, 2017 | December 31, 2016 | December 31, | ||||||||||
| Assumptions for Pricing Model: | ||||||||||||
| Expected term in years | 0.59 | 1.22 | 2.60 | |||||||||
| Volatility range for years | 143 | % | 100 | % | 103 | % | ||||||
| Risk-free interest rate | 1.76 | % | 1.47 | % | 1.06 | % | ||||||
| Expected annual dividends | None | None | None | |||||||||
| Value of warrants outstanding: | ||||||||||||
| Fair value of warrants | $ | 152,927 | $ | 173,131 | $ | 240,786 | ||||||
| F-19 |
VUZIX CORPORATION
NOTES TO CONSOLIDATED FINANCIAL STATEMENTS — (Continued)
Note 9 — Long-Term Debt
Long-term debt consisted of the following:
| December 31, 2017 | December 31, 2016 | |||||||
| Convertible, Senior Secured Notes payable. The principal was due June 3, 2017 and no payments were required prior to maturity. The notes carried a 5% annual interest rate, payable upon the notes’ maturity. Both the principal plus accrued interest were convertible into shares of the Company’s common stock at $2.25, subject to normal adjustments. The notes were secured by a first security position in all the assets of the Company. | $ | — | $ | 1,591,740 | ||||
| Convertible, Senior Secured Notes Debt Issuance Costs of $139,340, net of accumulated amortization. | — | (19,500 | ) | |||||
| Unamortized debt discount related to derivative liability associated with above notes’ conversion price that is subject to adjustment in the event of subsequent equity sales at a lower purchase price (subject to certain exceptions). Upon issuance on June 3, 2014, the discount was $1,938,988. | — | (155,760 | ) | |||||
| — | 1,416,480 | ) | ||||||
| Less: Amount Due Within One Year | — | (1,416,480 | ) | |||||
| Amount Due After One Year | $ | — | $ | — | ||||
All of the $1,591,740 in Convertible Senior Secured Notes outstanding as of December 31, 2016, were converted into 707,440 shares of common stock during the year ended December 31, 2017 and $269,543 of accrued interest on these Notes was converted into 119,797 shares of common stock during the year ended December 31, 2017.
| F-20 |
VUZIX CORPORATION
NOTES TO CONSOLIDATED FINANCIAL STATEMENTS — (Continued)
Note 10 — Income Taxes
The Company files U.S. federal and various state and foreign tax returns.
Pre-tax earnings consisted of the following for the years ended:
| December 31, | December 31, | December 31, | ||||||||||
| 2017 | 2016 | 2015 | ||||||||||
| Pre-Tax (Loss) | ||||||||||||
| U.S. | $ | (19,680,720 | ) | $ | (19,263,625 | ) | $ | (13,425,887 | ) | |||
| Outside the U.S. | 47,218 | 43,543 | (1,591 | ) | ||||||||
| Total Pre-Tax (Loss) | $ | (19,633,502 | ) | $ | (19,250,082 | ) | $ | (13,427,478 | ) | |||
The provision expense/(benefit) for income taxes for the years ended December 31, 2017, 2016 and 2015 was as follows:
| 2017 | 2016 | 2015 | ||||||||||
| U.S. Income Taxes: | ||||||||||||
| Current Provision | $ | — | $ | — | $ | — | ||||||
| Deferred Provision | 3,639,752 | (5,963,589 | ) | (3,730,342 | ) | |||||||
| Valuation Allowance | (3,639,752 | ) | 5,963,589 | 3,730,342 | ||||||||
| Income Taxes Outside the U.S.: | ||||||||||||
| Current Provision | — | — | — | |||||||||
| Deferred Provision | 215,745 | (197,907 | ) | — | ||||||||
| Valuation Allowance | (215,745 | ) | 197,907 | — | ||||||||
| State Income Taxes: | ||||||||||||
| Current Provision | — | — | — | |||||||||
| Deferred Provision | (59,530 | ) | (75,442 | ) | (128,572 | ) | ||||||
| Valuation Allowance | 59,530 | 75,442 | 128,572 | |||||||||
| Total Provision | $ | — | $ | — | $ | — | ||||||
A reconciliation of the statutory U.S. federal income tax rate to the effective rates for the years ended December 31, 2017, 2016 and 2015 is as follows:
| 2017 % | 2016 % | 2015 % | ||||||||||
| Federal Income Tax at Statutory Rate | 34.0 | 34.0 | 34.0 | |||||||||
| State Tax Provision, Net of Federal Benefit | 0.3 | 0.3 | 0.3 | |||||||||
| Foreign Income Taxed at Other Than 34% | — | (0.7 | ) | — | ||||||||
| Change in Corporate Tax Rates from 34% to 21% | (52.9 | ) | — | — | ||||||||
| Loss on Derivative Valuation | — | — | (6.3 | ) | ||||||||
| Other | (0.7 | ) | 0.5 | 0.7 | ||||||||
| Effective Tax Rate | (19.3 | ) | 34.1 | 28.7 | ||||||||
| Change in Valuation Allowance | 19.3 | (34.1 | ) | (28.7 | ) | |||||||
| Net Effective Tax Rate | — | — | — | |||||||||
| F-21 |
VUZIX CORPORATION
NOTES TO CONSOLIDATED FINANCIAL STATEMENTS — (Continued)
Significant components of the Company’s deferred tax assets and liabilities at year end are as follows:
| December 31, | December 31, | December 31, | ||||||||||
| 2017 | 2016 | 2015 | ||||||||||
| Deferred Tax Assets: | ||||||||||||
| Net Operating Loss Carry-forwards | $ | 16,167,791 | $ | 19,752,311 | $ | 15,027,603 | ||||||
| Tax Credit Carry-forwards | 2,404,490 | 2,398,817 | 1,823,661 | |||||||||
| Inventory Valuation Adjustment | 675,830 | 622,168 | 161,944 | |||||||||
| Officer’s Compensation | 86,670 | 271,095 | 141,491 | |||||||||
| Loss from Foreign Operations | — | 197,907 | — | |||||||||
| Other | 108,734 | 44,372 | 89,783 | |||||||||
| Total Deferred Tax Assets | 19,443,515 | 23,286,670 | 17,244,482 | |||||||||
| Deferred Tax Liabilities: | ||||||||||||
| Income from Foreign Operations | 17,838 | |||||||||||
| Other | 11,789 | |||||||||||
| Total Deferred Tax Liabilities | 29,627 | 76,815 | 271,565 | |||||||||
| Net Deferred Tax Assets Before Valuation Allowance | $ | 19,413,888 | $ | 23,209,855 | $ | 16,972,917 | ||||||
| Valuation Allowance | (19,413,888 | ) | (23,209,855 | ) | (16,972,917 | ) | ||||||
| Net Deferred Tax Assets | $ | — | $ | — | $ | — | ||||||
As of December 31, 2017, the Company has approximately $76 million in net operating loss carry-forwards and approximately $2.4 million of federal and state credit carry-forwards which will begin to expire in 2018 if not utilized. Utilization of the NOL carry-forwards may be subject to an annual limitation in the case of sufficient equity ownership changes under Section 382 of the tax law or the NOL’s may expire unutilized.
As a result of the assessment of the FASB ASC 740-10 (Prior Authoritative Literature: FASB Interpretation No. 48 (“FIN 48”), Accounting for Uncertainty in Income Taxes — An Interpretation of FASB Statement No. 109), the Company has no unrecognized tax benefits. By statute, tax years 2013-2017 are open to examination by the major taxing jurisdictions to which the Company is subject.
FASB ASC 740 “Accounting for Income Taxes”, requires recognition of deferred tax assets and liabilities for the expected future tax consequences of events that have been included in the financial statements or tax returns. Under this method, deferred tax assets and liabilities are determined based on differing treatment of items for financial reporting and income tax reporting purposes. The deferred tax balances are adjusted to reflect tax rates by tax jurisdiction, based on currently enacted tax laws, which will be in effect in the years in which the temporary differences are expected to reverse. In light of the historic losses of the Company, a 100% valuation allowance has been recorded to fully offset any benefit associated with the net deferred tax assets, for which realization is not considered more likely than not to occur.
The Tax Cuts and Jobs Act (the “Tax Act”) enacted on December 22, 2017 significantly lowered the corporate income tax rate to a flat 21% effective January 1, 2018. There was no impact on the income tax provision for the lowering of the corporate tax rate because the change in the net deferred tax asset resulting from the lower rate was fully offset by the corresponding change in the Company’s valuation allowance.
Note 11 — Capital Stock
Preferred stock
The Board of Directors is authorized to establish and designate different series of preferred stock and to fix and determine the voting powers and other special rights and qualifications of such series. A total of 5,000,000 shares of preferred stock are authorized as of December 31, 2017 and December 31, 2016. There were 49,626 shares of Series A Preferred Stock issued and outstanding on December 31, 2017 and December 31, 2016. There were no declared preferred dividends owed as of December 31, 2017 or 2016.
On January 2, 2015 (the “Series A Closing Date”), we entered into and closed a Series A Preferred Stock Purchase Agreement (the “Series A Purchase Agreement”) with Intel Corporation (the “Series A Purchaser”), pursuant to which we issued and sold to the Series A Purchaser, an aggregate of 49,626 shares of the Company’s Series A Preferred Stock, at a purchase price of $500 per share, for an aggregate purchase price of $24,813,000 (the “Series A Private Placement”). Each share of Series A Preferred Stock is convertible, at the option of the Series A Purchaser, into 100 shares of the Company’s common stock (determined by dividing the Series A Original Issue Price of $500 by the Series A Conversion Price. The Series A Conversion Price is $5.00, subject to adjustment in the event of stock splits, dividends or other combinations).
| F-22 |
VUZIX CORPORATION
NOTES TO CONSOLIDATED FINANCIAL STATEMENTS — (Continued)
Each share of Series A Preferred Stock is entitled to receive dividends at a rate of 6% per year, compounded quarterly and payable in cash or in kind, at the Company’s sole discretion. As of December 31, 2017, total accrued and unpaid preferred dividends were $4,849,063. In the event of the liquidation, dissolution or winding up of the Company, each share of Series A Preferred Stock is entitled to a liquidation preference equal to one times (1x) the Series A Purchaser’s original per share purchase price, plus a right to receive an additional liquidation distribution together with the common stock holders pro rata on an as converted basis, but not in excess of $1,000 per share in the aggregate (subject to adjustment for accrued but unpaid dividends and in the event of stock splits, dividends or other combinations). Each share of Series A Preferred Stock is entitled to vote with the holders of the Company’s common stock on matters presented to its stockholders, and is entitled to cast such number of votes equal to the whole number of shares of common stock into which such shares of Series A Preferred Stock are convertible. The holders of record of the Series A Preferred Stock are entitled to nominate and elect 2 directors to the Company’s Board of Directors (the “Board Election Right”), at least one of whom is required to qualify as an “independent” director, as that term is used in applicable exchange listing rules. The Board Election Right with respect to the independent director will terminate on such date as the number of shares of Series A Preferred Stock then outstanding is less than 40% of the original amount purchased by the Series A Purchaser. The Board Election Right with respect to the second director shall terminate on such date as the number of shares of Series A Preferred Stock then outstanding is less than 20% of the original amount purchased by the Series A Purchaser. The Company also granted the Series A Purchaser the right to have a board observer at meetings of the Company’s Board of Directors and committees thereof. To date, the Series A Purchaser has not exercised such director election or meeting observation rights.
For as long as at least 25% (or 12,406 shares) of the Series A Preferred Stock is outstanding, the Company may not, without the consent of holders of at least 60% of the then outstanding shares of Series A Preferred Stock, take certain actions, including but not limited to: (i) liquidate, dissolve, or wind up the business and affairs of the Company; (ii) amend, alter or repeal any provision of its charter or bylaws in a manner that adversely effects the rights of the Series A Preferred Stock; (iii) create or issue any capital stock that is equal to or senior to the Series A Preferred Stock with respect to preferences; (iv) create or issue any debt security, subject to certain exceptions; (v) pay off any debt obligation prior to its stated maturity date; or (vi) enter into any stockholders rights plan or similar arrangement or take other actions that may limit actions that holders of a majority of the Series A Preferred Stock can take under Section 203 of the Delaware General Corporation Law, as well as such other customary provisions protecting the rights of the holder of the Series A Preferred Stock, as are outlined in the Certificate of Designation.
The Series A Purchaser has the right to participate in any proposed issuance by the Company of its securities, subject to certain exceptions (the “Participation Right”). In the event the Series A Purchaser is not afforded the opportunity to exercise its Participation Right, the Series A Purchaser will have the right, but not the obligation, up to two times per calendar year, to acquire additional securities from the Company in such amount as is sufficient to maintain the Series A Purchaser’s ownership percentage in the Company, calculated immediately prior to such applicable financing, at a purchase price equal to the per share price of the Company’s securities in such applicable financing.
In connection with the Series A Private Placement, the Company entered into an investor’s rights agreement with the Series A Purchaser, pursuant to which the Company agreed to file a “resale” registration statement with the Securities and Exchange Commission (the “SEC”) covering all shares of common stock issuable upon conversion of the Series A Preferred Stock sold in the Series A Private Placement on or before February 14, 2015. The Company filed the registration statement on February 12, 2015 and the registration statement was declared effective by the SEC on February 17, 2015.
Common Stock
The Company’s authorized common stock consists of 100,000,000 shares, par value of $0.001 as of December 31, 2017 and December 31, 2016. There were 24,276,275 and 19,569,247 shares of common stock issued and outstanding as of December 31, 2017 and December 31, 2016, respectively. On August 14, 2017, the Company closed a public offering of 1,500,000 shares of common stock, at a public offering price of $5.75 per share, resulting in net proceeds after commissions and expenses of $7,978,321. As part of this offering, the Company’s COO purchased 10,000 shares, but at the market price of $6.10 per share that reflected the Company’s closing market trading price on the date of the transaction to comply with certain Nasdaq rules.
On December 19, 2017, the Company closed a public offering of 2,066,116 shares of common stock, at an offering price of $6.05 per share, resulting in net proceeds after commissions and expenses of $11,532,502. The Company also issued to investors in this offering three-year warrants to purchase an aggregate 1,033,058 shares of its common stock at $7.00 per share, which will be exercisable for a period of three years commencing six months from issuance.
On July 11, 2016, the Company closed its public offering of 1,150,000 shares of common stock, at a public offering price of $5.75 per share, for gross proceeds of $6,612,500. On December 2, 2016, the Company closed its public offering of 2,000,000 shares of common stock, at a public offering price of $7.25 per share, for gross proceed of $14,500,000. Total net proceeds from these public offering was $19,238,015.
| F-23 |
VUZIX CORPORATION
NOTES TO CONSOLIDATED FINANCIAL STATEMENTS — (Continued)
Note 12 — Stock Warrants
The following table shows the various changes in warrants for the years ended:
| December 31, 2017 | December 31, 2016 | December 31, | ||||||||||
| Warrants Outstanding, Beginning of Year | 401,859 | 535,091 | 5,236,660 | |||||||||
| Exercised During the Year | (250,009 | ) | (133,232 | ) | (4,746,755 | ) | ||||||
| Issued During the Year | 1,033,062 | - | 60,000 | |||||||||
| Forfeited During the Year | - | - | (14,814 | ) | ||||||||
| Warrants Outstanding, End of Year | 1,184,912 | 401,859 | 535,091 | |||||||||
The outstanding warrants as of December 31, 2017 expire from March 21, 2018 to June 18, 2021. The weighted average remaining term of the warrants is 3.1 years. The weighted average exercise price is $6.44 per share. The outstanding warrants as of December 31, 2016 expire from March 21, 2018 to August 5, 2018. The weighted average remaining term of the warrants was 1.3 years. The weighted average exercise price was $2.41 per share. The outstanding warrants as of December 31, 2015 expire from March 21, 2018 to August 5, 2018. The weighted average remaining term of the warrants was 2.3 years. The weighted average exercise price was $2.43 per share.
During the year ended December 31, 2017 a total of 250,009 warrants were exercised on a cashless basis resulting in the issuance of 168,000 shares. During the year ended December 31, 2016 a total of 111,232 warrants were exercised on a cashless basis resulting in the issuance of 74,621 shares and an additional 22,000 warrants were exercised for cash resulting in proceeds of $60,750. During the year ending December 31, 2015 a total of 4,178,267 warrants were exercised on a cashless basis resulting in the issuance of 3,559,783 shares. During the year ending December 31, 2015 a total of 568,488 warrants were exercised for cash resulting in proceeds of $1,272,627.
Management completed a derivative analysis on the 1,033,062 warrants issued in conjunction with our public offering which closed on December 19, 2017 to determine whether or not they met the criteria under ASC 815-10-15-83 to trigger treatment as a derivative instrument. Management concluded that these warrants did not meet the criteria to be treated as a derivative instrument.
Note 13 — Stock Option Plans
The Company has the following Stock Option Plans (“Plans”) that allow for the granting of both incentive stock options or ISOs, which can result in potentially favorable tax treatment to the participant, and non-statutory stock options. The Company’s 2014 Equity Incentive Plan (the “2014 Plan”) was approved by the stockholders of the Company on June 26, 2014. The Company will no longer issue any options under the 2007 and 2009 Plans. The 2014 Plan has an “evergreen provision”, under which the maximum number of shares of common stock that may be issued under the 2014 Plan was initially 1,000,000 and automatically increases each time the Company issues additional shares of common stock so that the total number of shares issuable thereunder at all times equals 10% of the then outstanding shares of common stock, unless in any case the Board of Directors adopts a resolution providing that the number of shares issuable under the 2014 Plan not be so increased. As of December 31, 2017, the authorized shares of common stock under the 2014 Plan totaled 2,427,628.
The exercise price per share subject to an option is determined by the administrator, but in the case of an ISO must not be less than the fair market value of a share of our common stock on the date of grant and in the case of a non-statutory stock option must not be less than 100% of the fair market value of a share of our common stock on the date of grant.
Under the 2014 Plan, the Company may grant stock options, stock appreciation rights, performance awards of stock and/or cash, and stock awards of restricted stock.
| F-24 |
VUZIX CORPORATION
NOTES TO CONSOLIDATED FINANCIAL STATEMENTS — (Continued)
Options outstanding under the Stock Options Plans are as follows:
| 2007 Plan | 2009 Plan | 2014 Plan | Total | |||||||||||||
| Outstanding as of December 31, 2015 | 37,447 | 120,842 | 864,500 | 1,022,789 | ||||||||||||
| Available for future issuance under plan | - | - | 744,295 | 744,295 | ||||||||||||
| Total authorized by plan | 37,447 | 120,842 | 1,608,795 | 1,767,084 | ||||||||||||
| Outstanding as of December 31, 2016 | 21,977 | 132,771 | 929,550 | 1,084,298 | ||||||||||||
| Available for future issuance under plan | — | — | 1,027,375 | 1,027,375 | ||||||||||||
| Totals authorized by plan | 21,977 | 132,771 | 1,956,925 | 2,111,673 | ||||||||||||
| Outstanding as of December 31, 2017 | 10,665 | 117,094 | 1,382,485 | 1,510,244 | ||||||||||||
| Available for future issuance under plan | — | — | 1,045,143 | 1,045,143 | ||||||||||||
| Totals authorized by plan | 10,665 | 117,094 | 2,427,628 | 2,555,387 | ||||||||||||
The 2014 Plan gives the Board of Directors of the Company the ability to determine vesting periods for all stock incentives granted under the 2014 Plan, and allows option terms to be up to ten years from the original grant date. Employees’ incentive stock options must vest at a minimum rate of 20% per year over a five-year period, commencing on the date of grant. Most vest ratably over four years commencing on the date of the option grant. In the case of directors, such options are granted annually and expire ten years after the date of their grant and vest ratably, on a monthly basis, over the next 12 months. Non-employee directors have vesting of 50% immediately on grant and the balance vest ratably, on a monthly basis, over the next 12 months. Advisors or consultants can have vesting range from 100% of the option grants vesting immediately to ratably, on a monthly basis, up to 48 months.
The following table summarizes stock option activity for the years ended December 31, 2017, 2016 and 2015:
| Weighted | Weighted Average | |||||||||||
| Number of Options | Average Exercise Price | Remaining Life (years) | ||||||||||
| Outstanding at December 31, 2014 | 720,551 | $ | 4.46 | 8.56 | ||||||||
| Granted | 374,000 | 5.67 | ||||||||||
| Exercised | (15,833 | ) | 2.60 | |||||||||
| Expired or Forfeited | (55,929 | ) | 8.12 | |||||||||
| Outstanding at December 31, 2015 | 1,022,789 | $ | 4.59 | 7.56 | ||||||||
| Granted | 116,750 | 6.60 | ||||||||||
| Exercised | (10,450 | ) | 3.46 | |||||||||
| Expired or Forfeited | (44,791 | ) | 3.87 | |||||||||
| Outstanding at December 31, 2016 | 1,084,298 | $ | 4.76 | 7.57 | ||||||||
| Granted | 534,500 | 5.74 | ||||||||||
| Exercised | (63,187 | ) | 2.89 | |||||||||
| Expired or Forfeited | (45,367 | ) | 8.30 | |||||||||
| Outstanding at December 31, 2017 | 1,510,244 | $ | 5.04 | 7.58 | ||||||||
As of December 31, 2017, there were 797,861 options that were fully vested and exercisable at weighted average exercise price of $4.65 per share. The weighted average remaining contractual term on the vested options is 6.4 years. The unvested balance of 712,383 options as of December 31, 2017 are exercisable at a weighted average exercise price of $5.48 per share. The weighted average remaining contractual term on the unvested options is 8.7 years.
As of December 31, 2016, there were 613,665 options that were fully vested and exercisable at weighted average exercise price of $4.83 per share. The weighted average remaining contractual term on the vested options was 7.0 years. The unvested balance of 470,633 options as of December 31, 2016 were exercisable at a weighted average exercise price of $4.67 per share. The weighted average remaining contractual term on the vested options was 8.4 years.
As of December 31, 2015, there were 424,688 options that were fully vested and exercisable at weighted average exercise price of $5.34 per share. The weighted average remaining contractual term on the vested options is 7.4 years. The unvested balance of 598,101 options as of December 31, 2015 were exercisable at a weighted average exercise price of $4.05 per share. The weighted average remaining contractual term on the vested options was 7.4 years.
The aggregate intrinsic value of the options outstanding as of December 31, 2017, 2016 and 2015 was approximately $3,517,878, $2,776,068 and $3,449,805, respectively.
| F-25 |
VUZIX CORPORATION
NOTES TO CONSOLIDATED FINANCIAL STATEMENTS — (Continued)
The Black-Scholes-Merton option pricing model was used to estimate the fair value of share-based awards under FASB ASC Topic 718. The Black-Scholes-Merton option pricing model incorporates various and highly subjective assumptions, including expected term and share price volatility. For valuation purposes, stock option awards were categorized into two groups, stock option grants to employees and stock option grants to members of the Board of Directors.
The expected term of options granted was estimated to be the average of the vesting term, historical exercise and forfeiture rates, and the contractual life of the option. The share price volatility at the grant date is estimated using historical stock prices based upon the expected term of the options granted. The risk-free interest rate assumption is determined using the rates for U.S. Treasury zero-coupon bonds with maturities similar to those of the expected term of the award being valued. Cash dividends have never been paid and are not anticipated to be paid in the foreseeable future. Therefore, the assumed expected dividend yield is zero.
The following summary table shows the assumptions used to compute the fair value of stock options granted during 2017, 2016 and 2015 and their estimated value:
| December 31, | 2017 | 2016 | 2015 | |||||||||
| Assumptions for Black-Scholes: | ||||||||||||
| Expected term in years | 6.5 to 6.8 | 7.9 | 6.0 to 7.9 | |||||||||
| Volatility | 122.8% to 133% | 103.6% to 109.7% | 114.4% to 113.5% | |||||||||
| Risk-free interest rate | 1.98% to 2.30% | 1.27% to 1.68% | 1.74% to 2.02% | |||||||||
| Expected annual dividends | None | None | None | |||||||||
| Value of options granted: | ||||||||||||
| Number of options granted | 534,500 | 116,750 | 374,000 | |||||||||
| Weighted average fair value per share | $ | 5.24 | $ | 5.73 | $ | 4.50 | ||||||
| Fair value of options granted | $ | 2,803,329 | $ | 669,435 | $ | 1,684,179 | ||||||
FASB ASC Topic 718 requires pre-vesting option forfeitures at the time of grant to be estimated and periodically revised in subsequent periods if actual forfeitures differ from those estimates. Stock-based compensation expense is recorded only for those awards expected to vest using an estimated forfeiture rate based on historical pre-vesting forfeiture data.
Unrecognized stock-based compensation expense was $3,517,878 as of December 31, 2017, relating to a total of 712,383 unvested stock options under the Company’s stock option plans. This stock-based compensation expense is expected to be recognized over a weighted average period of approximately 3 years.
| F-26 |
VUZIX CORPORATION
NOTES TO CONSOLIDATED FINANCIAL STATEMENTS — (Continued)
Note 14 — Commitments
Purchase commitments
At December 31, 2017, we have approximately $7 million in open purchase obligations that represent commitments to purchase inventory, materials, capital equipment, and other goods used in the normal operation of our business.
Adverse purchase commitments
We have periodically entered into noncancelable purchase contracts in order to ensure the availability of materials to support production of our products. We continuously assess our outstanding commitments and recognize a loss on purchase commitments, when required, if such commitments are in excess of our product needs or the costs are not expected to be recoverable. As of December 31, 2017, such commitments are immaterial.
Lease commitments
The Company has signed several lease agreements, with the largest being for its new office and manufacturing space under an operating lease that commenced October 3, 2015, that expires on October 3, 2020. The base rent contractual payment obligations under this operating lease will be $335,248 per year. The lease has an original five-year term with an option by the Company to renew for two additional three-year terms at pre-agreed to lease rates. The Company also leases small office spaces in England under a two-year lease and under a one-year lease arrangements in Japan.
Future minimum payments required under operating lease obligations as of December 31, 2017 are as follows:
| Total Minimum | ||||
| Year Ending Dec 31, | Lease Payments | |||
| 2018 | $ | 411,135 | ||
| 2019 | 403,730 | |||
| 2020 | 363,881 | |||
| 2021 | - | |||
| 2022 | - | |||
| Total | $ | 1,178,746 | ||
For the lease agreements described above, the Company is required to pay the pro rata share of the real property taxes and assessments, expenses and other charges associated with these facilities.
Rent expense for the years ended December 31, 2017, 2016 and 2015 totaled $461,246, $482,147 and $186,471, respectively.
Note 15 — Employee Benefit Plans
The Company has a Section 401(k) Savings Plan which covers employees who meet certain age and length of service requirements. To date the plan is comprised of 100% employee deferrals.
Note 16 — Litigation
The Company is currently not involved in any actual or pending legal proceeding or litigation and we are not aware of any such proceedings contemplated by or against us or our property.
| F-27 |
VUZIX CORPORATION
NOTES TO CONSOLIDATED FINANCIAL STATEMENTS — (Continued)
Note 17 — Geographic and Other Financial Information (Unaudited)
Geographic Financial Information (Unaudited)
Geographical revenue information, based on ship-to destination for the three years ended December 31, 2017, 2016 and 2015 was based on the location of the customers is as follows (in thousands):
By Continent and Region:
| Fiscal Year | ||||||||||||||||||||||||
| 2017 | 2016 | 2015 | ||||||||||||||||||||||
| Revenue | % of Total | Revenue | % of Total | Revenue | % of Total | |||||||||||||||||||
| Asia-Pacific | $ | 1,927 | 35 | % | $ | 493 | 23 | % | $ | 250 | 9 | % | ||||||||||||
| Europe | 1,892 | 34 | % | 649 | 31 | % | 334 | 12 | % | |||||||||||||||
| North America | 1,687 | 30 | % | 981 | 46 | % | 2,161 | 79 | % | |||||||||||||||
| Others | 32 | 1 | % | 4 | 0 | % | 5 | 0 | % | |||||||||||||||
| Total Revenues | $ | 5,538 | 100 | % | $ | 2,127 | 100 | % | $ | 2,750 | 100 | % | ||||||||||||
By Country:
| Fiscal Year | ||||||||||||||||||||||||
| 2017 | 2016 | 2015 | ||||||||||||||||||||||
| Revenue | % of Total | Revenue | % of Total | Revenue | % of Total | |||||||||||||||||||
| US | $ | 1,618 | 29 | % | $ | 962 | 45 | % | $ | 2,147 | 78 | % | ||||||||||||
| France | 429 | 8 | % | 211 | 10 | % | 44 | 2 | % | |||||||||||||||
| Germany | 526 | 9 | % | 263 | 12 | % | 129 | 5 | % | |||||||||||||||
| Japan | 1,340 | 24 | % | 288 | 14 | % | 217 | 8 | % | |||||||||||||||
| United Kingdom | 529 | 10 | % | 46 | 2 | % | 32 | 1 | % | |||||||||||||||
| Others | 1,096 | 20 | % | 357 | 17 | % | 181 | 6 | % | |||||||||||||||
| Total Revenues | $ | 5,538 | 100 | % | $ | 2,127 | 100 | % | $ | 2,750 | 100 | % | ||||||||||||
The Company does not maintain significant amounts of long-lived assets outside of the United States.
Customer Concentrations
Toshiba Client Solutions Co. Ltd. (Toshiba) of Japan represented 18% of our revenues in 2017. No single customer represented more that 10% of revenues in 2016. One customer, a stockholder whom is the sole holder of our Series A Preferred Stock, represented 18% of revenues in 2015.
Toshiba represented 25% of accounts receivable and 100% of accrued project revenues at December 31, 2017. No single customer represented more than 10% of accounts receivable at December 31, 2016. One customer represented 89% of accounts receivable at December 31, 2015.
Note 18 — Quarterly Financial Information (Unaudited)
The following table summarizes our unaudited quarterly financial information for the periods shown below (in thousands, except per share data):
| Fiscal Year 2017 | ||||||||||||||||
| December 31, | September 30, | June 30, | March 31, | |||||||||||||
| Revenue | $ | 1,597 | $ | 1,405 | $ | 1,325 | $ | 1,211 | ||||||||
| Gross profit (loss) | (304 | ) | (92 | ) | (429 | ) | 149 | |||||||||
| Net loss | (5,879 | ) | (5,502 | ) | (4,070 | ) | (4,182 | ) | ||||||||
| Net loss per share, basic and diluted | (0.29 | ) | (0.28 | ) | (0.22 | ) | (0.23 | ) | ||||||||
| Net loss attributable to common stockholders | (6,321 | ) | (5,938 | ) | (4,494 | ) | (4,595 | ) | ||||||||
| Fiscal Year 2016 | ||||||||||||||||
| December 31, | September 30, | June 30, | March 31, | |||||||||||||
| Revenue | $ | 620 | $ | 583 | $ | 561 | $ | 364 | ||||||||
| Gross profit (loss) | (562 | ) | (237 | ) | (126 | ) | (239 | ) | ||||||||
| Net loss | (6,335 | ) | (5,036 | ) | (4,103 | ) | (3,776 | ) | ||||||||
| Net loss per share, basic and diluted | (0.37 | ) | (0.32 | ) | (0.28 | ) | (0.26 | ) | ||||||||
| Net loss attributable to common stockholders | (6,751 | ) | (5,446 | ) | (4,503 | ) | (4,170 | ) | ||||||||
| F-28 |
VUZIX CORPORATION
NOTES TO CONSOLIDATED FINANCIAL STATEMENTS — (Continued)
Note 19 — Related Party Transactions
The Company has accrued compensation owed to officers of the Company for services rendered that remain outstanding. These amounts are not subject to a fixed repayment schedule and they bear interest at a rate of 8% per year, compounding monthly. The amounts were $327,469 as December 31, 2017 and $648,720 as of December 31, 2016 and $358,719 as of December 31, 2015. The related interest amounts included in Accrued Interest were $171,435, $141,645 and $97,801 at December 31, 2017, 2016, and 2015, respectively. Interest expense related to the outstanding current accrued compensation in Accrued Expenses (Note 7) to officers was $52,221, $43,844 and $35,722 for the years ended December 31, 2017, 2016 and 2015, respectively.
During the year ended December 31, 2016, $54,023 or 3% of total revenues, were derived from a major stockholder (15% on as-converted to common stock basis with respect to shares of Series A Preferred Stock held by such stockholder) of the Company who also represented $2,998 of the accounts receivable balance at December 31, 2016. Said stockholder comprised $481,920 or 18% of total revenues and represented $290,750 of the accounts receivable balance at December 31, 2015. Said stockholder comprised of $0 of total revenue in 2017.
Note 20 — Subsequent Events
Recent Warrant Exercises:
Since January 1, 2018, the Company has received cashless exercises of 10,000 warrants that resulted in the issuance of 7,428 shares of common stock and the exercise for cash of 17,500 warrants for total cash proceeds of 39,375.
Sale of Common Stock:
On January 24, 2018, the Company entered into a securities purchase agreement with the purchasers set forth on the signature pages thereto for the purchase and sale of an aggregate of 3,000,000 shares of the Company’s common stock, and warrants to purchase an aggregate of up to 1,200,000 shares of common stock, in a registered direct offering at a combined purchase price of $10.00 per share and 0.4 of a warrant, for an aggregate purchase price of $30,000,000. The warrants have a term of one year from issuance and an exercise price of $10.00 per share. The purchase agreement closed on January 29, 2018.
| F-29 |
SIGNATURES
Pursuant to the requirements of Section 13 or 15(d) of the Securities Exchange Act of 1934, the registrant has duly caused this report to be signed on its behalf by the undersigned, thereunto duly authorized, on the 16 th day of March, 2018.
| VUZIX CORPORATION | |
| /s/ Paul J. Travers | |
| Paul J. Travers | |
| Chief Executive Officer |
POWER OF ATTORNEY
KNOW BY ALL PERSONS BY THESE PRESENTS, that each person whose signature appears below constitutes and appoints jointly and severally, Paul J. Travers and Grant Russell, and each one of them, his or her attorneys-in-fact, each with the power of substitution, for him or her in any and all capacities, to sign any and all amendments to this Annual Report on Form 10-K and to file the same, with exhibits thereto and other documents in connection therewith, with the Securities and Exchange Commission, hereby ratifying and confirming all that each said attorneys-in-fact, or his substitute or substitutes, may do or cause to be done by virtue hereof.
Pursuant to the requirements of the Securities Exchange Act of 1934, this report has been signed below by the following persons on behalf of the registrant and in the capacities and on the dates indicated:
| Signature | Title | Date | ||
| /s/ Paul J. Travers | President, Chief Executive Officer | March 16, 2018 | ||
| Paul J. Travers | and Director | |||
| (Principal Executive Officer) | ||||
| /s/ Grant Russell | Chief Financial Officer, | March 16, 2018 | ||
| Grant Russell | Executive Vice-President and Director | |||
| (Principal Financial and | ||||
| Accounting Officer) | ||||
| /s/ Paul Boris | Chief Operating Officer, Director | March 16, 2018 | ||
| Paul Boris | ||||
| /s/ Alexander Ruckdaeschel | Director | March 16, 2018 | ||
| Alexander Ruckdaeschel | ||||
| /s/ Edward Kay | Director | March 16, 2018 | ||
| Edward Kay | ||||
| /s/ Timothy Harned | Director | March 16, 2018 | ||
| Timothy Harned | ||||
| /s/ Michael Scott | Director | March 16, 2018 | ||
Michael Scott |
48
VUZIX CORPORATION
Schedule II — Valuation and Qualifying Accounts (in thousands)
| Description | Balance at Beginning of Period | Charged to Expenses | Deductions | Balance at End of Period | ||||||||||||
| For the Year Ended December 31, 2015 | ||||||||||||||||
| Allowances deducted from assets | ||||||||||||||||
| Doubtful Accounts | $ | - | $ | - | $ | - | $ | - | ||||||||
| Inventory | 666 | (179 | )(a) | - | 487 | |||||||||||
| Total allowances deducted from assets | $ | 666 | $ | (179 | ) | $ | - | $ | 487 | |||||||
| For the Year Ended December 31, 2016 | ||||||||||||||||
| Allowances deducted from assets | ||||||||||||||||
| Doubtful Accounts | $ | - | $ | - | $ | - | $ | - | ||||||||
| Inventory | 487 | 137 | (a) | - | 624 | |||||||||||
| Total allowances deducted from assets | $ | 487 | $ | 137 | $ | - | $ | 624 | ||||||||
| For the Year Ended December 31, 2017 | ||||||||||||||||
| Allowances deducted from assets | ||||||||||||||||
| Doubtful Accounts | $ | - | $ | 29 | $ | - | $ | 29 | ||||||||
| Inventory | 624 | 212 | (a) | - | 836 | |||||||||||
| Total allowances deducted from assets | $ | 624 | $ | 241 | $ | - | $ | 865 | ||||||||
| (a) | Net change in inventory allowance, excluding iWear net realizable value writedown. |
49
Exhibit Index
| † | Confidential treatment granted as to certain portion |
| * | Filed herewith. |
50
| (1) | Filed as an exhibit to Amendment No. 3 to the Registration Statement on Form S-1 filed October 16, 2009 and incorporated herein by reference. |
| (2) | Filed as an exhibit to the Current Report on Form 8-K filed February 7, 2013 and incorporated herein by reference. |
| (3) | Filed as an exhibit to the Current Report on Form 8-K filed June 30, 2014 and incorporated herein by reference. |
| (4) | Filed as an exhibit to the Current Report on Form 8-K filed January 2, 2015 and incorporated herein by reference. |
| (5) | Filed as an exhibit to the S-1/A filed July 29, 2013 and incorporated herein by reference. |
| (6) | Filed as an exhibit to the S-1 filed July 2, 2009 and incorporated herein by reference. |
| (7) | Filed as an exhibit to the Current Report on Form 8-K filed June 2, 2010 and incorporated herein by reference. |
| (8) | Filed as an exhibit to the Current Report on Form 8-K filed October 27, 2010 and incorporated herein by reference. |
| (9) | Filed as an exhibit to the S-1 filed December 21, 2012 and incorporated herein by reference. |
| (10) | Filed as an exhibit to the Current Report on Form 8-K filed June 21, 2012 and incorporated herein by reference. |
| (11) | Filed as an exhibit to the Current Report on Form 8-K filed July 16, 2013 and incorporated herein by reference. |
| (12) | Filed with Definitive Proxy Statement on April 30, 2014 and incorporated herein by reference. |
| (13) | Filed as an exhibit to 8-K filed January 2, 2015 and incorporated herein by reference. |
| (14) | Filed as exhibit to 10-K filed March 30, 2016 and incorporated herein by reference. |
| (15) | Filed as exhibit to 8-K filed October 9, 2014 and incorporated herein by reference. |
| (16) | Filed as exhibit to S-1/A filed June 10, 2013 and incorporated herein by reference. | |
|
(17) |
Filed as exhibit to Form 8-K filed August 8, 2017 and incorporated herein by reference. | |
|
(18) |
Filed as exhibit to Form 8-K filed December 15, 2017 and incorporated herein by reference. | |
|
(19) |
Filed as exhibit to Form 8-K filed January 26, 2018 and incorporated herein by reference. |
51