Attached files
| file | filename |
|---|---|
| EX-32.2 - SECTION 906 CFO CERTIFICATION - Papa Murphy's Holdings, Inc. | ex32220180101section906cfo.htm |
| EX-32.1 - SECTION 906 CEO CERTIFICATION - Papa Murphy's Holdings, Inc. | ex32120180101section906ceo.htm |
| EX-31.2 - SECTION 302 CFO CERTIFICATION - Papa Murphy's Holdings, Inc. | ex31220180101section302cfo.htm |
| EX-31.1 - SECTION 302 CEO CERTIFICATION - Papa Murphy's Holdings, Inc. | ex31120180101section302ceo.htm |
| EX-24.1 - POWER OF ATTORNEY - Papa Murphy's Holdings, Inc. | ex24120180101directorspowe.htm |
| EX-23.1 - CONSENT OF INDEPENDENT REGISTERED PUBLIC ACCOUNTING FIRM - Papa Murphy's Holdings, Inc. | mossadamsconsent20180101.htm |
| EX-21.1 - SUBSIDIARIES - Papa Murphy's Holdings, Inc. | ex21120180101listofsubsidi.htm |
| EX-10.26 - EXHIBIT 10.26 - Papa Murphy's Holdings, Inc. | ex102620180101hutchensprom.htm |
| EX-10.8 - EXHIBIT 10.8 - Papa Murphy's Holdings, Inc. | ex10820180101spangleremplo.htm |
UNITED STATES
SECURITIES AND EXCHANGE COMMISSION
Washington, D.C. 20549
––––––––––––––––––––––––––––––––––––––––––––––––––––––––
FORM 10-K
––––––––––––––––––––––––––––––––––––––––––––––––––––––––
(Mark One)
[X] ANNUAL REPORT PURSUANT TO SECTION 13 OR 15(d) OF THE SECURITIES EXCHANGE ACT OF 1934.
For the fiscal year ended January 1, 2018
OR
[ ] TRANSITION REPORT PURSUANT TO SECTION 13 OR 15(d) OF THE SECURITIES EXCHANGE ACT OF 1934
For the transition period from to
Commission file number 001-36432
––––––––––––––––––––––––––––––––––––––––––––––––––––––––
Papa Murphy’s Holdings, Inc.
(Exact name of registrant as specified in its charter)
––––––––––––––––––––––––––––––––––––––––––––––––––––––––
Delaware | 27-2349094 | |
(State or Other Jurisdiction of Incorporation or Organization) | (IRS Employer Identification No.) | |
8000 NE Parkway Drive, Suite 350, Vancouver, WA | 98662 | |
(Address of principal executive offices) | (Zip Code) | |
(360) 260-7272 | ||
(Registrant’s telephone number, including area code) | ||
Securities registered pursuant to Section 12(b) of the Act: | ||
Common Stock, $0.01 par value | NASDAQ Global Select Market | |
(Title of Each Class) | (Name of Each Exchange on Which Registered) | |
Securities registered pursuant to Section 12(g) of the Act: | ||
NONE | ||
––––––––––––––––––––––––––––––––––––––––––––––––––––––––
Indicate by check mark if the registrant is a well-known seasoned issuer, as defined in Rule 405 of the Securities Act. Yes [ ] No [X]
Indicate by check mark if the registrant is not required to file reports pursuant to Section 13 or Section 15(d) of the Act. Yes [ ] No [X]
Indicate by check mark whether the registrant (1) has filed all reports required to be filed by Section 13 or 15(d) of the Securities Exchange Act of 1934 during the preceding 12 months (or for such shorter period that the registrant was required to file such reports), and (2) has been subject to such filing requirements for the past 90 days. Yes [X] No [ ]
Indicate by check mark whether the registrant has submitted electronically and posted on its corporate Web site, if any, every Interactive Data File required to be submitted and posted pursuant to Rule 405 of Regulation S-T during the preceding 12 months (or for such shorter period that the registrant was required to submit and post such files). Yes [X] No [ ]
Indicate by check mark if disclosure of delinquent filers pursuant to Item 405 of Regulation S-K is not contained herein, and will not be contained, to the best of registrant’s knowledge, in definitive proxy or information statements incorporated by reference in Part III of this Form 10-K or any amendment to this Form 10-K. [ ]
Indicate by check mark whether the registrant is a large accelerated filer, an accelerated filer, a non-accelerated filer, or a smaller reporting company. See the definitions of “accelerated filer,” “large accelerated filer,” and “smaller reporting company” in Rule 12b-2 of the Exchange Act.
Large accelerated filer [ ] | Accelerated filer [X] | |
Non-accelerated filer [ ] | Smaller reporting company [ ] | |
Emerging growth company [X] | ||
If an emerging growth company, indicate by check mark if the registrant has elected not to use the extended transition period for complying with any new or revised financial accounting standards provided pursuant to Section 13(a) of the Exchange Act. [X]
Indicate by check mark whether the registrant is a shell company (as defined in Rule 12b-2 of the Exchange Act). Yes [ ]. No [X].
At July 3, 2017, the last business day of the registrant’s most recently completed second fiscal quarter, the aggregate market value of the shares of voting and non-voting common stock of the Registrant held by non-affiliates was $52,178,979 based on the last sales price of the Registrant’s common stock as reported by the NASDAQ Global Select Market on that day.
At March 2, 2018, there were 16,971,461 shares of the Registrant’s common stock, $0.01 par value, outstanding.
DOCUMENTS INCORPORATED BY REFERENCE:
Part III incorporates certain information by reference from the registrant’s definitive proxy statement for the 2018 annual meeting of shareholders, which will be filed no later than 120 days after the close of the registrant’s fiscal year ended January 1, 2018.
TABLE OF CONTENTS
PART I | ||
Item 1. | Business | |
Item 1A. | Risk Factors | |
Item 1B. | Unresolved Staff Comments | |
Item 2. | Properties | |
Item 3. | Legal Proceedings | |
Item 4. | Mine Safety Disclosures | |
PART II | ||
Item 5. | Market for Registrant’s Common Equity, Related Stockholder Matters and Issuer Purchases of Equity Securities | |
Item 6. | Selected Financial Data | |
Item 7. | Management’s Discussion and Analysis of Financial Condition and Results of Operations | |
Item 7A. | Quantitative and Qualitative Disclosures about Market Risk | |
Item 8. | Financial Statements and Supplementary Data | |
Item 9. | Changes in and Disagreements with Accountants on Accounting and Financial Disclosure | |
Item 9A. | Controls and Procedures | |
Item 9B. | Other Information | |
PART III | ||
Item 10. | Directors, Executive Officers and Corporate Governance | |
Item 11. | Executive Compensation | |
Item 12. | Security Ownership of Certain Beneficial Owners and Management and Related Stockholder Matters | |
Item 13. | Certain Relationships and Related Transactions, and Director Independence | |
Item 14. | Principal Accountant Fees and Services | |
PART IV | ||
Item 15. | Exhibits and Financial Statement Schedules | |
SIGNATURES | ||
2
PART I
ITEM 1. Business
General |
Papa Murphy’s Holdings, Inc. is a franchisor and operator of the largest Take ‘N’ Bake pizza chain in the United States. We were founded in 1981 and have grown our footprint to a total of 1,523 system-wide stores as of January 1, 2018.
We have defined three reportable segments for the Company: Domestic Company Stores, Domestic Franchise and International. Financial information about segment operations appears in Selected Financial Data, Management’s Discussion and Analysis of Financial Condition and Results of Operations, and Financial Statements and Supplementary Data in Note 18—Segment Information of the accompanying Notes to Consolidated Financial Statements.
We are a Delaware corporation that was organized and acquired a majority of the capital stock of PMI Holdings, Inc., our predecessor, in 2010. In May 2014, we completed our initial public offering (the “IPO”) and now our common stock trades on the NASDAQ Global Select Market under the “FRSH” ticker symbol. Papa Murphy’s Holdings, Inc. and its subsidiaries are sometimes referred to as the “Company,” “Papa Murphy’s,” or in the first person as “we,” “us,” and “our” in this report.
We make available, free of charge, the following filings on our corporate website located at www.papamurphys.com as soon as reasonably practicable after such filings are electronically filed with, or furnished to, the Securities and Exchange Commission (“SEC”): our annual report on Form 10-K, our quarterly reports on Form 10-Q, our current reports on Form 8-K, any amendments to such reports, and our annual proxy statement. Information contained on our corporate website located at www.papamurphys.com is not part of this annual report on Form 10-K.
Our Concept |
The Papa Murphy’s experience is different from traditional pizza restaurants. Our customers:
• | CREATE their fresh, personally customized pizza with high-quality ingredients; |
• | TAKE their fresh pizza home; and |
• | BAKE their pizza fresh in their ovens, at their convenience, for a home-cooked meal served hot. |
We were founded on the following core values—Great Quality, Great Value, Great Customer Service—and we strive to deliver on these values every day.
• | Great Quality: We have continually focused on quality since our founding and we believe customers can taste the difference. Unlike some of our competitors, we do not use pre-shredded, pre-packaged, or frozen cheese and our dough is made from scratch daily, never frozen. |
• | Great Value: We offer a high-quality pizza at a value price point. |
• | Great Customer Service: We train our store crews to greet each customer, to promote the latest new products and to assist each customer in choosing the combination of fresh made pizzas and side items to complete the customer’s meal. |
We actively target solving the “dinnertime dilemma” by providing a scratch-made, customized, home-baked meal. Our concept has broad appeal and is focused on freshness, quality, and convenience.
• | We make our dough fresh in each store daily, starting with flour, water, and yeast; |
• | We grate our cheese daily from blocks of 100% whole-milk mozzarella cheese; |
• | We slice fresh, never-frozen vegetables by hand; |
• | We feature specialty, premium ingredients; |
• | We use only high-quality meats with no added fillers; and |
• | We provide a convenient, easy, meal-time solution. |
3
Our stores feature a food-forward design with a store layout that highlights our high-quality, scratch-made pizzas. Pizzas are made fresh to order and our customers can follow their pizza as it is created.
Our menu offers customers the ability to create a customized pizza from a broad selection of crusts, sauces, and topping combinations. Our core menu offerings include the following:
▪ | Signature pizzas: classic combinations with broad appeal; |
▪ | Gourmet Delite pizzas: our artisan thin crust with premium, specialty toppings; |
▪ | Stuffed pizzas: two-layer, four-pound pizzas with meats and vegetables stuffed between two layers of dough; |
▪ | Fresh Pan pizzas: signature recipes with a thick, buttery crust; and |
▪ | “C.Y.O.” or Create Your Own pizzas: customer choice of crust, sauce, and any combination of our cheese, meat, and vegetable toppings. |
We have developed a loyal and diverse customer base. We attribute our success across a national footprint to the broad appeal of our concept. Our business model resonates across all ages, demographics, and income levels. Finally, we believe our model encourages a stronger emotional connection. The active role of ordering and watching the pizza being built gives customers a feeling of ownership: “a pizza” becomes “my pizza.”
Efficient, Simple Operating Model
Our stores average just 1,400 square feet in size and do not require ovens, venting hoods, freezers, or dining areas. Our store model offers franchise owners operating advantages that differentiate us from other restaurant concepts. Our domestic stores:
• | Focus on creating fresh pizzas for carry out reducing operational complexity for franchise owners and their employees; |
• | Maintain shorter operating hours (typically 11:00 a.m. to 9:00 p.m.) that are attractive to franchise owners and their employees; |
• | Require fewer employees each shift compared to other restaurant concepts, resulting in lower labor costs; |
• | Accept electronic benefit transfer (“EBT”) payment systems (food stamps); |
• | Benefit from local cooperative marketing and consistent creative marketing assets for use in a variety of media channels; |
• | Utilize a centrally-managed, locally customizable, integrated e-commerce platform; and |
• | Receive strong franchisor support through training, operating standards, supply-chain management, and development assistance. |
Our Strategy |
Our strategy has four key components: (i) convenience; (ii) relevance; (iii) people; and (iv) process. We believe that successfully implementing these strategic components will enable us to achieve our growth and profitability targets and leverage our current infrastructure.
Convenience
We believe convenience is our differentiating attribute because our customers have control over when they order, receive, bake, and serve our fresh, hot, made to order pizza. Customers decide exactly when their pizza goes into and comes out of their oven for maximum convenience and freshness. We believe customers want a product that is easy to order, easy to pay for, and easy to obtain.
• | E-commerce and Online Ordering. We continue to improve our e-commerce platform to provide a consistent and convenient online ordering experience to consumers. To remain relevant, we must design systems that have the flexibility to advertise and promote special products or promotions as well as provide convenience to the consumer through ease of ordering and payment. We believe our e-commerce platform will enable owners to realize greater efficiencies in store labor costs and provide an easy consumer experience through multiple ordering platforms and integration with third party delivery services. |
• | Expansion of Delivery. Online ordering addresses only half of the convenience cycle. In 2018, we plan to continue expansion of delivery through the use of various third party delivery options as they become available in the |
4
markets we serve. Our research indicates a strong demand for delivery from our customers, with more than half indicating they would order more often if delivery was available. We have a unique opportunity with delivery because our pizzas are not baked and customers receive the same high-quality fresh food when delivered as when they pick up their order in-store.
Relevance
As we strive to provide fresh, hot, and convenient options for the “dinnertime dilemma,” we must ensure that our messaging and brand strategy resonate with consumers in a competitive marketplace. We intend to broaden our marketing messaging and focus on telling the right story to the right audience.
• | Increased Digital Marketing. We continue to learn which value offers drive traffic by testing a broad range of messages through a variety of media channels including social media, text, and email. Through this dynamic, strategic shift in media mix, we have begun to capture consumer ordering and shopping trends in a rapidly changing marketplace. The insights gained from this data enable us to rapidly adapt to changes in consumer preferences and develop increasingly effective digital marketing campaigns. |
• | Loyalty Program. We are in the early stages of developing a loyalty program on a digital platform intended to increase the frequency of purchases. |
• | Improved Messaging. To better communicate the brand’s benefits and differentiation, we are refining our consumer messaging to reach a broader audience across all communication points. Emphasis will be placed on empowering the consumer and providing them with control over ingredients, quality, and timing. |
• | Targeted Communication. In order to increase the effectiveness of our messaging, we will focus on reaching customers through targeted communications and offers. |
People
By cultivating a culture of teamwork, continuous learning, and development, we expect to improve productivity and performance throughout our organization.
• | Franchisee Relations. Developing and maintaining strong relations with franchise owners are crucial components to our business strategy. With 1,483 stores across the United States and 489 domestic franchise owners as of January 1, 2018, we have a diverse base of owners who can help cultivate ingenuity, entrepreneurship, and community connections that are key to successful store-level operations. Engaging with franchise owners from a perspective of cooperation will allow the brand to learn best practices for ensuring quality, value, and service, as well as help all franchise owners execute our strategy locally on a consistent basis. |
• | Field Support. To help our franchise owners operate a profitable business and to protect our brand standards, we deploy teams located across the country to provide support in operations, store technology, and marketing. These teams assist franchise owners by coaching them on strategies for reaching new audiences, operating their stores with maximum efficiency, and building brand awareness and community engagement locally through offering employment opportunities, providing a high quality convenient meal, and partnering with local organizations to give back to the community. |
Process
In order to achieve optimal results, we are focusing efforts on creating an efficient, consistent execution process.
• | Spending Optimization. We intend to optimize and prioritize our spending to deliver improved store-level financial results. We are prioritizing initiatives that focus on the areas of store operations, growth channels, business reviews, advertising relevance, and real-time sales analytics with the intended result of stabilizing comparable store sales figures and improving profitability. |
• | Consumer Experience. We believe a consistent, high-quality consumer experience in product, service, and advertising is key to building a strong brand. In addition, providing franchise owners with access to real-time store performance metrics will allow them to quickly optimize their store operations, identify trends in customer patterns, and improve overall store economics. |
5
Our Industry and Competition |
With system-wide sales of $847 million in fiscal year 2017, we are the fifth largest pizza chain in the United States as measured by system-wide sales and total number of stores. We generally compete on the basis of product quality, variety, price, location, image, convenience, and service with regional and local pizza restaurants as well as national chains such as Domino’s Pizza®, Pizza Hut®, Papa John’s®, and Little Caesars Pizza®. According to NPD Crest, the quick service restaurant (“QSR”) pizza market, a subset of the overall pizza category, was about $36 billion in 2017. The top five pizza chains accounted for approximately 50.4% of QSR pizza restaurant sales in 2017 compared to 49.4% in 2016 and 47.8% in 2015. We believe the pizza restaurant market continues to be an attractive category due to its size and growth, as well as its fragmented competitive landscape.
On a broader scale, we compete with other limited service restaurants (“LSRs”), the overall food service industry, grocery and convenience stores, and online meal kit delivery services. The food service industry, particularly LSRs, are competitive with respect to product quality, price, location, service, and convenience. Many of our competitors have been in existence for longer periods of time and have developed stronger brand awareness in markets where we compete. In these markets, we compete for customers, employees, management personnel, franchisees, and real estate sites suitable for our stores.
Suppliers and Distribution |
We enter into national supply or pricing agreements with certain key third-party suppliers. We negotiate pricing for our franchised and Company-owned stores with national pricing agreements covering a term of three months to one year. We do not realize any profits from the sale of these supplies to franchise owners.
We rely on multiple third-party distributors as our primary distributors of cheese, refrigerated items, meat, canned and dry goods, paper and disposables, and janitorial supplies. Pursuant to our distribution service agreements, we have the right to designate the brands and products supplied. Supplies are delivered to each store one to two times each week.
For our beverage products, we rely on Pepsi-Cola Advertising and Marketing, Inc. (“Pepsi”) as our primary provider of packaged beverage products. We have maintained a national distribution relationship with Pepsi since 2004.
Intellectual Property and Trademarks |
We regard the Papa Murphy’s brand name and associated trademarks as valuable assets. We have a portfolio of 32 trademarks registered with the United States Patent and Trademark Office. We have also secured trademark registrations for our brand name in multiple countries outside of the United States in which we currently conduct business or may consider conducting business in the future. All of the marks we own cover store-related services and/or food products.
Management Information/Technology Systems |
Our point-of-sale system (“POS system”) has been customized specifically for Papa Murphy’s stores, and we use this integrated restaurant-level technology for inventory, labor management and cash handling in our domestic stores. Our POS system allows us to track sales data and evaluate store efficiency. Through our POS system we are able to collect, utilize, and disseminate data and information collected by each store to generate reports and evaluate sales performance in real-time. In addition, we collect monthly store-level profit and loss statements for analysis.
We continue to make substantial investments to further develop our e-commerce capabilities and platform, including a new Papa Murphy’s website and mobile application ordering system. This ordering channel, fully integrated with our in-store POS system, enables us to gather more information about customer ordering habits, which will enable us to further develop attractive offers and increase sales with digital marketing.
6
Franchising Overview |
Our store base was 90.5% franchised as of January 1, 2018, with our franchise owners operating a total of 1,378 Papa Murphy’s stores in 39 states, Canada, and the Middle East. Through our franchise support, development infrastructure, and screening process, we have successfully built a base of 501 franchise owners with an average store ownership of approximately 2.7 stores per franchise owner. A majority of our franchise owners owned one store, approximately 73% owned one or two stores, and 21% of all franchised stores were owned by our 10 largest franchise owners. We believe this highly diversified owner base demonstrates the viability of our store concept across numerous types of owners and operators, and provides an attractive base of owners with capacity to grow with our brand. We believe the relationships we have with our franchise system provide a solid platform for growth.
We are dedicated to providing the tools our franchise owners need to succeed before, during, and after a store opening, including assistance with site selection and development, training, operations, and marketing. We set forth qualification criteria and provide training programs for franchise owners to ensure that every Papa Murphy’s store meets the same quality and customer service standards to preserve the consistency and reliability of the Papa Murphy’s brand.
Our asset-light franchised business model offers us strategic and financial benefits. It enables us to focus Company resources on menu innovation, marketing, franchise owner training, and operations support to drive the overall success of our brand. Our franchised business model also allows us to grow our store base and brand awareness with limited corporate capital investment. Further, our predominantly franchised business model reduces our exposure to changes in commodity and other operating costs. As a result, our business model is designed to provide high operating margins and cash flows with low capital expenditures and working capital.
Employees |
As of March 1, 2018, we had 1,753 employees, including 290 salaried employees and 1,463 hourly employees. None of our employees are unionized or covered by a collective bargaining agreement and we consider our current employee relations to be good.
Seasonality | ||||
Seasonal factors and the timing of holidays cause our revenues to fluctuate from quarter to quarter. We typically follow family eating patterns at home, with our strongest sales levels occurring in the months of September through May and our lowest sales levels occurring in the months of June, July, and August. Therefore, our revenues per store are typically higher in the first and fourth quarters and lower in the second and third quarters. Additionally, our new store openings have historically been most heavily concentrated in the fourth quarter and we anticipate that new store openings will continue to be weighted towards the third and fourth quarters. As a result of these factors, our quarterly and annual results of operations and comparable store sales may fluctuate significantly. Accordingly, results for any one quarter are not necessarily indicative of results to be expected for any other quarter or for any year, and comparable store sales for any particular future period may decrease and materially and adversely affect our business, financial condition, or results of operations.
Government Regulation |
We, along with our franchise owners, are subject to various federal, state, local, and foreign laws affecting the operation of our respective businesses. Each store is subject to licensing and regulation by a number of governmental authorities, which include zoning, health, safety, sanitation, building, and fire agencies in the jurisdiction in which the store operates. In order to maintain our stores, we may be required to expend funds to meet certain federal, state, local, and foreign regulations, including regulations that require remodeled stores to be accessible to persons with disabilities. Difficulties in obtaining, or the failure to obtain, required licenses or approvals could delay or prevent the opening of a new store. Our domestic store operations are subject to various federal and state laws governing such matters as minimum wage requirements, benefits, working conditions, citizenship requirements, and overtime. We are also subject to federal and state environmental regulations.
7
We are subject to Federal Trade Commission (“FTC”) rules and to various state and foreign laws that govern the offer and sale of franchises. The FTC requires us to furnish to prospective franchise owners a franchise disclosure document containing prescribed information. Some states and foreign countries also have disclosure requirements and other laws regulating franchising and the franchisor-franchisee relationship. These laws regulate various aspects of the franchise relationship, including terminations and the refusal to renew franchises. The failure to comply with these laws and regulations in any jurisdiction or to obtain required government approvals could result in a ban or temporary suspension of future franchise sales, fines, or other penalties or require us to make offers of rescission or restitution, any of which could materially and adversely affect our business, financial condition, and results of operations.
8
Item 1A. Risk Factors
An investment in our common stock involves a high degree of risk. Before making an investment decision, you should carefully consider the following risk factors, as well as the other information in this Annual Report on Form 10-K, in evaluating our business. If any of these risks, as well as other risks and uncertainties that are not yet identified or that we currently think are immaterial, actually occur, our business, results of operations or financial condition could be materially and adversely affected. In such an event, the trading price of our common stock could decline and you could lose part or all of your investment.
Risks Relating to Our Business and Industry |
The limited service restaurant pizza category and restaurant sector overall are highly competitive and such competition could adversely affect our business, financial condition and results of operations.
The restaurant industry in general, and the limited service restaurant pizza category in particular, are highly competitive with respect to price, value, food quality, ambience, convenience, concept, service, and location. A substantial number of restaurant operations compete with us for customer traffic, both in store and online. We compete against other major national limited service restaurant pizza chains and regional and local businesses, including other chains offering pizza products. We also compete on a broader scale with other international, national, regional, and local limited-service restaurants. In addition, we face increasing competition from pizza product and other offerings available at grocery stores and convenience stores and through home delivery, including from online meal kit delivery services, which offer pre-made ready-to-bake frozen and carry-out pizzas and other foods that customers may prepare at home. Many of our competitors have significantly greater financial, marketing, personnel, and other resources as well as greater brand recognition than we do and may have lower operating costs, more restaurants, better locations, broader delivery options, and more effective marketing than we do. Many of our competitors are well established in markets in which we and our franchise owners operate stores or intend to locate new stores. In addition, many of our competitors emphasize lower-cost value options or meal packages, home delivery, or have loyalty programs, which provide discounts on certain menu offerings, and they may continue to do so in the future.
We also compete for employees, suitable real estate sites, and qualified franchise owners. If we are unable to compete successfully and maintain or enhance our competitive position, or if customers have a poor experience at a Papa Murphy’s store, whether Company-owned or franchise-owned, we could experience decreased customer traffic, downward pressure on prices, lower demand for our products, reduced margins, diminished ability to take advantage of new business opportunities, and the loss of market share, all of which could have a material and adverse effect on our business, financial condition, and results of operations.
The food service market is affected by consumer preferences and perceptions. Changes in these preferences and perceptions may lessen the demand for our products, which would reduce sales and harm our business.
Food service businesses are affected by changes in consumer tastes, international, national, regional, and local economic conditions, and demographic trends. For instance, if prevailing health or dietary preferences cause consumers to avoid pizza and other products we offer in favor of foods that are perceived as more healthy, our business, financial condition, and results of operations would be materially and adversely affected. In addition, if consumers no longer seek pizza that they can bake at home in favor of pizza that is already baked or can be delivered, our business, financial condition, and results of operations would be materially and adversely affected. Moreover, because we are primarily dependent on a single product, if consumer demand for pizza in general, and take and bake pizza in particular, should decrease, our business would be adversely affected more than if we had a more diversified menu, as many other food service businesses do.
Our business and results of operations depend significantly upon the success of our and our franchise owners’ existing and new stores.
Our business and results of operations are significantly dependent upon the success of our franchised and Company-owned stores. We and our franchise owners may be adversely affected by:
▪ | declining economic conditions, including downturns in the housing market, increases in unemployment rates, reductions in consumer disposable income, adverse credit market conditions, increases in fuel prices, drops in consumer confidence, and other events or factors that adversely affect consumer spending in the markets that we serve; |
9
▪ | increased competition in the restaurant industry, particularly in the pizza, casual, and fast-casual dining segments, and from grocery stores, convenience stores, and online meal kit delivery services; |
▪ | changes in consumer tastes and preferences; |
▪ | demographic trends; |
▪ | customers’ budgeting constraints; |
▪ | customers’ willingness to accept menu price increases; |
▪ | adverse weather conditions; |
▪ | our reputation and consumer perception of our concepts’ offerings in terms of quality, price, value, ambiance, and service; and |
▪ | customers’ experiences in our stores. |
In addition, the adverse effects of any of the preceding factors may reduce the attractiveness of new franchise stores to prospective franchise owners, which could make it more difficult to recruit the qualified franchise owners needed to implement our refranchising initiative. Our Company-owned stores and our franchise owners are also susceptible to increases in certain key operating expenses that are either wholly or partially beyond our control, including:
▪ | food costs, particularly for mozzarella cheese and other raw materials, many of which we do not or cannot effectively hedge; |
▪ | labor costs, including wages, which are affected by minimum wage requirements, workers’ compensation, health care, and other benefits expenses; |
▪ | rent expenses and construction, remodeling, maintenance, and other costs under leases for our new and existing stores; |
▪ | compliance costs as a result of changes in legal, regulatory, or industry standards; |
▪ | energy, water, and other utility costs; |
▪ | insurance costs; |
▪ | information technology and other logistics costs; and |
▪ | litigation expenses. |
Furthermore, the success of our and our franchise owners’ stores in markets in which we have historically not had a significant number of stores may be adversely affected by a lack of awareness or acceptance of our brand and the take and bake concept as well as by a lack of existing marketing efforts and operational execution in these new markets. Stores in new markets may also face challenges related to being new to a market and having less marketing funds than competitors, which may be due in part to lower store density than competitors. To the extent that we are unable to foster name recognition and affinity for our brand and concept in new markets and implement effective advertising and promotional programs, our franchise owners’ and our new stores may not perform as expected and our results of operations could be adversely affected.
Our strategic initiatives may not be successful, which may have an adverse effect on our business and results of operations.
Our business depends upon our ability to execute on our strategic initiatives in order to stabilize our sales and maintain profitability. These strategic initiatives include improving and expanding our online ordering platform, deploying third-party delivery services and increasing the scope and effectiveness of our digital marketing. These initiatives may not increase our sales and margins to the degree we expect, or at all. Online ordering and delivery also introduce new operating procedures to our stores, which, if not implemented properly, could adversely affect the experience of our customers and be burdensome to our store operators. Our digital marketing strategy relies, in part, on our customers using our online ordering platform, which provides us with contact and other information about our customers. If we are not successful in improving and expanding our online ordering platform, our digital marketing efforts may suffer. In further of our strategic initiatives, we are devoting additional resources to digital marketing. If our digital marketing efforts are not as effective as traditional forms of marketing, such as television or print, our results of operations could be adversely affected.
The planned refranchising of a portion of our Company-owned stores could adversely affect our results of operations.
We have announced plans to refranchise a significant number of our 145 Company-owned stores (total as of March 1, 2018) by selling the stores and entering into franchise agreements with the buyers. We are targeting to own about 50 Company-owned stores by 2020. Company-owned store sales accounted for 65% of our total revenues in 2017. We expect the proposed refranchising to result in a decrease in our total revenues because once the stores are refranchised we will derive revenue from the collection of a royalty equal to a percentage of net sales rather than from the total net sales of food
10
and beverages to customers. In addition, refranchising Company-owned stores, and particularly Company-owned stores that have historically enjoyed high profit margins, may reduce our operating income.
We face many challenges associated with refranchising Company-owned stores, including identifying, recruiting, and contracting with a sufficient number of qualified franchise owners, retaining employees during the transition to franchise owner management, and obtaining necessary consents from landlords and other third parties. These challenges may delay, limit, or prevent our planned refranchising, which could materially and adversely affect our ability to improve operating margins, reduce our exposure to changes in commodity and other operating costs, and generate cash to be used to repay debt. In addition, if we fail to manage our refranchising initiative effectively, the initiative could be time-consuming and distracting for management.
If we fail to identify, recruit, and contract with a sufficient number of qualified franchise owners, our ability to refranchise Company-owned stores and open new franchise stores could be materially and adversely affected.
The refranchising of Company-owned stores and the opening of additional franchise stores depends, in part, upon the attractiveness of our franchise stores to prospective franchise owners and the availability of prospective franchise owners who meet our criteria. Because most of our franchise owners open and operate one or two stores, our refranchising initiative requires us to identify, recruit, and contract with a significant number of new franchise owners each year. Decreases in system-wide average store sales or comparable store sales in select markets may reduce the attractiveness of new franchise stores to prospective franchise owners, making it more difficult for us to recruit qualified franchise owners. We may not be able to identify, recruit, or contract with suitable franchise owners in our target markets on a timely basis or at all. In addition, our franchise owners may not have access to the financial or management resources that they need to open the stores contemplated by their agreements with us, or they may elect to cease store development for other reasons. If we are unable to recruit suitable franchise owners or if franchise owners are unable or unwilling to acquire existing Company-owned stores or open new stores, our business, financial condition, and results of operations could be materially and adversely affected.
We may be unable to refinance or generate sufficient cash flow to satisfy our outstanding debt, which would adversely affect our financial condition and results of operations.
As of January 1, 2018, we had $95.9 million of outstanding indebtedness, including $92.9 million outstanding under our senior secured credit facilities, and $20.0 million of availability under a revolving credit facility, and we may, from time to time, incur additional indebtedness. Our obligations under our senior secured credit facility will mature in August 2019.
Our ability to meet our payment obligations under our debt depends on our ability to generate significant cash flows in the future. Interest rates on our senior secured credit facility are based on LIBOR and so increases in LIBOR would increase our payment obligations. If we are unable to generate sufficient cash flows to service our debt payment obligations, we may need to refinance or restructure our debt, sell assets, reduce or delay investments in our business, or seek to raise additional capital through the sale of equity securities. Such measures might not be successful, and additional debt or equity capital may not be available on acceptable terms or at all. If we are unable to implement one or more of these alternatives, we may be unable to meet our debt payment obligations, which would have a material adverse effect on our business, results of operations, or financial condition.
Our indebtedness may limit our ability to invest in the ongoing needs of our business and if we are unable to comply with our financial covenants, our liquidity and results of operations could be adversely affected.
The agreement governing our senior secured credit facilities places certain conditions on us, including that it:
▪ | requires us to utilize a substantial portion of our cash flow from operations to make payments on our indebtedness, reducing the availability of our cash flow to fund working capital, capital expenditures, development activity, and other general corporate purposes; |
▪ | increases our vulnerability to adverse general economic or industry conditions; |
▪ | limits our flexibility in planning for, or reacting to, changes in our business or the industries in which we operate; |
▪ | makes us more vulnerable to increases in interest rates, as borrowings under our new senior secured credit facilities are made at variable rates; |
▪ | limits our ability to obtain additional financing in the future for working capital or other purposes; and |
▪ | places us at a competitive disadvantage compared to our competitors that have less indebtedness. |
Our senior secured credit facilities place certain limitations on our ability to incur additional indebtedness. However, subject to the qualifications and exceptions in our senior secured credit facilities, we may be permitted to incur substantial additional indebtedness and may incur obligations that do not constitute indebtedness under the terms of the new senior secured credit facilities. The senior secured credit facilities also place certain limitations on, among other things, our ability to enter
11
into certain types of transactions, financing arrangements and investments, to make certain changes to our capital structure, and to guarantee certain indebtedness and pay. These restrictions limit or prohibit, among other things, our ability to:
▪ | pay dividends on, redeem or repurchase our stock, or make other distributions; |
▪ | incur or guarantee additional indebtedness; |
▪ | sell stock in our subsidiaries; |
▪ | create or incur liens; |
▪ | make acquisitions or investments; |
▪ | transfer or sell certain assets or merge or consolidate with or into other companies; |
▪ | make certain payments or prepayments of indebtedness subordinated to our obligations under our new senior secured credit facilities; and |
▪ | enter into certain transactions with our affiliates. |
Failure to comply with certain covenants or the occurrence of a change of control under our senior secured credit facilities could result in the acceleration of our obligations under the senior secured credit facilities, which would have an adverse effect on our liquidity, capital resources, and results of operations.
Our senior secured credit facilities also require us to comply with certain financial covenants regarding our leverage ratio, our interest coverage ratio, and our fixed charge coverage ratio. Changes with respect to these financial covenants may increase our interest rate and failure to comply with these covenants could result in a default and an acceleration of our obligations under the new senior secured credit facilities, which would have an adverse effect on our liquidity, capital resources, and results of operations.
The success of our business continues to depend, to a significant degree, upon the continued contributions of our senior officers and key employees, both individually and as a group, and the hiring of qualified executives to join our management team.
The composition of our senior management team has changed and we anticipate more change in the future as we seek to hire a new Chief Financial Officer in 2018, allowing our existing Chief Financial Officer, Mark Hutchens, to focus solely on his new role as Executive Vice President and Chief Operations Officer.
The changes in our senior management team have resulted in reallocations of duties and may increase employee uncertainty and cause unintended attrition. If we are not able to successfully manage these changes, it may be more difficult for us to attract and recruit highly skilled employees and our Company culture may suffer. The loss of any additional senior officers and key employees could have negative effects on our business and operations.
Although we have employment agreements in place with certain senior officers and key employees, we cannot prevent them from terminating their employment with us. The loss of the services of our Chief Executive Officer, Chief Operating Officer and Chief Financial Officer, other senior officers or key employees could have negative effects on our business and operations and could materially and adversely affect our business and plans for future development. We do not believe that we will lose the services of any of our current senior officers and key employees in the foreseeable future; however, we currently have no effective replacement for any of these individuals due to their experience, reputation in the industry, and special role in our operations. We do not maintain any key man life insurance policies for any of our employees.
New information or attitudes regarding diet and health could result in changes in regulations and consumer consumption habits that could adversely affect our results of operations.
Government regulation and consumer eating habits may affect our business as a result of changes in attitudes regarding diet and health or new information regarding the adverse health effects of consuming certain menu offerings. These changes have resulted in, and may continue to result in, laws and regulations requiring us to disclose the nutritional content of our food offerings, and they have resulted, and may continue to result in, laws and regulations affecting permissible ingredients and menu offerings. For example, to implement the nutrition labeling provisions of the Patient Protection and Affordable Care Act of 2010 (the “PPACA”), the United States Food and Drug Administration (the “FDA”) finalized Food Labeling; Nutrition Labeling of Standard Menu Items in Restaurants and Similar Retail Food Establishments (“the Menu Labeling Final Rule”), which requires covered restaurants, including our stores, to post nutritional information, including calorie disclosures, on their menus and/or menu boards and to provide additional nutrition information upon request. The Menu Labeling Final Rule is scheduled to take effect in May 2018. While some states had previously passed state menu labeling laws, the Menu Labeling Final Rule is intended to preempt inconsistent state laws. An unfavorable report on, or reaction to, our menu ingredients, the size of our portions, or the nutritional content of our menu items could negatively influence the demand for our products and materially and adversely affect our business, financial condition, and results of operations.
12
Compliance with current and future laws and regulations regarding the ingredients and nutritional content of our menu items may be costly and time-consuming. Additionally, if consumer health regulations or consumer eating habits change significantly, we may be required to modify or discontinue certain menu items, and we may experience higher costs associated with the implementation of those changes. We cannot predict the effect of the new nutrition labeling requirements under the Menu Labeling Final Rule until it takes effect. The risks and costs associated with nutritional disclosures on our menus could also affect our operations, particularly given differences among applicable legal requirements and practices within the restaurant industry with respect to testing and disclosure, ordinary variations in food preparation among our own restaurants, and the need to rely on the accuracy and completeness of nutritional information obtained from third-party suppliers.
We may also become subject to legislation or regulation seeking to tax and/or regulate high-fat foods, foods with high sugar and salt content, or foods otherwise deemed “unhealthy”. If we fail to comply with existing or future laws and regulations, we may be subject to governmental or judicial fines or sanctions.
Our results of operations and strategy depend in significant part on the success of our franchise owners, and we are subject to a variety of additional risks associated with our franchise owners, including litigation that has been brought against us by certain franchise owners.
A substantial portion of our revenues comes from royalties generated by our franchise stores. We anticipate that franchise royalties will represent a substantial and growing part of our revenues in the future. Accordingly, we are reliant on the performance of our franchise owners in successfully opening and operating their stores and paying royalties to us on a timely basis, and our reliance on the performance of our franchise owners increases as we franchise Company-owned stores. Our franchise system subjects us to a number of risks, any one of which may affect our ability to collect royalty payments from our franchise owners, may harm the goodwill associated with our brands, and may materially and adversely affect our business and results of operations.
• | Franchise owner independence. Franchise owners are independent operators, and their employees are not our employees. Accordingly, their actions are outside of our control. Although we have developed criteria to evaluate and screen prospective franchise owners, we cannot be certain that our franchise owners will have the business acumen or financial resources necessary to operate successful franchises in their locations and state franchise laws may limit our ability to terminate or modify these franchise agreements. Moreover, despite our training, support, and monitoring, franchise owners may not successfully operate stores in a manner consistent with our standards and requirements, or may not hire and adequately train qualified managers and other store personnel. The failure of our franchise owners to operate their franchises successfully, and actions taken by their employees, could each have a material and adverse effect on our reputation, brand, ability to attract prospective franchise owners, business, financial condition, or results of operations. |
• | Franchise agreement termination or non-renewal. Each franchise agreement is subject to termination by us as the franchisor in the event of a default, generally after expiration of applicable cure periods, although in certain circumstances a franchise agreement may be terminated by us upon notice without an opportunity to cure. The default provisions under the franchise agreements are drafted broadly and include, among other things, any failure to meet operating standards and actions that may threaten our licensed intellectual property. |
In addition, each franchise agreement has an expiration date. Upon the expiration of the franchise agreement, we or the franchise owner may not elect to renew the franchise agreement. If the franchise agreement is renewed, the franchise owner will receive a successive franchise agreement for an additional term. Such option, however, is contingent on the franchise owner’s execution of the then-current form of franchise agreement (which may include new obligations, as well as increased franchise fees, royalty payments, advertising fees, and other fees and costs), the satisfaction of certain conditions (including modernization of the restaurant and related operations) and the payment of a renewal fee. If a franchise owner is unable or unwilling to satisfy any of the foregoing conditions, we may elect not to renew the expiring franchise agreement, in which event the franchise agreement will terminate upon expiration of the term.
• | Franchise owner insurance. The franchise agreements require each franchise owner to maintain certain insurance types and levels. Certain extraordinary hazards, however, may not be covered, and insurance may not be available (or may be available only at prohibitively expensive rates) with respect to many other risks. Moreover, any loss incurred could exceed policy limits and any policy payments made to franchise owners may not be made on a timely basis. Any such loss or delay in payment could have a material and adverse effect on a franchise owner’s ability to satisfy obligations under the franchise agreement, including the ability to make royalty payments and perform indemnity obligations. Further, the franchise owner may fail to obtain or maintain the required insurance types and levels, and we may not be aware of that failure until a loss is incurred. |
13
• | Product liability exposure. We require franchise owners to maintain general liability insurance coverage to protect against the risk of product liability and other risks and demand strict franchise owner compliance with health and safety regulations. However, franchise owners may receive or produce defective food or beverage products, which may materially and adversely affect our brand’s goodwill and our business. Further, a franchise owner’s failure to comply with health and safety regulations, including requirements relating to food quality or preparation and the sourcing of food from vendors, could subject the franchise owner, and possibly us, to litigation. Any litigation, including the imposition of fines or damage awards, could adversely affect the ability of a franchise owner to make royalty payments, or could generate negative publicity, or otherwise adversely affect us. |
• | Franchise owners’ participation in our strategy. Our franchise owners are an integral part of our business. We may be unable to successfully implement our strategy if our franchise owners do not actively participate in such implementation. From time to time, franchise owners have disagreed with or resisted elements of our strategy, including new product initiatives and investments in their stores such as remodeling, migrating to a new e-commerce platform, and adopting third party delivery. Franchise owners may also fail to participate in our marketing initiatives, with respect to financial contributions, time spent on initiatives and the content of marketing messaging, and implementation of recommended promotions, which could materially and adversely affect their sales trends, average weekly sales (“AWS”), and results of operations. In addition, the failure of our franchise owners to focus on the fundamentals of restaurant operations, such as quality, service, and cleanliness, would have a negative effect on our business. It also may be difficult for us to monitor our international franchise owners’ implementation of our strategy due to our lack of personnel in the markets served by such franchise owners. |
• | Franchise owner litigation and conflicts with franchise owners. Franchise owners are subject to a variety of litigation risks, including customer claims, personal-injury claims, environmental claims, employee claims, intellectual property claims, and claims related to violations of the Americans with Disabilities Act, religious freedom, the Fair Labor Standards Act (“FLSA”), the Employee Retirement Income Security Act of 1974, as amended, and advertising laws. Each of these claims may increase costs and limit the funds available to make royalty payments and reduce entries into new franchise agreements. We also may be named in lawsuits against our franchise owners. |
In addition, the nature of the franchisor-franchise owner relationship may give rise to conflict. For example, franchise owners have expressed a number of concerns and disagreements with our Company, including concern over a lack of franchise owner involvement in strategic decision-making, inadequate assistance in increasing and difficulty maintaining franchise store profitability in a higher cost environment, disagreement with marketing strategy and initiatives and product launches, concern over the implementation of the Company’s marketing programs, disagreement with the Company’s expansion strategy and the availability of development incentives, dissatisfaction with food safety measures implemented by the Company, including required purchases and new protocols, and dissatisfaction with costs associated with, and the functionality of, the Company’s online ordering platform. Our senior management team engages with franchise owner leadership to address these concerns and resolve specific issues raised by the franchise owners. Such engagement may not result in a satisfactory resolution of the issues, which could materially and adversely affect our ability to strengthen our franchise system and maintain relationships with our franchise owners, damage our reputation and our brand, and materially and adversely affect our results of operations.
We currently are subject to litigation with a group of our franchise owners as described in Part I, Item 3. Legal Proceedings. We also may become subject to additional litigation with franchise owners in the future. In addition to these and other claims that may be brought against us by franchise owners, we also may engage in future litigation with franchise owners to enforce the terms of our franchise agreements and compliance with our brand standards as determined necessary to protect our brand, the consistency of our products, and the customer experience. Any negative outcome of these or any other claims could materially and adversely affect our results of operations as well as our ability to expand our franchise system and may damage our reputation and our brand.
• | Access to credit. Our franchise owners typically finance new operations and new store openings with loans or other forms of credit. If our franchise owners are unable to access credit or obtain sufficient credit, if interest rates on loans that our franchise owners use to finance operations of current stores or to open new stores increase or if franchise owners are unable to service their debt, our franchise owners may have difficulty operating their stores or opening new stores, which could materially and adversely affect our results of operations as well as our ability to expand our franchise system. |
• | Franchise owner bankruptcy. The bankruptcy of a multi-unit franchise owner could negatively affect our ability to collect payments due under such franchise owner’s franchise agreement. In a franchise owner bankruptcy, the |
14
bankruptcy trustee may reject its franchise agreements pursuant to Section 365 under the United States Bankruptcy Code, in which case there would be no further royalty payments from such franchise owner.
Termination of area development agreements (“ADAs”) or master franchise agreements with certain franchise owners could adversely affect our revenues.
We enter into ADAs with certain domestic franchise owners that plan to open multiple Papa Murphy’s stores in a designated market area and we have entered into master franchise agreements with third parties to develop and operate stores in Canada and in the Middle East. These franchise owners are granted certain rights with respect to specified territories, and, at their discretion, these franchise owners may open more stores than specified in their agreements. The termination of ADAs or other arrangements with a master franchise owner or a lack of expansion by these franchise owners could result in the delay of the development of franchised restaurants or discontinuation or an interruption in the operation of our brands in a particular market or markets. We may not be able to find another operator to resume development activities in such market or markets. Any such delay, discontinuation or interruption would result in a delay in, or loss of, royalty income to us by way of reduced sales and could materially and adversely affect our business, financial condition, or results of operations.
We are subject to all of the risks associated with leasing space subject to long-term non-cancelable leases.
We do not own any of the real property where our Company-owned stores operate. Payments under our operating leases account for a portion of our operating expenses. Our leases generally have an initial term of five years and generally can be extended only in five-year increments (at increased rates). All of our leases require a fixed annual rent, although some require the payment of additional rent if store sales exceed a negotiated amount. Generally, our leases are net leases, which require us to pay all of the cost of insurance, taxes, maintenance, and utilities. We generally cannot cancel these leases. Additional sites that we lease are likely to be subject to similar long-term non-cancelable leases. We also sublease or assign some of our leases to our franchisees, and will continue to do so in the future, either before or after we have developed a store at the leased location. When we assign or sublease our leases to franchisees, such as assignments or subleases made in connection with refranchising Company-owned stores, we are in most instances required to retain ultimate liability to the landlord. If an existing or future store is not profitable, resulting in its closure (or, in the case of a lease that we have subleased or assigned to a franchisee, the franchisee defaults on the subleased or assigned lease), we could lose some or all of our development investment as well as be committed to perform our obligations under the applicable lease. This could include, among other things, paying the base rent for the balance of the lease term. We may also be subject to a claim by a franchise owner who defaults on a lease that we knew or should have known that the leased location would be unprofitable.
In addition, we may fail to negotiate renewals as each of our leases expires, either on commercially acceptable terms or at all, which could cause us to pay increased occupancy costs or to close stores in desirable locations. These potential increased occupancy costs and closed stores could materially and adversely affect our business, financial condition, or results of operations.
The effect of negative economic factors, including the availability of credit, on our franchise owners’ and our landlords could negatively affect our results of operations.
Negative effects on our and our franchise owners’ existing and potential landlords due to the inaccessibility of credit and other unfavorable economic factors may adversely affect our business and results of operations. If our or our franchise owners’ landlords are unable to obtain financing or remain in good standing under their existing financing arrangements, they may be unable to provide construction funding to us or satisfy other lease covenants. In addition, if our franchise owners or our landlords are unable to obtain sufficient credit to continue to properly manage their retail sites, we may experience a drop in the level of quality of such retail locations.
Damage to our reputation and the Papa Murphy’s brand and negative publicity relating to our stores, including our franchise stores, could reduce sales at some or all of our other stores and could negatively affect our business, financial condition, and results of operations.
Our success is dependent in part upon our ability to maintain and enhance the value of the Papa Murphy’s brand, consumers’ connection to our brand and positive relationships with our franchise owners. We may, from time to time, be faced with negative publicity relating to food quality, food safety, store facilities, customer complaints or litigation alleging illness or injury, health inspection scores, integrity of our or our suppliers’ food processing, employee and franchise owner relationships, franchise owner litigation, or other matters, regardless of whether the allegations are valid or whether we are held to be responsible. The risks associated with such negative publicity cannot be completely eliminated or mitigated and may materially and adversely affect our business, financial condition, and results of operations and result in damage to our brand. For multi-location food service businesses such as ours, the negative effect of adverse publicity relating to one store or a limited number of stores may extend far beyond the stores or franchise owners involved to affect some or all of our other stores. The risk of negative publicity is particularly great with respect to our franchise stores because we are limited in
15
the manner in which we can regulate them, especially on a real-time basis. A similar risk exists with respect to unrelated food service businesses, if consumers associate those businesses with our own operations.
The use of social media platforms and similar devices, including blogs, social media websites, and other forms of Internet-based communications that allow individuals to access a broad audience of consumers and other interested persons has increased markedly. Consumers value readily available information concerning goods and services that they purchase and may act on such information without further investigation or authentication. The availability of information on social media platforms is virtually immediate, as is its effect. Many social media platforms immediately publish the content their subscribers and participants’ post, often without filters or checks on the accuracy of the content posted. The opportunity for dissemination of information, including inaccurate information, is seemingly limitless and readily available. Information concerning our Company may be posted on such platforms at any time. Information posted may be adverse to our interests or may be inaccurate, each of which may harm our performance, prospects, or business. The harm may be immediate without affording us an opportunity for redress or correction. Such platforms also could be used for dissemination of trade secret information, compromising valuable Company assets.
Food safety and foodborne illness concerns could have an adverse effect on our business.
We cannot guarantee that our supply chain and food safety controls and training will be fully effective in preventing all food safety issues at our stores, including any occurrences of foodborne illnesses such as salmonella, E. coli, and hepatitis A. In addition, we do not assure you that our franchise locations will maintain the high levels of internal controls and training we require at our Company-owned stores. Furthermore, our franchise owners and we rely on third-party vendors, making it difficult to monitor food safety compliance and increasing the risk that foodborne illness would affect multiple locations rather than a single store. Some foodborne illness incidents could be caused by third-party vendors and transporters outside of our control. New illnesses resistant to our current precautions may develop in the future, or diseases with long incubation periods could arise, that could give rise to claims or allegations on a retroactive basis. One or more instances of foodborne illness in any of our stores or markets or related to types of food products we sell, if publicized on national media outlets or through social media, could negatively affect our store sales nationwide. This risk exists even if it were later determined that the illness was wrongly attributed to us or one of our stores. A number of other restaurant chains have experienced incidents related to foodborne illnesses that have had a material and adverse effect on their operations. The occurrence of a similar incident at one or more of our stores, or negative publicity or public speculation about an incident, could materially and adversely affect our business, financial condition, or results of operations.
Our success depends in part upon effective advertising and marketing campaigns, which may not be successful, and franchise owner support of such advertising and marketing campaigns, as well as compliance with the restrictions and obligations imposed by laws regulating certain marketing practices.
We believe the Papa Murphy’s brand is critical to our business. We expend resources in our marketing efforts using a variety of media, including television advertising, digital and social media, email, and opt-in text messaging. We expect to continue to conduct brand awareness programs and customer initiatives to attract and retain customers. Additionally, some of our competitors have greater financial resources than we do, which enables them to spend significantly more on marketing and advertising than us. Should our competitors increase spending on marketing and advertising, or should our advertising and promotions be less effective than our competitors, our business, financial condition, and results of operations could be materially and adversely affected.
The support of our franchise owners is critical for the success of our advertising and the marketing campaigns we seek to undertake, and the successful execution of these campaigns will depend on our ability to maintain alignment with our franchise owners. Our franchise owners are required to spend a minimum of five percent of net sales directly on local advertising or contribute to a local fund managed by franchise owners in certain market areas to fund the purchase of advertising media. Our franchise owners are also required to contribute two percent of their net sales to a fund to support the development of new products, brand development, and national marketing programs. Consequently, a decline in net sales at franchise stores may result in reduced spending on advertising and the development of new products, brand development, and national marketing programs, or may require us, our franchise owners, or other third-parties to contribute additional advertising funds, which we, our franchise owners, and other third-parties have done at various times. Although we maintain control over advertising and marketing materials and can mandate certain strategic initiatives pursuant to our franchise agreements, we need the active support of our franchise owners if the implementation of these initiatives is to be successful. Additional advertising funds are not contractually required, and we, our franchise owners and other third-parties may choose to discontinue contributing additional funds in the future. Any significant decreases in our advertising and marketing funds or financial support for advertising activities could significantly curtail our marketing efforts, which may materially and adversely affect our business, financial condition, and results of operations.
Further, some of our marketing campaigns involve emails and opt-in text messages. In the United States, the Telephone Consumer Protection Act regulates making phone calls and sending text messages to consumers. The Federal Controlling
16
the Assault of Non-Solicited Pornography and Marketing Act of 2003 (the “CAN-SPAM Act”) regulates commercial email messages and specifies penalties for the transmission of commercial email messages that do not comply with the law‘s requirements, such as providing an opt-out mechanism for stopping future emails from senders. States and other countries have similar laws related to telemarketing and commercial emails. Failure to comply with obligations and restrictions related to text message and email marketing could subject us to lawsuits, fines, statutory damages, consent decrees, injunctions, adverse publicity, and other losses that could harm our business. We are currently subject to one such lawsuit, which is described in Part I, Item 3, Legal Proceedings.
We experience the effects of seasonality.
Seasonal factors and the timing of holidays cause our revenues to fluctuate from quarter to quarter. We typically follow family eating patterns at home, with our strongest sales levels occurring in the months of September through May, and our lowest sales levels occurring in the months of June, July, and August. Therefore, our revenues per store have typically been higher in the first and fourth quarters and lower in the second and third quarters. Additionally, our new store openings have historically been concentrated in the fourth and first quarters because new franchise owners may seek to benefit from historically stronger sales levels occurring in these periods. We believe that new store openings will continue to be weighted towards the fourth quarter. As a result of these factors, our quarterly and annual results of operations and comparable store sales may fluctuate significantly. Accordingly, results for any one quarter are not necessarily indicative of results to be expected for any other quarter or for any year and comparable store sales for any particular future period may decrease and materially and adversely affect our business, financial condition, or results of operations.
Changes in economic conditions, including effects from recession, adverse weather, and other unforeseen conditions, could materially and adversely affect our business, financial condition, and results of operations.
The restaurant industry depends on consumer discretionary spending. Volatile economic conditions now or in the future may depress consumer confidence and discretionary spending. If the economy fails to fully recover for a prolonged period of time or worsens and if our customers have less discretionary income or reduce the amount they spend on quick service meals, customer traffic could be adversely affected. We believe that if negative economic conditions persist for a long period of time or become pervasive, consumers might make long-lasting changes to their discretionary spending behavior, including dining out less frequently. Declines in food commodity prices may accelerate these changes in consumer spending by inducing consumers to purchase more of their meals from grocery and convenience stores. In addition, given our geographic concentrations in the West and Midwest, economic conditions in these particular areas of the country could have a disproportionate effect on our overall results of operations, and regional occurrences such as local strikes, terrorist attacks, increases in energy prices, adverse weather conditions, tornadoes, earthquakes, floods, droughts, fires, or other natural or man-made disasters could materially and adversely affect our business, financial condition, and results of operations. Adverse weather conditions may also affect customer traffic at our stores, and, in more severe cases, cause temporary store closures, sometimes for prolonged periods. If store sales decrease, our profitability could decline as we spread fixed costs across a lower level of sales. Reductions in staff levels, asset impairment charges, and potential store closures could result from prolonged negative store sales.
Changes in food availability and costs could adversely affect our results of operations.
Our profitability and operating margins are dependent in part on our ability to anticipate and react to changes in food costs, particularly the costs of mozzarella cheese and flour. We are party to national supply agreements for core ingredients with certain key third party suppliers, including Saputo Cheese Inc. and Davisco Foods, for cheese; Pizza Blends, Inc., for flour and dough mix; Neil Jones Foods Company, for tomatoes used in sauce; and several suppliers for meat, pursuant to which we lock in pricing for our franchise owners and Company-owned stores. We rely on Sysco Corporation as the primary distributor of food and other products to our franchise owners and Company-owned stores. Our pricing arrangements with national suppliers typically have terms from three months to a year, after which the pricing may be renegotiated. Each store purchases food supplies directly from our approved distributors and produce locally through an approved produce supplier.
The type, variety, quality, availability, and price of produce, meat, and cheese are volatile and are subject to factors beyond our control, including weather, governmental regulation, availability, and seasonality, each of which may affect our and our franchise owners’ food costs or cause a disruption in our supply. For example, cheese pricing is higher in the summer months due to a drop off in milk production in higher temperatures. Our food distributors and suppliers also may be affected by higher costs to produce and transport commodities used in our stores, higher minimum wage and benefit costs, and other expenses that they pass through to their customers, which could result in higher costs for goods and services supplied to us. We may not be able to anticipate and react to changing food costs through our purchasing practices and menu price adjustments in the future. As a result, any increase in the prices charged by suppliers would increase the food costs for our Company-owned stores and for our franchise owners and could adversely affect our and their profitability. In addition, because we provide moderately priced food, we may choose not to, or may be unable to, pass along commodity price increases to consumers, and any price increases that are passed along to consumers may materially and adversely affect
17
store sales, which would lower revenues generated from Company-owned stores and franchise owner royalties. These potential changes in food and supply costs and availability could materially and adversely affect our business, financial condition, or results of operations.
Decreases in food costs may also affect consumer behavior in ways adverse to us. If our competitors, including grocery stores, are better able to pass along commodity price decreases to customers than we are, then we may experience lower demand for our products and loss of market share.
Our dependence on a sole supplier or a limited number of suppliers for some ingredients could result in disruptions to our business.
Sysco Corporation is the primary distributor of our food and other products to our domestic franchise owners and Company-owned stores, and any disruption to this distribution due to work stoppages, strikes, or other business interruption may materially and adversely affect our franchise owners and us. The initial term of our Distribution Service Agreement with Sysco expired in August 2007, and now the agreement automatically renews for one-year terms until terminated by either party with written notice one year before the termination date in such notice. Additionally, we do not have formal long-term arrangements with all of our suppliers, and therefore our suppliers may implement significant price increases or may not meet our requirements in a timely fashion, or at all. Any material interruptions in our supply chain, such as a material interruption of ingredient supply due to the failures of third party distributors or suppliers, or interruptions in service by common carriers that ship goods within our distribution channels, may result in significant cost increases and reduce store sales. We may not be able to find alternative distributors or suppliers on a timely basis or at all. Our franchise and Company-owned stores could also be harmed by any prolonged disruption in the supply of products from or to our key suppliers due to weather, crop disease, civil unrest, and other events beyond our control. Insolvency of key suppliers could also negatively affect our business. Our focus on a limited menu would make the consequences of a shortage of a key ingredient, such as cheese or flour, more severe, and affected stores could experience significant reductions in sales during the shortage.
Changes in laws related to electronic benefit transfer (“EBT”) systems could adversely affect our results of operations.
Because our products are not cooked, we and our franchise owners currently are able to accept EBT payments, or food stamps, at stores in the United States. Changes in state and federal laws governing where EBT cards may be used and what they may be used for may limit our ability to accept such payments and could significantly reduce sales. Reductions in food stamp benefits occurred in November 2013, and further additional reductions in food stamp benefits are periodically proposed by lawmakers in the U.S. Senate or House of Representatives. In addition, the Trump Administration has proposed modifying food stamp benefits so that recipients would receive packages of food in place of a portion of the cash food stamp benefits they previously received. The recent reductions and potential future reductions in food stamp benefits may reduce sales, which could materially and adversely affect our business, financial condition, and results of operations.
Changes in employment laws may adversely affect our business.
Various federal and state labor laws govern our relationships with our employees and the relationships of our franchise owners with their employees, which may affect our and our franchise owners’ operating costs. These laws include employee classification as exempt/non-exempt for overtime and other purposes, minimum wage requirements, unemployment tax rates, mandatory health benefits, workers’ compensation rates, immigration status, tax reporting, and other wage and benefit requirements. A substantial number of employees at our franchise and Company-owned stores are paid at rates related to the U.S. federal minimum wage, and increases in the U.S. federal minimum wage, or higher minimum wage rates imposed by states or municipalities, may increase labor costs. Any such increases in labor costs might result in franchise owners inadequately staffing restaurants. Understaffed restaurants could reduce sales at such restaurants, decrease royalty payments, and adversely affect our brands.
The U.S. federal government and various states are considering or have already adopted new immigration laws and enforcement programs. Some of these changes may increase obligations for compliance and oversight, which could subject us to additional costs and make the hiring process for us and our franchise owners more cumbersome, or reduce the availability of potential employees. Although we require all of our employees, including at our Company-owned stores, to provide us with government-specified documentation evidencing their employment eligibility, some of our employees may, without our knowledge, be unauthorized workers. We currently participate in the “E-Verify” program, an Internet-based, free program run by the United States government to verify employment eligibility, in states in which participation is required and we have implemented throughout our stores. However, use of the “E-Verify” program does not guarantee that we will properly identify all applicants who are ineligible for employment. In addition, our franchise owners are responsible for screening any employees they hire. Unauthorized workers are subject to deportation and may subject us or our franchise owners to fines or penalties, and if we are found to be employing unauthorized workers, we could experience adverse
18
publicity that negatively impacts our brand and may make it more difficult to hire and keep qualified employees. Termination of a significant number of employees who were unauthorized employees may disrupt store operations and cause temporary increases in our or our franchise owners’ labor costs as we train new employees. We could also become subject to fines, penalties, and other costs related to claims that we did not fully comply with all recordkeeping obligations of federal and state immigration compliance laws.
Franchisors may be subject to claims that they are joint employers with their franchisees. This could expose franchisors, including us, to liability for claims by, or based on the acts of, franchisees’ employees. Although we carry insurance policies for a significant portion of our risks and associated liabilities with respect to workers’ compensation, general liability, employer’s liability, health benefits, and other insurable risks, a claim not covered by that insurance, or a judgment in excess of our insurance coverage, could materially and adversely affect our business, financial condition, and results of operations. Regardless of whether any claims that may be brought against us are valid or whether we are ultimately determined to be liable, our business, financial condition, and results of operations could also be adversely affected by negative publicity, litigation costs resulting from the defense of these claims, and the diversion of time and resources from our operations.
If our franchise owners or we face labor shortages, labor disputes, or increased labor costs, our growth and operating results could be adversely affected.
Labor is a primary component in the cost of operating our Company-owned stores and for franchise owners. If we or our franchise owners face labor shortages or increased labor costs because of increased competition for employees, higher employee turnover rates, increases in the federal, state or local minimum wage, or other employee benefits costs (including costs associated with health insurance coverage), our operating expenses could increase and our growth could be adversely affected. In addition, our success depends in part upon our franchise owners’ and our ability to attract, motivate, and retain a sufficient number of well-qualified store operators and management personnel, as well as a sufficient number of other qualified employees, to keep pace with our expansion schedule. Qualified individuals needed to fill these positions are in short supply in some geographic areas. In addition, restaurants have traditionally experienced relatively high employee turnover rates. Although we have not yet experienced significant problems in recruiting or retaining employees, our franchise owners’ and our ability to recruit and retain such individuals may delay the planned openings of new stores or result in higher employee turnover in existing stores, which could have a material and adverse effect on our business, financial condition, or results of operations.
Additionally, while we do not currently have any unionized employees and are not currently subject to any unionization efforts, there is a potential for union organizers to engage in efforts to organize our employees or those of our franchise owners. Potential union representation and collective bargaining agreements may result in increased labor costs that can have an effect on competitiveness, as well as affect our ability to retain well-qualified employees. Labor disputes, as well, may precipitate strikes and picketing that may have an effect on business, including guest patronage. Further, potential changes in labor laws could increase the likelihood of some or all of our employees being subjected to greater organized labor influence, and could have a material and adverse effect on our business, financial condition, or results of operations by imposing requirements that could potentially increase our costs, reduce our flexibility, and affect our employee culture.
Any increase in the cost of labor could adversely affect our business and our growth. Competition for employees could require us or our franchise owners to pay higher wages, which could result in higher labor costs. In addition, increases in the minimum wage, of which several have been mandated by governing bodies in some localities in which we or our franchise owners operate stores, would increase our labor costs. Moreover, costs associated with workers’ compensation are rising, and these costs may continue to rise in the future. We may be unable to increase our menu prices in order to pass these increased labor costs on to consumers, in which case our margins would be negatively affected, which could materially and adversely affect our business, financial condition, or results of operations.
The effect of changes to healthcare laws in the United States may increase the number of employees who choose to participate in our healthcare plans, which may significantly increase our healthcare costs and negatively affect our results of operations and our franchise owners.
In 2010, the PPACA was signed into law in the United States to require health care coverage for many uninsured individuals and expand coverage for those already insured. We offer and subsidize comprehensive healthcare coverage, primarily for our salaried employees. The healthcare reform law requires us to offer healthcare benefits to all full-time employees (including full-time hourly employees) that meet certain minimum requirements of coverage and affordability, or face penalties. We offer hourly employees who qualify as full-time employees under the PPACA the option of enrolling in our health care coverage during our annual open enrollment period, but the number of such employees electing to so enroll is low. If the number of full-time hourly employees electing to enroll in our health care coverage increases significantly, we may incur substantial additional expense, or, if the benefits we offer do not meet applicable requirements, we may incur penalties. It is also possible that by making changes or failing to make changes in the healthcare plans offered by us, we will become less competitive in the market for our labor. Finally, implementing the requirements of healthcare reform is likely to
19
impose additional administrative costs. The U.S. Congress may also consider repealing all or a portion of the PPACA and it is uncertain what, if any, new laws and regulations would replace the repealed portions of the PPACA. The costs and other effects of these new healthcare requirements, and any proposed repeal or modifications of such requirements, are still being determined, but they may significantly increase our healthcare coverage costs and could materially and adversely affect our business, financial condition, or results of operations.
Restaurant companies have been the target of class actions and other litigation alleging, among other things, violations of federal and state law. We could be party to litigation that could adversely affect us by distracting management, increasing our expenses, or subjecting us to material money damages and other remedies.
We are subject to lawsuits, administrative proceedings and claims that arise in the ordinary course of our business. In recent years, a number of restaurant companies have been subject to claims by customers, employees, franchise owners, and others regarding issues such as food safety, personal injury and premises liability, employment-related claims, harassment, discrimination, disability, compliance with advertising laws (including the Telephone Consumer Protection Act), and other operational issues common to the foodservice industry. A number of these lawsuits have resulted in the payment of substantial damages by the defendants. For example, on May 8, 2015, we were named as a defendant in a putative class action lawsuit claiming a violation of the Telephone Consumer Protection Act. Specific information regarding the lawsuit is included in Part 1, Item 3, Legal Proceedings.
Although we have historically experienced very few customer lawsuits, our customers occasionally allege we caused an illness or injury they suffered at or after a visit to our stores, or that we have problems with food quality or operations. We are also subject to a variety of other claims arising in the ordinary course of our business, including personal injury claims, contract claims, and claims alleging violations of laws regarding workplace and employment matters, equal opportunity, discrimination, and similar matters and may become subject to class action or other lawsuits related to these or different matters in the future. We may also be named as a defendant in any such claims brought against any of our franchise owners. An adverse judgment or settlement, related to any litigation claim, that is not insured or is in excess of our insurance coverage could have an adverse effect on our business, financial condition, or results of operations. Regardless of whether any claims that may be brought against us are valid or whether we are ultimately determined to be liable, our business, financial condition, and results of operations could also be adversely affected by negative publicity, litigation costs resulting from the defense of these claims, and the diversion of time and resources from our operations.
In addition, the restaurant industry has been subject to a growing number of claims based on the nutritional content of food products sold and disclosure and advertising practices. We may also be subject to this type of proceeding in the future and, even if we are not, publicity about these matters (particularly directed at the limited service or fast casual segments of the industry) may harm our reputation and could materially and adversely affect our business, financial condition, or results of operations.
Opening new stores in existing markets may negatively affect sales at existing stores.
Although our core strategy is to focus on stabilizing same store sales and maintain profitability by maximizing customer convenience, delivering effective marketing messages to our customers, cultivating a culture of teamwork, continuous learning, and development, and creating an efficient, consistent execution process, we may from time to time open new franchise stores, including new franchise stores in our existing markets. Expansion in existing markets may be affected by local economic and market conditions. Further, the customer target area of our stores varies by location, depending on a number of factors, including population density, other local retail and business attractions, area demographics, and geography. As a result, the opening of a new store in or near markets in which stores already exist could adversely affect the sales of these existing stores. We and our franchise owners may selectively open new stores in and around areas of existing stores. Competition for sales between our stores may become significant in the future as we continue to expand our operations and could affect sales growth, which could materially and adversely affect our business, financial condition, or results of operations.
Our expansion into international markets exposes us to a number of risks that may differ in each country where we have franchise stores.
We currently have franchise stores in Canada and the United Arab Emirates and may continue to grow internationally. Our international operations are in early stages and historically have not been profitable and have achieved lower margins than our domestic stores. We expect this financial performance to continue in the near-term. Our financial condition and results of operations may be adversely affected if global markets in which our franchise stores compete are affected by changes in political, economic or other factors. These factors, over which neither our franchise owners nor we have control, may include:
• | recessionary or expansive trends in international markets; |
20
• | changing labor conditions and difficulties in staffing and managing our foreign operations; |
• | increases in the taxes we pay and other changes in applicable tax laws; |
• | legal and regulatory changes, and the burdens and costs of our compliance with a variety of foreign laws; |
• | changes in inflation rates; |
• | changes in exchange rates and the imposition of restrictions on currency conversion or the transfer of funds; |
• | difficulty in protecting our brand, reputation and intellectual property; |
• | difficulty in collecting our royalties and longer payment cycles; |
• | expropriation of private enterprises; |
• | anti-American sentiment and the identification of the Papa Murphy’s brand as an American brand; |
• | restrictions on immigration and international travel; |
• | political and economic instability and civil unrest; and |
• | other external factors. |
Furthermore, because of the differences in foreign laws concerning proprietary rights, our intellectual property rights may not receive the same degree of protection in foreign countries as they would in the United States. This could have an adverse effect on our ability to successfully expand into other jurisdictions in the future.
Any acquisitions, partnerships, or joint ventures that we make could disrupt our business and harm our financial condition.
From time to time, we may evaluate potential strategic acquisitions of existing stores or complementary businesses as well as partnerships or joint ventures with third parties, including potential franchisors, to facilitate our refranchising initiative and growth, particularly our international expansion. We may not be successful in identifying acquisition, partnership, and joint venture candidates. In addition, we may not be able to continue the operational success of any stores we acquire or successfully finance or integrate any businesses that we acquire or with which we form a partnership or joint venture. We may have potential write-offs of acquired assets and an impairment of any goodwill recorded as a result of acquisitions. Furthermore, the integration of any acquisition may divert management’s time and resources from our core business and disrupt our operations or may result in conflicts with our business.
Any acquisition, partnership, or joint venture may not be successful, may reduce our cash reserves, may negatively affect our earnings and financial performance, and, to the extent financed with stock or the proceeds of debt, may be dilutive to our stockholders or increase our already high levels of indebtedness. We do not ensure that any acquisition, partnership, or joint venture we make will not have a material and adverse effect on our business, financial condition, and results of operations.
Security breaches of confidential customer information in connection with our electronic processing of credit and debit card transactions may adversely affect our business.
The majority of our store sales are by credit or debit cards. Other restaurants and retailers have experienced security breaches in which credit and debit card information of their customers has been stolen. We may in the future become subject to lawsuits or other proceedings for purportedly fraudulent transactions arising out of the actual or alleged theft of our customers’ credit or debit card information. In addition, most states have enacted legislation requiring notification of security breaches involving personal information, including credit and debit card information. Any such claim, proceeding, or mandatory notification could cause us to incur significant unplanned expenses, which could have an adverse impact on our financial condition and results of operations. Further, adverse publicity resulting from these allegations could harm our reputation and could materially and adversely affect our business, financial condition, and results of operations.
System security risks, data breaches, and cyber attacks could disrupt our operations.
We manage and store various proprietary information and sensitive or confidential data relating to our business, including sensitive and personally identifiable information related to our suppliers, customers, and franchise owners. Breaches of our security measures through hacking, fraud, or other forms of deception, or the accidental loss, inadvertent disclosure, or unapproved dissemination of proprietary information or sensitive or confidential data about us, our suppliers, our customers, our employees, or our franchise owners, could expose us, our customers, our suppliers, and our franchise owners to a risk of loss or misuse of this information, result in litigation and potential liability for us, damage our brand and reputation, or otherwise harm our business. In addition, our current data protection measures might not protect us against increasingly
21
sophisticated and aggressive threats and the cost and operational consequences of implementing further data protection measures could be significant.
Information technology system failures or breaches of our network security could interrupt our operations and adversely affect our business.
We rely on our computer systems and network infrastructure across our operations, including POS system processing at our stores. Our ability to effectively and efficiently manage our operations depends upon our ability to protect our computer equipment and systems against damage from physical theft, fire, power loss, telecommunications failure, or other catastrophic events, as well as from internal and external security breaches, viruses, worms, and other disruptive problems. Any damage or failure of our computer systems or network infrastructure that causes an interruption in our operations could materially and adversely affect our business, reputation, financial condition, and results of operations and subject us to litigation or actions by regulatory authorities. Remediation of such problems could also result in significant, unplanned expenditures.
An increasingly significant portion of our retail sales depends on the continuing operation of our information technology and communications systems, including our online ordering platform, POS system, and our credit card processing systems. Our information technology, communication systems, and electronic data may be vulnerable to damage or interruption from earthquakes, terrorist attacks, floods, fires, power loss, telecommunications failures, computer viruses, loss of data, unauthorized data breaches, or other attempts to harm our systems. Additionally, we rely on data centers that are also subject to break-ins, sabotage, and intentional acts of vandalism that could cause disruptions in our ability to serve our customers and protect customer data. Some of our systems are not fully redundant, and our disaster recovery planning cannot account for all eventualities. The occurrence of a natural disaster, intentional sabotage, or other unanticipated problems could result in lengthy interruptions in our service. Any errors or vulnerabilities in our systems, or damage to or failure of our systems, could result in interruptions in our services and non-compliance with certain regulations, which could materially and adversely affect our business, reputation, financial condition, and results of operations.
We may not be able to adequately protect our intellectual property, which could harm the value of our brand and adversely affect our business.
Our ability to implement our business plan successfully depends in part on our ability to build brand recognition in the markets served by our stores using our trademarks and other proprietary intellectual property, including our brand names and logos. If our efforts to protect our intellectual property are inadequate, or if any third party misappropriates, dilutes, infringes, or otherwise violates our intellectual property, the value of our brand may be harmed, which could have a material adverse effect on our business and might prevent our brand from achieving or maintaining market acceptance. We may also face the risk of claims that we have infringed third parties’ intellectual property rights.
We also rely on trade secrets and proprietary know-how to protect our brand. Our methods of safeguarding this information may not be adequate. Moreover, we may face claims of misappropriation or infringement of a third party’s rights that could interfere with our use of this information. We do not maintain confidentiality agreements with all of our team members. Even with respect to the confidentiality agreements we have, we do not assure you that those agreements will provide meaningful protection, or that adequate remedies will be available in the event of an unauthorized use or disclosure of our proprietary information. If competitors independently develop or otherwise obtain access to our trade secrets or proprietary know-how, the appeal of our stores could be reduced and our business could be harmed.
We are subject to extensive government regulation and requirements issued by other groups and our failure to comply with existing or increased regulations could adversely affect our business and operating results.
We are subject to numerous federal, state, local, and foreign laws and regulations, as well as requirements issued by other groups, including those described elsewhere in this section and those relating to:
▪ | the preparation, sale, and labeling of food; |
▪ | building and zoning requirements; |
▪ | environmental laws; |
▪ | compliance with securities laws and NASDAQ listed company rules; |
▪ | working and safety conditions; |
▪ | sales taxes or other transaction taxes; |
▪ | compliance with the Payment Card Industry Data Security Standards and similar requirements; and |
22
▪ | compliance with the Dodd-Frank Wall Street Reform and Consumer Protection Act and any rules promulgated thereunder. |
In addition, restaurants located in the United States must comply with Title III of the Americans with Disabilities Act. Although we believe newer restaurants meet the Americans with Disabilities Act construction standards and, further, that most franchise owners have historically been diligent in the remodeling of older restaurants, a finding of noncompliance with the Americans with Disabilities Act could result in the imposition of injunctive relief, fines, awards of damages, or additional capital expenditures to remedy such noncompliance. In addition, the Americans with Disabilities Act may also require modifications to guest-facing technologies, including our website, to provide service to, or make reasonable accommodations for, disabled persons.
We are also subject to Federal Trade Commission rules and to various state and foreign laws that govern the offer and sale of franchises. Additionally, these laws regulate various aspects of the franchise relationship, including terminations and the refusal to renew franchises. The failure to comply with these laws and regulations in any jurisdiction or to obtain required government approvals could result in a ban or temporary suspension on future franchise sales, fines or other penalties, or require us to make offers of rescission or restitution, any of which could materially and adversely affect our business, financial condition, and results of operations.
Some of the jurisdictions where we have franchise and Company-owned stores do not assess sales tax on our pizzas. Accordingly, we may benefit from a pricing advantage over some pizza chain competitors in these jurisdictions. If these jurisdictions were to impose sales tax on our products, these stores may experience a decline in sales due to the loss of this pricing advantage. In addition, our stores may be subject to unanticipated sales tax assessments. These sales tax assessments could result in losses to our franchise owners or franchise stores going out of business, which could adversely affect our number of franchise stores and our results of operations. Changes in sales tax assessments of this type at the franchise owner level could lead to undercapitalized franchise owners going out of business and loss of royalties at the Company level. Similarly, such tax assessments could impact the profitability of our Company-owned stores. As a result, changes in sales tax assessments could have a material and adverse effect on our business, financial condition, and results of operations.
Our current insurance coverage may not be adequate, insurance premiums for such coverage may increase and we may not be able to obtain insurance at acceptable rates, or at all.
We have retention programs for workers’ compensation, general liability, and owned and non-owned automobile liabilities. These insurance policies may not be adequate to protect us from liabilities that we incur in our business. In addition, in the future our insurance premiums may increase and we may not be able to obtain similar levels of insurance on reasonable terms, or at all. Any substantial inadequacy of, or inability to obtain insurance coverage, including but not limited to coverage regarding litigation, could materially and adversely affect our business, financial condition, and results of operations.
Changes to accounting rules or regulations may adversely affect our results of operations.
Changes to existing accounting rules or regulations may affect our future results of operations or cause the perception that we are more highly leveraged. Other new accounting rules or regulations and varying interpretations of existing accounting rules or regulations have occurred and may occur in the future. For instance, accounting regulatory authorities have indicated that they will require lessees to capitalize all but short-term leases in their financial statements. This change, when implemented, will require us to record significant lease obligations and related right of use assets on our consolidated balance sheet and make other changes to our financial statements. This and other future changes to accounting rules or regulations, such as announced changes to revenue recognition standards, could materially and adversely affect our business, financial condition, or results of operations.
Risks Relating to Our Company and Our Ownership Structure |
The requirements of being a public company may strain our resources and divert resources and management’s attention and this burden may increase once we are no longer an “emerging growth company.”
As a publicly traded company, we incur, and will continue to incur, significant legal, accounting, and other expenses that we were not required to incur prior to our initial public offering in May 2014. This will be particularly so after we are no longer an “emerging growth company” as defined under the Jumpstart our Business Startups Act (“JOBS Act”).
The demands of being a public company, including engagement and communications with stockholders, require a significant commitment of resources and management oversight that has increased and may continue to increase our costs
23
and might place a strain on our systems and resources. As a result, our management’s attention might be diverted from other business concerns.
For as long as we remain an “emerging growth company” as defined in the JOBS Act, we may take advantage of certain exemptions from various reporting requirements that are applicable to other public companies that are not “emerging growth companies.” These exceptions provide for, but are not limited to, relief from the auditor attestation requirements of Section 404 of the Sarbanes-Oxley Act, less extensive disclosure obligations regarding executive compensation in our periodic reports and proxy statements, exemptions from the requirements to hold a nonbinding advisory vote on executive compensation and stockholder approval of any golden parachute payments not previously approved, and an extended transition period for complying with new or revised accounting standards. We may take advantage of these reporting exemptions until we are no longer an “emerging growth company.” We may remain an “emerging growth company” for up to five years following our initial public offering. To the extent we do not use exemptions from various reporting requirements under the JOBS Act, we may be unable to realize our anticipated cost savings from those exemptions. Once we are no longer an “emerging growth company,” we will no longer enjoy the benefits of those exemptions.
We have implemented internal controls over financial reporting and processes to evaluate their design and test their effectiveness so that management can provide the required management assessments under Section 404 of the Sarbanes-Oxley Act (“Section 404”). Section 404 requires annual management assessments of the effectiveness of our internal control over financial reporting. Section 404 also generally requires a report by our independent registered public accounting firm on the effectiveness of our internal control over financial reporting. However, under the JOBS Act, our independent registered public accounting firm will not be required to attest to the effectiveness of our internal control over financial reporting pursuant to Section 404 until we are no longer an “emerging growth company.”
We may encounter problems or delays in implementing improvements in connection with receiving a favorable attestation from our independent registered public accounting firm. If we are unable to maintain adequate internal control over financial reporting, we may be unable to report our financial information on a timely basis, may suffer adverse regulatory consequences, or violate applicable stock exchange listing rules. Any restatement of our financial statements due to a lack of adequate internal controls or otherwise could result in a loss of public confidence in the reliability of our financial statements and sanctions imposed on us by the SEC. Failure to maintain effective internal control over financial reporting could have a material adverse effect on our business and share price.
Our largest stockholders have the power to significantly influence our decisions and their interests may conflict with our or yours in the future.
On May 4, 2010, affiliates of Lee Equity Partners, LLC (“Lee Equity”) acquired a majority of the capital stock of PMI Holdings Inc., our predecessor. Lee Equity is a middle-market private equity investment firm managing more than $1 billion of equity capital. Immediately following the consummation of our initial public offering, Lee Equity and its affiliates owned approximately 41% of our outstanding capital stock, and as of March 2, 2018, owns 26% of our outstanding capital stock. Under a stockholder’s agreement that we entered into with Lee Equity in connection with our initial public offering, for so long as Lee Equity (or one or more of its affiliates, to the extent assigned thereto), individually or in the aggregate owns (i) 20% or more of the voting power of the issued and outstanding shares of our common stock, Lee Equity will be entitled to designate two director nominees or (ii) 10% or more of the voting power of the issued and outstanding shares of our common stock, Lee Equity will be entitled to designate one director nominee, in each case to serve on the Board of Directors (the “Board”) at any meeting of stockholders at which directors are to be elected to the extent that Lee Equity does not have a director designee then serving on the Board. In addition to its rights to designate nominees to the Board, Lee Equity has consent rights with respect to certain significant matters so long as Lee Equity owns 25% or more of the outstanding shares of our common stock, including among others, certain change of control transactions, issuances of equity securities, the incurrence of significant indebtedness, declaration or payments of non-pro rata dividends, significant investments in, or acquisitions or dispositions of assets, adoption of any new equity-based incentive plan, any material increase in the salary of our Chief Executive Officer, certain amendments to our organizational documents, any material change to our business, or any change to the number of directors serving on our Board. So long as Lee Equity owns 10% or more of our issued and outstanding common stock, Lee Equity will be granted access to our customary non-public information and members of our management team and shall have the ability to share our material non-public information with any potential purchaser of us that executes an acceptable confidentiality agreement with us which will include a prohibition on trading on material non-public information. Lee Equity has the right to assign any of its governance and registration rights to its affiliates or to a third party in connection with the sale by Lee Equity of 10% or more of the issued and outstanding shares of our common stock. As such, Lee Equity has substantial influence over us.
Lee Equity makes investments in companies in a variety of industries and may, from time to time, acquire and hold interests in businesses that compete directly or indirectly with us. Lee Equity may also pursue, for its own accounts, acquisition opportunities that may be complementary to our business, and as a result, those acquisition opportunities may not be
24
available to us. Our amended and restated certificate of incorporation contains provisions renouncing any interest or expectancy held by our directors affiliated with Lee Equity in certain corporate opportunities. Accordingly, the interests of Lee Equity may supersede ours, causing it or its affiliates to compete against us or to pursue opportunities instead of us, for which we have no recourse. Such actions, on the part of Lee Equity and inaction on our part, could have a material adverse effect on our business, financial condition, and results of operations.
On December 21, 2017, we entered into a Cooperation Agreement (the “Cooperation Agreement”) with MFP Partners, L.P. (“MFP”) and Misada Capital Holdings, LLC (“Misada”), among others. As of March 2, 2018, MFP and its affiliates collectively own 14% of our outstanding capital stock and Misada and its affiliates collectively own 9% of our outstanding capital stock. Pursuant to the Cooperation Agreement, MFP and Misada each has the right to designate a member of our Board so long as MFP and its affiliates or Misada and its affiliates, as the case may be, continue to beneficially own at least the lesser of (i) 10% or more of the our outstanding capital stock, and (ii) 1,696,546 shares of our outstanding capital stock, in the case of MFP, or 848,273 shares of our outstanding capital stock, in the case of Misada, in each case subject to adjustment for stock splits, reclassifications, combinations, and similar adjustments.
Such concentration of ownership among Lee Equity, MFP, and Misada, and the governance and control rights held by Lee Equity, MFP, and Misada, may also have the effect of delaying or preventing a change in control, which may be to the benefit of Lee Equity, MFP, or Misada and their affiliates but not in the interest of the Company or other stockholders not affiliated with Lee Equity, MFP, or Misada.
Anti-takeover provisions in our organizational documents could make an acquisition of us more difficult, limit attempts by our stockholders to replace or remove our current management, and adversely affect the market price of our common stock.
Provisions in our certificate of incorporation and bylaws may have the effect of discouraging or preventing a change of control or changes in our management. Our certificate of incorporation and bylaws include provisions that:
▪ | authorize our Board to issue, without further action by the stockholders, up to 15,000,000 shares of undesignated preferred stock; |
▪ | require that any action to be taken by our stockholders be effected at a duly called annual or special meeting and not by written consent; |
▪ | specify that special meetings of our stockholders can be called only by or at the direction of our Board or, at the request of Lee Equity or its transferee that has privately acquired from Lee Equity at least 10% of our outstanding common stock, so long as Lee Equity or its transferee owns at least 10% of our outstanding common stock; |
▪ | establish an advance notice procedure for stockholder proposals to be brought before an annual or special meeting, including proposed nominations of persons for election to our Board; |
▪ | establish that our Board is divided into three classes, with each class serving three-year staggered terms; |
▪ | prohibit cumulative voting in the election of directors; |
▪ | provide that our directors may be removed only for cause by a majority of the remaining members of our Board or the holders of at least 66 2/3% of our outstanding voting stock |
▪ | empower our Board to cancel, postpone, or reschedule an annual meeting of stockholders, at any time before the holding of the annual meeting and for any reason; and |
▪ | require comprehensive disclosures and affirmations from any individual who has been proposed by a stockholder as a nominee for election to our Board. |
These provisions may frustrate or prevent any attempts by our stockholders to replace or remove our current management by making it more difficult for stockholders to replace members of our Board, which is responsible for appointing the members of our management, and may discourage, delay, or prevent a transaction involving a change in control of our Company that is in the best interest of our minority stockholders. Even in the absence of a takeover attempt, the existence of these provisions may adversely affect the prevailing market price of our common stock if they are viewed as discouraging future takeover attempts. In addition, we have opted out of Section 203 of the Delaware General Corporation Law, which would otherwise prohibit us from engaging in any of a broad range of business combinations with any “interested stockholder” (any stockholder with 15% or more of our outstanding voting stock) for a period of three years following the time that the stockholder became an “interested stockholder”, subject to certain exceptions. Our certificate of incorporation contains provisions that have similar effect as Section 203 of the Delaware General Corporations Law, except that they exclude from the definition of “interested stockholder” Lee Equity, and any person that has acquired from Lee Equity or any Lee Equity transferee 5% or more of our outstanding voting stock.
25
Item 1B. Unresolved Staff Comments
None.
Item 2. Properties
Our corporate headquarters, located in Vancouver, Washington, houses substantially all of our executive management and employees who provide our primary corporate support functions: legal, marketing, technology, human resources, finance, and research and development. We lease the property for the corporate headquarters and all of our 145 Company-owned stores.
Our system-wide stores are typically located in neighborhood shopping centers and the average store size is approximately 1,400 square feet. As of January 1, 2018, we and our franchise owners operated 1,523 stores with 1,483 of these stores located in 39 states (consisting of 1,338 franchised and 145 Company-owned stores) plus 14 stores in Canada and 26 stores in the Middle East. Our franchised stores are situated on real property owned by franchise owners or leased directly by franchise owners from third party landlords.
The map and chart below show the locations of our franchised and Company-owned stores in the United States as of January 1, 2018.
26
Domestic Franchised Stores | Company- Owned Stores | Total | ||||||
Alabama | 32 | — | 32 | |||||
Alaska | 12 | — | 12 | |||||
Arizona | 55 | — | 55 | |||||
Arkansas | 6 | 5 | 11 | |||||
California | 169 | — | 169 | |||||
Colorado | 70 | 21 | 91 | |||||
Florida | 13 | 12 | 25 | |||||
Georgia | 4 | — | 4 | |||||
Hawaii | 2 | — | 2 | |||||
Idaho | 25 | 9 | 34 | |||||
Illinois | 25 | — | 25 | |||||
Indiana | 36 | — | 36 | |||||
Iowa | 34 | — | 34 | |||||
Kansas | 37 | — | 37 | |||||
Kentucky | 16 | — | 16 | |||||
Louisiana | 2 | — | 2 | |||||
Maryland | 1 | — | 1 | |||||
Michigan | 10 | 10 | 20 | |||||
Minnesota | 75 | 25 | 100 | |||||
Mississippi | 2 | 2 | 4 | |||||
Missouri | 50 | 3 | 53 | |||||
Montana | 14 | — | 14 | |||||
Nebraska | 13 | — | 13 | |||||
Nevada | 25 | — | 25 | |||||
New Mexico | 13 | 6 | 19 | |||||
North Carolina | 26 | — | 26 | |||||
North Dakota | 13 | — | 13 | |||||
Ohio | 1 | — | 1 | |||||
Oklahoma | 23 | — | 23 | |||||
Oregon | 99 | 7 | 106 | |||||
South Carolina | 2 | — | 2 | |||||
South Dakota | 15 | — | 15 | |||||
Texas | 85 | 8 | 93 | |||||
Tennessee | 28 | 19 | 47 | |||||
Utah | 60 | — | 60 | |||||
Virginia | 4 | — | 4 | |||||
Washington | 134 | 16 | 150 | |||||
Wisconsin | 97 | 2 | 99 | |||||
Wyoming | 10 | — | 10 | |||||
Total | 1,338 | 145 | 1,483 | |||||
Lease Arrangements
We lease the property for our corporate headquarters and our Company-owned stores and are not a party to the leases for the franchise locations except for two locations that operate under a sublease and leases assigned to franchisees wherein we remain secondarily liable upon the sale of a store. Lease terms for Company-owned stores are generally five years with one or more five-year renewal options and generally require us to pay a proportionate share of real estate taxes, insurance, common area, and other operating costs in addition to a base or fixed rent.
27
Item 3. Legal Proceedings
We currently are subject to litigation with a group of our franchise owners. In January 2014, six franchise owner groups claimed that we misrepresented our sales volumes, made false representations to them and charged excess advertising fees, among other things. We engaged in mediation with these franchise owners, which is required under the terms of their franchise agreements, in order to address and resolve their claims, but we were unable to reach a settlement agreement. On April 4, 2014, a total of 12 franchise owner groups, including those franchise owners that previously made the allegations described above, filed a lawsuit against us in the Superior Court in Clark County, Washington, making essentially the same allegations for violation of the Washington Franchise Investment Protection Act, fraud, negligent misrepresentation and breach of contract and seeking declaratory and injunctive relief, as well as monetary damages. Based on motions filed by us in that lawsuit, the court ruled on July 9, 2014, that certain of the plaintiffs’ claims under the anti-fraud and nondisclosure provisions of the Washington Franchise Investment Protection Act should be dismissed and that certain other claims in the case would need to be more specifically alleged. The court also ruled that the six franchise owner groups who had not mediated with us prior to filing the lawsuit must mediate with us in good faith, and that their claims shall be stayed until they have done so.
On June 18, 2014, an additional 16 franchise owner groups, represented by the same counsel as the plaintiffs described above, filed a lawsuit in the Superior Court in Clark County, Washington making essentially the same allegations as made in the lawsuit described above and seeking declaratory and injunctive relief, as well as monetary damages. The court consolidated the two lawsuits into a single case and ordered that the plaintiffs in the new lawsuit, none of whom had mediated with us prior to filing the lawsuit, must do so, and that their claims be stayed until they have completed mediating with us in good faith.
In October 2014, we engaged in mediation with the 22 franchise owner groups who had not previously done so. As a result of that mediation and other efforts, we reached resolution with 13 of the franchise owner groups involved in the consolidated lawsuits, and their claims have either been dismissed or dismissal is pending.
In February 2015, the remaining franchise owner groups in the consolidated lawsuits filed an amended complaint, removing some claims, amending some claims, adding claims and naming some of our former and current franchise sales staff as additional individual defendants. In September 2016, the remaining 15 franchise owner groups in the consolidated lawsuits filed an amended complaint to add a claim under the Washington Consumer Protection Act based on substantially the same allegations as the prior claims, to re-plead claims under the Washington Franchise Investment Protection Act that had previously been dismissed, and to dismiss Dan Harmon as a defendant.
In June 2017, the parties moved for summary judgment. We moved for summary judgment against two of the remaining franchise owner groups, the board of directors members moved for summary judgment on all claims against them, and the plaintiffs moved for summary judgment against all defendants on their Washington Consumer Protection Act and Washington Franchise Investment Protection Act claims. A hearing on the summary judgment motions was held on October 13, 2017.
In July 2017, we engaged in mediation with the remaining 15 franchise owner groups in the consolidated lawsuits. As a result of that mediation and other efforts, we reached resolutions with six of the remaining franchise owner groups, and their claims have been dismissed.
As before, we believe the allegations in this litigation lack merit and, for those plaintiffs with whom we are unable to reach resolution, we will continue to vigorously defend our interests, including by asserting a number of affirmative defenses and, where appropriate, counterclaims. We provide no assurance that we will be successful in our defense of these lawsuits; however, we do not currently expect the cost of resolving them to have a material adverse effect on our consolidated financial position, results of operations, or cash flows.
We are from time to time involved in litigation, certain other claims and arbitration matters arising in the ordinary course of our business. We accrue for a liability when it is both probable that a liability has been incurred and the amount of the loss can be reasonably estimated. Significant judgment is required in both the determination of the probability of a loss and the determination as to whether a loss is reasonably estimable. These accruals are reviewed at least quarterly and adjusted to reflect the effects of negotiations, settlements, rulings, advice of legal counsel and technical experts and other information and events pertaining to a particular matter. To the extent there is a reasonable possibility (within the meaning of Accounting Standards Codification (“ASC”) 450) that losses could exceed amounts already accrued, if any, and the additional loss or range of loss is able to be estimated, we disclose the additional loss or range of loss.
28
In some instances, we are unable to reasonably estimate any potential loss or range of loss. The nature and progression of litigation can make it difficult to predict the impact a particular lawsuit will have on our business. There are many reasons that we cannot make these assessments, including, among others, one or more of the following: the early stages of a proceeding; damages sought that are unspecified, unsupportable, unexplained or uncertain; discovery not having been started or incomplete; the complexity of the facts that are in dispute; the difficulty of assessing novel claims; the parties not having engaged in any meaningful settlement discussions; the possibility that other parties may share in any ultimate liability; and/or the often slow pace of litigation.
We are named as a defendant in a putative class action lawsuit filed by plaintiff John Lennartson on May 7, 2015, in the United States District Court for the Western District of Washington. The lawsuit alleges we failed to comply with the requirements of the Telephone Consumer Protection Act (TCPA) when we sent SMS text messages to consumers. Mr. Lennartson asks that the court certify the putative class and that statutory damages under the TCPA be awarded to plaintiff and each class member. On October 14, 2016, the Federal Communications Commission (FCC) granted us a limited waiver from the TCPA’s written consent requirements for certain text messages that we sent up through October 16, 2013 to individuals who, like Mr. Lennartson, provided written consent prior to October 16, 2013. On October 20, 2016, we filed a motion for summary judgment seeking dismissal. On October 27, 2016, Mr. Lennartson filed a motion seeking to extend the time to respond to the summary judgment motion on the basis that he intends to appeal the FCC’s waiver. On November 4, 2016, the Court granted Mr. Lennartson’s motion to continue his response to our summary judgment motion until he can complete his appeal of the FCC’s waiver order. In addition, on January 9, 2017, Mr. Lennartson filed an amended complaint adding additional plaintiffs, some of whom provided consent after October 16, 2013, and who are therefore differently situated from Mr. Lennartson, as well as additional Washington state law claims. On October 27, 2017, plaintiffs moved to certify their putative class, which we opposed, and on November 22, 2017, we moved for summary judgment on all of plaintiffs’ claims. We and the plaintiffs have commenced negotiations regarding the proposed terms of a settlement agreement, and the Court has issued a stay of the case for 30 days while the parties pursue settlement negotiations. Successful completion of these negotiations, in addition to necessary court approvals and other conditions, would result in the final resolution of the lawsuit; however, we provide no assurance that any final settlement agreement will be reached by the parties or approved by the Court, or that the lawsuit will be finally resolved. An adverse judgment or settlement related to this lawsuit could have a material adverse effect on our consolidated financial position, results of operations, or cash flows.
In addition to the foregoing, we are subject to routine legal proceedings, claims, and litigation in the ordinary course of our business. We also may engage in future litigation with franchise owners to enforce the terms of our franchise agreements and compliance with our brand standards as determined necessary to protect our brand, the consistency of our products, and the customer experience. Lawsuits require significant management attention and financial resources and the outcome of any litigation is inherently uncertain. We do not, however, expect that the costs to resolve these routine matters will have a material adverse effect on our consolidated financial position, results of operations, or cash flows.
Item 4. Mine Safety Disclosures
Not applicable.
29
PART II
Item 5. Market for Registrant’s Common Equity, Related Stockholder Matters and Issuer Purchases of Equity Securities
Our common stock has traded on the NASDAQ Global Select Market under the symbol FRSH since it began trading on May 2, 2014. Our initial public offering was priced at $11.00 per share on May 1, 2014. The following table sets forth, for the periods indicated, the highest and lowest intraday sales prices per share of our common stock as reported on the NASDAQ Global Select Market.
High | Low | ||||||
Fiscal Year 2016 | |||||||
First quarter (December 29, 2015 - March 28, 2016) | $ | 12.15 | $ | 8.45 | |||
Second quarter (March 29, 2016 - June 27, 2016) | $ | 12.96 | $ | 6.48 | |||
Third quarter (June 28, 2016 - September 26, 2016) | $ | 7.80 | $ | 5.15 | |||
Fourth quarter (September 27, 2016 - January 2, 2017) | $ | 6.88 | $ | 3.56 | |||
Fiscal Year 2017 | |||||||
First quarter (January 3, 2017 - April 3, 2017) | $ | 5.33 | $ | 3.88 | |||
Second quarter (April 4, 2017 - July 3, 2017) | $ | 6.80 | $ | 3.92 | |||
Third quarter (July 4, 2017 - October 2, 2017) | $ | 6.21 | $ | 3.50 | |||
Fourth quarter (October 3, 2017 - January 1, 2018) | $ | 6.50 | $ | 5.30 | |||
On March 7, 2018, we had approximately 34 stockholders of record of our common stock. These figures do not include beneficial owners who hold shares in nominee name.
The Company did not repurchase any shares during the quarter ended January 1, 2018. The Company does not have any share repurchase programs in effect.
Dividends |
No dividends have been declared or paid on our shares of common stock and we do not intend to pay dividends on our common stock in the foreseeable future. We currently expect to retain all available funds and future earnings, if any, for use in the operation, development and expansion of our business. However, in the future, we may change this policy and choose to pay dividends. Any future determination to pay cash dividends will be at the discretion of our Board of Directors and will depend on then-existing conditions, including our financial condition, operating results, business prospects, capital requirements, results of operations and other factors that our Board of Directors considers relevant.
We are a holding company that does not conduct any business operations of our own. As a result, our ability to pay cash dividends on our common stock is dependent upon cash dividends and distributions and other transfers from our subsidiaries. The ability of our subsidiaries to pay dividends is restricted by the terms of our senior secured credit facility. For additional information regarding our financial condition and restrictions on the ability of our subsidiaries to pay dividends, see Management’s Discussion and Analysis of Financial Condition and Results of Operations and Note 9 — Financing Arrangements of the accompanying Notes to Consolidated Financial Statements, respectively.
30
Performance Graph |
The following graph demonstrates a comparison of cumulative total returns for Papa Murphy’s common stock, the Standard & Poor’s 500 Stock Index, the NASDAQ Composite Index, and the Standard & Poor’s 400 Restaurants Index over the period from May 1, 2014, (using the price of which our shares of common stock were initially sold to the public) to January 1, 2018. The comparison assumes $100 was invested in Papa Murphy’s common stock on May 1, 2014, and in each of the aforementioned indices. Cumulative total returns for each of the indices assumes that all dividends were reinvested on the day of issuance.
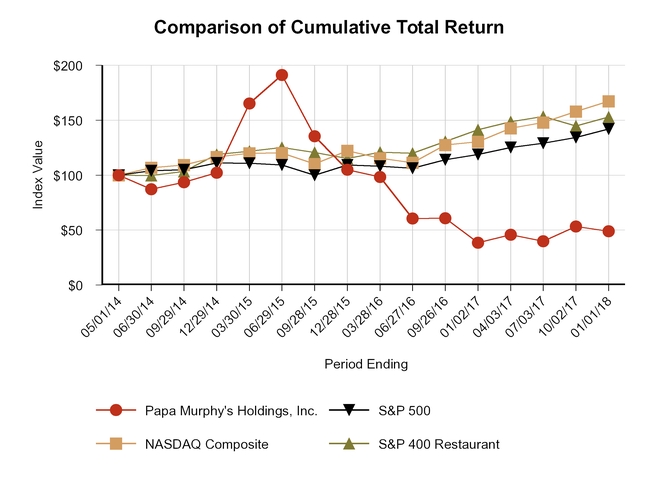
Historical stock price performance should not be relied on as indicative of future stock price performance.
31
Item 6. Selected Financial Data
We derived the selected consolidated statements of operations and cash flows data for fiscal years 2017, 2016, and 2015 and the selected consolidated balance sheet data as of January 1, 2018, and January 2, 2017, from our audited consolidated financial statements and related notes thereto included in Financial Statements and Supplementary Data. We derived the selected consolidated statements of operations and cash flows data for fiscal years 2014 and 2013 and the selected consolidated balance sheet data as of December 28, 2015, December 29, 2014, and December 30, 2013, from our audited consolidated financial statements and related notes thereto not included in this report. Fiscal year 2016 was a 53-week period while all other fiscal years reported were 52-week periods.
Our historical results are not necessarily indicative of future operating results. You should read the information set forth below together with Management’s Discussion and Analysis of Financial Condition and Results of Operations and Financial Statements and Supplementary Data and the related Notes to Consolidated Financial Statements.
FISCAL YEAR | |||||||||||||||||||
(in thousands, except share and per share data) | 2017 | 2016 | 2015 | 2014 | 2013 | ||||||||||||||
Consolidated Statement of Operations Data: | |||||||||||||||||||
Revenues | |||||||||||||||||||
Franchise royalties | $ | 37,552 | $ | 39,851 | $ | 40,243 | $ | 39,305 | $ | 36,897 | |||||||||
Franchise and development fees | 2,220 | 2,912 | 4,222 | 4,531 | 4,330 | ||||||||||||||
Company-owned store sales | 76,868 | 82,080 | 74,300 | 50,598 | 39,148 | ||||||||||||||
Other | 2,021 | 2,040 | 1,444 | 2,965 | 120 | ||||||||||||||
Total revenues | 118,661 | 126,883 | 120,209 | 97,399 | 80,495 | ||||||||||||||
Costs and Expenses | |||||||||||||||||||
Store operating costs: | |||||||||||||||||||
Cost of food and packaging | 25,958 | 28,347 | 26,603 | 19,686 | 14,700 | ||||||||||||||
Compensation and benefits | 23,603 | 23,746 | 19,858 | 12,673 | 10,687 | ||||||||||||||
Advertising | 8,221 | 8,203 | 7,888 | 5,041 | 3,820 | ||||||||||||||
Occupancy | 7,043 | 6,226 | 4,750 | 2,873 | 2,365 | ||||||||||||||
Other store operating costs | 8,102 | 10,268 | 7,517 | 4,434 | 3,988 | ||||||||||||||
Selling, general, and administrative | 33,870 | 28,108 | 28,207 | 29,263 | 24,180 | ||||||||||||||
Depreciation and amortization | 10,452 | 12,236 | 10,002 | 8,052 | 6,973 | ||||||||||||||
Loss (gain) on disposal or impairment of property and equipment | 15,680 | 101 | (251 | ) | 72 | 847 | |||||||||||||
Total costs and expenses | 132,929 | 117,235 | 104,574 | 82,094 | 67,560 | ||||||||||||||
Operating (Loss) Income | (14,268 | ) | 9,648 | 15,635 | 15,305 | 12,935 | |||||||||||||
Interest expense, net | 5,078 | 4,868 | 4,523 | 8,025 | 10,429 | ||||||||||||||
Loss on early retirement of debt | — | — | — | 4,619 | 4,029 | ||||||||||||||
Loss on impairment of investments | — | — | 4,500 | — | — | ||||||||||||||
Other expense, net | 204 | 188 | 133 | 178 | 44 | ||||||||||||||
(Loss) Income Before Income Taxes | (19,550 | ) | 4,592 | 6,479 | 2,483 | (1,567 | ) | ||||||||||||
(Benefit from) provision for income taxes | (19,543 | ) | 1,943 | 2,068 | 1,235 | 1,024 | |||||||||||||
Net Income (Loss) | (7 | ) | 2,649 | 4,411 | 1,248 | (2,591 | ) | ||||||||||||
Net loss attributable to noncontrolling interests | — | — | 500 | — | 19 | ||||||||||||||
Net Income (Loss) Attributable to Papa Murphy’s | $ | (7 | ) | $ | 2,649 | $ | 4,911 | $ | 1,248 | $ | (2,572 | ) | |||||||
Earnings (loss) per common share: | |||||||||||||||||||
Basic (1) | $ | — | $ | 0.16 | $ | 0.29 | $ | (0.07 | ) | $ | (2.34 | ) | |||||||
Diluted (1) | — | 0.16 | 0.29 | (0.07 | ) | (2.34 | ) | ||||||||||||
Weighted average common stock outstanding: | |||||||||||||||||||
Basic | 16,870,013 | 16,743,285 | 16,653,127 | 12,101,236 | 3,847,861 | ||||||||||||||
Diluted | 16,870,013 | 16,773,493 | 16,870,693 | 12,101,236 | 3,847,861 | ||||||||||||||
32
FISCAL YEAR | |||||||||||||||||||
(in thousands, except share and per share data) | 2017 | 2016 | 2015 | 2014 | 2013 | ||||||||||||||
Consolidated Statement of Cash Flows: | |||||||||||||||||||
Net cash provided by operating activities | $ | 15,537 | $ | 16,804 | $ | 23,743 | $ | 15,509 | $ | 9,874 | |||||||||
Net cash used in investing activities | (1,648 | ) | (19,390 | ) | (19,554 | ) | (9,527 | ) | (15,249 | ) | |||||||||
Net cash (used in) provided by financing activities | (13,784 | ) | (2,212 | ) | (2,378 | ) | (4,631 | ) | 6,613 | ||||||||||
AS OF | |||||||||||||||||||
(in thousands) | January 1, 2018 | January 2, 2017 | December 28, 2015 | December 29, 2014 | December 30, 2013 | ||||||||||||||
Consolidated Balance Sheet Data: | |||||||||||||||||||
Cash and cash equivalents | $ | 2,174 | $ | 2,069 | $ | 6,867 | $ | 5,056 | $ | 3,705 | |||||||||
Total current assets | 9,352 | 13,116 | 18,896 | 14,991 | 14,521 | ||||||||||||||
Total assets | 246,174 | 273,872 | 275,471 | 264,127 | 258,712 | ||||||||||||||
Total current liabilities | 27,846 | 22,900 | 24,149 | 18,558 | 17,965 | ||||||||||||||
Total debt (2) | 95,900 | 109,679 | 112,200 | 115,000 | 170,000 | ||||||||||||||
Total Papa Murphy’s Holdings, Inc. shareholders’ equity | 102,171 | 101,496 | 97,656 | 91,298 | 33,925 | ||||||||||||||
Net working capital (3) | (18,494 | ) | (9,784 | ) | (5,253 | ) | (3,567 | ) | (3,444 | ) | |||||||||
(in thousands, except selected operating data, unless otherwise noted) | FISCAL YEAR | ||||||||||||||||||
2017 | 2016 | 2015 | 2014 | 2013 | |||||||||||||||
Other Financial Data: | |||||||||||||||||||
Capital expenditures (4) | 3,987 | 18,010 | 10,430 | 4,067 | 3,037 | ||||||||||||||
Selected Operating Data: | |||||||||||||||||||
Number of stores at end of period | |||||||||||||||||||
Domestic franchised | 1,338 | 1,369 | 1,369 | 1,342 | 1,327 | ||||||||||||||
Domestic Company-owned | 145 | 168 | 127 | 91 | 69 | ||||||||||||||
International | 40 | 40 | 40 | 28 | 22 | ||||||||||||||
Total | 1,523 | 1,577 | 1,536 | 1,461 | 1,418 | ||||||||||||||
Number of comparable stores at end of period (5) | |||||||||||||||||||
Domestic franchised | 1,298 | 1,298 | 1,279 | 1,247 | 1,226 | ||||||||||||||
Domestic Company-owned | 145 | 136 | 110 | 88 | 68 | ||||||||||||||
International | 35 | 35 | 28 | 20 | 17 | ||||||||||||||
Total | 1,478 | 1,469 | 1,417 | 1,355 | 1,311 | ||||||||||||||
AWS per store (whole dollars) (6) | $ | 10,589 | $ | 10,958 | $ | 11,651 | $ | 11,480 | $ | 11,099 | |||||||||
Comparable store sales growth (decline) (7) | (4.0 | )% | (5.2 | )% | 1.9 | % | 4.5 | % | 2.8 | % | |||||||||
System-wide sales (8) | $ | 846,864 | $ | 898,709 | $ | 892,249 | $ | 849,682 | $ | 785,630 | |||||||||
System-wide sales growth (decline) (9) | (5.8 | )% | 0.7 | % | 13.6 | % | 8.2 | % | 6.3 | % | |||||||||
(1) | Basic and Diluted EPS is a loss for 2014 as a result of cumulative dividends to preferred stockholders prior to our IPO. |
(2) | Represents total outstanding indebtedness, including current portion and excluding unamortized deferred financing costs. |
(3) | Represents total current assets less total current liabilities. |
(4) | Represents cash paid for long-lived asset capital expenditures related to the acquisition of property and equipment and excludes expenditures relating to acquisitions of businesses and the acquisition of property and equipment in accounts payable. |
(5) | A comparable store is a store that has been open for at least 52 weeks from the comparable date, which is the Tuesday following the opening date. |
(6) | AWS consists of the average weekly sales of domestic franchised and Company-owned stores over a specified period of time. AWS is calculated by dividing the total net sales of our system-wide stores for the relevant time period by the number of weeks these same stores were open in such time period. |
(7) | System-wide comparable store sales growth (decline) represents year-over-year sales comparisons for comparable domestic stores. |
(8) | System-wide sales include net sales by all of our system-wide stores. |
(9) | System-wide sales growth represents year-over-year sales comparisons for system-wide sales. |
33
Item 7. Management’s Discussion and Analysis of Financial Condition and Results of Operations
The following discussion and analysis of our financial condition and results of operations should be read in conjunction with Selected Financial Data and Financial Statements and Supplementary Data and the related Notes to Consolidated Financial Statements. To match our operating cycle, we use a 52- or 53-week fiscal year, ending on the Monday nearest to December 31. Our fiscal quarters each contain 13 operating weeks, with the exception of the fourth quarter of a 53-week fiscal year, which contains 14 operating weeks. Fiscal year 2017 was a 52-week period ended on January 1, 2018; fiscal year 2016 was a 53-week period ended on January 2, 2017; and fiscal year 2015 was a 52-week period ended on December 28, 2015.
Cautionary Note Regarding Forward-Looking Statements
In addition to historical information, this discussion and analysis contains “forward-looking statements” within the meaning of the U.S. Private Securities Litigation Reform Act of 1995 that involve risks and uncertainties. Our actual results may differ materially from those anticipated in these forward-looking statements as a result of certain factors including, but not limited to, those discussed in the section entitled “Risk Factors” in this Annual Report on Form 10-K. All statements other than statements of historical fact or relating to present facts or current conditions included in this discussion and analysis are forward-looking statements. Forward-looking statements give our current expectations and projections relating to our financial condition, results of operations, plans, objectives, future performance, and business. You can identify forward-looking statements by the fact that they do not relate strictly to historical or current facts. Examples of forward-looking statements include those regarding our future financial or operating results, cash flows, sufficiency of liquidity, prospects for refinancing, operating margins, capital expenditures and working capital needs, refranchising initiative and the intended use of proceeds from refranchising, effects of refranchising initiative on operating results, reduction in Company-owned stores, franchise store growth, mix of new store openings, strategic initiatives, trends in average check size for online orders, growth in online ordering and benefits from utilization of e-commerce platform, plans for delivery and demand for delivery among our customers, plans for a loyalty program, our marketing strategy, effects of national television advertising, rate of increase of selling, general, and administrative expenses compared to increases in revenue, plans to optimize and prioritize spending, benefits of providing franchise owners access to real-time store performance metrics, business strategies and priorities, market opportunities, future government policies and regulatory changes, resolution of litigation and claims, expansion and growth opportunities, economies of scale achieved by growth, effects on earnings from acquisitions, plans for dividend payments, seasonal fluctuations, adoption of new accounting standards and the estimated effects of those new standards, exposure to foreign currency and interest rate risk, as well as industry trends and outlooks. These statements may include words such as “anticipate,” “estimate,” “expect,” “project,” “plan,” “intend,” “believe,” “may,” “should,” “can have,” “likely,” and other words and terms of similar meaning in connection with any discussion of the timing or nature of future operating or financial performance or other events.
The forward-looking statements contained in this discussion and analysis are based on assumptions that we have made in light of our industry experience and our perceptions of historical trends, current conditions, expected future developments, and other factors we believe are appropriate under the circumstances. As you read and consider this discussion and analysis, you should understand that these statements are not guarantees of performance or results. They involve risks, uncertainties (many of which are beyond our control), and assumptions. Although we believe that these forward-looking statements are based on reasonable assumptions, you should be aware that many factors could affect our actual operating and financial performance and cause our performance to differ materially from the performance anticipated in the forward-looking statements. We believe these factors include, but are not limited to, those described under the section entitled “Risk Factors” in this Annual Report on Form 10-K. Should one or more of these risks or uncertainties materialize, or should any of these assumptions prove incorrect, our actual operating and financial performance may vary in material respects from expectations based on these forward-looking statements.
Any forward-looking statement made by us in this discussion and analysis speaks only as of the date on which we make it. Factors or events that could cause our actual operating and financial performance to differ may emerge from time to time, and it is not possible for us to predict all of them. We undertake no obligation to publicly update any forward-looking statement, whether as a result of new information, future developments, or otherwise, except as may be required by law.
34
Overview |
Papa Murphy’s is a franchisor and operator of the largest Take ‘N’ Bake pizza chain in the United States and the fifth largest pizza chain overall. We operate through a footprint of 1,523 stores, of which 90.5% are franchised, located in 39 states plus Canada and the Middle East.
Our financial results are driven largely by system-wide sales at our franchised and Company-owned stores. System-wide sales are driven by changes in comparable store sales and store counts, which translate into royalty payments from franchise owners, as well as Company-owned store revenues. Total revenues can be impacted by the acquisition of franchised stores or the refranchising of Company-owned stores.
Our model offers operating advantages that differentiate us from other restaurant concepts. Our domestic stores (i) do not require ovens, venting hoods, freezers, or dining areas because our customers bake their pizzas at home; (ii) maintain shorter operating hours (typically 11:00 a.m. to 9:00 p.m.) that are attractive to franchise owners and their employees; (iii) require fewer employees during each shift compared to other restaurant concepts, resulting in lower labor costs; and (iv) accept EBT payment systems (food stamps).
The relatively moderate initial investments and low operating costs required to own and operate a Papa Murphy’s store create the opportunity for high margins and attractive returns. We believe the low cost structure, simple operations, strong brand message supported by high levels of advertising spending, and high-quality menu offerings drive attractive store-level economics, which, in turn, drive demand for new stores.
2017 Review |
Revenues
Total revenues declined 6.5% from $127 million in 2016 to $119 million in 2017 due primarily to a decline in the number of franchised and Company-owned stores and a decline in comparable store sales. In addition, 2016 contained a 53rd week of operations, which contributed an additional $2.7 million in revenue. System-wide sales declined 5.8% from $899 million in 2016 to $847 million in 2017 as a result of a net reduction of 54 stores during the year and a decline in comparable store sales. Comparable store sales (decline) growth for selected segments during the periods reported was as follows:
Fiscal Year | ||||||||
2017 | 2016 | 2015 | ||||||
Domestic Franchise | (3.8 | )% | (5.0 | )% | 1.9 | % | ||
Domestic Company Stores | (5.5 | )% | (7.3 | )% | 1.8 | % | ||
Total domestic stores | (4.0 | )% | (5.2 | )% | 1.9 | % | ||
The decline in comparable store sales in 2017 and 2016 resulted from reduced transactions. We believe the reduction in transactions was a result of suboptimal consumer messaging and inconsistent store-level execution. Comparable store sales growth in 2015 primarily resulted from an increased average check due to targeted price increases and the launch of our Gourmet Delite product category in the fourth quarter of 2014.
Store Development and Refranchising
During 2017, we and our franchise owners opened 35 stores, including 31 in the United States. While we operate a small percentage of stores as Company-owned stores, we expect the majority of our new store expansion to continue to come from new franchised store openings.
Through 2016, we have focused our financial resources on accelerating the build out of several markets with Company-owned stores. Consistent with our strategy, we are now working to refranchise a significant number of our Company-owned stores to experienced and well-capitalized franchisees who can further grow these markets. In May 2017, we successfully refranchised seven Company-owned stores pursuant to this strategy. Our target is to continue reducing the number of Company-owned stores to no more than 50 stores by 2020.
35
E-commerce
We began the system-wide roll-out of an e-commerce platform in early 2016 and have seen positive results to date as the average transaction amount continues to be about 20% higher with online orders than in-store orders. We strategically use online-only promotions communicated through text and email messaging. In June 2017, we announced plans to accelerate our convenience strategy by moving our online ordering system to a third-party’s platform, which will also enable online and mobile ordering to be fully integrated with third-party marketplace and delivery services, where available. As part of the transition, we recognized a non-cash charge of $9.1 million before taxes related to the impairment of our e-commerce platform in the second quarter of 2017.
Store Closures
In 2017, a total of 89 stores were closed system-wide, including 16 Company-owned stores. In connection with the Company-owned store closures, we recognized asset impairment charges of $2.3 million before taxes and recorded lease loss reserves related to remaining contractual lease obligations of $1.0 million before taxes.
Company-owned Store Asset Impairment
In the third quarter of 2017, as part of our impairment analysis of the book value of the property and equipment associated with our Company-owned stores, we determined that the book value of our stores in four markets was higher than the fair value of the stores located in those markets. Accordingly, we recognized an asset impairment charge of $4.4 million before taxes during the third quarter of 2017, which impairment charge was in addition to the store closure impairment charge described above.
National Media
During the first quarter of 2017, we tested national advertising for all domestic stores. Several of our markets that historically received no television media were provided with a few weeks of national cable advertising. Based upon our analysis, the national advertising did not materially affect our sales trends.
Income Taxes
In December 2017, the Tax Cuts and Jobs Act (the “2017 Tax Act”) was enacted. The 2017 Tax Act includes a number of changes to existing U.S. tax laws that impact the Company, most notably a reduction of the top U.S. corporate income tax rate from 35 percent to 21 percent for tax years beginning after December 31, 2017. The 2017 Tax Act also provides for the acceleration of depreciation for certain assets placed into service after September 27, 2017, as well as prospective changes beginning in 2018, including additional limitations on executive compensation and limitations on the deductibility of interest. As a result of the 2017 Tax Act, the Company recorded a $12.6 million benefit from income taxes for the year ended January 1, 2018, and a corresponding $12.6 million decrease in net deferred tax liabilities as of January 1, 2018.
Our Segments |
We operate in three business segments: Domestic Franchise, Domestic Company Stores, and International. Our Domestic Franchise segment consists of our domestic franchised stores, which represent the majority of our system-wide stores. Our Domestic Company Stores segment consists of our Company-owned stores in the United States. Our International segment consists of our stores outside of the United States, all of which are franchised.
We measure the performance of our segments based on segment adjusted EBITDA and allocate resources based primarily on this measure. “EBITDA” is calculated as net income (loss) before interest expense, income taxes, depreciation, and amortization. Segment adjusted EBITDA excludes certain unallocated and corporate expenses, which include costs related to our board of directors, CEO, CFO, and certain legal expenses. Although segment adjusted EBITDA is not a measure of financial condition or performance determined in accordance with generally accepted accounting principles in the United States (“GAAP”), we use segment adjusted EBITDA to compare the operating performance of our segments on a consistent basis and to evaluate the performance and effectiveness of our operational strategies. Our calculation of segment adjusted EBITDA may not be comparable to that reported by other companies.
Our measure of segment performance changed beginning in fiscal year 2017. Previously, segment operating income was used as the measure of segment performance. Our Chief Operating Decision Maker (“CODM”) now uses segment adjusted
36
EBITDA as the primary measure of segment performance to allocate resources. The CODM believes this measure provides an enhanced basis for consistently measuring segment performance against operational objectives and strategies.
The following table presents our revenues, segment adjusted EBITDA, and depreciation and amortization for each of our segments for the periods presented:
Fiscal Year | |||||||||||
(in thousands) | 2017 | 2016 | 2015 | ||||||||
Revenues | |||||||||||
Domestic Franchise | $ | 41,421 | $ | 44,434 | $ | 45,579 | |||||
Domestic Company Stores | 76,868 | 82,080 | 74,300 | ||||||||
International | 372 | 369 | 330 | ||||||||
Total | $ | 118,661 | $ | 126,883 | $ | 120,209 | |||||
Segment Adjusted EBITDA | |||||||||||
Domestic Franchise | $ | 24,195 | $ | 23,772 | $ | 26,142 | |||||
Domestic Company Stores | 2,751 | 2,808 | 5,943 | ||||||||
International | 315 | 300 | 268 | ||||||||
Total reportable segments adjusted EBITDA | 27,261 | 26,880 | 32,353 | ||||||||
Corporate and unallocated | (7,417 | ) | (5,184 | ) | (6,678 | ) | |||||
Depreciation and amortization | (10,452 | ) | (12,236 | ) | (10,002 | ) | |||||
Interest expense, net | (5,078 | ) | (4,868 | ) | (4,524 | ) | |||||
Secondary offering costs(1) | — | — | (345 | ) | |||||||
Loss on Project Pie impairment and disposal(2) | — | — | (4,325 | ) | |||||||
CEO transition and restructuring(3) | (2,614 | ) | — | — | |||||||
E-commerce impairment(4) | (9,085 | ) | — | — | |||||||
Store closures and impairments(5) | (7,712 | ) | — | — | |||||||
Litigation settlements(6) | (4,453 | ) | — | — | |||||||
(Loss) Income Before Income Taxes | $ | (19,550 | ) | $ | 4,592 | $ | 6,479 | ||||
Depreciation and amortization | |||||||||||
Domestic Franchise | $ | 5,891 | $ | 6,606 | $ | 5,392 | |||||
Domestic Company Stores | 4,530 | 5,599 | 4,579 | ||||||||
International | 31 | 31 | 31 | ||||||||
Total | $ | 10,452 | $ | 12,236 | $ | 10,002 | |||||
(1) | Represents costs related to the secondary offering of the Company’s common stock. |
(2) | Represents a $4 million loss recognized upon impairment of Project Pie, LLC, a cost-method investment, and its subsequent disposal, and the write-off as bad debt receivables totaling $325,000. |
(3) | Represents non-recurring management transition and restructuring costs in connection with the departure of our former Chief Executive Officer and other executives and the recruitment of a new Chief Executive Officer and other executive positions. |
(4) | Represents impairment of our e-commerce platform based on the decision to move to a third party developed and hosted solution. |
(5) | Represents non-cash charges associated with the disposal or impairment of store assets upon the determination that the book value of certain stores was higher than the fair value of those stores, plus lease buyouts and reserves for the residual contractual lease obligations on closed stores. |
(6) | Payments and accruals made toward franchisee settlements and litigation reserves. |
37
Key Operating Metrics |
We evaluate the performance of our business using a variety of operating and performance metrics. Set forth below is a summary and description of our key operating metrics.
2017 | 2016 | 2015 | |||||||||
Domestic store average weekly sales (AWS) | $ | 10,589 | $ | 10,958 | $ | 11,651 | |||||
Domestic comparable store sales growth (decline) | (4.0 | )% | (5.2 | )% | 1.9 | % | |||||
Domestic comparable stores | 1,443 | 1,434 | 1,389 | ||||||||
System-wide sales (in thousands) | $ | 846,864 | $ | 898,709 | $ | 892,249 | |||||
Number of system-wide stores at period end | 1,523 | 1,577 | 1,536 | ||||||||
Adjusted EBITDA (in thousands) | $ | 19,844 | $ | 21,696 | $ | 26,174 | |||||
Average Weekly Sales (AWS)
AWS consists of the average weekly sales of domestic franchised and Company-owned stores over a specified period of time. AWS is calculated by dividing the total net sales of our domestic system-wide stores for the relevant time period by the number of weeks these stores were open in such time period. This measure allows management to assess changes in customer traffic and spending patterns in our domestic stores.
Comparable Store Sales Growth
Comparable store sales growth represents the change in year-over-year sales for comparable stores. A comparable store is a store that has been open for at least 52 full weeks from the comparable date (the Tuesday following the opening date). Comparable store sales growth reflects changes in the number of transactions and in customer spend per transaction at existing stores. Customer spend per transaction is affected by changes in menu prices, sales mix, and the number of items sold per customer.
System-Wide Sales
System-wide sales include net sales by all of our system-wide stores. This measure allows management to assess the health of our brand, our relative position to competitors, and assess changes in our royalty revenues.
Store Openings, Closures, Acquisitions, and Divestitures
We review the number of new stores, the number of closed stores, and the number of acquired and divested stores to assess growth (decline) in system-wide sales, royalty revenues, and Company-owned store sales.
38
The following table presents the changes in the number of stores in our system for fiscal 2017, 2016, and 2015.
Domestic Company Stores | Domestic Franchise | Total Domestic | International | Total | ||||||||||
Store count at 12/29/2014 | 91 | 1,342 | 1,433 | 28 | 1,461 | |||||||||
Openings | 18 | 81 | 99 | 12 | 111 | |||||||||
Closings | (1 | ) | (35 | ) | (36 | ) | — | (36 | ) | |||||
Net transfers | 19 | (19 | ) | — | — | — | ||||||||
Store count at 12/28/2015 | 127 | 1,369 | 1,496 | 40 | 1,536 | |||||||||
Openings | 35 | 69 | 104 | 5 | 109 | |||||||||
Closings | (1 | ) | (62 | ) | (63 | ) | (5 | ) | (68 | ) | ||||
Net transfers | 7 | (7 | ) | — | — | — | ||||||||
Store count at 1/2/2017 | 168 | 1,369 | 1,537 | 40 | 1,577 | |||||||||
Openings | — | 31 | 31 | 4 | 35 | |||||||||
Closings | (16 | ) | (69 | ) | (85 | ) | (4 | ) | (89 | ) | ||||
Net transfers | (7 | ) | 7 | — | — | — | ||||||||
Store count at January 1, 2018 | 145 | 1,338 | 1,483 | 40 | 1,523 | |||||||||
EBITDA and Adjusted EBITDA
To supplement our consolidated financial statements presented in accordance with generally accepted accounting principles in the U.S. (“GAAP”), we consider certain financial measures that are not prepared in accordance with GAAP. These non-GAAP financial measures are not based on any standardized methodology prescribed by GAAP and are not necessarily comparable to similarly-titled measures presented by other companies.
“Adjusted EBITDA” is calculated as net (loss) income before interest expense, income taxes, depreciation, and amortization (“EBITDA”) as adjusted for the effects of items that we do not consider indicative of our operating performance. Adjusted EBITDA is a supplemental measure of operating performance that does not represent and should not be considered as an alternative to net (loss) income, as determined by GAAP, and our calculation of Adjusted EBITDA may not be comparable to that reported by other companies.
Adjusted EBITDA is a non-GAAP financial measure. Management believes that this financial measure, when viewed with our results of operations in accordance with GAAP and our reconciliation of Adjusted EBITDA to net (loss) income, provides additional information to investors about certain material or unusual items that we do not expect to continue at the same level in the future. By providing this non-GAAP financial measure, we believe we are enhancing investors’ understanding of our business, our results of operations, and assisting investors in evaluating how well we are executing strategic initiatives. We believe Adjusted EBITDA is used by investors as a supplemental measure to evaluate the overall operating performance of companies in our industry.
Management uses Adjusted EBITDA and other similar measures:
▪ | in comparing our operating performance on a consistent basis; |
▪ | to calculate incentive compensation for our employees; |
▪ | for planning purposes, including the preparation of our internal annual operating budget; and |
▪ | to evaluate the performance and effectiveness of our operational strategies. |
Adjusted EBITDA has limitations as an analytical tool and you should not consider it in isolation or as a substitute for analysis of our results as reported under GAAP. Some of the limitations are:
▪ | Adjusted EBITDA does not reflect the significant interest expense or the cash requirements necessary to service interest or principal payments on our debt; |
▪ | Although depreciation and amortization are non-cash charges, the assets being depreciated and amortized may have to be replaced in the future and Adjusted EBITDA does not reflect the cash requirements for such replacements; and |
▪ | Adjusted EBITDA does not reflect our tax expense or the cash requirements to pay our taxes. |
To address these limitations, we reconcile Adjusted EBITDA to the most directly comparable GAAP measure, net income. Further, we also review GAAP measures and evaluate individual measures that are not included in Adjusted EBITDA.
39
The following table provides a reconciliation of our net (loss) income to Adjusted EBITDA for the periods presented:
Fiscal Year | |||||||||||
(in thousands) | 2017 | 2016 | 2015 | ||||||||
Net (Loss) Income | $ | (7 | ) | $ | 2,649 | $ | 4,411 | ||||
Net loss attributable to noncontrolling interests | — | — | 500 | ||||||||
Net (Loss) Income Attributable to Papa Murphy’s | (7 | ) | 2,649 | 4,911 | |||||||
Depreciation and amortization | 10,452 | 12,236 | 10,002 | ||||||||
Income tax (benefit) provision | (19,543 | ) | 1,943 | 2,068 | |||||||
Interest expense, net | 5,078 | 4,868 | 4,523 | ||||||||
EBITDA | (4,020 | ) | 21,696 | 21,504 | |||||||
Secondary offering costs(1) | — | — | 345 | ||||||||
Loss on Project Pie impairment and disposal(2) | — | — | 4,325 | ||||||||
CEO transition and restructuring(3) | 2,614 | — | — | ||||||||
E-commerce impairment(4) | 9,085 | — | — | ||||||||
Store closures and impairments(5) | 7,712 | — | — | ||||||||
Litigation settlements(6) | 4,453 | — | — | ||||||||
Adjusted EBITDA | $ | 19,844 | $ | 21,696 | $ | 26,174 | |||||
(1) | Represents costs related to the secondary offering of the Company’s common stock. |
(2) | Represents a $4 million loss recognized upon impairment of Project Pie, LLC, a cost-method investment, and its subsequent disposal, and the write-off as bad debt receivables totaling $325,000. |
(3) | Represents non-recurring management transition and restructuring costs plus costs associated with recruitment of a new Chief Executive Officer and Chief Financial Officer. |
(4) | Represents impairment of our e-commerce platform based on the decision to move to a third party developed and hosted solution. |
(5) | Represents non-cash charges associated with the disposal or impairment of store assets upon the determination that the book value of certain stores was higher than the fair value of those stores, plus lease buyouts and reserves for the residual contractual lease obligations on closed stores. |
(6) | Payments and accruals made toward franchisee settlements and litigation reserves. |
Key Financial Definitions |
Revenues
Substantially all of our revenues are derived from sales of pizza and other food and beverage products to the general public by Company-owned stores and the collection of franchise royalties and fees associated with franchise and development rights. Franchise and development fees include initial franchise fees charged for opening a new franchised store, successive fees for the renewal of expiring franchise agreements, transfer fees for transferring ownership of a franchise, and deposit forfeitures. “Other revenue,” as used in this report, includes (i) revenues earned from the sublease of real estate under a master lease agreement with a national retailer, (ii) transaction fees from the Company’s online ordering platform, (iii) fees for customer support services provided to franchisees, and (iv) revenues derived from the resale of POS system licenses to franchise owners at cost. Lease income is recognized in the period earned, which coincides with the period the expense is due to the master leaseholder. See Selling, General, and Administrative Costs below for the related offsetting expense to the POS system licenses resold to franchise owners.
Store Operating Costs
Store operating costs relate to our Domestic Company Stores segment and consist of cost of food and packaging, compensation and benefits, advertising, occupancy costs, and other store operating costs, including new store pre-opening costs. We expect all of our store operating costs to vary as our store count changes from building, acquiring, closing, and refranchising Company-owned stores. Cost of food and packaging and advertising can be expected to fluctuate with commodity price changes and increases or decreases in the revenues of our Domestic Company Stores segment.
Selling, General, and Administrative Costs
Selling, general, and administrative costs consist of wages, benefits, and other compensation, franchise development expenses, travel, marketing, accounting fees, legal fees, the costs of POS system software licenses sold to franchise
40
owners at cost, and other expenses related to the infrastructure required to support our franchised and Company-owned stores. See Revenues above for the related offsetting revenue from the POS system software licenses resold to franchise owners. Selling, general, and administrative costs also include net advertising expenses of an advertising fund we manage on behalf of all domestic stores.
Depreciation and Amortization
Depreciation and amortization constitute non-cash charges related to the depreciation of fixed assets, including leasehold improvements and equipment, and the amortization of franchise relationships and reacquired franchise rights relating to our acquisition of certain franchised stores.
Results of Operations |
The following table presents our results of operations in dollars and as a percentage of total revenues for the periods reported.
Fiscal Year | ||||||||||||||||||||
2017 | 2016 | 2015 | ||||||||||||||||||
(dollars in thousands) | $ | Total % of Revenues | $ | Total % of Revenues | $ | Total % of Revenues | ||||||||||||||
Revenues | ||||||||||||||||||||
Franchise royalties | $ | 37,552 | 31.6 | % | $ | 39,851 | 31.4 | % | $ | 40,243 | 33.5 | % | ||||||||
Franchise and development fees | 2,220 | 1.9 | % | 2,912 | 2.3 | % | 4,222 | 3.5 | % | |||||||||||
Company-owned store sales | 76,868 | 64.8 | % | 82,080 | 64.7 | % | 74,300 | 61.8 | % | |||||||||||
Other | 2,021 | 1.7 | % | 2,040 | 1.6 | % | 1,444 | 1.2 | % | |||||||||||
Total revenues | 118,661 | 100.0 | % | 126,883 | 100.0 | % | 120,209 | 100.0 | % | |||||||||||
Costs and Expenses | ||||||||||||||||||||
Store operating costs: | ||||||||||||||||||||
Cost of food and packaging (1) | 25,958 | 22.0 | % | 28,347 | 22.3 | % | 26,603 | 22.0 | % | |||||||||||
Compensation and benefits (1) | 23,603 | 19.9 | % | 23,746 | 18.7 | % | 19,858 | 16.5 | % | |||||||||||
Advertising (1) | 8,221 | 6.9 | % | 8,203 | 6.5 | % | 7,888 | 6.6 | % | |||||||||||
Occupancy (1) | 7,043 | 5.9 | % | 6,226 | 4.9 | % | 4,750 | 4.0 | % | |||||||||||
Other store operating costs (1) | 8,102 | 6.8 | % | 10,268 | 8.1 | % | 7,517 | 6.3 | % | |||||||||||
Selling, general, and administrative | 33,870 | 28.5 | % | 28,108 | 22.2 | % | 28,207 | 23.5 | % | |||||||||||
Depreciation and amortization | 10,452 | 8.8 | % | 12,236 | 9.6 | % | 10,002 | 8.3 | % | |||||||||||
Loss (gain) on disposal or impairment of property and equipment | 15,680 | 13.2 | % | 101 | 0.1 | % | (251 | ) | (0.2 | )% | ||||||||||
Total costs and expenses | 132,929 | 112.0 | % | 117,235 | 92.4 | % | 104,574 | 87.0 | % | |||||||||||
Operating (Loss) Income (1) | (14,268 | ) | (12.0 | )% | 9,648 | 7.6 | % | 15,635 | 13.0 | % | ||||||||||
Interest expense, net | 5,078 | 4.3 | % | 4,868 | 3.9 | % | 4,523 | 3.8 | % | |||||||||||
Loss on early retirement of debt | — | — | % | — | — | % | — | — | % | |||||||||||
Loss on impairment of investments | — | — | % | — | — | % | 4,500 | 3.7 | % | |||||||||||
Other expense, net | 204 | 0.2 | % | 188 | 0.1 | % | 133 | 0.1 | % | |||||||||||
(Loss) Income Before Income Taxes | (19,550 | ) | (16.5 | )% | 4,592 | 3.6 | % | 6,479 | 5.4 | % | ||||||||||
(Benefit from) provision for income taxes | (19,543 | ) | (16.5 | )% | 1,943 | 1.5 | % | 2,068 | 1.7 | % | ||||||||||
Net (Loss) Income | $ | (7 | ) | — | % | $ | 2,649 | 2.1 | % | 4,411 | 3.7 | % | ||||||||
Net loss attributable to noncontrolling interests | — | — | % | — | 0.0 | % | 500 | 0.4 | % | |||||||||||
Net (Loss) Income Attributable to Papa Murphy’s | $ | (7 | ) | — | % | $ | 2,649 | 2.1 | % | $ | 4,911 | 4.1 | % | |||||||
(1)Please see the table presented in Costs and Expenses below, which presents Company store expenses as a percentage of Company store revenue for 2017, 2016, and 2015.
41
Revenues
Franchise royalties. The following table presents franchise royalties for the periods reported:
(dollars in thousands) | 2017 | Change | 2016 | Change | 2015 | ||||||||||||
Franchise royalties | $ | 37,552 | (5.8 | )% | $ | 39,851 | (1.0 | )% | $ | 40,243 | |||||||
Percentage of total revenues | 31.6 | % | 31.4 | % | 33.5 | % | |||||||||||
Franchise royalties decreased in 2017 and in 2016 due primarily to decreases in Domestic Franchise comparable store sales of 3.8% and 5.0%, respectively. Franchise royalties in 2017 were also negatively affected by the closure of 73 franchised stores.
Franchise and development fees. The following table presents franchise and development fees for the periods reported:
(dollars in thousands) | 2017 | Change | 2016 | Change | 2015 | ||||||||||||
Franchise and development fees | $ | 2,220 | (23.8 | )% | $ | 2,912 | (31.0 | )% | $ | 4,222 | |||||||
Percentage of total revenues | 1.9 | % | 2.3 | % | 3.5 | % | |||||||||||
Franchise and development fees decreased in 2017 due to reductions in initial and successive franchise fees, partially offset by an increase in transfer fees. For 2016, franchise and development fees decreased due to reductions in deposit forfeitures, initial franchise fees, and transfer fees.
Company-owned store sales. The following table presents Company-owned store sales for the periods reported:
(dollars in thousands) | 2017 | Change | 2016 | Change | 2015 | ||||||||||||
Company-owned store sales | $ | 76,868 | (6.3 | )% | $ | 82,080 | 10.5 | % | $ | 74,300 | |||||||
Percentage of total revenues | 64.8 | % | 64.7 | % | 61.8 | % | |||||||||||
Company-owned store sales decreased in 2017 due to the sale of seven Company-owned stores, the closure of 16 Company-owned stores, and a decline in comparable store sales of 5.5% in the Domestic Company Stores segment.
For 2016, Company-owned store sales increased due to the acquisition of 10 stores from franchise owners and the opening of 35 new Company-owned stores, partially offset by a decline in comparable store sales of 7.3% in the Domestic Company Stores segment.
Costs and Expenses
Store operating costs. The following table presents store operating costs for the periods reported:
(dollars in thousands) | 2017 | Change | 2016 | Change | 2015 | ||||||||||||
Store operating costs | $ | 72,927 | (5.0 | )% | $ | 76,790 | 15.3 | % | $ | 66,616 | |||||||
Percentage of total revenues | 61.5 | % | 60.5 | % | 55.4 | % | |||||||||||
Store operating costs decreased in 2017 primarily as a result of the sale of seven Company-owned stores and the closure of 16 Company-owned stores during 2017. Store operating costs and the corresponding percentage of total revenues increased in 2016 primarily as a result of the opening of 35 new Company-owned stores and the acquisition of 10 stores from franchise owners during 2016.
42
The following table presents store operating costs as a percentage of Company-owned store sales for the periods reported:
Fiscal Year | ||||||||
2017 | 2016 | 2015 | ||||||
As a % of Company-owned store sales: | ||||||||
Cost of food and packaging | 33.8 | % | 34.5 | % | 35.8 | % | ||
Compensation and benefits | 30.7 | % | 28.9 | % | 26.7 | % | ||
Advertising | 10.7 | % | 10.0 | % | 10.6 | % | ||
Occupancy | 9.2 | % | 7.6 | % | 6.4 | % | ||
Other store operating costs | 10.5 | % | 12.6 | % | 10.2 | % | ||
Total store operating costs | 94.9 | % | 93.6 | % | 89.7 | % | ||
Total store operating costs. Total store operating costs as a percentage of Company-owned store sales increased by 130 basis points in 2017 compared to 2016 and increased 390 basis points in 2016 compared to 2015, due primarily to the effect of store portfolio changes in select markets and as further explained below:
• | Occupancy. The increase in occupancy costs as a percentage of Company-owned store sales is primarily a result of lease buyouts or reserves for contractual lease obligations associated with store closures. |
• | Compensation and benefits. Compensation and benefits as a percentage of Company-owned store sales increased primarily due to fixed labor costs such as store manager salaries representing a larger portion of compensation in lower volume stores. In addition, increases in the minimum wage have negatively affected several of our established markets. |
• | Other store operating costs. Other store operating costs as a percentage of Company-owned store sales increased in 2016 as a result of pre-opening costs associated with the opening of 35 Company-owned stores in 2016, compared with 18 openings in 2015 and no openings in 2017. |
▪ | Advertising. The increase in advertising as a percentage of Company-owned store sales in 2017 compared to 2016 was driven primarily by increased spending on print advertising and Company-owned store contributions to our national advertising campaign. The decrease in advertising as a percentage of Company-owned store sales in 2016 compared to 2015 was driven by a reduction in spending on print advertising. |
Selling, general, and administrative. The following table presents selling, general, and administrative costs for the periods reported:
(dollars in thousands) | 2017 | Change | 2016 | Change | 2015 | ||||||||||||
Selling, general, and administrative | $ | 33,870 | 20.5 | % | $ | 28,108 | (0.4 | )% | $ | 28,207 | |||||||
Percentage of total revenues | 28.5 | % | 22.2 | % | 23.5 | % | |||||||||||
Selling, general, and administrative costs increased in 2017 compared to 2016 due primarily to legal settlements and litigation reserves of $4.5 million and severance and restructuring costs of $2.6 million, partially offset by a reduction in employee costs. Selling, general, and administrative costs decreased in 2016 compared to 2015 primarily due to less deficit spending in the advertising fund and a reduction in employee costs, partially offset by increased costs for our online ordering system.
Depreciation and amortization. The following table presents depreciation and amortization for the periods reported:
(dollars in thousands) | 2017 | Change | 2016 | Change | 2015 | ||||||||||||
Depreciation and amortization | $ | 10,452 | (14.6 | )% | $ | 12,236 | 22.3 | % | $ | 10,002 | |||||||
Percentage of total revenues | 8.8 | % | 9.6 | % | 8.3 | % | |||||||||||
Depreciation and amortization decreased in 2017 compared to 2016 primarily due to a reduction in the number of Company-owned stores period-over-period and the impairment of our current e-commerce platform. Depreciation and amortization increased in 2016 compared to 2015 primarily due to an increase in the number of Company-owned stores and increased capital expenditures on property and equipment for business technology projects.
43
Loss (gain) on disposal or impairment of property and equipment. The following table presents the Loss (gain) on disposal or impairment of property and equipment for the periods reported:
(dollars in thousands) | 2017 | Change | 2016 | Change | 2015 | ||||||||||
Loss (gain) on disposal or impairment of property and equipment | $ | 15,680 | N/M | $ | 101 | N/M | $ | (251 | ) | ||||||
Percentage of total revenues | 13.2 | % | 0.1 | % | (0.2 | )% | |||||||||
N/M = Not Meaningful
The loss recorded in 2017 primarily resulted from an asset impairment charge to our current e-commerce platform of $9.1 million and asset impairment charges from store closures and the write-down of Company-owned store assets in four markets of $7.7 million in the aggregate, partially offset by gains from the refranchising of Company-owned stores. The loss recorded in 2016 primarily resulted from an asset impairment charge of $0.2 million on assets held for sale, partially offset by the gain on the sale of Company-owned stores. The gain recorded in 2015 primarily resulted from the sale of Company-owned stores.
Interest expense, net. The following table presents net interest expense for the periods reported:
(dollars in thousands) | 2017 | Change | 2016 | Change | 2015 | ||||||||||||
Interest expense, net | $ | 5,078 | 4.3 | % | $ | 4,868 | 7.6 | % | $ | 4,523 | |||||||
Percentage of total revenues | 4.3 | % | 3.9 | % | 3.8 | % | |||||||||||
Interest expense, net increased in 2017 compared to 2016 as a result of increases in LIBOR lending rates which resulted in a higher weighted average interest rate of 4.34% during 2017 compared to 3.77% in 2016, partially offset by a reduction in the balance of outstanding debt throughout 2017.
Interest expense, net increased in 2016 as a result of a higher weighted average interest rate of 3.77% during 2016 compared to 3.45% in 2015, partially offset by a reduction in the balance of outstanding debt throughout 2016.
Income Taxes. The following table presents income taxes for the periods reported:
(dollars in thousands) | 2017 | Change | 2016 | Change | 2015 | |||||||||||
(Benefit from) provision for income taxes | $ | (19,543 | ) | N/M | $ | 1,943 | (6.0 | )% | $ | 2,068 | ||||||
Percentage of total revenues | (16.5 | )% | 1.5 | % | 1.7 | % | ||||||||||
Effective tax rate | N/M | 42.3 | % | 31.9% | ||||||||||||
N/M = Not Meaningful
The (Benefit from) provision for income taxes decreased in 2017 compared to 2016 due to the corporate tax rate reduction made by the 2017 Tax Act. This tax rate reduction yielded a $12.6 million benefit in 2017. The effective tax rate for 2017 was higher due to a switch to a pre-tax Loss in 2017 and a current year benefit created by the 2017 Tax Act corporate tax rate reduction. For 2016, our provision for income taxes decreased compared to 2015, primarily due to a decline in Income before Income Taxes, partially offset by an increase in the tax effect of certain permanent tax differences.
Segment Results
Domestic Franchise. The following table presents Domestic Franchise total revenues and Adjusted EBITDA for the periods reported:
(dollars in thousands) | 2017 | Change | 2016 | Change | 2015 | ||||||||||||
Total revenues | $ | 41,421 | (6.8 | )% | $ | 44,434 | (2.5 | )% | $ | 45,579 | |||||||
Percentage of total revenues | 34.9 | % | 35.0 | % | 37.9 | % | |||||||||||
Adjusted EBITDA | 24,195 | 1.8 | % | 23,772 | (9.1 | )% | 26,142 | ||||||||||
Total revenues for the Domestic Franchise segment decreased in 2017 compared to 2016 due primarily to a decline in segment comparable store sales of 3.8% and the closure of 73 franchised stores. Total revenues for the Domestic Franchise segment decreased in 2016 compared to 2015 due primarily to a decline in segment comparable store sales of 5.0%.
44
Adjusted EBITDA for the Domestic Franchise segment increased in 2017 compared to 2016 due primarily to reductions in Selling, general and administrative costs, partially offset by a reduction in total revenues. Adjusted EBITDA for the Domestic Franchise segment decreased in 2016 compared to 2015 due primarily to increased marketing costs as advertising fund expenditures exceeded contributions.
Domestic Company Stores. The following table presents Domestic Company Stores total revenues and Adjusted EBITDA for the periods reported:
(dollars in thousands) | 2017 | Change | 2016 | Change | 2015 | ||||||||||||
Total revenues | $ | 76,868 | (6.3 | )% | $ | 82,080 | 10.5 | % | $ | 74,300 | |||||||
Percentage of total revenues | 64.8 | % | 64.7 | % | 61.8 | % | |||||||||||
Adjusted EBITDA | 2,751 | (2.0 | )% | 2,808 | (52.8)% | 5,943 | |||||||||||
Total revenues for the Domestic Company Stores segment decreased in 2017 compared to 2016 as a result of a decline in segment comparable store sales of 5.5% and the closure of 16 segment stores. For 2016, Total revenues for the Domestic Company Stores segment increased compared to 2015 as a result of the opening of 35 new Company-owned stores and the acquisition of 10 stores from franchise owners, partially offset by a decline in segment comparable store sales of 7.3% and the closure of one store.
Adjusted EBITDA for the Domestic Company Stores segment decreased in 2017 compared to 2016 as a result of a decline in comparable store sales of 5.5%, partially offset by savings generated from the closing of 16 underperforming stores. For 2016, Adjusted EBITDA for the Domestic Company Stores segment decreased compared to 2015 as a result of a decline in comparable store sales of 7.3%, increased depreciation and amortization as a result of adding 41 total Company-owned stores, and increased pre-opening costs due to more new store openings.
International. The following table presents International total revenues and Adjusted EBITDA for the periods reported:
(dollars in thousands) | 2017 | Change | 2016 | Change | 2015 | ||||||||||||
Total revenues | $ | 372 | 0.8 | % | $ | 369 | 11.8 | % | $ | 330 | |||||||
Percentage of total revenues | 0.3 | % | 0.3 | % | 0.3 | % | |||||||||||
Adjusted EBITDA | 315 | 5.0 | % | 300 | 11.9% | 268 | |||||||||||
Total revenues for the International segment increased in 2017 and 2016 largely as a result of increased royalties from product sales. Adjusted EBITDA for the International segment increased in 2017 and 2016 largely as a result of increased royalties from product sales.
Liquidity and Capital Resources |
Our primary sources of liquidity are cash flows from operating activities and proceeds from the incurrence of debt, which together are sufficient to fund our operations, tax payments, capital expenditures, interest, fees, and principal payments on our debt as well as to support our growth strategy. As a public company, we may also raise additional capital through the sale of equity. Our ability to obtain additional financing will depend on many factors, including prevailing market conditions, our financial condition, and our ability to negotiate favorable terms and conditions. Financing may not be available on terms that are acceptable or favorable to us, if at all. We have also initiated a refranchising initiative to reduce our Company-owned stores to about 50 by 2020. We intend to use the net cash proceeds from refranchising to reduce debt.
As of January 1, 2018, we had cash and cash equivalents of $2.2 million and a $20.0 million revolving credit facility, of which none was drawn. As of January 1, 2018, we had $95.9 million of outstanding indebtedness and principal payments of $2.1 million are due quarterly. We believe that our cash flows from operations, available cash and cash equivalents, and available borrowings under our revolving credit facility will be sufficient to meet our liquidity needs for at least the next 12 months.
As of January 1, 2018, we were in compliance with all of our covenants and other obligations under our senior secured credit facility.
While we believe that we will have the ability to refinance our senior secured credit facility when it matures in 2019, we do not assure you that we will be able to refinance our credit facility on acceptable terms, if at all.
45
Cash Flows
The following table presents a summary of cash flows from operating, investing, and financing activities for the periods presented:
Twelve Months Ended | |||||||||||
(in thousands) | 2017 | 2016 | 2015 | ||||||||
Net cash provided by operating activities | $ | 15,537 | $ | 16,804 | $ | 23,743 | |||||
Net cash used in investing activities | (1,648 | ) | (19,390 | ) | (19,554 | ) | |||||
Net cash used in financing activities | (13,784 | ) | (2,212 | ) | (2,378 | ) | |||||
Total cash flows | $ | 105 | $ | (4,798 | ) | $ | 1,811 | ||||
Operating Activities
Net cash provided by operating activities decreased by $1.3 million in 2017 compared to 2016 primarily due to a $2.7 million decrease in net income, partially offset by the timing of changes in working capital. Net cash provided by operating activities decreased by $6.9 million in 2016 compared to 2015 primarily due to a $1.8 million decrease in net income and the timing of changes in working capital.
Investing Activities
In 2017, net cash used in investing activities decreased by $17.7 million compared to 2016 primarily due to a $14.0 million decrease in capital spending as a result of a reduction in spending on the construction of new Company-owned stores and a $2.6 million decrease in cash paid for store acquisitions. In 2016, net cash used in investing activities decreased by $0.2 million over 2015 because we did not make additional investments in Project Pie, a cost-method investee, and we did not issue any new notes receivable, the combination of which reduced cash used in investing activities by $0.8 million. This savings was offset in part by a $7.6 million increase in capital spending, primarily on the construction of new stores and our new e-commerce online ordering platform and a $7.1 million decrease in cash paid for store acquisitions.
Financing Activities
Net cash used in financing activities increased in 2017 by $11.6 million primarily due to an increase in net long-term debt payments of $11.9 million. Net cash used in financing activities decreased in 2016 by $0.2 million primarily due to a reduction in net long-term debt payments of $0.3 million.
Contractual Obligations |
As of January 1, 2018, our contractual obligations and other commitments were as follows:
Payments Due by Period | |||||||||||||||||||
(in millions) | Total | Less than 1 year | 1-3 years | 3-5 years | More than 5 years | ||||||||||||||
Long-term debt obligations | $ | 95.9 | $ | 8.4 | $ | 87.5 | $ | — | $ | — | |||||||||
Operating lease obligations | 20.1 | 5.2 | 8.2 | 3.8 | 2.9 | ||||||||||||||
Total (1) | $ | 116.0 | $ | 13.6 | $ | 95.7 | $ | 3.8 | $ | 2.9 | |||||||||
(1) | We have a technology license contract that provides for a purchase commitment which results in our being contingently liable for licenses not purchased by us or our franchise owners. We are contingently liable under this agreement for approximately $0.5 million annually through 2018 and considering various factors including internal forecasts, prior history, and the ability to use or resell any licenses purchased under this commitment in future periods, no accrual was required related to this commitment. This amount is not included in the table above because timing of payment, if any, is uncertain. |
Off-Balance Sheet Arrangements |
We have guaranteed certain operating lease payments related to specified franchised stores in connection with the divestiture and refranchising of Company-owned stores. The maximum aggregate potential liability associated with the guaranteed lease payments is $1.8 million. We believe that none of these guarantees has or is likely to have a material effect on our results of operations, financial condition, or liquidity. Additional information on guaranteed lease payments can
46
be found in the “Lease guarantees” section of Financial Statements and Supplementary Data in Note 15 — Commitments and Contingencies of the accompanying Notes to Consolidated Financial Statements.
Critical Accounting Policies |
Our discussion and analysis of our financial condition and results of operations are based upon our consolidated financial statements, which have been prepared in accordance with GAAP. The preparation of these consolidated financial statements requires us to make estimates and judgments that affect the reported amounts of assets, liabilities, revenues, and expenses. On an ongoing basis, we evaluate our judgments and estimates, including those related to revenue recognition, accounts and notes receivable, goodwill and other intangible assets, impairment of long-lived assets, income taxes, advertising and marketing costs, and share-based compensation. We base our estimates on historical experience and on various other assumptions that we believe to be reasonable under the circumstances. Actual results may differ from these estimates under different assumptions or conditions. We believe that our most critical accounting policies and estimates are:
Revenue recognition
Sales from Company-owned stores are recognized as revenue when the products are provided to customers. We report revenues net of sales taxes collected from customers and remitted to government taxing authorities. Royalty fees are based on a percentage of sales and are recorded as revenues as the fees are earned and become receivable from the franchise owner. Lease income is recognized in the period earned, which generally coincides with the period the expense is due to the master leaseholder, if a sublease.
Consideration for franchise and development fees that are received in advance of being earned are included as unearned franchise and development fees in our Consolidated Balance Sheets. For fees paid on an installment basis that have otherwise been earned, recognition of revenue is deferred until collectability is certain.
Franchise fees are recognized as revenue when all material services or conditions relating to the store have been substantially performed or satisfied by us, which is typically when a new franchised store begins operations or on the commencement date of the successive franchise agreement. Development fees for the right to develop stores in specific geographic areas are recognized as revenue when all material services or conditions relating to the sale have been substantially performed, which is typically when the first franchised store begins operations in the development area. Development fees determined based on the number of stores to open in an area are deferred and recognized on a pro rata basis after individual franchise agreements are executed for the stores subject to the development agreements and the stores begin operations.
Revenue from gift cards is recognized when the gift card is redeemed by a customer in one of our stores. Revenue is not recognized for gift cards redeemed in franchised stores. When the likelihood of a gift card being redeemed by a customer is determined to be remote and the Company expects to be entitled to the breakage, then the value of the unredeemed gift card is recognized by us as a contribution (“gift card breakage”) to the advertising fund described below. We determine the gift card breakage rate based upon Company-specific historical redemption patterns.
Accounts and notes receivable
Accounts receivable consist primarily of (a) amounts due from franchise owners for continuing fees that are collected weekly, (b) receivables for supply chain vendor rebates, (c) subleased retail rents, and (d) other miscellaneous receivables. Accounts receivable are stated net of an allowance for doubtful accounts determined by management through an evaluation of specific accounts, considering historical losses and existing economic conditions where relevant.
Notes receivable consist primarily of amounts due from sales of Company-owned stores. Management reviews the notes receivable on a periodic basis and evaluates the creditworthiness and financial condition of the counterparty to determine the appropriate allowance, if any. In certain cases, we will choose to modify the terms of a note to help a store owner achieve certain profitability targets or to accommodate a store owner while the store owner obtains third party financing. If the store owner does not repay the note, we have the contractual right to take back ownership of the store based on the underlying franchise agreement, which therefore minimizes the credit risk to us.
47
Goodwill and other intangible assets
Goodwill arises from business combinations and represents the excess of the purchase consideration transferred over the fair value of the net assets acquired, including identifiable intangible assets and liabilities assumed. The majority of our goodwill was generated in May 2010 when Lee Equity acquired all of the equity interests of PMI Holdings, Inc. (“Lee Equity Acquisition”), though we have also recognized goodwill upon the acquisition of stores from franchise owners. Goodwill is assigned to reporting units for purposes of impairment testing.
We consider our trade name and trademarks to be indefinite-lived intangible assets. These assets were initially recognized in May 2010 upon the Lee Equity Acquisition. Our intangible assets that are not indefinite-lived include franchise relationships and reacquired franchise rights.
Goodwill and intangible assets determined to have an indefinite life are not amortized, but are tested for impairment annually, or more often if an event occurs or circumstances change that indicate an impairment might exist. Management evaluates indefinite-lived assets each reporting period to determine whether events and circumstances continue to support an indefinite useful life. Intangible assets with finite lives are amortized over their estimated useful lives on a straight-line basis and tested for impairment together with long-lived assets.
In performing our annual goodwill impairment test, we have the option to first assess qualitative factors to determine whether the existence of events or circumstances leads to a determination that it is not “more likely than not” that the fair value of a reporting unit is less than its carrying amount. If we determine that it is more likely than not, we perform the two-step quantitative goodwill impairment test. Under the two-step quantitative goodwill impairment test, the fair value of the reporting unit is compared to its respective carrying amount, including goodwill. If the fair value exceeds the carrying amount, then no impairment exists. If the carrying amount exceeds the fair value, further analysis is performed to determine the amount of the impairment. Both the qualitative and quantitative assessments are completed separately with respect to the goodwill of each of our reporting units. We review goodwill for impairment annually, as of the first day of our fourth fiscal quarter, or more frequently if indicators of impairment exist. We can bypass the qualitative assessment and move directly to the quantitative assessment for any reporting unit in any period and can elect to resume performing the qualitative assessment in any subsequent period.
Most of our goodwill is attributed to and tested for impairment at the Domestic Franchise segment, which is considered one reporting unit, as the segment does not have any components of a business for which discrete financial information is available and is regularly reviewed by segment management.
In performing our annual impairment test for indefinite-lived intangible assets, we have the option to first assess qualitatively whether it is more likely than not that the indefinite-lived intangible asset is impaired, thus necessitating a quantitative impairment test. We do not calculate the fair value of an indefinite-lived asset and perform the quantitative test unless we determine that it is more likely than not that the asset is impaired. We review indefinite-lived intangible assets for impairment annually, as of the first day of our fourth fiscal quarter, or more frequently if indicators of impairment exist. We can bypass the qualitative assessment and move directly to the quantitative assessment for any indefinite-lived intangible asset in any period and can elect to resume performing the qualitative assessment in any subsequent period.
Impairment of long-lived assets
Long-lived assets are evaluated for recoverability of the carrying amount whenever events and circumstances indicate the carrying amount of an asset may not be fully recoverable. Some of the events or changes in circumstances that would trigger an impairment review include, but are not limited to, significant under-performance relative to expected and/or historical results (such as two years of comparable store sales decrease or two years of negative operating cash flows), significant negative industry or economic trends, or knowledge of transactions involving the sale of similar property at amounts below the carrying value.
Assets are grouped for recognition and measurement of impairment at the lowest level for which identifiable cash flows are largely independent of the cash flows of other assets. Typically, long-lived assets relating to Company-owned stores are tested for impairment at the level of the retail market area in which they are located and long-lived assets relating to franchised operations are tested for impairment at the segment level. If the carrying amount of an asset group exceeds the estimated, undiscounted future cash flows expected to be generated by the asset, then an impairment charge is recognized to the extent the carrying amount exceeds the asset group’s fair value. In determining fair value, management considers current results, trends, future prospects, and other economic factors.
48
Income taxes
We account for income taxes using the asset and liability approach. This requires the recognition of deferred tax assets and liabilities for the expected future tax consequences of temporary differences between the financial statement and the tax basis of assets and liabilities at the applicable tax rates. A valuation allowance is recorded against deferred tax assets if, based on available evidence, it is more likely than not that some or all of the deferred tax assets will not be realized.
The effect of uncertain tax positions would be recorded in the consolidated financial statements only after determining a more likely than not probability that the uncertain tax positions would withstand an examination by tax authorities based on the technical merits of the position. The tax benefit to be recognized is measured as the largest amount of benefit that is greater than fifty percent likely of being realized upon ultimate settlement. As facts and circumstances change, management reassesses these probabilities and would record any changes in the financial statements as appropriate.
Advertising and marketing costs
We expense media development costs when the advertisement is first aired. All other advertising costs, including contributions to other local and regional advertising programs are expensed when incurred. These costs are included in store operating costs or selling, general, and administrative expenses based on the nature of the advertising and marketing costs incurred.
Franchised and Company-owned stores in the United States contribute to an advertising fund that we manage on behalf of these stores. In addition, certain supply chain vendors contribute to the advertising fund. The advertising fund also operates a gift card program for the Papa Murphy’s system. Any gift card breakage from this program is recognized as a contribution to the advertising fund. Under our franchise agreements and other agreements, the contributions received must be spent on marketing, creative efforts, media support, or other related purposes specified in the agreements and result in no profit recognized. The expenditures are primarily amounts paid to third parties, but may also include personnel expenses and allocated costs. In accordance with GAAP, contributions to the advertising fund are netted against the related expense.
At each reporting date, to the extent contributions exceed expenditures on a cumulative basis, the excess contributions to the advertising fund are accounted for as a deferred liability and are recorded in accrued expenses in our Consolidated Balance Sheets. If expenditures exceed contributions on a cumulative basis, the excess is recorded as an expense within selling, general, and administrative expenses. Previously recognized expenses may be recovered if subsequent contributions exceed expenditures.
Share-based Compensation
We maintain two equity compensation plans, our 2010 Amended Management Incentive Plan and our 2014 Management Incentive Plan, under which we have granted awards of stock options and restricted stock awards that typically vest based on the achievement of a time-vesting or a market condition.
Compensation expense relating to restricted stock awards is recognized for the portion of the grant date fair value that exceeds any purchase price paid for the stock. This expense is recognized over the requisite service period, typically the vesting period, utilizing the straight-line attribution method.
The fair value of time-vesting stock option awards is estimated on the grant date using a Black-Scholes-Merton option-pricing model. Compensation expense relating to stock option awards is recognized for the grant date fair value. The fair value of stock options that contain a market condition is estimated on the grant date using a Monte Carlo valuation method, which utilizes multiple input variables to determine the probability of the Company achieving the market condition and the fair value of the award. This expense is recognized over the requisite service period, typically the vesting period, utilizing the straight-line attribution method.
In addition, prior to the IPO we sold unrestricted common and preferred stock to certain employees and recognized as compensation expense the portion of the fair value that exceeded the purchase price on the issue date.
JOBS Act
We qualify as an “emerging growth company” pursuant to the provisions of the JOBS Act. For as long as we are an “emerging growth company,” we may take advantage of certain exemptions from various reporting requirements that are applicable to other public companies that are not “emerging growth companies,” including not being required to comply with the auditor attestation requirements of Section 404(b) of the Sarbanes-Oxley Act, reduced disclosure obligations regarding executive compensation in our periodic reports and proxy statements, reduced disclosure obligations relating to the presentation of financial statements in Management’s Discussion and Analysis of Financial Condition and Results of Operations, exemptions from the requirements of holding advisory “say-on-pay” votes on executive compensation and
49
stockholder advisory votes on golden parachute compensation. We have availed ourselves of the reduced reporting obligations and executive compensation disclosure in this annual report on Form 10-K, and expect to continue to avail ourselves of the reduced reporting obligations available to emerging growth companies in future filings. We could be an “emerging growth company” until the end of our 2019 fiscal year.
In addition, an emerging growth company can delay its adoption of certain accounting standards until those standards would otherwise apply to private companies. However, we are choosing to “opt out” of this extended transition period, and as a result, we plan to comply with any new or revised accounting standards on the relevant dates on which non-emerging growth companies must adopt the standards. Section 107 of the JOBS Act provides that our decision to opt out of the extended transition period for complying with new or revised accounting standards is irrevocable.
Recent Accounting Pronouncements
For a description of recent accounting pronouncements, see the “Recent Accounting Pronouncements” section in Financial Statements and Supplementary Data in Note 2 — Summary of Significant Accounting Policies of the accompanying Notes to Consolidated Financial Statements.
50
Item 7A. Quantitative and Qualitative Disclosures about Market Risk
Commodity Price Risk |
We are exposed to market risks from changes in commodity prices. During the normal course of the year, we enter into national pricing commitments for cheese and other food products that are affected by changes in commodity prices and, as a result, our franchised and Company-owned stores are subject to volatility in food costs. We also maintain relationships with multiple suppliers for certain key products, such as cheese. We do not engage in speculative transactions nor do we hold or issue financial instruments for trading purposes. In instances when we use fixed pricing agreements with our suppliers, these agreements cover our physical commodity needs, are not net-settled, and are accounted for as normal purchases.
Interest Rate Risk |
We are subject to interest rate risk on our senior secured credit facility. Interest rates on our senior secured credit facility are based on LIBOR, and under specified circumstances we may be required by our lenders to enter into interest rate swap arrangements. A hypothetical 1.0% increase or decrease in the interest rate associated with our senior secured credit facility would have resulted in a $1.0 million change to interest expense on an annualized basis.
Foreign Currency Exchange Rate Risk |
Our international franchise owners use the local currency as their functional currency. Royalty payments from our franchise owners in the Middle East are generally remitted to us in U.S. dollars, and royalty payments from our Canadian franchise owners are generally remitted to us in Canadian dollars. Because our international activities do not account for a significant portion of our revenues, we believe our exposure to foreign currency risk is minimal.
51
Item 8. Financial Statements and Supplementary Data
INDEX TO CONSOLIDATED FINANCIAL STATEMENTS
Consolidated Statements of Operations for the Fiscal Years ended January 1, 2018, January 2, 2017, and December 28, 2015 | |
Consolidated Balance Sheets as of January 1, 2018 and January 2, 2017 | |
Consolidated Statements of Shareholders’ Equity for the Fiscal Years ended January 1, 2018, January 2, 2017, and December 28, 2015 | |
Consolidated Statements of Cash Flows for the Fiscal Years ended January 1, 2018, January 2, 2017, and December 28, 2015 | |
Notes to Consolidated Financial Statements | |
Report of Independent Registered Public Accounting Firm | |
52
Papa Murphy’s Holdings, Inc. and Subsidiaries |
Consolidated Statements of Operations
Fiscal Year Ended | |||||||||||
(In thousands, except share and per share data) | January 1, 2018 | January 2, 2017 | December 28, 2015 | ||||||||
Revenues | |||||||||||
Franchise royalties | $ | 37,552 | $ | 39,851 | $ | 40,243 | |||||
Franchise and development fees | 2,220 | 2,912 | 4,222 | ||||||||
Company-owned store sales | 76,868 | 82,080 | 74,300 | ||||||||
Other | 2,021 | 2,040 | 1,444 | ||||||||
Total revenues | 118,661 | 126,883 | 120,209 | ||||||||
Costs and Expenses | |||||||||||
Store operating costs: | |||||||||||
Cost of food and packaging | 25,958 | 28,347 | 26,603 | ||||||||
Compensation and benefits | 23,603 | 23,746 | 19,858 | ||||||||
Advertising | 8,221 | 8,203 | 7,888 | ||||||||
Occupancy | 7,043 | 6,226 | 4,750 | ||||||||
Other store operating costs | 8,102 | 10,268 | 7,517 | ||||||||
Selling, general, and administrative | 33,870 | 28,108 | 28,207 | ||||||||
Depreciation and amortization | 10,452 | 12,236 | 10,002 | ||||||||
Loss (gain) on disposal or impairment of property and equipment | 15,680 | 101 | (251 | ) | |||||||
Total costs and expenses | 132,929 | 117,235 | 104,574 | ||||||||
Operating (Loss) Income | (14,268 | ) | 9,648 | 15,635 | |||||||
Interest expense, net | 5,078 | 4,868 | 4,523 | ||||||||
Loss on impairment of investments | — | — | 4,500 | ||||||||
Other expense, net | 204 | 188 | 133 | ||||||||
(Loss) Income Before Income Taxes | (19,550 | ) | 4,592 | 6,479 | |||||||
(Benefit from) provision for income taxes | (19,543 | ) | 1,943 | 2,068 | |||||||
Net (Loss) Income | (7 | ) | 2,649 | 4,411 | |||||||
Net loss attributable to noncontrolling interests | — | — | 500 | ||||||||
Net (Loss) Income Attributable to Papa Murphy’s | $ | (7 | ) | $ | 2,649 | $ | 4,911 | ||||
Earnings per share of common stock | |||||||||||
Basic | $ | — | $ | 0.16 | $ | 0.29 | |||||
Diluted | $ | — | $ | 0.16 | $ | 0.29 | |||||
Weighted average common stock outstanding | |||||||||||
Basic | 16,870,013 | 16,743,285 | 16,653,127 | ||||||||
Diluted | 16,870,013 | 16,773,493 | 16,870,693 | ||||||||
See accompanying notes.
53
Papa Murphy’s Holdings, Inc. and Subsidiaries |
Consolidated Balance Sheets
(In thousands, except par value and share data) | January 1, 2018 | January 2, 2017 | |||||
ASSETS | |||||||
Current Assets | |||||||
Cash and cash equivalents | $ | 2,174 | $ | 2,069 | |||
Accounts receivable, net | 3,788 | 5,330 | |||||
Current portion of notes receivable | 97 | 92 | |||||
Inventories | 719 | 917 | |||||
Prepaid expenses and other current assets | 2,574 | 4,708 | |||||
Total current assets | 9,352 | 13,116 | |||||
Property and equipment, net | 10,064 | 28,516 | |||||
Notes receivable, net of current portion | — | 57 | |||||
Goodwill | 107,751 | 108,470 | |||||
Trade name and trademarks | 87,002 | 87,002 | |||||
Definite-life intangibles, net | 31,655 | 36,313 | |||||
Other assets | 350 | 398 | |||||
Total assets | $ | 246,174 | $ | 273,872 | |||
LIABILITIES AND EQUITY | |||||||
Current Liabilities | |||||||
Accounts payable | $ | 5,389 | $ | 6,160 | |||
Accrued expenses and other current liabilities | 13,139 | 7,503 | |||||
Current portion of unearned franchise and development fees | 918 | 1,358 | |||||
Current portion of long-term debt | 8,400 | 7,879 | |||||
Total current liabilities | 27,846 | 22,900 | |||||
Long-term debt, net of current portion | 86,994 | 100,965 | |||||
Unearned franchise and development fees, net of current portion | 784 | 410 | |||||
Deferred tax liability, net | 24,457 | 44,179 | |||||
Other liabilities | 3,922 | 3,922 | |||||
Total liabilities | 144,003 | 172,376 | |||||
Commitments and contingencies (Note 15) | |||||||
Equity | |||||||
Preferred stock ($0.01 par value; 15,000,000 shares authorized; no shares issued or outstanding) | — | — | |||||
Common stock ($0.01 par value; 200,000,000 shares authorized; 16,971,461 and 16,955,970 shares issued and outstanding, respectively) | 170 | 170 | |||||
Additional paid-in capital | 120,614 | 119,932 | |||||
Accumulated deficit | (18,613 | ) | (18,606 | ) | |||
Total equity | 102,171 | 101,496 | |||||
Total liabilities and equity | $ | 246,174 | $ | 273,872 | |||
See accompanying notes.
54
Papa Murphy’s Holdings, Inc. and Subsidiaries |
Consolidated Statements of Shareholders’ Equity
Common Stock | Additional Paid-In Capital | Stock Subscription Receivable | Accumulated Deficit | Total Papa Murphy’s Holdings, Inc. Shareholders’ Equity | Non-Controlling Interests | Total Equity | ||||||||||||||||||||||||
(In thousands) | Shares | Amount | ||||||||||||||||||||||||||||
BALANCE, December 29, 2014 | 16,944 | $ | 169 | $ | 117,354 | $ | (100 | ) | $ | (26,125 | ) | $ | 91,298 | $ | 444 | $ | 91,742 | |||||||||||||
Common stock issued | 42 | — | 376 | — | — | 376 | — | 376 | ||||||||||||||||||||||
Common stock repurchases | (36 | ) | — | (10 | ) | — | — | (10 | ) | — | (10 | ) | ||||||||||||||||||
Stock based compensation expense | — | — | 1,081 | — | — | 1,081 | — | 1,081 | ||||||||||||||||||||||
Noncontrolling interest transactions | — | — | — | — | — | — | 56 | 56 | ||||||||||||||||||||||
Net income | — | — | — | — | 4,911 | 4,911 | (500 | ) | 4,411 | |||||||||||||||||||||
BALANCE, December 28, 2015 | 16,950 | $ | 169 | $ | 118,801 | $ | (100 | ) | $ | (21,214 | ) | $ | 97,656 | $ | — | $ | 97,656 | |||||||||||||
Cumulative effect adjustment | — | — | 41 | — | (41 | ) | — | — | — | |||||||||||||||||||||
Common stock issued | 45 | 1 | 292 | — | — | 293 | — | 293 | ||||||||||||||||||||||
Common stock repurchases | (38 | ) | — | (84 | ) | — | — | (84 | ) | — | (84 | ) | ||||||||||||||||||
Stock based compensation expense | — | — | 882 | — | — | 882 | — | 882 | ||||||||||||||||||||||
Repayment of note receivable issued to fund the purchase of stock | — | — | — | 100 | — | 100 | — | 100 | ||||||||||||||||||||||
Net income | — | — | — | — | 2,649 | 2,649 | — | 2,649 | ||||||||||||||||||||||
BALANCE, January 2, 2017 | 16,956 | $ | 170 | $ | 119,932 | $ | — | $ | (18,606 | ) | $ | 101,496 | $ | — | $ | 101,496 | ||||||||||||||
Common stock issued | 35 | — | — | — | — | — | — | — | ||||||||||||||||||||||
Common stock repurchases | (20 | ) | — | (5 | ) | — | — | (5 | ) | — | (5 | ) | ||||||||||||||||||
Stock based compensation expense | — | — | 687 | — | — | 687 | — | 687 | ||||||||||||||||||||||
Net loss | — | — | — | — | (7 | ) | (7 | ) | — | (7 | ) | |||||||||||||||||||
BALANCE, January 1, 2018 | 16,971 | $ | 170 | $ | 120,614 | $ | — | $ | (18,613 | ) | $ | 102,171 | $ | — | $ | 102,171 | ||||||||||||||
See accompanying notes.
55
Papa Murphy’s Holdings, Inc. and Subsidiaries |
Consolidated Statements of Cash Flows
Fiscal Year Ended | |||||||||||
(In thousands) | January 1, 2018 | January 2, 2017 | December 28, 2015 | ||||||||
Operating Activities | |||||||||||
Net (Loss) Income | $ | (7 | ) | $ | 2,649 | $ | 4,411 | ||||
Net loss attributable to noncontrolling interests | — | — | 500 | ||||||||
Net (Loss) Income Attributable to Papa Murphy’s | (7 | ) | 2,649 | 4,911 | |||||||
Adjustments to reconcile to cash from operating activities | |||||||||||
Depreciation and amortization | 10,452 | 12,236 | 10,002 | ||||||||
Loss (gain) on disposal or impairment of property and equipment | 15,680 | 101 | (251 | ) | |||||||
Deferred taxes | (19,722 | ) | 1,724 | 1,707 | |||||||
Stock-based compensation | 687 | 898 | 1,081 | ||||||||
Loss on impairment of cost-method investment | — | — | 4,000 | ||||||||
Other non-cash items | 422 | 329 | 646 | ||||||||
Change in operating assets and liabilities | |||||||||||
Accounts receivable | 1,540 | (522 | ) | 641 | |||||||
Prepaid expenses and other assets | 1,352 | 2,197 | (1,988 | ) | |||||||
Unearned franchise and development fees | (66 | ) | (567 | ) | (1,213 | ) | |||||
Accounts payable | (783 | ) | (1,103 | ) | 3,628 | ||||||
Accrued expenses and other liabilities | 5,982 | (1,138 | ) | 579 | |||||||
Net cash provided by operating activities | 15,537 | 16,804 | 23,743 | ||||||||
Investing Activities | |||||||||||
Acquisition of property and equipment | (3,987 | ) | (18,010 | ) | (10,430 | ) | |||||
Acquisition of stores, less cash acquired | — | (2,562 | ) | (9,691 | ) | ||||||
Proceeds from sale of stores | 2,288 | 1,110 | 1,250 | ||||||||
Issuance of notes receivable | — | — | (250 | ) | |||||||
Payments received on notes receivable | 51 | 72 | 67 | ||||||||
Investment in cost-method investee | — | — | (500 | ) | |||||||
Net cash used in investing activities | (1,648 | ) | (19,390 | ) | (19,554 | ) | |||||
Financing Activities | |||||||||||
Payments on long-term debt | (12,979 | ) | (3,321 | ) | (2,800 | ) | |||||
Advances on revolver | 14,900 | 16,800 | 5,900 | ||||||||
Payments on revolver | (15,700 | ) | (16,000 | ) | (5,900 | ) | |||||
Repurchases of common stock | (5 | ) | (84 | ) | (10 | ) | |||||
Proceeds from exercise of stock options | — | 293 | 376 | ||||||||
Payments received on subscription receivables | — | 100 | — | ||||||||
Investment by noncontrolling interest holders | — | — | 56 | ||||||||
Net cash used in financing activities | (13,784 | ) | (2,212 | ) | (2,378 | ) | |||||
Net change in cash and cash equivalents | 105 | (4,798 | ) | 1,811 | |||||||
Cash and Cash Equivalents, beginning of year | 2,069 | 6,867 | 5,056 | ||||||||
Cash and Cash Equivalents, end of period | $ | 2,174 | $ | 2,069 | $ | 6,867 | |||||
Supplemental Disclosures of Cash Flow Information | |||||||||||
Cash paid during the period for interest | $ | 4,835 | $ | 4,894 | $ | 3,624 | |||||
Cash (received) paid during the period for income taxes | $ | (185 | ) | $ | 169 | $ | 3,078 | ||||
Noncash Supplemental Disclosures of Investing Activities | |||||||||||
Net change in property and equipment in accounts payable | $ | (154 | ) | $ | 607 | $ | 3,098 | ||||
See accompanying notes.
56
Papa Murphy’s Holdings, Inc. and Subsidiaries |
Notes to Consolidated Financial Statements
Note 1 | Description of Business | |
Note 2 | Summary of Significant Accounting Policies | |
Note 3 | Acquisitions | |
Note 4 | Prepaid Expenses and Other Current Assets | |
Note 5 | Property and Equipment | |
Note 6 | Divestitures | |
Note 7 | Goodwill | |
Note 8 | Intangible Assets | |
Note 9 | Financing Arrangements | |
Note 10 | Fair Value Measurement | |
Note 11 | Accrued and Other Liabilities | |
Note 12 | Income Taxes | |
Note 13 | Share-based Compensation | |
Note 14 | Earnings per Share (EPS) | |
Note 15 | Commitments and Contingencies | |
Note 16 | Retirement Plans | |
Note 17 | Advertising Fund | |
Note 18 | Segment Information | |
Note 19 | Selected Quarterly Financial Data (unaudited) | |
57
Note 1 — Description of Business |
Papa Murphy’s Holdings, Inc. (“Papa Murphy’s” or the “Company”), together with its subsidiaries, is a franchisor and operator of a Take ‘N’ Bake pizza chain. The Company franchises the right to operate Take ‘N’ Bake pizza franchises and operates Take ‘N’ Bake pizza stores owned by the Company. As of January 1, 2018, the Company had 1,523 stores consisting of 1,483 domestic stores (1,338 franchised stores and 145 Company-owned stores) across 39 states, plus 40 franchised stores in Canada and the United Arab Emirates.
Substantially all revenues are derived from retail sales of pizza and other food and beverage products to the general public by Company-owned stores and the collection of franchise royalties and fees associated with franchise and development rights.
Note 2 — Summary of Significant Accounting Policies |
Principles of consolidation and basis of presentation
These consolidated financial statements have been prepared in accordance with generally accepted accounting principles in the United States (“GAAP”) and include the accounts of Papa Murphy’s Holdings, Inc., its subsidiaries, and certain entities which the Company consolidates as variable interest entities (“VIEs”). The Company reports noncontrolling interests in consolidated entities as a component of equity separate from shareholders’ equity. All significant intercompany transactions and balances have been eliminated.
The Company participates in various advertising cooperatives with its franchise owners established to collect and administer funds contributed for use in advertising and promotional programs in a specific market designed to increase sales and promote the Papa Murphy’s brand. Contributions to the advertising cooperatives are required for both Company-owned and franchised stores and are generally based on a percentage of a store’s sales. The Company maintains certain variable interests in these cooperatives. As the cooperatives are required to spend all funds collected on advertising and promotional programs, total equity at risk is not sufficient to permit the cooperatives to finance their activities without additional subordinated financial support. Therefore, these cooperatives are VIEs. As a result of the Company’s voting rights exercised through Company-owned stores, the Company consolidates certain of these cooperatives for which it is the primary beneficiary. Advertising cooperative assets, consisting primarily of cash and receivables, can only be used to settle the obligations of the respective cooperative. Advertising cooperative liabilities represent the corresponding obligation arising from the receipt of the contributions to purchase advertising and promotional programs for which creditors do not have recourse to the general credit of a primary beneficiary. Therefore, the Company reports all assets and liabilities of the advertising cooperatives that it consolidates as prepaid expenses and other current assets and accrued expenses and other current liabilities, respectively, in the Consolidated Balance Sheets. Because the contributions to these advertising and marketing cooperatives are specifically designated and segregated for advertising, the Company does not reflect franchise owner contributions to these cooperatives in its Consolidated Statements of Operations or Consolidated Statements of Cash Flows.
Fiscal year
The Company uses a 52- or 53-week fiscal year, ending on the Monday nearest to December 31. Fiscal year 2017 was a 52-week year, fiscal year 2016 was a 53-week year, and fiscal year 2015 was a 52-week year. All references to years relate to fiscal periods rather than calendar periods. References to fiscal 2017, 2016, and 2015 are references to fiscal years ended January 1, 2018, January 2, 2017, and December 28, 2015, respectively.
Use of estimates
Preparing financial statements in conformity with GAAP requires management to make estimates and assumptions that affect the amounts reported in the Company’s consolidated financial statements and accompanying notes. Significant items that are subject to such estimates and assumptions include the estimation of the fair value of acquired assets and liabilities, including fixed assets, goodwill, and intangible assets and the related subsequent impairment analysis, fair value of stock based compensation, asset retirement obligations, lease guarantees, and deferred tax asset valuation allowance. Although management bases its estimates on historical experience and assumptions that are believed to be reasonable under the circumstances, actual results may differ from those estimates.
58
Cash and cash equivalents
The Company considers all highly liquid investments with original maturities of three months or less when purchased to be cash equivalents. The Company maintains cash and cash equivalent balances with financial institutions that periodically exceed federally insured limits. The Company also holds limited funds, to the extent necessary, on deposit outside the United States. The Company makes such deposits with entities it believes are of high credit quality and has not incurred any losses related to these balances. Management believes its credit risk to be minimal.
All credit card, debit card, and electronic benefits transfer transactions that process in less than seven days are classified as cash and cash equivalents. The amounts due from banks for these transactions classified as cash and cash equivalents totaled $1.0 million as of the end of each of fiscal 2017 and 2016.
Accounts receivable
Accounts receivable consist primarily of (a) amounts due from franchise owners for continuing fees that are collected weekly, (b) receivables for vendor rebates and (c) other miscellaneous receivables. Accounts receivable are stated net of an allowance for doubtful accounts determined by management through an evaluation of specific accounts, considering historical losses and existing economic conditions where relevant. Allowance for doubtful accounts amounted to $67,000 and $37,000 as of the end of fiscal 2017 and 2016, respectively.
Notes receivable
Notes receivable consist primarily of amounts due from sales of Company-owned stores. Management reviews the notes receivable on a periodic basis and evaluates the creditworthiness and financial condition of the counterparty to determine the appropriate allowance, if any. If the store owner does not repay the note, the Company has the contractual right to take back ownership of the store based on the underlying franchise agreement, which therefore minimizes the credit risk to the Company.
Inventories
Inventories consist principally of food products and packaging supplies for use in Company-owned stores. Inventories are valued at the lower of cost, determined under the first-in, first-out method or net realizable value.
Property and equipment
Property and equipment are recorded at cost. Property and equipment are depreciated using the straight-line method over the estimated useful lives of the assets. Leasehold improvements are amortized using the straight-line method over the shorter of the useful lives of the assets or the related lease term, including renewal options to the extent renewals are reasonably assured, not to exceed 10 years.
The estimated useful lives for property and equipment are:
Property and Equipment | Estimated Useful Life |
Leasehold improvements | Shorter of lease term or estimated useful life, not to exceed 10 years |
Restaurant equipment and fixtures | 5 to 7 years |
Office furniture and equipment | 3 to 7 years |
Software | 3 to 5 years |
Vehicles | 5 years |
Deferred financing costs
Costs incurred to obtain long-term financing are accounted for as a deferred charge and amortized to interest expense over the terms of the respective debt agreements using the effective interest method. Unamortized deferred charges are recorded as a reduction from the carrying amount of the related debt liability in the Company’s Consolidated Balance Sheets.
Goodwill and other intangible assets
Goodwill arises from business combinations and represents the excess of the purchase consideration transferred over the fair value of the net assets acquired, including identifiable intangible assets and liabilities assumed. The majority of the
59
Company’s goodwill was generated in May 2010 when affiliates of Lee Equity Partners, LLC (“Lee Equity”) acquired all of the equity interests of PMI Holdings, Inc. (“Lee Equity Acquisition”), though the Company has also recognized goodwill upon the acquisition of stores from franchise owners. Goodwill is assigned to reporting units for purposes of impairment testing.
The Company considers its trade name and trademarks to be indefinite-lived intangible assets. These assets were initially recognized in May 2010 upon the Lee Equity Acquisition. The Company’s intangible assets that are not indefinite-lived include franchise relationships and reacquired franchise rights.
Goodwill and intangible assets determined to have an indefinite life are not amortized, but are tested for impairment annually, or more often if an event occurs or circumstances change that indicate an impairment might exist. Management evaluates indefinite-lived assets each reporting period to determine whether events and circumstances continue to support an indefinite useful life. Intangible assets with finite lives are amortized over their estimated useful lives on a straight-line basis and tested for impairment together with long-lived assets.
In performing its annual goodwill impairment test, the Company first assesses qualitative factors to determine whether the existence of events or circumstances leads to a determination that it is not “more likely than not” that the fair value of a reporting unit is less than its carrying amount. If the Company determines that it is more likely than not, it performs the two-step quantitative goodwill impairment test. Under the two-step quantitative goodwill impairment test, the fair value of the reporting unit is compared to its respective carrying amount, including goodwill. If the fair value exceeds the carrying amount, then no impairment exists. If the carrying amount exceeds the fair value, further analysis is performed to determine the amount of the impairment. Both the qualitative and quantitative assessments are completed separately with respect to the goodwill of each of the Company’s reporting units. The Company reviews goodwill for impairment annually, as of the first day of our fourth fiscal quarter, or more frequently if indicators of impairment exist. The Company can bypass the qualitative assessment and move directly to the quantitative assessment for any reporting unit in any period and can elect to resume performing the qualitative assessment in any subsequent period.
Most of the Company’s goodwill is attributed to and tested for impairment at the Domestic Franchise segment, which is considered one reporting unit, as the segment does not have any components of a business for which discrete financial information is available and is regularly reviewed by segment management.
In performing its annual impairment test for indefinite-lived intangible assets, the Company first assesses qualitatively whether it is more likely than not that the indefinite-lived intangible asset is impaired, thus necessitating a quantitative impairment test. The Company does not calculate the fair value of an indefinite-lived asset and perform the quantitative test unless it determines that it is more likely than not that the asset is impaired. The Company reviews indefinite-lived intangible assets for impairment annually, as of the first day of its fourth fiscal quarter, or more frequently if indicators of impairment exist. The Company can bypass the qualitative assessment and move directly to the quantitative assessment for any indefinite-lived intangible asset in any period and can elect to resume performing the qualitative assessment in any subsequent period.
Impairment of long-lived assets
Long-lived assets are evaluated for recoverability of the carrying amount whenever events and circumstances indicate the carrying amount of an asset may not be fully recoverable. Some of the events or changes in circumstances that would trigger an impairment review include, but are not limited to, significant under-performance relative to expected and/or historical results (such as two years of comparable store sales decrease or two years of negative operating cash flows), significant negative industry or economic trends, or knowledge of transactions involving the sale of similar property at amounts below the carrying value.
Assets are grouped for recognition and measurement of impairment at the lowest level for which identifiable cash flows are largely independent of the cash flows of other assets. Typically, long-lived assets relating to Company-owned stores are tested for impairment at the level of the retail market in which they are located and long-lived assets relating to franchised operations are tested for impairment at each segment level. If the carrying amount of an asset group exceeds the estimated undiscounted future cash flows expected to be generated by the asset, then an impairment charge is recognized to the extent the carrying amount exceeds the asset group’s fair value. In determining fair value, management considers current results, trends, future prospects, and other economic factors.
Assets held for sale
Assets are classified as held for sale when management with the appropriate authority commits to a plan to sell the assets, the assets are available for immediate sale, the assets are actively marketed at a reasonable price, the sale is probable within a year, and certain other criteria are met. Assets held for sale consist primarily of Company-owned stores where the Company has committed to a plan to sell specific stores. Assets designated as held for sale are held at the lower of the net
60
book value or fair value less costs to sell and reported in Prepaid expenses and other current assets on the Consolidated Balance Sheets (see Note 4 — Prepaid Expenses and Other Current Assets). Depreciation is not charged against property and equipment classified as assets held for sale.
Asset retirement obligations (“AROs”)
AROs are primarily associated with leasehold improvements which, at the end of a lease, the Company is obligated to remove in order to comply with certain lease agreements. At the inception of a lease with such conditions, the Company records an ARO and a corresponding capital asset in an amount equal to the estimated fair value of the obligation. Fair value is estimated based on a number of assumptions requiring management’s judgment, including store closing costs, cost inflation rates, and discount rates in effect at the time the lease is signed. Over time, the obligation is accreted to its projected future value and, upon satisfaction of the ARO conditions, any difference between the recorded liability and the actual retirement costs incurred is recognized as an operating gain or loss in the Consolidated Statements of Operations. The Company had AROs outstanding of $1.6 million and $1.8 million as of the end of fiscal 2017 and 2016, respectively, as a component of other liabilities.
Revenue recognition
Company-owned store sales are recognized when products are provided to customers. Franchise royalties are based on a percentage of sales and are recognized as the fees are earned and become receivable from the franchise owner.
Franchise fees are recognized as revenue when all material services or conditions relating to a store have been substantially performed or satisfied by the Company, which is typically when a new franchised store begins operations or on the commencement date of the successive franchise agreement. Development fees for the right to develop stores in specific geographic areas are recognized as revenue when all material services or conditions relating to the sale have been substantially performed, which is typically when the first franchised store begins operations in the development area. Development fees determined based on the number of stores to open in an area are deferred and recognized on a pro rata basis after individual franchise agreements are executed for the stores subject to the development agreements and the stores begin operations.
Consideration for franchise and development fees received in advance of being earned are included as unearned franchise and development fees in the Company’s Consolidated Balance Sheets. For fees paid on an installment basis that have otherwise been earned, recognition of revenue is deferred until collectability is certain.
Other revenues consist primarily of (a) software license revenue from the resale of point-of-sale (“POS”) software licenses to franchise owners at cost; (b) transaction fees from the Company’s online ordering platform; (c) customer support services provided to franchisees; and (d) lease income recognized in the period earned, which generally coincides with the period the expense is due to the master leaseholder, if a sublease.
The Company operates a system-wide gift card program and recognizes revenue from gift cards when a gift card is redeemed in a Company-owned store. When the likelihood of a gift card being redeemed by a customer is determined to be remote (“gift card breakage”), the value of the unredeemed gift card is recognized by the Company as a contribution to the advertising fund described under Advertising and marketing costs below. The Company determines the gift card breakage rate based upon Company-specific historical redemption patterns.
Software revenue recognition
Periodically, the Company acquires POS software licenses in a lump sum purchase. The Company recognizes revenues for the resale of software licenses upon delivery to franchise owners to the extent collectability is probable.
Advertising and marketing costs
Advertising costs, including contributions to local advertising cooperatives which are based on a percentage of sales, are expensed when incurred except for media development costs which are expensed when the advertisement is first aired. These costs are included in store operating costs or selling, general, and administrative expenses based on the nature of the advertising and marketing costs incurred.
Franchised and Company-owned stores in the United States contribute to an advertising fund that the Company manages on behalf of these stores. In addition, certain suppliers contribute to the advertising fund. Under our franchise agreements and other agreements, contributions received by the advertising fund must be spent on marketing, creative efforts, media support, or other related purposes specified in the agreements and result in no profit recognized. Contributions to the advertising fund are netted against the related expense. Expenditures of the advertising fund are primarily amounts paid to
61
third-parties, but may also include personnel expenses and allocated costs. At each reporting date, to the extent contributions to the advertising fund exceed expenditures on a cumulative basis, the excess contributions are accounted for as a deferred liability and are recorded in accrued expenses in the Company’s Consolidated Balance Sheets. However, if expenditures exceed contributions on a cumulative basis, the excess is recorded as an expense within selling, general, and administrative expenses. In subsequent periods, previously recognized expenses may be recovered if subsequent contributions exceed expenditures. Excess (recovered) advertising expense included in selling, general, and administrative, net of contributions, was $4.4 million, $0.4 million and $1.7 million for fiscal 2017, 2016, and 2015, respectively.
As of the end of fiscal 2017, previously recognized expenses of $6.0 million may be recovered in future periods if subsequent advertising fund contributions exceed expenditures.
Store pre-opening costs
Pre-opening costs, including wages, benefits, and travel for the training and opening teams, cost of food and packaging, and other store operating costs are expensed as incurred prior to a store opening for business.
Rent expense
Rent expense for the Company’s leases, which generally have escalating rental payments over the term of the lease, is recorded on a straight-line basis over the lease term. The lease term includes renewal options that are reasonably expected to be exercised and begins when the Company has control and possession of the leased property, which is typically before rental payments are due under the lease. The difference between the rent expense and rent paid is recorded as deferred rent as a component of accrued expenses. Tenant allowances are recorded in deferred rent and amortized as reductions of rent expense over the lease term. Rent expense is included in store occupancy costs or selling, general, and administrative expenses, based on the nature of the leased facility.
When a store is closed before the end of its lease, the Company accrues a loss provision for lease termination costs based on the net present value of the contractual, minimum rent obligations reduced by sublease rental income that could be reasonably obtained from the property using a credit-adjusted, risk-free interest rate at the time of closure. Certain other related costs are also included in the provision for lease losses. The Company’s provision for lease losses from closed stores was $0.7 million as of the end of fiscal 2017. The initial charge and any subsequent adjustment to the accrual are included in store occupancy costs.
Lease guarantees
On occasion, the Company becomes a guarantor for certain operating leases when it sells a Company-owned store or a store under construction by the Company. The guarantee obligation is initially measured as the fair value of the guarantee, which is recorded as a liability. The Company recognizes its release from risk as a guarantor as the lease obligation is settled over the remaining lease term. In addition, throughout the guarantee period, the Company records a reserve when any loss becomes probable in connection with such lease guarantee. As of the end of fiscal 2017 and 2016, the Company’s liability in connection with the unamortized value of these lease guarantees was $69,000 and $55,000, respectively, and no additional liability has been recorded in connection with a probable loss from these guarantees.
Income taxes
The Company accounts for income taxes using the asset and liability approach. This requires the recognition of deferred tax assets and liabilities for the expected future tax consequences of temporary differences between the financial statement and the tax basis of assets and liabilities at the applicable tax rates. A valuation allowance is recorded against deferred tax assets if, based on available evidence, it is more likely than not that some or all of the deferred tax assets will not be realized.
The effect of uncertain tax positions would be recorded in the consolidated financial statements only after determining a more likely than not probability that the uncertain tax positions would withstand an examination by tax authorities based on the technical merits of the position. The tax benefit to be recognized is measured as the largest amount of benefit that is greater than fifty percent likely of being realized upon ultimate settlement. As facts and circumstances change, management reassesses these probabilities and would record any changes in the financial statements as appropriate.
As of the end of fiscal 2017 and 2016, the Company has recorded reserves for uncertain tax positions totaling $77,000 and $72,000, respectively.
62
Share-based compensation
The Company awards equity compensation under the Company’s 2010 Amended Management Incentive Plan (“2010 Plan”) and 2014 Management Incentive Plan (“2014 Plan”), consisting of stock option and restricted stock awards. Restricted stock and stock option awards typically vest based on the achievement of a time-vesting or a market condition. Compensation expense relating to restricted stock with time-vesting conditions is recognized for the portion of the grant date fair value that exceeds any purchase price paid for the stock. This expense is recognized over the requisite service period, typically the vesting period, utilizing the straight-line attribution method.
The fair value of time-vesting stock option awards is estimated on the grant date using a Black-Scholes-Merton option-pricing model. Compensation expense relating to stock option awards is recognized for the grant date fair value. The fair value of stock options that contain a market condition is estimated on the grant date using a Monte Carlo valuation method, which utilizes multiple input variables to determine the probability of the Company achieving the market condition and the fair value of the award. The risk-free interest rate is based on the estimated effective life and is estimated based on U.S. Treasury Yield Curve rates. Since the Company has limited relevant option exercise experience, the expected term is based on a simplified method calculation and the expected volatility is based on the historical volatility of the share price of a group of peer companies. Compensation expense relating to stock option awards is recognized for the grant date fair value. This expense is recognized over the requisite service period, typically the vesting period, utilizing the straight-line attribution method.
Business Combinations
The Company accounts for business combinations under the acquisition method of accounting, recording any assets acquired and liabilities assumed based upon their respective fair values. Any excess of the fair value of purchase consideration over the fair value of the assets acquired less liabilities assumed is recorded as goodwill. The Company uses management estimates based on historically similar transactions to assist in establishing the acquisition date fair values of assets acquired, liabilities assumed, and contingent consideration granted, if any. These estimates and valuations require the Company to make significant assumptions, including projections of future events and operating performance.
Internal use software
Expenditures for major software purchases and software developed for internal use are capitalized and amortized over the useful life of the software (three to five years) on a straight-line basis. The Company’s policy provides for the capitalization of external direct costs of materials and services associated with developing or obtaining internal-use computer software. Costs associated with preliminary project stage activities, training, maintenance, and all other post-implementation stage activities are expensed as incurred.
Reclassification
Certain amounts in the prior period financial statements have been reclassified to conform to the current period presentation. These reclassifications had no effect on the Company’s consolidated financial position, shareholders’ equity or net cash flows for any of the periods presented.
Recent accounting pronouncements
In May 2014, the Financial Accounting Standards Board (“FASB”) issued ASU No. 2014-09, Revenue from Contracts with Customers (Topic 606) (“ASU 2014-09”), a new standard to achieve a consistent application of revenue recognition within the U.S., resulting in a single revenue model to be applied by reporting companies under GAAP. The original effective date for ASU 2014-09 would have required adoption by the Company in the first quarter of fiscal 2017 with early adoption prohibited. In August 2015, the FASB issued ASU No. 2015-14, Revenue from Contracts with Customers (Topic 606) - Deferral of the Effective Date (“ASU 2015-14”), which defers the effective date of ASU 2014-09 for one year and permits early adoption in accordance with the original effective date of ASU 2014-09.
The new revenue standard is required to be applied retrospectively to each prior reporting period presented or retrospectively with the cumulative effect of initially applying the standard recognized at the date of initial application. The Company anticipates adopting the standard in the first quarter of fiscal 2018 using the full retrospective method to restate each prior reporting period presented.
The Company anticipates this standard will have a material impact on its consolidated financial statements. The most significant impacts will relate to its: (i) accounting for franchise and development fees, and (ii) accounting for its advertising funds. The Company expects revenue related to its franchise royalties, which are based on a percentage of franchise sales,
63
and revenue from Company-owned restaurants to remain substantially unchanged. Specifically, under the new standard the Company expects to recognize franchise fees ratably over the life of the contract rather than at the time the store is opened or a successive contract commences. In addition, the Company expects to account for advertising fund revenues on a gross basis, instead of net, as the Company is the principal that determines how the funds collected will be spent. The Company is adopting this standard using the full retrospective method and will apply the standard to each prior reporting period. In preparation for adoption of the standard, the Company implemented internal controls and key system functionality to enable the preparation of financial information.
The Company estimates that adoption of this standard will result in the recognition of additional revenue of $29.8 million and $24.3 million for fiscal 2017 and 2016, respectively, and an increase in selling, general and administrative expenses of $30.7 million and $25.9 million, respectively. In addition, the Company estimates that adoption of the standard will result in an increase in unearned franchise and development fees of $9.9 million and $10.6 million as of January 1, 2018, and January 2, 2017, respectively. See Expected Impacts to Reported Results below for the estimated impact of adoption of this standard on our consolidated financial statements.
In February 2016, the FASB issued ASU 2016-02, Leases (“ASU 2016-02”). This update requires that lessees recognize assets and liabilities on the balance sheet for the rights and obligations created by all leases with terms of more than 12 months. ASU 2016-02 also will require disclosures designed to give financial statement users information on the amount, timing, and uncertainty of cash flows arising from leases. These disclosures include both qualitative and quantitative information. The effective date for ASU 2016-02 is for fiscal years, and interim periods within those fiscal years, beginning after December 15, 2018, with earlier adoption permitted. The Company elected to early adopt the standard effective January 2, 2018, concurrent with our adoption of the new revenue recognition standard. The Company is adopting this standard using the modified retrospective approach and is electing the available practical expedients on adoption. In preparation for adoption of the standard, the Company implemented internal controls and key system functionality to enable the preparation of financial information in accordance with the standard.
This standard will have a material impact on the Company’s Consolidated Balance Sheets. The most significant impact will be the recognition of right of use assets and lease liabilities for operating leases. The Company estimates that adoption of this standard will result in recognition of additional right of use assets of $16.2 million and additional lease liabilities of $20.0 million as of the end of fiscal 2017 for operating leases. In addition, the Company estimates that it will dispose of $2.5 million in other current and long term liabilities as of the end of fiscal 2017 for operating leases. The Company estimates that this standard will not have a material impact on the Company’s Consolidated Statements of Operations for fiscal 2017 and 2016, except for the impairment of right of use assets in fiscal 2017 in connection with the Company’s impairment of fixed assets (see Note 5 — Property and Equipment).
In August 2016, the FASB issued ASU No. 2016-15, Statement of Cash Flows (Topic 320) (“ASU 2016-15”). This update clarifies the presentation of certain cash receipts and cash payments in the statement of cash flows. The effective date for ASU 2016-15 is for fiscal years, and interim periods within those fiscal years, beginning after December 15, 2017, with early adoption permitted. The Company is still evaluating the impact of ASU 2016-15 on its Consolidated Statements of Cash Flows.
In January 2017, the FASB issued ASU No. 2017-04, Intangibles-Goodwill and Other: Simplifying the Test for Goodwill Impairment (“ASU 2017-04”). The new standard simplifies how an entity measures goodwill impairment by removing the second step of the two-step quantitative goodwill impairment test. An entity will no longer perform a hypothetical purchase price allocation to measure goodwill impairment. Instead, impairment will be measured at the amount by which the carrying value exceeds the fair value of a reporting unit; however, the loss recognized should not exceed the total amount of goodwill allocated to that reporting unit. An entity still has the option to perform a qualitative assessment of whether it is more-likely-than-not that a reporting unit’s fair value is less than its carrying amount. ASU 2017-04 requires prospective adoption and is effective for the annual or any interim goodwill impairment tests in fiscal years beginning after December 15, 2019, with early adoption permitted. The Company is still evaluating the impact of ASU 2017-04 on its financial position and results of operations.
64
Expected Impacts to Reported Results
Adoption of the standard related to revenue recognition is expected to impact our reported results as follows:
Fiscal 2017 Income Statement | |||||||||
(in thousands, except earnings per share) | As Reported | New Revenue Standard Adjustment | As Adjusted | ||||||
Total revenues | $ | 118,661 | $ | 29,847 | $ | 148,508 | |||
Store advertising and other costs | 16,323 | (1,570 | ) | 14,753 | |||||
Selling, general, and administrative | 33,870 | 30,738 | 64,608 | ||||||
Benefit from income taxes | (19,543 | ) | 168 | (19,375 | ) | ||||
Net (Loss) Income | (7 | ) | 511 | 504 | |||||
Diluted earnings per share | 0.00 | 0.03 | 0.03 | ||||||
Fiscal 2016 Income Statement | |||||||||
(in thousands, except earnings per share) | As Reported | New Revenue Standard Adjustment | As Adjusted | ||||||
Total revenues | $ | 126,883 | $ | 24,290 | $ | 151,173 | |||
Store advertising and other costs | 18,471 | (1,672 | ) | 16,799 | |||||
Selling, general, and administrative | 28,108 | 25,937 | 54,045 | ||||||
Provision for income taxes | 1,943 | 9 | 1,952 | ||||||
Net income | 2,649 | 16 | 2,665 | ||||||
Diluted earnings per share | 0.16 | 0.00 | 0.16 | ||||||
Balance Sheet as of January 1, 2018 | |||||||||
(in thousands) | As Reported | New Revenue Standard Adjustment | As Adjusted | ||||||
Unearned franchise and development fees | $ | 1,702 | $ | 9,899 | $ | 11,601 | |||
Accrued expenses and other current liabilities | 13,139 | (507 | ) | 12,632 | |||||
Deferred tax liability, net | 24,457 | (3,567 | ) | 20,890 | |||||
Accumulated deficit | (18,613 | ) | (5,825 | ) | (24,438 | ) | |||
Balance Sheet as of January 2, 2017 | |||||||||
(in thousands) | As Reported | New Revenue Standard Adjustment | As Adjusted | ||||||
Unearned franchise and development fees | $ | 1,768 | $ | 10,586 | $ | 12,354 | |||
Accrued expenses and other current liabilities | 7,503 | (516 | ) | 6,987 | |||||
Deferred tax liability, net | 44,179 | (3,734 | ) | 40,445 | |||||
Accumulated deficit | (18,606 | ) | (6,336 | ) | (24,942 | ) | |||
Adoption of the standard related to revenue recognition is not expected to materially affect cash from or used in operating, financing, or investing cash flows on the Company’s consolidated cash flows statements.
Note 3 — Acquisitions |
Acquisitions in 2016
On April 11, 2016, Papa Murphy’s Company Stores, Inc. (“PMCSI”), a wholly owned subsidiary of the Company, acquired certain assets used in the operation of nine Papa Murphy’s stores in the Joplin, Missouri, and Fort Smith, Arkansas, areas from a franchise owner. On November 15, 2016, PMCSI acquired certain assets used in the operation of one store in the
65
Grand Rapids, Michigan area from a franchise owner. The total consideration paid of approximately $3.1 million was funded through existing cash, $0.5 million in insurance proceeds, and advances on the Company’s Senior Credit Facility (see Note 9 — Financing Arrangements). The Company incurred transaction costs of $10,000 associated with the acquisitions that were recognized as other store operating costs in the Consolidated Statements of Operations.
The fair values of the assets acquired are summarized below (in thousands):
Cash and cash equivalents | $ | 5 | |
Inventory | 26 | ||
Prepaid expenses and other current assets | 27 | ||
Property and equipment | 604 | ||
Asset retirement obligations | (67 | ) | |
Total identifiable net assets acquired | 595 | ||
Goodwill | 1,964 | ||
Total net assets acquired | 2,559 | ||
Dispute settlement | 500 | ||
Total consideration | $ | 3,059 | |
Goodwill represents the excess of the purchase price over the net tangible and intangible assets acquired and is expected to be fully deductible for income tax purposes. This goodwill is primarily attributable to the acquired customer bases and, to a lesser extent, economies of scale expected from combining the operations of the acquired stores with the existing operations of the Company.
The pro forma effects of this acquisition and the operating results of the acquired stores are not presented because the effects were not material to reported results.
Investments
The Company, through a non-wholly owned subsidiary, Project Pie Holdings, LLC (“PPH”), made investments in Project Pie, LLC (“Project Pie”) in the form of Series A Convertible Preferred Units (the “Preferred Units”). Project Pie is a fast casual custom-pizza restaurant chain with stores located throughout the United States, the Philippines and Scotland.
The Company disposed of its ownership interests in PPH on June 29, 2015. Prior to the Company’s disposal of its ownership interests in PPH, it recorded a pre-tax impairment of $4.5 million to its investment in Project Pie.
Earlier in 2015, the Company determined that Project Pie was a variable interest entity as a result of Project Pie having insufficient equity at risk, but that the Company did not have a variable interest in Project Pie and did not have control. The Company did not account for its investment in Project Pie as an equity method investment since the Company’s investment was in preferred units with subordination characteristics substantially different from the common units and were determined not to be in-substance common stock. The Company’s investment was classified as a cost method investment in other assets.
66
Note 4 — Prepaid Expenses and Other Current Assets |
Prepaid expenses and other current assets consist of the following:
(in thousands) | 2017 | 2016 | |||||
Prepaid media development costs | $ | 376 | $ | 606 | |||
Prepaid software and support | 223 | 985 | |||||
Prepaid rent | 549 | 622 | |||||
Prepaid insurance | 377 | 453 | |||||
Taxes receivable | 182 | 547 | |||||
POS software licenses for resale | 364 | — | |||||
Assets held for sale | 432 | 1,406 | |||||
Advertising cooperative assets, restricted | 4 | 48 | |||||
Other | 67 | 41 | |||||
Total prepaid expenses and other current assets | $ | 2,574 | $ | 4,708 | |||
Prepaid media development costs represent costs incurred for advertisements that have not aired.
Assets held for sale include assets from closed stores that the Company is actively marketing to new or existing franchisees.
Note 5 — Property and Equipment |
Property and equipment, net, consists of the following:
(in thousands) | 2017 | 2016 | |||||
Leasehold improvements | $ | 7,475 | $ | 11,726 | |||
Restaurant equipment and fixtures | 12,515 | 15,361 | |||||
Office furniture and equipment | 2,978 | 2,535 | |||||
Software | 7,917 | 14,929 | |||||
Vehicles | 6 | 92 | |||||
Construction in progress | 1,059 | 987 | |||||
31,950 | 45,630 | ||||||
Accumulated depreciation and amortization | (21,886 | ) | (17,114 | ) | |||
Property and equipment, net | $ | 10,064 | $ | 28,516 | |||
Depreciation expense amounted to $5.8 million, $7.2 million, and $4.7 million during fiscal 2017, 2016, and 2015, respectively.
During fiscal 2017, the Company decided to replace its current e-commerce platform. As part of this decision, the Company recognized an impairment to the software component of its property and equipment of $9.1 million during fiscal 2017.
As part of the Company’s property and equipment impairment review, the Company recorded an impairment of $4.4 million to its Company-owned store assets during fiscal 2017.
The Company recognized impairment losses of $2.3 million and $0.2 million in fiscal 2017 and 2016, respectively, related to the closure of certain underperforming Company-owned stores.
No impairment loss was recognized during fiscal 2015.
67
Note 6 — Divestitures |
Divestitures in 2017
On May 1, 2017, the Company completed the sale and refranchise of six Company-owned stores in Colorado. On May 8, 2017, the Company completed the sale and refranchise of one Company-owned store in Colorado in an unrelated transaction. The aggregate sale price for the seven stores was $2.5 million, paid in cash, and the Company recognized a pre-tax gain of $0.2 million. In connection with the sale, the buyers paid $0.3 million in franchise fees. The assets sold were classified as assets held for sale on the Company’s Consolidated Balance Sheets. These dispositions did not meet the criteria for accounting as a discontinued operation.
Divestitures in 2016
On October 18, 2016, the Company completed the sale and refranchise of one Company-owned store in Colorado and one Company-owned store in Minnesota. On October 24, 2016, the Company completed the sale and refranchise of one Company-owned store in Washington. The aggregate sale price for the three stores was $1.0 million, paid in cash, and the Company recognized a pre-tax gain of $69,000. In connection with the sale, the buyers paid $75,000 in franchise fees. These dispositions did not meet the criteria for accounting as a discontinued operation.
The following is a summary of the assets sold (in thousands):
Leasehold improvements | $ | 386 | |
Restaurant equipment and fixtures | 438 | ||
Property and equipment | 824 | ||
Prepaid expenses and other current assets | 19 | ||
Total assets sold | $ | 843 | |
Note 7 — Goodwill |
The following summarizes changes to the Company’s goodwill by reportable segment:
(in thousands) | Domestic Company Stores | Domestic Franchise | Total | ||||||||
Balance at December 28, 2015 | $ | 24,960 | $ | 81,546 | $ | 106,506 | |||||
Acquisitions | 1,964 | — | 1,964 | ||||||||
Balance at January 2, 2017 | 26,924 | 81,546 | 108,470 | ||||||||
Disposition | (719 | ) | — | (719 | ) | ||||||
Balance at January 1, 2018 | $ | 26,205 | $ | 81,546 | $ | 107,751 | |||||
There is no goodwill associated with the International segment. Based on the results of the Company’s impairment testing, the Company did not recognize any impairment of goodwill during fiscal 2017, 2016, or 2015. The Company recorded Goodwill disposals in fiscal 2017 and 2015 from the sale of Company-owned stores to franchise owners.
68
Note 8 — Intangible Assets |
Intangible assets consist of the following:
2017 | |||||||||||||
(in thousands) | Gross Carrying Amount | Accumulated Amortization | Net | Weighted Average Amortization Period | |||||||||
Intangible assets subject to amortization: | |||||||||||||
Franchise relationships | $ | 56,000 | $ | (26,855 | ) | $ | 29,145 | 16.0 | |||||
Reacquired franchise rights | 5,887 | (3,377 | ) | 2,510 | 6.8 | ||||||||
Net intangible assets subject to amortization | $ | 61,887 | $ | (30,232 | ) | $ | 31,655 | 15.1 | |||||
Intangible assets not subject to amortization | |||||||||||||
Trade name and trademarks | $ | 87,002 | |||||||||||
2016 | |||||||||||||
(in thousands) | Gross Carrying Amount | Accumulated Amortization | Net | Weighted Average Amortization Period | |||||||||
Intangible assets subject to amortization: | |||||||||||||
Franchise relationships | $ | 56,000 | $ | (23,355 | ) | $ | 32,645 | 16.0 | |||||
Reacquired franchise rights | 6,914 | (3,246 | ) | 3,668 | 6.3 | ||||||||
Net intangible assets subject to amortization | $ | 62,914 | $ | (26,601 | ) | $ | 36,313 | 14.5 | |||||
Intangible assets not subject to amortization | |||||||||||||
Trade name and trademarks | $ | 87,002 | |||||||||||
Reacquired franchise rights were recorded as part of the Company’s acquisitions of franchised stores. Trade name and trademarks are intangible assets determined to have indefinite lives and are not subject to amortization. Management has concluded that none of its reporting units with a material amount of intangible assets not subject to amortization are at risk for failing step one of the quantitative assessment for impairment of intangible assets.
Amortization expense amounted to $4.7 million, $5.1 million, $5.3 million for fiscal 2017, 2016, and 2015, respectively.
The estimated future amortization expense of amortizable intangible assets as of the end of fiscal 2017 is as follows (in thousands):
Fiscal year | 2018 | $ | 4,316 | |
2019 | 4,070 | |||
2020 | 3,945 | |||
2021 | 4,459 | |||
2022 | 3,803 | |||
Thereafter | 11,062 | |||
$ | 31,655 | |||
69
Note 9 — Financing Arrangements |
Long-term debt consists of the following:
(in thousands) | 2017 | 2016 | |||||
Term loan under 2014 credit facility | $ | 92,900 | $ | 105,879 | |||
Revolving line of credit under 2014 credit facility | — | 800 | |||||
Notes payable | 3,000 | 3,000 | |||||
Total principal amount of long-term debt | 95,900 | 109,679 | |||||
Less unamortized debt issuance costs | (506 | ) | (835 | ) | |||
Total long-term debt | 95,394 | 108,844 | |||||
Less current portion | (8,400 | ) | (7,879 | ) | |||
Total long-term debt, net of current portion | $ | 86,994 | $ | 100,965 | |||
Maturities on long-term debt consist of the following:
(in thousands) | Senior Secured Credit Facility | Notes Payable | Total | |||||||||
Fiscal Years | 2018 | $ | 5,400 | $ | 3,000 | $ | 8,400 | |||||
2019 | 87,500 | — | 87,500 | |||||||||
$ | 92,900 | $ | 3,000 | $ | 95,900 | |||||||
The weighted average interest rate across all senior secured credit facilities for fiscal 2017, 2016, and 2015 was 4.34%, 3.77%, and 3.45%, respectively.
2014 senior secured credit facility
On August 28, 2014, PMI Holdings, Inc., a wholly-owned subsidiary of the Company, entered into a $132.0 million senior secured credit facility (the “2014 Credit Facility”) consisting of a $112.0 million term loan and a $20.0 million revolving credit facility, which includes a $2.5 million letter of credit sub-facility and a $1.0 million swing-line loan sub-facility. Closing and structuring fees of $1.6 million were incurred as a result of this transaction which will be amortized over the duration of the loan. The term loan and any loans made under the revolving credit facility mature in August 2019.
Borrowings under the 2014 Credit Facility bear interest at a rate per annum equal to an applicable margin based on the Company’s consolidated leverage ratio, plus, at the Company’s option, either (a) a base rate determined by reference to the highest of (i) the “Prime Rate” publicly quoted by The Wall Street Journal, (ii) the federal funds rate plus 50 basis points, or (iii) the LIBOR rate with a one-month interest period plus 100 basis points, or (b) a LIBOR rate determined for the specified interest period. The applicable margin for borrowings under the 2014 Credit Facility ranges from 150 to 225 basis points for base rate borrowings and 250 to 325 basis points for LIBOR rate borrowings. The 2014 Credit Facility includes customary fees for loan facilities of this type, including a commitment fee on the revolving credit facility. As of January 1, 2018, all $92.9 million of the term loan was subject to the LIBOR rate option at 4.82%.
The obligations under the 2014 Credit Facility are guaranteed by certain domestic subsidiaries of the Company (the “subsidiary guarantors”) and are secured by substantially all assets of the Company and the subsidiary guarantors. The 2014 Credit Facility also contains customary affirmative and negative covenants that are typical for loan facilities of this type, including covenants that, among other things, restrict our ability and the ability of our subsidiaries to incur indebtedness, issue certain types of equity, incur liens, enter into fundamental changes, including mergers and consolidations, sell assets, make dividends, distributions and investments, and prepay subordinated indebtedness, subject to customary exceptions. The 2014 Credit Facility also includes certain financial covenants with respect to a maximum consolidated leverage ratio, a minimum interest coverage ratio, and a fixed charge coverage ratio.
With a maturity date of over one year from January 1, 2018, balances outstanding under the 2014 Credit Facility are classified as non-current on the Consolidated Balance Sheets, except for mandatory, minimum term loan amortization payments of $2.1 million due on the last day of each fiscal quarter.
70
Notes payable
PMCSI has a note payable for $3.0 million which bears interest at 5% and matures in December 2018. This note is subordinated to the senior secured credit facility.
Deferred financing costs and prepayment penalties
In conjunction with the 2014 Credit Facility, the Company evaluated the refinancing of its prior credit facility and determined that the borrowing was extinguished and not modified. Accordingly, unamortized deferred financing costs of $2.3 million from the prior credit facility and a prepayment penalty of $1.1 million were expensed as a Loss on early retirement of debt in 2014. The Company incurred $1.6 million in financing costs, which was capitalized and is being amortized using an effective interest rate method.
Deferred financing costs amortized to interest expense in the Consolidated Statements of Operations amounted to $0.3 million, $0.3 million, and $0.3 million for fiscal years 2017, 2016, and 2015, respectively.
Amortization of deferred financing costs in the future is expected to be as follows (in thousands):
Fiscal Years | 2018 | $ | 310 | |
2019 | 196 | |||
$ | 506 | |||
Note 10 — Fair Value Measurement |
The Company determines the fair value of assets and liabilities based on the price that would be received to sell the asset or paid to transfer the liability to a market participant. GAAP defines a fair value hierarchy that prioritizes the assumptions used to measure fair value. The three levels of the fair value hierarchy are defined as follows:
▪ | Level 1 — Quoted prices in active markets for identical assets or liabilities that the entity has the ability to access. |
▪ | Level 2 — Observable inputs other than prices included in Level 1, such as quoted prices for similar assets and liabilities in active markets; quoted prices for identical or similar assets and liabilities in markets that are not active; or other inputs that are observable or can be corroborated with observable market data |
▪ | Level 3 — Unobservable inputs that are supported by little or no market activity and that are significant to the fair value of the assets and liabilities. This includes certain pricing models, discounted cash flow methodologies and similar techniques that use significant unobservable inputs. |
The following table presents information about the Company’s assets and liabilities measured at fair value on a recurring basis:
2017 | 2016 | ||||||||||||||||
(in thousands) | Carrying Value | Fair Value | Carrying Value | Fair Value | Fair Value Measurements | ||||||||||||
Financial assets | |||||||||||||||||
Notes receivable (1) | $ | 97 | $ | 88 | $ | 149 | $ | 150 | Level 3 | ||||||||
(1) | The fair value of notes receivable was estimated primarily using a discounted cash flow method based on a discount rate, reflecting the applicable credit spread. |
Financial instruments not included in the table above consist of cash and cash equivalents, accounts receivable, accounts payable, and long-term debt. The fair value of cash and cash equivalents, accounts receivable, and accounts payable approximates carrying value because of the short-term nature of the accounts. The fair value of long-term debt approximates carrying value because the borrowings are made with variable market rates and negotiated terms and conditions that are consistent with current market rates.
71
Note 11 — Accrued and Other Liabilities |
Accrued expenses and other current liabilities consist of the following:
(in thousands) | 2017 | 2016 | |||||
Accrued compensation and related costs | $ | 3,902 | $ | 2,192 | |||
Accrued legal settlement costs | 3,940 | — | |||||
Gift cards and certificates payable | 3,184 | 3,033 | |||||
Accrued interest and non-income taxes payable | 461 | 524 | |||||
Convention fund balance | 841 | 1,025 | |||||
Advertising cooperative liabilities | 60 | 204 | |||||
Other | 751 | 525 | |||||
$ | 13,139 | $ | 7,503 | ||||
Note 12 — Income Taxes |
In December 2017, the Tax Cuts and Jobs Act (the “2017 Tax Act”) was enacted. The 2017 Tax Act includes a number of changes to existing U.S. tax laws that affect the Company, most notably a reduction of the top U.S. corporate income tax rate from 35% to 21% for tax years beginning after December 31, 2017. The 2017 Tax Act also provides for the acceleration of depreciation for certain assets placed into service after September 27, 2017 as well as prospective changes beginning in 2018, including additional limitations on the deductibility executive compensation and interest.
The Company recognized the income tax effects of the 2017 Tax Act in its 2017 financial statements in accordance with Staff Accounting Bulletin No. 118, which provides SEC staff guidance for the application of ASC Topic 740 Income Taxes in the reporting period in which the 2017 Tax Act was signed into law. As such, the Company’s financial results reflect the income tax effects of the 2017 Tax Act for which the accounting under ASC Topic 740 is complete and provisional amounts for those specific income tax effects of the 2017 Tax Act for which the accounting under ASC Topic 740 is incomplete, but a reasonable estimate could be determined. The Company included provisional estimates of income tax effects of the 2017 Tax Act because the interaction between valuation allowance and future deferred tax assets and liabilities is uncertain as of January 1, 2018.
The changes to existing U.S. tax laws as a result of the 2017 Tax Act, which the Company believes have the most significant impact on the Company’s federal income taxes, are as follows:
Reduction of the U.S. Corporate Income Tax Rate
The Company measures deferred tax assets and liabilities using enacted tax rates that will apply in the years in which the temporary differences are expected to be recovered or paid. Accordingly, the Company’s deferred tax assets and liabilities were remeasured to reflect the reduction in the Company’s statutory U.S. corporate income tax rate from 34% percent to 21%, resulting in a $12.6 million decrease in income tax expense for the year ended January 1, 2018 and a corresponding $12.6 million decrease in net deferred tax liabilities as of January 1, 2018.
72
The components of the (benefit from) provision for income taxes are as follows:
(in thousands) | 2017 | 2016 | 2015 | ||||||||
Current tax provision | |||||||||||
Federal | $ | 9 | $ | 5 | $ | 83 | |||||
State | 171 | 214 | 278 | ||||||||
180 | 219 | 361 | |||||||||
Deferred tax (benefit) provision | |||||||||||
Federal | (18,877 | ) | 1,508 | 2,211 | |||||||
State | (846 | ) | 216 | (504 | ) | ||||||
(19,723 | ) | 1,724 | 1,707 | ||||||||
Total (benefit from) provision for income taxes | $ | (19,543 | ) | $ | 1,943 | $ | 2,068 | ||||
The components of the non-current deferred tax liability are as follows:
(in thousands) | 2017 | 2016 | |||||
Deferred income tax assets: | |||||||
Unearned franchise and development fees | $ | 246 | $ | 379 | |||
Convention and Advertising funds balance | 208 | 380 | |||||
Compensation accruals | 449 | 102 | |||||
Gift card accruals | 348 | 458 | |||||
Asset retirement obligation | 120 | 201 | |||||
Deferred rent | 283 | 434 | |||||
Share-based compensation | 769 | 1,082 | |||||
Net operating loss | 1,013 | 1,598 | |||||
Other | 213 | 387 | |||||
Total deferred tax assets | 3,649 | 5,021 | |||||
Valuation allowance | (98 | ) | (61 | ) | |||
Total deferred tax assets after valuation allowance | 3,551 | 4,960 | |||||
Deferred income tax liabilities: | |||||||
Fixed asset, goodwill, and intangible asset basis differences | (27,273 | ) | (46,836 | ) | |||
Other | (735 | ) | (2,303 | ) | |||
Total deferred tax liabilities | (28,008 | ) | (49,139 | ) | |||
Net deferred tax liability | $ | (24,457 | ) | $ | (44,179 | ) | |
As of the end of fiscal 2017, the Company had federal and state net operating loss carry forwards of $3.8 million and $5.0 million, respectively. As of the end of fiscal 2016, the Company had federal and state net operating loss carry forwards of $4.2 million and $3.9 million, respectively. The federal and state net operating loss carry forwards begin to expire in 2032 and 2020, respectively. As of the end of fiscal 2017, the Company has federal credit carryovers of $0.6 million that are a combination of credits that begin to expire in 2035.
Tax benefits for federal and state net operating loss carry forwards are recorded as an asset to the extent that management assesses the utilization of such assets to be “more likely than not”; otherwise, a valuation allowance is required to be recorded. The Company has looked to future reversals of existing taxable temporary differences in determining that its federal and a majority of its state net operating loss carry forwards are more likely than not to be utilized prior to their expiration dates. Consequently, no valuation allowance has been recorded for these deferred tax assets. Several separate filing states where the Company operates have facts that indicate it is more likely that the Company will not utilize the separate filing state carryovers prior to their expiration dates. As of the end of fiscal 2017, the Company has recorded a $98,000 valuation allowance for these particular carryovers. The Company will continue to evaluate the need for a valuation allowance in the future. Changes in estimated future taxable income and other underlying factors may lead to adjustments to the valuation allowance in the future.
73
As of the end of fiscal 2017, the Company had $77,000 of unrecognized tax benefits that, if recognized, would affect the effective tax rate. A reconciliation of the beginning and ending liability for unrecognized tax benefits excluding interest and penalties is as follows (in thousands):
Balance as of the end of fiscal 2016 | $ | 72 | |
Additions for tax positions of prior years | 5 | ||
Balance as of the end of fiscal 2017 | $ | 77 | |
A reconciliation of income tax at the United States federal statutory tax rate (using a statutory tax rate of 34%) to income tax expense for the periods reported is as follows:
(in thousands) | 2017 | 2016 | 2015 | ||||||||
Federal income tax provision based on statutory rate | $ | (6,647 | ) | $ | 1,561 | $ | 2,203 | ||||
State and local income tax effect | (445 | ) | 284 | 314 | |||||||
Impact of change in tax rates | (12,621 | ) | — | (464 | ) | ||||||
Non-deductible expenses | 203 | 255 | 133 | ||||||||
Tax credits and other | (33 | ) | (157 | ) | (118 | ) | |||||
(Benefit from) provision for income taxes | $ | (19,543 | ) | $ | 1,943 | $ | 2,068 | ||||
Note 13 — Share-based Compensation |
In May 2010, the Company’s Board of Directors approved the 2010 Plan. In May 2014, the Company’s Board of Directors adopted the 2014 Plan (together with the 2010 Plan, the “Incentive Plans”). The Incentive Plans reserve 2,116,747 common shares for equity incentive awards consisting of incentive stock options, non-qualified stock options, restricted stock awards, and unrestricted stock awards. Equity incentive awards may be issued from either the 2010 Plan or the 2014 Plan.
Restricted common shares
Under the Incentive Plans, restricted common stock awards are subject to either time-vesting or market conditions. Time-vesting restricted common stock awards issued under the 2010 Plan have generally vested 20% on each of the five anniversaries of the sale date. Time-vesting restricted common stock awards granted under the 2014 Plan have generally vested 100% on the one-year anniversary of the grant date. Prior to fiscal 2017, market condition restricted common stock awards were scheduled to vest when the volume-weighted average closing price per share of the Company’s common stock equals or exceeds $22.00 per share for 90 consecutive trading days. In fiscal 2017, the vesting condition for market condition restricted common stock was modified to vest when the volume-weighted average closing price per share of the Company’s common stock equals or exceeds $14.50 per share for 90 consecutive trading days. To the extent the fair value of an award on the date of the sale, grant, or modification exceeds the sale price, if any, the excess is recognized as compensation expense as a component of selling, general, and administrative expenses. Compensation expense for time-vesting restricted common stock awards is recognized over the requisite service period on a straight line basis.
The Company has a right to repurchase shares sold to employees under the 2010 Plan in the case of a qualifying sale, bankruptcy event, or a termination of employment or service of the employee who purchased shares, including a voluntary termination. Unvested shares as of the date of these events are repurchased at the original sale price. The Company generally does not repurchase vested shares from terminated employees.
74
Information with respect to restricted stock awards is as follows:
Number of Shares of Restricted Common Stock | |||||||||
Time Vesting | Market Condition | Weighted Average Award Date Fair Value per Share | |||||||
Unvested, 2016 | 30,670 | 148,946 | $ | 2.70 | |||||
Granted | 35,333 | — | 4.65 | ||||||
Vested | (29,597 | ) | (104,820 | ) | (1) | 5.18 | |||
Forfeited/Repurchased | (1,508 | ) | (3,772 | ) | 2.93 | ||||
Unvested, 2017 | 34,898 | 40,354 | $ | 3.44 | |||||
(1) | As part of the severance agreement with the Company’s former CEO and other executives, the Company accelerated the vesting of certain market condition restricted common stock awards. |
Fair value information for restricted stock awards during the periods reported is as follows:
(in thousands, except per share amounts) | 2017 | 2016 | 2015 | ||||||||
Weighted average grant date fair value per share | $ | 4.65 | $ | 7.66 | $ | 19.05 | |||||
Total fair value of shares issued | $ | 164 | $ | 138 | $ | 150 | |||||
Total fair value of shares vested | $ | 697 | $ | 220 | $ | 171 | |||||
Stock options
Under the Incentive Plans, stock options are subject to either time-vesting or market conditions. Time-vesting stock options generally vest 25% on each of the four anniversaries of the grant date. Prior to fiscal 2017, market condition stock options were scheduled to vest when the volume-weighted average closing price per share of the Company’s common stock equals or exceeds $22.00 per share for 90 consecutive trading days. In fiscal 2017, the vesting condition for market condition stock options was modified to vest when the volume-weighted average closing price per share of the Company’s common stock equals or exceeds $14.50 per share for 90 consecutive trading days. The grant date fair value and any additional fair value from modification of an award are recognized as compensation expense as a component of selling, general, and administrative expenses. The compensation expense is recognized over the requisite service period, typically the vesting period, on a straight line basis.
Information with respect to stock option activity is as follows:
Number of Shares Subject to Stock Options | |||||||||||||||
Time Vesting | Market Condition | Weighted Average Exercise Price per Share | Weighted Average Remaining Contractual Term | Aggregate Intrinsic Value (in thousands) | |||||||||||
Outstanding, 2016 | 951,688 | 171,495 | $ | 11.48 | |||||||||||
Granted | 626,667 | 83,333 | 4.75 | ||||||||||||
Forfeited | (629,240 | ) | (96,701 | ) | 3.95 | ||||||||||
Outstanding, 2017 | 949,115 | 158,127 | $ | 7.60 | 8.3 years | $ | 478 | ||||||||
Exercisable, 2017 | 277,398 | — | $ | 11.10 | 6.8 years | $ | 10 | ||||||||
Fair value information for stock options granted and vested and the intrinsic value of stock options exercised during the periods reported are as follows:
(in thousands, except per share amounts) | 2017 | 2016 | 2015 | ||||||||
Weighted average grant date fair value per share | $ | 1.66 | $ | 3.67 | $ | 5.41 | |||||
Total fair value of awards granted | $ | 1,179 | $ | 651 | $ | 1,039 | |||||
Total fair value of awards vested | $ | 422 | $ | 594 | $ | 431 | |||||
Total intrinsic value of stock options exercised | $ | — | $ | 25 | $ | 189 | |||||
75
Compensation cost and valuation
Total compensation costs recognized in connection with the Incentive Plans for fiscal 2017, 2016, and 2015 amounted to $0.7 million, $0.9 million, and $1.1 million, respectively. Additionally, the associated income tax benefits for fiscal 2017, 2016, and 2015 amounted to $0.1 million, $0.3 million, and $0.4 million, respectively.
As of the end of fiscal 2017, the total unrecognized share-based compensation expense was $1.5 million, with $1.1 million associated with time-vesting awards and $0.4 million associated with market condition awards. The remaining weighted average period for unrecognized share-based compensation expense was 2.4 years as of the end of fiscal 2017.
The fair value of the stock option awards granted during the periods reported was estimated with the following weighted-average assumptions.
2017 | 2016 | 2015 | |||
Risk free rate | 2.00% | 1.74% | 1.94% | ||
Expected volatility | 25.8% | 30.4% | 37.9% | ||
Expected term | 5.5 years | 6.3 years | 6.3 years | ||
Expected dividend yield | 0.0% | 0.0% | 0.0% | ||
Note 14 — Earnings per Share (EPS) |
The number of shares and earnings per share (“EPS”) data for all periods presented are based on the historical weighted-average shares of common stock outstanding.
Basic EPS is calculated by dividing income available to common stockholders by the weighted-average number of shares of common stock outstanding during each period. Diluted EPS is calculated using income available to common stockholders divided by diluted weighted-average shares of common stock outstanding during each period, which includes unvested restricted common stock and outstanding stock options. Diluted EPS considers the effect of potentially dilutive securities except in periods in which there is a loss because the inclusion of the potential common shares would have an anti-dilutive effect.
The following table sets forth the computations of basic and diluted EPS:
(in thousands, except per share data) | 2017 | 2016 | 2015 | ||||||||
Earnings: | |||||||||||
Net (loss) income | $ | (7 | ) | $ | 2,649 | $ | 4,411 | ||||
Net loss attributable to noncontrolling interests | — | — | 500 | ||||||||
Net (loss) income attributable to Papa Murphy’s | (7 | ) | 2,649 | 4,911 | |||||||
Cumulative Series A and B Preferred dividends | — | — | (2,150 | ) | |||||||
Net (loss) income available to common shareholders | $ | (7 | ) | $ | 2,649 | $ | 2,761 | ||||
Shares: | |||||||||||
Basic weighted average common shares outstanding | 16,870 | 16,743 | 16,653 | ||||||||
Dilutive effect of restricted equity awards (1) | — | 30 | 218 | ||||||||
Diluted weighted average number of shares outstanding | 16,870 | 16,773 | 16,871 | ||||||||
Earnings per share: | |||||||||||
Basic earnings per share | $ | — | $ | 0.16 | $ | 0.29 | |||||
Diluted earnings per share | $ | — | $ | 0.16 | $ | 0.29 | |||||
(1) | An aggregated total of 901,000, 746,000, and 78,000 potential common shares have been excluded from the diluted EPS calculation for 2017, 2016, and 2015, respectively, because their effect would have been anti-dilutive. |
76
Note 15 — Commitments and Contingencies |
Operating lease commitments
The Company leases facilities and various office equipment under non-cancelable operating leases which expire through December 2025. Lease terms for its store units are generally for five years with renewal options and generally require the Company to pay a proportionate share of real estate taxes, insurance, common area maintenance, and other operating costs.
The Company has entered into operating leases that it has subleased to two franchised stores. These operating leases have minimum base rent terms and contingent rent terms if individual franchised store sales exceed certain levels and have terms expiring on various dates from May 2020 to October 2020.
As of the end of fiscal 2017, future minimum payments under the non-cancelable operating leases, excluding contingent rent obligations, are as follows:
(in thousands) | Total lease minimum payments | Sublease income | Net lease minimum payments | |||||||||
Fiscal years | 2018 | $ | 5,227 | $ | 54 | $ | 5,173 | |||||
2019 | 4,602 | 54 | 4,548 | |||||||||
2020 | 3,607 | 30 | 3,577 | |||||||||
2021 | 2,319 | — | 2,319 | |||||||||
2022 | 1,475 | — | 1,475 | |||||||||
Thereafter | 2,855 | — | 2,855 | |||||||||
$ | 20,085 | $ | 138 | $ | 19,947 | |||||||
Rent expense for fiscal 2017, 2016, and 2015 was $8.0 million, $7.2 million, and $5.6 million, respectively.
Lease guarantees
As of the end of fiscal 2017, the Company is the guarantor for operating leases of 21 franchised stores that have terms expiring on various dates from January 2018 to November 2022. These obligations were recorded at fair value at the time the guarantee was entered into, typically in connection with the refranchising of a Company-owned store. The obligations from these leases will generally continue to decrease over time as the leases expire. As of the end of fiscal 2017, the Company does not believe it is probable it would be required to perform under the outstanding guarantees. The applicable franchise owners continue to have primary liability for these operating leases.
As of the end of fiscal 2017, future commitments under these leases are as follows (in thousands):
Fiscal Years | 2018 | $ | 598 | |
2019 | 552 | |||
2020 | 430 | |||
2021 | 186 | |||
2022 | 14 | |||
$ | 1,780 | |||
Legal proceedings
The Company is currently subject to litigation with a group of franchise owners. In January 2014, six franchise owner groups claimed that the Company misrepresented sales volumes, made false representations to them, and charged excess advertising fees, among other things. The Company engaged in mediation with these franchise owners, which is required under the terms of their franchise agreements, in order to address and resolve their claims, but was unable to reach a settlement agreement. On April 4, 2014, a total of twelve franchise owner groups, including those franchise owners that previously made the allegations described above, filed a lawsuit against the Company in the Superior Court in Clark County, Washington, making essentially the same allegations for violation of the Washington Franchise Investment Protection Act,
77
fraud, negligent misrepresentation and breach of contract and seeking declaratory and injunctive relief, as well as monetary damages. Based on motions filed by the Company in that lawsuit, the court ruled on July 9, 2014 that certain of the plaintiffs’ claims under the anti-fraud and nondisclosure provisions of the Washington Franchise Investment Protection Act should be dismissed and that certain other claims in the case would need to be more specifically alleged. The court also ruled that the six franchise owner groups who had not mediated with the Company prior to filing the lawsuit must mediate with the Company in good faith, and that their claims shall be stayed until they have done so.
On June 18, 2014, an additional 16 franchise owner groups, represented by the same counsel as the plaintiffs described above, filed a lawsuit in the Superior Court in Clark County, Washington making essentially the same allegations as made in the lawsuit described above and seeking declaratory and injunctive relief, as well as monetary damages. The court consolidated the two lawsuits into a single case and ordered that the plaintiffs in the new lawsuit, none of whom had mediated with the Company prior to filing the lawsuit, must do so, and that their claims be stayed until they completed mediating with the Company in good faith.
In October 2014, the Company engaged in mediation with the 22 franchise owner groups who had not previously done so. As a result of that mediation and other efforts, the Company has now reached resolution with 13 of the franchise owner groups involved in the consolidated lawsuits, and their claims have either been dismissed or dismissal is pending.
In February 2015, the remaining franchise owner groups in the consolidated lawsuits filed an amended complaint, removing some claims, amending some claims, adding claims and naming some of the Company’s former and current franchise sales staff as additional individual defendants. In September 2016, the remaining 15 franchise owner groups in the consolidated lawsuits filed an amended complaint to add a claim under the Washington Consumer Protection Act based on substantially the same allegations as the prior claims, to re-plead claims under the Washington Franchise Investment Protection Act that had previously been dismissed, and to dismiss Dan Harmon as a defendant.
In June 2017, the parties moved for summary judgment. The Company moved for summary judgment against two of the remaining franchise owner groups, the board of directors members moved for summary judgment on all claims against them, and the plaintiffs moved for summary judgment against all defendants on their Washington Consumer Protection Act and Washington Franchise Investment Protection Act claims. A hearing on the summary judgment motions was held on October 13, 2017.
In July 2017, the Company engaged in mediation with the remaining 15 franchise owner groups in the consolidated lawsuits. As a result of that mediation and other efforts, the Company reached resolutions with six of the remaining franchise owner groups, and their claims have been dismissed.
The Company is from time to time involved in litigation, certain other claims and arbitration matters arising in the ordinary course of business. The Company accrues for a liability when it is both probable that a liability has been incurred and the amount of the loss can be reasonably estimated. Significant judgment is required in both the determination of the probability of a loss and the determination as to whether a loss is reasonably estimable. These accruals are reviewed at least quarterly and adjusted to reflect the effects of negotiations, settlements, rulings, advice of legal counsel and technical experts and other information and events pertaining to a particular matter. To the extent there is a reasonable possibility (within the meaning of Accounting Standards Codification (“ASC”) 450) that losses could exceed amounts already accrued, if any, and the additional loss or range of loss is able to be estimated, the Company discloses the additional loss or range of loss.
In some instances, the Company is unable to reasonably estimate any potential loss or range of loss. The nature and progression of litigation can make it difficult to predict the impact a particular lawsuit will have on its business. There are many reasons that the Company cannot make these assessments, including, among others, one or more of the following: the early stages of a proceeding; damages sought that are unspecified, unsupportable, unexplained or uncertain; discovery not having been started or incomplete; the complexity of the facts that are in dispute; the difficulty of assessing novel claims; the parties not having engaged in any meaningful settlement discussions; the possibility that other parties may share in any ultimate liability; and/or the often slow pace of litigation.
The Company is named as a defendant in a putative class action lawsuit filed by plaintiff John Lennartson on May 7, 2015, in the United States District Court for the Western District of Washington. The lawsuit alleges the Company failed to comply with the requirements of the Telephone Consumer Protection Act (TCPA) when it sent SMS text messages to consumers. Mr. Lennartson asks that the court certify the putative class and that statutory damages under the TCPA be awarded to plaintiff and each class member. On October 14, 2016, the Federal Communications Commission (FCC) granted the Company a limited waiver from the TCPA’s written consent requirements for certain text messages that it sent up through October 16, 2013 to individuals who, like Mr. Lennartson, provided written consent prior to October 16, 2013. On October 20, 2016, the Company filed a motion for summary judgment seeking dismissal. On October 27, 2016, Mr. Lennartson filed a motion seeking to extend the time to respond to the summary judgment motion on the basis that he intends to appeal the FCC’s waiver. On November 4, 2016, the Court granted Mr. Lennartson’s motion to continue his response to the Company’s
78
summary judgment motion until he can complete his appeal of the FCC’s waiver order. In addition, on January 9, 2017, Mr. Lennartson filed an amended complaint adding additional plaintiffs, some of whom provided consent after October 16, 2013, and who are therefore differently situated from Mr. Lennartson, as well as additional Washington state law claims. On October 27, 2017, plaintiffs moved to certify their putative class, which the Company opposed, and on November 22, 2017, the Company moved for summary judgment on all of plaintiffs’ claims. The Company and the plaintiffs have commenced negotiations regarding the proposed terms of a settlement agreement, and the Court has issued a stay of the case for 30 days while the parties pursue settlement negotiations. Successful completion of these negotiations, in addition to necessary court approvals and other conditions, would result in the final resolution of the lawsuit; however, the Company provides no assurance that any final settlement agreement will be reached by the parties or approved by the Court, or that the lawsuit will be finally resolved. The Company has recorded a contingent liability of $3.9 million related to this lawsuit. An adverse judgment or settlement related to this lawsuit could have a material adverse effect on the Company’s consolidated financial position, results of operations, or cash flows.
In addition to the foregoing, the Company is subject to routine legal proceedings, claims and litigation in the ordinary course of its business. The Company may also engage in future litigation with franchise owners to enforce the terms of franchise agreements and compliance with brand standards as determined necessary to protect the Company’s brand, the consistency of products and the customer experience. Lawsuits require significant management attention and financial resources and the outcome of any litigation is inherently uncertain. The Company does not, however, currently expect that the costs to resolve these routine matters will have a material adverse effect on its consolidated financial position, results of operations, or cash flows.
Note 16 — Retirement Plans |
The Company has a defined contribution benefit plan, qualified under Section 401(k) of the Internal Revenue Code (the “401(k) Plan”), covering all eligible employees. 401(k) Plan participants may receive up to a 4% matching contribution up to the limits established by the plan and by the Internal Revenue Service and are vested immediately. Contributions to the 401(k) Plan by the Company during fiscal 2017, 2016, and 2015 amounted to $0.4 million, $0.4 million, and $0.4 million, respectively.
Note 17 — Advertising Fund |
Franchised and Company-owned stores in the United States contribute to an advertising fund that the Company manages on behalf of these stores. In addition, certain suppliers contribute to the advertising fund. Under our franchise agreements and other agreements, contributions received by the advertising fund must be spent on marketing, creative efforts, media support, or other related purposes specified in the agreements and result in no profit recognized. Contributions to the advertising fund are netted against the related expense. Expenditures of the advertising fund are primarily amounts paid to third-parties, but may also include personnel expenses and allocated costs. At each reporting date, to the extent contributions to the advertising fund exceed expenditures on a cumulative basis, the excess contributions are accounted for as a deferred liability and are recorded in accrued expenses in the Company’s Consolidated Balance Sheets. However, if expenditures exceed contributions on a cumulative basis, the excess is recorded as an expense within selling, general, and administrative expenses. In subsequent periods, previously recognized expenses may be recovered if subsequent contributions exceed expenditures.
Information on the Company’s advertising fund balance for the periods reported is as follows:
(in thousands) | 2017 | 2016 | 2015 | ||||||||
Opening fund (deficit) surplus | $ | (1,586 | ) | $ | (1,200 | ) | $ | 505 | |||
Net activity during the period | (4,383 | ) | (386 | ) | (1,705 | ) | |||||
Ending fund deficit | $ | (5,969 | ) | $ | (1,586 | ) | $ | (1,200 | ) | ||
As of January 1, 2018, previously recognized expenses of $6.0 million may be recovered in future periods if subsequent advertising fund contributions exceed expenditures.
79
Note 18 — Segment Information |
The Company has the following reportable segments: (i) Domestic Franchise; (ii) Domestic Company Stores; and (iii) International. The Domestic Franchise segment includes operations with respect to franchised stores in the United States and derives its revenues from franchise and development fees and the collection of franchise royalties from the Company’s franchise owners located in the United States. The Domestic Company Stores segment includes operations with respect to Company-owned stores in the United States and derives its revenues from retail sales of pizza and side items to the general public. The International segment includes operations related to the Company’s operations outside the United States and derives its revenues from franchise and development fees and the collection of franchise royalties from franchises located outside the United States.
The Company measures the performance of its segments based on segment adjusted EBITDA and allocates resources based primarily on this measure. “EBITDA” is calculated as net (loss) income before interest expense, income taxes, depreciation, and amortization. Segment adjusted EBITDA excludes certain unallocated and corporate expenses. Although segment adjusted EBITDA is not a measure of financial condition or performance determined in accordance with GAAP, the Company uses segment adjusted EBITDA to compare the operating performance of its segments on a consistent basis and to evaluate the performance and effectiveness of its operational strategies. The Company’s calculation of segment adjusted EBITDA may not be comparable to that reported by other companies.
The following tables summarize information on revenues, segment adjusted EBITDA, depreciation and amortization, interest expense (income), and assets for each of the Company’s reportable segments and include a reconciliation of segment adjusted EBITDA to (loss) income before income taxes:
Revenues | |||||||||||
(in thousands) | 2017 | 2016 | 2015 | ||||||||
Domestic Franchise | $ | 41,421 | $ | 44,434 | $ | 45,579 | |||||
Domestic Company Stores | 76,868 | 82,080 | 74,300 | ||||||||
International | 372 | 369 | 330 | ||||||||
Total | $ | 118,661 | $ | 126,883 | $ | 120,209 | |||||
The following table summarizes revenues by geographic area:
Revenues | |||||||||||
(in thousands) | 2017 | 2016 | 2015 | ||||||||
United States | $ | 118,289 | $ | 126,514 | $ | 119,879 | |||||
International | 372 | 369 | 330 | ||||||||
Total | $ | 118,661 | $ | 126,883 | $ | 120,209 | |||||
80
Segment Adjusted EBITDA | |||||||||||
(in thousands) | 2017 | 2016 | 2015 | ||||||||
Domestic Franchise | $ | 24,195 | $ | 23,772 | $ | 26,142 | |||||
Domestic Company Stores | 2,751 | 2,808 | 5,943 | ||||||||
International | 315 | 300 | 268 | ||||||||
Total reportable segments adjusted EBITDA | 27,261 | 26,880 | 32,353 | ||||||||
Corporate and unallocated | (7,417 | ) | (5,184 | ) | (6,678 | ) | |||||
Depreciation and amortization | (10,452 | ) | (12,236 | ) | (10,002 | ) | |||||
Interest expense, net | (5,078 | ) | (4,868 | ) | (4,524 | ) | |||||
Secondary offering costs(1) | — | — | (345 | ) | |||||||
Loss on Project Pie impairment and disposal(2) | — | — | (4,325 | ) | |||||||
CEO transition and restructuring(3) | (2,614 | ) | — | — | |||||||
E-commerce impairment(4) | (9,085 | ) | — | — | |||||||
Store closures and impairments(5) | (7,712 | ) | — | — | |||||||
Litigation settlements(6) | (4,453 | ) | — | — | |||||||
(Loss) Income Before Income Taxes | $ | (19,550 | ) | $ | 4,592 | $ | 6,479 | ||||
(1) | Represents costs related to the secondary offering of the Company’s common stock. |
(2) | Represents a $4 million loss recognized upon impairment of Project Pie, a cost-method investment, and its subsequent disposal, and the write-off as bad debt receivables totaling $325,000. |
(3) | Represents non-recurring management transition and restructuring costs plus costs associated with recruitment of a new Chief Executive Officer and Chief Financial Officer. |
(4) | Represents impairment of our e-commerce platform based on the decision to move to a third-party developed and hosted solution. |
(5) | Represents non-cash charges associated with the disposal or impairment of store assets upon the determination that the book value of certain stores was higher than the fair value of those stores, plus lease buyouts and reserves for the residual contractual lease obligations on closed stores. |
(6) | Payments and accruals made toward franchisee settlements and litigation reserves. |
Depreciation and amortization | |||||||||||
(in thousands) | 2017 | 2016 | 2015 | ||||||||
Domestic Franchise | $ | 5,891 | $ | 6,606 | $ | 5,392 | |||||
Domestic Company Stores | 4,530 | 5,599 | 4,579 | ||||||||
International | 31 | 31 | 31 | ||||||||
Total | $ | 10,452 | $ | 12,236 | $ | 10,002 | |||||
Total Assets | |||||||||||
(in thousands) | 2017 | 2016 | 2015 | ||||||||
Domestic Franchise | $ | 119,964 | $ | 133,466 | $ | 139,705 | |||||
Domestic Company Stores | 38,674 | 52,531 | 45,217 | ||||||||
International | 336 | 318 | 438 | ||||||||
Other (1) | 87,200 | 87,557 | 90,111 | ||||||||
Total | $ | 246,174 | $ | 273,872 | $ | 275,471 | |||||
(1) | Other assets which are not allocated to the individual segments primarily include trade names & trademarks. |
All long-lived assets are held within the United States.
81
Note 19 — Selected Quarterly Financial Data (unaudited) |
The following table presents selected unaudited quarterly financial data for the periods indicated:
(in thousands, except per share data) | Q1 | Q2 | Q3 | Q4 | |||||||||||
2017 | |||||||||||||||
Revenue | $ | 31,994 | $ | 29,102 | $ | 26,824 | $ | 30,741 | |||||||
Operating (Loss) Income | (7,945 | ) | (6,861 | ) | (2,081 | ) | 2,619 | ||||||||
Net (Loss) Income | (5,414 | ) | (6,187 | ) | (1,869 | ) | 13,463 | ||||||||
Basic (loss) earnings per share | $ | (0.32 | ) | $ | (0.37 | ) | $ | (0.11 | ) | $ | 0.80 | ||||
Diluted (loss) earnings per share | $ | (0.32 | ) | $ | (0.37 | ) | $ | (0.11 | ) | $ | 0.79 | ||||
2016 | |||||||||||||||
Revenue | $ | 32,985 | $ | 29,894 | $ | 28,519 | $ | 35,485 | |||||||
Operating Income | 2,323 | 2,813 | 691 | 3,821 | |||||||||||
Net Income (Loss) | 642 | 952 | (421 | ) | 1,476 | ||||||||||
Basic earnings (loss) per share | $ | 0.04 | $ | 0.06 | $ | (0.03 | ) | $ | 0.09 | ||||||
Diluted earnings (loss) per share | $ | 0.04 | $ | 0.06 | $ | (0.03 | ) | $ | 0.09 | ||||||
The sum of the quarterly earnings per share does not always equal the annual earnings per share as a result of the computation of quarterly versus annual average shares outstanding.
82
Report of Independent Registered Public Accounting Firm
To the Shareholders and the Board of Directors of
Papa Murphy’s Holdings, Inc.
Opinion of the Financial Statements
We have audited the accompanying consolidated balance sheets of Papa Murphy’s Holdings, Inc. and subsidiaries (the “Company”) as of January 1, 2018 and January 2, 2017, the related consolidated statements of operations, shareholders’ equity, and cash flows for each of the three years in the period ended January 1, 2018, and the related notes and schedules (collectively referred to as the “consolidated financial statements”). In our opinion, the consolidated financial statements referred to above present fairly, in all material respects, the consolidated financial position of the Company as of January 1, 2018 and January 2, 2017, and the consolidated results of its operations and its cash flows for the years then ended, in conformity with accounting principles generally accepted in the United States of America.
Basis for Opinion
These consolidated financial statements and financial statement schedules are the responsibility of the Company’s management. Our responsibility is to express an opinion on the Company’s consolidated financial statements based on our audits. We are a public accounting firm registered with the Public Company Accounting Oversight Board (United States) (“PCAOB”) and are required to be independent with respect to the Company in accordance with the U.S. federal securities laws and the applicable rules and regulations of the Securities and Exchange Commission and the PCAOB.
We conducted our audits in accordance with the standards of the PCAOB. Those standards require that we plan and perform the audit to obtain reasonable assurance about whether the consolidated financial statements are free of material misstatement, whether due to error or fraud. The Company is not required to have, nor were we engaged to perform, an audit of its internal control over financial reporting. As part of our audits, we are required to obtain an understanding of internal control over financial reporting but not for the purpose of expressing an opinion on the effectiveness of the Company’s internal control over financial reporting. Accordingly, we express no opinion.
Our audits included performing procedures to assess the risks of material misstatement of the consolidated financial statements, whether due to error or fraud, and performing procedures to respond to those risks. Such procedures included examining, on a test basis, evidence regarding the amounts and disclosures in the consolidated financial statements. Our audits also included evaluating the accounting principles used and significant estimates made by management, as well as evaluating the overall presentation of the consolidated financial statements. We believe that our audits provide a reasonable basis for our opinion.
/s/ Moss Adams LLP
Portland, Oregon
March 14, 2018
We have served as the Company’s auditor since 2006.
83
Item 9. Changes in and Disagreements With Accountants on Accounting and Financial Disclosure
None.
Item 9A. Controls and Procedures
Evaluation of Disclosure Controls and Procedures |
Our management, with the participation of our Chief Executive Officer and Chief Financial Officer has evaluated the effectiveness of our disclosure controls and procedures as of the end of the period covered by this report, pursuant to Rules 13a-15 and 15d-15 under the Securities Exchange Act of 1934 (“Exchange Act”). Based on that evaluation, our Chief Executive Officer and Chief Financial Officer concluded that, as of the end of the period covered by this report, our disclosure controls and procedures are effective to provide reasonable assurance that information we are required to disclose in reports that we file or submit under the Exchange Act is recorded, processed, summarized, and reported within the time periods specified in SEC rules and forms, and that such information is accumulated and communicated to our management, including our Chief Executive Officer and Chief Financial Officer, as appropriate, to allow timely decisions regarding required disclosure.
Management’s Annual Report on Internal Control over Financial Reporting |
Our management is responsible for establishing and maintaining adequate internal control over financial reporting (as defined in Rule 13a-15(f) under the Exchange Act). With the participation of our Chief Executive Officer and Chief Financial Officer, our management evaluated the effectiveness of our internal control over financial reporting based on the framework issued by the Committee of Sponsoring Organizations of the Treadway Commission (“COSO”) in Internal Control—Integrated Framework (2013). Based on our evaluation under the framework in Internal Control—Integrated Framework (2013), our management concluded that our internal control over financial reporting was effective as of January 1, 2018.
We have not engaged an independent registered accounting firm to perform an audit of our internal control over financial reporting as of any balance sheet date or for any period reported in our financial statements. Our independent public registered accounting firm will first be required to attest to the effectiveness of our internal control over financial reporting for our Annual Report on Form 10-K for the first year we are no longer an “emerging growth company.”
Changes in Internal Control over Financial Reporting |
There have been no changes in our internal control over financial reporting (as defined in Rule 13a-15(f) of the Exchange Act) that occurred during our last fiscal quarter that have materially affected, or are reasonably likely to materially affect, our internal control over financial reporting. During fiscal year 2017, we implemented internal controls to ensure we have adequately evaluated our contracts and properly assessed the impact of the new accounting standards related to revenue recognition and leases on our financial statements to facilitate the adoption of these new accounting standards on January 2, 2018. We do not expect any further significant changes to our internal control over financial reporting due to the adoption of the new standards.
Item 9B. Other Information
None.
84
PART III
Item 10. Directors, Executive Officers and Corporate Governance
The information required by this item is incorporated by reference to our Definitive Proxy Statement for our 2018 Annual Meeting of Stockholders. The Definitive Proxy Statement will be filed with the Securities and Exchange Commission within 120 days after the end of our 2017 fiscal year.
Item 11. Executive Compensation
The information required by this item is incorporated by reference to our Definitive Proxy Statement for our 2018 Annual Meeting of Stockholders. The Definitive Proxy Statement will be filed with the Securities and Exchange Commission within 120 days after the end of our 2017 fiscal year.
Item 12. Security Ownership of Certain Beneficial Owners and Management and Related Stockholder Matters
The information required by this item is incorporated by reference to our Definitive Proxy Statement for our 2018 Annual Meeting of Stockholders. The Definitive Proxy Statement will be filed with the Securities and Exchange Commission within 120 days after the end of our 2017 fiscal year.
Item 13. Certain Relationships and Related Transactions, and Director Independence
The information required by this item is incorporated by reference to our Definitive Proxy Statement for our 2018 Annual Meeting of Stockholders. The Definitive Proxy Statement will be filed with the Securities and Exchange Commission within 120 days after the end of our 2017 fiscal year.
Item 14. Principal Accountant Fees and Services
The information required by this item is incorporated by reference to our Definitive Proxy Statement for our 2018 Annual Meeting of Stockholders. The Definitive Proxy Statement will be filed with the Securities and Exchange Commission within 120 days after the end of our 2017 fiscal year.
85
PART IV
Item 15. Exhibits and Financial Statement Schedules
(a) | The following documents are filed as part of this report: | |
Form 10-K Page No. | ||
1. | Financial Statements: The following financial statements are included in Item 8. “Financial Statements and Supplementary Data”: | |
Consolidated Statements of Operations for the Fiscal Years ended January 1, 2018, January 2, 2017, and December 28, 2015 | ||
Consolidated Balance Sheets as of January 1, 2018 and January 2, 2017 | ||
Consolidated Statements of Shareholders’ Equity for the Fiscal Years ended January 1, 2018, January 2, 2017, and December 28, 2015 | ||
Consolidated Statements of Cash Flows for the Fiscal Years ended January 1, 2018, January 2, 2017, and December 28, 2015 | ||
Notes to Consolidated Financial Statements | ||
Report of Independent Registered Public Accounting Firm | ||
2. | Financial Statement Schedule: | |
Schedule I - Condensed Financial Information of the Registrant | ||
Schedule II - Valuation and Qualifying Accounts | ||
All other schedules are omitted because they are not applicable, not required or the required information is shown in the financial statements or the notes thereto. | ||
3. | Exhibits: | |
Incorporated By Reference | |||||
Exhibit | File | Filing | |||
Number | Description Of Exhibits | Form | Number | Exhibit | Date |
3.1 | 8-K | 001-36432 | 3.1 | May 13, 2014 | |
3.2 | 8-K | 001-36432 | 3.1 | December 22, 2016 | |
4.1 | S-1/A | 333-194488 | 4.1 | April 28, 2014 | |
4.2 | 8-K | 001-36432 | 4.1 | May 13, 2014 | |
10.1‡ | S-1/A | 333-194488 | 10.1 | April 4, 2014 | |
10.2 | 8-K | 001-36432 | 10.1 | May 13, 2014 | |
10.3 | 10-Q | 001-36432 | 10.1 | November 13, 2014 | |
10.4‡ | S-1/A | 333-194488 | 10.5 | April 28, 2014 | |
10.5 | S-1/A | 333-194488 | 10.6 | April 4, 2014 | |
10.6 | S-1/A | 333-194488 | 10.7 | April 4, 2014 | |
10.7 | S-1/A | 333-194488 | 10.8 | April 4, 2014 | |
10.8*‡ | |||||
10.9‡ | S-1/A | 333-194488 | 10.20 | April 21, 2014 | |
10.10‡ | S-1/A | 333-194488 | 10.21 | April 21, 2014 | |
86
Incorporated By Reference | |||||
Exhibit | File | Filing | |||
Number | Description Of Exhibits | Form | Number | Exhibit | Date |
10.11‡ | S-1/A | 333-194488 | 10.22 | April 21, 2014 | |
10.12‡ | S-1/A | 333-194488 | 10.23 | April 21, 2014 | |
10.13‡ | S-1/A | 333-194488 | 10.24 | April 21, 2014 | |
10.14‡ | S-1/A | 333-194488 | 10.25 | April 21, 2014 | |
10.15‡ | S-1/A | 333-194488 | 10.26 | April 21, 2014 | |
10.16 | S-1/A | 333-194488 | 10.27 | April 21, 2014 | |
10.17 | S-1/A | 333-194488 | 10.28 | April 21, 2014 | |
10.18‡ | S-1/A | 333-194488 | 10.29 | April 28, 2014 | |
10.19 | 10-Q | 001-36432 | 10.1 | November 2, 2016 | |
10.20 | 10-K | 001-36432 | 10.32 | March 15, 2017 | |
10.21 | 10-K | 001-36432 | 10.33 | March 15, 2017 | |
10.22‡ | 10-K | 001-36432 | 10.16 | March 15, 2017 | |
10.23‡ | 10-K | 001-36432 | 10.18 | March 15, 2017 | |
10.24‡ | 10-Q | 001-36432 | 10.1 | May 10, 2017 | |
10.25‡ | 10-Q | 001-36432 | 10.2 | May 10, 2017 | |
10.26*‡ | |||||
10.27 | 8-K | 001-36432 | 10.1 | December 21, 2017 | |
10.28 | 8-K | 001-36432 | 10.2 | December 21, 2017 | |
21.1* | |||||
23.1* | |||||
24.1* | |||||
31.1* | |||||
31.2* | |||||
32.1* | |||||
32.2* | |||||
87
Incorporated By Reference | |||||
Exhibit | File | Filing | |||
Number | Description Of Exhibits | Form | Number | Exhibit | Date |
101.INS* | XBRL Instance Document | ||||
101.SCH* | XBRL Taxonomy Extension Schema Document | ||||
101.CAL* | XBRL Taxonomy Extension Calculation Linkbase Document | ||||
101.DEF* | XBRL Taxonomy Extension Definition Linkbase Document | ||||
101.LAB* | XBRL Taxonomy Extension Label Linkbase Document | ||||
101.PRE* | XBRL Taxonomy Extension Presentation Linkbase Document | ||||
* Filed herewith
‡ A management contract or compensatory plan or arrangement
88
SCHEDULE I—CONDENSED FINANCIAL INFORMATION OF REGISTRANT
Papa Murphy’s Holdings, Inc. |
Parent Company Information
Condensed Statements of (Loss) Income
Fiscal Year | |||||||||||
(in thousands) | 2017 | 2016 | 2015 | ||||||||
Equity in (losses) earnings of subsidiaries | $ | (16,718 | ) | $ | 6,905 | $ | 9,486 | ||||
Selling, general, and administrative expense | 2,636 | 2,140 | 2,380 | ||||||||
Operating (Loss) Income | (19,354 | ) | 4,765 | 7,106 | |||||||
Other expense, net | 200 | 180 | 136 | ||||||||
(Loss) Income Before Income Taxes | (19,554 | ) | 4,585 | 6,970 | |||||||
(Benefit from) provision for income taxes | (19,547 | ) | 1,936 | 2,059 | |||||||
Net (Loss) Income | (7 | ) | 2,649 | 4,911 | |||||||
See accompanying notes.
89
SCHEDULE I—CONDENSED FINANCIAL INFORMATION OF REGISTRANT
Papa Murphy’s Holdings, Inc. |
Parent Company Information
Condensed Balance Sheets
(in thousands, except par value and share data) | January 1, 2018 | January 2, 2017 | |||||
Assets | |||||||
Current Assets | |||||||
Prepaid expenses and other current assets | $ | 183 | $ | 547 | |||
Total current assets | 183 | 547 | |||||
Investment in affiliates | 128,631 | 145,349 | |||||
Total assets | $ | 128,814 | $ | 145,896 | |||
Liabilities and Equity | |||||||
Current Liabilities | |||||||
Other current liabilities | $ | 56 | $ | 36 | |||
Due to consolidated affiliates | 2,130 | 185 | |||||
Total current liabilities | 2,186 | 221 | |||||
Deferred tax liability | 24,457 | 44,179 | |||||
Total liabilities | $ | 26,643 | $ | 44,400 | |||
Commitments and contingencies | |||||||
Shareholders’ Equity | |||||||
Preferred stock ($0.01 par value; 15,000,000 shares authorized; no shares issued or outstanding) | — | — | |||||
Common stock ($0.01 par value; 200,000,000 shares authorized; 16,971,461 and 16,955,970 shares issued and outstanding, respectively) | 170 | 170 | |||||
Additional paid-in capital | 120,614 | 119,932 | |||||
Accumulated deficit | (18,613 | ) | (18,606 | ) | |||
Total shareholders’ equity | 102,171 | 101,496 | |||||
Total liabilities and shareholders’ equity | $ | 128,814 | $ | 145,896 | |||
See accompanying notes.
90
SCHEDULE I—CONDENSED FINANCIAL INFORMATION OF REGISTRANT
Papa Murphy’s Holdings, Inc. |
Parent Company Information
Condensed Statements of Cash Flows
Fiscal Year | |||||||||||
(in thousands) | 2017 | 2016 | 2015 | ||||||||
Net cash (used in) provided by operating activities | $ | 6 | $ | (209 | ) | $ | (7,278 | ) | |||
Investing Activities | |||||||||||
(Deemed) dividend from subsidiary | — | — | 6,912 | ||||||||
Net cash provided by (used in) investing activities | — | — | 6,912 | ||||||||
Financing Activities | |||||||||||
Repurchases of common stock | (6 | ) | (84 | ) | (10 | ) | |||||
Proceeds from exercise of stock options | — | 293 | 376 | ||||||||
Net cash provided by financing activities | (6 | ) | 209 | 366 | |||||||
Net change in cash and cash equivalents | — | — | — | ||||||||
Cash and Cash Equivalents, beginning of year | — | — | — | ||||||||
Cash and Cash Equivalents, end of period | $ | — | $ | — | $ | — | |||||
See accompanying notes.
91
SCHEDULE I—CONDENSED FINANCIAL INFORMATION OF REGISTRANT
Papa Murphy’s Holdings, Inc. |
Parent Company Information
Notes to Condensed Financial Information
Note 1—Basis of Presentation |
Papa Murphy’s Holdings, Inc. (the “Parent Company”) is a holding company with no material operations of its own that conducts substantially all of its activities through its subsidiaries.
These consolidated financial statements have been presented on a “parent-only” basis. Under a parent-only presentation, the Parent Company’s investments in subsidiaries are presented under the equity method of accounting. Certain information and footnote disclosures normally included in financial statements prepared in accordance with GAAP have been condensed or omitted. As such, these parent-only statements should be read in conjunction with the Notes to Consolidated Financial Statements of Papa Murphy’s Holdings, Inc. and subsidiaries included in Financial Statements and Supplementary Data.
92
Schedule II—Valuation and Qualifying Accounts
Papa Murphy’s Holdings, Inc. and Subsidiaries |
Balance at Beginning of Period | Charged to costs and expenses | (Write-offs), Net of Recoveries | Balance at End of Period | ||||||||||||
Fiscal year 2017 | |||||||||||||||
Allowance for trade and other receivables | $ | 37 | $ | 48 | $ | (18 | ) | $ | 67 | ||||||
Fiscal year 2016 | |||||||||||||||
Allowance for trade and other receivables | $ | 31 | $ | 6 | $ | — | $ | 37 | |||||||
Fiscal year 2015 | |||||||||||||||
Allowance for trade and other receivables | $ | 60 | $ | (30 | ) | $ | 1 | $ | 31 | ||||||
93
SIGNATURES
Pursuant to the requirements of the Securities Exchange Act of 1934, the registrant has duly caused this report to be signed on its behalf by the undersigned, hereunto duly authorized, on March 14, 2018.
PAPA MURPHY’S HOLDINGS, INC. | |||
By: | /s/ Mark Hutchens | ||
Name: | Mark Hutchens | ||
Title: | Executive Vice President, Chief Operating Officer, and Chief Financial Officer | ||
Pursuant to the requirements of the Securities Exchange Act of 1934, this report has been signed below by the following persons on behalf of the registrant in the capacities and on the dates indicated.
SIGNATURE | TITLE | DATE | |
/s/ Weldon Spangler | Chief Executive Officer | March 14, 2018 | |
Weldon Spangler | (Principal Executive Officer) and Director | ||
/s/ Mark Hutchens | Executive Vice President, Chief Operating Officer, and Chief Financial Officer | March 14, 2018 | |
Mark Hutchens | (Principal Financial Officer and Principal Accounting Officer) | ||
/s/ Jean Birch* | Chair of the Board | March 14, 2018 | |
Jean Birch | |||
/s/ Benjamin Hochberg* | Director | March 14, 2018 | |
Benjamin Hochberg | |||
/s/ Yoo Jin Kim* | Director | March 14, 2018 | |
Yoo Jin Kim | |||
/s/ L. David Mounts* | Director | March 14, 2018 | |
L. David Mounts | |||
/s/ John Shafer* | Director | March 14, 2018 | |
John Shafer | |||
/s/ Rob Weisberg* | Director | March 14, 2018 | |
Rob Weisberg | |||
/s/ Katherine L. Scherping* | Director | March 14, 2018 | |
Katherine L. Scherping | |||
/s/ Noah Elbogen* | Director | March 14, 2018 | |
Noah Elbogen | |||
/s/ Alex Matina* | Director | March 14, 2018 | |
Alex Matina | |||
*By: | /s/ Mark Hutchens | |
Mark Hutchens | ||
Attorney-in-fact pursuant to filed Power of Attorney | ||
94