Attached files
| file | filename |
|---|---|
| EX-32.2 - EX-32.2 - Gates Industrial Corp plc | d547886dex322.htm |
| EX-32.1 - EX-32.1 - Gates Industrial Corp plc | d547886dex321.htm |
| EX-31.2 - EX-31.2 - Gates Industrial Corp plc | d547886dex312.htm |
| EX-31.1 - EX-31.1 - Gates Industrial Corp plc | d547886dex311.htm |
| EX-23.1 - EX-23.1 - Gates Industrial Corp plc | d547886dex231.htm |
| EX-21.1 - EX-21.1 - Gates Industrial Corp plc | d547886dex211.htm |
Table of Contents
UNITED STATES
SECURITIES AND EXCHANGE COMMISSION
Washington, D.C. 20549
FORM 10-K
| ☒ | ANNUAL REPORT PURSUANT TO SECTION 13 OR 15(d) OF THE SECURITIES EXCHANGE ACT OF 1934 |
For the fiscal year ended December 30, 2017
Commission file number 001-38366
Gates Industrial Corporation plc
(Exact Name of Registrant as Specified in its Charter)
| England and Wales | 98-1395184 | |
| (State or other jurisdiction of incorporation or organization) |
(I.R.S. Employer Identification Number) |
| 1551 Wewatta Street, Denver, Colorado | 80202 | |
| (Address of principal executive offices) | (Zip Code) |
(303) 744-1911
(Registrant’s telephone number, including area code)
Securities registered pursuant to Section 12(b) of the Act:
| Title of each class |
Name of each exchange on which registered | |
| Ordinary Shares, $0.01 par value | New York Stock Exchange |
Securities registered pursuant to Section 12(g) of the Act: None
Indicate by check mark if the registrant is a well-known seasoned issuer, as defined in Rule 405 of the Securities Act. Yes ☐ No ☒
Indicate by check mark if the registrant is not required to file reports pursuant to Section 13 or Section 15(d) of the Act. Yes ☐ No ☒
Indicate by check mark whether the registrant (1) has filed all reports required to be filed by Section 13 or 15(d) of the Securities Exchange Act of 1934 during the preceding 12 months (or for such shorter period that the registrant was required to file such reports), and (2) has been subject to such filing requirements for the past 90 days. Yes ☐ No ☒
Indicate by check mark whether the registrant has submitted electronically and posted on its corporate Web site, if any, every Interactive Data File required to be submitted and posted pursuant to Rule 405 of Regulation S-T during the preceding 12 months (or for such shorter period that the registrant was required to submit and post such files). Yes ☒ No ☐
Indicate by check mark if disclosure of delinquent filers pursuant to Item 405 of Regulation S-K is not contained herein, and will not be contained, to the best of registrants’ knowledge, in definitive proxy or information statements incorporated by reference in Part III of this Form 10-K or any amendment to this Form 10-K. ☒
Indicate by check mark whether the registrant is a large accelerated filer, an accelerated filer, a non-accelerated filer, smaller reporting company or emerging growth company. See the definitions of “large accelerated filer,” “accelerated filer,” “smaller reporting company” and “emerging growth company” in Rule 12b-2 of the Exchange Act. (Check one):
| Large accelerated filer | ☐ | Accelerated filer | ☐ | |||
| Non-accelerated filer | ☒ (Do not check if a smaller reporting company) | Smaller reporting company | ☐ | |||
| Emerging growth company | ☐ | |||||
Indicate by check mark whether the registrant is a shell company (as defined in Rule 12b-2 of the Exchange Act). Yes ☐ No ☒
As of July 1, 2017, the last day of the registrant’s most recently completed second quarter, the registrant’s common stock was not publicly traded. The registrant’s ordinary shares, $0.01 par value per share, began trading on the New York Stock Exchange on January 25, 2018. As of March 8, 2018 the aggregate market value of the registrant’s ordinary shares held by non-affiliates of the registrant was $783.7 million (based upon the closing sale price of the common stock on that date on the New York Stock Exchange). As of March 8, 2018, there were 289,745,605 million ordinary shares outstanding.
Table of Contents
| Part I |
||||
| 1 | ||||
| 10 | ||||
| 34 | ||||
| 34 | ||||
| 34 | ||||
| 34 | ||||
| Part II |
||||
| 35 | ||||
| 36 | ||||
| Item 7. Management’s Discussion and Analysis of Financial Condition and Results of Operations |
38 | |||
| Item 7A. Quantitative and Qualitative Disclosures about Market Risk |
64 | |||
| 67 | ||||
| Item 9. Changes in and Disagreements with Accountants on Accounting and Financial Disclosure |
67 | |||
| 67 | ||||
| 68 | ||||
| Part III |
||||
| Item 10. Directors, Executive Officers and Corporate Governance |
68 | |||
| 74 | ||||
| 99 | ||||
| Item 13. Certain Relationships and Related Transactions, and Director Independence |
102 | |||
| 106 | ||||
| Part IV |
||||
| 106 | ||||
| 108 | ||||
| 109 | ||||
Table of Contents
Forward-looking statements
This Annual Report on Form 10-K (this “annual report” or “report”) contains forward-looking statements within the meaning of Section 27A of the Securities Act of 1933, as amended (the “Securities Act”) and Section 21E of the Securities Exchange Act of 1934, as amended (the “Exchange Act”) that reflect our current views with respect to, among other things, our operations and financial performance. Forward-looking statements include all statements that are not historical facts. In some cases, you can identify these forward-looking statements by the use of words such as “outlook,” “believes,” “expects,” “potential,” “continues,” “may,” “will,” “should,” “could,” “seeks,” “predicts,” “intends,” “trends,” “plans,” “estimates,” “anticipates” or the negative version of these words or other comparable words. Such forward-looking statements are subject to various risks and uncertainties. Accordingly, there are or will be important factors that could cause actual outcomes or results to differ materially from those indicated in these statements. These factors include but are not limited to those described under “Part I—Item 1A. Risk Factors.” These factors should not be construed as exhaustive and should be read in conjunction with the other cautionary statements that are included in this annual report. We undertake no obligation to publicly update or review any forward-looking statement, whether as a result of new information, future developments or otherwise, except as required by law.
Social Media
We use our website (www.gates.com), our corporate Facebook page @GatesCorporation and our corporate Twitter account @GatesAuto as channels of distribution of company information. The information we post through these channels may be deemed material. Accordingly, investors should monitor these channels, in addition to following our press releases, Securities and Exchange Commission filings and public conference calls and webcasts. The contents of our website and social media channels are not, however, a part of this report.
ABOUT THIS ANNUAL REPORT
Financial Statement Presentation
This annual report includes certain historical consolidated financial and other data for Omaha Topco Limited, an exempted company incorporated in the Cayman Islands with limited liability (“Omaha Topco”). Omaha Topco was formed by Blackstone (as defined below) primarily as a vehicle to finance the acquisition in July 2014 of the entire equity interest in Pinafore Holdings B.V. for $5.4 billion (the “Acquisition”) by investment funds managed by Blackstone. Following the Acquisition, Pinafore Holdings B.V. and its subsidiaries (the “Pre-Acquisition Predecessor”) is the predecessor to the group comprised of Omaha Topco and its subsidiaries (the “Post-Acquisition Predecessor”).
The last day of the fiscal year for the Post-Acquisition Predecessor’s annual consolidated financial statements is the Saturday nearest December 31. Accordingly, the Post-Acquisition Predecessor’s consolidated financial statements are presented for the periods from January 1, 2017 to December 30, 2017 (“Fiscal 2017”), January 3, 2016 to December 31, 2016 (“Fiscal 2016”) and January 4, 2015 to January 2, 2016 (“Fiscal 2015”).
Gates Industrial Corporation plc is a public limited company that was organized under the laws of England and Wales on September 25, 2017. It is the financial reporting entity following the completion of its initial public offering (the “IPO”) in January 2018. Prior to the completion of the IPO, we undertook certain reorganization transactions (the “pre-IPO reorganization transactions”) so that Gates Industrial Corporation plc now indirectly owns all equity interests in Omaha Topco and is the holding company of our business. In connection with the pre-IPO reorganization transactions, the equity owners of Omaha Topco received depositary receipts representing ordinary shares in Gates Industrial Corporation plc in consideration for their equity in Omaha Topco, at a ratio of 0.76293 of our ordinary shares for each outstanding ordinary share of Omaha Topco. The reorganization was accounted for as a transaction between entities under common control in a manner similar to pooling-of-interest and the net assets were recorded at the historical cost basis when the entities were contributed into Gates Industrial Corporation plc.
Gates Industrial Corporation plc is a newly organized entity and had no significant business transactions or activities prior to the pre-IPO reorganization transactions, and, as a result, the historical financial information reflects that of Omaha Topco.
Certain monetary amounts, percentages and other figures included elsewhere in this annual report have been subject to rounding adjustments. Accordingly, figures shown as totals in certain tables or charts may not be the arithmetic aggregation of the figures that precede them, and figures expressed as percentages in the text may not total 100% or, as applicable, when aggregated may not be the arithmetic aggregation of the percentages that precede them.
Table of Contents
Certain Definitions
As used in this annual report, unless otherwise noted or the context requires otherwise:
| • | “Gates,” the “Company,” “we,” “us” and “our” refer (1) prior to the consummation of the IPO and the pre-IPO reorganization transactions, to Omaha Topco and its consolidated subsidiaries and (2) after the consummation of the IPO and the pre-IPO reorganization transactions, to Gates Industrial Corporation plc and its consolidated subsidiaries, as the case may be; |
| • | “Blackstone” or “our Sponsor” refer to investment funds affiliated with The Blackstone Group L.P., our current majority owners; |
| • | “car parc” refers to the number of light vehicles in a region, it is typically used to gauge the size of replacement markets within a region; |
| • | “notes issuers” refers to Gates Global LLC, a Delaware limited liability company and indirect subsidiary of the Company, and Gates Global Co., a Delaware corporation and subsidiary of Gates Global LLC, which co-issued our senior notes; and |
| • | “pre-IPO owners” refer to our Sponsor together with the other owners of Omaha Topco, prior to the IPO. |
Table of Contents
Part I
We are a global manufacturer of innovative, highly engineered power transmission and fluid power solutions. We offer a broad portfolio of products to diverse replacement channel customers, and to original equipment (“first-fit”) manufacturers as specified components, with the majority of our revenue coming from replacement channels. Our products are used in applications across numerous end markets, which include construction, agriculture, energy, automotive, transportation, general industrial, consumer products and many others. Our revenue has historically been highly correlated with industrial activity and utilization, and not with any single end market given the diversification of our business and high exposure to replacement markets. Key indicators of our performance include industrial production, industrial sales and manufacturer shipments. We sell our products globally under the Gates brand, which is recognized by distributors, equipment manufacturers, installers and end users as a premium brand for quality and technological innovation; this reputation has been built for over a century since Gates’ founding in 1911.
Within the diverse end markets we serve, our highly engineered products are critical components in applications for which the cost of downtime is high relative to the cost of our products, resulting in the willingness of end users to pay a premium for superior performance and availability. These applications subject our products to normal wear and tear, resulting in a natural replacement cycle that drives high-margin, recurring revenue. Our product portfolio represents one of the broadest ranges of power transmission and fluid power products in the markets we serve, and we maintain long-standing relationships with a diversified group of blue-chip customers throughout the world. As a leading designer, manufacturer and marketer of highly engineered, mission-critical products, we have become an industry leader across most of the regions and end markets in which we operate.
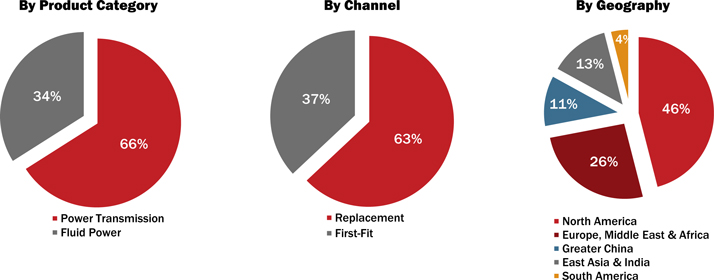
Gates’ business is well-balanced and diversified across products, channels and geographies, as highlighted in the following charts showing breakdowns of our Fiscal 2017 net sales of $3,042 million.
Our History and Recent Developments
On October 1, 1911, Charles Gates, Sr. purchased the Colorado Tire and Leather Company, a manufacturer of steel-studded bands of leather that attached to tires to extend their mileage. In 1917, the Company commercialized the V-belt, which used rubber and woven threading instead of rope belts, which were more commonly used at that time. In 1963, we built the first of many international facilities in Erembodegem, Belgium, followed by Jacarei, Brazil, in 1973. In 1986 Gates acquired the Uniroyal Power Transmission Company, which included an interest in the Unitta joint venture that lay the groundwork for Gates’ growth in the Asia-Pacific region. We have full operational control over the joint venture, and as such consolidate it in our financial statements.
In 1996, the Gates was acquired by a publicly held engineering firm based in the United Kingdom, Tomkins plc, which was itself acquired by Onex Partners and the Canada Pension Plan Investment Board, who proceeded to divest certain of Tomkins plc’s businesses under a new parent entity, Pinafore Holdings B.V. Gates was acquired by funds affiliated with The Blackstone Group L.P. in July 2014.
1
Table of Contents
Gates has developed an active acquisition pipeline and the organizational capability to integrate acquired companies. In 2017, we closed two transactions, Techflow Flexibles in the United Kingdom and Atlas Hydraulics in North America, both focused on expanding our presence in industrial markets with new products, capabilities, capacity and geographic reach.
Our Solutions
We operate our business on a product-line basis through our two reporting segments – Power Transmission and Fluid Power. See note 5 of our audited consolidated financial statements included elsewhere in this report for additional information.
We sell our products under the Gates brand in all geographies and end markets. Our power transmission segment includes elastomer drive belts and related components used to efficiently transfer motion in a broad range of applications. Power transmission products represented approximately 66% of our total net sales for Fiscal 2017. Our fluid power segment includes hoses, tubing and fittings designed to convey hydraulic fluid at high pressures in both mobile and stationary applications, and other high-pressure and fluid transfer hoses used to convey various fluids. Our fluid power products represented approximately 34% of our net sales for Fiscal 2017.
Our power transmission and fluid power products are often critical to the functioning of the equipment, process or system in which they are components, such that the cost of downtime or potential equipment damage is high relative to the cost of our products. Our products are therefore replaced not only as a result of normal wear and tear, but also preemptively as part of ongoing maintenance to the broader system.
We believe that we provide industry-leading delivery times for our products and have a broad portfolio of both power transmission and fluid power products in the end markets we serve. We have a long history of focusing on customer engagement and training, driving product innovation and providing best-in-class order fulfilment services. This allows us to maintain a consistently high level of customer satisfaction, driving continued loyalty among our customer base.
Power Transmission. Our Power Transmission solutions enable and control motion. They are used in applications in which belts, chains, cables, geared transmissions or direct drives transfer power from an engine or motor to another part or system. Belt-based power transmission drives typically consist of either a synchronous belt or an asynchronous belt (V-belt, CVT belt or Micro-V® belt) and related components (sprockets, pulleys, water pumps, tensioners or other accessories). Within our Power Transmission segment, we offer solutions across the following key application platforms:

| • | Stationary drives: fixed drive systems such as those used in a factory driving a machine or pump, or on a grain elevator driving the lift auger. |
| • | Mobile drives: drives on a piece of mobile machinery such as a combine harvester or a road compactor, or in applications such as the brush head of a vacuum cleaner. |
| • | Engine systems: synchronous drives and related components for cam shafts and auxiliary drives and asynchronous accessory drives for A/C compressors, power steering, alternators and starter/generator systems. |
2
Table of Contents
| • | Personal mobility: drives on motorcycles, scooters, bicycles, snowmobiles and other power sports vehicles that are used to transfer power between the power source and the drive wheel(s) or track. |
| • | Vertical lift: elevators, cargo lifts and other applications in which a belt, cable, chain or other lifting mechanism is used to carry load. |
Customers choose power transmission solutions based on a number of factors, including application requirements such as load, speed, gear ratio, temperature, operating environment, ease of maintenance, noise, efficiency and reliability, as well as the support they receive from their suppliers, including application-specific engineering. Belt-based drive systems have many advantages over other alternatives, as they are typically clean, low-maintenance, lubrication-free, quiet with low-vibration, light-weight, compact, energy-efficient, durable and reliable. In applications where these advantages are valued, customers typically choose belts over other forms of power transmission solutions.
Our belts are classified by their general design into asynchronous and synchronous belts; in addition, we also manufacture metal drive products and assemble automotive replacement kits.
Asynchronous Belts. Asynchronous belts are our highest-volume products and are used in a broad range of applications. Asynchronous belts are made of proprietary rubber formulations, textiles and embedded cords for reinforcement. We were a pioneer in the design and manufacturing of V-belts, which draw their name from the shape of their profile. We also manufacture “ribbed” V-belts, which are belts with lengthwise V-shaped grooves, which we market under the Micro-V® name. This design results in a thinner belt for the same drive surface, making it more flexible and offering improved efficiency through lower friction losses. Belt starter/generator (“BSG”) belts are used in start/stop accessory drive systems on automobiles and other engine applications used to improve fuel economy. The demanding BSG system functionality, including engine starting, torque boosting and energy recuperation, requires a high-performance belt construction. Continuously-variable transmission (“CVT”) systems found in scooters, power sports vehicles and other applications use a specialized V-belt knows as a CVT belt.
In industrial end markets, asynchronous belts have a wide variety of applications, including use in pump drives, manufacturing lines, HVAC systems, industrial engines, truck, bus and marine engines, forestry and mining equipment and many other applications. In automotive applications, our asynchronous belts perform functions that include transferring power from the crankshaft to accessory drive components such as the alternator, A/C compressor, power steering system, water pump and, in some vehicles, a BSG system.

Synchronous Belts. Synchronous belts, also known as timing belts, are non-slipping mechanical drive belts. They have teeth molded onto the inner surface and they run over matching toothed pulleys or sprockets. Synchronous belts experience no slippage and are often used to transfer motion for indexing or timing purposes, as well as for linear positioning and positive drive conveying. They are typically used instead of chains or gears and we believe have a number of advantages over these alternatives, including less noise, no need for lubrication, improved durability and performance and a more compact design. Our synchronous belts are made of a flexible polymer over fabric reinforcement and are often built with Kevlar, aramid and carbon fibers.
3
Table of Contents
Examples of industrial applications include use in HVAC systems, food processing and bottling plants, mining and agricultural equipment, automatic doors and robotics. In automotive applications, our synchronous belts are used to synchronize the rotation of the engine crankshaft with the camshaft due to engine combustion in a valve train system, as well as in electric power steering and parking brake systems which are present in gasoline-powered, hybrid and electric vehicles.

Metal Drive Components. We manufacture and sell the tensioners and idlers used in belt drive systems. These products are designed and engineered to work efficiently with our belts. Tensioners are devices that maintain a constant tension in the belt drive system, thereby ensuring proper function and preventing loss of power or system failure. Tensioners typically employ a spring that places pressure along the belt for an intricate hold, while still allowing enough movement for vibration and to prevent stretching. Idlers, which sometimes also perform as tensioners, are used to take up extra belt length.

Kits. Our kits for the automotive replacement market include all of the parts needed by an automotive service shop to perform a replacement of one of our products. Kits are created for specific makes and models and typically include belts, tensioners and idlers, and will sometimes also include water pumps as they are often replaced when a timing belt is replaced. Our kits are convenient for service technicians as they eliminate the need for more complicated product sourcing. On a comparable quantity basis, kits typically sell at a premium to a loose belt and single tensioner.

Our power transmission products are used in a broad range of applications in end markets including construction, agriculture, transportation, automotive, energy, general industrial and consumer products. The majority of our Fiscal 2017 net sales came from the replacement markets, which provide high-margin, recurring revenue streams and are driven by attractive market trends. The bulk of our power transmission replacement business resides in developed regions, in which a large, aging installed base of equipment follows a natural maintenance cycle and is served by well-developed distribution channels. For example, a combine harvester in North America has over 25 high-performance belts that are typically replaced at regular intervals, depending on wear and tear, with end users having access to replacement parts through an established channel. Similarly, in the North American automotive replacement market, maintenance intervals are well defined and miles driven per vehicle are increasing, leading to more wear and tear on vehicles. A smaller portion of our power transmission replacement business is generated in emerging markets, which generally have a smaller base of installed equipment and relatively immature distribution channels. As they continue to develop, these replacement markets represent a significant long-term opportunity for growth.
4
Table of Contents
In addition to our power transmission replacement business, we also serve a wide variety of blue-chip first-fit customers across all of our end markets. The majority of our automotive first-fit revenues in power transmission tend to come from emerging markets. These markets generally are higher-growth and result in higher-margin business than our developed regions. Our first-fit presence in these markets serves to further strengthen our brand, strongly positioning us to serve the growing base of installed equipment as the nascent replacement channels continue to develop.
Fluid Power. Our Fluid Power solutions are used in applications in which hoses and rigid tubing assemblies either transfer power hydraulically or convey fluids, gases or granular materials from one location to another. Within our Fluid Power segment, we offer solutions across the following key application platforms:

| • | Stationary hydraulics: applications within stationary machinery, such as an injection molding machine or a manufacturing press. |
| • | Mobile hydraulics: applications used to power various implements in mobile equipment used in construction, agriculture, mining and other heavy industries. |
| • | Engine systems: applications for engine systems such as coolant, fuel, A/C, turbocharger, air intake and SCR for diesel emissions. |
| • | Other industrial: applications in which hoses are used to convey fluids, gases or granular material across several industries such as oil and gas drilling and refining, food and beverage and other process industries. |
Customers choose fluid power solutions based on a number of factors including application-specific product performance parameters such as pressure and temperature ratings, corrosion and leak resistance, weight, flexibility, abrasion resistance and cleanliness, as well as compliance with standards and product availability. Attributes associated with the supplier, including brand, global footprint and reputation for reliability and quality, are also considered.
Hydraulics. Our hydraulics product line is comprised of hoses, tubing and fittings, as well as assemblies consisting of these products. Our hydraulic products are key components of hydraulic systems in both stationary and mobile equipment applications. We provide a full selection of hose sizes and construction types for use in a wide variety of working requirements and conditions. Hydraulic hoses are made of synthetic rubber and reinforced with steel wire or a textile-based yarn, and typically operate at very high pressures, often in extreme environmental conditions. Hoses are designed for use in specific mechanical applications and require high levels of quality and durability.
Our hydraulic fittings and tubing are engineered to match the product performance of our hydraulic hoses. The high-pressure nature of hydraulic systems requires these products have high levels of performance similar to those found in our hydraulic hoses. The ultimate performance of a hydraulic assembly, in which our products function as part of a hydraulic circuit, depends not only on how well the components are made, but also on how well they complement each other. In order to ensure compatibility with numerous applications, our hydraulic fittings are manufactured in a wide assortment of sizes, crimping systems and materials, and are protected by a range of patents.
5
Table of Contents
Our hydraulic products and assemblies are used in construction, agricultural and forestry equipment, as well as in food and other processing lines and stationary machinery.

Engine Hose. Our engine hose products perform a variety of conveyance functions in engine applications in gasoline-powered, hybrid and electric vehicles. Engine system applications for which Gates provides solutions include coolant (radiator, heater), air system (turbocharger, intake, vacuum, crankcase ventilation), fuel, oil (transmission oil cooling, power steering) and emissions/Diesel Exhaust Filtration (DEF) systems.

Industrial Hose. Our industrial hoses are capable of transferring a wide range of substances—chemicals, food and beverages, petroleum, fuels, bulk materials, water, steam and air—to meet the requirements of diverse applications, including manufacturing, mining, oil and gas drilling, marine, agriculture, industrial cleaning and construction. Our application engineering teams work with customers to assist them in selecting the appropriate hose solution to safely meet their operational needs. We leverage our materials science expertise to enable hose performance at varying pressures and levels of resistance to chemicals, oil, abrasion, ozone, flame and both hot and cold temperatures. For performance in extreme environments, many of our industrial hoses feature both crush-resistant and flexible designs. Gates industrial hoses are highly engineered to meet or exceed a multitude of industry standards and certifications, and are offered in a range of diameters, lengths and colors to allow customers to differentiate the hoses in applications. We also offer a wide range of couplings to provide complete assembly solutions to our customers.

Our fluid power products are used in numerous applications, including construction, agriculture, transportation, automotive, energy and general industrial. The largest portion of our Fiscal 2017 fluid power revenue came from replacement markets. Within these replacement markets, the majority of our revenue comes from industrial applications. Approximately 17% of our Fiscal 2017 fluid power revenue came from products sold into the automotive end market, almost all of which was served through the higher-margin replacement channel.
Our Diverse Markets
We participate in many sectors of the industrial and consumer markets. Our products play essential roles in a diverse range of applications across a wide variety of end markets ranging from harsh and hazardous industries such as agriculture, construction, manufacturing and energy, to everyday consumer applications such as printers, power washers, automatic doors and vacuum cleaners. Virtually every form of transportation, ranging from trucks, buses and automobiles to personal mobility vehicles such as motorcycles, bicycles and snowmobiles uses our products.
6
Table of Contents
Our revenue has historically been highly correlated with industrial activity and utilization, and not with any single end market given the diversification of our business and high exposure to replacement markets. Key indicators include industrial production, industrial sales and manufacturer shipments.
Our products are sold in over 120 countries across our four commercial regions: (1) the Americas; (2) Europe, Middle East & Africa; (3) Greater China; and (4) East Asia & India. We have a long-standing presence in each of these regions. See note 5E “Selected geographic information” in our audited consolidated financial statements included elsewhere in this report for information regarding our net sales by geographic origin and property, plant and equipment by geographic origin.
Our commercial capabilities are complemented by our global manufacturing footprint, which frequently allows us to manufacture products in close proximity to our customers. We have power transmission and fluid power operations in each commercial region and typically manufacture products for both first-fit customers and replacement customers in the same factory, which provides improved factory loading and demand leveling, as well as optimization of capital expenditures.
Our Channels
We sell our power transmission and fluid power products both as replacement components and as specified components on original equipment to customers worldwide. For Fiscal 2017, approximately 63% of our net sales were generated from replacement markets and 37% from first-fit markets globally. Our mix of replacement sales to first-fit sales varies by region based on our market strategy and the maturity of the equipment fleet and replacement channel. For example, in emerging markets such as China, our business is characterized by a higher first-fit presence, given the relatively underdeveloped replacement channels and newer average age of cars. We believe that ultimately our first-fit presence in these emerging markets will allow us to better develop the replacement channels as they mature over time. By contrast, in North America and Europe, where there are long-established replacement markets, approximately 71% and 67% of our Fiscal 2017 net sales, respectively, were derived from these higher-margin replacement channels. In the vast majority of the applications we service, we do not need to have been the first-fit provider to service these applications in the replacement markets.
Replacement. The majority of our sales are generated from customers in replacement channels, who primarily serve a large base of installed equipment that follows a natural maintenance cycle. Our ability to help replacement channel partners maximize revenue is an important part of our value proposition. These customers miss sales opportunities if a required product cannot be obtained quickly, either from a catalog or on-hand inventory.
In addition to our products, we provide a complementary suite of services, digital tools and other content to distributors, installers and end users of equipment containing our products. We offer customer training on product installation and early identification of wear-and-tear on components, which helps drive sales for our channel customers while mitigating the risk of equipment failure for end users.
First-Fit. We work closely with our customers by providing application engineering expertise to assist them in selecting the right products for their applications. In engine systems, we are one of the only suppliers providing application engineering for cam drive and accessory drive applications, and completing all design and manufacturing of the system components in-house. Close interactions between our R&D organization and customer technical teams provide input into our innovation and product development processes. We selectively participate in first-fit projects, focusing on opportunities where we are able to differentiate with technology and innovative solutions.
7
Table of Contents
Customers
We maintain long-standing relationships with many customers, who range from local distributors with one location to large, global manufacturers of equipment. No single customer accounted for more than 10% of our Fiscal 2017 net sales.
Sales and Marketing and Distribution Organization
Our sales and distribution operations are structured to serve our customers efficiently across the globe. We have field representatives who possess local knowledge of product and application requirements, allowing us to meet our customers’ product availability requirements with short lead times. Our global sales and service support team helps reinforce customer and distributor relationships by focusing on end markets and customers.
Manufacturing
We have a global, “in region, for region” manufacturing footprint and regional service model that enable us to operate efficiently and effectively in proximity to our customers. We operate 64 manufacturing facilities and service centers as well as several major technical centers giving us a presence in 30 countries throughout the world. Our in-country deployment of manufacturing and technical resources enables us to meet customer needs rapidly and satisfy regional variations in product preference, while our scale allows us to service global customers on a world-wide basis.
Competition
We operate in competitive markets and industries that are also very fragmented. We offer our products and solutions across numerous and varied end markets and geographies through over 120 locations in 30 countries. Consequently, we have many competitors across our various markets and product offerings. These competitors and the degree of competition vary by product line, geographic scope, end market and channel. Although each of our markets and product offerings has many competitors, no single competitor competes with us with respect to all of our products, solutions, channels and end markets. Our global presence makes it difficult for smaller regional and low-cost country manufacturers to penetrate our markets. We differentiate ourselves on the basis of product performance and quality, breadth of portfolio, customer support and training, service level, fill rates and product availability.
Research, Development and Intellectual Property
Applied R&D is important to our businesses and integral to our leading market positions. We have engineering teams in the United States, Canada, the United Kingdom, Germany, Spain, Poland, Turkey, Japan, China, Brazil, India, Mexico, Korea and Thailand that focus on the introduction of new and improved products with a particular emphasis on energy efficiency and safety, the application of technology to reduce unit and operating costs and improving services to our customers.
As of December 30, 2017, we owned more than 2,000 issued patents and pending patent applications, and over 3,000 registered trademarks in various jurisdictions. While no individual patent or group of patents, taken alone, is considered critical to our business, collectively our patents and trademarks provide meaningful protection for our products and technical innovations.
Materials and Suppliers
We use a wide variety of materials, resulting in a highly diversified mix of inputs, which are sourced from a variety of suppliers around the world. Generally, we seek to obtain materials in the regions where our products are manufactured to minimize transportation and other costs. As of December 30, 2017, we had not experienced any significant shortages of raw materials and normally do not carry inventories of raw materials in excess of those required to meet our production schedules.
8
Table of Contents
We are continually seeking to manage commodity and raw material costs using various strategies, including working with our suppliers to mitigate costs, exploring material substitution opportunities, combining purchase requirements across regions and changing suppliers when appropriate.
Environmental
Our operations, products and properties are subject to extensive U.S. and foreign federal, state, local, and provincial laws and regulations relating to environmental, health and safety (“EHS”) protection, including laws and regulations governing air emissions, wastewater discharges, waste management and disposal, substances in products, and workplace health and safety, as well as the investigation and clean-up of contaminated sites. Under certain environmental laws, the obligation to investigate and remediate contamination at a facility may be imposed on current and former owners, lessees or operators or on persons who may have sent waste to that facility for disposal. We are currently performing environmental investigations and/or remediation at a number of former and current facilities in the United States and Canada and are incurring costs in relation to a number of offsite waste disposal sites.
Employees
As of December 30, 2017, we employed approximately 14,200 employees worldwide. Approximately 6,600 of our employees were located in North America, 3,200 in EMEA, 3,700 in China and East Asia and 700 in South America. Some of our employees are members of labor unions and over many years we have been able to maintain successful relationships with the unions and employment organizations. To date, employee relations have been flexible and constructive as we continue to pursue lean manufacturing improvements in our plants.
Where You Can Find More Information
We file annual, quarterly and current reports, proxy statements and other information with the SEC. Our SEC filings are available to the public over the internet at the SEC’s website at http://www.sec.gov. Our SEC filings are also available on our website, free of charge, at http://www.gates.com as soon as reasonably practicable after they are filed with or furnished to the SEC. You may also read and copy any filed document at the SEC’s public reference room in Washington, D.C. at 100 F Street, N.E., Washington, D.C. 20549. Please call the SEC at 1-800-SEC-0330 for further information about public reference rooms.
We maintain an internet site at http://www.gates.com. Our website and the information contained on or connected to that site are not incorporated into this report.
9
Table of Contents
The risk factors noted in this section and other factors noted throughout this annual report, describe certain risks and uncertainties that could cause our actual results to differ materially from those contained in any forward-looking statement and should be considered carefully in evaluating our company and our business.
Risks Related to Our Business and Industry
Conditions in the global and regional economy and the major end markets we serve may materially and adversely affect the business and results of operations of our businesses should they deteriorate.
Our business and operating results have been, and will continue to be, affected by worldwide and regional economic conditions, including conditions in the end markets we serve. The level of demand for our products depends, in part, on the general economic conditions that exist in our served end markets. A substantial portion of our revenues are derived from customers in cyclical industries that typically are adversely affected by downward economic cycles. Our customers may experience deterioration of their businesses, cash flow shortages or difficulty obtaining financing as a result of the effects of contraction or low levels of economic growth, disruptions in the financial markets, weak consumer and business confidence, high levels of unemployment, reduced levels of capital expenditures, fluctuating commodity prices, bankruptcies and other challenges affecting the global economy, as happened following the global recession in 2008. For example, our historical results have been highly correlated to global industrial activity and utilization and decreases in such activity or utilization may impact our business, financial condition and results of operations. As a result, existing or potential customers may delay or cancel plans to purchase our products and services and may not be able to fulfill their obligations to us in a timely fashion. Further, our suppliers, distributors and vendors may experience similar conditions, which may impact their ability to fulfill their obligations to us. If conditions in the global economy or in the regions and major end markets that we serve deteriorate, demand for our products and services may be decline and our results of operations, financial position and cash flows could be materially adversely affected.
We are subject to economic, political and other risks associated with international operations, and this could adversely affect our business and our strategy to capitalize on our global reach.
One of our key strategies is to capitalize on our global commercial reach, and a substantial portion of our operations are conducted and located outside the United States. For Fiscal 2017, approximately 62% of our net sales originated from outside of the United States. We have manufacturing, sales and service facilities spanning five continents and sell to customers in over 120 countries. Moreover, a significant amount of our manufacturing functions and sources of our raw materials and components are from emerging markets such as China, India and Eastern Europe. Accordingly, our business and results of operations, as well as the business and results of operations of our vendors, suppliers and customers, are subject to risks associated with doing business internationally, including:
| • | instability in a specific country’s or region’s political, economic or social conditions, including inflation, recession, interest rate fluctuations and actual or anticipated military or political conflicts; |
| • | changes in foreign currency exchange rates or currency restructurings and hyperinflation or deflation in the countries in which we operate; |
| • | imposition of restrictions on currency conversion or the transfer of funds or limitations on our ability to repatriate income or capital in a tax efficient manner; |
| • | trade protection measures, such as tariff increases and embargoes, and import and export licensing and control requirements; |
| • | the complexities of operating within multiple tax jurisdictions, including potentially negative consequences from changes in tax laws or from tax examinations, which may, in addition, require an extended period of time to resolve; |
| • | partial or total expropriation by local, state or national governments; |
| • | uncertainties as to local laws regarding, and enforcement of, contract and intellectual property rights; |
10
Table of Contents
| • | the ability to comply with or effect of complying with complex and changing laws, regulations and policies of foreign governments, including differing and, in some cases, more stringent labor and environmental regulations; |
| • | differing local product preferences and product requirements; and |
| • | difficulties involved in staffing and managing widespread operations, including challenges in administering and enforcing corporate policies, which may be different than the normal business practices of local cultures. |
The likelihood of such occurrences and their potential effect on us vary from country to country and are unpredictable. Certain regions, including Latin America, Asia, the Middle East and Africa, are generally more economically and politically volatile and as a result, our operations in these regions could be subject to significant fluctuations in sales and operating income from quarter to quarter. Because a significant percentage of our operating income in recent years has come from these regions, adverse fluctuations in the operating results in these regions could have a disproportionate impact on our results of operations in future periods.
The new U.S. administration has publicly supported certain potential tax and trade proposals, modifications to international trade policy and other changes which may affect U.S. trade relations with other countries. In addition, economic and political uncertainty arose out of the June 23, 2016 vote in the United Kingdom that resulted in the decision to leave the European Union (the “E.U.”). It is possible that these or other changes, if enacted, may impact or require us to modify our current business practices. At the present time, it is unclear as to the ultimate impact of these changes, policies or proposals and, as such, we are unable to determine the effect, if any, that such changes, policies or proposals would have on our business.
Additionally, concerns persist regarding the debt burden of certain European countries and the ability of these countries to meet future financial obligations, as well as concerns regarding the overall stability of the euro and the suitability of the euro as a single currency given the diverse economic and political circumstances of individual euro-area countries. If a country within the euro area were to default on its debt or withdraw from the euro currency, or if the euro were to be dissolved entirely, the impact on markets around the world, and on our global business, could be immediate and material. Such a development could cause financial and capital markets within and outside Europe to constrict, thereby negatively impacting our ability to finance our business, and also could cause a substantial reduction in consumer confidence and spending that could negatively impact sales. Any one of these impacts could have a material adverse effect on our financial condition and results of operations.
If we are unable to obtain raw materials at favorable prices in sufficient quantities, or at the time we require them, our operating margins and results of operations may be materially adversely affected.
We purchase our energy, steel, aluminum, rubber and rubber-based materials, chemicals, polymers and other key manufacturing inputs from outside sources. We do not traditionally have long-term pricing contracts with raw material suppliers. The costs of these raw materials have been volatile historically and are influenced by factors that are outside our control. In recent years, the prices for energy, metal alloys, polymers and certain other of our raw materials have fluctuated significantly. While we strive to avoid this risk by using price escalation mechanisms with respect to our raw materials in certain of our customer contracts and we also seek to offset our increased costs with gains achieved through operational efficiencies, if we are unable to pass increases in the costs of our raw materials on to our customers, we experience a lag in our ability to pass increases to our customers, or operational efficiencies are not achieved, our operating margins and results of operations may be materially adversely.
Additionally, our businesses compete globally for key production inputs. The availability of qualified suppliers and of key inputs may be disrupted by market disturbances or any number of geopolitical factors, including political unrest and significant weather events. Such disruptions may require additional capital or operating expenditure by us or force reductions in our production volumes. In the event of an industry-wide general shortage of certain raw materials or key inputs, or a shortage or discontinuation of certain raw materials or key inputs from one or more of our suppliers, we may not be able to arrange for alternative sources of certain raw materials or key inputs. Any such shortage may materially adversely affect our competitive position versus companies that are able to better or more cheaply source such raw materials or key inputs.
11
Table of Contents
Adverse changes in our relationships with, or the financial condition, performance, purchasing patterns or inventory levels of, key channel partners could adversely affect our business, financial condition and results of operations.
Certain of our businesses sell a significant amount of their products to key channel partners, including distributors, that have valuable relationships with end users. Some of these channel partners may also sell our competitors’ products, and if they favor competing products for any reason they may fail to market our products effectively. Adverse changes in our relationships with these channel partners, or adverse developments in their financial condition, performance or purchasing patterns, could adversely affect our business, financial condition and results of operations. The levels of inventory maintained by our distributors and other channel partners, and changes in those levels, can also significantly impact our results of operations in any given period. In addition, the consolidation of channel partners and customers in certain of our end markets could adversely impact our profitability.
We face competition in all areas of our business and may not be able to successfully compete with our competitors, which could adversely affect our revenues and profitability.
We are subject to competition from other producers of products that are similar to ours. We compete on a number of factors, including product performance, quality, value, product availability, brand recognition, customer service and innovation and technology. Our customers often demand delivery of our products on a tight time schedule and in a number of geographic markets. If our quality of service declines or we cannot meet the demands of our customers, they may utilize the services or products of our competitors. Our competitors include manufacturers that may be better capitalized, may have a more extensive low-cost sourcing strategy and presence in low-cost regions or may receive significant governmental support and as a result, may be able to offer more aggressive pricing. Our competitors also may develop products that are superior to our products, or may develop more efficient or effective methods of providing products and services or may adapt more quickly than we do to new technologies or evolving customer requirements. If we are unable to continue to provide technologically superior or better quality products or to price our products competitively, our ability to compete could be harmed and we could lose customers or market share.
Pricing pressures from our customers may materially adversely affect our business.
We generate strong margins by selling premium products at premium prices. Accordingly, our margins could suffer if our customers are no longer willing to pay a premium for our product and service offerings. We face the greatest pricing pressure from our customers in the automotive first-fit end market. Virtually all vehicle manufacturers seek price reductions in both the initial bidding process and during the term of the award. We are also, from time to time, subject to pricing pressures from customers in our other end markets. If we are not able to offset price reductions through improved operating efficiencies and reduced expenditures or new product introduction, those price reductions may have a material adverse effect on our results of operations.
We are dependent on the continued operation of our manufacturing facilities and we may need to make investments in new or existing facilities.
While we are not heavily dependent on any single manufacturing facility, major disruptions at a number of our manufacturing facilities, due to labor unrest, adverse weather, natural disasters, terrorist attacks, significant mechanical failure of our facilities, or other catastrophic event, could result in significant interruption of our business and a potential loss of customers and sales or could significantly increase our operating costs.
In addition, we may need to make investments in new or existing manufacturing facilities to adapt our production capacity to changing market conditions and to align with our growth strategies. The costs of such investments may be significant and we may not realize the expected benefits on our anticipated timeframe or at all, which may have a material adverse effect on our business, financial condition and results of operations.
12
Table of Contents
We may not be able to accurately forecast demand or meet significant increases in demand for our products.
Certain of our businesses operate with short lead times and we order raw materials and supplies and plan production based on discussions with our customers and internal forecasts of demand. If we are unable to accurately forecast demand for our products, in terms of both volume and specific products, or react appropriately to abrupt changes in demand, we may experience delayed product shipments and customer dissatisfaction. If demand increases significantly from current levels, both we and our suppliers may have difficulty meeting such demand, particularly if such demand increases occur rapidly. Additionally, we may carry excess inventory if demand for our products decreases below projected levels. Failure to accurately forecast demand or meet significant increases in demand could have a material adverse impact on our business, financial condition and operating results.
We are exposed to exchange rate fluctuations in the international markets in which we operate.
We conduct operations in many areas of the world involving transactions denominated in a variety of functional currencies. We are subject to currency exchange rate risk to the extent that our costs may be denominated in currencies other than those in which we earn and report revenues and vice versa. In addition, a decrease in the value of any of these currencies relative to the U.S. dollar could reduce our profits from non-U.S. operations and the translated value of the net assets of our non-U.S. operations when reported in U.S. dollars in our consolidated financial statements. Ongoing movements in average currency translation rates in the future could continue to have a negative impact on our business, financial condition or results of operations as reported in U.S. dollars. Fluctuations in currencies may also make it more difficult to perform period-to-period comparisons of our reported results of operations.
We anticipate that there will be instances in which costs and revenues will not be exactly matched with respect to currency denomination. As a result, to the extent we continue to expand geographically, we expect that increasing portions of our revenues, costs, assets and liabilities will be subject to fluctuations in foreign currency valuations. We may experience economic loss and a negative impact on earnings or net assets solely as a result of foreign currency exchange rate fluctuations. Further, the markets in which we operate could restrict the removal or conversion of the local or foreign currency, resulting in our inability to hedge against these risks.
We also face risks arising from the imposition of exchange controls and currency devaluations. Exchange controls may limit our ability to convert foreign currencies into U.S. dollars or to remit dividends and other payments by our foreign subsidiaries or businesses located in or conducted within a country imposing controls. Currency devaluations result in a diminished value of funds denominated in the currency of the country instituting the devaluation. Actions of this nature, if they occur or continue for significant periods of time, could have an adverse effect on our results of operations and financial condition in any given period.
We are dependent on market acceptance of new product introductions and product innovations for continued revenue growth.
The markets in which we operate are subject to technological change. Our long-term operating results depend substantially upon our ability to continually develop, introduce, and market new and innovative products, to modify existing products, to respond to technological change, and to customize certain products to meet customer requirements and evolving industry standards. The development of new product introductions and product innovations may require significant investment by us. There are numerous risks inherent in this process, including the risks that we will be unable to anticipate the direction of technological change or that we will be unable to develop and market new products and applications in a timely fashion to satisfy customer demands. For example, the increased adoption of electric vehicles may affect certain of the end markets that we serve and could alter the application platforms in which we offer solutions.
If we are unable to adapt to technological changes, including by developing and marketing new products, our business and results of operations may be adversely affected.
13
Table of Contents
We have taken, and continue to take, cost-reduction actions, which may expose us to additional risk and we may not be able to maintain the level of cost reductions that we have achieved.
We have been reducing costs in all of our businesses and have discontinued product lines, divested non-core businesses, consolidated manufacturing operations and reduced our employee population. The impact of these cost-reduction actions on our sales and profitability may be influenced by many factors and we may not be able to maintain the level of cost savings that we have achieved depending on our ability to successfully complete these efforts. In connection with the implementation and maintenance of our cost reduction measures, we may face delays in anticipated workforce reductions, a decline in employee morale and a potential inability to meet operational targets due to an inability to retain or recruit key employees.
We are subject to risks from litigation, legal and regulatory proceedings and obligations that may materially impact our operations.
We face an inherent business risk of exposure to various types of claims, lawsuits and proceedings. We are involved in various tax, intellectual property, product liability, product warranty and environmental claims and lawsuits, and other legal, antitrust and regulatory proceedings arising in the ordinary course of our business. Although it is not possible to predict with certainty the outcome of every claim, lawsuit or proceeding and the range of probable loss, we believe these claims, lawsuits and proceedings will not individually or in the aggregate have a material impact on our results. However, we could, in the future, be subject to various claims, lawsuits and proceedings, including, amongst others, tax, intellectual property, product liability, product warranty, environmental claims and antitrust claims, and we may incur judgments or enter into settlements of lawsuits and proceedings that could have a material adverse effect on our results of operations in any particular period.
Our products could infringe on the intellectual property of others, which may cause us to engage in costly litigation and, if we are not successful, could cause us to pay substantial damages and/or prohibit us from selling our products.
Third parties may assert infringement or other intellectual property claims against us based on their patents or other intellectual property rights. Any claim relating to intellectual property infringement that is successfully asserted against us may require us to pay substantial damages, including treble damages, if we are found to be willfully infringing another party’s patents, for past use of the asserted intellectual property and royalties and other consideration going forward if we are forced to take a license. In addition, if any such claim were successfully asserted against us, we may be forced to stop or delay developing, manufacturing, selling or otherwise commercializing our products, product candidates or other technology, or those we develop with our R&D partners. Even if infringement claims against us are without merit, defending these types of lawsuits takes significant time, may be expensive and may divert management attention from other business concerns.
In addition, first-fit and other manufacturers have attempted to use claims of intellectual property infringement against manufacturers and distributors of aftermarket products to restrict or eliminate the sale of aftermarket products that are the subject of the claims. First-fit manufacturers have brought such claims in federal court and with the U.S. International Trade Commission and with various foreign government agencies.
To the extent first-fit and other manufacturers are seeking and obtaining more utility and design patents than they have in the past and are successful in asserting infringement of these patents and defending their validity, if any of our products are found to infringe someone’s patent, we could be restricted or prohibited from selling such products, which could have an adverse effect on our business. If we are sued for intellectual property infringement, we will likely incur significant expenses investigating and defending such claims, even if we prevail.
In addition, certification by independent organizations of certain of our aftermarket products may be revoked or adversely affected by first-fit manufacturer claims. Lack of certification may negatively impact us because many major insurance companies recommend or require the use of aftermarket products only if they have been certified by an independent certifying organization.
14
Table of Contents
Failure to adequately protect or enforce our intellectual property rights against counterfeiting activities could adversely affect our business.
Although we routinely conduct anti-counterfeiting activities in multiple jurisdictions, we have encountered counterfeit reproductions of our products or products that otherwise infringe on our intellectual property rights. The actions we take to establish and protect trademarks and other intellectual property rights may not be adequate to prevent such counterfeiting activities by others. If we are unsuccessful in challenging such products on the basis of trademark or other intellectual property infringement, continued sales of such imitating products may adversely affect market share and impact customer perceptions and demand, leading to the shift of consumer preference away from our products and loss of market share.
We will not seek to protect our intellectual property rights in all jurisdictions throughout the world and we may not be able to adequately enforce our intellectual property rights even in the jurisdictions where we seek protection.
Filing, prosecuting and defending patents on our products in all countries and jurisdictions throughout the world would be prohibitively expensive, and the laws of certain foreign countries may not protect or allow enforcement of intellectual property rights to the same extent as the laws of the United States.
Competitors may use our technologies in jurisdictions where we do not pursue and obtain patent protection to develop their own products and further, may export otherwise infringing products to territories where we have patent protection, but where the ability to enforce our patent rights is not as strong as in the United States. These products may compete with our products, and our intellectual property rights may not be effective or sufficient to prevent such competition. In addition, we may face significant expenses in connection with the protection of our intellectual property rights outside the United States. If we are unable to successfully protect our rights or resolve intellectual property conflicts with others, our business, financial condition and results of operations may be adversely affected.
Failure to develop, obtain, enforce and protect intellectual property rights or liability for intellectual property infringement could adversely affect our business.
Our success depends on our ability to develop technologies and inventions used in our products and to brand such products, to obtain intellectual property rights in such technologies, inventions, and brands, and to protect and enforce such intellectual property rights. In this regard, we rely on U.S. and foreign trademark, patent, copyright, and trade secret laws, as well as license agreements, nondisclosure agreements, and confidentiality and other contractual provisions. Nevertheless, the technologies and inventions developed by our engineers in the future may not prove to be as valuable as those of competitors, or competitors may develop similar or identical technologies and inventions independently of us and before we do.
We may not be able to obtain patents or other intellectual property rights in our new technologies and inventions or, if we do, the scope of such rights may not be sufficiently broad to afford us any significant commercial advantage over our competitors. Owners of patents or other intellectual property rights that we need to conduct our business as it evolves may be unwilling to license such intellectual property rights to us on terms we consider reasonable. Competitors and other third parties may challenge the ownership, validity, and/or enforceability of our patents or other intellectual property rights. Further, we expect pirates to continue to counterfeit certain of our products using our trademarks, which has led to, and will likely continue to cause loss of sales. It is difficult to police such counterfeiting, particularly on a worldwide basis, and the efforts we take to stop such counterfeiting may not be effective.
Our other efforts to enforce our intellectual property rights against infringers may not prove successful and will likely be time consuming and expensive and may divert management’s attention from the day-to-day operation of our business. Adequate remedies may not be available in the event of an infringement or unauthorized use or disclosure of our trade secrets and manufacturing expertise. If we fail to successfully enforce our intellectual property rights, our competitive position could suffer, which could harm our business, financial condition, results of operations and cash flows. Further, successful assertion of our intellectual property rights depends on the judicial strength and willingness of the issuing jurisdictions to enact and enforce sufficient intellectual property laws. Creation and enforcement of intellectual property rights is a relatively recent development in much of the world, and so some time may be necessary to realize reliable intellectual property systems across all markets and jurisdictions, if this occurs at all.
15
Table of Contents
We operate in industries with respect to which there are many third-party patents. Owners of patents or other intellectual property rights that we need to conduct our business as it evolves may be unwilling to license such intellectual property rights to us on terms we consider reasonable. We cannot assure you that our business operations, products and methods do not or will not infringe, misappropriate or otherwise violate the patents or other intellectual property rights of third parties. Any claim relating to intellectual property infringement that is successfully asserted against us may require us to pay substantial damages, including treble damages, if we are found to be willfully infringing another party’s patents, for past use of the asserted intellectual property and royalties and other consideration going forward if we are forced to take a license. In addition, if any such claim were successfully asserted against us, we may be forced to stop or delay developing, manufacturing, selling or otherwise commercializing our products, product candidates or other technology, or those we develop with our R&D partners. If we are sued for intellectual property infringement, we will likely incur significant expenses investigating and defending such claims, even if we prevail. Any of these risks coming to fruition could have a material adverse effect on our business, results of operations, financial condition and prospects.
We may be subject to recalls, product liability claims or may incur costs related to product warranties that may materially and adversely affect our business.
Meeting or exceeding many government-mandated safety standards is costly and requires manufacturers to remedy defects related to product safety through recall campaigns if the products do not comply with safety, health or environmental standards. If we, customers or government regulators determine that a product is defective or does not comply with such standards prior to the start of production, the launch of a product could be delayed until such defect is remedied. The costs associated with any protracted delay of a product launch or a recall campaign to remedy defects in products that have been sold could be substantial.
We face an inherent risk of product liability claims if product failure results in any claim for injury or loss. Supplier consolidation and the increase in low-cost country sourcing may increase the likelihood of receiving defective materials, thereby increasing the risk of product failure and resulting liability claims. Litigation is inherently unpredictable and these claims, regardless of their outcome, may be costly, divert management attention and adversely affect our reputation. Although we have liability insurance, we cannot be certain that this insurance coverage will continue to be available to us at a reasonable cost or will be adequate. In addition, even if we are successful in defending against a claim relating to our products, claims of this nature could cause our customers to lose confidence in our products and us.
From time to time, we receive product warranty claims from our customers, pursuant to which we may be required to bear costs of repair or replacement of certain of our products. Vehicle manufacturers are increasingly requiring their outside suppliers to participate in the warranty of their products and to be responsible for the operation of these component products in new vehicles sold to consumers. Warranty claims may range from individual customer claims to full recalls of all products in the field. It cannot be assured that costs associated with providing product warranties will not be material.
We are subject to anti-corruption laws in various jurisdictions, as well as other laws governing our international operations. If we fail to comply with these laws we could be subject to civil or criminal penalties, other remedial measures, and legal expenses, which could materially adversely affect our business, financial condition and results of operations.
Our international operations are subject to one or more anti-corruption laws in various jurisdictions, such as the U.S. Foreign Corrupt Practices Act of 1977, as amended (the “FCPA”), the U.K. Bribery Act of 2010 and other anti-corruption laws. The FCPA and these other laws generally prohibit employees and intermediaries from bribing or making other prohibited payments to foreign officials or other persons to obtain or retain business or gain some other business advantage. We operate in a number of jurisdictions that pose a high risk of potential FCPA or other anti-corruption violations, and we participate in joint ventures and relationships with third parties whose actions could potentially subject us to liability under the FCPA or other anti-corruption laws. In addition, we cannot predict the nature, scope or effect of future regulatory requirements to which our international operations might be subject or the manner in which existing laws might be administered or interpreted.
16
Table of Contents
We are also subject to other laws and regulations governing our international operations, including regulations administered by the U.S. Department of Commerce’s Bureau of Industry and Security, the U.S. Department of Treasury’s Office of Foreign Assets Control, and various non-U.S. government entities, including applicable export control regulations, economic sanctions on countries and persons, customs requirements, currency exchange regulations, and transfer pricing regulations (collectively, “Trade Control laws”).
We are also subject to new U.K. corporate criminal offences for failure to prevent the facilitation of tax evasion pursuant to the Criminal Finances Act 2017 (“FTP offences”). The FTP offences impose criminal liability on a company where it has failed to prevent the criminal facilitation of tax evasion by a person associated with the company.
We have instituted policies, procedures and ongoing training of certain employees with regard to business ethics, designed to ensure that we and our employees comply with the FCPA, other anticorruption laws, Trade Control laws and the Criminal Finances Act 2017. However, there is no assurance that our efforts have been and will be completely effective in ensuring our compliance with all applicable anti-corruption laws, including the FCPA, or other legal requirements. If we are not in compliance with the FCPA, other anti-corruption laws, Trade Control laws or the Criminal Finances Act 2017, we may be subject to criminal and civil penalties, disgorgement and other sanctions and remedial measures, and legal expenses, which could have a material adverse impact on our business, financial condition, results of operations and liquidity. Likewise, any investigation of any potential violations of the FCPA, other anti-corruption laws or the Criminal Finances Act 2017 by U.S. or foreign authorities could also have a material adverse impact on our reputation, business, financial condition and results of operations.
Existing or new laws and regulations may prohibit, restrict or burden the sale of aftermarket products.
Most states have passed laws that regulate or limit the use of aftermarket products in certain types of repair work. These laws include requirements relating to consumer disclosure, owner’s consent regarding the use of aftermarket products in the repair process, and the requirement to have aftermarket products certified by an independent testing organization. Additional legislation of this kind may be introduced in the future. If additional laws prohibiting or restricting the use of aftermarket products are passed, it could have an adverse impact on our aftermarket products business.
Certain organizations test the quality and safety of vehicle replacement products. If these organizations decide not to test a particular vehicle product, or in the event that such organizations decide that a particular vehicle product does not meet applicable quality or safety standards, we may decide to discontinue sales of such product or insurance companies may decide to discontinue authorization of repairs using such product. Such events could adversely affect our business.
Our information technology systems are decentralized, which may lead to certain security risks and make access to our applications cumbersome.
In general, our information technology (“IT”) systems are decentralized. This decentralization may lead to security risks and makes access to common applications cumbersome. We are in the midst of several large-scale information technology projects, including with respect to Enterprise Resource Planning systems and consolidation of applications and servers. The costs of such projects may exceed the amounts we have budgeted for them, and any material failures in the execution of such projects may hinder our day-to-day operations.
Our business could be materially adversely affected by interruptions to our computer and IT systems.
Most of our business activities rely on the efficient and uninterrupted operation of our computer and IT systems and those of third parties with which we have contracted. In the event that the providers of these systems terminate their relationships with us or if we suffer prolonged outages of these or our own systems for whatever reason, we could suffer disruptions to our operations. In the event that we decide to switch providers or to implement upgrades or replacements to our own systems, we may also suffer disruptions to our business on this
17
Table of Contents
basis. We may be unsuccessful in the development, maintenance and upgrading of our own systems, and we may underestimate the costs and expenses of developing and implementing our own systems. Also, our revenue may be hampered during the period of implementing an alternative system, which period could extend longer than we anticipated.
Despite our implementation of security measures, our computer and IT systems are vulnerable to damage, disruptions or shutdowns due to failures during the process of upgrading or replacing software, databases or components; hardware failures; or computer viruses, as well as circumstances beyond our reasonable control, including power outages; acts of malfeasance, unauthorized access (“hacking”), acts of terror, acts of government, natural disasters, civil unrest, and denial of service attacks; any of which may lead to the theft of our intellectual property and trade secrets, the compromising of confidential information, manipulation and destruction of data and production downtimes. This could also impede our ability to record or process orders, manufacture and ship in a timely manner, account for and collect receivables, protect sensitive data of the Company, our customers, our employees, our suppliers and other business partners, comply with our third-party obligations of confidentiality and care, or otherwise carry on business in the normal course. Any failure of these systems or cybersecurity incidents could require significant costly remediation beyond levels covered by insurance and could cause us to lose customers and/or revenue, require us to incur significant expense to remediate, including as a result of legal or regulatory claims or proceedings, or damage our reputation, any of which could have a material adverse effect on our business, financial condition and results of operations. The regulatory environment related to information security and privacy is constantly changing, and compliance with those requirements could result in additional costs.
Our operations are subject to various environmental, health and safety laws and regulations, and we may incur significant costs to comply with these requirements, or be subject to sanctions or held liable for damages resulting from any failure to comply.
Our operations, products and properties are subject to extensive U.S. and foreign, federal, state, local and provincial laws and regulations relating to EHS protection, including laws and regulations governing air emissions, wastewater discharges, waste management and disposal, substances in products, and workplace health and safety, as well as the investigation and clean-up of contaminated sites. EHS laws and regulations vary by jurisdiction and have become increasingly stringent over time. Failure to comply with EHS laws and regulations could have significant consequences on our business and operations, including the imposition of substantial fines and sanctions for violations, injunctive relief (including requirements that we limit or cease operations at affected facilities), and negative publicity.
In addition, new EHS laws and regulations applicable to our business or stricter interpretation or enforcement of existing EHS laws and regulations could adversely affect our business, financial condition and results of operations. For example, increasing global efforts to control emissions of carbon dioxide, methane and other greenhouse gases (“GHGs”), have the potential to impact us. Certain countries, states, provinces, regulatory agencies and multinational and international authorities with jurisdiction over our operations have implemented measures, or are in the process of evaluating options, including so-called “cap and trade” systems, to regulate GHG emissions. The nature and extent of these measures varies among jurisdictions where we have operations. GHG regulation could increase the price of the energy and raw materials we purchase or require us to purchase allowances to offset our own emissions. It could also negatively impact the demand for our products. For example, if the U.S. EPA continues to focus on GHG regulation, it could adversely affect our customers in the oil and gas industry, which is a key demand driver of our industrial end markets. In addition, efforts to decrease use of fossil fuels in general may result in decreased oil and gas production and impact demand for our products.
We could also be responsible for the investigation and remediation of environmental contamination and may be subject to associated liabilities and claims for personal injury and property and natural resource damages. We own, lease or operate numerous properties (many of which are sites of long-standing manufacturing operations), have been in business for many years and have acquired and disposed of properties and businesses over that time. Hydrocarbons, chlorinated solvents or other regulated substances or wastes may have been disposed of at or released from properties owned, leased or operated by us or at or from other locations where such substances or wastes were taken for disposal. Such properties may be subject to investigation, clean-up and monitoring requirements. Under some environmental laws, liability for the entire cost of the cleanup of contaminated sites may be imposed jointly and severally upon current or former owners, lessees or operators of a facility, or upon any party who sent waste to a disposal site, regardless of fault or the lawfulness of the activities giving rise to the contamination.
18
Table of Contents
We have incurred, and will continue to incur, both operating and capital costs to comply with EHS laws and regulations, including costs associated with the clean-up and investigation of some of our current and former properties and offsite disposal locations. We are currently performing environmental investigations or remediation at a number of former and current facilities in the United States and Canada. We have incurred and will continue to incur costs to investigate and/or remediate conditions at those sites. We are also incurring costs associated with contamination at a number of offsite waste disposal sites. In the future, we may incur similar liabilities in connection with environmental conditions currently unknown to us relating to our existing, prior, or future sites or operations or those of companies whose liabilities we may have assumed or acquired. In addition, we are subject to personal injury and/or property damage claims alleging losses arising from hazardous materials associated with our current or former operations, facilities or products. The discovery of previously unknown contamination, the imposition of new clean-up requirements, or new claims for property damage, personal injury or damage to natural resources arising from environmental matters or hazardous materials could result in additional costs or liabilities that could have a negative effect on our business, financial condition and results of operations.
In addition, our products may be subject to EHS regulations in the markets in which we operate; such regulations are becoming increasingly common and stringent. These regulations may restrict or prohibit the types of substances that are used or present in our products, or impose labeling or other requirements. For example, some of our products manufactured or sold in the E.U. may potentially be subject to the E.U.’s Registration, Evaluation, Authorisation, and Restriction of Chemical Substances regulation (“REACH”), which regulates the sale of certain hazardous substances, or the Restriction of Hazardous Substances regulation (“RoHS”), which limits the use of certain hazardous substances in electrical and electronic equipment, or similar requirements in other jurisdictions. Any failure by our products to meet such standards could result in significant costs or delays relating to sale of such products, or require product reformulations or removal from those markets as well as the imposition of fines and penalties.
See “—We may be subject to recalls, product liability claims or may incur costs related to product warranties that may materially and adversely affect our business” for additional risks relating to EHS regulations applicable to our products.
Our insurance may not fully cover all future losses we may incur.
Manufacturers of products such as ours are subject to inherent risks. We maintain an amount of insurance protection that we consider adequate, but we cannot provide any assurance that our insurance will be sufficient or provide effective coverage under all circumstances and against all hazards or liabilities to which we may be subject. Specifically, our insurance may not be sufficient to replace facilities or equipment that are damaged in part or in full. Damages or third-party claims for which we are not fully insured could adversely affect our financial condition and results of operation. Further, due to rising insurance costs and changes in the insurance markets, insurance coverage may not continue to be available at all or at rates or on terms similar to those presently available. Additionally, our insurance may subject us to significant deductibles, self-insured retentions, retrospectively rated premiums or similar costs. Any losses not covered by insurance could have a material adverse effect on us. We typically purchase business interruption insurance for our facilities. However, if we have a stoppage, our insurance policies may not cover every contingency and may not be sufficient to cover all of our lost revenues. In the future, we may be unable to purchase sufficient business interruption insurance at desirable costs.
We supply products to industries that are subject to inherent risks, including equipment defects, malfunctions and failures and natural disasters, which could result in unforeseen and damaging events. These risks may expose us, as an equipment operator and supplier, to liability for personal injury, wrongful death, property damage, and pollution and other environmental damage. The insurance we carry against many of these risks may not be adequate to cover our claims or losses. Further, insurance covering the risks we expect to face or in the amounts we desire may not be available in the future or, if available, the premiums may not be commercially justifiable. If we were to incur substantial liability and such damages were not covered by insurance or were in excess of policy limits, or if we were to incur liability at a time when we were not able to obtain liability insurance, our business, results of operations, cash flows and financial condition could be negatively impacted. If our clients suffer damages as a result of the occurrence of such events, they may reduce their business with us.
19
Table of Contents
Longer lives of products used in our end markets may adversely affect demand for some of our replacement products.
The average useful life of certain products in our end markets has increased in recent years due to innovations in technologies and manufacturing processes. The longer product lives allow end users to replace parts less often. As a result, a portion of sales in the replacement markets we serve may be displaced. If this trend continues, it could adversely impact our replacement market sales.
The replacement market in emerging markets may develop in a manner that could limit our ability to grow in those markets.
In emerging markets such as China, India, Eastern Europe and Russia, the replacement markets are still nascent as compared to those in more developed nations. In these markets, we have focused on building a first-fit presence in order to establish brand visibility in the end markets we serve. However, as the replacement markets in these regions grow, our products may not be selected as the replacement product, although we are the first-fit provider. If we are not able to convert our first-fit presence in these emerging markets into sales in the replacement end market, there may be a material adverse effect on our replacement end market growth potential in these emerging markets.
We may in the future acquire businesses or assets, which we may not be able to successfully integrate, and we may be unable to recoup our investment in these businesses or assets.
We consider strategic acquisitions of complementary businesses or assets to expand our product portfolio and geographic presence on an ongoing basis, and regularly have discussions concerning potential acquisitions, certain of which may be material. Acquisitions, particularly investments in emerging markets, involve legal, economic and political risks. We also encounter risks in the selection of appropriate investment and disposal targets, execution of the transactions and integration of acquired businesses or assets.
We may not be able to effectively integrate future acquisitions or successfully implement appropriate operational, financial and management systems and controls to achieve the benefits expected to result from these acquisitions. As a result, we may not be able to recoup our investment in those acquisitions or achieve the economic benefits that we anticipate from these acquisitions. Our efforts to integrate these businesses or assets could be affected by a number of factors beyond our control, such as general economic conditions and increased competition. In addition, the process of integrating these businesses or assets could cause the interruption of, or loss of momentum in, the activities of our existing business and the diversion of management’s attention. Furthermore:
| • | the key personnel of the acquired company may decide not to work for us; |
| • | customers of the acquired company may decide not to purchase products from us; |
| • | suppliers of the acquired company may decide not to sell products to us; |
| • | the markets may reject the acquired technologies, or they may not integrate with our existing technologies as expected; |
| • | we may experience business disruptions as a result of information technology systems conversions; |
| • | we may experience additional financial and accounting challenges and complexities in areas such as tax planning, treasury management, and financial reporting; |
| • | we may be held liable for environmental, tax or other risks and liabilities as a result of our acquisitions, some of which we may not have discovered during our due diligence; |
| • | we may intentionally assume the liabilities of the companies we acquire, which could result in material adverse effects on our business; |
| • | our existing business may be disrupted or receive insufficient management attention; |
20
Table of Contents
| • | we may not be able to realize the cost savings or other financial benefits we anticipated, either in the amount or in the time frame that we expect; and |
| • | we may incur debt or issue equity securities to pay for any future acquisition, the issuance of which could involve the imposition of restrictive covenants or be dilutive to our existing shareholders. |
These impacts and any delays or difficulties encountered in connection with the integration of these businesses or assets could negatively impact our business and results of operations.
In addition, certain of the businesses that we have acquired and may acquire have unaudited financial statements that have been prepared by the management of such companies and have not been independently reviewed or audited. We cannot assure you that the financial statements of companies we have acquired or will acquire would not be materially different if such statements were audited. Finally, we cannot assure you that we will continue to acquire businesses at valuations consistent with our prior acquisitions or that we will complete future acquisitions at all. We cannot assure you that there will be attractive acquisition opportunities at reasonable prices, that financing will be available or that we can successfully integrate such acquired businesses into our existing operations. In addition, our results of operations from these acquisitions could, in the future, result in impairment charges for any of our intangible assets, including goodwill, or other long-lived assets, particularly if economic conditions worsen unexpectedly. These changes could materially negatively affect our business, results of operations or financial condition.
If we lose our senior management or key personnel, our business may be materially and adversely affected.
The success of our business is largely dependent on our senior management team, as well as on our ability to attract and retain other qualified key personnel. In addition, there is significant demand in our industry for skilled workers. It cannot be assured that we will be able to retain all of our current senior management personnel and attract and retain other necessary personnel, including skilled workers, necessary for the development of our business. The loss of the services of senior management and other key personnel or the failure to attract additional personnel as required could have a material adverse effect on our business, financial condition and results of operations.
Our business depends on our strong brand, and if we are not able to maintain and enhance our brand we may be unable to sell our products.
Our brand has worldwide recognition and our success depends on our ability to maintain and enhance our brand image and reputation. In particular, we believe that maintaining and enhancing the Gates brand is critical to maintaining and expanding our customer base. Maintaining, promoting and enhancing our brand may require us to make substantial investments in areas such as product innovation, product quality, intellectual property protection, marketing and employee training, and these investments may not have the desired impact on our brand image and reputation. Our business could be adversely impacted if we fail to achieve any of these objectives or if the reputation or image of our brand is tarnished or receives negative publicity. In addition, adverse publicity about regulatory or legal action against us could damage our reputation and brand image and reduce long-term demand for our products, even if the regulatory or legal action is unfounded or not material to our operations. If we are unable to maintain or enhance the image of our brand, it could materially adversely affect our business, financial condition and results of operations.
We may be materially adversely impacted by work stoppages and other labor matters.
As of December 30, 2017, we had approximately 14,200 employees worldwide. Certain of our employees are represented by various unions under collective bargaining agreements. While we have no reason to believe that we will be impacted by work stoppages and other labor matters, we cannot assure you that future issues with our labor unions will be resolved favorably or that we will not encounter future strikes, work stoppages, or other types of conflicts with labor unions or our employees. Increased unionization of our workforce, new labor legislation or changes in regulations could disrupt our operations, reduce our profitability or interfere with the ability of our management to focus on executing our business strategies. Any of these factors may have a materially adverse effect on us or may limit our flexibility in dealing with our workforce. In addition, many of our customers have unionized workforces. If one or more of our customers experience a material work stoppage, it could similarly have a material adverse effect on our business, results of operations and financial condition.
21
Table of Contents
We have investments in joint ventures, which limits our ability to manage third-party risks associated with these projects.
We have investments in joint ventures which may involve risks such as the possibility that a co-venturer in an investment might become bankrupt, be unable to meet its capital contribution obligations, have economic or business interests or goals that are inconsistent with our business interests or goals or take actions that are contrary to our instructions or to applicable laws and regulations. Actions by a co-venturer or other third party could expose us to claims for damages, financial penalties and reputational harm, any of which could adversely affect our business and operations. In addition, we may agree to guarantee indebtedness incurred by a joint venture or co-venturer or provide standard indemnifications to lenders for loss liability or damage occurring as a result of our actions or actions of the joint venture or other co-venturers. Such a guarantee or indemnity may be on a joint and several basis with a co-venturer, in which case we may be liable in the event that our co-venturer defaults on its guarantee obligation. The non-performance of a co-venturer’s obligations may cause losses to us in excess of the capital we have invested or committed.
Preparing our financial statements requires us to have access to information regarding the results of operations, financial position and cash flows of our joint ventures. Any deficiencies in our joint ventures’ internal controls over financial reporting may affect our ability to report our financial results accurately or prevent or detect fraud. Such deficiencies also could result in restatements of, or other adjustments to, our previously reported or announced operating results, which could diminish investor confidence and reduce the market price for our ordinary shares. Additionally, if our joint ventures are unable to provide this information for any meaningful period or fail to meet expected deadlines, we may be unable to satisfy our financial reporting obligations or timely file our periodic reports.
Although our joint ventures may generate positive cash flow, in some cases they may be unable to distribute that cash to the joint venture partners. Additionally, in some cases our joint venture partners may control distributions and may choose to leave capital in the joint venture rather than distribute it. Because our ability to generate liquidity from our joint ventures depends in part on their ability to distribute capital to us, our failure to receive distributions from our joint venture partners could reduce our cash flow return on these investments.
We are subject to liabilities with respect to businesses that we have divested in the past.
In recent years, we have divested a number of businesses. With respect to some of these former businesses, we have contractually agreed to indemnify the buyer against liabilities arising prior to the divestiture, including lawsuits, tax liabilities, product liability claims or environmental matters. Even without ongoing contractual indemnification obligations, we could be exposed to liabilities arising out of such divestitures. As a result of these types of arrangements, conditions outside our control could materially adversely affect our future financial results.
Terrorist acts, conflicts and wars may materially adversely affect our business, financial condition and results of operations.
As we have a large international footprint, we are subject to increased risk of damage or disruption to us, our employees, facilities, partners, suppliers, distributors, resellers or customers due to terrorist acts, conflicts and wars, wherever located around the world. The potential for future attacks, the national and international responses to attacks or perceived threats to national security, and other actual or potential conflicts or wars have created many economic and political uncertainties. Although it is impossible to predict the occurrences or consequences of any such events, they could result in a decrease in demand for our products, make it difficult or impossible to deliver products to our customers or to receive raw materials from our suppliers, create delays and inefficiencies in our supply chain and result in the need to impose employee travel restrictions, and thereby materially adversely affect our business, financial condition, results of operations and cash flows.
22
Table of Contents
If we suffer loss to our facilities, supply chains, distribution systems or information technology systems due to catastrophe or other events, it may have a material adverse effect on our business, financial condition and results of operations.
Our facilities, supply chains, distribution systems and information technology systems are subject to catastrophic loss due to fire, flood, earthquake, hurricane, public health crisis, or other natural or man-made disasters. If any of these facilities, supply chains or systems were to experience a catastrophic loss, it could disrupt our operations, delay production and shipments, result in defective products or services, damage customer relationships and our reputation and result in legal exposure and large repair or replacement expenses. The third-party insurance coverage that we maintain will vary from time to time in both type and amount depending on cost, availability and our decisions regarding risk retention, and may be unavailable or insufficient to protect us against losses.
Certain of our defined benefit pension plans are underfunded, and additional cash contributions we may be required to make will reduce the cash available for our business, such as the payment of our interest expense.
Certain of our employees in the United States, the United Kingdom, Canada, Mexico, Germany and Japan are participants in defined benefit pension plans which we sponsor and/or have obligations to contribute to. As of December 30, 2017, the unfunded amount of our defined benefit pension plans on a worldwide basis was approximately $39.4 million on an FASB ASC Topic 715 “Compensation—Retirement Benefits” basis. The amount of our contributions to our underfunded plans will depend upon asset returns, funding assumptions, regulatory requirements and a number of other factors and, as a result, the amount we may be required to contribute to such plans in the future may vary. Such cash contributions to the plans will reduce the cash available for our business such as the payment of interest expense on our notes or our other indebtedness.
The loss or financial instability of any significant customer or customers could adversely affect our business, financial condition, results of operations or cash flows.
A substantial part of our business is concentrated with a few customers, and we have certain customers that are significant to our business. During Fiscal 2017, our top ten customers accounted for approximately 25% of our consolidated net sales, and our largest customer accounted for approximately 9% of our consolidated net sales. The loss of one or more of these customers or other major customers, or a deterioration in our relationship with any of them could have a material adverse effect on our business, financial condition, results of operations or cash flows.
Our contracted backlog is comprised of future orders for our products from a broad number of customers. Defaults by any of the customers that have placed significant orders with us could have a significant adverse effect on our net sales, profitability and cash flow. Our customers may in the future default on their obligations to us due to bankruptcy, lack of liquidity, operational failure or other reasons deriving from the general economic environment or circumstances affecting those customers in particular. If a customer defaults on its obligations to us, it could have a material adverse effect on our backlog, business, financial condition, results of operations or cash flows.
Changes in our effective tax rate could adversely impact our net income.
We are subject to income taxes in various jurisdictions in which we operate. As a result of Gates Industrial Corporation plc being U.K. tax resident, the Company is within the scope of U.K. corporation tax including the controlled foreign company regime. We consider that the non U.K. entities held directly or indirectly by the Company would not give rise to a material charge under the U.K. controlled foreign companies rules. However, changes to, or adverse interpretations of, these rules, or changes in the future activities of the group, may alter this position and could impact the group’s effective tax rate. Additionally, we expect that the pre-IPO reorganization transactions will not give rise to material tax costs for the group, but this position cannot be guaranteed.
Our tax liabilities are dependent upon the location of earnings among these different jurisdictions. Our provision for income taxes and cash tax liability could be adversely affected by numerous factors, including income before taxes being lower than anticipated in countries with lower statutory tax rates and higher than anticipated in countries with higher statutory tax rates, changes in the valuation of deferred tax assets and liabilities, and changes in tax laws and regulations. We are also subject to examination by taxing authorities of our income tax returns for tax years 2012 to 2016 in the United States and for tax years 2007 to 2016 in other major foreign jurisdictions. The
23
Table of Contents
results of audits, examinations and other contests related to previously filed tax returns and continuing assessments of our tax exposures may have an adverse effect on our provision for income taxes and cash tax liability. Additionally, tax rates, tax laws or their implementation, and applicable tax authority practices in any particular jurisdiction could change in the future, possibly on a retroactive basis, and any such change could have a material adverse effect on the business, financial condition, results of operation and prospects of the Company.
We are subject to changes in legislative, regulatory and legal developments involving taxes and the interpretation of those laws is subject to challenge by the relevant governmental authorities.
We are subject to U.S. federal and state, and other countries’ and jurisdictions’, income, payroll, property, sales and use, fuel, and other types of taxes. These laws and regulations are inherently complex and the Company and its subsidiaries will be obliged to make judgments and interpretations about the application of these laws and regulations to the Company and its subsidiaries and their operations and businesses. The interpretation and application of these laws and regulations could be challenged by the relevant governmental authorities, which could result in administrative or judicial procedures, actions or sanctions, the ultimate outcome of which could have a material adverse effect on the business, financial condition, results of operation and prospects of the Company.
Changes in tax rates, enactment of new tax laws, revisions of tax regulations, and claims or litigation with taxing authorities may require significant judgment in determining the appropriate provision and related accruals for these taxes; and as a result, such changes could result in substantially higher taxes and, therefore, could have a significant adverse effect on our results of operations, financial conditions and liquidity. In this regard, new U.S. federal income tax laws were recently enacted by the Tax Cuts and Jobs Act. The Tax Cuts and Jobs Act is complex and new (and it lacks administrative guidance), thus the impact of certain aspects of its provisions on us is uncertain, including on our income tax expense for Fiscal 2017. In addition, the U.S., the E.U. and member states along with numerous other countries are currently engaged in establishing fundamental changes to tax laws affecting the taxation of multinational corporations including pursuant to the Organisation for Economic Co-operation and Development’s Base Erosion and Profit Shifting project. The U.K. has already enacted significant measures in this regard. Further, the United Kingdom’s decision to leave the E.U. may result in changes to the interpretation and application of tax laws and regulations including changes to the interpretations of double tax treaties which could lead to significant changes in the U.K. tax burden of the Company. In addition, it may become more difficult for cash to be repatriated to U.K. companies without the application of withholding tax and the tax treatment of the interest on any intra-group loans may be impacted by these changes, both resulting in significant changes to the tax burden of the Company. Any such developments in the U.S. or in other countries could materially affect our tax burden and/or have a negative impact on our ability to compete in the global marketplace.
We intend to operate so as to be treated exclusively as a resident of the U.K. for tax purposes, but the relevant tax authorities may treat us as also being a resident of another jurisdiction for tax purposes.
We are a company incorporated in the U.K. Current U.K. tax law provides that we will be regarded as being U.K. resident for tax purposes from incorporation and shall remain so unless (i) we were concurrently resident of another jurisdiction (applying the tax residence rules of that jurisdiction) that has a double tax treaty with the U.K. and (ii) there is a tiebreaker provision in that tax treaty which allocates exclusive residence to that other jurisdiction.
Based upon our anticipated management and organizational structure, we believe that we should be regarded solely as resident in the U.K. from our incorporation for tax purposes. However, because this analysis is highly factual and may depend on future changes in our management and organizational structure, there can be no assurance regarding the final determination of our tax residence. Should we be treated as resident in a country or jurisdiction other than the U.K., we could be subject to taxation in that country or jurisdiction on our worldwide income and may be required to comply with a number of material and formal tax obligations, including withholding tax and/or reporting obligations provided under the relevant tax law, which could result in additional costs and expenses.
24
Table of Contents
We may not qualify for benefits under the tax treaties entered into between the United Kingdom and other countries.
We intend to operate in a manner such that when relevant, we are eligible for benefits under the tax treaties entered into between the U.K. and other countries. However, our ability to qualify and continue to qualify for such benefits will depend upon the requirements contained within each treaty and the applicable domestic laws, as the case may be, on the facts and circumstances surrounding our operations and management, and on the relevant interpretation of the tax authorities and courts.
Our failure to qualify for benefits under the tax treaties entered into between the U.K. and other countries could result in adverse tax consequences to us and could result in certain tax consequences of owning or disposing of our ordinary shares.
The value of our deferred tax assets could become impaired, which could materially and adversely affect our results of operations and financial condition.
In accordance with FASB ASC Topic 740 “Income Taxes,” each quarter we determine the probability of the realization of deferred tax assets, using significant judgments and estimates with respect to, among other things, historical operating results, expectations of future earnings and tax planning strategies. This topic requires that the tax effects of a position be recognized only if it is “more-likely-than-not” to be sustained based solely on its technical merits as of the reporting date. The more-likely-than-not threshold represents a positive assertion by management that a company is entitled to the economic benefits of a tax position. If a tax position is not considered more-likely-than-not to be sustained based solely on its technical merits, no benefits of the position are to be recognized. Moreover, the more-likely-than-not threshold must continue to be met in each reporting period to support continued recognition of a benefit. If we determine in the future that there is not sufficient positive evidence to support the valuation of these assets, due to the risk factors described herein or other factors, we may be required to adjust the valuation allowance to reduce our deferred tax assets. Such a reduction could result in material non-cash expenses in the period in which the valuation allowance is adjusted and could have a material adverse effect on our results of operations and financial condition. In addition, future changes in laws or regulations could have a material impact on the company’s overall tax position.
Our overall effective tax rate is equal to our total tax expense as a percentage of our total earnings before tax. However, tax expenses and benefits are determined separately for each tax paying component (an individual entity) or group of entities that is consolidated for tax purposes in each jurisdiction. Losses in certain jurisdictions which have valuation allowances against their deferred tax assets provide no current financial statement tax benefit. As a result, changes in the mix of projected earnings between jurisdictions, among other factors, could have a significant impact on our overall effective tax rate.
Restriction on use of tax attributes may result from an “ownership change” under applicable tax law.
Section 382 of the U.S. Internal Revenue Code of 1986, as amended (the “Code”), limits the ability of a corporation that undergoes an “ownership change” to use its tax attributes, such as net operating losses and tax credits. In general, an “ownership change” occurs if shareholders owning 5% or more (applying certain look-through rules) of an issuer’s outstanding ordinary shares, collectively, increase their ownership percentage by more than 50 percentage points within any three-year period over such shareholders’ lowest percentage ownership during this period. If we were to issue new ordinary shares, such new shares could contribute to such an “ownership change” under U.S. tax law. Moreover, not every event that could contribute to such an “ownership change” is within our control. If an “ownership change” under Section 382 were to occur, our ability to utilize tax attributes in the future may be limited.
25
Table of Contents
Risks Related to Our Indebtedness
Our substantial leverage could adversely affect our financial condition, our ability to raise additional capital to fund our operations, our ability to operate our business, our ability to react to changes in the economy or our industry or our ability to pay our debts, and could divert our cash flow from operations to debt payments.
We are highly leveraged. As of December 30, 2017, the total principal amount of our debt was approximately $4.0 billion (equivalent). Subject to the limits contained in the credit agreements that govern our senior secured credit facilities, the indenture that governs our notes and the applicable agreements governing our other debt instruments, we may be able to incur substantial additional debt from time to time to finance working capital, capital expenditures, investments or acquisitions, or for other purposes. If we do so, the risks related to our high level of debt could increase. Specifically, our high level of debt could have important consequences, including the following:
| • | making it more difficult for us to satisfy our obligations with respect to our debt; |
| • | limiting our ability to obtain additional financing to fund future working capital, capital expenditures, acquisitions or other general corporate requirements; |
| • | requiring a substantial portion of our cash flows to be dedicated to debt service payments instead of other purposes, thereby reducing the amount of cash flows available for working capital, capital expenditures, acquisitions and other general corporate purposes; |
| • | increasing our vulnerability to general adverse economic and industry conditions; |
| • | exposing us to the risk of increased interest rates as certain of our borrowings are at variable rates of interest; |
| • | limiting our flexibility in planning for and reacting to changes in the industry in which we compete; |
| • | placing us at a disadvantage compared to other, less leveraged competitors; and |
| • | increasing our cost of borrowing. |
We are a holding company, and our consolidated assets are owned by, and our business is conducted through, our subsidiaries. Revenue from these subsidiaries is our primary source of funds for debt payments and operating expenses. If our subsidiaries are restricted from making distributions, our ability to meet our debt service obligations or otherwise fund our operations may be impaired. Moreover, there may be restrictions on payments by subsidiaries to their parent companies under applicable laws, including laws that require companies to maintain minimum amounts of capital and to make payments to shareholders only from profits. As a result, although a subsidiary of ours may have cash, we may not be able to obtain that cash to satisfy our obligation to service our outstanding debt or fund our operations.
Despite our current level of indebtedness, we may be able to incur substantially more debt and enter into other transactions which could further exacerbate the risks to our financial condition described above.
We may be able to incur significant additional indebtedness in the future. Although certain of the agreements governing our existing indebtedness contain restrictions on the incurrence of additional indebtedness and entering into certain types of other transactions, these restrictions are subject to a number of qualifications and exceptions. Additional indebtedness incurred in compliance with these restrictions could be substantial. These restrictions also do not prevent us from incurring obligations, such as trade payables, that do not constitute indebtedness as defined under our debt instruments. To the extent new debt is added to our current debt levels, the substantial leverage risks described in the immediately preceding risk factor would increase.
Our variable rate indebtedness subjects us to interest rate risk, which could cause our indebtedness service obligations to increase significantly.
Interest rates may increase in the future. As a result, interest rates on our revolving credit facility or other variable rate debt offerings could be higher or lower than current levels. As of December 30, 2017, after taking into account our interest rate derivatives, $1,315.0 million (equivalent), or 33.0%, of our outstanding debt had variable interest rates. If interest rates increase, our debt service obligations on the variable rate indebtedness would increase even though the amount borrowed remained the same, and our net income and cash flows, including cash available for servicing our indebtedness, would correspondingly decrease.
26
Table of Contents
Certain of our debt agreements impose significant operating and financial restrictions on us and our subsidiaries, which could prevent us from capitalizing on business opportunities.
The credit agreements that govern our senior secured term loan facilities and the indenture that governs our notes impose significant operating and financial restrictions on our subsidiaries. These restrictions limit the ability of certain of our subsidiaries to, among other things:
| • | incur or guarantee additional debt or issue disqualified stock or preferred stock; |
| • | pay dividends and make other distributions on, or redeem or repurchase, capital stock; |
| • | make certain investments; |
| • | incur certain liens; |
| • | enter into transactions with affiliates; |
| • | merge or consolidate; |
| • | enter into agreements that restrict the ability of restricted subsidiaries to make dividends or other payments; |
| • | designate restricted subsidiaries as unrestricted subsidiaries; and |
| • | transfer or sell assets. |
As a result of these restrictions, we are limited as to how we conduct our business and we may be unable to raise additional debt or equity financing to compete effectively or to take advantage of new business opportunities. The terms of any future indebtedness we may incur could include similar or more restrictive covenants. We cannot assure you that we will be able to maintain compliance with these covenants in the future and, if we fail to do so, that we will be able to obtain waivers from the lenders or amend the covenants.
Our failure to comply with the restrictive covenants described above as well as other terms of our other indebtedness or the terms of any future indebtedness from time to time could result in an event of default, which, if not cured or waived, could result in our being required to repay these borrowings before their due date. If we are forced to refinance these borrowings on less favorable terms or are unable to refinance these borrowings, our results of operations and financial condition could be adversely affected.
Our failure to comply with the agreements relating to our outstanding indebtedness, including as a result of events beyond our control, could result in an event of default that could materially and adversely affect our results of operations and our financial condition.
If there were an event of default under any of the agreements relating to our outstanding indebtedness, the holders of the defaulted debt could cause all amounts outstanding with respect to that debt to be due and payable immediately. We cannot assure you that our assets or cash flows would be sufficient to fully repay borrowings under our outstanding debt instruments if accelerated upon an event of default. Further, if we are unable to repay, refinance or restructure our indebtedness under our secured debt, the holders of such debt could proceed against the collateral securing that indebtedness. In addition, any event of default or declaration of acceleration under one debt instrument could also result in an event of default under one or more of our other debt instruments.
Repayment of our debt is dependent on cash flow generated by our subsidiaries, which may be subject to limitations beyond our control.
Our subsidiaries own all of our assets and conduct all of our operations. Accordingly, repayment of our indebtedness is dependent on the generation of cash flow by our subsidiaries and their ability to make such cash available to Gates Global LLC, by dividend, debt repayment or otherwise.
27
Table of Contents
Unless they are obligors of our indebtedness, our subsidiaries do not have any obligation to pay amounts due on such indebtedness or to make funds available to the notes issuers for that purpose. Our non-guarantor subsidiaries may not be able to, or may not be permitted to, make distributions to enable us to make payments in respect of our indebtedness, including the notes. Each non-guarantor subsidiary is a distinct legal entity and, under certain circumstances, legal and contractual restrictions may limit our ability to obtain cash from our non-guarantor subsidiaries. While limitations on our subsidiaries restrict their ability to pay dividends or make other intercompany payments to Gates Global LLC, these limitations are subject to certain qualifications and exceptions.
In the event that Gates Global LLC is unable to receive distributions from subsidiaries, it may be unable to make required principal and interest payments on our indebtedness.
Risks Related to the Ownership of our Ordinary Shares
Our Sponsor and its affiliates control us and their interests may conflict with ours or yours in the future.
Our Sponsor and its affiliates beneficially owned approximately 84.2% of our ordinary shares as of March 8, 2018. Moreover, under our articles of association (the “Articles”) and our shareholders agreement with our Sponsor, for so long as our Sponsor and its affiliates retain significant ownership of us, we have agreed to nominate to our board individuals designated by such Sponsor. Even when our Sponsor and its affiliates cease to own ordinary shares representing a majority of the total voting power, for so long as our Sponsor continues to own a significant percentage of our ordinary shares, such Sponsor will still be able to significantly influence the composition of our board of directors and the approval of actions requiring shareholder approval through their voting power. Accordingly, for such period of time, our Sponsor will have significant influence with respect to our management, business plans and policies, including the appointment and removal of our officers. In particular, for so long as our Sponsor continues to own a significant percentage of our ordinary shares, such Sponsor will be able to cause or prevent a change of control of our company or a change in the composition of our board of directors and could preclude any unsolicited acquisition of our company. The concentration of ownership could deprive you of an opportunity to receive a premium for your ordinary shares as part of a sale of our company and ultimately might affect the market price of our ordinary shares.
Our Sponsor and its affiliates engage in a broad spectrum of activities. In the ordinary course of their business activities, our Sponsor and its affiliates may engage in activities where their interests conflict with our interests or those of our shareholders. Our shareholders’ agreement provides that none of our Sponsor, any of its affiliates or any director who is not employed by us or his or her affiliates will have any duty to refrain from engaging, directly or indirectly, in the same business activities or similar business activities or lines of business in which we operate. Our Sponsor also may pursue acquisition opportunities that may be complementary to our business, and, as a result, those acquisition opportunities may not be available to us. In addition, our Sponsor may have an interest in our pursuing acquisitions, divestitures and other transactions that, in their judgment, could enhance their investment, even though such transactions might involve risks to us and our shareholders.
We are a “controlled company” within the meaning of the rules of the NYSE and, as a result, rely on and intend to continue to rely on, exemptions from certain corporate governance requirements. You may not have the same protections afforded to shareholders of companies that are subject to such requirements.
Our Sponsor controls a majority of the combined voting power of all classes of our shares entitled to vote generally in the election of directors. As a result, we are a “controlled company” within the meaning of the corporate governance standards of the NYSE. Under these rules, a company of which more than 50% of the voting power in the election of directors is held by an individual, group or another company is a “controlled company” and may elect not to comply with certain corporate governance requirements. For example, controlled companies, within one year of the date of the listing of their ordinary shares:
| • | are not required to have a board that is composed of a majority of “independent directors,” as defined under the rules of such exchange; |
| • | are not required to have a compensation committee that is composed entirely of independent directors; and |
28
Table of Contents
| • | are not required to have a nominating and corporate governance committee that is composed entirely of independent directors. |
We intend to continue to utilize these exemptions. As a result, we currently do not have a majority of the directors on our board that have been affirmatively determined to be independent by our board. In addition, none of the committees of the board currently consist entirely of directors that have affirmatively been determined independent by our board. Accordingly, you may not have the same protections afforded to shareholders of companies that are subject to all of the corporate governance requirements of the NYSE.
Our internal controls over financial reporting currently do not meet all of the standards contemplated by Section 404 of the Sarbanes-Oxley Act, and failure to achieve and maintain effective internal controls over financial reporting in accordance with Section 404 of the Sarbanes-Oxley Act could have a material adverse effect on our business and market price of the ordinary shares.
Our internal controls over financial reporting currently do not meet all of the standards contemplated by Section 404 of the Sarbanes-Oxley Act that eventually we will be required to meet. Because currently we do not have comprehensive documentation of our internal controls and have not yet tested our internal controls in accordance with Section 404, we cannot conclude in accordance with Section 404 that we do not have a material weakness in our internal controls or a combination of significant deficiencies that could result in the conclusion that we have a material weakness in our internal controls. Additionally, our independent registered public accounting firm will be required to attest to the effectiveness of management’s internal control over financial reporting on an annual basis. If we are not able to complete this initial assessment of our internal controls and otherwise implement the requirements of Section 404 in a timely manner or with adequate compliance, our independent registered public accounting firm may not be able to certify as to the adequacy of our internal controls over financial reporting.
Matters impacting our internal controls may cause us to be unable to report our financial information on a timely basis and thereby subject us to adverse regulatory consequences, including sanctions by the SEC or violations of applicable stock exchange listing rules, which may result in a breach of the covenants under our financing arrangements. There also could be a negative reaction in the financial markets due to a loss of investor confidence in us and the reliability of our financial statements. Confidence in the reliability of our financial statements also could suffer if we or our independent registered public accounting firm were to report a material weakness in our internal controls over financial reporting. This could materially adversely affect us and lead to a decline in the market price of our ordinary shares.
If securities or industry analysts do not publish research or reports about our business, or if they downgrade their recommendations regarding our ordinary shares, our share price and trading volume could decline.
The trading market for our ordinary shares will be influenced by the research and reports that industry or securities analysts publish about us or our business. If any of the analysts who cover us downgrade our ordinary shares or publishes inaccurate or unfavorable research about our business, our ordinary share price may decline. If analysts cease coverage of us or fail to regularly publish reports on us, we could lose visibility in the financial markets, which in turn could cause our ordinary share price or trading volume to decline and our ordinary shares to be less liquid.
The market price of our ordinary shares may be volatile, which could cause the value of your investment to decline.
The market price of our ordinary shares may be highly volatile and could be subject to wide fluctuations. Securities markets worldwide experience significant price and volume fluctuations. This market volatility, as well as general economic, market or political conditions, could reduce the market price of our ordinary shares regardless of our operating performance. In addition, our operating results could be below the expectations of public market analysts and investors due to a number of potential factors, including variations in our quarterly operating results or dividends, if any, to shareholders, additions or departures of key management personnel, failure to meet analysts’ earnings estimates, publication of research reports about our industry, litigation and government investigations, changes or proposed changes in laws or regulations or differing interpretations or enforcement thereof affecting our
29
Table of Contents
business, adverse market reaction to any indebtedness we may incur or securities we may issue in the future, changes in market valuations of similar companies or speculation in the press or investment community, announcements by our competitors of significant contracts, acquisitions, dispositions, strategic partnerships, joint ventures or capital commitments, adverse publicity about the industries we participate in or individual scandals, and in response the market price of our ordinary shares could decrease significantly.
Stock markets and the price of our ordinary shares may experience extreme price and volume fluctuations. In the past, following periods of volatility in the overall market and the market price of a company’s securities, securities class action litigation has often been instituted against these companies. This litigation, if instituted against us, could result in substantial costs and a diversion of our management’s attention and resources.
Because we have no current plans to pay dividends on our ordinary shares, you may not receive any return on your investment unless you sell your ordinary shares for a price greater than that which you paid for them.
We have no current plans to pay dividends on our ordinary shares. The declaration, amount and payment of any future dividends on our ordinary shares will be at the sole discretion of our board of directors. Our board of directors may take into account general and economic conditions, our financial condition and results of operations, our available cash and current and anticipated cash needs, capital requirements, contractual, legal, tax and regulatory restrictions and implications on the payment of dividends by us to our shareholders or by our subsidiaries to us and such other factors as our board of directors may deem relevant. In addition, our ability to pay dividends is limited by our senior secured credit facilities and notes and may be limited by covenants of other indebtedness we or our subsidiaries incur in the future. As a result, you may not receive any return on an investment in our ordinary shares unless you sell your ordinary shares for a price greater than that which you paid for them.
English law will require that we meet certain additional financial requirements before we declare dividends and repurchase shares.
Under English law, with limited exceptions, Gates Industrial Corporation plc will only be able to declare dividends, make distributions or repurchase shares out of “distributable reserves” on Gates Industrial Corporation plc’s stand-alone balance sheet, without regard to our consolidated financial statements. Distributable reserves are a company’s accumulated, realized profits, to the extent not previously utilized by distribution or capitalization, less its accumulated, realized losses, to the extent not previously written off in a reduction or reorganization of capital duly made.
Gates Industrial Corporation plc does not currently have distributable reserves. We intend to seek the approval of a capital reduction by the English court to create distributable reserves that could be used for future dividend payments or to effect share repurchases. If that approval is not received, Gates Industrial Corporation plc will not have sufficient distributable reserves to declare and pay dividends for the foreseeable future and Gates Industrial Corporation plc would be required to undertake other efforts to allow it to declare dividends or repurchase shares. These efforts may include certain intra-group reorganizations which are established alternatives for the creation of distributable reserves in a U.K. public limited company.
You may be diluted by the future issuance of additional ordinary shares in connection with our incentive plans, acquisitions or otherwise.
Our shareholders adopted a resolution authorizing our board of directors to allot our ordinary shares and to grant rights to subscribe for or convert any security into such shares for the consideration and on the terms and conditions established by our board of directors in its sole discretion, whether in connection with acquisitions or otherwise. Additionally, we have reserved 12,500,000 ordinary shares for issuance under our Omnibus Incentive Plan. For further information, see Item 11 of this Annual Report on Form 10-K. Any ordinary shares that we issue, including under our Omnibus Incentive Plan or other equity incentive plans that we may adopt in the future, would dilute the percentage ownership held by the holders of our ordinary shares.
30
Table of Contents
Future issuances of ordinary shares by us, and the availability for resale of shares held by our pre-IPO owners, may cause the market price of our ordinary shares to decline.
Sales of a substantial number of our ordinary shares in the public market, or the perception that these sales could occur, could substantially decrease the market price of our ordinary shares. After the expiration or earlier waiver or termination of the lock-up periods described below, substantially all of our outstanding ordinary shares will be available for resale in the public market. Registration of the sale of these ordinary shares would permit their sale into the market immediately. The market price of our ordinary shares could drop significantly if the holders of these shares sell them or are perceived by the market as intending to sell them.
Pursuant to a registration rights agreement, we have granted our Sponsor the right to cause us, in certain instances, at our expense, to file registration statements under the Securities Act covering resales of our ordinary shares held by them. These shares represented approximately 84.2% of our outstanding ordinary shares as of March 8, 2018. These shares also may be sold pursuant to Rule 144 under the Securities Act, depending on their holding period and subject to restrictions in the case of shares held by persons deemed to be our affiliates. As restrictions on resale end or if these stockholders exercise their registration rights, the market price of our stock shares decline if the holders of restricted shares sell them or are perceived by the market as intending to sell them.
In connection with our IPO, our executive officers, directors and holders of certain of our outstanding ordinary shares at the time of the IPO, including our Sponsor, that collectively owned approximately 84.7% of our outstanding common stock as of March 8, 2018, signed lock-up agreements with the underwriters of the initial public offering that, subject to certain customary exceptions, restrict the sale of the shares of our common stock held by them for 180 days following the date of the IPO prospectus. Citigroup Global Markets Inc. and Morgan Stanley & Co. LLC may, in their sole discretion, release all or any portion of the ordinary shares subject to lock-up agreements.
Upon the expiration of the lock-up agreements described above, all of such ordinary shares will be eligible for resale in the public market, subject, in the case of ordinary shares held by our affiliates, to volume, manner of sale and other limitations under Rule 144. We expect that our Sponsor will continue to be considered an affiliate following the expiration of the lock-up period based on its expected share ownership and its board nomination rights. Certain other of our shareholders may also be considered affiliates at that time. However, commencing 180 days following our IPO, the holders of these ordinary shares will have the right, subject to certain exceptions and conditions, to require us to register their ordinary shares under the Securities Act, and they will have the right to participate in future registrations of securities by us. Registration of any of these outstanding ordinary shares would result in such securities becoming freely tradable without compliance with Rule 144 upon effectiveness of the registration statement.
On January 29, 2018, we filed a registration statement on Form S-8 under the Securities Act to register ordinary shares or securities convertible into or exchangeable for ordinary shares issued pursuant to the 2014 Incentive Plan, the 2015 Non-Employee Director Incentive Plan or the Omnibus Incentive Plan. This, and any similar registration statements filed on Form S-8 in the future, is automatically effective upon filing. Accordingly, ordinary shares registered under such registration statements will be available for sale in the open market. The initial registration statement on Form S-8 covered 12,500,000 ordinary shares.
As restrictions on resale end, the market price of our ordinary shares could drop significantly if the holders of these restricted ordinary shares sell them or are perceived by the market as intending to sell them. These factors could also make it more difficult for us to raise additional funds through future offerings of our ordinary shares or other securities or to use our ordinary shares as consideration for acquisitions of other businesses, investments or other corporate purposes.
U.S. investors may have difficulty enforcing civil liabilities against our company, our directors or members of senior management and the experts named in this annual report.
There is doubt as to whether English courts would enforce certain civil liabilities under U.S. securities laws in original actions or judgments of U.S. courts based upon these civil liability provisions. In addition, awards of punitive damages in actions brought in the United States or elsewhere may be unenforceable in the United Kingdom.
31
Table of Contents
An award for monetary damages under the U.S. securities laws would be considered punitive if it does not seek to compensate the claimant for loss or damage suffered and is intended to punish the defendant. The enforceability of any judgment in the United Kingdom will depend on the particular facts of the case as well as the laws and treaties in effect at the time. The United States and the United Kingdom do not currently have a treaty providing for recognition and enforcement of judgments (other than arbitration awards) in civil and commercial matters.
The rights of our shareholders may differ from the rights typically offered to shareholders of a U.S. corporation.
We are incorporated under English law. The rights of holders of ordinary shares are governed by English law, including the provisions of the Companies Act 2006 (the “Companies Act”), and by our Articles. These rights differ in certain respects from the rights of shareholders in typical U.S. corporations.
The U.K. City Code on Takeovers and Mergers (the “Takeover Code”) applies, among other things, to an offer for a public company whose registered office is in the United Kingdom (or the Channel Islands or the Isle of Man) and whose securities are not admitted to trading on a regulated market in the United Kingdom (or the Channel Islands or the Isle of Man) if the company is considered by the Panel on Takeovers and Mergers (the “Takeover Panel”) to have its place of central management and control in the United Kingdom (or the Channel Islands or the Isle of Man). This is known as the “residency test”. Under the Takeover Code, the Takeover Panel will determine whether we have our place of central management and control in the United Kingdom by looking at various factors, including the structure of our board of directors, the functions of the directors and where they are resident.
If at the time of a takeover offer the Takeover Panel determines that we have our place of central management and control in the United Kingdom, we would be subject to a number of rules and restrictions, including but not limited to the following: (i) our ability to enter into deal protection arrangements with a bidder would be extremely limited; (ii) we might not, without the approval of our shareholders, be able to perform certain actions that could have the effect of frustrating an offer, such as issuing shares or carrying out acquisitions or disposals; and (iii) we would be obliged to provide equality of information to all bona fide competing bidders.
Our Sponsor has an interest in over 50% of our voting share capital, and therefore, if the Takeover Panel were to determine that we were subject to the Takeover Code, our Sponsor would be able to increase its aggregate holding in us without triggering the requirement under Rule 9 of the Takeover Code to make a cash offer for the outstanding shares in the issuer.
The Takeover Panel has confirmed to our representatives that, on the basis of our board of directors, it does not consider the Takeover Code to apply to the Company, although that position is subject to change if our place of central management and control is subsequently found to move to the U.K.
Our Articles provide that the courts of England and Wales have exclusive jurisdiction to determine any dispute brought by a shareholder in that shareholder’s capacity as such, or related to or connected with any derivative claim in respect of a cause of action vested in the Company or seeking relief on behalf of the Company, against the Company and/or the board and/or any of the directors, former directors, officers or other employees individually, arising out of or in connection with the Articles or (to the maximum extent permitted by applicable law) otherwise, which could limit our shareholders’ ability to obtain a favorable judicial forum for disputes with us or our directors, former directors, officers or employees.
Our Articles provide that the courts of England and Wales shall have exclusive jurisdiction to determine any dispute brought by a shareholder in that shareholder’s capacity as such, or related to or connected with any derivative claim in respect of a cause of action vested in the Company or seeking relief on behalf of the Company, against the Company and/or the board and/or any of the directors, former directors, officers or other employees individually, arising out of or in connection with these Articles or (to the maximum extent permitted by applicable law) otherwise. This choice of forum provision may limit a shareholder’s ability to bring a claim in a judicial forum that the shareholder believes is favorable for disputes with us or our directors, former directors, officers or other employees, which may discourage lawsuits against us and our directors, former directors, officers and employees. The rights of stockholders under Delaware law and shareholders under English law in relation to the bringing of shareholder suits differ in several significant respects. Any person or entity purchasing or otherwise acquiring or holding any interest in our ordinary shares shall be deemed to have notice of and to have consented to the provisions of our governing documents described above, as they may be amended from time to time.
32
Table of Contents
Any shareholder whose principal currency is not the U.S. dollar will be subject to exchange rate fluctuations.
Our ordinary shares are traded in, and any cash dividends or other distributions to be declared in respect of them, if any, will be denominated in, U.S. dollars. Shareholders whose principal currency is not the U.S. dollar will be exposed to foreign currency exchange rate risk. Any depreciation of the U.S. dollar in relation to such foreign currency would reduce the value of our ordinary shares held by such shareholders, whereas any appreciation of the U.S. dollar would increase their value in foreign currency terms. In addition, we will not offer our shareholders the option to elect to receive dividends, if any, in any other currency. Consequently, our shareholders may be required to arrange their own foreign currency exchange, either through a brokerage house or otherwise, which could incur additional commissions or expenses.
Transfers of our shares outside DTC may be subject to stamp duty or stamp duty reserve tax in the U.K., which would increase the cost of dealing in our shares.
On completion of the IPO, as noted below, the new ordinary shares were issued to a nominee for The Depository Trust Company (“DTC”) and corresponding book-entry interests credited in the facilities of DTC. On the basis of current law, no charges to U.K. stamp duty or stamp duty reserve tax (“SDRT”) are expected to arise on the issue of the ordinary shares into DTC’s facilities or on transfers of book-entry interests in ordinary shares within DTC’s facilities and you are strongly encouraged to hold your ordinary shares in book-entry form through the facilities of DTC.
A transfer of title in the ordinary shares from within the DTC system to a purchaser out of DTC and any subsequent transfers that occur entirely outside the DTC system, will attract a charge to stamp duty at a rate of 0.5% of any consideration, which is payable by the transferee of the ordinary shares. Any such duty must be paid (and the relevant transfer document, if any, stamped by HM Revenue & Customs (“HMRC”)) before the transfer can be registered in our company books. However, if those ordinary shares are redeposited into DTC, the redeposit will attract stamp duty or SDRT at the rate of 1.5% to be paid by the transferor.
We have put in place arrangements to require that our ordinary shares held in certificated form cannot be transferred into the DTC system until the transferor of the ordinary shares has first delivered the ordinary shares to a depositary specified by us so that stamp duty (and/or SDRT) may be collected in connection with the initial delivery to the depositary. Any such ordinary shares will be evidenced by a receipt issued by the depositary. Before the transfer can be registered in our books, the transferor will also be required to put funds in the depositary to settle the resultant liability to stamp duty (and/or SDRT), which will be charged at a rate of 1.5% of the value of the shares.
If our ordinary shares are not eligible for deposit and clearing within the facilities of DTC, then transactions in our securities may be disrupted.
The facilities of DTC are a widely-used mechanism that allow for rapid electronic transfers of securities between the participants in the DTC system, which include many large banks and brokerage firms. Our ordinary shares are currently eligible for deposit and clearing within the DTC system. DTC generally has discretion to cease to act as a depository and clearing agency for the ordinary shares including to the extent that any changes in U.K. law (including changes as a result of the U.K.’s decision to leave the E.U.) changes the stamp duty or SDRT position in relation to the ordinary shares. While we would pursue alternative arrangements to preserve our listing and maintain trading, any such disruption could have a material adverse effect on the market price of our ordinary shares.
33
Table of Contents
Item 1B. Unresolved Staff Comments
None.
We have a presence in over 120 locations in 30 countries across the Americas, Europe, Asia and Australia. Our corporate operations center is located in Denver, Colorado, and we also maintain regional headquarters in Denver, Colorado, Erembodegem, Belgium, Shanghai, China and Singapore.
As of December 30, 2017, the carrying amount of our property, plant and equipment was $686.2 million of which $2.4 million related to assets held under capital leases. This compares to a carrying amount of our property, plant and equipment of $599.6 million as of December 31, 2016, of which $2.3 million related to assets held under capital leases.
Included in property, plant and equipment are land and buildings with a total carrying amount of $213.4 million as of December 30, 2017, compared with $203.7 million as of December 31, 2016, representing manufacturing facilities, service centers, distribution centers and offices located throughout the world, predominantly in North America. As of December 30, 2017, Gates owned 35 of these facilities, including 25 manufacturing or service centers.
Gates leases a further 95 locations. These leased locations included 39 manufacturing or service centers as of December 30, 2017. Management believes that the Company’s properties are suitable and adequate for its current and anticipated business operations.
Gates is, from time to time, party to general legal proceedings and claims, which arise in the ordinary course of business. Gates is also, from time to time, party to legal proceedings and claims in respect of environmental obligations, product liability, intellectual property and other matters which arise in the ordinary course of business and against which management believes meritorious defenses are available.
While it is not possible to quantify the financial impact or predict the outcome of all pending claims and litigation, management does not anticipate that the outcome of any current proceedings or known claims, either individually or in aggregate, will have a material adverse effect upon our financial position, results of operations or cash flows.
Item 4. Mine Safety Disclosures
Not applicable.
34
Table of Contents
Item 5. Market for Registrant’s Common Equity, Stockholder Matters and Issuer Purchases Of Equity
Market Information
Our ordinary shares began trading publicly on the New York Stock Exchange (“NYSE”) under the symbol “GTES” on January 25, 2018. Prior to that time there was no public market for our ordinary shares. As of March 8, 2018, there were approximately 40 holders of record of our ordinary shares. This stockholder figure does not include a substantially greater number of holders whose ordinary shares are held by these recordholders.
Recent Sales of Unregistered Securities
In connection with our formation in September 2017, we issued one ordinary share for $0.01 and one redeemable preferred share for £50,000 to Blackstone Capital Partners (Cayman) VI L.P. in exchange for a note due on April 2, 2018. The issuance of such shares was not registered under the Securities Act, because the shares were offered and sold in a transaction by the issuer not involving any public offering exempt from registration under Section 4(a)(2) of the Securities Act.
In connection with the closing of our IPO on January 29, 2018, we issued 245,474,605 ordinary shares in consideration for the ordinary shares and certain indebtedness of a newly formed subsidiary of Omaha Topco and our pre-IPO owners received depositary receipts representing such ordinary shares. Such securities were issued in reliance on the exemption contained in Section 4(a)(2) of the Securities Act, as transactions by issuers not involving a public offering. No general solicitation or underwriters were involved in such issuances.
Use of Proceeds from Registered Securities
On January 29, 2018, we completed an IPO in which we sold 38,500,000 ordinary shares at a price of $19.00 per share and on February 5, 2018 we issued an additional 5,775,000 ordinary shares pursuant to the exercise in full of the underwriters’ over-allotment option. The shares offered and sold in the IPO were registered under the Securities Act pursuant to our Registration Statement on Form S-1 (File No. 333-222310), which was declared effective by the SEC on January 22, 2018. The offering did not terminate until after the sale of all 44,275,000 ordinary shares registered on the registration statement. The aggregate offering price for the shares registered and sold by us was approximately $841.2 million. The underwriters of the offering were led by Citigroup Global Markets Inc, Morgan Stanley & Co. LLC, UBS Securities LLC, Barclays Capital Inc., Credit Suisse Securities (USA) LLC, Goldman Sachs & Co. LLC and RBC Capital Markets, LLC.
The IPO generated net proceeds of approximately $789.6 million to us after net underwriting discounts and commissions of $42.1 million and other offering expenses of approximately $9.5 million. Blackstone Advisory Partners L.P., an underwriter in the offering, is an affiliate of our Sponsor and received underwriting fees of approximately $3.2 million. No other offering expenses were paid directly or indirectly to any of our directors or officers (or their associates), persons owning 10% or more of our ordinary shares or any other affiliates. We used the net proceeds from the offering, together with available cash, to (i) redeem all €235.0 million ($285.8 million equivalent as of the redemption date) principal amount of our euro notes, (ii) redeem approximately $622.0 million principal amount of our dollar notes and (iii) redeem our £50,000 redeemable preferred share issued in connection with the pre-IPO reorganization transactions.
35
Table of Contents
Dividends
We have no current plans to pay dividends on our ordinary shares. Any decision to declare and pay dividends in the future will be made at the sole discretion of our board of directors and will depend on, among other things, our results of operations, cash requirements, financial condition, contractual restrictions and other factors that our board of directors may deem relevant. We are a holding company and have no direct operations, accordingly, we will only be able to pay dividends from funds we receive from our subsidiaries. In addition, the ability of our subsidiaries to pay dividends will be limited by covenants in our existing indebtedness and may be limited by the agreements governing any indebtedness we or our subsidiaries may incur in the future.
In Fiscal 2017, Fiscal 2016 and Fiscal 2015, we did not pay any dividends on our shares.
Item 6. Selected Financial Data
Upon completion of the IPO of the Company’s shares in January 2018, the Company undertook certain reorganization transactions (the “Transactions”) such that Gates Industrial Corporation plc now owns indirectly all of the equity interests in Omaha Topco and has become the holding company of the Gates business. The reorganization was accounted for as a transaction between entities under common control and the net assets were recorded at the historical cost basis when Omaha Topco was contributed into the Company. Gates Industrial Corporation plc had no significant business transactions or activities prior to the date of the Transactions.
The following table sets forth the selected historical consolidated financial information of Gates Industrial Corporation plc, which therefore reflects the historical consolidated financial information of Omaha Topco and the Predecessor to Omaha Topco, Pinafore Holdings B.V., for the periods and dates indicated. The balance sheet data as of December 30, 2017 and December 31, 2016 and the statement of operations and cash flow data for Fiscal 2017, Fiscal 2016 and Fiscal 2015 have been derived from the audited consolidated financial statements of Gates Industrial Corporation plc included elsewhere in this annual report. The balance sheet data as of January 2, 2016 and the statement of operations and cash flow data for Post-Acquisition Predecessor 2014 and Pre-Acquisition Predecessor 2014 have been derived from the audited consolidated financial statements of Omaha Topco that are not included in this annual report. The balance sheet data as of January 3, 2015 has been derived from the unaudited consolidated balance sheet of Omaha Topco that is not included in this annual report. The balance sheet data as of December 31, 2013 and the statement of operations data for the fiscal year ended December 31, 2013 (“Fiscal 2013”) have been derived from the audited consolidated financial statements of Pinafore Holdings B.V. which are not included in this annual report.
The unaudited consolidated balance sheet as of January 3, 2015 has been prepared on the same basis as the audited consolidated financial statements.
You should read the following selected consolidated financial data together with our consolidated financial statements and the related notes included elsewhere in this annual report and the “Management’s Discussion and Analysis of Financial Condition and Results of Operations” sections of this annual report. See also “About this Annual Report—Financial Statement Presentation.”
36
Table of Contents
| (dollars in millions) | Fiscal 2017 |
Fiscal 2016 |
Fiscal 2015 |
Post- Acquisition Predecessor 2014 |
Pre- Acquisition Predecessor 2014 |
Fiscal 2013 | ||||||||||||||||||||||||
| Statement of operations data: |
||||||||||||||||||||||||||||||
| Net sales |
$ | 3,041.7 | $ | 2,747.0 | $ | 2,745.1 | $ | 1,445.1 | $ | 1,597.1 | $ | 2,947.3 | ||||||||||||||||||
| Net income (loss) from continuing operations |
182.0 | 71.9 | 50.9 | (86.9 | ) | 14.3 | 120.7 | |||||||||||||||||||||||
| Gain (loss) on disposal of discontinued operations, net of tax |
0.7 | 12.4 | — | (2.3 | ) | (0.1 | ) | 1.0 | ||||||||||||||||||||||
| Loss from discontinued operations, net of tax benefit |
— | — | — | — | (47.9 | ) | (6.8 | ) | ||||||||||||||||||||||
|
|
|
|
|
|
|
|
|
|
|
|
|
|||||||||||||||||||
| Net income (loss) |
182.7 | 84.3 | 50.9 | (89.2 | ) | (33.7 | ) | 114.9 | ||||||||||||||||||||||
| Non-controlling interests |
(31.4 | ) | (26.6 | ) | (26.0 | ) | (7.7 | ) | (11.5 | ) | (28.4 | ) | ||||||||||||||||||
|
|
|
|
|
|
|
|
|
|
|
|
|
|||||||||||||||||||
| Net income (loss) attributable to shareholders |
$ | 151.3 | $ | 57.7 | $ | 24.9 | $ | (96.9 | ) | $ | (45.2 | ) | $ | 86.5 | ||||||||||||||||
|
|
|
|
|
|
|
|
|
|
|
|
|
|||||||||||||||||||
| Basic earnings per share data |
||||||||||||||||||||||||||||||
| Earnings (loss) per share from continuing operations |
$ | 0.62 | $ | 0.18 | $ | 0.10 | $ | (0.39 | ) | |||||||||||||||||||||
| Earnings (loss) per share from discontinued operations |
— | 0.05 | — | (0.01 | ) | |||||||||||||||||||||||||
|
|
|
|
|
|
|
|
|
|||||||||||||||||||||||
| Net income (loss) per share |
$ | 0.62 | $ | 0.23 | $ | 0.10 | $ | (0.40 | ) | |||||||||||||||||||||
|
|
|
|
|
|
|
|
|
|||||||||||||||||||||||
| Diluted earnings per share data |
||||||||||||||||||||||||||||||
| Earnings (loss) per share from continuing operations |
$ | 0.60 | $ | 0.18 | $ | 0.10 | $ | (0.39 | ) | |||||||||||||||||||||
| Earnings (loss) per share from discontinued operations |
— | 0.05 | — | (0.01 | ) | |||||||||||||||||||||||||
|
|
|
|
|
|
|
|
|
|||||||||||||||||||||||
| Net income (loss) per share |
$ | 0.60 | $ | 0.23 | $ | 0.10 | $ | (0.40 | ) | |||||||||||||||||||||
|
|
|
|
|
|
|
|
|
|||||||||||||||||||||||
| (dollars in millions) | As of December 30, 2017 |
As of December 31, 2016 |
As of January 2, 2016 |
As of January 3, 2015 |
As of December 31, 2013 | ||||||||||||||||||||
| Balance sheet data: |
|||||||||||||||||||||||||
| Total assets |
$ | 6,853.7 | $ | 6,383.3 | $ | 6,565.6 | $ | 7,143.5 | $ | 5,164.2 | |||||||||||||||
| Debt, long term and current portion |
$ | 3,955.7 | $ | 3,836.9 | $ | 3,907.3 | $ | 4,002.3 | $ | 1,718.4 | |||||||||||||||
As discussed further in the consolidated financial statements included elsewhere in this annual report, our net income for the fourth quarter of 2017 includes a provisional benefit of $118.2 million related to the new comprehensive tax legislation enacted in the U.S. in December 2017.
37
Table of Contents
Item 7. Management’s Discussion And Analysis Of Financial Condition And Results Of Operations
The following discussion should be read in conjunction with “Item 6. Selected Financial Data” and our consolidated financial statements and related notes thereto included elsewhere in this annual report. In addition to historical information, this discussion contains forward-looking statements that involve risks, uncertainties and assumptions that could cause actual results to differ materially from management’s expectations. Factors that could cause such differences are discussed in “Forward-Looking Statements” and “Risk Factors.”
Our Company
We are a global manufacturer of innovative, highly engineered power transmission and fluid power solutions. We offer a broad portfolio of products to diverse replacement channel customers, and to original equipment (“first-fit”) manufacturers as specified components, with the majority of our revenue coming from replacement channels. Our products are used in applications across numerous end markets, which include construction, agriculture, energy, automotive, transportation, general industrial, consumer products and many others. Our revenue has historically been highly correlated with industrial activity and utilization, and not with any single end market given the diversification of our business and high exposure to replacement markets. Key indicators of our performance include industrial production, industrial sales and manufacturer shipments. We sell our products globally under the Gates brand, which is recognized by distributors, equipment manufacturers, installers and end users as a premium brand for quality and technological innovation; this reputation has been built for over a century since Gates’ founding in 1911.
Within the diverse end markets we serve, our highly engineered products are critical components in applications for which the cost of downtime is high relative to the cost of our products, resulting in the willingness of end users to pay a premium for superior performance and availability. These applications subject our products to normal wear and tear, resulting in a natural replacement cycle that drives high-margin, recurring revenue. Our product portfolio represents one of the broadest ranges of power transmission and fluid power products in the markets we serve, and we maintain long-standing relationships with a diversified group of blue-chip customers throughout the world. As a leading designer, manufacturer and marketer of highly engineered, mission-critical products, we have become an industry leader across most of the regions and end markets in which we operate.
Business Trends
Our revenue has historically been highly correlated with industrial activity and utilization, and not with any single end market given the diversification of our business and high exposure to replacement markets. Our products are used in applications across numerous end markets across both our replacement and first-fit channels, including construction, agriculture, energy, automotive, transportation, general industrial, consumer products and many others. This diversification limits our exposure to trends in any given end market. In addition, a majority of our sales are generated from customers in replacement channels, who primarily serve a large base of installed equipment that follows a natural maintenance cycle that is somewhat less susceptible to various trends that affect our end markets. Such trends include infrastructure investment and construction activity, agricultural production and related commodity prices, commercial and passenger vehicle production, miles driven and fleet age, evolving regulatory requirements related to emissions and fuel economy and oil and gas prices and production. Key indicators of our performance include industrial production, industrial sales and manufacturer shipments.
During Fiscal 2017, Fiscal 2016 and Fiscal 2015, sales into replacement channels accounted for 62.9%, 64.2% and 64.3%, respectively, of our total net sales. Our replacement sales cover a very broad range of applications and industries and accordingly, are highly correlated with industrial activity and utilization and not a single end market. Sales into first-fit channels accounted for 37.1%, 35.8% and 35.7% of sales during Fiscal 2017, Fiscal 2016 and Fiscal 2015, respectively. Our first-fit applications are sold into a wide variety of end markets to industrial and automotive manufacturers. First-fit sales also tend to be a higher percent of sales in emerging markets, where the installed base of equipment may be lower and the replacement channel distribution network may not be as well developed. In these situations, we believe that sales to first-fit customers will generally help in our eventual development of replacement market channels.
38
Table of Contents
Fiscal 2017 Results Compared with Fiscal 2016 Results
Summary Gates Performance
| (dollars in millions) | Fiscal 2017 | Fiscal 2016 | ||||||
| Net sales |
$ | 3,041.7 | $ | 2,747.0 | ||||
| Cost of sales |
1,823.7 | 1,686.2 | ||||||
|
|
|
|
|
|||||
| Gross profit |
1,218.0 | 1,060.8 | ||||||
| Selling, general and administrative expenses |
779.6 | 744.1 | ||||||
| Transaction-related costs |
18.1 | 0.4 | ||||||
| Impairments |
2.8 | 3.2 | ||||||
| Restructuring expenses |
17.4 | 11.4 | ||||||
| Other operating (income) expense |
(0.3 | ) | 2.8 | |||||
|
|
|
|
|
|||||
| Operating income |
400.4 | 298.9 | ||||||
| Interest expense |
234.6 | 216.3 | ||||||
| Other expense (income) |
56.3 | (10.4 | ) | |||||
|
|
|
|
|
|||||
| Income before taxes |
109.5 | 93.0 | ||||||
| Income tax (benefit) expense |
(72.5 | ) | 21.1 | |||||
|
|
|
|
|
|||||
| Net income from continuing operations |
$ | 182.0 | $ | 71.9 | ||||
|
|
|
|
|
|||||
| Adjusted EBITDA(1) |
$ | 669.1 | $ | 594.9 | ||||
| Adjusted EBITDA margin (%) |
22.0 | % | 21.7 | % | ||||
| (1) | See “—Non-GAAP Measures” for a reconciliation of Adjusted EBITDA to net income, the closest comparable GAAP measure, for each of the periods presented. |
Net sales
Net sales during Fiscal 2017 were $3,041.7 million, up by 10.7%, or $294.7 million, compared with net sales during the prior year of $2,747.0 million. Our net sales in Fiscal 2017 were positively impacted by movements in average currency exchange rates of $13.4 million compared with the prior year, due principally to the strengthening of the Euro against the U.S. dollar. In addition, the acquisitions of Techflow Flexibles and Atlas Hydraulics during Fiscal 2017 together contributed a further $33.4 million to the increase in net sales compared with Fiscal 2016. Techflow Flexibles is based in the United Kingdom and specializes in high-pressure flexible hoses and Atlas Hydraulics is a North American fully-integrated product engineering, manufacturing, and commercial business headquartered in Ontario, Canada.
Core sales growth, which both excludes the impact of exchange rate movements and the first year of sales from acquired businesses, was 9.0% or $246.7 million. Core growth was driven primarily by higher sales volumes of $232.9 million.
Sales in our Power Transmission and Fluid Power businesses grew on a core basis by 7.3% and 12.5%, respectively, but by $136.4 million and $110.3 million, respectively, in dollar terms. Core growth in the Power Transmission business was driven primarily by the continued recovery in industrial end markets, particularly in Asia, which grew by 20.4%. Core growth in our Fluid Power business was driven by strong volume growth in the infrastructure and agriculture end markets, which grew by 17.5% or $62.5 million on a core basis during Fiscal 2017 compared with the prior year. The majority of this growth came from recovering industrial demand in North America and from China.
Cost of sales
Cost of sales for Fiscal 2017 was $1,823.7 million, an increase of 8.2%, or $137.5 million, compared with $1,686.2 million in the prior year. The increase was driven primarily by higher volumes which accounted for $138.7 million of the year-over-year increase.
39
Table of Contents
Gross profit
Gross profit for Fiscal 2017 was $1,218.0 million, up 14.8% from $1,060.8 million during the prior year. Expressed as a percentage of sales, our gross profit margin increased to 40.0% during Fiscal 2017 from 38.6% during the prior year. This 140 basis point improvement over the prior year was driven primarily by the benefit of increased volumes on our partially fixed cost base. During Fiscal 2017, productivity improvements from the implementation of our Gates Operating System initiatives largely offset the impact of wage and raw material inflation compared with the prior year.
Selling, general and administrative expenses
Selling, general and administrative (“SG&A”) expenses for Fiscal 2017 were $779.6 million compared with $744.1 million during the prior year. This increase of $35.5 million was driven primarily by higher selling and distribution expenses of $28.5 million, which increased broadly in line with the higher net sales during Fiscal 2017 and higher labor and benefits costs of $10.9 million as we continue to invest in our commercial function. These higher costs were partially offset by lower intangible asset amortization of $17.7 million compared with the prior year.
Transaction-related costs
Transaction-related costs for Fiscal 2017 were $18.1 million compared with $0.4 million during the prior year. Expenses in Fiscal 2017 included $4.8 million of costs related to the IPO and a further $6.6 million related to payments made on resolution of certain contingencies that affected the purchase price paid by Blackstone on acquiring Gates in July 2014. The debt refinancings completed in April 2017 and November 2017 cost a further $2.0 million in professional fees. The remainder of the costs incurred during Fiscal 2017 related primarily to acquisition activities, primarily the acquisitions of Techflow Flexibles and Atlas Hydraulics.
Restructuring expenses
Restructuring costs of $17.4 million were recognized during Fiscal 2017, including $13.6 million in relation to severance costs, primarily in Europe and the U.S. associated with organizational rationalizations.
Restructuring costs of $11.4 million were recognized during Fiscal 2016, including $7.3 million in relation to severance costs, largely in North America and Europe.
Operating Income from Continuing Operations
Operating income from continuing operations in Fiscal 2017 was $400.4 million, compared with $298.9 million in Fiscal 2016. The increase was driven primarily by increased sales and higher gross profit in Fiscal 2017 compared with Fiscal 2016.
40
Table of Contents
Interest expense
Interest expense for Fiscal 2017 was $234.6 million compared with $216.3 million for the prior year. Our interest expense may be analyzed as follows:
| Year ended | ||||||||
| (dollars in millions) | December 30, 2017 | December 31, 2016 | ||||||
| Debt: |
||||||||
| Dollar Term Loan |
$ | 117.8 | $ | 121.1 | ||||
| Euro Term Loan |
23.4 | 10.5 | ||||||
| Dollar notes |
72.5 | 64.9 | ||||||
| Euro notes |
16.7 | 15.4 | ||||||
| Other loans |
1.4 | 1.7 | ||||||
|
|
|
|
|
|||||
| 231.8 | 213.6 | |||||||
| Other interest expense |
2.8 | 2.7 | ||||||
|
|
|
|
|
|||||
| $ | 234.6 | $ | 216.3 | |||||
|
|
|
|
|
|||||
Details of the bank and other loans are presented in note 15 to the audited consolidated financial statements included elsewhere in this annual report. Interest expense includes the amortization of issue costs incurred in relation to the debt and the amortization of the deferred premium on our interest rate caps. Interest expense during Fiscal 2017 increased over the prior year due to the debt refinancing completed in April 2017 which caused a $14.2 million acceleration of deferred financing costs on the Dollar Term Loan due to the $650 million partial repayment of that tranche. This impact was offset partially by a lower interest charge incurred due to the partial Dollar Term Loan repayment on April 7, 2017. The interest on the Euro Term Loan increased from $10.5 million in the prior year to $23.4 million in Fiscal 2017 as a result of the additional debt of €466.2 million drawn on April 7, 2017, offset partially by a reduction in the rate of interest on this facility. The interest associated with the dollar notes increased due to the additional $150 million of debt incurred on March 30, 2017 as part of the refinancing.
Other expense (income)
Other expense for Fiscal 2017 was $56.3 million, which increased from $10.4 million of other income in the prior year driven primarily by the impacts of movements in currency exchange rates on unhedged net debt and derivative instruments. Included in unhedged debt as of December 30, 2017 is €388.1 million of the additional €466.2 million Euro Term Loan debt borrowing drawn in April 2017, which did not qualify for net investment hedging. Our other (expense) income may be analyzed as follows:
| Year ended | ||||||||
| (dollars in millions) | December 30, 2017 | December 31, 2016 | ||||||
| Interest on bank deposits |
$ | (4.6 | ) | $ | (3.0 | ) | ||
| Foreign currency loss (gain) on net debt and debt hedging instruments |
57.4 | (7.2 | ) | |||||
| Other |
3.5 | (0.2 | ) | |||||
|
|
|
|
|
|||||
| $ | 56.3 | $ | (10.4 | ) | ||||
|
|
|
|
|
|||||
Income tax (benefit) expense
For Fiscal 2017, we had income tax benefit of $72.5 million on pre-tax income of $109.5 million, resulting in an effective tax rate of (66.2%) compared with an income tax expense of $21.1 million on pre-tax income of $93.0 million, which resulted in an effective income tax rate of 22.7% for the prior year. The change in the effective tax rate for fiscal year 2017 is primarily the result of the provisional $118.2 million tax benefit related to the impacts of the Tax Cuts and Jobs Act enacted on December 22, 2017. In addition our rate was further reduced by manufacturing incentives, company owned life insurance, and non-U.S. statutory tax rate adjustments of $24.0 million. These reductions were offset partially by our geographical mix of earnings, U.S. tax on foreign earnings and changes in withholding taxes in non-U.S. jurisdictions where earnings are not considered indefinitely reinvested of $22.0 million.
41
Table of Contents
Adjusted EBITDA
Adjusted EBITDA for Fiscal 2017 was $669.1 million, an increase of 12.5% or $74.2 million, compared with the prior year Adjusted EBITDA of $594.9 million. The Adjusted EBITDA margin was 22.0%, a 30 basis point increase from the prior year margin of 21.7%. Excluding the businesses we acquired during Fiscal 2017, this margin expansion would have been 50 basis points. The increase in Adjusted EBITDA was driven primarily by higher sales volumes of $86.8 million and productivity improvements in costs of sales of $25.7 million, partially offset by wage and raw material inflation of $24.7 million, and SG&A spend of $28.6 million.
For a reconciliation of net income to Adjusted EBITDA for each of the periods presented and the calculation of the Adjusted EBITDA margin, see “—Non-GAAP Measures.”
Analysis by Operating Segment
Power Transmission (66.1% of Gates’ net sales for Fiscal 2017)
| (dollars in millions) | Year ended December 30, 2017 |
Year ended December 31, 2016 |
Period over Period Change |
|||||||||
| Net sales |
$ | 2,009.4 | $ | 1,862.1 | 7.9 | % | ||||||
|
|
|
|
|
|
|
|||||||
| Adjusted EBITDA |
$ | 458.1 | $ | 408.5 | 12.1 | % | ||||||
| Adjusted EBITDA margin (%) |
22.8 | % | 21.9 | % | ||||||||
Power Transmission
Net sales in Power Transmission for Fiscal 2017 were $2,009.4 million, an increase of 7.9%, or $147.3 million, when compared with the prior year net sales of $1,862.1 million. Excluding the positive impact of movements in average currency exchange rates of $10.9 million, core sales increased by 7.3%, or $136.4 million, compared with the prior year. The increase was due primarily to higher sales volumes, which drove $128.3 million of the growth.
Just over half of the volume gains arose from sales to the industrial end markets, with sales to the general industrial end market being the largest driver. Growth in sales to this end market, which comprised 21.0% of Power Transmission sales in Fiscal 2017, was 12.7% or $47.5 million, benefitting from the sustained industrial recovery, particularly in Asia. The remainder of the sales volume growth arose in the automotive end market, which grew by 5.8% compared with the prior year, driven primarily by the continued strong demand in China.
42
Table of Contents
Our Power Transmission Adjusted EBITDA for Fiscal 2017 was $458.1 million, an increase of 12.1% or $49.6 million, compared with the prior year Adjusted EBITDA of $408.5 million. The increase in Adjusted EBITDA was driven primarily by higher sales volumes of $41.9 million and productivity improvements of $18.7 million; offset partially by wage and raw material inflation of $18.5 million. Adjusted EBITDA margin for Fiscal 2017 was 22.8%, a 90 basis point improvement from the prior year margin of 21.9% due to the factors discussed above.
Fluid Power (33.9% of Gates’ net sales for Fiscal 2017)
| (dollars in millions) | Year ended December 30, 2017 |
Year ended December 31, 2016 |
Period over Period Change |
|||||||||
| Net sales |
$ | 1,032.3 | $ | 884.9 | 16.7 | % | ||||||
|
|
|
|
|
|
|
|||||||
| Adjusted EBITDA |
$ | 211.0 | $ | 186.4 | 13.2 | % | ||||||
| Adjusted EBITDA margin (%) |
20.4 | % | 21.1 | % | ||||||||
Net sales in Fluid Power for Fiscal 2017 were $1,032.3 million, an increase of 16.7%, or $147.4 million, compared with net sales during the prior year period of $884.9 million. Excluding the positive impact of movements in average currency exchange rates of $2.5 million and the benefit from recent acquisitions, core sales increased by 12.5%, or $110.3 million, compared with the prior year. This increase was due primarily to higher volumes.
Volumes grew across all of our end markets during Fiscal 2017 compared with the prior year, with almost all of this increase arising from sales to the industrial end markets, which comprise the majority of our Fluid Power net sales, and in particular, the infrastructure and agriculture end markets, which comprised approximately 40% of Fluid Power’s net sales for Fiscal 2017. Sales improved across all regions, but particularly in North America and China, which grew by $63.3 million and $21.9 million, respectively.
43
Table of Contents
Adjusted EBITDA for Fiscal 2017 was $211.0 million, an increase of 13.2%, or $24.6 million, compared with the prior year Adjusted EBITDA of $186.4 million. The increase in Adjusted EBITDA was driven by higher sales volumes of $44.9 million, productivity improvements of $7.0 million; offset partially by wage and raw material inflation of $12.3 million and higher labor-related SG&A spend of 12.6 million, related primarily to investment in our commercial and research and development functions. The increase in SG&A spend was driven by a combination of higher selling and distribution costs related to the higher sales volumes and wage inflation. Adjusted EBITDA margin was 20.4%, a 70 basis point decrease from the prior year margin of 21.1% due to the factors discussed above.
Fiscal 2016 Results Compared with Fiscal 2015 Results
Gates Summary
| (dollars in millions) | Fiscal 2016 | Fiscal 2015 | ||||||
| Net sales |
$ | 2,747.0 | $ | 2,745.1 | ||||
| Cost of sales |
1,686.2 | 1,709.0 | ||||||
|
|
|
|
|
|||||
| Gross profit |
1,060.8 | 1,036.1 | ||||||
| Selling, general and administrative expenses |
744.1 | 784.5 | ||||||
| Transaction-related costs |
0.4 | 0.7 | ||||||
| Impairments of intangibles and other assets |
3.2 | 51.1 | ||||||
| Restructuring expenses |
11.4 | 15.6 | ||||||
| Other operating expense (income) |
2.8 | (0.4 | ) | |||||
|
|
|
|
|
|||||
| Operating income from continuing operations |
298.9 | 184.6 | ||||||
| Interest expense |
216.3 | 212.6 | ||||||
| Other income |
(10.4 | ) | (69.7 | ) | ||||
|
|
|
|
|
|||||
| Income from continuing operations before tax |
93.0 | 41.7 | ||||||
| Income tax expense (benefit) |
21.1 | (9.2 | ) | |||||
|
|
|
|
|
|||||
| Net income from continuing operations |
$ | 71.9 | $ | 50.9 | ||||
|
|
|
|
|
|||||
| Adjusted EBITDA(1) |
$ | 594.9 | $ | 547.2 | ||||
| Adjusted EBITDA margin (%) |
21.7 | % | 19.9 | % | ||||
| (1) | See “—Non-GAAP Measures” for a reconciliation of Adjusted EBITDA to net income, the closest comparable GAAP measure, for each of the periods presented. |
44
Table of Contents
Net sales
Net sales in Fiscal 2016 were $2,747.0 million, an increase of $1.9 million compared with net sales during Fiscal 2015 of $2,745.1 million. Our net sales for Fiscal 2016 were adversely impacted by movements in average currency translation rates, particularly the Mexican Peso, Chinese Renminbi and Argentine Peso for an aggregate of $67.7 million. Excluding this impact, net sales increased by $69.6 million, or 2.5%, in Fiscal 2016 compared with Fiscal 2015. This increase was driven by higher sales prices of $28.3 million and higher volumes of $26.2 million.
The volume increase arose mostly in our Power Transmission business, which grew by $72.4 million, or 5.4%, compared with Fiscal 2015. This growth was predominantly in sales to the automotive end market, and China in particular performed well with a 12.2% growth in sales to the replacement channels. This was partially offset by lower volumes to Power Transmission’s industrial end markets. Volumes contracted in Fluid Power during Fiscal 2016 compared with Fiscal 2015, with sales down by $46.2 million. The automotive end market in Fluid Power also proved resilient, with volume growth of 5.7%, including strong demand from emerging markets such as Russia. This was more than offset by the weaker sales to the industrial end markets, where volumes were down by $54.6 million in Fiscal 2016 compared with Fiscal 2015. Pricing gains were split relatively equally between Power Transmission and Fluid Power and were focused primarily in North America, with approximately $13 million carried over from actions in Fiscal 2015 and $5 million from new actions in Fiscal 2016.
Cost of Sales
Cost of sales in Fiscal 2016 were $1,686.2 million, a decrease of 1.3% or $22.8 million, compared with $1,709.0 million in Fiscal 2015. The decrease was driven by productivity improvements, primarily procurement initiatives of $29.1 million, and favorable impacts from average foreign currency exchange rates of $23.3 million. Partially offsetting the overall decrease in cost of sales were the negative impacts of inventory adjustments of $17.7 million related to changes we made in our accounting convention for expensing maintenance, repair and operations assets below a nominal value threshold. This change was made to bring consistency to our global inventory management. Also increasing cost of sales were volume increases of approximately $16 million.
Gross Profit
Gross profit for Fiscal 2016 was $1,060.8 million, up $2.4% or $24.7 million, compared with $1,036.1 million in Fiscal 2015. Expressed as a percentage of sales, our gross profit margin increased to 38.6% during Fiscal 2016 from 37.7% during the prior year. This 90 basis point improvement over the prior year was due principally to the benefit of increased volumes on our partially fixed cost base and our productivity improvements, offset partially by the inventory adjustments noted above.
Selling, General and Administrative Expenses
Total SG&A expenses in Fiscal 2016 were $744.1 million, a decrease of 5.1% or $40.4 million, compared with $784.5 million in Fiscal 2015. SG&A expenses are comprised primarily of selling and distribution costs, administrative expenses, the amortization of acquired intangible assets and R&D costs.
Selling and distribution costs were $295.0 million in Fiscal 2016, compared with $305.6 million in Fiscal 2015, a decrease of $10.6 million. As a percentage of sales, our Fiscal 2016 costs were flat at 11% compared with the prior year, as labor-related cost inflation was broadly offset by headcount reductions.
The remainder of the SG&A expenses in Fiscal 2016 were $449.1 million, compared with $478.9 million in Fiscal 2015, a decrease of $29.8 million. The decrease in these costs in Fiscal 2016 was due principally to labor spending reductions to right-size the business of $12.3 million. The amortization of acquired intangible assets reduced from $158.5 million in Fiscal 2015 to $141.9 million in Fiscal 2016 (a decrease of $16.6 million), due primarily to the majority of our technology intangible assets recognized at the time of the acquisition of Gates by Blackstone becoming fully amortized halfway through Fiscal 2016.
45
Table of Contents
Impairment of Goodwill and Other Assets
For Fiscal 2016, we recognized impairments of $3.2 million, relating primarily to discontinuing the use of software in North America and the impairment of a receivable related to a restructured line of business in the U.S.
For Fiscal 2015, we recognized impairments of $51.1 million, including $44.0 million in relation to the U.S. dollar denominated indefinite-lived brands and trade names intangible that was recognized as part of the purchase accounting at the time of the Acquisition. The impairment arose due to the strengthening of the U.S. dollar against the currencies in which the sales supporting the value of this asset were denominated. A further impairment of $6.7 million was recognized in relation to property, plant and equipment in Brazil, as a result of the challenging trading conditions in that region, which were exacerbated by the significant devaluation of the Brazilian Real against the U.S. dollar.
Restructuring Expenses
During Fiscal 2016, we recognized restructuring expenses of $11.4 million, compared with $15.6 million in Fiscal 2015. In both periods, these costs related primarily to severance expenses incurred across both segments as part of the right-sizing of our operations and the streamlining of our corporate functions.
Other Operating Expense
During Fiscal 2016, we recognized other operating expense of $2.8 million, compared with other operating income of $0.4 million in Fiscal 2015. The costs incurred in both periods related primarily to businesses disposed of in prior years. In Fiscal 2016, this expense was offset by a benefit in tax expense, due to the release of a tax contingency that was held in respect of a disposed business.
Operating Income from Continuing Operations
Operating income from continuing operations in Fiscal 2016 was $298.9 million, compared with $184.6 million in Fiscal 2015. The increase was driven primarily by increased gross margin, decreased SG&A spend and the higher impairment expense recognized in Fiscal 2015 compared with Fiscal 2016.
Interest Expense
The interest expense for Fiscal 2016 was $216.3 million, compared with $212.6 million for Fiscal 2015. Our interest expense may be analyzed as follows:
| (dollars in millions) | Fiscal 2016 | Fiscal 2015 | ||||||
| Debt: |
||||||||
| —Interest on bank and other loans: |
||||||||
| Dollar Term Loan |
$ | 121.1 | $ | 116.4 | ||||
| Euro Term Loan |
10.5 | 10.6 | ||||||
| Dollar notes |
64.9 | 64.9 | ||||||
| Euro notes |
15.4 | 15.7 | ||||||
| Other bank loans |
1.7 | 1.7 | ||||||
| 2015 Notes |
— | 0.4 | ||||||
|
|
|
|
|
|||||
| 213.6 | 209.7 | |||||||
| Other interest expense |
2.7 | 2.9 | ||||||
|
|
|
|
|
|||||
| $ | 216.3 | $ | 212.6 | |||||
|
|
|
|
|
|||||
Details of our debt are presented in note 15 of our audited consolidated financial statements included elsewhere in this annual report. Interest expense includes the amortization of issue costs incurred in relation to the borrowings.
46
Table of Contents
The increase in interest expense during Fiscal 2016 compared with Fiscal 2015 was due largely to an increase of $4.7 million in the amount of the deferred premium on our interest rate caps that is being amortized to interest expense. Partially offsetting the interest expense increase was the impact of the settlement of legacy 2015 notes during September 2015.
Other Income
Other income for Fiscal 2016 was $10.4 million, compared with $69.7 million for Fiscal 2015. Our other income may be analyzed as follows:
| (dollars in millions) | Fiscal 2016 | Fiscal 2015 | ||||||
| Interest earned on bank deposits |
$ | (3.0 | ) | $ | (1.8 | ) | ||
| Currency transaction gain on net debt and hedging instruments |
(7.2 | ) | (67.7 | ) | ||||
| Other |
(0.2 | ) | (0.2 | ) | ||||
|
|
|
|
|
|||||
| $ | (10.4 | ) | $ | (69.7 | ) | |||
|
|
|
|
|
|||||
Other income in Fiscal 2015 included significant currency transaction gains related to Gates’ euro debt, prior to its designation as a net investment hedge during the first quarter of 2015.
Income Tax Expense (Benefit)
During Fiscal 2016, the income tax expense attributable to continuing operations was $21.1 million on a profit before tax of $93.0 million compared to an income tax benefit attributable to continuing operations of $9.2 million on a profit before tax of $41.7 million in Fiscal 2015.
Our effective tax rate for Fiscal 2016 was lower than our statutory rate of 35% as a result of our geographical mix of earnings, manufacturing incentives, and company owned life insurance adjustments of $43.4 million. These reductions in the rate were partially offset by U.S. tax on foreign earnings, tax law changes, and valuation allowances of $32.9 million.
Our effective tax rate for Fiscal 2015 was lower than our statutory rate of 35% primarily as a result of our geographical mix of earnings, which included a $26.0 million benefit from non-operating gains of $74.2 million not subject to taxation. In addition, our rate was reduced by manufacturing incentives, company owned life insurance, tax law changes, and the release of uncertain tax positions of $32.2 million. These reductions in the rate were partially offset by U.S. tax on foreign earnings and valuation allowances of $35.4 million.
Adjusted EBITDA
Adjusted EBITDA for Fiscal 2016 was $594.9 million, an increase of 8.7%, or $47.7 million, compared with $547.2 million for Fiscal 2015. The underlying increase was due largely to productivity improvements (in particular procurement sourcing initiatives of $29.1 million), higher pricing of $28.3 million, lower SG&A spend of $12.3 million and the impact of higher volumes of $10.8 million. Partially offsetting these improvements was the unfavorable impact of movements in average foreign currency exchange rates of $14.2 million, labor inflation of $14.0 million and unfavorable product mix of $3.6 million. Adjusted EBITDA margin was 21.7% for Fiscal 2016, a 180 basis point improvement compared with the margin of 19.9% for Fiscal 2015 due to increased productivity and higher prices in Fiscal 2016.
For a reconciliation of net income (loss) to Adjusted EBITDA for each of the periods presented and the calculation of the Adjusted EBITDA margin, see “—Non-GAAP Measures.”
47
Table of Contents
Analysis by Operating Segment
Power Transmission (67.8% of Gates’ Fiscal 2016 net sales)
| (dollars in millions) | Fiscal 2016 | Fiscal 2015 | Period over Period Change |
|||||||||
| Net sales |
$ | 1,862.1 | $ | 1,809.6 | 2.9 | % | ||||||
|
|
|
|
|
|
|
|||||||
| Adjusted EBITDA |
$ | 408.5 | $ | 378.3 | 8.0 | % | ||||||
| Adjusted EBITDA margin (%) |
21.9 | % | 20.9 | % | ||||||||
Net sales in Power Transmission in Fiscal 2016 were $1,862.1 million, an increase of 2.9%, or $52.5 million, compared with net sales during Fiscal 2015 of $1,809.6 million. Excluding the adverse impact of movements in average currency exchange rates of $43.6 million, net sales increased by 5.3%, or $96.1 million, compared with Fiscal 2015. This was driven by higher sales volumes of $72.4 million and the impact of pricing actions of $13.8 million.
The volume increase was driven primarily by our automotive end market, the majority of which was from the replacement channels. China in particular performed well as our businesses benefitted from government stimulus programs as well as market share gains. This was partially offset by lower volumes to Power Transmission’s industrial end markets. General industrials drove the majority of this decline, with most other industrial end markets remaining flat or just slightly down from the prior year period. In addition to the net increase in volumes, sales benefitted from favorable pricing actions of $13.8 million, primarily from the replacement channels and particularly in North America.
48
Table of Contents
Adjusted EBITDA was $408.5 million for Fiscal 2016, an increase of 8.0%, or $30.2 million, compared with $378.3 million in Fiscal 2015. The increase in Adjusted EBITDA was driven primarily by higher sales volumes of $25.8 million, favorable pricing actions of $13.8 million, productivity improvements of $9.2 million and lower SG&A spend of $8.1 million; offset partially by unfavorable movements in average foreign currency exchange rates of $9.9 million, inflation of $9.2 million and unfavorable product mix of $7.0 million. Adjusted EBITDA margin increased to 21.9% in Fiscal 2016, a 100 basis point improvement compared with 20.9% in Fiscal 2015 due to higher prices and productivity in Fiscal 2016.
Fluid Power (32.2% Gates’ Fiscal 2016 net sales)
| (dollars in millions) | Fiscal 2016 | Fiscal 2015 | Period over Period Change |
|||||||||
| Net sales |
$ | 884.9 | $ | 935.5 | (5.4 | %) | ||||||
|
|
|
|
|
|
|
|||||||
| Adjusted EBITDA |
$ | 186.4 | $ | 168.9 | 10.4 | % | ||||||
| Adjusted EBITDA margin (%) |
21.1 | % | 18.1 | % | ||||||||
Net sales in Fluid Power in Fiscal 2016 were $884.9 million, a decrease of $50.6 million, or 5.4%, compared with net sales in Fiscal 2015 of $935.5 million. Excluding the adverse impact of movements in average currency exchange rates of $24.1 million, net sales decreased by 2.8%, or $26.5 million. Volumes drove this decrease, declining by almost 5% in Fiscal 2016 compared with Fiscal 2015, offset partially by favorable price impacts of $14.5 million.
Sales volumes to the energy and transportation end markets, which together accounted for 24.1% of Fluid Power’s Fiscal 2016 sales, declined by 14.4% and 7.4%, respectively. Oil and gas was the largest contributor to this decline, driven by falling energy prices that affected our Middle East and Singapore operations in particular. The lower transportation sales were concentrated in the U.S. Partially offsetting the industrial volume declines were increased sales to the automotive end market, which had growth of 5.7% in Fiscal 2016. This was driven by solid demand from emerging European markets, benefiting volumes by approximately $14 million, and Western European sales of kits and waterpumps, which grew by approximately $19 million. Softening the overall decline in volumes were favorable pricing actions of $14.5 million in Fiscal 2016 compared with Fiscal 2015, most of which came from the replacement channels.
49
Table of Contents
Adjusted EBITDA was $186.4 million, an increase of 10.4% or $17.5 million, compared with $168.9 million in Fiscal 2015. The increase in Adjusted EBITDA was driven primarily by productivity improvements of $19.9 million, favorable pricing actions of $14.5 million, lower SG&A spend of $4.2 million and favorable product mix of $3.4 million; offset partially by lower sales volumes of $15.0 million, inflation of $4.8 million and unfavorable movements in average foreign currency exchange rates of $4.2 million. Adjusted EBITDA margin improved to 21.1% in Fiscal 2016, a 300 basis point improvement compared with 18.1% in Fiscal 2015 driven by a 220 basis point improvement in gross margins discussed above.
Liquidity and Capital Resources
Treasury Responsibilities and Philosophy
Our primary liquidity and capital resource needs are for working capital, debt service requirements, capital expenditures, facility expansions and acquisitions. We expect to finance our future cash requirements with cash on hand, cash flows from operations and, where necessary, borrowings under our revolving credit facilities. We have historically relied on our cash flow from operations and various debt and equity financings for liquidity.
Our central treasury function is responsible for procuring our financial resources and maintaining an efficient capital structure, together with managing our liquidity, foreign exchange and interest rate exposures. All treasury operations are conducted within strict policies and guidelines that are approved by the Board. Compliance with those policies and guidelines is monitored by the regular reporting of treasury activities to the Board.
A key element of our treasury philosophy is that funding, interest rate and currency decisions and the location of cash and debt balances are centrally managed. Our borrowing requirements are met by raising funds in the most favorable markets. Management may retain a portion of net debt in the foreign currencies in which the net assets of our operations are denominated. The desired currency profile of net debt can be achieved by either sourcing debt in the foreign currency or entering into currency derivative contracts.
From time to time, we enter into currency derivative contracts to manage currency transaction exposures. Similarly from time to time we may enter into interest rate derivatives to maintain the desired mix of floating and fixed rate debt.
Management monitors closely the credit quality of the institutions with which it holds deposits. Similar considerations are given to our portfolio of derivative financial instruments. As of December 30, 2017, 57.5% of our cash and cash equivalents were held in two highly-rated global financial institutions.
Our borrowing facilities are monitored against forecast requirements and timely action is taken to put in place, renew or replace credit lines. Management’s policy is to manage liquidity risk by diversifying our funding sources and by staggering the maturity of our debt.
50
Table of Contents
As market conditions warrant, we and our majority equity holders, Blackstone and its affiliates, may from time to time, seek to repurchase debt securities that we have issued or loans that we have borrowed in privately negotiated or open market transactions, by tender offer or otherwise. Subject to any applicable limitations contained in the agreements governing our indebtedness, any such purchases may be funded by existing cash balances or the incurrence of new secured or unsecured debt, including borrowings under our credit facilities. The amounts involved in any such purchase transactions, individually or in the aggregate, may be material. Any such purchases may relate to a substantial amount of a particular tranche of debt, with a corresponding reduction in the trading liquidity of that debt. In addition, any such purchases made at prices below the “adjusted issue price” (as defined for U.S. federal income tax purposes) may result in taxable cancellation of indebtedness income to us, which amounts may be material, and result in related adverse tax consequences to us.
Subsequent to the end of the fiscal year, Gates used the net proceeds from the IPO to redeem in full the €235.0 million of outstanding Euro Senior Notes and made partial redemptions of the Dollar Senior Notes. See the section entitled “Indebtedness” below for additional details.
It is our policy to retain sufficient liquidity throughout the capital expenditure cycle to maintain our financial flexibility. We do not anticipate any material long-term deterioration in our overall liquidity position in the foreseeable future. Management believes that the current level of working capital is sufficient for Gates’ present requirements.
Cash Flow
Fiscal 2017 compared to Fiscal 2016:
Cash provided by operations was $313.5 million during Fiscal 2017 compared with $371.6 million during Fiscal 2016. Operating cash flow before movements in operating assets and liabilities was $340.6 million during Fiscal 2017 compared with $279.9 million in Fiscal 2016, an increase of $60.7 million that was due largely to the improved operational performance of Gates which flowed through to operating income. Movements in operating assets and liabilities during Fiscal 2017 gave rise to a decrease of 27.1 million in cash compared with an increase of $91.7 million in the prior year period. This decrease, or further spend of cash, was driven primarily by the build of inventory due to increased production, with a corresponding increase in trade payables being offset partially by a $24.6 million increase in trade receivable balances linked directly to our increased sales. In addition, the Fiscal 2016 cash provided by operations includes the receipt of a tax refund in the United States of $41.3 million related to returns filed in prior periods.
Net cash used in investing activities during Fiscal 2017 was $220.6 million, compared with $60.1 million in the prior year. Capital expenditure increased by $43.0 million from $68.1 million in Fiscal 2016 to $111.1 million in Fiscal 2017, driven primarily by expenditures on our two new facilities being built to expand production capacity in our Fluid Power segment. In addition, during Fiscal 2017, we paid $110.7 million, net of cash acquired, to purchase the Techflow Flexibles and Atlas Hydraulics businesses.
Net cash used in financing activities was $75.3 million during Fiscal 2017, compared with $110.8 million in the prior year. This change in cash outflows was driven primarily by an excess cash flow payment of $38.2 million to our term loan lenders made in the first quarter of 2016. In addition, dividend payments to non-controlling shareholders of our joint venture operations in the prior year were $14.3 million higher than in Fiscal 2017. Partially offsetting these year-over-year decreases in financing cash outflows was $18.8 million of financing costs incurred in Fiscal 2017 in relation to the debt refinancings completed in April 2017 and November 2017.
Fiscal 2016 compared to Fiscal 2015:
Cash provided by operations was $371.6 million in Fiscal 2016 compared with $275.9 million in Fiscal 2015. Operating cash flow before movements in operating assets and liabilities was $279.9 million compared with $246.6 million in Fiscal 2015, an increase of $33.3 million that was due largely to the improvement in operational performance. Movements in operating assets and liabilities during Fiscal 2016 gave rise to an increase of $91.7 million in cash generated from operations compared with $29.3 million in Fiscal 2015. This increase was driven primarily by the receipt of a tax refund in the United States of $41.3 million related to returns filed in prior periods. In addition, accounts receivable increased during Fiscal 2016 compared with Fiscal 2015 as sales rose, partially offset by a decrease in inventory driven primarily by more disciplined inventory management.
51
Table of Contents
Net cash outflow from investing activities in Fiscal 2016 was $60.1 million, broadly flat with the net cash outflow from investing activities of $60.5 million in Fiscal 2015. Capital expenditure was lower in Fiscal 2016 at $68.1 million, compared with $85.8 million in Fiscal 2015, however Fiscal 2015 benefited from a decrease in restricted cash of $25.6 million (primarily related to the repayment of legacy debt with escrowed cash) compared with $2.7 million during Fiscal 2016.
Net cash outflow from financing activities was $110.8 million in Fiscal 2016, compared with an outflow of $73.9 million in Fiscal 2015. This was driven by $14.8 million higher repayment of debt in Fiscal 2016, primarily related to the Excess Cash Flow payment of $38.2 million made in the first quarter of 2016. In addition, dividend payments to non-controlling shareholders in Fiscal 2016 were $10.8 million higher than in Fiscal 2015.
As a result of the decreased debt, cash interest paid decreased to $198.8 million in Fiscal 2016 from $208.0 million in Fiscal 2015.
Indebtedness
As of December 30, 2017, our long-term debt consisted principally of two term loans, two unsecured notes and two revolving credit facilities.
Our Long-term debt as of December 30, 2017 and December 31, 2016 may be analyzed as follows:
| Carrying amount | Principal amount | |||||||||||||||
| (dollars in millions) | As of December 30, 2017 |
As of December 31, 2016 |
As of December 30, 2017 |
As of December 31, 2016 |
||||||||||||
| Bank overdrafts |
$ | — | $ | 0.3 | $ | — | $ | 0.3 | ||||||||
| Bank and other loans: |
||||||||||||||||
| —Secured |
||||||||||||||||
| Term Loans (U.S. dollar and euro denominated) |
2,467.8 | 2,540.9 | 2,515.0 | 2,600.3 | ||||||||||||
| —Unsecured |
||||||||||||||||
| Senior Notes (U.S. dollar and euro denominated) |
1,487.5 | 1,295.3 | 1,472.5 | 1,285.7 | ||||||||||||
| Other borrowings |
0.4 | 0.4 | 0.4 | 0.4 | ||||||||||||
|
|
|
|
|
|
|
|
|
|||||||||
| 3,955.7 | 3,836.6 | 3,987.9 | 3,886.4 | |||||||||||||
|
|
|
|
|
|
|
|
|
|||||||||
| $ | 3,955.7 | $ | 3,836.9 | $ | 3,987.9 | $ | 3,886.7 | |||||||||
|
|
|
|
|
|
|
|
|
|||||||||
Details of our long-term debt are presented in note 15 to our audited consolidated financial statements included elsewhere in this annual report.
During March and April 2017, we completed several refinancing transactions to reprice the Euro Term Loans, extend the maturities of certain debt tranches and to change the currency and interest structure of our debt. An additional $150.0 million was raised as Dollar Senior Notes in March 2017 and, in April €466.2 million was raised under the Euro Term Loan facility. The proceeds from these debt raisings were used to repay $650.0 million of the existing Dollar Term Loans.
During November 2017, we completed a further refinancing to reduce the applicable margins on each of the term loans by 0.25%, with a further 0.25% reduction in the margins contingent on the completion of the IPO, which occurred in January 2018, at which point the additional margin reduction became effective.
The majority of the costs related to the above refinancing transactions were deferred and are being amortized to net income over the remaining term of the related debt using the effective interest method. During Fiscal 2017, $16.6 million of refinancing costs were deferred on the balance sheet. Those refinancing costs that do not qualify for deferral are recognized in net income as they are incurred. During Fiscal 2017, $2.0 million of refinancing costs were recognized in net income as transaction-related costs.
52
Table of Contents
Dollar and Euro Term Loans
Gates’ secured credit facilities include a Dollar Term Loan credit facility and a Euro Term Loan credit facility that were drawn on July 3, 2014. As part of a refinancing transaction in April 2017, the maturity dates for both of the term loan facilities were extended from July 3, 2021 to March 31, 2024, with a springing maturity of April 15, 2022 if more than $500 million of the Dollar Senior Notes remain in issue at that time.
These term loan facilities bear interest at a floating rate. As of December 30, 2017, borrowings under the Dollar Term Loan facility, which currently bears interest at LIBOR, subject to a floor of 1%, plus a margin of 3.00%, bore interest at a rate of 4.69% per annum. As of December 30, 2017, the Euro Term Loan bore interest at Euro LIBOR, subject to a floor of 0%, plus a margin of 3.25%.
Both term loans are subject to quarterly amortization payments of 0.25%, based on the original principal amount less certain prepayments with the balance payable on maturity. During Fiscal 2017, we made quarterly amortization payments against the Dollar Term Loan and the Euro Term Loan of $19.3 million and $6.3 million, respectively. During Fiscal 2016, we made quarterly amortization payments against the Dollar Term Loan and the Euro Term Loan of $24.9 million and $2.2 million, respectively.
Under the terms of the credit agreement, Gates is obliged to offer annually to the term loan lenders an ‘excess cash flow’ amount as defined under the agreement, based on the preceding year’s final results. Based on the Fiscal 2016 and Fiscal 2017 results, our leverage ratio as defined under the credit agreement was below the threshold above which payments are required, and therefore no excess cash flow payment was required to be made in respect of either period.
During Fiscal 2017, a transactional foreign exchange loss of $96.7 million was recognized in respect of the Euro Term Loan, compared with a gain of $8.7 million in Fiscal 2016. Of these losses, $60.2 million was recognized in other (expense) income in Fiscal 2017 and $0 in the prior year period, and a $36.5 million loss was recognized in other comprehensive income in Fiscal 2017 in respect of the Euro Term Loan as part of this facility has been designated as a net investment hedge of certain of Gates’ euro investments. In the prior year period, a gain of $8.7 million was recognized in other comprehensive income.
As of December 30, 2017, the principal amount outstanding under the Dollar Term Loan was $1,729.4 million and the Euro Term Loan was $785.6 million (€635.5 million).
Unsecured Senior Notes
As of December 30, 2017, Gates had outstanding $1,190.0 million Dollar Senior Notes and $282.5 million (€235.0 million) Euro Senior Notes, which are scheduled to mature on July 15, 2022 (the “Notes”). The Dollar Senior Notes bear interest at an annual fixed rate of 6% and the Euro Senior Notes carry an annual fixed interest rate of 5.75%. Interest payments commenced on January 15, 2015 and are made semi-annually.
During Fiscal 2017, a transactional foreign exchange loss of $36.8 million, compared with a $10.6 million gain in Fiscal 2016, was recognized in respect of the Euro Senior Notes and was recognized in OCI as a net investment hedge of certain of Gates’ Euro investments.
Subsequent to the end of the fiscal year, Gates redeemed in full the €235.0 million of outstanding Euro Senior Notes and made partial redemptions of the Dollar Senior Notes. All of these prepayments, totaling $907.8 million in principal, $26.9 million in redemption premiums and $3.1 million in accrued interest, were funded by the net proceeds from the IPO of approximately $800 million, with the remainder coming from excess cash on hand. Following these redemptions, there are no longer any Euro Senior Notes outstanding and there are $568.0 million of Dollar Senior Notes outstanding.
53
Table of Contents
In addition, in connection with the pre-IPO reorganization transactions, a wholly-owned U.S. subsidiary of Gates Global LLC, entered into an intercompany agreement pursuant to which it became an obligor under the Notes for U.S. federal income tax purposes and agreed to make future payments due on the Dollar Senior Notes. As a result, interest on the Dollar Senior Notes will be U.S. source income.
Revolving Credit Facility
Gates also has a secured revolving credit facility, maturing on July 3, 2019, that provides for multi-currency revolving loans up to an aggregate principal amount of $125.0 million, with a letter of credit sub-facility of $20.0 million. In January 2018, the maturity date of this facility was extended from July 3, 2019 to January 29, 2023, with a springing maturity of April 15, 2022 if more than $500 million of the Dollar Senior Notes remain in issue at that time. In addition, as part of this amendment, the facility size was increased from $125.0 million to $185.0 million.
As of both December 30, 2017 and December 31, 2016, there were $0 drawings for cash under the revolving credit facility and there were no letters of credit outstanding.
Asset-Backed Revolver
Gates has a revolving credit facility backed by certain of its assets in North America. The facility allows for loans of up to a maximum of $325.0 million ($293.7 million as of December 30, 2017, compared with $288.6 million as of December 31, 2016, based on the values of the secured assets on those dates) with a letter of credit sub-facility of $150.0 million.
In January 2018, the maturity date of this facility was extended to January 29, 2023, with a springing maturity of April 15, 2022 if more than $500 million of the Dollar Senior Notes remain in issue at that time.
As of December 30, 2017 and December 31, 2016, there were $0 drawings for cash under the asset-backed revolver. The letters of credit outstanding under the asset-backed revolver were $58.0 million and $54.3 million as of December 30, 2017 and December 31, 2016, respectively.
Non-guarantor subsidiaries
The majority of the Company’s US subsidiaries are guarantors of the Senior Secured Credit Facilities.
For Fiscal 2017, before intercompany eliminations, our non-guarantor subsidiaries represented approximately 69% of our revenues and 64% of our EBITDA as defined in the financial covenants attaching to the senior secured credit facilities (“Covenant EBITDA”). As of December 30, 2017, before intercompany eliminations, our non-guarantor subsidiaries represented approximately 95% of our total assets and approximately 94% of our total liabilities. After adjusting for intercompany loans payable and receivable by Finco Omaha Limited, a non-guarantor intermediate holding company, our non-guarantor subsidiaries represented approximately 40% of our total assets and approximately 18% of our total liabilities. The intercompany loan asset and liability held by Finco Omaha Limited largely offset each other.
Net Debt
During Fiscal 2017, our net debt increased by $81.6 million from $3,309.7 million as of December 31, 2016 to $3,391.3 million at December 30, 2017. We generated cash from operating activities of $313.5 million, offset by capital expenditures of $111.1 million and business acquisition costs of $110.7 million, which related to the purchase of Techflow Flexibles during June 2017 and Atlas Hydraulics during October 2017. During Fiscal 2017, in connection with the refinancing of our debt, we paid financing costs of $18.8 million. Dividend payments to minority shareholders in our joint ventures (primarily Nitta Corporation) were $24.6 million.
Movements in foreign currency had an unfavorable impact of $113.9 million on net debt during Fiscal 2017, the majority of the movement relating to the impact of movements in the euro against the U.S. dollar on our euro-denominated debt.
54
Table of Contents
During Fiscal 2016, our net debt decreased by $262.2 million from $3,571.9 million as of January 2, 2016 to $3,309.7 million at December 31, 2016. We generated cash from operating activities of $371.6 million, offset partially by capital expenditures of $68.1 million and dividend payments of $38.9 million to minority shareholders in our joint ventures (primarily Nitta Corporation).
Movements in foreign currency had a favorable impact of $6.7 million on net debt during Fiscal 2016, the majority of the movement relating to the impact of movements in the euro against the U.S. dollar on our euro-denominated debt.
Borrowing Headroom
As of December 30, 2017, our asset-backed revolving credit facility had a borrowing base of $293.7 million, being the maximum amount the Company can draw down based on the current value of the secured assets. The facility was undrawn for cash but there were letters of credit outstanding against the facility amounting to $58.0 million. We also have a secured revolving credit facility that provides for multi-currency revolving loans up to an aggregate principal amount of $125.0 million. We had no drawings against uncommitted borrowing facilities (bank overdrafts) but we had outstanding performance bonds, letters of credit and bank guarantees amounting to $3.4 million (in addition to those outstanding under the revolving credit facility).
Overall, therefore, our committed borrowing headroom was $357.3 million, in addition to cash balances of $564.4 million.
Cash Balances
As of December 30, 2017, our total cash and cash equivalents were $564.4 million, compared with $527.2 million as of December 31, 2016.
Restricted cash balances were $1.6 million as of both December 30, 2017 and December 31, 2016, primarily $1.4 million in both periods that was held in escrow for insurance purposes. Cash held in in our non-wholly owned Asian subsidiaries was $135.1 million and $96.5 million as of December 30, 2017 and December 31, 2016, respectively.
Off-Balance Sheet Arrangements
We have not entered into any transaction, agreement or other contractual arrangement that is considered to be an off-balance sheet arrangement that is required to be disclosed other than operating lease commitments.
Tabular Disclosure of Contractual Obligations
Our consolidated contractual obligations and commercial commitments are summarized in the following table which includes aggregate information about our contractual obligations as of December 30, 2017 and the periods in which payments are due, based on the earliest date on which we could be required to settle the liabilities.
55
Table of Contents
Floating interest payments and payments and receipts on interest rate derivatives are estimated based on market interest rates prevailing at the balance sheet date. Amounts in respect of operating leases and purchase obligations are items that we are obligated to pay in the future, but they are not required to be included on the consolidated balance sheet.
| Earliest period in which payment/(receipt) due | ||||||||||||||||||||
| (dollars in millions) | Total | Less than 1 year |
1 - 3 years | 3 - 5 years | After 5 years | |||||||||||||||
| Bank overdrafts and debt(1): |
||||||||||||||||||||
| —Principal |
$ | 3,987.9 | $ | 25.4 | $ | 50.8 | $ | 1,523.3 | $ | 2,388.4 | ||||||||||
| —Interest payments(2)(3) |
886.3 | 168.0 | 292.7 | 289.5 | 136.1 | |||||||||||||||
| Derivative financial instruments: |
||||||||||||||||||||
| —Payments(4) |
46.6 | 22.1 | 24.5 | — | — | |||||||||||||||
| —Receipts(4) |
(54.4 | ) | (23.8 | ) | (30.6 | ) | — | — | ||||||||||||
| Capital leases |
2.1 | 0.4 | 0.7 | 0.7 | 0.3 | |||||||||||||||
| Operating leases |
147.2 | 26.4 | 29.9 | 18.4 | 72.5 | |||||||||||||||
| Post-retirement benefits(5) |
12.4 | 12.4 | — | — | — | |||||||||||||||
| Indemnified tax liabilities |
3.9 | 3.9 | — | — | — | |||||||||||||||
| Purchase obligations(6) |
57.0 | 39.3 | 13.4 | 4.3 | — | |||||||||||||||
|
|
|
|
|
|
|
|
|
|
|
|||||||||||
| Total |
$ | 5,089.0 | $ | 274.1 | $ | 381.4 | $ | 1,836.2 | $ | 2,597.3 | ||||||||||
|
|
|
|
|
|
|
|
|
|
|
|||||||||||
| (1) | On January 29, 2018, as agreed as part of the refinancing in November 2017, the applicable margins on each of the term loans were lowered by 0.25% following the completion of the IPO. The result of this repricing on the annual expected interest payments set out above is not significant. |
| (2) | Future interest payments include payments on fixed and floating rate debt. |
| (3) | Floating rate interest payments are estimated based on market interest rates and terms prevailing as of December 30, 2017. |
| (4) | Receipts and payments on foreign currency derivatives, interest rate caps and currency forwards are estimated based on market rates prevailing as of December 30, 2017. |
| (5) | Post-retirement benefit obligations represent our expected cash contributions to its defined benefit pension and other post-retirement benefit plans in 2018. It is not practicable to present expected cash contributions for subsequent years because they are determined annually on an actuarial basis to provide for current and future benefits in accordance with federal law and other regulations. |
| (6) | A purchase obligation is defined as an agreement to purchase goods or services that is enforceable and legally binding on us and that specifies all significant terms, including: fixed or minimum quantities to be purchased; fixed, minimum or variable price provisions; and the approximate timing of the transaction. |
Non-GAAP Measures
EBITDA and Adjusted EBITDA
EBITDA is a non-GAAP measure that represents net income or loss for the period before the impact of income taxes, net finance costs, depreciation and amortization. EBITDA is widely used by securities analysts, investors and other interested parties to evaluate the profitability of companies. EBITDA eliminates potential differences in performance caused by variations in capital structures (affecting net finance costs), tax positions (such as the availability of net operating losses against which to relieve taxable profits), the cost and age of tangible assets (affecting relative depreciation expense) and the extent to which intangible assets are identifiable (affecting relative amortization expense).
Management uses Adjusted EBITDA as its key profitability measure. This is a non-GAAP measure that represents EBITDA before certain items that impact comparison of the performance of our businesses either period-over-period or with other businesses. We use Adjusted EBITDA as our measure of segment profitability to assess the performance of our businesses and it is used for total Gates as well because we believe it is important to consider
56
Table of Contents
our profitability on a basis that is consistent with that of our operating segments, as well as that of our peer companies with a similar leveraged, private equity ownership history. We believe that Adjusted EBITDA should, therefore, be made available to securities analysts, investors and other interested parties to assist in their assessment of the performance of our businesses.
During the periods presented, the items excluded from EBITDA in arriving at Adjusted EBITDA primarily included:
| • | the non-cash charges in relation to share-based compensation; |
| • | transaction-related costs incurred in relation to business combinations and major corporate transactions, including acquisition integration activities; |
| • | the effect on cost of sales of fair value adjustments to the carrying amount of inventory acquired in business combinations; |
| • | impairments, comprising impairments of goodwill and significant impairments or write downs of other assets; |
| • | net interest relating to post-retirement benefit obligations, significant lump-sum settlements and the amortization of prior period actuarial gains and losses; |
| • | restructuring costs; |
| • | the net gain or loss on disposals and on the exit of businesses; and |
| • | fees paid to our private equity sponsor for monitoring, advisory and consulting services. |
Differences exist among our businesses and from period to period in the extent to which their respective employees receive share-based compensation or a charge for such compensation is recognized. Similarly, non-cash net interest relating to post-retirement benefit obligations, significant lump-sum settlements and the amortization of prior period actuarial gains and losses may cause differences between our businesses and from period to period when comparing performance. We therefore exclude from Adjusted EBITDA the non-cash charges in relation to share-based compensation and the above adjustments related to post-retirement benefits in order to assess the relative performance of our businesses.
We exclude from Adjusted EBITDA those acquisition-related costs that are required to be expensed in accordance with ASC 805 ‘Business Combinations,’ in particular, the effect on cost of sales of the uplift to the carrying amount of inventory held by Gates at the date of the Acquisition, and costs associated with major corporate transactions because we do not believe that they relate to our performance. Other items are excluded from Adjusted EBITDA because they are individually or collectively significant items that are not considered to be representative of the performance of our businesses. During the periods presented we excluded restructuring costs that reflect specific actions taken by management to improve Gates’ future profitability; the net gain or loss on disposals of assets other than in the ordinary course of operations and gains and losses incurred in relation to non-Gates businesses disposed of in prior periods; and impairments of goodwill and significant impairments of other assets, representing the excess of their carrying amounts over the amounts that are expected to be recovered from them in the future.
EBITDA and Adjusted EBITDA exclude items that can have a significant effect on our profit or loss and should, therefore, be used in conjunction with, not as substitutes for, profit or loss for the period. Management compensates for these limitations by separately monitoring net income from continuing operations for the period.
57
Table of Contents
The following table reconciles the net income, the most directly comparable GAAP measure, to EBITDA and Adjusted EBITDA:
| (dollars in millions) | Fiscal 2017 | Fiscal 2016 | Fiscal 2015 | |||||||||
| Net income |
$ | 182.7 | $ | 84.3 | $ | 50.9 | ||||||
| Income tax (benefit) expense |
(72.5 | ) | 21.1 | (9.2 | ) | |||||||
| Net finance costs |
290.9 | 205.9 | 142.9 | |||||||||
| Amortization |
130.9 | 149.5 | 165.6 | |||||||||
| Depreciation |
81.3 | 91.3 | 104.3 | |||||||||
|
|
|
|
|
|
|
|||||||
| EBITDA |
613.3 | 552.1 | 454.5 | |||||||||
| Gain on disposal of discontinued operations |
(0.7 | ) | (12.4 | ) | — | |||||||
| Share-based compensation |
5.4 | 4.2 | 4.3 | |||||||||
| Transaction-related costs |
18.1 | 0.4 | 0.7 | |||||||||
| Acquisition-related costs included in cost of sales |
0.7 | — | — | |||||||||
| Impact of fair value adjustment on inventory (included in cost of sales) |
1.2 | — | — | |||||||||
| Impairment of inventory (included in cost of sales) |
2.0 | 21.7 | 9.6 | |||||||||
| Other impairments |
2.8 | 3.2 | 51.1 | |||||||||
| Benefit from sale of inventory impaired in a prior period |
— | (1.0 | ) | — | ||||||||
| Restructuring expenses |
17.4 | 11.4 | 15.6 | |||||||||
| Adjustments relating to post-retirement benefits |
2.5 | 6.4 | 4.8 | |||||||||
| Other operating (income) expense |
(0.3 | ) | 2.8 | (0.4 | ) | |||||||
| Sponsor fees |
6.7 | 6.1 | 7.0 | |||||||||
|
|
|
|
|
|
|
|||||||
| Adjusted EBITDA |
$ | 669.1 | $ | 594.9 | $ | 547.2 | ||||||
|
|
|
|
|
|
|
|||||||
Adjusted EBITDA Margin
Adjusted EBITDA margin is a non-GAAP measure that represents Adjusted EBITDA expressed as a percentage of sales. We use Adjusted EBITDA margin to measure the success of our businesses in managing our cost base and improving profitability.
| (dollars in millions) | Fiscal 2017 | Fiscal 2016 | Fiscal 2015 | |||||||||
| Continuing operations |
||||||||||||
| Net sales |
$ | 3,041.7 | $ | 2,747.0 | $ | 2,745.1 | ||||||
| Adjusted EBITDA |
$ | 669.1 | $ | 594.9 | $ | 547.2 | ||||||
| Adjusted EBITDA margin (%) |
22.0 | % | 21.7 | % | 19.9 | % | ||||||
58
Table of Contents
Core growth reconciliations
Core sales growth is a non-GAAP measure that represents net sales for the period excluding the impacts of movements in foreign currency rates and the first-year impacts of acquisitions and disposals. We present core growth because it allows for a meaningful comparison of year-over-year performance without the volatility caused by foreign currency gain or losses or the incomparability that would be caused by the impact of an acquisition or disposal. Management believes that this measure is therefore useful for securities analysts, investors and other interested parties to assist in their assessment of the trading performance of our businesses. The closest GAAP measure is net sales, on a segment basis.
| (dollars in millions) | Power Transmission |
Fluid Power | Total | |||||||||
| Fiscal 2017 net sales |
$ | 2,009.4 | $ | 1,032.3 | $ | 3,041.7 | ||||||
| Impact on net sales of movements in currency rates |
10.9 | 2.5 | 13.4 | |||||||||
| Impact on net sales of acquisitions |
— | 33.4 | 33.4 | |||||||||
|
|
|
|
|
|
|
|||||||
| Fiscal 2017 core sales |
$ | 1,998.5 | $ | 996.4 | $ | 2,994.9 | ||||||
|
|
|
|
|
|
|
|||||||
| Fiscal 2016 net sales |
$ | 1,862.1 | $ | 884.9 | $ | 2,747.0 | ||||||
|
|
|
|
|
|
|
|||||||
| Increase in net sales on a core basis |
$ | 136.4 | $ | 111.5 | $ | 247.9 | ||||||
| Core sales growth (%) |
7.3 | % | 12.6 | % | 9.0 | % | ||||||
Net Debt
Management uses net debt, rather than the narrower measure of net cash and cash equivalents which forms the basis for the consolidated cash flow statement, as a measure of our liquidity and in assessing the strength of our balance sheet.
Management analyzes the key cash flow items driving the movement in net debt to better understand and assess Gates’ cash performance and utilization in order to maximize the efficiency with which resources are allocated. The analysis of cash movements in net debt also allows management to more clearly identify the level of cash generated from operations that remains available for distribution after servicing our debt and post-employment benefit obligations and after the cash impacts of acquisitions and disposals.
Net debt represents the net total of:
| • | the carrying amount of our debt (bank overdrafts and bank and other loans); and |
| • | the carrying amount of cash and cash equivalents. |
Net debt may be analyzed as follows:
| (dollars in millions) | As of December 30, 2017 |
As of December 31, 2016 |
||||||
| Long-term debt: |
||||||||
| —Bank overdrafts |
$ | — | $ | 0.3 | ||||
| —Bank and other loans |
3,955.7 | 3,836.6 | ||||||
|
|
|
|
|
|||||
| 3,955.7 | 3,836.9 | |||||||
| Cash and cash equivalents |
(564.4 | ) | (527.2 | ) | ||||
|
|
|
|
|
|||||
| Net debt |
$ | 3,391.3 | $ | 3,309.7 | ||||
|
|
|
|
|
|||||
59
Table of Contents
Adjusted EBITDA adjustments for ratio calculation purposes
Our financial maintenance ratio in our revolving credit agreement and other ratios related to incurrence-based covenants (measured only upon the taking of certain actions, including the incurrence of additional indebtedness) under our revolving credit facility, our term loan facility and the indenture governing our outstanding notes are calculated in part based on financial measures similar to Adjusted EBITDA as presented elsewhere in this annual report, which financial measures are determined at the Gates Global LLC level and adjust for certain additional items such as severance costs, the pro forma impacts of acquisitions and the pro forma impacts of cost-saving initiatives. These incremental adjustments, as calculated pursuant to such agreements, provide us with a net benefit to Adjusted EBITDA for ratio calculation purposes of $16.3 million during Fiscal 2017.
The Company is not an obligor under our revolving credit facility, our term loan facility or the indenture governing our outstanding notes. Gates Global LLC, an indirect subsidiary of Gates Industrial Corporation plc, is the borrower under our revolving credit facility and our term loan facility and the issuer of our outstanding notes. The only significant difference between the results of operations and net assets that would be shown in the consolidated financial statements of Gates Global LLC and those for the Company that are included elsewhere in this annual report is additional cash and cash equivalents held by the Company of $8.3 million and $9.8 million as of December 30, 2017 and December 31, 2016, respectively.
Critical Accounting Estimates and Judgments
Details of our significant accounting policies are set out in note 2 to our audited consolidated financial statements included elsewhere in this annual report.
When applying our accounting policies, management must make assumptions, judgments and estimates concerning the future that affect the carrying amounts of assets and liabilities at the balance sheet date, the disclosure of contingencies that existed at the balance sheet date and the amounts of revenue and expenses recognized during the period. Management makes these assumptions, estimates and judgments based on factors such as historical experience, the observance of trends in the industries in which we operate and information available from our customers and other outside sources. Due to the inherent uncertainty involved in making assumptions, estimates and judgments, the actual outcomes could be different. The policies discussed below are considered by management to be more critical than other policies because their application involves a significant amount of estimation uncertainty that increases the risk of a material adjustment to the carrying amounts of our assets and liabilities.
Net Sales
We derive our net sales primarily from the sale of a wide range of power transmission and fluid power products and components for a large variety of industrial and automotive applications, both in the aftermarket and first-fit channels, throughout the world.
Revenue from the sale of goods is measured at the invoiced amount net of estimated returns, early settlement discounts, rebates and sales tax and is recognized only when: (i) there is persuasive evidence of a sales agreement, typically in the form of a written sale or purchase agreement approved by both parties, (ii) the delivery of goods has occurred—this generally occurs upon passage of title which, depending on the arrangement with the customer, is typically upon release of the goods from the physical control of the Company or upon receipt of the goods by the customer and, where there are contractual acceptance provisions, when the customer has accepted the goods (or the right to reject them has lapsed); (iii) the sales price is fixed or determinable; and (iv) the collectability of revenue is reasonably assured.
Although the majority of our sales agreements contain standard terms and conditions, there may, at times, be agreements with customers that contain multiple elements or non-standard terms and conditions. As a result, judgment is required to determine the appropriate accounting for transactions under these agreements, including whether the specified deliverables should be treated as separate units of accounting for recognition purposes, and, if so, how the sales price should be allocated among the elements and when to recognize sales for each element. For delivered elements, sales are generally recognized only when the delivered elements have standalone value and there are no uncertainties regarding customer acceptance. Sales for service contracts generally are recognized as the services are provided.
60
Table of Contents
Where a customer has the right to return goods, future returns are estimated based on historical returns profiles. Settlement discounts that may apply to unpaid invoices are estimated based on the settlement histories of the relevant customers and projected market conditions in the various markets we serve. Rebates that may apply to issued invoices are estimated based on expected total qualifying sales to the relevant customers.
Impairment of Goodwill and Other Long-Lived Assets
Goodwill, other intangible assets and property, plant and equipment are tested for impairment if an event occurs or circumstances change that would more likely than not reduce the fair value below its carrying amount. Additionally, goodwill and other intangible assets that have indefinite useful lives are subject to an annual impairment test.
Goodwill
To identify a potential impairment of goodwill, the fair value of the reporting unit to which the goodwill is allocated is compared with its carrying amount, including goodwill. If the fair value of the reporting unit exceeds its carrying amount, the goodwill of the reporting unit is not considered impaired. If the fair value is lower than the carrying amount, an impairment charge is recognized for the amount by which the carrying amount exceeds the reporting unit’s fair value, limited to the amount of goodwill allocated to that reporting unit.
Historically, the Company conducted its annual impairment test on the goodwill balance as of the last day of the fiscal year. During Fiscal 2017, this was changed to the first day of the fourth quarter. This change in the date as of which the impairment testing is performed was made in order to better align with the year end process and the timing of forecast preparations. This change is expected to be beneficial in that it allows more time to review and consider the impairment test results before the year end. Management based the fair value calculations on a weighted blend of the income and market approaches. The principal assumptions used were those regarding sales growth rates, selling prices and changes in direct costs.
For all reporting units, the fair values exceeded the carrying values and no goodwill impairments were therefore recognized during Fiscal 2017, Fiscal 2016 or Fiscal 2015.
We base our fair value estimates on assumptions we believe to be reasonable at the time but that are unpredictable and inherently uncertain. In addition, we make certain judgments and assumptions in allocating shared assets and liabilities to determine the carrying values for each of our reporting units tested. Changes in assumptions or circumstances could result in an additional impairment in the period in which the change occurs and in future years.
Indefinite-Lived Assets Other than Goodwill
To identify a potential impairment of indefinite-lived assets other than goodwill, the fair value of the asset is compared with its carrying amount. If the fair value of the indefinite-lived asset exceeds its carrying amount, it is not considered impaired. Fair value is calculated based on the anticipated net cash inflows and outflows related to the indefinite-lived asset.
Fair value for our indefinite-lived brands and trade names intangible asset is determined using a relief from royalty valuation methodology in which the key assumptions included sales growth rates and an estimated royalty rate. Sales forecasts were determined on the same basis as those used for the annual impairment testing of goodwill.
Historically, the Company conducted its annual impairment tests on its brands and trade names, an indefinite-lived intangible asset, as of the last day of the fiscal year. During Fiscal 2017, this was changed to the first day of the fourth quarter. This change in the date as of which the impairment testing is performed from the fiscal year end to
61
Table of Contents
the end of the first week of the fourth fiscal quarter, was made in order to better align with the year end process and the timing of forecast preparations and is consistent with the timing of the annual impairment testing of goodwill. This change is expected to be beneficial in that it allows more time to review and consider the impairment test results before the year end. The fair value is determined using a relief from royalty valuation methodology in which the key assumptions included sales growth rates and an estimated royalty rate.
As a result of the impairment testing, no impairment was recognized during Fiscal 2017 or Fiscal 2016. In Fiscal 2015, an impairment of $44.0 million was recognized in relation to the brands and trade names intangible asset, driven almost exclusively by the impact of weakening foreign currencies (in which the sales that support the value of the intangible asset are denominated) against the US dollar (in which the brands and trade name intangible asset is denominated.
We base our fair value estimates on assumptions we believe to be reasonable at the time but that are unpredictable and inherently uncertain. Changes in assumptions or circumstances could result in an additional impairment in the period in which the change occurs and in future years.
Other Long-Lived Assets
A long-lived asset or finite lived intangible asset or asset group is considered to be impaired when the undiscounted expected future cash flows from the asset or asset group are less than its carrying amount. In that event, an impairment loss is recognized to the extent that the carrying amount of the asset or asset group exceeds its fair value. Fair value is estimated as the present value of the expected future cash flows from the asset or asset group discounted at a rate commensurate with the risk involved. An impairment loss for an asset group is allocated to the long-lived and intangible assets of the group on a pro rata basis using the relative carrying amounts of those assets, with the limitation that the carrying amount of an individual asset is not reduced below its fair value.
As of December 30, 2017, the carrying amount of property, plant and equipment was $686.2 million, excluding assets held for sale, compared with $599.6 million as of December 31, 2016. No significant impairment of plant and equipment was recognized during Fiscal 2017 or Fiscal 2016. An impairment of plant and equipment in Brazil for $6.7 million was recognized during Fiscal 2015.
The carrying amount of finite-lived intangible assets at December 30, 2017 was $1,657.4 million compared with $1,674.7 million as of December 31, 2016. During Fiscal 2017, an impairment of $1.0 million was recognized in relation to technology and know-how, compared with a computer software impairment of $2.0 million and $0.1 million for Fiscal 2016 and Fiscal 2015, respectively.
Impairment losses may be recognized on assets within the next financial year if events or circumstances indicate that the carrying amount of an asset may not be recoverable. An asset would be considered impaired if the estimated future net undiscounted cash flows generated are less than the carrying amount of the asset.
Share-Based Compensation
Share-based compensation has historically been provided to certain of our employees and directors under share option, bonus and other share award plans. A description of the awards granted and the costs recognized by us during the periods presented is set out in note 18 to the audited consolidated financial statements included elsewhere in this annual report.
We recognize a compensation expense in respect of these plans that is based on the fair value of the awards, measured at the date of grant using either the Black-Scholes option-pricing formula or a Monte-Carlo valuation model and reflecting market performance conditions and all non-vesting conditions. Fair value is not subsequently remeasured unless the conditions on which the award was granted are modified.
62
Table of Contents
Generally, the compensation expense for each separately vesting portion of the award is recognized on a straight-line basis over the vesting period for that portion of the award subject to continued service with us through each vesting date. A compensation expense is recognized for awards containing performance conditions only to the extent that it is probable that those performance conditions will be met. Adjustments are made to reflect expected and actual forfeitures during the vesting period due to failure to satisfy service conditions or performance conditions.
We expect to continue to grant stock options in the future, and, to the extent that we do, our stock-based compensation expense recognized in future periods will likely increase.
The Black-Scholes option-pricing model requires the input of highly subjective assumptions, including the fair value of the underlying shares, the expected volatility of the price of our shares, risk-free interest rates, the expected term of the option and the expected dividend yield of our shares. These estimates involve inherent uncertainties and the application of management’s judgment. If factors change and different assumptions are used, our stock-based compensation expense could be materially different in the future.
| • | Fair Value of Our Shares. As of December 30, 2017, the Company’s shares were not publicly traded and we therefore estimated the fair value of our shares, as discussed below. |
| • | Expected Volatility. As we have not been a public company and do not have a trading history for our shares, the expected stock price volatility for our shares is estimated by taking the average historical price volatility for industry peers based on daily price observations over a period equivalent to the expected term of the share option grants. We intend to continue to consistently apply this process using the same or similar public companies until a sufficient amount of historical information regarding the volatility of our own share price becomes available, or unless circumstances change such that the identified companies are no longer similar to us, in which case more suitable companies whose share prices are publicly available would be used in the calculation. |
| • | Risk-free Interest Rate. The risk-free interest rate is based on the yields of U.S. Treasury securities with maturities similar to the expected term of the options for each option group. |
| • | Expected Term. The expected term represents the period that our share-based awards are expected to be outstanding. As we do not have sufficient historical experience for determining the expected term of the share option awards granted, we base our expected term for awards issued on the simplified method, which represents the average period from vesting to the expiration of the stock option. |
| • | Expected Dividend Yield. We have never declared or paid any cash dividends to shareholders and do not presently plan to pay cash dividends in the foreseeable future. Consequently, we use an expected dividend yield of zero. |
The fair value of our shares has historically been determined based upon information available at the time of grant. Given the absence of a public trading market for our shares prior to January 2018 and in accordance with the American Institute of Certified Public Accountants Practice Aid, Valuation of Privately Held Company Equity Securities Issued as Compensation, or the Practice Aid, management has exercised reasonable judgment and considered numerous objective and subjective factors to determine the best estimate of the fair value of our shares at each grant date. These factors included:
| • | our operating and financial performance; |
| • | current business conditions and projections; |
| • | the likelihood of achieving a liquidity event for the shares of shares underlying these stock options, such as an initial public offering or sale of our company, given prevailing market conditions; |
| • | the lack of marketability of our shares; and |
| • | the market performance of comparable publicly traded companies. |
In valuing our shares, we determined the equity value of our business using a weighted blend of the income and market approaches. The income approach estimates the fair value of a company based on the present value of such company’s future estimated cash flows and the residual value of such company beyond the forecast period.
63
Table of Contents
These future values are discounted to their present values to reflect the risks inherent in such company achieving these estimated cash flows. Significant inputs of the income approach (in addition to our estimated future cash flows themselves) include the long-term growth rate assumed in the residual value, discount rate and normalized long-term operating margin. The terminal value was calculated to estimate our value beyond the forecast period by applying valuation metrics to the final year of our forecasted revenue and discounting that value to the present value using the same weighted average cost of capital applied to the forecasted periods.
Following our IPO, the fair value per share of our shares for purposes of determining stock-based compensation is the closing price of our shares as reported on the applicable grant date.
Taxation
We are subject to income tax in most of the jurisdictions in which we operate. Management is required to exercise significant judgment in determining our provision for income taxes. Management’s judgment is required in relation to uncertain tax positions whereby additional current tax may become payable in the future following the audit by tax authorities of previously-filed tax returns. It is possible that the final outcome of these uncertain tax positions may differ from management’s estimates.
Management assesses uncertain tax positions based upon an evaluation of the facts, circumstances and information available at the balance sheet date. Provision is made for uncertain tax positions to the extent that the amounts previously taken or expected to be taken in tax returns exceeds the tax benefits that are recognized in the consolidated financial statements in respect of the tax positions. A tax benefit is recognized in the consolidated financial statements only if management considers that it is more likely than not that the tax position will be sustained on examination by the relevant tax authority solely on the technical merits of the position and is measured as the largest amount of tax benefit that will more likely than not be realized upon settlement assuming that the tax authority has full knowledge of all relevant information. Provisions for uncertain tax positions are reviewed regularly and are adjusted to reflect events such as the expiration of limitation periods for assessing tax, guidance given by the tax authorities and court decisions.
Deferred tax assets and liabilities are recognized based on the expected future tax consequences of the difference between the financial statement carrying amount and the respective tax basis. Deferred taxes are measured on the enacted rates expected to apply to taxable income at the time the difference is anticipated to reverse. Deferred tax assets are reduced through the establishment of a valuation allowance if it is more likely than not that the deferred tax asset will not be realized taking into account the timing and amount of the reversal of taxable temporary differences, expected future taxable income and tax planning strategies.
Deferred tax is provided on certain taxable temporary differences arising on investments in foreign subsidiaries, except where we intend, and are able, to reinvest such amounts on a permanent basis or to remit such amounts in a tax-free manner.
Accounting Pronouncements Not Yet Adopted
Recently-issued accounting pronouncements that may be relevant to our operations but have not yet been adopted are outlined in note 3 to our audited consolidated financial statements included elsewhere in this annual report.
Item 7A. Quantitative and Qualitative Disclosures About Market Risk
Our market risk includes the potential loss arising from adverse changes in foreign currency exchange rates, interest rates and commodity prices. From time to time, we use derivative financial instruments, principally foreign currency swaps, forward foreign currency contracts and interest rate caps (options), to reduce our exposure to foreign currency risk and interest rate risk. We do not hold or issue derivatives for speculative purposes and monitor closely the credit quality of the institutions with which we transact. Our objective in managing these risks is to reduce fluctuations in earnings and cash flows associated with changes in foreign currency exchange rates and interest rate movements.
64
Table of Contents
On a regular basis, we monitor third-party depository institutions that hold our cash and short-term investments, primarily for safety of principal and secondarily for maximizing yield on those funds. We diversify our cash and short-term investments among counterparties to minimize exposure to any one of these entities. We also monitor the creditworthiness of our customers and suppliers to mitigate any adverse impact.
Foreign Currency Exchange Risk
We have global operations and thus make investments and enter into transactions denominated in various foreign currencies. Our operating results are impacted by buying, selling and financing in currencies other than the functional currency of our operating companies. We monitor exposure to transactions denominated in currencies other than the functional currency of each country in which we operate, and enter into forward contracts to mitigate that exposure as needed. We also naturally hedge foreign currency through our production in the countries in which we sell our products.
In addition, we are exposed to currency risk associated with translating our functional currency financial statements into its reporting currency, which is the U.S. dollar. As a result, we are exposed to movements in the exchange rates of various currencies against the U.S. dollar. Translational foreign exchange risks arise predominantly on the potential increase in our significant euro debt when translated to U.S. dollars, as well as on the potential decreases in the value of our earnings, cash balances and other net assets denominated in euro and other currencies when translated to U.S. dollars.
The currency profiles of our cash and debt are centrally managed as are decisions about the location of cash. The currency profile of cash and debt, after taking into account the effect of forward currency swaps used to manage those profiles, were as follows:
| (dollars in millions) | As of December 30, 2017 |
As of December 31, 2016 |
||||||
| Cash and cash equivalents by currency: |
||||||||
| —U.S. dollar |
$ | 305.0 | $ | 336.8 | ||||
| —Euro |
51.1 | 45.2 | ||||||
| —Chinese Yuan Renminbi |
60.4 | 35.5 | ||||||
| —Japanese Yen |
33.6 | 20.8 | ||||||
| —Other |
114.3 | 88.9 | ||||||
|
|
|
|
|
|||||
| $ | 564.4 | $ | 527.2 | |||||
|
|
|
|
|
|||||
| Principal amount of debt (including bank overdrafts) by currency: |
||||||||
| —U.S. dollar |
$ | 2,649.4 | $ | 3,168.8 | ||||
| —Euro |
1,338.5 | 717.7 | ||||||
| —British Pound |
— | 0.2 | ||||||
|
|
|
|
|
|||||
| $ | 3,987.9 | $ | 3,886.7 | |||||
|
|
|
|
|
|||||
As described in note 13 to the audited consolidated financial statements included elsewhere in this annual report, during Fiscal 2016 and Fiscal 2017 we had designated €265.5 million of our Euro Term Loans, €235.0 million of our euro notes and a €254.5 million cross currency swap as hedges of the majority of our net investment in euro-denominated foreign operations. Changes in the value of these instruments resulting from fluctuations in the euro to U.S. dollar exchange rate are accordingly recorded as foreign currency translation adjustments within other comprehensive income.
65
Table of Contents
Interest Rate Risk
Our prevailing market risk on interest rates is the potential fluctuation in interest costs and in the fair value of long-term debt resulting from movements in interest rates.
We use interest rate caps as part of our interest rate risk management strategy to add stability to interest expense and to manage our exposure to interest rate movements. The interest rate caps are designated as cash flow hedges and involve the receipt of variable rate payments from a counterparty if interest rates rise above the strike rate on the contract in exchange for a premium. The following table summarizes the key terms of the interest rate derivatives held by the Company:
| Notional principal amount $ million |
Interest rate | |||||||||||||||||||||||
| (dollars in millions) | Payable | Receivable | ||||||||||||||||||||||
| Variable | Fixed | Variable | Fixed | Variable rate index | ||||||||||||||||||||
| As of December 30, 2017 |
||||||||||||||||||||||||
| Maturity date: |
||||||||||||||||||||||||
| —June 2019 |
1,000.0 | — | 1.3 | % | 0.7 | % | — | 3 month LIBOR | ||||||||||||||||
| —June 2020 |
200.0 | — | 0.3 | % | — | — | 3 month LIBOR | |||||||||||||||||
| As of December 31, 2016 |
||||||||||||||||||||||||
| Maturity date: |
||||||||||||||||||||||||
| —June 2019 |
1,000.0 | — | 1.3 | % | — | — | 3 month LIBOR | |||||||||||||||||
The interest rate profile of the Company’s financial assets and liabilities, after taking into account the effect of the interest rate hedging activities, was as follows:
| As of December 30, 2017 | As of December 31, 2016 | |||||||||||||||||||||||||||||||
| Interest-bearing | Interest-bearing | |||||||||||||||||||||||||||||||
| (dollars in millions) | Floating rate |
Fixed rate |
Non-interest bearing |
Total | Floating rate |
Fixed rate |
Non-interest bearing |
Total | ||||||||||||||||||||||||
| Financial assets: |
||||||||||||||||||||||||||||||||
| Available-for-sale investments |
$ | — | $ | — | $ | 2.4 | $ | 2.4 | $ | — | $ | — | $ | 2.6 | $ | 2.6 | ||||||||||||||||
| Cash and cash equivalents |
417.8 | — | 146.6 | 564.4 | 337.5 | — | 189.7 | 527.2 | ||||||||||||||||||||||||
| Restricted cash |
— | — | 1.6 | 1.6 | — | — | 1.6 | 1.6 | ||||||||||||||||||||||||
|
|
|
|
|
|
|
|
|
|
|
|
|
|
|
|
|
|||||||||||||||||
| 417.8 | — | 150.6 | 568.4 | 337.5 | — | 193.9 | 531.4 | |||||||||||||||||||||||||
| Financial liabilities: |
||||||||||||||||||||||||||||||||
| Debt |
(1,315.0 | ) | (2,672.5 | ) | (0.4 | ) | (3,987.9 | ) | (1,600.3 | ) | (2,285.7 | ) | (0.7 | ) | (3,886.7 | ) | ||||||||||||||||
| Obligations under finance leases |
— | (1.4 | ) | — | (1.4 | ) | — | (1.4 | ) | — | (1.4 | ) | ||||||||||||||||||||
|
|
|
|
|
|
|
|
|
|
|
|
|
|
|
|
|
|||||||||||||||||
| (1,315.0 | ) | (2,673.9 | ) | (0.4 | ) | (3,989.3 | ) | (1,600.3 | ) | (2,287.1 | ) | (0.7 | ) | (3,888.1 | ) | |||||||||||||||||
|
|
|
|
|
|
|
|
|
|
|
|
|
|
|
|
|
|||||||||||||||||
| $ | (897.2 | ) | $ | (2,673.9 | ) | $ | 150.2 | $ | (3,420.9 | ) | $ | (1,262.8 | ) | $ | (2,287.1 | ) | $ | 193.2 | $ | (3,356.7 | ) | |||||||||||
|
|
|
|
|
|
|
|
|
|
|
|
|
|
|
|
|
|||||||||||||||||
Liquidity risk
Liquidity risk is the risk that an entity will encounter difficulty in meeting obligations associated with financial liabilities. Our debt facilities are monitored against forecast requirements and timely action is taken to put in place, renew or replace credit lines. We aim to reduce liquidity risk by diversifying our funding sources, maintaining adequate headroom under our debt facilities and by staggering the maturities of our debt.
We have established long-term credit ratings of B3 Stable with Moody’s and B+ Stable with Standard & Poor’s. Credit ratings are subject to regular review by the credit rating agencies and may change in response to economic and commercial developments.
66
Table of Contents
For the expected timing of contractual cash flows relating to the financial liabilities and related financial assets see the table set out above under “Item 7. Management’s Discussion and Analysis of Financial Condition and Results of Operations—Tabular Disclosure of Contractual Obligations.”
Commodity Risk
We source a wide variety of materials and components from a network of global suppliers. While such materials are typically available from numerous suppliers, commodity raw materials such as aluminum, steel and polymers are subject to price fluctuations, which could have a negative impact on our results. We primarily manage these risks through normal operating activities. We strive to pass along such commodity price increases to customers to avoid profit margin erosion and utilize lean initiatives to further mitigate the impact of commodity raw material price fluctuations as we achieve improved efficiencies. We historically have not entered into any derivative commodity instruments to manage the exposure to changing price risk for supplies, but we will continue to evaluate their viability.
Item 8. Financial Statements and Supplementary Data
The information required by this Item is included as a separate section in this annual report on Form 10-K. See Part IV. Item 15. “Exhibits, Financial Statement Schedules,” which is incorporated herein by reference.
Item 9. Changes in and Disagreements With Accountants on Accounting and Financial Disclosure
None.
Item 9A. Controls and Procedures
Disclosure Controls and Procedures
The Company maintains a set of disclosure controls and procedures designed to ensure that information required to be disclosed by the Company in reports that it files or submits under the Exchange Act, is recorded, processed, summarized and reported within the time periods specified in SEC rules and forms. Any controls and procedures, no matter how well designed and operated, can provide only reasonable, not absolute, assurance of achieving the desired control objectives. The Company’s management, with the participation of the Company’s Chief Executive Officer, and the Company’s Chief Financial Officer, has evaluated the effectiveness of the design and operation of the Company’s disclosure controls and procedures as of the end of the period covered by this Annual Report on Form 10-K. Based upon that evaluation, the Company’s Chief Executive Officer and the Company’s Chief Financial Officer concluded that, as of December 30, 2017, the Company’s disclosure controls and procedures were effective to accomplish their objectives at the reasonable assurance level.
Management’s Annual Report on Internal Control over Financial Reporting
Internal control over financial reporting is a process designed to provide reasonable assurance regarding the reliability of financial reporting and the preparation of financial statements in accordance with GAAP. We are currently in the process of reviewing, documenting and testing our internal control over financial reporting.
We have not performed an evaluation of our internal control over financial reporting, such as required by Section 404 of the Sarbanes-Oxley Act, nor have we engaged an independent registered public accounting firm to perform an audit of our internal control over financial reporting as of any balance sheet date or for any period reported in our financial statements. This annual report does not include a report of management’s assessment regarding internal control over financial reporting or an attestation report of the company’s registered public accounting firm due to a transition period established by rules of the Securities and Exchange Commission for newly public companies.
67
Table of Contents
Changes in Internal Control over Financial Reporting
There has been no change in our internal control over financial reporting during our most recent fiscal quarter that has materially affected, or is reasonably likely to materially affect, our internal control over financial reporting.
As of the filing of the Registration Statement and the IPO prospectus, the Fiscal 2017 Annual Plan bonuses for the Company’s named executive officers had not been determined and, therefore, were omitted from the Summary Compensation Tables included in the Registration Statement and the IPO prospectus. On March 7, 2018, the Company’s compensation committee approved Fiscal 2017 Plan bonuses for the Company’s named executive officers. The Fiscal 2017 Annual Plan award earned by each of our named executive officers and the new total compensation amounts for the named executive officers are reported in the Summary Compensation Table in Item 11 of this Annual Report on Form 10-K.
Part III
Item 10. Directors, Executive Officers and Corporate Governance
Directors and Executive Officers
The following table sets forth our directors and executive officers, as well as their ages as of March 8, 2018.
| Name |
Age | Position | ||
| Ivo Jurek | 53 | Chief Executive Officer and Director | ||
| David L. Calhoun | 60 | Director, Chairman of the Board of Directors | ||
| Neil P. Simpkins | 51 | Director | ||
| Julia C. Kahr | 39 | Director | ||
| John Plant | 64 | Director | ||
| Terry Klebe | 63 | Director | ||
| Karyn Ovelmen | 54 | Director | ||
| David H. Naemura | 48 | Chief Financial Officer | ||
| Walter T. Lifsey | 59 | Chief Operating Officer | ||
| Jamey S. Seely | 46 | Executive Vice President, General Counsel and Corporate Secretary | ||
| Roger C. Gaston | 62 | Executive Vice President—Human Resources | ||
| Gregory F. Kirchhoff | 59 | Senior Vice President—Corporate Controller |
Ivo Jurek has served as a director of Gates Industrial Corporation plc since its formation in September 2017 and has served as our Chief Executive Officer and a director of Gates entities since May 2015. Mr. Jurek oversees and manages all of Gates’ departments and lines of products and services globally. As Chief Executive Officer, Mr. Jurek has led Gates to expand product lines in fluid power, power transmission, and strategically grow market share through acquisitions and joint ventures, while driving improved financial performance through increased plants efficiency. Mr. Jurek has a deep understanding of new technology development, manufacturing, distribution and international business markets. Prior to joining Gates, Mr. Jurek served as President of Eaton Electrical, Asia Pacific from November 2012. During that time, Mr. Jurek had management oversight of Eaton Electrical’s Asia Pacific portfolio which included optimizing manufacturing plants, identifying new markets, and assisting with the overall performance of the company. Prior to that, Mr. Jurek served as Group President for Cooper Power Systems—Cooper Bussmann with complete oversight of all business activities and in significant general management positions for International Rectifier Corporation and TRW Inc.
68
Table of Contents
David L. Calhoun has served as a director of Gates Industrial Corporation plc since November 2017 and has served as a director of Gates entities since 2014. He is a Senior Managing Director and Head of Private Equity Portfolio Operations of Blackstone and a member of Blackstone’s Management Committee. Mr. Calhoun joined Blackstone in January 2014 and oversees a team within the portfolio operations group focused on creating and driving added value initiatives with Blackstone portfolio company CEOs. From the beginning of 2014 to May 2017, Mr. Calhoun served on the Board for Nielsen, including as Executive Chairman of the Board from January 2014 to January 2016, a company he joined in 2006 as Chief Executive Officer shortly after it was acquired by a consortium of private equity investors including Blackstone. Throughout his seven years’ tenure, Mr. Calhoun led Nielsen’s transformation into a leading global information and measurement company listed on the NYSE (Ticker: NLSN) and Standard & Poor’s 500 Index. Before Nielsen, Mr. Calhoun served as Vice Chairman of The General Electric Company and President and Chief Executive Officer of GE Infrastructure, the company’s largest business unit. During his distinguished 26-year tenure at GE, Mr. Calhoun ran multiple business units, including GE Lighting, GE Employers Reinsurance Co., GE Aircraft Engines, and GE Transportation (Aircraft and Rail). Earlier in his career at GE, he held a wide range of operating, finance, and marketing roles across the company, including within GE Plastics and GE Capital. Mr. Calhoun also serves on the Board of Directors of The Boeing Company and Caterpillar and effective April 1, 2017, he became the Chairman of the Board for Caterpillar. He is the co-author with Rick Kash of the book “How Companies Win.”
Mr. Calhoun is a member of Virginia Tech’s Pamplin Advisory Council, which advises the university on student and alumni issues.
Neil P. Simpkins has served as a director of Gates Industrial Corporation plc since November 2017 and has served as a director of Gates entities since 2014. He is a Senior Managing Director of Blackstone’s Corporate Private Equity Group. Since joining Blackstone in 1998, Mr. Simpkins has led the acquisitions of TRW Automotive, Vanguard Health Systems, Team Health, LLC, Apria Healthcare Group, Change Healthcare, Inc., Summit Materials, Inc. and Gates. Before joining Blackstone, Mr. Simpkins was a Principal at Bain Capital. While at Bain Capital, Mr. Simpkins was involved in the execution of investments in the consumer products, industrial, healthcare and information industries. Prior to joining Bain Capital, Mr. Simpkins was a consultant at Bain & Company in the Asia Pacific region and in London. He currently serves as a Director of Apria Healthcare Group, Summit Materials, Inc., Change Healthcare, Inc. and Team Health, Inc.
Julia C. Kahr has served as a director of Gates Industrial Corporation plc since its formation in September 2017 and has served as a director of Gates entities since 2014. She is a Senior Managing Director of Blackstone’s Corporate Private Equity Group. Since joining Blackstone in 2004, she has been involved in the execution of Blackstone’s investments in SunGard Data Systems, Encore Medical Corporation, DJO Global, Summit Materials, Inc. and Gates. Before joining Blackstone, she was a Project Leader at the Boston Consulting Group, where she worked with companies in a variety of industries, including health care, financial services, media and entertainment and consumer goods. She is also the sole author of Working Knowledge, a book published by Simon & Schuster in 1998. She currently serves on the Board of Directors of DJ Orthopedics and Barry-Wehmiller Companies, Inc. and is also a member of the Board of Directors of Episcopal Social Services.
John Plant has served as a director of Gates Industrial Corporation plc since December 2017 and has served as a director of Gates entities since 2015. Mr. Plant is the former Chairman of the Board, President and Chief Executive Officer of TRW Automotive, which was acquired by ZF Friedrichshafen AG in May 2015. He was a co-member of the Chief Executive Office of TRW Inc. from 2001 to 2003 and an Executive Vice President of TRW from its 1999 acquisition of Lucas Varity to 2003. Prior to TRW, Mr. Plant was President of Lucas Variety Automotive and managing director of the Electrical and Electronics division from 1991 through 1997. Mr. Plant currently serves as a director of Masco Corporation and Jabil Circuit Corporation and director and chair of the board of Arconic. He is a board member of the Automotive Safety Council and also a Fellow of the Institute of Chartered Accountants.
69
Table of Contents
Terry Klebe has served as a director of Gates Industrial Corporation plc since December 2017 and has served as a director of Gates entities since 2016. Mr. Klebe was previously Senior Vice President and Chief Financial Officer of Cooper Industries, a multinational industrial manufacturing company with 2010 revenues of $5.1 billion, from 2002 until his retirement in February 2010. Mr. Klebe continued to serve as vice chairman at Cooper through his retirement in April 2011. Mr. Klebe also served on the Board of Directors of Fairchild Semiconductors and as a head of Audit Committee until its sale in September 2016.
Karyn Ovelmen has served as a director of Gates Industrial Corporation plc since December 2017. Mrs. Ovelmen was previously Executive Vice President and Chief Financial Officer of Flowserve Corp., a provider of flow control products and services for the global infrastructure market, from June 2015 to February 2017. Prior to Flowserve, she served as Chief Financial Officer and Executive Vice President of LyondellBasell Industries NV from 2011 to May 2015. Mrs. Ovelmen also served as Executive Vice President and Chief Financial Officer of Petroplus Holdings AG from May 2006 to September 2010 and as Executive Vice President and Chief Financial Officer of Argus Services Corporation from 2005 to 2006. Prior to Argus Services, she was Vice President of External Reporting and Investor Relations for Premcor Refining Group Inc. She also spent 12 years with PricewaterhouseCoopers, primarily serving energy industry accounts. Mrs. Ovelmen currently serves as a director of ArcelorMittal and as chairman of ArcelorMittal’s audit & risk committee.
David H. Naemura has served as our Chief Financial Officer since March 2015. As Chief Financial Officer, Mr. Naemura manages Gates’ global corporate finance and accounting functions, including capital structure,
resource allocation, financial reporting and the maintenance of our global internal control systems. Mr. Naemura also manages Information Technology and Gates’ mergers and acquisitions function. Previously, Mr. Naemura served as a Group CFO in Danaher Corporation starting in April 2012. While Group CFO, Mr. Naemura maintained responsibility for a diverse group of businesses in a variety of industrial and electronics end markets. Prior to serving in his Group CFO Role at Danaher Corporation, Mr. Naemura served as a Platform CFO in Danaher from June 2009 to March 2012. Mr. Naemura was also previously an operating company CFO in Danaher. Prior to Danaher, Mr. Naemura was employed by Tektronix Corporation since 2000, prior to their acquisition by Danaher Corporation in 2007. Mr. Naemura was also formerly an auditor.
Walter T. Lifsey has served as our Chief Operating Officer since August 2015. As Chief Operating Officer, Mr. Lifsey manages and oversees all manufacturing and operations globally for Gates, including the operations function, health, safety and environmental, quality assurance, procurement and certain new product development. Mr. Lifsey has transformed manufacturing processes and procedures at Gates and is developing critical new assets and infrastructure for Gates globally. Prior to joining Gates, Mr. Lifsey served as Chief Operating Officer of View Inc., a manufacturer of intelligent windows, where Mr. Lifsey was responsible for all aspects of manufacturing, product quality, manufacturing engineering, operational planning, and manufacturing information systems. Before his time at View, Mr. Lifsey served in various roles at Atmel Corporation beginning in 2006 before becoming their Chief Operating Officer where he led global operations from May 2010 to November 2012. Prior to Atmel, he served in various senior management roles at International Rectifier and TRW Inc.
Jamey S. Seely has served as our Executive Vice President, General Counsel and Corporate Secretary since September 2017. Prior to joining Gates, Ms. Seely served as Executive Vice President, General Counsel and Corporate Secretary for ION Geophysical overseeing all corporate matters, securities regulation and disclosure issues, corporate governance, litigation, executive compensation and a broad range of financings, joint ventures and strategic transactions. Prior to ION, Ms. Seely served as Senior Vice President of Alternative Energy for NRG Energy, Inc., with management and legal oversight of multiple new business and startup ventures related to enhanced oil recovery, solar power and nuclear project development. Prior to NRG Energy, Ms. Seely served as Vice President and General Counsel at Direct Energy and as a partner in the corporate and securities law group of Thompson & Knight LLP. Ms. Seely is licensed to practice in Texas and New York.
70
Table of Contents
Roger C. Gaston has served as our Executive Vice President—Human Resources since December 2017 and previously served as our Senior Vice President—Human Resources since August 2016. As Executive Vice President of Human Resources, Mr. Gaston works to build and enhance the Gates human resources function globally. He oversees talent management, recruiting, benefits, labor relations, maintaining a healthy workforce, and talent development. Prior to Gates, Mr. Gaston worked as Senior Vice President—Human Resources for Avaya Inc., a multibillion dollar enterprise telecommunications and solutions company, since 2006. At Avaya, Mr. Gaston oversaw all aspects of human resource management and industrial relations policies, practices and operations. Before Avaya, Mr. Gaston was a Corporate Vice President—Human Resources for Storage Technology Corp. from 2000 to 2005. Prior to Storage Technology Mr. Gaston served as the Senior Vice President, Human Resources for Toys R Us, Inc. from 1996-2000. A Chapter 11 petition for bankruptcy protection was filed by Avaya in January of 2017.
Gregory F. Kirchhoff has served as our Senior Vice President—Corporate Controller since October 2012. As Senior Vice President—Corporate Controller, Mr. Kirchhoff has been responsible for the oversight of external financial reporting, corporate center accounting and policies, and financial internal controls. Prior to joining Gates, Mr. Kirchhoff served as Director of Financial Control & Compliance at Gates Worldwide Limited, a Tomkins Plc company, from August 2004 to September 2012.
Controlled Company Exception
Our Sponsor holds more than a majority of the voting power of our ordinary shares eligible to vote in the election of our directors. As a result, we are a “controlled company” within the meaning of the NYSE corporate governance standards. Under these NYSE corporate governance standards, a company of which more than 50% of the voting power is held by an individual, group or another company is a “controlled company” and may elect not to comply with certain corporate governance standards, including the requirements (1) that a majority of our board of directors consist of independent directors, (2) that our board of directors have a compensation committee that is comprised entirely of independent directors with a written charter addressing the committee’s purpose and responsibilities and (3) that our board of directors have a nominating and corporate governance committee that is comprised entirely of independent directors with a written charter addressing the committee’s purpose and responsibilities. We currently utilize these exemptions and we intend to continue to utilize these exemptions. As a result, a majority of our directors is not independent and our compensation committee and nominating and corporate governance committee are not comprised entirely of independent directors. Accordingly, you may not have the same protections afforded to shareholders of companies that are subject to all of these corporate governance requirements. In the event that we cease to be a “controlled company” and our ordinary shares continue to be listed on the NYSE, we will be required to comply with these provisions within the applicable transition periods.
Composition of the Board of Directors
Our business and affairs are managed under the direction of our board of directors, which consists of seven directors, of whom Mr. Plant, Mr. Klebe and Mrs. Ovelmen have affirmatively been determined by our board of directors to be independent. We are party to a shareholders agreement with certain affiliates of our Sponsor. This agreement grants our Sponsor the right to designate nominees to our board of directors subject to the maintenance of certain ownership requirements in us. See “Item 13. Certain Relationships and Related Person Transactions—Shareholders Agreement.”
Background and Experience of Directors
When considering whether directors and nominees have the experience, qualifications, attributes or skills, taken as a whole, to enable our board of directors to satisfy its oversight responsibilities effectively in light of our business and structure, the board of directors focuses primarily on each person’s background and experience as reflected in the information discussed in each of the directors’ individual biographies set forth above. We believe that our directors provide an appropriate mix of experience and skills relevant to the size and nature of our business. In particular, the members of our board of directors considered the following important characteristics, among others:
| • | Mr. Jurek’s extensive business and industry experience as well as his experience leading Gates since May 2015. |
71
Table of Contents
| • | Mr. Calhoun’s management perspective he brings to Board deliberations and his extensive management expertise at public companies, including as former Chief Executive Officer, Executive Chairman and director of Nielsen. |
| • | Mr. Simpkins’ significant financial and business experience, including as a Senior Managing Director in the Corporate Private Equity Group at Blackstone and former Principal at Bain Capital. |
| • | Ms. Kahr’s extensive knowledge of a variety of different industries and her significant financial and investment experience from her involvement in Blackstone, including as Senior Managing Director. |
| • | Mr. Plant’s significant management and operational experience from his service in various senior management roles, including as former Chairman of the Board, President and Chief Executive Officer of TRW Automotive. |
| • | Mr. Klebe’s extensive business and leadership experience, including as former Vice Chairman of Cooper Industries plc. |
| • | Mrs. Ovelmen’s extensive business and leadership experience, including as former Chief Financial Officer of companies including Flowserve and LyondellBasell Industries NV. |
Board Committees
Our board of directors has established an audit committee, a compensation committee and a nominating and corporate governance committee. The composition and responsibilities of each committee are described below. Our board of directors may also establish from time to time any other committees that it deems necessary or desirable. Members serve on these committees until their resignation or until otherwise determined by our board of directors.
Each of the standing committees of the board of directors discussed below operate under written charters, which are available on our website at www.gates.com under About Us: Investor Relations: Governance: Governance Documents. The information contained on, or accessible from, our website is not part of this annual report by reference or otherwise.
Audit Committee
Our audit committee consists of Ms. Kahr, Mr. Klebe and Mrs. Ovelmen, with Mr. Klebe serving as chair. Our audit committee is responsible for, among other things:
| • | selecting and hiring our independent auditors, and approving the audit and non-audit services to be performed by our independent auditors; |
| • | assisting the board of directors in evaluating the qualifications, performance and independence of our independent auditors; |
| • | assisting the board of directors in monitoring the quality and integrity of our financial statements and our accounting and financial reporting; |
| • | assisting the board of directors in monitoring our compliance with legal and regulatory requirements; |
| • | reviewing the adequacy and effectiveness of our internal control over financial reporting processes; |
| • | assisting the board of directors in monitoring the performance of our internal audit function; |
| • | monitoring the performance of our internal audit function; |
| • | reviewing with management and our independent auditors our annual and quarterly financial statements; |
| • | establishing procedures for the receipt, retention and treatment of complaints received by us regarding accounting, internal accounting controls or auditing matters and the confidential, anonymous submission by our employees of concerns regarding questionable accounting or auditing matters; and |
| • | preparing the audit committee report that the rules and regulations of the SEC require to be included in our annual proxy statement. |
72
Table of Contents
The SEC rules and NYSE rules require us to have one independent audit committee member upon the listing of our ordinary shares on the NYSE, a majority of independent directors within 90 days of the effective date of the registration statement and all independent audit committee members within one year of the effective date of the registration statement. The board has affirmatively determined that Mr. Klebe and Mrs. Ovelmen qualify as independent directors under the NYSE listing standards and the independence standards of Rule 10A-3 of the Exchange Act. In addition, our board of directors has determined that each of Mr. Klebe and Mrs. Ovelmen is an audit committee financial expert within the meaning of Item 407(d) of Regulation S-K under the Securities Act.
Compensation Committee
Our compensation committee consists of Mr. Simpkins, and Ms. Kahr, with Mr. Simpkins serving as chair. The compensation committee is responsible for, among other things:
| • | reviewing and approving corporate goals and objectives relevant to the compensation of our CEO, evaluating our CEO’s performance in light of those goals and objectives, and, either as a committee or together with the other independent directors (as directed by the board of directors), determining and approving our CEO’s compensation level based on such evaluation; |
| • | reviewing and approving, or making recommendations to the board of directors with respect to, the compensation of our other executive officers, including annual base salary, bonus and equity-based incentives and other benefits; |
| • | reviewing and recommending the compensation of our directors; |
| • | reviewing and discussing annually with management our “Compensation Discussion and Analysis” disclosure required by SEC rules; |
| • | preparing the compensation committee report required by the SEC to be included in our annual proxy statement; and |
| • | reviewing and making recommendations with respect to our equity compensation plans. |
Nominating and Corporate Governance Committee
Our nominating and corporate governance committee consists of Mr. Simpkins and Ms. Kahr, with Mr. Simpkins serving as chair. The nominating and corporate governance committee is responsible for, among other things:
| • | assisting our board of directors in identifying prospective director nominees and recommending nominees to the board of directors; |
| • | overseeing the evaluation of the board of directors and management; |
| • | reviewing developments in corporate governance practices and developing and recommending a set of corporate governance guidelines; and |
| • | recommending members for each committee of our board of directors. |
Code of Ethics
We maintain a Code of Business Conduct and Ethics that applies to all of our officers, directors and employees, including our principal executive officer, principal financial officer, principal accounting officer and controller, or persons performing similar functions, which is posted on our website. Our Code of Business Conduct and Ethics is a “code of ethics,” as defined in Item 406(b) of Regulation S-K. We will make any legally required disclosures regarding amendments to, or waivers of, provisions of our code of ethics on our website. The information contained on, or accessible from, our website is not part of this annual report by reference or otherwise.
73
Table of Contents
Section 16(a) Beneficial Ownership Reporting Compliance
Section 16(a) of the Exchange Act requires a company’s executive officers, directors, principal accounting officer and persons who beneficially own more than 10% of the company’s common stock (the “Reporting Persons”), to file with the SEC and the NYSE initial reports of ownership and reports of changes in beneficial ownership. Such Reporting Persons are required by SEC regulations to furnish us with copies of all Section 16(a) forms they file.
Due to the timing of our IPO and when the Reporting Persons became subject to the reporting requirements of Section 16(a) in January 2018, none of the Reporting Persons was subject to Section 16(a) during the year ended December 30, 2017.
Item 11. EXECUTIVE COMPENSATION
The share and option information with respect to Omaha Topco in this “Executive and Director Compensation” section has not been adjusted to give effect to the pre-IPO reorganization transactions.
Compensation Discussion and Analysis
This section contains a discussion of the material elements of compensation awarded to, earned by or paid to our Chief Executive Officer, our Chief Financial Officer and our three other most highly compensated executive officers serving in such capacities as of December 30, 2017 (collectively referred to as our “Named Executive Officers”) who are listed below:
| Name |
Title | |
| Ivo Jurek | Chief Executive Officer | |
| David Naemura | Chief Financial Officer | |
| Walter Lifsey | Chief Operating Officer | |
| Roger Gaston | Executive Vice President, Human Resources | |
| Jamey Seely(1) | Executive Vice President, General Counsel and Corporate Secretary | |
| Rasmani Bhattacharya(2) | Former Executive Vice President and General Counsel |
| (1) | Ms. Seely joined the Company in September 2017. |
| (2) | Ms. Bhattacharya left the Company in July 2017. |
Prior to the IPO, executive compensation and related decisions were made by the Board of Directors of Omaha Topco. In connection with the IPO, our Board of Directors established a compensation committee that has assumed responsibility for establishing, maintaining and administering our compensation and benefit policies. Except where the context requires otherwise, the terms “Board” or “Board of Directors” as used in this “Executive and Director Compensation” section refer to the Board of Directors of Omaha Topco.
Transition of Our Executive Compensation Programs
Our compensation approach is tied to our stage of development. Prior to the IPO, we were a privately-held company. As a result, we were not subject to any stock exchange listing or SEC rules related to Board and compensation committee structure and function. Prior to Blackstone’s acquisition of Gates in July 2014, executive compensation practices were tied to immediate business needs relating to hiring and retaining talent and did not tie specifically to market pay practices. Gates’ ownership change in 2014 brought leadership changes as well. As new executives were brought into the organization, compensation decisions took a more market-based pay approach. In 2016, with the Board’s approval, we engaged Aon Hewitt, an independent compensation consulting firm (the “Consultant”), to provide executive compensation consulting services to help align executive pay with market practices for 2017 executive pay decisions and to advise on executive and director compensation in connection with our IPO. The services provided by the Consultant are described more fully in the section entitled “Role of the Independent Compensation Consultant” below.
74
Table of Contents
As our executive compensation program evolves as a public company, it will reflect the belief that the amount earned by our executives must significantly depend on achieving rigorous company and individual performance objectives designed to enhance shareholder value. We have made and intend to continue to make changes to our executive compensation programs with the goal of aligning our programs with our executive compensation philosophy as a public company. Accordingly, the compensation paid to our Named Executive Officers for Fiscal 2017, and the form and manner in which it was paid, is not necessarily indicative of how we will compensate our Named Executive Officers in the future.
The material elements of our executive compensation programs include base salary, an annual, short-term incentive plan that is tied, in part, to company financial performance, long-term incentive opportunities, broad-based employee benefits, limited perquisites and severance coverage, all of which are described below. Key features of these programs include:
| • | no incentive funding when Company performance does not meet threshold requirements under our annual short-term incentive plan; and |
| • | no excise tax gross-ups nor any other tax gross-ups except in the event of relocation. |
We anticipate that we will continue to review our executive compensation programs following the IPO and make such changes as are determined to be necessary or appropriate for our status as a public company. As we gain experience as a public company, we expect that the specific direction, emphasis and components of our executive compensation program will continue to evolve. For more information on changes to our executive compensation program that were made in connection with our IPO, see “Actions Taken in Connection with the IPO” below.
Executive Compensation Philosophy and Determination Process
Compensation Philosophy. Our philosophy is to offer an executive compensation program that will enable us to attract, motivate, reward and retain high-caliber executives who are capable of creating and sustaining value for our shareholders over the long term. In addition, the executive compensation program is designed to provide a fair and competitive compensation opportunity that appropriately rewards executives for their contributions to our success. We also believe that a significant portion of each executive’s compensation should be “at risk” and tied to overall Company and individual performance. As described below, we believe that each element of our executive compensation program aligns with this philosophy.
Role of Board and Management. Our Board has historically taken into account multiple factors, such as considering the responsibilities, performance, contributions and experience of each Named Executive Officer and compensation in relation to other employees and other equivalent roles.
In addition, the Board takes into account our Chief Executive Officer’s judgment and knowledge of our industry when considering recommendations for executive officer compensation. Our Chief Executive Officer annually reviews each executive officer’s and Named Executive Officer’s performance with the Board and recommends an appropriate base salary, annual incentive target opportunity and annual incentive payout and, if applicable, grant of long-term equity incentive award. Based upon the recommendations of our Chief Executive Officer and the other considerations described below and in consideration of the executive compensation philosophy described above, the Board approves the annual compensation packages of our executive officers other than our Chief Executive Officer.
The Board annually reviews our Chief Executive Officer’s performance, base salary, annual incentive target opportunity and outstanding long-term incentive awards and approves any changes to the Chief Executive Officer’s compensation package in light of such review. Our Chief Executive Officer does not participate in deliberations regarding his own compensation.
Role of the Independent Compensation Consultant. As described above, we retained the Consultant to support the oversight and management of our executive compensation program. In late 2016, we compared total direct compensation against market data provided by the Consultant and used it as a reference point to provide a framework for Fiscal 2017 executive compensation decisions.
75
Table of Contents
In Fiscal 2017, in connection with our IPO, the Consultant performed a variety of work, including but not limited to: assisting in the development of a market-based director compensation program, conducting a review of the competitiveness of our executive compensation program, re-evaluating our executive severance and change-in-control benefit programs, and evaluating a post-IPO long-term equity incentive award program and strategy. See “Change in Control and Severance Benefits” and “Actions Taken in Connection with the IPO” below for additional details on the adoption of our new Executive Severance Plan and Executive Change in Control Plan and executive compensation adjustments made in connection with the IPO. To assist the compensation committee in its review and evaluation of each of these areas, the Consultant provided the Board with data from a peer group composed of the following 15 companies:
Peer Group
| Actuant Corporation | Flowserve Corporation | Nordson Corporation | ||
| AMTEK, Inc. | Franklin Electric Co., Inc. | Regal Beloit Corporation | ||
| Colfax Corporation | Graco, Inc. | Rexnord Corporation | ||
| Donaldson Company, Inc. | IDEX Corporation | SPX Corporation | ||
| EnPro Industries, Inc. | Lincoln Electric Holdings | The Timken Company |
The peer group was developed with assistance from the Consultant based on the following factors:
| • | publicly-traded companies within similar GICS code classifications; |
| • | peer companies used by the potential peer companies within the similar GICS codes; |
| • | management and Board recommendations; |
| • | companies with annual revenues of approximately 0.4x to 3x Gates’ annual revenues; and |
| • | companies with enterprise values of approximately 0.2x to 5x Gates’ expected total enterprise value. |
Compensation Committee Interlocks and Insider Participation
During the last completed fiscal year, we did not have a compensation committee. Decisions regarding the compensation of our executive officers have historically been made by the board. Mr. Jurek, who is our Chief Executive Officer, generally participates in discussions and deliberations of the board regarding executive compensation, including during the last completed fiscal year. Other than Mr. Jurek, no member of the board was at any time during the last completed fiscal year, or at any other time, one of our officers or employees. None of our executive officers currently serves, or has served during the last completed fiscal year, as a member of the board of directors or compensation committee (or other committee performing equivalent functions) of any entity that has one or more of its executive officers serving on the board. We are party to certain transactions with affiliates of our Sponsor described in “Certain Relationships and Related Person Transactions.”
What We Pay and Why: Elements of Compensation
Our executive compensation programs are designed to recognize an executive’s scope of responsibilities, leadership ability and effectiveness in achieving key performance goals and objectives. As an executive’s level of responsibility within Gates increases, so does the percentage of total compensation that is linked to performance in the form of variable compensation. We also provide various retirement and benefit programs and modest, business-related benefits as discussed below.
Base Salary. Base salaries for our Named Executive Officers in 2017 were determined by the Board after consideration of: (1) the Chief Executive Officer’s recommendations (for all Named Executive Officers other than the Chief Executive Officer); (2) breadth, scope and complexity of the executive’s role; (3) internal equity; (4) current compensation; (5) tenure in position and prior tenure in related roles (excepting Gates); (6) market pay levels; and (7) individual performance. Base salaries are reviewed annually or at other times when appropriate and may be increased from time to time pursuant to such review. During Fiscal 2017, to reward performance as well as to better align their compensation to the market, we adjusted the base salary of Mr. Lifsey (from $522,500 to $548,625) and Mr. Gaston (from $370,000 to $385,000). Mr. Naemura had his total target cash compensation pay
76
Table of Contents
mix adjusted to align with current market practices and, as a result, his base salary was adjusted effective March 2017 from $512,500 to $595,000. Ms. Bhattacharya’s base salary was not increased in 2017. Ms. Seely was hired in September 2017 at a base salary of $425,000. Mr. Jurek’s base salary of $900,000 has not been adjusted since he commenced employment in May 2015. The Summary Compensation Table below shows the base salary earned by each Named Executive Officer during Fiscal 2017.
Annual Incentive Plan. We provide an annual incentive opportunity under the Gates Global Bonus Plan (the “Annual Plan”) to (1) reward certain employees, including our Named Executive Officers, for achieving specific performance goals that would advance our profitability; (2) drive key business results; and (3) recognize individuals based on their contributions to those results.
Payouts under the 2017 Annual Plan were based on a combination of the achievement of our financial performance goals in the fiscal year (the “Gates Financial Performance Factor”), which fund the Annual Plan, and the Named Executive Officer’s performance during the fiscal year against his or her individual performance goals (the “Individual Performance Factor”).
Gates Financial Performance Factor. The Gates Financial Performance Factor sets the funding levels for the Annual Plan. The Board, after an evaluation of possible financial performance measures, determined to continue to use Adjusted EBITDA (50%) and Operating Cash Flow (30%) as well as Revenue (20%) as the financial performance measures for 2017. Revenue was included as a performance measure in 2017 to encourage profitable revenue growth. The Board determined that these financial performance measures were critical indicators of our performance for 2017 and, when combined, contributed to sustainable growth. Financial performance for these measures was determined 100% at a company-wide level. The Annual Plan financial performance measures are described below.
| Performance Measure | Definitions | |
| Adjusted EBITDA (50%) | Adjusted EBITDA under the Annual Plan is defined in substantially the same manner as described in “Item 7. Management’s Discussion and Analysis of Financial Condition and Results of Operations—Non-GAAP Measures,” except it does not reflect certain adjustments, primarily Sponsor fees, that are not adjusted for under the terms of the Annual Plan. | |
| Operating Cash Flow (30%) | Calculated as Adjusted EBITDA (as defined for purposes of the Annual Plan as described immediately above), less capital expenditures, plus or minus the change in average trade working capital. | |
| Revenue (20%) | Revenue under the Annual Plan is defined as consolidated revenue as reflected in our financial statements. | |
The achievement factor for each of the financial performance measures will be determined by multiplying the weight attributed to each performance measure by the applicable payout percentage for each measure. For each of the performance measures, payout percentages will be determined by calculating actual achievement against the target goal based on a pre-established scale. Funding attainment with respect to these performance measures can range from:
| • | no funding for performance below the threshold requirement level; |
| • | 50% of target incentive for achieving 95% of the target performance requirement; and |
| • | 150% of target incentive for achieving 105% of the target performance requirement. |
If achievement with respect to any performance measure falls between the threshold and target, or between the target and maximum, earned award amounts for that particular performance measure will be interpolated on a straight-line mathematical basis (and rounded to the nearest whole number). If achievement with respect to any performance measure does not reach threshold, then that measure will be deemed to have 0% attainment.
77
Table of Contents
The following table outlines the calculation of the funding attainment based on the pre-established scale associated with our actual results against the targets and the resulting weighted and combined achievement factors.
| Measure |
Weighting | Target ($ in millions) |
Actual ($ in millions) |
2017 Payout Percentage (% of Target) |
2017 Achievement Factor (%) |
2017 Weighted Achievement Factor (%) |
||||||||||||||||||
| Adjusted EBITDA |
50 | % | $ | 612.9 | $ | 662.4 | 181 | % | 150 | % | 75 | % | ||||||||||||
| Operating Cash Flow |
30 | % | $ | 509.6 | $ | 564.4 | 208 | % | 150 | % | 45 | % | ||||||||||||
| Revenue |
20 | % | $ | 2,781.8 | $ | 3,008.3 | 181 | % | 150 | % | 30 | % | ||||||||||||
| Attainment |
— | — | — | — | — | 150 | % | |||||||||||||||||
Notwithstanding the establishment of the performance components and the formula for determining the funding levels as described above, the compensation committee has the ability to exercise positive or negative discretion and award a greater or lesser amount to fund the Annual Plan than the amount determined by the above formula if, in the exercise of its business judgment, the compensation committee determines that a greater or lesser amount is warranted under the circumstances. The compensation committee did not exercise this discretion with respect to the 2017 Annual Plan bonuses.
After the Gates Financial Performance Factor is calculated and the “pool” is set to fund bonus payouts, our Chief Executive Officer has the discretion to determine how that pool is allocated throughout the organization (excluding with respect to himself). This is done by adjusting the Gates Financial Performance Factor either upward or downward for each functional area or geographic region based on the performance of that specific region or functional area. For Fiscal 2017, our Chief Executive Officer did not exercise his discretion to adjust the Gates Financial Performance Factor for any of the functional areas applicable to the other Named Executive Officers.
Individual Performance Factor. Each Named Executive Officer’s Individual Performance Factor was determined based on both financial and non-financial objectives appropriate for each Named Executive Officer’s position. For 2017, we selected the following individual performance goals for each of our Named Executive Officers:
| • | Operational Excellence: Improvements in operational efficiency/productivity. |
| • | Building Organizational Capacity: Increasing talent pipeline within the organization; attracting and developing talent and growing organizational capacity. |
| • | Financial Goals: Achieving our annual financial plan. |
Actual amounts paid under the Annual Plan were calculated by multiplying each Named Executive Officer’s base salary in effect on December 30, 2017 (or, with respect to Ms. Bhattacharya, her base salary in effect on the date of her termination of employment) by (i) his or her Annual Plan target bonus opportunity (which is reflected as a percentage of base salary), (ii) the final Gates Financial Performance Factor and (iii) the Individual Performance Factor (other than with respect to Ms. Bhattacharya). There is no maximum on the discretionary components of the Annual Plan. The following table illustrates the calculation of the annual cash incentive awards payable to each of our Named Executive Officers under the 2017 Annual Plan based on 2017 financial performance and individual performance.
78
Table of Contents
| Name |
Base Salary ($) |
Target Bonus (% of Base Salary) |
Target Bonus Opportunity ($) |
Combined Performance Factor (%)* |
Actual Payout ($) |
|||||||||||||||
| I. Jurek |
$ | 900,000 | 150 | % | $ | 1,350,000 | 150 | % | $ | 2,025,000 | ||||||||||
| D. Naemura |
$ | 595,000 | 115 | % | $ | 684,250 | 150 | % | $ | 1,026,375 | ||||||||||
| J. Seely(1) |
$ | 425,000 | 70 | % | $ | 99,068 | 150 | % | $ | 148,601 | ||||||||||
| W. Lifsey |
$ | 548,625 | 100 | % | $ | 548,625 | 150 | % | $ | 822,938 | ||||||||||
| R. Gaston |
$ | 385,000 | 60 | % | $ | 231,000 | 150 | % | $ | 346,500 | ||||||||||
| R.Bhattacharya(2) |
$ | 350,000 | 136 | % | $ | 238,000 | 150 | % | $ | 357,000 | ||||||||||
| * | The final percentage after applying the Gates Financial Performance Factor and the Individual Performance Factor. |
| (1) | The Target Bonus Opportunity and Actual Payout amounts reported for Ms. Seely represent a pro-rated 2017 Annual Plan bonus based on her September 2017 start date. |
| (2) | The Target Bonus Opportunity and Actual Payout amounts reported for Ms. Bhattacharya represent a pro-rated 2017 Annual Plan bonus based on our actual performance in connection with her termination of employment and pursuant to the terms of her employment agreement. |
Sign-on and Discretionary Bonuses. From time to time, we may award sign-on and discretionary bonuses. Sign-on bonuses are used only when necessary to attract highly skilled officers to the Company. Generally they are used to incentivize candidates to leave their current employers, or may be used to offset the loss of unvested compensation they may forfeit as a result of leaving their current employers. Ms. Seely was provided with an $180,000 guaranteed sign-on bonus in 2017 in connection with the commencement of her employment that is payable at the same time as the 2017 Annual Plan payments. In connection with Mr. Naemura’s total target cash compensation pay mix realignment, Mr. Naemura received a one-time special cash bonus of $22,212 in order to address the fact that his target bonus annual opportunity was reduced effective January 1, 2017 and contemplated a full-year base salary at his increased base salary amount, but his actual base salary adjustment was not effective until March 2017.
Long-Term Incentive. We believe that our Named Executive Officers’ long-term compensation should be directly linked to the value we deliver to stockholders. Equity awards to our Named Executive Officers are designed to provide long-term incentive opportunities over a period of several years. We granted executive awards under the 2014 Omaha Topco Ltd. Stock Incentive Plan, which was assumed by Gates Industrial Corporation plc and renamed the Gates Industrial Corporation plc Stock Incentive Plan in connection with the pre-IPO reorganization (the “2014 Incentive Plan”), permitting our Named Executive Officers to obtain shares in Omaha Topco. Stock options have been our preferred equity award because the stock options will not have any value unless the underlying shares of common stock appreciate in value following the grant date. Accordingly, awarding stock options causes more compensation to be “at risk” and further aligns our executive compensation with our long-term profitability and the creation of shareholder value.
Historically, grants have not been made on an annual basis, and instead are made upon an executive’s commencement of employment with us, when an executive receives a promotion into a more senior-level position or to reward performance. The amounts of each Named Executive Officer’s stock option grant were determined based on several factors, including: (1) each Named Executive Officer’s position and expected contribution to our future growth; (2) dilution effects on stockholders and the need to maintain the availability of an appropriate number of shares for stock option awards to non-executive employees; and (3) ensuring that our Named Executive Officers were provided with appropriate and competitive total long-term equity compensation.
The stock options have four equally-weighted tiers. Tier I is subject to a five-year pro rata vesting schedule, and the remaining tiers are subject to vesting upon Blackstone’s achievement of specified internal rates of return or multiple of investment targets. Vesting of Tier I may accelerate upon specified events, and, for grants awarded prior to May 2017, vesting of Tiers II – IV may continue past separation of service upon specified events. For more information regarding the stock options, including the vesting criteria, see the section entitled “Narrative Disclosure Relating to the Summary Compensation Table and the Grants of Plan-Based Awards Table” below.
Another key component of our long-term equity incentive program is that our Named Executive Officers and other eligible employees have been provided with the opportunity to invest in Omaha Topco’s common stock. We considered this investment opportunity an important part of our equity program because it encouraged stock ownership and aligned the investing Named Executive Officers’ financial interests with those of Omaha Topco’s stockholders. As of the date of the IPO, Mr. Jurek invested in 195,455 shares; Mr. Naemura invested in 36,365
79
Table of Contents
shares; and Mr. Gaston invested in 18,182 shares. In connection with Ms. Bhattacharya’s departure, her purchased shares were repurchased by Omaha Topco on July 11, 2017 for a purchase price of $180,000, pursuant to the terms of her subscription agreement.
Fiscal 2017 Grants. Messrs. Jurek and Gaston were awarded stock option grants under the 2014 Incentive Plan on May 2, 2017 to reward performance as well as to better align their compensation to the market in the amount of 710,400 and 276,100 stock options respectively. The terms and conditions of these Fiscal 2017 awards were the same as their respective 2016 awards, except that a specified portion of Tiers II – IV will not continue to vest past separation of service upon specified events. Ms. Seely commenced employment as our Executive Vice President and General Counsel on September 5, 2017 and was granted 550,000 stock options under the 2014 Incentive Plan on September 19, 2017. The terms and conditions of Ms. Seely’s option are substantially the same as Mr. Gaston’s 2017 stock option award. No other long-term equity incentive awards were granted to the Named Executive Officers in Fiscal 2017. See “Equity-Based Awards” below for additional details.
Post-IPO Long-Term Incentive Plan. In connection with the IPO, we adopted the Gates Industrial Corporation plc 2018 Omnibus Incentive Plan (the “2018 Omnibus Incentive Plan”), a new market-based long-term incentive program to align our executive compensation package with similarly situated public companies. See “Actions Taken in Connection with the IPO—New Long-Term Incentive Program” below for additional details.
Other Aspects of Our Compensation Programs
Retirement Benefits. We offer the following retirement benefits to eligible U.S.-based employees, including our Named Executive Officers, as specified below. Additional details about the Gates Corporation Supplemental Retirement Plan (the “Supplemental Retirement Plan”), as it applies to our Named Executive Officers, is included in the “2017 Nonqualified Deferred Compensation” section of this annual report.
| Plan | Description | |
| Gates MatchMaker 401(k) Plan | A qualified defined contribution retirement benefit available to eligible U.S. Employees (as defined in the plan document) that is intended to qualify as a profit sharing plan under Section 401(k) of the Code. | |
| Supplemental Retirement Plan | An unfunded, nonqualified plan that provides our executives, including our Named Executive Officers, benefits similar to the Gates MatchMaker 401(k) Plan but without the Code contribution and earnings limitations. | |
We offer a defined contribution retirement benefit to all eligible Gates participants through the Gates MatchMaker 401(k) Plan. The Gates MatchMaker 401(k) Plan provides employees with individual retirement accounts funded by (1) an automatic Gates-paid contribution of 3% of employee eligible earnings, and (2) a Gates-paid match on employee contributions dollar-for-dollar on the first 3% of eligible earnings that the employee contributes. The Code limits employee contributions to the Gates MatchMaker 401(k) Plan to $18,000 ($24,000 for participants over age 50), and earnings upon which employee/employer contributions may be made are limited to $270,000 in 2017.
We currently offer participation in the Supplemental Retirement Plan to specified employees that include the Named Executive Officers. This plan is a nonqualified deferred compensation plan that provides participants with two benefit opportunities:
| 1. | Non elective employer contribution. A 6% employer contribution (the “Retirement Contribution”) on eligible earnings that exceed Section 401(a)(17) of the Code’s dollar limits. |
| 2. | Compensation Deferral Opportunity. In June 2017, we amended the Supplemental Retirement Plan to permit participants to defer up to 80% of base salary (beginning in January 2018) and 80% of bonus compensation (beginning with the 2017 Annual Plan payouts). There is no employer paid matching contribution on these deferrals. |
These deferrals are in addition to amounts participants may defer in the Gates MatchMaker 401(k) Plan.
80
Table of Contents
Also in June 2017, a Rabbi trust to hold plan assets was established. Additional details about the Supplemental Retirement Plan, as it applies to the Named Executive Officers, are included in the “2017 Nonqualified Deferred Compensation” section of this annual report.
Other Benefits. We provide other benefits to the Named Executive Officers that we believe are necessary to compete for executive talent. The additional benefits for the Named Executive Officers generally consist of a car allowance (which has been phased out for newly hired executives and will be phased out entirely in 2018 for existing participants), a parking subsidy and an executive annual physical examination. Tax gross-ups are provided to our executive officers, including the Named Executive Officers, for certain relocation benefits. The specific amounts attributable to the 2017 other benefits provided to the Named Executive Officers are set forth in the “All Other Compensation” column of the Summary Compensation Table of this annual report.
We also provide other benefits such as medical, dental and short-term disability coverage to each Named Executive Officer, which are identical to the benefits provided to all other eligible U.S.-based employees. Our executive officers, including our Named Executive Officers, also receive enhanced benefits that are not available to other employees, such as relocation assistance, and, effective January 1, 2017, enhanced life, accidental death and dismemberment (“AD&D”) and long-term disability insurance benefits. Specifically, all Named Executive Officers were eligible for enhanced life and AD&D insurance benefits in the following amounts in 2017: 3x base salary up to $2,000,000 (for Messrs Gaston, Naemura and Lifsey and Mses. Seely and Bhattacharya), and 3x base salary up to $3,000,000 (for Mr. Jurek). In addition, all Named Executive Officers were eligible for enhanced long-term disability insurance benefits of 66.7% of their salary. We provide vacation and paid holidays to all employees, including the Named Executive Officers. All of the Named Executive Officers were eligible for four weeks of vacation in 2017 except Mr. Gaston, who was eligible for two weeks of vacation.
Change in Control and Severance Benefits. The Board believes that the Named Executive Officers are better able to perform their duties with respect to any potential proposed corporate transaction without concern for the impact of the transaction on their individual employment with carefully structured change-in-control and severance benefits. In addition, the Board believes that the interests of our stockholders are better protected and enhanced by providing greater certainty regarding executive pay obligations in the context of planning and negotiating any potential corporate transactions. We provide limited single-trigger change-in-control benefits to certain of our Named Executive Officers in their equity grant agreements and pursuant to the Supplemental Retirement Plan.
In connection with the IPO, we developed a new market-competitive Executive Severance Plan and Executive Change in Control Plan. Pursuant to the participation agreements executed by our currently employed Named Executive Officers in connection with the Executive Severance Plan and Change in Control Plan, each of Messrs. Jurek, Naemura and Lifsey agreed to terminate their existing employment agreements with us. Accordingly, the Executive Severance Plan and Change in Control Plan replaces the severance benefits provided under the predecessor Gates Corporation Severance Plan to Mr. Gaston and Ms. Seely and under the employment agreements entered into with Messrs. Jurek, Naemura and Lifsey. Additional details about the Executive Severance Plan and the Executive Change in Control Plan, as it applies to the Named Executive Officers, are included below in the “Actions Taken in Connection with the IPO” section of this annual report.
Departure of Ms. Bhattacharya
Ms. Bhattacharya’s employment terminated in July 2017. Her departure constituted a termination without “cause” pursuant to the terms of her employment agreement entitling her to the severance benefits described therein. See “Potential Payments upon a Termination or Change in Control—Departure of Ms. Bhattacharya” for further details regarding Ms. Bhattacharya’s departure.
Employment Agreements. Upon their commencement of employment, Messrs. Jurek, Naemura and Lifsey and Ms. Bhattacharya entered into employment agreements that contained substantially similar terms. Each of the employment agreements provided for a five-year initial employment term that extended automatically for additional one-year periods unless either we or the executive elected not to extend the term. Under the employment agreements, each executive was eligible to receive a minimum base salary, as set forth in the applicable agreement, and annual cash incentive compensation opportunity based on the achievement of specified financial and individual
81
Table of Contents
goals as defined by the Board each year. If these goals were achieved, each executive was eligible to receive a cash bonus. Each Named Executive Officer was also entitled to participate in all employee benefit plans, programs and arrangements made available to other executive officers generally, except that severance benefits were specifically incorporated into the employment agreement. As discussed above, in connection with the adoption of the Executive Severance Plan and the Executive Change in Control Plan, each of Messrs. Jurek, Naemura and Lifsey agreed to terminate their existing employment agreements with us. For more information regarding the employment agreements, please see the “Narrative Disclosure to Summary Compensation Table and Grants of Plan-Based Awards Table” of this annual report.
Other Compensation Practices. In anticipation of becoming a public reporting company, we are in the process of adopting practices that we believe are important components of a public-company executive compensation program, which are generally described below.
Section 162(m). In general, Section 162(m) of the Code (“Section 162(m)”) denies a publicly-held corporation a deduction for U.S. federal income tax purposes for compensation in excess of $1 million per year per person to the executives designated in Section 162(m), including, but not limited to, its chief executive officer, chief financial officer, and the next three most highly compensated executives of such corporation whose compensation is required to be disclosed in its proxy statement. Following our IPO, we may be able to claim the benefit of a special exemption rule that applies to compensation paid (or compensation in respect of equity awards such as stock options or restricted stock granted) during a specified transition period. This transition period may extend until the first annual stockholder meeting held in 2022, unless the transition period is terminated earlier under the post-offering transition rules set forth in Section 162(m).
Accounting for Stock-Based Compensation. We follow FASB ASC Topic 718 (“ASC Topic 718”) for our stock-based compensation awards. ASC Topic 718 requires companies to measure the compensation expense for all share-based payment awards made to employees and directors, including stock options, based on the grant date “fair value” of these awards. This calculation is performed for accounting purposes and reported in the compensation tables below, even though our executive officers may never realize any value from their awards. ASC Topic 718 also requires companies to recognize the compensation cost of their stock-based compensation awards in their income statements over the period that an executive officer is required to render service in exchange for the option or other award.
Actions Taken in Connection with the IPO
Assumption of Existing Plans and Awards. In connection with the IPO, the existing Omaha Topco plans were assumed by Gates Industrial Corporation plc pursuant to the pre-IPO reorganization transactions. In connection with such assumption, (i) Omaha Topco options were converted into Gates Industrial Corporation plc options that (x) reflect an exchange ratio of 0.76293 Gates Industrial Corporation plc ordinary shares for each outstanding Omaha Topco share and (y) have exercise prices that were adjusted to ensure that the options received are of equivalent economic value to the legacy Omaha Topco options and (ii) Omaha Topco restricted stock units were converted into Gates Industrial Corporation plc restricted stock units that reflect an exchange ratio of 0.76293 Gates Industrial Corporation plc ordinary shares for each outstanding Omaha Topco share. In addition, directors and executive officers who held shares of Omaha Topco, like other equity owners of Omaha Topco, received depositary receipts representing ordinary shares of Gates Industrial Corporation plc at the same ratio of 0.76293 Gates Industrial Corporation plc ordinary shares for each outstanding share of Omaha Topco.
Compensation Adjustments. As noted above, in Fiscal 2017, with the assistance of the Consultant, we conducted a review of the competitiveness of our executive compensation program. Specifically, we reviewed market data provided by the Consultant consisting of both our peer group data and data from the Aon Hewitt 2016 Total Compensation Measurement Database® (TCM) (all manufacturing companies with revenues ranging from $1.5 to $6.0 billion). In order to meet our goal of generally setting total target annual cash compensation (i.e., base salary plus target bonus) for our executive officers between the 50th and the 75th percentile of the market data, we determined it was appropriate to increase the base salaries for Messrs. Jurek, Lifsey and Gaston, effective January 1, 2018, as follows: Mr. Jurek (from $900,000 to $945,000), Mr. Lifsey (from $548,625 to $610,000) and Mr. Gaston (from $385,000 to $400,000). Mr. Jurek’s base salary increase also reflects a one-time salary adjustment that was provided to offset the elimination of automobile allowances beginning in 2018. Effective January 1, 2018,
82
Table of Contents
Mr. Nameura also received a similar one-time salary adjustment (from $595,000 to $610,000). In addition, Mr. Gaston’s 2018 Annual Plan target opportunity was increased from 60% to 70% of base salary in order to further align his target annual cash compensation with the targeted range of the market data.
New Long-Term Incentive Program. In connection with the IPO, we approved the 2018 Omnibus Incentive Plan, under which we intend to provide awards of a mix of performance shares, time-based stock options and time-based restricted shares. This long-term equity incentive program is informed by the peer group and broader public company practice and is consistent with our compensation objective of providing a long-term equity incentive opportunity that aligns compensation with the creation of stockholder value and achievement of business goals.
Executive Severance Plan and Executive Change in Control Plan. As noted above, in Fiscal 2017, with the assistance of the Consultant, we re-evaluated our executive severance and change-in-control benefit programs. Specifically, we reviewed both peer group and broader U.S. market data provided by the Consultant. As a result of this review, together with recommendations from the Consultant, we developed a new market-competitive Executive Severance Plan and Executive Change in Control Plan, which became effective in connection with the IPO. Pursuant to the participation agreements executed by our currently employed Named Executive Officers in connection with the Executive Severance Plan and Change in Control Plan, each of Messrs. Jurek, Naemura and Lifsey agreed to terminate their existing employment agreements with us. Accordingly, the Executive Severance Plan and Change in Control Plan replaces the severance benefits provided under the predecessor Gates Corporation Severance Plan to Mr. Gaston and Ms. Seely and under the employment agreements entered into with Messrs. Jurek, Naemura and Lifsey.
The Executive Severance Plan provides for severance payments upon certain terminations of employment to our currently employed Named Executive Officers and other senior executives who are expected to make substantial contributions to our success and thereby provides for stability and continuity of operations. The Named Executive Officers are generally provided with severance payments for a period of two years for Mr. Jurek (who will receive the sum of two times base salary plus two times previous year bonus), one year for Mr. Naemura (who will receive the sum of one times base salary plus one times previous year bonus) and two years for the other Named Executive Officers (who will receive two times base salary) should his or her employment be terminated either by us without “cause” or by the executive for “constructive termination.” The Executive Severance Plan also provides for reimbursement for reasonable outplacement and provides health and dental benefit continuation assistance.
The Executive Change in Control Plan provides double-trigger benefits to Mr. Jurek and all of our executive vice presidents (including each of the Named Executive Officers (other than Ms. Bhattacharya)), regional presidents and select senior vice presidents. The Executive Change in Control Plan serves to encourage these key executives to carry out their duties and provide continuity of management in the event of a “change in control” of Gates. The Named Executive Officers are generally provided with payments in the amount of two and one-half times base salary plus target bonus (for Mr. Jurek) and one and one-half times base salary plus target bonus (for the other participating Named Executive Officers) should his or her employment be terminated either by us without “cause” or by the executive for “constructive termination” within the two-year period following a change in control. The Executive Change in Control Plan also provides for reimbursement for reasonable outplacement and provides life and long-term disability insurance and health and dental benefit continuation assistance.
The benefits provided under both the Executive Severance Plan and the Executive Change in Control Plan are contingent upon the affected Named Executive Officer’s execution and non-revocation of a general release of claims and compliance with specified restrictive covenants. See “Potential Payments upon a Termination or Change in Control,” which describes the payments to which each of the Named Executive Officers may be entitled under the Executive Severance Plan and the Executive Change in Control Plan.
Clawback Policy. We have adopted a clawback policy for incentive compensation. The Compensation Committee determined that it may be appropriate to recover annual and/or long-term incentive compensation in specified situations. Under the policy, if the Compensation Committee determines that incentive compensation of its current and former Section 16 officers (or any other current and former employee designated by the Board or the Compensation Committee) was overpaid, in whole or in part, as a result of a restatement of the reported financial results of the Company or any of its segments due to material non-compliance with financial reporting requirements (unless due to a change in accounting policy or applicable law), and such restatement was caused or contributed,
83
Table of Contents
directly or indirectly, by such employee’s fraud, willful misconduct or gross negligence, then the Compensation Committee will determine, in its discretion, whether to seek to recover or cancel any overpayment of incentive compensation paid or awarded based on the inaccurate financial information or restated results. The clawback policy and our Omnibus Incentive Plan also provide that if a covered person engages in any detrimental activity (as defined in our Omnibus Incentive Plan) as determined by the Compensation Committee, the Compensation Committee may, in its sole discretion, provide for one or more of the following: (i) cancellation of any or all of such covered person’s outstanding awards; or (ii) forfeiture by the covered person of any gain realized on the vesting or exercise of awards, and prompt repayment of any such gain to us.
Stock Ownership Guidelines. In connection with the IPO, we adopted an executive stock ownership program for our Named Executive Officers and other executives. Each of our Named Executive Officers is expected to own our ordinary shares in the following amounts:
| Chief Executive Officer | 5 times base salary | |
| All other Named Executive Officers | 3 times base salary |
Any Named Executive Officer who does not meet the threshold will be required to retain 50% of stock acquired through the exercise or vesting of equity awards made by the Company.
Compensation Committee Report
The compensation committee has reviewed and discussed the Compensation Discussion and Analysis with management. Based on its review and discussion with management, the compensation committee recommended to the Board of Directors that the Compensation Discussion and Analysis be included in this Annual Report on Form 10-K for the fiscal year ended December 30, 2017.
Submitted by the compensation committee of our Board of Directors:
Neil P. Simpkins, Chair
Julia C. Kahr
Summary Compensation Table
The following table sets forth the compensation for the fiscal years ended December 30, 2017 and December 31, 2016 for our Named Executive Officers.
| Name and Principal Position |
Year | Salary ($)(1) |
Bonus ($)(2) |
Stock Awards ($) |
Option Awards ($)(3) |
Non-Equity Incentive Plan Compensation ($)(4) |
Change in Pension Value and Nonqualified Deferred Compensation Earnings ($) |
All Other Compensation ($)(5) |
Total ($)(6) |
|||||||||||||||||||||||||||
| Ivo Jurek, Chief Executive Officer |
2017 | $ | 900,000 | — | — | $ | 749,472 | $ | 2,025,000 | — | $ | 195,305 | $ | 3,869,777 | ||||||||||||||||||||||
| 2016 | $ | 900,000 | — | — | $ | 1,750,000 | — | $ | 128,898 | $ | 2,778,898 | |||||||||||||||||||||||||
| David Naemura, Chief Financial Officer |
2017 | $ | 572,789 | $ | 22,212 | — | — | $ | 1,026,375 | — | $ | 113,058 | $ | 1,734,434 | ||||||||||||||||||||||
| 2016 | $ | 509,135 | — | — | — | $ | 823,000 | — | $ | 56,373 | $ | 1,388,508 | ||||||||||||||||||||||||
| Jamey Seely, EVP, General Counsel and Corporate Secretary |
2017 | $ | 120,962 | $ | 180,000 | — | $ | 635,250 | $ | 148,601 | — | $ | 45,256 | $ | 1,130,069 | |||||||||||||||||||||
| Roger Gaston, EVP, Human Resources |
2017 | $ | 380,962 | — | — | $ | 291,286 | $ | 346,500 | — | $ | 52,707 | $ | 1,071,455 | ||||||||||||||||||||||
| 2016 | $ | 135,192 | — | — | $ | 296,592 | $ | 238,000 | — | $ | 470,725 | $ | 1,140,509 | |||||||||||||||||||||||
| Walt Lifsey, Chief Operating Officer |
2017 | $ | 541,592 | — | — | $ | 822,938 | — | $ | 80,795 | $ | 1,445,325 | ||||||||||||||||||||||||
| 2016 | $ | 507,885 | — | — | $ | 335,220 | $ | 627,000 | — | $ | 469,575 | $ | 1,939,680 | |||||||||||||||||||||||
| Rasmani Bhattacharya, Former EVP and General Counsel |
2017 | $ | 191,154 | — | — | $ | 357,000 | — | $ | 433,891 | $ | 982,045 | ||||||||||||||||||||||||
| 2016 | $ | 350,000 | — | — | $ | 476,000 | — | $ | 47,946 | $ | 873,946 | |||||||||||||||||||||||||
| (1) | The amounts reported in the “Salary” column consist of base salary earned in Fiscal 2017. The following base salary increases were provided during 2017: Mr. Naemura (from $512,500 to $595,000), Mr. Lifsey (from $522,500 to $548,625) and Mr. Gaston (from $370,000 to $385,000). The amount reported for Ms. Bhattacharya represents salary earned through her July 2017 departure date. The amount reported for Ms. Seely represents salary earned from her September 2017 start date. |
84
Table of Contents
| (2) | The amount reported for Mr. Naemura represents a one-time special cash bonus in order to address the fact that in connection with his total target cash compensation pay mix realignment his target bonus annual opportunity was reduced effective January 1, 2017 and contemplated a full year base salary at his increased base salary amount, but his actual base salary adjustment was not effective until March 2017. The amount reported for Ms. Seely represents her guaranteed sign-on bonus awarded in connection with the commencement of her employment, which amount is payable at the same time as the 2017 Annual Plan payments. |
| (3) | The amounts reported in the “Option Awards” column for 2017 represent the grant date fair value of the time-vesting options (Tier I) granted to Messrs. Jurek and Gaston and Ms. Seely calculated in accordance with ASC Topic 718 using a Black-Scholes valuation model. For information regarding the assumptions used in determining the fair value of these awards, please refer to Note 18, Share-Based Compensation of the audited consolidated financial statements included elsewhere in this annual report. The grant date fair value of the exit-vesting portion of the stock options (Tiers II, III and IV) was computed based upon the probable outcome of the performance conditions as of the grant date in accordance with FASB ASC Topic 718. Achievement of the performance conditions for these stock options was not deemed probable on the grant date and, accordingly, no value is included in the table for the Tier II, III or IV exit-vesting portion of the awards pursuant to the SEC’s disclosure rules. Assuming achievement of the performance conditions, the grant date fair value of Tiers II, III and IV of the awards that were granted in 2017 was: Mr. Jurek – $470,640 for Tier II, $367,632 for Tier III and $392,496 for Tier IV, Mr. Gaston – $182,916 for Tier II, $142,882 for Tier III and $152,545 for Tier IV and Ms. Seely – $490,875 for Tier II, $405,625 for Tier III and $360,250 for Tier IV. |
| (4) | The amounts reported in the “Non-Equity Incentive Plan Compensation” column for 2017 include amounts earned by Named Executive Officers (as applicable) under the Annual Plan (and paid in March 2018). The terms of the Annual Plan are described more fully above in the “What We Pay and Why: Elements of Compensation-Annual Incentive.” The amount reported for Ms. Seely represents a pro-rated 2017 Annual Plan bonus based on her September 2017 start date. In connection with her termination of employment and pursuant to the terms of her employment agreement, Ms. Bhattacharya is entitled to a pro-rata portion of her 2017 Annual Plan bonus based on our actual performance. |
| (5) | The amounts reported in the “All Other Compensation” column for 2017 reflect the sum of: (1) the amounts contributed by Gates to the Gates MatchMaker 401(k) Plan and the Supplemental Retirement Plan, which are calculated on the same basis for all participants, including the Named Executive Officers; (2) relocation benefits (where applicable); (3) limited tax gross-ups on relocation benefits; (4) severance payments for Ms. Bhattacharya and (5) the cost of all other executive benefits that are required to be reported by SEC rules. The material provisions of the Gates MatchMaker 401(k) Plan and the Supplemental Retirement Plan are described in the “2017 Nonqualified Deferred Compensation” section of this annual report. |
The narrative following the table below describes these components of All Other Compensation:
| Name | Company Contributions to Gates MatchMaker 401 (k)(a) |
Company Contributions to Gates Executive Supplemental Retirement Benefit Plan (b) |
Relocation (c) |
Tax Gross-ups (d) |
Severance (e) |
Other Benefits (f) |
Total | |||||||||||||||||||||
| I. Jurek |
$ | 16,200 | $ | 142,800 | — | — | — | $ | 36,305 | $ | 195,305 | |||||||||||||||||
| D. Naemura |
$ | 16,200 | $ | 68,880 | — | — | — | $ | 27,978 | $ | 113,058 | |||||||||||||||||
| J. Seely |
$ | 6,914 | — | $ | 23,319 | $ | 13,215 | — | $ | 1,808 | $ | 45,256 | ||||||||||||||||
| R. Gaston |
$ | 16,200 | $ | 20,938 | $ | 6,057 | $ | 2,523 | — | $ | 6,989 | $ | 52,707 | |||||||||||||||
| W. Lifsey |
$ | 16,200 | $ | 53,915 | — | — | — | $ | 10,680 | $ | 80,795 | |||||||||||||||||
| R. Bhattacharya |
$ | 16,200 | — | — | — | $ | 405,224 | $ | 12,467 | $ | 433,891 | |||||||||||||||||
| (a) | Company Contributions to Gates MatchMaker 401(k) Plan. Gates makes matching contributions on 100% up to 3% of eligible earnings deferred by all eligible participants, including Named Executive Officers, in accordance with the Gates MatchMaker 401(k) Plan. Gates also makes a retirement contribution to all eligible participants, including Named Executive Officers, in an amount equal to 3% of eligible earnings, subject to Code limitations. |
85
Table of Contents
| (b) | Company Contributions to the Supplemental Retirement Plan. Gates makes a Retirement Contribution of 6% of eligible compensation on behalf of all eligible participants, including the Named Executive Officers, under the Supplemental Retirement Plan for eligible compensation that exceeds Section 401(a)(17) of the Code. |
| (c) | Relocation. Gates provides relocation benefits to its newly hired executive officers, including Named Executive Officers, that includes home finding assistance, home purchase assistance (including reimbursement of closing costs and limited inspection fees), home sale assistance (marketing and closing cost assistance), moving household goods, and a lump sum for miscellaneous expenses of $6,500. |
| (d) | Tax Gross-Ups. Gates provides a reimbursement for taxable moving expenses. |
| (e) | Payments Upon Separation from Service. This column reflects amounts paid to Ms. Bhattacharya following her termination of employment in addition to her pro-rated 2017 Annual Plan bonus. Pursuant to the terms of her employment agreement, in Fiscal 2017, Ms. Bhattacharya received the following: $349,462 representing her severance allowance paid in 2017 (payable in bi-weekly installments over a 12 months period); a payment of $12,563 for accrued but unused vacation; 12 months of accrued post-separation medical, vision and dental coverage reimbursements of $3,200; and accrued post-separation outplacement services of $10,000. This column also reflects the $30,000 gain on Ms. Bhattacharya’s investment in our shares that were repurchased by us for $180,000 pursuant to the call rights contained in her subscription agreement. Details regarding Ms. Bhattacharya’s separation from service are further described in the “Potential Payments Upon Termination or Change in Control” section of this annual report. |
| (f) | Other Benefits. Certain additional limited benefits are made available to executives, including the Named Executive Officers. The aggregate incremental cost of these benefits is included for each Named Executive Officer in the “All Other Compensation” column of the Summary Compensation Table, but the individual values for each item are not required to be disclosed under SEC rules because none of them exceeded the greater of $25,000 or 10% of the total amount of personal benefits for each Named Executive Officer. In general, these benefits include a car allowance provided to Messrs. Jurek and Naemura and to Ms. Bhattacharya (which has been phased out for new executive officers and will be phased out for all participants in 2018) and a parking subsidy. Gates also makes available executive physicals to all Named Executive Officers (only used by Messrs. Jurek and Naemura in 2017). Ms. Bhattacharya also received a fitness reimbursement. Amounts reported also include the full value of the premiums paid by Gates with respect to the enhanced life, AD&D and long-term disability insurance benefits provided to the Named Executive Officers. |
| (6) | Total amounts reported include 2017 Annual Plan bonuses for the Named Executive Officers. |
2017 Grants of Plan-Based Awards
The following table provides information on bonus opportunity ranges under the 2017 Annual Plan for, and stock options granted in 2017 to, each of our Named Executive Officers.
| Grant Date | Estimated Future Payouts under non-equity incentive plan awards ($) |
Estimated future payouts under equity incentive plan awards (#) |
All other option awards: number of securities underlying options (#) |
Exercise or base price of option awards ($/sh) |
Grant date fair value of stock and option awards ($) |
|||||||||||||||||||||||||||||||||||||||
| Name |
Threshold | Target | Maximum | Threshold | Target | Maximum | ||||||||||||||||||||||||||||||||||||||
| I. Jurek |
(1 | ) | $ | 135,000 | $ | 1,350,000 | — | |||||||||||||||||||||||||||||||||||||
| Tier I |
(2 | ) | 5/2/2017 | 177,600 | $ | 6.00 | $ | 749,472 | ||||||||||||||||||||||||||||||||||||
| Tier II |
(2 | ) | 5/2/2017 | 177,600 | $ | 6.00 | — | |||||||||||||||||||||||||||||||||||||
| Tier III |
(2 | ) | 5/2/2017 | 177,600 | $ | 6.00 | — | |||||||||||||||||||||||||||||||||||||
| Tier IV |
(2 | ) | 5/2/2017 | 177,600 | $ | 9.00 | — | |||||||||||||||||||||||||||||||||||||
| D. Naemura |
(1 | ) | $ | 68,425 | $ | 684,250 | — | |||||||||||||||||||||||||||||||||||||
| J. Seely |
(1 | ) | $ | 9,907 | $ | 99,068 | — | |||||||||||||||||||||||||||||||||||||
| Tier I |
(2 | ) | 9/19/2017 | 137,500 | $ | 10.25 | $ | 635,250 | ||||||||||||||||||||||||||||||||||||
| Tier II |
(2 | ) | 9/19/2017 | 137,500 | $ | 10.25 | — | |||||||||||||||||||||||||||||||||||||
| Tier III |
(2 | ) | 9/19/2017 | 137,500 | $ | 10.25 | — | |||||||||||||||||||||||||||||||||||||
| Tier IV |
(2 | ) | 9/19/2017 | 137,500 | $ | 15.38 | — | |||||||||||||||||||||||||||||||||||||
| R. Gaston |
(1 | ) | $ | 23,100 | $ | 231,000 | — | |||||||||||||||||||||||||||||||||||||
| Tier I |
(2 | ) | 5/2/2017 | 69,025 | $ | 6.00 | $ | 291,286 | ||||||||||||||||||||||||||||||||||||
| Tier II |
(2 | ) | 5/2/2017 | 69,025 | $ | 6.00 | — | |||||||||||||||||||||||||||||||||||||
| Tier III |
(2 | ) | 5/2/2017 | 69,025 | $ | 6.00 | — | |||||||||||||||||||||||||||||||||||||
| Tier IV |
(2 | ) | 5/2/2017 | 69,025 | $ | 9.00 | — | |||||||||||||||||||||||||||||||||||||
| W. Lifsey |
(1 | ) | $ | 54,863 | $ | 548,625 | — | |||||||||||||||||||||||||||||||||||||
| R. Bhattacharya |
(1 | ) | $ | 47,600 | $ | 476,000 | — | |||||||||||||||||||||||||||||||||||||
86
Table of Contents
| (1) | The amounts located in the first row for each Named Executive Officer represent the cash-based award opportunity range under the 2017 Annual Plan, the terms of which are summarized under “What We Pay and Why: Elements of Compensation—Annual Incentive Plan” above. For purposes of this table and threshold level disclosure, we assumed that the lowest weighted of the two performance measures achieved the threshold level of attainment (in other words, 10% of the target award was earned) and the Individual Performance Factor was set at 100%. Additionally, discretion can be used to reduce the payment to zero. Annual Plan payments, if earned, are contingent upon the Named Executive Officer remaining in continuous employment through the payment date. The calculation uses each Named Executive Officer’s base salary as of December 31, other than Ms. Bhattacharya whose calculation uses her base salary in effect on the date of her departure. Ms. Bhattacharya’s last day of active service with the Company was July 4, 2017. While the amounts reported for Ms. Bhattacharya reflect a full year 2017 Annual Plan award opportunity, in connection with her termination of employment and pursuant to the terms of her employment agreement, Ms. Bhattacharya is only entitled to a pro-rata portion of her 2017 Annual Plan bonus based on our actual performance. Details regarding Ms. Bhattacharya’s separation from service are further described in the “Potential Payments Upon Termination or Change in Control” section of this annual report. Amounts reported for Ms. Seely represent a pro-rated 2017 Annual Plan bonus based on her September 2017 start date. The actual amount earned by each Named Officer for 2017 is included in the “Non-Equity Incentive Plan Compensation” column of the Summary Compensation Table. |
| (2) | Represents time-vesting stock options (Tier I) and exit-vesting stock options (Tiers II, III and IV) granted to Messrs. Jurek, Gaston and Ms. Seely in 2017. The grant date fair value of the stock options is calculated in accordance with ASC Topic 718 using a Black-Scholes valuation model. The grant date fair value of the Tier II, III and IV exit-vesting stock options is based on the probable outcome of the performance conditions. See Footnote (3) to the Summary Compensation Table. |
Narrative Disclosure Relating to the Summary Compensation Table and the Grants of Plan-Based Awards Table
Employment Agreements
In connection with their commencement of employment, Messrs. Jurek, Naemura and Lifsey and Ms. Bhattacharya entered into employment agreements that contained substantially similar terms. Each of the employment agreements provided for a five-year initial employment term that extended automatically for successive one-year periods unless either Gates or the executive elected not to extend the term, by providing at least 60 days’ advance notice.
Each employment agreement established the executive’s (1) initial base salary, subject to discretionary periodic increases and (2) eligibility to receive an annual cash incentive bonus, based on the achievement of specified financial and individual performance targets set by the Board each year. The Annual Plan became effective on January 1, 2016, and all of our Named Executive Officers began participating in the Annual Plan in lieu of the short-term incentive provisions set forth in their respective employment agreements at that time. The employment agreements also contained severance benefits, as described below.
As discussed above, in connection with the adoption of the Executive Severance Plan and the Executive Change in Control Plan, each of Messrs. Jurek, Naemura and Lifsey agreed to terminate their existing employment agreements with us.
The following are the material individual provisions of the employment agreements in effect with Ms. Bhattacharya prior to her departure and with Messrs. Jurek, Naemura and Lifsey during Fiscal 2017. In addition, the terms with respect to grants of stock options are described below for our Named Executive Officers in the section entitled “Equity-Based Awards.” Severance provisions and agreements, including the severance agreement entered into with Ms. Bhattacharya in connection with her departure from the Company, are described below in the section entitled “Potential Payments Upon Termination or Change in Control.”
Mr. Jurek’s Employment Agreement. Mr. Jurek’s employment agreement, dated as of May 18, 2015, provided that he was to serve as our Chief Executive Officer, and was eligible to receive a base salary of $900,000, subject to periodic increases as may be approved by the Board. In addition, Mr. Jurek was entitled to reimbursement in connection with his and his family’s relocation to Denver from Hong Kong, and other assistance to ensure a smooth transition. During the first 12 months of his employment, he was also entitled to reimbursement of reasonable travel expenses for his spouse and children to the extent they were not based in Denver during such period.
Mr. Naemura’s Employment Agreement. Mr. Naemura’s employment agreement, dated as of March 30, 2015, provided that he was to serve as our Chief Financial Officer, and was eligible to receive a base salary of $500,000, subject to periodic increases as may be approved by the Board. In addition, Mr. Naemura was entitled to a vehicle allowance in accordance with Gates’ standard policies in place for its senior executives from time to time, reimbursement for relocation expenses to Denver from Dallas (which were subject to repayment in the event he voluntarily terminated his employment before March 30, 2016), and eligibility to participate in the Supplemental Retirement Plan as in effect from time to time.
87
Table of Contents
Mr. Lifsey’s Employment Agreement. Mr. Lifsey’s employment agreement, dated as of August 24, 2015, provided that he was to serve as our Chief Operating Officer, and was eligible to receive a base salary of $475,000, subject to periodic increases as may be approved by the Board.
Ms. Bhattacharya’s Employment Agreement. Ms. Bhattacharya’s employment agreement, dated as of December 19, 2014, provided that she was to serve as Executive Vice President and General Counsel of the Company, and she was eligible to receive a base salary of $350,000, subject to periodic increases as may be approved by the Board. In addition, Ms. Bhattacharya was entitled to a car/automobile allowance or program in accordance with our standard policies in place for its senior executives from time to time.
Equity-Based Awards
As noted above, upon employment or as granted in the Board’s discretion, Named Executive Officers received grants of stock options and the ability to purchase shares of Omaha Topco common stock under the 2014 Incentive Plan. The stock options are divided into four equally weighted tranches referred to as “Tiers” for vesting purposes. Tier I of the stock options (25% of the total award) is subject to time-based vesting restrictions that vest 20% on each of the first five anniversaries of the grant date or vesting reference date, as applicable. Tiers II, III and IV (each 25% of the total) are subject to exit-based vesting and will vest and become exercisable if either the specified internal rate of return or multiple of investment targets noted below are achieved:
| • | Tier I Options. Tier I options (25% of the total award) are subject to time-based vesting that vest 20% on each of the first five anniversaries of the grant date or vesting reference date, as applicable, subject to the participant’s continued employment. |
| • | Tier II Options. Tier II options (25% of the total award) vest and become exercisable, if, prior to July 3, 2022, and on or after the date that Blackstone has sold at least 25% of the maximum number of the shares that it held in Omaha Topco to any unaffiliated person or group or has sold all or substantially all of the assets of Omaha Topco to any unaffiliated person or group (any such date, a “Liquidity Event”), Blackstone receives net cash proceeds together with any dividends or distributions received, in each case, in respect of its Omaha Topco shares sold that results in either (i) a return of at least 2.0 times the amount of its cumulative invested capital or (ii) an annual internal rate of return of at least 15% on its cumulative invested capital, in each case, subject to the participant’s continued employment. |
| • | Tier III Options. Tier III options (25% of the total award) vest and become exercisable, if, on or after a Liquidity Event, Blackstone receives net cash proceeds together with any dividends or distributions received, in each case, in respect of its Omaha Topco shares sold that results in either (i) a return of at least 2.5 times the amount of its cumulative invested capital or (ii) an annual internal rate of return of at least 20% on its cumulative invested capital, in each case, subject to the participant’s continued employment. |
| • | Tier IV Options. Tier IV options (25% of the total award) vest and become exercisable at the same time, and subject to the same conditions, as the Tier II Options. However, the Tier IV options have an exercise price greater than the fair market value of one share of Omaha Topco common stock on the date of grant of such options. |
Any part of a Named Executive Officer’s stock option award that is vested upon termination of employment by us without “Cause” or by the Named Executive Officer for “good reason” (as such terms are defined in the stock option agreements), will generally remain outstanding and exercisable for 90 days following the termination of employment. This period is shortened to 30 days if the Named Executive Officer resigns without good reason and no grounds for a termination by us for Cause exists, and is extended to 12 months if employment is terminated due to death or Disability. Vested options will immediately terminate if the Named Executive Officer’s employment is terminated by us for Cause, if the Named Executive Officer resigns without good reason when grounds for Cause exist or if there is a restrictive covenant violation. Any vested options that are not exercised within the applicable post-termination exercise window will terminate. Any part of a Named Executive Officer’s stock option award that
88
Table of Contents
vests following a termination without Cause, for good reason or due to death or Disability, will generally remain outstanding and exercisable for 60 days following the date such option vested. In each case, the exercise period will be shortened to the expiration date of the stock option, if earlier. See “Potential Payments upon a Termination or Change in Control—Long-Term Incentive Awards” below for a description of the potential vesting that each of these Named Executive Officers may be entitled to in connection with a Change in Control or certain terminations of employment.
By accepting a grant of options pursuant to the 2014 Incentive Plan and the stock option award agreement, our Named Executive Officers agreed to certain restrictive covenants, including an indefinite covenant not to disclose confidential information and not to disparage us, and, during each of the executive’s employment and for the one-year period following any termination of employment (or such longer period as the Named Executive Officer is eligible to receive severance payments from us), covenants related to non-competition and non-solicitation of employees, customers or suppliers.
In addition, as a condition to receiving his or her equity-based awards and in connection with investments in our common stock, each Named Executive Officer was required to enter into a subscription agreement with us, and to become a party to our shareholders agreement. These agreements generally govern the Named Executive Officers’ rights with respect to any shares of our common stock purchased or acquired on exercise of vested stock options. The subscription agreement also contains certain restrictive covenants.
If a Named Executive Officer materially breaches any of these restrictive covenants contained in the stock option award agreement, then we have the right to “claw back” and recover any gains the Named Executive Officer may have realized with respect to his or her shares acquired under the terms of the stock option agreement or pursuant to the subscription agreement, as applicable. If the Named Executive Officer (i) is terminated for “Cause” (as defined in the respective Named Executive Officer’s employment agreements), (ii) voluntarily resigns when grounds exist for “Cause” or (iii) violates a restrictive covenant, then we have the right to repurchase his or her shares, including any shares issuable or issued upon the exercise of any options for the lesser of (a) fair market value (measured as of the purchase date) and (b) cost.
Outstanding Equity Awards at December 30, 2017
The following table provides information regarding outstanding equity awards held by each Named Executive Officer as of December 30, 2017.
| Name |
Grant Date | Number of Securities Underlying Unexercised Options (#) Exercisable(1) |
Number of Securities Underlying Unexercised Options (#) Unexercisable(1) |
Equity Incentive Plan Awards: Number of Securities Underlying Unexercised Unearned Options (#)(2) |
Option Exercise Price ($) |
Option Expiration Date |
||||||||||||||||||||||
| I. Jurek |
5/18/2015 | Tier I | 533,333 | 800,000 | — | $ | 5.00 | 5/18/2025 | ||||||||||||||||||||
| 5/18/2015 | Tier II | — | — | 1,333,333 | $ | 5.00 | 5/18/2025 | |||||||||||||||||||||
| 5/18/2015 | Tier III | — | — | 1,333,333 | $ | 5.00 | 5/18/2025 | |||||||||||||||||||||
| 5/18/2015 | Tier IV | — | — | 1,333,333 | $ | 7.50 | 5/18/2025 | |||||||||||||||||||||
| 5/2/2017 | Tier I | — | 177,600 | — | $ | 6.00 | 5/2/2027 | |||||||||||||||||||||
| 5/2/2017 | Tier II | — | — | 177,600 | $ | 6.00 | 5/2/2027 | |||||||||||||||||||||
| 5/2/2017 | Tier III | — | — | 177,600 | $ | 6.00 | 5/2/2027 | |||||||||||||||||||||
| 5/2/2017 | Tier IV | — | — | 177,600 | $ | 9.00 | 5/2/2027 | |||||||||||||||||||||
| D. Naemura |
3/30/2015 | Tier I | 195,000 | 292,500 | — | $ | 5.00 | 3/30/2025 | ||||||||||||||||||||
| 3/30/2015 | Tier II | — | — | 487,500 | $ | 5.00 | 3/30/2025 | |||||||||||||||||||||
| 3/30/2015 | Tier III | — | — | 487,500 | $ | 5.00 | 3/30/2025 | |||||||||||||||||||||
| 3/30/2015 | Tier IV | — | — | 487,500 | $ | 7.50 | 3/30/2025 | |||||||||||||||||||||
89
Table of Contents
| Name |
Grant Date | Number of Securities Underlying Unexercised Options (#) Exercisable(1) |
Number of Securities Underlying Unexercised Options (#) Unexercisable(1) |
Equity Incentive Plan Awards: Number of Securities Underlying Unexercised Unearned Options (#)(2) |
Option Exercise Price ($) |
Option Expiration Date |
||||||||||||||||||||||
| J. Seely |
9/19/2017 | Tier I | — | 137,500 | — | $ | 10.25 | 9/19/2027 | ||||||||||||||||||||
| 9/19/2017 | Tier II | — | — | 137,500 | $ | 10.25 | 9/19/2027 | |||||||||||||||||||||
| 9/19/2017 | Tier III | — | — | 137,500 | $ | 10.25 | 9/19/2027 | |||||||||||||||||||||
| 9/19/2017 | Tier IV | — | — | 137,500 | $ | 15.38 | 9/19/2027 | |||||||||||||||||||||
| R. Gaston |
8/8/2016 | Tier I | 17,760 | 71,040 | — | $ | 5.00 | 8/8/2026 | ||||||||||||||||||||
| 8/8/2016 | Tier II | — | — | 88,800 | $ | 5.00 | 8/8/2026 | |||||||||||||||||||||
| 8/8/2016 | Tier III | — | — | 88,800 | $ | 5.00 | 8/8/2026 | |||||||||||||||||||||
| 8/8/2016 | Tier IV | — | — | 88,800 | $ | 7.50 | 8/8/2026 | |||||||||||||||||||||
| 5/2/2017 | Tier I | — | 69,025 | — | $ | 6.00 | 5/2/2027 | |||||||||||||||||||||
| 5/2/2017 | Tier II | — | — | 69,025 | $ | 6.00 | 5/2/2027 | |||||||||||||||||||||
| 5/2/2017 | Tier III | — | — | 69,025 | $ | 6.00 | 5/2/2027 | |||||||||||||||||||||
| 5/2/2017 | Tier IV | — | — | 69,025 | $ | 9.00 | 5/2/2027 | |||||||||||||||||||||
| W. Lifsey |
8/24/2015 | Tier I | 131,424 | 197,136 | — | $ | 5.00 | 8/24/2025 | ||||||||||||||||||||
| 8/24/2015 | Tier II | — | — | 328,560 | $ | 5.00 | 8/24/2025 | |||||||||||||||||||||
| 8/24/2015 | Tier III | — | — | 328,560 | $ | 5.00 | 8/24/2025 | |||||||||||||||||||||
| 8/24/2015 | Tier IV | — | — | 328,560 | $ | 7.50 | 8/24/2025 | |||||||||||||||||||||
| 5/12/2016 | Tier I | 22,200 | 88,800 | — | $ | 5.00 | 5/12/2026 | |||||||||||||||||||||
| 5/12/2016 | Tier II | — | — | 111,000 | $ | 5.00 | 5/12/2026 | |||||||||||||||||||||
| 5/12/2016 | Tier III | — | — | 111,000 | $ | 5.00 | 5/12/2026 | |||||||||||||||||||||
| 5/12/2016 | Tier IV | — | — | 111,000 | $ | 7.50 | 5/12/2026 | |||||||||||||||||||||
| R. Bhattacharya (3) |
1/9/2015 | Tier II | — | — | 71,040 | $ | 5.00 | 1/9/2025 | ||||||||||||||||||||
| 1/9/2015 | Tier III | — | — | 71,040 | $ | 5.00 | 1/9/2025 | |||||||||||||||||||||
| 1/9/2015 | Tier IV | — | — | 71,040 | $ | 7.50 | 1/9/2025 | |||||||||||||||||||||
| (1) | Represents Tier I time-vesting stock options held by the Named Executive Officers as of December 30, 2017. The Tier I options vest 20% on each of the first five anniversaries of the grant date. |
| (2) | Represents Tier II, III and IV exit-vesting stock options held by the Named Executive Officers as of December 30, 2017. The Tier II, III and IV exit-vesting options become vested when and to the extent specified internal rate of return or multiple of investment targets are achieved by Blackstone as described in the “—Narrative Disclosure Relating to the Summary Compensation Table and Grants of Plan-Based Awards—Equity-Based Awards” section above. |
| (3) | Ms. Bhattacharya’s last day of active service with the Company was July 4, 2017. As a result of her departure, Ms. Bhattacharya became vested in an additional 17,760 Tier I time-vesting stock options and will remain eligible to vest in 80% of her unvested Tier II, III and IV exit-vesting stock options for 24 months following her departure date. All other unvested stock options were immediately forfeited. In addition, Ms. Bhattacharya had the right to exercise all of her vested and deemed vested stock options within 90 days of her departure date after which they were all cancelled. See “Potential Payments upon a Termination or Change in Control—Departure of Ms. Bhattacharya” for details regarding Ms. Bhattacharya’s departure. |
2017 Option Exercises and Stock Vested
None of our Named Executive Officer’s exercised stock options in 2017.
90
Table of Contents
2017 Nonqualified Deferred Compensation
The Company offers to its executives, including all of the Named Executive Officers, the opportunity to participate in the Supplemental Retirement Plan. The table below provides information as of December 30, 2017, for those Named Executive Officers who were eligible to participate in this plan.
| Name |
Executive Contributions in Last FY ($)(1) |
Registrant Contributions in Last FY ($)(2) |
Aggregate Earnings in Last FY ($)(3) |
Aggregate Withdrawals/ Distributions ($) |
Aggregate Balance at Last FYE ($)(4) |
|||||||||||||||
| I. Jurek |
$ | 202,500 | 142,800 | 16,797 | — | 472,920 | ||||||||||||||
| D. Naemura |
— | 68,880 | 7,224 | — | 121,443 | |||||||||||||||
| J. Seely(5) |
— | — | — | — | — | |||||||||||||||
| R. Gaston |
— | 20,938 | — | — | 20,938 | |||||||||||||||
| W. Lifsey |
— | 53,915 | 4,064 | — | 87,662 | |||||||||||||||
| R. Bhattacharya(6) |
— | — | 7,984 | — | 56,912 | |||||||||||||||
| (1) | This column reflects 2017 Annual Plan bonuses earned by the Named Executive Officers with respect to the last fiscal year that have been deferred on a voluntary basis. Only Mr. Jurek elected to defer 10% of his 2017 Annual Plan bonus. Mr. Jurek’s deferral amount is included in the “Non-equity Incentive Plan Compensation” column of the Summary Compensation Table. |
| (2) | This column contains contributions by us with respect to the last fiscal year under the Supplemental Retirement Plan, which provides for benefits in excess of amounts permitted to be contributed under our Gates MatchMaker 401(k) Plan as a result of Section 401(a)(17) of the Code. As a result, participants are eligible to receive a retirement contribution paid by the Company in an amount equal to 6% of eligible compensation that exceeds Section 401(a)(17) of the Code, which is earned in 2017 and paid in the first quarter of 2018. These amounts are included in the “All Other Compensation” column of the Summary Compensation Table. |
| (3) | Because amounts included in this column do not include above-market or preferential earnings, none of these amounts are included under the “Change in Pension Value and Nonqualified Deferred Compensation Earnings” column of the Summary Compensation Table. |
| (4) | The following amounts reported in the “Aggregate Balance at Last Fiscal Year End” column were reported as compensation in the Summary Compensation Table for Fiscal 2016: Mr. Jurek: $92,100; Mr. Naemura: $22,270; Mr. Lifsey: $29,683 and Ms. Bhattacharya: $10,306. |
| (5) | Ms. Seely did not receive a 2017 contribution under the Supplement Retirement Plan with respect to Fiscal 2017 as she was hired in 2017 and her eligible compensation under the Supplemental Retirement Plan in 2017 did not exceed the dollar limits under Section 401(a)(17) of the Code. |
| (6) | Ms. Bhattacharya’s last day of active service with the Company was July 4, 2017. Therefore, the Company will distribute the aggregate balance in Ms. Bhattacharya’s vested account in the first quarter of 2018 in accordance with the terms of the Supplemental Retirement Plan. |
Narrative to Nonqualified Deferred Compensation for 2017 Table
We currently offer participation in the Supplemental Retirement Plan to specified employees including the Named Executive Officers. This plan is a nonqualified deferred compensation plan that provides participants with two benefit opportunities:
| 1. | Non elective employer contribution. A 6% employer contribution (the “Retirement Contribution”) on eligible earnings that exceed Section 401(a)(17) of the Code’s dollar limits. |
| 2. | Compensation Deferral Opportunity. In June 2017, we amended the Supplemental Retirement Plan to permit participants to defer up to 80% of base salary (beginning in January 2018) and 80% of bonus compensation (beginning with the 2017 Annual Plan payouts). There is no employer paid matching contribution on these deferrals. |
91
Table of Contents
These deferrals are in addition to amounts participants may defer in the Gates MatchMaker 401(k) Plan. Each Named Executive Officer who participates in the deferral feature of the Supplemental Retirement Plan is 100% vested in that portion of their account that is attributable to elective deferrals. Also in June 2017, a Rabbi trust to hold plan assets was established.
The amounts deferred are credited to accounts selected by the Named Executive Officer that mirror the investment alternatives available in the Gates MatchMaker 401(k) Plan. During Fiscal 2017, participants were permitted to select the investment alternatives in which they wanted their accounts to be deemed to be invested and were credited with earnings and/or losses based on the performance of the relevant investments. Participants were able to change the investment elections for their accounts on a daily basis during Fiscal 2017. For Fiscal 2017, the Named Executive Officers participated in one or more of the following 18 investment options, which had the returns indicated below:
| American Beacon Scap Val Instl | 8.68% | T Rowe Price New America Grth | 34.57% | |||||||
| American Fundamental Invstr R6 | 23.72% | Vanguard Equity Income Admiral | 18.99% | |||||||
| American New Perspective R6 | 29.30% | Vanguard Fed Money Market Fund(2) | 0.10% | |||||||
| Dodge & Cox Balanced | 12.59% | Vanguard Inflation Protect Adm | 2.91% | |||||||
| Europacific Growth R6(1) | 4.23% | Vanguard Institutional Index | 21.79% | |||||||
| Loomis Sayles Core Plus Bond N | 5.31% | Vanguard Midcap Index Instl | 19.29% | |||||||
| Massmutual Slct Mid Cap Grth I(1) | 4.42% | Vanguard Sm Cap Index Instl | 16.25% | |||||||
| MFS Mid Cap Value R6 | 13.84% | Vanguard Total Bd Mkt Idx Inst | 3.43% | |||||||
| Pimco All Asset Instl | 13.98% | Vanguard Total Intl Stk Instl | 27.55% |
| (1) | The Europacific Growth R6 and the Massmututal Slct Mid Cap Grth funds were first made available in September 2017 and the return indicated reflects the return for the portion of the year the funds were available. |
| (2) | The Vanguard Fed Money Market fund was first made available in November 2017 and the rate of return indicated reflects the return for the portion of the year the fund was available. |
A Named Executive Officer’s vested account will commence to be paid at the earliest to occur of the following events: (1) the specified date elected by the participant (provided the date specified is at least two years from the end of the Supplemental Retirement Plan year in which the contribution to the Supplemental Retirement Plan is made); (2) the participant’s Disability (as defined in the Supplemental Retirement Plan); (3) the participant’s termination of employment; (4) the participant’s death; or (5) upon a Change in Control (as defined in the Supplemental Retirement Plan). If the distribution is made on account of a termination of employment (other than death), the vested account will be distributed in accordance with the form of distribution as elected (a single lump-sum or in annual installments over two, three, four or five years). If a distribution is made on account of death, the participant’s vested account will be distributed to his or her beneficiary in a single lump-sum as soon as practicable following the participant’s death, regardless of the form of benefit elected. If a distribution is made on account of a termination of employment for any reason other than Disability or death, distribution of a lump-sum or the first installment will be made or begin as soon as possible after the first day of the seventh month following the termination of employment. If a distribution is made on account of Disability or death, the distribution will be made or begin as soon as possible on the first day of the month following the payment event. If a distribution is made on account of a specified date or Change in Control, the distribution will be made or begin as soon as is reasonably practical, but in no event later than the last day of the calendar year.
Potential Payments upon a Termination or Change in Control
Summary of Potential Payments
We entered into employment agreements with Messrs. Jurek, Naemura and Lifsey and Ms. Bhattacharya which provided severance benefits to such Named Executive Officers in varying amounts under certain scenarios. Pursuant to the participation agreements executed by our currently employed Named Executive Officers in connection with the Executive Severance Plan and Change in Control Plan, each of Messrs. Jurek, Naemura and Lifsey agreed to terminate their existing employment agreements with us. Accordingly, the Executive Severance Plan and Change in Control Plan will replace the severance benefits provided under the predecessor Gates
92
Table of Contents
Corporation Severance Plan to Mr. Gaston and Ms. Seely and under the employment agreements entered into with Messrs. Jurek, Naemura and Lifsey. In order to receive payment and benefits under the Executive Severance Plan or Executive Change in Control Plan, the Named Executive Officer must execute and not revoke a valid release of claims against us and comply with the restrictive covenants set forth in the Executive Severance Plan or Executive Change in Control Plan, as applicable.
Severance and other benefits that are payable upon a termination of employment or upon a change in control under the Executive Severance Plan and Change in Control Plan are described below. The table following this narrative discussion summarizes the amounts that would have been payable upon termination or a change in control under certain circumstances to Named Executive Officers (other than Ms. Bhattacharya who terminated employment in July 2017), assuming that their employment terminated on December 29, 2017 and assuming the Executive Severance Plan and Change in Control Plan were in effect on such date. Ms. Bhattacharya has already received and is still receiving severance payments under the Bhattacharya Separation Agreement in connection with the termination of her employment, which payments are described further below.
Executive Severance Plan. In connection with our IPO we adopted the Executive Severance Plan. The Executive Severance Plan provides for severance payments upon certain terminations of employment to our Named Executive Officers and other executive officers who are expected to make substantial contributions to our success and thereby provide for stability and continuity of operations. All of our currently employed Named Executive Officers participate in the Executive Severance Plan pursuant to individual participation agreements.
The Executive Severance Plan provides that, if we terminate the employment of a Named Executive Officer for any reason other than “cause”, death or disability, or if the Named Executive Officer terminates other than for a “constructive termination,” then the Named Executive Officer will be entitled to receive:
| • | salary continuation payments in an amount equal to the sum of two times base salary and two times previous year bonus for Mr. Jurek, one times base salary and one times previous year bonus for Mr. Naemura and two times base salary for each other Named Executive Officer; |
| • | the Named Executive Officer’s annual bonus under the Annual Plan as earned (without the adjustment for an individual performance factor) for the year in which the separation occurs; |
| • | cash payments in an amount equal to the total amount of Gates’ portion of the monthly COBRA insurance premiums for participation in the health and dental benefit programs in which the Named Executive Officer participated immediately prior to separation, payable monthly for each month of the welfare continuation period, which is for a period of 24 months; and |
| • | reimbursement for reasonable outplacement services which are directly related to the Named Executive Officer’s termination and which are incurred only during a six-consecutive month period that ends within or with the 12-month period following the termination of the Named Executive Officer’s employment. |
For these purposes, “cause” and “constructive termination” have the meanings ascribed to such terms in the Executive Severance Plan.
Our Executive Severance Plan contains a “best-of-net” provision. With a “best-of-net” provision, if any of the participants is subject to an excise tax under Code Section 280G and Code Section 4999, then the amount of severance the participant receives may be reduced so that the excise tax does not apply; however, such reduction will only occur if it results in the receipt of a greater after-tax severance than would otherwise be provided.
Named Executive Officers are not entitled to payments under the Executive Severance Plan if they are entitled to receive payment under the Executive Change in Control Plan discussed below. In addition, in order to receive payments under the Executive Severance Plan, the Named Executive Officer must execute and not revoke a release of claims against us and continue to comply with confidentiality, non-compete, non-solicitation and non-disparagement covenants during each of the executive’s employment and for the one-year period following any termination of employment (or such longer period as the Named Executive Officer is eligible to receive severance payments from us).
93
Table of Contents
Executive Change in Control Plan. In connection with our IPO we adopted the Executive Change in Control Plan in which all of our executive officers, including each of our currently employed Named Executive Officers, participate pursuant to individual participation agreements. The Executive Change in Control Plan serves to encourage these key executives to carry out their duties and provide continuity of management in the event of a “change in control” of Gates.
If a change in control occurs and the Named Executive Officer’s employment is terminated by us or a successor for reasons other than “cause” or is terminated voluntarily by the individual for “constructive termination,” in each case within the period beginning 90 days prior to the consummation of a change in control and ending on the second anniversary of the date of such change in control, then the Executive Change in Control Plan generally provides that the individual would be entitled to receive:
| • | a lump-sum payment in the amount of two and one-half times base salary plus target bonus amount (for Mr. Jurek) and one and one-half times base salary plus target bonus amount (for the other Named Executive Officers); |
| • | a lump-sum payment equal to the executive’s target bonus amount in effect prior to the change in control; |
| • | cash payments in an amount equal to the total amount of the monthly COBRA insurance premiums for participation in the health and dental benefit programs as well as the monthly premiums for the life and long-term disability insurance benefit programs in which the Named Executive Officer participated immediately prior to separation, payable monthly for each month of the welfare continuation period, which is equal to 30 months for Mr. Jurek and 24 months for each other participating Named Executive Officer; and |
| • | reimbursement for reasonable outplacement services which are directly related to the Named Executive Officer’s termination and which are incurred only during a six-consecutive month period that ends within or with the 12-month period following the termination of the Named Executive Officer’s employment. |
For these purposes, “change in control”, “cause” and “constructive termination” have the meanings ascribed to such terms in the Executive Change in Control Plan.
Neither plan contains a single trigger or a modified single trigger for benefits. In addition, the Executive Change in Control Plan does not provide for benefits upon death or disability following a change in control.
Our Executive Change in Control Plan contains a “best-of-net” provision. With a “best-of-net” provision, if any of the participants is subject to an excise tax under Code Section 280G and Code Section 4999, then the amount of severance the participant receives may be reduced so that the excise tax does not apply; however, such reduction will only occur if it results in the receipt of a greater after-tax severance than would otherwise be provided.
To the extent a payment or benefit that is paid or provided under the Executive Change in Control Plan would also be paid or provided under the terms of another plan, program, agreement, arrangement or legal requirement, the executive would be entitled to payment under the Executive Change in Control Plan or such other applicable plan, program, agreement, arrangement or legal requirement, whichever provides for greater benefits, but would not be entitled to benefits under both the Executive Change in Control Plan and such other plan, program, agreement, arrangement or legal requirement.
In addition, in order to receive payment and benefits under the Executive Change in Control Plan, the Named Executive Officer must execute and not revoke a release of claims against Gates and continue to comply with confidentiality, non-compete and non-solicitation covenants during each of the executive’s employment and for the one-year period following any termination of employment (or such longer period as the Named Executive Officer is eligible to receive severance payments from us).
94
Table of Contents
Annual Plan
Messrs. Jurek, Naemura, Lifsey and Gaston, and Ms. Seely participated in the Annual Plan. For Fiscal 2017, the Annual Plan provided that a participant had to be an employee at the time of a payout in order to receive a payout under the Annual Plan, except (i) in the case of death, Disability (as defined in the Annual Plan) or Retirement (as defined in the Annual Plan), (ii) if such payment was required by local law or individual employment agreement, or (iii) under the terms of a Gates-approved severance arrangement (referred to as “Termination with Severance”). In the case of death, Disability or Retirement, the bonus payout would have been calculated based on the target achievement of annual financial performance targets (without the adjustment for an individual performance factor), and prorated to reflect the number of full months worked for us by the participant in the year of such termination. In the case of Termination with Severance, the bonus payout would have been calculated in accordance with the Executive Severance and Change in Control Plans, as applicable.
Long-Term Incentive Awards
For Messrs. Jurek, Naemura and Lifsey, vesting of one additional “tranche” of the Tier I time-vesting options will accelerate upon termination of employment by (i) the Company without Cause, (ii) by the participant for Good Reason and (iii) death or Disability ((i)–(iii) collectively referred to as a “Good Leaver Termination”). In addition, for all Named Executive Officers with options granted prior to May 2017, with respect to the Tier II, III and IV exit-vesting options, if there is a separation from service due to a Good Leaver Termination prior to July 3, 2022, then a percentage of such options equal to the “Specified Portion” listed below will remain outstanding and eligible to vest for a period ending on the earlier of (x) the date that is 24 months following the date of termination or (y) July 3, 2022.
| Date of Good Leaver Termination |
Specified Portion (Messrs. Jurek, Naemura, Lifsey and Ms. Bhattacharya) |
Specified Portion (Mr. Gaston) |
||||||
| Prior to the first anniversary of the date of grant/vesting reference date |
20 | % | 0 | % | ||||
| On or after the first anniversary of the date of grant/vesting reference date and prior to the second anniversary of the date of grant/vesting reference date |
40 | % | 20 | % | ||||
| On or after the second anniversary of the date of grant/vesting reference date and prior to the third anniversary of the date of grant/vesting reference date |
60 | % | 40 | % | ||||
| On or after the third anniversary of the date of grant/vesting reference date and prior to the fourth anniversary of the date of grant/vesting reference date |
80 | % | 60 | % | ||||
| On or after the fourth anniversary of the date of grant/vesting reference date and prior to the fifth anniversary of the date of grant/vesting reference date |
100 | % | 80 | % | ||||
| On or after the fifth anniversary of the date of grant/vesting reference date |
— | 100 | % | |||||
In addition, for options granted prior to May 2017 if the participant retires on or after the third anniversary of the vesting commencement date, is at least age 62 and has completed three years of service, then the Board may, in its discretion, treat such retirement as a Good Leaver Termination with respect to Tiers II, III and IV.
For all option awards, upon a “Change in Control” (as such term is defined in the 2014 Incentive Plan) during the participant’s employment, all unvested Tier I time-vesting options will accelerate and become fully vested. The Tier II, III and IV exit-vesting options would not automatically become fully vested in connection with a Change in Control. However, all or a portion of the Tier II, III and IV exit-vesting options may become vested to the extent a Change in Control occurs prior to July 3, 2022, which results in the applicable vesting conditions being met. If not, then the Tier II, III and IV exit-vesting options would remain outstanding and eligible to vest until July 3, 2022, or until Blackstone ceases to own any of our ordinary shares.
95
Table of Contents
Retirement Benefits
The Supplemental Retirement Plan that is made available to all Named Executive Officers has payment provisions relating to the termination of employment with Gates and a Change in Control (as defined in the Supplemental Retirement Plan), which are described more fully above under “Nonqualified Deferred Compensation for Fiscal 2017.”
Payments and Benefits Upon Termination or Change-in-Control
The following table describes the potential payments and benefits that would have been payable to our Named Executive Officers (other than Ms. Bhattacharya) assuming an eligible termination (as described above under “Summary of Potential Payments”) of their employment on the last business day of 2017 and assuming the Executive Severance and Change in Control Plans were in effect on such date. The data below assumes share price equal to the IPO price of $19.00 per share.
The amounts shown in the table below do not include:
| • | payments and benefits to the extent they are provided generally to all salaried employees upon termination of employment and do not discriminate in scope, terms or operation in favor of the Named Executive Officers; or |
| • | distributions of previously vested plan balances under our the Gates MatchMaker 401(k) Plan and the Supplemental Retirement Plan (see the “2017 Nonqualified Deferred Compensation” section above for information about the Supplemental Retirement Plan). |
| I. Jurek | D. Naemura | J. Seely | R. Gaston | W. Lifsey | ||||||||||||||||
| Termination—Disability or Death |
||||||||||||||||||||
| Cash Severance Payments(1) |
$ | 1,350,000 | $ | 684,250 | $ | 99,068 | $ | 231,000 | $ | 548,625 | ||||||||||
| Option Awards(2) |
$ | 2,833,944 | $ | 925,828 | $ | 0 | $ | 0 | $ | 834,783 | ||||||||||
|
|
|
|
|
|
|
|
|
|
|
|||||||||||
| Total |
$ | 4,183,944 | $ | 1,610,078 | $ | 99,068 | $ | 231,000 | $ | 1,383,408 | ||||||||||
|
|
|
|
|
|
|
|
|
|
|
|||||||||||
| Termination—By the Company without Cause |
||||||||||||||||||||
| Cash Severance Payments(3) |
$ | 7,325,000 | $ | 2,444,375 | $ | 931,101 | $ | 1,116,500 | $ | 1,920,187 | ||||||||||
| Health Plan Continuation(4) |
$ | 23,932 | $ | 23,932 | $ | 16,578 | $ | 23,932 | $ | 16,578 | ||||||||||
| Outplacement(5) |
$ | 7,500 | $ | 7,500 | $ | 7,500 | $ | 7,500 | $ | 7,500 | ||||||||||
| Option Awards(2) |
$ | 2,833,944 | $ | 925,828 | $ | 0 | $ | 0 | $ | 834,783 | ||||||||||
|
|
|
|
|
|
|
|
|
|
|
|||||||||||
| Total |
$ | 10,190,376 | $ | 3,401,635 | $ | 1,022,679 | $ | 1,147,932 | $ | 2,779,048 | ||||||||||
|
|
|
|
|
|
|
|
|
|
|
|||||||||||
|
Change-in-Control—(with Termination) |
||||||||||||||||||||
| Cash Severance Payments(6) |
$ | 6,975,000 | $ | 2,603,125 | $ | 1,182,818 | $ | 1,155,000 | $ | 2,194,500 | ||||||||||
| Health Plan Continuation(4) |
$ | 79,556 | $ | 47,941 | $ | 30,153 | $ | 41,549 | $ | 37,827 | ||||||||||
| Outplacement(5) |
$ | 7,500 | $ | 7,500 | $ | 7,500 | $ | 7,500 | $ | 7,500 | ||||||||||
| Option Awards(2) |
$ | 9,105,365 | $ | 2,777,483 | $ | 583,780 | $ | 1,260,986 | $ | 2,715,154 | ||||||||||
|
|
|
|
|
|
|
|
|
|
|
|||||||||||
| Total |
$ | 16,167,421 | $ | 5,436,049 | $ | 1,804,251 | $ | 2,465,035 | $ | 4,954,981 | ||||||||||
|
|
|
|
|
|
|
|
|
|
|
|||||||||||
|
Change-in-Control—(without Termination) |
||||||||||||||||||||
| Option Awards(2) |
$ | 9,105,365 | $ | 2,777,483 | $ | 583,780 | $ | 1,260,986 | $ | 2,715,154 | ||||||||||
|
|
|
|
|
|
|
|
|
|
|
|||||||||||
| Total |
$ | 9,105,365 | $ | 2,777,483 | $ | 583,780 | $ | 1,260,986 | $ | 2,715,154 | ||||||||||
|
|
|
|
|
|
|
|
|
|
|
|||||||||||
| (1) | Amounts reported reflect a pro-rata portion of the Annual Plan bonus based on the target achievement of annual financial and individual performance targets. |
96
Table of Contents
| (2) | For Messrs. Jurek, Naemura and Lifsey, if the executive’s employment is terminated by the Company without Cause, by the executive for Good Reason or as a result of death or Disability, then vesting of one additional “tranche” of the Tier I time-vesting options will accelerate. In the event of a Change in Control, all such unvested Tier I time-vesting options will accelerate and become fully vested. The amounts reported reflect the “spread” value for the Tier I time-vesting options granted prior to Fiscal 2017, in each case representing the difference between the $19.00 per share IPO price following the IPO. Amounts reported assume that Tier II, III and IV exit-vesting options do not vest upon a Change in Control. |
| (3) | For Messrs. Jurek and Naemura, the amounts reported reflect the sum of (a) a pro rata portion of the 2017 Annual Plan bonus payment as earned (without the adjustment for an individual performance factor) and (b) two times Mr. Jurek’s and one times Mr. Naemura’s (x) then-current base salary and (y) the actual Fiscal 2016 Annual Plan bonus payment, which would be paid in substantially equal installments over a period of 24 months for Mr. Jurek and 12 months for Mr. Naemura. For the remaining Named Executive Officers, the amount reported is (a) two times his or her then-current base salary and (b) a pro rata portion of the Fiscal 2017 Annual Plan bonus as earned (without the adjustment for an individual performance factor), which would be paid in substantially equal installments over a period of 24 months. |
| (4) | The amounts reported in “Termination—By the Company without Cause” represent cash payments in an amount equal to the estimated total amount of Gates’ portion of the monthly COBRA insurance premiums for participation in the health and dental benefit programs in which the Named Executive Officer participated immediately prior to termination for a period of 24 months for each of the Named Executive Officers. The amounts reported in “Change-in-Control—(with Termination)” represent cash payments in an amount equal to the estimated total amount of the monthly COBRA insurance premiums for participation in the health and dental benefit programs as well as the monthly premiums for the life and long-term disability insurance programs in which the Named Executive Officer participated immediately prior to termination for a period of 30 months for Mr. Jurek and 24 months for each of the other Named Executive Officers. |
| (5) | Amounts reported represent costs of outplacement services for a six-month period for each executive assuming rates in effect at December 29, 2017. |
| (6) | The amounts reported reflect the sum of (a) one and one-half times (two and one-half times for Mr. Jurek) the executive’s then-current base salary plus the Fiscal 2017 Annual Plan target bonus and (b) the Fiscal 2017 Annual Plan target bonus. Our Executive Change in Control Plan provides that if the executive is subject to an excise tax under Code Section 280G and Code Section 4999 then the amount of severance the executive receives may be reduced so that the excise tax does not apply, however, such reduction will only occur if the receipt of a greater after-tax severance than would otherwise be provided. For purposes of the above disclosure we have assumed that the executive’s severance amounts will not be reduced. |
Departure of Ms. Bhattacharya
Ms. Bhattacharya’s last day of active service with us was July 4, 2017. In connection with Ms. Bhattacharya’s termination of employment with us, she entered into the Bhattacharya Separation Agreement. Ms. Bhattacharya’s departure from employment with us constituted a termination without “Cause” pursuant to the terms of her employment agreement entitling her to (a) severance pay in the amount of $826,000, which will be paid in equal installments over the 12 months following her termination of employment with us (the severance pay equals (the sum of (i) her annual base salary of $350,000, and (ii) an amount equal to her annual bonus in respect of our 2016 fiscal year of $476,000), (b) $7,563 paid in equal installments over 12 months following her termination of employment with us, which represents the estimated annual cost of our portion of continuation of medical, dental and vision under COBRA, (c) outplacement services up to $10,000, for a six-month consecutive period that ends within or with the 12-month period following her termination of employment with us, and (d) a pro rata portion of her annual bonus in respect of our 2017 fiscal year, based on our actual performance (the “2017 Bonus” and together with (a), (b) and (c), the “Bhattacharya Severance Benefits”). Ms. Bhattacharya’s 2017 Bonus was determined to be $357,000 and was paid at the same time annual bonuses in respect of our 2017 fiscal year were determined and paid with respect to our senior executives.
For purposes of her existing option award agreement, her departure constituted a “Good Leaver Termination,” entitling her to vest in an additional 17,760 Tier I time-vesting stock options and to remain eligible to vest in 80% of her unvested Tier II, III and IV exit-vesting stock options for 24 months following her departure date. All other unvested stock options were immediately forfeited. In addition, Ms. Bhattacharya had the right to exercise all of her vested and deemed vested stock options within 90 days of her departure date, which were not exercised and were cancelled. In addition, pursuant to the terms of her subscription agreement, her purchased shares were repurchased by us on July 11, 2017 for a purchase price of $180,000, resulting in a gain of $30,000.
97
Table of Contents
The Bhattacharya Severance Benefits were contingent upon Ms. Bhattacharya’s execution and non-revocation of a release of claims in our favor (which we received) and her continued compliance with certain non-competition, non-solicitation, non-disparagement and confidentiality covenants contained in the Bhattacharya Separation Agreement. The confidentiality and non-disparagement covenants each have an indefinite term. The non-competition and non-solicitation covenants each have a term of 12 months. If we believe that Ms. Bhattacharya is in violation of these restrictive covenants after her termination, we may suspend all of the payments described above. However, we also have the right to waive a breach of any covenant by Ms. Bhattacharya.
Director Compensation
Our employee director and Sponsor-affiliated directors receive no additional compensation for serving on the Board. As such, none of our directors, other than Terry Klebe, John Plant and Karyn Ovelmen, received compensation for the year ended December 30, 2017. All of our directors are reimbursed for their reasonable out-of-pocket expenses related to their service as a member of the Board.
Karyn Ovelmen was appointed to our Board effective December 15, 2017. She received a cash retainer of $5,200 for her service as a director in Fiscal 2017.
Messrs. Klebe and Plant each received an annual cash retainer of $150,000 (payable in quarterly installments in arrears). The following stock options have been granted to Mr. Klebe under the 2014 Incentive Plan and Mr. Plant under the 2015 Non-Employee Director Incentive Plan:
| • | In connection with joining the Board in Fiscal 2016, Mr. Klebe was granted a one-time award of 100,000 time-based vesting stock options on May 12, 2016. These stock options are subject to the vesting restrictions described below. On that same date, Mr. Klebe purchased 75,000 shares of Omaha Topco at a price of $5.00 per share. |
| • | In connection with joining the Board in Fiscal 2015, Mr. Plant was granted a one-time award of 100,000 time-based vesting stock options on May 14, 2015. These stock options are subject to the vesting restrictions described below. On that same date, Mr. Plant purchased 60,000 shares of Omaha Topco at a price of $5.00 per share. |
These stock options vest 20% on each of the first five anniversaries of the grant date. In the event of a change in control (as defined in the 2015 Non-Employee Director Incentive Plan), the stock options, to the extent not already vested, will become fully vested and exercisable. If service terminates for any reason, then the stock options, to the extent not then vested and exercisable, will immediately be canceled. The stock options have a ten-year term, and will generally remain outstanding and exercisable for 90 days following the termination of service as a director (or, if earlier, the expiration date of the stock option). This period is extended to 12 months if service is terminated due to death or disability.
In 2017, we analyzed competitive market data provided by the Consultant (as defined below) relating to director compensation programs, including both cash retainers, equity awards and stock ownership guidelines. These compensation elements were benchmarked against the same 15-company peer group that was used to evaluate executive compensation pay levels and program design and is described in detail below in the section entitled “Role of Independent Compensation Consultant,” as well as a general industry group consisting of comparably sized general industry (excluding financial services) companies with median revenues of approximately Gates’ size. As a result of the analysis, in connection with our IPO, we developed a market-competitive director compensation program for our non-employee, non-Sponsor affiliated directors. The program provides eligible directors with an annual compensation package of $225,000 consisting of $125,000 as an annual cash retainer (payable in quarterly installments in arrears) and $100,000 in value of restricted stock units (payable annually). Restricted stock units will vest in full on the first anniversary of the grant date. Eligible directors may elect to receive all or a portion of their cash retainer in the form of restricted stock units. Restricted stock units elected in lieu of payments in cash will have the same vesting terms as the annual restricted stock unit grant.
98
Table of Contents
As part of this program, the Lead Director and chairpersons of the following committees will receive the additional fixed annual cash retainers (payable in quarterly installments in arrears) listed below. We reimburse all Directors for expenses associated with each meeting attended.
| Role |
Annual Cash Retainers Chair |
|||
| Chair, Audit Committee |
$ | 25,000 | ||
| Chair, Compensation Committee |
$ | 10,000 | ||
| Chair, Nominating and Governance Committee |
$ | 10,000 | ||
We have adopted stock ownership guidelines for our non-employee, non-Sponsor affiliated directors in order to better align our eligible directors’ financial interests with those of our shareholders by requiring such directors to own a minimum level of our shares. Each of our non-employee, non-Sponsor affiliated directors is required to own stock in an amount equal to four times his or her annual cash retainer. Any such director who does not meet the threshold will be required to retain 50% of stock acquired through the exercise or vesting of equity awards made by the Company.
Director Compensation for Fiscal 2017
The following table provides summary information concerning the compensation of our directors, other than our employee director, for Fiscal 2017.
| Name |
Fees Earned or Paid in Cash ($) |
Option Awards ($)(1) |
Total ($) |
|||||||||
| T. Klebe |
$ | 150,000 | — | $ | 150,000 | |||||||
| K. Ovelmen(2) |
$ | 5,200 | — | $ | 5,200 | |||||||
| J. Plant |
$ | 150,000 | — | $ | 150,000 | |||||||
| N. Simpkins |
— | — | — | |||||||||
| D. Calhoun |
— | — | — | |||||||||
| J. Kahr |
— | — | — | |||||||||
| (1) | As of December 30, 2017, Messrs. Klebe and Plant each held 100,000 time-based vesting stock options, respectively, that vest 20% on each of the first five anniversaries of the grant date. |
| (2) | Ms. Ovelmen was appointed to our Board of Directors effective December 15, 2017, and the amount reported represents her cash retainer for her service as a director in Fiscal 2017. |
Item 12. Security Ownership of Certain Beneficial Owners and Management and Related Stockholder Matters
The following table sets forth information regarding the beneficial ownership of our ordinary shares as of March 8, 2018 after giving effect to the pre-IPO reorganization transactions by (1) each person known to us to beneficially own more than 5% of our outstanding ordinary shares, (2) each of our directors and named executive officers and (3) all of our directors and executive officers as a group.
The amounts and percentages of ordinary shares beneficially owned are reported on the basis of SEC regulations governing the determination of beneficial ownership of securities. Under SEC rules, a person is deemed to be a “beneficial owner” of a security if that person has or shares voting power or investment power, which includes the power to dispose of or to direct the disposition of such security. A person is also deemed to be a beneficial owner of any securities of which that person has a right to acquire beneficial ownership within 60 days. Securities that can be so acquired are deemed to be outstanding for purposes of computing such person’s ownership
99
Table of Contents
percentage, but not for purposes of computing any other person’s percentage. Under these rules, more than one person may be deemed to be a beneficial owner of the same securities and a person may be deemed to be a beneficial owner of securities as to which such person has no economic interest.
Except as otherwise indicated in the footnotes below, each of the beneficial owners has, to our knowledge, sole voting and investment power with respect to the indicated ordinary shares. Unless otherwise noted, the address of each beneficial owner is 1551 Wewatta Street, Denver, Colorado 80202
| Ordinary Shares Beneficially Owned |
||||||||
| Name of Beneficial Owner |
Number | % | ||||||
| 5% or greater shareholders: |
||||||||
| Blackstone(1) |
243,985,383 | 84.2 | ||||||
| Directors and named executive officers: |
||||||||
| Ivo Jurek(2) |
583,112 | * | ||||||
| David H. Naemura(3) |
250,900 | * | ||||||
| Walter T. Lifsey(4) |
117,204 | * | ||||||
| Roger C. Gaston(5) |
37,952 | * | ||||||
| Jamey S. Seely |
— | * | ||||||
| Rasmani Bhattacharya |
— | * | ||||||
| David L. Calhoun(6) |
— | * | ||||||
| Neil P. Simpkins(7) |
— | * | ||||||
| Julia C. Kahr(8) |
— | * | ||||||
| John Plant(9) |
91,550 | * | ||||||
| Terry Klebe(10) |
72,477 | * | ||||||
| Karyn Ovelmen |
— | * | ||||||
| Directors and executive officers as a group (13 persons)(11) |
1,200,971 | * | ||||||
| * | Represents less than 1%. |
| (1) | Reflects 112,216,476 ordinary shares directly held by Blackstone Capital Partners (Cayman) VI L.P., 371,540 ordinary shares directly held by Blackstone Family Investment Partnership (Cayman) VI—ESC L.P.,108,509,467 ordinary shares directly held by Blackstone GTS Co-Invest L.P., and 22,887,900 ordinary shares directly held by BTO Omaha Holdings L.P. (together, the “Blackstone Funds”). |
The general partner of each of Blackstone Capital Partners (Cayman) VI L.P. and Blackstone GTS Co-Invest L.P. is Blackstone Management Associates (Cayman) VI L.P. The general partners of each of Blackstone Management Associates (Cayman) VI L.P. and Blackstone Family Investment Partnership (Cayman) VI—ESC L.P. are BCP VI GP L.L.C. and Blackstone LR Associates (Cayman) VI Ltd.
The general partner of BTO Omaha Holdings L.P. is BTO Omaha Manager L.L.C. The managing member of BTO Omaha Manager L.L.C. is Blackstone Tactical Opportunities Management Associates (Cayman) L.P. The general partners of Blackstone Tactical Opportunities Management Associates (Cayman) L.P. are BTO GP L.L.C. and Blackstone Tactical Opportunities LR Associates (Cayman) Ltd.
Blackstone Holdings III L.P. is the sole member of each of BCP VI GP L.L.C. and BTO GP L.L.C. and the controlling shareholder of each of Blackstone LR Associates (Cayman) VI Ltd. and Blackstone Tactical Opportunities LR Associates (Cayman) Ltd. The general partner of Blackstone Holdings III L.P. is Blackstone Holdings III GP L.P. The general partner of Blackstone Holdings III GP L.P. is Blackstone Holdings III GP Management L.L.C. The sole member of Blackstone Holdings III GP Management L.L.C. is The Blackstone Group L.P. The general partner of The Blackstone Group L.P. is Blackstone Group Management L.L.C. Blackstone Group Management L.L.C. is wholly-owned by Blackstone’s senior managing directors and controlled by its founder, Stephen A. Schwarzman. Each of such Blackstone entities (other than each of the Blackstone Funds to the extent they directly hold securities reported herein) and Mr. Schwarzman may be deemed to beneficially own the shares beneficially owned by the Blackstone Funds directly or indirectly controlled by it or him, but each disclaims beneficial ownership of such shares. The address of Mr. Schwarzman and each of the other entities listed in this footnote is c/o The Blackstone Group, L.P., 345 Park Avenue, New York, New York 10154.
100
Table of Contents
| (2) | Includes 433,994 ordinary shares issuable upon exercise of options that are currently exercisable or exercisable within 60 days. |
| (3) | Includes 223,157 ordinary shares issuable upon exercise of options that are currently exercisable or exercisable within 60 days. |
| (4) | Includes 117,204 ordinary shares issuable upon exercise of options that are currently exercisable or exercisable within 60 days. |
| (5) | Includes 24,081 ordinary shares issuable upon exercise of options that are currently exercisable or exercisable within 60 days. |
| (6) | Mr. Calhoun is a Senior Managing Director of The Blackstone Group. Mr. Calhoun disclaims beneficial ownership of any ordinary shares owned directly or indirectly by the Blackstone Funds. |
| (7) | Mr. Simpkins is a Senior Managing Director of The Blackstone Group. Mr. Simpkins disclaims beneficial ownership of any ordinary shares owned directly or indirectly by the Blackstone Funds. |
| (8) | Ms. Kahr is a Senior Managing Director of The Blackstone Group. Ms. Kahr disclaims beneficial ownership of any ordinary shares owned directly or indirectly by the Blackstone Funds. |
| (9) | Includes 45,775 ordinary shares issuable upon exercise of options that are currently exercisable or exercisable within 60 days. |
| (10) | Includes 15,258 ordinary shares issuable upon exercise of options that are currently exercisable or exercisable within 60 days. |
| (11) | Includes 891,986 ordinary shares issuable upon exercise of options that are currently exercisable or exercisable within 60 days. |
The following table summarizes our equity compensation plan information as of December 30, 2017:
| Plan Category | Number of Securities to be Issued upon Exercise of Outstanding Options, Warrants and Rights |
Weighted-Average Exercise Price of Outstanding Options, Warrants, and Rights(1) |
Number of Securities Remaining Available for Future Issuance Under Equity Compensation Plans (Excluding Securities Reflected in the 1st Column of This Table) |
|||||||||
| Equity compensation plans approved by security holders |
26,531,124 | (2) | $ | 6.03 | 12,500,000 | (3) | ||||||
| (1) | Excludes the shares issuable upon the vesting of restricted stock units included in the first column of this table for which there is no weighted-average exercise price. |
| (2) | Consists of 26,531,124 shares of our common stock issuable upon the exercise of outstanding stock options or vesting of restricted stock units awarded under our 2014 Omaha Topco Ltd. Stock Incentive Plan or 2015 Non-Employee Director Incentive Plan. |
| (3) | Our Omnibus Incentive Plan provides that the total number of ordinary shares that may be issued under our Omnibus Incentive Plan is 12,500,000, or the “Absolute Share Limit”; provided, however, that the Absolute Share Limit shall be increased on the first day of each fiscal year beginning with the 2019 fiscal year in an amount equal to the least of (x) 6,500,000 ordinary shares, (y) 2.5% of the total number of ordinary shares outstanding on the last day of the immediately preceding fiscal year, and (z) a lower number of ordinary shares as determined by the board. In connection with the initial approval of our Gates Industrial Corporation Plc 2018 Omnibus Incentive Plan on January 17, 2018, our 2018 Plan replaced our 2014 Plan and 2015 Plan with respect to prospective equity grants. |
101
Table of Contents
Item 13. Certain Relationships And Related Person Transactions, and Director Independence
Statement of Policy Regarding Transactions with Related Persons
Our board of directors has adopted a written statement of policy regarding transactions with related persons, which we refer to as our “related person policy.” Our related person policy requires that a “related person” (as defined in paragraph (a) of Item 404 of Regulation S-K) must promptly disclose to our general counsel any “related person transaction” (defined as any transaction that is anticipated would be reportable by us under Item 404(a) of Regulation S-K in which we were or are to be a participant and the amount involved exceeds $120,000 and in which any related person had or will have a direct or indirect material interest) and all material facts with respect thereto. Our general counsel will then promptly communicate that information to our board of directors. No related person transaction will be executed without the approval or ratification of our board of directors or a duly authorized committee of our board of directors. It is our policy that directors interested in a related person transaction will recuse themselves from any vote on a related person transaction in which they have an interest.
Other Relationships
Blackstone Advisory Partners L.P. received underwriting fees of $3.2 million in connection with the IPO.
Shareholders Agreement
In connection with the pre-IPO reorganization transactions and the IPO, we entered into a shareholders agreement with our Sponsor. The shareholders agreement requires us to nominate a number of individuals designated by our Sponsor for election as our directors at any meeting of our shareholders (each a “Sponsor Director”) such that, following the election of any directors and taking into account any director continuing to serve as such without the need for re-election, the number of Sponsor Directors serving as directors of our company will be equal to: (1) if our pre-IPO owners and their affiliates together continue to beneficially own at least 50% of our ordinary shares entitled to vote generally in the election of directors as of the record date for such meeting, the lowest whole number that is greater than 50% of the total number of directors comprising our board of directors; (2) if our pre-IPO owners and their affiliates together continue to beneficially own at least 40% (but less than 50%) of our ordinary shares entitled to vote generally in the election of directors as of the record date for such meeting, the lowest whole number that is at least 40% of the total number of directors comprising our board of directors; (3) if our pre-IPO owners and their affiliates together continue to beneficially own at least 30% (but less than 40%) of our ordinary shares entitled to vote generally in the election of directors as of the record date for such meeting, the lowest whole number that is at least 30% of the total number of directors comprising our board of directors; (4) if our pre-IPO owners and their affiliates together continue to beneficially own at least 20% (but less than 30%) of our ordinary shares entitled to vote generally in the election of directors as of the record date for such meeting, the lowest whole number that is at least 20% of the total number of directors comprising our board of directors; and (5) if our pre-IPO owners and their affiliates together continue to beneficially own at least 5% (but less than 20%) of our ordinary shares entitled to vote generally in the election of directors as of the record date for such meeting, the lowest whole number that is at least 10% of the total number of directors comprising our board of directors. In the case of a vacancy on our board created by the removal or resignation of a Sponsor Director, the shareholders agreement requires us to nominate an individual designated by our Sponsor for election to fill the vacancy. The above-described provisions of the shareholders agreement will remain in effect until our Sponsor is no longer entitled to nominate a Sponsor Director pursuant to the shareholders agreement, unless our Sponsor requests that it terminate at an earlier date.
The shareholders agreement also provides that, to the fullest extent permitted by law, we renounce any interest or expectancy that we have in, or right to be offered an opportunity to participate in, specified business opportunities that may be presented from time to time to our Sponsor or to members of our board of directors who are not our employees.
102
Table of Contents
Registration Rights Agreement
In connection with the IPO, we entered into a registration rights agreement to provide to our Sponsor an unlimited number of “demand” registration rights. The registration rights agreement also provides our Sponsor customary “piggyback” registration rights and provides that we will pay certain expenses relating to such registrations and indemnify our Sponsor against certain liabilities which may arise under the Securities Act.
Monitoring Fee and Support and Services Agreements
In connection with the Acquisition, Omaha Topco entered into a Transaction and Monitoring Fee Agreement (the “Former Transaction and Monitoring Fee Agreement”) with Blackstone Management Partners L.L.C. (“BMP”) and Blackstone Tactical Opportunities Advisors L.L.C., affiliates of the Sponsor (the “Managers”). Under the Former Transaction and Monitoring Fee Agreement, we paid the Managers, at the closing of the Acquisition, $56.8 million as a transaction fee as consideration for the Managers undertaking due diligence investigations and financial and structural analysis and providing corporate strategy and other advice and negotiation assistance in connection with the Acquisition. In addition, Omaha Topco and certain of its direct and indirect subsidiaries (collectively the “Monitoring Service Recipients”) reimburse the Managers for any out-of-pocket expenses incurred by the Managers and their affiliates.
In addition, under the Former Transaction and Monitoring Fee Agreement, the Monitoring Service Recipients engaged the Managers to provide certain monitoring, advisory and consulting services in the following areas:
| • | advice regarding financings and relationships with lenders and bankers; |
| • | advice regarding the selection, retention and supervision of independent auditors, outside legal counsel, investment bankers and other advisors or consultants; |
| • | advice regarding “Environmental, Social and Governance” issues pertinent to our affairs; |
| • | advice regarding the strategic direction of our business; and |
| • | such other advice directly related to or ancillary to the above advisory services as we may reasonably request. |
In consideration for the monitoring, advisory and consulting services, the Monitoring Service Recipients paid the Managers a monitoring fee at the closing of the Acquisition and have paid, at the beginning of each subsequent fiscal year, a monitoring fee equal to 1% of a covenant EBITDA measure as defined in accordance with the agreements governing our senior secured credit facilities. The Former Transaction and Monitoring Fee Agreement also contemplates that Monitoring Service Recipients will pay to the Managers a milestone payment upon the consummation of an initial public offering.
In connection with the IPO, we and the Managers terminated the Former Transaction and Monitoring Fee Agreement and we entered into a new Monitoring Fee Agreement (the “New Monitoring Fee Agreement”) with the Managers that is substantially similar to the Former Transaction and Monitoring Fee Agreement, except that the New Monitoring Fee Agreement does not require the payment of a milestone payment in connection with an initial public offering and the New Monitoring Fee Agreement will terminate upon the earlier to occur of (i) the second anniversary of the closing date of our IPO and (ii) the date our Sponsor beneficially owns less than 5% of our ordinary shares and such shares have a fair market value of less than $25 million. Following termination, the Managers will refund us any portion of the monitoring fee previously paid in respect of fiscal quarters that follow the termination date.
In addition, in connection with the Acquisition, Omaha Topco entered into a Support and Services Agreement (the “Former Support and Services Agreement”) with BMP. Under the Former Support and Services Agreement, Omaha Topco and certain of its direct and indirect subsidiaries reimbursed BMP and its affiliates for expenses related to support services customarily provided by Blackstone’s portfolio operations group to Blackstone’s portfolio companies, as well as healthcare-related services provided by Blackstone’s Equity Healthcare group and Blackstone’s group purchasing program. In connection with the IPO, we and BMP terminated the Former Support and Services Agreement and we entered into a new Support and Services Agreement with the Managers that is
103
Table of Contents
Substantially similar to the Former Support and Services Agreement, except that it terminates on the date our Sponsor beneficially owns less than 5% of our ordinary shares and such shares have a fair market value of less than $25 million, or such earlier date as may be chosen by Blackstone.
Pursuant to these agreements, we paid affiliates of our Sponsor $6.7 million, $6.1 million, and $7.0 million during Fiscal 2017, Fiscal 2016, Fiscal 2015, respectively.
Private Placements of Omaha Topco Common Stock
The share information with respect to Omaha Topco in this “—Private Placements of Omaha Topco Common Stock” section has not been adjusted to give effect to the pre-IPO reorganization transactions.
On May 14, 2015, Omaha Topco issued and sold 60,000 shares of its common stock to John Plant, one of our directors, for an aggregate purchase price of $300,000.
On May 18, 2015, Omaha Topco issued and sold 150,000 shares of its common stock to Ivo Jurek, our Chief Executive Officer and one of our directors, for an aggregate purchase price of $750,000.
On May 12, 2016, Omaha Topco issued and sold 75,000 shares of its common stock to Terry Klebe, one of our directors, for an aggregate purchase price of $375,000.
On March 10, 2017, Omaha Topco issued and sold 45,455 shares of its common stock to Ivo Jurek, our Chief Executive Officer and one of our directors, for an aggregate purchase price of $250,002.50.
On March 10, 2017, Omaha Topco issued and sold 36,364 shares of its common stock to David H. Naemura, our Chief Financial Officer, for an aggregate purchase price of $200,002.
On March 10, 2017, Omaha Topco issued and sold 18,182 shares of its common stock to Roger Gaston, our Executive Vice President—Human Resources, for an aggregate purchase price of $100,001.
Commercial Transactions with Sponsor Portfolio Companies
Our Sponsor and its affiliates have ownership interests in a broad range of companies. We have entered and may in the future enter into commercial transactions in the ordinary course of our business with some of these companies, including the sale of goods and services and the purchase of goods and services.
During the periods presented, through to November 2, 2017, Blackstone held an interest in Alliance Automotive Group (“Alliance”), a wholesale distributor of automotive parts in France and the United Kingdom. Net sales by Gates to affiliates of Alliance during the portion of Fiscal 2017 in which Blackstone controlled Alliance were $27.2 million, compared with $20.0 million during Fiscal 2016 and $11.1 million during Fiscal 2015.
During Fiscal 2016 and Fiscal 2015, Blackstone also held an interest in Optiv Inc., an entity that supplies Gates with certain IT-related services. During Fiscal 2016 and Fiscal 2015, Gates paid Optiv Inc. $1.2 million and $0.2 million, respectively. Blackstone sold Optiv in December 2016, and it was therefore not a related party to Gates during Fiscal 2017.
Indemnification Agreements
We are party to indemnification agreements with our directors and executive officers to indemnify them to the maximum extent allowed under applicable law. These agreements indemnify these individuals against certain costs, charges, losses, liabilities, damages and expenses incurred by such director or officer in the execution or discharge of his or her duties or the exercise of his or her powers or otherwise in relation to or in connection with his or her duties, powers or office. These agreements do not indemnify our directors against any liability attaching to such individuals in connection with any negligence, default, breach of duty or breach of trust in relation to the company of which he or she is a director, which would be rendered void under the Companies Act 2006.
104
Table of Contents
There is currently no pending material litigation or proceeding involving any of our directors, officers or employees for which indemnification is sought.
Depositary Receipt Arrangements
In connection with the pre-IPO reorganization transactions described under “About this Annual Report—Financial Statement Presentation,” our Sponsor and the other equity owners of Omaha Topco received depositary receipts, each representing one ordinary share in Gates Industrial Corporation plc in consideration for their equity in Omaha Topco, at a ratio of 0.76293 of our ordinary shares for each outstanding share of Omaha Topco. The depositary receipts were issued by Computershare Trust Company, N.A., as depositary (the “Depositary”), and a nominee for the Depositary (the “Depositary Nominee”) is the registered holder of the ordinary shares of Gates Industrial Corporation plc issued in exchange for the outstanding shares of Omaha Topco.
The depositary receipts arrangement was established because, as a result of restrictions on transfer on certain of the ordinary shares concerned, those ordinary shares could not be issued directly into DTC at the time of our IPO. The use of the Depositary allows for the shares to be held in the Depositary initially and subsequently transferred into DTC without the application of U.K. stamp duty or SDRT, provided certain conditions are met. The depositary receipts are not registered or listed on the NYSE or any other stock exchange, are not be eligible for DTC, and no trading market for them has developed. Instead, subject to compliance with applicable securities laws and contractual restrictions on transfer, the pre-IPO owners may request of the Depositary that all or a portion of their depositary receipts be cancelled in order to effectuate a transfer of the ordinary shares underlying such depositary receipts to Cede & Co., as nominee/custodian for DTC, which holds the transferred ordinary shares on its customary terms, in order to settle trades of such ordinary shares (in the public market or otherwise), or to otherwise hold or transfer such shares through and within the systems of DTC.
Subject to compliance with applicable securities laws and contractual restrictions on transfer, the holders of the depositary receipts are generally entitled to the same rights as a direct holder of our ordinary shares or an investor holding book-entry interests in our ordinary shares through DTC.
A holder of depositary receipts is entitled to withdraw the ordinary shares underlying its depositary receipts from the Depositary upon the surrender of such depositary receipts to the Depositary and the delivery of applicable transfer documentation.
105
Table of Contents
Item 14. Principal Accounting Fees and Services
The following table sets out the fees payable by Gates to our principal accountant, Deloitte & Touche LLP during the years ended December 30, 2017 and December 31, 2016:
| (dollars in millions) | As of December 30, 2017 |
As of December 31, 2016 |
||||||
| Audit fees(1) |
$ | 5.4 | $ | 3.9 | ||||
| Tax fees |
0.9 | 0.7 | ||||||
| All other fees(2) |
0.4 | 0.3 | ||||||
|
|
|
|
|
|||||
| Total fees |
$ | 6.7 | $ | 4.9 | ||||
|
|
|
|
|
|||||
| (1) | Includes the audit and review of our financial statements, statutory audits and IPO-related services. |
| (2) | Includes financial due diligence related to acquisitions and potential acquisitions. |
On December 15, 2017, in anticipation of becoming a public-traded company, the Company adopted an Audit Committee charter that requires the Audit Committee to preapprove the engagement terms and fees of Deloitte LLP for all services. Before the adoption of this charter, the Audit Committee [of Omaha Topco] delegated to management the authority to pre-approve all services from independent auditors, requiring management to report back regularly to the Audit Committee on the terms and fees of such engagement. The fees incurred for 2016 and 2017 in the table above were incurred prior to the adoption of the Company’s new Audit Committee charter.
Item 15. Exhibits, Financial Statement Schedules
The following documents are filed as part of this report.
(a) Financial Statements and Schedule. See Index to Financial Statements on page F-1 hereof.
(b) Exhibits
Index to Exhibits
106
Table of Contents
107
Table of Contents
| * | Filed herewith. |
| † | Management contract or compensatory plan or arrangement. |
Not applicable.
108
Table of Contents
Pursuant to the requirements of Section 13 or 15(d) of the Securities Exchange Act of 1934, the registrant has duly caused this report to be signed on its behalf by the undersigned, thereunto duly authorized.
| GATES INDUSTRIAL CORPORATION PLC | ||
| By: |
/s/ David H. Naemura | |
| Name: David H. Naemura | ||
| Title: Chief Financial Officer | ||
March 14, 2018
Pursuant to the requirements of the Securities Exchange Act of 1934, this report has been signed below by the following persons on behalf of the registrant and in the capacities and on the date indicated.
| Signature | Title | |
| /s/ Ivo Jurek Ivo Jurek |
Chief Executive Officer and Director | |
| /s/ David H. Naemura David H. Naemura |
Chief Financial Officer (principal financial officer and principal accounting officer) and Gates’ authorized representative in the United States | |
| /s/ David L. Calhoun David L. Calhoun |
Director | |
| /s/ Neil P. Simpkins Neil P. Simpkins |
Director | |
| /s/ Julia C. Kahr Julia C. Kahr |
Director | |
| /s/ John Plant John Plant |
Director | |
| /s/ Terry Klebe Terry Klebe |
Director | |
| /s/ Karyn Ovelmen Karyn Ovelmen |
Director | |
109
Table of Contents
| Audited Consolidated Financial Statements of Gates Industrial Corporation plc and its subsidiaries: |
||||
| F-2 | ||||
| F-3 | ||||
| F-4 | ||||
| Consolidated Balance Sheets as of December 30, 2017 and December 31, 2016 |
F-5 | |||
| F-6 | ||||
| F-7 | ||||
| F-8 |
F-1
Table of Contents
REPORT OF INDEPENDENT REGISTERED PUBLIC ACCOUNTING FIRM
To the shareholders and the Board of Directors of Gates Industrial Corporation plc
Opinion on the Financial Statements
We have audited the accompanying consolidated balance sheets of Gates Industrial Corporation plc and subsidiaries (the “Company”) as of December 30, 2017 and December 31, 2016, the related consolidated statements of operations, comprehensive income, shareholders’ equity, and cash flows, for each of the three years in the period ended December 30, 2017, and the related notes (collectively referred to as the “financial statements”). In our opinion, the financial statements present fairly, in all material respects, the financial position of the Company as of December 30, 2017 and December 31, 2016, and the results of its operations and its cash flows for each of the three years in the period ended December 30, 2017, in conformity with accounting principles generally accepted in the United States of America.
Basis for Opinion
These financial statements are the responsibility of the Company’s management. Our responsibility is to express an opinion on the Company’s consolidated financial statements based on our audits. We are a public accounting firm registered with the Public Company Accounting Oversight Board (United States) (PCAOB) and are required to be independent with respect to the Company in accordance with the U.S. federal securities laws and the applicable rules and regulations of the Securities and Exchange Commission and the PCAOB.
We conducted our audits in accordance with the standards of the PCAOB. Those standards require that we plan and perform the audit to obtain reasonable assurance about whether the consolidated financial statements are free of material misstatement, whether due to error or fraud. The Company is not required to have, nor were we engaged to perform, an audit of its internal control over financial reporting. As part of our audits, we are required to obtain an understanding of internal control over financial reporting but not for the purpose of expressing an opinion on the effectiveness of the Company’s internal control over financial reporting. Accordingly, we express no such opinion.
Our audits included performing procedures to assess the risks of material misstatement of the consolidated financial statements, whether due to error or fraud, and performing procedures that respond to those risks. Such procedures included examining, on a test basis, evidence regarding the amounts and disclosures in the financial statements. Our audits also included evaluating the accounting principles used and significant estimates made by management, as well as evaluating the overall presentation of the financial statements. We believe that our audits provide a reasonable basis for our opinion.
/s/ Deloitte & Touche LLP
Denver, Colorado
March 14, 2018
We have served as the Company’s auditor since 2014.
F-2
Table of Contents
Gates Industrial Corporation plc
Consolidated Statements of Operations
| For the year ended | ||||||||||||
| (dollars in millions, except per share amounts) |
December 30, 2017 |
December 31, 2016 |
January 2, 2016 |
|||||||||
| Net sales |
$ | 3,041.7 | $ | 2,747.0 | $ | 2,745.1 | ||||||
| Cost of sales |
1,823.7 | 1,686.2 | 1,709.0 | |||||||||
|
|
|
|
|
|
|
|||||||
| Gross profit |
1,218.0 | 1,060.8 | 1,036.1 | |||||||||
| Selling, general and administrative expenses |
779.6 | 744.1 | 784.5 | |||||||||
| Transaction-related costs |
18.1 | 0.4 | 0.7 | |||||||||
| Impairment of intangibles and other assets |
2.8 | 3.2 | 51.1 | |||||||||
| Restructuring expenses |
17.4 | 11.4 | 15.6 | |||||||||
| Other operating (income) expense |
(0.3 | ) | 2.8 | (0.4 | ) | |||||||
|
|
|
|
|
|
|
|||||||
| Operating income from continuing operations |
400.4 | 298.9 | 184.6 | |||||||||
| Interest expense |
234.6 | 216.3 | 212.6 | |||||||||
| Other expense (income) |
56.3 | (10.4 | ) | (69.7 | ) | |||||||
|
|
|
|
|
|
|
|||||||
| Income from continuing operations before taxes |
109.5 | 93.0 | 41.7 | |||||||||
| Income tax (benefit) expense |
(72.5 | ) | 21.1 | (9.2 | ) | |||||||
|
|
|
|
|
|
|
|||||||
| Net income from continuing operations |
182.0 | 71.9 | 50.9 | |||||||||
| Gain on disposal of discontinued operations, net of tax, respectively, of $0, $0 and $0 |
0.7 | 12.4 | — | |||||||||
|
|
|
|
|
|
|
|||||||
| Net income |
182.7 | 84.3 | 50.9 | |||||||||
| Non-controlling interests |
(31.4 | ) | (26.6 | ) | (26.0 | ) | ||||||
|
|
|
|
|
|
|
|||||||
| Net income attributable to shareholders |
$ | 151.3 | $ | 57.7 | $ | 24.9 | ||||||
|
|
|
|
|
|
|
|||||||
| Earnings per share |
||||||||||||
| Basic |
||||||||||||
| Earnings per share from continuing operations |
$ | 0.62 | $ | 0.18 | $ | 0.10 | ||||||
| Earnings per share from discontinued operations |
— | 0.05 | — | |||||||||
|
|
|
|
|
|
|
|||||||
| Net income per share |
$ | 0.62 | $ | 0.23 | $ | 0.10 | ||||||
|
|
|
|
|
|
|
|||||||
| Diluted |
||||||||||||
| Earnings per share from continuing operations |
$ | 0.60 | $ | 0.18 | $ | 0.10 | ||||||
| Earnings per share from discontinued operations |
— | 0.05 | — | |||||||||
|
|
|
|
|
|
|
|||||||
| Net income per share |
$ | 0.60 | $ | 0.23 | $ | 0.10 | ||||||
|
|
|
|
|
|
|
|||||||
The accompanying notes form an integral part of these consolidated financial statements.
F-3
Table of Contents
Gates Industrial Corporation plc
Consolidated Statements of Comprehensive Income
| For the year ended | ||||||||||||
| (dollars in millions) |
December 30, 2017 |
December 31, 2016 |
January 2, 2016 |
|||||||||
| Net income |
$ | 182.7 | $ | 84.3 | $ | 50.9 | ||||||
| Other comprehensive income (loss) |
||||||||||||
| Foreign currency translation: |
||||||||||||
| —Net translation gain (loss) on foreign operations, net of tax benefit (expense) respectively of $15.0, ($5.6), and ($11.1) |
280.2 | (196.3 | ) | (383.7 | ) | |||||||
| —(Loss) gain on net investment hedges, net of tax benefit, respectively, of $0, $0.3 and $0 |
(109.4 | ) | 33.7 | (27.3 | ) | |||||||
|
|
|
|
|
|
|
|||||||
| Total foreign currency translation movements |
170.8 | (162.6 | ) | (411.0 | ) | |||||||
| Cash flow hedges (Interest rate caps): |
||||||||||||
| —Loss arising in the period, net of tax expense, respectively, of $0, $0 and $0 |
(2.0 | ) | (7.0 | ) | (18.4 | ) | ||||||
| —Reclassification to net income, net of tax expense, respectively, of $2.0, $1.3 and $0 |
9.6 | 4.1 | 0.7 | |||||||||
|
|
|
|
|
|
|
|||||||
| Total cash flow hedges movements |
7.6 | (2.9 | ) | (17.7 | ) | |||||||
| Available-for-sale investments: |
||||||||||||
| —Net unrealized (loss) gain, net of tax benefit (expense), respectively, of $0.1, $0.1 and ($0.1) |
(0.2 | ) | (0.4 | ) | 0.3 | |||||||
| —Reclassification to net income of gain on investments sold, net of tax expense, respectively, of $0, $0 and $0 |
— | (0.3 | ) | — | ||||||||
|
|
|
|
|
|
|
|||||||
| Total available-for-sale investment movements |
(0.2 | ) | (0.7 | ) | 0.3 | |||||||
| Post-retirement benefits: |
||||||||||||
| —Actuarial gain (loss), net of tax (expense) benefit, respectively, of ($5.4), $2.3 and $0.3 |
20.2 | (6.4 | ) | (2.9 | ) | |||||||
| —Reclassification of actuarial gain to net income, net of tax benefit, respectively, of $0, $0.2 and $0.4 |
— | (0.3 | ) | (0.6 | ) | |||||||
|
|
|
|
|
|
|
|||||||
| Total post-retirement benefit movements |
20.2 | (6.7 | ) | (3.5 | ) | |||||||
|
|
|
|
|
|
|
|||||||
| Other comprehensive income (loss) |
198.4 | (172.9 | ) | (431.9 | ) | |||||||
|
|
|
|
|
|
|
|||||||
| Comprehensive income (loss) for the period |
$ | 381.1 | $ | (88.6 | ) | $ | (381.0 | ) | ||||
|
|
|
|
|
|
|
|||||||
| Comprehensive income (loss) attributable to shareholders: |
||||||||||||
| —Arising from continuing operations |
$ | 319.1 | $ | (110.7 | ) | $ | (387.2 | ) | ||||
| —Arising from discontinued operations |
0.7 | 12.4 | — | |||||||||
|
|
|
|
|
|
|
|||||||
| 319.8 | (98.3 | ) | (387.2 | ) | ||||||||
| Comprehensive income attributable to non-controlling interests |
61.3 | 9.7 | 6.2 | |||||||||
|
|
|
|
|
|
|
|||||||
| $ | 381.1 | $ | (88.6 | ) | $ | (381.0 | ) | |||||
|
|
|
|
|
|
|
|||||||
The accompanying notes form an integral part of these consolidated financial statements.
F-4
Table of Contents
Gates Industrial Corporation plc
Consolidated Balance Sheets
| (dollars in millions, except share numbers and per share amounts) |
As of December 30, 2017 |
As of December 31, 2016 |
||||||
| Assets |
||||||||
| Current assets |
||||||||
| Cash and cash equivalents |
$ | 564.4 | $ | 527.2 | ||||
| Trade accounts receivable, net of allowances of $6.8 and $3.4 |
713.8 | 650.5 | ||||||
| Inventories |
457.1 | 366.9 | ||||||
| Taxes receivable |
14.1 | 8.9 | ||||||
| Prepaid expenses and other assets |
76.8 | 71.2 | ||||||
|
|
|
|
|
|||||
| Total current assets |
1,826.2 | 1,624.7 | ||||||
|
|
|
|
|
|||||
| Non-current assets |
||||||||
| Property, plant and equipment, net |
686.2 | 599.6 | ||||||
| Goodwill |
2,085.5 | 1,912.3 | ||||||
| Pension surplus |
57.7 | 42.1 | ||||||
| Intangible assets, net |
2,126.8 | 2,144.1 | ||||||
| Taxes receivable |
32.7 | 32.1 | ||||||
| Other non-current assets |
38.6 | 28.4 | ||||||
|
|
|
|
|
|||||
| Total assets |
$ | 6,853.7 | $ | 6,383.3 | ||||
|
|
|
|
|
|||||
| Liabilities and equity |
||||||||
| Current liabilities |
||||||||
| Debt, current portion |
$ | 66.4 | $ | 46.9 | ||||
| Trade accounts payable |
392.0 | 313.1 | ||||||
| Taxes payable |
29.0 | 20.3 | ||||||
| Accrued expenses and other current liabilities |
210.4 | 199.2 | ||||||
|
|
|
|
|
|||||
| Total current liabilities |
697.8 | 579.5 | ||||||
|
|
|
|
|
|||||
| Non-current liabilities |
||||||||
| Debt, less current portion |
3,889.3 | 3,790.0 | ||||||
| Post-retirement benefit obligations |
157.1 | 171.6 | ||||||
| Taxes payable |
100.6 | 95.0 | ||||||
| Deferred income taxes |
517.1 | 652.3 | ||||||
| Other non-current liabilities |
63.4 | 26.5 | ||||||
|
|
|
|
|
|||||
| Total liabilities |
5,425.3 | 5,314.9 | ||||||
|
|
|
|
|
|||||
| Commitments and contingent liabilities (Note 22) |
||||||||
| Shareholders’ equity |
||||||||
| —Shares, par value of $0.01 each—authorized shares: 3,000,000,000; outstanding shares: 245,474,605 (December 31, 2016: authorized shares: 3,000,000,000; outstanding shares: 245,627,952) |
2.5 | 2.5 | ||||||
| —Additional paid in capital |
1,622.6 | 1,619.0 | ||||||
| —Accumulated other comprehensive loss |
(747.4 | ) | (915.9 | ) | ||||
| —Retained earnings (deficit) |
136.9 | (14.3 | ) | |||||
|
|
|
|
|
|||||
| Total shareholders’ equity |
1,014.6 | 691.3 | ||||||
| Non-controlling interests |
413.8 | 377.1 | ||||||
|
|
|
|
|
|||||
| Total equity |
1,428.4 | 1,068.4 | ||||||
|
|
|
|
|
|||||
| Total liabilities and equity |
$ | 6,853.7 | $ | 6,383.3 | ||||
|
|
|
|
|
|||||
The accompanying notes form an integral part of these consolidated financial statements.
F-5
Table of Contents
Gates Industrial Corporation plc
Consolidated Statements of Cash Flows
| For the year ended | ||||||||||||
| (dollars in millions) |
December 30, 2017 |
December 31, 2016 |
January 2, 2016 |
|||||||||
| Cash flows from operating activities |
||||||||||||
| Net income |
$ | 182.7 | $ | 84.3 | $ | 50.9 | ||||||
| Adjustments to reconcile net income to net cash provided by operations: |
||||||||||||
| Depreciation and amortization |
212.2 | 240.8 | 269.9 | |||||||||
| Impairments of intangibles and other assets |
4.8 | 3.2 | 51.3 | |||||||||
| Gain on disposal of businesses |
(0.9 | ) | (10.1 | ) | (0.4 | ) | ||||||
| Non-cash currency transaction loss (gain) on net debt and hedging instruments |
57.4 | 3.1 | (67.9 | ) | ||||||||
| Other net non-cash financing costs |
47.6 | 13.7 | 16.0 | |||||||||
| Share-based compensation expense |
5.4 | 4.2 | 4.3 | |||||||||
| Decrease in post-employment benefit obligations (net) |
(7.4 | ) | (5.8 | ) | (11.6 | ) | ||||||
| Deferred income taxes |
(162.8 | ) | (54.3 | ) | (67.4 | ) | ||||||
| Other operating activities |
1.6 | 0.8 | 1.5 | |||||||||
| Changes in operating assets and liabilities, net of effects of acquisitions: |
||||||||||||
| —(Increase) decrease in accounts receivable |
(24.6 | ) | (44.8 | ) | 4.3 | |||||||
| —(Increase) decrease in inventories |
(45.4 | ) | 39.5 | 9.5 | ||||||||
| —Increase in accounts payable |
49.9 | 50.2 | 46.5 | |||||||||
| —(Increase) decrease in prepaid expenses and other assets |
(4.1 | ) | (7.2 | ) | 1.6 | |||||||
| —Increase (decrease) in taxes payable |
6.5 | 35.0 | (21.5 | ) | ||||||||
| —(Decrease) increase in other liabilities |
(9.4 | ) | 19.0 | (11.1 | ) | |||||||
|
|
|
|
|
|
|
|||||||
| Net cash provided by operations |
313.5 | 371.6 | 275.9 | |||||||||
|
|
|
|
|
|
|
|||||||
| Cash flows from investing activities |
||||||||||||
| Purchases of property, plant and equipment |
(101.1 | ) | (59.0 | ) | (78.5 | ) | ||||||
| Purchases of intangible assets |
(10.0 | ) | (9.1 | ) | (7.3 | ) | ||||||
| Decrease in restricted cash |
0.1 | 2.7 | 25.6 | |||||||||
| Proceeds from the sale of property, plant and equipment |
2.3 | 5.2 | 2.7 | |||||||||
| Purchase of subsidiaries, net of cash acquired |
(110.7 | ) | — | — | ||||||||
| Other investing activities |
(1.2 | ) | 0.1 | (3.0 | ) | |||||||
|
|
|
|
|
|
|
|||||||
| Net cash used in investing activities |
(220.6 | ) | (60.1 | ) | (60.5 | ) | ||||||
|
|
|
|
|
|
|
|||||||
| Cash flows from financing activities |
||||||||||||
| Issue of shares |
0.6 | 1.1 | 12.2 | |||||||||
| Deferred offering costs |
(2.3 | ) | — | — | ||||||||
| Buy-back of shares |
(1.6 | ) | (2.0 | ) | (1.5 | ) | ||||||
| Proceeds from long-term debt |
644.7 | 0.1 | 0.8 | |||||||||
| Payments of long-term debt |
(676.9 | ) | (67.3 | ) | (52.5 | ) | ||||||
| Debt issuance costs paid |
(18.8 | ) | — | — | ||||||||
| Dividends paid to non-controlling interests |
(24.6 | ) | (38.9 | ) | (28.1 | ) | ||||||
| Other financing activities |
3.6 | (3.8 | ) | (4.8 | ) | |||||||
|
|
|
|
|
|
|
|||||||
| Net cash used in financing activities |
(75.3 | ) | (110.8 | ) | (73.9 | ) | ||||||
| Effect of exchange rate changes on cash and cash equivalents |
19.6 | (9.2 | ) | (14.2 | ) | |||||||
|
|
|
|
|
|
|
|||||||
| Net increase in cash and cash equivalents |
37.2 | 191.5 | 127.3 | |||||||||
| Cash and cash equivalents at beginning of period |
527.2 | 335.7 | 208.4 | |||||||||
|
|
|
|
|
|
|
|||||||
| Cash and cash equivalents at the end of the period |
$ | 564.4 | $ | 527.2 | $ | 335.7 | ||||||
|
|
|
|
|
|
|
|||||||
| Supplemental schedule of cash flows |
||||||||||||
| Interest paid |
$ | 198.0 | $ | 198.8 | $ | 208.0 | ||||||
| Income taxes paid, net |
$ | 84.8 | $ | 41.7 | $ | 86.4 | ||||||
| Non-cash accrued capital expenditures |
$ | 1.7 | $ | 3.9 | $ | — | ||||||
| Accrued deferred offering costs |
$ | 4.1 | $ | — | $ | — | ||||||
The accompanying notes form an integral part of these consolidated financial statements.
F-6
Table of Contents
Gates Industrial Corporation plc
Consolidated Statements of Shareholders’ Equity
| (dollars in millions) |
Share capital |
Additional paid-in-capital |
Accumulated other comprehensive loss |
Retained (deficit) earnings |
Total shareholders’ equity |
Non- controlling interests |
Total equity |
|||||||||||||||||||||
| As of January 3, 2015 |
$ | 2.4 | $ | 1,598.5 | $ | (347.8 | ) | $ | (96.9 | ) | $ | 1,156.2 | $ | 428.2 | $ | 1,584.4 | ||||||||||||
| Net income |
— | — | — | 24.9 | 24.9 | 26.0 | 50.9 | |||||||||||||||||||||
| Other comprehensive loss |
— | — | (412.1 | ) | — | (412.1 | ) | (19.8 | ) | (431.9 | ) | |||||||||||||||||
|
|
|
|
|
|
|
|
|
|
|
|
|
|
|
|||||||||||||||
| Total comprehensive (loss) income |
— | — | (412.1 | ) | 24.9 | (387.2 | ) | 6.2 | (381.0 | ) | ||||||||||||||||||
|
|
|
|
|
|
|
|
|
|
|
|
|
|
|
|||||||||||||||
| Other changes in equity: |
||||||||||||||||||||||||||||
| —Issue of shares |
0.1 | 12.1 | — | — | 12.2 | — | 12.2 | |||||||||||||||||||||
| —Buy-back of shares |
— | (1.5 | ) | — | — | (1.5 | ) | — | (1.5 | ) | ||||||||||||||||||
| —Share-based compensation (net of tax benefit of $2.3) |
— | 6.6 | — | — | 6.6 | — | 6.6 | |||||||||||||||||||||
| —Dividends paid to non-controlling interests |
— | — | — | — | — | (28.1 | ) | (28.1 | ) | |||||||||||||||||||
|
|
|
|
|
|
|
|
|
|
|
|
|
|
|
|||||||||||||||
| As of January 2, 2016 |
2.5 | 1,615.7 | (759.9 | ) | (72.0 | ) | 786.3 | 406.3 | 1,192.6 | |||||||||||||||||||
|
|
|
|
|
|
|
|
|
|
|
|
|
|
|
|||||||||||||||
| Net income |
— | — | — | 57.7 | 57.7 | 26.6 | 84.3 | |||||||||||||||||||||
| Other comprehensive loss |
— | — | (156.0 | ) | — | (156.0 | ) | (16.9 | ) | (172.9 | ) | |||||||||||||||||
|
|
|
|
|
|
|
|
|
|
|
|
|
|
|
|||||||||||||||
| Total comprehensive (loss) income |
— | — | (156.0 | ) | 57.7 | (98.3 | ) | 9.7 | (88.6 | ) | ||||||||||||||||||
|
|
|
|
|
|
|
|
|
|
|
|
|
|
|
|||||||||||||||
| Other changes in equity: |
||||||||||||||||||||||||||||
| —Issue of shares |
— | 1.1 | — | — | 1.1 | — | 1.1 | |||||||||||||||||||||
| —Buy-back of shares |
— | (2.0 | ) | — | — | (2.0 | ) | — | (2.0 | ) | ||||||||||||||||||
| —Share-based compensation (net of tax benefit of $0) |
— | 4.2 | — | — | 4.2 | — | 4.2 | |||||||||||||||||||||
| —Dividends paid to non-controlling interests |
— | — | — | — | — | (38.9 | ) | (38.9 | ) | |||||||||||||||||||
|
|
|
|
|
|
|
|
|
|
|
|
|
|
|
|||||||||||||||
| As of December 31, 2016 |
2.5 | 1,619.0 | (915.9 | ) | (14.3 | ) | 691.3 | 377.1 | 1,068.4 | |||||||||||||||||||
|
|
|
|
|
|
|
|
|
|
|
|
|
|
|
|||||||||||||||
| Net income |
— | — | — | 151.3 | 151.3 | 31.4 | 182.7 | |||||||||||||||||||||
| Other comprehensive income |
— | — | 168.5 | — | 168.5 | 29.9 | 198.4 | |||||||||||||||||||||
|
|
|
|
|
|
|
|
|
|
|
|
|
|
|
|||||||||||||||
| Total comprehensive income |
— | — | 168.5 | 151.3 | 319.8 | 61.3 | 381.1 | |||||||||||||||||||||
|
|
|
|
|
|
|
|
|
|
|
|
|
|
|
|||||||||||||||
| Other changes in equity: |
||||||||||||||||||||||||||||
| —Issue of shares |
— | 0.6 | — | — | 0.6 | — | 0.6 | |||||||||||||||||||||
| —Buy-back of shares |
— | (1.5 | ) | — | (0.1 | ) | (1.6 | ) | — | (1.6 | ) | |||||||||||||||||
| —Share-based compensation (net of tax benefit of $0) |
— | 4.5 | — | — | 4.5 | — | 4.5 | |||||||||||||||||||||
| —Dividends paid to non-controlling interests |
— | — | — | — | — | (24.6 | ) | (24.6 | ) | |||||||||||||||||||
|
|
|
|
|
|
|
|
|
|
|
|
|
|
|
|||||||||||||||
| As of December 30, 2017 |
$ | 2.5 | $ | 1,622.6 | $ | (747.4 | ) | $ | 136.9 | $ | 1,014.6 | $ | 413.8 | $ | 1,428.4 | |||||||||||||
|
|
|
|
|
|
|
|
|
|
|
|
|
|
|
|||||||||||||||
The accompanying notes form an integral part of these consolidated financial statements.
F-7
Table of Contents
Gates Industrial Corporation plc
Notes to the Consolidated Financial Statements
1. Background
Gates Industrial Corporation plc (the “Company”) is a public limited company that was organized under the laws of England and Wales on September 25, 2017. Following the completion of the initial public offering of the Company’s shares in January 2018, the Company undertook certain reorganization transactions (the “Transactions”) such that Gates Industrial Corporation plc now owns indirectly all of the equity interests in Omaha Topco Limited (“Omaha Topco”), which is incorporated in the Cayman Islands, and has become the holding company of the Gates business. The previous owners of Omaha Topco were The Blackstone Group L.P. (“Blackstone” or our “Sponsor”), various investment funds managed by Blackstone, and Gates management equity holders. These equity owners of Omaha Topco received depositary receipts representing ordinary shares in the Company in consideration for their equity in Omaha Topco, at a ratio of 0.76293 of our ordinary shares for each outstanding ordinary share of Omaha Topco. All share and per share amounts in these consolidated financial statements have been retrospectively adjusted to reflect the effect of the split. The reorganization was accounted for as a transaction between entities under common control and the net assets were recorded at the historical cost basis, in a manner similar to a pooling of interests, when Omaha Topco was contributed into the Company. Gates Industrial Corporation plc had no significant business transactions or activities prior to the date of the Transactions, and as a result, the historical financial information reflects that of Omaha Topco.
In these consolidated financial statements and related notes, all references to the “Gates”, “Group”, “we”, “us”, “our” refer, unless the context requires otherwise, to the Company and its subsidiaries.
Gates manufactures a wide range of power transmission and fluid power products and components for a large variety of industrial and automotive applications, both in the aftermarket and first-fit channels, throughout the world. Gates is comprised of two operating segments: Power Transmission and Fluid Power.
2. Significant accounting policies
A. Basis of preparation
The consolidated financial statements and related notes have been prepared in accordance with accounting principles generally accepted in the United States of America (“U.S. GAAP”) and are presented in U.S. dollars unless otherwise indicated.
The accounting policies used in preparing these consolidated financial statements and related notes are the same as those applied in the prior period, except for the adoption of the following new Accounting Standard Updates (“ASU”) at the beginning of Fiscal 2017:
| • | ASU 2015-02 “Consolidation” (Topic 810): Amendments to the Consolidation Analysis |
| • | ASU 2015-16 “Business Combinations” (Topic 805): Simplifying the Accounting for Measurement-Period Adjustments |
| • | ASU 2016-09 “Compensation – Stock Compensation” (Topic 718): Improvements to Employee Share-based Payment Accounting |
| • | ASU 2017-04 “Intangibles – Goodwill and Other” (Topic 350): Simplifying the Test for Goodwill Impairment |
In January 2017, the Financial Accounting Standards Board (“FASB”) issued ASU 2017-04 which eliminates step 2 of the Goodwill impairment test. Instead, an entity should perform its goodwill impairment test by comparing the fair value of a reporting unit with its carrying amount. An entity should recognize an impairment charge for the amount by which the carrying amount exceeds the reporting unit’s fair value (but the loss recognized may not exceed the total amount of goodwill allocated to that reporting unit). We have early adopted this pronouncement on a prospective basis.
Adoption of the above new ASUs did not have a significant impact on Gates’ results or financial position during Fiscal 2017.
Certain amounts in the prior years’ consolidated financial statements have been reclassified to conform to the current year presentation.
B. Accounting periods
The Company prepares its annual consolidated financial statements to the Saturday nearest December 31. Accordingly, the consolidated balance sheets are presented as of December 30, 2017 and December 31, 2016 and the related consolidated statements of operations, comprehensive income, cash flows, and shareholders’ equity are presented for the years ended December 30, 2017 (“Fiscal 2017”), December 31, 2016 (“Fiscal 2016”) and January 2, 2016 (“Fiscal 2015”).
F-8
Table of Contents
C. Basis of consolidation
The consolidated financial statements include the results, cash flows and assets and liabilities of Gates and its majority-owned subsidiaries, and Gates’ share of the results of its equity method investees.
Gates consolidates entities in which it has a controlling interest or when it is considered the primary beneficiary of a variable interest entity. The consolidated financial statements reflect the assets, liabilities, revenues and expenses of consolidated subsidiaries and the non-controlling parties’ ownership interest is presented as a non-controlling interest. Intercompany transactions and balances, and any unrealized profits or losses arising from intercompany transactions, are eliminated on consolidation.
The results of a subsidiary acquired during the period are included in Gates’ results from the effective date of acquisition. The results of a subsidiary sold during the period are included in Gates’ results up to the effective date of disposal.
D. Foreign currency transactions and translation
At an entity level, transactions denominated in currencies other than the entity’s functional currency (foreign currencies) are translated into the entity’s functional currency at the exchange rates prevailing on the dates of the transactions. Monetary assets and liabilities denominated in foreign currencies are translated at the exchange rate prevailing on the reporting date. Exchange differences arising from changes in exchange rates are recognized in net income for the period. The net foreign currency transaction loss included in operating income from continuing operations during Fiscal 2017 was $7.6 million, compared with a gain of $3.3 million in Fiscal 2016 and a loss of $4.0 million in Fiscal 2015. We also recognized net financing-related foreign currency transaction losses within other (expense) income of $57.4 million during Fiscal 2017, compared with a loss of $1.9 million in Fiscal 2016 and a gain of $62.7 million in Fiscal 2015.
On consolidation, the results of operations of entities whose functional currency is other than the U.S. dollar are translated into U.S. dollars at the weighted average exchange rate for the period and their assets and liabilities are translated into U.S. dollars at the exchange rate prevailing on the balance sheet date. Currency translation differences are recognized within other comprehensive income (“OCI”) as a separate component of accumulated other comprehensive income. In the event that a foreign operation is sold, or substantially liquidated, the cumulative currency translation differences that are attributable to the operation are reclassified to net income.
In the statement of cash flows, the cash flows of operations whose functional currency is other than the U.S. dollar are translated into U.S. dollars at the weighted average exchange rate for the period.
E. Net sales
Gates derives its net sales primarily from the sale of a wide range of power transmission and fluid power products and components for a large variety of industrial and automotive applications, both in the aftermarket and first-fit channels, throughout the world.
Revenue from the sale of goods is measured at the invoiced amount net of estimated returns, early settlement discounts and rebates and is recognized only when: (i) there is persuasive evidence of a sales agreement, typically in the form of a written sale or purchase agreement approved by both parties, (ii) the delivery of goods has occurred—this generally occurs upon passage of title which, depending on the arrangement with the customer, is typically upon release of the goods from the physical control of the Company or upon receipt of the goods by the customer and, where there are contractual acceptance provisions, when the customer has accepted the goods (or the right to reject them has lapsed); (iii) the sales price is fixed or determinable; and (iv) the collectability of revenue is reasonably assured.
Where a customer has the right to return goods, future returns are estimated based on historical returns profiles. Settlement discounts that may apply to unpaid invoices are estimated based on the settlement histories of the relevant customers. Rebates that may apply to issued invoices are estimated based on expected total qualifying sales to the relevant customers.
F. Selling, general and administrative expenses
Shipping and handling costs
Shipping and handling costs billed to customers in relation to goods sold are included in net sales and the related costs are included in selling, general and administrative expenses. During Fiscal 2017, Gates’ continuing operations recognized shipping and handling costs of $147.0 million, compared with $132.8 million in Fiscal 2016 and $133.9 million in Fiscal 2015.
F-9
Table of Contents
Research and development costs
Research and development costs are charged to net income in the period in which they are incurred. Gates’ research and development expense for its continuing operations was $68.6 million in Fiscal 2017, compared with $68.5 million in Fiscal 2016 and $67.4 million in Fiscal 2015. These costs primarily related to product development and also to technology to enhance manufacturing processes.
G. Restructuring expenses
Restructuring expenses are incurred in major projects undertaken to rationalize and improve the cost competitiveness of Gates. Restructuring costs incurred during the periods presented are analyzed in note 16.
Liabilities in respect of termination benefits provided to employees who are involuntarily terminated under the terms of a one-time benefit arrangement are recognized over the future service period when those employees are required to render services to the entity beyond the minimum retention period. If employees are not required to render service until they are terminated or if they will not be retained to render service beyond 60 days or a longer legal notification period, the liability is recognized on the communication date.
Termination benefits that are covered by a contract or an ongoing benefit arrangement are recognized when it is probable that employees will be entitled to benefits and the amount can be reasonably estimated. Benefits that are offered for a short period of time in exchange for voluntary termination are recognized when the employees accept the offer.
Restructuring costs other than termination benefits and lease exit costs are recognized only when the Company has incurred a related liability.
H. Business combinations
A business combination is a transaction or other event in which control is obtained of one or more businesses. Business combinations are accounted for using the purchase method.
Goodwill arising in a business combination is measured as the excess of the aggregate of the consideration transferred, the amount of any non-controlling interest in the acquired business and, in a business combination achieved in stages, the fair value at the acquisition date of the previously held equity interest in the acquired business, over the net identifiable assets and liabilities of the acquired business at the acquisition date. If the net identifiable assets and liabilities of the acquired business exceed the aggregate of the consideration transferred, the amount of any non-controlling interest in the acquired business and the fair value at the acquisition date of any previously held equity interest, that excess is recognized as a gain in net income.
Consideration transferred in a business combination is measured at the aggregate of the fair values of the assets acquired, liabilities assumed, debt issued and equity instruments issued in exchange for control over the acquired business. Acquisition-related costs are recognized in net income.
Any non-controlling interests in the acquired business are measured at their fair value at the acquisition date.
Identifiable assets and liabilities of the acquired business are measured at their fair value at the acquisition date.
If the initial accounting for a business combination is incomplete by the end of the reporting period in which the combination occurs, Gates reports provisional amounts for the items for which the accounting is incomplete. If, within a maximum of one year after the acquisition date, new information is obtained about facts and circumstances that existed at the acquisition date that, if known, would have affected the amounts recognized at that date, adjustments are made prospectively to the amounts recognized, or new assets and liabilities recognized and recorded in goodwill. Otherwise, any adjustments to the provisional amounts are recognized in net income.
I. Goodwill
Goodwill arising in a business combination is allocated to the reporting unit that is expected to benefit from the synergies of the acquisition.
Where a number of reporting units are acquired in a business combination, the goodwill attributable to each of them is determined by allocating the purchase consideration in proportion to their respective business enterprise values and comparing the allocated purchase consideration with the fair value of the identifiable assets and liabilities of the reporting unit. Goodwill is not amortized but is tested at least annually for impairment or more frequently whenever events or changes in circumstances indicate that the carrying value may not be recoverable and is carried at cost less any recognized impairment.
F-10
Table of Contents
To identify a potential impairment of goodwill, the fair value of the reporting unit to which the goodwill is allocated is compared with its carrying amount, including goodwill. Gates calculates fair values using a weighted blend of income and market approaches. If the fair value of the reporting unit exceeds its carrying amount, the goodwill of the reporting unit is not considered impaired. If the fair value is lower than the carrying amount, an impairment charge is recognized for the amount by which the carrying amount exceeds the reporting unit’s fair value, limited to the amount of goodwill allocated to that reporting unit.
The process of evaluating the potential impairment of goodwill is subjective and requires estimates and assumptions at various points during the analysis. Gates’ estimated future cash flows are based on assumptions that are consistent with its annual planning process and include estimates for revenue and operating margins and future economic and market conditions. Actual future results may differ from those estimates.
We base our fair value estimates on assumptions we believe to be reasonable at the time but that are unpredictable and inherently uncertain. In addition, we make certain judgments and assumptions in allocating shared assets and liabilities to determine the carrying values for each of Gates’ reporting units tested. Changes in assumptions or circumstances could result in an additional impairment in the period in which the change occurs and in future years.
J. Other intangible assets
Other intangible assets are stated at cost less accumulated amortization and any recognized impairment.
(i) Assets acquired in business combinations
An acquired intangible asset with a finite useful life is amortized on a straight-line basis so as to charge its cost, which represents its fair value at the date of acquisition, to net income over the Company’s expectation of its useful life, as follows:
| Customer relationships |
16 to 17 years | |||
| Technology |
2 to 7 years |
Acquired brands and trade names are considered to have an indefinite useful life and are not amortized but are tested at least annually for impairment and are carried at cost less any recognized impairment.
(ii) Computer software
Computer software that is not integral to an item of property, plant and equipment is recognized separately as an intangible asset. Computer software is amortized on a straight-line basis over its estimated useful life, which ranges from 2 to 6 years.
K. Property, plant and equipment
Property, plant and equipment is recorded at cost less accumulated depreciation and any recognized impairment losses. Major improvements are capitalized. Expenditures for repairs and maintenance that do not significantly extend the useful life of the asset are expensed as incurred.
Land and assets under construction are not depreciated. Depreciation of property, plant and equipment, other than land and assets under construction, is generally expensed on a straight-line basis over their estimated useful lives. The Company’s estimated useful lives of items of property, plant and equipment are in the following ranges:
| Buildings and improvements |
30 to 50 years | |||
| Leasehold improvements |
|
Shorter of lease term or useful life |
| |
| Plant, equipment and vehicles |
2 to 25 years |
L. Impairment of long-lived assets and intangible assets
Long-lived assets and intangible assets to be held and used, except intangible assets with indefinite useful lives, are reviewed for impairment when events or circumstances indicate that the carrying amount of the asset or asset group may not be recoverable.
Intangible assets with indefinite useful lives are tested at least annually for impairment or more frequently whenever events or changes in circumstances indicate that the carrying value may not be recoverable. A long-lived asset, or finite lived intangible asset or asset group is considered to be impaired when the undiscounted expected future cash flows from the asset or asset group are less than its
F-11
Table of Contents
carrying amount. In that event, an impairment loss is recognized to the extent that the carrying amount of the asset or asset group exceeds its fair value. Fair value is estimated as the present value of the expected future cash flows from the asset or asset group discounted at a rate commensurate with the risk involved. An impairment loss for an asset group is allocated to the long-lived and intangible assets of the group on a pro rata basis using the relative carrying amounts of those assets, with the limitation that the carrying amount of an individual asset is not reduced below its fair value.
M. Inventories
Inventories are stated at the lower of cost or net realizable value. A valuation adjustment is made to inventory for any excess, obsolete or slow moving items based on management’s review of on-hand inventories compared with historical and estimated future sales and usage profiles. Any consequent write down of inventory results in a new cost basis for inventory.
Cost represents the expenditure incurred in bringing inventories to their existing location and condition, which may include the cost of raw materials, direct labor costs, other direct costs and related production overheads. Cost is generally determined on a first in, first out (“FIFO”) basis, but the cost of certain inventories is determined on a last in, first out (“LIFO”) basis. As of December 30, 2017, inventories whose cost was determined on a LIFO basis represented 29.2% of the total carrying amount of inventories compared with 35.5% as of December 31, 2016.
N. Financial instruments
(i) Cash and cash equivalents
Cash and cash equivalents comprise cash on hand, deposits available on demand and other short-term, highly liquid investments with maturities on acquisition of 90 days or less. We have cash concentrations in certain large, highly-rated global financial institutions. Management closely monitors the credit quality of the institutions in which it holds deposits.
(ii) Restricted cash
Restricted cash includes cash given as collateral under letters of credit for insurance and regulatory purposes.
(iii) Trade accounts receivable
Trade accounts receivable represent the amount of sales of goods to customers, net of discounts and rebates, for which payment has not been received, less an allowance for doubtful accounts that is estimated based on factors such as the credit rating of the customer, historical trends, the current economic environment and other information.
(iv) Debt
Debt is initially measured at fair value, net of directly attributable transaction costs, if any, and is subsequently measured at amortized cost using the effective interest rate method.
(v) Accounts payable
Accounts payable represents the amount of invoices received from suppliers for purchases of goods and services and the amount of goods received but not invoiced, for which payment has not been made.
(vi) Derivative financial instruments
Gates uses derivative financial instruments, principally forward foreign currency contracts, to reduce its exposure to exchange rate movements, primarily on purchases of inventory. Gates uses derivative financial instruments, primarily interest rate caps, to reduce its exposure to interest rate movements, primarily on the Term Loan debt. Gates does not hold or issue derivatives for speculative or trading purposes.
Gates recognizes all derivative financial instruments as either assets or liabilities at fair value on the balance sheet date. The accounting for the change in the fair value is recognized in net income unless designated in an effective cash flow or net investment hedging relationship.
F-12
Table of Contents
(vii) Investments
Traded investments are classified as available-for-sale and are measured at fair value. Changes in their fair values are recognized in OCI and deferred in accumulated other comprehensive income except to the extent that they represent an other than temporary impairment in which case the impairment is recognized in net income. In the event that such an investment is sold, the realized gain or loss is transferred from accumulated other comprehensive income to net income.
(viii) Fair Value
Fair value is defined as the price that would be received to sell an asset or paid to transfer a liability in an orderly transaction between market participants at the measurement date. Financial assets and liabilities that are held at fair value, or for which fair values are presented in these consolidated financial statements, have been categorized into one of three levels to reflect the degree to which observable inputs are used in determining the fair values. Where a change in the determination of the fair value of a financial asset or liability results in a transfer between the levels of the fair value hierarchy, Gates recognizes that transfer at the end of the reporting period.
O. Post-retirement benefits
Post-retirement benefits comprise pension benefits provided to employees and other benefits, mainly healthcare, provided to certain employees in North America.
Gates accounts for its post-retirement benefit plans in accordance with Accounting Standards Codification (“ASC”) Topic 715 “Compensation – Retirement Benefits”, which is based on the principle that the cost of providing these benefits is recognized in net income over the service periods of the participating employees.
For defined benefit plans, the net obligation or surplus arising from providing the benefits is recognized as a liability or an asset determined by actuarial valuations of each of the plans that are carried out annually by independent qualified actuaries on Gates’ balance sheet date. Benefit obligations are measured using the projected unit credit method. Plan assets (if any) are measured at fair value. Gates recognizes in net income the net periodic benefit cost, which comprises the service cost, the interest cost, the expected return on plan assets (if any), and the amortization of cumulative actuarial gains and losses and prior service costs.
Actuarial gains and losses represent differences between the expected and actual returns on the plan assets, gains and losses on the plan liabilities and the effect of changes in actuarial assumptions. Gates uses the “corridor approach” whereby, to the extent that cumulative actuarial gains and losses exceed 10% of the greater of the market related value of the plan assets and the projected benefit obligation at the beginning of the fiscal year, they are reclassified from accumulated other comprehensive income to net income over the average remaining service periods of participating employees.
Gains and losses on settlements and curtailments are recognized in net income in the period in which the curtailment or settlement occurs.
P. Share-based compensation
Share-based compensation has historically been provided to certain of our employees under share option, bonus and other share award plans. All share-award plans are equity settled, except for certain awards issued in the form of stock appreciation rights to employees in China, where local regulations necessitate a cash-settled award. These awards are therefore accounted for as liabilities rather than equity.
Gates recognizes a compensation expense based on the fair value of the awards, measured using either the Black-Scholes option-pricing model or a Monte-Carlo valuation model. Fair value is determined at the date of grant and reflects market performance conditions and all non-vesting conditions.
For equity awards, fair value is not subsequently remeasured unless the conditions on which the award was granted are modified.
Generally, the compensation expense for each separately vesting portion of the award is recognized on a straight-line basis over the vesting period for that portion of the award. Compensation expense is recognized for awards containing performance conditions only to the extent that it is probable that those performance conditions will be met.
For liability awards, the fair value is remeasured each period and the change in fair value is recognized as an expense in the statement of operations and a corresponding increase in the outstanding liability.
Adjustments are made to reflect expected and actual forfeitures during the vesting period due to failure to satisfy service conditions or performance conditions.
An amount corresponding to the compensation expense for equity awards is recognized in equity as additional paid in capital.
F-13
Table of Contents
Q. Income taxes
Current tax is the amount of tax payable or receivable in respect of the taxable income for the period. Taxable income differs from financial reporting income because it excludes items of income or expense recognized for financial reporting purposes that are either not taxable or deductible for tax purposes or are taxable or deductible in other periods. Current tax is calculated using tax rates that have been enacted at the balance sheet date.
Management assesses uncertain tax positions based upon an evaluation of the facts, circumstances and information available at the balance sheet date. Provision is made for uncertain tax positions to the extent that the amounts previously taken or expected to be taken in tax returns exceeds the tax benefits that are recognized in the consolidated financial statements in respect of the tax positions. A tax benefit is recognized in the consolidated financial statements only if management considers that it is more likely than not that the tax position will be sustained on examination by the relevant tax authority solely on the technical merits of the position and is measured as the largest amount of tax benefit that is greater than 50% likely of being realized upon settlement assuming that the tax authority has full knowledge of all relevant information. Provisions for uncertain tax positions are reviewed regularly and are adjusted to reflect events such as the expiration of limitation periods for assessing tax, guidance given by the tax authorities and court decisions.
Interest and penalties relating to unrecognized tax benefits are accrued in accordance with the applicable tax legislation on any excess of the tax benefit claimed or expected to be claimed in a tax return and the tax benefit recognized in the consolidated financial statements. Interest and penalties are recognized as a component of income tax benefit (expense) in the consolidated statement of operations and accrued interest and penalties are included under the related taxes payable line in the consolidated balance sheet.
Deferred tax assets and liabilities are recognized based on the expected future tax consequences of the difference between the financial statement carrying amount and the respective tax basis. Deferred taxes are measured on the enacted rates expected to apply to taxable income at the time the difference is anticipated to reverse. Deferred tax assets are reduced through the establishment of a valuation allowance if it is more likely than not that the deferred tax asset will not be realized taking into account the timing and amount of the reversal of taxable temporary differences, expected future taxable income and tax planning strategies.
Deferred tax is provided on taxable temporary differences arising on investments in foreign subsidiaries, except where we intend, and are able, to reinvest such amounts on a permanent basis.
On December 22, 2017, the U.S. government enacted comprehensive tax legislation commonly referred to as the Tax Cuts and Jobs Act (the “Tax Act”). The Act makes broad and complex changes to the U.S. tax code, including, but not limited to, (1) reducing the U.S. federal corporate tax rate from 35 percent to 21 percent; (2) requiring companies to pay a one-time transition tax on certain unrepatriated earnings of foreign subsidiaries; (3) generally eliminating U.S. federal income taxes on dividends from foreign subsidiaries; (4) requiring a current inclusion in U.S. federal taxable income of certain earnings of controlled foreign corporations; (5) eliminating the corporate alternative minimum tax (AMT) and changing how existing AMT credits can be realized; (6) creating the base erosion anti-abuse tax (BEAT), a new minimum tax; (7) creating a new limitation on deductible interest expense; and (8) changing rules related to use and limitations of net operating loss carryforwards created in tax years beginning after December 31, 2017.
In conjunction with the Tax Act, the SEC staff issued Staff Accounting Bulletin No. 118 (“SAB 118”), which provides guidance on accounting for the tax effects of the Tax Act. SAB 118 provides a measurement period that should not extend beyond one year from the Tax Act enactment date for companies to complete the accounting under ASC 740. In accordance with SAB 118, a company must reflect the income tax effects of those aspects of the Act for which the accounting under ASC 740 is complete. To the extent that a company’s accounting for certain income tax effects of the Tax Act is incomplete but it is able to determine a reasonable estimate, it must record a provisional estimate in the financial statements. If a company cannot determine a provisional estimate to be included in the financial statements, it should continue to apply ASC 740 on the basis of the provisions of the tax laws that were in effect immediately before the enactment of the Tax Act.
R. Use of estimates
The preparation of consolidated financial statements under U.S. GAAP requires us to make assumptions and estimates concerning the future that affect the carrying amounts of assets and liabilities at the balance sheet date, the disclosure of contingencies that existed at the balance sheet date and the amounts of revenue and expenses recognized during the accounting period. Estimates and assumptions are particularly important in accounting for rebates, post-retirement benefits, impairment of long-lived assets, intangible assets and goodwill, inventory valuation, financial instruments, share-based compensation, product warranties and income taxes. Estimates and assumptions used are based on factors such as historical experience, the observance of trends in the industries in which Gates operates and information available from our customers and other outside sources. Due to the inherent uncertainty involved in making assumptions and estimates, actual outcomes could differ from those assumptions and estimates.
3. Recent accounting pronouncements not yet adopted
The following recent accounting pronouncements are relevant to Gates’ operations but have not yet been adopted. Unless otherwise indicated, management has not yet completed its evaluation of the impact of the adoption of these pronouncements.
F-14
Table of Contents
ASU 2014-09 “Revenue From Contracts With Customers” (Topic 606): Revenue Recognition
ASU 2016-08 “Revenue from Contracts with Customers” (Topic 606): Principal versus Agent Considerations (Reporting Revenue Gross versus Net)
ASU 2016-10 “Revenue from Contracts with Customers” (Topic 606): Identifying Performance Obligations and Licensing
ASU 2016-12 “Revenue from Contracts with Customers” (Topic 606): Narrow-Scope Improvements and Practical Expedients
ASU 2016-20 “Technical Corrections and Improvements to Topic 606, Revenue from Contracts with Customers”
ASU 2017-13 “Revenue from Contracts with Customers” (Topic 606): Amendments to SEC Paragraphs
ASU 2017-14 “Income Statement – Reporting Comprehensive Income (Topic 220), Revenue Recognition (Topic 605), and Revenue from Contracts with Customers (Topic 606)”
In May 2014, the FASB issued an ASU providing new guidance on the requirements for revenue recognition. The standards update provides a single principles-based, five-step model to be applied to all contracts with customers. The five steps are: (i) identify the contract(s) with a customer, (ii) identify the performance obligations in the contract, (iii) determine the transaction price, (iv) allocate the transaction price to the performance obligations in the contract, and (v) recognize revenue when (or as) the entity satisfies a performance obligation. The ASU also sets out requirements to disclose sufficient information to enable users of financial statements to understand the nature, amount, timing, and uncertainty of revenue and cash flows arising from contracts with customers.
Subsequent to issuing this ASU, the FASB issued several amendments, listed above, which provide clarification, additional guidance, practical expedients and technical corrections. We are continuing to assess all potential impacts of the new standard and anticipate an impact on revenue recognized at the time of sale in certain jurisdictions in relation to warranty reserves. However, we do not currently believe that the adoption of the new standard will have a significant impact on our consolidated financial statements. New disclosures will also be required, which we are in the process of finalizing.
The ASUs are all effective for fiscal years beginning after December 15, 2017, including interim periods within that reporting period. Entities have the option of using either a full retrospective or modified retrospective approach for the adoption of the standard. We will adopt the modified retrospective method.
ASU 2016-01 “Financial Instruments” (Topic 825-10): Recognition and Measurement of Financial Assets and Financial Liabilities
In January 2016, the FASB issued an ASU which listed a number of improvements to GAAP in the area of financial instruments; specifically the fair value measurement of equity investments, impairment assessment of equity investments, and various other disclosure eliminations as well as additional disclosure requirements.
The ASU is effective for fiscal years beginning after December 15, 2017, including interim periods within those fiscal years. Adoption of this ASU may impact the presentation in future consolidated financial statements.
ASU 2016-02 “Leases” (Topic 842)
In February 2016, the FASB issued an ASU which introduces a lessee model that will bring most leases of property, plant and equipment onto the balance sheet. It requires a lessee to recognize a lease obligation (present value of future lease payments) and also a “right of use asset” for all leases, although certain short-term leases are exempted from the standard. The ASU introduces two models for the subsequent measurement of the lease asset and liability, depending on whether the lease qualifies as a “finance lease” or an “operating lease”. This distinction focuses on whether or not effective control of the asset is being transferred from the lessor to the lessee.
The ASU is effective for fiscal years beginning after December 15, 2018, including interim periods within those fiscal years. The impact on our consolidated financial statements of adopting this standard update, which will affect the recognition, measurement and presentation of leases, is expected to be material given the number and value of leases held, but is still in the process of being evaluated.
ASU 2016-13 “Financial Instruments” (Topic 326): Measurement of Credit Losses on Financial Instruments
In June 2016, the FASB issued an ASU which broadens the information that an entity must consider when developing its expected credit loss estimate for assets. The financial asset must be measured at the net amount expected to be collected.
F-15
Table of Contents
The ASU is effective for fiscal years beginning after December 15, 2019, including interim periods within those fiscal years. The impact on our consolidated financial statements of adopting this standard update, which may affect the recognition, measurement and presentation of financial assets, is still being evaluated.
ASU 2016-15 “Statement of Cash Flows” (Topic 230): Classification of Certain Cash Receipts and Cash Payments and ASU 2016-18 “Statement of Cash Flows” – Restricted Cash
In 2016, the FASB issued two ASUs that clarify the operating, investing and financing cash flow classifications when receiving or paying cash in certain situations including debt prepayments, distributions from equity method investees and proceeds from settlement of corporate-owned life insurance policies; as well as require the explanation of restricted cash movements for the period.
In addition the new requirement states that an entity should include restricted cash in the cash and cash equivalents line when reconciling the beginning-of-period and end-of-period amounts in the statement of cash flows.
The ASUs are effective for fiscal years beginning after December 15, 2017 and interim periods within those fiscal years. When adopted, the standard updates will likely affect the presentation of our cash flows in our consolidated financial statements and the impact is still being evaluated.
ASU 2016-16 “Income Taxes” (Topic 740): Intra-entity Transfers of Assets other than Inventory
In October 2016, the FASB issued an ASU which requires an entity to recognize the income tax consequences of an intra-entity transfer of an asset other than inventory when the transfer occurs.
The ASU is effective for fiscal years beginning after December 15, 2017 including interim periods within those fiscal years. The impact on our consolidated financial statements of adopting this standard update, which may affect the recognition, measurement and presentation of taxes, is still being evaluated.
ASU 2017-01 “Business Combinations” (Topic 805): Clarifying the definition of a business
In January 2017, the FASB issued an ASU which better defines a business as having three elements; inputs, processes and outputs.
The ASU is effective for fiscal years beginning after December 15, 2017, including interim periods within those fiscal years. The impact on our consolidated financial statements of adopting this standard update, which may affect the recognition and measurement of entities acquired in the future, is still being evaluated.
ASU 2017-07 “Compensation-Retirement Benefits” (Topic 715): Improving the Presentation of Net Periodic Pension Costs and Net Periodic Postretirement Benefit Cost
In March 2017, the FASB issued an ASU which requires that an employer report the service cost component of its net periodic pension and postretirement costs in the same line item as other compensation costs arising from services rendered by the relevant employees during the period. The other components of net periodic benefit cost (which include the interest cost, actual return on plan assets, and the amortization of any prior service cost or credit and prior actuarial gains or losses) are required to be presented in the income statement separately from the service cost component and outside of operating income. If a separate line item is used to present these other components of net periodic benefit cost, that line item must be appropriately described. If a separate line item is not used, an entity should disclose the line item in the income statement in which these other components are included.
The ASU is effective for fiscal years beginning after December 15, 2017, including interim periods within those fiscal years. We expect the adoption of this standard update to affect the disclosure and presentation of our net periodic benefit costs, but we have not yet quantified the impact to our financial statements.
ASU 2017-09 “Stock Compensation” (Topic 718): Scope of Modification Accounting
In May 2017, the FASB issued an ASU which clarifies when an entity should apply modification accounting by providing guidance on which changes to the terms or conditions of a stock compensation award will require modification accounting.
The ASU is effective for all entities for annual periods, and interim periods within those annual periods, beginning after December 15, 2017. The amendments in this standard update should be applied prospectively. We do not expect any impact on our consolidated financial statements of adopting this standard update, but it may affect the recognition and measurement of stock compensation in the future should we modify our stock compensation plan.
ASU 2017-12 “Derivatives and Hedging” (Topic 815): Targeted Improvements to Accounting for Hedging Activities
F-16
Table of Contents
In August 2017, the FASB issued an ASU with the objective of improving the financial reporting of hedging relationships to better portray the economic results of an entity’s risk management activities in its financial statements. The amendments in ASU 2017-12 require an entity to present the earnings effect of the hedging instrument in the same income statement line item in which the earnings effect of the hedged item is reported. The new approach no longer separately measures and reports hedge ineffectiveness.
The amendments are effective for fiscal years beginning after December 15, 2018, and interim periods within fiscal years beginning after December 15, 2018. Early application is permitted in any interim period after issuance of ASU 2017-12. An entity should apply a cumulative effect adjustment related to eliminating the separate measurement of ineffectiveness to accumulated OCI and retained earnings as of the beginning of the fiscal year that the entity adopts. The amended presentation and disclosure guidance is required only prospectively. We expect the adoption of this standard update to affect the disclosure and presentation of our derivative and hedging activities, but we have not yet quantified the impact to our financial statements.
ASU 2018-02 “Income Statement – Reporting Comprehensive Income” (Topic 220): Reclassification of Certain Tax Effects from Accumulated Other Comprehensive Income
In February 2018, the FASB issued an ASU to address concerns about the guidance in current U.S. GAAP that requires deferred tax liabilities and assets to be adjusted for the effect of a change in tax laws or rates with the effect included in income from continuing operations in the reporting period that includes the enactment date. This concern stemmed from the U.S. federal government’s enactment of the Tax Act. The amendments in ASU 2018-02 allow a reclassification from accumulated OCI to retained earnings for stranded tax effects resulting from the Tax Act.
The amendments in this Update are effective for all entities for fiscal years beginning after December 15, 2018, and interim periods within those fiscal years. Early adoption is permitted, and the amendments should be applied either in the period of adoption or retrospectively to each period in which the effect of the change in the U.S. federal corporate income tax rate in the Tax Cuts and Jobs Act is recognized. As of December 30, 2017, we have not completed the accounting for the income tax effects of the Tax Act. However, we have made a reasonable estimate and reported a provisional benefit. We will continue to update our calculations as additional required information is prepared and analyzed, interpretations and assumptions are refined, and additional guidance is issued. The Company is still in process of determining the impact of this ASU.
4. Acquisitions
Description and financial effect of acquisitions
In June 2017, Gates purchased 100% of GTF Engineering and Services UK Limited, the owner of the majority of the net assets of Techflow Flexibles, for $36.7 million. Techflow Flexibles is a fully integrated engineering, manufacturing and commercial operation based in the United Kingdom that specializes in high-pressure flexible hoses.
On October 2, 2017, Gates completed the acquisition of Atlas Hydraulics for $74.0 million, net of cash acquired. Atlas Hydraulics is a fully-integrated product engineering, manufacturing, and commercial business headquartered in Ontario, Canada. With locations in Canada, the U.S. and Mexico, the company specializes in the design, manufacture, and supply of hydraulic tube and hose assemblies.
Gates incurred aggregate costs related directly to these acquisitions of $3.0 million, all of which are included in the transaction-related costs line in the statement of operations.
The following is the final record of the fair value of net assets acquired and liabilities assumed:
| (dollars in millions) |
Techflow Flexibles |
Atlas Hydraulics |
||||||
| Assets acquired |
||||||||
| Accounts receivable |
$ | 1.7 | $ | 10.3 | ||||
| Inventories |
4.2 | 21.2 | ||||||
| Prepaid expenses and other receivables |
1.7 | 0.5 | ||||||
| Taxes receivable |
— | 2.7 | ||||||
| Property, plant and equipment |
13.0 | 24.5 | ||||||
F-17
Table of Contents
| (dollars in millions) |
Techflow Flexibles |
Atlas Hydraulics |
||||||
| Intangible assets |
3.8 | 23.0 | ||||||
|
|
|
|
|
|||||
| Total assets |
24.4 | 82.2 | ||||||
|
|
|
|
|
|||||
| Liabilities assumed |
||||||||
| Accounts payable |
2.6 | 5.5 | ||||||
| Accrued expenses |
4.8 | 2.4 | ||||||
| Other current liabilities |
0.3 | 10.5 | ||||||
| Taxes payable |
1.9 | — | ||||||
| Deferred income taxes |
0.6 | 11.6 | ||||||
|
|
|
|
|
|||||
| Total liabilities |
10.2 | 30.0 | ||||||
|
|
|
|
|
|||||
| Net assets acquired |
$ | 14.2 | $ | 52.2 | ||||
|
|
|
|
|
|||||
Goodwill has been recognized as follows:
| (dollars in millions) |
Techflow Flexibles |
Atlas Hydraulics |
||||||
| Consideration, net of cash acquired |
$ | 36.7 | $ | 74.0 | ||||
| Net assets acquired |
(14.2 | ) | (52.2 | ) | ||||
|
|
|
|
|
|||||
| Goodwill |
$ | 22.5 | $ | 21.8 | ||||
|
|
|
|
|
|||||
The goodwill of $22.5 million arising from the acquisition of Techflow Flexibles relates largely to the expected enhancement to Gates’ ability to make and supply long-length and large-diameter hoses, primarily for the oil & gas exploration and production industries. None of the goodwill recognized is expected to be deductible for income tax purposes.
The goodwill of $21.8 million arising from the acquisition of Atlas Hydraulics relates primarily to the expansion of Gates’ presence in industrial markets through increased manufacturing capacity and geographic reach. None of the goodwill recognized is expected to be deductible for income tax purposes.
Pro forma information has not been presented for these acquisitions due to their size relative to Gates.
5. Segment information
A. Background
ASC 280 “Segment Reporting” requires segment information provided in the consolidated financial statements to reflect the information that was provided to the chief operating decision maker for the purposes of making decisions about allocating resources and in assessing the performance of each segment. The chief executive officer (“CEO”) of Gates serves as the chief operating decision maker.
The segment information provided in these consolidated financial statements reflects the information that is used by the chief operating decision maker for the purposes of making decisions about allocating resources and in assessing the performance of each segment. These decisions are based on net sales and Adjusted EBITDA (defined below).
B. Operating Segments
Gates manufactures a wide range of power transmission and fluid power products and components for a large variety of industrial and automotive applications, both in the aftermarket and first-fit channels, throughout the world.
Our reportable segments are identified on the basis of our primary product lines, as this is the basis on which information is provided to the CEO for the purposes of allocating resources and assessing the performance of Gates’ businesses. Our operating and reporting segments are therefore Power Transmission and Fluid Power.
C. Measure of segment profit or loss
The CEO uses Adjusted EBITDA, as defined below, to measure the profitability of each segment. Adjusted EBITDA is, therefore, the measure of segment profit or loss presented in Gates’ segment disclosures.
F-18
Table of Contents
“EBITDA” represents net income for the period before net finance costs, income taxes, depreciation and amortization derived from financial information prepared in accordance with U.S. GAAP.
Adjusted EBITDA represents EBITDA before specific items that are considered to hinder comparison of the performance of our businesses either year-on-year or with other businesses. During the periods presented, the specific items excluded from EBITDA in computing Adjusted EBITDA primarily included:
| • | the non-cash compensation charge in relation to share-based compensation; |
| • | transaction-related costs incurred in relation to business combinations and major corporate transactions, including acquisition integration activities; |
| • | The effect on cost of sales of fair value adjustments to the carrying amount of inventory acquired in business combinations; |
| • | impairments, comprising impairments of goodwill and significant impairments or write downs of other assets; |
| • | net interest relating to post-retirement benefit obligations, significant lump-sum settlements and the amortization of prior period actuarial gains and losses; |
| • | restructuring costs; |
| • | the net gain or loss on disposals and on the exit of businesses; and |
| • | fees paid to our private equity sponsor for monitoring, advisory and consulting services. |
D. Net sales and Adjusted EBITDA – continuing operations
Segment asset information is not provided to the chief operating decision maker and therefore segment asset information has not been presented. Due to the nature of Gates’ operations, cash generation and profitability are viewed as the key measures rather than an asset base measure.
| Net Sales | ||||||||||||
| (dollars in millions) |
Fiscal 2017 | Fiscal 2016 | Fiscal 2015 | |||||||||
| Power Transmission |
$ | 2,009.4 | $ | 1,862.1 | $ | 1,809.6 | ||||||
| Fluid Power |
1,032.3 | 884.9 | 935.5 | |||||||||
|
|
|
|
|
|
|
|||||||
| Continuing operations |
$ | 3,041.7 | $ | 2,747.0 | $ | 2,745.1 | ||||||
|
|
|
|
|
|
|
|||||||
| Adjusted EBITDA | ||||||||||||
| (dollars in millions) |
Fiscal 2017 | Fiscal 2016 | Fiscal 2015 | |||||||||
| Power Transmission |
$ | 458.1 | $ | 408.5 | $ | 378.3 | ||||||
| Fluid Power |
211.0 | 186.4 | 168.9 | |||||||||
|
|
|
|
|
|
|
|||||||
| Continuing operations |
$ | 669.1 | $ | 594.9 | $ | 547.2 | ||||||
|
|
|
|
|
|
|
|||||||
Sales between reporting segments and the impact of such sales on Adjusted EBITDA for each segment are not included in internal reports presented to the CEO and have therefore not been included above.
Reconciliation of Adjusted EBITDA to net income from continuing operations:
| (dollars in millions) |
Fiscal 2017 | Fiscal 2016 | Fiscal 2015 | |||||||||
| Adjusted EBITDA |
$ | 669.1 | $ | 594.9 | $ | 547.2 | ||||||
| Depreciation and amortization |
(212.2 | ) | (240.8 | ) | (269.9 | ) | ||||||
| Share-based compensation |
(5.4 | ) | (4.2 | ) | (4.3 | ) | ||||||
| Transaction-related costs(1) |
(18.1 | ) | (0.4 | ) | (0.7 | ) | ||||||
| Acquisition-related costs included in cost of sales |
(0.7 | ) | — | — | ||||||||
| Impact of fair value adjustment on inventory (included in cost of sales)(2) |
(1.2 | ) | — | — | ||||||||
| Inventory impairments and adjustments (included in cost of sales)(3) |
(2.0 | ) | (21.7 | ) | (9.6 | ) | ||||||
| Other impairments |
(2.8 | ) | (3.2 | ) | (51.1 | ) | ||||||
| Benefit from sale of inventory impaired in a prior period(4) |
— | 1.0 | — | |||||||||
| Restructuring expenses |
(17.4 | ) | (11.4 | ) | (15.6 | ) | ||||||
| Adjustments relating to post-retirement benefits |
(2.5 | ) | (6.4 | ) | (4.8 | ) | ||||||
| Other operating income (expense) |
0.3 | (2.8 | ) | 0.4 | ||||||||
F-19
Table of Contents
| (dollars in millions) |
Fiscal 2017 | Fiscal 2016 | Fiscal 2015 | |||||||||
| Sponsor fees |
(6.7 | ) | (6.1 | ) | (7.0 | ) | ||||||
|
|
|
|
|
|
|
|||||||
| Operating income from continuing operations |
400.4 | 298.9 | 184.6 | |||||||||
| Interest expense |
(234.6 | ) | (216.3 | ) | (212.6 | ) | ||||||
| Other income |
(56.3 | ) | 10.4 | 69.7 | ||||||||
|
|
|
|
|
|
|
|||||||
| Income before income taxes |
109.5 | 93.0 | 41.7 | |||||||||
| Income tax benefit (expense) |
72.5 | (21.1 | ) | 9.2 | ||||||||
|
|
|
|
|
|
|
|||||||
| Net income from continuing operations |
$ | 182.0 | $ | 71.9 | $ | 50.9 | ||||||
|
|
|
|
|
|
|
|||||||
| (1) | Transaction-related costs relate primarily to advisory costs recognized in respect of the initial public offering, the acquisition of businesses and costs related to other corporate transactions such as debt refinancings. |
| (2) | As part of the accounting for business combinations, the inventory acquired in a business combination is fair valued as of the date of the acquisition. This uplifted inventory value is then expensed through cost of sales as the inventory is sold. We add back to operating income from continuing operations in arriving at Adjusted EBITDA this excess value of inventory over its historical carrying amount. |
| (3) | During Fiscal 2016, Gates changed its accounting convention to expense maintenance, repair and operations assets below a nominal value threshold and also revised its methods for estimating the write down for excess or obsolete raw materials and work in progress. These changes, totaling $17.7 million were made to bring consistency to our global inventory management. In Fiscal 2015, a similar adjustment of $5.9 million was made in regard to the calculation of the write down for excess or obsolete finished goods. |
| (4) | This benefit relates to inventory sold during the second quarter of 2016 that had been previously impaired as part of a restructuring initiative. The initial impairment was excluded from Adjusted EBITDA when it was recognized in Fiscal 2015. For consistency, the recovery in the value of the inventory through its sale has therefore also been excluded from Adjusted EBITDA, to the extent of the original impairment recognized on the inventory sold. |
E. Selected geographic information
| (dollars in millions) |
Fiscal 2017 | Fiscal 2016 | Fiscal 2015 | |||||||||
| Net sales by geographic origin |
||||||||||||
| U.S. |
$ | 1,148.1 | $ | 1,057.6 | $ | 1,083.0 | ||||||
| Rest of North America |
283.0 | 261.6 | 273.2 | |||||||||
| Europe |
743.5 | 668.7 | 650.2 | |||||||||
| China |
327.4 | 260.2 | 255.5 | |||||||||
| Rest of Asia |
356.2 | 337.4 | 319.6 | |||||||||
| Rest of the world |
183.5 | 161.5 | 163.6 | |||||||||
|
|
|
|
|
|
|
|||||||
| $ | 3,041.7 | $ | 2,747.0 | $ | 2,745.1 | |||||||
|
|
|
|
|
|
|
|||||||
| (dollars in millions) |
As of December 30, 2017 |
As of December 31, 2016 |
||||||
| Property, plant and equipment by geographic location |
||||||||
| U.S. |
$ | 198.9 | $ | 193.2 | ||||
| Rest of North America |
79.4 | 52.0 | ||||||
| Europe |
143.6 | 109.3 | ||||||
| China |
141.8 | 125.4 | ||||||
| Rest of Asia |
81.1 | 79.1 | ||||||
| Rest of the world |
41.4 | 40.6 | ||||||
|
|
|
|
|
|||||
| $ | 686.2 | $ | 599.6 | |||||
|
|
|
|
|
|||||
F. Information about major customers
Gates has a significant concentration of sales in the United States of America (the “United States” or “U.S.”), which accounted for 38.5% of Gates’ net sales by destination from continuing operations during Fiscal 2017, compared with 38.5% during Fiscal 2016 and 39.5% during Fiscal 2015. During Fiscal 2017, 2016 and 2015, no single customer accounted for more than 10% of Gates’ net sales. Two customers of our North America businesses accounted for 14.9% and 10.8%, respectively, of our total trade accounts receivable balance as of December 30, 2017, compared with 20.9% and 13.1%, respectively, as of December 31, 2016. These concentrations are due to the extended payment terms common in the industry in which they operate.
F-20
Table of Contents
6. Income taxes
A. Income tax recognized in net income
On December 22, 2017, the U.S. government enacted comprehensive tax legislation known as the Tax Act that significantly revised U.S. corporate income tax by, among other things, lowering the federal corporate income tax rate from 35 percent to 21 percent, limiting or eliminating various deductions including interest expense and certain employee compensation costs, and imposing a one-time transition tax on certain unremitted foreign earnings. Due to the complexities involved in accounting for the Tax Act, the U.S. Securities and Exchange Commission issued SAB 118 requiring companies to include a reasonable estimate of the impact of the Tax Act, to the extent a reasonable estimate could be determined as ASC 740 requires tax impacts to be accounted for in the period of enactment. However, SAB 118 allows for a one-year measurement period to complete the accounting and finalize the impacts. As of December 30, 2017 we have not completed the accounting for the income tax effects of the Tax Act. However, in accordance with SAB 118 we have made a reasonable estimate and reported a provisional benefit of $118.2 million. We will continue to update our calculations as additional required information is prepared and analyzed, interpretations and assumptions are refined, and additional guidance is issued.
The provisional estimate includes a $153.7 million deferred tax benefit for the revaluing of our net U.S. deferred tax liabilities from the U.S. Corporate income tax rate of 35 percent to 21, including the state impact of the reduced federal benefit.
A provisional charge of $1.9 million was reported for the disallowance of certain incentive based compensation under Internal Revenue Code Section 162(m). Due to the uncertainty in the interpretation of pre-existing compensation plans as defined within the Tax Act we have made certain assumptions in our calculations. We continue to analyze various aspects of the law and as additional guidance is issued we will further refine our calculation.
We also recognized a provisional charge of $33.6 million for the estimated cost of the mandatory deemed repatriation of non-U.S. earnings, including changes in the deferred tax liability related to the amount of earnings considered not indefinitely reinvested. The final impact may differ from the provisional estimate due to additional information and analysis required to determine cumulative earnings since 1986 for non-U.S. subsidiaries at two separate points in time. We are still determining the amount of assets held as liquid versus non-liquid assets as defined in the Tax Act. Additionally, we continue to evaluate information supporting available foreign tax credit utilization as well as valuation allowance considerations for carry forward credits. Due to the uncertainty about aspects of the Tax Act, we have made various assumptions to determine a reasonable estimate that we expect to refine as additional guidance is issued.
The Tax Act also establishes new provisions for Global intangible low taxed income (“GILTI”) and base erosion anti-abuse tax (“BEAT”) that taxes certain payments between a U.S. Corporation and its subsidiaries. Because of the complexity of the new GILTI tax rules, we are continuing to evaluate this provision of the Tax Act and the application of ASC 740. Under U.S. GAAP, we have made the accounting policy choice of treating taxes due on future U.S. inclusions in taxable income related to GILTI as a current-period expense when incurred (the “period cost method”). We will be subject to GILTI and BEAT provisions effective beginning January 1, 2018. Due to the complexity of these provisions we continue to monitor additional regulatory and administrative guidance to further evaluate the impacts.
Income from continuing operations before taxes has been reported for the United States, the jurisdiction of the Company. These amounts arose as follows:
| (dollars in millions) |
Fiscal 2017 | Fiscal 2016 | Fiscal 2015 | |||||||||
| The United States |
$ | (63.1 | ) | $ | (110.6 | ) | $ | (199.7 | ) | |||
| Outside the United States |
172.6 | 203.6 | 241.4 | |||||||||
|
|
|
|
|
|
|
|||||||
| Income from continuing operations before income taxes |
$ | 109.5 | $ | 93.0 | $ | 41.7 | ||||||
|
|
|
|
|
|
|
|||||||
Income tax (benefit) expense on income from continuing operations analyzed by tax jurisdiction is as follows:
| (dollars in millions) |
Fiscal 2017 | Fiscal 2016 | Fiscal 2015 | |||||||||
| Current tax |
||||||||||||
| U.S. – federal taxes |
$ | 7.6 | $ | 9.3 | $ | (22.3 | ) | |||||
| – state taxes |
0.2 | 0.2 | 3.0 | |||||||||
| Other foreign |
82.5 | 65.8 | 77.4 | |||||||||
|
|
|
|
|
|
|
|||||||
| Total current tax expense |
$ | 90.3 | $ | 75.3 | $ | 58.1 | ||||||
|
|
|
|
|
|
|
|||||||
F-21
Table of Contents
| (dollars in millions) |
Fiscal 2017 | Fiscal 2016 | Fiscal 2015 | |||||||||
| Deferred tax |
||||||||||||
| U.S. – federal taxes |
$ | (136.0 | ) | $ | (21.2 | ) | $ | (36.2 | ) | |||
| – state taxes |
(5.6 | ) | (8.3 | ) | (8.7 | ) | ||||||
| Other foreign |
(21.2 | ) | (24.7 | ) | (22.4 | ) | ||||||
|
|
|
|
|
|
|
|||||||
| Total deferred tax benefit |
(162.8 | ) | (54.2 | ) | (67.3 | ) | ||||||
|
|
|
|
|
|
|
|||||||
| Income tax (benefit) expense |
$ | (72.5 | ) | $ | 21.1 | $ | (9.2 | ) | ||||
|
|
|
|
|
|
|
|||||||
Reconciliation of the reported income tax (benefit) expense to the amount of income tax expense that would result from applying the statutory tax rate to the income from continuing operations before taxes:
| Fiscal 2017 | Fiscal 2016 | Fiscal 2015 | ||||||||||
| U.S. corporation tax expense at 35% |
35.0 | % | 35.0 | % | 35.0 | % | ||||||
| Effect of: |
||||||||||||
| —State tax provision, net of Federal benefit |
2.5 | % | (6.0 | %) | (14.4 | %) | ||||||
| —Provision for uncertain tax positions |
2.7 | % | 2.6 | % | (8.9 | %) | ||||||
| —Company-owned life insurance |
(12.1 | %) | (14.4 | %) | (33.6 | %) | ||||||
| —Manufacturing incentives |
(5.8 | %) | (10.7 | %) | (24.9 | %) | ||||||
| —Effects of differences between statutory and foreign tax rates |
4.4 | % | (22.8 | %) | (61.4 | %) | ||||||
| —U.S. tax on foreign earnings |
14.3 | % | 19.5 | % | 43.2 | % | ||||||
| —Deferred tax on statutory tax rate changes (1) |
(146.8 | %) | 130.3 | % | (9.7 | %) | ||||||
| —Effects of currency exchange rate movements (2) |
(105.1 | %) | 40.5 | % | (64.9 | %) | ||||||
| —Change in valuation allowance (3) |
111.7 | % | (160.7 | %) | 104.8 | % | ||||||
| —Unremitted earnings of foreign subsidiaries |
24.6 | % | (1.9 | %) | 11.4 | % | ||||||
| —Share-based compensation |
1.7 | % | — | — | ||||||||
| —Other permanent differences |
6.7 | % | 11.3 | % | 1.5 | % | ||||||
|
|
|
|
|
|
|
|||||||
| Income tax (benefit) expense |
66.2 | % | 22.7 | % | (21.9 | %) | ||||||
|
|
|
|
|
|
|
|||||||
| (1) | “Deferred tax on statutory tax rate changes” was impacted in Fiscal 2017 primarily by the decrease in the U.S. tax rate. In Fiscal 2016 the impact was primarily as a result of the Luxembourg statutory rate decrease applied to historical operating losses of which the tax impact was fully offset by the change in valuation allowance. |
| (2) | “Effects of currency exchange rate movements” was impacted primarily by the re-measurement of historical operating losses to reflect the impact of foreign currency which were fully offset by a change in valuation allowance. |
| (3) | “Change in Valuation Allowance” are primarily impacted during the years by statutory rate changes on previously valued assets as well as various changes in foreign attributes and the creation of excess foreign tax credits in the U.S. |
B. Deferred tax assets (liabilities)
Deferred tax assets (liabilities) recognized by Gates were as follows:
| (dollars in millions) |
As of December 30, 2017 |
As of December 31, 2016 |
||||||
| Deferred tax assets: |
||||||||
| Accounts receivable |
$ | 3.5 | $ | 3.7 | ||||
| Inventories |
4.7 | 4.3 | ||||||
| Property, plant and equipment |
5.5 | 4.6 | ||||||
| Accrued expenses |
45.7 | 57.2 | ||||||
| Post-retirement benefit obligations |
30.5 | 47.2 | ||||||
| Compensation |
8.9 | 16.5 | ||||||
| Net operating losses |
946.1 | 824.9 | ||||||
| Capital loss carryforward |
134.6 | 122.0 | ||||||
| Credits |
174.7 | 172.0 | ||||||
| Other items |
2.0 | 2.0 | ||||||
|
|
|
|
|
|||||
| $ | 1,356.2 | $ | 1,254.4 | |||||
| Valuation allowances |
(1,216.2 | ) | (1,075.9 | ) | ||||
F-22
Table of Contents
| (dollars in millions) |
As of December 30, 2017 |
As of December 31, 2016 |
||||||
| Total deferred tax assets |
$ | 140.0 | $ | 178.5 | ||||
|
|
|
|
|
|||||
| Deferred tax liabilities: |
||||||||
| Inventories |
(19.3 | ) | (27.8 | ) | ||||
| Property, plant and equipment |
(52.4 | ) | (57.4 | ) | ||||
| Intangible assets |
(517.2 | ) | (693.2 | ) | ||||
| Post-retirement benefit obligations |
(10.7 | ) | (8.1 | ) | ||||
| Net investment in subsidiaries |
(46.6 | ) | (22.3 | ) | ||||
| Other items |
(5.1 | ) | (19.6 | ) | ||||
|
|
|
|
|
|||||
| Total deferred tax liabilities |
$ | (651.3 | ) | $ | (828.4 | ) | ||
|
|
|
|
|
|||||
| Net deferred tax liabilities |
$ | (511.3 | ) | $ | (649.9 | ) | ||
|
|
|
|
|
|||||
As of December 30, 2017 and December 31, 2016:
| • | Gates had foreign and U.S. federal operating tax losses amounting to $3,603.5 million, compared with $3,141.6 million as of December 31, 2016, and U.S. state operating tax losses amounting to $291.4 million, compared with $271.8 million as of December 31, 2016. Operating losses of $3,546.7 million can be carried forward indefinitely and $348.2 million have expiration dates between 2018 and 2037. After valuation allowances of $922.9 million, we recognized a deferred tax asset of $23.4 million, compared with $21.3 million as of December 31, 2016, in respect of these losses; |
| • | Gates had capital tax losses amounting to $792.3 million, compared with $717.9 million as of December 31, 2016. Capital losses of $791.8 million can be carried forward indefinitely and $0.5 million expire between 2018 and 2028. After valuation allowances of $134.6 million, compared with $122.0 million as of December 31, 2016, we recognized no deferred tax asset in respect of these losses; |
| • | Gates had foreign tax credits amounting to $148.0 million, compared with $134.9 million as of December 31, 2016, which expire between 2021 and 2027. We recognized no deferred tax asset in respect of these tax credits; and |
| • | Gates had other tax credits amounting to $26.7 million, compared with $43.8 million as of December 31, 2016, of which $18.7 million can be carried forward indefinitely and $8.0 million expire between 2018 and 2029. We recognized a deferred tax asset of $18.9 million, compared with $31.5 million as of December 31, 2016, in respect of these tax credits. |
At December 30, 2017, income and withholding taxes in the various tax jurisdictions in which Gates operates have not been provided on approximately $1,836.4 million of taxable temporary differences related to the investments in the Company’s subsidiaries. These temporary differences represent the estimated excess of the financial reporting over the tax basis in our investments in those subsidiaries, which are primarily the result of purchase accounting adjustments. The amount of unrecognized deferred income tax liability on these taxable temporary differences has not been determined because the hypothetical calculation is not practicable due to the uncertainty as to how they may reverse. However, Gates has recognized a deferred tax liability of $46.6 million on $869.5 million of taxable temporary differences related to undistributed earnings of the Company’s subsidiaries.
C. Uncertain tax positions
Unrecognized tax benefits represent the difference between the tax benefits that we are able to recognize for financial reporting purposes and the tax benefits that we have recognized or expect to recognize in filed tax returns. As of December 30, 2017, Gates had unrecognized tax benefits, net of competent authority and other offsets, of $60.9 million, compared with $56.5 million as of December 31, 2016, and $54.3 million as of January 2, 2016, which, if recognized, would affect our annual effective tax rate.
Changes in the balance of unrecognized tax benefits were as follows:
| (dollars in millions) |
Fiscal 2017 | Fiscal 2016 | Fiscal 2015 | |||||||||
| At the beginning of the period |
$ | 106.3 | $ | 88.8 | $ | 71.7 | ||||||
| Increases for tax positions related to the current period |
5.5 | 15.7 | 27.6 | |||||||||
| Increases for tax positions related to prior periods |
4.6 | 18.1 | 11.0 | |||||||||
| Decreases for tax positions related to prior periods |
(2.8 | ) | (10.2 | ) | (9.0 | ) | ||||||
| Decreases related to settlements |
(0.7 | ) | — | (7.0 | ) | |||||||
| Decreases due to lapsed statute of limitations |
(11.8 | ) | (6.0 | ) | (3.0 | ) | ||||||
| Foreign currency translation |
5.0 | (0.1 | ) | (2.5 | ) | |||||||
|
|
|
|
|
|
|
|||||||
| At the end of the period |
$ | 106.1 | $ | 106.3 | $ | 88.8 | ||||||
|
|
|
|
|
|
|
|||||||
F-23
Table of Contents
Gates recognizes interest and penalties relating to unrecognized tax benefits in income tax expense. As of December 30, 2017, Gates had accrued $13.9 million, compared with $11.7 million as of December 31, 2016, and $9.0 million as of January 2, 2016, for the payment of interest and penalties on unrecognized tax benefits. The increase in the accrual resulted principally from interest on existing positions of which $1.5 million was recognized as income tax expense during Fiscal 2017, compared with $2.7 million in expense during Fiscal 2016 and $1.0 million in expense during Fiscal 2015.
As of December 30, 2017, Gates unrecognized tax benefits consisted primarily of tax positions related to transfer pricing in multiple international jurisdictions and audits in various jurisdictions. We believe that it is reasonably possible that a decrease of up to $2.1 million in Gates’ gross unrecognized tax benefits will occur in the next twelve months as a result of the settlement of an audit or the expiration of the statutes of limitations in various international jurisdictions.
As of December 30, 2017, tax years 2012 to 2016 remain subject to examination in the United States and the tax years 2008 to 2016 remain subject to examination in other major foreign jurisdictions where Gates conducts business.
State income tax returns are generally subject to examination for a period of three to five years after the filing of the respective return. The state impact of any federal changes remains subject to examination by various state jurisdictions for a period of up to two years after the formal notification to states.
7. Discontinued operations
During Fiscal 2017, we recognized a net gain of $0.7 million, compared with a gain of $12.4 million during Fiscal 2016 and $0 during Fiscal 2015, in relation to businesses disposed of in prior periods. The majority of these net gains in Fiscal 2017 and Fiscal 2016 related to the release of reserves for tax indemnifications made to buyers of businesses sold by Gates in prior periods. These releases were triggered primarily by the expiration of statutes of limitations on historical tax periods.
8. Earnings per share
Basic income per share represents net income divided by the weighted average number of shares outstanding during the period. Diluted income per share considers the effect of potential shares, unless the inclusion of the potential shares would have an anti-dilutive effect. The treasury stock method is used to determine the potential dilutive shares resulting from assumed exercises of equity related instruments.
The computation of net income per share is presented below:
| (dollars in millions, except share numbers and per share amounts) |
Fiscal 2017 | Fiscal 2016 | Fiscal 2015 | |||||||||
| Net income attributable to shareholders |
$ | 151.3 | $ | 57.7 | $ | 24.9 | ||||||
| Weighted average number of shares outstanding |
245,520,533 | 245,683,929 | 245,824,411 | |||||||||
| Dilutive effect of share-based awards |
4,970,295 | 2,676,258 | 1,849,623 | |||||||||
|
|
|
|
|
|
|
|||||||
| Diluted weighted average number of shares outstanding |
250,490,828 | 248,360,187 | 247,674,034 | |||||||||
|
|
|
|
|
|
|
|||||||
| Basic net income per share |
$ | 0.62 | $ | 0.23 | $ | 0.10 | ||||||
| Diluted net income per share |
$ | 0.60 | $ | 0.23 | $ | 0.10 | ||||||
|
|
|
|
|
|
|
|||||||
For Fiscal 2017, shares totaling 180,538, compared with 3,181,930 in Fiscal 2016 and 8,168,043 in Fiscal 2015, were excluded from the diluted income per share calculation because they were anti-dilutive.
9. Inventories
| (dollars in millions) |
As of December 30, 2017 |
As of December 31, 2016 |
||||||
| Raw materials and supplies |
$ | 128.0 | $ | 92.6 | ||||
| Work in progress |
32.8 | 23.7 | ||||||
| Finished goods |
296.3 | 250.6 | ||||||
|
|
|
|
|
|||||
| Total inventories |
457.1 | 366.9 | ||||||
|
|
|
|
|
|||||
F-24
Table of Contents
10. Property, plant and equipment
| (dollars in millions) |
As of December 30, 2017 |
As of December 31, 2016 |
||||||
| Cost |
||||||||
| Land and buildings |
$ | 262.1 | $ | 236.6 | ||||
| Plant, equipment and vehicles |
678.6 | 564.3 | ||||||
| Assets under construction |
68.8 | 31.5 | ||||||
|
|
|
|
|
|||||
| 1,009.5 | 832.4 | |||||||
| Less: Accumulated depreciation and impairment |
(323.3 | ) | (232.8 | ) | ||||
|
|
|
|
|
|||||
| Total |
$ | 686.2 | $ | 599.6 | ||||
|
|
|
|
|
|||||
During Fiscal 2017, the depreciation expense in relation to the above assets was $81.3 million, compared with $91.3 million in Fiscal 2016 and $104.3 million in Fiscal 2015.
Property, plant and equipment includes assets held under capital leases with a carrying amount of $2.4 million as of December 30, 2017, compared with $2.3 million as of December 31, 2016.
11. Goodwill
| (dollars in millions) |
Power Transmission |
Fluid Power |
Total | |||||||||
| Cost and carrying amount |
||||||||||||
| As of January 2, 2016 |
$ | 1,378.8 | $ | 627.4 | $ | 2,006.2 | ||||||
| Foreign currency translation |
(55.8 | ) | (38.1 | ) | (93.9 | ) | ||||||
|
|
|
|
|
|
|
|||||||
| As of December 31, 2016 |
$ | 1,323.0 | $ | 589.3 | $ | 1,912.3 | ||||||
| Reclassification of goodwill between segments |
7.2 | (7.2 | ) | — | ||||||||
| Acquisitions |
— | 44.3 | 44.3 | |||||||||
| Foreign currency translation |
100.0 | 28.9 | 128.9 | |||||||||
|
|
|
|
|
|
|
|||||||
| As of December 30, 2017 |
$ | 1,430.2 | $ | 655.3 | $ | 2,085.5 | ||||||
|
|
|
|
|
|
|
|||||||
During Fiscal 2016 and Fiscal 2017, Gates transitioned its operations to align around its two primary product line businesses, Power Transmission and Fluid Power, including reorganizing the management team roles and responsibilities, introducing global product management functions, centralizing cost functions, implementing new processes and systems, and changing internal reports presented to the chief operating decision maker to reflect this strategic re-focus on product lines. This change in the way in which Gates is managed necessitated a change in our reportable operating segments from regional segments to product line segments, which occurred during the third quarter of 2017. The impact of the segment change on goodwill was initially estimated as of July 1, 2017. The reallocation of goodwill was finalized based on the relative fair value of the reporting units as of September 30, 2017. As part of the finalization of this allocation during 2017, a reclassification of $7.2 million between the segments was made.
As described further in note 4, on June 12, 2017, and October 2, 2017, Gates completed the acquisitions of the Techflow Flexibles and Atlas Hydraulics businesses, respectively.
Historically, the Company conducted its annual impairment test on the goodwill balance as of the last day of the fiscal year. During Fiscal 2017, this was changed to the first day of the fourth quarter. This change in the date as of which the impairment testing is performed was made in order to better align with the year end process and the timing of forecast preparations. This change is expected to be beneficial in that it allows more time to review and consider the impairment test results before the year end. Management based the fair value calculations on a weighted blend of the income and market approaches.
For all reporting units, the fair values exceeded the carrying values and no goodwill impairments were therefore recognized during Fiscal 2017, Fiscal 2016 or Fiscal 2015.
F-25
Table of Contents
12. Intangible assets
| As of December 30, 2017 | As of December 31, 2016 | |||||||||||||||||||||||
| (dollars in millions) |
Cost | Accumulated amortization and impairment |
Net | Cost | Accumulated amortization and impairment |
Net | ||||||||||||||||||
| Finite-lived: |
||||||||||||||||||||||||
| Customer relationships |
$ | 2,051.1 | $ | (424.4 | ) | $ | 1,626.7 | $ | 1,935.1 | $ | (288.8 | ) | $ | 1,646.3 | ||||||||||
| Technology |
90.8 | (86.2 | ) | 4.6 | 86.0 | (79.8 | ) | 6.2 | ||||||||||||||||
| Capitalized software |
48.3 | (22.2 | ) | 26.1 | 38.3 | (16.1 | ) | 22.2 | ||||||||||||||||
|
|
|
|
|
|
|
|
|
|
|
|
|
|||||||||||||
| $ | 2,190.2 | $ | (532.8 | ) | $ | 1,657.4 | $ | 2,059.4 | $ | (384.7 | ) | $ | 1,674.7 | |||||||||||
|
|
|
|
|
|
|
|
|
|
|
|
|
|||||||||||||
| Indefinite-lived: |
||||||||||||||||||||||||
| Brands and trade names |
513.4 | (44.0 | ) | 469.4 | 513.4 | (44.0 | ) | 469.4 | ||||||||||||||||
|
|
|
|
|
|
|
|
|
|
|
|
|
|||||||||||||
| Total intangible assets |
$ | 2,703.6 | $ | (576.8 | ) | $ | 2,126.8 | $ | 2,572.8 | $ | (428.7 | ) | $ | 2,144.1 | ||||||||||
|
|
|
|
|
|
|
|
|
|
|
|
|
|||||||||||||
During Fiscal 2017, an impairment of $1.0 million was recognized in relation to technology and know-how, compared with a computer software impairment of $2.0 million and $0.1 million for Fiscal 2016 and Fiscal 2015, respectively. Refer to note 14.C. for additional detail on assets measured at fair value on a non-recurring basis.
During Fiscal 2017, the amortization expense recognized in continuing operations in respect of intangible assets was $130.9 million, compared with $149.5 million for Fiscal 2016 and $165.6 million for Fiscal 2015. In addition, movements in foreign currency exchange rates resulted in an increase of $78.3 million in Fiscal 2017, compared with a decrease of $48.0 million in Fiscal 2016, in the net carrying value of total intangible assets.
The amortization expense for the next five years is estimated to be as follows:
| (dollars in millions) |
||||
| Fiscal year |
||||
| 2018 |
$ | 128.2 | ||
| 2019 |
128.2 | |||
| 2020 |
127.6 | |||
| 2021 |
121.4 | |||
| 2022 |
120.9 | |||
13. Derivative financial instruments
Gates is exposed to certain risks relating to its ongoing business operations. From time to time, Gates uses derivative financial instruments, principally foreign currency swaps, forward foreign currency contracts and interest rate caps (options), to reduce its exposure to foreign currency risk and interest rate risk. Gates does not hold or issue derivatives for speculative purposes and monitors closely the credit quality of the institutions with which it transacts.
Gates recognizes derivative instruments as either assets or liabilities in the consolidated balance sheet. Gates designates certain of its currency swaps as net investment hedges and designates its interest rate caps as cash flow hedges. The effective portion of the gain or loss on the designated derivative instrument is recognized in OCI and reclassified into net income in the same period or periods during which the hedged transaction affects earnings. Gains and losses on the derivative instrument representing either hedge ineffectiveness or hedge components excluded from the assessment of effectiveness are recognized in current period net income.
All other derivative instruments not designated in an effective hedging relationship are considered economic hedges and their change in fair value is recognized in net income in each period.
The following table sets out the fair value (loss) gain recognized in OCI in relation to the instruments designated as net investment hedging instruments:
| (dollars in millions) |
Fiscal 2017 | Fiscal 2016 | Fiscal 2015 | |||||||||
| Fair value (loss) gain recognized in OCI in relation to: |
||||||||||||
| —Euro-denominated debt |
$ | (73.3 | ) | $ | 19.3 | $ | (15.9 | ) | ||||
| —Designated cross currency swaps |
(36.1 | ) | 14.1 | (11.4 | ) | |||||||
|
|
|
|
|
|
|
|||||||
| Total net fair value (loss) gain |
$ | (109.4 | ) | $ | 33.4 | $ | (27.3 | ) | ||||
|
|
|
|
|
|
|
|||||||
F-26
Table of Contents
The closing fair value of the designated currency swaps as of December 30, 2017, was a liability of $38.9 million, compared with an asset of $0.5 million as of December 31, 2016.
During Fiscal 2017, there was a $2.0 million loss, compared with a $7.0 million loss in Fiscal 2016 and an $18.4 million loss in Fiscal 2015, recognized in OCI in relation to interest rate caps. In addition, $11.6 million in relation to the interest rate caps was reclassified from OCI to net income during Fiscal 2017, compared with $5.4 million in Fiscal 2016 and $0.7 million in Fiscal 2015.
The closing fair value of the interest rate caps as of December 30, 2017 was a liability of $5.6 million, compared with liability of $14.7 million as of December 31, 2016.
Management does not designate its currency forward contracts, which are used primarily in respect of operational currency exposures related to payables, receivables and material procurement, as hedging instruments for the purposes of hedge accounting under ASC Topic 815 “Derivatives and Hedging”. During Fiscal 2017, a net loss of $2.8 million was recognized in selling, general and administrative expenses on the fair valuation of these currency contracts, compared with a net loss of $0.2 in Fiscal 2016 and $0 in Fiscal 2015.
The fair values of derivative financial instruments held by Gates were as follows:
| As of December 30, 2017 | As of December 31, 2016 | |||||||||||||||||||||||||||||||||||||||
| (dollars in millions) |
Other current assets |
Other non- current assets |
Other current liabilities |
Other non- current liabilities |
Net | Other current assets |
Other non- current assets |
Other current liabilities |
Other non- current liabilities |
Net | ||||||||||||||||||||||||||||||
| Derivatives designated as hedging instruments |
||||||||||||||||||||||||||||||||||||||||
| Currency swaps |
$ | 3.2 | $ | — | $ | — | $ | (42.1 | ) | $ | (38.9 | ) | $ | 3.9 | $ | — | $ | — | $ | (3.4 | ) | $ | 0.5 | |||||||||||||||||
| Interest rate caps |
— | 0.6 | (3.8 | ) | (2.4 | ) | (5.6 | ) | — | 2.2 | (11.1 | ) | (5.8 | ) | (14.7 | ) | ||||||||||||||||||||||||
| Derivatives not designated as hedging instruments |
||||||||||||||||||||||||||||||||||||||||
| Currency swaps |
— | — | — | — | — | 0.1 | — | (0.1 | ) | — | — | |||||||||||||||||||||||||||||
| Currency forward contracts |
0.5 | — | (1.6 | ) | — | (1.1 | ) | 2.0 | — | (0.8 | ) | — | 1.2 | |||||||||||||||||||||||||||
|
|
|
|
|
|
|
|
|
|
|
|
|
|
|
|
|
|
|
|
|
|||||||||||||||||||||
| $ | 3.7 | $ | 0.6 | $ | (5.4 | ) | $ | (44.5 | ) | $ | (45.6 | ) | $ | 6.0 | $ | 2.2 | $ | (12.0 | ) | $ | (9.2 | ) | $ | (13.0 | ) | |||||||||||||||
|
|
|
|
|
|
|
|
|
|
|
|
|
|
|
|
|
|
|
|
|
|||||||||||||||||||||
A. Currency derivatives
As of December 30, 2017, the notional principal amount of outstanding foreign exchange contracts that are used to manage the currency profile of Gates’ cash was $0, compared with $24.9 million as of December 31, 2016, none of which were designated as hedging instruments during the current period. As of December 30, 2017, the notional amount of outstanding currency forward contracts that are used to manage operational foreign exchange exposures was $99.2 million, compared with $83.3 as of December 31, 2016, none of which have been designated as hedging instruments during the current period. In addition, Gates held cross currency swaps that have been designated as net investment hedges. As of December 30, 2017, the notional principal amount of these contracts was $270.0 million, compared with $270.0 million as of December 31, 2016.
B. Interest rate caps
Gates uses interest rate caps as part of its interest rate risk management strategy to add stability to interest expense and to manage its exposure to interest rate movements. Interest rate caps designated as cash flow hedges involve the receipt of variable rate payments from a counterparty if interest rates rise above the strike rate on the contract in exchange for a premium. As of December 30, 2017, the notional amount of the interest rate cap contracts outstanding was $2.2 billion, compared with $2.2 billion as of December 31, 2016. Contracts with a notional amount of $1.0 billion run through June 30, 2019 and a further contract for $0.2 billion runs through June 30, 2020. The remaining contract, with a notional amount of $1.0 billion, is for the period June 28, 2019 through June 30, 2020.
F-27
Table of Contents
14. Fair value measurement
A. Fair value hierarchy
We account for certain assets and liabilities at fair value. ASC Topic 820 “Fair Value Measurements and Disclosures” establishes the following hierarchy for the inputs that are used in fair value measurement:
| • | “Level 1” inputs are unadjusted quoted prices in active markets for identical assets or liabilities. |
| • | “Level 2” inputs are those other than quoted prices included within Level 1 that are observable for the asset or liability, either directly (i.e. as prices) or indirectly (i.e. derived from prices). |
| • | “Level 3” inputs are not based on observable market data (unobservable inputs). |
Assets and liabilities that are measured at fair value are categorized in one of the three levels on the basis of the lowest-level input that is significant to its valuation.
B. Financial assets and liabilities
The following table summarizes financial assets and liabilities and their fair value as of December 30, 2017 and December 31, 2016:
| Fair value | ||||||||||||||||||||||||||||||||
| Carrying amount | Level 1 | Level 2 | Level 3 | |||||||||||||||||||||||||||||
| (dollars in millions) |
As of December 30, 2017 |
As of December 31, 2016 |
As of December 30, 2017 |
As of December 31, 2016 |
As of December 30, 2017 |
As of December 31, 2016 |
As of December 30, 2017 |
As of December 31, 2016 |
||||||||||||||||||||||||
| Assets and liabilities not recorded at fair value |
||||||||||||||||||||||||||||||||
| Cash and cash equivalents |
$ | 564.4 | $ | 527.2 | $ | — | $ | — | $ | 564.4 | $ | 527.2 | $ | — | $ | — | ||||||||||||||||
| Restricted cash |
1.6 | 1.6 | — | — | 1.6 | 1.6 | — | — | ||||||||||||||||||||||||
| Bank overdrafts |
— | (0.3 | ) | — | — | — | (0.3 | ) | — | — | ||||||||||||||||||||||
| Debt, including current portion |
(3,955.7 | ) | (3,836.6 | ) | — | — | (4,036.9 | ) | (3,878.2 | ) | — | — | ||||||||||||||||||||
|
|
|
|
|
|
|
|
|
|
|
|
|
|
|
|
|
|||||||||||||||||
| $ | (3,389.7 | ) | $ | (3,308.1 | ) | $ | — | $ | — | $ | (3,470.9 | ) | $ | (3,349.7 | ) | $ | — | $ | — | |||||||||||||
| Recurring fair value measurements |
||||||||||||||||||||||||||||||||
| Assets recorded at fair value |
||||||||||||||||||||||||||||||||
| Investments – Available-for-sale securities |
$ | 2.4 | $ | 2.6 | $ | 2.4 | $ | 2.6 | $ | — | $ | — | $ | — | $ | — | ||||||||||||||||
| Derivatives |
4.3 | 8.2 | — | — | 4.3 | 8.2 | — | — | ||||||||||||||||||||||||
|
|
|
|
|
|
|
|
|
|
|
|
|
|
|
|
|
|||||||||||||||||
| 6.7 | 10.8 | 2.4 | 2.6 | 4.3 | 8.2 | — | — | |||||||||||||||||||||||||
| Liabilities recorded at fair value |
||||||||||||||||||||||||||||||||
| Derivatives |
$ | (49.9 | ) | $ | (21.2 | ) | $ | — | $ | — | $ | (49.9 | ) | $ | (21.2 | ) | $ | — | $ | — | ||||||||||||
Transfers between Levels of the Fair Value Hierarchy
During the periods presented, there were no transfers between Levels 1 and 2, and Gates had no assets or liabilities measured at fair value on a recurring basis using Level 3 inputs. However, as described in note 17 of these financial statements and notes, certain of the assets held by Gates’ funded defined benefit pension plans are valued on a recurring basis using Level 3 inputs.
Valuation and methodology and key inputs
Certain financial assets and liabilities are not measured at fair value; however, items such as cash and cash equivalents, restricted cash, revolving credit facilities and bank overdrafts generally attract interest at floating rates and accordingly their carrying amounts are considered to approximate fair value. Due to their short maturities, the carrying amounts of accounts receivable and accounts payable are also considered to approximate their fair values.
Available-for-sale securities represent equity securities that are traded in an active market and therefore are measured using quoted prices in an active market. Derivative assets and liabilities included in Level 2 above represent foreign currency exchange forward and swap contracts, and interest rate cap contracts.
We value our foreign currency exchange derivatives using internal models consistent with those used by a market participant that maximize the use of market observable inputs including forward prices for currencies.
F-28
Table of Contents
We value our interest rate cap contracts using a widely accepted discounted cash flow valuation methodology that reflects the contractual terms of each derivative, including the period to maturity. The methodology derives the fair values of the caps using the market standard methodology of netting the discounted future fixed cash payments and the discounted expected variable receipts that would occur if variable interest rates rise above the strike rate of the caps. The variable interest rates used in the calculation are based on an expectation of future interest rates derived from observable market-based interest rate curves and implied volatilities. In addition, credit valuation adjustments, which consider the impact of any credit enhancements to the contracts, are incorporated in the fair values to account for potential non-performance risk.
To comply with the provisions of ASC 820, we incorporate credit valuation adjustments to appropriately reflect both our own non-performance risk and the respective counterparty’s non-performance risk in the fair value measurements.
Debt is comprised principally of borrowings under the secured credit facilities and the unsecured senior notes. Debt under the secured credit facilities attract interest at floating rates, subject to a 1% LIBOR floor, 0% EURIBOR floor and their principal amounts, derived from a market price, discounted for illiquidity, are considered to approximate fair value. Debt under the unsecured senior notes have fixed interest rates, are traded between “Qualified Institutional Buyers” and their fair value is derived from quoted market prices.
C. Assets measured at fair value on a non-recurring basis
Gates has non-recurring fair value measurements related to certain assets, including goodwill, intangible assets, and property, plant, and equipment.
Historically, the Company conducted its annual impairment tests on its brands and trade names, an indefinite-lived intangible asset, as of the last day of the fiscal year. During Fiscal 2017, this was changed to the first day of the fourth quarter. This change in the date as of which the impairment testing is performed was made in order to better align with the year end process and the timing of forecast preparations and is consistent with the timing of the annual impairment testing of goodwill. This change is expected to be beneficial in that it allows more time to review and consider the impairment test results before the year end. The fair value is determined using a relief from royalty valuation methodology in which the key assumptions included sales growth rates and an estimated royalty rate. There were no impairments of brands and trade names during Fiscal 2017 or Fiscal 2016. In Fiscal 2015, the fair value of our brands and trade names intangible asset decreased to $469.4 million, resulting in an impairment of $44.0 million. This was driven almost exclusively by the impact of weakening foreign currencies (in which the sales that support the value of the intangible asset are denominated) against the US dollar (in which the brands and trade name intangible asset is denominated).
During Fiscal 2017, an impairment of $1.0 million was recognized in relation to certain of our technology and know-how intangible assets whose fair value had reduced to zero and in Fiscal 2016, an impairment of $2.0 million was recognized in relation to certain computer software assets whose fair value had reduced to zero.
15. Debt
Long-term debt, including the current portion and bank overdrafts, is analyzed as follows:
| (dollars in millions) |
As of December 30, 2017 |
As of December 31, 2016 |
||||||
| Bank overdrafts |
$ | — | $ | 0.3 | ||||
| —Secured |
||||||||
| Dollar Term Loan |
1,729.4 | 2,398.7 | ||||||
| Euro Term Loan |
785.6 | 201.6 | ||||||
| —Unsecured |
||||||||
| Dollar Senior Notes |
1,190.0 | 1,040.0 | ||||||
| Euro Senior Notes |
282.5 | 245.7 | ||||||
| Other loans |
0.4 | 0.4 | ||||||
|
|
|
|
|
|||||
| Total principal of debt |
3,987.9 | 3,886.7 | ||||||
| Deferred issuance costs |
(73.2 | ) | (85.7 | ) | ||||
| Accrued interest |
41.0 | 35.9 | ||||||
|
|
|
|
|
|||||
| Total carrying value of debt |
3,955.7 | 3,836.9 | ||||||
| Debt, current portion |
66.4 | 46.9 | ||||||
|
|
|
|
|
|||||
| Debt, less current portion |
$ | 3,889.3 | $ | 3,790.0 | ||||
|
|
|
|
|
|||||
Gates’ secured debt is jointly and severally, irrevocably and fully and unconditionally guaranteed by certain of its subsidiaries and are secured by liens on substantially all of their assets.
F-29
Table of Contents
Gates is subject to covenants, representations and warranties under certain of its debt facilities. During the periods covered by these consolidated financial statements, we were in compliance with the applicable financial covenants. Also under the agreements governing our debt facilities, our ability to engage in activities such as incurring certain additional indebtedness, making certain investments and paying certain dividends is dependent, in part, on our ability to satisfy tests based on measures determined under those agreements.
The principal payments due under our financing arrangements over the next five years and thereafter are as follows:
| (dollars in millions) |
Total | |||
| Fiscal year |
||||
| 2018 |
$ | 25.4 | ||
| 2019 |
25.4 | |||
| 2020 |
25.4 | |||
| 2021 |
25.4 | |||
| 2022 |
1,497.9 | |||
| Thereafter |
2,388.4 | |||
|
|
|
|||
| $ | 3,987.9 | |||
|
|
|
|||
Dollar and Euro Term Loans
Gates’ secured credit facilities include a Dollar Term Loan credit facility and a Euro Term Loan credit facility that were drawn on July 3, 2014. As part of a refinancing transaction in April 2017, the maturity dates for both of the term loan facilities were extended from July 3, 2021 to March 31, 2024, with a springing maturity of April 15, 2022 if more than $500 million of the Dollar Senior Notes remain in issue at that time. These term loan facilities bear interest at a floating rate, which for U.S. dollar debt can be either a base rate as defined in the credit agreement plus an applicable margin, or at Gates’ option, LIBOR plus an applicable margin.
The Dollar and Euro Term Loans were refinanced during April and November 2017. Following these refinancings, the Dollar Term Loan interest rate is currently LIBOR, subject to a floor of 1%, plus a margin of 3.00% and as of December 30, 2017, borrowings under this facility bore interest at a rate of 4.69% per annum. As of December 30, 2017, the Euro Term Loan bears interest at Euro LIBOR, subject to a floor of 0%, plus a margin of 3.25%. The next term loan interest rate re-set date is on March 29, 2018.
On January 29, 2018, as agreed as part of the refinancing in November 2017, the applicable margins on each of the term loans were lowered by 0.25% following the successful completion of an initial public offering.
Both term loans are subject to quarterly amortization payments of 0.25%, based on the original principal amount less certain prepayments with the balance payable on maturity. During Fiscal 2017, Gates made quarterly amortization payments against the Dollar Term Loan and the Euro Term Loan of $19.3 million and $6.3 million, respectively. During Fiscal 2016, we made quarterly amortization payments against the Dollar Term Loan and the Euro Term Loan of $24.9 million and $2.2 million, respectively.
Under the terms of the credit agreement, Gates is obliged to offer annually to the term loan lenders an “excess cash flow” amount as defined under the agreement, based on the preceding year’s final results. Based on the Fiscal 2016 and Fiscal 2017 results, our leverage ratio as defined under the credit agreement was below the threshold above which payments are required, and therefore no excess cash flow payment was required to be made in respect of either period.
During Fiscal 2017, a transactional foreign exchange loss of $96.7 million, compared with a $8.7 million gain for Fiscal 2016, was recognized in respect of the Euro Term Loan, of which $60.2 million, compared with $0 for Fiscal 2016, was recognized in other (expense) income and a $36.5 million loss, compared with a $8.7 million gain for Fiscal 2016, was recognized in OCI in respect of the Euro Term Loan as part of this facility is designated as a net investment hedge of certain of Gates’ Euro investments.
As of December 30, 2017, the principal amount outstanding under the Dollar Term Loan was $1,729.4 million and the Euro Term Loan was $785.6 million (€653.5 million).
F-30
Table of Contents
Unsecured senior notes
As of December 30, 2017, Gates had outstanding $1,190.0 million Dollar Senior Notes and $282.5 million (€235.0 million) Euro Senior Notes, which are scheduled to mature on July 15, 2022 (the “Notes”). The Dollar Senior Notes bear interest at an annual fixed rate of 6% and the Euro Senior Notes carry an annual fixed interest rate of 5.75%. Interest payments commenced on January 15, 2015 and are made semi-annually.
During Fiscal 2017, a transactional foreign exchange loss of $36.8 million, compared with a $10.6 million gain in Fiscal 2016, was recognized in respect of the Euro Senior Notes and was recorded in OCI as a net investment hedge of certain of Gates’ Euro investments.
Gates may redeem the Notes, at its option, in whole at any time or in part from time to time, at the following redemption prices (expressed as a percentage of the principal amount), plus accrued and unpaid interest to the redemption date:
| Dollar Senior Note Redemption price |
Euro Senior Note Redemption price |
|||||||
| During the year commencing: |
||||||||
| —July 15, 2017 |
103.0 | % | 102.875 | % | ||||
| —July 15, 2018 |
101.5 | % | 101.438 | % | ||||
| —July 15, 2019 and thereafter |
100.0 | % | 100.000 | % | ||||
In the event of a change of control over the Company, each holder will have the right to require Gates to repurchase all of such holder’s Notes at a purchase price in cash equal to 101% of the principal amount thereof, plus accrued and unpaid interest to the date of repurchase, except to the extent that Gates has previously elected to redeem the Notes.
Subsequent to the end of the fiscal year, Gates redeemed in full the €235.0 million of outstanding Euro Senior Notes, plus interest accrued up to and including January 31, 2018 of $0.7 million. The Notes were redeemed at a price of 102.875% and a redemption premium of $8.2 million was therefore paid in addition to the principal of $285.8 million equivalent as of the redemption date.
In addition, on February 8 and February 9, 2018, Gates made partial redemptions of the Dollar Senior Notes with a principal of $522.0 million and $100.0 million, respectively. Both of these calls were made at a price of 103.0%, incurring redemption premiums of $15.7 million and $3.0 million, respectively. Interest accrued of $2.0 million and $0.4 million, respectively, was also paid on these dates.
All of the above prepayments, totaling $907.8 million in principal, $26.9 million in redemption premium and $3.1 million in accrued interest, were funded primarily by the net proceeds from the initial public offering of approximately $800 million, with the remainder coming from excess cash on hand.
Revolving credit facility
Gates also has a secured revolving credit facility, maturing on July 3, 2019, that provides for multi-currency revolving loans up to an aggregate principal amount of $125.0 million, with a letter of credit sub-facility of $20.0 million. In January 2018, the maturity date of this facility was extended from July 3, 2019 to January 29, 2023, with a springing maturity of April 15, 2022 if more than $500 million of the Dollar Senior Notes remain in issue at that time. In addition, as part of this amendment, the facility size was increased from $125.0 million to $185.0 million.
As of both December 30, 2017 and December 31, 2016, there were $0 drawings for cash under the revolving credit facility and there were no letters of credit outstanding.
Debt under the revolving credit facility bears interest at a floating rate, which can be either a base rate as defined in the credit agreement plus an applicable margin or, at Gates’ option LIBOR, plus an applicable margin.
Asset-backed revolver
Gates has a revolving credit facility backed by certain of its assets in North America. The facility allows for loans of up to a maximum of $325.0 million ($293.7 million as of December 30, 2017, compared with $288.6 million as of December 31, 2016, based on values of the secured assets on those dates) with a letter of credit sub-facility of $150 million within this. In January 2018, the maturity date of this facility was extended to January 29, 2023, with a springing maturity of April 15, 2022 if more than $500 million of the Dollar Senior Notes remain in issue at that time.
F-31
Table of Contents
As of both December 30, 2017 and December 31, 2016, there were $0 drawings for cash under the asset-backed revolver. Debt under the facility bears interest at a floating rate, which can be either a base rate as defined in the credit agreement plus an applicable margin or, at Gates’ option, LIBOR, plus an applicable margin. The letters of credit outstanding under the asset-backed revolver as of December 30, 2017 amounted to $58.0 million, compared with $54.3 million as of December 31, 2016.
16. Accrued expenses and other liabilities
Other liabilities consisted of the following:
| (dollars in millions) |
As of December 30, 2017 |
As of December 31, 2016 |
||||||
| Accrued compensation |
$ | 85.3 | $ | 72.9 | ||||
| Derivative financial instruments |
49.9 | 21.2 | ||||||
| VAT and other taxes payable |
23.5 | 25.5 | ||||||
| Warranty reserve |
14.1 | 14.3 | ||||||
| Workers’ compensation reserve |
11.9 | 10.1 | ||||||
| Other accrued expenses and other liabilities |
89.1 | 81.7 | ||||||
|
|
|
|
|
|||||
| $ | 273.8 | $ | 225.7 | |||||
|
|
|
|
|
|||||
The above liabilities are presented in Gates’ balance sheet within other current liabilities and other non-current liabilities as follows:
| (dollars in millions) |
As of December 30, 2017 |
As of December 31, 2016 |
||||||
| —Accrued expenses and other current liabilities |
$ | 210.4 | $ | 199.2 | ||||
| —Other non-current liabilities |
63.4 | 26.5 | ||||||
|
|
|
|
|
|||||
| $ | 273.8 | $ | 225.7 | |||||
|
|
|
|
|
|||||
Changes in restructuring and warranty reserves (included in accrued expenses and other liabilities) were as follows:
| (dollars in millions) |
Restructuring reserves |
Warranty reserves |
||||||
| As of January 3, 2015 |
$ | 2.6 | $ | 10.6 | ||||
| Charge for the period |
12.2 | 11.2 | ||||||
| Utilized during the period |
(8.7 | ) | (9.0 | ) | ||||
| Released during the period |
(0.3 | ) | — | |||||
| Foreign currency translation |
(0.1 | ) | (0.1 | ) | ||||
|
|
|
|
|
|||||
| As of January 2, 2016 |
5.7 | 12.7 | ||||||
| Charge for the period |
9.0 | 12.0 | ||||||
| Utilized during the period |
(8.6 | ) | (9.5 | ) | ||||
| Released during the period |
(1.0 | ) | (0.7 | ) | ||||
| Foreign currency translation |
(0.1 | ) | (0.2 | ) | ||||
|
|
|
|
|
|||||
| As of December 31, 2016 |
5.0 | 14.3 | ||||||
| Charge for the period |
13.9 | 12.3 | ||||||
| Utilized during the period |
(10.5 | ) | (13.1 | ) | ||||
| Released during the period |
(0.1 | ) | (0.1 | ) | ||||
| Foreign currency translation |
0.3 | 0.7 | ||||||
|
|
|
|
|
|||||
| As of December 30, 2017 |
$ | 8.6 | $ | 14.1 | ||||
|
|
|
|
|
|||||
Restructuring costs
Gates has undertaken various restructuring activities to streamline its operations, consolidate and take advantage of available capacity and resources, and ultimately achieve net cost reductions. Restructuring activities include efforts to integrate and rationalize our businesses and to relocate manufacturing operations to lower cost locations. A majority of the remaining accrual for restructuring costs is expected to be utilized during 2018.
F-32
Table of Contents
Restructuring costs of $17.4 million were recognized in net income during Fiscal 2017, compared with costs of $11.4 million recognized during Fiscal 2016 and $15.6 million recognized during Fiscal 2015. In each period, these costs related primarily to severance expenses incurred across both segments, primarily in Europe and North America, as part of the right-sizing of Gates’ operations and the streamlining of our corporate functions. Restructuring costs recognized in the statements of operations for each segment:
| (dollars in millions) |
Fiscal 2017 | Fiscal 2016 | Fiscal 2015 | |||||||||
| Power Transmission |
$ | 11.1 | $ | 6.5 | $ | 9.4 | ||||||
| Fluid Power |
6.3 | 4.9 | 6.2 | |||||||||
|
|
|
|
|
|
|
|||||||
| Continuing operations |
$ | 17.4 | $ | 11.4 | $ | 15.6 | ||||||
|
|
|
|
|
|
|
|||||||
Warranty reserves
An accrual is made for warranty claims on various products depending on specific market expectations and the type of product. These estimates are established using historical information on the nature, frequency and average cost of warranty claims. The majority of the warranty accruals are expected to be utilized during 2018, with the remainder estimated to be utilized within the next three years.
An accrual is made for the cost of product recalls if management considers it probable that it will be necessary to recall a specific product and the amount can be reasonably estimated.
17. Post-retirement benefits
A. Defined contribution pension plans
Gates provides defined contribution pension benefits in most of the countries in which it operates; in particular, the majority of its employees in the U.S. are entitled to such benefits.
During Fiscal 2017, the expense recognized by Gates in respect of defined contribution pension plans was $18.6 million, compared with $17.7 million in Fiscal 2016 and $18.2 million in Fiscal 2015.
B. Defined benefit pension plans
Gates operates defined benefit pension plans in certain of the countries in which it operates, in particular, in the U.S. and U.K. Generally, the pension benefits provided under these plans are based on pensionable salary and the period of service of the individual employees. Plan assets are held separately from those of Gates in funds that are under the control of trustees. All of the defined benefit pension plans operated by Gates are closed to new entrants. In addition to the funded defined benefit pension plans, Gates has unfunded defined benefit obligations to certain current and former employees.
Funded status
The net deficit recognized in respect of defined benefit pension plans is presented in the balance sheet as follows:
| (dollars in millions) |
As of December 30, 2017 |
As of December 31, 2016 |
||||||
| Pension surplus |
$ | (57.7 | ) | $ | (42.1 | ) | ||
| Accrued expenses and other current liabilities |
2.3 | 2.6 | ||||||
| Post-retirement benefit obligations |
94.7 | 101.2 | ||||||
|
|
|
|
|
|||||
| $ | 39.3 | $ | 61.7 | |||||
|
|
|
|
|
|||||
| Plans whose projected benefit obligation was in excess of plan assets: |
||||||||
| —Aggregate projected benefit obligation |
$ | 419.0 | $ | 609.4 | ||||
| —Aggregate plan assets |
322.4 | 506.3 | ||||||
| Plans whose accumulated benefit obligation was in excess of the plan assets: |
||||||||
| —Aggregate accumulated benefit obligation |
$ | 414.4 | $ | 601.5 | ||||
| —Aggregate plan assets |
321.7 | 501.6 | ||||||
F-33
Table of Contents
Benefit obligation
Changes in the projected benefit obligation in relation to defined benefit pension plans were as follows:
| (dollars in millions) |
Fiscal 2017 | Fiscal 2016 | ||||||
| Benefit obligation at the beginning of the period |
$ | 1,079.7 | $ | 1,094.0 | ||||
| Additions |
— | 10.7 | ||||||
| Employer service cost |
5.7 | 5.0 | ||||||
| Employer contributions |
0.1 | 0.1 | ||||||
| Plan amendments |
0.7 | (0.2 | ) | |||||
| Interest cost |
30.4 | 37.5 | ||||||
| Net actuarial (gain) loss |
(19.6 | ) | 99.9 | |||||
| Benefits paid |
(58.8 | ) | (68.9 | ) | ||||
| Expenses paid from assets |
(1.8 | ) | (2.0 | ) | ||||
| Curtailments and settlements |
(163.3 | ) | (2.7 | ) | ||||
| Foreign currency translation |
59.8 | (93.7 | ) | |||||
|
|
|
|
|
|||||
| Benefit obligation at the end of the period |
$ | 932.9 | $ | 1,079.7 | ||||
|
|
|
|
|
|||||
| Accumulated benefit obligation |
$ | 928.4 | $ | 1,075.0 | ||||
|
|
|
|
|
|||||
Changes in plan assets
Changes in the fair value of the assets held by defined benefit pension plans were as follows:
| (dollars in millions) |
Fiscal 2017 | Fiscal 2016 | ||||||
| Plan assets at the beginning of the period |
$ | 1,018.0 | $ | 1,040.3 | ||||
| Additions |
— | 11.1 | ||||||
| Actual return on plan assets |
27.3 | 127.8 | ||||||
| Employer contributions |
10.5 | 10.8 | ||||||
| Plan participants’ contributions |
0.2 | 0.2 | ||||||
| Curtailments and settlements |
(162.3 | ) | (2.7 | ) | ||||
| Benefits paid |
(58.8 | ) | (68.9 | ) | ||||
| Expenses paid from assets |
(1.7 | ) | (2.0 | ) | ||||
| Foreign currency translation |
60.4 | (98.6 | ) | |||||
|
|
|
|
|
|||||
| Plan assets at the end of the period |
$ | 893.6 | $ | 1,018.0 | ||||
|
|
|
|
|
|||||
In September 2017, Gates completed an annuity purchase for most of the retirees in its largest U.S. defined benefit pension plan. The $154.0 million purchase price, funded from plan assets, settled $155.1 million of the pension benefit obligation. The net post-retirement benefit obligation has therefore reduced by $1.1 million.
Gates’ desired investment objectives for pension plan assets include maintaining an adequate level of diversification to reduce interest rate and market risk, and to provide adequate liquidity to meet immediate and future benefit payment requirements. Outside the U.S., Gates’ defined benefit pension plans target a mix of growth seeking assets, comprising equities, and income generating assets, comprising government and corporate bonds, that is considered by the trustees to be appropriate in the circumstances. Plan assets are rebalanced periodically to maintain target asset allocations.
Certain benefit obligations outside the U.S. are matched by insurance contracts.
Investments in equities and fixed income securities are held in pooled investment funds that are managed by investment managers on a passive (or “index-tracking”) basis. The trustees ensure that there is no significant concentration of credit risk in any one financial institution.
Plan assets do not include any financial instruments issued by, any property occupied by, or other assets used by Gates.
F-34
Table of Contents
The fair values of pension plan assets by asset category were as follows:
| As of December 30, 2017 | As of December 31, 2016 | |||||||||||||||||||||||||||||||
| (dollars in millions) |
Quoted prices in active markets (Level 1) |
Significant observable inputs (Level 2) |
Significant unobservable inputs (Level 3) |
Total | Quoted prices in active markets (Level 1) |
Significant observable inputs (Level 2) |
Significant unobservable inputs (Level 3) |
Total | ||||||||||||||||||||||||
| Public equities |
$ | — | $ | 18.5 | $ | — | $ | 18.5 | $ | — | $ | 17.6 | $ | — | $ | 17.6 | ||||||||||||||||
| Fixed income securities: |
||||||||||||||||||||||||||||||||
| —Corporate securities |
— | 305.9 | — | 305.9 | — | 404.7 | — | 404.7 | ||||||||||||||||||||||||
| —Government securities |
— | 305.6 | — | 305.6 | — | 325.6 | — | 325.6 | ||||||||||||||||||||||||
| —Annuities and insurance |
— | 3.7 | 248.1 | 251.8 | — | 3.3 | 250.6 | 253.9 | ||||||||||||||||||||||||
| Cash and cash equivalents |
— | 11.7 | — | 11.7 | — | 16.2 | — | 16.2 | ||||||||||||||||||||||||
|
|
|
|
|
|
|
|
|
|
|
|
|
|
|
|
|
|||||||||||||||||
| Total |
$ | — | $ | 645.4 | $ | 248.1 | $ | 893.5 | $ | — | $ | 767.4 | $ | 250.6 | $ | 1,018.0 | ||||||||||||||||
|
|
|
|
|
|
|
|
|
|
|
|
|
|
|
|
|
|||||||||||||||||
Investments in equities and bonds held in pooled investment funds are measured at the bid price quoted by the investment managers, which reflect the quoted prices of the underlying securities. Insurance contracts are measured at their surrender value quoted by the insurers. Cash and cash equivalents largely attract floating interest rates.
Changes in the fair value of plan assets measured using significant unobservable inputs (level 3) may be analyzed as follows:
| (dollars in millions) |
Fiscal 2017 | Fiscal 2016 | ||||||
| Fair value at the beginning of the period |
$ | 250.6 | $ | 261.5 | ||||
| Additions |
— | 11.0 | ||||||
| Unrealized (losses) gains in the period |
(14.7 | ) | 34.0 | |||||
| Purchases |
1.5 | 4.7 | ||||||
| Sales |
(1.0 | ) | (1.0 | ) | ||||
| Impacts of benefits paid |
(12.8 | ) | (13.3 | ) | ||||
| Settlements |
(0.4 | ) | — | |||||
| Fees |
— | (0.2 | ) | |||||
| Foreign exchange |
24.9 | (46.1 | ) | |||||
|
|
|
|
|
|||||
| $ | 248.1 | $ | 250.6 | |||||
|
|
|
|
|
|||||
Estimated future contributions and benefit payments
Gates’ funding policy for its defined benefit pension plans is to contribute amounts determined annually on an actuarial basis to provide for current and future benefits in accordance with federal law and other regulations. During Fiscal 2018, Gates expects to contribute approximately $6.3 million to its defined benefit pension plans.
Benefit payments, reflecting expected future service, are expected to be made by Gates’ defined benefit pension plans as follows:
| (dollars in millions) |
||||
| Fiscal year |
||||
| —2018 |
$ | 50.5 | ||
| —2019 |
54.5 | |||
| —2020 |
55.2 | |||
| —2021 |
56.7 | |||
| —2022 |
56.7 | |||
| —2023 through 2027 |
287.1 | |||
Net periodic benefit cost
Components of the net periodic benefit cost for defined benefit pension plans relating to continuing operations were as follows:
| (dollars in millions) |
Fiscal 2017 | Fiscal 2016 | Fiscal 2015 | |||||||||
| Employer service cost |
$ | 5.8 | $ | 5.0 | $ | 4.4 | ||||||
| Settlement and curtailments |
(3.8 | ) | 0.1 | 0.1 | ||||||||
| Interest cost |
30.4 | 37.5 | 38.9 | |||||||||
| Expected return on plan assets |
(26.9 | ) | (33.8 | ) | (35.6 | ) | ||||||
| Amortization of net actuarial loss |
0.4 | — | — | |||||||||
|
|
|
|
|
|
|
|||||||
| Net periodic benefit cost |
$ | 5.9 | $ | 8.8 | $ | 7.8 | ||||||
|
|
|
|
|
|
|
|||||||
F-35
Table of Contents
Other comprehensive income
Changes in plan assets and benefit obligations of defined benefit pension plans recognized in OCI were as follows:
| (dollars in millions) |
Fiscal 2017 | Fiscal 2016 | Fiscal 2015 | |||||||||
| Current period actuarial (gain) loss |
$ | (20.9 | ) | $ | 5.9 | $ | (1.0 | ) | ||||
| Amortization of net actuarial loss |
(0.4 | ) | — | — | ||||||||
| Prior service credit |
0.7 | (0.1 | ) | — | ||||||||
| Gain recognize due to settlement |
3.8 | (0.1 | ) | (0.1 | ) | |||||||
|
|
|
|
|
|
|
|||||||
| Pre-tax changes recognized in OCI other than foreign currency translation |
(16.8 | ) | 5.7 | (1.1 | ) | |||||||
| Foreign currency translation |
(0.9 | ) | (1.1 | ) | (1.4 | ) | ||||||
|
|
|
|
|
|
|
|||||||
| Total pre-tax changes recognized in OCI |
$ | (17.7 | ) | $ | 4.6 | $ | (2.5 | ) | ||||
|
|
|
|
|
|
|
|||||||
As of December 30, 2017, a cumulative gain before tax of $2.5 million, compared with a loss of $15.2 million in Fiscal 2016 and a loss of $10.6 million in Fiscal 2015, relating to net actuarial losses, was recognized in accumulated OCI in respect of post-retirement benefits and had not yet been recognized as a component of the net periodic benefit cost.
It is estimated that a net $0.2 million loss will be amortized from accumulated other comprehensive loss into net periodic benefit cost during the period from December 31, 2017 through December 29, 2018.
Assumptions
Major assumptions used in determining the benefit obligation and the net periodic benefit cost for defined benefit pension plans are presented in the following table as weighted averages:
| Benefit obligation | Net periodic benefit cost | |||||||||||||||
| As of December 30, 2017 |
As of December 31, 2016 |
As of December 30, 2017 |
As of December 31, 2016 |
|||||||||||||
| Discount rate |
2.619 | % | 2.960 | % | 2.960 | % | 3.620 | % | ||||||||
| Rate of salary increase |
3.178 | % | 4.028 | % | 4.028 | % | 4.057 | % | ||||||||
| Expected return on plan assets |
2.844 | % | 3.357 | % | 3.357 | % | 3.281 | % | ||||||||
In determining the expected return on plan assets, we consider the relative weighting of plan assets, the historical performance of total plan assets and individual asset classes, and economic and other indicators of future performance. Return projections are validated using a simulation model that incorporates yield curves, credit spreads and risk premiums to project long-term prospective returns.
C. Other defined benefit plans
Gates provides other post-employment benefits, principally health and life insurance cover, on an unfunded basis to certain of its employees in the U.S. and Canada.
Funded status
The deficit recognized in respect of other defined benefit plans is presented in the balance sheet as follows:
| (dollars in millions) |
As of December 30, 2017 |
As of December 31, 2016 |
||||||
| Accrued expenses and other current liabilities |
$ | 6.0 | $ | 6.7 | ||||
| Post-retirement benefit obligations |
62.4 | 70.4 | ||||||
|
|
|
|
|
|||||
| $ | 68.4 | $ | 77.1 | |||||
|
|
|
|
|
|||||
F-36
Table of Contents
Benefit obligation
Changes in the accumulated benefit obligation in relation to other defined benefit plans were as follows:
| (dollars in millions) |
Fiscal 2017 | Fiscal 2016 | ||||||
| Benefit obligation at the beginning of the period |
$ | 77.1 | $ | 75.6 | ||||
| Interest cost |
2.7 | 3.1 | ||||||
| Actuarial (gain) loss |
(3.9 | ) | 4.1 | |||||
| Benefits paid |
(4.9 | ) | (6.3 | ) | ||||
| Plan amendments |
(4.4 | ) | — | |||||
| Foreign currency translation |
1.8 | 0.6 | ||||||
|
|
|
|
|
|||||
| Benefit obligation at the end of the period |
$ | 68.4 | $ | 77.1 | ||||
|
|
|
|
|
|||||
| Accumulated benefit obligation |
$ | 68.4 | $ | 77.1 | ||||
|
|
|
|
|
|||||
Estimated future contributions and benefit payments
Contributions are made to our other defined benefit plans as and when benefits are paid from the plans. During Fiscal 2018, Gates expects to contribute approximately $6.1 million to its other benefit plans.
Benefit payments, reflecting expected future service, are expected to be made by Gates’ other defined benefit plans as follows:
| (dollars in million) | ||||
| Fiscal years: |
||||
| —2018 |
6.1 | |||
| —2019 |
5.9 | |||
| —2020 |
5.6 | |||
| —2021 |
5.4 | |||
| —2022 |
5.2 | |||
| —2023 through 2027 |
22.1 | |||
Net periodic benefit cost
Components of the net periodic benefit cost for other defined benefit plans were as follows:
| (dollars in millions) |
Fiscal 2017 | Fiscal 2016 | Fiscal 2015 | |||||||||
| Interest cost |
$ | 2.7 | $ | 3.1 | $ | 2.7 | ||||||
| Amortization of net actuarial loss |
(0.3 | ) | (0.5 | ) | (0.9 | ) | ||||||
|
|
|
|
|
|
|
|||||||
| Net periodic benefit cost |
$ | 2.4 | $ | 2.6 | $ | 1.8 | ||||||
|
|
|
|
|
|
|
|||||||
The net periodic benefit cost relates entirely to continuing operations.
Other comprehensive income
Changes in the benefit obligation of other defined benefit plans recognized in OCI were as follows:
| (dollars in millions) |
Fiscal 2017 | Fiscal 2016 | Fiscal 2015 | |||||||||
| Current period actuarial (gain) loss |
$ | (3.9 | ) | $ | 4.1 | $ | 4.2 | |||||
| Amortization of net actuarial loss |
0.3 | 0.5 | 0.9 | |||||||||
| Prior service credit |
(4.3 | ) | — | — | ||||||||
| Other adjustments |
— | — | 0.2 | |||||||||
|
|
|
|
|
|
|
|||||||
| Total pre-tax changes recognized in OCI |
$ | (7.9 | ) | $ | 4.6 | $ | 5.3 | |||||
|
|
|
|
|
|
|
|||||||
F-37
Table of Contents
As of December 30, 2017, there was a net cumulative gain before tax of $0.1 million, compared with a gain of $8.0 million in Fiscal 2016 and a gain of $12.6 million in Fiscal 2015, recognized in accumulated OCI in respect of other post-retirement benefits and had not yet been recognized as a component of the net periodic benefit cost.
It is estimated that a $0.8 million gain will be amortized from accumulated other comprehensive income into net periodic benefit cost during the period from December 31, 2017 through December 29, 2018.
Assumptions
Major assumptions used in determining the benefit obligation and the net periodic benefit cost for other defined benefit plans are presented in the following table as weighted averages:
| Benefit obligation | Net periodic benefit cost | |||||||||||||||
| As of December 30, 2017 |
As of December 31, 2016 |
As of December 30, 2017 |
As of December 31, 2016 |
|||||||||||||
| Discount rate |
3.42 | % | 3.80 | % | 3.80 | % | 4.19 | % | ||||||||
The initial healthcare cost trend rate as of December 30, 2017, starts at 7.37%, compared with 7.83% as of December 31, 2016, with an ultimate trend rate of 4.94%, compared with 4.94% as of December 31, 2016, beginning in 2023.
Assumed health care cost trend rates have a significant effect on the amounts reported for the health care plans. A one percentage point change in the assumed health care cost trend rate as of December 30, 2017 would have the following effects:
| (dollars in millions) |
1% point increase | 1% point decrease | ||||||
| Increase (decrease) in the total of service and interest cost |
$ | 0.2 | $ | (0.1 | ) | |||
| Increase (decrease) in the benefit obligation |
$ | 2.5 | $ | (2.2 | ) | |||
18. Share-based compensation
A. Background
The Company operates a stock-based incentive plan over its shares to provide incentives to Gates’ senior executives and other eligible employees. The total compensation cost for share-based arrangements recognized in net income under this plan was as follows:
| (dollars in millions) |
Fiscal 2017 | Fiscal 2016 | Fiscal 2015 | |||||||||
| Share-based compensation expense |
$ | 5.4 | $ | 4.2 | $ | 4.3 | ||||||
| Income tax benefit |
1.7 | 1.4 | 1.8 | |||||||||
|
|
|
|
|
|
|
|||||||
| Net expense recognized in net income |
$ | 3.7 | $ | 2.8 | $ | 2.5 | ||||||
|
|
|
|
|
|
|
|||||||
B. Description of the plans
On December 10, 2014, a new stock-based incentive plan encompassing 27,126,400 shares authorized for issue as incentive awards was established by the Company for the benefit of senior executives of Gates and other eligible employees. A total of 18,969,440 options were granted on inception of the new option plan, with an effective grant date of December 10, 2014. The options are split equally into four tiers, each with specific vesting conditions.
Tier I options vest evenly over five years from the grant date, subject to the participant’s continued employment by Gates on the vesting date. Tier II, III and IV options vest on achievement of specified investment returns by Blackstone upon occurrence of a change of control event, which is also subject to the participant’s continued employment by Gates on the vesting date.
The performance conditions associated with Tiers II, III and IV must be achieved on or prior to July 3, 2022 in order for vesting to occur. All the options expire on January 9, 2025.
Due to Chinese regulatory restrictions on foreign stock ownership, awards granted under this plan to Chinese employees have been issued as stock appreciation rights (“SARs”). The terms of these SARs are identical to those of the options described above with the exception that no share is issued on exercise but cash equivalent to the increase in value of the Company’s share from the date of grant to the date of exercise is paid in cash to the employee. These awards are therefore treated as liability awards under ASC 718 “Compensation – Stock Compensation” and are revalued to their fair value at each period end. During Fiscal 2017, 351,560 SARs were issued under the plan at a weighted average exercise price of $7.48, compared with 338,740 issued in Fiscal 2016 at a weighted
F-38
Table of Contents
average exercise price of $6.56 each. None of these awards have been exercised, expired or forfeited during the periods presented. During Fiscal 2017, a charge of $0.9 million was recognized in net income in respect of these awards, compared with a charge of $0.1 million during Fiscal 2016.
In addition to the above, in December 2017, under the same plan, the Company issued 76,293 restricted stock units (“RSUs”). These RSUs vest evenly over three years from the date of grant, subject to the participant’s continued employment by Gates on the vesting date. The awards expire ten years after the date of grant, in December 2027. The weighted average grant date fair value of these awards was $13.14. There were no other movements in RSUs during the periods presented.
As of December 30, 2017, the unrecognized compensation relating to the nonvested awards was $46.9 million, which is expected to be recognized over a weighted-average period of 3.7 years.
The fair value of the options at their grant date was measured using a Black-Scholes valuation model in the case of Tier I options, and Monte Carlo valuations in the case of Tiers II, III and IV. The fair values and relevant assumptions were as follows:
| Fiscal 2017 | Fiscal 2016 | Fiscal 2015 | ||||||||||
| Fair value: |
||||||||||||
| —Tier I |
$ | 4.50 | $ | 2.96 | $ | 1.85 | ||||||
| —Tier II |
$ | 2.80 | $ | 1.83 | $ | 1.27 | ||||||
| —Tier III |
$ | 2.22 | $ | 1.46 | $ | 1.06 | ||||||
| —Tier IV |
$ | 2.28 | $ | 1.56 | $ | 1.09 | ||||||
| Inputs to the model: |
||||||||||||
| —Expected volatility |
43.6 | % | 45.0 | % | 45.0 | % | ||||||
| —Expected option life for Tier I options |
6.5 years | 6.5 years | 6.1 years | |||||||||
| —Expected option life for Tier II, III and IV options |
6.0 years | 6.6 years | 7.1 years | |||||||||
| —Expected option life after liquidity event for Tier II, III and IV options |
4.0 years | 3.4 years | 2.5 years | |||||||||
| —Risk-free interest rate: |
||||||||||||
| Tier I |
2.04 | % | 1.54 | % | 1.61 | % | ||||||
| Tiers II, III and IV |
1.98 | % | 1.56 | % | 2.34 | % | ||||||
| —Expected dividends |
— | — | — | |||||||||
Details of the options outstanding were as follows:
| Fiscal 2017 | ||||||||
| Number of options |
Weighted Average Exercise Price $ |
|||||||
| Outstanding at the beginning of the period |
||||||||
| —Tier I |
3,849,610 | $ | 6.56 | |||||
| —Tier II |
4,894,809 | $ | 6.56 | |||||
| —Tier III |
4,894,809 | $ | 6.56 | |||||
| —Tier IV |
4,894,809 | $ | 9.84 | |||||
|
|
|
|
|
|||||
| 18,534,037 | $ | 7.43 | ||||||
| Movements during the period |
||||||||
| Granted during the period: |
||||||||
| —Tier I |
1,034,090 | $ | 8.79 | |||||
| —Tier II |
1,034,090 | $ | 8.79 | |||||
| —Tier III |
1,034,090 | $ | 8.79 | |||||
| —Tier IV |
1,034,090 | $ | 13.18 | |||||
|
|
|
|
|
|||||
| 4,136,360 | $ | 9.89 | ||||||
| Forfeited during the period: |
||||||||
| —Tier I |
(221,372 | ) | $ | 6.84 | ||||
| —Tier II |
(682,735 | ) | $ | 6.84 | ||||
| —Tier III |
(682,735 | ) | $ | 6.84 | ||||
| —Tier IV |
(682,735 | ) | $ | 9.98 | ||||
|
|
|
|
|
|||||
| (2,269,577 | ) | $ | 7.79 | |||||
F-39
Table of Contents
| Fiscal 2017 | ||||||||
| Number of options |
Weighted Average Exercise Price $ |
|||||||
| Expired during the period: |
||||||||
| —Tier I |
(216,793 | ) | $ | 6.56 | ||||
|
|
|
|
|
|||||
| (216,793 | ) | $ | 6.56 | |||||
| Outstanding at the end of the period |
||||||||
| —Tier I |
4,445,535 | $ | 7.07 | |||||
| —Tier II |
5,246,164 | $ | 6.99 | |||||
| —Tier III |
5,246,164 | $ | 6.99 | |||||
| —Tier IV |
5,246,164 | $ | 10.48 | |||||
|
|
|
|
|
|||||
| 20,184,027 | $ | 7.91 | ||||||
|
|
|
|
|
|||||
| Exercisable at the end of the period |
1,315,576 | $ | 6.56 | |||||
The aggregate intrinsic value of options that are fully vested and currently exercisable was $16.3 million and the weighted-average remaining contractual term of those options was 7.3 years.
In conjunction with the initial public offering in January 2018, Gates adopted a new equity-based compensation plan. The total number of ordinary shares that may be issued under this plan is 12,500,000, but this may be increased each year from 2019 onwards by a certain amount as permitted in the plan. The plan allows for the issue of a variety of equity-based and cash-based awards, including stock options, stock appreciation rights and restricted stock units.
19. Equity
Issuances and purchases of shares by the Company were as follows:
| Number of Shares | ||||
| As of January 3, 2015 |
244,137,598 | |||
| Issuance of Shares |
1,854,190 | |||
| Purchase of Shares |
(221,247 | ) | ||
|
|
|
|||
| As of January 2, 2016 |
245,770,541 | |||
| Issuance of Shares |
167,842 | |||
| Purchase of Shares |
(310,431 | ) | ||
|
|
|
|||
| As of December 31, 2016 |
245,627,952 | |||
| Issuance of Shares |
80,107 | |||
| Purchase of Shares |
(233,454 | ) | ||
|
|
|
|||
| As of December 30, 2017 |
245,474,605 | |||
|
|
|
|||
The Company has one class of authorized and issued shares, with a par value of $0.01. Each share carries equal voting rights but no right to fixed income.
During Fiscal 2017, we determined that repurchased common shares have been retired rather than held in treasury. Accordingly, we have corrected the Fiscal 2016 and Fiscal 2015 consolidated financial statements to reflect these repurchases as retirements. The adjustments had no impact on our total shareholders’ equity, common shares outstanding or earnings per share.
20. Analysis of accumulated other comprehensive income (loss)
Changes in accumulated other comprehensive income (loss) by component (net of tax) are as follows:
| (dollars in millions) |
Available-for- sale investments |
Post- retirement benefit |
Cumulative translation adjustment |
Cash flow hedges |
Accumulated OCI attributable to shareholders |
Non- controlling interests |
Accumulated OCI |
|||||||||||||||||||||
| As of January 3, 2015 |
$ | 0.3 | $ | 1.9 | $ | (345.5 | ) | $ | (4.5 | ) | $ | (347.8 | ) | $ | (18.7 | ) | $ | (366.5 | ) | |||||||||
|
|
|
|
|
|
|
|
|
|
|
|
|
|
|
|||||||||||||||
| Foreign currency translation |
— | 1.4 | (392.4 | ) | — | (391.0 | ) | (20.0 | ) | (411.0 | ) | |||||||||||||||||
| Cash flow hedges movements |
— | — | — | (17.7 | ) | (17.7 | ) | — | (17.7 | ) | ||||||||||||||||||
|
Available-for-sale investment movements |
0.2 | — | — | — | 0.2 | 0.1 | 0.3 | |||||||||||||||||||||
| Post-retirement benefit movements |
— | (3.6 | ) | — | — | (3.6 | ) | 0.1 | (3.5 | ) | ||||||||||||||||||
|
|
|
|
|
|
|
|
|
|
|
|
|
|
|
|||||||||||||||
| Other comprehensive income (loss) |
0.2 | (2.2 | ) | (392.4 | ) | (17.7 | ) | (412.1 | ) | (19.8 | ) | (431.9 | ) | |||||||||||||||
|
|
|
|
|
|
|
|
|
|
|
|
|
|
|
|||||||||||||||
F-40
Table of Contents
| (dollars in millions) |
Available-for- sale investments |
Post- retirement benefit |
Cumulative translation adjustment |
Cash flow hedges |
Accumulated OCI attributable to shareholders |
Non- controlling interests |
Accumulated OCI |
|||||||||||||||||||||
| As of January 2, 2016 |
0.5 | (0.3 | ) | (737.9 | ) | (22.2 | ) | (759.9 | ) | (38.5 | ) | (798.4 | ) | |||||||||||||||
|
|
|
|
|
|
|
|
|
|
|
|
|
|
|
|||||||||||||||
| Foreign currency translation |
— | — | (146.2 | ) | — | (146.2 | ) | (16.4 | ) | (162.6 | ) | |||||||||||||||||
| Cash flow hedges movements |
— | — | — | (2.9 | ) | (2.9 | ) | — | (2.9 | ) | ||||||||||||||||||
| Available-for-sale investment movements |
(0.7 | ) | — | — | — | (0.7 | ) | — | (0.7 | ) | ||||||||||||||||||
| Post-retirement benefit movements |
— | (6.2 | ) | — | — | (6.2 | ) | (0.5 | ) | (6.7 | ) | |||||||||||||||||
|
|
|
|
|
|
|
|
|
|
|
|
|
|
|
|||||||||||||||
| Other comprehensive loss |
(0.7 | ) | (6.2 | ) | (146.2 | ) | (2.9 | ) | (156.0 | ) | (16.9 | ) | (172.9 | ) | ||||||||||||||
|
|
|
|
|
|
|
|
|
|
|
|
|
|
|
|||||||||||||||
| As of December 31, 2016 |
(0.2 | ) | (6.5 | ) | (884.1 | ) | (25.1 | ) | (915.9 | ) | (55.4 | ) | (971.3 | ) | ||||||||||||||
|
|
|
|
|
|
|
|
|
|
|
|
|
|
|
|||||||||||||||
| Foreign currency translation |
— | — | 141.3 | — | 141.3 | 29.5 | 170.8 | |||||||||||||||||||||
| Cash flow hedges movements |
— | — | — | 7.6 | 7.6 | — | 7.6 | |||||||||||||||||||||
| Available-for-sale investment movements |
(0.1 | ) | — | — | — | (0.1 | ) | (0.1 | ) | (0.2 | ) | |||||||||||||||||
| Post-retirement benefit movements |
— | 19.7 | — | — | 19.7 | 0.5 | 20.2 | |||||||||||||||||||||
|
|
|
|
|
|
|
|
|
|
|
|
|
|
|
|||||||||||||||
| Other comprehensive (loss) income |
(0.1 | ) | 19.7 | 141.3 | 7.6 | 168.5 | 29.9 | 198.4 | ||||||||||||||||||||
|
|
|
|
|
|
|
|
|
|
|
|
|
|
|
|||||||||||||||
| As of December 30, 2017 |
$ | (0.3 | ) | $ | 13.2 | $ | (742.8 | ) | $ | (17.5 | ) | $ | (747.4 | ) | $ | (25.5 | ) | $ | (772.9 | ) | ||||||||
|
|
|
|
|
|
|
|
|
|
|
|
|
|
|
|||||||||||||||
21. Related party transactions
A. Entities affiliated with Blackstone
On July 3, 2014, Blackstone Management Partners L.L.C. (“BMP”), an affiliate of Blackstone, and Blackstone Tactical Opportunities Advisors L.L.C., affiliates of the Sponsor (the “Managers”), entered into a Transaction and Monitoring Fee Agreement (the “Former Transaction and Monitoring Fee Agreement”) with Omaha Topco. Under this agreement, we paid the Managers at the closing of the acquisition of Gates by Blackstone $56.8 million as a transaction fee as consideration for the Managers undertaking due diligence investigations and financial and structural analysis and providing corporate strategy and other advice and negotiation assistance.
In addition, under this agreement, Omaha Topco and certain of its direct and indirect subsidiaries (collectively the “Monitoring Service Recipients”) have engaged the Managers to provide certain monitoring, advisory and consulting services in the following areas:
| • | advice regarding financings and relationships with lenders and bankers; |
| • | advice regarding the selection, retention and supervision of independent auditors, outside legal counsel, investment bankers and other advisors or consultants; |
| • | advice regarding environmental, social and governance issues pertinent to our affairs; |
| • | advice regarding the strategic direction of our business; and |
| • | such other advice directly related to or ancillary to the above advisory services as we may reasonably request. |
In consideration of these oversight services, Gates agreed to pay BMP an annual fee of 1% of a covenant EBITDA measure defined under the agreements governing our senior secured credit facilities. In addition, the Monitoring Service Recipients agreed to reimburse the Managers for any related out-of-pocket expenses incurred by the Managers and their affiliates. During Fiscal 2017, Gates incurred $6.7 million, compared with $6.1 million during Fiscal 2016 and $7.0 million in Fiscal 2015, in respect of these oversight services and out-of-pocket expenses, of which there was no amount owing at December 30, 2017 or December 31, 2016.
The Former Transaction and Monitoring Fee Agreement also contemplated that Gates would pay to the Managers a milestone payment upon the consummation of an initial public offering. In January 2018, we and the Managers terminated this agreement and entered into a new Monitoring Fee Agreement (the “New Monitoring Fee Agreement”) with the Managers that is substantially similar to the existing agreement, except that the New Monitoring Fee Agreement does not require the payment of a milestone payment in connection with the initial public offering and it terminates upon the earlier to occur of (i) the second anniversary of the closing date of initial public offering and (ii) the date our Sponsor beneficially owns less than 5% of our ordinary shares and such shares have a fair market value of less than $25 million. Following termination, the Managers will refund us any portion of the monitoring fee previously paid in respect of fiscal quarters that follow the termination date.
F-41
Table of Contents
In addition, we have entered into a Support and Services Agreement with BMP. Under this agreement, the Company and certain of its direct and indirect subsidiaries reimburse BMP for customary support services provided by Blackstone’s portfolio operations group to the Company at BMP’s direction. BMP will invoice the Company for such services based on the time spent by the relevant personnel providing such services during the applicable period and Blackstone’s allocated costs of such personnel. During the periods presented, no amounts were paid or outstanding under this agreement. In connection with the initial public offering in January 2018, we and BMP terminated this agreement and we entered into a new agreement with the Managers that is substantially similar to the existing agreement, except that it terminates on the date our Sponsor beneficially owns less than 5% of our ordinary shares and such shares have a fair market value of less than $25 million, or such earlier date as may be chosen by Blackstone.
In connection with the IPO, Blackstone Advisory Partners L.P. received underwriting fees of $3.2 million in January 2018.
During the periods presented, through to November 2, 2017, Blackstone held a controlling interest in Alliance Automotive Group (“Alliance”), a wholesale distributor of automotive parts in France and the United Kingdom. Net sales by Gates to affiliates of Alliance during the portion of Fiscal 2017 in which Blackstone controlled Alliance were $27.2 million, compared with $20.0 million during Fiscal 2016 and $11.1 million during Fiscal 2015.
During Fiscal 2016 and Fiscal 2015, Blackstone also held an interest in Optiv Inc., an entity that supplies Gates with certain IT-related services. During Fiscal 2016 and Fiscal 2015, Gates paid Optiv Inc. $1.2 million and $0.2 million, respectively. Blackstone sold Optiv in December 2016, and it was therefore not a related party to Gates during Fiscal 2017.
B. Equity method investees
Sales to and purchases from equity method investees were as follows:
| (dollars in millions) |
Fiscal 2017 | Fiscal 2016 | Fiscal 2015 | |||||||||
| Sales |
$ | 1.8 | $ | 2.3 | $ | 2.9 | ||||||
| Purchases |
$ | (9.8 | ) | $ | (9.7 | ) | $ | (10.8 | ) | |||
Amounts outstanding in respect of these transactions were payables of $0.2 million as of December 30, 2017, compared with $0.3 million as of December 31, 2016.
C. Non-Gates entities controlled by non-controlling shareholders
Sales to and purchases from non-Gates entities controlled by non-controlling shareholders were as follows:
| (dollars in millions) |
Fiscal 2017 | Fiscal 2016 | Fiscal 2015 | |||||||||
| Sales |
$ | 55.2 | $ | 49.3 | $ | 42.4 | ||||||
| Purchases |
$ | (21.7 | ) | $ | (23.3 | ) | $ | (20.0 | ) | |||
Amounts outstanding in respect of these transactions were as follows:
| (dollars in millions) |
As of December 30, 2017 |
As of December 31, 2016 |
||||||
| Receivables |
$ | 0.5 | $ | 3.6 | ||||
| Payables |
$ | (0.4 | ) | $ | (3.3 | ) | ||
22. Commitments, contingencies and allowances
A. Leases
Future minimum lease payments under operating and capital leases that had initial or remaining non-cancelable lease terms in excess of one year as of December 30, 2017 were as follows:
| (dollars in millions) |
Operating | Capital | Total | |||||||||
| Fiscal year |
||||||||||||
| 2018 |
$ | 26.4 | $ | 0.4 | $ | 26.8 | ||||||
| 2019 |
15.0 | 0.4 | 15.4 | |||||||||
| 2020 |
14.9 | 0.4 | 15.3 | |||||||||
| 2021 |
10.0 | 0.4 | 10.4 | |||||||||
| 2022 |
8.4 | 0.4 | 8.8 | |||||||||
| Thereafter |
72.5 | 0.1 | 72.6 | |||||||||
|
|
|
|
|
|
|
|||||||
| Total minimum payments |
$ | 147.2 | $ | 2.1 | $ | 149.3 | ||||||
|
|
|
|
|
|
|
|||||||
F-42
Table of Contents
Minimum payments have not been reduced by minimum sublease rental income of $2.4 million as of December 30, 2017 that is due in the future under non-cancelable subleases.
The rental expense recognized in respect of assets held under operating leases was as follows:
| (dollars in millions) |
Fiscal 2017 | Fiscal 2016 | Fiscal 2015 | |||||||||
| Minimum payments |
$ | 36.6 | $ | 35.0 | $ | 37.0 | ||||||
| Less: Sublease rentals |
(3.4 | ) | (3.5 | ) | (3.4 | ) | ||||||
|
|
|
|
|
|
|
|||||||
| $ | 33.2 | $ | 31.5 | $ | 33.6 | |||||||
|
|
|
|
|
|
|
|||||||
No arrangements have been entered into for contingent rental payments.
B. Capital and other commitments
As of December 30, 2017, Gates had entered into contractual commitments for the purchase of property, plant and equipment amounting to $23.2 million, compared with $9.9 million as of December 31, 2016, and for the purchase of non-integral computer software amounting to $3.5 million, compared with $6.9 million as of December 31, 2016. As of December 30, 2017, Gates had entered into contractual commitments for non-capital items such as raw materials and supplies amounting to $30.3 million, compared with $14.3 million as of December 31, 2016.
C. Performance bonds, letters of credit and bank guarantees
As of December 30, 2017, letters of credit were outstanding against the asset-backed revolving facility amounting to $58.0 million, compared with $54.3 million as of December 31, 2016. Gates had additional outstanding performance bonds, letters of credit and bank guarantees amounting to $3.4 million, compared with $3.2 million as of December 31, 2016.
D. Company–owned life insurance policies
Gates is the beneficiary of a number of corporate-owned life assurance policies against which it borrows from the relevant life assurance company. As of December 30, 2017, the surrender value of the policies was $917.4 million, compared with $906.3 million as of December 31, 2016, and the amount outstanding on the related loans was $915.7 million, compared with $904.1 million as of December 31, 2016. For financial reporting purposes these amounts are offset as a legal right of offset exists and the net receivable of $1.7 million, compared with $2.2 million as of December 31, 2016, is included in other receivables.
E. Contingencies
Gates is, from time to time, party to general legal proceedings and claims, which arise in the ordinary course of business. Gates is also, from time to time, party to legal proceedings and claims in respect of environmental obligations, product liability, intellectual property and other matters which arise in the ordinary course of business and against which management believes Gates has meritorious defenses available.
While it is not possible to quantify the financial impact or predict the outcome of all pending claims and litigation, management does not anticipate that the outcome of any current proceedings or known claims, either individually or in aggregate, will materially affect Gates’ financial position, results of operations or cash flows.
F-43
Table of Contents
F. Allowance for doubtful accounts
Movements in our allowance for doubtful accounts were as follows:
| (dollars in millions) |
Balance at beginning of year |
Charged to net income |
Deductions | Foreign currency translation |
Balance at end of year |
|||||||||||||||
| 2015 |
$ | 5.5 | $ | 0.4 | $ | (0.6 | ) | $ | (0.3 | ) | $ | 5.0 | ||||||||
| 2016 |
$ | 5.0 | $ | 1.5 | $ | (2.9 | ) | $ | (0.2 | ) | $ | 3.4 | ||||||||
| 2017 |
$ | 3.4 | $ | 3.7 | $ | (0.8 | ) | $ | 0.5 | $ | 6.8 | |||||||||
23. Quarterly financial data
The following table sets forth selected unaudited quarterly financial information for the years ended December 30, 2017, and December 31, 2016. The information for each of these quarters has been prepared on the same basis as the audited consolidated financial statements included elsewhere in this annual report. These quarterly results of operations are not necessarily indicative of our results of operations to be expected for any future period.
| (dollars in millions) |
First Quarter | Second Quarter | Third Quarter | Fourth Quarter | ||||||||||||
| (unaudited) | ||||||||||||||||
| 2017 |
||||||||||||||||
| Statement of operations data: |
||||||||||||||||
| Net sales |
$ | 730.2 | $ | 769.1 | $ | 760.6 | $ | 781.8 | ||||||||
| Gross profit |
286.8 | 318.4 | 310.8 | 302.0 | ||||||||||||
| Income from continuing operations before income taxes |
38.6 | 12.7 | 34.0 | 24.2 | ||||||||||||
| Net income |
26.4 | 7.9 | 18.2 | 130.2 | ||||||||||||
| Net income attributable to shareholders |
18.9 | 0.4 | 13.2 | 118.8 | ||||||||||||
| Basic earnings per share from continuing operations |
0.08 | — | 0.05 | 0.49 | ||||||||||||
| Basic earnings per share from discontinued operations |
— | — | — | — | ||||||||||||
| Diluted earnings per share from continuing operations |
0.07 | 0.01 | 0.05 | 0.47 | ||||||||||||
| Diluted earnings per share from discontinued operations |
0.01 | — | — | (0.01 | ) | |||||||||||
| 2016 |
||||||||||||||||
| Statement of operations data: |
||||||||||||||||
| Net sales |
$ | 685.7 | $ | 718.1 | $ | 675.5 | $ | 667.7 | ||||||||
| Gross profit |
262.6 | 286.4 | 267.4 | 244.4 | ||||||||||||
| Income from continuing operations before income taxes |
19.9 | 31.3 | 29.0 | 12.8 | ||||||||||||
| Net income |
12.9 | 26.6 | 29.5 | 15.3 | ||||||||||||
| Net income attributable to shareholders |
7.0 | 17.6 | 23.2 | 9.9 | ||||||||||||
| Basic earnings per share from continuing operations |
0.03 | 0.07 | 0.08 | — | ||||||||||||
| Basic earnings per share from discontinued operations |
— | — | 0.02 | 0.03 | ||||||||||||
| Diluted earnings per share from continuing operations |
0.03 | 0.07 | 0.08 | — | ||||||||||||
| Diluted earnings per share from discontinued operations |
— | — | 0.02 | 0.03 | ||||||||||||
Earnings per share amounts are computed independently for each of the quarters presented, therefore, the sum of the quarterly earnings per share amounts may not equal the total computed for the year.
As discussed in note 6, our net income for the fourth quarter of 2017 includes a provisional benefit of $118.2 million related to the new comprehensive tax legislation enacted in the U.S. in December 2017.
24. Subsequent events
During January 2018, Gates completed the initial public offering, issuing 44,275,000 ordinary shares at a price of $19.00 per share. As described in note 15, the net proceeds from the initial public offering, together with a portion of cash on hand, were used to repay debt with a principal amount totaling $907.8 million during January and February 2018.
F-44