Attached files
| file | filename |
|---|---|
| EX-99.1 - EX-99.1 - HD Supply Holdings, Inc. | a18-7998_1ex99d1.htm |
| 8-K - 8-K - HD Supply Holdings, Inc. | a18-7998_18k.htm |
FINANCIAL RESULTS AND COMPANY OVERVIEW 2017 Fourth-Quarter and Fiscal Year Performance March 13th, 2018
Disclaimer Forward-Looking Statements and Preliminary Results This presentation includes “forward-looking statements” within the meaning of Section 27A of the Securities Act and Section 21E of the Exchange Act. Forward-looking statements are based on management’s beliefs and assumptions and information currently available to management and are subject to known and unknown risks and uncertainties, many of which may be beyond our control. We caution you that the forward-looking information presented in this presentation is not a guarantee of future results, and that actual results may differ materially from those made in or suggested by the forward-looking information contained in this presentation. In addition, forward-looking statements generally can be identified by the use of forward-looking terminology such as “may,” “plan,” “seek,” “comfortable with,” “will,” “expect,” “intend,” “estimate,” “anticipate,” “believe” or “continue” or the negative thereof or variations thereon or similar terminology. A number of important factors could cause actual events to differ materially from those contained in or implied by the forward-looking statements, including those “Risk factors” in our annual report on Form 10-K, for the fiscal year ended January 28, 2018, filed on March 13, 2018 and those described from time to time in our, and HD Supply, Inc.’s, other filings with the U.S. Securities and Exchange Commission, which can be found at the SEC’s website www.sec.gov. Any forward-looking information presented herein is made only as of the date of this presentation, and we do not undertake any obligation to update or revise any forward-looking information to reflect changes in assumptions, the occurrence of unanticipated events, or otherwise. Estimates for Net sales, Adjusted EBITDA and Adjusted net income per diluted share are preliminary estimates and are subject to risks and uncertainties, including, among others, changes in connection with quarter-end adjustments. Any variation between HD Supply’s actual results and the preliminary financial data set forth herein may be material. Non-GAAP Financial Measures HD Supply supplements its financial results that are determined in accordance with accounting principles generally accepted in the United States of America (“GAAP”) with non-GAAP measurements, including Adjusted EBITDA, Adjusted net income, Adjusted net income per diluted share, Net debt and Free cash flow. This supplemental information should not be considered in isolation or as a substitute for the GAAP measurements. Additional information regarding Adjusted EBITDA, Adjusted net income and Adjusted net income per diluted share referred to in this presentation is included at the end of this presentation under “Reconciliation of Non-GAAP Measures.”
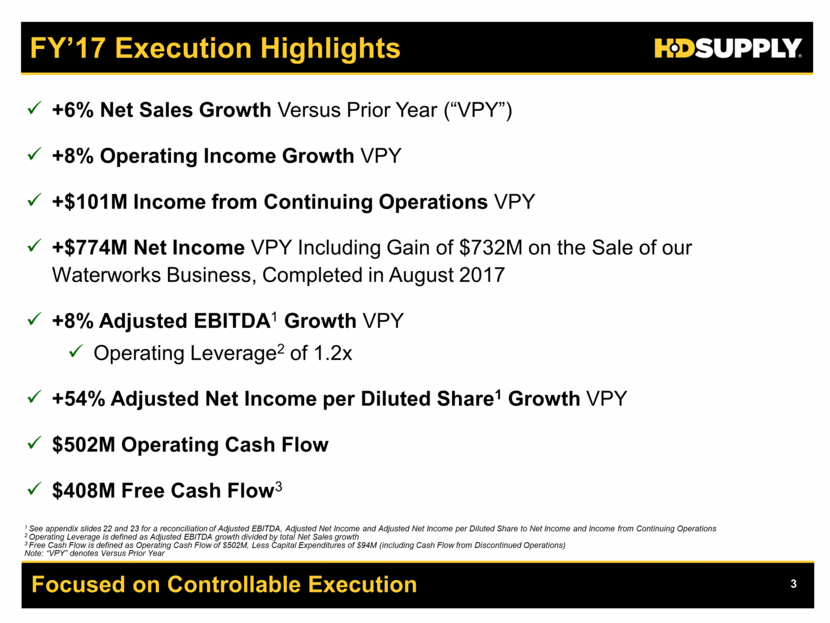
FY’17 Execution Highlights Focused on Controllable Execution 1 See appendix slides 22 and 23 for a reconciliation of Adjusted EBITDA, Adjusted Net Income and Adjusted Net Income per Diluted Share to Net Income and Income from Continuing Operations 2 Operating Leverage is defined as Adjusted EBITDA growth divided by total Net Sales growth 3 Free Cash Flow is defined as Operating Cash Flow of $502M, Less Capital Expenditures of $94M (including Cash Flow from Discontinued Operations) Note: “VPY” denotes Versus Prior Year +6% Net Sales Growth Versus Prior Year (“VPY”) +8% Operating Income Growth VPY +$101M Income from Continuing Operations VPY +$774M Net Income VPY Including Gain of $732M on the Sale of our Waterworks Business, Completed in August 2017 +8% Adjusted EBITDA1 Growth VPY Operating Leverage2 of 1.2x +54% Adjusted Net Income per Diluted Share1 Growth VPY $502M Operating Cash Flow $408M Free Cash Flow3
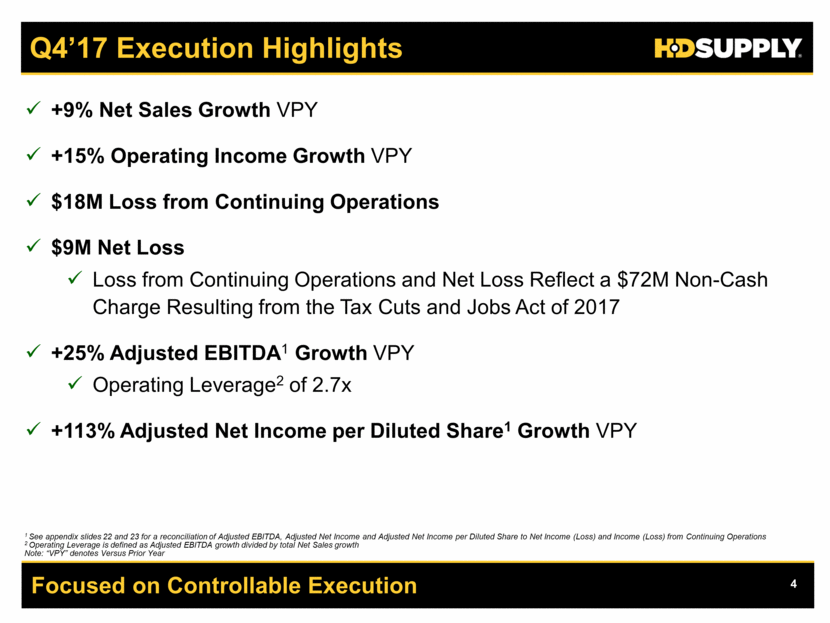
Q4’17 Execution Highlights Focused on Controllable Execution 1 See appendix slides 22 and 23 for a reconciliation of Adjusted EBITDA, Adjusted Net Income and Adjusted Net Income per Diluted Share to Net Income (Loss) and Income (Loss) from Continuing Operations 2 Operating Leverage is defined as Adjusted EBITDA growth divided by total Net Sales growth Note: “VPY” denotes Versus Prior Year +9% Net Sales Growth VPY +15% Operating Income Growth VPY $18M Loss from Continuing Operations $9M Net Loss Loss from Continuing Operations and Net Loss Reflect a $72M Non-Cash Charge Resulting from the Tax Cuts and Jobs Act of 2017 +25% Adjusted EBITDA1 Growth VPY Operating Leverage2 of 2.7x +113% Adjusted Net Income per Diluted Share1 Growth VPY
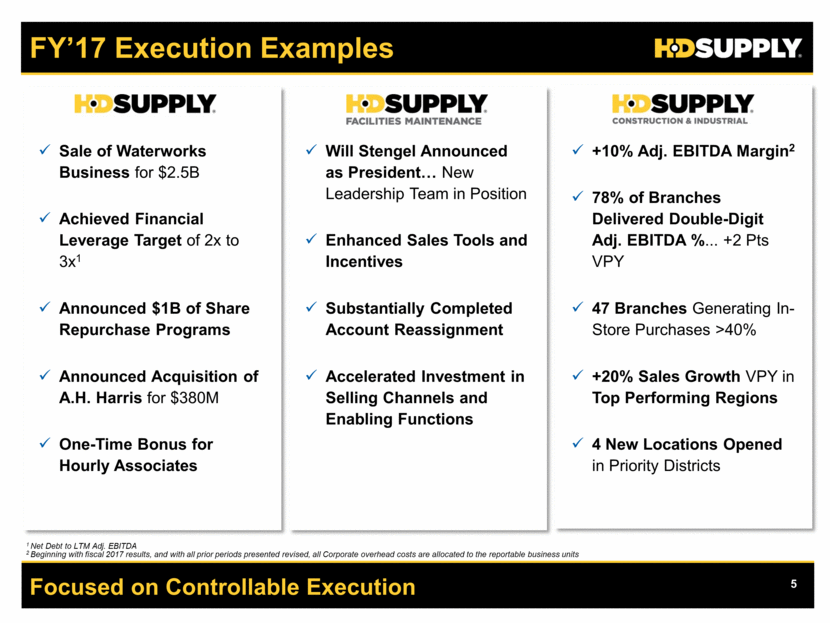
FY’17 Execution Examples Sale of Waterworks Business for $2.5B Achieved Financial Leverage Target of 2x to 3x1 Announced $1B of Share Repurchase Programs Announced Acquisition of A.H. Harris for $380M One-Time Bonus for Hourly Associates Focused on Controllable Execution Will Stengel Announced as President New Leadership Team in Position Enhanced Sales Tools and Incentives Substantially Completed Account Reassignment Accelerated Investment in Selling Channels and Enabling Functions +10% Adj. EBITDA Margin2 78% of Branches Delivered Double-Digit Adj. EBITDA %... +2 Pts VPY 47 Branches Generating In-Store Purchases >40% +20% Sales Growth VPY in Top Performing Regions 4 New Locations Opened in Priority Districts 1 Net Debt to LTM Adj. EBITDA 2 Beginning with fiscal 2017 results, and with all prior periods presented revised, all Corporate overhead costs are allocated to the reportable business units
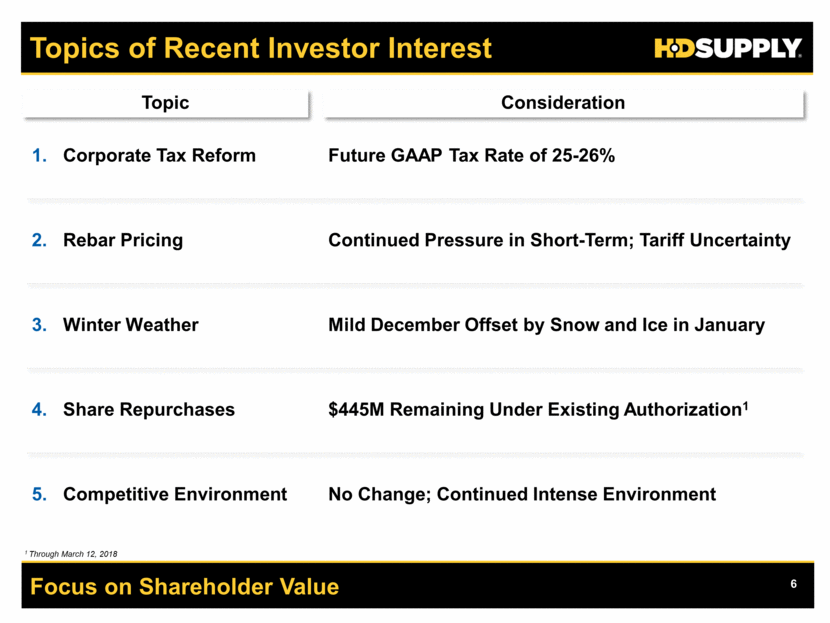
No Change; Continued Intense Environment $445M Remaining Under Existing Authorization1 Topics of Recent Investor Interest Topic Consideration Winter Weather Share Repurchases Competitive Environment Mild December Offset by Snow and Ice in January Focus on Shareholder Value Continued Pressure in Short-Term; Tariff Uncertainty Rebar Pricing Future GAAP Tax Rate of 25-26% Corporate Tax Reform 1 Through March 12, 2018
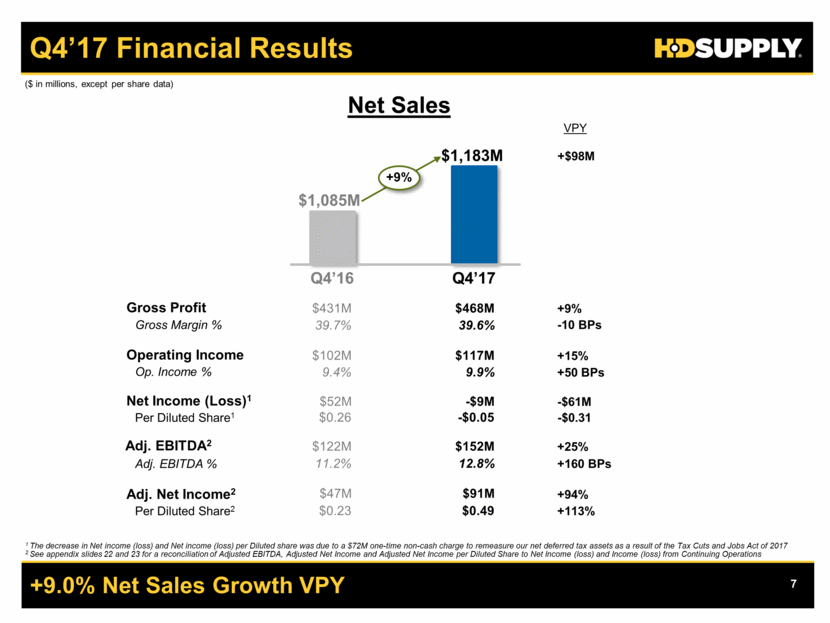
$1,085M $1,183M +9% Gross Profit Gross Margin % Operating Income Adj. EBITDA % Op. Income % $431M $468M 39.7% 39.6% $122M $152M $102M $117M 11.2% 12.8% 9.9% +9% -10 BPs +160 BPs +25% ($ in millions, except per share data) $47M $91M +15% Net Sales 1 The decrease in Net income (loss) and Net income (loss) per Diluted share was due to a $72M one-time non-cash charge to remeasure our net deferred tax assets as a result of the Tax Cuts and Jobs Act of 2017 2 See appendix slides 22 and 23 for a reconciliation of Adjusted EBITDA, Adjusted Net Income and Adjusted Net Income per Diluted Share to Net Income (loss) and Income (loss) from Continuing Operations Q4’16 Adj. EBITDA2 VPY Adj. Net Income2 9.4% Q4’17 $0.23 $0.49 +113% Per Diluted Share2 +$98M +94% Net Income (Loss)1 $52M -$9M -$61M $0.26 -$0.05 -$0.31 Per Diluted Share1 +9.0% Net Sales Growth VPY Q4’17 Financial Results +50 BPs
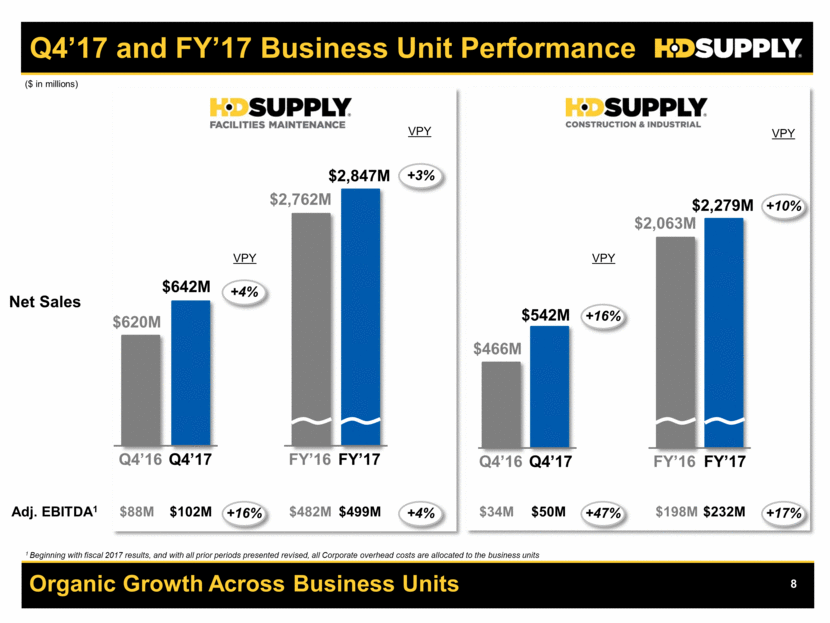
Organic Growth Across Business Units Q4’17 and FY’17 Business Unit Performance Adj. EBITDA1 Net Sales ($ in millions) Q4’17 $642M $102M Q4’16 $620M $88M VPY +4% +16% FY’17 $2,847M $499M FY’16 $482M +3% +4% $2,762M VPY Q4’17 $542M $50M Q4’16 $466M $34M VPY +16% +47% FY’17 $2,279M $232M FY’16 $198M +10% +17% $2,063M VPY 1 Beginning with fiscal 2017 results, and with all prior periods presented revised, all Corporate overhead costs are allocated to the business units
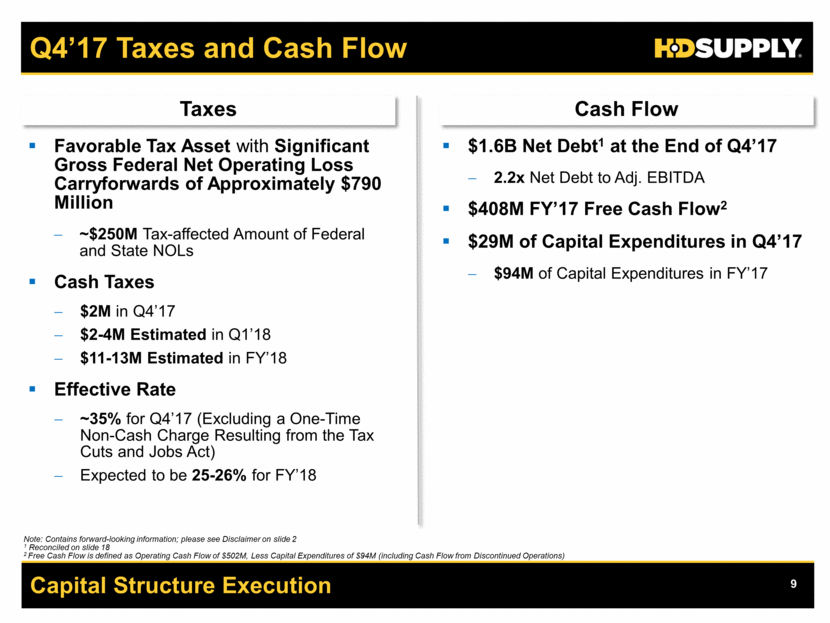
Q4’17 Taxes and Cash Flow Favorable Tax Asset with Significant Gross Federal Net Operating Loss Carryforwards of Approximately $790 Million ~$250M Tax-affected Amount of Federal and State NOLs Cash Taxes $2M in Q4’17 $2-4M Estimated in Q1’18 $11-13M Estimated in FY’18 Effective Rate ~35% for Q4’17 (Excluding a One-Time Non-Cash Charge Resulting from the Tax Cuts and Jobs Act) Expected to be 25-26% for FY’18 $1.6B Net Debt1 at the End of Q4’17 2.2x Net Debt to Adj. EBITDA $408M FY’17 Free Cash Flow2 $29M of Capital Expenditures in Q4’17 $94M of Capital Expenditures in FY’17 Note: Contains forward-looking information; please see Disclaimer on slide 2 1 Reconciled on slide 18 2 Free Cash Flow is defined as Operating Cash Flow of $502M, Less Capital Expenditures of $94M (including Cash Flow from Discontinued Operations) Taxes Cash Flow Capital Structure Execution
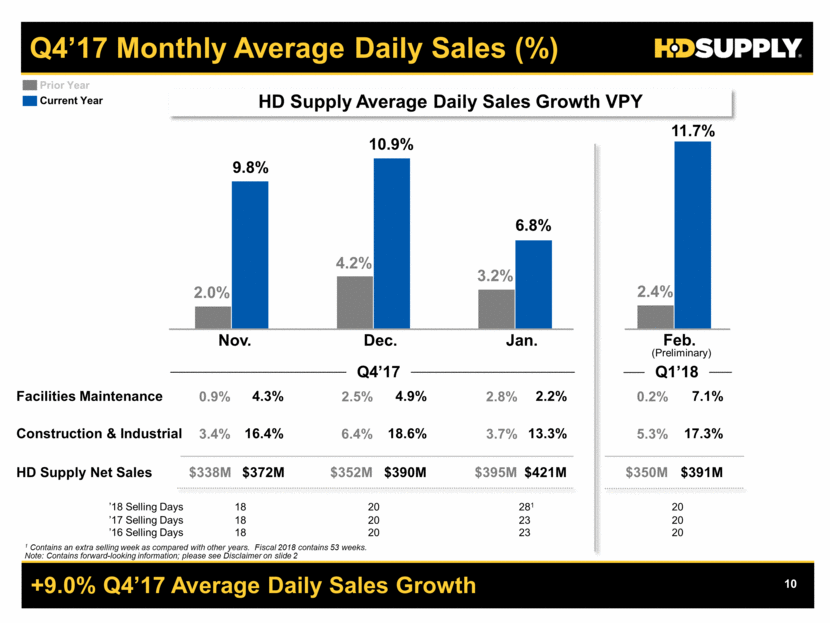
+9.0% Q4’17 Average Daily Sales Growth Q4’17 Monthly Average Daily Sales (%) 2.2% 13.3% 11.7% Feb. 7.1% 17.3% 4.9% ’16 Selling Days 23 20 20 18.6% Facilities Maintenance Construction & Industrial (Preliminary) 9.8% 10.9% 6.8% 4.3% 16.4% 18 2.0% 2.4% Nov. Dec. Jan. Prior Year $421M $391M $390M HD Supply Net Sales $372M 4.2% 3.2% Q4’17 0.2% 5.3% $350M 2.8% 3.7% $395M 2.5% 6.4% $352M 0.9% 3.4% $338M HD Supply Average Daily Sales Growth VPY ’17 Selling Days 23 20 20 18 Current Year 1 Contains an extra selling week as compared with other years. Fiscal 2018 contains 53 weeks. Note: Contains forward-looking information; please see Disclaimer on slide 2 281 20 20 18 ’18 Selling Days Q1’18
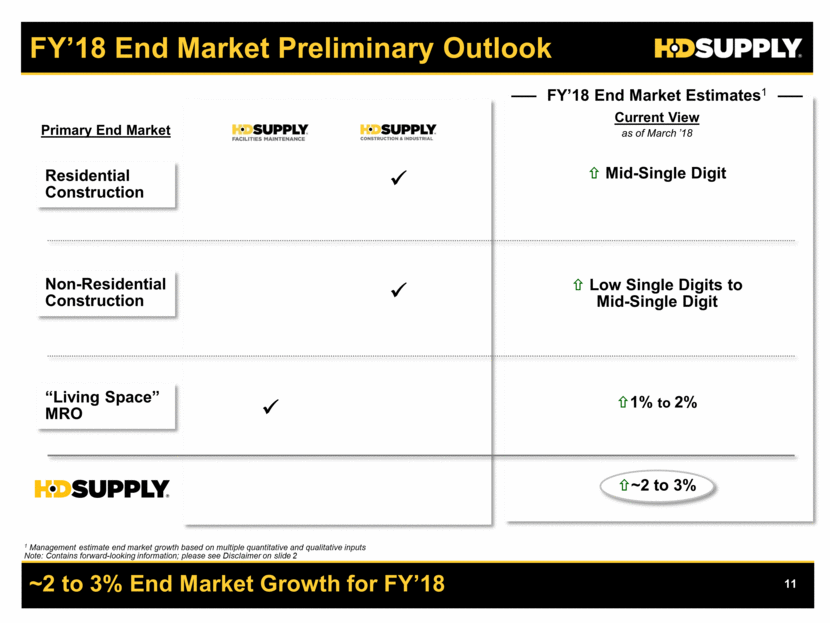
~2 to 3% End Market Growth for FY’18 FY’18 End Market Preliminary Outlook Residential Construction “Living Space” MRO Primary End Market Non-Residential Construction ~2 to 3% FY’18 End Market Estimates1 1% to 2% Current View as of March ’18 Mid-Single Digit 1 Management estimate end market growth based on multiple quantitative and qualitative inputs Note: Contains forward-looking information; please see Disclaimer on slide 2 Low Single Digits to Mid-Single Digit
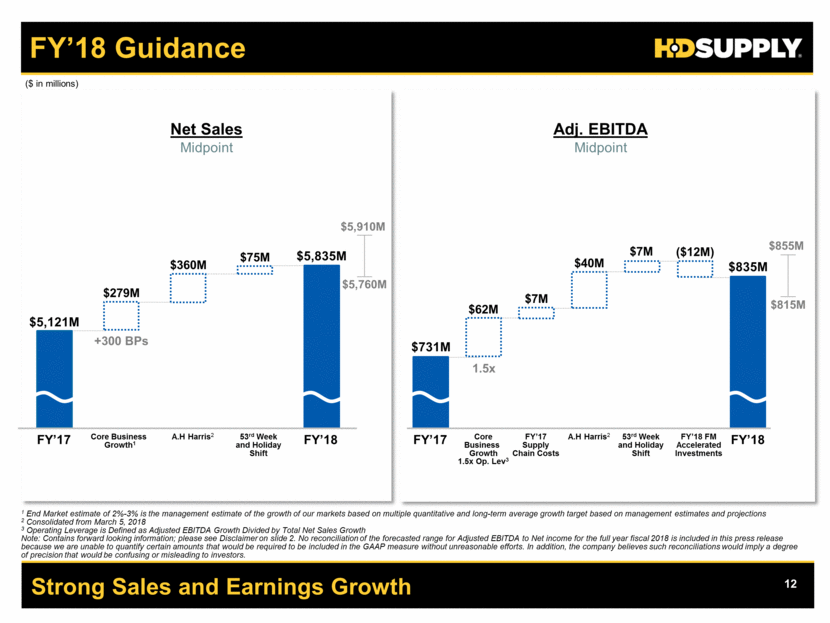
FY’18 Guidance Strong Sales and Earnings Growth 1 End Market estimate of 2%-3% is the management estimate of the growth of our markets based on multiple quantitative and long-term average growth target based on management estimates and projections 2 Consolidated from March 5, 2018 3 Operating Leverage is Defined as Adjusted EBITDA Growth Divided by Total Net Sales Growth Note: Contains forward looking information; please see Disclaimer on slide 2. No reconciliation of the forecasted range for Adjusted EBITDA to Net income for the full year fiscal 2018 is included in this press release because we are unable to quantify certain amounts that would be required to be included in the GAAP measure without unreasonable efforts. In addition, the company believes such reconciliations would imply a degree of precision that would be confusing or misleading to investors. $5,121M FY’17 +300 BPs $360M $75M $5,835M Core Business Growth1 A.H Harris2 53rd Week and Holiday Shift FY’18 Net Sales ($ in millions) $731M FY’17 1.5x FY’17 Supply Chain Costs A.H Harris2 FY’18 FM Accelerated Investments FY’18 Adj. EBITDA $835M $40M $7M Midpoint Midpoint 53rd Week and Holiday Shift $7M ($12M) Core Business Growth 1.5x Op. Lev3 $279M $62M $5,910M $5,760M $855M $815M
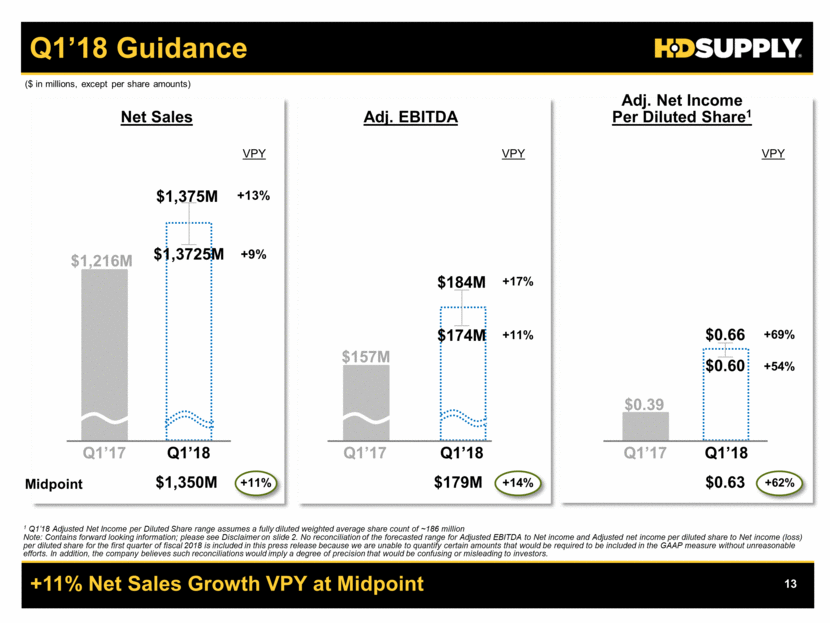
+17% +11% +13% +9% Q1’18 Guidance +11% Net Sales Growth VPY at Midpoint $1,375M $1,3725M $157M $1,216M $184M $174M VPY Q1’17 Q1’18 Q1’17 Q1’18 Q1’18 Net Sales Adj. EBITDA Adj. Net Income Per Diluted Share1 VPY 1 Q1’18 Adjusted Net Income per Diluted Share range assumes a fully diluted weighted average share count of ~186 million Note: Contains forward looking information; please see Disclaimer on slide 2. No reconciliation of the forecasted range for Adjusted EBITDA to Net income and Adjusted net income per diluted share to Net income (loss) per diluted share for the first quarter of fiscal 2018 is included in this press release because we are unable to quantify certain amounts that would be required to be included in the GAAP measure without unreasonable efforts. In addition, the company believes such reconciliations would imply a degree of precision that would be confusing or misleading to investors. $0.66 $0.60 VPY ($ in millions, except per share amounts) $0.39 . . Q1’17 +69% +54% Midpoint $1,350M +11% $179M +14% $0.63 +62%
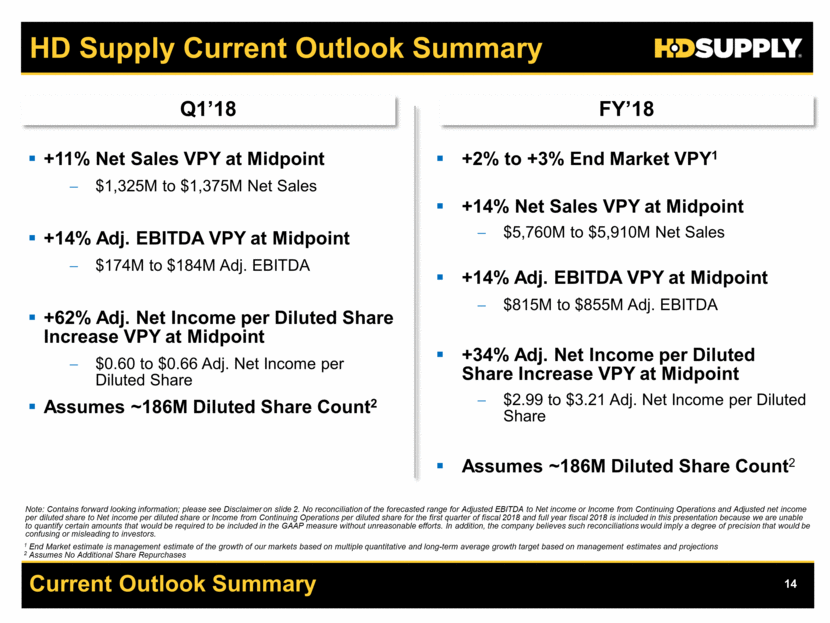
Current Outlook Summary HD Supply Current Outlook Summary +11% Net Sales VPY at Midpoint $1,325M to $1,375M Net Sales +14% Adj. EBITDA VPY at Midpoint $174M to $184M Adj. EBITDA +62% Adj. Net Income per Diluted Share Increase VPY at Midpoint $0.60 to $0.66 Adj. Net Income per Diluted Share Assumes ~186M Diluted Share Count2 1 End Market estimate is management estimate of the growth of our markets based on multiple quantitative and long-term average growth target based on management estimates and projections 2 Assumes No Additional Share Repurchases +2% to +3% End Market VPY1 +14% Net Sales VPY at Midpoint $5,760M to $5,910M Net Sales +14% Adj. EBITDA VPY at Midpoint $815M to $855M Adj. EBITDA +34% Adj. Net Income per Diluted Share Increase VPY at Midpoint $2.99 to $3.21 Adj. Net Income per Diluted Share Assumes ~186M Diluted Share Count2 Q1’18 FY’18 Note: Contains forward looking information; please see Disclaimer on slide 2. No reconciliation of the forecasted range for Adjusted EBITDA to Net income or Income from Continuing Operations and Adjusted net income per diluted share to Net income per diluted share or Income from Continuing Operations per diluted share for the first quarter of fiscal 2018 and full year fiscal 2018 is included in this presentation because we are unable to quantify certain amounts that would be required to be included in the GAAP measure without unreasonable efforts. In addition, the company believes such reconciliations would imply a degree of precision that would be confusing or misleading to investors.
Q&A Q&A
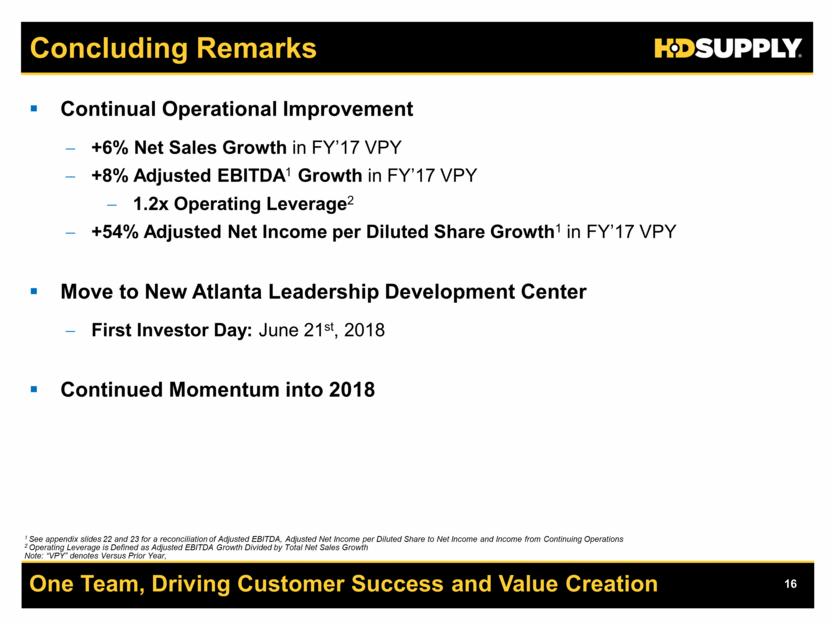
Concluding Remarks One Team, Driving Customer Success and Value Creation Continual Operational Improvement +6% Net Sales Growth in FY’17 VPY +8% Adjusted EBITDA1 Growth in FY’17 VPY 1.2x Operating Leverage2 +54% Adjusted Net Income per Diluted Share Growth1 in FY’17 VPY Move to New Atlanta Leadership Development Center First Investor Day: June 21st, 2018 Continued Momentum into 2018 1 See appendix slides 22 and 23 for a reconciliation of Adjusted EBITDA, Adjusted Net Income per Diluted Share to Net Income and Income from Continuing Operations 2 Operating Leverage is Defined as Adjusted EBITDA Growth Divided by Total Net Sales Growth Note: “VPY” denotes Versus Prior Year,
Q&A APPENDIX
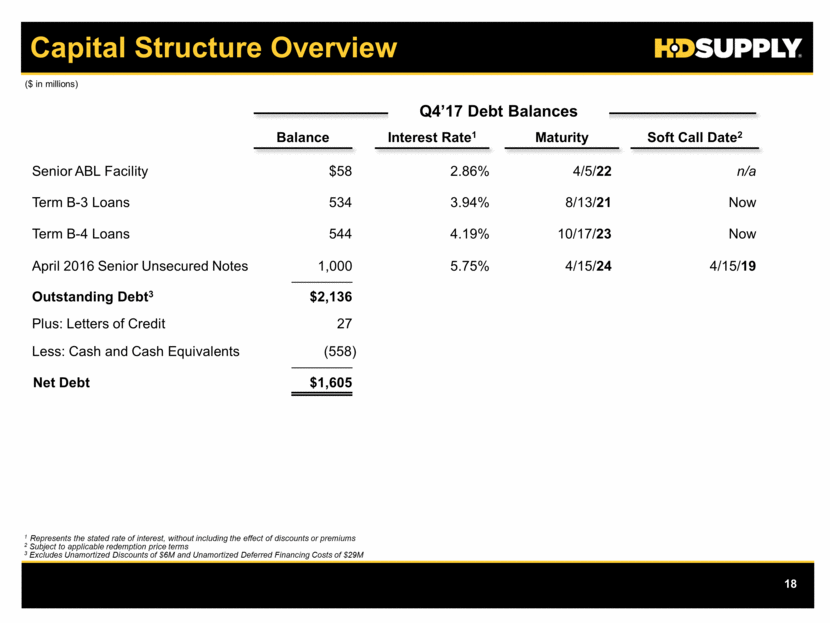
~$1.7B Net Debt Capital Structure Overview Q4’17 Debt Balances Senior ABL Facility Term B-3 Loans April 2016 Senior Unsecured Notes $58 1,000 4/5/22 8/13/21 Outstanding Debt3 Less: Cash and Cash Equivalents Net Debt $1,605 (558) $2,136 Balance Maturity 1 Represents the stated rate of interest, without including the effect of discounts or premiums 2 Subject to applicable redemption price terms 3 Excludes Unamortized Discounts of $6M and Unamortized Deferred Financing Costs of $29M ($ in millions) 2.86% 3.94% Interest Rate1 534 n/a Now Soft Call Date2 5.75% 4/15/24 4/15/19 Term B-4 Loans 10/17/23 4.19% 544 Now Plus: Letters of Credit 27
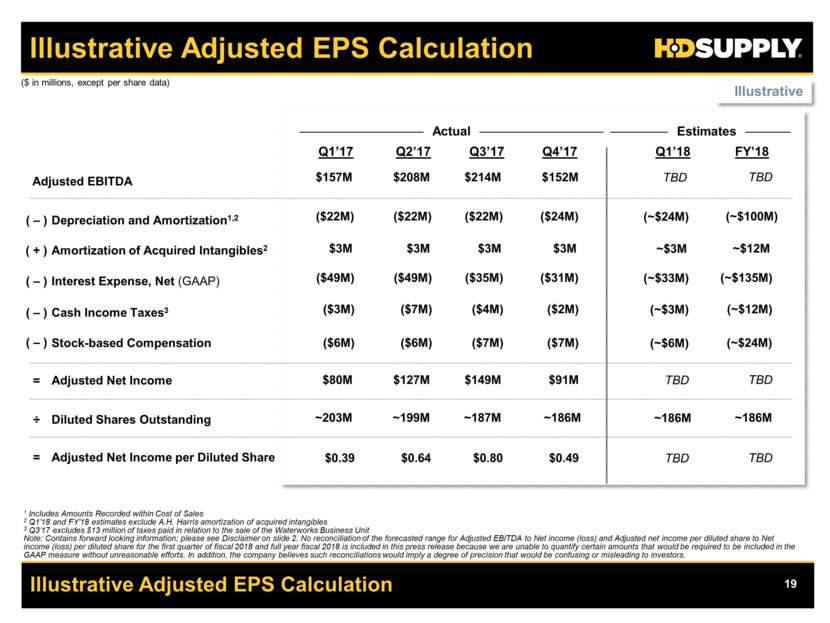
Illustrative Adjusted EPS Calculation Adjusted EBITDA Adjusted Net Income per Diluted Share Illustrative Adjusted EPS Calculation Adjusted Net Income = = Diluted Shares Outstanding ÷ TBD TBD TBD ~186M FY’18 Q1’17 ($ in millions, except per share data) Q2’17 $152M $0.49 $91M ~186M Q1’18 Estimates ~199M Q3’17 $214M $0.80 $149M ~187M Q4’17 Depreciation and Amortization1,2 ( – ) ($24M) (~$100M) Amortization of Acquired Intangibles2 ($22M) ( + ) ~$12M $3M $3M $3M Interest Expense, Net (GAAP) ( – ) (~$135M) Cash Income Taxes3 ( – ) (~$12M) Stock-based Compensation ( – ) ($31M) ($35M) ($2M) ($4M) 1 Includes Amounts Recorded within Cost of Sales 2 Q1’18 and FY’18 estimates exclude A.H. Harris amortization of acquired intangibles 3 Q3’17 excludes $13 million of taxes paid in relation to the sale of the Waterworks Business Unit Note: Contains forward looking information; please see Disclaimer on slide 2. No reconciliation of the forecasted range for Adjusted EBITDA to Net income (loss) and Adjusted net income per diluted share to Net income (loss) per diluted share for the first quarter of fiscal 2018 and full year fiscal 2018 is included in this press release because we are unable to quantify certain amounts that would be required to be included in the GAAP measure without unreasonable efforts. In addition, the company believes such reconciliations would imply a degree of precision that would be confusing or misleading to investors. Actual ($7M) ($6M) ($7M) (~$24M) $208M ($22M) ($49M) $127M $0.64 ($7M) $157M ($22M) $3M ($49M) ($3M) ($6M) $0.39 $80M ~203M Illustrative TBD TBD TBD ~186M (~$24M) ~$3M (~$33M) (~$3M) (~$6M)
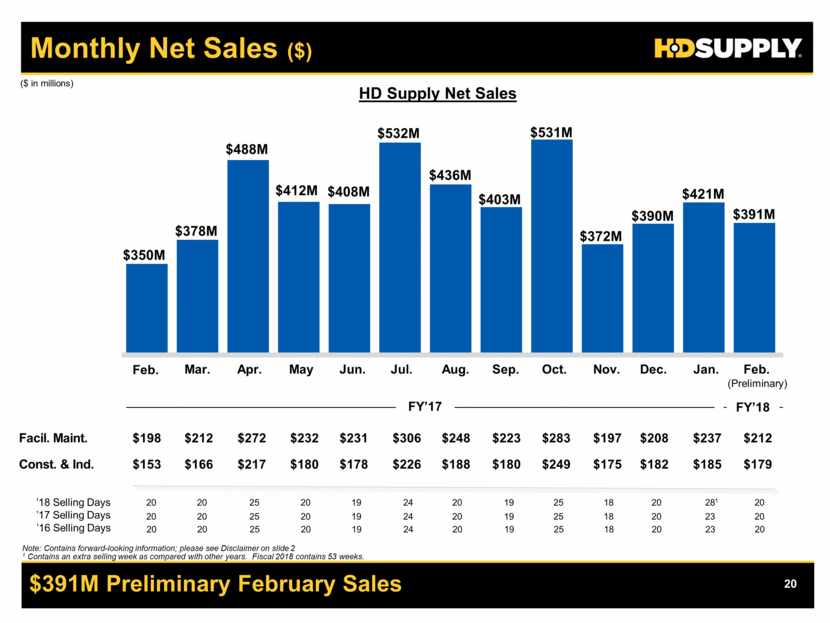
$391M Preliminary February Sales Monthly Net Sales ($) Facil. Maint. Const. & Ind. ’18 Selling Days ’17 Selling Days ($ in millions) HD Supply Net Sales (Preliminary) FY’17 Mar. Apr. May Jun. Jul. Aug. Sep. Oct. Nov. Dec. Jan. Feb. Feb. $350M $378M $488M $412M $408M $532M $390M $436M $403M $421M $531M $372M $391M $212 $272 $232 $231 $306 $248 $223 $283 $197 $208 $237 $212 $166 $217 $180 $178 $226 $188 $180 $249 $175 $182 $185 $179 $198 $153 20 20 25 20 19 24 20 19 25 18 20 281 20 20 20 25 20 19 24 20 19 25 18 20 23 20 Note: Contains forward-looking information; please see Disclaimer on slide 2 1 Contains an extra selling week as compared with other years. Fiscal 2018 contains 53 weeks. FY’18 ’16 Selling Days 20 20 25 20 19 24 20 19 25 18 20 23 20
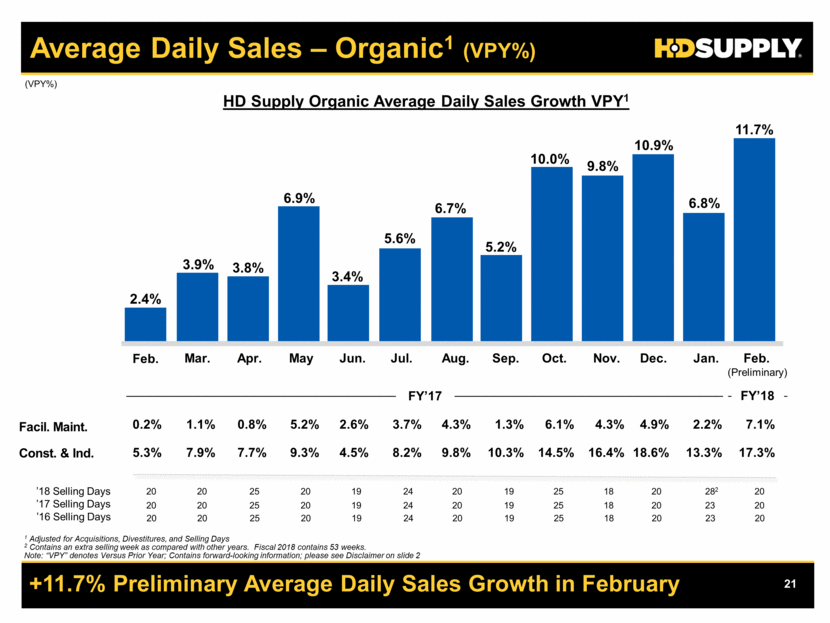
+11.7% Preliminary Average Daily Sales Growth in February Average Daily Sales – Organic1 (VPY%) HD Supply Organic Average Daily Sales Growth VPY1 (VPY%) 1 Adjusted for Acquisitions, Divestitures, and Selling Days 2 Contains an extra selling week as compared with other years. Fiscal 2018 contains 53 weeks. Note: “VPY” denotes Versus Prior Year; Contains forward-looking information; please see Disclaimer on slide 2 Facil. Maint. Const. & Ind. 1.1% 0.8% 5.2% 2.6% 3.7% 4.3% 1.3% 6.1% 4.3% 4.9% 2.2% 7.1% 0.2% 7.9% 7.7% 9.3% 4.5% 8.2% 9.8% 10.3% 14.5% 16.4% 18.6% 13.3% 17.3% 5.3% 2.4% 3.9% 3.8% 6.9% 3.4% 5.6% 10.9% 6.7% 5.2% 6.8% 10.0% 9.8% 11.7% (Preliminary) FY’17 Mar. Apr. May Jun. Jul. Aug. Sep. Oct. Nov. Dec. Jan. Feb. Feb. ’18 Selling Days ’17 Selling Days 20 20 25 20 19 24 20 19 25 18 20 282 20 20 20 25 20 19 24 20 19 25 18 20 23 20 ’16 Selling Days 20 20 25 20 19 24 20 19 25 18 20 23 20 FY’18
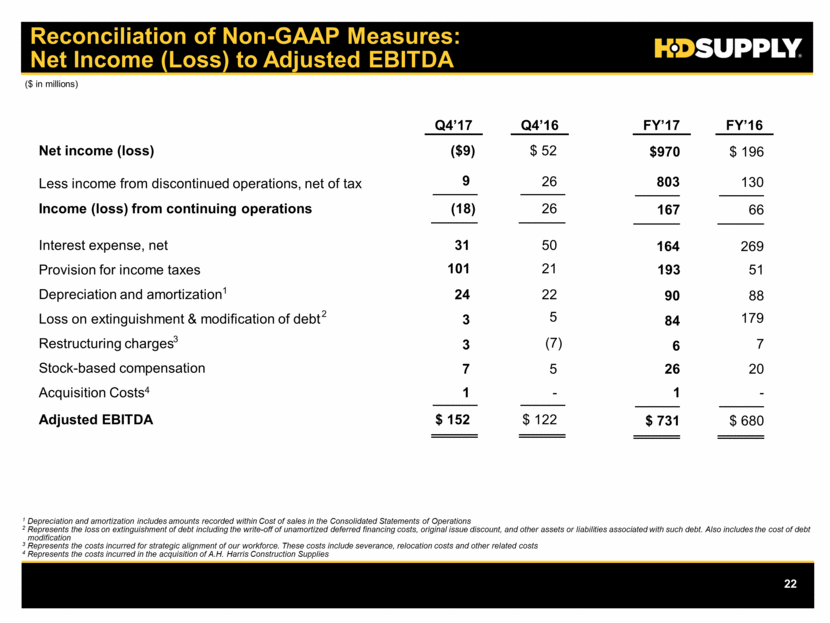
Reconciliation of Non-GAAP Measures: Net Income (Loss) to Adjusted EBITDA ($ in millions) 1 Depreciation and amortization includes amounts recorded within Cost of sales in the Consolidated Statements of Operations 2 Represents the loss on extinguishment of debt including the write-off of unamortized deferred financing costs, original issue discount, and other assets or liabilities associated with such debt. Also includes the cost of debt modification 3 Represents the costs incurred for strategic alignment of our workforce. These costs include severance, relocation costs and other related costs 4 Represents the costs incurred in the acquisition of A.H. Harris Construction Supplies Q4’17 Q4’16 Net income (loss) ($9) $ 52 Less income from discontinued operations, net of tax 9 26 Income (loss) from continuing operations (18) 26 Interest expense, net 31 50 Provision for income taxes 21 Depreciation and amortization 1 24 22 Loss on extinguishment & modification of debt 3 Restructuring charges 2 3 (7) Stock-based compensation 3 7 5 Adjusted EBITDA $ 152 $ 122 101 5 FY’17 FY’16 $970 $ 196 803 130 167 66 164 269 51 90 88 84 6 7 26 20 $ 731 $ 680 193 179 Acquisition Costs4 1 - 1 -
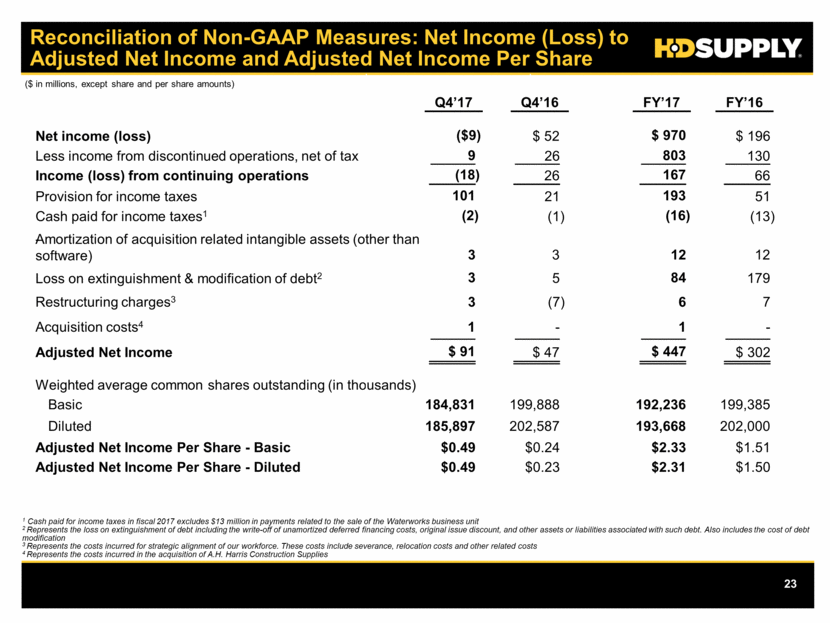
Reconciliation of Non-GAAP Measures: Net Income (Loss) to Adjusted Net Income and Adjusted Net Income Per Share ($ in millions, except share and per share amounts) 1 Cash paid for income taxes in fiscal 2017 excludes $13 million in payments related to the sale of the Waterworks business unit 2 Represents the loss on extinguishment of debt including the write-off of unamortized deferred financing costs, original issue discount, and other assets or liabilities associated with such debt. Also includes the cost of debt modification 3 Represents the costs incurred for strategic alignment of our workforce. These costs include severance, relocation costs and other related costs 4 Represents the costs incurred in the acquisition of A.H. Harris Construction Supplies Weighted average common shares outstanding (in thousands) Basic Diluted Adjusted Net Income Per Share - Basic Adjusted Net Income Per Share - Diluted Net income (loss) ($9) $ 52 Less income from discontinued operations, net of tax 26 Income (loss) from continuing operations (18) 26 Provision for income taxes 101 21 Cash paid for income taxes1 (2) (1) Amortization of acquisition related intangible assets (other than - software) Restructuring charges3 (7) 3 Loss on extinguishment & modification of debt2 3 Adjusted Net Income $ 91 $ 47 184,831 199,888 185,897 202,587 $0.49 $0.24 $0.49 $0.23 9 5 3 3 $ 970 $ 196 130 167 66 193 51 (16) (13) 7 6 84 $ 447 $ 302 192,236 199,385 193,668 202,000 $2.33 $1.51 $2.31 $1.50 803 179 12 12 Acquisition costs4 - 1 - 1 Q4’17 Q4’16 FY’17 FY’16