Attached files
| file | filename |
|---|---|
| EX-99.2 - EX-99.2 - CatchMark Timber Trust, Inc. | d518084dex992.htm |
| 8-K - 8-K - CatchMark Timber Trust, Inc. | d518084d8k.htm |
Exhibit 99.1
|
Exhibit 99.1
Follow-On Equity Offering
M ar c h 2 0 1 8
|
F O R WA R D—L OOK I N G S TAT E M E N T S
This presentation contains forward-looking statements within the meaning of Section 27A of the Securities Act of 1933 and Section 21E of the Securities
Exchange Act of 1934, as amended. Such forward-looking statements can generally be identified by our use of forward-looking terminology such as “may,” “will,” “expect,” “intend,” “anticipate,”
“estimate,” “believe,” “continue,” or other similar words. However, the absence of these or similar words or expressions does not mean that a statement is not forward-looking. Forward-looking statements are not
guarantees of performance and are based on certain assumptions, discuss future expectations, describe plans and strategies, contain projections of results of operations or of financial condition or state other forward-looking information. Such
statements include, among others, that we believe that we are well positioned given expected increases in sawtimber pricing, housing starts and lumber consumption and our evolving harvest mix to an increased share of sawtimber; that we will continue
to concentrate on disciplined execution of our operating plan while strategically expanding our timberlands holdings and capital relationships; that we believe that we are on target for executing our business plan; that we remain focused on
providing a superior and sustainable rate of return to stockholders through disciplined acquisitions, sustainable harvests, increased cash flow and revenue growth, well-timed sales, our joint venture strategy, recurring dividends and opportunistic
share repurchases; and that we believe that our new growth opportunities, operational execution, and capital allocation strategy are building long-term value. Forward-looking statements involve risks and uncertainties that could cause actual results
to differ materially from those contemplated by our forward-looking statements including, but not limited to: (i) we may not generate the harvest volumes from our timberlands that we currently anticipate; (ii) the demand for our timber may
not increase at the rate we currently anticipate or at all due to changes in general economic and business conditions in the geographic regions where our timberlands are located; (iii) the cyclical nature of the real estate market generally,
including fluctuations in demand and valuations, may adversely impact our ability to generate income and cash flow from sales of higher-and-better use properties;
(iv) timber prices may not increase at the rate we currently anticipate or could decline, which would negatively impact our revenues; (v) the supply of timberlands available for acquisition that meet our investment criteria may be less
than we currently anticipate; (vi) we may be unsuccessful in winning bids for timberland that are sold through an auction process; (vii) we may not be able to access external sources of capital at attractive rates or at all;
(viii) potential increases in interest rates could have a negative impact on our business; (ix) our share repurchase program may not be successful in improving stockholder value over the long-term; (x) our joint venture strategy may
not enable us to access non-dilutive capital and enhance our ability to make acquisitions; and (xi) the factors described in Item 1A. Risk Factors of our Annual Report on Form 10-K for the fiscal year ended December 31, 2017 and our other filings with Securities and Exchange Commission. Accordingly, readers are cautioned not to place undue reliance on these forward-looking
statements, which speak only as of the date of this presentation. We undertake no obligation to update our forward-looking statements, except as required by law.
|
DI S CLA I M E R
The Company has filed a registration statement (including a prospectus and a related preliminary prospectus supplement) with the SEC for the offering to which this presentation
relates. Before you invest, you should read the preliminary prospectus supplement and the accompanying prospectus in that registration statement and the other documents that the Company has filed with the SEC for more complete information about the
Company and such offering. You may get these documents for free by visiting EDGAR on the SEC website at www.sec.gov. Alternatively, the Company, any underwriter or any dealer participating in such offering will arrange to send you the prospectus and
preliminary prospectus supplement if you request it by calling toll-free (800) 248-8863. This communication shall not constitute an offer to sell or the solicitation of any offer to buy, nor shall there be any
sale of securities in any jurisdiction in which such offer, solicitation or sale would be unlawful prior to the registration or qualification of such securities under the securities law of any such jurisdiction.
|
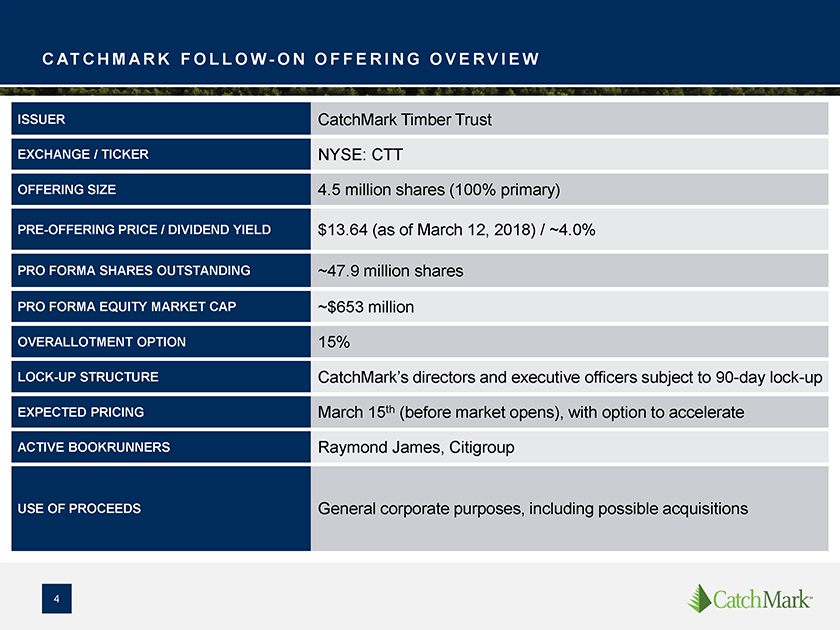
CATCHM A RK F O L L O W—O N O F F E R I N G O V
E R V I E W
ISSUER CatchMark Timber Trust
EXCHANGE / TICKER NYSE: CTT
OFFERING SIZE 4.5 million shares (100% primary)
PRE-OFFERING PRICE / DIVIDEND YIELD $13.64 (as of March 12, 2018) / ~4.0%
PRO FORMA SHARES OUTSTANDING ~47.9 million
shares
PRO FORMA EQUITY MARKET CAP ~$653 million
OVERALL OTMENT OPTION
15%
LOCK-UP STRUCTURE CatchMark’s directors and executive officers subject to
90-day lock-up
EXPECTED PRICING March 15th (before market opens), with option to
accelerate
ACTIVE BOOKRUNNERS Raymond James, Citigroup
USE OF PROCEEDS
General corporate purposes, including possible acquisitions
|
A B O U T C AT C H M A R K
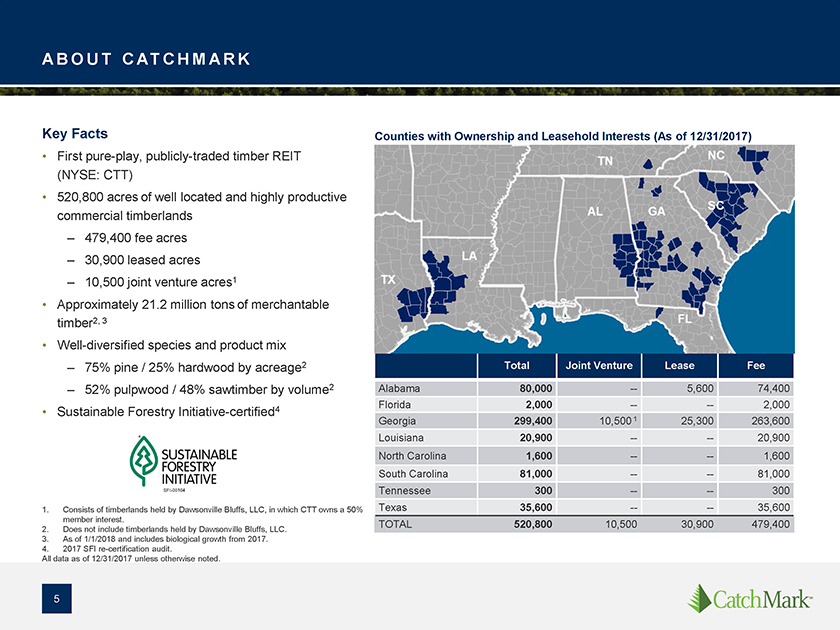
Key Facts
• First pure-play, publicly-traded timber REIT (NYSE: CTT)
• 520,800 acres of well located and highly productive commercial timberlands
–
479,400 fee acres
– 30,900 leased acres
– 10,500 joint venture
acres1
• Approximately 21.2 million tons of merchantable timber2, 3
• Well-diversified species and product mix
– 75% pine / 25%
hardwood by acreage2
– 52% pulpwood / 48% sawtimber by volume2
•
Sustainable Forestry Initiative-certified4
1. Consists of timberlands held by Dawsonville Bluffs, LLC, in which CTT owns a 50% member interest.
2. Does not include timberlands held by Dawsonville Bluffs, LLC. 3. As of 1/1/2018 and includes biological growth from 2017. 4. 2017 SFI
re-certification audit.
All data as of 12/31/2017 unless otherwise noted.
Counties with Ownership and Leasehold Interests (As of 12/31/2017)
Total Joint Venture
LeaseFee
Alabama 80,000 —5,60074,400
Florida 2,000 ——2,000
Georgia 299,400 10,500 125,300263,600
Louisiana 20,900 ——20,900
North Carolina 1,600 ——1,600
South Carolina 81,000
——81,000
Tennessee 300 ——300
Texas 35,600
——35,600
TOTAL 520,800 10,50030,900479,400
|
EXPER I EN C ED M A N A G E M E N T T E A M
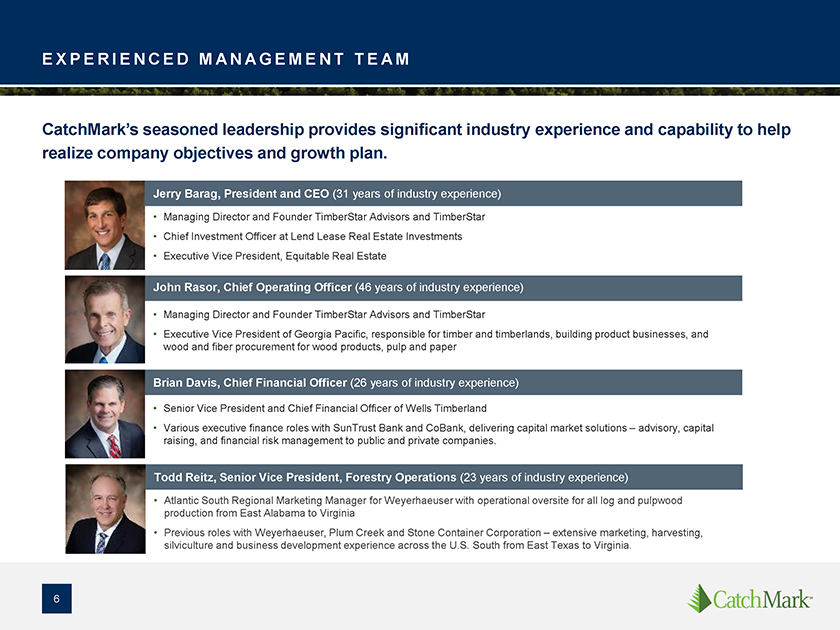
CatchMark’s seasoned leadership provides significant industry experience and capability to help realize company objectives and growth plan.
Jerry Barag, President and CEO (31 years of industry experience)
• Managing Director and
Founder TimberStar Advisors and TimberStar
• Chief Investment Officer at Lend Lease Real Estate Investments
• Executive Vice President, Equitable Real Estate
John Rasor, Chief Operating Officer (46
years of industry experience)
• Managing Director and Founder TimberStar Advisors and TimberStar
• Executive Vice President of Georgia Pacific, responsible for timber and timberlands, building product businesses, and wood and fiber procurement for wood products, pulp and
paper
Brian Davis, Chief Financial Officer (26 years of industry experience)
• Senior Vice President and Chief Financial Officer of Wells Timberland
• Various executive finance roles with SunTrust Bank and CoBank, delivering capital market solutions – advisory, capital raising, and financial risk
management to public and private companies.
Todd Reitz, Senior Vice President, Forestry Operations (23 years of industry experience)
• Atlantic South Regional Marketing Manager for Weyerhaeuser with operational oversite for all log and pulpwood production from East Alabama to Virginia
• Previous roles with Weyerhaeuser, Plum Creek and Stone Container Corporation – extensive marketing, harvesting, silviculture and business development experience across
the U.S. South from East Texas to Virginia.
|
E X PA NDE D A N D I M P R O V E D T I M B E R L A N
D A S S E T S
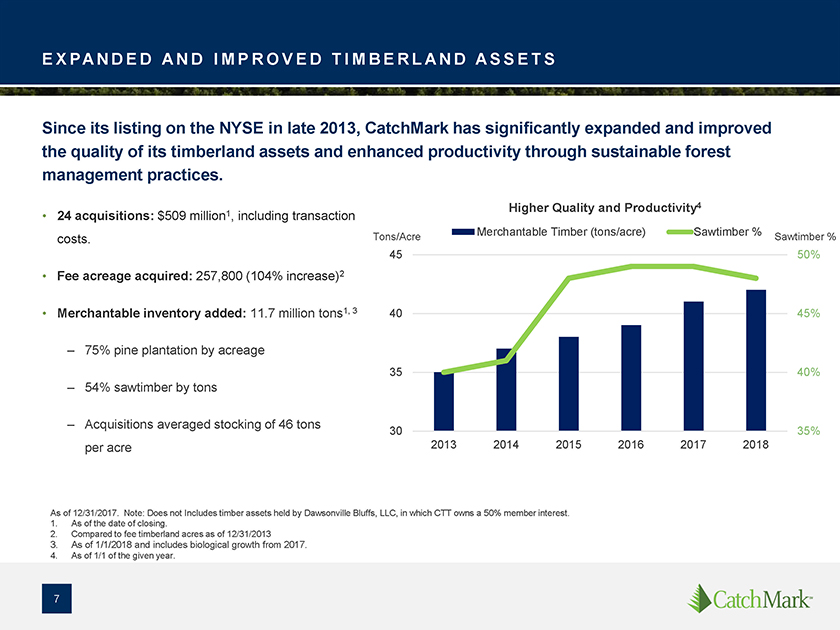
Since its listing on the NYSE in late 2013, CatchMark has significantly expanded and improved the quality of its timberland assets and enhanced
productivity through sustainable forest management practices.
• 24 acquisitions: $509 million1, including transaction costs.
• Fee acreage acquired: 257,800 (104% increase)2
• Merchantable inventory added:
11.7 million tons1, 3
– 75% pine plantation by acreage
– 54%
sawtimber by tons
– Acquisitions averaged stocking of 46 tons per acre
Higher Quality and Productivity4
Tons/Acre Merchantable Timber (tons/acre)
Sawtimber % Sawtimber %
45 50%
40 45%
35 40%
30 35% 2013 2014 2015 2016 2017 2018
As of 12/31/2017. Note: Does not Includes timber assets held by Dawsonville Bluffs, LLC, in which CTT owns a 50% member interest. 1. As of the date of closing.
2. Compared to fee timberland acres as of 12/31/2013
3. As of 1/1/2018 and includes biological
growth from 2017.
4. As of 1/1 of the given year.
|
RO BUS T A N D AT T R A C T I V E A C Q U I S I T I
O N P I P E L I N E
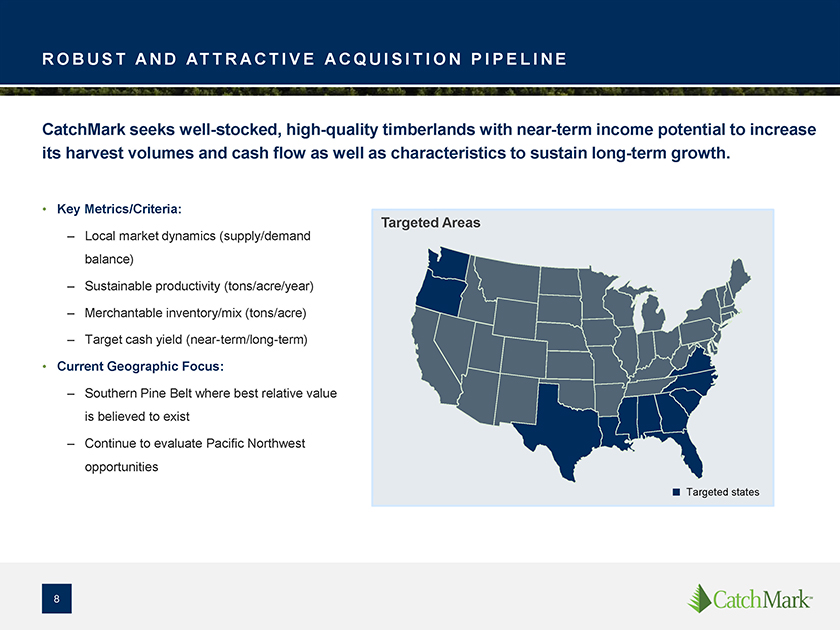
CatchMark seeks well-stocked, high-quality timberlands with near-term income potential to increase its harvest volumes and cash flow as well as
characteristics to sustain long-term growth.
• Key Metrics/Criteria:
– Local market dynamics (supply/demand balance)
– Sustainable
productivity (tons/acre/year)
– Merchantable inventory/mix (tons/acre)
– Target cash yield (near-term/long-term)
• Current Geographic
Focus:
– Southern Pine Belt where best relative value is believed to exist
– Continue to evaluate Pacific Northwest opportunities
Targeted Areas
Targeted states
|
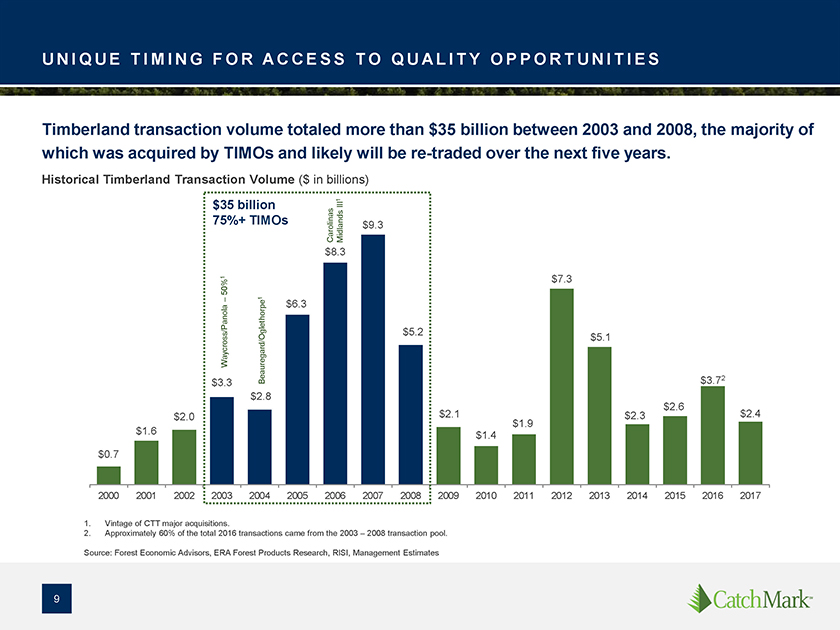
U N I QU E T I M I N G F O R A C C E S S T O Q U A L
I T Y O P P O R T U N I T I E S
Timberland transaction volume totaled more than $35 billion between 2003 and 2008, the majority of which was acquired by TIMOs
and likely will be re-traded over the next five years.
Historical Timberland Transaction Volume ($ in billions)
1
$35 billion III 75%+ TIMOs $9.3
Carolinas Midlands
$8.3
1 $7.3
50%
1
– $6.3
$5.2
Waycross/Panola $5.1 $3.3 Beauregard/Oglethorpe $3.72
$2.8 $2.6 $2.0 $2.1 $2.3 $2.4 $1.9 $1.6 $1.4 $0.7
2000 2001 2002 2003 2004 2005 2006 2007 2008
2009 2010 2011 2012 2013 2014 2015 2016 2017
1. Vintage of CTT major acquisitions.
2. Approximately 60% of the total 2016 transactions came from the 2003 – 2008 transaction pool.
Source: Forest Economic Advisors, ERA Forest Products Research, RISI, Management Estimates
|
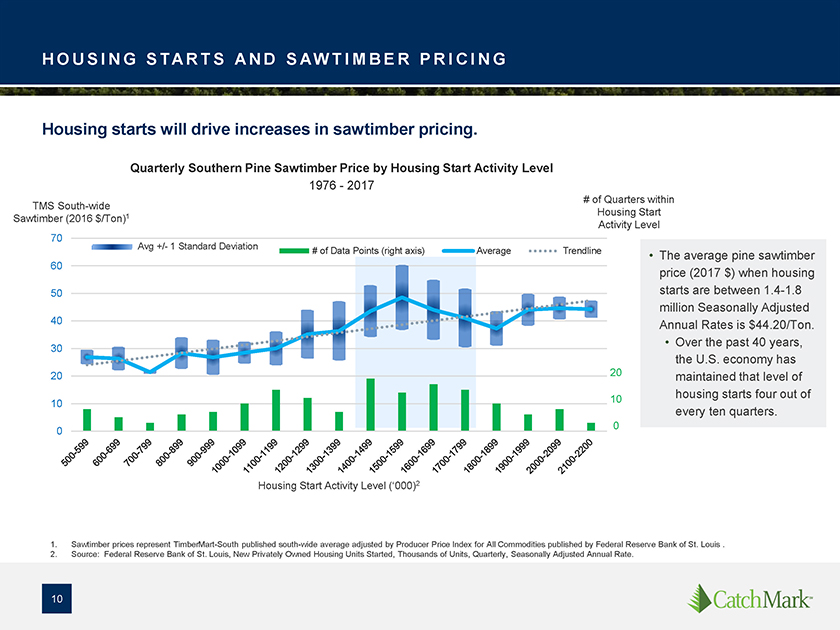
H O U S I N G S TA R T S A N D S AW T I M B E R P R
I C I N G
Housing starts will drive increases in sawtimber pricing.
Quarterly
Southern Pine Sawtimber Price by Housing Start Activity Level
1976—2017
TMS South-wide Sawtimber (2016 $/Ton)1
# of Quarters within Housing Start
Activity Level
The average pine sawtimber price (2017 $) when housing starts are between 1.4-1.8 million Seasonally
Adjusted Annual Rates is $44.20/Ton.
Over the past 40 years, the U.S. economy has maintained that level of housing starts four out of every ten quarters.
70 60 50 40 30 20 10 0
Avg +/- 1 Standard Deviation # of Data Points (right
axis) Average Trendline
Housing Start Activity Level (‘000)2
20 10 0
1. Sawtimber prices represent TimberMart-South published south-wide average adjusted by Producer Price Index for All Commodities published by Federal Reserve Bank
of St. Louis .
2. Source: Federal Reserve Bank of St. Louis, New Privately Owned Housing Units Started, Thousands of Units, Quarterly, Seasonally Adjusted Annual
Rate.
|
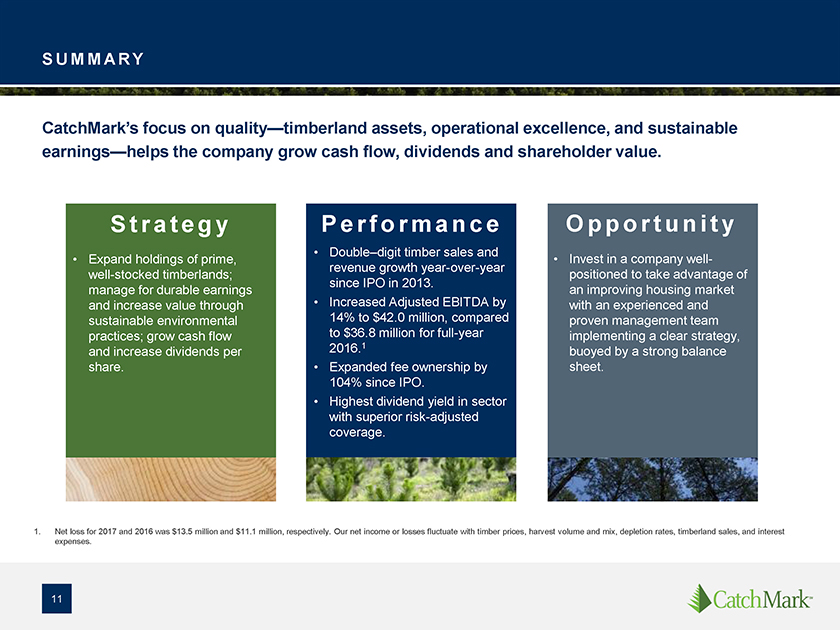
S U M M A RY
CatchMark’s focus on quality—timberland assets, operational excellence, and sustainable earnings—helps the company grow cash flow, dividends and shareholder value.
S t ra t e g y
• Expand holdings of prime, well-stocked timberlands;
manage for durable earnings and increase value through sustainable environmental practices; grow cash flow and increase dividends per share.
P e rf o rm a n ce
• Double–digit timber sales and revenue growth year-over-year since IPO in 2013.
• Increased Adjusted EBITDA by 14% to $42.0 million, compared to $36.8 million for full-year 2016.1
• Expanded fee ownership by 104% since IPO.
• Highest dividend yield in sector with
superior risk-adjusted coverage.
Op p o rt u n i t y
• Invest in a
company well-positioned to take advantage of an improving housing market with an experienced and proven management team implementing a clear strategy, buoyed by a strong balance sheet.
1. Net loss for 2017 and 2016 was $13.5 million and $11.1 million, respectively. Our net income or losses fluctuate with timber prices, harvest volume and mix, depletion
rates, timberland sales, and interest expenses.

|
Appendix
|
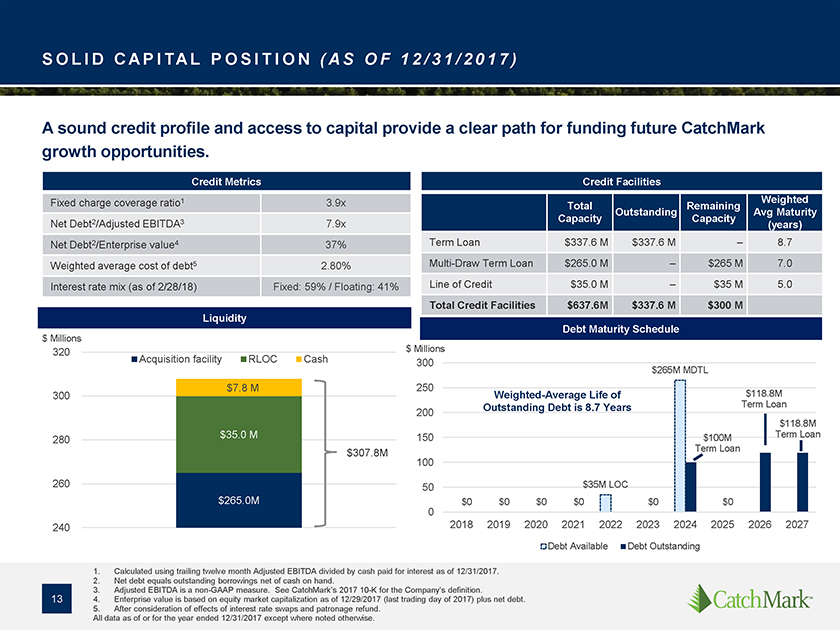
SOL I D C A P I TA L P O S I T I O N ( A S O F 1 2 /
3 1 / 2 0 1 7 )
A sound credit profile and access to capital provide a clear path for funding future CatchMark growth opportunities.
Credit Metrics
Fixed charge coverage ratio1 3.9x
Net Debt2/Adjusted EBITDA3 7.9x
Net Debt2/Enterprise value4 37%
Weighted average cost of debt5 2.80%
Interest rate mix (as of 2/28/18) Fixed: 59% / Floating:
41%
Credit Facilities
Total RemainingWeighted
Outstanding Avg Maturity
Capacity Capacity (years)
Term Loan $337.6 M $337.6 M–8.7
Multi-Draw Term Loan $265.0 M –$265 M7.0
Line of Credit $35.0 M –$35 M5.0
Total Credit Facilities $637.6M $337.6 M$300 M
Liquidity
$ Millions
320 300 280 260 240
Acquisition facility RLOC Cash
$7.8 M
$35.0 M
$265.0M
$307.8M
$ Millions
300 250 200 150 100 50 0
Debt Maturity Schedule
$265M MDTL
Weighted-Average Life of Outstanding Debt is 8.7 Years
$118.8M Term Loan
$118.8M Term Loan
$100M Term Loan
$35M LOC
$0 $0 $0 $0 $0 $0
2018 2019 2020 2021 2022 2023 2024 2025 2026 2027
Debt Available Debt Outstanding
1. Calculated using trailing twelve month Adjusted EBITDA divided by cash paid for interest as of 12/31/2017. 2. Net debt equals outstanding borrowings net of cash on hand.
3. Adjusted EBITDA is a non-GAAP measure. See CatchMark’s 2017 10-K for the
Company’s definition.
4. Enterprise value is based on equity market capitalization as of 12/29/2017 (last trading day of 2017) plus net debt. 5. After
consideration of effects of interest rate swaps and patronage refund.
All data as of or for the year ended 12/31/2017 except where noted otherwise.
|
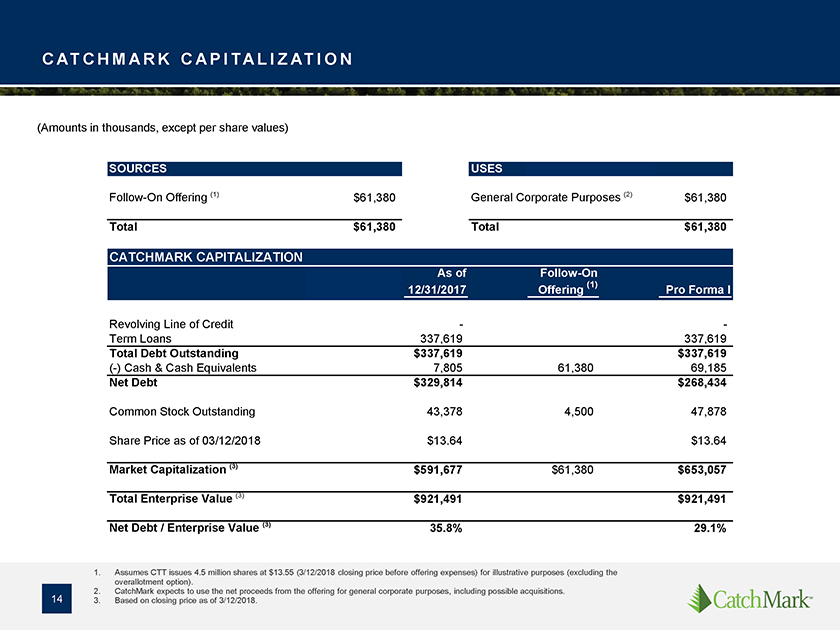
CATCHM A RK C A P I TA L I Z AT I O N
(Amounts in thousands, except per share values)
Follow-On Offering (1) $61,380
Total
$61,380
USES
General Corporate Purposes (2) $61,380
Total $61,380
CATCHMARK CAPITALIZATION
As of Follow-On
12/31/2017 Offering (1) Pro Forma
I
Revolving Line of Credit - -
Term Loans 337,619 337,619
Total Debt Outstanding $337,619 $337,619
(-) Cash & Cash Equivalents 7,805
61,38069,185
Net Debt $329,814 $268,434
Common Stock Outstanding 43,378
4,50047,878
Share Price as of 03/12/2018 $13.64 $13.64
Market Capitalization
(3) $591,677 $61,380$653,057
Total Enterprise Value (3) $921,491 $921,491
Net
Debt / Enterprise Value (3) 35.8% 29.1%
1. Assumes CTT issues 4.5 million shares at $13.55 (3/12/2018 closing price before offering expenses) for illustrative
purposes (excluding the overallotment option).
2. CatchMark expects to use the net proceeds from the offering for general corporate purposes, including possible
acquisitions.
3. Based on closing price as of 3/12/2018.