Attached files
| file | filename |
|---|---|
| EX-32.1 - EXHIBIT 32.1 - Okta, Inc. | okta-1312018_ex321.htm |
| EX-31.2 - EXHIBIT 31.2 - Okta, Inc. | okta-1312018_ex312.htm |
| EX-31.1 - EXHIBIT 31.1 - Okta, Inc. | okta-1312018_ex311.htm |
| EX-23.1 - EXHIBIT 23.1 - Okta, Inc. | okta-1312018_ex231.htm |
| EX-21.1 - EXHIBIT 21.1 - Okta, Inc. | okta-1312018_ex211.htm |
| EX-10.11 - EXHIBIT 10.11 - Okta, Inc. | okta-1312018_ex1011.htm |
UNITED STATES
SECURITIES AND EXCHANGE COMMISSION
Washington, D.C. 20549
FORM 10-K
(Mark One)
ý | ANNUAL REPORT PURSUANT TO SECTION 13 OR 15(d) OF THE SECURITIES EXCHANGE ACT OF 1934 |
For the fiscal year ended January 31, 2018
or
☐ | TRANSITION REPORT PURSUANT TO SECTION 13 OR 15(d) OF THE SECURITIES EXCHANGE ACT OF 1934 |
For the transition period from to
Commission File Number: 001-38044
Okta, Inc.
(Exact name of Registrant as specified in its charter)
Delaware (State or Other Jurisdiction of Incorporation or Organization) | 26-4175727 (I.R.S. Employer Identification Number) | |||
301 Brannan Street San Francisco, California 94107 (Address of Principal executive offices) | ||||
Registrant’s telephone number, including area code: (888) 722-7871
___________________________________________________
Securities registered pursuant to Section 12(b) of the Act:
(Title of each class) | (Name of each exchange on which registered) | |
Class A common stock, par value $0.0001 per share | The NASDAQ Stock Market LLC | |
Securities registered pursuant to Section 12(g) of the Act: None
___________________________________________________
Indicate by check mark if the Registrant is a well-known seasoned issuer, as defined in Rule 405 of the Securities Act. Yes ☐ No ý
Indicate by check mark if the Registrant is not required to file reports pursuant to Section 13 or Section 15(d) of the Act. Yes ☐ No ý
Indicate by check mark whether the Registrant (1) has filed all reports required to be filed by Section 13 or 15(d) of the Securities Exchange Act of 1934 during the preceding 12 months (or for such shorter period that the Registrant was required to file such reports), and (2) has been subject to such filing requirements for the past 90 days. Yes ý No ☐
Indicate by check mark whether the Registrant has submitted electronically and posted on its corporate Web site, if any, every Interactive Data File required to be submitted and posted pursuant to Rule 405 of Regulation S-T (§232.405 of this chapter) during the preceding 12 months (or for such shorter period that the Registrant was required to submit and post such files). Yes ý No ☐
Indicate by check mark if disclosure of delinquent filers pursuant to Item 405 of Regulation S-K (§229.405 of this chapter) is not contained herein, and will not be contained, to the best of the Registrant’s knowledge, in definitive proxy or information statements incorporated by reference in Part III of this Form 10-K or any amendment to this Form 10-K. ☐
Indicate by check mark whether the Registrant is a large accelerated filer, an accelerated filer, a non-accelerated filer, smaller reporting company, or an emerging growth company. See the definitions of “large accelerated filer,” “accelerated filer,” “smaller reporting company,” and “emerging growth company” in Rule 12b-2 of the Exchange Act.
Large accelerated filer | ☐ | Accelerated filer | ☐ | |||
Non-accelerated filer | ý (Do not check if a smaller reporting company) | Smaller reporting company | ☐ | |||
Emerging growth company | ý | |||||
If an emerging growth company, indicate by check mark if the Registrant has elected not to use the extended transition period for complying with any new or revised financial accounting standards provided pursuant to Section 13(a) of the Exchange Act. ý
Indicate by check mark whether the Registrant is a shell company (as defined in Rule 12b-2 of the Act). Yes ☐ No ý
The aggregate market value of the stock of the Registrant as of July 31, 2017 (based on a closing price of $21.95 per share) held by non-affiliates was approximately $371.7 million. As of March 7, 2018, there were73,880,045 shares of the Registrant’s Class A Common Stock and 30,776,974 shares of the Registrant's Class B Common Stock outstanding.
DOCUMENTS INCORPORATED BY REFERENCE
Portions of the registrant's definitive Proxy Statement relating to the 2018 Annual Meeting of Stockholders are incorporated herein by reference in Part III of this Annual Report on Form 10-K to the extent stated herein. Such Proxy Statement will be filed with the Securities and Exchange Commission within 120 days of the registrant's fiscal year ended January 31, 2018.
Okta, Inc.
Form 10-K
For the Fiscal Year Ended January 31, 2018
TABLE OF CONTENTS
Page | ||
Part I | ||
Part II | ||
Part III | ||
Part IV | ||
Special Note Regarding Forward-Looking Statements
This Annual Report on Form 10-K contains forward-looking statements within the meaning of the “safe harbor” provisions of the Private Securities Litigation Reform Act of 1995, including but not limited to, statements regarding our financial outlook and market positioning. These forward-looking statements are made as of the date they were first issued and were based on current expectations, estimates, forecasts and projections as well as the beliefs and assumptions of management. Words such as “expect,” “anticipate,” “should,” “believe,” “hope,” “target,” “project,” “goals,” “estimate,” “potential,” “predict,” “may,” “will,” “might,” “could,” “intend,” “shall” and variations of these terms or the negative of these terms and similar expressions are intended to identify these forward-looking statements. The forward-looking statements are contained principally in “Management’s Discussion and Analysis of Financial Condition and Result of Operations” and “Risk Factors".
Forward-looking statements contained in this Form 10-K include, but are not limited to, statements about:
• | our future financial performance, including our revenue, costs of revenue, gross profit or gross margin and operating expenses; |
• | our growth strategy and ability to compete; |
• | the sufficiency of our cash, cash equivalents and investments to meet our liquidity needs; |
• | our ability to maintain the security and availability of our internal networks and platform; |
• | our ability to increase our number of customers; |
• | our ability to sell additional products to and retain our existing customers; |
• | our ability to successfully expand in our existing markets and into new markets; |
• | our ability to effectively manage our growth and future expenses; |
• | our ability to expand our network of independent software vendors and channel partners; |
• | our ability to form and expand partnerships with independent software vendors and system integrators; |
• | our ability to introduce new products, enhance existing products and address new use cases; |
• | our ability to maintain, protect and enhance our intellectual property; |
• | our ability to comply with modified or new laws and regulations applying to our business; |
• | the attraction and retention of qualified employees and key personnel; |
• | our anticipated investments in sales and marketing and research and development; |
• | our ability to comply with modified or new laws and regulations applying to our business, including GDPR (as defined below) and other privacy regulations that may be implemented in the future; |
• | the impact of recent accounting pronouncements on our financial statements; and |
• | our ability to successfully defend litigation brought against us. |
Forward-looking statements are subject to a number of risks and uncertainties, many of which involve factors or circumstances that are beyond Okta’s control. Okta’s actual results could differ materially from those stated or implied in forward-looking statements due to a number of factors, including but not limited to, risks detailed in “Risk Factors” in this Annual Report on Form 10-K as well as other documents that may be filed by the Company from time to time with the Securities and Exchange Commission. Moreover, we operate in a very competitive and rapidly changing environment. New risks emerge from time to time. It is not possible for our management to predict all risks, nor can we assess the impact of all factors on our business or the extent to which any factor, or combination of factors, may cause actual results to differ materially from those contained in any forward-looking statements we may make. In light of these risks, uncertainties and assumptions, the forward-looking events and circumstances discussed in this Annual Report on Form 10-K may not occur and actual results could differ materially and adversely from those anticipated or implied in the forward-looking statements.
You should not rely upon forward-looking statements as predictions of future events. Although we believe that the expectations reflected in the forward-looking statements are reasonable, we cannot guarantee that the future results, levels of activity, performance or events and circumstances reflected in the forward-looking statements will be achieved or occur. Moreover, except as required by law, neither we nor any other person assumes responsibility for the accuracy and completeness of the forward-looking statements. We undertake no obligation to update publicly any forward-looking statements for any reason after the date of this Annual Report on Form 10-K to conform these statements to actual results or to changes in our expectations.
Part I
Item 1. Business
Overview
Okta is the leading independent provider of identity for the enterprise. Our mission is to enable any organization to use any technology, and we believe identity is the key to making that happen. The Okta Identity Cloud is our category-defining platform that enables our customers to securely connect people to technology, anywhere, anytime and from any device.
Identity has always been the key to establishing trust between users and technologies. We founded Okta in 2009 to reinvent identity for the cloud era, where identity is the critical foundation for connection and trust between users and technology. The Okta Identity Cloud helps organizations effectively harness the power of cloud and mobile technologies by securing users and connecting them with the applications they rely on.
Every day, people use Okta to securely access a wide range of cloud applications, websites, mobile applications and services from a multitude of devices. Each of these users represents a unique user identification that authenticates into our platform. Workforces sign into our platform to seamlessly access the applications they need to do their most important work. Organizations also use our platform to provide their customers with more modern experiences online and via mobile devices, and to connect with partners to streamline their operations. Developers leverage our platform to securely embed identity into their software. As we add new customers, users, developers and applications to our platform, our business, customers and users benefit from powerful network effects that increase the value and security of the Okta Identity Cloud.
Given the growth trends in the number of applications and cloud adoption, identity is quickly becoming the most critical layer of an organization’s security. As the corporate perimeter has dissolved, identity has become the most reliable way to manage user access, adopt cloud and mobile technologies and protect digital assets. Our approach to identity eliminates duplicative, sprawling credentials and disparate authentication policies, allowing our customers to simplify and scale their IT and security infrastructures more efficiently as the number of users, devices, clouds and other technologies in their ecosystem grows.
We designed the Okta Identity Cloud to provide organizations an integrated approach to managing and securing all of their identities. Our platform allows our customers to easily provision their customers, employees, contractors, and partners, enabling any user to connect to any device, cloud or application, all with a simple, intuitive and consumer-like user experience. Developers leverage the Okta Identity Cloud to secure and manage the identities of their own customers accessing their cloud and mobile applications.
Our customers are able to achieve fast time to value, lower costs and increased efficiency while improving compliance and providing security that is persistent, perimeter-less and context-aware. These benefits are delivered through multiple products on a unified platform, our superior cloud architecture, and a vast and increasing network of integrations.
The Okta Identity Cloud is an independent and neutral cloud-based identify platform that allows our customers to integrate with any prevalent application, service or cloud that they choose. We offer a complete and integrated identity stack that is built on a single code base, rather than a point solution that needs to be integrated with other identity products. In addition, we do not push our customers to particular vendors or a specific proprietary software stack. This independence and neutrality enables our customers to easily adopt the best technologies, and is designed to securely connect their users to the technology that they choose. We prioritize the compatibility of the Okta Identity Cloud with on-premise infrastructures and public, private and hybrid clouds. Our customers value our open approach, which enables them to future proof their environments.
As of January 31, 2018, more than 4,350 customers across nearly every industry used the Okta Identity Cloud to secure and manage identities around the world. Our customers are comprised of leading global organizations ranging from the largest enterprises, to small and medium-sized businesses, universities, non-profits and government agencies. We partner with leading application and infrastructure vendors, such as Amazon Web Services, Box, Google Cloud, Microsoft, NetSuite, SAP, ServiceNow, and Workday. We had over 5,500 integrations with cloud, mobile and web applications and IT infrastructure providers as of January 31, 2018, which while not directly correlated to revenue, shows the breadth and acceptance of our platform.
4
We employ a SaaS business model, and generate revenue primarily by selling multi-year subscriptions to our cloud-based offerings. We focus on acquiring and retaining our customers and increasing their spending with us through expanding the number of users who access our platform and up-selling additional products. We sell our products directly through our field and inside sales teams, as well as indirectly through our network of independent software vendors, or ISVs, and channel partners.
The Okta Identity Cloud
The Okta Identity Cloud is a secure, reliable and scalable platform that provides comprehensive identity management, enabling our customers to secure their users and connect them to technology and applications, anywhere, anytime and from any device. Our customers use the platform to secure their workforces, to provide more seamless experiences for their customers, and to create solutions that make their partner networks more collaborative.
The Okta Identity Cloud is used as the central system for an organization’s connectivity, access, authentication and identity lifecycle management needs spanning all of its users and applications.
We enable our customers to easily deploy, manage and secure applications and devices, and to provision and support users across their IT environments, with a simple, intuitive, consumer-like user experience. Developers are similarly able to leverage a robust set of tools to quickly build custom web and mobile application experiences that leverage the Okta Identity Cloud as the underlying identity platform. Once deployed, we enable administrators to enforce contextual access management decisions based on conditions such as user identity, device, location, application identity, IP reputation and time of day.
The Okta Identity Cloud is used by organizations in two distinct and powerful ways. It is used to manage and secure their extended enterprise (employees, contractors and partners), which we previously referred to as our internal use case. It is also used to manage and secure an organization’s customers’ identities via the powerful APIs we have developed, which we previously referred to as our external use case.
The Okta Identity Cloud for the Extended Enterprise
The Okta Identity Cloud simplifies the way an organization’s extended enterprise connects to its applications and data from any device, while increasing efficiency and keeping IT environments secure. We enable organizations to provide their users with immediate and secure access to every application they need from any device they use, without requiring multiple credentials, which significantly enhances user connectivity and productivity. We offer our customers an additional security layer through our Adaptive Multi-Factor Authentication product. As our customers’ assets continue to migrate outside of the firewall, we believe this product is one of the simplest yet most effective ways to secure users and data. Our Universal Directory and Lifecycle Management products also serve as a system of record to help our customers organize, customize and manage their users and their access privileges throughout the users’ entire lifecycle. This includes managing all requests and approvals and automating account and device provisioning and de-provisioning seamlessly across directories, applications and devices. The Okta Identity Cloud enables our customers to automate access across their growing ecosystem of employees, contractors and partners, increasing collaboration across their extended enterprise.
The Okta Identity Cloud to Transform the Customer Experience
The Okta Identity Cloud also enables organizations to transform their customer’s experience by empowering development teams to rapidly and securely build customer-facing cloud, mobile or web applications. Managing identity-centric connectivity for an organization’s customers in this way is a relatively new use case. We enable an organization’s product team to layer our powerful identity platform into their cloud, web and mobile applications through our APIs. This makes it easier for them to authenticate, manage and secure their connections, enabling rapid product innovation for the business. Organizations are able to centrally manage policy and API-level access across their development efforts, leading to more seamless customer experiences that are personalized, engaging and secure.
Growth Strategy
Key elements of our growth strategy are to:
Execute with Our Existing Platform
• | Drive New Customer Growth. To increase our market share, we intend to continue to grow our customer base, with a focus on key verticals, including highly-regulated sectors. |
5
• | Deepen Relationships Within Our Existing Customer Base. We plan to further increase revenue from our existing customers by cross-selling and up-selling additional products. We also believe we can expand our footprint by focusing on current customers that have deployed the Okta Identity Cloud for the extended enterprise, and expanding those customers’ use of our platform to managing their customers’ identities, or vice versa. |
• | Expand Our Integrations and Partner Ecosystem. The Okta Integration Network is an extensive partner ecosystem, which includes, among thousands of others, integrations with Amazon Web Services, Atlassian, Box, DocuSign, Google Cloud, Microsoft, NetSuite, SAP, ServiceNow, Slack, Workday, Workplace by Facebook, and Zendesk. We plan to continue these partnerships as well as add new integration partners to enrich our user experience and expand our customer base. We view our investment in partnerships as a force multiplier that enables us to build and promote complementary capabilities that benefit our customers. We also plan to expand our indirect sales network to leverage the sales efforts of additional ISVs and channel partners. |
• | Expand Our International Footprint. With 15% of our revenue generated outside of the United States in fiscal 2018, up from 13% in fiscal 2017, we believe there is significant opportunity to grow our international business. We believe global demand for our products will continue to increase as international organizations fully embrace cloud and mobile computing. |
Increase Our Opportunities
• | Innovate and Advance Our Platform with New Products and Use Cases. We intend to continue making significant investments in research and development, hiring top technical talent and maintaining an agile organization. By continuing to innovate, we believe that we can address new use cases and offer increasing value to existing and potential customers. |
• | Leverage Our Unique Data Assets with Powerful Analytics. Our position at the intersection of people, devices, applications and infrastructure gives us unique access to powerful data, and the opportunity to provide differentiated insights based on that data. We expect the value of our analytics will increase as customers continue to connect more devices, applications and users to their networks and as we add more customers. We do not currently derive revenue from our unique data assets, but we intend to explore opportunities for monetization in the future. |
Our Products
The Okta Identity Cloud consists of a suite of products to manage and secure identities, and it is used by IT organizations to secure their extended enterprise and also by developers to build customer-facing websites and applications. Products used for the extended enterprise are consumed through Okta-branded web and mobile interfaces, and provide simple ways for IT organizations to manage identities for their employees, contractors and partners. Our APIs are used by developers to embed Okta identity functionality into their own customer-facing web or mobile applications. We continuously improve the Okta Identity Cloud through the release and development of additional products and features, with weekly updates.
• | Universal Directory. Universal Directory provides a centralized, cloud-based system of record to store and secure user, application and device profiles for an organization. Users and profiles stored in the directory can be used with our Single Sign-On product to manage passwords and authentication, or can be used by developers to store and authenticate the users of their applications. When used to its fullest to manage and secure identities for the extended enterprise, Universal Directory becomes an organization’s system of record for all of its employees, partners and contractors. |
• | Single Sign-On. When used to manage and secure identities for the extended enterprise, Single Sign-On enables users to access all of their applications, whether in the cloud or on-premise, from any device, with a single entry of their user credentials. We combine secure access, modern protocols, flexible policies and a consumer-like user experience to permit organizations to easily allow customers or partners to sign in to their applications with their existing identity information. Single Sign-On also enables built-in reporting and analytics that provide real-time search functionalities across users, devices, applications and the associated access and usage activity. |
• | Adaptive Multi-Factor Authentication. Adaptive Multi-Factor Authentication is a comprehensive, but simple-to-use, product that provides an additional layer of security for an organization’s web and mobile applications and data. We offer an intelligent approach to security, built on contextual data. Adaptive Multi-Factor |
6
Authentication, standard in our product since late 2017, includes a policy framework that is integrated with a broad set of cloud and on-premise applications and network infrastructures. It offers adaptive, risk-based authentication that leverages data intelligence from across the Okta network of thousands of organizations.
• | Lifecycle Management. Lifecycle Management enables IT organizations or developers to manage a user's identity throughout its entire lifecycle. It automates IT processes and ensures user accounts are created and deactivated at the appropriate times, including the workflow and policies needed to power those processes. With Okta Lifecycle Management, organizations can securely manage the entire identity lifecycle, from on-boarding to off-boarding, and ensure compliance requirements are met as user roles evolve and access levels change. |
• | API Access Management. API Access Management enables organizations to secure APIs as systems connect to each other. Access to these APIs is managed based on the user, which enables organizations to centrally maintain one set of permissions for any employee, partner or customer across every point of access. API Access Management reduces development time, boosts security and enables seamless end-user experiences by providing a unified portable service for authorizing secure and always available access to any API. |
• | Mobility Management. Mobility Management simplifies and automates mobile device administration and provisioning across phones, tablets and laptops, to ensure that devices are secure. In late 2017, we ceased investing in mobility management as a stand-alone product, focusing more on mobile access management as part of our Sign-On product. We will continue to support Mobility Management for existing clients through the duration of their contracts. |
By focusing on identity, the one constant in an ever-changing technology and threat landscape, the Okta Identity Cloud provides our customers with a solution to solve their IT and security challenges.
Our Technology
We focus on engineering a simple but comprehensive platform to solve complex problems. Our pure cloud architecture is multi-tenant, encrypted and third-party validated.
Okta Integration Network
Our Okta Integration Network contains over 5,500 integrations with cloud, mobile and web applications and IT infrastructure providers from Amazon Web Services, Atlassian, Box, Cisco, Citrix, DocuSign, F5 Networks, Google Cloud, Microsoft, MuleSoft, NetSuite, Palo Alto Networks, SAP, ServiceNow, Slack, Splunk, Workday, Workplace by Facebook, Zendesk and Zoom, among thousands of others. At the core of the Okta Integration Network is a patented technology that allows our customers to seamlessly connect to any application or type of device that is already integrated into our network.
One Platform with Differentiated Administration, User and Developer Experience
The Okta Identity Cloud is built on one common platform and user interface framework, offering administrators and users a consistent, easy-to-use, consumer-like experience across our products. Our technology integrates with industry-leading browsers and mobile applications to provide seamless access to any web or native mobile application. We also heavily leverage operating system management and security technologies across desktops, laptops and mobile devices to provide a transparent, but secure experience for users across a range of devices. These integrations allow us to seamlessly deliver connectivity use cases that previously required significant custom development to achieve.
Robust Security
Security is a mission-critical issue for Okta and for our customers. Our approach to security spans day-to-day operational practices to the design and development of our software to how customer data is segmented and secured within our multi-tenant platform. We ensure that access to our platform is securely delegated across an organization. Our source code is updated weekly, and there are audited and verifiable security checkpoints to ensure source code fidelity and continuous security review. We have attained SOC 2, CSA Star 2, Level 2 Attestation, ISO/IEC 27001:2013, ISO/IEC 27018:2014 and HIPAA certifications and the FedRAMP Moderate Authority to Operate. We also plan to meet the requirements of the European Union’s General Data Protection Regulation 2016/679 by May 25, 2018.
7
Scalability and Uptime
Our technical operations and engineering teams are designed around the concept of an always-on, highly redundant and available platform that we can upgrade without customer disruption. Our products and architecture were built entirely in and for the cloud with availability and scalability at the center of the design, and were built to be agnostic with respect to the underlying infrastructure. Our maintenance windows do not require any downtime.
Our proprietary cell architecture includes redundant, active-active availability zones with cross-continental disaster recovery centers, real-time database replication and geo-distributed storage. If one of our systems goes down, another is quickly promoted. Our architecture is designed to scale both vertically by increasing the size of the application tiers and horizontally by adding new geo-distributed cells.
Our platform is monitored not only at the infrastructure level but also at the application and third-party integration level. Synthetic transaction monitoring allows our technical operations team to detect and resolve issues proactively.
Our Customers
As of January 31, 2018, we had over 4,350 customers on our platform. Our customers span nearly all industry verticals and range from small organizations with fewer than 100 employees to companies in the Fortune 100, with up to hundreds of thousands of employees, some of which use the Okta Identity Cloud to manage millions of their customers' identities.
Sales and Marketing
Sales
We sell directly to customers through our inside and field sales force and also indirectly through our extensive ecosystem of channel partners. Once a sale is made, we leverage our land-and-expand sales model to generate incremental revenue, often within the term of the initial agreement, through the addition of new users and the sale of additional products. In many instances, we find that initial customer success with our platform results in key internal decision makers expanding their deployments, for example, from initial use for their extended enterprise to expanded use of our platform to manage their customers’ identities. Furthermore, as our customers are successful in their businesses and increase headcount, we share in their growth as the number of identities that we manage increases.
Our sales organization is structured to address the specific needs of each segment of our target market. Our sales team is divided by geography, customer size, use case and industry vertical. Our direct sales force is supported by our sales engineers, security team, cloud architects, professional services team and other technical resources.
We benefit from an expansive partner ecosystem that helps drive additional sales. Nearly all of the leading cloud application providers are our partners, and many of them drive further customer acquisition for us through co-selling arrangements, building our offerings directly into their products, and product demonstrations running on the Okta Identity Cloud. We also partner with several of the large technology companies that are driving the movement to the cloud. In addition to these technology partners, we leverage system integrators, traditional VARs and Government VARs to broaden the range of customers we reach.
Marketing
Our most valuable marketing features our customers and their successes, and is informed by a deeply data-driven approach, giving us insights into the efficacy of our efforts. Our marketing efforts focus on promoting our industry-leading identity platform, establishing our brand, generating awareness, creating sales leads and cultivating the Okta Community.
A centerpiece of our marketing strategy is our annual customer conference, Oktane, that features customers sharing their success stories, new product and feature announcements and hands-on product labs.
Research and Development
Our research and development organization is responsible for the design, architecture, creation and the quality of the Okta Identity Cloud. The research and development organization also works closely with our technical operations team to ensure the successful deployment and monitoring of our platform. We utilize test automation and application monitoring to ensure the Okta Identity Cloud is always-on. Our research and development expenses for the years ended January 31, 2018, 2017 and 2016, were $70.8 million, $38.7 million and $28.8 million, respectively.
8
Customer Support and Professional Services
Our products are designed for ease of use and fast deployments. We also offer several programs to help our customers maximize their success with our products.
Customer Support and Training Services
We offer three tiers of support, each of which builds upon the previous tier. We provide live webinars as well as on-demand instructional videos to provide our customers with information about product features, functionality and our most common customer use cases.
Professional Services
Our professional services team provides assistance to customers in the deployment of the Okta Identity Cloud and includes identity, mobility and security experts, customized deployment plans and SmartStart, which provides a quick path to implementation.
Okta Community
We have created the Okta Community, an online community available to all of our customers that enables them to connect with other customers and partners to ask questions and find answers.
Intellectual Property
We protect our intellectual property through a combination of trademarks, domain names, copyrights, trade secrets and patents, as well as contractual provisions and restrictions on access to our proprietary technology.
As of January 31, 2018, we had ten issued patents in the United States, which expire between 2030 and 2035 and cover various aspects of our products. In addition, as of such date, we also had three issued patents in Australia, which expire between 2033 and 2035, and one issued patent in New Zealand expiring in 2034.
We registered “Okta” as a trademark in the United States, the European Community, Australia, Canada and Japan. We also have filed other trademark applications in the United States and certain other jurisdictions.
We are the registered holder of a variety of domestic and international domain names that include “Okta” and similar variations.
In addition to the protection provided by our intellectual property rights, we enter into confidentiality and proprietary rights or similar agreements with our employees, consultants and contractors. Our employees, consultants and contractors are also subject to invention assignment agreements. We further control the use of our proprietary technology and intellectual property through provisions in both general and product-specific terms of use.
Additional information regarding certain risks related to our intellectual property is included in Part I, Item 1A “Risk Factors” of this Annual Report on Form 10-K.
Our Competitors
Our competitors for Okta Identity Cloud products to manage identities for the extended enterprise include:
• | Authentication providers, such as Computer Associates, Microsoft, IBM, Oracle and SailPoint; |
• | Life Cycle Management providers, such as Computer Associates, IBM, Microsoft and Oracle; |
• | Multi-factor Authentication providers, such as RSA (a division of Dell Technologies), Microsoft and Symantec; and |
• | Infrastructure-as-a-service providers, such as Microsoft, Google Cloud Platform and Amazon Web Services. |
For organizations to manage their customers’ identities, the Okta Identity Cloud generally competes with internally developed systems.
We also compete with small, private niche companies that offer point products that attempt to address certain of the problems that our platform solves.
9
Due to the flexibility and breadth of our platform, we can and often do co-exist alongside our competitors’ products within our customer base.
The principal competitive factors in our markets include product capabilities, flexibility, independence, total cost of ownership, time to value, scalability, user experience, number of pre-built integrations, customer satisfaction, global reach, and ease of integration, management and use. We believe our product strategy, technology and company culture allow us to compete favorably on each of these factors.
We expect competition to increase as other established and emerging companies enter our markets, as customer requirements evolve, and as new products and technologies are introduced. We expect this to be particularly true as we are a cloud-based offering, and our competitors may also seek to repurpose their existing offerings to provide identity management solutions with subscription models.
With the recent increase in merger and acquisition transactions in the technology industry, particularly transactions involving cloud-based technologies, there is a greater likelihood that we will compete with other large technology companies in the future. Many of our competitors, particularly the large technology companies named above, have longer operating histories, significantly greater financial, technical, sales and marketing, distribution, customer support or other resources, and greater name recognition than we do. However, we believe that our platform architecture, position as an independent provider of identity solutions and focus on innovation enable us to respond more quickly to new or emerging technologies and changes in customer requirements than our larger competitors that primarily focus on other market segments and tie their identity solutions to their other proprietary products.
Additional information regarding our competition is included in Part I, Item 1A “Risk Factors” of this Annual Report on Form 10-K.
Okta for Good
Okta for Good’s mission is to mobilize our technology and people to enable non-profit organizations to achieve their missions faster. Through Okta for Good, which is a part of our company and not a separate legal entity, we also donate and discount access to our service for non-profit organizations, who use the Okta Identity Cloud to make their teams more efficient and allows them to focus on making a meaningful impact in the world. Our employee volunteer program enables global team members to donate time to support charitable organizations worldwide.
Employees
As of January 31, 2018, we had 1,176 employees, including 151 employees located outside of the United States. To our knowledge, none of our employees is represented by a labor union or covered by a collective bargaining agreement. We have not experienced any work stoppages, and we consider our relations with our employees to be good.
Financial Information and Segments
The financial information required under this Item 1 is incorporated herein by reference to the section of this Annual Report titled “Part II-Item 8-Financial Statements and Supplementary Data.” We operate as one reportable segment. For financial information regarding our business, see “Part II-Item 7-Management’s Discussion and Analysis of Financial Condition and Results of Operations” of this Annual Report and our consolidated audited financial statements and related notes included elsewhere in this Annual Report.
Corporate Information
We were incorporated in 2009 as Saasure Inc., a California corporation, and were later reincorporated in 2010 under the name Okta, Inc. as a Delaware corporation. Our principal executive offices are located at 301 Brannan Street, San Francisco, California 94107, and our telephone number is (888) 722-7871. Our website address is www.okta.com. Information contained on, or that can be accessed through, our website does not constitute part of this Annual Report on Form 10-K.
Additional Information
The following filings are available through our investor relations website after we file them with the Securities and Exchange Commission ("SEC"): Annual Report on Form 10-K, Quarterly Reports on Form 10-Q and our Proxy Statement for our annual meeting of stockholders. These filings are also available for download free of charge on our investor relations website. Our investor relations website is located at investor.okta.com. You may obtain copies of this information by mail from the Public Reference Section of the SEC, 100 F Street, N.E., Room 1580, Washington, D.C.
10
20549. The SEC also maintains an Internet website that contains reports, proxy statements and other information about issuers, like us, that file electronically with the SEC. The address of that website is www.sec.gov.
We webcast our earnings calls and certain events we participate in or host with members of the investment community on our investor relations website. Additionally, we provide notifications of news or announcements regarding our financial performance, including SEC filings, investor events, press and earnings releases, and blogs as part of our investor relations website. Further corporate governance information, including our corporate governance guidelines and code of conduct, is also available on our investor relations website under the heading "Corporate Governance." The contents of our websites are not intended to be incorporated by reference into this Annual Report on Form 10-K or in any other report or document we file with the SEC, and any references to our websites are intended to be inactive textual references only.
11
Item 1A. Risk Factors
A description of the risks and uncertainties associated with our business is set forth below. You should carefully consider the risks and uncertainties described below, as well as the other information in this Annual Report on Form 10-K, including our consolidated financial statements and the related notes and “Management’s Discussion and Analysis of Financial Condition and Results of Operations”. The occurrence of any of the events or developments described below, or of additional risks and uncertainties not presently known to us or that we currently deem immaterial, could materially and adversely affect our business, results of operations, financial condition and growth prospects. In such an event, the market price of our Class A common stock could decline and you could lose all or part of your investment.
Risks Related to Our Business
We have a limited operating history, which makes it difficult to forecast our revenue and evaluate our business and future prospects.
We have been in existence since 2009, and much of our growth has occurred in recent periods. As a result of our limited operating history, our ability to forecast our future results of operations and plan for and model future growth is limited and subject to a number of uncertainties. We have encountered and will continue to encounter risks and uncertainties frequently experienced by growing companies in rapidly changing industries, such as the risks and uncertainties described herein. Additionally, the sales cycle for the evaluation and implementation of our platform, which typically extends for multiple months for enterprise deals, may also cause us to experience a delay between increasing operating expenses and the generation of corresponding revenue, if any. Accordingly, we may be unable to prepare accurate internal financial forecasts or replace anticipated revenue that we do not receive as a result of delays arising from these factors, and our results of operations in future reporting periods may be below the expectations of investors. If we do not address these risks successfully, our results of operations could differ materially from our estimates and forecasts or the expectations of investors, causing our business to suffer and our stock price to decline.
We have experienced rapid growth in recent periods, and our recent growth rates may not be indicative of our future growth. As our costs increase, we may not be able to generate sufficient revenue to achieve and, if achieved, maintain profitability.
From fiscal 2016 to fiscal 2017, our revenue grew from $85.9 million to $160.3 million, an increase of 87% and from fiscal 2017 to fiscal 2018, our revenue grew from $160.3 million to $260.0 million, an increase of 62%. In future periods, we may not be able to sustain revenue growth consistent with recent history, or at all. We believe our revenue growth depends on a number of factors, including, but not limited to, our ability to:
• | price our products effectively so that we are able to attract and retain customers without compromising our profitability; |
• | attract new customers, successfully deploy and implement our platform, up-sell or otherwise increase our existing customers’ use of our platform, obtain customer renewals and provide our customers with excellent customer support; |
• | increase our number of ISVs and channel partners; |
• | adequately expand our sales force, and maintain or increase our sales force’s productivity; |
• | successfully introduce new products, enhance existing products and address new use cases; |
• | introduce our platform to new markets outside of the United States; |
• | successfully compete against larger companies and new market entrants; and |
• | increase awareness of our brand on a global basis. |
If we are unable to accomplish any of these tasks, our revenue growth will be harmed. We also expect our operating expenses to increase in future periods, and if our revenue growth does not increase to offset these anticipated increases in our operating expenses, our business, financial position and results of operations will be harmed, and we may not be able to achieve or maintain profitability.
12
We have a history of losses, and we expect to incur losses for the foreseeable future.
We have incurred significant net losses in each year since our inception, including net losses of $76.3 million, $83.5 million and $114.4 million in fiscal 2016, 2017 and 2018, respectively. We expect to continue to incur net losses for the foreseeable future. Because the market for our platform is rapidly evolving and has not yet reached widespread adoption, it is difficult for us to predict our future results of operations. We expect our operating expenses to significantly increase over the next several years as we hire additional personnel, particularly in sales and marketing, expand and improve the effectiveness of our distribution channels, expand our operations and infrastructure, both domestically and internationally, and continue to develop our platform. As we continue to develop as a public company, we may incur additional legal, accounting and other expenses that we did not incur historically. If our revenue does not increase to offset these increases in our operating expenses, we will not be profitable in future periods. While historically, our total revenue has grown, not all components of our total revenue have grown consistently. Further, in future periods, our revenue growth could slow or our revenue could decline for a number of reasons, including slowing demand for our software, increasing competition, any failure to gain or retain channel partners, a decrease in the growth of our overall market, or our failure, for any reason, to continue to capitalize on growth opportunities. As a result, our past financial performance should not be considered indicative of our future performance. Any failure by us to achieve or sustain profitability on a consistent basis could cause the value of our common stock to decline.
If we fail to manage our growth effectively, we may be unable to execute our business plan, maintain high levels of service and customer satisfaction or adequately address competitive challenges.
We have experienced, and may continue to experience, rapid growth and organizational change, which has placed, and may continue to place, significant demands on our management and our operational and financial resources. We have also experienced significant growth in the number of users and logins and in the amount of data that our Software-as-a-Service, or SaaS, hosting infrastructure supports. Finally, our organizational structure is becoming more complex as we improve our operational, financial and management controls as well as our reporting systems and procedures. We will require significant capital expenditures and the allocation of valuable management resources to grow and change in these areas without undermining our culture of rapid innovation, teamwork and attention to customer success, which has been central to our growth so far. If we fail to manage our anticipated growth and change in a manner that preserves the key aspects of our corporate culture, the quality of our platform may suffer, which could negatively affect our brand and reputation and harm our ability to retain and attract customers and employees.
We have established international offices, including offices in the United Kingdom, Canada and Australia and we may continue to expand our international operations into other countries in the future. Our expansion has placed, and our expected future growth will continue to place, a significant strain on our managerial, customer operations, research and development, marketing and sales, administrative, financial and other resources. If we are unable to manage our continued growth successfully, our business and results of operations could suffer.
In addition, as we expand our business, it is important that we continue to maintain a high level of customer service and satisfaction. As our customer base continues to grow, we will need to expand our account management, customer service and other personnel, and our network of ISVs, channel partners and system integrators, to provide personalized account management and customer service. If we are not able to continue to provide high levels of customer service, our reputation, as well as our business, results of operations and financial condition, could be harmed.
We face intense competition, especially from larger, well-established companies, and we may lack sufficient financial or other resources to maintain or improve our competitive position.
The market for identity solutions is intensely competitive, and we expect competition to increase in the future from established competitors and new market entrants. For products that organizations can use to manage identities for their extended enterprise, which we previously referred to as the internal use case, our competitors include authentication, provisioning and adaptive multi-factor authentication providers, many of which are large companies such as Computer Associates, Citrix, IBM, Microsoft, Oracle, RSA (a division of Dell Technologies) and Symantec, infrastructure-as-a-service providers such as Google Cloud Platform and Amazon Web Services, or AWS, and companies, such as VMware, that have acquired identity management solution providers in recent years. For products that organizations can use to manage and secure their customers’ identities, which we previously referred to as the external use case, we generally compete with internally developed systems. We also face competition from small, private niche companies that offer point products that attempt to address certain of the problems that our platform solves. In addition, with the recent increase in large merger and acquisition transactions in the technology industry, particularly transactions involving cloud-based technologies, there is a greater likelihood that we will compete
13
with other large technology companies in the future. Many of our existing competitors have, and some of our potential competitors could have, substantial competitive advantages such as greater name recognition and longer operating histories, larger sales and marketing budgets and resources, broader distribution and established relationships with ISVs, channel partners and customers, greater customer support resources, greater resources to make acquisitions, lower labor and development costs, larger and more mature intellectual property portfolios and substantially greater financial, technical and other resources.
In addition, some of our larger competitors have substantially broader product offerings and leverage their relationships based on other products or incorporate functionality into existing products to gain business in a manner that discourages users from purchasing our products, including through selling at zero or negative margins, product bundling or closed technology platforms. Potential customers may also prefer to purchase from their existing suppliers rather than a new supplier regardless of product performance or features. These larger competitors often have broader product lines and market focus and will therefore not be as susceptible to downturns in a particular market. Our competitors may also seek to repurpose their existing offerings to provide identity solutions with subscription models. Conditions in our market could change rapidly and significantly as a result of technological advancements, partnering by our competitors or continuing market consolidation. New start-up companies that innovate and large competitors that are making significant investments in research and development may invent similar or superior products and technologies that compete with our products. In addition, some of our competitors may enter into new alliances with each other or may establish or strengthen cooperative relationships with systems integrators, third-party consulting firms or other parties. Any such consolidation, acquisition, alliance or cooperative relationship could lead to pricing pressure and our loss of market share and could result in a competitor with greater financial, technical, marketing, service and other resources, all of which could harm our ability to compete. Furthermore, organizations may be more willing to incrementally add solutions to their existing infrastructure from competitors than to replace their existing infrastructure with our products. These competitive pressures in our market or our failure to compete effectively may result in price reductions, fewer orders, reduced revenue and gross margins, increased net losses, and loss of market share. Any failure to meet and address these factors could harm our business, results of operations and financial condition.
If we are unable to attract new customers, sell additional products to our existing customers or develop new products and enhancements to our products that achieve market acceptance, our revenue growth and profitability will be harmed.
To increase our revenue and achieve and maintain profitability, we must add new customers or sell additional products to our existing customers. Numerous factors, however, may impede our ability to add new customers and sell additional products to our existing customers, including our inability to convert new organizations into paying customers, failure to attract and effectively train new sales and marketing personnel, failure to retain and motivate our current sales and marketing personnel, failure to develop or expand relationships with channel partners, failure to successfully deploy products for new customers and provide quality customer support once deployed or failure to ensure the effectiveness of our marketing programs. In addition, if prospective customers do not perceive our platform to be of sufficiently high value and quality, we will not be able to attract the number and types of new customers that we are seeking.
In addition, our ability to attract new customers and increase revenue from existing customers depends in large part on our ability to enhance and improve our existing products and to introduce compelling new products that reflect the changing nature of our markets. The success of any enhancement to our products depends on several factors, including timely completion and delivery, competitive pricing, adequate quality testing, integration with existing technologies and our platform and overall market acceptance. If we are unable to successfully develop new products, enhance our existing products to meet customer requirements, or otherwise gain market acceptance, our business, results of operations and financial condition would be harmed.
Further, to grow our business, we must convince developers to adopt and build their external portals on our platform. We believe that these developer-built portals facilitate greater usage and customization of our products. If these developers stop developing on or supporting our platform, we will lose the benefit of network effects that have contributed to the growth in our number of customers, and our business, results of operations and financial condition could be harmed.
14
Our business depends on our customers renewing their subscriptions and purchasing additional licenses or subscriptions from us. Any material decline in our Dollar-Based Retention Rate would harm our future results of operations.
To continue to grow our business, it is important that our customers renew their subscriptions when existing contract terms expire and that we expand our commercial relationships with our existing customers. Our customers have no obligation to renew their subscriptions, and our customers may decide not to renew their subscriptions with a similar contract period, at the same prices and terms or with the same or a greater number of users. We have experienced significant growth in the number of users of our platform, but we do not know whether we will continue to achieve similar user growth rates in the future. In the past, some of our customers have elected not to renew their agreements with us, and it is difficult to accurately predict long-term customer retention and expansion rates. Our customer retention and expansion may decline or fluctuate as a result of a number of factors, including our customers’ satisfaction with our products, our product support, our prices and pricing plans, the prices of competing software products, reductions in our customers’ spending levels, user adoption of our platform, deployment success, utilization rates by our customers, new product releases and changes to the packaging of our product offerings. If our customers do not purchase additional subscriptions or renew their subscriptions, renew on less favorable terms or fail to add more users, our revenue may decline or grow less quickly than anticipated, which would harm our future results of operations. Furthermore, if our contractual license terms were to shorten it could lead to increased volatility of, and diminished visibility into, future recurring revenue. If our sales of new or recurring subscriptions and software-related support service contracts decline from existing customers, our revenue and revenue growth may decline, and our business will suffer.
If there are interruptions or performance problems associated with our technology or infrastructure, our existing customers may experience service outages, and our new customers may experience delays in the deployment of our platform.
Our continued growth depends, in part, on the ability of our existing and potential customers to access our platform 24 hours a day, seven days a week, without interruption or degradation of performance. We may experience disruptions, data loss, outages and other performance problems with our infrastructure due to a variety of factors, including infrastructure changes, introductions of new functionality, human or software errors, capacity constraints, denial-of-service attacks or other security-related incidents. In some instances, we may not be able to identify the cause or causes of these performance problems immediately or in short order. We may not be able to maintain the level of service uptime and performance required by our customers, especially during peak usage times and as our products become more complex and our user traffic increases. For example, in October 2016, a distributed denial-of-service attack against Dyn, a domain name service vendor we use (since acquired by Oracle), prevented many of our customers and their users in the United States from accessing our platform or applications authenticated by our platform and resulted in our failing to meet certain contracted uptime levels under our service level agreements and the issuance of service credits to some of our customers, although the dollar value of such credits were not material. If our platform is unavailable or if our customers are unable to access our products or deploy them within a reasonable amount of time, or at all, our business would be harmed. Since our customers rely on our service to access and complete their work, any outage on our platform would impair the ability of our customers to perform their work, which would negatively impact our brand, reputation and customer satisfaction. Moreover, we depend on services from various third parties to maintain our infrastructure and distribute our products via the Internet. If a service provider fails to provide sufficient capacity to support our platform or otherwise experiences service outages, such failure could interrupt our customers’ access to our services, which could adversely affect their perception of our platform's reliability and our revenues. Any disruptions in these services, including as a result of actions outside of our control, would significantly impact the continued performance of our products. In the future, these services may not be available to us on commercially reasonable terms, or at all. Any loss of the right to use any of these services could result in decreased functionality of our products until equivalent technology is either developed by us or, if available from another provider, is identified, obtained and integrated into our infrastructure. If we do not accurately predict our infrastructure capacity requirements, our customers could experience service shortfalls. We may also be unable to effectively address capacity constraints, upgrade our systems as needed, and continually develop our technology and network architecture to accommodate actual and anticipated changes in technology.
Any of the above circumstances or events may harm our reputation, cause customers to terminate their agreements with us, impair our ability to obtain subscription renewals from existing customers, impair our ability to grow our customer base, result in the expenditure of significant financial, technical and engineering resources, subject us to financial penalties and liabilities under our service level agreements, and otherwise harm our business, results of operations and financial condition.
15
A network or data security incident may allow unauthorized access to our network or data or our customers’ data, harm our reputation, create additional liability and adversely impact our financial results.
Increasingly, companies are subject to a wide variety of attacks on their networks and systems on an ongoing basis. In addition to threats from traditional computer “hackers,” malicious code (such as malware, viruses, worms and ransomware), employee theft or misuse, phishing and denial-of-service attacks, we now also face threats from sophisticated nation-state and nation-state supported actors who engage in attacks (including advanced persistent threat intrusions) that add to the risks to our internal networks and the information that they store and process. Despite significant efforts to create security barriers to such threats, it is virtually impossible for us to entirely mitigate these risks. As a well-known provider of identity and security solutions, we pose an attractive target for such attacks. The security measures we have integrated into our internal networks and platform, which are designed to detect unauthorized activity and prevent or minimize security breaches, may not function as expected or may not be sufficient to protect our internal networks and platform against certain attacks. In addition, techniques used to sabotage or to obtain unauthorized access to networks in which data is stored or through which data is transmitted change frequently and generally are not recognized until launched against a target. As a result, we may be unable to anticipate these techniques or implement adequate preventative measures to prevent an electronic intrusion into our networks.
Our customers’ storage and use of data concerning, among others, their employees, contractors, customers and partners is essential to their use of our platform, which stores, transmits and processes customers’ proprietary information and personally identifiable information. If a breach of customer data security were to occur, as a result of third-party action, employee error, malfeasance or otherwise, and the confidentiality, integrity or availability of our customers’ data was disrupted, we could incur significant liability to our customers and to individuals or businesses whose information was being stored by our customers, and our platform may be perceived as less desirable, which could negatively affect our business and damage our reputation. In addition, a network or security breach could result in the loss of customers and make it more challenging to acquire new customers. Because techniques used to obtain unauthorized access to, or to sabotage, systems change frequently and generally are not recognized until launched against a target, we and our customers may be unable to anticipate these techniques or to implement adequate preventive measures.
In addition, security breaches impacting our platform could result in a risk of loss or unauthorized disclosure of this information, which, in turn, could lead to litigation, governmental audits and investigations and possible liability, damage our relationships with our existing customers, trigger indemnification and other contractual obligations, cause us to incur mitigation and remediation expenses, and have a negative impact on our ability to attract and retain new customers. Furthermore, as a well-known provider of identity and security solutions, any such breach, including a breach of our customers’ networks, could compromise our networks or networks secured by our products, creating system disruptions or slowdowns and exploiting security vulnerabilities of our or our customers’ networks, and the information stored on our or our customers’ networks could be accessed, publicly disclosed, altered, lost or stolen, which could subject us to liability and cause us financial harm. These breaches, or any perceived breach, of our networks, our customers’ networks, or other networks secured by our products, whether or not any such breach is due to a vulnerability in our platform, may also undermine confidence in our platform or our industry and result in damage to our reputation, negative publicity, loss of ISVs, channel partners, customers and sales, increased costs to remedy any problem, increased insurance expense, and costly litigation. In addition, a breach of the security measures of one of our key ISVs or channel partners could result in the exfiltration of confidential corporate information or other data that may provide additional avenues of attack, and if a high profile security breach occurs with respect to another SaaS provider, our customers and potential customers may lose trust in the security of the SaaS business model generally, which could adversely impact our ability to retain existing customers or attract new ones, potentially causing a negative impact on our business. Any of these negative outcomes could adversely impact market acceptance of our products and could harm our business, results of operations and financial condition.
Third parties may attempt to fraudulently induce employees or customers into disclosing sensitive information such as user names, passwords or other information or otherwise compromise the security of our internal networks, electronic systems and/or physical facilities in order to gain access to our data or our customers’ data, which could result in significant legal and financial exposure, a loss of confidence in the security of our platform, interruptions or malfunctions in our operations, and, ultimately, harm to our future business prospects and revenue. We may be required to expend significant capital and financial resources to protect against such threats or to alleviate problems caused by breaches in security.
16
We may experience quarterly fluctuations in our results of operations due to a number of factors that make our future results difficult to predict and could cause our results of operations to fall below analyst or investor expectations.
Our quarterly results of operations fluctuate from quarter to quarter as a result of a number of factors, many of which are outside of our control and may be difficult to predict, including, but not limited to:
• | the level of demand for our platform; |
• | our ability to attract new customers and increase our existing customers’ use of our platform; |
• | the timing and success of new product introductions by us or our competitors or any other change in the competitive landscape of our market; |
• | pricing pressure as a result of competition or otherwise; |
• | seasonal buying patterns for IT spending; |
• | the mix of revenue attributable to larger transactions as opposed to smaller transactions and the associated volatility and timing of our transactions; |
• | errors in our forecasting of the demand for our products, which could lead to lower revenue, increased costs or both; |
• | increases in and timing of sales and marketing and other operating expenses that we may incur to grow and expand our operations and to remain competitive; |
• | credit or other difficulties confronting our channel partners; |
• | adverse litigation judgments, settlements of litigation and other disputes or other litigation-related or dispute-related costs; |
• | significant security breaches of, technical difficulties with, or interruptions to, the delivery and use of our platform; |
• | the impact of new accounting pronouncements and associated system implementations; |
• | changes in the legislative or regulatory environment; |
• | fluctuations in foreign currency exchange rates; |
• | expenses related to real estate, including our office leases, and other fixed expenses; |
• | costs related to the acquisition of businesses, talent, technologies or intellectual property, including potentially significant amortization costs and possible write-downs; and |
• | general economic conditions in either domestic or international markets, including geopolitical uncertainty and instability. |
Any one or more of the factors above may result in significant fluctuations in our results of operations. You should not rely on our past results as an indicator of our future performance.
The variability and unpredictability of our quarterly results of operations or other operating metrics could result in our failure to meet our expectations or those of analysts that cover us or investors with respect to revenue or other metrics for a particular period. If we fail to meet or exceed such expectations for these or any other reasons, the market price of our Class A common stock could fall substantially, and we could face costly lawsuits, including securities class action suits.
Any actual or perceived failure by us to comply with our privacy policy or legal or regulatory requirements in one or multiple jurisdictions could result in proceedings, actions or penalties against us.
Our customers’ storage and use of data concerning, among others, their employees, contractors, customers and partners is essential to their use of our platform. We have implemented various features intended to enable our customers to better comply with applicable privacy and security requirements in their collection and use of data, but these features do not ensure their compliance and may not be effective against all potential privacy concerns.
Many jurisdictions have enacted or are considering enacting privacy and/or data security legislation, including laws and regulations applying to the collection, use, storage, transfer, disclosure and/or processing of personal information. The costs of compliance with, and other burdens imposed by, such laws and regulations that are applicable
17
to the businesses of our customers may limit the use and adoption of our service and reduce overall demand for it. These privacy and data security related laws and regulations are evolving and may result in increasing regulatory and public scrutiny and escalating levels of enforcement and sanctions. In addition, we are subject to certain contractual obligations regarding the collection, use, storage, transfer, disclosure and/or processing of personal information. Although we are working to comply with those federal, state, and foreign laws and regulations, industry standards, contractual obligations and other legal obligations that apply to us, those laws, regulations, standards and obligations are evolving and may be modified, interpreted and applied in an inconsistent manner from one jurisdiction to another, and may conflict with one another, other requirements or legal obligations, our practices or the features of our platform. In addition, some of our customers rely on our certification under the Federal Risk and Authorization Management Program, or FedRAMP, to help satisfy their own legal and regulatory compliance requirements.
Any failure or perceived failure by us to comply with federal, state or foreign laws or regulations, industry standards, contractual obligations or other legal obligations, or any actual or suspected security incident, whether or not resulting in unauthorized access to, or acquisition, release or transfer of personal information or other data, may result in governmental enforcement actions and prosecutions, private litigation, fines and penalties or adverse publicity and could cause our customers to lose trust in us, which could have an adverse effect on our reputation and business. Any inability to adequately address privacy and security concerns, even if unfounded, or comply with applicable laws, regulations, policies, industry standards, contractual obligations or other legal obligations could result in additional cost and liability to us, damage our reputation, inhibit sales and adversely affect our business.
We also expect that there will continue to be new proposed laws, regulations and industry standards concerning privacy, data protection and information security in the United States, the European Union and other jurisdictions, and we cannot yet determine the impact such future laws, regulations and standards may have on our business. In addition to government activity, privacy advocacy groups and technology and other industries are considering various new, additional or different self-regulatory standards that may place additional burdens on us. Future laws, regulations, standards and other obligations, and changes in the interpretation of existing laws, regulations, standards and other obligations could impair our or our customers’ ability to collect, use or disclose information relating to consumers, which could decrease demand for our applications, increase our costs and impair our ability to maintain and grow our customer base and increase our revenue. New laws, amendments to or re-interpretations of existing laws and regulations, industry standards, contractual obligations and other obligations may require us to incur additional costs and restrict our business operations. Such laws and regulations may require companies to implement privacy and security policies, permit users to access, correct and delete personal information stored or maintained by such companies, inform individuals of security breaches that affect their personal information, and, in some cases, obtain individuals’ consent to use personal information for certain purposes. If we fail to comply with federal, state and international data privacy laws and regulations our ability to successfully operate our business and pursue our business goals could be harmed.
Our failure to comply with applicable laws and regulations, or to protect such data, could result in enforcement action against us, including fines and public censure, claims for damages by customers and other affected individuals, damage to our reputation and loss of goodwill (both in relation to existing customers and prospective customers), any of which could harm our business, results of operations and financial condition.
Since many of our services’ features involve the processing of personal information from our customers and their employees, contractors, customers, partners and others, any inability to adequately address privacy concerns, even if such concerns are unfounded, or to comply with applicable privacy or data security laws, regulations and policies, could result in liability to us, damage to our reputation, inhibition of sales and to our business.
Around the world, there are numerous lawsuits in process against various technology companies that process personal information. If those lawsuits are successful, it could increase the likelihood that our company may be exposed to liability for our own policies and practices concerning the processing of personal information and could hurt our business. Furthermore, the costs of compliance with, and other burdens imposed by laws, regulations and policies concerning privacy and data security that are applicable to the businesses of our customers may limit the use and adoption of our platform and reduce overall demand for it. Privacy concerns, whether or not valid, may inhibit market adoption of our platform. Additionally, concerns about security or privacy may result in the adoption of new legislation that restricts the implementation of technologies like ours or requires us to make modifications to our platform, which could significantly limit the adoption and deployment of our technologies or result in significant expense to modify our platform.
We publicly post our privacy policies and practices concerning our processing, use and disclosure of the personally identifiable information provided to us by our website visitors. Our publication of our privacy policies and
18
other statements we publish that provide promises and assurances about privacy and security can subject us to potential state and federal action if they are found to be deceptive or misrepresentative of our practices.
Evolving and changing definitions of what constitutes “Personal Information” and “Personal Data” within the European Union, the United States and elsewhere, especially relating to classification of IP addresses, machine or device identification numbers, location data and other information, may limit or inhibit our ability to operate or expand our business, including limiting technology alliance partners that may involve the sharing of data.
If our platform is perceived to cause, or is otherwise unfavorably associated with, violations of privacy or data security requirements, it may subject us or our customers to public criticism and potential legal liability. Existing and potential privacy laws and regulations concerning privacy and data security and increasing sensitivity of consumers to unauthorized processing of personal information may create negative public reactions to technologies, products and services such as ours. Public concerns regarding personal information processing, privacy and security may cause some of our customers’ end users to be less likely to visit their websites or otherwise interact with them. If enough end users choose not to visit our customers’ websites or otherwise interact with them, our customers could stop using our platform. This, in turn, may reduce the value of our service and slow or eliminate the growth of our business.
Our financial results may fluctuate due to increasing variability in our sales cycles.
We plan our expenses based on certain assumptions about the length and variability of our sales cycle. These assumptions are based upon historical trends for sales cycles and conversion rates associated with our existing customers. As we continue to focus on sales to larger organizations, we expect our sales cycles to lengthen and become less predictable, which may harm our financial results. Factors that may influence the length and variability of our sales cycle include, among other things:
• | the need to raise awareness about the uses and benefits of our platform, including products that our customers can use to manage and secure the identities of their customers; |
• | the need to allay privacy and security concerns; |
• | the discretionary nature of purchasing and budget cycles and decisions; |
• | the competitive nature of evaluation and purchasing processes; |
• | announcements or planned introductions of new products, features or functionality by us or our competitors; and |
• | often lengthy purchasing approval processes. |
Our increasing focus on sales to larger organizations may further increase the variability of our financial results. If we are unable to close one or more expected significant transactions with large organizations in a particular period, or if an expected transaction is delayed until a subsequent period, our results of operations for that period, and for any future periods in which revenue from such transaction would otherwise have been recognized, may be harmed.
We provide service level commitments under our customer contracts. If we fail to meet these contractual commitments, we could be obligated to provide credits for future service, or face contract termination with refunds of prepaid amounts related to unused subscriptions, which could harm our business, results of operations and financial condition.
Our customer agreements contain service level agreements, under which we guarantee specified availability of our platform. Any failure of or disruption to our infrastructure could make our platform unavailable to our customers. If we are unable to meet the stated service level commitments to our customers or suffer extended periods of unavailability of our platform, we may be contractually obligated to provide affected customers with service credits for future subscriptions, or customers could elect to terminate and receive refunds for prepaid amounts related to unused subscriptions. For example, in October 2016, a distributed denial-of-service attack against Dyn, a domain name service vendor we use (since acquired by Oracle), prevented many of our customers and their users in the United States from accessing our platform or applications authenticated by our platform and resulted in our failing to meet certain contracted uptime levels under our service level agreements and the issuance of service credits to some of our customers. Our revenue, other results of operations and financial condition could be harmed if we suffer unscheduled downtime that exceeds the service level commitments under our agreements with our customers, and any extended service outages could adversely affect our business and reputation as customers may elect not to renew and we could lose future sales.
19
If we fail to offer high-quality customer support, our business and reputation will suffer.
Once our platform is deployed to our customers, our customers rely on our support services to resolve any related issues. High-quality customer education and customer support is important for the successful marketing and sale of our products and for the renewal of existing customers. The importance of high-quality customer support will increase as we expand our business and pursue new organizations. If we do not help our customers quickly resolve post-deployment issues and provide effective ongoing customer support, our ability to upsell additional products to existing customers would suffer and our reputation with existing or potential customers would be harmed.
Our growth depends, in part, on the success of our strategic relationships with third parties.
To grow our business, we anticipate that we will continue to depend on relationships with third parties, such as ISVs and channel partners. Identifying partners, and negotiating and documenting relationships with them, requires significant time and resources. Our competitors may be effective in providing incentives to third parties to favor their products or services over subscriptions to our platform. In addition, acquisitions of such partners by our competitors could result in a decrease in the number of our current and potential customers, as these partners may no longer facilitate the adoption of our applications by potential customers. Further, some of our partners are or may become competitive with certain of our products and may elect to no longer integrate with our platform. If we are unsuccessful in establishing or maintaining our relationships with third parties, our ability to compete in the marketplace or to grow our revenue could be impaired, and our results of operations may suffer. Even if we are successful, we cannot assure you that these relationships will result in increased customer usage of our applications or increased revenue.
Because we recognize revenue from subscriptions and support services over the term of the relevant service period, downturns or upturns in sales are not immediately fully reflected in our results of operations.
We recognize recurring subscriptions and related support services revenue monthly over the term of the relevant period. As a result, much of the revenue we report each quarter is the recognition of deferred revenue from recurring subscriptions and related support services contracts entered into during previous quarters. Consequently, a decline in new or renewed recurring subscriptions and software-related support service contracts in any one quarter will not be fully reflected in revenue in that quarter, but will negatively affect our revenue in future quarters. Accordingly, the effect of significant downturns in new or renewed sales of our recurring subscriptions and software-related support services are not reflected in full in our results of operations until future periods. Revenue from our recurring subscriptions and software-related support services also makes it difficult for us to rapidly increase our revenue through additional service sales in any period, as revenue from new and renewal software-related service contracts must be recognized over the applicable service period.
If we fail to adapt to rapid technological change, our ability to remain competitive could be impaired.
The industry in which we compete is characterized by rapid technological change, frequent introductions of new products and evolving industry standards. Our ability to attract new customers and increase revenue from existing customers will depend in significant part on our ability to anticipate industry standards and trends and continue to enhance existing products or introduce or acquire new products on a timely basis to keep pace with technological developments. The success of any enhancement or new product depends on several factors, including the timely completion and market acceptance of the enhancement or new product. Any new product we develop or acquire might not be introduced in a timely or cost-effective manner and might not achieve the broad market acceptance necessary to generate significant revenue. If any of our competitors implements new technologies before we are able to implement them, those competitors may be able to provide more effective products than ours at lower prices. Any delay or failure in the introduction of new or enhanced products could harm our business, results of operations and financial condition.
Adverse general economic and market conditions and reductions in IT and identity spending may reduce demand for our products, which could harm our revenue, results of operations and cash flows.
Our revenue, results of operations and cash flows depend on the overall demand for our products. Concerns about the systemic impact of a potential widespread recession (in the United States or internationally), energy costs, geopolitical issues or the availability and cost of credit could lead to increased market volatility, decreased consumer confidence and diminished growth expectations in the U.S. economy and abroad, which in turn could result in reductions in IT and identity spending by our existing and prospective customers. Prolonged economic slowdowns may result in customers requesting us to renegotiate existing contracts on less advantageous terms to us than those currently in place or defaulting on payments due on existing contracts or not renewing at the end of the contract term.
20
In addition, the economies of countries in Europe have been experiencing weakness associated with high sovereign debt levels, weakness in the banking sector and uncertainty over the future of the Eurozone. We have current and potential new customers in Europe. If economic conditions in Europe and other key markets for our applications continue to remain uncertain or deteriorate further, many customers may delay or reduce their information technology spending.
Our customers may merge with other entities who use alternative identity solutions and, during weak economic times, there is an increased risk that one or more of our customers will file for bankruptcy protection, either of which may harm our revenue, profitability and results of operations. We also face risk from international customers that file for bankruptcy protection in foreign jurisdictions, particularly given that the application of foreign bankruptcy laws may be more difficult to predict. In addition, we may determine that the cost of pursuing any claim may outweigh the recovery potential of such claim. As a result, broadening or protracted extension of an economic downturn could harm our business, revenue, results of operations and cash flows.
If we are unable to ensure that our products interoperate with a variety of operating systems and software applications that are developed by others, our platform may become less competitive and our results of operations may be harmed.
The number of people who access the Internet through mobile devices and access cloud-based software applications through mobile devices, including smartphones and handheld tablets or laptop computers, has increased significantly in the past few years and is expected to continue to increase. While we have created mobile applications and mobile versions of our products, if these mobile applications and products do not perform well, our business may suffer. We are also dependent on third-party application stores that may prevent us from timely updating our current products or uploading new products. In addition, our products interoperate with servers, mobile devices and software applications predominantly through the use of protocols, many of which are created and maintained by third parties. We therefore depend on the interoperability of our products with such third-party services, mobile devices and mobile operating systems, as well as cloud-enabled hardware, software, networking, browsers, database technologies and protocols that we do not control. Any changes in such technologies that degrade the functionality of our products or give preferential treatment to competitive services could adversely affect adoption and usage of our platform. Also, we may not be successful in developing or maintaining relationships with key participants in the mobile industry or in developing products that operate effectively with a range of operating systems, networks, devices, browsers, protocols and standards. In addition, we may face different fraud, security and regulatory risks from transactions sent from mobile devices than we do from personal computers. If we are unable to effectively anticipate and manage these risks, or if it is difficult for our customers to access and use our platform, our business, results of operations and financial condition may be harmed.
If we fail to enhance our brand cost-effectively, our ability to expand our customer base will be impaired and our business, results of operations and financial condition may suffer.
We believe that developing and maintaining awareness of our brand in a cost-effective manner is critical to achieving widespread acceptance of our existing and future products and is an important element in attracting new customers. Furthermore, we believe that the importance of brand recognition will increase as competition in our market increases. Successful promotion of our brand will depend largely on the effectiveness of our marketing efforts and on our ability to provide reliable and useful products at competitive prices. In the past, our efforts to build our brand have involved significant expenses. Brand promotion activities may not yield increased revenue, and even if they do, any increased revenue may not offset the expenses we incur in building our brand. If we fail to successfully promote and maintain our brand, or incur substantial expenses in an unsuccessful attempt to promote and maintain our brand, we may fail to attract new customers or retain our existing customers to the extent necessary to realize a sufficient return on our brand-building efforts, and our business, results of operations and financial condition could suffer.
Failure to effectively develop and expand our marketing and sales capabilities could harm our ability to increase our customer base and achieve broader market acceptance of our products.
Our ability to increase our customer base and achieve broader market acceptance of our products will depend to a significant extent on our ability to expand our marketing and sales operations. We plan to continue expanding our direct sales force and engaging additional channel partners, both domestically and internationally. This expansion will require us to invest significant financial and other resources. Our business will be harmed if our efforts do not generate a corresponding increase in revenue. We may not achieve anticipated revenue growth from expanding our direct sales force if we are unable to hire and develop talented direct sales personnel, if our new direct sales personnel are unable to achieve desired productivity levels in a reasonable period of time or if we are unable to retain our existing direct
21
sales personnel. We also may not achieve anticipated revenue growth from our channel partners if we are unable to attract and retain additional motivated channel partners, if any existing or future channel partners fail to successfully market, resell, implement or support our products for their customers, or if they represent multiple providers and devote greater resources to market, resell, implement and support the products and solutions of these other providers. For example, some of our channel partners also sell or provide integration and administration services for our competitors’ products, and if such channel partners devote greater resources to marketing, reselling and supporting competing products, this could harm our business, results of operations and financial condition.
Our ability to introduce new products and features is dependent on adequate research and development resources and our ability to successfully complete acquisitions. If we do not adequately fund our research and development efforts or complete acquisitions successfully, we may not be able to compete effectively and our business and results of operations may be harmed.
To remain competitive, we must continue to develop new products, applications and enhancements to our existing platform. This is particularly true as we further expand and diversify our capabilities. Maintaining adequate research and development resources, such as the appropriate personnel and development technology, to meet the demands of the market is essential. If we elect not to or are unable to develop products internally due to certain constraints, such as high employee turnover, lack of management ability or a lack of other research and development resources, we may choose to expand into a certain market or strategy via an acquisition for which we could potentially pay too much or fail to successfully integrate into our operations. Further, many of our competitors expend a considerably greater amount of funds on their respective research and development programs, and those that do not may be acquired by larger companies that would allocate greater resources to our competitors’ research and development programs. Our failure to maintain adequate research and development resources or to compete effectively with the research and development programs of our competitors would give an advantage to such competitors and may harm our business, results of operations and financial condition.
Interruptions or delays in the services provided by third-party data centers or internet service providers could impair the delivery of our platform and our business could suffer.
We host our platform using AWS data centers, a provider of cloud infrastructure services. All of our products utilize resources operated by us in these locations. Our operations depend on protecting the virtual cloud infrastructure hosted in AWS by maintaining its configuration, architecture and interconnection specifications, as well as the information stored in these virtual data centers and which third-party internet service providers transmit. Although we have disaster recovery plans that utilize multiple AWS locations, any incident affecting their infrastructure that may be caused by fire, flood, severe storm, earthquake, power loss, telecommunications failures, unauthorized intrusion, computer viruses and disabling devices, natural disasters, war, criminal act, military actions, terrorist attacks and other similar events beyond our control could negatively affect our platform. A prolonged AWS service disruption affecting our platform for any of the foregoing reasons could damage our reputation with current and potential customers, expose us to liability, cause us to lose customers or otherwise harm our business. We may also incur significant costs for using alternative equipment or taking other actions in preparation for, or in reaction to, events that damage the AWS services we use.
AWS enables us to order and reserve server capacity in varying amounts and sizes distributed across multiple regions. AWS provides us with computing and storage capacity pursuant to an agreement that continues until terminated by either party. AWS may terminate the agreement by providing 30 days prior written notice and may, in some cases, terminate the agreement immediately for cause upon notice.
Our platform is accessed by a large number of customers, often at the same time. As we continue to expand the number of our customers and products available to our customers, we may not be able to scale our technology to accommodate the increased capacity requirements, which may result in interruptions or delays in service. In addition, the failure of AWS data centers or third-party internet service providers to meet our capacity requirements could result in interruptions or delays in access to our platform or impede our ability to scale our operations. In the event that our AWS service agreements are terminated, or there is a lapse of service, interruption of internet service provider connectivity or damage to such facilities, we could experience interruptions in access to our platform as well as delays and additional expense in arranging new facilities and services.
22
Our success depends, in part, on the integrity and scalability of our systems and infrastructures. System interruption and the lack of integration, redundancy and scalability in these systems and infrastructures may harm our business, results of operations and financial condition.
Our success depends, in part, on our ability to maintain the integrity of our systems and infrastructure, including websites, information and related systems. System interruption and a lack of integration and redundancy in our information systems and infrastructure may adversely affect our ability to operate websites, process and fulfill transactions, respond to customer inquiries and generally maintain cost-efficient operations. We may experience occasional system interruptions that make some or all systems or data unavailable or prevent us from efficiently providing access to our platform. We also rely on third-party computer systems, broadband and other communications systems and service providers in connection with providing access to our platform generally. Any interruptions, outages or delays in our systems and infrastructure, our business and/or third parties, or deterioration in the performance of these systems and infrastructure, could impair our ability to provide access to our platform. Fire, flood, power loss, telecommunications failure, hurricanes, tornadoes, earthquakes, other natural disasters, acts of war or terrorism and similar events or disruptions may damage or interrupt computer, broadband or other communications systems and infrastructure at any time. Any of these events could cause system interruption, delays and loss of critical data, and could prevent us from providing access to our platform. While we have backup systems for certain aspects of their operations, disaster recovery planning by its nature cannot be sufficient for all eventualities. In addition, we may not have adequate insurance coverage to compensate for losses from a major interruption. If any of these events were to occur, it could harm our business, results of operations and financial condition.
We rely on software and services from other parties. Defects in or the loss of access to software or services from third parties could increase our costs and adversely affect the quality of our products.
We rely on technologies from third parties to operate critical functions of our business, including cloud infrastructure services and customer relationship management services. Our business would be disrupted if any of the third-party software or services we utilize, or functional equivalents thereof, were unavailable due to extended outages or interruptions or because they are no longer available on commercially reasonable terms or prices. In each case, we would be required to either seek licenses to software or services from other parties and redesign our products to function with such software or services or develop these components ourselves, which would result in increased costs and could result in delays in our product launches and the release of new product offerings until equivalent technology can be identified, licensed or developed, and integrated into our products. Furthermore, we might be forced to limit the features available in our current or future products. These delays and feature limitations, if they occur, could harm our business, results of operations and financial condition.
Real or perceived errors, failures, vulnerabilities or bugs in our products, including deployment complexity, could harm our business and results of operations.
Errors, failures, vulnerabilities or bugs may occur in our products, especially when updates are deployed or new products are rolled out. Our platform is often used in connection with large-scale computing environments with different operating systems, system management software, equipment and networking configurations, which may cause errors or failures of products, or other aspects of the computing environment into which our products are deployed. In addition, deployment of our products into complicated, large-scale computing environments may expose errors, failures, vulnerabilities or bugs in our products. Any such errors, failures, vulnerabilities or bugs may not be found until after they are deployed to our customers. Real or perceived errors, failures, vulnerabilities or bugs in our products could result in negative publicity, loss of customer data, loss of or delay in market acceptance of our products, loss of competitive position, or claims by customers for losses sustained by them, all of which could harm our business, results of operations and financial condition.
If we fail to adequately protect our proprietary rights, our competitive position could be impaired and we may lose valuable assets, generate less revenue and incur costly litigation to protect our rights.
Our success is dependent, in part, upon protecting our proprietary information and technology. We rely on a combination of patents, copyrights, trademarks, service marks, trade secret laws and contractual restrictions to establish and protect our proprietary rights. However, the steps we take to protect our intellectual property may be inadequate. We will not be able to protect our intellectual property if we are unable to enforce our rights or if we do not detect unauthorized use of our intellectual property. Despite our precautions, it may be possible for unauthorized third parties to copy our products and use information that we regard as proprietary to create products that compete with ours. Some license provisions protecting against unauthorized use, copying, transfer and disclosure of our products may be unenforceable under the laws of certain jurisdictions and foreign countries. Further, the laws of some countries do
23
not protect proprietary rights to the same extent as the laws of the United States, and mechanisms for enforcement of intellectual property rights in some foreign countries may be inadequate. To the extent we expand our international activities, our exposure to unauthorized copying and use of our products and proprietary information may increase. Accordingly, despite our efforts, we may be unable to prevent third parties from infringing upon or misappropriating our technology and intellectual property.
We rely in part on trade secrets, proprietary know-how and other confidential information to maintain our competitive position. Although we enter into confidentiality and invention assignment agreements with our employees and consultants and enter into confidentiality agreements with the parties with whom we have strategic relationships and business alliances, no assurance can be given that these agreements will be effective in controlling access to and distribution of our products and proprietary information. Further, these agreements do not prevent our competitors from independently developing technologies that are substantially equivalent or superior to our products.
To protect our intellectual property rights, we may be required to spend significant resources to monitor and protect these rights. Litigation may be necessary in the future to enforce our intellectual property rights and to protect our trade secrets. Such litigation could be costly, time consuming and distracting to management and could result in the impairment or loss of portions of our intellectual property. Furthermore, our efforts to enforce our intellectual property rights may be met with defenses, counterclaims and countersuits attacking the validity and enforceability of our intellectual property rights. Our inability to protect our proprietary technology against unauthorized copying or use, as well as any costly litigation or diversion of our management’s attention and resources, could delay further sales or the implementation of our products, impair the functionality of our products, delay introductions of new products, result in our substituting inferior or more costly technologies into our products, or injure our reputation. In addition, we may be required to license additional technology from third parties to develop and market new products, and we cannot assure you that we could license that technology on commercially reasonable terms or at all, and our inability to license this technology could harm our ability to compete.
Our results of operations may be harmed if we are subject to an infringement claim or a claim that results in a significant damage award.
We expect that software product developers will increasingly be subject to infringement claims as the number of products and competitors grows and the functionality of products in different industry segments overlaps. Other companies have claimed in the past, and may claim in the future, that we infringe upon their intellectual property rights. A claim may also be made relating to technology that we acquire or license from third parties. If we were subject to a claim of infringement, regardless of the merit of the claim or our defenses, the claim could:
• | require costly litigation to resolve and/or the payment of substantial damages or other amounts to settle such disputes; |
• | require significant management time; |
• | cause us to enter into unfavorable royalty or license agreements, if such arrangements are available at all; |
• | require us to discontinue the sale of some or all of our products, or to remove or reduce features or functionality of our products; |
• | require us to indemnify our customers or third-party service providers; and/or |
• | require us to expend additional development resources to redesign our products. |
Any one or more of the above could harm our business, results of operations and financial condition.
We use open source software in our products, which could negatively affect our ability to offer our products and subject us to litigation or other actions.
We use open source software in our products and may use more open source software in the future. From time to time, there have been claims challenging the ownership of open source software against companies that incorporate open source software into their products. However, the terms of many open source licenses have not been interpreted by U.S. courts, and there is a risk that these licenses could be construed in a way that could impose unanticipated conditions or restrictions on our ability to commercialize our products. As a result, we could be subject to lawsuits by parties claiming ownership of what we believe to be open source software. Litigation could be costly for us to defend, have a negative effect on our results of operations and financial condition or require us to devote additional research and development resources to change our products. In addition, if we were to combine our proprietary software products with open source software in a certain manner, we could, under certain of the open source licenses, be required to
24
release the source code of our proprietary software to the public. This would allow our competitors to create similar products with less development effort and time. If we inappropriately use open source software, or if the license terms for open source software that we use change, we may be required to re-engineer our products, incur additional costs, discontinue the sale of some or all of our products or take other remedial actions.
In addition to risks related to license requirements, usage of open source software can lead to greater risks than use of third-party commercial software, as open source licensors generally do not provide warranties or assurance of title or controls on origin of the software. In addition, many of the risks associated with usage of open source software, such as the lack of warranties or assurances of title, cannot be eliminated, and could, if not properly addressed, negatively affect our business. We have established processes to help alleviate these risks, including a review process for screening requests from our development organizations for the use of open source software, but we cannot be sure that all of our use of open source software is in a manner that is consistent with our current policies and procedures, or will not subject us to liability.
Indemnity provisions in various agreements potentially expose us to substantial liability for intellectual property infringement and other losses.
Our agreements with customers and other third parties may include indemnification or other provisions under which we agree to indemnify or otherwise be liable to them for losses suffered or incurred as a result of claims of intellectual property infringement, damages caused by us to property or persons, or other liabilities relating to or arising from the use of our platform or other acts or omissions. The term of these contractual provisions often survives termination or expiration of the applicable agreement. As we continue to grow, the possibility of infringement claims and other intellectual property rights claims against us may increase. For any intellectual property rights indemnification claim against us or our customers, we will incur significant legal expenses and may have to pay damages, settlement fees, license fees and/or stop using technology found to be in violation of the third party’s rights. Large indemnity payments could harm our business, results of operations and financial condition. We may also have to seek a license for the infringing or allegedly infringing technology. Such license may not be available on reasonable terms, if at all, and may significantly increase our operating expenses or may require us to restrict our business activities and limit our ability to deliver certain products. As a result, we may also be required to develop alternative non-infringing technology, which could require significant effort and expense and/or cause us to alter our platform, which could negatively affect our business.
From time to time, customers require us to indemnify or otherwise be liable to them for breach of confidentiality, violation of applicable law or failure to implement adequate security measures with respect to their data stored, transmitted, or accessed using our platform. Although we normally contractually limit our liability with respect to such obligations, the existence of such a dispute may have adverse effects on our customer relationship and reputation and we may still incur substantial liability related to them.
Any assertions by a third party, whether or not successful, with respect to such indemnification obligations could subject us to costly and time-consuming litigation, expensive remediation and licenses, divert management attention and financial resources, harm our relationship with that customer and other current and prospective customers, reduce demand for our platform, and harm our brand, business, results of operations and financial condition.
We may face particular privacy, data security and data protection risks in Europe due to the recent invalidation of the Safe Harbors Program and the new European General Data Protection Regulation.
In the European Community, Directive 95/46/EC, or the Directive, has required European Union member states to implement data protection laws to meet the strict privacy requirements of the Directive. Among other requirements, the Directive regulates transfers of personally identifiable data that is subject to the Directive, or Personal Data, to third countries, such as the United States, that have not been found to provide adequate protection to such Personal Data. Our customers have in the past relied upon our adherence to the U.S. Department of Commerce’s Safe Harbor Privacy Principles and compliance with the U.S.-EU and U.S.-Swiss Safe Harbor Frameworks as agreed to and set forth by the U.S. Department of Commerce, and the European Union and Switzerland, which established a means for legitimating the transfer of Personal Data by data controllers in the European Economic Area, or EEA, to the United States. As a result of the October 6, 2015 European Union Court of Justice, or ECJ, opinion in Case C-362/14 (Schrems v. Data Protection Commissioner) regarding the adequacy of the U.S.-EU Safe Harbor Framework, the U.S.-EU Safe Harbor Framework is no longer deemed to be a valid method of compliance with requirements set forth in the Directive (and member states’ implementations thereof) regarding the transfer of Personal Data outside of the EEA.
Negotiators from the European Union and United States reached political agreement on a successor to the Safe Harbor framework that will be referred to as the EU-US Privacy Shield. On May 26, 2016 the European Parliament
25
adopted a resolution and on July 8, 2016 the European Member States representatives approved the final version of the EU-US Privacy Shield, paving the way forward for the adoption of the decision by the European Commission. As of August 1, 2016, interested companies have been permitted to register for the program. There continue to be concerns about whether the Privacy Shield will face additional challenges. Until the remaining legal uncertainties regarding the future of the EU-US Privacy Shield are settled and we determine whether we will participate in the program, we will continue to face uncertainty as to whether our efforts to comply with our obligations under European privacy laws will be sufficient. If we are investigated by a European data protection authority, we may face fines and other penalties. Any such investigation or charges by European data protection authorities could have a negative effect on our existing business and on our ability to attract and retain new customers.
In light of the ECJ opinion in Case C-362/14, we offer our customers other methods to enable compliant data transfers from the EEA to the United States and have begun to undertake efforts to conform transfers of Personal Data from the EEA based on current regulatory obligations, the guidance of data protection authorities, and evolving best practices. Despite this, we may be unsuccessful in establishing conforming means or means that are acceptable to our customers of transferring such data from the EEA, including due to ongoing legislative activity, which may vary the current data protection landscape.
We may also experience hesitancy, reluctance, or refusal by European or multi-national customers to continue to use our services due to the potential risk exposure to such customers as a result of the ECJ ruling in Case C-362/14 and the current data protection obligations imposed on them by certain data protection authorities. Such customers may also view any alternative approaches to compliance as being too costly, too burdensome, too legally uncertain or otherwise objectionable and therefore decide not to do business with us.
We and our customers are at risk of enforcement actions taken by certain EU data protection authorities until such point in time that we may be able to ensure that all transfers of Personal Data to us in the United States from the EEA are conducted in compliance with all applicable regulatory obligations, the guidance of data protection authorities and evolving best practices. We may find it necessary to establish systems to maintain Personal Data originating from the European Union in the EEA, which may involve substantial expense and may cause us to need to divert resources from other aspects of our business, all of which may adversely affect our business.
In addition, data protection regulation is an area of increased focus and changing requirements. On April 27, 2016 the European Union adopted the General Data Protection Regulation 2016/679, or GDPR, that will take effect on May 25, 2018, replacing the current data protection laws of each EU member state. The GDPR applies to any company established in the EU as well as to those outside the EU if they collect and use personal data in connection with the offering of goods or services to individuals in the EU or the monitoring of their behavior. The GDPR enhances data protection obligations for processors and controllers of personal data, including, for example, expanded disclosures about how personal information is to be used, limitations on retention of information, mandatory data breach notification requirements and onerous new obligations on services providers. Non-compliance with the GDPR can trigger fines of up to €20 million or 4% of total worldwide annual turnover, whichever is higher. Given the breadth and depth of changes in data protection obligations, preparing to meet the GDPR’s requirements before its application on May 25, 2018 requires time, resources and a review of the technology and systems currently in use against the GDPR’s requirements. Separate EU laws and regulations (and member states’ implementations thereof) govern the protection of consumers and of electronic communications and these are also evolving. A draft of the new ePrivacy Regulation extends the strict opt-in marketing rules with limited exceptions to business-to-business communications, alters rules on third-party cookies, web beacons and similar technology and significantly increases penalties. We cannot yet determine the impact that such future laws, regulations, and standards may have on our business. Such laws and regulations are often subject to differing interpretations and may be inconsistent among jurisdictions. We may incur substantial expense in complying with the new obligations to be imposed by the GDPR and we may be required to make significant changes in our business operations and product and services development, all of which may adversely affect our revenues and our business overall.
We and our customers are at risk of enforcement actions taken by certain EU data protection authorities until such point in time that we may be able to ensure that all transfers of personal data to us from the EEA are conducted in compliance with all applicable regulatory obligations, the guidance of data protection authorities and evolving best practices. We may find it necessary to establish systems to maintain personal data originating from the EU in the EEA, which may involve substantial expense and may cause us to need to divert resources from other aspects of our business, all of which may adversely affect our business.
26
We function as a HIPAA Business Associate for certain of our customers and, as such, are subject to strict privacy and data security requirements. If we fail to comply with any of these requirements, we could be subject to significant liability, all of which can adversely affect our business as well as our ability to attract and retain new customers.
The Health Insurance Portability Act of 1996, as amended by the Health Information Technology for Economic and Clinical Health Act, or HITECH, and their respective implementing regulations, or HIPAA, imposes specified requirements relating to the privacy, security and transmission of individually identifiable health information. Among other things, HITECH makes HIPAA’s security standards directly applicable to business associates. We function as a business associate for certain of our customers that are HIPAA covered entities and service providers, and in that context we are regulated as a business associate for the purposes of HIPAA. If we are unable to comply with our obligations as a HIPAA business associate, we could face substantial civil and even criminal liability. Modifying the already stringent penalty structure that was present under HIPAA prior to HITECH, HITECH created four new tiers of civil monetary penalties and gave state attorneys general new authority to file civil actions for damages or injunctions in federal courts to enforce the federal HIPAA laws and seek attorneys’ fees and costs associated with pursuing federal civil actions. In addition, many state laws govern the privacy and security of health information in certain circumstances, many of which differ from HIPAA and each other in significant ways and may not have the same effect.
The HIPAA covered entities and service providers to which we provide services require us to enter into HIPAA-compliant business associate agreements with them. These agreements impose stringent data security obligations on us. If we are unable to meet the requirements of any of these business associate agreements, we could face contractual liability under the applicable business associate agreement as well as possible civil and criminal liability under HIPAA, all of which can have an adverse impact on our business and generate negative publicity, which, in turn, can have an adverse impact on our ability to attract and retain new customers.
We are subject to anti-corruption, anti-bribery and similar laws, and non-compliance with such laws can subject us to criminal penalties or significant fines and harm our business and reputation.
We are subject to anti-corruption and anti-bribery and similar laws, such as the U.S. Foreign Corrupt Practices Act of 1977, as amended, or the FCPA, the U.S. domestic bribery statute contained in 18 U.S.C. § 201, U.S. Travel Act, the USA PATRIOT Act, the U.K. Bribery Act 2010 and other anti-corruption, anti-bribery and anti-money laundering laws in countries in which we conduct activities. Anti-corruption and anti-bribery laws have been enforced aggressively in recent years and are interpreted broadly and prohibit companies and their employees and agents from promising, authorizing, making or offering improper payments or other benefits to government officials and others in the private sector. As we increase our international sales and business, our risks under these laws may increase. Noncompliance with these laws could subject us to investigations, sanctions, settlements, prosecution, other enforcement actions, disgorgement of profits, significant fines, damages, other civil and criminal penalties or injunctions, adverse media coverage and other consequences. Any investigations, actions or sanctions could harm our business, results of operations and financial condition.
We are subject to governmental export controls and economic sanctions laws that could impair our ability to compete in international markets and subject us to liability if we are not in full compliance with applicable laws.
Our business activities are subject to various restrictions under U.S. export controls and trade and economic sanctions laws, including the U.S. Commerce Department’s Export Administration Regulations and economic and trade sanctions regulations maintained by the U.S. Treasury Department’s Office of Foreign Assets Control. The U.S. export control laws and U.S. economic sanctions laws include prohibitions on the sale or supply of certain products and services to U.S. embargoed or sanctioned countries, governments, persons and entities and also require authorization for the export of encryption items. In addition, various countries regulate the import of certain encryption technology, including through import permitting and licensing requirements, and have enacted laws that could limit our ability to distribute our services or could limit our customers’ ability to implement our services in those countries. Although we take precautions to prevent our products from being provided in violation of such laws, our products may have been in the past, and could in the future be, provided inadvertently in violation of such laws, despite the precautions we take. If we fail to comply with these laws and regulations, we and certain of our employees could be subject to civil or criminal penalties, including the possible loss of export privileges and monetary penalties. Obtaining the necessary authorizations, including any required license, for a particular transaction may be time-consuming, is not guaranteed, and may result in the delay or loss of sales opportunities. Although we take precautions to prevent transactions with U.S. sanction targets, we could inadvertently provide our products to persons prohibited by U.S. sanctions. This could result in negative consequences to us, including government investigations, penalties and harm to our reputation.
27
We have limited experience with respect to determining the optimal prices for our products.
In the past, we have sometimes adjusted our prices either for individual customers in connection with long-term agreements or for a particular product. We expect that we may need to change our pricing in future periods. Further, as competitors introduce new products that compete with ours or reduce their prices, we may be unable to attract new customers or retain existing customers based on our historical pricing. As we expand internationally, we also must determine the appropriate price to enable us to compete effectively internationally. In addition, if our mix of products sold changes, then we may need to, or choose to, revise our pricing. As a result, we may be required or choose to reduce our prices or change our pricing model, which could harm our business, results of operations and financial condition.
We may face exposure to foreign currency exchange rate fluctuations.
Today, our international contracts are sometimes denominated in local currencies. However, the majority of our international costs are denominated in local currencies. Over time, an increasing portion of our international contracts may be denominated in local currencies. Therefore, fluctuations in the value of the U.S. dollar and foreign currencies may affect our results of operations when translated into U.S. dollars. We do not currently engage in currency hedging activities to limit the risk of exchange rate fluctuations. However, in the future, we may use derivative instruments, such as foreign currency forward and option contracts, to hedge certain exposures to fluctuations in foreign currency exchange rates. The use of such hedging activities may not offset any or more than a portion of the adverse financial effects of unfavorable movements in foreign exchange rates over the limited time the hedges are in place. Moreover, the use of hedging instruments may introduce additional risks if we are unable to structure effective hedges with such instruments.
Future acquisitions, strategic investments, partnerships or alliances could be difficult to identify and integrate, divert the attention of key management personnel, disrupt our business, dilute stockholder value and harm our results of operations and financial condition.
We have in the past acquired, and we may in the future seek to acquire or invest in, businesses, products or technologies that we believe could complement or expand our current platform, enhance our technical capabilities or otherwise offer growth opportunities. The pursuit of potential acquisitions may divert the attention of management and cause us to incur various expenses in identifying, investigating and pursuing suitable acquisitions, whether or not they are consummated. In addition, we have limited experience in acquiring other businesses. If we acquire additional businesses, we may not be able to successfully integrate and retain the acquired personnel, integrate the acquired operations and technologies, or effectively manage the combined business following the acquisition.
We may not be able to find and identify desirable acquisition targets or we may not be successful in entering into an agreement with any one target. Acquisitions could also result in dilutive issuances of equity securities or the incurrence of debt, or in adverse tax consequences or unfavorable accounting treatment, which could harm our results of operations. We may also experience delays or reductions in customer purchases for both us and the acquired business, disruption of partner relationships, claims and disputes with stockholders or third parties, unforeseen integration or other expenses, and future impairment of goodwill or other acquired intangible assets. In addition, if an acquired business fails to meet our expectations, our business, results of operations and financial condition may suffer.
Our customers may fail to pay us in accordance with the terms of their agreements, necessitating action by us to compel payment.
We typically enter into multiple year, non-cancelable arrangements with our customers. If customers fail to pay us under the terms of our agreements, we may be adversely affected both from the inability to collect amounts due and the cost of enforcing the terms of our contracts, including litigation. The risk of such negative effects increases with the term length of our customer arrangements. Furthermore, some of our customers may seek bankruptcy protection or other similar relief and fail to pay amounts due to us, or pay those amounts more slowly, either of which could adversely affect our business, results of operations and financial condition.
Because our long-term success depends, in part, on our ability to expand the sales of our products to customers located outside of the United States, our business will be susceptible to risks associated with international operations.
We currently maintain offices and have sales personnel outside the United States in the United Kingdom, Canada and Australia, and we intend to expand our international operations. In fiscal 2017 and 2018, our international revenue was 13% and 15%, respectively, of our total revenue. Any international expansion efforts that we may undertake may
28
not be successful. In addition, conducting international operations subjects us to new risks, some of which we have not generally faced in the United States. These risks include, among other things:
• | unexpected costs and errors in the localization of our products, including translation into foreign languages and adaptation for local practices and regulatory requirements; |
• | lack of familiarity and burdens of complying with foreign laws, legal standards, privacy standards, regulatory requirements, tariffs and other barriers; |
• | laws and business practices favoring local competitors or commercial parties; |
• | costs and liabilities related to compliance with the GDPR and disparate data privacy standards and enforcement; |
• | practical difficulties of enforcing intellectual property rights in countries with fluctuating laws and standards and reduced or varied protection for intellectual property rights in some countries; |
• | unexpected changes in regulatory requirements, taxes, trade laws, tariffs, export quotas, custom duties or other trade restrictions; |
• | difficulties in managing systems integrators and technology partners; |
• | differing technology standards; |
• | longer accounts receivable payment cycles and difficulties in collecting accounts receivable; |
• | difficulties in managing and staffing international operations and differing employer/employee relationships and local employment laws; |
• | fluctuations in exchange rates that may increase the volatility of our foreign-based revenue; and |
• | potentially adverse tax consequences, including the complexities of foreign value added tax (or other tax) systems and restrictions on the repatriation of earnings. |
Additionally, operating in international markets also requires significant management attention and financial resources. We cannot be certain that the investment and additional resources required in establishing operations in other countries will produce desired levels of revenue or profitability.
We have not engaged in currency hedging activities to limit risk of exchange rate fluctuations. Changes in exchange rates affect our costs and earnings, and may also affect the book value of our assets located outside the United States and the amount of our stockholders’ equity.
We have limited experience in marketing, selling and supporting our platform abroad. Our limited experience in operating our business internationally increases the risk that any potential future expansion efforts that we may undertake will not be successful. If we invest substantial time and resources to expand our international operations and are unable to do so successfully and in a timely manner, our business and results of operations will suffer.
We may be required to defer recognition of some of our revenue, which may harm our financial results in any given period.
We may be required to defer recognition of revenue for a significant period of time after entering into an agreement due to a variety of factors, including, among other things, whether:
• | the transaction involves both current products and products that are under development; |
• | the customer requires significant modifications, configurations or complex interfaces that could delay delivery or acceptance of our products; |
• | the transaction involves extended payment terms; |
• | the transaction involves acceptance criteria or other terms that may delay revenue recognition; or |
• | the transaction involves performance milestones or payment terms that depend upon contingencies. |
Because of these factors and other specific revenue recognition requirements under GAAP, we must have very precise terms in our contracts to recognize revenue when we initially provide access to our platform or perform services. Although we strive to enter into agreements that meet the criteria under GAAP for current revenue recognition on delivered elements, our agreements are often subject to negotiation and revision based on the demands of our
29
customers. The final terms of our agreements sometimes result in deferred revenue recognition well after the time of delivery, which may adversely affect our financial results in any given period. In addition, because of prevailing economic conditions, more customers may require extended payment terms, shorter term contracts or alternative licensing arrangements that could reduce the amount of revenue we recognize upon delivery of our platform and could adversely affect our short-term financial results.
Furthermore, the presentation of our financial results requires us to make estimates and assumptions that may affect revenue recognition. In some instances, we could reasonably use different estimates and assumptions, and changes in estimates are likely to occur from period to period. Accordingly, actual results could differ significantly from our estimates.
Our international operations may give rise to potentially adverse tax consequences.
We are expanding our international operations and staff to better support our growth into the international markets. Our corporate structure and associated transfer pricing policies anticipate future growth into the international markets. The amount of taxes we pay in different jurisdictions may depend on the application of the tax laws of the various jurisdictions, including the United States, to our international business activities, changes in tax rates, new or revised tax laws or interpretations of existing tax laws and policies and our ability to operate our business in a manner consistent with our corporate structure and intercompany arrangements. The taxing authorities of the jurisdictions in which we operate may challenge our methodologies for pricing intercompany transactions, which are generally required to be computed on an arm’s-length basis pursuant to intercompany arrangements or disagree with our determinations as to the income and expenses attributable to specific jurisdictions. If such a challenge or disagreement were to occur, and our position was not sustained, we could be required to pay additional taxes, interest and penalties, which could result in one-time tax charges, higher effective tax rates, reduced cash flows and lower overall profitability of our operations. Our financial statements could fail to reflect adequate reserves to cover such a contingency.
Changes in tax laws or regulations in the various tax jurisdictions we are subject to that are applied adversely to us or our customers could increase the costs of our products and harm our business.
New income, sales, use or other tax laws, statutes, rules, regulations or ordinances could be enacted at any time. Those enactments could harm our domestic and international business operations, and our business and financial performance. Further, existing tax laws, statutes, rules, regulations or ordinances could be interpreted, changed, modified or applied adversely to us. These events could require us or our customers to pay additional tax amounts on a prospective or retroactive basis, as well as require us or our customers to pay fines and/or penalties and interest for past amounts deemed to be due. If we raise our prices to offset the costs of these changes, existing and potential future customers may elect not to purchase our products in the future. Additionally, new, changed, modified or newly interpreted or applied tax laws could increase our customers’ and our compliance, operating and other costs, as well as the costs of our products. Further, these events could decrease the capital we have available to operate our business. Any or all of these events could harm our business and financial performance.
As a multinational organization, we may be subject to taxation in several jurisdictions around the world with increasingly complex tax laws, the application of which can be uncertain. The amount of taxes we pay in these jurisdictions could increase substantially as a result of changes in the applicable tax principles, including increased tax rates, new tax laws or revised interpretations of existing tax laws and precedents, which could harm our liquidity and results of operations. In addition, the authorities in these jurisdictions could review our tax returns and impose additional tax, interest and penalties, and the authorities could claim that various withholding requirements apply to us or our subsidiaries or assert that benefits of tax treaties are not available to us or our subsidiaries, any of which could harm us and our results of operations.
Comprehensive tax reform legislation could adversely affect our business and financial condition.
On December 22, 2017, President Trump signed into law the “Tax Cuts and Jobs Act” (“TCJA”) that significantly reforms the Internal Revenue Code of 1986, as amended (the “Code”). The TCJA, among other things, includes changes to U.S. federal tax rates, imposes significant additional limitations on the deductibility of interest and net operating loss carryforwards, allows for the expensing of capital expenditures, and puts into effect the migration from a “worldwide” system of taxation to a territorial system. We continue to examine the impact this tax reform legislation may have on our business. The impact of this tax reform is uncertain and could be adverse.
30
We depend on our executive officers and other key employees, and the loss of one or more of these employees or an inability to attract and retain other highly skilled employees could harm our business.
Our success depends largely upon the continued services of our executive officers and other key employees. We rely on our leadership team in the areas of research and development, operations, security, marketing, sales, customer support, general and administrative functions, and on individual contributors in our research and development and operations functions. From time to time, there may be changes in our executive management team resulting from the hiring or departure of executives, which could disrupt our business. We do not have employment agreements with our executive officers or other key personnel that require them to continue to work for us for any specified period and, therefore, they could terminate their employment with us at any time. The loss of one or more of our executive officers, especially our Chief Executive Officer or Chief Operating Officer, or key employees could harm our business. Changes in our executive management team may also cause disruptions in, and harm to, our business.
In addition, to execute our growth plan, we must attract and retain highly qualified personnel. Competition for these personnel in the San Francisco Bay Area, where our headquarters is located, and in other locations where we maintain offices, is intense, especially for engineers experienced in designing and developing software and SaaS applications and experienced sales professionals. We have, from time to time experienced, and we expect to continue to experience, difficulty in hiring and retaining employees with appropriate qualifications. Many of the companies with which we compete for experienced personnel have greater resources than we have. If we hire employees from competitors or other companies, their former employers may attempt to assert that these employees or we have breached their legal obligations, resulting in a diversion of our time and resources. In addition, job candidates and existing employees often consider the value of the equity awards they receive in connection with their employment. If the perceived value of our equity awards declines, it may harm our ability to recruit and retain highly skilled employees. If we fail to attract new personnel or fail to retain and motivate our current personnel, our business and future growth prospects could be harmed.
Our management team has limited experience managing a public company.
Most members of our management team have limited experience managing a publicly-traded company, interacting with public company investors, and complying with the increasingly complex laws pertaining to public companies. Our management team may not successfully or efficiently manage our transition to being a public company that is subject to significant regulatory oversight and reporting obligations under the federal securities laws and the continuous scrutiny of securities analysts and investors. These new obligations and constituents require significant attention from our senior management and could divert their attention away from the day-to-day management of our business, which could harm our business, results of operations and financial condition.
Our failure to raise additional capital or generate cash flows necessary to expand our operations and invest in new technologies in the future could reduce our ability to compete successfully and harm our results of operations.
We may need to raise additional funds, and we may not be able to obtain additional debt or equity financing on favorable terms, if at all. If we raise additional equity financing, our security holders may experience significant dilution of their ownership interests. If we engage in additional debt financing, we may be required to accept terms that restrict our ability to incur additional indebtedness, force us to maintain specified liquidity or other ratios or restrict our ability to pay dividends or make acquisitions. If we need additional capital and cannot raise it on acceptable terms, or at all, we may not be able to, among other things:
• | develop and enhance our products; |
• | continue to expand our product development, sales and marketing organizations; |
• | hire, train and retain employees; |
• | respond to competitive pressures or unanticipated working capital requirements; or |
• | pursue acquisition opportunities. |
In addition, access to our existing line of credit with Silicon Valley Bank is subject to certain financial and other covenants. Our inability to abide by these covenants or do any of the foregoing could reduce our ability to compete successfully and harm our business, results of operations and financial condition.
31
If we fail to maintain an effective system of disclosure controls and internal control over financial reporting, our ability to produce timely and accurate financial statements or comply with applicable regulations could be impaired.
The Sarbanes-Oxley Act requires, among other things, that we maintain effective disclosure controls and procedures and internal control over financial reporting. We are continuing to develop and refine our disclosure controls and other procedures that are designed to ensure that information required to be disclosed by us in the reports that we file with the Securities and Exchange Commission, or SEC, is recorded, processed, summarized, and reported within the time periods specified in SEC rules and forms and that information required to be disclosed in reports under the Securities Exchange Act of 1934, as amended, or the Exchange Act, is accumulated and communicated to our principal executive and financial officers. We are also continuing to improve our internal control over financial reporting. For example, we have worked to improve the controls around our key accounting processes and our quarterly close process, we have implemented a number of new systems to supplement our core ERP system as part of our control environment, and we have hired additional accounting and finance personnel to help us implement these processes and controls. In order to maintain and improve the effectiveness of our disclosure controls and procedures and internal control over financial reporting, we have expended, and anticipate that we will continue to expend, significant resources, including accounting-related costs and significant management oversight. If any of these new or improved controls and systems do not perform as expected, we may experience material weaknesses in our controls.
Our current controls and any new controls that we develop may become inadequate because of changes in conditions in our business. Further, weaknesses in our disclosure controls and internal control over financial reporting may be discovered in the future. Any failure to develop or maintain effective controls or any difficulties encountered in their implementation or improvement could harm our results of operations or cause us to fail to meet our reporting obligations and may result in a restatement of our financial statements for prior periods. Any failure to implement and maintain effective internal control over financial reporting also could adversely affect the results of periodic management evaluations and annual independent registered public accounting firm attestation reports regarding the effectiveness of our internal control over financial reporting that we will eventually be required to include in our periodic reports that are filed with the SEC. Ineffective disclosure controls and procedures and internal control over financial reporting could also cause investors to lose confidence in our reported financial and other information, which would likely have a negative effect on the trading price of our Class A common stock. In addition, if we are unable to continue to meet these requirements, we may not be able to remain listed on the NASDAQ. We are not currently required to comply with the SEC rules that implement Section 404 of the Sarbanes-Oxley Act and are therefore not required to make a formal assessment of the effectiveness of our internal control over financial reporting for that purpose. As a public company, we are required to provide an annual management report on the effectiveness of our internal control over financial reporting commencing with our second annual report on Form 10-K.
Our independent registered public accounting firm is not required to formally attest to the effectiveness of our internal control over financial reporting until after we are no longer an “emerging growth company” as defined in the JOBS Act. At such time, our independent registered public accounting firm may issue a report that is adverse in the event it is not satisfied with the level at which our internal control over financial reporting is documented, designed, or operating. Any failure to maintain effective disclosure controls and internal control over financial reporting could harm our business and results of operations and could cause a decline in the price of our Class A common stock.
Changes in existing financial accounting standards or practices, or taxation rules or practices, may harm our results of operations.
Changes in existing accounting or taxation rules or practices, new accounting pronouncements or taxation rules, or varying interpretations of current accounting pronouncements or taxation practice could harm our results of operations or the manner in which we conduct our business. Further, such changes could potentially affect our reporting of transactions completed before such changes are effective.
GAAP is subject to interpretation by the Financial Accounting Standards Board, the SEC and various bodies formed to promulgate and interpret appropriate accounting principles. A change in these principles or interpretations could have a significant effect on our reported financial results, and could affect the reporting of transactions completed before the announcement of a change. For example, in May 2014 the Financial Accounting Standards Board issued Accounting Standards Update No. 2014-09, Revenue from Contracts with Customers (Topic 606) (ASU 2014-09), for which certain elements may impact our accounting for revenue and costs incurred to acquire contracts. Under this new standard, revenue is recognized when a customer obtains control of promised goods or services and is recognized in an amount that reflects the consideration which the entity expects to receive in exchange for those goods or services. This new standard is effective for our interim and annual periods beginning February 1, 2018, and we expect this new
32
standard to have a material impact on the amount and timing of the costs incurred to acquire contracts. Refer to Note 2 in the notes to our consolidated financial statements included elsewhere in this Annual Report on Form 10-K for additional information on the new guidance and its potential impact on us. Adoption of this standard and any difficulties in implementation of changes in accounting principles, including the ability to modify our accounting systems, could cause us to fail to meet our financial reporting obligations, which could result in regulatory discipline and harm investors’ confidence in us.
If our estimates or judgments relating to our critical accounting policies prove to be incorrect, our results of operations could be adversely affected.
The preparation of financial statements in conformity with GAAP requires management to make estimates and assumptions that affect the amounts reported in our consolidated financial statements and accompanying notes. We base our estimates on historical experience and on various other assumptions that we believe to be reasonable under the circumstances, as provided in the section titled “Management’s Discussion and Analysis of Financial Condition and Results of Operations.” The results of these estimates form the basis for making judgments about the carrying values of assets, liabilities and equity, and the amount of revenue and expenses that are not readily apparent from other sources. Significant assumptions and estimates used in preparing our consolidated financial statements include those related to revenue recognition, capitalized internal-use software costs, income taxes, other non-income taxes, business combination and valuation of goodwill and purchased intangible assets and stock-based compensation. Our results of operations may be adversely affected if our assumptions change or if actual circumstances differ from those in our assumptions, which could cause our results of operations to fall below the expectations of securities analysts and investors, resulting in a decline in the trading price of our Class A common stock.
Catastrophic events may disrupt our business.
Natural disasters or other catastrophic events may cause damage or disruption to our operations, international commerce and the global economy, and thus could harm our business. We have a large employee presence in San Francisco, California and the west coast of the United States contains active earthquake zones. In the event of a major earthquake, hurricane or catastrophic event such as fire, power loss, telecommunications failure, cyber-attack, war or terrorist attack, we may be unable to continue our operations and may endure system interruptions, reputational harm, delays in our application development, lengthy interruptions in our products, breaches of data security and loss of critical data, all of which could harm our business, results of operations and financial condition. In addition, the insurance we maintain may not be adequate to cover our losses resulting from disasters or other business interruptions.
We may be subject to liability claims if we breach our contracts and our insurance may be inadequate to cover our losses.
We are subject to numerous obligations in our contracts with our customers and partners. Despite the procedures, systems and internal controls we have implemented to comply with our contracts, we may breach these commitments, whether through a weakness in these procedures, systems and internal controls, negligence or the willful act of an employee or contractor. Our insurance policies, including our errors and omissions insurance, may be inadequate to compensate us for the potentially significant losses that may result from claims arising from breaches of our contracts, disruptions in our services, including those caused by cybersecurity incidents, failures or disruptions to our infrastructure, catastrophic events and disasters or otherwise. In addition, such insurance may not be available to us in the future on economically reasonable terms, or at all. Further, our insurance may not cover all claims made against us and defending a suit, regardless of its merit, could be costly and divert management’s attention.
We are an “emerging growth company,” and the reduced disclosure requirements applicable to emerging growth companies may make our Class A common stock less attractive to investors.
We are an “emerging growth company,” as defined in the JOBS Act, and we take advantage of certain exemptions from various reporting requirements that are applicable to other public companies that are not “emerging growth companies,” including not being required to comply with the auditor attestation requirements of Section 404 of the Sarbanes-Oxley Act, reduced disclosure obligations regarding executive compensation in our periodic reports and proxy statements, and exemptions from the requirements of holding a nonbinding advisory vote on executive compensation and stockholder approval of any golden parachute payments not previously approved. We cannot predict if investors will find our Class A common stock less attractive because we will rely on these exemptions. If some investors find our Class A common stock less attractive as a result, there may be a less active trading market for our Class A common stock and the price of our Class A common stock may be more volatile.
33
Exposure to political developments in the United Kingdom, including the outcome of the U.K. referendum on membership in the EU, could harm us.
On June 23, 2016, a referendum was held on the United Kingdom’s membership in the European Union, the outcome of which was a vote in favor of leaving the European Union. The United Kingdom’s vote to leave the European Union creates an uncertain political and economic environment in the United Kingdom and potentially across other EU member states, which may last for a number of months or years.
The result of the referendum means that the long-term nature of the United Kingdom’s relationship with the European Union is unclear and that there is considerable uncertainty as to when any such relationship will be agreed and implemented. The political and economic instability created by the United Kingdom’s vote to leave the European Union has caused and may continue to cause significant volatility in global financial markets and the value of the British Pound or other currencies, including the Euro. Depending on the terms reached regarding any exit from the European Union, it is possible that there may be adverse practical or operational implications on our business.
Our business may be subject to additional obligations to collect and remit sales tax and other taxes, and we may be subject to tax liability for past sales. Any successful action by state, foreign or other authorities to collect additional or past sales tax could harm our business.
States and some local taxing jurisdictions have differing rules and regulations governing sales and use taxes, and these rules and regulations are subject to varying interpretations that may change over time. In particular, the applicability of sales taxes to our platform in various jurisdictions is unclear. It is possible that we could face sales tax audits and that our liability for these taxes could exceed our estimates as state tax authorities could still assert that we are obligated to collect additional amounts as taxes from our customers and remit those taxes to those authorities. We could also be subject to audits in states and international jurisdictions for which we have not accrued tax liabilities. A successful assertion that we should be collecting additional sales or other taxes on our services in jurisdictions where we have not historically done so and do not accrue for sales taxes could result in substantial tax liabilities for past sales, discourage customers from purchasing our products or otherwise harm our business, results of operations and financial condition.
We file sales tax returns in certain states within the United States as required by law and certain customer contracts for a portion of the products that we provide. We do not collect sales or other similar taxes in other states and many of such states do not apply sales or similar taxes to the vast majority of the products that we provide. However, one or more states or foreign authorities could seek to impose additional sales, use or other tax collection and record-keeping obligations on us or may determine that such taxes should have, but have not been, paid by us. Liability for past taxes may also include substantial interest and penalty charges. Any successful action by state, foreign or other authorities to compel us to collect and remit sales tax, use tax or other taxes, either retroactively, prospectively or both, could harm our business, results of operations and financial condition.
Our ability to use our net operating loss carry-forwards and certain other tax attributes may be limited.
Under Section 382 of the Internal Revenue Code of 1986, as amended, or the Code, if a corporation undergoes an “ownership change,” generally defined as a greater than 50% change (by value) in its equity ownership over a three year period, the corporation’s ability to use its pre-change net operating loss carry-forwards and other pre-change tax attributes, such as research tax credits, to offset its post-change income may be limited. We have experienced ownership changes in the past and any such ownership change in the future could result in increased future tax liability. In addition, we may experience ownership changes in the future as a result of subsequent shifts in our stock ownership. As a result, if we earn net taxable income, our ability to use our pre-change net operating loss carry-forwards to offset U.S. federal taxable income may be subject to limitations, which could potentially result in increased future tax liability to us.
Risks Related to Ownership of Our Class A Common Stock
The stock price of our Class A common stock may be volatile or may decline regardless of our operating performance.
Prior to our IPO, there was no public market for shares of our Class A common stock. The market prices of the securities of other newly public companies have historically been highly volatile. The market price of our Class A common stock may fluctuate significantly in response to numerous factors, many of which are beyond our control, including, but not limited to:
34
• | overall performance of the equity markets and/or publicly-listed technology companies; |
• | actual or anticipated fluctuations in our revenue or other operating metrics; |
• | changes in the financial projections we provide to the public or our failure to meet these projections; |
• | failure of securities analysts to initiate or maintain coverage of us, changes in financial estimates and/or recommendations by any securities analysts who follow our company, or our failure to meet the estimates or the expectations of investors; |
• | recruitment or departure of key personnel; |
• | significant security breaches, technical difficulties or interruptions of our services; |
• | the economy as a whole and market conditions in our industry; |
• | rumors and market speculation involving us or other companies in our industry; |
• | announcements by us or our competitors of significant innovations, acquisitions, strategic partnerships, joint ventures, or capital commitments; |
• | new laws or regulations or new interpretations of existing laws or regulations applicable to our business; |
• | lawsuits threatened or filed against us; |
• | other events or factors, including those resulting from war, incidents of terrorism, or responses to these events; and |
• | sales of additional shares of our Class A common stock by us, our directors, our officers or our stockholders. |
In addition, stock markets have experienced extreme price and volume fluctuations that have affected and continue to affect the market prices of equity securities of many companies. Stock prices of many companies have fluctuated in a manner unrelated or disproportionate to the operating performance of those companies. In the past, stockholders have instituted securities class action litigation following periods of market volatility. If we were to become involved in securities litigation, it could subject us to substantial costs, divert resources and the attention of management from our business, and harm our business.
The dual class structure of our common stock has the effect of concentrating voting control with those stockholders who held our capital stock prior to the completion of our IPO, including our directors, executive officers, and their affiliates, who held in the aggregate 59.0% of the voting power of our capital stock as of January 31, 2018. This will limit or preclude your ability to influence corporate matters, including the election of directors, amendments of our organizational documents, and any merger, consolidation, sale of all or substantially all of our assets, or other major corporate transaction requiring stockholder approval.
Our Class B common stock has ten votes per share, and our Class A common stock has one vote per share. As of January 31, 2018, our directors, executive officers, and their affiliates, held in the aggregate 59.0% of the voting power of our capital stock. Because of the ten-to-one voting ratio between our Class B and Class A common stock, the holders of our Class B common stock collectively could continue to control a majority of the combined voting power of our common stock and therefore be able to control all matters submitted to our stockholders for approval until April 12, 2027, the date that is the ten year anniversary of the closing of our IPO. This concentrated control may limit or preclude your ability to influence corporate matters for the foreseeable future, including the election of directors, amendments of our organizational documents, and any merger, consolidation, sale of all or substantially all of our assets, or other major corporate transaction requiring stockholder approval. In addition, this may prevent or discourage unsolicited acquisition proposals or offers for our capital stock that you may feel are in your best interest as one of our stockholders.
Future transfers by holders of Class B common stock will generally result in those shares converting to Class A common stock, subject to limited exceptions, such as certain transfers effected for estate planning purposes. The conversion of Class B common stock to Class A common stock will have the effect, over time, of increasing the relative voting power of those holders of Class B common stock who have retained their shares.
35
Sales of substantial amounts of our Class A common stock in the public markets, or the perception that sales might occur, could cause the market price of our Class A common stock to decline.
Sales of a substantial number of shares of our Class A common stock into the public market, particularly sales by our directors, executive officers, and principal stockholders, or the perception that these sales might occur, could cause the market price of our Class A common stock to decline.
In addition, as of January 31, 2018, we had 24,836,949 options outstanding that, if fully exercised, would result in the issuance of Class B common stock and 80,096 options outstanding that, if fully exercised, would result in the issuance of shares of Class A common stock. As of January 31, 2018, we also had 2,862,929 restricted stock units (“RSUs”) outstanding that, if vested and settled, would result in the issuance of shares of Class A common stock. All of the shares of Class A and Class B common stock issuable upon the exercise of stock options and vesting of RSUs and the shares reserved for future issuance under our equity incentive plans, are registered for public resale under the Securities Act. Accordingly, these shares will be able to be freely sold in the public market upon issuance, subject to applicable vesting requirements.
Furthermore, a substantial number of shares of our Class A common stock is reserved for issuance upon the exercise of the 2023 Notes (as defined below) and the warrants issued at the time of the issuance of the 2023 Notes. If we elect to satisfy our conversion obligation on the 2023 Notes solely in shares of our Class A common stock upon conversion of the notes, we will be required to deliver the shares of our Class A common stock, together with cash for any fractional share, on the second business day following the relevant conversion date.
As of January 31, 2018, the holders of approximately 21.5 million shares of our common stock have rights, subject to some conditions, to require us to file registration statements for the public resale of the Class A common stock issuable upon conversion of such shares or to include such shares in registration statements that we may file for us or other stockholders. Any registration statement we file to register additional shares, whether as a result of registration rights or otherwise, could cause the market price of our Class A common stock to decline or be volatile.
The requirements of being a public company may strain our resources, divert management’s attention, and affect our ability to attract and retain executive management and qualified board members.
We are subject to the reporting requirements of the Exchange Act, the listing standards of NASDAQ and other applicable securities rules and regulations. We expect that the requirements of these rules and regulations will continue to increase our legal, accounting, and financial compliance costs, make some activities more difficult, time-consuming, and costly, and place significant strain on our personnel, systems, and resources. For example, the Exchange Act requires, among other things, that we file annual, quarterly and current reports with respect to our business and results of operations. As a result of the complexity involved in complying with the rules and regulations applicable to public companies, our management’s attention may be diverted from other business concerns, which could harm our business, results of operations and financial condition. Although we have already hired additional employees to assist us in complying with these requirements, we may need to hire more employees in the future or engage outside consultants, which will increase our operating expenses.
In addition, changing laws, regulations and standards relating to corporate governance and public disclosure are creating uncertainty for public companies, increasing legal and financial compliance costs, and making some activities more time-consuming. These laws, regulations and standards are subject to varying interpretations, in many cases due to their lack of specificity, and, as a result, their application in practice may evolve over time as new guidance is provided by regulatory and governing bodies. This could result in continuing uncertainty regarding compliance matters and higher costs necessitated by ongoing revisions to disclosure and governance practices. We intend to invest substantial resources to comply with evolving laws, regulations and standards, and this investment may result in increased general and administrative expenses and a diversion of management’s time and attention from business operations to compliance activities. If our efforts to comply with new laws, regulations and standards differ from the activities intended by regulatory or governing bodies due to ambiguities related to their application and practice, regulatory authorities may initiate legal proceedings against us and our business may be harmed.
We also expect that being a public company and these new rules and regulations will make it more expensive for us to obtain director and officer liability insurance, and we may be required to accept reduced coverage or incur substantially higher costs to obtain coverage. These factors could also make it more difficult for us to attract and retain qualified members of our board of directors, particularly to serve on our audit committee and compensation committee, and qualified executive officers.
36
As a result of disclosure of information in filings required of a public company, our business and financial condition will become more visible, which may result in an increased risk of threatened or actual litigation, including by competitors and other third parties. If such claims are successful, our business and results of operations could be harmed, and even if the claims do not result in litigation or are resolved in our favor, these claims, and the time and resources necessary to resolve them, could divert the resources of our management and harm our business, results of operations and financial condition.
If securities or industry analysts do not publish or cease publishing research, or publish inaccurate or unfavorable research, about our business, the price of our Class A common stock and trading volume could decline.
The trading market for our Class A common stock will depend in part on the research and reports that securities or industry analysts publish about us or our business. If industry analysts do not publish or cease publishing research on our company, the trading price for our Class A common stock would be negatively affected. If one or more of the analysts who cover us downgrade our Class A common stock or publish inaccurate or unfavorable research about our business, our Class A common stock price would likely decline. If one or more of these analysts cease coverage of us or fail to publish reports on us on a regular basis, demand for our Class A common stock could decrease, which might cause our Class A common stock price and trading volume to decline.
We do not intend to pay dividends for the foreseeable future.
We have never declared or paid any cash dividends on our common stock and do not intend to pay any cash dividends in the foreseeable future. We anticipate that we will retain all of our future earnings for use in the operation of our business and for general corporate purposes. Any determination to pay dividends in the future will be at the discretion of our board of directors. Accordingly, investors must rely on sales of their Class A common stock after price appreciation, which may never occur, as the only way to realize any future gains on their investments. In addition, our credit facility contains restrictions on our ability to pay dividends.
Provisions in our charter documents and under Delaware law could make an acquisition of our company more difficult, limit attempts by our stockholders to replace or remove our current board of directors, and limit the market price of our Class A common stock.
Provisions in our amended and restated certificate of incorporation and amended and restated bylaws may have the effect of delaying or preventing a change of control or changes in our management. Our amended and restated certificate of incorporation and amended and restated bylaws include provisions that:
• | provide that our board of directors is classified into three classes of directors with staggered three-year terms; |
• | permit the board of directors to establish the number of directors and fill any vacancies and newly-created directorships; |
• | require super-majority voting to amend some provisions in our amended and restated certificate of incorporation and amended and restated bylaws; |
• | authorize the issuance of “blank check” preferred stock that our board of directors could use to implement a stockholder rights plan; |
• | provide that only the Chairperson of our board of directors, our Chief Executive Officer, or a majority of our board of directors are authorized to call a special meeting of stockholders; |
• | provide for a dual class common stock structure in which holders of our Class B common stock have the ability to control the outcome of matters requiring stockholder approval, even if they own significantly less than a majority of the outstanding shares of our Class A and Class B common stock, including the election of directors and significant corporate transactions, such as a merger or other sale of our company or its assets; |
• | prohibit stockholder action by written consent, which requires all stockholder actions to be taken at a meeting of our stockholders; |
• | provide that the board of directors is expressly authorized to make, alter or repeal our bylaws; and |
• | advance notice requirements for nominations for election to our board of directors or for proposing matters that can be acted upon by stockholders at annual stockholder meetings. |
37
Moreover, Section 203 of the Delaware General Corporation Law may discourage, delay, or prevent a change in control of our company. Section 203 imposes certain restrictions on mergers, business combinations, and other transactions between us and holders of 15% or more of our common stock.
Our amended and restated bylaws designate a state or federal court located within the State of Delaware as the exclusive forum for certain litigation that may be initiated by our stockholders, which could limit stockholders’ ability to obtain a favorable judicial forum for disputes with us.
Our amended and restated bylaws provide that the Court of Chancery of the State of Delaware will be the exclusive forum for:
• | any derivative action or proceeding brought on our behalf; |
• | any action asserting a breach of fiduciary duty; |
• | any action asserting a claim against us arising pursuant to the Delaware General Corporation Law, our amended and restated certificate of incorporation, or our amended and restated bylaws; or |
• | or any action asserting a claim against us that is governed by the internal affairs doctrine. |
This choice of forum provision may limit a stockholder’s ability to bring a claim in a judicial forum that it finds favorable for disputes with us or any of our directors, officers, or other employees, which may discourage lawsuits with respect to such claims. Alternatively, if a court were to find the choice of forum provision contained in our amended and restated certificate of incorporation to be inapplicable or unenforceable in an action, we may incur additional costs associated with resolving such action in other jurisdictions, which could harm our business, results of operations and financial condition.
Risks Related to our Outstanding Convertible Notes
Servicing our debt may require a significant amount of cash. We may not have sufficient cash flow from our business to pay our indebtedness, and we may not have the ability to raise the funds necessary to settle for cash conversions of the 2023 Notes or to repurchase the 2023 Notes for cash upon a fundamental change, which could adversely affect our business and results of operations.
In February 2018, we issued $345 million aggregate principal amount of 0.25% convertible senior notes due 2023, or the 2023 Notes, in a private offering. The interest rate is fixed at 0.25% per annum and is payable semi-annually in arrears on February 15 and August 15 of each year, beginning on August 15, 2018. Our ability to make scheduled payments of the principal of, to pay interest on or to refinance our indebtedness, including the 2023 Notes, depends on our future performance, which is subject to economic, financial, competitive and other factors beyond our control. Our business may not generate cash flow from operations in the future sufficient to service our debt and make necessary capital expenditures. If we are unable to generate such cash flow, we may be required to adopt one or more alternatives, such as selling assets, restructuring debt or obtaining additional debt financing or equity capital on terms that may be onerous or highly dilutive. Our ability to refinance any future indebtedness will depend on the capital markets and our financial condition at such time. We may not be able to engage in any of these activities or engage in these activities on desirable terms, which could result in a default on our debt obligations. In addition, any of our future debt agreements may contain restrictive covenants that may prohibit us from adopting any of these alternatives. Our failure to comply with these covenants could result in an event of default which, if not cured or waived, could result in the acceleration of our debt.
In addition, holders of the 2023 Notes have the right to require us to repurchase their 2023 Notes upon the occurrence of a fundamental change (as defined in the indenture governing the 2023 Notes) at a repurchase price equal to 100% of the principal amount of the 2023 Notes to be repurchased, plus accrued and unpaid interest, if any. Upon conversion of the 2023 Notes, unless we elect to deliver solely shares of our Class A common stock to settle such conversion (other than paying cash in lieu of delivering any fractional share), we will be required to make cash payments in respect of the 2023 Notes being converted. We may not have enough available cash or be able to obtain financing at the time we are required to make repurchases of 2023 Notes surrendered therefor or 2023 Notes being converted. In addition, our ability to repurchase the 2023 Notes or to pay cash upon conversions of the 2023 Notes may be limited by law, by regulatory authority or by agreements governing our future indebtedness. Our failure to repurchase 2023 Notes at a time when the repurchase is required by the indenture governing the notes or to pay any cash payable on future conversions of the 2023 Notes as required by such indenture would constitute a default under such indenture. A default under the indenture or the fundamental change itself could also lead to a default under
38
agreements governing our future indebtedness. If the repayment of the related indebtedness were to be accelerated after any applicable notice or grace periods, we may not have sufficient funds to repay the indebtedness and repurchase the 2023 Notes or make cash payments upon conversions thereof.
In addition, our indebtedness, combined with our other financial obligations and contractual commitments, could have other important consequences. For example, it could:
• | make us more vulnerable to adverse changes in general U.S. and worldwide economic, industry and competitive conditions and adverse changes in government regulation; |
• | limit our flexibility in planning for, or reacting to, changes in our business and our industry; |
• | place us at a disadvantage compared to our competitors who have less debt; |
• | limit our ability to borrow additional amounts to fund acquisitions, for working capital and for other general corporate purposes; and |
• | make an acquisition of our company less attractive or more difficult. |
Any of these factors could harm our business, results of operations and financial condition. In addition, if we incur additional indebtedness, the risks related to our business and our ability to service or repay our indebtedness would increase.
The conditional conversion feature of the 2023 Notes, if triggered, may adversely affect our financial condition and operating results.
In the event the conditional conversion feature of the 2023 Notes is triggered, holders of 2023 Notes will be entitled to convert the 2023 Notes at any time during specified periods at their option. If one or more holders elect to convert their 2023 Notes, unless we elect to satisfy our conversion obligation by delivering solely shares of our Class A common stock (other than paying cash in lieu of delivering any fractional share), we would be required to settle a portion or all of our conversion obligation through the payment of cash, which could adversely affect our liquidity. In addition, even if holders do not elect to convert their 2023 Notes, we could be required under applicable accounting rules to reclassify all or a portion of the outstanding principal of the notes as a current rather than long-term liability, which would result in a material reduction of our net working capital.
Transactions relating to our 2023 Notes may affect the value of our Class A common stock.
The conversion of some or all of the 2023 Notes would dilute the ownership interests of existing stockholders to the extent we satisfy our conversion obligation by delivering shares of our Class A common stock upon any conversion of such 2023 Notes. Our 2023 Notes may become in the future convertible at the option of their holders under certain circumstances. If holders of our 2023 Notes elect to convert their notes, we may settle our conversion obligation by delivering to them a significant number of shares of our Class A common stock, which would cause dilution to our existing stockholders.
In addition, in connection with the issuance of the 2023 Notes, we entered into convertible note hedge transactions with certain financial institutions (the "Option Counterparties"). We also entered into warrant transactions with the Option Counterparties pursuant to which we sold warrants for the purchase of our Class A common stock. The convertible note hedge transactions are expected generally to reduce the potential dilution to our Class A common stock upon any conversion or settlement of the 2023 Notes and/or offset any cash payments we are required to make in excess of the principal amount of converted 2023 Notes, as the case may be. The warrant transactions could separately have a dilutive effect to the extent that the market price per share of our Class A common stock exceeds the strike price of any warrants unless, subject to the terms of the warrant transactions, we elect to cash settle the warrants.
From time to time, the Option Counterparties or their respective affiliates may modify their hedge positions by entering into or unwinding various derivative transactions with respect to our Class A common stock and/or purchasing or selling our Class A common stock or other securities of ours in secondary market transactions prior to the maturity of the 2023 Notes. This activity could cause a decrease in the market price of our Class A common stock.
39
The accounting method for convertible debt securities that may be settled in cash, such as the 2023 Notes, could have a material effect on our reported financial results.
Under Financial Accounting Standards Board Accounting Standards Codification 470-20, Debt with Conversion and Other Options, which we refer to as ASC 470-20, an entity must separately account for the liability and equity components of convertible debt instruments (such as the 2023 Notes) that may be settled entirely or partially in cash upon conversion in a manner that reflects the issuer’s economic interest cost. ASC 470-20 requires the value of the conversion option of the 2023 Notes, representing the equity component, to be recorded as additional paid-in capital within stockholders’ equity in our consolidated balance sheet and as a discount to the 2023 Notes, which reduces their initial carrying value. The carrying value of the 2023 Notes, net of the discount recorded, will be accreted up to the principal amount of the 2023 Notes from the issuance date until maturity, which will result in non-cash charges to interest expense in our consolidated statement of operations. Accordingly, we will report lower net income or higher net loss in our financial results because ASC 470-20 requires interest to include both the current period’s accretion of the debt discount and the instrument’s coupon interest, which could adversely affect our reported or future financial results, the trading price of our Class A common stock and the trading price of the 2023 Notes.
In addition, under certain circumstances, convertible debt instruments (such as the 2023 Notes) that may be settled entirely or partly in cash are currently accounted for utilizing the treasury stock method, the effect of which is that the shares issuable upon conversion of the 2023 Notes are not included in the calculation of diluted earnings per share except to the extent that the conversion value of the 2023 Notes exceeds their principal amount. Under the treasury stock method, for diluted earnings per share purposes, the transaction is accounted for as if the number of shares of Class A common stock that would be necessary to settle such excess, if we elected to settle such excess in shares, are issued. We cannot be sure that the accounting standards in the future will continue to permit the use of the treasury stock method. If we are unable to use the treasury stock method in accounting for the shares issuable upon conversion of the 2023 Notes, then our diluted earnings per share would be harmed.
Item 1B. Unresolved Staff Comments
None.
Item 2. Properties
Our corporate headquarters is located in San Francisco, California, where we currently lease approximately 128,000 square feet under lease agreements that expire at various times from 2019 through 2024.
In December 2017, we entered into an office lease to lease approximately 207,066 rentable square feet in an office building in San Francisco, California expected to become our new corporate headquarters. This lease has a 10 year term, which is expected to expire in October 2028. The Company is entitled to two five-year options to extend this lease, subject to certain requirements.
We also lease facilities in Bellevue, Washington; San Jose, California; Toronto, Canada; London, United Kingdom; and Sydney, Australia. These office leases expire on various dates through August 2024.
We believe that our facilities are suitable to meet our current needs. We intend to expand our facilities or add new facilities as we add employees and enter new geographic markets, and we believe that suitable additional or alternative space will be available as needed to accommodate any such growth.
Item 3. Legal Proceedings
From time to time in the normal course of business, the Company may be subject to various legal matters such as threatened or pending claims or proceedings. There were no material such matters as of January 31, 2018.
Item 4. Mine Safety Disclosures
Not Applicable.
40
Part II
Item 5. Market for Registrant's Common Equity, Related Stockholder Matters and Issuer Purchases of Equity Securities
Market Price of Our Class A Common Stock
Our Class A common stock has been listed on the NASDAQ Global Select Market under the symbol "OKTA" since April 7, 2017. Prior to that date, there was no public trading market for our Class A common stock. The following table sets forth for the periods indicated the high and low sale prices per share of our Class A common stock as reported on the NASDAQ Global Select Market:
Low | High | |||||||
Fiscal year ending January 31, 2018 | ||||||||
First Quarter (from April 7, 2017) | $ | 22.60 | $ | 26.90 | ||||
Second Quarter | 21.66 | 28.25 | ||||||
Third Quarter | 21.52 | 33.64 | ||||||
Fourth Quarter | 24.93 | 31.80 | ||||||
As of March 7, 2018, we had 185 holders of record of our Class A and Class B common stock. The actual number of stockholders is greater than this number of record holders and includes stockholders who are beneficial owners but whose shares are held in street name by brokers and other nominees.
Dividend Policy
We have never declared or paid cash dividends on our capital stock. We currently intend to retain any future earnings for use in the operation of our business and do not intend to declare or pay any cash dividends in the foreseeable future. Any further determination to pay dividends on our capital stock will be at the discretion of our board of directors, subject to applicable laws, and will depend on our financial condition, results of operations, capital requirements, general business conditions and other factors that our board of directors considers relevant.
Stock Performance Graph
This performance graph shall not be deemed "soliciting material" or to be "filed" with the SEC for purposes of Section 18 of the Securities Exchange Act of 1934, as amended (the "Exchange Act"), or otherwise subject to the liabilities under that Section, and shall not be deemed to be incorporated by reference into any filing of Okta Inc. under the Securities Act or the Exchange Act.
We have presented below the cumulative total return to our stockholders between April 7, 2017 (the date our Class A common stock commenced trading on the NASDAQ) through January 31, 2018 in comparison to the Standard & Poor’s 500 Index and Standard & Poor Information Technology Index. All values assume a $100 initial investment and data for the Standard & Poor’s 500 Index and Standard & Poor Information Technology Index assume reinvestment of dividends. The comparisons are based on historical data and are not indicative of, nor intended to forecast, the future performance of our Class A common stock.
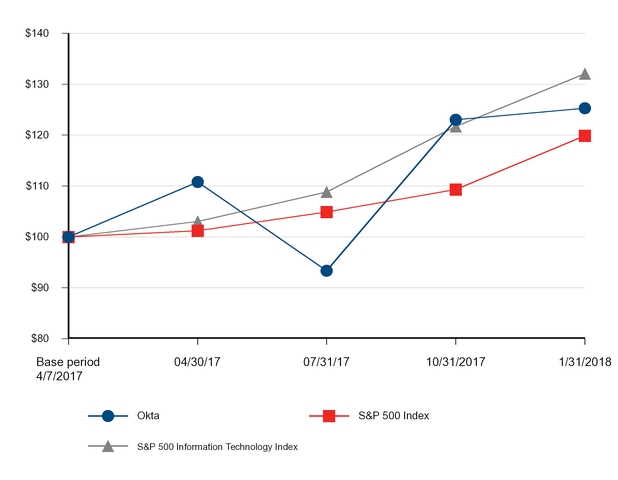
Company/Index | Base period 4/7/2017 | 4/30/2017 | 7/31/2017 | 10/31/2017 | 1/31/2018 | |||||||||||||||
Okta | $ | 100.00 | $ | 110.80 | $ | 93.36 | $ | 123.01 | $ | 125.27 | ||||||||||
S&P 500 Index | 100.00 | 101.22 | 104.87 | 109.33 | 119.88 | |||||||||||||||
S&P 500 Information Technology Index | 100.00 | 103.04 | 108.82 | 121.68 | 132.07 | |||||||||||||||
Securities Authorized for Issuance under Equity Compensation Plans
The information required by this item with respect to our equity compensation plans is incorporated by reference to our Proxy Statement for the 2018 Annual Meeting of Stockholders to be filed with the Securities and Exchange Commission within 120 days of the fiscal year ended January 31, 2018.
Unregistered Sales of Equity Securities and Use of Proceeds
(a) | Unregistered Sales of Equity Securities |
From February 1, 2017 through January 31, 2018, we issued and sold to our employees and non-employees an aggregate of 926,931 unregistered shares of common stock upon the exercise of options issued under our 2009 Plan at exercise prices ranging from $0.48 to $10.52 per share, for an aggregate exercise price of $2.5 million. From February 1, 2017 through January 31, 2018, we granted to our employees, consultants and other service providers restricted stock awards for an aggregate of 598,500 shares of common stock under our 2009 Plan.
From February 1, 2017 through January 31, 2018, we issued 1,000,000 shares of our common stock in connection with a business combination.
42
From February 1, 2017 through January 31, 2018, we issued 194,951 shares of our common stock to Silicon Valley Bank in connection with the net exercise of warrants.
We believe these transactions were exempt from registration under the Securities Act of 1933 in reliance upon Section 4(a)(2) of the Securities Act or Regulation D promulgated thereunder, or Rule 701 promulgated under Section 3(b) of the Securities Act as transactions by an issuer not involving any public offering or pursuant to benefit plans and contracts relating to compensation as provided under Rule 701. The recipients of the securities in each of these transactions represented their intentions to acquire the securities for investment only and not with a view to or for sale in connection with any distribution thereof. All recipients had adequate access, through their relationships with us, to information about Okta.
(b) | Use of Proceeds from Public Offering of Class A Common Stock |
On April 7, 2017, we closed our initial public offering, in which we sold 12,650,000 shares of Class A common stock at a price to the public of $17.00 per share, including shares sold in connection with the exercise of the underwriters’ option to purchase additional shares. The offer and sale of all of the shares in the IPO were registered under the Securities Act pursuant to a registration statement on Form S-1 (File No. 333-216654), which was declared effective by the SEC on April 6, 2017. We raised $200.0 million in net proceeds after deducting underwriters’ discounts and commissions of $15.1 million and before deducting offering expenses of approximately $5.6 million. There has been no material change in the planned use of proceeds from our IPO as described in our final prospectus filed with the SEC on April 7, 2017 pursuant to Rule 424(b). The managing underwriters of our IPO were Goldman, Sachs & Co., J.P. Morgan and Allen & Company LLC. No payments were made by us to directors, officers or persons owning ten percent or more of our common stock or to their associates, or to our affiliates, other than payments in the ordinary course of business to officers for salaries and to non-employee directors pursuant to our director compensation policy. Pending the uses described, we have invested or intend to invest the net proceeds in short-term interest-bearing investment-grade securities, certificates of deposit or government securities, pursuant to the investment policy approved by our board of directors.
(c) | Issuer Purchases of Equity Securities |
None.
43
SELECTED CONSOLIDATED FINANCIAL DATA AND OTHER DATA
The following selected consolidated statements of operations data for the years ended January 31, 2018, 2017 and 2016 and the consolidated balance sheet data as of January 31, 2018 and 2017 have been derived from our audited consolidated financial statements included elsewhere in this Annual Report on Form 10-K. Our historical results are not necessarily indicative of the results that may be expected in the future. You should read the following selected consolidated financial data and other data below in conjunction with the section titled “Management’s Discussion and Analysis of Financial Condition and Results of Operations” and our consolidated financial statements and related notes included elsewhere in this Annual Report on Form 10-K.
Year Ended January 31, | |||||||||||
2018 | 2017 | 2016 | |||||||||
(in thousands, except per share data) | |||||||||||
Revenue | |||||||||||
Subscription | $ | 239,177 | $ | 143,136 | $ | 76,443 | |||||
Professional services and other | 20,813 | 17,190 | 9,464 | ||||||||
Total revenue | 259,990 | 160,326 | 85,907 | ||||||||
Cost of revenue | |||||||||||
Subscription(1) | 52,481 | 34,211 | 20,684 | ||||||||
Professional services and other(1) | 28,274 | 21,738 | 15,340 | ||||||||
Total cost of revenue | 80,755 | 55,949 | 36,024 | ||||||||
Gross profit | 179,235 | 104,377 | 49,883 | ||||||||
Operating expenses | |||||||||||
Research and development(1) | 70,821 | 38,659 | 28,761 | ||||||||
Sales and marketing(1) | 172,973 | 118,742 | 77,915 | ||||||||
General and administrative(1) | 51,803 | 30,099 | 19,195 | ||||||||
Total operating expenses | 295,597 | 187,500 | 125,871 | ||||||||
Operating loss | (116,362 | ) | (83,123 | ) | (75,988 | ) | |||||
Other income (expense), net | 1,682 | 39 | (19 | ) | |||||||
Loss before provision for (benefit from) income taxes | (114,680 | ) | (83,084 | ) | (76,007 | ) | |||||
Provision for (benefit from) income taxes | (321 | ) | 425 | 295 | |||||||
Net loss | $ | (114,359 | ) | $ | (83,509 | ) | $ | (76,302 | ) | ||
Net loss per share(2): | |||||||||||
Basic and diluted | $ | (1.38 | ) | $ | (4.39 | ) | $ | (4.28 | ) | ||
Weighted-average shares outstanding used to compute net loss per share(2): | |||||||||||
Basic and diluted | 83,004 | 19,038 | 17,817 | ||||||||
(1) | Amounts include stock-based compensation expense as follows: |
Year Ended January 31, | |||||||||||
2018 | 2017 | 2016 | |||||||||
(in thousands) | |||||||||||
Cost of subscription revenue | $ | 4,600 | $ | 1,979 | $ | 909 | |||||
Cost of professional services and other revenue | 3,137 | 1,283 | 553 | ||||||||
Research and development | 18,107 | 2,992 | 1,748 | ||||||||
Sales and marketing | 13,242 | 6,029 | 2,853 | ||||||||
General and administrative | 10,774 | 4,844 | 3,769 | ||||||||
Total stock-based compensation expense | $ | 49,860 | $ | 17,127 | $ | 9,832 | |||||
(2) | Please refer to Note 13 to our consolidated financial statements for an explanation of the method used to compute the historical net loss per share and the number of shares used in the computation of the per share amounts. |
44
As of January 31, | |||||||
2018 | 2017 | ||||||
(in thousands) | |||||||
Consolidated Balance Sheet Data: | |||||||
Cash, cash equivalents and short-term investments | $ | 229,714 | $ | 37,672 | |||
Working capital | 124,656 | (41,706 | ) | ||||
Total assets | 367,397 | 130,635 | |||||
Deferred revenue, current and non-current portion | 168,667 | 113,723 | |||||
Redeemable convertible preferred stock warrant liability | — | 304 | |||||
Redeemable convertible preferred stock | — | 227,954 | |||||
Total stockholders’ equity (deficit) | 163,586 | (243,605 | ) | ||||
Other Financial Measures and Key Metrics (1)
Year Ended January 31, | |||||||||||
2018 | 2017 | 2016 | |||||||||
(dollars in thousands) | |||||||||||
Gross profit | $ | 179,235 | $ | 104,377 | $ | 49,883 | |||||
Non-GAAP gross profit | $ | 186,976 | $ | 107,829 | $ | 51,535 | |||||
Gross margin | 69 | % | 65 | % | 58 | % | |||||
Non-GAAP gross margin | 72 | % | 67 | % | 60 | % | |||||
Operating loss | $ | (116,362 | ) | $ | (83,123 | ) | $ | (75,988 | ) | ||
Non-GAAP operating loss | $ | (65,744 | ) | $ | (65,806 | ) | $ | (65,935 | ) | ||
Operating margin | (45 | )% | (52 | )% | (89 | )% | |||||
Non-GAAP operating margin | (25 | )% | (41 | )% | (77 | )% | |||||
Net cash used in operating activities | $ | (25,240 | ) | $ | (42,101 | ) | $ | (41,536 | ) | ||
Net cash provided by (used in) investing activities | $ | (99,704 | ) | $ | 6,965 | $ | 1,160 | ||||
Net cash provided by financing activities | $ | 237,408 | $ | 457 | $ | 76,841 | |||||
Free cash flow | $ | (37,221 | ) | $ | (53,843 | ) | $ | (48,237 | ) | ||
Customers (period end) | 4,375 | 3,114 | 2,225 | ||||||||
Calculated billings | $ | 314,934 | $ | 194,524 | $ | 118,023 | |||||
Dollar-based retention rate for the trailing 12 months ended | 121 | % | 123 | % | 120 | % | |||||
(1) | A reconciliation for each non-GAAP financial measure is included in the "Non-GAAP Financial Measures" section of Item 7 "Management's Discussion and Analysis of Financial Condition and Results of Operations" of this Annual Report on Form 10-K. |
45
Item 7. MANAGEMENT’S DISCUSSION AND ANALYSIS OF FINANCIAL CONDITION AND RESULTS OF OPERATIONS
The following discussion and analysis of our financial condition and results of operations should be read in conjunction with our consolidated financial statements and related notes appearing elsewhere in this Annual Report on Form 10-K. In addition to historical financial information, the following discussion contains forward-looking statements that is based upon current plans, expectations and beliefs that involve risks and uncertainties. Our actual results may differ materially from those anticipated in these forward-looking statements as a result of various factors, including those set forth under the section titled “Risk Factors” under Part I, Item 1A in this Annual Report on Form 10-K. Our fiscal year ends January 31.
Overview
Okta is the leading independent provider of identity for the enterprise. The Okta Identity Cloud is our category-defining platform that enables our customers to securely connect people to technology, anywhere, anytime and from any device. Every day, people use Okta to securely access a wide range of cloud applications, websites, mobile applications and services from a multitude of devices. Workforces sign into our platform to seamlessly access the applications they need to do their most important work. Organizations use our platform to provide their customers with more modern experiences online and via mobile devices, and to connect with partners to streamline their operations. Developers leverage our platform to securely embed identity into their software.
Our approach to identity eliminates duplicative, sprawling credentials and disparate authentication policies, allowing our customers to simplify and scale their IT and security infrastructures more efficiently as the number of users, devices, clouds and other technologies in their ecosystem grows. Our customers are able to achieve fast time to value, lower costs and increased efficiency while improving compliance and providing security that is persistent, perimeter-less and context-aware. These benefits are delivered through multiple products on a unified platform, our superior cloud architecture and a vast and increasing network of integrations.
We founded the company in 2009 to reinvent identity for the modern cloud era, where identity is the critical foundation for connection and trust between users and technology. Since our inception, we have consistently innovated to enhance our platform and our product offerings.
In parallel to this product innovation, we have rapidly expanded the breadth and depth of the Okta Integration Network, which provides customers with a pre-integrated set of cloud, mobile and web applications that spans the functionality of our products. As of January 31, 2018, we had over 5,500 integrations with cloud, mobile and web applications and IT infrastructure providers.
We employ a SaaS business model. We focus on acquiring and retaining our customers and increasing their spending with us through expanding the number of users who access our platform and up-selling additional products. We sell our products directly through our field and inside sales teams, as well as indirectly through our network of ISVs and channel partners. Our subscription fees include the use of our service and our technical support and management of our platform. We base subscription fees primarily on the products used and the number of users on our platform. We generate subscription fees pursuant to noncancelable contracts with a weighted-average duration of 2.4 years as of January 31, 2018. Our customers use our platform to manage and secure their extended enterprise (employees, contractors and partners), which we previously referred to as the internal use case. Organizations also use our platform to manage and secure their customers' identities via the powerful APIs we have developed, which we previously referred to as the external use case. We typically invoice customers in advance in annual installments for subscriptions to our platform.
Financial Information and Segments
We operate our business as one reportable segment. Our revenue has grown significantly. For the years ended January 31, 2018, 2017 and 2016, our revenue was $260.0 million, $160.3 million and $85.9 million, respectively, representing a growth rate of 62% and 87%, respectively. For the years ended January 31, 2018, 2017 and 2016, we generated net losses of $114.4 million, $83.5 million and $76.3 million, respectively. Our accumulated deficit as of January 31, 2018 was $402.5 million.
Key Business Metrics
We review a number of operating and financial metrics, including the following key metrics, to evaluate our business, measure our performance, identify trends affecting our business, formulate business plans, and make strategic decisions.
As of January 31, | ||||||||
2018 | 2017 | 2016 | ||||||
Customers with annual contract value (ACV) above $100,000 | 691 | 443 | 255 | |||||
Dollar-based retention rate for the trailing 12 months ended | 121 | % | 123 | % | 120 | % | ||
Year Ended January 31, | |||||||||||
2018 | 2017 | 2016 | |||||||||
(dollars in thousands) | |||||||||||
Calculated billings | $ | 314,934 | $ | 194,524 | $ | 118,023 | |||||
Number of Customers with Annual Contract Value Above $100,000
As of January 31, 2018, we had over 4,350 customers on our platform. We believe that our ability to increase the number of customers on our platform is an indicator of our market penetration, the growth of our business, and our potential future business opportunities. Increasing awareness of our platform and capabilities, coupled with the mainstream adoption of cloud technology, has expanded the diversity of our customer base to include organizations of all sizes across all industries. Over time, larger customers have constituted a greater share of our revenue, which has contributed to an increase in average revenue per customer. The number of customers who have greater than $100,000 in annual contract value with us was 691, 443 and 255 as of January 31, 2018, 2017 and 2016, respectively. We expect this trend to continue as larger enterprises recognize the value of our platform and replace their legacy IAM infrastructure. We define a customer as a separate and distinct buying entity, such as a company, an educational or government institution, or a distinct business unit of a large company that has an active contract with us or one of our partners to access our platform.
Dollar-Based Retention Rate
Our ability to generate revenue is dependent upon our ability to maintain our relationships with our customers and to increase their utilization of our platform. We believe we can achieve these goals by focusing on delivering value and functionality that enables us to both retain our existing customers and expand the number of users and products used within an existing customer. We assess our performance in this area by measuring our Dollar-Based Retention Rate. Our Dollar-Based Retention Rate measures our ability to increase revenue across our existing customer base through expansion of users and products associated with a customer as offset by churn and contraction in the number of users and/or products associated with a customer.
Our Dollar-Based Retention Rate is based upon our Annual Contract Value, or ACV, which is calculated based on the terms of that customer’s contract and represents the total contracted annual subscription amount as of that period end. We calculate our Dollar-Based Retention Rate as of a period end by starting with the ACV from all customers as of twelve months prior to such period end, or Prior Period ACV. We then calculate the ACV from these same customers as of the current period end, or Current Period ACV. Current Period ACV includes any upsells and is net of contraction or churn over the trailing twelve months but excludes revenue from new customers in the current period. We then divide the total Current Period ACV by the total Prior Period ACV to arrive at our Dollar-Based Retention Rate.
Our Dollar-Based Retention Rate has consistently exceeded 120%, which is primarily attributable to an expansion of users and up-selling additional products within our existing customers. Larger enterprises often implement a limited initial deployment of our platform before increasing their deployment on a broader scale.
Calculated Billings
Calculated Billings represent our total revenue plus the change in deferred revenue in the period. Calculated Billings in any particular period reflects sales to new customers plus subscription renewals and upsells to existing
47
customers, and represent amounts invoiced for subscription, support and professional services. We typically invoice customers in advance in annual installments for subscriptions to our platform.
Calculated Billings increased 62% in the year ended January 31, 2018 over the year ended January 31, 2017. As our Calculated Billings continue to grow in absolute terms, we expect our Calculated Billings growth rate to trend down over time. See the section titled “Selected Consolidated Financial Data and Other Data—Non-GAAP Financial Measures” for additional information and a reconciliation of Calculated Billings to total revenue.
Components of Results of Operations
Revenue
Subscription Revenue. Subscription revenue primarily consists of fees for access to and usage of our cloud-based platform and related support. We generate subscription fees pursuant to noncancelable contracts with a weighted average duration of 2.4 years as of January 31, 2018. Subscription revenue is driven primarily by the number of customers, the number of users per customer and the products used. We typically invoice customers in advance in annual installments for subscriptions to our platform. We recognize subscription revenue ratably over the term of the subscription period beginning on the date access to our platform is provided, provided all other revenue recognition criteria have been met.
Professional Services and Other. Professional services revenue includes fees from assisting customers in implementing and optimizing the use of our products. These services include application configuration, system integration and training services.
We generally invoice customers monthly as the work is performed for time and materials arrangements. We generally have standalone value for our professional services and recognize revenue for the estimated fair value as a separate unit of accounting as services are performed or for those fixed-fee contracts, upon completion of the services.
Overhead Allocation and Employee Compensation Costs
We allocate shared costs, such as facilities (including rent, utilities and depreciation on equipment shared by all departments), information technology costs, and recruiting costs to all departments based on headcount. As such, allocated shared costs are reflected in each cost of revenue and operating expense category. Employee compensation costs include salaries, bonuses, benefits and stock-based compensation for each operating expense category and sales commissions for sales and marketing.
Cost of Revenue and Gross Margin
Cost of Subscription. Cost of subscription primarily consists of expenses related to hosting our services and providing support. These expenses include employee-related costs associated with our cloud-based infrastructure and our customer support organization, third-party hosting fees, software and maintenance costs, outside services associated with the delivery of our subscription services, travel-related costs, amortization expense associated with capitalized internal-use software and acquired technology, and allocated overhead.
We intend to continue to invest additional resources in our platform infrastructure and our platform support organizations. As we continue to invest in technology innovation, we expect to have increased capitalized internal-use software costs and related amortization. We expect our investment in technology to expand the capability of our platform, enabling us to improve our gross margin over time. The level and timing of investment in these areas could affect our cost of subscription revenue in the future.
Cost of Professional Services and Other. Cost of professional services consists primarily of employee-related costs for our professional services delivery team, travel-related costs, and costs of outside services associated with supplementing our professional services delivery team. The cost of providing professional services has historically been higher than the associated revenue we generate.
Gross Margin. Gross margin is gross profit expressed as a percentage of total revenue. Our gross margin may fluctuate from period to period as our revenue fluctuates, and as a result of the timing and amount of investments to expand our hosting capacity, our continued efforts to build platform support and professional services teams, increased stock-based compensation expenses, as well as the amortization of costs associated with capitalized internal-use software and acquired intangible assets.
48
Operating Expenses
Research and Development. Research and development expenses consist primarily of employee compensation costs and overhead allocation. We believe that continued investment in our platform is important for our growth. We expect our research and development expenses will increase in absolute dollars as our business grows.
Sales and Marketing. Sales and marketing expenses consist primarily of employee compensation costs, costs of general marketing activities and promotional activities, travel-related expenses and allocated overhead. Commissions earned by our sales force that are direct and incremental and can be associated specifically with a noncancelable subscription contract are deferred and amortized over the same period that revenue is recognized for the related noncancelable contract. We expect our sales and marketing expenses will increase in absolute dollars and continue to be our largest operating expense category for the foreseeable future as we expand our sales and marketing efforts. However, we expect our sales and marketing expenses to decrease as a percentage of our revenue as our revenue grows.
General and Administrative. General and administrative expenses consist primarily of employee compensation costs for finance, accounting, legal and human resources personnel. In addition, general and administrative expenses include non-personnel costs, such as legal and other professional fees, charitable contributions and all other supporting corporate expenses not allocated to other departments.
We expect to incur additional expenses as a result of operating as a public company, including costs to comply with the rules and regulations applicable to companies listed on a national securities exchange, costs related to compliance and reporting obligations pursuant to the rules and regulations of the SEC, and increased expenses for insurance, investor relations and professional services. We expect our general and administrative expenses will increase in absolute dollars as our business grows.
Other Income (Expense), Net
Other income (expense), net consists of interest income from our investment holdings, interest expense and expenses resulting from the revaluation of our redeemable convertible preferred stock warrant liability.
Provision for (Benefit from) Income Taxes
Provision for (benefit from) income taxes consists of federal and state income taxes in the United States and income taxes in certain foreign jurisdictions.
49
Results of Operations
The following table sets forth our results of operations for the periods presented in dollars and as a percentage of our revenue:
Year Ended January 31, | |||||||||||
2018 | 2017 | 2016 | |||||||||
(in thousands, except per share data) | |||||||||||
Revenue | |||||||||||
Subscription | $ | 239,177 | $ | 143,136 | $ | 76,443 | |||||
Professional services and other | 20,813 | 17,190 | 9,464 | ||||||||
Total revenue | 259,990 | 160,326 | 85,907 | ||||||||
Cost of revenue | |||||||||||
Subscription(1) | 52,481 | 34,211 | 20,684 | ||||||||
Professional services and other(1) | 28,274 | 21,738 | 15,340 | ||||||||
Total cost of revenue | 80,755 | 55,949 | 36,024 | ||||||||
Gross profit | 179,235 | 104,377 | 49,883 | ||||||||
Operating expenses | |||||||||||
Research and development(1) | 70,821 | 38,659 | 28,761 | ||||||||
Sales and marketing(1) | 172,973 | 118,742 | 77,915 | ||||||||
General and administrative(1) | 51,803 | 30,099 | 19,195 | ||||||||
Total operating expenses | 295,597 | 187,500 | 125,871 | ||||||||
Operating loss | (116,362 | ) | (83,123 | ) | (75,988 | ) | |||||
Other income (expense), net | 1,682 | 39 | (19 | ) | |||||||
Loss before provision for (benefit from) income taxes | (114,680 | ) | (83,084 | ) | (76,007 | ) | |||||
Provision for (benefit from) income taxes | (321 | ) | 425 | 295 | |||||||
Net loss | $ | (114,359 | ) | $ | (83,509 | ) | $ | (76,302 | ) | ||
_______________________________
(1) Includes stock-based compensation expense as follows:
Year Ended January 31, | |||||||||||
2018 | 2017 | 2016 | |||||||||
(in thousands) | |||||||||||
Cost of subscription revenue | $ | 4,600 | $ | 1,979 | $ | 909 | |||||
Cost of professional services and other revenue | 3,137 | 1,283 | 553 | ||||||||
Research and development | 18,107 | 2,992 | 1,748 | ||||||||
Sales and marketing | 13,242 | 6,029 | 2,853 | ||||||||
General and administrative | 10,774 | 4,844 | 3,769 | ||||||||
Total stock-based compensation expense | $ | 49,860 | $ | 17,127 | $ | 9,832 | |||||
50
The following table sets forth our results of operations for the periods presented as a percentage of our revenue:
Year Ended January 31, | ||||||||
2018 | 2017 | 2016 | ||||||
Revenue | ||||||||
Subscription | 92 | % | 89 | % | 89 | % | ||
Professional services and other | 8 | 11 | 11 | |||||
Total revenue | 100 | 100 | 100 | |||||
Cost of revenue | ||||||||
Subscription | 20 | 21 | 24 | |||||
Professional services and other | 11 | 14 | 18 | |||||
Total cost of revenue | 31 | 35 | 42 | |||||
Gross profit | 69 | 65 | 58 | |||||
Operating expenses: | ||||||||
Research and development | 27 | 24 | 34 | |||||
Sales and marketing | 67 | 74 | 91 | |||||
General and administrative | 20 | 19 | 22 | |||||
Total operating expenses | 114 | 117 | 147 | |||||
Operating loss | (45 | ) | (52 | ) | (89 | ) | ||
Other income (expense), net | 1 | — | — | |||||
Loss before provision for (benefit from) income taxes | (44 | ) | (52 | ) | (89 | ) | ||
Provision for (benefit from) income taxes | — | — | — | |||||
Net loss | (44 | )% | (52 | )% | (89 | )% | ||
Comparison of the Years Ended January 31, 2018 and 2017
Revenue
Year Ended January 31, | ||||||||||||||
2018 | 2017 | $ Change | % Change | |||||||||||
(dollars in thousands) | ||||||||||||||
Revenue: | ||||||||||||||
Subscription | $ | 239,177 | $ | 143,136 | $ | 96,041 | 67 | % | ||||||
Professional services and other | 20,813 | 17,190 | 3,623 | 21 | ||||||||||
Total revenue | $ | 259,990 | $ | 160,326 | $ | 99,664 | 62 | |||||||
Percentage of revenue: | ||||||||||||||
Subscription | 92 | % | 89 | % | ||||||||||
Professional services and other | 8 | 11 | ||||||||||||
Total | 100 | % | 100 | % | ||||||||||
Subscription revenue increased by $96.0 million, or 67%, for the year ended January 31, 2018 compared to the year ended January 31, 2017. The increase was primarily due to the addition of new customers as well as an increase in users and sales of additional products to existing customers.
Professional services and other revenue increased by $3.6 million, or 21%, for the year ended January 31, 2018 compared to the year ended January 31, 2017. The increase in professional services revenue primarily related to an increase in implementation services priced on a time and materials basis, associated with an increase in the number of new customers purchasing our subscription services.
51
Cost of Revenue, Gross Profit and Gross Margin
Year Ended January 31, | ||||||||||||||
2018 | 2017 | $ Change | % Change | |||||||||||
(dollars in thousands) | ||||||||||||||
Cost of revenue: | ||||||||||||||
Subscription | $ | 52,481 | $ | 34,211 | $ | 18,270 | 53 | % | ||||||
Professional services and other | 28,274 | 21,738 | 6,536 | 30 | ||||||||||
Total cost of revenue | $ | 80,755 | $ | 55,949 | $ | 24,806 | 44 | |||||||
Gross profit | $ | 179,235 | $ | 104,377 | $ | 74,858 | 72 | |||||||
Gross margin: | ||||||||||||||
Subscription | 78 | % | 76 | % | ||||||||||
Professional services and other | (36 | ) | (26 | ) | ||||||||||
Total gross margin | 69 | 65 | ||||||||||||
Cost of subscription revenue increased by $18.3 million, or 53%, for the year ended January 31, 2018 compared to the year ended January 31, 2017, primarily due to an increase of $9.2 million in employee compensation costs related to higher headcount to support the growth in our subscription services, an increase of $4.2 million in data center costs as we increased capacity to support our growth, an increase of $1.6 million in allocated overhead costs to support personnel growth, an increase of $1.0 million related to the amortization of capitalized internal-use software costs due to the continued development of our software program and an increase of $0.9 million in consulting fees.
Our gross margin for subscription revenue increased to 78% during the year ended January 31, 2018, up from 76% during the year ended January 31, 2017, due to economies of scale as our subscription revenue increased. While our gross margins for subscription revenue may fluctuate in the near-term as we invest in our growth, we expect our subscription revenue gross margin to increase over time as we achieve additional economies of scale.
Cost of professional services and other revenue increased by $6.5 million, or 30%, for the year ended January 31, 2018, compared to the year ended January 31, 2017, primarily due to an increase of $6.0 million in employee compensation costs related to higher headcount and an increase of $0.8 million in allocated overhead costs.
Our gross margin for professional services and other revenue decreased to (36)% from (26)% during the year ended January 31, 2018 as compared to the year ended January 31, 2017, due to the continued shift that began during fiscal 2016 to price our professional services on a time and materials basis. Professional services and other revenue during the year ended January 31, 2018 included $14.1 million, or 68% of total professional services and other revenue, of professional services that were recognized on a time and materials basis, for which the related costs were incurred in the same period. Professional services and other revenue during the year ended January 31, 2017 included $9.1 million, or 53% of total professional services and other revenue, of professional services that were recognized on a time and materials basis.
Operating Expenses
Research and Development Expenses
Year Ended January 31, | ||||||||||||||
2018 | 2017 | $ Change | % Change | |||||||||||
(dollars in thousands) | ||||||||||||||
Research and development | $ | 70,821 | $ | 38,659 | $ | 32,162 | 83 | % | ||||||
Percentage of revenue | 27 | % | 24 | % | ||||||||||
Research and development expenses increased $32.2 million, or 83%, for the year ended January 31, 2018 compared to the year ended January 31, 2017. The increase was primarily due to an increase of $26.9 million in employee compensation costs due to higher headcount and the post combination compensation expense related to the equity awards issued in connection with the Stormpath business combination, an increase of $2.4 million in allocated overhead costs and an increase of $1.1 million due to write-off of capitalized internal-use software costs related to
52
projects that were not deployed. These increases were partially offset by a net increase of $0.5 million related to capitalized internal-use software costs.
Sales and Marketing Expenses
Year Ended January 31, | ||||||||||||||
2018 | 2017 | $ Change | % Change | |||||||||||
(dollars in thousands) | ||||||||||||||
Sales and marketing | $ | 172,973 | $ | 118,742 | $ | 54,231 | 46 | % | ||||||
Percentage of revenue | 67 | % | 74 | % | ||||||||||
Sales and marketing expenses increased $54.2 million, or 46%, for the year ended January 31, 2018, compared to the year ended January 31, 2017. The increase was primarily due to an increase of $33.9 million in employee compensation costs related to headcount growth, an increase of $9.5 million related to marketing and event costs primarily driven by increases in demand generation programs, advertising, sponsorships, a larger annual customer conference and brand awareness efforts aimed at acquiring new customers, an increase of $5.2 million in allocated overhead costs, an increase of $2.5 million in travel and employee related expenses, an increase of $1.3 million in contractor and consultant fees to support our expanding customer base, and an increase of $0.8 million in software license costs.
General and Administrative Expenses
Year Ended January 31, | ||||||||||||||
2018 | 2017 | $ Change | % Change | |||||||||||
(dollars in thousands) | ||||||||||||||
General and administrative | $ | 51,803 | $ | 30,099 | $ | 21,704 | 72 | % | ||||||
Percentage of revenue | 20 | % | 19 | % | ||||||||||
General and administrative expenses increased $21.7 million, or 72%, for the year ended January 31, 2018 compared to the year ended January 31, 2017. The increase was primarily due to an increase of $15.4 million in employee compensation costs related to higher headcount to support our continued growth, an increase of $5.0 million in costs from professional services comprised primarily of IT, legal, accounting, and consulting fees, and an increase of $2.0 million in allocated overhead costs, an increase of $1.0 million in software license costs, an increase of $0.7 million in charitable contributions and an increase of $0.5 million in travel and employee related expenses.
Other Income (Expense), Net
Year Ended January 31, | |||||||||||||
2018 | 2017 | $ Change | % Change | ||||||||||
(dollars in thousands) | |||||||||||||
Other income (expense), net | $ | 1,682 | $ | 39 | $ | 1,643 | N/A | ||||||
Other income (expense), net increased $1.6 million for the year ended January 31, 2018 compared to the year ended January 31, 2017. The increase was primarily due to interest income earned on higher cash and short-term investment balances from the completion of our IPO.
53
Provision for (benefit from) income taxes
Year Ended January 31, | |||||||||||||
2018 | 2017 | $ Change | % Change | ||||||||||
(dollars in thousands) | |||||||||||||
Provision for (benefit from) income taxes | $ | (321 | ) | $ | 425 | $ | (746 | ) | N/A | ||||
We recorded a benefit from income taxes of $(0.3) million for the year ended January 31, 2018, compared to a provision for income taxes of $0.4 million for the year ended January 31, 2017. The income tax provision for the year ended January 31, 2017 was related to foreign taxes and tax amortization of goodwill. The $(0.3) million benefit from income taxes for the year ended January 31, 2018 resulted from $1.3 million of excess tax deductions related to option exercises by foreign employees, a portion of which we intend to use to claim a refund of taxes paid in prior years.
Comparison of the Years Ended January 31, 2017 and 2016
Revenue
Year Ended January 31, | ||||||||||||||
2017 | 2016 | $ Change | % Change | |||||||||||
(dollars in thousands) | ||||||||||||||
Revenue: | ||||||||||||||
Subscription | $ | 143,136 | $ | 76,443 | $ | 66,693 | 87 | % | ||||||
Professional services and other | 17,190 | 9,464 | 7,726 | 82 | ||||||||||
Total revenue | $ | 160,326 | $ | 85,907 | $ | 74,419 | 87 | |||||||
Percentage of revenue: | ||||||||||||||
Subscription | 89 | % | 89 | % | ||||||||||
Professional services and other | 11 | 11 | ||||||||||||
Total | 100 | % | 100 | % | ||||||||||
Subscription revenue increased by $66.7 million, or 87%, for the year ended January 31, 2017 compared to the year ended January 31, 2016. The increase was primarily due to the addition of new customers, as our number of customers increased by 40% from January 31, 2016 to January 31, 2017, as well as an increase in users and sales of additional products to existing customers as reflected by our Dollar-Based Retention Rate of 123% for the year ended January 31, 2017.
Professional services and other revenue increased by $7.7 million, or 82%, for the year ended January 31, 2017 compared to the year ended January 31, 2016. The increase in professional services revenue primarily related to an increase in implementation services associated with an increase in the number of new customers purchasing our subscription services.
54
Cost of Revenue, Gross Profit and Gross Margin
Year Ended January 31, | ||||||||||||||
2017 | 2016 | $ Change | % Change | |||||||||||
(dollars in thousands) | ||||||||||||||
Cost of revenue: | ||||||||||||||
Subscription | $ | 34,211 | $ | 20,684 | $ | 13,527 | 65 | % | ||||||
Professional services and other | 21,738 | 15,340 | 6,398 | 42 | ||||||||||
Total cost of revenue | $ | 55,949 | $ | 36,024 | $ | 19,925 | 55 | |||||||
Gross profit | $ | 104,377 | $ | 49,883 | $ | 54,494 | 109 | |||||||
Gross margin: | ||||||||||||||
Subscription | 76 | % | 73 | % | ||||||||||
Professional services and other | (26 | ) | (62 | ) | ||||||||||
Total gross margin | 65 | 58 | ||||||||||||
Cost of subscription revenue increased by $13.5 million, or 65%, for the year ended January 31, 2017 compared to the year ended January 31, 2016, primarily due to an increase of $7.4 million in employee compensation costs related to higher headcount to support the growth in our subscription services, an increase of $2.3 million in data center costs as we increased capacity to support our growth, an increase of $1.2 million in allocated overhead costs to support our personnel growth, an increase of $1.0 million in travel and employee related expenses and an increase of $0.8 million related to the amortization of capitalized internal-use software costs due to the continued development of our software platform.
Our gross margin for subscription revenue increased from 73% during the year ended January 31, 2016 to 76% during the year ended January 31, 2017, due to economies of scale as our subscription revenue increased. While our gross margins for subscription revenue may fluctuate in the near-term as we invest in our growth, we expect our subscription revenue gross margin to increase over time as we achieve additional economies of scale.
Cost of professional services and other revenue increased by $6.4 million, or 42%, for the year ended January 31, 2017, compared to the year ended January 31, 2016, primarily due to an increase of $4.5 million in employee compensation costs related to higher headcount, and an increase of $0.7 million in allocated overhead costs.
Our gross margin for professional services and other revenue improved from (62)% during the year ended January 31, 2016 to (26)% during the year ended January 31, 2017, primarily due to increased utilization of professional services personnel and the shift during the year ended January 31, 2016 to price our professional services on a time and materials basis. We expect our gross margin from professional services revenue will improve as we realize the benefits of this shift in our pricing model to primarily time and materials.
Operating Expenses
Research and Development Expenses
Year Ended January 31, | ||||||||||||||
2017 | 2016 | $ Change | % Change | |||||||||||
(dollars in thousands) | ||||||||||||||
Research and development | $ | 38,659 | $ | 28,761 | $ | 9,898 | 34 | % | ||||||
Percentage of revenue | 24 | % | 34 | % | ||||||||||
Research and development expenses increased $9.9 million, or 34%, for the year ended January 31, 2017 compared to the year ended January 31, 2016. The increase was primarily due to an increase of $9.9 million in employee compensation costs, an increase of $1.7 million in allocated overhead costs, and an increase of $0.5 million for travel and employee related expenses. These increases were partially offset by an increase of $2.9 million related to capitalized internal-use software costs.
55
Sales and Marketing Expenses
Year Ended January 31, | ||||||||||||||
2017 | 2016 | $ Change | % Change | |||||||||||
(dollars in thousands) | ||||||||||||||
Sales and marketing | $ | 118,742 | $ | 77,915 | $ | 40,827 | 52 | % | ||||||
Percentage of revenue | 74 | % | 91 | % | ||||||||||
Sales and marketing expenses increased $40.8 million, or 52%, for the year ended January 31, 2017 compared to the year ended January 31, 2016. The increase was primarily due to an increase of $28.2 million in employee compensation costs related primarily to higher headcount, an increase of $4.7 million related to marketing and event costs primarily driven by increases in demand generation programs, advertising, sponsorships, a larger annual customer conference, and brand awareness efforts aimed at acquiring new customers, an increase of $4.1 million in allocated overhead costs, an increase of $3.6 million in travel and employee related expenses, and an increase of $0.8 million in software license costs.
General and Administrative Expenses
Year Ended January 31, | ||||||||||||||
2017 | 2016 | $ Change | % Change | |||||||||||
(dollars in thousands) | ||||||||||||||
General and administrative | $ | 30,099 | $ | 19,195 | $ | 10,904 | 57 | % | ||||||
Percentage of revenue | 19 | % | 22 | % | ||||||||||
General and administrative expenses increased $10.9 million, or 57%, for the year ended January 31, 2017 compared to the year ended January 31, 2016. The increase was primarily due to an increase of $5.8 million in employee compensation costs related to higher headcount to support our continued growth, an increase of $2.6 million in costs from professional services comprised primarily of legal, accounting, and consulting fees, an increase of $1.2 million in allocated overhead costs and an increase of $0.5 million in software license costs.
56
Quarterly Results of Operations Data and Other Data
The following tables set forth selected unaudited consolidated quarterly statements of operations data for each of the eight fiscal quarters ended January 31, 2018, as well as the percentage of revenue that each line item represents for each quarter. The information for each of these quarters has been prepared on the same basis as the audited annual consolidated financial statements included elsewhere in this Annual Report on Form 10-K and, in the opinion of management, includes all adjustments, which consist only of normal recurring adjustments, necessary for the fair presentation of the results of operations for these periods. This data should be read in conjunction with our audited consolidated financial statements and related notes included elsewhere in this Annual Report on Form 10-K. These quarterly results are not necessarily indicative of our results of operations to be expected for any future period.
Three Months Ended | |||||||||||||||||||||||||||||||
Apr 30, 2016 | Jul 31, 2016 | Oct 31, 2016 | Jan 31, 2017 | Apr 30, 2017 | Jul 31, 2017 | Oct 31, 2017 | Jan 31, 2018 | ||||||||||||||||||||||||
(in thousands) | |||||||||||||||||||||||||||||||
Revenue | |||||||||||||||||||||||||||||||
Subscription | $ | 27,563 | $ | 33,439 | $ | 38,123 | $ | 44,011 | $ | 48,357 | $ | 56,080 | $ | 62,705 | $ | 72,035 | |||||||||||||||
Professional services and other | 4,224 | 3,997 | 4,160 | 4,809 | 4,650 | 4,915 | 5,533 | 5,715 | |||||||||||||||||||||||
Total revenue | 31,787 | 37,436 | 42,283 | 48,820 | 53,007 | 60,995 | 68,238 | 77,750 | |||||||||||||||||||||||
Cost of revenue | |||||||||||||||||||||||||||||||
Subscription(1) | 7,460 | 8,466 | 8,597 | 9,688 | 11,157 | 12,691 | 13,553 | 15,080 | |||||||||||||||||||||||
Professional services and other(1) | 4,919 | 5,314 | 5,506 | 5,999 | 6,306 | 6,991 | 7,570 | 7,407 | |||||||||||||||||||||||
Total cost of revenue | 12,379 | 13,780 | 14,103 | 15,687 | 17,463 | 19,682 | 21,123 | 22,487 | |||||||||||||||||||||||
Gross profit | 19,408 | 23,656 | 28,180 | 33,133 | 35,544 | 41,313 | 47,115 | 55,263 | |||||||||||||||||||||||
Operating expenses | |||||||||||||||||||||||||||||||
Research and development(1) | 8,766 | 9,655 | 9,706 | 10,532 | 15,359 | 16,923 | 19,190 | 19,349 | |||||||||||||||||||||||
Sales and marketing(1) | 26,401 | 28,421 | 32,442 | 31,478 | 37,180 | 39,597 | 49,606 | 46,590 | |||||||||||||||||||||||
General and administrative(1) | 6,945 | 6,142 | 7,922 | 9,090 | 11,639 | 11,948 | 13,546 | 14,670 | |||||||||||||||||||||||
Total operating expenses | 42,112 | 44,218 | 50,070 | 51,100 | 64,178 | 68,468 | 82,342 | 80,609 | |||||||||||||||||||||||
Operating loss | (22,704 | ) | (20,562 | ) | (21,890 | ) | (17,967 | ) | (28,634 | ) | (27,155 | ) | (35,227 | ) | (25,346 | ) | |||||||||||||||
Other income (expense), net | 32 | 56 | 50 | (99 | ) | (19 | ) | 382 | 509 | 810 | |||||||||||||||||||||
Loss before provision for (benefit from) income taxes | (22,672 | ) | (20,506 | ) | (21,840 | ) | (18,066 | ) | (28,653 | ) | (26,773 | ) | (34,718 | ) | (24,536 | ) | |||||||||||||||
Provision for (benefit from) income taxes | 81 | 95 | 91 | 158 | 248 | 229 | (940 | ) | 142 | ||||||||||||||||||||||
Net loss | $ | (22,753 | ) | $ | (20,601 | ) | $ | (21,931 | ) | $ | (18,224 | ) | $ | (28,901 | ) | $ | (27,002 | ) | $ | (33,778 | ) | $ | (24,678 | ) | |||||||
_______________________________
(1) Amounts include stock-based compensation expense as follows:
Three Months Ended | |||||||||||||||||||||||||||||||
Apr 30, 2016 | Jul 31, 2016 | Oct 31, 2016 | Jan 31, 2017 | Apr 30, 2017 | Jul 31, 2017 | Oct 31, 2017 | Jan 31, 2018 | ||||||||||||||||||||||||
(in thousands) | |||||||||||||||||||||||||||||||
Cost of subscription revenue | $ | 393 | $ | 446 | $ | 578 | $ | 562 | $ | 686 | $ | 1,056 | $ | 1,421 | $ | 1,437 | |||||||||||||||
Cost of professional services and other revenue | 273 | 313 | 304 | 393 | 469 | 738 | 979 | 951 | |||||||||||||||||||||||
Research and development | 618 | 736 | 808 | 830 | 3,301 | 4,438 | 5,174 | 5,194 | |||||||||||||||||||||||
Sales and marketing | 1,354 | 1,412 | 1,619 | 1,644 | 2,375 | 3,021 | 3,894 | 3,952 | |||||||||||||||||||||||
General and administrative | 731 | 757 | 1,527 | 1,829 | 2,075 | 2,725 | 2,940 | 3,034 | |||||||||||||||||||||||
Total stock-based compensation expense | $ | 3,369 | $ | 3,664 | $ | 4,836 | $ | 5,258 | $ | 8,906 | $ | 11,978 | $ | 14,408 | $ | 14,568 | |||||||||||||||
57
Three Months Ended | |||||||||||||||||||||||
Apr 30, 2016 | Jul 31, 2016 | Oct 31, 2016 | Jan 31, 2017 | Apr 30, 2017 | Jul 31, 2017 | Oct 31, 2017 | Jan 31, 2018 | ||||||||||||||||
Revenue | |||||||||||||||||||||||
Subscription | 87 | % | 89 | % | 90 | % | 90 | % | 91 | % | 92 | % | 92 | % | 93 | % | |||||||
Professional services and other | 13 | 11 | 10 | 10 | 9 | 8 | 8 | 7 | |||||||||||||||
Total revenue | 100 | 100 | 100 | 100 | 100 | 100 | 100 | 100 | |||||||||||||||
Cost of revenue | |||||||||||||||||||||||
Subscription | 23 | 23 | 20 | 20 | 21 | 21 | 20 | 19 | |||||||||||||||
Professional services and other | 15 | 14 | 13 | 12 | 12 | 11 | 11 | 10 | |||||||||||||||
Total cost of revenue | 38 | 37 | 33 | 32 | 33 | 32 | 31 | 29 | |||||||||||||||
Gross profit | 62 | 63 | 67 | 68 | 67 | 68 | 69 | 71 | |||||||||||||||
Operating expenses: | |||||||||||||||||||||||
Research and development | 28 | 26 | 23 | 22 | 29 | 28 | 28 | 25 | |||||||||||||||
Sales and marketing | 83 | 76 | 77 | 64 | 70 | 65 | 73 | 60 | |||||||||||||||
General and administrative | 22 | 16 | 19 | 19 | 22 | 20 | 20 | 19 | |||||||||||||||
Total operating expenses | 133 | 118 | 119 | 105 | 121 | 113 | 121 | 104 | |||||||||||||||
Operating loss | (71 | ) | (55 | ) | (52 | ) | (37 | ) | (54 | ) | (45 | ) | (52 | ) | (33 | ) | |||||||
Other income (expense), net | — | — | — | — | — | 1 | 1 | 1 | |||||||||||||||
Loss before provision for (benefit from) income taxes | (71 | ) | (55 | ) | (52 | ) | (37 | ) | (54 | ) | (44 | ) | (51 | ) | (32 | ) | |||||||
Provision for (benefit from) income taxes | — | — | — | — | — | — | (1 | ) | — | ||||||||||||||
Net loss | (71 | )% | (55 | )% | (52 | )% | (37 | )% | (54 | )% | (44 | )% | (50 | )% | (32 | )% | |||||||
Quarterly Revenue Trends
Our quarterly revenue increased sequentially in each of the periods presented due primarily to increases in the number of new customers as well as expansion within existing customers and sales of new products. We have typically acquired more new customers in the fourth quarter of our fiscal year, though this seasonality is sometimes not immediately apparent in our revenue due to the fact that we recognize subscription revenue over the term of the contract. Our contracts have a weighted-average duration of 2.4 years. Beginning in the three months ended April 30, 2016, we began to see the impact of migrating more of the pricing for our professional services engagements to a time and materials basis. With this change, the impact of fixed fee project completions on professional services revenue was less significant in recent periods and we do not expect a material impact in future periods.
Quarterly Cost of Revenue and Gross Margin Trends
Our quarterly gross margin has generally been increasing due to increasing subscription revenue and related economies of scale combined with the overall growth in our professional services revenue and increased utilization of professional services personnel.
Quarterly Operating Expense Trends
Total costs and expenses generally increased sequentially for the fiscal quarters presented, primarily due to the addition of personnel in connection with the expansion of our business. Our research and development expenses can fluctuate quarter to quarter based on the timing and extent of capitalizable internal-use software development activities. Sales and marketing expenses grew sequentially over the periods. Sales and marketing expenses included $5.0 million and $3.3 million of expenses related to our annual customer conference in the third quarter of fiscal 2018 and 2017, respectively. Our sales and marketing expenses generally increase in the quarter in which the conference is held. General and administrative costs generally increased in recent quarters due to higher outside professional service fees in connection with preparing to be and operating as a public company.
58
Non-GAAP Financial Measures
In addition to our results determined in accordance with U.S. generally accepted accounting principles, or GAAP, we believe the following non-GAAP measures are useful in evaluating our operating performance. We use the below referenced non-GAAP financial information, collectively, to evaluate our ongoing operations and for internal planning and forecasting purposes. We believe that non-GAAP financial information, when taken collectively, may be helpful to investors because it provides consistency and comparability with past financial performance, and assists in comparisons with other companies, some of which use similar non-GAAP financial information to supplement their GAAP results. The non-GAAP financial information is presented for supplemental informational purposes only, and should not be considered a substitute for financial information presented in accordance with GAAP, and may be different from similarly-titled non-GAAP measures used by other companies. A reconciliation is provided below for each non-GAAP financial measure to the most directly comparable financial measure stated in accordance with GAAP. Investors are encouraged to review the related GAAP financial measures and the reconciliation of these non-GAAP financial measures to their most directly comparable GAAP financial measures.
Non-GAAP Gross Profit and Non-GAAP Gross Margin
We define non-GAAP gross profit and non-GAAP gross margin as GAAP gross profit and GAAP gross margin, adjusted for stock-based compensation expense and amortization of acquired intangibles.
Year Ended January 31, | |||||||||||
2018 | 2017 | 2016 | |||||||||
(dollars in thousands) | |||||||||||
Gross profit | $ | 179,235 | $ | 104,377 | $ | 49,883 | |||||
Add: | |||||||||||
Stock-based compensation expense included in cost of revenue | 7,737 | 3,262 | 1,462 | ||||||||
Amortization of acquired intangibles | 4 | 190 | 190 | ||||||||
Non-GAAP gross profit | $ | 186,976 | $ | 107,829 | $ | 51,535 | |||||
Gross margin | 69 | % | 65 | % | 58 | % | |||||
Non-GAAP gross margin | 72 | % | 67 | % | 60 | % | |||||
Non-GAAP Operating Loss and Non-GAAP Operating Margin
We define non-GAAP operating loss and non-GAAP operating margin as GAAP operating loss and GAAP operating margin, adjusted for stock-based compensation expense, charitable contributions, amortization of acquired intangibles and acquisition related compensation expense.
Year Ended January 31, | |||||||||||
2018 | 2017 | 2016 | |||||||||
(dollars in thousands) | |||||||||||
Operating loss | $ | (116,362 | ) | $ | (83,123 | ) | $ | (75,988 | ) | ||
Add: | |||||||||||
Stock-based compensation expense | 49,860 | 17,127 | 9,832 | ||||||||
Charitable contributions | 754 | — | — | ||||||||
Amortization of acquired intangibles | 4 | 190 | 190 | ||||||||
Acquisition related compensation expense | — | — | 31 | ||||||||
Non-GAAP operating loss | $ | (65,744 | ) | $ | (65,806 | ) | $ | (65,935 | ) | ||
Operating margin | (45 | )% | (52 | )% | (89 | )% | |||||
Non-GAAP operating margin | (25 | )% | (41 | )% | (77 | )% | |||||
59
Free Cash Flow
We define Free Cash Flow as net cash used in operating activities, less cash used for purchases of property and equipment and capitalized internal-use software costs.
Year Ended January 31, | |||||||||||
2018 | 2017 | 2016 | |||||||||
(in thousands) | |||||||||||
Net cash used in operating activities | $ | (25,240 | ) | $ | (42,101 | ) | $ | (41,536 | ) | ||
Less: | |||||||||||
Purchases of property and equipment | (6,550 | ) | (6,253 | ) | (4,093 | ) | |||||
Capitalized internal-use software costs | (5,431 | ) | (5,489 | ) | (2,608 | ) | |||||
Free Cash Flow | $ | (37,221 | ) | $ | (53,843 | ) | $ | (48,237 | ) | ||
Net cash provided by (used in) investing activities | $ | (99,704 | ) | $ | 6,965 | $ | 1,160 | ||||
Net cash provided by financing activities | $ | 237,408 | $ | 457 | $ | 76,841 | |||||
Calculated Billings
We define Calculated Billings as total revenue plus the change in deferred revenue during the period.
Year Ended January 31, | |||||||||||
2018 | 2017 | 2016 | |||||||||
(in thousands) | |||||||||||
Total revenue | $ | 259,990 | $ | 160,326 | $ | 85,907 | |||||
Add: | |||||||||||
Deferred revenue (end of period) | 168,667 | 113,723 | 79,525 | ||||||||
Less: | |||||||||||
Deferred revenue (beginning of period) | (113,723 | ) | (79,525 | ) | (47,409 | ) | |||||
Calculated Billings | $ | 314,934 | $ | 194,524 | $ | 118,023 | |||||
Liquidity and Capital Resources
As of January 31, 2018, our principal sources of liquidity were cash, cash equivalents and short-term investments totaling $229.7 million, which were held for working capital purposes, as well as the available balance of our credit facility, described further below. Our cash equivalents and investments were comprised primarily of money market funds, U.S. treasury securities, commercial paper and corporate debt securities. We have generated significant operating losses and negative cash flows from operations as reflected in our accumulated deficit and consolidated statements of cash flows. We expect to continue to incur operating losses and negative cash flows from operations for the foreseeable future.
60
In April 2017, upon completion of our initial public offering, or IPO, we received aggregate proceeds of $200.0 million, net of underwriters’ discounts and commissions, before deducting offering costs of approximately $5.6 million. Historically, we have financed our operations primarily through the net proceeds we received through private sales of equity securities, as well as payments received from customers for subscription and professional services. We believe our existing cash and cash equivalents, our investments, our credit facility, and cash provided by sales of our products and services will be sufficient to meet our working capital and capital expenditure needs for at least the next 12 months. Our future capital requirements will depend on many factors, including our subscription growth rate, subscription renewal activity, billing frequency, the timing and extent of spending to support development efforts, the expansion of sales and marketing activities, the introduction of new and enhanced product offerings, and the continuing market adoption of our platform. We may in the future enter into arrangements to acquire or invest in complementary businesses, services and technologies, including intellectual property rights. We may be required to seek additional equity or debt financing. In the event that additional financing is required from outside sources, we may not be able to raise it on terms acceptable to us or at all. If we are unable to raise additional capital or generate cash flows necessary to expand our operations and invest in new technologies this could reduce our ability to compete successfully and harm our results of operations.
In March 2014, we entered into a loan and security agreement with Silicon Valley Bank for a line of credit and term loan of $5.0 million and $10.0 million, respectively. In June 2015, we amended our credit facility to increase the line of credit from $5.0 million to $20.0 million and extend the maturity date to March 2017. In November 2016, we amended our credit facility again to increase the line of credit to $40.0 million and extend the maturity date to November 2018. The available amount, not to exceed $40.0 million, is based on certain revenue metrics and is reduced by letters of credit totaling $4.2 million as of January 31, 2018 established in connection with facility lease agreements. As of January 31, 2018, $35.8 million was available under the line of credit, of which no amounts had been drawn.
A significant majority of our customers pay in advance for annual subscriptions. Therefore, a substantial source of our cash is from our deferred revenue, which is included on our consolidated balance sheet as a liability. Deferred revenue consists of the unearned portion of billed fees for our subscriptions, which is recognized as revenue in accordance with our revenue recognition policy. As of January 31, 2018, we had deferred revenue of $168.7 million, of which $162.6 million was recorded as a current liability and is expected to be recorded as revenue in the next 12 months, provided all other revenue recognition criteria have been met.
In December 2017, we entered into an office lease for our new corporate headquarters. We expect to incur approximately $15.0 million in capital expenditures for certain leasehold improvements during fiscal 2019.
See Note 15 Subsequent Events to our Audited Consolidated Financial Statements for discussion of the 2023 Notes.
Cash Flows
The following table summarizes our cash flows for the periods indicated:
Year Ended January 31, | |||||||||||
2018 | 2017 | 2016 | |||||||||
(in thousands) | |||||||||||
Net cash used in operating activities | $ | (25,240 | ) | $ | (42,101 | ) | $ | (41,536 | ) | ||
Net cash provided by (used in) investing activities | (99,704 | ) | 6,965 | 1,160 | |||||||
Net cash provided by financing activities | 237,408 | 457 | 76,841 | ||||||||
Effects of changes in foreign currency exchange rates on cash and cash equivalents | 487 | (120 | ) | (42 | ) | ||||||
Net increase (decrease) in cash, cash equivalents and restricted cash | $ | 112,951 | $ | (34,799 | ) | $ | 36,423 | ||||
Operating Activities
Our largest source of operating cash is cash collections from our customers for subscription and professional services. Our primary uses of cash from operating activities are for employee-related expenditures, marketing expenses and third-party hosting costs. Historically, we have generated negative cash flows from operating activities and have
61
supplemented working capital requirements through net proceeds from the private sale of equity securities and in the current period from the net proceeds of our IPO.
During the year ended January 31, 2018, cash used in operating activities was $25.2 million primarily due to our net loss of $114.4 million, adjusted for non-cash charges of $76.5 million and net cash inflows of $12.7 million provided by changes in our operating assets and liabilities. Non-cash charges primarily consisted of stock-based compensation, amortization of deferred commissions, depreciation and amortization of property and equipment and intangible assets, write-off of capitalized internal-use software costs, deferred income taxes and charitable contributions. The primary drivers of the changes in operating assets and liabilities related to a $54.9 million increase in deferred revenue, and an increase of $7.6 million in accounts payable, accrued compensation and accrued other expenses, offset by an increase of $18.3 million in accounts receivable, a $21.4 million increase in deferred commissions and an increase of $10.1 million in prepaid expenses and other assets.
During the year ended January 31, 2017, cash used in operating activities was $42.1 million primarily due to our net loss of $83.5 million, adjusted for non-cash charges of $36.1 million and net cash inflows of $5.3 million provided by changes in our operating assets and liabilities. Non-cash charges primarily consisted of stock-based compensation, amortization of deferred commissions, and depreciation and amortization of property and equipment and intangible assets. The primary drivers of the changes in operating assets and liabilities related to a $34.2 million increase in deferred revenue, partially offset by a $19.4 million increase in deferred commissions and a $12.0 million increase in accounts receivable, net, resulting primarily from increased subscription arrangements as a majority of our customers are invoiced in advance for annual subscriptions with a corresponding increase in commissions paid. Additionally, the change in operating assets and liabilities was due to an increase of $5.9 million in accounts payable, accrued compensation and other accrued expenses, offset by an increase of $3.4 million in prepaid expenses and other assets.
During the year ended January 31, 2016, cash used in operating activities was $41.5 million primarily due to our net loss of $76.3 million, adjusted for non-cash charges of $22.1 million and net cash inflows of $12.7 million provided by changes in our operating assets and liabilities. Non-cash charges primarily consisted of stock-based compensation, amortization of deferred commissions, and depreciation and amortization of property and equipment and intangible assets. The primary drivers of the changes in operating assets and liabilities related to a $32.1 million increase in deferred revenue, partially offset by a $16.0 million increase in deferred commissions and a $10.7 million increase in accounts receivable, net, resulting primarily from increased subscription arrangements in the fourth quarter as a majority of our customers are invoiced in advance for annual subscriptions with a corresponding increase in commissions paid. Additionally, the change in operating assets and liabilities was due to an increase of $3.3 million in accrued compensation and $3.9 million in accrued expenses and other liabilities.
Investing Activities
Net cash used in investing activities during the year ended January 31, 2018 of $99.7 million was primarily attributable to the purchases of investments of $129.1 million, purchases of property and equipment of $6.6 million to support additional office space and headcount, and the capitalization of internal-use software costs of $5.4 million associated with the development of additional features and functionality to our platform. These activities were offset by proceeds from the sales and maturities of investments of $41.4 million.
Net cash provided by investing activities during the year ended January 31, 2017 of $7.0 million was primarily attributable to proceeds from the sales and maturities of investments of $18.7 million, which was partially offset by purchases of property and equipment of $6.3 million to support additional office space and headcount, and the capitalization of internal-use software costs of $5.5 million associated with the development of additional features and functionality of our platform.
Net cash provided by investing activities during the year ended January 31, 2016 of $1.2 million was primarily attributable to proceeds from the sales and maturities of investments of $54.2 million, which was partially offset by cash used to purchase investments of $46.4 million, purchases of property and equipment to support additional office space and headcount of $4.1 million, and the capitalization of internal-use software costs associated with the development of additional features and functionality of our platform of $2.6 million.
Financing Activities
Cash provided by financing activities during the year ended January 31, 2018 of $237.4 million was primarily attributable to proceeds from the completion of our IPO of $200.0 million, net of underwriters’ discounts and commissions, proceeds from the exercise of stock options of $33.6 million, net of repurchases, and proceeds from our
62
employee stock purchase plan of $8.4 million, offset by $4.0 million in payments related to deferred offering costs and principal payments on a financing arrangement of $0.5 million.
Cash provided by financing activities during the year ended January 31, 2017 of $0.5 million was primarily the result of $2.4 million in proceeds from the exercise of stock options, net of repurchases, partially offset by the payment of deferred offering costs of $1.6 million and principal payments on a financing arrangement of $0.4 million.
Cash provided by financing activities during the year ended January 31, 2016 of $76.8 million was primarily the result of $73.4 million in proceeds from the sale of our redeemable convertible preferred stock, net of issuance costs and $3.6 million from the exercise of stock options, net of repurchases, partially offset by $0.2 million of principal payments under a financing arrangement.
Obligations and Other Commitments
Our principal commitments consist of obligations under our operating leases for office space and data center hosting facilities. The following table summarizes our contractual obligations as of January 31, 2018:
Payments Due by Period | |||||||||||||||||||
Less Than 1 Year | 1 to 3 Years | 3 to 5 Years | More Than 5 Years | Total | |||||||||||||||
(in thousands) | |||||||||||||||||||
Operating lease obligations | $ | 14,105 | $ | 42,962 | $ | 53,008 | $ | 144,386 | $ | 254,461 | |||||||||
Other obligations | 13,048 | 17,424 | — | — | 30,472 | ||||||||||||||
Total contractual obligations | $ | 27,153 | $ | 60,386 | $ | 53,008 | $ | 144,386 | $ | 284,933 | |||||||||
See Note 15 Subsequent Events to our Audited Consolidated Financial Statements for discussion of the 2023 Notes.
Indemnification Agreements
In the ordinary course of business, we enter into agreements of varying scope and terms pursuant to which we agree to indemnify customers, vendors, lessors, business partners and other parties with respect to certain matters, including, but not limited to, losses arising out of the breach of such agreements, services to be provided by us or from intellectual property infringement claims made by third parties. In addition, we have entered into indemnification agreements with our directors and certain officers and employees that will require us, among other things, to indemnify them against certain liabilities that may arise by reason of their status or service as directors, officers or employees. No demands have been made upon us to provide indemnification under such agreements and there are no claims that we are aware of that could have a material effect on our consolidated balance sheets, consolidated statements of operations and comprehensive loss, or consolidated statements of cash flows.
Off-Balance Sheet Arrangements
As of January 31, 2018, we did not have any relationships with unconsolidated organizations or financial partnerships, such as structured finance or special purpose entities that would have been established for the purpose of facilitating off-balance sheet arrangements or other contractually narrow or limited purposes.
Critical Accounting Policies and Estimates
We prepare our consolidated financial statements in accordance with GAAP. In the preparation of these consolidated financial statements, we are required to make estimates and assumptions that affect the reported amounts of assets, liabilities, revenue, costs and expenses, and related disclosures. To the extent that there are material differences between these estimates and actual results, our financial condition or results of operations would be affected. We base our estimates on past experience and other assumptions that we believe are reasonable under the
63
circumstances, and we evaluate these estimates on an ongoing basis. We refer to accounting estimates of this type as critical accounting policies and estimates, which we discuss below.
Revenue Recognition
We derive revenue from subscription fees (which include support fees) and professional services fees. We sell subscriptions to our platform through arrangements that are generally one to three years in length. Our arrangements are generally noncancelable and nonrefundable. Furthermore, if a customer reduces the contracted usage or service level, the customer has no right of refund. Our subscription arrangements do not provide customers with the right to take possession of the software supporting the platform and, as a result, are accounted for as service arrangements. This revenue recognition policy is consistent for sales generated directly with customers and sales generated indirectly through channel partners.
We commence revenue recognition when all of the following criteria are met:
• | There is persuasive evidence of an arrangement; |
• | Delivery has occurred; |
• | The amount of fees to be paid by the customer is fixed or determinable; and |
• | Collection of the fees is reasonably assured. |
Subscription Revenue
Subscription revenue, which includes support, is recognized on a straight-line basis over the noncancelable contractual term of the arrangement, generally beginning on the date that our service is made available to the customer, provided all other revenue recognition criteria have been met.
Professional Services Revenue
Our professional services principally consist of customer specific requests for application integrations, user interface enhancements and other customer specific requests.
Revenue for our professional services billed on a fixed fee basis are generally recognized when the professional services are completed and professional services arrangements billed on a time and materials basis are recognized as services are performed.
Multiple Element Arrangements
For arrangements with multiple deliverables, we evaluate whether the individual deliverables qualify as separate units of accounting. In order to treat deliverables in a multiple deliverable arrangement as separate units of accounting, the deliverables must have stand-alone value upon delivery and, in situations in which a general right of return exists for the delivered item, delivery or performance of the undelivered item is considered probable and substantially within our control. Our professional services have stand-alone value because we have routinely sold these professional services separately. Our subscription services have stand-alone value as we routinely sell the subscriptions separately. Customers have no general right of return for delivered items. If the deliverables have stand-alone value upon delivery, we account for each deliverable separately and revenue is recognized for the respective deliverables as they are delivered based on the relative selling price, which we determine by using the best estimate of selling price (BESP).
We have determined the BESP for our deliverables based on customer size, size and volume of our transactions, overarching pricing objectives and strategies, market and industry conditions, product-specific factors and historical sales of the deliverables.
Deferred Revenue
Deferred revenue consists of customer billings in advance of revenue being recognized from our subscription and support services and professional services arrangements. We primarily invoice our customers for our subscription services arrangements annually in advance. Our payment terms generally provide that customers pay the invoiced portion of the total arrangement fee within 30 days of the invoice date. Amounts anticipated to be recognized within one year of the balance sheet date are recorded as deferred revenue, current; the remaining portion is recorded as deferred revenue, noncurrent in the consolidated balance sheets.
64
Deferred revenue on our consolidated balance sheets totaled $168.7 million and $113.7 million at January 31, 2018 and 2017, respectively.
Deferred Commissions
Deferred commissions represent direct and incremental compensation costs incurred in connection with the acquisition of customer contracts. Deferred commissions are initially deferred when earned and amortized over the same period that revenue is recognized for the related noncancelable portion of the subscription arrangement. Amounts anticipated to be recognized within one year of the balance sheet date are recorded as deferred commissions, current; the remaining portion is recorded as deferred commissions, noncurrent in the consolidated balance sheets. Commissions are generally paid within three months of when the subscription arrangement is signed with the customer. Amortization of deferred commissions is included in sales and marketing expense in our consolidated statements of operations.
Deferred commissions on our consolidated balance sheets totaled $27.5 million and $23.6 million at January 31, 2018 and 2017, respectively.
Capitalized Internal-Use Software Costs
We capitalize certain costs incurred during the application development stage in connection with software development for our platform. Costs related to preliminary project activities and post-implementation activities are expensed as incurred.
Capitalized internal-use software costs are amortized on a straight-line basis over the software’s estimated useful life, which is generally three years. We record amortization related to capitalized internal-use software within subscription cost of revenue in the consolidated statements of operations. We evaluate the useful lives of these assets on an annual basis and test for impairment whenever events or changes in circumstances occur that could impact the recoverability of these assets. During the year ended January 31, 2018, we charged to research and development expense a write-off of $1.1 million of previously capitalized internal-use software costs.
Business Combinations
When we acquire a business, the purchase price is allocated to the net tangible and identifiable intangible assets acquired based on their estimated fair values. Any residual purchase price is recorded as goodwill. The allocation of the purchase price requires management to make significant estimates in determining the fair values of assets acquired and liabilities assumed, especially with respect to intangible assets. These estimates can include, but are not limited to, the cash flows that an asset is expected to generate in the future, the appropriate weighted-average cost of capital and the cost savings expected to be derived from acquiring an asset. These estimates are inherently uncertain and unpredictable. During the measurement period, which may be up to one year from the acquisition date, adjustments to the fair value of these tangible and intangible assets acquired and liabilities assumed may be recorded, with the corresponding offset to goodwill. Upon the conclusion of the measurement period or final determination of the fair value of assets acquired or liabilities assumed, whichever comes first, any subsequent adjustments are recorded to our consolidated statements of operations.
Goodwill on our consolidated balance sheets totaled $6.3 million and $2.6 million at January 31, 2018 and 2017, respectively. Goodwill is tested for impairment annually on November 1 or more frequently if certain indicators are present. Based on the annual assessment, no indicator of impairment was noted and as such no impairment charge was recorded during the years ended January 31, 2018, 2017 and 2016.
Stock-Based Compensation
Stock-based compensation issued to employees, including the purchase rights issued under our 2017 Employee Stock Purchase Plan (ESPP), is measured based on the grant-date fair value of the awards and recognized as an expense following the straight-line attribution method, over the requisite service period, for stock options, restricted stock units (RSUs) and restricted stock, and over the offering period, for the purchase rights issued under the ESPP. We account for equity awards issued to non-employees based on the fair value of the award, determined using the Black-Scholes option valuation model. The unvested options issued to non-employees are re-measured to fair value at the end of each reporting period. Prior to adoption of ASU 2016-09, the stock-based compensation was recorded net of estimated forfeitures.
65
Our use of the Black-Scholes option-pricing model to estimate the fair value of stock options granted requires the input of highly subjective assumptions. These assumptions and estimates are as follows:
Fair value — Prior to the IPO, the fair value of the shares of common stock underlying stock options had been established by our board of directors, which was responsible for these estimates, and had been based in part upon a valuation provided by a third-party valuation firm. Because there had been no public market for our common stock, our board of directors considered this independent valuation and other factors, including, but not limited to, revenue growth, the current status of the technical and commercial success of our operations, our financial condition, the stage of development and competition to establish the fair value of our common stock at the time of grant of the option. After the IPO, the we used the publicly quoted price as reported on the Nasdaq Global Select Market as the fair value of our common stock.
Expected volatility — Expected volatility is a measure of the amount by which the stock price is expected to fluctuate. Since we do not have sufficient trading history of our common stock, we estimate the expected volatility of its stock options at their grant date by taking the weighted-average historical volatility of a group of comparable publicly-traded companies over a period equal to the expected life of the options.
Expected term — We determine the expected term based on the average period the stock options are expected to remain outstanding, generally calculated as the midpoint of the stock option’s vesting term and contractual expiration period, as we do not have sufficient historical information to develop reasonable expectations about future exercise patterns and post-vesting employment termination behavior.
Risk-free rate — We use the U.S. Treasury yield that corresponds with the expected term.
Expected dividend yield — We utilize a dividend yield of zero, as we do not currently issue dividends and do not expect to in the future.
The following table summarizes the assumptions, other than fair value of our common stock, relating to our stock options granted in the year ended January 31, 2018, 2017, and 2016:
Year Ended January 31, | ||||||||
2018 | 2017 | 2016 | ||||||
Expected volatility | 40% - 41% | 40% - 44% | 42% - 46% | |||||
Expected term (in years) | 6.3 - 6.4 | 5.5 - 6.9 | 5.0 - 6.1 | |||||
Risk-free interest rate | 1.87% - 2.21% | 1.13% - 2.28% | 1.43% - 1.88% | |||||
Expected dividend yield | — | — | — | |||||
Recent Accounting Pronouncements
See Note 2 to our consolidated financial statements “Summary of Significant Accounting Policies-Recently Adopted Accounting Pronouncements and Recent Accounting Pronouncements Not Yet Adopted” for more information.
Item 7A. Quantitative and Qualitative Disclosures about Market Risk
Foreign Currency Exchange Risk
The functional currencies of our foreign subsidiaries are the respective local currencies. Most of our sales are denominated in U.S. dollars, and therefore our revenue is not currently subject to significant foreign currency risk. Our operating expenses are denominated in the currencies of the countries in which our operations are located, which are primarily in the United States, the United Kingdom, Canada and Australia. Our consolidated results of operations and cash flows are, therefore, subject to fluctuations due to changes in foreign currency exchange rates and may be adversely affected in the future due to changes in foreign exchange rates. To date, we have not entered into any hedging arrangements with respect to foreign currency risk or other derivative financial instruments. During the years ended January 31, 2018, 2017 and 2016, a hypothetical 10% change in foreign currency exchange rates applicable to our business would not have had a material impact on our consolidated financial statements.
66
Interest Rate Risk
We had cash, cash equivalents and short-term investments totaling $229.7 million as of January 31, 2018, of which $192.5 million was invested in money market funds, commercial paper, U.S. treasury securities and corporate debt securities. Our cash and cash equivalents are held for working capital purposes. Our short-term investments are made for capital preservation purposes. We do not enter into investments for trading or speculative purposes.
Our cash equivalents and our investment portfolio are subject to market risk due to changes in interest rates. Fixed rate securities may have their market value adversely affected due to a rise in interest rates. Due in part to these factors, our future investment income may fall short of our expectations due to changes in interest rates or we may suffer losses in principal if we are forced to sell securities that decline in market value due to changes in interest rates. However, because we classify our short-term investments as “available for sale,” no gains or losses are recognized due to changes in interest rates unless such securities are sold prior to maturity or declines in fair value are determined to be other-than-temporary.
As of January 31, 2018, a hypothetical 10% relative change in interest rates would not have had a material impact on the value of our cash equivalents or investment portfolio. Fluctuations in the value of our cash equivalents and investment portfolio caused by a change in interest rates (gains or losses on the carrying value) are recorded in other comprehensive income (loss), and are realized only if we sell the underlying securities prior to maturity.
67
Item 8. FINANCIAL STATEMENTS AND SUPPLEMENTARY DATA
INDEX TO CONSOLIDATED FINANCIAL STATEMENTS
Page | |
68
Report of Ernst & Young LLP, Independent Registered Public Accounting Firm
To the Stockholders and the Board of Directors of Okta, Inc.
Opinion on the Financial Statements
We have audited the accompanying consolidated balance sheets of Okta, Inc. (the “Company”) as of January 31, 2018 and 2017, the related consolidated statements of operations, comprehensive loss, redeemable convertible preferred stock and stockholders' equity (deficit), and cash flows for each of the three years in the period ended January 31, 2018, and the related notes (collectively referred to as the “consolidated financial statements”). In our opinion, the consolidated financial statements present fairly, in all material respects, the financial position of the Company at January 31, 2018 and 2017, and the results of its operations and its cash flows for each of the three years in the period ended January 31, 2018, in conformity with U.S. generally accepted accounting principles.
Basis for Opinion
These financial statements are the responsibility of the Company's management. Our responsibility is to express an opinion on the Company’s financial statements based on our audits. We are a public accounting firm registered with the Public Company Accounting Oversight Board (United States) (PCAOB) and are required to be independent with respect to the Company in accordance with the U.S. federal securities laws and the applicable rules and regulations of the Securities and Exchange Commission and the PCAOB.
We conducted our audits in accordance with the standards of the PCAOB. Those standards require that we plan and perform the audit to obtain reasonable assurance about whether the financial statements are free of material misstatement, whether due to error or fraud. The Company is not required to have, nor were we engaged to perform, an audit of its internal control over financial reporting. As part of our audits we are required to obtain an understanding of internal control over financial reporting but not for the purpose of expressing an opinion on the effectiveness of the Company's internal control over financial reporting. Accordingly, we express no such opinion.
Our audits included performing procedures to assess the risks of material misstatement of the financial statements, whether due to error or fraud, and performing procedures that respond to those risks. Such procedures included examining, on a test basis, evidence regarding the amounts and disclosures in the financial statements. Our audits also included evaluating the accounting principles used and significant estimates made by management, as well as evaluating the overall presentation of the financial statements. We believe that our audits provide a reasonable basis for our opinion.
/s/ Ernst & Young LLP
We have served as the Company’s auditor since 2013.
San Francisco, California
March 12, 2018
69
OKTA, INC.
CONSOLIDATED BALANCE SHEETS
(in thousands, except per share data)
As of January 31, | |||||||
2018 | 2017 | ||||||
Assets | |||||||
Current assets: | |||||||
Cash and cash equivalents | $ | 127,949 | $ | 23,282 | |||
Short-term investments | 101,765 | 14,390 | |||||
Accounts receivable, net of allowances of $1,472 and $1,306 | 52,248 | 34,544 | |||||
Deferred commissions | 16,481 | 13,549 | |||||
Prepaid expenses and other current assets | 16,973 | 7,025 | |||||
Total current assets | 315,416 | 92,790 | |||||
Property and equipment, net | 12,540 | 11,026 | |||||
Deferred commissions, noncurrent | 10,971 | 10,050 | |||||
Intangible assets, net | 11,761 | 9,155 | |||||
Goodwill | 6,282 | 2,630 | |||||
Other assets | 10,427 | 4,984 | |||||
Total assets | $ | 367,397 | $ | 130,635 | |||
Liabilities, redeemable convertible preferred stock and stockholders’ equity (deficit) | |||||||
Current liabilities: | |||||||
Accounts payable | $ | 9,566 | $ | 9,387 | |||
Accrued expenses and other current liabilities | 6,187 | 8,363 | |||||
Accrued compensation | 12,374 | 8,734 | |||||
Deferred revenue | 162,633 | 108,012 | |||||
Total current liabilities | 190,760 | 134,496 | |||||
Deferred revenue, noncurrent | 6,034 | 5,711 | |||||
Other liabilities, noncurrent | 7,017 | 6,079 | |||||
Total liabilities | 203,811 | 146,286 | |||||
Commitments and contingencies (Note 9) | |||||||
Redeemable convertible preferred stock, par value $0.0001 per share; no shares authorized, issued and outstanding as of January 31, 2018; 59,495 shares authorized, 59,465 issued and outstanding with liquidation preference of $230,373 as of January 31, 2017. | — | 227,954 | |||||
Stockholders’ equity (deficit): | |||||||
Preferred stock, par value $0.0001 per share; 100,000 shares authorized, no shares issued and outstanding as of January 31, 2018 and January 31, 2017. | — | — | |||||
Class A Common stock, par value $0.0001 per share; 1,000,000 shares authorized, 70,610 shares issued and outstanding as of January 31, 2018; no shares authorized, issued and outstanding as of January 31, 2017. | 7 | — | |||||
Class B Common stock, par value $0.0001 per share;120,000 shares authorized as of January 31, 2018 and January 31, 2017, respectively; 33,361 and 20,293 shares issued and outstanding as of January 31, 2018 and January 31, 2017, respectively. | 3 | 2 | |||||
Additional paid-in capital | 565,653 | 44,469 | |||||
Accumulated other comprehensive income (loss) | 391 | (167 | ) | ||||
Accumulated deficit | (402,468 | ) | (287,909 | ) | |||
Total stockholders’ equity (deficit) | 163,586 | (243,605 | ) | ||||
Total liabilities, redeemable convertible preferred stock and stockholders’ equity (deficit) | $ | 367,397 | $ | 130,635 | |||
See Notes to Consolidated Financial Statements.
70
OKTA, INC.
CONSOLIDATED STATEMENTS OF OPERATIONS
(in thousands, except per share data)
Year Ended January 31, | |||||||||||
2018 | 2017 | 2016 | |||||||||
Revenue | |||||||||||
Subscription | $ | 239,177 | $ | 143,136 | $ | 76,443 | |||||
Professional services and other | 20,813 | 17,190 | 9,464 | ||||||||
Total revenue | 259,990 | 160,326 | 85,907 | ||||||||
Cost of revenue | |||||||||||
Subscription | 52,481 | 34,211 | 20,684 | ||||||||
Professional services and other | 28,274 | 21,738 | 15,340 | ||||||||
Total cost of revenue | 80,755 | 55,949 | 36,024 | ||||||||
Gross profit | 179,235 | 104,377 | 49,883 | ||||||||
Operating expenses | |||||||||||
Research and development | 70,821 | 38,659 | 28,761 | ||||||||
Sales and marketing | 172,973 | 118,742 | 77,915 | ||||||||
General and administrative | 51,803 | 30,099 | 19,195 | ||||||||
Total operating expenses | 295,597 | 187,500 | 125,871 | ||||||||
Operating loss | (116,362 | ) | (83,123 | ) | (75,988 | ) | |||||
Other income (expense), net | 1,682 | 39 | (19 | ) | |||||||
Loss before provision for (benefit from) income taxes | (114,680 | ) | (83,084 | ) | (76,007 | ) | |||||
Provision for (benefit from) income taxes | (321 | ) | 425 | 295 | |||||||
Net loss | $ | (114,359 | ) | $ | (83,509 | ) | $ | (76,302 | ) | ||
Net loss per share attributable to common stockholders, basic and diluted | $ | (1.38 | ) | $ | (4.39 | ) | $ | (4.28 | ) | ||
Weighted-average shares used to compute net loss per share attributable to common stockholders, basic and diluted | 83,004 | 19,038 | 17,817 | ||||||||
See Notes to Consolidated Financial Statements.
71
OKTA, INC.
CONSOLIDATED STATEMENTS OF COMPREHENSIVE LOSS
(in thousands)
Year Ended January 31, | |||||||||||
2018 | 2017 | 2016 | |||||||||
Net loss | $ | (114,359 | ) | $ | (83,509 | ) | $ | (76,302 | ) | ||
Net change in unrealized gains (losses) on available-for-sale securities | (202 | ) | 10 | (5 | ) | ||||||
Foreign currency translation adjustments | 760 | (120 | ) | (42 | ) | ||||||
Other comprehensive income (loss) | 558 | (110 | ) | (47 | ) | ||||||
Comprehensive loss | $ | (113,801 | ) | $ | (83,619 | ) | $ | (76,349 | ) | ||
See Notes to Consolidated Financial Statements.
72
OKTA, INC.
CONSOLIDATED STATEMENTS OF REDEEMABLE CONVERTIBLE PREFERRED STOCK AND STOCKHOLDERS’ EQUITY (DEFICIT)
(dollars in thousands)
Redeemable Convertible Preferred Stock | Class A Common Stock | Class B Common Stock | Additional Paid-in Capital | Accumulated Other Comprehensive Income (Loss) | Accumulated Deficit | Total Stockholders’ Equity (Deficit) | |||||||||||||||||||||||||||||||
Shares | Amount | Shares | Amount | Shares | Amount | ||||||||||||||||||||||||||||||||
Balances as of January 31, 2015 | 53,223,503 | $ | 154,530 | — | $ | — | 18,042,388 | $ | 2 | $ | 10,908 | $ | (10 | ) | $ | (128,098 | ) | $ | (117,198 | ) | |||||||||||||||||
Issuance of Series F redeemable convertible preferred stock, net of issuance costs of $1,576 | 6,241,936 | 73,424 | — | — | — | — | — | — | — | — | |||||||||||||||||||||||||||
Issuance of common stock upon exercise of stock options | — | — | — | — | 1,291,099 | — | 1,194 | — | — | 1,194 | |||||||||||||||||||||||||||
Repurchases of unvested common stock | — | — | — | — | (25,846 | ) | — | — | — | — | — | ||||||||||||||||||||||||||
Issuance of common stock pursuant to charitable donation | — | — | — | — | 17,433 | — | 132 | — | — | 132 | |||||||||||||||||||||||||||
Vesting of early exercised stock options | — | — | — | — | — | — | 1,014 | — | — | 1,014 | |||||||||||||||||||||||||||
Stock-based compensation | — | — | — | — | — | — | 10,076 | — | — | 10,076 | |||||||||||||||||||||||||||
Excess tax benefits from share-based compensation | — | — | — | — | — | — | 69 | — | — | 69 | |||||||||||||||||||||||||||
Other comprehensive loss | — | — | — | — | — | — | — | (47 | ) | — | (47 | ) | |||||||||||||||||||||||||
Net loss | — | — | — | — | — | — | — | — | (76,302 | ) | (76,302 | ) | |||||||||||||||||||||||||
Balances as of January 31, 2016 | 59,465,439 | 227,954 | — | — | 19,325,074 | 2 | 23,393 | (57 | ) | (204,400 | ) | (181,062 | ) | ||||||||||||||||||||||||
Issuance of common stock upon exercise of stock options | — | — | — | — | 980,074 | — | 2,001 | — | — | 2,001 | |||||||||||||||||||||||||||
Repurchases of unvested common stock | — | — | — | — | (25,745 | ) | — | — | — | — | — | ||||||||||||||||||||||||||
Issuance of common stock pursuant to charitable donation | — | — | — | — | 13,935 | — | 129 | — | — | 129 | |||||||||||||||||||||||||||
Vesting of early exercised stock options | — | — | — | — | — | — | 1,297 | — | — | 1,297 | |||||||||||||||||||||||||||
Stock-based compensation | — | — | — | — | — | — | 17,649 | — | — | 17,649 | |||||||||||||||||||||||||||
Other comprehensive loss | — | — | — | — | — | — | — | (110 | ) | — | (110 | ) | |||||||||||||||||||||||||
Net loss | — | — | — | — | — | — | — | — | (83,509 | ) | (83,509 | ) | |||||||||||||||||||||||||
Balances as of January 31, 2017 | 59,465,439 | 227,954 | — | — | 20,293,338 | 2 | 44,469 | (167 | ) | (287,909 | ) | (243,605 | ) | ||||||||||||||||||||||||
Issuance of common stock upon exercise of stock options | — | — | 8,277,412 | 1 | 902,830 | — | 33,362 | — | — | 33,363 | |||||||||||||||||||||||||||
Issuance of common stock upon net exercise of warrant | — | — | — | — | 168,750 | — | — | — | — | — | |||||||||||||||||||||||||||
Issuance of common stock in connection with initial public offering, net of underwriting discounts and issuance costs | — | — | 12,650,000 | 1 | — | — | 194,344 | — | — | 194,345 | |||||||||||||||||||||||||||
Issuance of Series B redeemable convertible preferred stock upon net exercise of warrants | 26,201 | 408 | — | — | — | — | — | — | — | — | |||||||||||||||||||||||||||
Conversion of convertible preferred stock to common stock in connection with initial public offering | (59,491,640 | ) | (228,362 | ) | — | — | 59,491,640 | 6 | 228,356 | — | — | 228,362 | |||||||||||||||||||||||||
Issuance of common stock and restricted stock in connection with acquisition | — | — | — | — | 1,598,500 | — | 3,652 | — | — | 3,652 | |||||||||||||||||||||||||||
73
Redeemable Convertible Preferred Stock | Class A Common Stock | Class B Common Stock | Additional Paid-in Capital | Accumulated Other Comprehensive Income (Loss) | Accumulated Deficit | Total Stockholders’ Equity (Deficit) | |||||||||||||||||||||||||||||||
Shares | Amount | Shares | Amount | Shares | Amount | ||||||||||||||||||||||||||||||||
Issuance of common stock pursuant to charitable donation | — | — | 24,287 | — | — | — | 708 | — | — | 708 | |||||||||||||||||||||||||||
Issuance of common stock under employee stock purchase plan | — | — | 569,373 | — | — | — | 8,369 | — | — | 8,369 | |||||||||||||||||||||||||||
Repurchases of unvested common stock | — | — | (2,813 | ) | — | (2,313 | ) | — | — | — | — | — | |||||||||||||||||||||||||
Conversion of Class B common stock to Class A common stock | — | — | 49,091,639 | 5 | (49,091,639 | ) | (5 | ) | — | — | — | — | |||||||||||||||||||||||||
Vesting of early exercised stock options | — | — | — | — | — | — | 1,335 | — | — | 1,335 | |||||||||||||||||||||||||||
Cumulative-effect adjustment in connection with the adoption of ASU 2016-09 | — | — | — | — | — | — | 200 | — | (200 | ) | — | ||||||||||||||||||||||||||
Stock-based compensation | — | — | — | — | — | — | 50,858 | — | — | 50,858 | |||||||||||||||||||||||||||
Other comprehensive loss | — | — | — | — | — | — | — | 558 | — | 558 | |||||||||||||||||||||||||||
Net loss | — | — | — | — | — | — | — | — | (114,359 | ) | (114,359 | ) | |||||||||||||||||||||||||
Balances as of January 31, 2018 | — | $ | — | 70,609,898 | $ | 7 | 33,361,106 | $ | 3 | $ | 565,653 | $ | 391 | $ | (402,468 | ) | $ | 163,586 | |||||||||||||||||||
See Notes to Consolidated Financial Statements.
74
OKTA, INC.
CONSOLIDATED STATEMENTS OF CASH FLOWS
(in thousands)
Year Ended January 31, | |||||||||||
2018 | 2017 | 2016 | |||||||||
Cash flows from operating activities: | |||||||||||
Net loss | $ | (114,359 | ) | $ | (83,509 | ) | $ | (76,302 | ) | ||
Adjustments to reconcile net loss to net cash used in operating activities: | |||||||||||
Depreciation, amortization and accretion | 7,001 | 4,568 | 2,889 | ||||||||
Stock-based compensation | 49,860 | 17,127 | 9,832 | ||||||||
Amortization of deferred commissions | 17,584 | 13,734 | 8,438 | ||||||||
Deferred income taxes | (534 | ) | — | — | |||||||
Write-off of intangible assets | 1,114 | — | — | ||||||||
Non-cash charitable contributions | 708 | — | — | ||||||||
Other, net | 719 | 704 | 934 | ||||||||
Changes in operating assets and liabilities: | |||||||||||
Accounts receivable | (18,321 | ) | (11,993 | ) | (10,668 | ) | |||||
Deferred commissions | (21,437 | ) | (19,391 | ) | (15,952 | ) | |||||
Prepaid expenses and other assets | (10,128 | ) | (3,422 | ) | (1,056 | ) | |||||
Accounts payable | 3,505 | 1,529 | 962 | ||||||||
Accrued compensation | 3,582 | 1,967 | 3,340 | ||||||||
Accrued expenses and other liabilities | 521 | 2,387 | 3,929 | ||||||||
Deferred revenue | 54,945 | 34,198 | 32,118 | ||||||||
Net cash used in operating activities | (25,240 | ) | (42,101 | ) | (41,536 | ) | |||||
Cash flows from investing activities: | |||||||||||
Capitalized internal-use software costs | (5,431 | ) | (5,489 | ) | (2,608 | ) | |||||
Purchases of property and equipment | (6,550 | ) | (6,253 | ) | (4,093 | ) | |||||
Purchases of securities available for sale | (129,086 | ) | — | (46,360 | ) | ||||||
Proceeds from maturities and redemption of securities available for sale | 39,825 | 12,500 | 41,576 | ||||||||
Proceeds from sales of securities available for sale | 1,538 | 6,207 | 12,645 | ||||||||
Net cash provided by (used in) investing activities | (99,704 | ) | 6,965 | 1,160 | |||||||
Cash flows from financing activities: | |||||||||||
Proceeds from initial public offering, net of underwriters' discounts and commissions | 199,948 | — | — | ||||||||
Payments of deferred offering costs | (4,038 | ) | (1,584 | ) | — | ||||||
Proceeds from exercise of stock options, net of repurchases and other | 33,646 | 2,437 | 3,630 | ||||||||
Proceeds from issuance of convertible redeemable preferred stock, net of issuance costs | — | — | 73,424 | ||||||||
Proceeds from shares issued in connection with employee stock purchase plan | 8,369 | — | — | ||||||||
Other | (517 | ) | (396 | ) | (213 | ) | |||||
Net cash provided by financing activities | 237,408 | 457 | 76,841 | ||||||||
Effects of changes in foreign currency exchange rates on cash, cash equivalents and restricted cash | 487 | (120 | ) | (42 | ) | ||||||
Net increase (decrease) in cash, cash equivalents and restricted cash | 112,951 | (34,799 | ) | 36,423 | |||||||
Cash, cash equivalents and restricted cash at beginning of year | 23,282 | 58,081 | 21,658 | ||||||||
Cash, cash equivalents and restricted cash at end of year | $ | 136,233 | $ | 23,282 | $ | 58,081 | |||||
75
Year Ended January 31, | |||||||||||
2018 | 2017 | 2016 | |||||||||
Supplementary cash flow disclosure: | |||||||||||
Cash paid during the period for: | |||||||||||
Income taxes | $ | 747 | $ | — | $ | — | |||||
Non-cash investing and financing activities: | |||||||||||
Vesting of early exercised common stock options | 1,335 | 1,297 | 1,014 | ||||||||
Issuance of common stock in connection with warrant exercises | 272 | — | — | ||||||||
Common stock issued as charitable contribution | 708 | 129 | 132 | ||||||||
Assets acquired under financing arrangement | — | 386 | 853 | ||||||||
Deferred offering costs, accrued but not yet paid | — | 2,106 | 368 | ||||||||
Property and equipment acquired through tenant improvement allowances | — | 1,332 | — | ||||||||
Property and equipment and other accrued but not yet paid | 111 | 1,367 | 317 | ||||||||
Issuance of common stock in connection with business combination | 2,160 | — | — | ||||||||
Conversion of redeemable convertible preferred stock to common stock | 228,362 | — | — | ||||||||
Reconciliation of cash, cash equivalents, and restricted cash within the consolidated balance sheets to the amounts shown in the statements of cash flows above: | |||||||||||
Cash and cash equivalents | $ | 127,949 | $ | 23,282 | $ | 54,408 | |||||
Restricted cash, noncurrent | 8,284 | — | 3,673 | ||||||||
Total cash, cash equivalents and restricted cash | $ | 136,233 | $ | 23,282 | $ | 58,081 | |||||
See Notes to Consolidated Financial Statements.
76
OKTA, INC.
NOTES TO CONSOLIDATED FINANCIAL STATEMENTS
1. Overview and Basis of Presentation
Description of Business
Okta, Inc. (the Company) is the leading provider of identity for the enterprise. The Okta Identity Cloud enables customers to securely connect people to technology, anywhere, anytime and from any device. The Company was incorporated in January 2009 as Saasure, Inc., a California corporation, and was later reincorporated in April 2010 under the name Okta, Inc. as a Delaware corporation. The Company is headquartered in San Francisco, California.
Basis of Presentation and Principles of Consolidation
The accompanying consolidated financial statements, which include the accounts of the Company and its wholly owned subsidiaries, have been prepared in conformity with accounting principles generally accepted in the United States of America (GAAP). All intercompany balances and transactions have been eliminated in consolidation. Certain immaterial reclassifications of prior period amounts have been made in our consolidated balance sheets and consolidated statements of cash flows to conform to the current period presentation.
The Company’s fiscal year ends on January 31. References to fiscal 2018, for example, refer to the fiscal year ended January 31, 2018.
Initial Public Offering
In April 2017, the Company completed an initial public offering (IPO), in which the Company issued and sold 12,650,000 shares of its newly authorized Class A common stock, which included 1,650,000 shares sold pursuant to the exercise by the underwriters’ option to purchase additional shares at a public offering price of $17.00 per share. The Company received aggregate proceeds of $200.0 million from the IPO, net of underwriters’ discounts and commissions, before deducting offering costs of approximately $5.6 million. Immediately prior to the completion of the IPO, all shares of common stock then outstanding were reclassified as Class B common stock, and all shares of redeemable convertible preferred stock then outstanding were converted into 59,491,640 shares of common stock on a one-to-one basis and then reclassified into Class B common stock. See Note 10 for additional details.
As of January 31, 2018, 70,609,898 shares of the Company’s Class A common stock and 33,361,106 shares of Class B common stock were outstanding.
Use of Estimates
The preparation of consolidated financial statements in conformity with GAAP requires management to make estimates, judgments and assumptions that affect the reported amounts of assets and liabilities, disclosure of contingent assets and liabilities at the date of the consolidated financial statements and the reported amounts of revenue and expenses during the reporting period. The Company bases its estimates on historical experience and on other assumptions that its management believes are reasonable under the circumstances. Actual results could vary from those estimates. The Company’s most significant estimates and judgments involve revenue recognition with respect to the determination of the relative selling prices for the Company’s services, determination of the fair value of the Company’s common stock prior to the completion of the IPO, valuation of the Company’s stock-based awards, valuation of deferred income tax assets and contingencies.
Foreign Currency
The functional currencies of the Company’s foreign subsidiaries are the respective local currencies. Translation adjustments arising from the use of differing exchange rates from period to period are included in accumulated other comprehensive loss within the consolidated statements of redeemable convertible preferred stock and stockholders’ equity (deficit). Foreign currency transaction gains and losses are included in other expense, net in the consolidated statements of operations and were not material for the years ended January 31, 2018, 2017 or 2016. All assets and liabilities denominated in a foreign currency are translated into U.S. dollars at the exchange rate on the balance sheet date. Revenue and expenses are translated at the average exchange rate during the period, and equity balances are translated using historical exchange rates.
77
2. Summary of Significant Accounting Policies
Segment Information
The Company operates in a single operating segment. The Company’s chief operating decision maker is its chief executive officer, who reviews financial information presented on a consolidated basis for purposes of making operating decisions, assessing financial performance and allocating resources.
Revenue Recognition
The Company derives revenue from subscription fees (which include support fees) and professional services fees. The Company sells subscriptions to its platform through arrangements that are generally one to three years in length. The Company’s arrangements are generally noncancelable and nonrefundable. Furthermore, if a customer reduces the contracted usage or service level, the customer has no right of refund. The Company’s subscription arrangements do not provide customers with the right to take possession of the software supporting the platform and, as a result, are accounted for as service arrangements. This revenue recognition policy is consistent for sales generated directly with customers and sales generated indirectly through our network of independent software vendors, or ISVs, and channel partners.
The Company commences revenue recognition when all of the following criteria are met:
• | There is persuasive evidence of an arrangement; |
• | Delivery has occurred; |
• | The amount of fees to be paid by the customer is fixed or determinable; and |
• | Collection of the fees is reasonably assured. |
Subscription Revenue
Subscription revenue, which includes support, is recognized on a straight-line basis over the noncancelable contractual term of the arrangement, generally beginning on the date that the Company’s service is made available to the customer, provided all other revenue recognition criteria have been met.
Professional Services Revenue
The Company’s professional services principally consist of customer specific requests for application integrations, user interface enhancements and other customer specific requests.
Revenue for the Company’s professional services billed on a fixed fee basis are generally recognized when the professional services are completed and professional services arrangements billed on a time and materials basis are recognized as services are performed.
Multiple Element Arrangements
For arrangements with multiple deliverables, the Company evaluates whether the individual deliverables qualify as separate units of accounting. In order to treat deliverables in a multiple deliverable arrangement as separate units of accounting, the deliverables must have stand-alone value upon delivery and, in situations in which a general right of return exists for the delivered item, delivery or performance of the undelivered item is considered probable and substantially within the control of the Company. The Company’s professional services have stand-alone value because the Company has routinely sold these professional services separately. The Company’s subscription services have stand-alone value as the Company routinely sells the subscriptions separately. Customers have no general right of return for delivered items. If the deliverables have stand-alone value upon delivery, the Company accounts for each deliverable separately and revenue is recognized for the respective deliverables as they are delivered based on their relative selling prices, which the Company determines by using the best estimate of selling price (BESP).
The Company has determined its BESP for its deliverables based on customer size, size and volume of the Company’s transactions, overarching pricing objectives and strategies, market and industry conditions, product-specific factors and historical sales of the deliverables.
78
Deferred Revenue
Deferred revenue consists of customer billings in advance of revenue being recognized from the Company’s subscription and support services and professional services arrangements. The Company primarily invoices its customers for its subscription services arrangements annually in advance. The Company’s payment terms generally provide that customers pay the invoiced portion of the total arrangement fee within 30 days of the invoice date. Amounts anticipated to be recognized within one year of the balance sheet date are recorded as deferred revenue, current; the remaining portion is recorded as deferred revenue, noncurrent in the consolidated balance sheets.
Deferred Commissions
Deferred commissions represent direct and incremental compensation costs incurred in connection with the acquisition of customer contracts. Deferred commissions are initially deferred when earned and amortized over the same period that revenue is recognized for the related noncancelable portion of the subscription arrangement. Amounts anticipated to be recognized within one year of the balance sheet date are recorded as deferred commissions, current; the remaining portion is recorded as deferred commissions, noncurrent in the consolidated balance sheets. Commissions are generally paid within three months of when the subscription arrangement is signed with the customer. Amortization of deferred commissions is included in sales and marketing expense in the consolidated statements of operations.
Cost of Revenue
Costs of revenue primarily consist of costs related to providing the Company’s cloud-based platform to its customers, including third-party hosting fees, amortization of capitalized internal-use software and finite-lived purchased developed technology, customer support, other employee-related expenses for security, technical operations and professional services staff, and allocated overhead costs.
Cash and Cash Equivalents
Cash and cash equivalents consist of cash on hand and highly liquid investments with original maturities of three months or less from the date of purchase. Cash equivalents generally consist of investments in money market funds. The fair market value of cash equivalents approximated their carrying value as of January 31, 2018 and 2017.
Short-term Investments
The Company’s short-term investments comprise asset-backed securities, U.S. treasury securities and corporate debt securities. The Company determines the appropriate classification of its short-term investments at the time of purchase and reevaluates such designation at each balance sheet date. The Company has classified and accounted for its short-term investments as available-for-sale securities as the Company may sell these securities at any time for use in its current operations or for other purposes, even prior to maturity. As a result, the Company classifies its short-term investments, including securities with stated maturities beyond twelve months, within current assets in the consolidated balance sheets.
Available-for-sale securities are recorded at fair value each reporting period. Unrealized gains and losses on these short-term investments are reported as a separate component of accumulated other comprehensive loss in the consolidated balance sheets until realized. Interest income is reported within other income (expense), net in the consolidated statements of operations. The Company periodically evaluates its short-term investments to assess whether those with unrealized loss positions are other-than-temporarily impaired. The Company considers various factors in determining whether to recognize an impairment charge, including the length of time the investment has been in a loss position, the extent to which the fair value is less than the Company’s cost basis, the investment’s financial condition and near-term prospects of the investee. Realized gains and losses are determined based on the specific identification method and are reported in other income (expense), net in the consolidated statements of operations. If the Company determines that the decline in an investment’s fair value is other-than-temporary, the difference is recognized as an impairment loss in the consolidated statements of operations.
Accounts Receivable and Allowances
Accounts receivable are recorded at the invoiced amount, net of allowances. These allowances are based on the Company’s assessment of the collectibility of accounts by considering the age of each outstanding invoice and the collection history of each customer and an evaluation of potential risk of loss associated with delinquent accounts.
79
Amounts deemed uncollectible are recorded to these allowances in the consolidated balance sheets with an offsetting decrease in related deferred revenue and a charge to general and administrative expense in the consolidated statement of operations.
Property and Equipment
Property and equipment, net, is stated at cost less accumulated depreciation. Depreciation is recorded using the straight-line method over the estimated useful lives of the respective assets. Repairs and maintenance costs are expensed as incurred.
The useful lives of property and equipment are as follows:
Useful lives | |
Capitalized internal-use software costs | 3 years |
Computers and equipment | 3 years |
Furniture and fixtures | 7 years |
Leasehold improvements | Shorter of 7 years or remaining lease term |
Capitalized Internal-Use Software Costs
The Company capitalizes as intangible assets certain costs incurred during the application development stage in connection with software development for its platform. Costs related to preliminary project activities and post-implementation activities are expensed as incurred. Capitalized costs are recorded as part of intangible assets. Maintenance and training costs are expensed as incurred.
Capitalized internal-use software costs are amortized on a straight-line basis over the software’s estimated useful life, which is generally three years. The Company records amortization related to capitalized internal-use software within subscription cost of revenue in the consolidated statements of operations. The Company evaluates the useful lives of these assets on an annual basis and tests for impairment whenever events or changes in circumstances occur that could impact the recoverability of these assets.
Business Combinations
When the Company acquires a business, the purchase price is allocated to the net tangible and identifiable intangible assets acquired. Any residual purchase price is recorded as goodwill. The allocation of the purchase price requires management to make significant estimates in determining the fair values of assets acquired and liabilities assumed, especially with respect to intangible assets. These estimates can include, but are not limited to, the cash flows that an asset is expected to generate in the future, the appropriate weighted-average cost of capital and the cost savings expected to be derived from acquiring an asset. These estimates are inherently uncertain and unpredictable. During the measurement period, which may be up to one year from the acquisition date, adjustments to the fair value of these tangible and intangible assets acquired and liabilities assumed may be recorded, with the corresponding offset to goodwill. Upon the conclusion of the measurement period or final determination of the fair value of assets acquired or liabilities assumed, whichever comes first, any subsequent adjustments are recorded to the consolidated statements of operations.
Goodwill and Other Long-Lived Assets
The excess of the purchase price over the estimated fair value of net assets of businesses acquired in a business combination is recognized as goodwill. Goodwill is tested for impairment annually on November 1st or more frequently if certain indicators are present.
Long-lived assets, such as property and equipment and finite-lived intangible assets subject to amortization are reviewed for impairment whenever events or changes in circumstances indicate that the carrying amount of any asset may not be recoverable. Recoverability of assets to be held and used is measured by comparing the carrying amount to the estimated undiscounted future cash flows expected to be generated. If the carrying amount exceeds the undiscounted cash flows, the assets are determined to be impaired and an impairment charge is recognized as the amount by which the carrying amount exceeds its fair value.
80
The Company amortizes intangible assets with finite lives on a straight-line basis over their estimated useful lives in cost of revenue in the consolidated statements of operations.
Advertising Expenses
Advertising costs are expensed as incurred. Advertising expense was $9.4 million, $4.4 million, and $3.7 million for the years ended January 31, 2018, 2017 and 2016.
Deferred Offering Costs
Deferred offering costs consist primarily of accounting, legal and other fees related to the Company’s IPO. Upon completion of the offering, these costs are offset against the offering proceeds within the consolidated statements of redeemable convertible preferred stock and stockholders’ equity (deficit). As of January 31, 2017 there were $3.7 million, in deferred offering costs in other assets, noncurrent in the consolidated balance sheets. There were no deferred offering costs outstanding as of January 31, 2018.
Stock-Based Compensation
Stock-based compensation issued to employees, including the purchase rights issued under the Company's 2017 Employee Stock Purchase Plan (ESPP), is measured based on the grant-date fair value of the awards and recognized as an expense following the straight-line attribution method over the requisite service period for stock options, restricted stock units (RSUs) and restricted stock, and over the offering period for the purchase rights issued under the ESPP.
The Company’s use of the Black-Scholes option-pricing model to estimate the fair value of stock options granted requires the input of highly subjective assumptions. These assumptions and estimates are as follows:
Fair value — Prior to the IPO, the fair value of the shares of common stock underlying stock options had been established by the Company’s board of directors, which was responsible for these estimates, and had been based in part upon a valuation provided by a third-party valuation firm. Because there had been no public market for the Company’s common stock, its board of directors considered this independent valuation and other factors, including, but not limited to, revenue growth, the current status of the technical and commercial success of its operations, its financial condition, the stage of development and competition to establish the fair value of the Company’s common stock at the time of grant of the option. After the IPO, the Company used the publicly quoted price as reported on the Nasdaq Global Select Market as the fair value of its common stock.
Expected volatility — Expected volatility is a measure of the amount by which the stock price is expected to fluctuate. Since the Company does not have sufficient trading history of its common stock, it estimates the expected volatility of its stock options at their grant date by taking the weighted-average historical volatility of a group of comparable publicly-traded companies over a period equal to the expected life of the options.
Expected term — The Company determines the expected term based on the average period the stock options are expected to remain outstanding, generally calculated as the midpoint of the stock option’s vesting term and contractual expiration period, as the Company does not have sufficient historical information to develop reasonable expectations about future exercise patterns and post-vesting employment termination behavior.
Risk-free rate — The Company uses the U.S. Treasury yield that corresponds with the expected term.
Expected dividend yield — The Company utilizes a dividend yield of zero, as it does not currently issue dividends and does not expect to in the future.
Prior to the adoption of ASU 2016-09 on February 1, 2017, the estimated forfeiture rate was based on an analysis of actual forfeitures, analysis of historical and expected future employee turnover behavior and other factors. Furthermore, to the extent the Company’s actual forfeiture rate is different from this estimate, share-based compensation is adjusted accordingly.
Income Taxes
The Company accounts for income taxes in accordance with the liability method of accounting for income taxes. Under this method, the Company recognizes deferred tax assets and liabilities for the expected future tax consequences of temporary differences between the financial reporting and tax basis of assets and liabilities, as well as for operating
81
loss and tax credit carryforwards. Deferred tax assets and liabilities are measured using enacted tax rates that are expected to apply to taxable income for the years in which those tax assets and liabilities are expected to be realized or settled.
The Company records a valuation allowance to reduce its deferred tax assets to the net amount that the Company believes is more likely than not to be realized. In assessing the need for a valuation allowance, the Company has considered its historical levels of income, expectations of future taxable income and ongoing tax planning strategies. Because of the uncertainty of the realization of the deferred tax assets, the Company has recorded a full valuation allowance against its deferred tax assets. Realization of its deferred tax assets is dependent primarily upon future U.S. taxable income.
The Company recognizes and measures tax benefits from uncertain tax positions using a two-step approach.
The first step is to evaluate the tax position taken or expected to be taken by determining if the weight of available evidence indicates that it is more likely than not that the tax position will be sustained in an audit, including resolution of any related appeals or litigation processes. The second step is to measure the tax benefit as the largest amount that is more than 50% likely to be realized upon ultimate settlement. Significant judgment is required to evaluate uncertain tax positions.
Although the Company believes that it has adequately reserved for its uncertain tax positions, it can provide no assurance that the final tax outcome of these matters will not be materially different. The Company evaluates its uncertain tax position on a regular basis and evaluations are based on a number of factors, including changes in facts and circumstances, changes in tax law, correspondence with tax authorities during the course of an audit and effective settlement of audit issues.
To the extent that the final tax outcome of these matters is different than the amounts recorded, such differences will affect the provision for income taxes in the period in which such determination is made and could have a material impact on the Company’s financial condition and results of operations. The provision for income taxes includes the effects of any accruals that the Company believes are appropriate, as well as the related net interest and penalties.
Facility Leases
Certain facility lease agreements contain rent holidays, allowances and rent escalation provisions. For these leases, the Company recognizes the related rental expense on a straight-line basis over the lease period of the facility and records the difference between amounts charged to operations and amounts paid as deferred rent. These rent holidays, allowances and rent escalations are considered in determining the straight-line expense to be recorded over the lease term.
Concentrations of Risk and Significant Customers
The Company’s financial instruments that are exposed to concentrations of credit risk consist primarily of cash and cash equivalents, short-term investments and accounts receivable. Cash and cash equivalents and short-term investments are currently held in two financial institutions and, at times, may exceed federally insured limits.
As of January 31, 2018 and 2017 and for each of the three years ended January 31, 2018, no single customer represented greater than 10% of accounts receivable or greater than 10% of revenue, respectively.
In order to reduce the risk of downtime of the Company’s subscription services, the Company utilizes data center facilities operated by third parties located in Virginia, Oregon, Germany and Ireland. The Company has internal procedures to restore services in the event of disaster at any of its current data center facilities. Even with these procedures for disaster recovery in place, the Company’s subscription services could be significantly interrupted during the time period following a disaster at one of its sites and the subsequent restoration of services at another site.
82
Geographical Information
Revenue by location is determined by the billing address of the customer. The following table sets forth revenue by geographic area (in thousands):
Year Ended January 31, | |||||||||||
2018 | 2017 | 2016 | |||||||||
United States | $ | 220,382 | $ | 138,925 | $ | 75,583 | |||||
International | 39,608 | 21,401 | 10,324 | ||||||||
Total | $ | 259,990 | $ | 160,326 | $ | 85,907 | |||||
Other than the United States, no individual country exceeded 10% of total revenue for the years ended January 31, 2018, 2017 and 2016. Property and equipment by geographic location is based on the location of the legal entity that owns the asset. As of January 31, 2018 and 2017, substantially all of the Company’s property and equipment was located in the United States.
Net Loss per Share
The Company computes basic and diluted net loss per share attributable to common stockholders in conformity with the two-class method required for participating securities. Under the two-class method, basic net loss per share attributable to common stockholders is calculated by dividing the net loss attributable to common stockholders by the weighted-average number of shares of common stock outstanding during the period, less shares subject to repurchase, without consideration for potentially dilutive securities as they do not share in losses. The diluted net loss per share attributable to common stockholders is computed giving effect to all potential dilutive common stock equivalents outstanding for the period. For purposes of this calculation, options to purchase common stock, unvested RSUs, purchase rights issued under the ESPP, shares subject to repurchase from early exercised options, and unvested common stock and restricted stock issued in connection with certain business combinations are considered common stock equivalents but have been excluded from the calculation of diluted net loss per share attributable to common stockholders as the effect is antidilutive. Since the Company's IPO, Class A and Class B common stock are the only outstanding equity of the Company. The rights of the holders of Class A and Class B common stock are identical, except with respect to voting and conversion rights. See Note 10.
Recently Adopted Accounting Pronouncements
In May 2014, the Financial Accounting Standards Board (FASB) issued ASU No. 2014-09, Revenue from Contracts with Customers (Topic 606) (ASU 2014-09) and has modified the standard thereafter. The standard replaces existing revenue recognition rules with a comprehensive revenue measurement and recognition standard and expanded disclosure requirements. ASU 2014-09, as amended, becomes effective for the Company on February 1, 2018. The standard permits the use of either the retrospective or modified retrospective transition method. Under the retrospective transition method, the standard applies to contracts in all reporting periods presented. Under the modified retrospective transition method, the standard applies only to contracts still open as of February 1, 2018, recognizing in beginning retained earnings an adjustment for the cumulative effect of the change and providing additional disclosures comparing results to previous standards.
The new standard will impact the following policies and disclosures:
• | removal of the current limitation on contingent revenue will result in revenue being recognized earlier for certain contracts; |
• | revenue for all professional services will be recognized based on proportional performance; |
• | required disclosures including information about the transaction price allocated to remaining performance obligations and related timing of revenue recognition; and |
• | accounting for deferred commissions including expanding the costs that qualify for deferral and increasing the amortization period beyond the initial contract to include anticipated renewals. |
83
On February 1, 2018, the Company adopted the requirements of Topic 606 using the retrospective transition method. The impact of adopting the new standard on the Company's fiscal 2018 and fiscal 2017 revenues is not material. The primary impact of adopting the new standard relates to the deferral of incremental commission costs of obtaining subscription contracts. Under Topic 605, the Company deferred only direct and incremental commission costs to obtain a contract and amortized those costs on a straight-line basis over the noncancelable term of the related subscription contract, which was generally one to three years. Under the new standard, the Company defers all incremental commission costs to obtain the contract. The Company amortizes these costs on a straight-line basis over a period of benefit, determined to be five years.
Select consolidated statement of operations line items, which reflect the adoption of the new standard are as follows (in millions, except per share data):
Year Ended January 31, | |||||||||||||||||||||||
2018 | 2017 | ||||||||||||||||||||||
As Reported | Adoption of ASU 2014-09 | As Adjusted | As Reported | Adoption of ASU 2014-09 | As Adjusted | ||||||||||||||||||
Revenue | |||||||||||||||||||||||
Subscription | $ | 239.2 | $ | (1.2 | ) | $ | 238.0 | $ | 143.1 | $ | 1.9 | $ | 145.0 | ||||||||||
Professional services and other | 20.8 | (0.7 | ) | 20.1 | 17.2 | (2.1 | ) | 15.1 | |||||||||||||||
Total revenue | 260.0 | (1.9 | ) | 258.1 | 160.3 | (0.2 | ) | 160.1 | |||||||||||||||
Sales and marketing | 173.0 | (8.0 | ) | 165.0 | 118.7 | (8.0 | ) | 110.8 | |||||||||||||||
Total operating expenses | 295.6 | (8.0 | ) | 287.6 | 187.5 | (8.0 | ) | 179.5 | |||||||||||||||
Net loss | (114.4 | ) | 6.1 | (108.3 | ) | (83.5 | ) | 7.8 | (75.7 | ) | |||||||||||||
Net loss per share, basic and diluted | (1.38 | ) | 0.08 | (1.30 | ) | (4.39 | ) | 0.41 | (3.98 | ) | |||||||||||||
84
Select consolidated balance sheet line items, which reflect the adoption of the new standard are as follows (in millions):
As of January 31, 2018 | As of January 31, 2017 | ||||||||||||||||||||||
As Reported | Adoption of ASU 2014-09 | As Adjusted | As Reported | Adoption of ASU 2014-09 | As Adjusted | ||||||||||||||||||
Assets | |||||||||||||||||||||||
Current assets: | |||||||||||||||||||||||
Deferred commissions | $ | 16.5 | $ | 1.3 | $ | 17.8 | $ | 13.5 | $ | (0.3 | ) | $ | 13.2 | ||||||||||
Prepaid expenses and other current assets | 17.0 | 0.4 | 17.4 | 7.0 | 1.3 | 8.3 | |||||||||||||||||
Total current assets | 315.4 | 1.7 | 317.1 | 92.8 | 1.0 | 93.8 | |||||||||||||||||
Deferred commissions, noncurrent | 11.0 | 29.8 | 40.8 | 10.1 | 23.4 | 33.5 | |||||||||||||||||
Total assets | $ | 367.4 | $ | 31.5 | $ | 398.9 | $ | 130.6 | $ | 24.4 | $ | 155.0 | |||||||||||
Liabilities and stockholders’ equity (deficit) | |||||||||||||||||||||||
Deferred revenue | $ | 162.6 | $ | (3.3 | ) | $ | 159.3 | $ | 108.0 | $ | (3.9 | ) | $ | 104.1 | |||||||||
Total current liabilities | 190.8 | (3.3 | ) | 187.5 | 134.5 | (3.9 | ) | 130.6 | |||||||||||||||
Deferred revenue, noncurrent | 6.0 | (0.7 | ) | 5.3 | 5.7 | (1.0 | ) | 4.7 | |||||||||||||||
Total liabilities | 203.8 | (4.0 | ) | 199.8 | 146.3 | (5.0 | ) | 141.3 | |||||||||||||||
Accumulated deficit | (402.5 | ) | 35.5 | (367.0 | ) | (287.9 | ) | 29.4 | (258.5 | ) | |||||||||||||
Total stockholders’ equity (deficit) | $ | 163.6 | $ | 35.5 | $ | 199.1 | $ | (243.6 | ) | $ | 29.4 | $ | (214.2 | ) | |||||||||
Adoption of the standards related to revenue recognition had no impact to cash provided by or used in operating, financing, or investing activities on our consolidated cash flows statements. Additionally, the adoption of the standards did not have a material impact on taxes. The adoption adjustments impacted the deferred taxes pertaining to the U.S. entity which are subject to a full valuation allowance.
In January 2016, the FASB issued ASU No. 2016-01 (Subtopic 825-10), Financial Instruments Overall: Recognition and Measurement of Financial Assets and Financial Liabilities (ASU 2016-01), which primarily affects the accounting for equity investments, financial liabilities under the fair value option and the presentation and disclosure requirements for financial instruments. In addition, the FASB clarified guidance related to the valuation allowance assessment when recognizing deferred tax assets resulting from unrealized losses on available-for-sale debt securities. The accounting for other financial instruments, such as loans, investments in debt securities and financial liabilities is largely unchanged. ASU 2016-01 is effective for fiscal years beginning after December 15, 2017 and interim periods in fiscal years beginning after December 15, 2018. Early adoption is permitted. The Company adopted ASU 2016-01 as of the beginning of its fiscal year ended January 31, 2018. The adoption of this standard did not have a material impact on the Company’s consolidated financial statements.
In March 2016, the FASB issued Accounting Standards Update (ASU) No. 2016-09, Compensation—Stock Compensation (Topic 718): Improvements to Employee Share-Based Payment Accounting. This new guidance was intended to simplify several areas of accounting for stock-based compensation arrangements, including the accounting for income taxes, the classification of excess tax benefits on the statement of cash flows and the accounting for forfeitures. This guidance is effective for fiscal years, and interim periods within those years, beginning after December 15, 2016. The Company adopted this guidance as of the beginning of its fiscal year ended January 31, 2018. The new guidance allows entities to account for forfeitures as they occur. The Company elected to account for forfeitures as they occur and adopted this provision on a modified retrospective basis. An adjustment of $0.2 million representing cumulative prior years’ impact was recognized as an adjustment to decrease retained earnings in the period of adoption. The amendments related to the accounting for income taxes and classification of excess tax benefits on the statement of cash flows were adopted prospectively. Adoption of all other changes in the new guidance did not have a significant impact on the Company's consolidated financial statements.
In January 2017, the FASB issued ASU No. 2017-01, Business Combinations (Topic 805) Clarifying the Definition of a Business (ASU 2017-01), which amends the guidance of FASB Accounting Standards Codification Topic 805,
85
“Business Combinations,” adding guidance to assist entities with evaluating whether transactions should be accounted for as acquisitions or disposals of assets or businesses. The definition of a business affects many areas of accounting including acquisitions, disposals, goodwill, and consolidation. This guidance is effective for annual and interim periods beginning after December 15, 2017, and early adoption is permitted under certain circumstances. The Company early adopted this guidance as of the beginning of its fiscal year ended January 31, 2018. The adoption of this standard did not have a material impact on the Company’s consolidated financial statements.
In January 2017, the FASB issued ASU No. 2017-04, Simplifying the Test for Goodwill Impairment (ASU 2017-04), which removes the second step of the goodwill impairment test that requires a hypothetical purchase price allocation. A goodwill impairment will now be the amount by which a reporting unit’s carrying value exceeds its fair value, not to exceed the carrying amount of goodwill. This guidance is effective for interim and annual reporting periods beginning after December 15, 2019 and will be applied prospectively. Early adoption is permitted for annual or any interim impairment tests with a measurement date on or after January 1, 2017. The Company early adopted this guidance as of the beginning of its fiscal year ended January 31, 2018. In November 2017, the Company performed an annual goodwill impairment review by comparing the fair value of its reporting unit with its carrying amount. Based on the annual assessment, no indicator of impairment was noted and as such no impairment charge was recorded during the year ended January 31, 2018. The adoption of this standard did not have a material impact on the Company’s consolidated financial statements.
In May 2017, the FASB issued ASU No. 2017-09, Compensation—Stock Compensation (Topic 718) Scope of Modification Accounting (ASU 2017-09), which clarifies which changes to the terms or conditions of a share-based payment award are subject to the guidance on modification accounting. Entities would apply the modification accounting guidance unless the value, vesting requirements and classification of a share-based payment award are the same immediately before and after a change to the terms or conditions of the award. This guidance is effective for annual and interim periods beginning after December 15, 2017, and will be applied prospectively to awards modified on or after the effective date. The Company early adopted this guidance as of the beginning of its fiscal year ended January 31, 2018. The adoption of this standard did not have a material impact on the Company’s consolidated financial statements.
Recent Accounting Pronouncements Not Yet Adopted
In February 2016, the FASB issued ASU No. 2016-02 (Topic 842), Leases (ASU 2016-02), which supersedes the guidance in topic ASC 840, Leases. The new standard requires lessees to apply a dual approach, classifying leases as either finance or operating leases based on the principle of whether or not the lease is effectively a financed purchase by the lessee. This classification will determine whether lease expense is recognized based on an effective interest method or on a straight-line basis over the term of the lease. A lessee is also required to record a right-of-use asset and a lease liability for all leases with a term of greater than 12 months regardless of their classification. Leases with a term of 12 months or less will be accounted for similar to existing guidance for operating leases today. Under the standard, disclosures are required to meet the objective of enabling users of financial statements to assess the amount, timing, and uncertainty of cash flows arising from leases. The Company will be required to recognize and measure leases existing at, or entered into after, the beginning of the earliest comparative period presented using a modified retrospective approach, with certain practical expedients available. ASU 2016-02 is effective for fiscal years beginning after December 15, 2018 and interim periods within those fiscal years. Early adoption is permitted. The Company is currently evaluating the impact of the adoption of this standard on its consolidated financial statements.
In February 2018, the FASB issued ASU No. 2018-02, Reclassification of Certain Tax Effects from Accumulated Other Comprehensive Income (ASU 2018-02). Under existing U.S. GAAP, the effects of changes in tax rates and laws on deferred tax balances are recorded as a component of income tax expense in the period in which the law was enacted. When deferred tax balances related to items originally recorded in accumulated other comprehensive income (loss) are adjusted, certain tax effects become stranded in accumulated other comprehensive income. The amendments in ASU 2018-02 allow a reclassification from accumulated other comprehensive income (loss) to retained earnings (accumulated deficit) for stranded income tax effects resulting from the 2017 Tax Cuts and Jobs Act. The amendments in this ASU also require certain disclosures about stranded income tax effects. The guidance is effective for fiscal years beginning after December 15, 2018, and interim periods within those fiscal years. Early adoption in any period is permitted. The Company’s provisional adjustments recorded in FY18 to account for the impact of the 2017 Tax Cuts and Jobs Act did not result in stranded tax effects. The Company does not anticipate the adoption of this standard will have a material impact on the Company's consolidated financial statements.
86
3. Acquisition
Stormpath
On February 17, 2017, the Company acquired the rights to hire certain employees and a non-exclusive intellectual property license from Stormpath, Inc. (Stormpath), a privately-held technology company which had built a user management and authentication service for software development teams. The transaction has been accounted for as a business combination and is expected to enhance the Company’s product offerings and service by leveraging the talents of the engineering teams. The total consideration of $3.7 million, consisting of 200,000 shares of common stock valued at $2.2 million issued to Stormpath and replacement awards valued at $1.5 million issued to the hired employees, was recognized as goodwill. See Note 11 for further details on replacement awards issued in this transaction. Goodwill is not deductible for tax purposes.
Pro forma results of operations for the transaction have not been presented as they were not material to the consolidated statements of operations.
In addition, the Company issued an incremental 800,000 shares of restricted common stock valued at $8.6 million to Stormpath in connection with the transaction. These shares of restricted common stock will vest ratably on the first and second anniversaries of the transaction date upon achieving the respective performance conditions, including the continued employment of certain employees with Okta and the wind down of the Stormpath, Inc. entity. The aggregate fair value of the shares of restricted common stock, as determined on the date of the transaction, will be recognized as post-combination stock-based compensation in the statement of operations over two years based on an accelerated attribution method. See Note 11 for further details.
4. Cash Equivalents and Short-term Investments
The amortized costs, unrealized gains and losses and estimated fair values of the Company’s cash equivalents and short-term investments as of January 31, 2018 and 2017 were as follows (in thousands):
As of January 31, 2018 | |||||||||||||||
Amortized Cost | Unrealized Gain | Unrealized Loss | Estimated Fair Value | ||||||||||||
Cash equivalents: | |||||||||||||||
Money market funds | $ | 90,770 | $ | — | $ | — | $ | 90,770 | |||||||
Total cash equivalents | $ | 90,770 | $ | — | $ | — | $ | 90,770 | |||||||
Short-term investments: | |||||||||||||||
Commercial paper | $ | 15,946 | $ | — | $ | — | $ | 15,946 | |||||||
U.S. treasury securities | 61,896 | — | (158 | ) | 61,738 | ||||||||||
Corporate debt securities | 24,125 | — | (44 | ) | 24,081 | ||||||||||
Total short-term investments | 101,967 | — | (202 | ) | 101,765 | ||||||||||
Total | $ | 192,737 | $ | — | $ | (202 | ) | $ | 192,535 | ||||||
As of January 31, 2017 | |||||||||||||||
Amortized Cost | Unrealized Gain | Unrealized Loss | Estimated Fair Value | ||||||||||||
Cash equivalents: | |||||||||||||||
Money market funds | $ | 10,565 | $ | — | $ | — | $ | 10,565 | |||||||
Total cash equivalents | $ | 10,565 | $ | — | $ | — | $ | 10,565 | |||||||
Short-term investments: | |||||||||||||||
Asset-backed securities | $ | 1,538 | $ | — | $ | — | $ | 1,538 | |||||||
Corporate debt securities | 12,842 | 13 | (3 | ) | 12,852 | ||||||||||
Total short-term investments | 14,380 | 13 | (3 | ) | 14,390 | ||||||||||
Total | $ | 24,945 | $ | 13 | $ | (3 | ) | $ | 24,955 | ||||||
87
All short-term investments were designated as available-for-sale securities as of January 31, 2018 and 2017.
The following tables present the contractual maturities of the Company’s short-term investments as of January 31, 2018 and 2017 (in thousands):
As of January 31, 2018 | As of January 31, 2017 | ||||||||||||||
Amortized Cost | Estimated Fair Value | Amortized Cost | Estimated Fair Value | ||||||||||||
Due within one year | $ | 93,421 | $ | 93,237 | $ | 12,842 | $ | 12,852 | |||||||
Due between one to five years | 8,546 | 8,528 | 1,538 | 1,538 | |||||||||||
$ | 101,967 | $ | 101,765 | $ | 14,380 | $ | 14,390 | ||||||||
The Company had 23 and five short-term investments in unrealized loss positions as of January 31, 2018 and 2017, respectively. There were no material gross unrealized gains or losses from available-for-sale securities and no material realized gains or losses from available-for-sale securities that were reclassified out of accumulated other comprehensive income for the years ended January 31, 2018, 2017 or 2016.
For available-for-sale debt securities that have unrealized losses, the Company evaluates whether (i) it has the intention to sell any of these investments and (ii) whether it is not more likely than not that it will be required to sell any of these available-for-sale debt securities before recovery of the entire amortized cost basis. Based on this evaluation, the Company determined that there were no other-than-temporary impairments associated with short-term investments as of January 31, 2018 and 2017.
5. Fair Value Measurements
The Company measures its financial assets at fair value each reporting period using a fair value hierarchy that prioritizes the use of observable inputs and minimizes the use of unobservable inputs when measuring fair value. A financial instrument’s classification within the fair value hierarchy is based upon the lowest level of input that is significant to the fair value measurement.
Three levels of inputs maybe used to measure as follows:
Level 1-Valuations based on observable inputs that reflect quoted prices for identical assets or liabilities in active markets.
Level 2-Valuations based on other inputs that are directly or indirectly observable in the marketplace.
Level 3-Valuations based on unobservable inputs that are supported by little or no market activity.
88
Assets and Liabilities Measured at Fair Value on a Recurring Basis
The following table presents information about the Company’s financial assets that are measured at fair value on a recurring basis using the above input categories (in thousands):
As of January 31, 2018 | |||||||||||||||
Level 1 | Level 2 | Level 3 | Total | ||||||||||||
Assets: | |||||||||||||||
Cash equivalents: | |||||||||||||||
Money market funds | $ | 90,770 | $ | — | $ | — | $ | 90,770 | |||||||
Total cash equivalents | $ | 90,770 | $ | — | $ | — | $ | 90,770 | |||||||
Short-term investments: | |||||||||||||||
Commercial paper | $ | — | $ | 15,946 | $ | — | $ | 15,946 | |||||||
U.S. treasury securities | — | 61,738 | — | 61,738 | |||||||||||
Corporate debt securities | — | 24,081 | — | 24,081 | |||||||||||
Total short-term investments | — | 101,765 | — | 101,765 | |||||||||||
Total cash equivalents and short-term investments | $ | 90,770 | $ | 101,765 | $ | — | $ | 192,535 | |||||||
As of January 31, 2017 | |||||||||||||||
Level 1 | Level 2 | Level 3 | Total | ||||||||||||
Assets: | |||||||||||||||
Cash equivalents: | |||||||||||||||
Money market funds | $ | 10,565 | $ | — | $ | — | $ | 10,565 | |||||||
Total cash equivalents | $ | 10,565 | $ | — | $ | — | $ | 10,565 | |||||||
Short-term investments: | |||||||||||||||
Asset-backed securities | $ | — | $ | 1,538 | $ | — | $ | 1,538 | |||||||
Corporate debt securities | — | 12,852 | — | 12,852 | |||||||||||
Total short-term investments | — | 14,390 | — | 14,390 | |||||||||||
Total cash equivalents and short-term investments | $ | 10,565 | $ | 14,390 | $ | — | $ | 24,955 | |||||||
Liabilities: | |||||||||||||||
Series B redeemable convertible preferred stock warrant | $ | — | $ | — | $ | 304 | $ | 304 | |||||||
During the three months ended April 30, 2017, the Series B redeemable convertible preferred stock warrant liability that was outstanding as of January 31, 2017 was exercised. The corresponding warrant liability was remeasured to fair value based upon the value of the underlying common stock issued at the IPO and reclassified to additional paid-in capital. The expense resulting from remeasurement was recognized in other income (expense), net in the consolidated statements of operations.
The change in the fair value of the Series B redeemable convertible preferred stock warrant was as follows (in thousands):
Balance at January 31, 2016 | $ | 237 | |
Increase in fair value of warrant | 67 | ||
Balance at January 31, 2017 | 304 | ||
Increase in fair value of warrant | 104 | ||
Reclassification of remaining warrant liability to additional paid-in capital | (408 | ) | |
Balance at January 31, 2018 | $ | — | |
During the years ended January 31, 2018, 2017 and 2016, the Company had no transfers between levels of the fair value hierarchy of its assets measured at fair value.
89
Assets and Liabilities Measured at Fair Value on a Recurring Basis
The carrying amounts of certain financial instruments, including cash held in banks, accounts receivable and accounts payable approximate fair value due to their short-term maturities and are excluded from the fair value table above.
6. Goodwill and Intangible Assets, net
Goodwill
During the three months ended April 30, 2017, the Company recorded $3.7 million of goodwill related to its transaction with Stormpath (see Note 3). No goodwill impairments were recorded during the years ended January 31, 2018, 2017 and 2016.
Goodwill balances as of January 31, 2018 and 2017 were as follows (in thousands):
Balance as of January 31, 2017 | $ | 2,630 | |
Goodwill recorded in connection with Stormpath acquisition | 3,652 | ||
Balance as of January 31, 2018 | $ | 6,282 | |
Intangible Assets, net
Intangible assets consisted of the following (in thousands):
As of January 31, 2018 | |||||||||||||||
Gross | Accumulated Amortization | Write-offs | Net | ||||||||||||
Capitalized internal-use software costs | $ | 17,511 | $ | (5,172 | ) | $ | (1,077 | ) | $ | 11,262 | |||||
Software licenses | 1,094 | (558 | ) | (37 | ) | 499 | |||||||||
Purchased developed technology | 570 | (570 | ) | — | — | ||||||||||
$ | 19,175 | $ | (6,300 | ) | $ | (1,114 | ) | $ | 11,761 | ||||||
As of January 31, 2017 | |||||||||||||||
Gross | Accumulated Amortization | Write-offs | Net | ||||||||||||
Capitalized internal-use software costs | $ | 10,859 | $ | (2,487 | ) | $ | — | $ | 8,372 | ||||||
Software licenses | 1,093 | (314 | ) | — | 779 | ||||||||||
Purchased developed technology | 570 | (566 | ) | — | 4 | ||||||||||
$ | 12,522 | $ | (3,367 | ) | $ | — | $ | 9,155 | |||||||
The Company capitalized $6.7 million and $6.1 million of internal-use software during the years ended January 31, 2018 and 2017, respectively, which included $1.2 million and $0.6 million of stock-based compensation costs, respectively. Amortization expense of capitalized internal-use software costs totaled $2.7 million, $1.6 million and $0.7 million during the years ended January 31, 2018, 2017 and 2016, respectively. The Company reversed $1.1 million of previously capitalized costs in the year ended January 31, 2018 as they were not realizable. The charge was recognized in research and development in the consolidated statements of operations.
The Company acquired $0.4 million of software licenses to support its operations in the year ended January 31, 2017 and did not acquire software licenses in the year ended January 31, 2018.
Amortization expense of intangible assets for the years ended January 31, 2018, 2017 and 2016 was $2.9 million, $1.8 million, and $0.9 million, respectively.
90
As of January 31, 2018, estimated remaining amortization expense for the intangible assets by fiscal year is as follows (in thousands):
2019 | $ | 2,954 | |
2020 | 1,943 | ||
2021 | 6,864 | ||
Total | $ | 11,761 | |
7. Balance Sheet Components
Property and Equipment, net
Property and equipment consisted of the following (in thousands):
As of January 31, | |||||||
2018 | 2017 | ||||||
Computers and equipment | $ | 5,384 | $ | 3,753 | |||
Furniture and fixtures | 7,083 | 4,204 | |||||
Leasehold improvements | 8,188 | 7,175 | |||||
Property and equipment, gross | 20,655 | 15,132 | |||||
Less accumulated depreciation | (8,115 | ) | (4,106 | ) | |||
Property and equipment, net | $ | 12,540 | $ | 11,026 | |||
Depreciation expense was $4.0 million, $2.4 million and $1.1 million for the years ended January 31, 2018, 2017 and 2016, respectively.
Allowances
The Company’s allowances for the years ended January 31, 2018, 2017 and 2016 are as follows (in thousands):
As of January 31, | |||||||||||
2018 | 2017 | 2016 | |||||||||
Balance, beginning of period | $ | 1,306 | $ | 861 | $ | 117 | |||||
Additions | 431 | 1,185 | 979 | ||||||||
Write-offs | (265 | ) | (740 | ) | (235 | ) | |||||
Balance, end of period | $ | 1,472 | $ | 1,306 | $ | 861 | |||||
91
Accrued Expenses and Other Current Liabilities
Accrued expenses and other current liabilities consisted of the following (in thousands):
As of January 31, | |||||||
2018 | 2017 | ||||||
Deposit related to early exercise of unvested options | $ | 1,119 | $ | 2,168 | |||
Accrued expenses | 3,389 | 4,297 | |||||
Redeemable convertible preferred stock warrant liability | — | 304 | |||||
Accrued taxes payable | 835 | 826 | |||||
Deferred rent, current | 520 | 225 | |||||
Other | 324 | 543 | |||||
Accrued expenses and other current liabilities | $ | 6,187 | $ | 8,363 | |||
Other Liabilities, noncurrent
Other liabilities, noncurrent consisted of the following (in thousands):
As of January 31, | |||||||
2018 | 2017 | ||||||
Deferred rent, noncurrent | $ | 5,010 | $ | 4,615 | |||
Deferred tax liabilities | 175 | 132 | |||||
Other | 1,832 | 1,332 | |||||
Other liabilities, noncurrent | $ | 7,017 | $ | 6,079 | |||
8. Debt
Loan and Security Agreement
On March 10, 2014, the Company entered into a line of credit and term loan agreement with Silicon Valley Bank (SVB) in the amount of $5 million and $10.0 million, respectively. On June 17, 2015, the Company expanded its line of credit from $5.0 million to $20.0 million and extended the term by one year to mature on March 10, 2017. On November 21, 2016, the Company amended the agreement to extend the maturity date to November 21, 2018 and increase the borrowing capacity of the line of credit (Revolving Line) to $40.0 million. The available amount, not to exceed $40.0 million, is based on certain revenue metrics and is reduced by letters of credit totaling $4.2 million as of January 31, 2018 established in connection with facility lease agreements. As of January 31, 2018, $35.8 million was available under the Revolving Line.
Proceeds from loans made under the Revolving Line may be borrowed, repaid and reborrowed until November 21, 2018. Repayment of any outstanding proceeds are payable on November 21, 2018, but may be prepaid without penalty. Borrowings under the Revolving Line bear interest at an annual rate based on the one-year Prime rate plus a spread of 0.75%. Interest is payable quarterly. The Company is required to pay a quarterly facility fee to SVB of 0.15% per annum on the average undrawn portion available under the facility plus balances of outstanding letters of credits. Additionally, the Company is required to pay an upfront, one-time, commitment fee of $0.1 million and annual anniversary fees of $0.1 million on the amendment’s first and second anniversary dates.
As of January 31, 2018 and 2017, no amounts had been drawn under the Revolving Line and the Company was in compliance with all covenants pursuant to the loan and security agreement.
As part of the initial loan agreement, upon closing, the Company granted SVB a warrant to purchase 187,500 shares of common stock at $1.40 per share, with a potential to acquire up to an additional 112,500 shares of common
92
stock at the same price, which right would be triggered upon future amounts drawn under the loan agreement. No additional amounts were drawn under the credit facility and as such, the conditional warrant to acquire up to an additional 112,500 shares was not issued. The fair value of the common stock warrant at the time of issuance was recorded as debt issuance costs. Upon exercise of the warrant in March 2017 in conjunction with the IPO, 168,750 shares were issued and 18,750 shares were withheld by the Company in lieu of cash exercise.
9. Commitments and Contingencies
Leases
The Company leases office space under noncancelable operating leases for its San Francisco, California headquarters, as well as its offices in various cities in the United States, United Kingdom, Australia and Canada. These office leases expire on various dates through October 2028.
These leases include a nine-year lease in San Francisco for which the Company is entitled to receive tenant incentives of $1.8 million, all of which was received as of January 31, 2017. Leasehold improvements associated with this lease are being amortized over its lease term.
In December 2017, the Company entered into an office lease in San Francisco expected to become the Company’s new corporate headquarters. This lease has a 10 year term, which is expected to expire in October 2028. The Company is entitled to two five-year options to extend this lease, subject to certain requirements. The total commitment is $206.3 million with a tenant improvement allowance of up to $24.7 million. The Company secured the lease obligation with an $8 million letter of credit, which is designated as restricted cash and included in other assets on its consolidated balance sheet as of January 31, 2018.
In August 2017, the Company executed an amendment to its San Jose lease to add space and to extend the lease term through August 2024. The incremental commitment for the additional space is $6.6 million with a tenant improvement allowance of up to $0.8 million. Rental payments will commence in March 2018.
As of January 31, 2018, the future minimum lease payments by fiscal year under various operating leases and purchase obligations, such as data center operations and sales and marketing activities, are as follows (in thousands):
Operating Leases | Purchase Obligations | Total | ||||||||||
2019 | $ | 14,105 | $ | 13,048 | $ | 27,153 | ||||||
2020 | 18,243 | 13,077 | 31,320 | |||||||||
2021 | 24,719 | 4,347 | 29,066 | |||||||||
2022 | 26,521 | — | 26,521 | |||||||||
2023 | 26,487 | — | 26,487 | |||||||||
Thereafter | 144,386 | — | 144,386 | |||||||||
Total contractual obligations | $ | 254,461 | $ | 30,472 | $ | 284,933 | ||||||
Deferred rent was $5.5 million and $4.8 million as of January 31, 2018 and 2017, respectively, and is included in accrued expenses and other current liabilities and other liabilities, noncurrent in the consolidated balance sheets. Rent expense was $10.6 million, $7.4 million and $5.2 million for the years ended January 31, 2018, 2017 and 2016, respectively.
In conjunction with the execution of the leases, letters of credit in the aggregate amount of $12.2 million and $5.4 million were issued and outstanding as of January 31, 2018 and 2017, respectively. No draws have been made under such letters of credit.
Legal Matters
From time to time in the normal course of business, the Company may be subject to various legal matters such as threatened or pending claims or proceedings. There were no material such matters as of January 31, 2018 and 2017.
Warranties and Indemnification
The Company’s subscription services are generally warranted to perform materially in accordance with the Company’s online help documentation under normal use and circumstances. Additionally, the Company’s arrangements generally include provisions for indemnifying customers against liabilities if its subscription services infringe a third party’s intellectual property rights. Furthermore, the Company may also incur liabilities if it breaches the security or confidentiality obligations in its arrangements. To date, the Company has not incurred significant costs and has not accrued a liability in the accompanying consolidated financial statements as a result of these obligations.
The Company has entered into service-level agreements with a majority of its customers defining levels of uptime reliability and performance and permitting those customers to receive credits for prepaid amounts related to unused subscription services if the Company fails to meet the defined levels of uptime. In very limited instances, the Company allows customers to early terminate their agreements in the event that the Company fails to meet those levels as they may constitute a breach of contract. If the customer did terminate, they would receive a refund of prepaid unused subscription fees. To date, the Company has not experienced any significant failures to meet defined levels of uptime reliability and performance as a result of those agreements and, as a result, the Company has not accrued any liabilities related to these agreements in the consolidated financial statements.
10. Common Stock and Stockholders' Equity (Deficit)
Redeemable Convertible Preferred Stock
Immediately prior to the completion of the IPO in April 2017, all shares of redeemable convertible preferred stock then outstanding were converted into 59,491,640 shares of common stock on a one-to-one basis and then immediately reclassified into Class B common stock and additional paid-in capital. As of January 31, 2018, there were no shares of redeemable convertible preferred stock issued and outstanding.
The authorized, issued and outstanding shares of redeemable convertible preferred stock (Preferred Stock) and liquidation preferences as of January 31, 2017 were as follows:
Series | Authorized Shares | Issued and Outstanding Shares | Liquidation Preference | Carrying Value | |||||||||
Series A | 14,210,789 | 14,210,783 | $ | 11,373,000 | $ | 11,322,000 | |||||||
Series B | 12,015,123 | 11,986,055 | 16,500,000 | 16,420,000 | |||||||||
Series C | 10,708,782 | 10,708,780 | 25,000,000 | 24,872,000 | |||||||||
Series D | 6,833,654 | 6,833,651 | 27,500,000 | 27,416,000 | |||||||||
Series E | 9,484,234 | 9,484,234 | 75,000,000 | 74,500,000 | |||||||||
Series F | 6,242,000 | 6,241,936 | 75,000,000 | 73,424,000 | |||||||||
59,494,582 | 59,465,439 | $ | 230,373,000 | $ | 227,954,000 | ||||||||
Series B Redeemable Convertible Preferred Stock Warrant
As of January 31, 2017, there was an outstanding warrant to purchase 29,058 shares of Series B redeemable convertible Preferred Stock at $1.38 per share (Series B warrant). The fair value of the Series B warrant was $0.3 million as of January 31, 2017. The Series B warrant was net exercised at the IPO price immediately following the completion of the Company's IPO in April 2017, and was reclassified to additional paid-in capital.
Common Stock
Immediately prior to the completion of the IPO, all shares of common stock then outstanding were reclassified into Class B common stock. Shares offered and sold in the IPO consisted of the newly authorized shares of Class A common stock.
As of January 31, 2018, the Company had authorized 1,000,000,000 shares of Class A common stock and had authorized 120,000,000 shares of Class B common stock, each with par value $0.0001 per share. As of January 31, 2017, the Company had authorized 120,000,000 shares of common stock with par value $0.0001 per share. As
93
of January 31, 2018, 70,609,898 shares of Class A common stock and 33,361,106 shares of Class B common stock were issued and outstanding. Holders of Class A and Class B common stock are entitled to one vote per share and 10 votes per share, respectively, and the shares of Class A common stock and Class B common stock are identical, except for voting and conversion rights. Shares of Class B common stock may be converted into Class A common stock at any time at the option of the stockholder on a one-for-one basis, and are automatically converted into Class A common stock upon sale or transfer, subject to certain limited exceptions. Shares of Class A common stock are not convertible.
As of January 31, 2018, shares of common stock reserved for future issuance are as follows:
Options and unvested RSUs outstanding | 27,779,974 | |
Available for future stock option and RSU grants | 9,842,925 | |
Available for ESPP | 2,430,627 | |
40,053,526 | ||
Awards Issued as Charitable Contributions
During the year ended January 31, 2018, the Company issued 24,287 shares of Class A common stock as charitable contributions and recognized $0.7 million as general and administrative expense in the consolidated statement of operations. During the years ended January 31, 2017 and 2016, the Company issued 13,935 and 17,433 shares, respectively, of Class B common stock as charitable contributions and recognized $0.1 million for both respective periods as general and administrative expense in the consolidated statement of operations.
11. Employee Incentive Plans
The Company’s equity incentive plans provide for granting stock options, RSUs and restricted stock awards to employees, consultants, officers and directors. In addition, the Company offers an ESPP to eligible employees.
Stock-based compensation expense by award type was as follows (in thousands):
Year Ended January 31, | |||||||||||
2018 | 2017 | 2016 | |||||||||
Stock options | $ | 24,186 | $ | 17,127 | $ | 9,832 | |||||
RSUs | 9,104 | — | — | ||||||||
ESPP | 7,111 | — | — | ||||||||
Restricted stock awards | 3,281 | — | — | ||||||||
Restricted common stock | 6,178 | — | — | ||||||||
Total | $ | 49,860 | $ | 17,127 | $ | 9,832 | |||||
94
Stock-based compensation expense was recorded in the following cost and expense categories in the Company’s consolidated statements of operations (in thousands):
Year Ended January 31, | |||||||||||
2018 | 2017 | 2016 | |||||||||
Cost of revenue: | |||||||||||
Subscription | $ | 4,600 | $ | 1,979 | $ | 909 | |||||
Professional services and other | 3,137 | 1,283 | 553 | ||||||||
Research and development | 18,107 | 2,992 | 1,748 | ||||||||
Sales and marketing | 13,242 | 6,029 | 2,853 | ||||||||
General and administrative | 10,774 | 4,844 | 3,769 | ||||||||
Total | $ | 49,860 | $ | 17,127 | $ | 9,832 | |||||
Stock-based compensation expense recorded to research and development in the consolidated statements of operations exclude amounts that were capitalized related to internal-use software for the years ended January 31, 2018, 2017 and 2016. Refer to Note 6 for additional details.
Equity Incentive Plans
The Company has two equity incentive plans: the 2009 Stock Plan (2009 Plan) and the 2017 Equity Incentive Plan (2017 Plan). Upon the completion of the Company’s IPO in April 2017, the Company ceased granting equity under the 2009 Plan, and all shares that remained available for future issuance under the 2009 Plan at that time were transferred to the 2017 Plan. As of January 31, 2018, options granted under the 2009 Plan to purchase 24,836,949 shares of Class B common stock remain outstanding, and options granted under the 2017 Plan to purchase 80,096 shares of Class A common stock remain outstanding. As of January 31, 2018, the total number of shares reserved for future Class A stock grants under the 2017 Plan was 9,842,925 shares, including shares transferred from the 2009 Plan.
Stock Options
Options issued to new employees under the Plan generally are exercisable for periods not to exceed ten years and generally vest over four years with 25% vesting after one year and with the remainder vesting monthly thereafter in equal installments. Shares offered under the Plan may be: (i) authorized but unissued shares or (ii) treasury shares.
A summary of the Company’s stock option activity and related information is as follows:
Number of Options | Weighted- Average Exercise Price | Weighted- Average Remaining Contractual Term (Years) | Aggregate Intrinsic Value (in thousands) | |||||||||
Outstanding as of January 31, 2017 | 32,866,862 | $ | 6.01 | 8.2 | $ | 145,570 | ||||||
Granted | 2,676,667 | 11.56 | ||||||||||
Exercised | (9,180,242 | ) | 3.66 | |||||||||
Canceled | (1,446,242 | ) | 7.76 | |||||||||
Outstanding as of January 31, 2018 | 24,917,045 | $ | 7.37 | 7.6 | $ | 550,173 | ||||||
As of January 31, 2018: | ||||||||||||
Vested and expected to vest | 24,917,045 | $ | 7.37 | 7.6 | $ | 550,173 | ||||||
Vested and exercisable | 10,205,493 | $ | 5.33 | 6.9 | $ | 246,189 | ||||||
The weighted-average grant-date fair value of options granted was $5.40, $4.00 and $3.14 during the years ended January 31, 2018, 2017 and 2016, respectively. The total grant-date fair value of stock options vested was $23.9 million, $13.1 million and $7.7 million during the years ended January 31, 2018, 2017 and 2016, respectively.
95
The intrinsic value of the options exercised, which represents the difference between the fair market value of the Company’s common stock on the date of exercise and the exercise price of each option, was $204.8 million, $6.9 million and $4.8 million for the years ended January 31, 2018, 2017 and 2016, respectively.
As of January 31, 2018, there was a total of $53.9 million of unrecognized stock-based compensation expense, which is expected to be recognized over a weighted-average period of 2.6 years.
The Company used the Black-Scholes option pricing model to estimate the fair value of stock options granted with the following assumptions:
Year Ended January 31, | ||||||||
2018 | 2017 | 2016 | ||||||
Expected volatility | 40% - 41% | 40% - 44% | 42% - 46% | |||||
Expected term (in years) | 6.3 - 6.4 | 5.5 - 6.9 | 5.0 - 6.1 | |||||
Risk-free interest rate | 1.87% - 2.21% | 1.13% - 2.28% | 1.43% - 1.88% | |||||
Expected dividend yield | — | — | — | |||||
Options Subject to Early Exercise
Prior to the IPO, at the discretion the Company's board of directors, certain options were exercisable immediately at the date of grant but are subject to a repurchase right, under which the Company may buy back any unvested shares at their original exercise price in the event of an employee’s termination prior to full vesting. The consideration received for an exercise of an unvested option is considered to be a deposit of the exercise price and the related dollar amount is recorded as a liability. The liabilities are reclassified into equity as the awards vest. As of January 31, 2018 and 2017, the Company had $1.1 million and $2.2 million, respectively, recorded in accrued expenses and other current liabilities related to early exercises of options to acquire 187,820 and 467,180 shares of Class B common stock, respectively.
Restricted Stock Units
A summary of the Company’s RSU activities and related information is as follows:
Number of RSUs | Weighted- Average Grant Date Fair Value Per Share | |||||
Outstanding as of January 31, 2017 | — | $ | — | |||
Granted | 3,012,111 | 24.37 | ||||
Vested | — | — | ||||
Forfeited | (149,182 | ) | 24.15 | |||
Outstanding as of January 31, 2018 | 2,862,929 | $ | 24.38 | |||
The Company granted 3,012,111 RSUs with an aggregate fair value of $73.4 million for the year ended January 31, 2018. As of January 31, 2018, all outstanding RSUs are unvested and there was $60.4 million of unrecognized stock-based compensation expense related to unvested RSUs, which is expected to be recognized over a weighted-average period of 3.5 years based on vesting under the award service conditions.
Equity Awards Issued in Connection with Business Combinations
In connection with the Stormpath transaction, the Company issued 800,000 shares of restricted common stock to Stormpath with an aggregate fair value of $8.6 million to be recognized as post combination stock-based compensation. The restricted common stock will vest ratably on the first and second anniversaries of the transaction date upon achievement of the respective performance conditions, including the continued employment of certain employees with the Company and the wind down of the Stormpath, Inc. entity. The stock-based compensation expense related to the restricted common stock has a requisite service period of two years and will be recognized using an accelerated attribution method due to the existence of performance conditions.
96
As of January 31, 2018, there was $2.5 million of unrecognized compensation expense related to this restricted common stock which is expected to be recognized over the remaining weighted average life of 1.0. These shares of restricted common stock were separately authorized by the Company’s board of directors, and did not reduce the number of shares available for future issuance under the 2009 Plan or the 2017 Plan.
The Company separately entered into retention arrangements with certain employees of Stormpath and issued 598,500 restricted stock awards under the 2009 Plan with an aggregate fair value of $6.6 million with performance conditions, including continued employment of certain employees with the Company and the wind down of the Stormpath, Inc. entity. The restricted stock awards will vest ratably over two or three years from the transaction date. Additionally, the Company granted 518,900 service-based stock options under the 2009 Plan to certain Stormpath employees with an aggregate fair value of $2.5 million to vest ratably over the requisite four-year service period.
The restricted stock awards and stock options offered directly to Stormpath employees for employment with the Company are deemed replacement awards and a portion of such awards are considered compensation for pre-combination service. Of the $9.1 million total aggregate fair value of the awards, $1.5 million is related to pre-combination service and is recognized as goodwill and a reduction to the post-combination compensation expense. The post-combination expenses for the restricted stock awards and stock options are $5.5 million and $2.1 million, respectively. The expense related to the restricted stock awards will be recognized over two or three years based on an accelerated attribution method. The expense for the stock options will be recognized ratably over the requisite service period.
As of January 31, 2018, there was $2.2 million of unrecognized compensation expense related to unvested restricted stock awards, which is expected to be recognized over the remaining weighted average life of 1.5 years.
As of January 31, 2018, there was $1.6 million of unrecognized compensation cost related to unvested stock options, which is expected to be recognized over the remaining weighted average life of 2.4 years. The related stock options expense and activity are included within the Stock Options section above.
All of these shares are outstanding as of January 31, 2018.
Employee Stock Purchase Plan
In February 2017, the Company’s board of directors adopted, and in March 2017, the Company’s stockholders approved the 2017 Employee Stock Purchase Plan, or the ESPP, which became effective prior to the completion of the IPO. The ESPP initially reserves and authorizes the issuance of up to a total of 3,000,000 shares of Class A common stock to participating employees. Except for the initial offering period, the ESPP provides for 12-month offering periods beginning June 21 and December 21 of each year, and each offering period will consist of two six-month purchase periods. The initial offering period began April 7, 2017 and will end on June 20, 2018.
The Company estimated the fair value of ESPP purchase rights using a Black-Scholes option pricing model with the following assumptions:
As of January 31, 2018 | |
Expected volatility | 32% - 38% |
Expected term (in years) | 0.5-1.2 |
Risk-free interest rate | 0.95%-1.73% |
Expected dividend yield | — |
During the year ended January 31, 2018, the Company sold 569,373 shares of its common stock under the ESPP. The shares were purchased at a weighted-average purchase price of $14.70 with proceeds of $8.4 million.
As of January 31, 2018, there was $4.0 million of unrecognized stock-based compensation expense related to the ESPP that is expected to be recognized over an average vesting period of 0.4 years.
97
12. Income Taxes
The domestic and foreign components of pre-tax loss for the years ended January 31, 2018, 2017 and 2016 are as follows (in thousands):
Year Ended January 31, | |||||||||||
2018 | 2017 | 2016 | |||||||||
Domestic | $ | (117,368 | ) | $ | (84,938 | ) | $ | (76,953 | ) | ||
Foreign | 2,688 | 1,854 | 946 | ||||||||
Loss before provision for (benefit from) income taxes | $ | (114,680 | ) | $ | (83,084 | ) | $ | (76,007 | ) | ||
The components of the provision for (benefit from) income taxes for the years ended January 31, 2018, 2017 and 2016 are as follows (in thousands):
Year Ended January 31, | |||||||||||
2018 | 2017 | 2016 | |||||||||
Current: | |||||||||||
Federal | $ | — | $ | — | $ | — | |||||
State | — | 18 | — | ||||||||
Foreign | 183 | 426 | 295 | ||||||||
Total current provision for income taxes | $ | 183 | $ | 444 | $ | 295 | |||||
Deferred: | |||||||||||
Federal | $ | (32 | ) | $ | 60 | $ | 60 | ||||
State | 10 | 6 | 6 | ||||||||
Foreign | (482 | ) | (85 | ) | (66 | ) | |||||
Total deferred provision for (benefit from) income taxes | $ | (504 | ) | $ | (19 | ) | $ | — | |||
Total provision for (benefit from) income taxes | $ | (321 | ) | $ | 425 | $ | 295 | ||||
As a result of the Company’s history of net operating losses and full valuation allowance against its deferred tax assets, the income tax provision was related to foreign taxes and tax amortization of goodwill for the years ended January 31, 2018, 2017 and 2016. For the year ended January 31, 2018, the income tax benefit resulted from $1.3 million of excess tax deductions related to option exercises by foreign employees, a portion of which we intend to use to claim a refund of taxes paid in prior years.
The following is a reconciliation of the statutory federal income tax rate to the Company’s effective tax rate for the years ended January 31, 2018, 2017 and 2016:
Year Ended January 31, | ||||||||
2018 | 2017 | 2016 | ||||||
Tax at federal statutory rate | 33.8 | % | 34.0 | % | 34.0 | % | ||
State income taxes, net of federal benefit | 3.3 | 3.3 | 2.7 | |||||
Change in valuation allowance | (23.5 | ) | (32.4 | ) | (33.8 | ) | ||
Stock-based compensation | 39.9 | (4.5 | ) | (3.1 | ) | |||
Tax Cuts and Jobs Act of 2017 | (53.2 | ) | — | — | ||||
Other, net | (0.1 | ) | (0.9 | ) | (0.2 | ) | ||
Effective tax rate | 0.2 | % | (0.5 | )% | (0.4 | )% | ||
98
The tax effects of temporary differences and related deferred tax assets and liabilities as of January 31, 2018 and 2017 are as follows (in thousands):
As of January 31, | |||||||
2018 | 2017 | ||||||
Deferred tax assets: | |||||||
Net operating loss carryforwards | $ | 123,013 | $ | 98,587 | |||
Stock-based compensation | 7,926 | 3,611 | |||||
Deferred revenue | 1,391 | 4,497 | |||||
Other reserves and accruals | 3,084 | 3,768 | |||||
Credits | 791 | 625 | |||||
Total deferred tax assets | 136,205 | 111,088 | |||||
Valuation allowance | (125,874 | ) | (98,379 | ) | |||
Total deferred tax assets, net | 10,331 | 12,709 | |||||
Deferred tax liabilities: | |||||||
Deferred commissions | (6,849 | ) | (8,802 | ) | |||
Capitalized internal-use software costs | (2,389 | ) | (2,816 | ) | |||
Goodwill | (175 | ) | (196 | ) | |||
Depreciation and amortization | (441 | ) | (953 | ) | |||
Total deferred tax liabilities | (9,854 | ) | (12,767 | ) | |||
Net deferred tax assets (liabilities) | $ | 477 | $ | (58 | ) | ||
As a result of continuing losses, the Company has determined that it is not more likely than not that it will realize the benefits of the U.S. deferred tax assets and, therefore, the Company has recorded a valuation allowance to reduce the carrying value of the U.S. deferred tax assets, net of U.S. deferred tax liabilities, to approximately zero. The U.S. valuation allowance increased by $27.5 million and $26.9 million during the years ended January 31, 2018 and 2017, respectively.
As of January 31, 2018 and 2017, the Company had approximately $490.6 million and $264.7 million, respectively, of federal and $295.6 million and $164.2 million, respectively, of state net operating loss carryforwards available to offset future taxable income. If not utilized, the federal and state net operating loss carryforwards will begin to expire in 2029 and 2021, respectively. As of January 31, 2018, the Company had approximately $2.3 million of UK net operating losses which do not expire.
As of January 31, 2018, the Company had federal and California research and development tax credit carryforwards of $6.2 million and $5.6 million, respectively. The federal research and development credits will start to expire in 2030 while the California research and development credits do not expire. The Company has California Enterprise Zone credits of $1 million that begin to expire in 2023.
The Company attributes net revenue, costs and expenses to domestic and foreign components based on the terms of its agreements with its subsidiaries. The Company does not provide for federal income taxes on the undistributed earnings of its foreign subsidiaries as such earnings are to be reinvested offshore indefinitely. If the Company repatriated these earnings, the resulting income tax liability would be insignificant. The Company is subject to taxation in the United States and various states and foreign jurisdictions.
On December 22, 2017, the Tax Cuts and Jobs Act of 2017 (“Tax Act”) was signed into law making significant changes to the Internal Revenue Code. Changes include, but are not limited to, a corporate tax rate decrease to 21% effective for tax years beginning after December 31, 2017. This change in tax rate resulted in a reduction in our net U.S. deferred tax assets before valuation allowance by $61.0 million, which was fully offset by a reduction in our valuation allowance. The Tax Act provided for a one-time deemed mandatory repatriation of post-1986 undistributed foreign subsidiary earnings and profits, or E&P. Our preliminary calculations show that we had negative net undistributed foreign E&P and are not subject to the deemed mandatory repatriation of year end. The other provisions of the Tax Act did not have a material impact on our consolidated financial statements as of January 31, 2018.
99
In December 2017, the SEC staff issued Staff Accounting Bulletin No. 118, Income Tax Accounting Implications of the Tax Cuts and Jobs Act (SAB 118), which allows us to record provisional amounts during a measurement period not to extend beyond one year of the enactment date. Although the rate reduction is known, the impact of the change is based on estimates of our net U.S. deferred tax assets before valuation allowance as of January 31, 2018. Additionally, potential further guidance may be forthcoming from the Financial Accounting Standards Board and the Securities and Exchange Commission, as well as regulations, interpretations and rulings from federal and state tax agencies, which could result in additional impacts.
The Tax Act contains a number of additional provisions which may impact the Company in future years. However, since the Tax Act was recently finalized and ongoing guidance and accounting interpretation is expected over the next 12 months, the Company has not yet elected any changes to accounting policies and the Company’s analysis is ongoing. Provisional accounting impacts may change in future reporting periods until the accounting analysis is finalized, which will occur no later than one year from the date the Tax Act was enacted.
The Company’s ability to utilize the net operating loss and tax credit carryforwards in the future may be subject to substantial restrictions in the event of past or future ownership changes as defined in Section 382 of the Internal Revenue Code and similar state tax laws.
A reconciliation of beginning and ending amount of unrecognized tax benefit is as follows (in thousands):
Year Ended January 31, | |||||||||||
2018 | 2017 | 2016 | |||||||||
Gross amount of unrecognized tax benefits as of the beginning of the year | $ | 5,775 | $ | 3,512 | $ | 1,889 | |||||
Additions based on tax positions related to current year | 5,944 | 2,263 | 1,623 | ||||||||
Gross amount of unrecognized tax benefits as of the end of the year | $ | 11,719 | $ | 5,775 | $ | 3,512 | |||||
The material jurisdictions in which the Company is subject to potential examination include the United States, California and the United Kingdom. Due to the Company’s net operating loss carryforwards, all tax years since inception remain subject to examination by federal and California taxing authorities. For the United Kingdom, the Company has an open examination for fiscal year 2016, but is no longer subject to examinations for fiscal years prior to 2016.
As of January 31, 2018, 2017 and 2016, the Company had unrecognized tax benefits which would not impact the effective tax rate because of the valuation allowance. The Company’s policy is to include interest and penalties related to unrecognized tax benefits within the provision for income taxes. The Company does not have any uncertain tax positions as of January 31, 2018 for which it is reasonably possible that the positions will increase or decrease within the next twelve months. As of January 31, 2018 and 2017, the Company has not accrued any interest or penalties related to unrecognized tax benefits.
13. Net Loss Per Share
The Company computes net loss per share of common stock in conformity with the two-class method required for participating securities. The Company considers all series of Preferred Stock to be participating securities as the holders of the Preferred Stock are entitled to receive a non-cumulative dividend on a pari passu basis in the event that a dividend is paid on the common stock. The holders of the Preferred Stock do not have a contractual obligation to share in the Company’s losses. As such, the Company’s net losses for the years ended January 31, 2018, 2017 and 2016, were not allocated to these participating securities.
100
The following table presents the calculation of basic and diluted net loss per share for periods presented (dollars in thousands, except per share data):
Year Ended January 31, | |||||||||||||||||||||||
2018 | 2017 | 2016 | |||||||||||||||||||||
Class A | Class B | Class A | Class B | Class A | Class B | ||||||||||||||||||
Numerator: | |||||||||||||||||||||||
Net loss | $ | (33,293 | ) | $ | (81,066 | ) | $ | — | $ | (83,509 | ) | $ | — | $ | (76,302 | ) | |||||||
Denominator: | |||||||||||||||||||||||
Weighted-average shares outstanding, basic and diluted | 24,165 | 58,839 | — | 19,038 | — | 17,817 | |||||||||||||||||
Net loss per share attributable to common stockholders, basic and diluted | $ | (1.38 | ) | $ | (1.38 | ) | $ | — | $ | (4.39 | ) | $ | — | $ | (4.28 | ) | |||||||
The Company was in a loss position for all periods presented; accordingly, basic net loss per share is the same as diluted net loss per share as the inclusion of all potential common shares outstanding would have been anti-dilutive. Potentially dilutive securities that were not included in the diluted per share calculations because they would be anti-dilutive were as follows (in thousands):
Year Ended January 31, | ||||||||
2018 | 2017 | 2016 | ||||||
Restricted common stock issued and outstanding | 800 | — | — | |||||
Unvested RSUs issued and outstanding | 2,863 | — | — | |||||
Unvested restricted stock awards issued and outstanding | 599 | — | — | |||||
Shares committed under the ESPP | 1,149 | — | — | |||||
Unvested shares subject to repurchase | 188 | — | — | |||||
Conversion of convertible preferred stock | — | 59,465 | 59,465 | |||||
Issued and outstanding stock options | 24,917 | 32,866 | 22,000 | |||||
Conversion of common stock warrant | — | 188 | 188 | |||||
Conversion of convertible Series B warrant | — | 29 | 29 | |||||
30,516 | 92,548 | 81,682 | ||||||
14. Related Party Transactions
Certain members of the Company's board of directors serve as directors of and/or are executive officers of and, in some cases, are investors in, companies that are customers or vendors of the Company. Certain of the Company’s executive officers also serve as directors of or serve in an advisory capacity to companies that are customers or vendors of the Company. Related party transactions were not material as of and for the years ended January 31, 2018, 2017 and 2016.
15. Subsequent Events
On February 22, 2018, the Company priced its private offering of $300.0 million aggregate principal amount of Convertible Senior Notes due 2023 (the “Initial Notes”). On February 23, 2018, the initial purchasers in the offering of the Notes exercised their option to purchase an additional $45.0 million aggregate principal amount of the Notes (the “Additional Notes” and together with the “Initial Notes”, the “Notes”), bringing the total aggregate principal amount of Notes to $345.0 million. On February 27, 2018, the Company received approximately $334.0 million in net proceeds from the offering of the Notes, after deducting the initial purchasers’ discount and commissions and estimated offering expenses payable by the Company. The Company used an aggregate amount of $80.0 million of the net proceeds
101
from the sale of the Notes to purchase the Note Hedge Transactions (as defined below), which was partially offset by proceeds of $52.4 million received from the Warrant Transactions (as defined below).
The Notes are senior, unsecured obligations of the Company and bear interest at a rate of 0.25% per year. Interest is payable semi-annually in arrears on February 15 and August 15 of each year, beginning on August 15, 2018. The Notes will mature on February 15, 2023, unless earlier repurchased or converted. The Company may not redeem the Notes prior to their maturity. The Notes are convertible into shares of Company’s Class A common stock at an initial conversion rate of 20.6795 shares of Class A common stock per $1,000 principal amount, which is equal to an initial conversion price of approximately $48.36 per share of Class A common stock, subject to adjustment. Prior to October 15, 2022, the Notes will be convertible at the option of holders during certain periods, upon satisfaction of certain limited conditions. Thereafter, the Notes will be convertible at any time until the close of business on the second scheduled trading day immediately preceding the maturity date. Upon conversion, the Notes may be settled in shares of the Company’s Class A common stock, cash or a combination of cash and shares of the Company’s Class A common stock, at the Company’s election. Holders of the Notes will have the right to require the Company to repurchase all or a portion of their Notes upon the occurrence of a fundamental change (as defined in the indenture governing the Notes) at a purchase price of 100% of their principal amount plus any accrued and unpaid interest.
In connection with the pricing of the Notes, the Company entered into convertible note hedge transactions (the "Note Hedge Transactions") with some of the initial purchasers of the Notes and/or their respective affiliates (the "Option Counterparties"). The Note Hedge Transactions are purchased call options containing a strike price equal to the initial conversion price of the Notes and an expiration date commensurate with the maturity date of the Notes. The Note Hedge Transactions are expected generally to reduce the potential dilution to the Class A common stock and/or offset the potential cash payments that the Company could be required to make in excess of the principal amount upon conversion of any Notes.
The Company also entered into separate warrant transactions (the "Warrant Transactions") with the Option Counterparties pursuant to which the Company sold warrants for the purchase of the Company’s Class A common stock. These warrants will expire on May 15, 2023. The Warrant Transactions could separately have a dilutive effect to the extent that the market price per share of the Company’s Class A common stock exceeds the strike price of the warrants unless, subject to the terms of the Warrant Transactions, the Company elects to cash settle the warrants. The strike price of the warrants will initially be $68.06 per share, which represents a premium of 90.00% above the closing sale price of the Company’s Class A common stock on February 22, 2018, and is subject to certain adjustments under the terms of the Warrant Transactions.
102
Item 9. Changes in and Disagreements with Accountants on Accounting and Financial Disclosure
None.
Item 9A. Controls and Procedures
Evaluation of Disclosure Controls and Procedures
Our management, with the participation of our principal executive officer and principal financial officer, has evaluated the effectiveness of our disclosure controls and procedures (as defined in Rules 13a- 15(e) and 15d- 15(e) under the Securities Exchange Act of 1934, as amended (the "Exchange Act")), as of the end of the period covered by this Annual Report on Form 10-K.
Based on such evaluation, our principal executive officer and principal financial officer have concluded that, as of such date, our disclosure controls and procedures were effective at a reasonable assurance level.
Management's Report on Internal Control Over Financial Reporting
This Annual Report on Form 10-K does not include a report of management's assessment regarding internal control over financial reporting or an attestation report of our independent registered public accounting firm as permitted in this transition period under the rules of the SEC for newly public companies.
Changes in Internal Control Over Financial Reporting
There was no change in our internal control over financial reporting (as defined in Rules 13a-15(f) and 15d-15(f) under the Exchange Act) that occurred during the period covered by this Annual Report on Form 10-K that has materially affected, or is reasonably likely to materially affect, our internal control over financial reporting.
Inherent Limitations on Effectiveness of Controls
Our management, including our principal executive officer and principal financial officer, do not expect that our disclosure controls or our internal control over financial reporting will prevent all errors and all fraud. A control system, no matter how well conceived and operated, can provide only reasonable, not absolute, assurance that the objectives of the control system are met. Further, the design of a control system must reflect the fact that there are resource constraints, and the benefits of controls must be considered relative to their costs. Because of the inherent limitations in all control systems, no evaluation of controls can provide absolute assurance that all control issues and instances of fraud, if any, have been detected. These inherent limitations include the realities that judgments in decision-making can be faulty, and that breakdowns can occur because of a simple error or mistake. Additionally, controls can be circumvented by the individual acts of some persons, by collusion of two or more people or by management override of the controls. The design of any system of controls is also based in part upon certain assumptions about the likelihood of future events, and there can be no assurance that any design will succeed in achieving its stated goals under all potential future conditions, over time, controls may become inadequate because of changes in conditions, or the degree of compliance with policies or procedures may deteriorate. Because of the inherent limitations in a cost-effective control system, misstatements due to error or fraud may occur and not be detected.
Item 9B. Other Information
Not Applicable.
Part III
Item 10. Directors, Executive Officers and Corporate Governance
The information required by this item is incorporated by reference to our Proxy Statement relating to our 2018 Annual Meeting of Stockholders. The Proxy Statement will be filed with the Securities and Exchange Commission within 120 days of the fiscal year ended January 31, 2018.
Code of Conduct
The Company's board of directors has adopted a Code of Conduct that applies to all officers, directors and employees, which is available on our website at (investor.okta.com) under "Corporate Governance". We intend to satisfy the disclosure requirement under Item 5.05 of Form 8-K regarding amendments to, or waiver from, a provision of our Code of Conduct by posting such information on the website address and location specified above.
Item 11. Executive Compensation
The information required by this item is incorporated by reference to our Proxy Statement relating to our 2018 Annual Meeting of Stockholders. The Proxy Statement will be filed with the Securities and Exchange Commission within 120 days of the fiscal year ended January 31, 2018.
Item 12. Security Ownership of Certain Beneficial Owners
The information required by this item is incorporated by reference to our Proxy Statement relating to our 2018 Annual Meeting of Stockholders. The Proxy Statement will be filed with the Securities and Exchange Commission within 120 days of the fiscal year ended January 31, 2018.
Item 13. Certain Relationships and Related Party Transactions
The information required by this item is incorporated by reference to our Proxy Statement relating to our 2018 Annual Meeting of Stockholders. The Proxy Statement will be filed with the Securities and Exchange Commission within 120 days of the fiscal year ended January 31, 2018.
Item 14. Principal Accountant Fees and Services
The information required by this item is incorporated by reference to our Proxy Statement relating to our 2018 Annual Meeting of Stockholders. The Proxy Statement will be filed with the Securities and Exchange Commission within 120 days of the fiscal year ended January 31, 2018.
Part IV
Item 15. Exhibits, Financial Statement Schedules
(a) The following documents are filed as part of this report:
1. | Financial Statements |
See Index to Financial Statements at Item 8 herein.
2. | Financial Statement Schedules |
Schedules not listed above have been omitted because they are not required, not applicable, or the required information is otherwise included.
3. | Exhibits |
See the Exhibit Index immediately following the signature page of this Annual Report on Form 10-K.
Item 16. Form 10-K Summary
None.
SIGNATURES
Pursuant to the requirements of Section 13 or 15(d) of the Securities Exchange Act of 1934, as amended, the registrant has duly caused this report to be signed on its behalf by the undersigned thereunto duly authorized.
OKTA, INC. | ||
March 12, 2018 | /s/ William E. Losch | |
William E. Losch Chief Financial Officer | ||
POWER OF ATTORNEY
KNOW ALL PERSONS BY THESE PRESENTS, that each person whose signature appears below constitutes and appoints Todd McKinnon, William E. Losch and Jonathan T. Runyan, and each of them, as his or her true and lawful attorneys-in-fact and agents, with full power of substitution and resubstitution, for him or her and in his or her name, place and stead, in any and all capacities, to sign any amendments to this Annual Report on Form 10-K and to file the same, with Exhibits thereto and other documents in connection therewith with the Securities and Exchange Commission, hereby ratifying and confirming all that each of said attorneys-in-fact, or substitute or substitutes may do or cause to be done by virtue hereof.
Pursuant to the requirements of the Securities Exchange Act of 1934, this report has been signed below by the following persons on behalf of the Registrant and in the capacities and on the dates indicated:
Signature | Title | Date | ||
/s/ Todd McKinnon Todd McKinnon | Chief Executive Officer and Director (Principal Executive Officer) | March 12, 2018 | ||
/s/ William E. Losch William E. Losch | Chief Financial Officer (Principal Accounting and Financial Officer) | March 12, 2018 | ||
/s/ J. Frederic Kerrest J. Frederic Kerrest | Director | March 12, 2018 | ||
/s/ Patrick Grady Patrick Grady | Director | March 12, 2018 | ||
/s/ Ben Horowitz Ben Horowitz | Director | March 12, 2018 | ||
/s/ Michael Kourey Michael Kourey | Director | March 12, 2018 | ||
/s/ Michael Stankey Michael Stankey | Director | March 12, 2018 | ||
/s/ Michelle Wilson Michelle Wilson | Director | March 12, 2018 | ||
EXHIBIT INDEX
Exhibit Number | Exhibit Description | Incorporated by Reference from Form | ||
Exhibit 3.2 to Form S-1 filed on March 13, 2017 | ||||
Exhibit 3.4 to Form S-1 filed on March 13, 2017 | ||||
Exhibit 4.1 to Form S-1 filed on March 13, 2017 | ||||
Exhibit 4.2 to Form S-1 filed on March 13, 2017 | ||||
Exhibit 4.1 to Form 8-K filed February 27, 2018 | ||||
Exhibit 4.2 to Form 8-K filed February 27, 2018 | ||||
Exhibit 10.1 to Form S-1 filed on March 13, 2017 | ||||
Exhibit 10.2 to Form S-1 filed on March 13, 2017 | ||||
Exhibit 10.3 to Form S-1A filed on March 27, 2017 | ||||
Exhibit 10.4 to Form S-1A filed on March 27, 2017 | ||||
Exhibit 10.5 to Form S-1 filed on March 13, 2017 | ||||
Exhibit 10.6 to Form S-1 filed on March 13, 2017 | ||||
Exhibit 10.7 to Form S-1 filed on March 13, 2017 | ||||
Exhibit 10.8 to Form S-1 filed on March 13, 2017 | ||||
Exhibit 10.9 to Form S-1 filed on March 13, 2017 | ||||
Exhibit 10.10 to Form S-1 filed on March 13, 2017 | ||||
Filed herewith | ||||
Exhibit Number | Exhibit Description | Incorporated by Reference from Form | ||
Exhibit 10.1 to Form 10-Q filed on September 8, 2017 | ||||
Exhibit 10.1 to Form 8-K filed on December 6, 2017 | ||||
Exhibit 10.1 to Form 8-K filed February 27, 2018 | ||||
Exhibit 10.2 to Form 8-K filed February 27, 2018 | ||||
Filed herewith | ||||
Filed herewith | ||||
Filed herewith | ||||
Filed herewith | ||||
Furnished herewith | ||||
101.INS | XBRL Instance Document | Filed herewith | ||
101.SCH | XBRL Taxonomy Extension Schema Document | Filed herewith | ||
101.CAL | XBRL Taxonomy Extension Calculation Linkbase Document | Filed herewith | ||
101.DEF | XBRL Taxonomy Extension Definition Linkbase Document | Filed herewith | ||
101.LAB | XBRL Taxonomy Extension Label Linkbase Document | Filed herewith | ||
101.PRE | XBRL Taxonomy Extension Presentation Linkbase Document | Filed herewith | ||
* The certifications furnished in Exhibit 32.1 hereto are deemed to accompany this Annual Report on Form 10-K and will not be deemed “filed” for purposes of Section 18 of the Securities Exchange Act of 1934, as amended, except to the extent that the registrant specifically incorporates it by reference.
# Indicates management contract or compensatory plan, contract or agreement.