Attached files
| file | filename |
|---|---|
| EX-23.1 - EX-23.1 - MOBILEIRON, INC. | mobl-20171231ex231bb508b.htm |
| EX-32.1 - EX-32.1 - MOBILEIRON, INC. | mobl-20171231ex321bce362.htm |
| EX-31.2 - EX-31.2 - MOBILEIRON, INC. | mobl-20171231ex312a72ead.htm |
| EX-31.1 - EX-31.1 - MOBILEIRON, INC. | mobl-20171231ex31180eda5.htm |
| EX-21.1 - EX-21.1 - MOBILEIRON, INC. | mobl-20171231ex21152c993.htm |
| EX-10.29 - EX-10.29 - MOBILEIRON, INC. | mobl-20171231ex102947501.htm |
UNITED STATES
SECURITIES AND EXCHANGE COMMISSION
Washington, D.C. 20549
FORM 10-K
(Mark One)
|
☒ |
ANNUAL REPORT PURSUANT TO SECTION 13 OR 15(d) OF THE SECURITIES EXCHANGE ACT OF 1934 |
For the fiscal year ended December 31, 2017
Or
For the transition period from to
Commission File Number 001-36471
MobileIron, Inc.
(Exact name of registrant as specified in its charter)
|
Delaware |
|
26-0866846 |
|
(State or other jurisdiction of |
|
(I.R.S. Employer Identification Number) |
401 East Middlefield Road
Mountain View, CA 94043
(650) 919-8100
Securities registered pursuant to Section 12(b) of the Act:
|
Title of each class |
|
Name of each exchange on which registered |
|
Common Stock, par value $0.0001 per share |
|
The NASDAQ Global Select Market |
Securities registered pursuant to Section 12(g) of the Act:
None
Indicate by check mark if the registrant is a well-known seasoned issuer, as defined in Rule 405 of the Securities Act. Yes ☐ No ☒
Indicate by check mark if the registrant is not required to file reports pursuant to Section 13 or Section 15(d) of the Securities Exchange Act of 1934 (the “Exchange Act”).
Yes ☐ No ☒
Indicate by check mark whether the registrant: (1) has filed all reports required to be filed by Section 13 or 15(d) of the Exchange Act during the preceding 12 months (or for such shorter period that the registrant was required to file such reports), and (2) has been subject to such filing requirements for the past 90 days. Yes ☒ No ☐
Indicate by check mark whether the registrant has submitted electronically and posted on its corporate Web site, if any, every Interactive Data File required to be submitted and posted pursuant to Rule 405 of Regulation S-T (§232.405 of this chapter) during the preceding 12 months (or for such shorter period that the registrant was required to submit and post such files).
Yes ☒ No ☐
Indicate by a check mark if disclosure of delinquent filers pursuant to Item 405 of Regulation S-K (§229.405 of this chapter) is not contained herein, and will not be contained, to the best of registrant’s knowledge, in definitive proxy or information statements incorporated by reference in Part III of this Form 10-K or any amendment to this Form 10-K. ☒
Indicate by check mark whether the registrant is a large accelerated filer, an accelerated filer, a non-accelerated filer, a smaller reporting company, or an emerging growth company. See the definitions of “large accelerated filer,” “accelerated filer,” “smaller reporting company” and “emerging growth company” in Rule 12b-2 of the Exchange Act. (Check one):
|
Large accelerated filer |
☐ |
|
|
|
|
Accelerated filer |
☒ |
|
|
|
|
|
|
|
|
|
|
Non-accelerated filer |
☐ |
|
|
(Do not check if a smaller reporting company) |
|
Smaller reporting company |
☐ |
|
|
|
|
|
|
|
|
|
|
|
|
|
|
|
|
Emerging growth company |
☒ |
If an emerging growth company, indicate by check mark if the registrant has elected not to use the extended transition period for complying with any new or revised financial accounting standards provided pursuant to Section 13(a) of the Exchange Act. ☒
Indicate by check mark whether the registrant is a shell company (as defined in Rule 12b-2 of the Exchange Act). Yes ☐ No ☒
As of June 30, 2017, the aggregate market value of shares of common stock held by non-affiliates of the registrant was $370 million based on the number of shares held by non-affiliates as of June 30, 2017 and based on the closing sale price of the registrant's common stock as reported on the NASDAQ Stock Market on June 30, 2017 of $6.05 per share. Shares of common stock held by officers, directors and holders of more than 5% of the outstanding common stock have been excluded from this calculation because such person may be deemed to be affiliates. This determination of affiliate status is not necessarily a conclusive determination for other purposes.
The number of outstanding shares of the registrant’s common stock was 100,560,616 as of March 7, 2018.
DOCUMENTS INCORPORATED BY REFERENCE
Portions of the information called for by Part III of this Annual Report on Form 10-K, to the extent not set forth herein, are hereby incorporated by reference from registrant’s definitive proxy statement for the 2018 Annual Meeting of Stockholders to be filed with the Securities and Exchange Commission within 120 days after the end of the registrant’s fiscal year ended December 31, 2017.
|
|
|
|
|
Page |
|
|
|
|
|
|
|
|
|
|
|
|
|
|
|
|
|
|
|
|
|
4 |
||
|
|
|
12 |
||
|
|
|
37 |
||
|
|
|
37 |
||
|
|
|
38 |
||
|
|
|
38 |
||
|
|
|
|
|
|
|
|
|
|
|
|
|
|
|
|
|
|
|
|
|
39 |
||
|
|
|
41 |
||
|
|
Management's Discussion and Analysis of Financial Condition and Results of Operations |
|
44 |
|
|
|
|
66 |
||
|
|
|
68 |
||
|
|
Changes in and Disagreements With Accountants on Accounting and Financial Disclosure |
|
97 |
|
|
|
|
97 |
||
|
|
|
98 |
||
|
|
|
|
|
|
|
|
|
|
|
|
|
|
|
|
|
|
|
|
|
99 |
||
|
|
|
99 |
||
|
|
Security Ownership of Certain Beneficial Owners and Management and Related Stockholder Matters |
|
99 |
|
|
|
Certain Relationships and Related Transactions, and Director Independence |
|
99 |
|
|
|
|
99 |
||
|
|
|
|
|
|
|
|
|
|
|
|
|
|
|
|
|
|
|
|
|
100 |
||
|
|
|
|
101 |
|
|
|
|
|
106 |
|
|
|
|
|
|
|
|
|
|
“MobileIron,” the MobileIron logos and other trademark or service marks of MobileIron, Inc. appearing in this Annual Report on Form 10-K are the property of MobileIron, Inc. Trade names, trademarks and service marks of other companies appearing in this report are the property of their respective holders. |
|
|
2
SPECIAL NOTE REGARDING FORWARD LOOKING STATEMENTS
This Annual Report on Form 10-K contains forward-looking statements within the meaning of the Private Securities Litigation Reform Act of 1995. In some cases you can identify these statements by forward-looking words such as “believe,” “may,” “will,” “might,” “estimate,” “continue,” “anticipate,” “intend,” “could,” “should,” “would,” “potentially,” “predict,” “plan,” “outlook,” “target,” “expect,” “future” or similar expressions, or the negative or plural of these words or expressions. These forward-looking statements include, but are not limited to, statements concerning the following:
|
· |
beliefs and objectives for future operations and growth; |
|
· |
our business plan and our ability to effectively manage our expenses; |
|
· |
our ability to timely and effectively scale and adapt our existing technology; |
|
· |
our ability to innovate new products and bring them to market in a timely manner; |
|
· |
our ability to expand internationally; |
|
· |
our ability to attract new customers and further penetrate our existing customer base; |
|
· |
our expectations concerning renewal rates for subscriptions and services by existing customers; |
|
· |
our expectations concerning the mix of our sales of subscriptions and perpetual licenses; |
|
· |
cost of revenue, including changes in costs associated with hardware, royalties, customer support, and data center operations; |
|
· |
operating expenses, including changes in research and development, sales and marketing, and general and administrative expenses; |
|
· |
our expectations concerning relationships with third parties, including channel partners; |
|
· |
economic and industry trends or trend analysis; and |
|
· |
the sufficiency of our existing cash and investments to meet our cash needs for at least the next 12 months. |
In addition, statements that "we believe" and similar statements reflect our beliefs and opinions on the relevant subject. These statements are based upon information available to us as of the date of this Annual Report on Form 10-K, and while we believe such information forms a reasonable basis for such statements, such information may be limited or incomplete, and our statements should not be read to indicate that we have conducted an exhaustive inquiry into, or review of, all potentially available relevant information. These statements are inherently uncertain and investors are cautioned not to unduly rely upon these statements.
These forward-looking statements are based on current expectations and assumptions that are subject to risks and uncertainties, which could cause our actual results to differ materially from those reflected in the forward-looking statements. These risks are not exhaustive. These statements are within the meaning of the “safe harbor” provisions of the Private Securities Litigation Reform Act of 1995. These statements appear throughout this Form 10-K and are statements regarding our intent, belief, or current expectations, primarily with respect to our business and related industry developments. You should not place undue reliance on these forward-looking statements, which apply only as of the date of this Form 10-K. Our actual results could differ materially from those anticipated in these forward-looking statements for many reasons, including the risks faced by us and described in Part I, Item 1A, entitled “Risk Factors,” and in Part II, Item 7, “Management’s Discussion and Analysis of Financial Condition and Results of Operations” in this Form 10-K. We undertake no obligation to update any forward-looking statements for any reason to conform these statements to actual results or to changes in our expectations.
3
\
Overview
Mobile and cloud computing are the catalysts for modern work. Mobile lets employees make better decisions and take faster actions because the information and tools they need to do their jobs are always available. Cloud lets developers build innovative services quickly and lets employees start using them easily.
Modern work requires a new security model, however, because both mobile and cloud operate outside the traditional network perimeter. Data no longer resides behind the firewall on locked-down PCs and servers, and so it cannot be secured by firewall-based solutions. Instead, data is spread across an information fabric that spans a wide variety of modern endpoints and cloud services. Modern endpoints are computing devices that run operating systems such as Android, iOS, macOS or Windows 10. While they can be desktops, they are increasingly portable, like smartphones, tablets, laptops, and wearables. Cloud services are SaaS applications such as Box, Concur, Google G Suite, Microsoft Office 365, Salesforce, ServiceNow, Tableau, and Workday, as well as custom applications built on infrastructure such as Amazon Web Services, Google Cloud Platform, and Microsoft Azure.
CIOs face the challenge of giving employees the ability to use the cloud services and endpoints they want without compromising either user experience or data security. To pass a security audit, IT will need to maintain control of company data. This means deleting data if an endpoint is lost, stopping data from being shared with consumer apps, and stopping data from ending up on endpoints that are not secure. But it is not enough to do this for just one cloud service or one type of endpoint. IT will need to do this across the wide range of technologies their users choose.
We believe that every modern endpoint, whether a smartphone, tablet, laptop, desktop, wearable or IoT device with access to enterprise data, will require a solution like MobileIron’s to secure that data. MobileIron provides a government-grade security platform to protect business data all the way from the cloud to the endpoint. The MobileIron platform combines cloud security, unified endpoint management (UEM), secure connectivity, and threat intelligence into an integrated solution designed to deliver enterprise services to users with a seamless experience that does not compromise data security.
Our platform establishes an adaptive data perimeter outside the firewall to ensure that only trusted users using trusted apps on trusted endpoints can access business information. A trusted user is one who is authorized to access certain business data. Trusted apps and endpoints are those that can then maintain the security of that data. Our cross-stack architecture (multi-cloud, multi-app, multi-OS, multi-identity) allows customers to tap into the innovation of best-of-breed cloud services and modern endpoints while still leveraging their existing infrastructure investments in identity management and network security. Our platform and products protect the customer from being locked into a single-vendor computing stack.
Customers use MobileIron to:
|
1. |
Establish a trusted workspace on the endpoint that includes the applications, connectivity, and seamless authentication users need to be productive. |
|
2. |
Separate business data from personal data both on the endpoint and across the network to prevent the loss of business data and to preserve the privacy of personal data. |
|
3. |
Block untrusted endpoints and apps from accessing business cloud services so that they cannot move business data outside the company’s control. |
|
4. |
Detect and remediate zero-day security threats to protect against new vulnerabilities and attacks. |
Our customers can deploy MobileIron as either a cloud service or on-premises software. They can choose subscription or perpetual licensing. We primarily target midsize and large enterprises around the world across a broad range of industries including financial services, government, healthcare, legal, manufacturing, professional services, retail, technology, and telecommunications.
4
Our business model is based on winning new customers, growing existing customers through seat expansion and product upsell, and renewing subscriptions and software support agreements. Our channel partners include distributors, resellers, service providers and system integrators. Our revenue grew to $176.5 million in 2017 and we have experienced rapid growth in our customer base, having sold our platform to over 16,000 cumulative customers since 2009. In 2017, we generated over two-thirds of our gross billings from recurring sources (subscriptions and software support agreements). No single end-user customer accounted for more than 5% of our total revenue in 2017. One reseller, AT&T, Inc., accounted for 15% of our revenue in 2017.
Our Product Architecture
The MobileIron product platform has four components:
|
· |
Policy engine: This is the central console for MobileIron, through which the administrator defines security policies, distributes and configures business services like email, applications, and connectivity, and assigns those policies and services to the appropriate users and endpoints. MobileIron can be deployed as either a cloud service (MobileIron Cloud) or on-premises software (MobileIron Core). MobileIron Bridge adds the capability to apply legacy Windows management policies to modern Windows 10 endpoints. MobileIron ServiceConnect extends the policy engine through a set of APIs that enable other security and infrastructure solutions to either pull data from MobileIron or trigger actions in MobileIron. |
|
· |
Adaptive access: MobileIron Access blocks untrusted devices and apps from accessing cloud services, based on security posture and compliance. Access also provides single sign-on (SSO) across applications on the device so that users do not have to enter their passwords. In addition, MobileIron Tunnel provides secure connectivity through per-app VPN to connect applications to back-end services. |
|
· |
Secure applications: MobileIron provides a set of secure applications for end-user productivity. These include Apps@Work (enterprise app store), Docs@Work (secure content), Email+ (secure email and PIM), Help@Work (troubleshooting), and Web@Work (secure browsing). In addition, MobileIron AppConnect is an SDK and wrapper that third-party developers can integrate into their applications to provide a higher level of security through additional encryption and advanced security controls. |
|
· |
Threat intelligence: MobileIron Threat Defense uses machine learning-based analysis to identify zero-day threats on the device, within client apps, and across the network. It then triggers the appropriate security response, from notification to deletion of data. |
Our Competitive Strengths
Customers buy the MobileIron solution when data security is a priority. Our strengths are:
|
· |
Government-grade security: We protect data on the device and across the network and enforce secure access to back-end business services. This end-to-end approach simplifies the deployment of security policies for our customers. We were the first company to receive Common Criteria certification against Version 2.0 of the Protection Profile for Mobile Device Management. Common Criteria is an internationally recognized set of guidelines (ISO/IEC 15408) used by governments, banks and other organizations to assess the security capabilities of technology products. We have been positioned in the Leaders Quadrant of the Gartner Magic Quadrant for Enterprise Mobility Management Suites seven years in a row 1 because of our strength in modern security. We have been granted 65 patents in our solution category as of December 31, 2017, which we believe is more than any of our competitors. |
|
· |
Cross-stack architecture: We have extensive support for Android, iOS, macOS, and Windows 10 endpoints. Our standards-based, adaptive access architecture allows us to protect cloud services across vendors such as Box, Concur, Google G Suite, Microsoft Office 365, Salesforce, ServiceNow, Tableau, and Workday. Our cross-stack architecture lets our customers securely deploy best-of-breed cloud services and endpoints. |
5
|
· |
Global customer support organization. The capability and quality of our solution combined with the strength of our global customer support organization has been a competitive differentiator. In 2017, we received the Service Capability & Performance (SCP) Standards certification for our customer support operations. |
|
· |
Platform extensibility and ecosystem breadth. We provide extensive product support for the operating system ecosystem (Apple, Google and Microsoft) with zero-day compatibility for new releases. Our AppConnect technology allows customers and independent software vendors (ISVs) to build applications that can be secured by MobileIron. Our ServiceConnect technology allows customers to deploy integrated workflows between MobileIron and their existing security and infrastructure solutions. We believe that our best-of-breed ecosystem is a competitive advantage over the single-stack lock-in of some of our competitors. As of December 31, 2017, our ecosystem had over 1,500 registered developers. Of those registered developers, the top 210 ISVs that we track had released over 350 technology integrations. |
1 *Gartner "Magic Quadrant for Enterprise Mobility Management Suites" by Rob Smith, Bryan Taylor, Manjunath Bhat, Chris Silva, Terrence Cosgrove, June 6, 2017.
Gartner does not endorse any vendor, product or service depicted in its research publications, and does not advise technology users to select only those vendors with the highest ratings or other designation. Gartner research publications consist of the opinions of Gartner's research organization and should not be construed as statements of fact. Gartner disclaims all warranties, expressed or implied, with respect to this research, including any warranties of merchantability or fitness for a particular purpose. The Gartner Report(s) described herein, (the "Gartner Report(s)") represent(s) research opinion or viewpoints published, as part of a syndicated subscription service, by Gartner, Inc. ("Gartner"), and are not representations of fact. Each Gartner Report speaks as of its original publication date (and not as of the date of this Form 10-K) and the opinions expressed in the Gartner Report(s) are subject to change without notice.
6
Customers
Our customers include leading enterprises in a broad range of industries, including financial services, government, healthcare, legal, manufacturing, professional services, retail, technology and telecommunications. No single industry verticals accounted for more than 20% of our gross billings in the three year period ended 2017. Medium to large enterprises accounted for a majority of our gross billings. We have sold our products to over 16,000 customers globally, including more than 500 companies on the Forbes Global 2000 Leading Companies list, as of December 31, 2017. Our channel partners include resellers, service providers and system integrators. We recognized 46%, 47% and 50% of total revenue from customers with a billing address in the United States in 2017, 2016 and 2015, respectively. We recognized 12% and 13% of total revenue from customers with a billing address in Germany in 2017 and 2016, respectively. No other country exceeded 10% of the total revenue in 2015. AT&T, Inc., as a reseller, accounted for approximately 14%, 15% and 16% of our total revenue in 2017, 2016 and 2015, respectively. No end user of our products accounted for more than 5% of our total revenue in 2017, 2016 or 2015.
Backlog
As is typical in the software industry, we expect a significant portion of our software license orders to be received in the last month of each quarter. We do not believe that our backlog at any particular time is meaningful because it has historically been immaterial relative to our total revenue and is not necessarily indicative of future revenue in any given period.
Sales and Marketing
We sell the substantial majority of our products through indirect sales channels and, as a result, maintain a sales force that works closely with our channel partners to develop sales opportunities. We have an outside salesforce focused on large organizations and an inside salesforce focused on mid-sized organizations. Our channel team works with our service providers to address small to mid-sized organizations. Our marketing team focuses on driving customer demand, building brand reputation, expanding market awareness, and enabling our internal and extended (channel) sales teams.
Our sales organization is supported by sales engineers with deep technical expertise and responsibility for pre-sales technical support and the technical training of our channel partners. Our sales organization has strong alignment with our customer success organization. Our sales cycle ranges from a few weeks for small businesses to many months for large enterprises.
We work with mobile and security focused channel partners to sell our platform to customers. We focus on building in-depth relationships with a number of solutions-oriented partners that have strong industry expertise. These channel partners include both traditional IT resellers as well as service providers. We operate a formal accreditation program for the sales and technical professionals of our channel partners.
Research and Development
We have invested significant time and financial resources in the development of our platform and believe that continued research and development is critical to our ongoing success. Research and development investments drive innovation and keep pace with the rapidly evolving mobile and cloud ecosystem. We believe that innovation and timely development of new features and products are essential to meeting the needs of our customers and channel partners and improving our competitive position.
Research and development expense totaled $75.4 million, $67.4 million and $61.9 million in 2017, 2016 and 2015, respectively. We plan to continue to significantly invest in resources to conduct our research and development efforts.
7
Competition
We operate in a highly competitive industry that is characterized by constant change and innovation. Changes in the devices, operating systems, applications and technology landscape result in evolving customer requirements.
Our competitors fall into two primary categories:
|
· |
diversified technology companies such as Microsoft, VMware, and IBM; and |
|
· |
mobile specialists such as BlackBerry. |
The principal competitive factors in our market include:
|
· |
product features, reliability, performance and effectiveness; |
|
· |
price and total cost of ownership; |
|
· |
depth of customer relationships; |
|
· |
product extensibility and ability to integrate with other technology infrastructures; |
|
· |
flexibility between cloud and on-premise deployment; |
|
· |
mobile IT expertise and focus; |
|
· |
channel depth and breadth; |
|
· |
strength of sales and marketing efforts; |
|
· |
brand awareness and reputation; and |
|
· |
focus on customer service and success. |
We believe we compare favorably with our competitors on the basis of these factors. However, many of our competitors have substantially greater financial and technical resources, stronger name recognition, larger sales and marketing budgets, broader distribution and more entrenched relationships. Some of them embed their competitive solutions into broader software and services bundles. For more information about the competitive risks we face, refer to Item 1A. “Risk Factors” included elsewhere in this Annual Report on Form 10-K.
Intellectual Property
We protect our core technology and intellectual property by relying on federal, state, common law and international intellectual property rights, including patents, trade secrets, copyrights and trademarks. We also rely on confidentiality and contractual restrictions, including confidentiality and invention assignment agreements with our employees and contractors and confidentiality agreements with third parties.
We pursue registration of our patents, trademarks and domain names in the United States and certain locations outside the United States. We actively seek patent protection covering inventions originating from the Company and acquire patents we believe may be useful or relevant to our business. As of December 31, 2017, we owned 65 patents worldwide covering various innovations of our modern unified endpoint management (UEM) technology.
Circumstances outside our control could pose a threat to our intellectual property rights. For example, effective intellectual property protection may not be available outside the United States. Also, the efforts we have taken to protect our proprietary rights may not be sufficient or effective.
8
Companies in the mobile and other technology industries or non-practicing entities may own large numbers of patents, copyrights and trademarks and may frequently request license agreements, threaten litigation or file suit against us based on allegations of infringement or other violations of intellectual property rights. We have faced, and expect to face in the future, suits or allegations that we have infringed the trademarks, copyrights, patents and other intellectual property rights of third parties, including those of our competitors and non-practicing entities. As we face increasing competition and as our business grows, we will likely face more claims of infringement.
Employees
As of December 31, 2017, we had 884 full-time employees, 374 of whom were primarily engaged in research and development, 272 of whom were primarily engaged in sales and marketing, 135 of whom were primarily engaged in customer success and 103 of whom were primarily engaged in administration and finance. 414 of these employees were located outside of the United States. None of our United States employees are represented by a labor organization or are party to any collective bargaining arrangement. Employees in certain European countries have the benefits of collective bargaining arrangements at the national level. We have never had a work stoppage, and we consider our relationship with our employees to be good.
Segment and Geographic information
We conduct business globally. Our chief operating decision maker (Chief Executive Officer) reviews financial information presented on a consolidated basis accompanied by information about revenue by geographic region for purposes of allocating resources and evaluating financial performance. We have one business activity, and there are no segment managers who are held accountable for operations, operating results or plans for levels, components or types of products or services below the consolidated company level. Accordingly, we are considered to be a single reportable segment and operating unit structure.
Revenue by geographic region based on the billing address was as follows:
|
|
|
|
|
|
|
|
|
|
|
|
|
|
Year Ended December 31, |
|||||||
|
(in thousands) |
|
2017 |
|
2016 |
|
2015 |
|||
|
Revenue |
|
|
|
|
|
|
|
|
|
|
United States |
|
$ |
81,335 |
|
$ |
77,039 |
|
$ |
74,235 |
|
International |
|
|
95,156 |
|
|
86,887 |
|
|
75,063 |
|
Total |
|
$ |
176,491 |
|
$ |
163,926 |
|
$ |
149,298 |
$2.7 million and $1.3 million, or 30% and 24%, as of December 31, 2017 and 2016, respectively, of our net Property and Equipment was attributable to our operations located in India. Substantially all other long-lived assets were attributable to operations in the United States.
Facilities
Our principal executive offices are located in Mountain View, California and include two buildings totaling approximately 78,000 square feet under leases expiring from June 2020 to May 2023. We have additional office locations in the United States and in various international locations, including offices in the United Kingdom, Netherlands, Germany, Japan, Singapore and India.
We may add new facilities or expand existing facilities as we add employees, and we believe that suitable additional or substitute space will be available on commercially reasonable terms to meet our future needs.
Legal Proceedings
On August 5, 2015, August 21, 2015 and August 24, 2015, purported stockholder class action lawsuits were filed in the Superior Court of California, Santa Clara County against the Company, certain of its officers, directors, underwriters and investors, captioned Schneider v. MobileIron, Inc., et al., Kerley v. MobileIron, Inc., et al. and Steinberg v. MobileIron, Inc., et al, which were subsequently consolidated under the case caption In re MobileIron Shareholder Litigation. The actions are purportedly brought on behalf of a putative class of all persons who purchased
9
the Company’s securities issued pursuant or traceable to the Company’s registration statement and the June 12, 2014 initial public offering. The lawsuits assert claims for violations of Sections 11, 12(a)(2) and 15 of the Securities Act of 1933. The complaint seeks among other things, compensatory damages and attorney’s fees and costs on behalf of the putative class. On April 12, 2016, Plaintiffs filed a corrected consolidated complaint, which no longer names the underwriters or investors as defendants. On August 8, 2016 the Company filed a demurrer to the corrected consolidated complaint. The court overruled the demurrer on October 4, 2016.
On March 8, 2017, the Company reached an agreement in principle to settle the above-described actions and the court granted preliminary approval of that settlement on June 9, 2017. The court approved the settlement on August 21, 2017 and entered final judgment in the case on October 11, 2017 releasing all parties. The settlement called for a payment of $7.5 million to the plaintiffs in resolution of all claims against the Company, its officers, directors and the other defendants. The Company contributed $1.1 million to the settlement in 2017. This amount represented the remainder of the Company’s retention amount under its Director & Officer liability insurance policy. The balance was paid by the Company’s Director & Officer liability insurance.
While the Company and the other defendants continue to deny each of the plaintiffs’ claims and deny any liability, the Company agreed to the settlement solely to resolve the disputes, to avoid the costs and risks of further litigation and to avoid further distractions to management.
We continually evaluate uncertainties associated with litigation and record a charge equal to at least the minimum estimated liability for a loss contingency when both of the following conditions are met: (i) information available prior to issuance of the financial statements indicates that it is probable that a liability has been incurred at the date of the financial statements and (ii) the loss or range of loss can be reasonably estimated. If we determine that a loss is possible and a range of the loss can be reasonably estimated, we disclose the range of the possible loss in the Notes to the Consolidated Financial Statements. We evaluate, on a quarterly basis, developments in our legal matters that could affect the amount of liability that has been previously accrued, if any, and the matters and related ranges of possible losses disclosed, and make adjustments and changes to our disclosures as appropriate. Significant judgment is required to determine both likelihood of there being and the estimated amount of a loss related to such matters. Until the final resolution of such matters, there may be an exposure to loss, and such amounts could be material. An estimate of a reasonably possible loss (or a range of loss) cannot be made in our lawsuits at this time.
Indemnification
Under the indemnification provisions of our standard sales related contracts, we agree to defend and/or settle claims brought by third parties against our customers and channel partners alleging that our software or the customer’s use thereof infringes the third party’s intellectual property right, such as a patent right. These indemnification obligations are typically not subject to limitation; however if we believe such a claim is reasonably likely to occur and if it is commercially impractical for us to either procure the right for the customer to continue to use our software or modify our software so that it’s not infringing, we can terminate the customer agreement and refund the customer a portion of the license fees paid (prorated over the three year period from initial delivery for software licensed on a perpetual basis). We also on occasion indemnify our customers for other types of third party claims. In addition, we indemnify our officers, directors, and certain key employees while they are serving in such capacities in good faith. Through December 31, 2017, we have not received any material written claim for indemnification.
Corporate Information
Our principal executive offices are located at 401 East Middlefield Road, Mountain View, CA 94043, and our telephone number is (650) 919-8100. Our website is www.mobileiron.com. The information posted on our website is not incorporated into this Annual Report on Form 10-K. Our Annual Report on Form 10-K, Quarterly Reports on Form 10-Q, Current Reports on Form 8-K and amendments to reports filed or furnished pursuant to Sections 13(a) and 15(d) of the Securities Exchange Act of 1934, as amended, are available free of charge on our investor relations website as soon as reasonably practicable after we electronically file such material with, or furnish it to, the SEC.
10
You may also access all of our public filings through the SEC's website at www.sec.gov. Further, a copy of this Annual Report on Form 10-K is located at the SEC's Public Reference Room at 100 F Street, NE, Washington, D.C. 20549. Information on the operation of the Public Reference Room can be obtained by calling the SEC at 1-800-SEC-0330.
11
Risks Related to Our Business and Industry
We have a limited operating history, which makes it difficult to evaluate our prospects and future financial results and may increase the risk that we will not be successful.
As a result of our limited operating history, our ability to forecast our future operating results is limited and subject to a number of uncertainties, including our ability to plan for and model future growth. We have encountered and expect to continue to encounter risks and uncertainties frequently experienced by growing companies in rapidly changing markets. If our assumptions regarding these uncertainties are incorrect or change in reaction to changes in our markets, or if we do not manage or address these risks successfully, our results of operations could differ materially from our expectations, and our business could suffer. Any success that we may experience in the future will depend, in large part, on our ability to, among other things:
|
— |
retain and expand our customer base on a cost-effective basis; |
|
|
— |
increase revenues from existing customers as they add users or devices; |
|
|
|
— |
increase revenues from existing customers as they purchase additional solutions; |
|
|
— |
successfully compete in our markets; |
|
|
— |
continue to add features and functionality to our solutions to meet customer demand; |
|
|
— |
gain market traction with our MobileIron cloud platform and our more recently introduced products and services such as MobileIron Access and MobileIron Threat Defense; |
|
|
— |
continue to invest in research and development and bring new products to market; |
|
|
— |
scale our engineering and internal business operations in an efficient and cost-effective manner; |
|
|
— |
scale our global Customer Success organization to make our customers successful in their mobile IT deployments; |
|
|
— |
continue to expand our solutions across mobile and modern operating systems and device platforms; |
|
|
— |
hire, integrate and retain professional and technical talent; |
|
|
— |
make our service provider partners successful in their deployments of our solutions and technology; |
|
|
— |
successfully expand our business domestically and internationally; and |
|
|
— |
successfully protect our intellectual property and defend against intellectual property infringement claims. |
We have had net losses each year since our inception and may not achieve or maintain profitability in the future.
We have incurred net losses each year since our inception, including net losses of $56.3 million, $67.2 million and $84.5 million in 2017, 2016 and 2015, respectively. As of December 31, 2017, our accumulated deficit was $398.7 million. Our revenue growth rate from 2016 to 2017 slowed compared to the revenue growth rate from 2015 to 2016, and we may not be able to sustain or increase our growth rate or achieve or sustain profitability in the future. The revenue growth rate has slowed, and may additionally slow or revenue may decline, for a number of reasons, including, but not limited to our customers’ and/or prospective customers’ failure to widely deploy mobile apps within their businesses, increasing and entrenched competition, changes in pricing model, customers’ failure to renew or expand their deployments of our software, product and billing model mix shift, a decrease in size or growth of the mobile IT market, or any failure to capitalize on market opportunities. In addition, we plan to continue to invest for future growth,
12
in part by making additional investments in research and development, and as a result, we do not expect to be profitable for the foreseeable future. In addition, we will need to increase operating efficiency, which may be challenging given our operational complexity, the expenses outlined above, and expenses associated with being a public company. As a result of these increased expenditures, we will have to generate and sustain increased revenues to achieve future profitability. We may incur significant losses in the future for a number of reasons, including without limitation the other risks and uncertainties described in this Annual Report on Form 10-K. Additionally, we may encounter unforeseen operating expenses, difficulties, complications, delays and other unknown factors that may result in losses in future periods. If these losses exceed our expectations or our revenue growth expectations are not met in future periods, our financial performance will be harmed.
Our operating results may fluctuate significantly, which makes our future results difficult to predict and could cause our operating results to fall below expectations or our guidance.
Our quarterly operating results have fluctuated in the past and may fluctuate significantly in the future. The timing and size of sales of our solutions makes our revenue highly variable and difficult to predict and can result in significant fluctuations in our revenue from period to period. Historically, a substantial portion of our revenue has been generated from sales of software solutions sold as perpetual licenses to large enterprise companies, which tend to close near the end of a given quarter. Further, our customers’ and prospective customers’ buying patterns and sales cycles can vary significantly from quarter to quarter and are not subject to an established pattern over the course of a quarter. Accordingly, at the beginning of a quarter, we have limited visibility into the level of sales that will be made in that quarter. If expected revenue at the end of any quarter is reduced or delayed for any reason, we may not be able to reduce our costs sufficiently to compensate for an unexpected shortfall in revenue, and even a small shortfall in revenue could disproportionately and adversely affect our operating margin, operating results or other key metrics for a given quarter.
Our operating results may fluctuate due to a variety of other factors, many of which are outside of our control, and any of which may cause our stock price to fluctuate. In addition to other risks listed in this “Risk Factors” section, factors that may affect our operating results include, but are not limited to:
|
|
— |
the inherent complexity, length and associated unpredictability of our sales cycles for our solutions; |
|
|
|
|
|
|
— |
the extent to which our customers and prospective customers delay or defer purchase decisions in a quarter, particularly in the last few weeks of the quarter, which is when we typically complete a large portion of our sales for a quarter; |
|
|
|
|
|
|
— |
our ability to develop and release in a timely manner new solutions, features and functionality that meet customer requirements; |
|
|
|
|
|
|
— |
changes in pricing due to competitive pricing pressure or other factors; |
|
|
|
|
|
|
— |
reductions and reprioritizations in customers’ IT budgets and delays in the purchasing cycles of our customers and prospective customers; |
|
|
|
|
|
|
— |
variation in sales channels or in mix of solutions sold, including the mix of solutions sold on a perpetual license versus a subscription or monthly recurring contract, or MRC, basis1; |
|
|
|
|
|
|
— |
the timing of recognizing revenue in any given quarter as a result of revenue recognition accounting rules, including the extent to which revenue from sales transactions in a given period may not be recognized until a future period or, conversely, the satisfaction of revenue recognition rules in a given period resulting in the recognition of revenue from transactions initiated in prior periods; |
|
|
|
|
13
|
|
— |
changes in our mix of revenue as a result of our different deployment options and licensing models and the ensuing revenue recognition effects; |
|
|
|
|
|
|
— |
the effect of litigation; |
|
|
|
|
|
|
— |
changes in foreign currency exchange rates; and |
|
|
|
|
|
|
— |
general economic conditions in our domestic and international markets. |
1In the MRC model, revenue and billings are based on active devices or users of the service provider’s customer and are reported to us by the service provider on a monthly basis over time and billed by us one month in arrears. Under the MRC model, we receive no billings or revenue for MRC at the time the deal is booked, but instead the MRC is billed and revenue is recognized each month based on active usage. Unlike one-year and other term subscriptions, MRC is not reflected in deferred revenue.
The cumulative effects of these factors could result in large fluctuations and unpredictability in our quarterly operating results. As a result, comparing our operating results on a period-to-period basis may not be meaningful. You should not rely on our past results as an indication of our future performance.
If our customers do not place significant follow-on orders to deploy our solutions widely throughout their companies, or if they do not renew with us or if they do not purchase additional solutions, our future revenue and operating results will be harmed.
In order to increase our revenues we must continually grow our customer base and increase the depth and breadth of the deployments of our solutions with our existing customers. While customers may initially purchase a relatively modest number of licenses, it is important to our revenue growth that they later expand the use of our software on substantially more devices or for more users throughout their business. We also need to upsell—to sell additional solutions—to the same customers. Our strategy also depends on our existing customers renewing their software support or subscription agreements with us. Because of the number of participants, consolidation in the mobile IT market and competing priorities within customers’ IT budgets, customers may delay making initial purchase orders or expanding orders as they take into account the evolving mobile IT landscape. Also, if we do not successfully develop and market new solutions, features and functionality that meet our customers’ needs, they may not place upsell orders or expand orders. The rate at which our customers purchase additional solutions depends on a number of factors, including the relative prioritization of the IT budget allocated to mobile projects versus other IT projects, perceived need for additional solutions, features or functionality, the reliability of our solutions and other competitive factors, such as pricing and competitors’ offerings. If our efforts to sell additional licenses to our customers and to upsell additional solutions to our customers are not successful, our business may suffer. In addition, we have entered into enterprise license arrangements with certain large customers under which they pay an amount up front and in turn can deploy an unlimited number of devices in a certain period, thereby lowering potential future additional orders from those customers.
Further, existing customers that purchase our solutions have no contractual obligation to purchase additional solutions after the initial subscription or contract period, and given our limited operating history, we are unable to accurately predict our customer expansion or renewal rates. Our customers’ expansion and renewal rates may decline or fluctuate as a result of a number of factors, including the level of their satisfaction with our solutions or our customer support, customer budgets, the pricing and breadth of our solutions compared with the solutions offered by our competitors, and the impact of our competitors’ selling enterprise mobility management or mobile security as a component of a broader suite, any of which may cause our revenue to grow more slowly than expected, if at all. Competition from larger companies has in the past and may in the future lengthen the renewal process and require us to recompete for renewal business.
For smaller or simpler deployments, the switching costs and time are relatively minor compared to traditional enterprise software deployments and a customer may decide not to renew with us and switch to a competitor’s offerings. Accordingly, we must invest significant time and resources in providing ongoing value to our customers. If these efforts
14
fail, or if our customers do not renew for other reasons, or if they renew on terms less favorable to us, our revenue may decline and our business will suffer.
We are in a highly competitive market, and competitive pressures from existing and new companies may harm our business, revenues, growth rates and market share. In addition, there has been consolidation in our market, and a number of our current or potential competitors have longer operating histories, greater brand recognition, larger customer bases and significantly greater resources than we do.
Our market is intensely competitive, and we expect competition to increase in the future from established competitors, consolidations and new market entrants. Our major competitors include Blackberry, Citrix, IBM, Microsoft and VMware. A number of our historical competitors have been purchased by large corporations. For example, AirWatch was acquired by VMware and Good Technology was acquired by Blackberry. These large corporations have longer operating histories, greater name recognition, larger and better established customer bases, more channel partners, and significantly greater financial, technical, sales, marketing and other resources than we have. Because these competitors possess greater resources, they may be able to adapt more quickly to new technologies and changes in customer requirements, devote greater resources to the promotion and sale of their solutions, purchase companies or new technologies, initiate or withstand substantial price competition, and/or develop and expand their products and features more quickly than we can. In addition, certain of our competitors may be able to leverage their relationships with customers based on an installed base of solutions or to incorporate functionality into existing solutions to gain business in a manner that discourages customers from including us in competitive bidding processes, evaluating and/or purchasing our solutions. They have done this in the past, and may in the future do this, by selling at zero or negative margins, through solution bundling or through enterprise license deals. Some potential customers, especially Forbes Global 2000 Leading Companies, have already made investments in, or may make investments in, substantial personnel and financial resources and established deep relationships with these much larger enterprise IT vendors, which may make them reluctant to evaluate our solutions or work with us regardless of solution performance or features. Potential customers may prefer to purchase a broad suite of solutions from a single provider, or may prefer to purchase mobile IT solutions from an existing supplier rather than a new supplier, regardless of performance or features.
We expect competition to intensify in the future as new and existing competitors introduce new solutions into our market. In addition, some of our competitors have entered into partnerships or other strategic relationships or purchased companies to offer a more comprehensive solution than they individually had offered. We expect this trend to continue as companies attempt to strengthen or maintain their market positions in an evolving industry. This competition has resulted in the past and could in the future result in increased pressure on pricing and renewals, increased sales and marketing expenses, or harm to our market share, any of which could harm our business. Competitors’ offerings may in the future have better performance or features, lower prices and/or broader acceptance than our solutions. Competitors’ products could also include new technologies, which could render our existing solutions obsolete or less attractive to customers, or be bundled with legacy enterprise security and management products as a “one-stop-shop” offering, which certain customers with large installed bases of those legacy products may prefer. If we fail to keep up with technological changes or to convince our customers and potential customers of the value of our solutions, our business, operating results and financial condition could be materially and adversely affected.
We compete in rapidly evolving markets and must develop new solutions and enhancements to our existing solutions. If we fail to predict and respond rapidly to emerging technological trends and our customers’ changing needs, we may not be able to remain competitive. In addition, we may not generate positive returns on our research and development investments, which may harm our operating results.
Our markets are characterized by rapidly changing technology, changing customer needs, evolving operating system standards and frequent introductions of new offerings. To succeed, we must effectively anticipate, and adapt in a timely manner to, customer and multiple operating system requirements and continue to develop or acquire new solutions and features that meet market demands and technology trends. Likewise, if our competitors introduce new offerings that compete with ours or incorporate features that are not available in our solutions, we may be required to reposition our solutions or introduce new solutions in response to such competitive pressure. We may not have access to or have adequate notice of new operating system developments, and we may experience unanticipated delays in developing new solutions and cloud services or fail to meet customer expectations for such solutions. If we fail to timely develop and introduce new solutions or enhancements that respond adequately to new challenges in the mobile IT
15
market, our business could be adversely affected, especially if our competitors are able to more timely introduce solutions with such increased functionality.
We have invested significant time and financial resources in the development of our platforms and infrastructure and believe that we must continue to dedicate substantial resources to our research and development efforts to maintain our competitive position. Developing our products is expensive, and the investment in product development may not generate additional revenue in the near-term or at all. The research and development of new technologically advanced products is also a complex and uncertain process requiring high levels of innovation and investment, as well as the accurate forecasts of technology, market trends and consumer needs. Our failure to successfully develop new and improved products, services and technologies may reduce our future growth and profitability and may adversely affect our business, results and financial condition.
We have invested in MobileIron Access and MobileIron Threat Defense but have not yet gained substantial market traction. Should our MobileIron Access or MobileIron Threat Defense fail to achieve substantial market traction, we would lose the value of our investment and our business and operating results may be harmed.
Further, we may be required to commit significant resources to developing new solutions before knowing whether our investments will result in solutions that the market will accept. We are in the process of phasing out our older cloud-based product in favor of MobileIron Cloud, our newer and more scalable cloud-only platform. The failure to successfully market MobileIron Cloud as a replacement and improvement to our older cloud-based product or the failure of our customers and prospective customers to adopt MobileIron Cloud for any reason could result in a decline in our revenue.
These risks are greater in the mobile IT market because our software is deployed on endpoints (E.g., phones, tablets or laptops) that run on different operating systems, and these multiple operating systems change frequently in response to consumer demand. As a result, we may need to release new software updates at a much greater pace than a traditional enterprise software company that supports only traditional PCs. We may experience technical design, engineering, marketing and other difficulties that could delay or prevent the development, introduction or marketing of new solutions and enhancements on both of our technology platforms. As a result, we may not be successful in modifying our current solutions or introducing new ones in a timely or appropriately responsive manner, or at all. If we fail to address these changes successfully, our business and operating results could be materially harmed.
Finally, all of our additional solutions require customers to use our MobileIron platform, whether deployed on-premise or through our cloud service. As such, virtually all of our revenue depends on the continued adoption and use of our MobileIron platform. If customers and prospective customers decided to stop using or purchasing the MobileIron platform, our product strategy and business would be harmed.
An increasing portion of our sales has been generated from subscription licenses, which involves certain risks.
An increasing portion of our sales has been generated from subscription licenses. This mix shift towards subscription licensing, and differing revenue recognition patterns between the different types of subscriptions that we offer under the new revenue accounting guidelines, present a number of risks to us. We recognize a substantial portion of our subscription revenues over the term of the subscription agreement as compared to sales of perpetual licenses, which are recognized up-front at the time of delivery. Under the new revenue accounting guidelines, a portion of subscriptions to on-premises software will be recognized up-front, while the remainder of the subscription will be recognized over the subscription term. That revenue recognition pattern is different from subscriptions to cloud offerings, for which all revenue will be recognized ratably over the term of the subscription. MRC revenue, which is currently included in subscription revenue in our statements of operations, is recognized monthly on the basis of active users or devices and thus will fluctuate from month to month. We receive no revenue or billings on MRC at the time the deal is booked. As a result, even if customer demand increases, our revenues will not increase at the same rate as in prior periods, or may decline. Customers in a subscription arrangement may elect not to renew their contractual arrangement with us upon expiration, or they may attempt to renegotiate pricing or other contract provisions on terms that are less favorable to us. Service providers that operate on an MRC billing model typically report to us in arrears on a monthly basis the number of actual users or devices deployed, and then we generate invoices based on those reports. Therefore, invoicing and collection logistics often result in a longer collection cycle, which negatively affects our cash flow. In addition, under an
16
MRC billing model, the service provider typically has the contractual and business relationship with the customer, and thus we typically depend more heavily on the service provider partner for both customer acquisition and support under this billing model. To the extent that service providers bundle our solution with their offerings and price aggressively, it could result in an increase in MRC billings. We have in the past may in the future attempt to mitigate these risks by converting service providers or customers from MRC to perpetual or other licensing arrangements, which may reduce the long term value of the customer relationship.
Changes in features and functionality by operating system providers and mobile device manufacturers could cause us to make short-term changes in engineering focus or product development or otherwise impair our product development efforts or strategy, increase our costs, and harm our business.
Our platform depends on interoperability with operating systems, such as those provided by Apple, Google and Microsoft, as well as device manufacturers. Because mobile and other modern operating systems are released more frequently than legacy PC operating systems, and we typically have limited advance notice of changes in features and functionality of operating systems and mobile devices, we may be forced to divert resources from our preexisting product roadmap in order to accommodate these changes. As a result of this limited advance notice, we also have a short time to implement and test changes to our product to accommodate these new features, which increases the risk of product defects. In addition, if we fail to enable IT departments to support operating system upgrades upon release, our business and reputation could suffer. This could disrupt our product roadmap and cause us to delay introduction of planned solutions, features and functionality, which could harm our business.
Operating system providers have included, and may continue to include, features and functionality in their operating systems that are comparable to certain of our solutions, features and/or functionality, thereby making our platform less valuable. The inclusion of, or the announcement of an intent to include, functionality perceived to be similar to that offered by our mobile IT solutions in mobile or other modern operating systems may have an adverse effect on our ability to market and sell our solutions. Even if the functionality offered by mobile operating system providers is more limited than our solutions, a significant number of potential customers may elect to accept such limited functionality in lieu of purchasing our solutions. Furthermore, some of the features and functionality in our solutions require interoperability with operating system APIs, and if operating system providers decide to restrict our access to their APIs, that functionality would be lost and our business could be impaired. Finally, we have entered into contractual arrangements with operating systems providers and/or mobile device manufactures, under which we are obligated to certain development priorities, which can further limit our engineering flexibility.
We have experienced substantial turnover, and the loss of key personnel or an inability to attract, retain and motivate qualified personnel may impair our ability to expand our business.
Our success is substantially dependent upon the continued service and performance of our senior management team and key technical, marketing, sales and operations personnel. Over the last two years, we have experienced substantial turnover in our sales, engineering and executive teams, and this could continue in the future. The replacement of any members of our senior management team or other key personnel likely would involve significant time and costs and may harm our business, operating results and financial condition. Our future success also depends, in part, on our ability to continue to attract, integrate and retain highly skilled personnel, in particular engineers and sales personnel. Competition for highly skilled personnel is frequently intense, especially in the San Francisco Bay Area, where we have a substantial presence and need for highly skilled personnel, including, in particular, engineers. We must offer competitive compensation and opportunities for professional growth in order to attract and retain these highly skilled employees. Failure to successfully attract, integrate or retain qualified personnel to fulfill our current or future needs may negatively impact our growth.
A failure of our product strategy could harm our business.
Our product and business strategy is highly dependent on current and future customers continuing to adopt our solutions, features, and functionality, including expanding to newer products, such as MobileIron Access and MobileIron Threat Defense, and migrating to MobileIron Cloud. Slow adoption by enterprises of mobile business applications may slow the adoption of our platform, because customers who are not deploying business apps other than email may not see
17
value in our more advanced application security and management capabilities. If customers shift from client-side apps to web apps as the preferred interface for end-users, it would reduce the value of our security solution because less confidential data would reside on the endpoint. Operating system providers and larger software companies could harm our strategy by creating competitive solutions and/or bundling those solutions in a broader portfolio of products. For example, Microsoft bundled certain enterprise mobility management capabilities into Microsoft 365 in an attempt to dissuade customers from using solutions like MobileIron. If our product strategy is not successful for these or other reasons, the value of our investment would be lost and our results of operations would be harmed.
If we are not able to scale our business and manage our expenses, our operating results may suffer.
We have expanded, decreased and/or relocated specific functions over time in order to scale efficiently, including 2016 and 2017 restructurings to improve our cost structure and help scale our business. Our need to scale our business has placed, and will continue to place, a significant strain on our administrative and operational business processes, infrastructure, facilities and other resources. Our ability to manage our operations will require significant expenditures and allocation of valuable management resources to improve internal business processes and systems, including investments in automation. Further international expansion may also be required for our continued business growth, and managing any international expansion will require additional resources and controls. If our operations infrastructure and business processes fail to keep pace with our business and customer requirements, customers may experience disruptions in service or support or we may not scale the business efficiently, which could adversely affect our reputation and adversely affect our revenues. There is no guarantee that we will be able to continue to develop and expand our infrastructure and business processes at the pace necessary to scale the business, and our failure to do so may have an adverse effect on our business. If we fail to efficiently expand our engineering, operations, customer support, professional services, cloud infrastructure, IT and financial organizations and systems, or if we fail to implement or maintain effective internal business processes, controls and procedures, our costs and expenses may increase more than we planned or we may fail to execute on our product roadmap or our business plan, any of which would likely seriously harm our business, operating results and financial condition.
A security breach of our cloud service infrastructure or a disruption of our cloud service availability for any reason could result in liabilities, lost business and reputational harm.
In connection with providing our cloud service to customers, we obtain access to certain data, such as employees’ names, registration credentials, mobile device ID, geolocation of last device check-in, business email addresses, mobile phone numbers, business contact information and the list of applications installed on the mobile devices. Any security breach of the systems used to provide the cloud service, whether through third-party action or employee error or malfeasance, could result in damage, loss, misuse or theft of such data. A breach could also give rise to litigation or require us to incur financial and operational expenses in connection with fulfillment of certain indemnity obligations to our cloud service customers, settling or defending claims made against us, or complying with specific laws or regulations such as breach notification requirements. Techniques used to sabotage or obtain unauthorized access to information processing systems change frequently. In addition, they generally are not recognized until launched against a target. As a result, we may be unable to anticipate these techniques or to implement adequate preventative or mitigation measures in a timely manner. Because our software is designed to enable IT administrators to secure and manage sensitive data transmitted to or stored on employees’ mobile devices, the publicity associated with an actual or perceived breach of our cloud service infrastructure would likely result in particular reputational damage, as well as loss of potential sales and existing customers. In addition, unexpected increases in demand at one customer may affect the overall service in unanticipated ways and may cause a disruption in service for other customers of this platform. We have experienced, and may in the future experience, disruptions, outages and other performance problems with our cloud service. These problems may be caused by a variety of factors, including, but not limited to, infrastructure changes, human or software errors, viruses, malicious code, denial of service or other security attacks, fraud, spikes in customer usage and interruption or loss of critical third party hosting, power or Internet connectivity services. If we sustain disruptions of our cloud services for any reason, our reputation, business and results of operations would be seriously harmed.
18
Defects in our solutions could harm our business, including as a result of customer dissatisfaction, data breaches or other disruption, and subject us to substantial liability.
Because the mobile IT market involves multiple operating platforms, we provide frequent incremental releases of solution updates and functional enhancements. Such new versions frequently contain undetected errors when first introduced or released. We have found defects in new releases of our solutions, and new errors in our existing solutions may be detected in the future. Defects in our solutions may also result in vulnerability to security attacks, which could result in claims by customers and users for losses that they sustain.
Because our customers use our solutions for important aspects of their business, any errors, defects, disruptions in service or other performance problems with our solutions could hurt our reputation and may damage our customers’ businesses. In certain instances, our customers have stopped using or failed to expand use of, our solutions as a result of defects, and this may happen in the future. In addition, customers may delay or withhold payment to us, elect not to renew and make warranty claims or other claims against us. In addition, we rely on positive customer experience in order to sell additional products to other customers or sell to new customers. Defects or disruptions in our solution could result in reputational harm and loss of future sales. In addition, regardless of the party at fault, errors of these kinds divert the attention of our engineering personnel from our development efforts, damage our reputation and the reputation of our solutions, cause significant customer relations problems and can result in product liability claims.
Security breaches and other disruptions of our information systems could significantly impair our operations, compromise our ability to conduct our business and deliver our products and services, and result in significant data losses, theft of our intellectual property, significant liability, damage to our reputation, and loss of current and future business.
We rely on our IT systems for almost all of our business operations, including internal operations, product development, sales and marketing, and communications with customers and other business partners. The secure processing, maintenance and transmission of both our own sensitive information and our customers’ data is critical to our operations and business strategy. Despite our security measures, our information technology systems and infrastructure may be vulnerable to attacks by hackers or breached due to employee error, malfeasance or other disruptions. Any cyber security attack could result in the damage, loss, theft or misappropriation of our proprietary information or our customers’ data and/or cause interruptions of our internal business operations or the delivery of our solutions to customers. Because the techniques used by unauthorized persons to access or sabotage networks change frequently and may not be recognized until launched against a target, we may be unable to anticipate these techniques or readily detect or take remedial action against an attack. Further, if unauthorized access or sabotage remains undetected for an extended period of time, the effects of such breach could be exacerbated. We also depend on our employees to handle confidential data appropriately and deploy our information resources in a secure fashion that does not expose our network systems to security breaches and the loss of data. Any breach as a result of cyber criminals or employee malfeasance or error could compromise our networks and the information stored there could be accessed, publicly disclosed, lost or stolen. Our insurance may not be sufficient to cover all of our losses from any future breaches of our systems. We have also outsourced a number of our business functions to third parties, and we rely on distributors, resellers, system vendors, and system integrators to sell our products and services. Thus our business operations also depend, in part, on their cybersecurity measures. Any unauthorized access, disclosure or other loss of information could result in legal claims or proceedings, investigations by law enforcement or regulatory bodies, liability under laws that protect the privacy of personal information, regulatory penalties, could disrupt our operations and the solutions we provide to customers, could compromise our ability to protect our intellectual property rights, and could damage our reputation, which could adversely affect our business, financial condition, and operating results.
We depend and rely upon technologies from third parties to operate our products, and interruptions or performance problems with these technologies may adversely affect our business and results of operations.
We rely on applications from third parties in order to operate critical functions of our products. If these services become unavailable due to extended outages, interruptions, errors or defects or because they are no longer available on commercially reasonable terms, our expenses could increase, our ability to manage finances could be interrupted and
19
supporting our customers could be impaired until equivalent services, if available, are identified, obtained and implemented, all of which could adversely affect our business.
Real or perceived errors, failures or bugs in our software could adversely affect our business, results of operations, financial condition, and growth prospects.
Our software is complex, and therefore, undetected errors, failures or bugs may occur in the future. Our software is used in IT environments with different operating systems, system management software, applications, devices, databases, servers, storage, middleware, custom and third-party applications and equipment and networking configurations, which may cause errors or failures in the IT environment into which our software is deployed. This diversity increases the likelihood of errors or failures in those IT environments. Despite testing by us, real or perceived errors, failures or bugs may not be found until our customers use our software. Real or perceived errors, failures or bugs in our products could result in negative publicity, loss of or delay in market acceptance of our software and harm our brand, weakening of our competitive position, claims by customers for losses sustained by them or failure to meet the stated service level commitments in our customer agreements. In such an event, we may be required, or may choose, for customer relations or other reasons, to expend significant additional resources in order to help correct the problem. Any errors, failures or bugs in our software could impair our ability to attract new customers, retain existing customers or expand their use of our software, which would adversely affect our business, results of operations and financial condition.
Disruptions of the third-party data centers that host our cloud service could result in delays or outages of our cloud service and harm our business.
We currently host our cloud service from third-party data center facilities operated by several different providers located around the world, such as Equinix and Amazon Web Services. Any damage to, or failure of, our cloud service that is hosted by these third parties, whether as a result of our actions, actions by the third-party data centers, actions by other third parties, or acts of God, could result in interruptions in our cloud service and/or the loss of data. While the third-party hosting centers host the server infrastructure, we manage the cloud services through our site reliability engineering team and need to support version control, changes in cloud software parameters and the evolution of our solutions, all in a multi-OS environment. As we continue to add data centers and capacity in our existing data centers, we may move or transfer our data and our customers’ data. Despite precautions taken during this process, any unsuccessful data transfers may impair the delivery of our service. In some cases, we have entered into contractual service level commitments to maintain uptime of at least 99.9% for our cloud services platform and if we or our third-party data center facilities fail to meet these service level commitments, we may have to issue service credits to these customers. Impairment of, or interruptions in, our cloud services may reduce our subscription revenues, subject us to claims and litigation, cause our customers to terminate their subscriptions and adversely affect our subscription renewal rates and our ability to attract new customers. Our business will also be harmed if our customers and potential customers believe our services are unreliable.
We do not control, or in some cases have limited control over, the operation of the data center facilities we use, and they are vulnerable to damage or interruption from earthquakes, floods, fires, power loss, telecommunications failures and similar events. They may also be subject to break-ins, sabotage, intentional acts of vandalism and similar misconduct, and to adverse events caused by operator error. We cannot rapidly switch to new data centers or move customers from one data center to another in the event of any adverse event. Despite precautions taken at these facilities, the occurrence of a natural disaster, an act of terrorism or other act of malfeasance, a decision to close the facilities without adequate notice, or other unanticipated problems at these facilities could result in lengthy interruptions in our service and the loss of customer data and business.
The prices of our solutions may decrease or we may change our licensing and subscription programs, renewal programs or bundling arrangements, which may reduce our revenue and adversely impact our financial results.
The prices for our solutions may decline for a variety of reasons, including competitive pricing pressures, discounts, a change in our mix of solutions toward subscription, enterprise-wide licensing arrangements, bundling of solutions, features and functionality by us or our competitors, potential changes in our pricing, anticipation of the introduction of new solutions, or promotional programs for customers or channel partners. Competition and
20
consolidation continue to increase in the markets in which we participate, and we expect competition to further increase in the future, leading to increased pricing pressures. Larger competitors with more diverse product lines may reduce the price of solutions or services that compete with ours or may bundle their solutions with other solutions and services. Furthermore, we anticipate that the sales prices and gross profits for our solutions will decrease over product life cycles. If we are unable to increase sales to offset any decline in our prices, our business and results of operations would be harmed.
We continually re-evaluate our licensing and subscription programs and renewal programs, including specific license and subscription models and terms and conditions. We have in the past implemented, and could in the future implement, new licensing and subscription programs, renewal programs or bundling arrangements, including promotional programs or specified enhancements to our current and future solutions, enterprise licensing arrangements, discounted pricing and/or conversion of service providers or customers from one billing model to another. Such billing model, renewal programs or licensing and subscription arrangement changes may result in delayed revenue recognition.
Our ability to sell our solutions is highly dependent on the quality of our support, which is made complex by the requirements of mobile IT. Our failure to deliver high quality support would have a material adverse effect on our sales and results of operations.
Once our solutions are deployed, our customers depend on our support organization or that of our channel partners to resolve any issues relating to our solutions. Our failure to provide effective support has in the past, and could in the future, adversely affect our ability to sell our solutions or increase the number of licenses sold to existing customers. Our customer support is especially critical because the mobile IT market requires relatively frequent software releases. Mobile IT requires a complex set of features, functionality and controls, which makes support critical and difficult. In addition, we target companies on the Forbes Global 2000 Leading Companies list, many of whom have complex networks and require higher levels of support than smaller customers. As customers deploy more licenses and purchase a broader array of our solutions, the complexity and difficulty of our support obligations increase. If we fail to meet the requirements of the larger customers, it may be more difficult to increase our deployments either within our existing Forbes Global 2000 Leading Companies list or other customers or with new Forbes Global 2000 Leading Companies list customers. We face additional challenges in supporting our non-U.S. customers, including the employment and retention of qualified support personnel and the need to rely on channel partners to provide support.
We rely substantially on channel partners for the sale and distribution of our solutions and, in some instances, for the support of our solutions. A loss of certain channel partners, a decrease in revenues from certain of these channel partners or any failure in our channel strategy could adversely affect our business.
A substantial portion of our sales are through channel partners – either telecommunications carriers, which we call service providers, or other resellers – and thus we depend on our channel partners and on our channel partner strategy for the vast majority of our revenue. Our international resellers often enter into agreements directly with our mutual customers to host our software and provide other value-added services, such as IT administration.
Our service provider partners often provide support to our customers and enter into similar agreements directly with our mutual customers to host our software and/or provide other value-added services. Our agreements and operating relationships with our service provider partners are complex and require a significant commitment of internal time and resources. In addition, our service provider partners are large corporations with multiple strategic businesses and relationships, and thus our business may not be significant to them in the overall context of their much larger enterprise. Even if the service provider partner considers us to be an important strategic relationship, internal processes at these large partners are sometimes difficult and time-consuming to navigate. Thus, any loss of a major channel partner or failure of our channel strategy could adversely affect our business. AT&T, as a reseller, is our largest service provider partner and was responsible for 14% of our total revenue for the year ended December 31, 2017.
Our agreements with AT&T and our other channel partners are non-exclusive and most of our channel partners have entered, and may continue to enter, into strategic relationships with our competitors. Our channel partners may terminate their respective relationships with us with limited or no notice and with limited or no penalty, pursue other partnerships or relationships, or attempt to develop or acquire solutions or services that compete with our solutions. If our channel partners do not effectively market and sell our solutions, if they choose to place greater emphasis on
21
solutions of their own or those offered by our competitors, or if they fail to provide adequate support or otherwise meet the needs of our customers, our ability to grow our business and sell our solutions may be adversely affected. The loss of our channel partners, in particular AT&T, the failure to recruit additional channel partners, or any reduction or delay in sales of our solutions by our channel partners could materially and adversely affect our results of operations.
In addition, we have sold and will sell directly to end-user customers, which may adversely affect our relationship with our channel partners.
Our sales cycles for large enterprises are often long, unpredictable and expensive. As a result, our sales and revenue are difficult to predict and may vary substantially from period to period, which may cause our operating results to fluctuate significantly.
Our sales efforts involve educating our customers about the use and benefits of our solutions, including the technical capabilities of our solutions and the business value of our solutions. Many of our large customers have very complex IT systems, mobile environments and data privacy and security requirements. Accordingly, many of these customers undertake a significant evaluation process, which frequently involves not only our solutions, but also those of our competitors, and has resulted in lengthy sales cycles. We spend substantial time, money and effort on our sales activities without any assurance that our efforts will produce any sales. In addition, purchases of our solutions are frequently subject to budget constraints, multiple purchase approvals, lengthy contract negotiations and unplanned administrative, processing and other delays. Moreover, the evolving nature of the mobile IT market may lead prospective customers to postpone their purchasing decisions pending adoption of technology by others or pending potential consolidation in the market, and may require evaluation of our product my multiple functions within their company. As a result of our lengthy sales cycle, it is difficult to predict whether and when a sale will be completed, and our operating results may vary significantly from quarter to quarter. Even if sales are completed, the revenues we receive from these customers may not be sufficient to offset our upfront investments.
We seek to sell our solutions to large enterprises. Sales to and support of these types of enterprises involve risks that could harm our business, financial position and results of operations.
Our growth strategy is dependent, in part, upon increasing sales of our solutions to large enterprises. Sales to large customers involve risks that may not be present (or that are present to a lesser extent) with sales to smaller entities. These risks include:
|
|
— |
more complicated network requirements, which result in more difficult and time-consuming implementation processes; |
|
|
|
|
|
|
— |
more intense and time-consuming customer support practices; |
|
|
|
|
|
|
— |
increased purchasing power and leverage held by large customers in negotiating contractual arrangements with us; |
|
|
|
|
|
|
— |
more customer-favorable contractual terms, including penalties; |
|
|
|
|
|
|
— |
longer sales cycles and the associated risk that substantial time and resources may be spent on a potential customer that ultimately elects not to purchase our solution or purchases fewer licenses than we had anticipated; |
|
|
|
|
|
|
— |
closer relationships with, and dependence upon, large technology companies that offer competitive solutions; |
|
|
|
|
|
|
— |
an RFP process that may favor incumbent or larger technology companies; |
|
|
|
|
22
|
|
— |
increased reputational risk as a result of data breaches or other problems involving high profile customers; and |
|
|
|
|
|
|
— |
more pressure for discounts. |
If we are unable to increase sales of our solutions to large enterprises while mitigating the risks associated with serving such customers, our business, financial position and results of operations may suffer.
Our failure to comply with privacy and data protection laws could have a material adverse effect on our business.
Personal privacy and data protection have become significant issues in the United States, Europe and elsewhere where we offer our solutions. We collect contact and other personal or identifying information from our customers, and our customers increasingly use our cloud services to store and process personal information and other regulated data. We also maintain personal data of our employees in connection with our HR and benefits administration and share that information with third party payroll and benefits providers.
Many federal, state and foreign government bodies and agencies have adopted or are considering adopting laws and regulations regarding the collection, use, disclosure and retention of personal information, with which we must comply. The variety, complexity and changing nature of the privacy law landscape worldwide is challenging. If our solutions fail to adequately separate personal information and to maintain the security of enterprise applications and data, the market perception of the effectiveness of our solutions could be harmed, employee adoption of mobile initiatives could be slowed, we could lose potential sales and existing customers, and we could incur significant liabilities.
If any of our customers or prospective customers decide not to purchase our software as a result of this regulatory uncertainty, our revenues could decline and our business could suffer. Any inability to adequately address privacy concerns, whether valid or not, or to comply with applicable privacy or data protection laws, regulations and privacy standards, could result in additional cost and liability to us, damage our reputation, inhibit sales of our solutions and harm our business. Furthermore, the attention garnered by the National Security Agency’s bulk intelligence collection programs may result in further concerns surrounding privacy and technology products, which could harm our business.
The European Union data protection law, the General Data Protection Regulation (“GDPR”), which will become effective in May 2018, is wide-ranging in scope. To adapt to these new requirements, we are investing resources necessary to enhance our policies and controls across our business units, products and services relating to how we collect and use personal data relating to customers, distributors, resellers, personnel and suppliers. Additionally, we expect that the international transfer of personal data will present ongoing compliance challenges and complicate our business transactions as we negotiate and implement suitable arrangements with international customers and international and domestic suppliers. Failure to comply may lead to fines of up to €20 million or up to 4% of the annual global revenues of the infringer, whichever is greater. EU data protection laws and their interpretations continue to develop, and may be inconsistent from jurisdiction to jurisdiction, which may further impact our information processing activities. Further, laws such as the EU’s proposed e-Privacy Regulation are increasingly aimed at the use of personal information for marketing purposes, and the tracking of individuals’ online activities. In addition, countries outside the EU are considering or have passed legislation that requires local storage and processing of data, which could increase the cost and complexity of delivering our products and services. Our current arrangements for the transfer of personal data will need to continue to adapt to future judicial decisions and regulatory activity as laws on privacy and the protection of personal data continue to evolve in the countries in which we and our customers do business. If we do not adapt to such changes in the laws or regulations, our business and reputation could be harmed.
The failure of third parties to comply with privacy and data security laws could harm our business.
The regulatory framework for privacy issues worldwide is currently evolving and is likely to remain uncertain for the foreseeable future, in particular as it relates to cloud computing vendors. Our existing contractual provisions may not protect us from claims for data loss or regulatory noncompliance made against cloud computing providers with whom we contract. Any failure by us or our channel partners or cloud computing vendors to comply with posted privacy
23
policies, other privacy-related or data protection laws and regulations, or the privacy commitments contained in contracts could result in legal or regulatory proceedings and/or fines, which could harm our business and reputation.
Employee adoption of mobile initiatives depends on the credible and clear separation of enterprise applications and data and personal information on the device, as well as the privacy of such data. For our customers, it is also essential to maintain the security of enterprise data properly while retaining the native experience users expect. While we contractually obligate our customers to make the required disclosures and gain the required consents from their employees in order to comply with applicable law regarding the processing of personally identifiable information that the employer may access, we do not control whether they in fact do so, and in some jurisdictions such employee consent may not be enforceable. Any claim by an employee that his or her employer had not complied with applicable privacy laws in connection with the deployment and use of our software on the employee’s mobile device could harm our reputation and business and subject us to liability, whether or not warranted.
We may acquire other businesses which could require significant management attention, disrupt our business, dilute stockholder value and adversely affect our operating results.
As part of our business strategy, we may make investments in complementary companies, solutions or technologies. We may not be able to find suitable acquisition candidates, and we may not be able to complete such acquisitions on favorable terms, if at all. If we do complete acquisitions, we may not ultimately strengthen our competitive position or achieve our goals. In addition, if we are unsuccessful at integrating such acquisitions or developing the acquired technologies, the revenue and operating results of the combined company could be adversely affected. We have in the past and could in the future record impairment losses in connection with acquisitions. Further, the integration of an acquired company typically requires significant time and resources, and we may not be able to manage the process successfully. We may not successfully evaluate or utilize the acquired technology or personnel or accurately forecast the financial impact of an acquisition transaction, including accounting charges. We may have to pay cash, incur debt or issue equity securities to pay for any such acquisition, each of which could adversely affect our financial condition or the value of our common stock. The sale of equity or issuance of debt to finance any such acquisitions could result in dilution to our stockholders. The incurrence of indebtedness would result in increased fixed obligations and could also include covenants or other restrictions that would impede our ability to manage our operations.
We have indemnity obligations under our contracts with our customers and channel partners, which could have a material adverse effect on our business.
The mobile industry has been characterized by substantial patent infringement lawsuits. In our agreements with customers and channel partners, we typically agree to indemnify them for losses related to, among other things, claims by third parties of intellectual property infringement and sometimes data breaches resulting in the compromise of personal data. If any such indemnification obligations are triggered, we could face substantial liabilities or be forced to make changes to our solutions or terminate our customer agreements and refund monies. In addition, provisions regarding limitation of liability in our agreements with customers or channel partners may not be enforceable in some circumstances or jurisdictions or may not protect us from claims and related liabilities and costs. We maintain insurance to protect against certain types of claims associated with the use of our solutions, but our insurance may not adequately cover any such claims. In addition, even claims that ultimately are unsuccessful could result in expenditures of and divert management’s time and other resources. Furthermore, any legal claims from customers and channel partners could result in reputational harm and the delay or loss of market acceptance of our solutions.
A portion of our revenues are generated by sales to heavily regulated organizations and governmental entities, which are subject to a number of challenges and risks.
Some of our customers are either in highly regulated industries or are governmental entities and may be required to comply with more stringent regulations in connection with the implementation and use of our solutions. Selling to these entities can be highly competitive, expensive and time consuming, often requiring significant upfront time and expense without any assurance that we will successfully complete a sale or that the organization will deploy our solution at scale. Highly regulated and governmental entities often require contract terms that differ from our standard arrangements and impose compliance requirements that are complicated, require preferential pricing or “most favored
24
nation” terms and conditions, or are otherwise time-consuming and expensive to satisfy. If we are unable to gain any required federal clearance or certificate in a timely manner, or at all, we would likely be prohibited from selling to particular federal customers. In addition, government demand and payment for our solutions and services may be impacted by public sector budgetary cycles and funding authorizations, particularly in light of U.S. budgetary challenges, with funding reductions or delays adversely affecting public sector demand for our solutions. The additional costs associated with providing our solutions to governmental entities and highly regulated customers could harm our margins. Moreover, changes in the underlying regulatory conditions that affect these types of customers could harm our ability to efficiently provide our solutions to them and to grow or maintain our customer base.
If our solutions do not interoperate with our customers’ IT infrastructures, sales of our solutions could be negatively affected.
Our solutions need to interoperate with our customers’ existing IT infrastructures, which have varied and complex specifications. As a result, we must attempt to ensure that our solutions interoperate effectively with these different, complex and varied back-end environments. To meet these requirements, we have and must continue to undertake development and testing efforts that require significant capital and employee resources. We may not accomplish these development efforts quickly or cost-effectively, or at all. If our solutions do not interoperate effectively, orders for our solutions could be delayed or cancelled, which would harm our revenues, gross margins and reputation, potentially resulting in the loss of existing and potential customers. The failure of our solutions to interoperate effectively within the enterprise environment may divert the attention of our engineering personnel from our development efforts and cause significant customer relations problems. In addition, if our customers are unable to implement our solutions successfully, they may not renew or expand their deployments of our solutions, customer perceptions of our solutions may be impaired and our reputation and brand may suffer.
Although technical problems experienced by users may not be caused by our solutions, our business and reputation may be harmed if users perceive our solutions as the cause of a device failure.
The ability of our solutions to operate effectively can be negatively impacted by many different elements unrelated to our solutions. For example, a user’s experience may suffer from an incorrect setting in his or her mobile device, an issue relating to his or her employer’s corporate network or an issue relating to the underlying mobile operating system, none of which we control. Even though technical problems experienced by users may not be caused by our solutions, users often perceive the underlying cause to be a result of poor performance of our solution. This perception, even if incorrect, could harm our business and reputation.
Our customers may exceed their licensed device or user count, and it is sometimes difficult to collect payments as a result of channel logistics, which could harm our business, financial position and results of operations.
Our customers license our solutions on either a per-device or per-user basis. Because we sell the vast majority of our solutions through channel partners, and in some cases multiple tiers of channel partners, the logistics of collecting payments for excess usage can sometimes be time-consuming. We may also encounter difficulty collecting accounts receivable and could be exposed to risks associated with uncollectible accounts receivable. Economic conditions may impact some of our customers’ ability to pay their accounts payable. If we are unable to collect from our customers for their excess usage or otherwise or if we have to write down our accounts receivable, our revenues and operating results would suffer.
If the market for our solutions shrinks or does not continue to develop as we expect, our growth prospects may be harmed.
The success of our business depends on the continued growth and proliferation of mobile and other modern IT infrastructure as an increasingly important computing platform for businesses. Our business plan assumes that the demand for mobile and other modern IT solutions and the deployment of business apps on mobile devices will increase. However, the mobile IT market has slowed and may not develop as quickly as we expect, or at all, and businesses may not continue to elect to utilize mobile IT solutions as an advanced business platform. This market for our solutions may not develop for a variety of reasons, including that larger, more established companies will enter the market or that mobile operating system companies will offer substantially similar functionality or that companies may not deploy
25
business apps at scale and thus may be satisfied with less advanced technologies. Accordingly, demand for our solutions may not continue to develop as we anticipate, or at all, and the growth of our business and results of operations may be adversely affected. In addition, because we derive substantially all of our revenue from the adoption and use of our platform, a decline or slowing growth in the mobile IT market would harm the results of our business operations more seriously than if we derived significant revenue from a variety of other products and services.
Our estimates of market opportunity and forecasts of market growth may prove to be inaccurate, and even if the markets in which we compete achieve the forecasted growth, we cannot assure you our business will grow at similar rates, if at all.
Growth forecasts are subject to significant uncertainty and are based on assumptions and estimates, which may not prove to be accurate. Forecasts relating to our market opportunity and the expected growth in the mobile IT market and other markets may prove to be inaccurate. Even if these markets experience the forecasted growth, we may not grow our business at similar rates, or at all. Our growth will be affected by many factors, including our success in implementing our business strategy, which is subject to many risks and uncertainties.
Seasonality may cause fluctuations in our revenue.
We believe there are significant seasonal factors that may cause us to record higher revenue in some quarters compared with others. We believe this variability is largely due to our customers’ budgetary and spending patterns, as many customers spend the unused portions of their discretionary budgets prior to the end of their fiscal years. For example, we have historically recorded our highest level of total revenue in our fourth quarter, which we believe corresponds to the fourth quarter of a majority of our customers. In addition, the type of budget (operating versus capital) available to a customer may affect its decision to purchase a perpetual license or a subscription license. As our rate of growth has slowed, seasonal or cyclical variations in our operations may become more pronounced, and our business, results of operations and financial position may be adversely affected.
Economic or political uncertainties or downturns could materially adversely affect our business.
Economic downturns or uncertainty could adversely affect our business operations or financial results. Negative conditions in the general economy and political sphere both in the United States and abroad, including conditions resulting from financial and credit market fluctuations and terrorist attacks on the United States, Europe, Asia Pacific or elsewhere, could cause a decrease in corporate spending on enterprise software in general and negatively affect the rate of growth of our business. Economic downturns or economic and/or political uncertainty make it difficult for our customers and us to forecast and plan future business activities accurately, and they could cause our customers to reevaluate their decision to purchase our products, which could delay and lengthen our sales cycles, or to deprioritize the portion of their IT budget focused on mobility. We cannot predict the timing, strength or duration of any economic slowdown, economic or political instability or recovery, generally or within any particular industry or geography. If the economic conditions of the general economy or industries in which we operate worsen from present levels, our business operations and financial results could be adversely affected.
Our business is subject to the risks of earthquakes, fire, floods and other natural catastrophic events, and to interruption by manmade problems such as network security breaches, computer viruses or terrorism.
Our corporate headquarters are located in the San Francisco Bay Area, a region known for seismic activity. A significant natural disaster, such as an earthquake, fire or flood, occurring near our headquarters could have a material adverse impact on our business, operating results and financial condition. Despite the implementation of network security measures, our networks also may be vulnerable to computer viruses, break-ins and similar disruptions from unauthorized tampering. In addition, natural disasters, acts of terrorism or war could cause disruptions in our or our customers’ businesses or the economy as a whole. We also rely on information technology systems to communicate among our workforce and with third parties. Any disruption to our communications or systems, whether caused by a natural disaster or by manmade problems, such as power disruptions, could adversely affect our business.
26
If we are unable to implement and maintain effective internal controls over financial reporting in the future, investors may lose confidence in the accuracy and completeness of our financial reports and the market price of our common stock may be negatively affected.
As a public company, we are required to maintain internal controls over financial reporting and to report any material weaknesses in such internal controls. Section 404 of the Sarbanes-Oxley Act of 2002 (the Sarbanes-Oxley Act) requires that we furnish a report by management on, among other things, the effectiveness of our internal control over financial reporting. Management’s assessment needs to include disclosure of any material weaknesses identified in our internal controls over financial reporting. Our independent registered public accounting firm will not be required to attest to the effectiveness of our internal controls over financial reporting until our first annual report required to be filed with the Securities and Exchange Commission, or SEC, following the date we are no longer an “emerging growth company,” as defined in the JOBS Act. We continued to qualify as an “emerging growth company,” as defined in the JOBS Act, and our independent registered public accounting firm was not required to attest to the effectiveness of our internal controls over financial reporting for the year ended December 31, 2017. Implementation of internal controls over financial reporting can be time-consuming, costly and complicated. If we have a material weakness in our internal controls over financial reporting, we may not detect errors on a timely basis and our financial statements may be materially misstated. If we identify material weaknesses in our internal controls over financial reporting, if we are unable to comply with the requirements of Section 404 in a timely manner, if we are unable to assert that our internal controls over financial reporting are effective, or if our independent registered public accounting firm is unable to express an opinion as to the effectiveness of our internal controls over financial reporting, investors may lose confidence in the accuracy and completeness of our financial reports, and the market price of our common stock could be negatively affected. In addition, we could become subject to investigations by the stock exchange on which our securities are listed, the SEC or other regulatory authorities, which could require additional financial and management resources.
If our estimates relating to our critical accounting policies are based on assumptions or judgments that change or prove to be incorrect, our operating results could fall below expectations of financial analysts and investors, resulting in a decline in our stock price.
The preparation of financial statements in conformity with U.S. GAAP requires management to make estimates, assumptions and judgments that affect the amounts reported in the consolidated financial statements and accompanying notes. We base our estimates on historical experience and on various other assumptions that we believe to be reasonable under the circumstances, the results of which form the basis for making judgments about the carrying values of assets, liabilities, equity, revenue and expenses that are not readily apparent from other sources. Our operating results may be adversely affected if our assumptions change or if actual circumstances differ from those in our assumptions, which could cause our operating results to fall below the expectations of financial analysts and investors, resulting in a decline in our stock price. Significant assumptions and estimates used in preparing our consolidated financial statements include those related to revenue recognition, stock-based compensation and income taxes. Moreover, the new revenue recognition guidance, Topic 606 – Revenue from Contracts with Customers, requires more judgment than did the prior guidance.
Impairment of goodwill and other intangible assets would result in a decrease in earnings.
We have in the past and may in the future acquire intangible assets. Current accounting rules require that goodwill and other intangible assets with indefinite useful lives no longer be amortized, but instead be tested for impairment at least annually. These rules also require that intangible assets with definite useful lives be amortized over their respective estimated useful lives to their estimated residual values, and reviewed for impairment whenever events or changes in circumstances indicate that the carrying amount of an asset may not be recoverable. Events and circumstances considered in determining whether the carrying value of amortizable intangible assets and goodwill may not be recoverable include, but are not limited to, significant changes in performance relative to expected operating results, significant changes in the use of the assets, significant negative industry or economic trends, or a significant decline in our stock price and/or market capitalization for a sustained period of time. To the extent such evaluation indicates that the useful lives of intangible assets are different than originally estimated, the amortization period is reduced or extended and the quarterly amortization expense is increased or decreased. Any impairment charges or changes to estimated amortization periods could have a material adverse effect on our financial results.
27
Risks Related to Our Intellectual Property
We have been sued by third parties for alleged infringement of their proprietary rights and may be sued in the future.
There is considerable patent and other intellectual property development activity in our industry. Our success depends in part on not infringing the intellectual property rights of others. From time to time, our competitors or other third parties have claimed, and we expect they will continue in the future to claim, that we are infringing their intellectual property rights, and we may be found to be infringing such rights.
For example, in December 2015, we and Good Technology announced the settlement of our three year mutual global patent litigation between us. The settlement included a narrow, non-material license agreement between us and Good Technology and a mutual dismissal of claims.
In the future, we may receive additional claims that our solutions infringe or violate the claimant’s intellectual property rights. However, we may be unaware of the intellectual property rights of others that may cover some or all of our solutions. Any claims or litigation could cause us to incur significant expenses and, if successfully asserted against us, could require that we pay substantial damages or ongoing royalty payments, prevent us from offering our solutions, or require that we comply with other unfavorable terms. If any of our customers are sued, we would in general be required to defend and/or settle the litigation on their behalf. In addition, if we are unable to obtain licenses or modify our solutions to make them non-infringing, we might have to refund a portion of perpetual license fees paid to us and terminate those agreements, which could further exhaust our resources. In addition, we may pay substantial settlement amounts or royalties on future solution sales to resolve claims or litigation, whether or not legitimately or successfully asserted against us. Even if we were to prevail in the actual or potential claims or litigation against us, any claim or litigation regarding our intellectual property could be costly and time-consuming and divert the attention of our management and key personnel from our business operations. Such disputes, with or without merit, could also cause potential customers to refrain from purchasing our solutions or otherwise cause us reputational harm.
We have been sued by non-practicing entities, or NPEs, for patent infringement in the past and may be sued by NPEs in the future. While we have settled such litigation in the past, these lawsuits, with or without merit, require management attention and can be expensive.
If we are unable to protect our intellectual property rights, our competitive position could be harmed or we could be required to incur significant expenses to enforce our rights.
Our ability to compete effectively is dependent in part upon our ability to protect our proprietary technology. We protect our proprietary information and technology through licensing agreements, third-party nondisclosure agreements and other contractual provisions, as well as through patent, trademark, copyright and trade secret laws in the United States and similar laws in other countries. There can be no assurance that these protections will be available in all cases or will be adequate to prevent our competitors from copying, reverse engineering or otherwise obtaining and using our technology, proprietary rights or solutions. The laws of some foreign countries, including countries in which our solutions are sold, may not be as protective of intellectual property rights as those in the United States, and mechanisms for enforcement of intellectual property rights may be inadequate. In addition, third parties may seek to challenge, invalidate or circumvent our patents, trademarks, copyrights and trade secrets, or applications for any of the foregoing. There can be no assurance that our competitors will not independently develop technologies that are substantially equivalent or superior to our technology or design around our proprietary rights. In each case, our ability to compete could be significantly impaired.
To prevent substantial unauthorized use of our intellectual property rights, it may be necessary to prosecute actions for infringement and/or misappropriation of our proprietary rights against third parties. Any such action could result in significant costs and diversion of our resources and management’s attention, and there can be no assurance that we will be successful in such action.
Furthermore, many of our current and potential competitors have the ability to dedicate substantially greater resources to enforce their intellectual property rights than we do. Accordingly, despite our efforts, we may not be able to prevent third parties from infringing upon or misappropriating our intellectual property.
28
Our use of open source software could impose limitations on our ability to commercialize our solutions.
Our solutions contain software modules licensed for use from third-party authors under open source licenses, including the GNU Public License, the GNU Lesser Public License, the Apache License and others. Use and distribution of open source software may entail greater risks than use of third-party commercial software, as open source licensors generally do not provide warranties or other contractual protections regarding infringement claims or the quality of the code. Some open source licenses contain requirements that we make available source code for modifications or derivative works we create based upon the type of open source software we use. If we combine our proprietary solutions with open source software in a certain manner, we could, under certain of the open source licenses, be required to release the source code of our proprietary solutions to the public or offer our solutions to users at no cost. This could allow our competitors to create similar solutions with lower development effort and time and ultimately could result in a loss of sales for us.
The terms of many open source licenses have not been interpreted by U.S. courts, and there is a risk that such licenses could be construed in a manner that could impose unanticipated conditions or restrictions on our ability to commercialize our solutions. In such event, we could be required to seek licenses from third parties in order to continue offering our solutions, to re-engineer our solutions or to discontinue the sale of our solutions in the event re-engineering cannot be accomplished on a timely basis, any of which could materially and adversely affect our business and operating results.
Risks Related to Our International Operations
Our international operations expose us to additional business risks, and failure to manage these risks may adversely affect our international revenue.
We derive a significant portion of our revenues from customers outside the United States. For the years ended December 31, 2017, 2016 and 2015, 54%, 53%, and 50% of our revenue, respectively, was attributable to our international customers, primarily those located in Europe. As of December 31, 2017, approximately 47% of our employees were located abroad.
We expect that our international activities will be dynamic over the foreseeable future as we continue to pursue opportunities in international markets, which will require significant management attention and financial resources. Therefore, we are subject to risks associated with having worldwide operations.
We have a limited history of marketing, selling and supporting our solutions internationally. As a result, we must hire and train experienced personnel to staff and manage our foreign operations. To the extent that we experience difficulties in recruiting, training, managing and retaining an international staff, and specifically staff related to sales and engineering, we may experience difficulties in foreign markets. In addition, business practices in the international markets that we serve may differ from those in the United States and may require us to include non-standard terms in customer contracts, such as extended warranty terms. To the extent that we may enter into customer contracts in the future that include non-standard terms related to payment, warranties or performance obligations, our operating results may be adversely affected. International operations are subject to other inherent risks, and our future results could be adversely affected by a number of factors, including:
|
|
— |
difficulties in executing an international channel partners strategy; |
|
|
|
|
|
|
— |
burdens of complying with a wide variety of foreign laws, including heightened concerns and legal requirements relating to data and privacy; |
|
|
|
|
|
|
— |
economic or political instability and security concerns in countries outside the United States in which we operate or have customers; |
|
|
|
|
|
|
— |
unfavorable contractual terms or difficulties in negotiating contracts with foreign customers or channel partners as a result of varying and complex laws and contractual norms; |
29
|
|
|
|
|
|
— |
difficulties in providing support and training to channel partners and customers in foreign countries and languages; |
|
|
|
|
|
|
— |
heightened risks of unfair or corrupt business practices in certain geographies and of improper or fraudulent sales arrangements that may impact financial results or result in fines and penalties; |
|
|
|
|
|
|
— |
difficulties and costs of attracting and retaining employees and managing foreign operations |
|
|
|
|
|
|
— |
import restrictions and the need to comply with export laws; |
|
|
|
|
|
|
— |
difficulties in protecting intellectual property; |
|
|
|
|
|
|
— |
difficulties in enforcing contracts and longer accounts receivable payment cycles; |
|
|
|
|
|
|
— |
the effect of foreign exchange fluctuations on the competitiveness of our prices; |
|
|
|
|
|
|
— |
potentially adverse tax consequences; |
|
|
|
|
|
|
— |
the increased cost of terminating employees in some countries; and |
|
|
|
|
|
|
— |
variability of foreign economic, political and labor conditions. |
As we continue to expand our business globally, our success will depend, in large part, on our ability to anticipate and manage effectively these and other risks associated with our international operations. Our failure to manage any of these risks successfully could harm our international operations and reduce our international sales, adversely affecting our business, operating results and financial condition.
We rely on channel partners to sell our solutions in international markets, the loss of which could materially reduce our revenue.
We sell our solutions in international markets almost entirely through channel partners. We believe that establishing and maintaining successful relationships with these channel partners is, and will continue to be, critical to our financial success. Recruiting and retaining qualified channel partners and training them to be knowledgeable about our solutions requires significant time and resources. In some countries, we rely on a sole or very few channel partners and thus the loss of the channel partner could have a significant impact on our sales and support in those countries. To develop and expand our distribution channel, we must continue to scale and improve our processes and procedures that support our channel, including investment in systems and training. In particular, foreign-based service provider partners are large and complex businesses, and we may have difficulty negotiating and building successful business relationships with them.
In addition, existing and future channel partners will only partner with us if we are able to provide them with competitive offerings on terms that are commercially reasonable to them. If we fail to maintain the quality of our solutions or to update and enhance them or to offer them at competitive discounts, existing and future channel partners may elect to partner with one or more of our competitors. In addition, the terms of our arrangements with our channel partners must be commercially reasonable for both parties. If we are unable to reach agreements that are beneficial to both parties, then our channel partner relationships will not succeed. In addition, international channel partners often rely on business models that favor our on premises product over our cloud product because in the former, the channel partner may host and manage the software for, and provide additional administrative, support, training and other services to, the
30
mutual customer for additional fees. This situation could impede sales of our cloud product in certain international markets.
If we fail to maintain relationships with our channel partners, fail to develop new relationships with other channel partners in new markets, fail to manage, train or incentivize existing channel partners effectively, or fail to provide channel partners with competitive solutions on terms acceptable to them, or if these partners are not successful in their sales efforts, our revenue may decrease and our operating results could suffer.
We have no long-term contracts or minimum purchase commitments with any of our channel partners, and our contracts with channel partners do not prohibit them from offering solutions that compete with ours, including solutions they currently offer or may develop in the future and incorporate into their own systems. Some of our competitors may have stronger relationships with our channel partners than we do, and we have limited control, if any, as to whether those partners sell our solutions, rather than our competitors’ solutions, or whether they devote resources to market and support our competitors’ solutions, rather than our solutions. Our failure to establish and maintain successful relationships with channel partners could materially adversely affect our business, operating results and financial condition.
Failure to comply with the U.S. Foreign Corrupt Practices Act and similar laws associated with our activities outside the United States could subject us to penalties and other adverse consequences.
A significant portion of our revenues is and will continue to be from jurisdictions outside of the United States. As a result, we are subject to the U.S. Foreign Corrupt Practices Act, or FCPA, which generally prohibits U.S. companies and their intermediaries from making payments to corrupt foreign officials for the purpose of obtaining or keeping business or otherwise obtaining favorable treatment, and requires companies to maintain adequate record-keeping and internal accounting practices to accurately reflect the transactions of the company. The FCPA applies to companies, individual directors, officers, employees and agents. Under the FCPA, we may be held liable for actions taken by strategic or local partners or representatives. In addition, the government may seek to hold us liable for successor liability FCPA violations committed by companies that we acquire.
In many foreign countries, particularly in countries with developing economies, including many countries in which we operate, it may be a local custom that businesses operating in such countries engage in business practices that are prohibited by the FCPA or other similar laws and regulations. Although we have contractual provisions in our agreements with channel partners that require them to comply with the FCPA and similar laws, we have not engaged in formal FCPA training of our channel partners. Our channel partners could take actions in violation of our policies, for which we may be ultimately held responsible. Our development of infrastructure designed to identify FCPA matters and monitor compliance is at an early stage. If we or our intermediaries fail to comply with the requirements of the FCPA or other anti-corruption laws, governmental authorities in the U.S. or elsewhere could seek to impose civil and/or criminal penalties, which could have a material adverse effect on our business, results of operations, financial conditions and cash flows.
We are subject to export controls, and our customers and channel partners are subject to import controls.
Certain of our solutions are subject to U.S. export controls and may be exported to certain countries outside the U.S. only by first obtaining an export license from the U.S. government, or by utilizing an existing export license exception, or after clearing U.S. government agency review. Obtaining the necessary export license or accomplishing a U.S. government review for a particular export may be time-consuming and may result in the delay or loss of sales opportunities. Furthermore, U.S. export control laws and economic sanctions prohibit the shipment of certain solutions to U.S. embargoed or sanctioned countries, governments and persons. If we were to fail to comply with U.S. export law requirements, U.S. customs regulations, U.S. economic sanctions or other applicable U.S. laws, we could be subject to substantial civil and criminal penalties, including fines, incarceration for responsible employees and managers and the possible loss of export or import privileges. U.S. export controls, sanctions and regulations apply to our channel partners as well as to us. Any failure by our channel partners to comply with such laws, regulations or sanctions could have negative consequences, including reputational harm, government investigations and penalties.
31
In addition, various countries regulate the import of certain encryption and other technology by requiring an import permit, authorization, pre-classification, import certification and/or an import license. Some countries have enacted laws that could limit our customers’ ability to implement our solutions in those countries.
Changes in our solutions or changes in export and import regulations may create delays in the introduction of our solutions into international markets, prevent our customers with international operations from deploying our solutions globally or, in some cases, prevent the export or import of our solutions to certain countries, governments or persons altogether. In addition, any change in export or import regulations, economic sanctions or related legislation, shift in the enforcement or scope of existing regulations, or change in the countries, governments, persons or technologies targeted by such regulations, could result in decreased use of our solutions by, or in our decreased ability to export or sell our solutions to, existing or potential customers with international operations. Any decreased use of our solutions or limitation on our ability to export or sell our solutions would likely adversely affect our business, financial condition and operating results.
Risks Related to Ownership of Our Common Stock
Our ability to use our net operating losses to offset future taxable income may be subject to certain limitations.
In general, under Section 382 of the Internal Revenue Code of 1986, as amended, or the Code, a corporation that undergoes an “ownership change” is subject to limitations on its ability to utilize its pre-change net operating losses, or NOLs, to offset future taxable income. Our existing NOLs may be subject to limitations arising from previous ownership changes. Future changes in our stock ownership, some of which are outside of our control, could result in an ownership change. Furthermore, our ability to utilize NOLs of companies that we may acquire in the future may be subject to limitations. There is also a risk that due to regulatory changes, such as suspensions on the use of NOLs, or other unforeseen reasons, our existing NOLs could expire or otherwise be unavailable to offset future income tax liabilities. For these reasons, we may not be able to utilize a material portion of the NOLs reflected on our balance sheet, even if we attain profitability.
The price of our common stock has been and may continue to be weak, and you could lose all or part of your investment.
The trading price of our common stock has declined since our Initial Public Offering, and the shares are thinly traded. The trading price of our common stock depends on a number of factors, including those described in this “Risk Factors” section, many of which are beyond our control and may not be related to our operating performance.
Since shares of our common stock were sold at our initial public offering, our stock price has ranged from as low as $2.56 to as high as $12.96 through December 31, 2017. These fluctuations could cause you to lose all or part of your investment in our common stock, because you might be unable to sell your shares at or above the price you paid. Factors that could cause fluctuations in the trading price of our common stock include the following:
|
|
— |
failure to meet quarterly guidance with regard to revenue, billings, cash flow breakeven or other key metrics; |
|
|
|
|
|
|
— |
price and volume fluctuations in the overall stock market from time to time; |
|
|
|
|
|
|
— |
volatility in the market prices and trading volumes of high technology stocks; |
|
|
|
|
|
|
— |
changes in operating performance and stock market valuations of other technology companies generally, or those in our industry in particular; |
|
|
|
|
|
|
— |
sales of shares of our common stock by us or our stockholders; |
|
|
|
|
|
|
— |
failure of financial analysts to maintain coverage of us, changes in financial estimates by any analysts who follow our company, or our failure to meet these estimates or the expectations of investors; |
32
|
|
|
|
|
|
— |
announcements by us or our competitors of new products or new or terminated significant contracts, commercial relationships or capital commitments; |
|
|
|
|
|
|
— |
the public’s reaction to our press releases, other public announcements and filings with the SEC; |
|
|
|
|
|
|
— |
rumors and market speculation involving us or other companies in our industry; |
|
|
|
|
|
|
— |
actual or anticipated changes in our results of operations or fluctuations in our operating results; |
|
|
|
|
|
|
— |
actual or anticipated developments in our business or our competitors’ businesses or the competitive landscape generally; |
|
|
|
|
|
|
— |
litigation involving us, our industry or both, or investigations by regulators into our operations or those of our competitors; |
|
|
|
|
|
|
— |
developments or disputes concerning our intellectual property or other proprietary rights; |
|
|
|
|
|
|
— |
announced or completed acquisitions of businesses or technologies by us or our competitors; |
|
|
|
|
|
|
— |
new laws or regulations or new interpretations of existing laws or regulations applicable to our business; |
|
|
|
|
|
|
— |
changes in accounting standards, policies, guidelines, interpretations or principles; |
|
|
|
|
|
|
— |
any major change in our management; |
|
|
|
|
|
|
— |
general economic conditions and slow or negative growth of our markets; and |
|
|
|
|
|
|
— |
other events or factors, including those resulting from war, incidents of terrorism or responses to these events. |
In addition, broad market and industry factors may seriously affect the market price of our common stock, regardless of our actual operating performance. In addition, in the past, following periods of volatility in the overall market and the market prices of particular companies’ securities, securities class action litigation has often been instituted against these companies. Litigation of this type has been instituted against us, and could result in substantial costs and a diversion of our management’s attention and resources.
On August 5, 2015, August 21, 2015 and August 24, 2015, purported stockholder class action lawsuits were filed in the Superior Court of California, Santa Clara County against the Company, certain of its officers, directors, underwriters and investors, captioned Schneider v. MobileIron, Inc., et al., Kerley v. MobileIron, Inc., et al. and Steinberg v. MobileIron, Inc., et al, which were subsequently consolidated under the case caption In re MobileIron Shareholder Litigation. The actions are purportedly brought on behalf of a putative class of all persons who purchased the Company’s securities issued pursuant or traceable to the Company’s registration statement and the June 12, 2014 initial public offering. The lawsuits assert claims for violations of Sections 11, 12(a)(2) and 15 of the Securities Act of 1933. The complaint sought, among other things, compensatory damages and attorney’s fees and costs on behalf of the putative class. On April 12, 2016, Plaintiffs filed a corrected consolidated complaint, which no longer named the underwriters or investors as defendants. On August 8, 2016 the Company filed a demurrer to the corrected consolidated complaint. The court overruled the demurrer on October 4, 2016.
33
On March 8, 2017, the Company reached an agreement in principle to settle the above-described actions and the court granted preliminary approval of that settlement on June 9, 2017. The court approved the settlement on August 21, 2017 and entered final judgment in the case on October 11, 2017 releasing all parties. The settlement called for a payment of $7.5 million to the plaintiffs in resolution of all claims against the Company, its officers, directors and the other defendants. The Company contributed $1.1 million to the settlement in 2017. This amount represented the remainder of the Company’s retention amount under its Director & Officer liability insurance policy. The balance was paid by the Company’s Director & Officer liability insurance.
While the Company and the other defendants continue to deny each of the plaintiffs’ claims and deny any liability, the Company agreed to the settlement solely to resolve the disputes, to avoid the costs and risks of further litigation and to avoid further distractions to management.
If financial or industry analysts do not publish research or reports about our business, or if they issue an adverse or misleading opinion regarding our stock, our stock price and trading volume could decline.
The trading market for our common stock will be influenced by the research and reports that industry or financial analysts publish about us or our business. We do not control these analysts or the content and opinions included in their reports. If any of the analysts who cover us issue an adverse or misleading opinion regarding our stock price, our stock price would likely decline. Financial analysts have in the past ceased coverage of our stock or published adverse reports, and this may recur in the future. Any cessation of coverage or adverse reports would likely cause our stock price or trading volume to decline.
Insiders continue to have substantial control over our company, which could limit your ability to influence the outcome of key transactions, including a change of control.
Our directors, executive officers and each of our stockholders who own greater than 5% of our outstanding common stock and their affiliates, in the aggregate, own approximately 42% of the outstanding shares of our common stock as of December 31, 2017. As a result, these stockholders, if acting together, will be able to influence or control matters requiring approval by our stockholders, including the election of directors and the approval of mergers, acquisitions or other extraordinary transactions. They may also have interests that differ from yours and may vote in a way with which you disagree and which may be adverse to your interests. This concentration of ownership may have the effect of delaying, preventing or deterring a change of control of our company, could deter certain public investors from purchasing our common stock and might ultimately affect the market price of our common stock.
We have in the past failed, and may in the future fail, to meet our publicly announced guidance or other expectations about our business and future operating results, which has in the past caused, and would in the future cause, our stock price to decline.
We have provided and may continue to provide guidance about our business and future operating results as part of our press releases, conference calls or otherwise. In developing this guidance, our management must make certain assumptions and judgments about our future performance. Our business results may vary significantly from such guidance due to a number of factors, many of which are outside of our control, and which could adversely affect our operations and operating results. Furthermore, if our publicly announced guidance of future operating results fails to meet expectations of securities analysts, investors or other interested parties, the price of our common stock would decline.
The requirements of being a public company may strain our resources, divert management’s attention and affect our ability to attract and retain qualified board members.
As a public company, we are or will be subject to the reporting requirements of the Exchange Act, the Sarbanes-Oxley Act, the Dodd-Frank Act, the listing requirements of the NASDAQ Global Stock Market and other applicable securities rules and regulations. Compliance with these rules and regulations may further increase our legal and financial compliance costs, make some activities more difficult, time-consuming or costly and increase demand on our systems and resources. The Exchange Act requires, among other things, that we file annual, quarterly and current reports with respect to our business and operating results.
34
Being a public company has made it more expensive for us to obtain director and officer liability insurance, and we may be required to accept reduced coverage or incur substantially higher costs to obtain coverage. These and other factors, including the decline in our stock price and the other risks described in this “Risk Factors” section, could also make it more difficult for us to attract and retain qualified executive officers and qualified members of our board of directors, particularly to serve on our audit committee and compensation committee.
We are an “Emerging Growth Company,” and any decision on our part to comply only with certain reduced disclosure requirements applicable to Emerging Growth Companies could make our common stock less attractive to investors.
We are an “emerging growth company,” as defined in the JOBS Act enacted in April 2012, and, for as long as we continue to be an “emerging growth company,” we may choose to take advantage of exemptions from various reporting requirements applicable to other public companies, but not to “emerging growth companies,” including, but not limited to, not being required to comply with the auditor attestation requirements of Section 404 of the Sarbanes-Oxley Act, reduced disclosure obligations regarding executive compensation in our periodic reports and proxy statements and exemptions from the requirements of holding a nonbinding advisory vote on executive compensation and stockholder approval of any golden parachute payments not previously approved. We will remain an “emerging growth company” until the earliest to occur of (i) the last day of the year in which we have more than $1.0 billion in annual revenue; (ii) the date we qualify as a “large accelerated filer,” with at least $700 million of equity securities held by non-affiliates; (iii) the date on which we have issued, in any three-year period, more than $1.0 billion in non-convertible debt securities; and (iv) the last day of the year ending after the fifth anniversary of the completion of our initial public offering. We cannot predict if investors will find our common stock less attractive if we choose to rely on these exemptions. If some investors find our common stock less attractive as a result of any choices to reduce future disclosure, there may be a less active trading market for our common stock and our stock price may be more volatile. For the year ended December 31, 2017, we continued to qualify as an “emerging growth company” as defined in the JOBS Act.
Our future capital needs are uncertain, and we may need to raise additional funds in the future. If we require additional funds in the future, those funds may not be available on acceptable terms, or at all.
We may need to raise substantial additional capital in the future to:
|
|
— |
fund our operations; |
|
|
|
|
|
|
— |
continue our research and development; |
|
|
|
|
|
|
— |
develop and commercialize new solutions; or |
|
|
|
|
|
|
— |
acquire companies, in-licensed solutions or intellectual property. |
Our future funding requirements will depend on many factors, including:
|
|
— |
market acceptance of our solutions; |
|
|
|
|
|
|
— |
the cost of our research and development activities; |
|
|
|
|
|
|
— |
the cost of defending and resolving litigation or other legal disputes; |
|
|
|
|
|
|
— |
the cost and timing of establishing additional sales, marketing and distribution capabilities; |
|
|
|
|
|
|
— |
the cost and timing of establishing additional technical support capabilities; |
|
|
|
|
|
|
— |
the effect of competing technological and market developments; and |
|
|
|
|
35
|
|
— |
the market for different types of funding and overall economic conditions. |
|
|
|
|
We may require additional funds in the future, and we may not be able to obtain those funds on acceptable terms, or at all. If we raise additional funds by issuing equity securities, our stockholders may experience dilution. Debt financing, if available, may involve covenants restricting our operations or our ability to incur additional debt. Any debt or additional equity financing that we raise may contain terms that are not favorable to us or our stockholders.
If we do not have, or are not able to obtain, sufficient funds, we may have to delay development or commercialization of our solutions. If we are unable to raise adequate funds, we may have to liquidate some or all of our assets, or delay, reduce the scope of or eliminate some or all of our development programs. We also may have to reduce marketing, customer support or other resources devoted to our solutions or cease operations. Any of these actions could harm our operating results.
Sales of substantial amounts of our common stock in the public markets, or the perception that these sales might occur, could reduce the price that our common stock might otherwise attain and may dilute your voting power and your ownership interest in us.
Sales of a substantial number of shares of our common stock in the public market, or the perception that these sales could occur, could adversely affect the market price of our common stock and may make it more difficult for you to sell your common stock at a time and price that you deem appropriate. At December 31, 2017, we have 97,203,950 shares of common stock outstanding, excluding any potential exercises of our outstanding stock options and vesting of RSUs.
In the future, we may issue additional shares of common stock, or securities with convertible features into our common stock, from time to time in connection with our employee equity plans, financings, acquisitions and investments or otherwise.
In February 2016, our Compensation Committee approved the issuance of 1,653,371 shares of common stock under our 2015 Non-Executive Bonus Plan. No shares were issued under our 2015 Executive Bonus Plan. For 2016, we implemented two stock-settled bonus plans, one for executives and one for non-executives, which resulted in the issuance of 1,010,550 shares of common stock in the first quarter of 2017. On June 14, 2017, our shareholders approved in a proxy vote the amendment and restatement of our 2014 Employee Stock Purchase Plan, or ESPP, to provide for a one-time increase of 1,200,000 shares of common stock available for issuance under the ESPP. In February of 2018, we issued 1,220,822 shares of common stock under our 2017 executive and non-executive stock-settled bonus plans. The issuance of shares of common stock under RSUs, future bonus programs, or our ESPP could result in substantial dilution to our existing stockholders and cause the trading price of our common stock to decline.
Certain provisions in our charter documents and Delaware law could limit attempts by our stockholders to replace or remove our board of directors or current management and limit the market price of our common stock.
Provisions in our certificate of incorporation and bylaws may have the effect of delaying or preventing a change of control or changes in our management. These provisions include the following:
|
|
— |
our board of directors has the right to elect directors to fill a vacancy created by the expansion of the board of directors or the resignation, death or removal of a director, which prevents stockholders from being able to fill vacancies on our board of directors; |
|
|
|
|
|
|
— |
our stockholders may not act by written consent or call special stockholders’ meetings; as a result, a holder, or holders, controlling a majority of our capital stock would not be able to take certain actions other than at annual stockholders’ meetings or special stockholders’ meetings called by the board of directors, the chairman of the board, the chief executive officer or the president; |
|
|
|
|
36
|
|
— |
our certificate of incorporation prohibits cumulative voting in the election of directors, which limits the ability of minority stockholders to elect director candidates; |
|
|
— |
stockholders must provide advance notice and additional disclosures in order to nominate individuals for election to the board of directors or to propose matters that can be acted upon at a stockholders’ meeting, which may discourage or deter a potential acquirer from conducting a solicitation of proxies to elect the acquirer’s own slate of directors or otherwise attempting to obtain control of our company; and |
|
|
|
|
|
|
— |
our board of directors may issue, without stockholder approval, shares of undesignated preferred stock; the ability to issue undesignated preferred stock makes it possible for our board of directors to issue preferred stock with voting or other rights or preferences that could impede the success of any attempt to acquire us. |
As a Delaware corporation, we are also subject to certain Delaware anti-takeover provisions. Under Delaware law, a corporation may not engage in a business combination with any holder of 15% or more of its capital stock unless the holder has held the stock for three years or, among other things, the board of directors has approved the transaction. Our board of directors could rely on Delaware law to prevent or delay an acquisition of our company.
Our executive officers are entitled to accelerated vesting of their stock options pursuant to the terms of their employment arrangements under certain conditions following a change of control of the Company. In addition to the arrangements currently in place with some of our executive officers, we may enter into similar arrangements in the future with other officers. Such arrangements could delay or discourage a potential acquisition of the Company.
Our financial results may be adversely affected by changes in accounting principles applicable to us.
U.S. GAAP are subject to interpretation by the Financial Accounting Standards Board (“FASB”), the SEC, and other various bodies formed to promulgate and interpret appropriate accounting principles. For example, in May 2014, the FASB issued accounting standards update No. 2014-09 (Topic 606), Revenue from Contracts with Customers, which supersedes nearly all existing revenue recognition guidance under U.S. GAAP. We are required to implement this guidance in the first quarter of our fiscal year 2018. The most significant impact relates to our accounting for subscriptions to our on-premise licenses, specifically, as under the new standard we recognize revenue from those subscriptions predominantly at the time of billing rather than ratably over the license term, potentially making revenue more volatile and difficult to predict. In addition, accounting for commissions is impacted significantly as we capitalize and amortize most commissions under the new standard instead of expensing commissions as incurred. Due to the complexity of certain of our contracts, the revenue recognition treatment required under the new standard is dependent on contract-specific terms. Any difficulties in implementing these pronouncements or adequately accounting after adoption could cause us to fail to meet our financial reporting obligations, which could result in regulatory discipline and harm investors’ confidence in us. In addition, to adopt the new standard we had to implement a new revenue recognition module in our accounting system, hire consultants and increase our spending on audit fees, thereby increasing our general and administrative expense. That increased spending will continue through at least our first quarter of 2018 and will likely increase our audit fees on an ongoing basis thereafter.
Item 1B. Unresolved Staff Comments
None.
Our principal executive offices are located in Mountain View, California and include three buildings totaling approximately 78,000 square feet under leases expiring from June 2020 to May 2023. We have additional office locations in the United States and in various international locations, including offices in the United Kingdom, Germany, Netherlands, Japan, Singapore and India.
We may add new facilities or expand existing facilities as we add employees, and we believe that suitable additional or substitute space will be available on commercially reasonable terms to meet our future needs.
37
The information set forth under “Litigation” in Note 12 contained in the “Notes to Consolidated Financial Statements” in Item 8, “Financial Statements and Supplementary Data,” of Part II of this Annual Report on Form 10-K is incorporated herein by reference.
Item 4. Mine Safety Disclosures
Not applicable.
38
Item 5. Market for Registrant’s Common Equity, Related Stockholder Matters and Issuer Purchases of Equity Securities
Issuance of Common Stock and Use of Proceeds
In June 2014, we closed our initial public offering, or IPO, in which we sold 12,777,777 shares of common stock at a price to the public of $9.00 per share. We raised approximately $102.9 million in net proceeds from the offering after deducting underwriting discounts and commissions of approximately $8.0 million and other offering expenses of approximately $4.1 million.
There has been no material change in the planned use of proceeds from our IPO as described in our final prospectus filed with the SEC on June 12, 2014 pursuant to Rule 424(b). We invested a portion of the funds received in registered money market funds and fixed income investments.
Market Information
Our common stock, $0.0001 par value per share, is listed on the NASDAQ Global Select Market under the symbol “MOBL” and began public trading on June 12, 2014.
Price Range for our Common Stock
The following table sets forth the reported high and low sales prices of our common stock for the periods indicated, as regularly quoted on The NASDAQ Global Select Market:
|
|
|
High |
|
Low |
||
|
Fiscal 2017 Quarters: |
|
|
|
|
|
|
|
Fourth Fiscal Quarter |
|
$ |
4.30 |
|
$ |
3.20 |
|
Third Fiscal Quarter |
|
$ |
6.55 |
|
$ |
3.45 |
|
Second Fiscal Quarter |
|
$ |
6.78 |
|
$ |
4.20 |
|
First Fiscal Quarter |
|
$ |
5.00 |
|
$ |
3.70 |
|
Fiscal 2016 Quarters: |
|
|
|
|
|
|
|
Fourth Fiscal Quarter |
|
$ |
4.50 |
|
$ |
2.60 |
|
Third Fiscal Quarter |
|
$ |
3.69 |
|
$ |
2.56 |
|
Second Fiscal Quarter |
|
$ |
4.78 |
|
$ |
2.78 |
|
First Fiscal Quarter |
|
$ |
4.55 |
|
$ |
3.01 |
Holders of Record and Dividends
As of March 7, 2018, there were 41 holders of record of our common stock. Because many of our shares are held by brokers and other institutions on behalf of stockholders, we are unable to estimate the total number of stockholders represented by these record holders. We have never declared or paid, and do not anticipate declaring or paying in the foreseeable future, any cash dividends on our capital stock. Any future determination as to the declaration and payment of dividends, if any, will be at the discretion of our board of directors, subject to applicable laws, and will depend on then existing conditions, including our financial condition, operating results, contractual restrictions, capital requirements, business prospects, and other factors our board of directors may deem relevant.
Stock Performance Graph and Cumulative Total Return
The following graph compares the cumulative total return attained by stockholders on our common stock relative to the cumulative total returns of the NASDAQ Composite Index (^IXIC) and NASDAQ Computer Index (^IXCO). The graph tracks the performance of a $100 investment in our common stock and in each of the indices (with the
39
reinvestment of all dividends) from June 12, 2014 to December 31, 2017. The stock price performance on the following graph is not necessarily indicative of future stock price performance.
MobileIron, Inc. Comparison of Total Return Performance
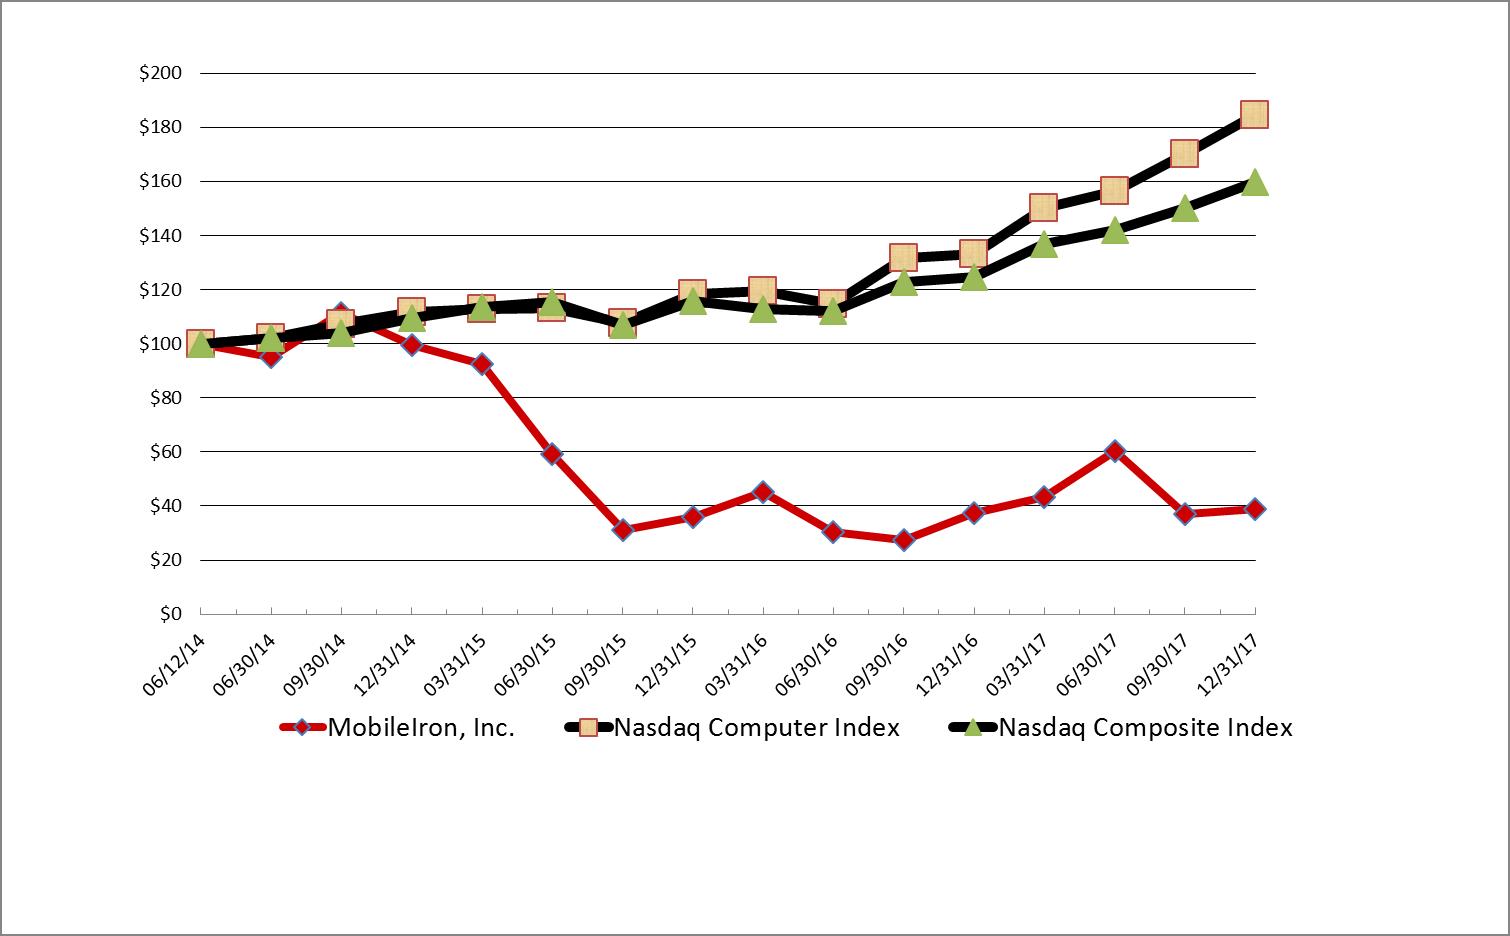
|
|
|
|
Base Period |
|
|
|
|
|
|
|
|
|
|
|
|
|
Company/Index |
|
|
6/12/14 |
12/31/14 |
|
12/31/15 |
|
12/31/16 |
|
12/31/17 |
|||||
|
MobileIron, Inc. |
|
$ |
100.00 |
|
$ |
99.60 |
|
$ |
36.10 |
|
$ |
37.50 |
|
$ |
39.00 |
|
Nasdaq Computer Index |
|
|
100.00 |
|
|
111.55 |
|
|
118.49 |
|
|
133.03 |
|
|
184.60 |
|
Nasdaq Composite Index |
|
|
100.00 |
|
|
109.55 |
|
|
115.83 |
|
|
124.52 |
|
|
159.69 |
Unregistered Sales of Equity Securities
In the year ended December 31, 2017, we did not repurchase any shares subject to repurchase.
The majority of restricted stock units are subject to vesting. The underlying shares of common stock are issued when the restricted stock units vest. The majority of participants choose to participate in broker-assisted automatic sales program to satisfy their applicable tax withholding requirements. We do not treat the shares sold pursuant to this automatic sales program as common stock repurchases (see Note 10 to the Consolidated Financial Statements).
We withheld shares through net settlements (where the award holder receives the net of the shares vested, after surrendering a portion of the shares back to the company for tax withholding) for our stock-settled bonus programs (the 2016 Executive Bonus Plan and 2016 Non-executive Bonus Plan). The following table provides a summary of the
40
purchase activity upon the employee vesting and release of shares under the stock-settled bonus programs to satisfy tax withholding obligations in 2017:
|
|
|
Total number of |
|
|
Average price paid |
|
|
Period |
|
shares repurchased |
|
|
per share |
|
|
February 1, 2017 through February 28, 2017 |
|
677,547 |
|
$ |
4.65 |
|
|
Total shares repurchased |
|
677,547 |
|
$ |
4.65 |
|
These purchases represent shares cancelled when surrendered in lieu of cash payments for tax obligations due from employees. These shares were not purchased as part of a publicly announced program to purchase shares.
Securities Authorized for Issuance under Equity Compensation Plans
See Item 12 of Part III of this Annual Report on Form 10-K regarding information about securities authorized for issuance under our equity compensation plan.
Item 6. Selected Financial Data
The following selected historical financial data should be read in conjunction with Item 7, “Management’s Discussion and Analysis of Financial Condition and Results of Operations,” our financial statements, and the related notes appearing in Item 8, “Financial Statements and Supplementary Data,” of this Annual Report on Form 10-K to fully understand factors that may affect the comparability of the information presented below.
The statement of operations data for 2017, 2016, 2015, 2014 and 2013 and the balance sheet data as of December 31, 2017, 2016, 2015, 2014 and 2013 are derived from our audited financial statements appearing in Item 8, “Financial Statements and Supplementary Data,” of this Annual Report on Form 10-K. The statement of operations data for 2014 and 2013 and the balance sheet data as of December 31, 2015, 2014 and 2013 is derived from audited financial
41
statements not included in this Annual Report on Form 10-K. Our historical results are not necessarily indicative of the results to be expected in the future.
|
|
|
Year ended December 31, |
|||||||||||||
|
(in thousands, except per share data) |
|
2017 |
|
2016 |
|
2015 |
|
2014 |
|
2013 |
|||||
|
Consolidated Statement of Operations Data: |
|
|
|
|
|
||||||||||
|
Revenue |
|
|
|
|
|
|
|
|
|
|
|
|
|
|
|
|
Perpetual license |
|
$ |
41,165 |
|
$ |
45,775 |
|
$ |
53,512 |
|
$ |
66,816 |
|
$ |
69,810 |
|
Subscription |
|
|
70,470 |
|
|
61,357 |
|
|
48,080 |
|
|
30,227 |
|
|
15,085 |
|
Software support and services |
|
|
64,856 |
|
|
56,794 |
|
|
47,706 |
|
|
35,252 |
|
|
20,679 |
|
Total revenue |
|
|
176,491 |
|
|
163,926 |
|
|
149,298 |
|
|
132,295 |
|
|
105,574 |
|
Cost of revenue |
|
|
|
|
|
|
|
|
|
|
|
|
|
|
|
|
Perpetual license |
|
|
1,869 |
|
|
2,658 |
|
|
2,881 |
|
|
4,448 |
|
|
3,327 |
|
Subscription |
|
|
8,626 |
|
|
8,297 |
|
|
7,181 |
|
|
5,719 |
|
|
3,684 |
|
Software support and services |
|
|
19,731 |
|
|
19,412 |
|
|
18,115 |
|
|
13,868 |
|
|
9,489 |
|
Restructuring charge |
|
|
311 |
|
|
181 |
|
|
— |
|
|
— |
|
|
— |
|
Total cost of revenue(1) |
|
|
30,537 |
|
|
30,548 |
|
|
28,177 |
|
|
24,035 |
|
|
16,500 |
|
Gross profit |
|
|
145,954 |
|
|
133,378 |
|
|
121,121 |
|
|
108,260 |
|
|
89,074 |
|
Operating expenses |
|
|
|
|
|
|
|
|
|
|
|
|
|
|
|
|
Research and development(1) |
|
|
75,350 |
|
|
67,398 |
|
|
61,871 |
|
|
46,278 |
|
|
36,400 |
|
Sales and marketing(1) |
|
|
96,477 |
|
|
101,757 |
|
|
105,520 |
|
|
99,870 |
|
|
68,309 |
|
General and administrative(1) |
|
|
28,091 |
|
|
29,695 |
|
|
36,037 |
|
|
22,400 |
|
|
12,081 |
|
Litigation settlement charge |
|
|
1,143 |
|
|
— |
|
|
— |
|
|
— |
|
|
— |
|
Restructuring charge |
|
|
1,038 |
|
|
871 |
|
|
1,049 |
|
|
— |
|
|
— |
|
Amortization of intangible assets |
|
|
— |
|
|
— |
|
|
— |
|
|
782 |
|
|
208 |
|
Impairment of in-process research and development |
|
|
— |
|
|
— |
|
|
— |
|
|
— |
|
|
3,925 |
|
Total operating expenses |
|
|
202,099 |
|
|
199,721 |
|
|
204,477 |
|
|
169,330 |
|
|
120,923 |
|
Operating loss |
|
|
(56,145) |
|
|
(66,343) |
|
|
(83,356) |
|
|
(61,070) |
|
|
(31,849) |
|
Other income (expense) - net |
|
|
988 |
|
|
145 |
|
|
(274) |
|
|
(302) |
|
|
(396) |
|
Loss before income taxes |
|
|
(55,157) |
|
|
(66,198) |
|
|
(83,630) |
|
|
(61,372) |
|
|
(32,245) |
|
Income tax expense |
|
|
1,142 |
|
|
982 |
|
|
852 |
|
|
517 |
|
|
252 |
|
Net loss |
|
$ |
(56,299) |
|
$ |
(67,180) |
|
$ |
(84,482) |
|
$ |
(61,889) |
|
$ |
(32,497) |
|
Net loss per share, basic and diluted |
|
$ |
(0.60) |
|
$ |
(0.78) |
|
$ |
(1.07) |
|
$ |
(1.30) |
|
$ |
(3.27) |
|
Weighted-average shares used to compute net loss per share, basic and diluted |
|
|
93,770 |
|
|
85,845 |
|
|
78,755 |
|
|
47,517 |
|
|
9,953 |
|
(1) |
Amounts include stock-based compensation expense as follows: |
|
|
|
Year ended December 31, |
|
|
|
||||||||||
|
(in thousands) |
|
2017 |
|
2016 |
|
2015 |
|
2014 |
|
2013 |
|||||
|
Stock-Based Compensation Expense: |
|
|
|
|
|
|
|
|
|
|
|
|
|
|
|
|
Cost of revenue |
|
$ |
3,772 |
|
$ |
3,043 |
|
$ |
2,774 |
|
$ |
1,353 |
|
$ |
327 |
|
Research and development |
|
|
14,520 |
|
|
11,728 |
|
|
10,607 |
|
|
5,980 |
|
|
5,238 |
|
Sales and marketing |
|
|
8,659 |
|
|
10,474 |
|
|
9,508 |
|
|
5,930 |
|
|
1,893 |
|
General and administrative |
|
|
6,780 |
|
|
9,144 |
|
|
5,902 |
|
|
3,363 |
|
|
931 |
|
Total stock-based compensation expense |
|
$ |
33,731 |
|
$ |
34,389 |
|
$ |
28,791 |
|
$ |
16,626 |
|
$ |
8,389 |
42
|
|
|
As of December 31, |
|||||||||||||
|
(in thousands) |
|
2017 |
|
2016 |
|
2015 |
|
2014 |
|
2013 |
|||||
|
Consolidated Balance Sheet Data: |
|
|
|
|
|
||||||||||
|
Cash and cash equivalents |
|
$ |
85,833 |
|
$ |
54,043 |
|
$ |
47,234 |
|
$ |
104,287 |
|
$ |
73,573 |
|
Short-term and long-term investments |
|
$ |
6,797 |
|
$ |
36,184 |
|
$ |
51,670 |
|
$ |
36,089 |
|
$ |
— |
|
Working capital |
|
$ |
35,480 |
|
$ |
49,585 |
|
$ |
66,568 |
|
$ |
90,448 |
|
$ |
49,054 |
|
Total assets |
|
$ |
162,597 |
|
$ |
153,106 |
|
$ |
161,114 |
|
$ |
191,842 |
|
$ |
111,259 |
|
Total deferred revenue |
|
$ |
112,501 |
|
$ |
88,076 |
|
$ |
69,875 |
|
$ |
54,174 |
|
$ |
40,751 |
|
Short-term borrowings |
|
$ |
— |
|
$ |
— |
|
$ |
— |
|
$ |
— |
|
$ |
4,300 |
|
Convertible preferred stock |
|
$ |
— |
|
$ |
— |
|
$ |
— |
|
$ |
— |
|
$ |
160,259 |
|
Accumulated deficit |
|
$ |
(398,684) |
|
$ |
(342,385) |
|
$ |
(275,205) |
|
$ |
(190,723) |
|
$ |
(128,834) |
|
Total stockholders' equity (deficit) |
|
$ |
21,851 |
|
$ |
40,817 |
|
$ |
68,139 |
|
$ |
115,094 |
|
$ |
(109,825) |
43
Item 7. Management’s Discussion and Analysis of Financial Condition and Results of Operations
The following discussion and analysis of our financial condition and results of operations should be read in conjunction with our financial statements and related notes appearing elsewhere in this Annual Report on Form 10-K. In addition to historical financial information, the following discussion contains forward-looking statements that reflect our plans, estimates and beliefs. Our actual results could differ materially from those contained in or implied by any forward-looking statements. Factors that could cause or contribute to these differences include those under “Risk Factors” included in Part I, Item 1A or in other parts of this report.
Mobile and cloud computing are the catalysts for modern work. Mobile lets employees make better decisions and take faster actions because the information and tools they need to do their jobs are always available. Cloud lets developers build innovative services quickly and lets employees start using them easily.
Modern work requires a new security model, however, because both mobile and cloud operate outside the traditional network perimeter. Data no longer resides behind the firewall on locked-down PCs and servers, and so it cannot be secured by firewall-based solutions. Instead, data is spread across an information fabric that spans a wide variety of modern endpoints and cloud services. Modern endpoints are computing devices that run Android, iOS, macOS or Windows 10. While they can be desktops, they are increasingly portable, like smartphones, tablets, laptops, and wearables. Cloud services are SaaS applications such as Box, Concur, Google G Suite, Microsoft Office 365, Salesforce, ServiceNow, Tableau, and Workday, as well as custom applications built on infrastructure such as Amazon Web Services, Google Cloud Platform, and Microsoft Azure.
CIOs face the challenge of giving employees the ability to use the cloud services and endpoints they want without compromising either user experience or data security. To pass a security audit, IT will need to maintain control of company data. This means deleting data if an endpoint is lost, stopping data from being shared with consumer apps, and stopping data from ending up on endpoints that are not secure. But it is not enough to do this for just one cloud service or one type of endpoint. IT will need to do this across the wide range of technologies their users choose.
We believe that every modern endpoint, whether a smartphone, tablet, laptop, desktop, wearable or IoT device with access to enterprise data, will require a solution like MobileIron’s to secure that data. MobileIron provides a government-grade security platform to protect business data all the way from the cloud to the endpoint. The MobileIron platform combines cloud security, unified endpoint management (UEM), secure connectivity, and threat intelligence into an integrated solution designed to deliver enterprise services to users with a seamless experience that does not compromise data security.
Our platform establishes an adaptive data perimeter outside the firewall to ensure that only trusted users using trusted apps on trusted endpoints can access business information. A trusted user is one who is authorized to access certain business data. Trusted apps and endpoints are those that can then maintain the security of that data. Our cross-stack architecture (multi-cloud, multi-app, multi-OS, multi-identity) allows customers to tap into the innovation of best-of-breed cloud services and modern endpoints while still leveraging their existing infrastructure investments in identity management and network security. Our platform and products protect the customer from being locked into a single-vendor computing stack.
Customers use MobileIron to:
|
1. |
Establish a trusted workspace on the endpoint that includes the applications, connectivity, and seamless authentication users need to be productive. |
|
2. |
Separate business data from personal data both on the endpoint and across the network to prevent the loss of business data and to preserve the privacy of personal data. |
|
3. |
Block untrusted endpoints and apps from accessing business cloud services so that they cannot move business data outside the company’s control. |
|
4. |
Detect and remediate zero-day security threats to protect against new vulnerabilities and attacks. |
44
Our customers can deploy MobileIron as either a cloud service or on-premises software. They can choose subscription or perpetual licensing. We primarily target midsize and large enterprises around the world across a broad range of industries including financial services, government, healthcare, legal, manufacturing, professional services, retail, technology, and telecommunications.
Our total revenue was $176.5 million in 2017, an increase of 8% from $163.9 million in 2016.
Revenue from subscriptions represented 40% and revenue from perpetual licenses represented 23% of total revenue in 2017. The balance, constituting 37% of total revenue in 2017, was software support and services revenue which consists primarily of revenue from agreements to provide software upgrades and updates, as well as technical support, to customers with perpetual software licenses. This represents a continuing mix shift in favor of subscription and software support and services revenue, as we recognized 37% of our total revenue from subscriptions, 28% from perpetual licenses and 35% from software support and services in 2016.
Our perpetual license revenue in 2017 was $41.2 million, representing a decrease of $4.6 million, or 10%, compared to 2016. The decline in perpetual license revenue was primarily due to a decrease in demand for our perpetual licenses and to a mix shift in favor of software licenses priced as subscriptions rather than perpetual licenses.
Our subscription revenue in 2017 was $70.5 million, representing an increase of $9.1 million, or 15%, compared to 2016, reflecting our customers’ preference to purchase licenses priced as subscriptions. When we sell our solutions on a subscription basis, we typically offer 12 months or longer terms and bill in advance. Certain service providers often operate under a monthly recurring charge, or MRC, model. In the MRC model, revenue and billings are based on active devices or users of the service provider’s customer and are reported to us by the service provider on a monthly basis over time and billed by us one month in arrears. Our MRC revenue, included in our reported subscription revenue, comprised approximately 11% of total revenue in 2017 and 15% of total revenue in 2016. The decrease in MRC revenue as a percentage of total revenue was largely due to customers switching from MRC to longer-term subscriptions or perpetual licenses. While we expect subscription revenue to increase as new and existing customers continue to purchase software subscription licenses, we also expect potential quarterly volatility in both billings and revenue as a result of mix changes between perpetual, on-premises and cloud term subscriptions, and MRC transactions.
Our software support and services revenue in 2017 was $64.9 million, representing an increase of $8.1 million, or 14%, compared to 2016. The growth rate of support and services revenue is primarily dependent on growth in our installed base of customers that purchase recurring software support.
Our gross billings were $200.9 million, $182.1 million, and $165.0 million in 2017, 2016 and 2015, respectively, representing growth rates of 10% from both 2016 to 2017 and 2015 to 2016. See “Key Metrics and Non-GAAP Financial Information” and “Recent Accounting Pronouncements” for more information and a reconciliation of gross billings to total revenue.
45
We sell a significant portion of our products through our channel partners, including resellers, service providers and system integrators. Our sales force develops sales opportunities and works closely with our channel partners to sell our solutions. We have a high touch sales force focused on large organizations, inside sales teams focused on mid-sized enterprises and sales teams that work with service providers that focus on smaller businesses. We prioritize our internal sales and marketing efforts on large organizations because we believe that they represent the largest potential opportunity.
We believe that our market opportunity is large, and sales to customers outside of the United States will remain a significant opportunity for future growth. In 2017, 2016 and 2015, 54%, 53% and 50%, respectively, of our total revenue was generated from customers located outside of the United States, primarily those located in Europe. International market trends that may affect sales of our products and services include heightened concerns and legal requirements relating to data security and privacy, the importance of execution on our international channel partner strategy, the importance of recruiting and retaining sufficient international personnel, the effect of exchange rates, and political and financial market instability.
In 2016 and 2017, we focused on driving more efficiency in our business. However, we have continued to incur net losses. We incurred net losses of $56.3 million, $67.2 million and $84.5 million in 2017, 2016 and 2015, respectively. As a result of this, we do not expect to be profitable for the foreseeable future under our current operating plan. Future profitability is primarily dependent on revenue growth, which may be challenging for a number of reasons including possible continued mix shift towards cloud subscription licensing, increasing and entrenched competition, changes in our pricing model, our ability to continue to develop and evolve our products, any failure to capitalize on market opportunities, the ability of our sales organization to retain its key employees and leadership team, and continued stock-based compensation charges from restricted stock unit grants and stock-settled bonuses. Future profitability is also dependent on our ability to manage our expenses, which are being impacted by increasing overhead costs associated with security initiatives, new revenue guidance implementation, office expansion in India, increased depreciation expense from capital expenditures for our new headquarters office and office in India, network and data center upgrades, and software projects. We will need to increase operating efficiency, which may be challenging given our operational complexity. In addition, the new revenue accounting standard may impact our profitability and may make our financial results more difficult to predict.
Key Metrics and Non-GAAP Financial Information
To supplement our financial results presented on a GAAP basis, we provide investors with certain non-GAAP financial measures, including gross billings, recurring billings, recurring revenue, non-GAAP gross profit, non-GAAP gross margin, non-GAAP operating loss, non-GAAP operating margin, non-GAAP net loss, and non-GAAP net loss per share. These non-GAAP financial measures exclude stock-based compensation, the amortization of intangible assets, a litigation settlement charge, and restructuring charges. Beginning 2016, we no longer excluded perpetual license revenue recognized from licenses delivered prior to 2013 from our non-GAAP financial measures and we have adjusted our non-GAAP financial measures tables accordingly. Perpetual license revenue recognized from licenses delivered prior to 2013 was insignificant in 2017 and 2016 and was $1.8 million in 2015.
Stock-based compensation expenses
In our non-GAAP financial measures, we have excluded the effect of stock-based compensation expenses. Stock-based compensation expenses will recur in future periods.
Amortization of intangible assets
In our non-GAAP financial measures, we have excluded the effect of the amortization of intangible assets. Amortization of intangible assets is significantly affected by the timing and size of our acquisitions. Amortization of intangible assets will recur in future periods if we acquire companies or intangible assets.
46
Litigation settlement charge
In our non-GAAP financial measures, we have excluded a charge for the cost of the settlement of our shareholder litigation. While it is possible that we will have material litigation-related charges in the future, we do not expect such charges to consistently recur.
Restructuring charges
In our non-GAAP financial measures, we have excluded the effect of the severance and other expenses related to our reduction in workforce. Restructuring charges may recur in the future; however, the timing and amounts are difficult to predict.
Non-GAAP gross profit, non-GAAP gross margin, non-GAAP operating loss, non-GAAP operating margin, non-GAAP net loss, and non-GAAP net loss per share
We believe that the exclusion of stock-based compensation expense, the amortization of intangible assets, the litigation settlement charge, and restructuring charges and from gross profit, gross margin, operating loss, operating margin, net loss, and net loss per share provides useful measures for management and investors because stock-based compensation, the amortization of intangible assets and restructuring charges have been and can continue to be inconsistent in amount from period to period. We have not historically had a material litigation-related settlement charge. While it is possible that we will have material litigation settlement charges in the future, we do not expect it to be a consistently recurring expense. We believe the inclusion of these items makes it difficult to compare periods and understand the growth and performance of our business. In addition, we evaluate our business performance and compensate management based in part on these non-GAAP measures. There are limitations in using non-GAAP financial measures because the non-GAAP financial measures are not prepared in accordance with GAAP, may be different from non-GAAP financial measures used by our competitors and exclude expenses that may have a material impact on our reported financial results. Further, stock-based compensation expense has been and will continue to be for the foreseeable future a significant recurring expense in our business and an important part of the compensation provided to our employees. Similarly, amortization of intangible assets has been a recurring expense and may recur in the future if we acquire companies or intangible assets.
Gross and recurring billings, recurring revenue and free cash flow
Our non-GAAP financial measures also include: gross billings, which we define as total revenue plus the change in deferred revenue in a period; recurring billings, which we define as total revenue less perpetual license, hardware, and professional services revenue plus the change in deferred revenue for subscription and software support arrangements in a period, adjusted for nonrecurring perpetual license billings; recurring revenue, which we define as total revenue less perpetual license, hardware, professional services and perpetual amounts recorded as subscription or software support revenue in multiple elements arrangements; and free cash flow, which we define as cash used in operating activities less the amount of property and equipment purchased. We consider gross billings to be a useful metric for management and investors because subscription billings, excluding MRC, and software support and services billings drive deferred revenue, which is an important indicator of future revenue. Similarly, we consider recurring billings and recurring revenue to be useful metrics because they are important indicators of the portion of our business that we would expect to recur each year. There are a number of limitations related to the use of gross, recurring billings and recurring revenue. First, gross and recurring billings include amounts that have not yet been recognized as revenue. Second, our calculation of gross and recurring billings may be different from other companies that report similar financial measures. Third, recurring revenue excludes perpetual license amounts recognized from multiple elements arrangements that we record as subscription or software support revenue in our GAAP statements of operations and that perpetual license amount is based on invoice value, not fair value, although we believe invoice value approximates the fair value of the element. Fourth, in the MRC model, revenue and billings are based on active devices or users of the service provider’s customer and are billed to us by the service provider on a monthly basis over time and one month in arrears. Thus, under the MRC model, we receive no billings or revenue for MRC at the time the deal is booked, but instead the MRC is billed and revenue is recognized each month based on active usage. Unlike term subscriptions, MRC is not reflected in deferred revenue. This important difference between MRC billings and perpetual and term subscription billings can lead to significant variability of billings in a given quarter depending on the type of
47
billing model that the customer chooses and the overall mix of billing types for all customers within a quarter. We compensate for these limitations by providing specific information regarding GAAP revenue and evaluating gross and recurring billings and recurring revenue together with revenue calculated in accordance with GAAP. Management believes that information regarding free cash flow provides investors with an important perspective on the cash available to invest in our business and fund ongoing operations. However, our calculation of free cash flow may not be comparable to similar measures used by other companies.
We believe these non-GAAP financial measures are helpful in understanding our past financial performance and our future results. Our non-GAAP financial measures are not meant to be considered in isolation or as a substitute for comparable GAAP measures and should be read only in conjunction with our consolidated financial statements prepared in accordance with GAAP. Our management regularly uses our supplemental non-GAAP financial measures internally to understand, manage and evaluate our business, and make operating decisions. These non-GAAP measures are among the primary factors management uses in planning for and forecasting future periods. Compensation of our executives is based in part on the performance of our business based on certain of these non-GAAP measures.
We monitor the following non-GAAP financial measures:
|
|
|
|
|
|
|
|
|
|
|
|
|
|
|
For the year ended December 31, |
|
|||||||
|
(in thousands, except percentages and per share data) |
|
2017 |
|
2016 |
|
2015 |
|
|||
|
Gross billings |
|
$ |
200,916 |
|
$ |
182,127 |
|
$ |
164,999 |
|
|
Year-over-year percentage increase |
|
|
10 |
% |
|
10 |
% |
|
— |
|
|
Recurring billings |
|
$ |
150,834 |
|
$ |
131,773 |
|
$ |
107,485 |
|
|
Percentage of gross billings |
|
|
75 |
% |
|
72 |
% |
|
65 |
% |
|
Year-over-year percentage increase |
|
|
14 |
% |
|
23 |
% |
|
— |
|
|
Recurring revenue |
|
$ |
130,292 |
|
$ |
113,414 |
|
$ |
90,563 |
|
|
Percentage of total revenue |
|
|
74 |
% |
|
69 |
% |
|
61 |
% |
|
Year-over-year percentage increase |
|
|
15 |
% |
|
25 |
% |
|
— |
|
|
Non-GAAP gross profit |
|
$ |
150,582 |
|
$ |
137,218 |
|
$ |
124,765 |
|
|
Non-GAAP gross margin |
|
|
85.3 |
% |
|
83.7 |
% |
|
83.6 |
% |
|
Non-GAAP operating loss |
|
$ |
(19,377) |
|
$ |
(30,286) |
|
$ |
(52,646) |
|
|
Non-GAAP operating margin |
|
|
(11.0) |
% |
|
(18.5) |
% |
|
(35.3) |
% |
|
Non-GAAP net loss |
|
$ |
(19,531) |
|
$ |
(31,123) |
|
$ |
(53,772) |
|
|
Non-GAAP loss per share |
|
$ |
(0.21) |
|
$ |
(0.36) |
|
$ |
(0.68) |
|
|
Free cash flow |
|
$ |
(3,418) |
|
$ |
(14,659) |
|
$ |
(52,265) |
|
48
Reconciliation of Non-GAAP Financial Measures
The following tables reconcile the most directly comparable GAAP financial measure to each of the non-GAAP financial measures discussed above.
|
|
|
|
|
|
|
|
||||
|
|
|
For the year ended December 31, |
|
|||||||
|
|
|
2017 |
|
2016 |
|
2015 |
|
|||
|
(in thousands, except percentages and per share data) |
|
|
|
|
|
|
|
|
|
|
|
Gross billings reconciliation: |
|
|
|
|
|
|
|
|
|
|
|
Total revenue |
|
$ |
176,491 |
|
$ |
163,926 |
|
$ |
149,298 |
|
|
Total deferred revenue, end of period (1) |
|
|
112,501 |
|
|
88,076 |
|
|
69,875 |
|
|
Less: Total deferred revenue, beginning of period |
|
|
(88,076) |
|
|
(69,875) |
|
|
(54,174) |
|
|
Total change in deferred revenue |
|
|
24,425 |
|
|
18,201 |
|
|
15,701 |
|
|
Gross billings |
|
$ |
200,916 |
|
$ |
182,127 |
|
$ |
164,999 |
|
|
Recurring billings reconciliation: |
|
|
|
|
|
|
|
|
|
|
|
Total revenue |
|
$ |
176,491 |
|
$ |
163,926 |
|
$ |
149,298 |
|
|
Less: Perpetual license revenue |
|
|
(41,165) |
|
|
(45,775) |
|
|
(53,512) |
|
|
Less: Professional services revenue |
|
|
(2,983) |
|
|
(2,811) |
|
|
(3,165) |
|
|
Subscription and software support deferred revenue, end of period (1) |
|
|
109,152 |
|
|
85,612 |
|
|
67,267 |
|
|
Less: Subscription and software support deferred revenue, beginning of period |
|
|
(85,612) |
|
|
(67,267) |
|
|
(49,194) |
|
|
Total change in subscription and software support deferred revenue |
|
|
23,540 |
|
|
18,345 |
|
|
18,073 |
|
|
Less: Adjustments (2) |
|
|
(5,049) |
|
|
(1,912) |
|
|
(3,209) |
|
|
Recurring billings |
|
$ |
150,834 |
|
$ |
131,773 |
|
$ |
107,485 |
|
|
Recurring revenue reconciliation: |
|
|
|
|
|
|
|
|
|
|
|
Total revenue |
|
|
176,491 |
|
|
163,926 |
|
|
149,298 |
|
|
Less: Perpetual license revenue |
|
|
(41,165) |
|
|
(45,775) |
|
|
(53,512) |
|
|
Less: Professional services revenue |
|
|
(2,983) |
|
|
(2,811) |
|
|
(3,165) |
|
|
Less: Perpetual license recorded over the term of subscription or software support (3) |
|
|
(2,051) |
|
|
(1,926) |
|
|
(2,058) |
|
|
Recurring revenue: |
|
$ |
130,292 |
|
$ |
113,414 |
|
$ |
90,563 |
|
|
Non-GAAP gross profit reconciliation: |
|
|
|
|
|
|
|
|
|
|
|
Gross profit |
|
$ |
145,954 |
|
$ |
133,378 |
|
$ |
121,121 |
|
|
Add: Stock-based compensation expense |
|
|
3,772 |
|
|
3,043 |
|
|
2,774 |
|
|
Add: Amortization of intangible assets |
|
|
545 |
|
|
616 |
|
|
870 |
|
|
Add: Restructuring charge |
|
|
311 |
|
|
181 |
|
|
— |
|
|
Non-GAAP gross profit |
|
$ |
150,582 |
|
$ |
137,218 |
|
$ |
124,765 |
|
|
Non-GAAP gross margin reconciliation: |
|
|
|
|
|
|
|
|
|
|
|
GAAP gross margin: GAAP gross profit over GAAP total revenue |
|
|
82.7 |
% |
|
81.4 |
% |
|
81.1 |
% |
|
GAAP to non-GAAP gross margin adjustments |
|
|
2.6 |
% |
|
2.3 |
% |
|
2.5 |
% |
|
Non-GAAP gross margin |
|
|
85.3 |
% |
|
83.7 |
% |
|
83.6 |
% |
|
Non-GAAP operating loss reconciliation: |
|
|
|
|
|
|
|
|
|
|
|
GAAP operating loss |
|
$ |
(56,145) |
|
$ |
(66,343) |
|
$ |
(83,356) |
|
|
Add: Stock-based compensation expense |
|
|
33,731 |
|
|
34,389 |
|
|
28,791 |
|
|
Add: Amortization of intangible assets |
|
|
545 |
|
|
616 |
|
|
870 |
|
|
Add: Litigation settlement charge |
|
|
1,143 |
|
|
— |
|
|
— |
|
|
Add: Restructuring charge |
|
|
1,349 |
|
|
1,052 |
|
|
1,049 |
|
|
Non-GAAP operating loss |
|
$ |
(19,377) |
|
$ |
(30,286) |
|
$ |
(52,646) |
|
|
Non-GAAP operating margin reconciliation: |
|
|
|
|
|
|
|
|
|
|
|
GAAP operating margin: GAAP operating profit over GAAP total revenue |
|
|
(31.8) |
% |
|
(40.5) |
% |
|
(55.8) |
% |
|
GAAP to non-GAAP operating margin adjustments |
|
|
20.8 |
% |
|
22.0 |
% |
|
20.5 |
% |
|
Non-GAAP operating margin |
|
|
(11.0) |
% |
|
(18.5) |
% |
|
(35.3) |
% |
|
Non-GAAP net loss reconciliation: |
|
|
|
|
|
|
|
|
|
|
|
GAAP net loss |
|
$ |
(56,299) |
|
$ |
(67,180) |
|
$ |
(84,482) |
|
|
Add: Stock-based compensation expense |
|
|
33,731 |
|
|
34,389 |
|
|
28,791 |
|
|
Add: Amortization of intangible assets |
|
|
545 |
|
|
616 |
|
|
870 |
|
|
Add: Litigation settlement charge |
|
|
1,143 |
|
|
— |
|
|
— |
|
|
Add: Restructuring charge |
|
|
1,349 |
|
|
1,052 |
|
|
1,049 |
|
|
Non-GAAP net loss |
|
$ |
(19,531) |
|
$ |
(31,123) |
|
$ |
(53,772) |
|
|
Non-GAAP net loss per share reconciliation: |
|
|
|
|
|
|
|
|
|
|
|
GAAP net loss per share |
|
$ |
(0.60) |
|
$ |
(0.78) |
|
$ |
(1.07) |
|
|
Add: Stock-based compensation expense per share |
|
|
0.36 |
|
|
0.40 |
|
|
0.37 |
|
|
Add: Amortization of intangible assets per share |
|
|
0.01 |
|
|
0.01 |
|
|
0.01 |
|
|
Add: Litigation settlement charge |
|
|
0.01 |
|
|
— |
|
|
— |
|
|
Add: Restructuring charge per share |
|
|
0.01 |
|
|
0.01 |
|
|
0.01 |
|
|
Non-GAAP net loss per share |
|
$ |
(0.21) |
|
$ |
(0.36) |
|
$ |
(0.68) |
|
|
Free cash flow: |
|
|
|
|
|
|
|
|
|
|
|
Net cash provided by (used in) operating activities |
|
$ |
3,036 |
|
$ |
(11,729) |
|
$ |
(48,535) |
|
|
Purchase of property and equipment |
|
|
(6,454) |
|
|
(2,930) |
|
|
(3,730) |
|
|
Free cash flow |
|
$ |
(3,418) |
|
$ |
(14,659) |
|
$ |
(52,265) |
|
49
|
(1) |
Our deferred revenue consists of amounts that have been invoiced but that have not yet been recognized as revenue as of the period end, including subscription, software support and service revenue paid for in advance by the customer that is recognized ratably over the contractual service period. |
|
(2) |
Includes nonrecurring perpetual license billings that consist of the Deferred Portion arising from undelivered elements of perpetual license arrangements and billings classified under Bundled Arrangements. See Note 1 entitled “Summary of Significant Accounting Policies—Revenue Recognition” in Item 8, “Financial Statements and Supplementary Data,” of Part II of this Annual Report on Form 10-K for a description of Deferred Portion and Bundled Arrangements. |
|
(3) |
Perpetual amounts recorded as subscription or software revenue in multiple elements arrangements, where undelivered elements do not have VSOE. |
Factors Affecting our Performance
Market Adoption of Enterprise Mobility
We are affected by the pace at which enterprises adopt mobility into their business processes and purchase and expand a mobile security platform. Because our prospective customers often do not have a separate budget for mobile security products, we invest in marketing efforts to increase market awareness, educate prospective customers and drive adoption of our platform. The degree to which prospective customers recognize the mission-critical need for mobile security solutions and deploy mobile apps to enhance employee productivity will determine the customer demand for our solutions. We believe our rate of growth will also be positively correlated to the importance prospective customers place on securing their mobile data.
Customer Preference for Best-of-Breed vs. Suite
We believe we are the best-of-breed platform in our industry. Many of our competitors sell enterprise mobility management or mobile security as a component of a broader suite. We believe the degree to which prospective customers view our value proposition as differentiated will determine the customer demand for our solutions. For example, the level of security desired, the preservation of the native experience on end user devices, and the ability of the solution to work with multiple cloud offerings are evaluated by our prospective customers as they make buying decisions.
Investment in our Ecosystem
We have invested, and intend to continue to invest, in expanding the breadth and depth of our ecosystem. We expect to invest in research and development to enhance the application and technology integration capabilities of our platform. We are also enhancing our solution to allow native apps written to operating systems specifications to be seamlessly integrated. The degree to which we expand our base of ecosystem partners will increase the value of our platform for our customers, which could lead to an increased number of new customers as well as renewals and follow-on sales opportunities.
Ability to Improve and Grow Our Worldwide Sales Channels
We have invested, and intend to continue to invest, in improving our sales operations to drive additional revenue and support the growth of our customer base. We work with our channel partners to identify and acquire new customers as well as pursue follow-on sales opportunities. We need to further leverage our channel by training existing and new partners to independently sell and support our products. Newly-hired sales personnel typically require several months to become productive and turnover of productive sales personnel can inhibit our billings and revenue growth. All of these factors will influence timing and overall levels of sales productivity, impacting the rate at which we will be able to acquire customers to drive revenue growth.
50
Expansion and Upsell within Existing Customer Base
After the initial sale to a new customer, we focus on providing increased value expanding our relationship with such customer to sell additional licenses and subscriptions. To increase our revenue, in addition to customers’ renewing their subscriptions or support contracts with us, it is important that our customers expand device license count and purchase additional products. Additional sales lead to increased revenue over the lifecycle of a customer relationship and can significantly increase the return on our sales and marketing investments. Accordingly, our revenue growth will depend in part on customers’ renewing their existing agreements with us and the degree to which and our expansion and upsell sales strategy is successful.
Mix of Subscription and Perpetual Revenue
We offer our solutions on both a subscription and perpetual pricing model. We are seeing broader market acceptance of our subscription licensing model from new customers. We expect the proportion of subscription revenue to our total revenue to continue to increase over time and there may be significant increases or decreases on a quarterly basis. We have also seen our cloud subscriptions increase as a proportion of our total revenue and expect this trend to continue. Under the new revenue accounting standard, revenue associated with the license portion of on-premise term subscriptions is recognized up-front with the remainder being recognized over the subscription term whereas all cloud subscription revenue is recognized ratably over the subscription term. Such differences in accounting treatment for on-premise and cloud subscriptions may cause revenue to fluctuate and to be less predictable on a quarterly basis.
Ability to Scale Operations
We plan to continue to invest for future growth, in part by making selective investments in research and development and, to a lesser degree, in sales and marketing. We will continue to incur significant accounting, legal and other expenses in order to comply with rules and regulations associated with being a public company. At the same time, we will need to increase our operating efficiency, which may be challenging given our rate of technology change, operational complexity, and expenses associated with being a public company.
Components of Operating Results
Revenue
Perpetual license revenue
Perpetual license revenue primarily relates to revenue from on premise perpetual licenses. From time to time, we enter into multiple element arrangements with customers in which a customer purchases our software with an appliance. Appliance revenue is also included in perpetual license revenue and constitutes less than 10% of total revenue in 2017, 2016 and 2015.
Subscription revenue
Subscription revenue is generated primarily from subscriptions to our on-premise term licenses, arrangements where perpetual and term license subscriptions are bundled together, and subscriptions to our cloud service. These revenues are recognized ratably over the subscription period or term. While most of our subscriptions have at least a one-year commitment, we also recognize in this category MRC, which is revenue from month-to-month subscription arrangements that are typically sold through service providers and billed on a monthly basis, one month in arrears. Except for MRC, we typically bill subscriptions annually in advance.
Software support and services revenue
Software support and services revenue includes recurring revenue from agreements to provide software upgrades and updates, as well as technical support, to customers with perpetual software licenses. Revenue related to software support is recognized ratably over the support term. Software support and services revenue also includes revenue from professional services, consisting of implementation consulting services and training of customer personnel.
51
Cost of Revenue
Perpetual license
Our cost of perpetual license revenue consists of cost of third-party software royalties, appliances and amortization of intangible assets.
Subscription
Our cost of subscription revenue primarily consists of costs associated with our data center operations for our cloud service, our global Technical Support organization and third-party software royalties. Cloud service data center costs primarily consist of third-party hosting facilities, telecommunication and information technology costs. Global Customer Success organization and data center operations costs primarily consist of salaries, benefits, stock-based compensation, depreciation, and facilities.
Software support and service
Our software support and services cost of revenue primarily consists of costs associated with our global Customer Success organization, including our customer support, professional services, customer advocacy and training teams. These costs consist of salaries, benefits, stock-based compensation, depreciation, facilities and information technology costs.
Gross Margin
Gross margin, or gross profit as a percentage of total revenue, has been and will continue to be affected by various factors, including mix between large and small customers, mix of products sold, including products we resell or pay a significant royalty on, mix between perpetual and subscription licenses, timing of revenue recognition and the extent to which we expand our global Customer Success organization and data center operations, including costs associated with third-party hosting facilities, and stock-based compensation expense associated with grants of equity awards. We expect our gross margins to fluctuate over time depending on the factors described above.
Operating Expenses
Personnel costs are the most significant component of operating expenses and consist of salaries, benefits, bonuses, stock-based compensation and with regard to sales and marketing expense, sales commissions. While operating expenses, exclusive of stock-based compensation expense, may fluctuate as a percentage of total revenue from period to period, we expect them to decrease over the long term as a percentage of total revenue. Stock-based compensation expense may fluctuate depending on the size and timing of restricted stock unit grants and stock-settled bonus plans, if any.
Research and Development Expenses
Research and development costs are expensed as incurred. Research and development expense consists primarily of personnel costs. Research and development expense also includes costs associated with contractors and consultants, equipment and software to support our development and quality assurance teams, facilities and information technology. While our research and development expense, exclusive of stock-based compensation expense, may fluctuate as a percentage of total revenue over the short term, we expect it to decrease as a percentage of total revenue over the long term.
Sales and Marketing Expenses
Sales and marketing expense consists primarily of personnel costs, including sales commissions. We expense commissions up-front at the time of the sale. Sales and marketing expense also includes costs associated with third-party events, lead generation campaigns, promotional and other marketing activities, as well as travel, equipment and software depreciation, consulting, information technology and facilities. While our sales and marketing expense, exclusive of
52
stock-based compensation expense, may fluctuate as a percentage of total revenue over the short term, we expect it to decrease as a percentage of total revenue over the long term.
General and Administrative Expenses
General and administrative expense consists of personnel costs, travel, information technology, facilities and professional services fees. General and administrative personnel include our executive, finance, human resources and legal organizations. Professional services fees consist primarily of litigation, other legal, accounting and consulting costs. While our general and administrative expense, exclusive of stock-based compensation expense, may fluctuate as a percentage of total revenue over the short term, we expect it to decrease as a percentage of total revenue over the long term.
Litigation Settlement Charge
The litigation settlement charge is the expense associated with the settlement of outstanding shareholder litigation.
Restructuring Charges
Restructuring charges consist of severance and severance-related costs and, in 2017, the estimated cost to exit a facility. These restructuring charges were designed to align our cost structure with our expected growth rate.
Other Income (Expense)—Net
Other income (expense), net consists primarily of the effect of exchange rates on our foreign currency-denominated asset and liability balances and interest income earned on our cash and cash equivalents and fixed income securities. All translation adjustments are recorded as foreign currency gains (losses) in the consolidated statements of operations.
Income Tax Expense
Income tax expense consists primarily of income taxes in foreign jurisdictions in which we conduct business. Due to our history of losses, we maintain a full valuation allowance for deferred tax assets including net operating loss carry-forwards, research and development tax credits, capitalized research and development and other book versus tax differences.
53
Consolidated of Results of Operations
The following tables summarize our results of operations for the periods presented and as a percentage of our total revenue for those periods. The period-to-period comparison of results is not necessarily indicative of results for future periods.
|
|
|
|
|
|
|
||||
|
|
|
Year ended December 31, |
|||||||
|
|
|
2017 |
|
2016 |
|
2015 |
|||
|
Revenue |
|
|
|
|
|
|
|
|
|
|
Perpetual license |
|
$ |
41,165 |
|
$ |
45,775 |
|
$ |
53,512 |
|
Subscription |
|
|
70,470 |
|
|
61,357 |
|
|
48,080 |
|
Software support and services |
|
|
64,856 |
|
|
56,794 |
|
|
47,706 |
|
Total revenue |
|
|
176,491 |
|
|
163,926 |
|
|
149,298 |
|
Cost of revenue (1) |
|
|
|
|
|
|
|
|
|
|
Perpetual license |
|
|
1,869 |
|
|
2,658 |
|
|
2,881 |
|
Subscription |
|
|
8,626 |
|
|
8,297 |
|
|
7,181 |
|
Software support and services |
|
|
19,731 |
|
|
19,412 |
|
|
18,115 |
|
Restructuring charge |
|
|
311 |
|
|
181 |
|
|
— |
|
Total cost of revenue |
|
|
30,537 |
|
|
30,548 |
|
|
28,177 |
|
Gross profit |
|
|
145,954 |
|
|
133,378 |
|
|
121,121 |
|
|
|
|
|
|
|
|
|
|
|
|
Operating expenses: |
|
|
|
|
|
|
|
|
|
|
Research and development (1) |
|
|
75,350 |
|
|
67,398 |
|
|
61,871 |
|
Sales and marketing (1) |
|
|
96,477 |
|
|
101,757 |
|
|
105,520 |
|
General and administrative (1) |
|
|
28,091 |
|
|
29,695 |
|
|
36,037 |
|
Litigation settlement charge |
|
|
1,143 |
|
|
— |
|
|
— |
|
Restructuring charge |
|
|
1,038 |
|
|
871 |
|
|
1,049 |
|
Total operating expenses |
|
|
202,099 |
|
|
199,721 |
|
|
204,477 |
|
Operating loss |
|
|
(56,145) |
|
|
(66,343) |
|
|
(83,356) |
|
Other income (expense) - net |
|
|
988 |
|
|
145 |
|
|
(274) |
|
Loss before income taxes |
|
|
(55,157) |
|
|
(66,198) |
|
|
(83,630) |
|
Income tax expense |
|
|
1,142 |
|
|
982 |
|
|
852 |
|
Net loss |
|
$ |
(56,299) |
|
$ |
(67,180) |
|
$ |
(84,482) |
|
Net loss per share, basic and diluted |
|
$ |
(0.60) |
|
$ |
(0.78) |
|
$ |
(1.07) |
|
Weighted-average shares used to compute net loss per share, basic and diluted |
|
|
93,770 |
|
|
85,845 |
|
|
78,755 |
|
(1) |
Amounts include stock-based compensation expense as follows: |
|
|
|
|
|
|
|
||||
|
|
|
Year ended December 31, |
|||||||
|
|
|
2017 |
|
2016 |
|
2015 |
|||
|
Cost of revenue |
|
$ |
3,772 |
|
$ |
3,043 |
|
$ |
2,774 |
|
Research and development |
|
|
14,520 |
|
|
11,728 |
|
|
10,607 |
|
Sales and marketing |
|
|
8,659 |
|
|
10,474 |
|
|
9,508 |
|
General and administrative |
|
|
6,780 |
|
|
9,144 |
|
|
5,902 |
|
Total |
|
$ |
33,731 |
|
$ |
34,389 |
|
$ |
28,791 |
54
|
|
|
|
|
|
|
||
|
|
|
Year ended December 31, |
|
||||
|
|
|
2017 |
|
2016 |
|
2015 |
|
|
Revenue |
|
|
|
|
|
|
|
|
Perpetual license |
|
23 |
% |
28 |
% |
36 |
% |
|
Subscription |
|
40 |
|
37 |
|
32 |
|
|
Software support and services |
|
37 |
|
35 |
|
32 |
|
|
Total revenue |
|
100 |
|
100 |
|
100 |
|
|
Cost of revenue |
|
|
|
|
|
|
|
|
Perpetual license |
|
1 |
|
2 |
|
2 |
|
|
Subscription |
|
5 |
|
5 |
|
5 |
|
|
Software support and services |
|
11 |
|
12 |
|
12 |
|
|
Restructuring charge |
|
— |
|
— |
|
— |
|
|
Total cost of revenue |
|
17 |
|
19 |
|
19 |
|
|
Gross profit |
|
83 |
|
81 |
|
81 |
|
|
Operating expenses: |
|
|
|
|
|
|
|
|
Research and development |
|
43 |
|
41 |
|
41 |
|
|
Sales and marketing |
|
54 |
|
62 |
|
71 |
|
|
General and administrative |
|
16 |
|
18 |
|
24 |
|
|
Litigation settlement charge |
|
1 |
|
— |
|
— |
|
|
Restructuring charge |
|
— |
|
1 |
|
1 |
|
|
Total operating expenses |
|
114 |
|
122 |
|
137 |
|
|
Operating loss |
|
(31) |
|
(41) |
|
(56) |
|
|
Other income (expense) - net |
|
— |
|
— |
|
— |
|
|
Loss before income taxes |
|
(31) |
|
(41) |
|
(56) |
|
|
Income tax expense |
|
1 |
|
— |
|
1 |
|
|
Net loss |
|
(32) |
% |
(41) |
% |
(57) |
% |
Years Ended December 31, 2017, 2016 and 2015
Revenue
|
|
|
|
|
|
|
|
|
|
|
|
|
|
Change |
|
|||||||||
|
(in thousands, |
|
Year Ended December 31, |
|
2017 vs 2016 |
|
|
2016 vs 2015 |
|
|||||||||||||||
|
except percentages) |
|
2017 |
|
2016 |
|
|
2015 |
|
|
Amount |
|
% |
|
|
Amount |
|
% |
|
|||||
|
Perpetual |
|
$ |
41,165 |
|
$ |
45,775 |
|
|
$ |
53,512 |
|
|
$ |
(4,610) |
|
(10) |
% |
|
$ |
(7,737) |
|
(14) |
% |
|
Subscription |
|
|
70,470 |
|
|
61,357 |
|
|
|
48,080 |
|
|
|
9,113 |
|
15 |
% |
|
|
13,277 |
|
28 |
% |
|
Software support and services |
|
|
64,856 |
|
|
56,794 |
|
|
|
47,706 |
|
|
|
8,062 |
|
14 |
% |
|
|
9,088 |
|
19 |
% |
|
Total revenue |
|
$ |
176,491 |
|
$ |
163,926 |
|
|
$ |
149,298 |
|
|
$ |
12,565 |
|
8 |
% |
|
$ |
14,628 |
|
10 |
% |
|
|
|
|
|
|
|
|
|
|
|
|
|
|
|
|
|
|
|
|
|
|
|
|
|
|
Percentage of total revenue |
|
|
|
|
|
|
|
|
|
|
|
|
|
|
|
|
|
|
|
|
|
|
|
|
Perpetual |
|
|
23 |
% |
|
28 |
% |
|
|
36 |
% |
|
|
|
|
|
|
|
|
|
|
|
|
|
Subscription |
|
|
40 |
|
|
37 |
|
|
|
32 |
|
|
|
|
|
|
|
|
|
|
|
|
|
|
Software support and services |
|
|
37 |
|
|
35 |
|
|
|
32 |
|
|
|
|
|
|
|
|
|
|
|
|
|
|
|
|
|
100 |
% |
|
100 |
% |
|
|
100 |
% |
|
|
|
|
|
|
|
|
|
|
|
|
55
|
|
|
For the year ended December 31, |
|
Change |
|
|||||||||||||||||||||
|
|
|
2017 |
|
2016 |
|
2015 |
|
2017 vs 2016 |
|
2016 vs 2015 |
|
|||||||||||||||
|
|
|
|
|
|
% of |
|
|
|
|
% of |
|
|
|
|
% of |
|
|
|
|
|
|
|
|
|
|
|
|
(in thousands, |
|
|
|
|
Total |
|
|
|
|
Total |
|
|
|
|
Total |
|
|
|
|
|
|
|
|
|
|
|
|
except percentages) |
|
Amount |
|
Revenue |
|
Amount |
|
Revenue |
|
Amount |
|
Revenue |
|
Amount |
|
% |
|
Amount |
|
% |
|
|||||
|
Revenue |
|
|
|
|
|
|
|
|
|
|
|
|
|
|
|
|
|
|
|
|
|
|
|
|
|
|
|
United States |
|
$ |
81,335 |
|
46 |
% |
$ |
77,039 |
|
47 |
% |
$ |
74,235 |
|
50 |
% |
$ |
4,296 |
|
6 |
% |
$ |
2,804 |
|
4 |
% |
|
International |
|
|
95,156 |
|
54 |
% |
|
86,887 |
|
53 |
% |
|
75,063 |
|
50 |
% |
|
8,269 |
|
10 |
% |
|
11,824 |
|
16 |
% |
|
Total revenue |
|
$ |
176,491 |
|
100 |
% |
$ |
163,926 |
|
100 |
% |
$ |
149,298 |
|
100 |
% |
$ |
12,565 |
|
8 |
% |
$ |
14,628 |
|
10 |
% |
Comparison of 2017 and 2016
Perpetual license revenue decreased $4.6 million in 2017 compared to 2016, primarily due to a shift in favor of software licenses priced as subscriptions and a slowdown in perpetual license orders.
Subscription revenue increased $9.1 million, or 15%, in 2017 compared to 2016, due to increased sales of subscriptions to licenses sold under a cloud-based delivery model and, to a lesser extent, subscriptions for license to our on premise software products. MRC revenue decreased from $24.5 million in 2016 to $20.0 million in 2017, largely due to the conversion of MRC agreements to longer-term subscription or perpetual license agreements.
Software support and services revenue increased $8.1 million, or 14%, in 2017 compared to 2016, primarily as a result of an increased installed base of customers that pay recurring software support.
Revenue from international and U.S. sales increased 10% and 6%, respectively, in 2017 compared to 2016 due to an increase in the adoption of our products and an increased cumulative installed base of customers, partially offset by the mix shift from perpetual to subscription, and a slowdown in perpetual license orders.
Revenue from AT&T, as a reseller, was 14% of total revenue in 2017 compared to 15% in 2016. No other customer accounted for 5% or more of total revenue in 2017 or 2016.
Comparison of 2016 and 2015
Perpetual license revenue decreased $7.7 million in 2016 compared to 2015, primarily due to a shift in favor of software licenses priced as subscriptions, a slowdown in perpetual license orders and a $1.6 million decrease in revenue recognized from licenses that were delivered prior to 2013, but for which the revenue is being recognized ratably over the contractual terms of the related software support agreements due to lack of VSOE for software support and services prior to January 1, 2013.
Subscription revenue increased $13.3 million, or 28%, in 2016 compared to 2015, due to increased sales of solutions sold under either a cloud-based delivery model or a subscription term license for our on premise software products. The increase in subscription revenue also included an increase in MRC revenue from $21.1 million in 2015 to $24.5 million in 2016.
Software support and services revenue increased $9.1 million, or 19%, in 2016 compared to 2015, primarily as a result of an increased installed base of customers that pay recurring software support.
Revenue from international sales increased 16% in 2016 compared to 2015 due to an increase in the adoption of our products and an increased cumulative installed base of customers partially offset by a decrease in revenue recognized from perpetual licenses delivered prior to 2013, as noted above.
Revenue from U.S. sales increased 4% in 2016 compared to 2015 due to an increase in the adoption of our products and an increased cumulative installed base of customers, partially offset by the mix shift from perpetual to subscription, a slowdown in perpetual license orders, and less revenue being recognized from licenses delivered prior to 2013.
Revenue from AT&T, as a reseller, was 15% of total revenue in 2016 compared with 16% in 2015. No other customer accounted for 5% or more of total revenue in 2016 or 2015.
56
Cost of Revenue and Gross Margin
|
|
|
For the year endedDecember 31, |
|
Change |
|
|||||||||||||||||||||
|
|
|
2017 |
|
2016 |
|
2015 |
|
2017 vs 2016 |
|
2016 vs 2015 |
|
|||||||||||||||
|
|
|
|
|
|
% of |
|
|
|
|
% of |
|
|
|
|
% of |
|
|
|
|
|
|
|
|
|
|
|
|
(in thousands, |
|
|
|
|
Total |
|
|
|
|
Total |
|
|
|
|
Total |
|
|
|
|
|
|
|
|
|
|
|
|
except percentages) |
|
Amount |
|
Revenue |
|
Amount |
|
Revenue |
|
Amount |
|
Revenue |
|
Amount |
|
% |
|
Amount |
|
% |
|
|||||
|
Cost of revenue: |
|
|
|
|
|
|
|
|
|
|
|
|
|
|
|
|
|
|
|
|
|
|
|
|
|
|
|
Perpetual license |
|
$ |
1,869 |
|
1 |
% |
$ |
2,658 |
|
2 |
% |
$ |
2,881 |
|
2 |
% |
$ |
(789) |
|
(30) |
% |
$ |
(223) |
|
(8) |
% |
|
Subscription |
|
|
8,626 |
|
5 |
% |
|
8,297 |
|
5 |
% |
|
7,181 |
|
5 |
% |
|
329 |
|
4 |
% |
|
1,116 |
|
16 |
% |
|
Software support and services |
|
|
19,731 |
|
11 |
% |
|
19,412 |
|
12 |
% |
|
18,115 |
|
12 |
% |
|
319 |
|
2 |
% |
|
1,297 |
|
7 |
% |
|
Restructuring charge |
|
|
311 |
|
— |
% |
|
181 |
|
— |
% |
|
— |
|
— |
% |
|
130 |
|
72 |
% |
|
181 |
|
NM |
|
|
Total cost of revenue |
|
$ |
30,537 |
|
17 |
% |
$ |
30,548 |
|
19 |
% |
$ |
28,177 |
|
19 |
% |
$ |
(11) |
|
(0) |
% |
$ |
2,371 |
|
8 |
% |
|
Gross profit |
|
$ |
145,954 |
|
|
|
$ |
133,378 |
|
|
|
$ |
121,121 |
|
|
|
$ |
12,576 |
|
9 |
% |
$ |
12,257 |
|
10 |
% |
|
Gross margin |
|
|
|
|
83 |
% |
|
|
|
81 |
% |
|
|
|
81 |
% |
|
|
|
|
|
|
|
|
|
|
Comparison of 2017 and 2016
Total cost of revenue was flat in 2017 compared to 2016. Perpetual license cost of revenue decreased $789,000 due primarily to lower appliance sales. Subscription cost of revenue increased $329,000 due to higher data center operations spending to support our growing cloud business and, to a lesser extent, higher royalty expense. Software support and services cost of revenue increased $319,000 due to an increase in Global Customer Success expense. Global Customer Success expense increased primarily due to higher stock-based compensation and other payroll-related expense, partially offset by lower fees paid for consulting services, which had supplemented our technical support and professional services teams. We incurred a $311,000 restructuring charge in 2017 due to a reduction in workforce, which was $130,000 higher than our restructuring charge in 2016, to align our cost structure with our revenue growth.
Comparison of 2016 and 2015
Total cost of revenue increased $2.4 million, or 8%, in 2016 compared to 2015. Perpetual license cost of revenue decreased $223,000, or 8%, primarily due to a decrease in royalty expense and intangible assets amortization, partially offset by costs associated with a modest increase in sales of our hardware appliances. Subscription cost of revenue increased $1.1 million, or 16%, due to an increase in data center operations and Global Customer Success organization expenses. Software support and services cost of revenue increased $1.3 million, or 7%, primarily due to an increase in Global Customer Success organization expense. Global Customer Success and data center operations expenses increased as a result of increases in payroll-related expense as we increased headcount, professional services expense to supplement our Global Customer Success team, and facilities and infrastructure expense. The $181,000 restructuring charge in 2016 resulted from workforce reductions designed to align our spending with our expected growth rate. Our gross margin in 2016 was approximately flat compared to 2015.
57
Operating Expenses
|
|
|
For the year ended December 31, |
|
Change |
|
||||||||||||||||||||||
|
|
|
2017 |
|
2016 |
|
|
2015 |
|
2017 vs 2016 |
|
2016 vs 2015 |
|
|||||||||||||||
|
|
|
|
|
|
% of |
|
|
|
|
% of |
|
|
|
|
|
% of |
|
|
|
|
|
|
|
|
|
|
|
|
(in thousands, |
|
|
|
|
Total |
|
|
|
|
Total |
|
|
|
|
|
Total |
|
|
|
|
|
|
|
|
|
|
|
|
except percentages) |
|
Amount |
|
Revenue |
|
Amount |
|
Revenue |
|
|
Amount |
|
Revenue |
|
Amount |
|
% |
|
Amount |
|
% |
|
|||||
|
Operating expenses: |
|
|
|
|
|
|
|
|
|
|
|
|
|
|
|
|
|
|
|
|
|
|
|
|
|
|
|
|
Research and development |
|
$ |
75,350 |
|
43 |
% |
$ |
67,398 |
|
41 |
% |
|
$ |
61,871 |
|
41 |
% |
$ |
7,952 |
|
12 |
% |
$ |
5,527 |
|
9 |
% |
|
Sales and marketing |
|
|
96,477 |
|
54 |
% |
|
101,757 |
|
62 |
% |
|
|
105,520 |
|
71 |
% |
|
(5,280) |
|
(5) |
% |
|
(3,763) |
|
(4) |
% |
|
General and administrative |
|
|
28,091 |
|
16 |
% |
|
29,695 |
|
18 |
% |
|
|
36,037 |
|
24 |
% |
|
(1,604) |
|
(5) |
% |
|
(6,342) |
|
(18) |
% |
|
Litigation settlement charge |
|
|
1,143 |
|
1 |
% |
|
— |
|
— |
% |
|
|
— |
|
— |
% |
|
1,143 |
|
NM |
% |
|
— |
|
NM |
% |
|
Restructuring charge |
|
|
1,038 |
|
— |
% |
|
871 |
|
1 |
% |
|
|
1,049 |
|
1 |
% |
|
167 |
|
19 |
% |
|
(178) |
|
(17) |
% |
|
Total operating expenses |
|
$ |
202,099 |
|
113 |
% |
$ |
199,721 |
|
122 |
% |
|
$ |
204,477 |
|
137 |
% |
$ |
2,378 |
|
1 |
% |
$ |
(4,756) |
|
(2) |
% |
Comparison of 2017 and 2016
Research and development expense increased $8.0 million, or 12%, in 2017 compared to 2016 primarily due to an increase in personnel costs of $5.0 million, facilities and infrastructure expense of $2.1 million, and professional services expense of $650,000. Stock-based compensation expense, part of personnel costs, increased by $2.8 million primarily because of higher expense associated with restricted stock unit grants and our stock-settled bonus plan, partially offset by lower stock option and ESPP expense. The remainder of the increase in personnel costs was due primarily to increased headcount. Facilities and infrastructure expense increased due to an investment in our IT infrastructure, office move costs including exit costs accrued for a Bangalore office, depreciation on equipment purchases, rent, and other infrastructure and costs to support higher headcount. We incurred additional professional services expense to supplement our development work and improve processes.
Sales and marketing expense decreased $5.3 million, or 5%, in 2017 compared to 2016. Personnel costs decreased by $3.7 million. Within personnel costs, stock-based compensation expense and other payroll-related expense decreased $1.8 million and $1.9 million, respectively, in 2017 compared to 2016. The stock-based compensation expense decrease was driven by lower expense associated with restricted stock unit grants, stock options, and ESPP. A more measured approach to hiring and replacing personnel, which accounted for a decrease in headcount, was the primary reason for the decrease in other payroll-related expenses. Outside professional services fees decreased $1.4 million due to lower costs associated with contractors who supplemented our sales team, expense associated with security initiatives, and recruiting expense. Travel-related expense decreased $952,000 due to lower sales headcount and continued cost control. Those expense decreases were partially offset by a $542,000 increase in facilities and infrastructure expense due to an investment in our IT infrastructure, office move expenses, software subscription costs, and rent.
General and administrative expense decreased $1.6 million, or 5%, in 2017 compared to 2016 primarily due to a $2.7 million decrease in personnel costs but partially offset by an $803,000 increase in facilities and infrastructure costs. The decrease in personnel costs includes a decrease in stock-based compensation expense of $2.4 million, which was driven primarily by lower stock option grant expense due to terminations but partially offset by higher restricted stock unit expense due to new grants. Other personnel-related expense decreased $284,000 due to a change in the mix of general and administrative personnel. Litigation legal fees decreased $922,000 as the shareholder lawsuit settled but this was offset by a $1.1 million increase in accounting and consulting fees associated with implementation of the new revenue recognition accounting standard. Facilities and infrastructure expense increased $803,000 due to an investment in our IT infrastructure, office move expense, software subscriptions and other support expenses.
We recorded a litigation settlement charge of $1.1 million for expense associated with the settlement of our shareholder litigation which received final court approval in 2017.
58
We incurred a $1.0 million restructuring charge in 2017 due to a reduction in force, which was $167,000 higher than our restructuring charge in 2016. The restructuring charges resulted from workforce reductions and a building exit, which were designed to align our spending with our revenue growth rate and company initiatives.
Comparison of 2016 and 2015
Research and development expense increased $5.5 million, or 9%, in 2016 compared to 2015, primarily due to an increase in personnel costs of $2.6 million as we increased our development headcount to support continued investment in our product and service offerings. This includes an increase in stock-based compensation expense of $1.1 million, which was driven primarily by our stock-settled bonus program and restricted stock unit grants, partially offset by declining expense from stock options. Facilities and other infrastructure expense increased by $2.3 million to support the increased headcount in research and development and also reflects office rent increases in the U.S. and India. Professional fees increased by $442,000 to support product development initiatives.
Sales and marketing expense decreased $3.8 million, or 4%, in 2016 compared to 2015, primarily due to decreases in personnel costs of $3.0 million. Personnel costs decreased due to a decrease in payroll and payroll related expenses of $3.9 million, off-set by an increase of $966,000 for stock-based compensation expense, driven primarily by restricted stock unit grants and our stock-settled bonus program, partially offset by declining expense from stock options. The headcount reduction completed in the third quarter of 2015, a more measured approach to hiring and replacing personnel since then, and a reduction in medical benefit costs were the primary reasons for the personnel costs decrease. Travel-related expense decreased $2.1 million, due to cost reduction initiatives implemented in the third quarter of 2015 that we sustained through 2016. The decrease in payroll-related and travel expenses was partially offset by an increase in professional fees of $827,000 to support sales and marketing and an increase in third-party marketing-related expense of $530,000 as we devoted more resources to field marketing programs and events.
General and administrative expense decreased $6.3 million, or 18%, in 2016 compared to 2015, primarily due to a $9.7 million decrease in litigation legal fees due to our settlement of patent litigation in 2015, partially offset by an increase in personnel costs of $3.5 million. The increase in personnel costs includes an increase in stock-based compensation expense of $3.3 million, which was driven primarily by our stock-settled bonus program and restricted stock unit grants. In addition, professional fees decreased $649,000 due to lower recruiting expense, and facilities and infrastructure expenses increased by $302,000.
Restructuring charges were $1.1 million in 2016 ($181,000 in cost of revenue and $871,000 in operating expenses) and $1.0 million in 2015. The restructuring charges resulted from workforce reductions designed to align our spending with our expected growth rate.
Other Income (Expense)—Net
|
|
|
For the year ended December 31, |
|
Change |
|
|||||||||||||||
|
(in thousands, |
|
|
|
|
|
|
|
|
|
|
2017 vs 2016 |
|
2016 vs 2015 |
|
||||||
|
except percentages) |
|
2017 |
|
2016 |
|
2015 |
|
Amount |
|
% |
|
Amount |
|
% |
|
|||||
|
Other income (expense)—net |
|
$ |
988 |
|
$ |
145 |
|
$ |
(274) |
|
$ |
843 |
|
581 |
% |
$ |
419 |
|
NM |
% |
Other income (expense)—net was primarily comprised of interest income and gains or losses from foreign currency transactions and the translation of foreign-denominated balances to the U.S. dollar. Interest income was $716,000, $454,000 and $238,000 in 2017, 2016 and 2015, respectively. We recorded a foreign currency gain of $242,000 in 2017 and foreign exchange losses of $339,000 and $518,000 in 2016 and 2015, respectively. Interest income has increased due to a general rise in interest rates. The strengthening of foreign currencies, in particular the Euro, relative to the U.S dollar resulted in gains on cash and accounts receivable denominated in foreign currencies in 2017.
59
Income Tax Expense
|
|
|
For the year ended December 31, |
|
Change |
|
|||||||||||||||
|
(in thousands, |
|
|
|
|
|
|
|
|
|
|
2017 vs 2016 |
|
2016 vs 2015 |
|
||||||
|
except percentages) |
|
2017 |
|
2016 |
|
2015 |
|
Amount |
|
% |
|
Amount |
|
% |
|
|||||
|
Income tax expense |
|
$ |
1,142 |
|
$ |
982 |
|
$ |
852 |
|
$ |
160 |
|
16 |
% |
$ |
130 |
|
15 |
% |
Income tax expense was $1.1 million, $982,000 and $852,000 in 2017, 2016 and 2015, respectively. The increase in income tax expense was due to an increase in foreign income taxes on profits realized by our foreign subsidiaries as we expanded internationally, most significantly in India. We have a full valuation allowance on our deferred tax assets.
Quarterly Results of Operations
The following table presents our operating results for each of the eight fiscal quarters in the period ended December 31, 2017. The information for each of these quarters is derived from our unaudited interim financial statements and should be read in conjunction with our audited consolidated financial statements included in this Annual Report. In our opinion, all necessary adjustments, which consist only of normal and recurring accruals, have been included to fairly present our unaudited quarterly results. These quarterly operating results are not necessarily indicative of our operating results for any future period.
We do not believe that inflation had a material effect on our business, financial condition or results of operations in the last three fiscal years. If our costs were to become subject to significant inflationary pressures, we may not be able to fully offset such higher costs through price increases. Our inability or failure to do so could harm our business, financial condition and results of operations.
|
|
|
Three Months Ended |
|
||||||||||||||||||||||
|
(in thousands, except share and per share data) |
|
December |
|
September |
|
June 30, |
|
March 31, |
|
December |
|
September |
|
June 30, |
|
March 31, |
|
||||||||
|
Revenue |
|
|
|
|
|
|
|
|
|
|
|
|
|
|
|
|
|
|
|
|
|
|
|
|
|
|
Perpetual license |
|
$ |
12,593 |
|
$ |
8,986 |
|
$ |
9,704 |
|
$ |
9,882 |
|
$ |
14,313 |
|
$ |
11,311 |
|
$ |
9,783 |
|
$ |
10,368 |
|
|
Subscription |
|
|
19,038 |
|
|
17,277 |
|
|
17,248 |
|
|
16,907 |
|
|
16,361 |
|
|
15,570 |
|
|
14,803 |
|
|
14,623 |
|
|
Software support and services |
|
|
17,200 |
|
|
16,457 |
|
|
15,700 |
|
|
15,499 |
|
|
14,798 |
|
|
14,685 |
|
|
14,295 |
|
|
13,016 |
|
|
Total revenue(1) |
|
|
48,831 |
|
|
42,720 |
|
|
42,652 |
|
|
42,288 |
|
|
45,472 |
|
|
41,566 |
|
|
38,881 |
|
|
38,007 |
|
|
Cost of revenue |
|
|
|
|
|
|
|
|
|
|
|
|
|
|
|
|
|
|
|
|
|
|
|
|
|
|
Perpetual license |
|
|
411 |
|
|
606 |
|
|
453 |
|
|
399 |
|
|
518 |
|
|
652 |
|
|
629 |
|
|
859 |
|
|
Subscription |
|
|
2,285 |
|
|
2,266 |
|
|
2,182 |
|
|
1,893 |
|
|
2,113 |
|
|
2,202 |
|
|
2,199 |
|
|
1,783 |
|
|
Software support and services |
|
|
4,522 |
|
|
4,835 |
|
|
5,396 |
|
|
4,978 |
|
|
4,721 |
|
|
4,774 |
|
|
5,289 |
|
|
4,628 |
|
|
Restructuring charges |
|
|
— |
|
|
311 |
|
|
— |
|
|
— |
|
|
— |
|
|
181 |
|
|
— |
|
|
— |
|
|
Total cost of revenue(1) |
|
|
7,218 |
|
|
8,018 |
|
|
8,031 |
|
|
7,270 |
|
|
7,352 |
|
|
7,809 |
|
|
8,117 |
|
|
7,270 |
|
|
Gross profit |
|
|
41,613 |
|
|
34,702 |
|
|
34,621 |
|
|
35,018 |
|
|
38,120 |
|
|
33,757 |
|
|
30,764 |
|
|
30,737 |
|
|
Operating expenses |
|
|
|
|
|
|
|
|
|
|
|
|
|
|
|
|
|
|
|
|
|
|
|
|
|
|
Research and development(1) |
|
|
18,910 |
|
|
19,581 |
|
|
19,666 |
|
|
17,193 |
|
|
16,213 |
|
|
16,238 |
|
|
18,019 |
|
|
16,927 |
|
|
Sales and marketing(1) |
|
|
23,184 |
|
|
24,317 |
|
|
25,674 |
|
|
23,302 |
|
|
24,843 |
|
|
24,001 |
|
|
27,246 |
|
|
25,668 |
|
|
General and administrative(1) |
|
|
6,853 |
|
|
7,210 |
|
|
7,840 |
|
|
6,188 |
|
|
6,921 |
|
|
6,961 |
|
|
8,265 |
|
|
7,548 |
|
|
Litigation settlement charge |
|
|
— |
|
|
— |
|
|
— |
|
|
1,143 |
|
|
|
|
|
|
|
|
|
|
|
|
|
|
Restructuring charges |
|
|
549 |
|
|
489 |
|
|
— |
|
|
— |
|
|
— |
|
|
871 |
|
|
— |
|
|
— |
|
|
Total operating expenses |
|
|
49,496 |
|
|
51,597 |
|
|
53,180 |
|
|
47,826 |
|
|
47,977 |
|
|
48,071 |
|
|
53,530 |
|
|
50,143 |
|
|
Operating loss |
|
|
(7,883) |
|
|
(16,895) |
|
|
(18,559) |
|
|
(12,808) |
|
|
(9,857) |
|
|
(14,314) |
|
|
(22,766) |
|
|
(19,406) |
|
|
Other income (expense) - net |
|
|
287 |
|
|
188 |
|
|
339 |
|
|
174 |
|
|
(39) |
|
|
19 |
|
|
30 |
|
|
135 |
|
|
Loss before income taxes |
|
|
(7,596) |
|
|
(16,707) |
|
|
(18,220) |
|
|
(12,634) |
|
|
(9,896) |
|
|
(14,295) |
|
|
(22,736) |
|
|
(19,271) |
|
|
Income tax expense |
|
|
261 |
|
|
358 |
|
|
324 |
|
|
199 |
|
|
310 |
|
|
298 |
|
|
198 |
|
|
176 |
|
|
Net loss |
|
$ |
(7,857) |
|
$ |
(17,065) |
|
$ |
(18,544) |
|
$ |
(12,833) |
|
$ |
(10,206) |
|
$ |
(14,593) |
|
$ |
(22,934) |
|
$ |
(19,447) |
|
|
Net loss per share, basic and diluted |
|
$ |
(0.08) |
|
$ |
(0.18) |
|
$ |
(0.20) |
|
$ |
(0.14) |
|
$ |
(0.12) |
|
$ |
(0.17) |
|
$ |
(0.27) |
|
$ |
(0.23) |
|
|
Weighted-average shares used to compute net loss per share, basic and diluted |
|
|
96,574 |
|
|
95,024 |
|
|
92,963 |
|
|
90,439 |
|
|
88,335 |
|
|
86,713 |
|
|
85,317 |
|
|
82,977 |
|
60
|
(1) |
Amounts include stock-based compensation expense as follows: |
|
|
|
Three Months Ended |
||||||||||||||||||||||
|
(in thousands) |
|
December 31, 2017 |
|
September 30, 2017 |
|
June 30, 2017 |
|
March 31, 2017 |
|
December 31, 2016 |
|
September 30, 2016 |
|
June 30, 2016 |
|
March 31, 2016 |
||||||||
|
Stock-Based Compensation Expense: |
|
|
|
|
|
|
|
|
|
|
|
|
|
|
|
|
|
|
|
|
|
|
|
|
|
Cost of revenue |
|
$ |
913 |
|
$ |
932 |
|
$ |
1,226 |
|
$ |
701 |
|
$ |
851 |
|
$ |
747 |
|
$ |
1,055 |
|
$ |
390 |
|
Research and development |
|
|
3,474 |
|
|
3,914 |
|
|
4,366 |
|
|
2,766 |
|
|
2,606 |
|
|
2,709 |
|
|
3,812 |
|
|
2,601 |
|
Sales and marketing |
|
|
2,047 |
|
|
2,258 |
|
|
2,582 |
|
|
1,772 |
|
|
2,056 |
|
|
2,307 |
|
|
2,992 |
|
|
3,119 |
|
General and administrative |
|
|
1,048 |
|
|
1,974 |
|
|
2,450 |
|
|
1,308 |
|
|
2,210 |
|
|
2,109 |
|
|
2,686 |
|
|
2,139 |
|
Total stock-based compensation expense |
|
$ |
7,482 |
|
$ |
9,078 |
|
$ |
10,624 |
|
$ |
6,547 |
|
$ |
7,723 |
|
$ |
7,872 |
|
$ |
10,545 |
|
$ |
8,249 |
Seasonality
There are seasonal factors that may cause us to record higher revenue in some quarters compared to others. We believe this variability is largely due to our customers’ budgetary and spending patterns, as many customers spend the unused portions of their discretionary budgets prior to the end of their fiscal years. For example, we have historically recorded our highest level of revenue in our fourth quarter, which we believe corresponds to the fourth quarter of a majority of our customers.
Liquidity and Capital Resources
|
|
|
As of December 31, |
|||||||
|
(in thousands) |
|
2017 |
|
2016 |
|
2015 |
|||
|
Cash and cash equivalents |
|
$ |
85,833 |
|
$ |
54,043 |
|
$ |
47,234 |
|
Short term-investments |
|
|
6,797 |
|
|
36,184 |
|
|
49,576 |
|
Long-term investments |
|
|
— |
|
|
— |
|
|
2,094 |
|
Total cash, cash equivalents and investments |
|
$ |
92,630 |
|
$ |
90,227 |
|
$ |
98,904 |
|
|
|
|
|
|
|
|
|
|
|
|
Change |
|
|||||||||
|
|
|
For the year Ended December 31, |
|
2017 vs 2016 |
|
|
2016 vs 2015 |
|
|||||||||||||
|
(in thousands, except percentages) |
|
2017 |
|
2016 |
|
2015 |
|
Amount |
|
% |
|
|
Amount |
|
% |
|
|||||
|
Net cash provided by (used in) operating activities |
|
$ |
3,036 |
|
$ |
(11,729) |
|
$ |
(48,535) |
|
$ |
14,765 |
|
(126) |
% |
|
$ |
36,806 |
|
(76) |
% |
|
Net cash provided by (used in) investing activities |
|
|
22,991 |
|
|
12,567 |
|
|
(19,679) |
|
|
10,424 |
|
83 |
% |
|
|
32,246 |
|
(164) |
% |
|
Net cash provided by financing activities |
|
$ |
5,763 |
|
$ |
5,971 |
|
$ |
11,161 |
|
$ |
(208) |
|
(3) |
% |
|
$ |
(5,190) |
|
(47) |
% |
At December 31, 2017, we had cash and cash equivalents of $85.8 million, the significant majority of which are held in the United States. At December 31, 2017, we had short-term investments of $6.8 million. In 2017, we purchased $8.6 million of investment securities and received $38.0 million from maturities of investment securities.
In addition, we have a revolving line of credit with a financial institution with potential borrowing capacity of approximately $15.5 million that expires in June 2018. We are required to maintain an adjusted quick ratio (defined as the ratio of current assets to current liabilities minus deferred revenue) of at least 1.25. As of December 31, 2017, we had no borrowings outstanding under this revolving loan facility and we were in compliance with our loan covenants.
In June 2014, we raised, net of offering costs, $102.9 million in our initial public offering. We believe that our existing cash and cash equivalents will be sufficient to meet our anticipated cash needs for at least the next 12 months. Our future capital requirements will depend on many factors including our growth rate, the timing and extent of spending to support development efforts, the expansion of sales and marketing activities, the introduction of new and enhanced products and services offerings, the continuing market acceptance of our products, any future acquisition and similar transactions and the proportion of our perpetual versus subscription sales. In the event that additional financing is
61
required from outside sources, we may not be able to raise it on terms acceptable to us or at all. If we are unable to raise additional capital when desired, our business, operating results and financial condition may be adversely affected.
Cash Provided by (Used in) Operating Activities
Our primary source of cash from operating activities has been from cash collections from our customers. We expect cash inflows from operating activities to be affected by increases in sales and the timing of collections. Our primary use of cash from operating activities has been for personnel costs. We expect cash outflows from operating activities to be affected by increases in personnel costs as we grow our business.
In 2017, we generated $3.0 million of cash from operating activities compared to a use of $11.7 million of cash from operating activities in 2016. We incurred a net loss of $56.3 million in 2017 compared to a net loss of $67.2 million in 2016 as we increased our revenue by 8% and only slightly increased our operating expenses. The net loss included non-cash charges of $37.7 million, primarily due to stock-based compensation and depreciation expense, compared to $38.5 million in 2016. Changes in operating assets and liabilities, as sources of cash, consisted of a $24.4 million increase in deferred revenue and a $2.0 million increase in accrued expenses and other long-term liabilities that were partially offset by an increase in accounts receivable of $4.6 million.
In 2016, we used $11.7 million of cash in operating activities primarily as a result of the net loss incurred in the year. While we increased our spending in research and development, we reduced spending in general and administrative and sales and marketing compared to 2015 in an effort to align our expenses with our revenue. Our net loss decreased from $84.5 million in 2015 to $67.2 million in 2016 as we decreased our operating expenses 2% to $199.7 million and increased our cost of revenue 8% to $30.5 million while increasing our revenue 10% to $163.9 million. The net loss included non-cash charges of $38.5 million, primarily due to stock-based compensation and depreciation expense, compared to $32.9 million in 2015. Changes in operating assets and liabilities, as sources of cash, consisted of an $18.2 million increase in deferred revenue that was partially offset by an increase in accounts receivable of $1.2 million.
In 2015, we used $48.5 million of cash in operating activities primarily as a result of addition of headcount in research and development, customer success, data center operations, investment in marketing programs, increase of our general and administrative headcount and litigation legal expense. We incurred a net loss of $84.5 million in 2015 as we increased our operating expenses 21% to $204.5 million and increased our cost of revenue 17% to $28.2 million. The net loss included non-cash charges of $32.9 million, primarily due to stock-based compensation, depreciation and intangible asset amortization expense. Changes in operating assets and liabilities, net of acquisitions, as sources of cash, consisted of a $15.7 million favorable increase in deferred revenue that was partially offset by an increase in accounts receivable of $8.1 million, a $5.0 million unfavorable change in accounts payable, accrued expenses and other long-term liabilities and an increase in other current and noncurrent assets of $932,000.
Cash Provided by (Used in) Investing Activities
Our investing activities have consisted of the purchase and maturities of investment securities and purchases of property and equipment. We expect to continue to make such purchases to support the growth of our business.
Cash provided by investing activities was $23.0 million in 2017. We received $38.0 million from maturities of investment securities and invested $8.6 million in new investment securities. Cash paid for the purchase of property and equipment was $6.5 million in 2017 as we continued to upgrade our network and data centers, equipped new headquarters and India office facilities, and implemented or enhanced systems associated with our quote-to-cash process.
Cash provided by investing activities of $12.6 million in 2016 consisted of $94.6 million received from maturities of investment securities that was partially offset by of our purchase of $79.1 million of short-term investments. In addition, we purchased $2.9 million of property and equipment. We purchased equipment to expand, refresh and improve our infrastructure, to support growth, and to outfit new office facilities.
Cash used in investing activities was $19.7 million 2015. In 2015, we purchased $60.9 million of short and long-term investments, partially offset by $45.0 million received from maturities of investment securities. In addition, we purchased $3.7 million of property and equipment. We purchased equipment to expand our data centers and infrastructure to support growth and to outfit new office facilities.
62
Cash Provided by Financing Activities
Our financing activities have consisted of proceeds from the exercise of stock options and contributions to our ESPP.
In 2017, our financing activities provided $5.8 million of cash. We received $4.1 million from the exercise of stock options and $4.8 million from ESPP contributions. We used $3.1 million to pay employee payroll taxes as part of the net settlement of our stock-settled bonuses.
In 2016, our financing activities provided $6.0 million of cash. We received $4.3 million from employees who participated in our ESPP and $1.6 million from the exercise of stock options.
In 2015, our financing activities provided $11.2 million of cash. We received $5.4 million from employees who participated in our ESPP and $5.8 million from the exercise of stock options.
Contractual Obligations and Commitments
The following table summarizes our contractual commitments and obligations as of December 31, 2017:
|
|
|
|
|
|
Less Than 1 |
|
|
|
|
|
|
|
More Than 5 |
|
||
|
(In thousands) |
|
Total |
|
year |
|
1-3 years |
|
3-5 years |
|
years |
|
|||||
|
Operating lease obligations |
|
$ |
28,189 |
|
$ |
7,195 |
|
$ |
12,675 |
|
$ |
7,156 |
|
$ |
1,163 |
|
|
Purchase obligations |
|
|
4,046 |
|
|
4,046 |
|
|
— |
|
|
— |
|
|
— |
|
|
Total |
|
$ |
32,235 |
|
$ |
11,241 |
|
$ |
12,675 |
|
$ |
7,156 |
|
$ |
1,163 |
|
We lease our office facilities under noncancelable operating lease agreements expiring between 2018 and 2023.
As of December 31, 2017, our net unrecognized tax benefits including interest and penalties were $6.8 million, $6.7 million of which are netted against deferred tax assets. At this time, we are unable to make a reasonably reliable estimate of the timing of payments in individual years in connection with these tax liabilities; therefore, such amounts are not included in the above contractual obligation table.
Off-Balance-Sheet Arrangements
Through December 31, 2017, we have no off-balance sheet arrangements as defined in Item 303(a)(4) of Regulation S-K.
Segment Information
We have one primary business activity and operate in one reportable segment.
Concentration
In 2017, AT&T accounted for approximately 15% of our revenue (including 1% as an end customer). In 2016, AT&T accounted for approximately 16% of our revenue (including 1% as an end customer). Our agreements with this reseller were made in the ordinary course of our business and may be terminated with or without cause by either party with advance notice. Although we believe we would experience some short term disruption in the distribution of our products, subscriptions and services if these agreements were terminated, we believe such termination would not have a material adverse effect on our financial results and alternative resellers and other channel partners exist to deliver our products to our end customers.
Critical Accounting Policies and Estimates
Our consolidated financial statements have been prepared in accordance with U.S. generally accepted accounting principles. The preparation of these consolidated financial statements requires us to make estimates and assumptions that affect the reported amounts of assets, liabilities, revenue, expenses and related disclosures. We base our estimates on
63
historical experience and on various other assumptions that we believe are reasonable under the circumstances. We evaluate our estimates and assumptions on an ongoing basis. Actual results may differ from these estimates. To the extent that there are material differences between these estimates and our actual results, our future financial statements will be affected.
The critical accounting policies requiring estimates, assumption and judgments that we believe have the most significant impact on our consolidated financial statements as described below. Our senior management has discussed the development, selection and disclosure of these estimates, assumptions and judgments with our audit committee. For further information on all of our significant accounting policies, see Note 1 entitled “Description of Business and Significant Accounting Policies” in Part II, Item 8 “Financial Statements and Supplementary Data” of this Annual Report on Form 10-K.
Revenue Recognition
We derive revenue principally from software-related arrangements consisting of perpetual software licenses, post-contract customer support for such licenses, or PCS or software support, including when and if available updates, and professional services such as consulting and training services. We also offer our software as term-based licenses and cloud-based arrangements. In addition, we install our software on servers that we ship to customers.
We consider the following to be key accounting policy elections and estimates in our revenue recognition:
|
(i) |
Determining VSOE of fair value and best estimate of selling price, or BESP, of fair value used to allocate revenue between the elements of multiple elements arrangements requires significant judgment. As of January 1, 2013, we determined that we had sufficient history to establish VSOE of fair value for PCS and professional services. Prior to January 1, 2013, we did not have VSOE of fair value for our software-related undelivered elements due to a limited history of stand-alone sales transactions and inconsistency in pricing. We established VSOE of fair value when we had a substantial majority of stand-alone sales transactions of software support and services pricing within a narrow pricing band. In our VSOE analysis, we generally include stand-alone sales transactions completed during a rolling 12 month period unless a shorter period is appropriate due to changes in our pricing structure. Because we did not achieve pricing consistency for our products, including product subscription and cloud-based services, we use the residual method to allocate revenue in multiple element arrangement within scope of ASC 985-605 Software Revenue Recognition and BESP to allocate the revenue in multiple element arrangement within scope of ASC 605 Revenue recognition; |
|
(ii) |
Determining whether collection of customer receivables is probable may require significant judgment. We assess collection on customer-by-customer and deal-by-deal basis and assess such factors as history of payments, financial condition, and payment terms; |
|
(iii) |
Generally, sales made through resellers are fulfilled to the end customer and processed in the same period. Inventory of the licenses held by the resellers was immaterial for all periods presented; |
|
(iv) |
We consider our resellers our customers and recognize revenue based on the price charged to resellers; and |
|
(v) |
Sales commissions and other incremental costs to acquire contracts are expensed as incurred and are recorded in sales and marketing expense. |
The new revenue recognition standard will have a material impact on our revenue and commission accounting. See Note 1 – Accounting Policies in the Notes to Financial Statements (Part II, Item 8 of this Form 10-K) for further discussion.
Goodwill and Intangible Assets with Indefinite Lives
We record the excess of the acquisition purchase price over the fair value of the tangible and identifiable intangible assets acquired as goodwill. We perform an impairment test of our goodwill in the third quarter of our fiscal
64
year, or more frequently if indicators of potential impairment arise. We have a single reporting unit and consequently evaluate goodwill for impairment based on an evaluation of the fair value of the Company as a whole. We record purchased intangible assets at their respective estimated fair values at the date of acquisition. Purchased intangible assets are being amortized using the straight-line method over their remaining estimated useful lives, which range from three to five years. We evaluate the remaining useful lives of intangible assets on a periodic basis to determine whether events or circumstances warrant a revision to the remaining estimated amortization period. We evaluated our goodwill for impairment in 2017 and 2016 and observed no impairment indicators.
Stock-Based Compensation
Stock-based compensation costs related to restricted stock and stock options granted to employees are measured at the date of grant based on the estimated fair value of the award, net of estimated forfeitures. We estimate the grant date fair value, and the resulting stock-based compensation expense, using the Black-Scholes option-pricing model. We recognize compensation costs for awards with service and performance vesting conditions on an accelerated method under the graded vesting method over the requisite service period of the award. For stock awards with no performance condition, we recognize compensation costs on a straight-line basis over the requisite service period of the award, which is generally the vesting term of four years.
Key assumptions used in determining the fair value of our stock option grants are estimated as follows:
|
· |
Risk-Free Interest Rate. We base the risk-free interest rate used in the Black-Scholes valuation model on the implied yield available on U.S. Treasury zero-coupon issues with a term equivalent to the options for each option group. |
|
· |
Expected Term. The expected term represents the period that our stock-based awards are expected to be outstanding. We have opted to use the simplified method for estimating the expected term, which calculates the expected term as the average time-to-vesting and the contractual life of the options. |
|
· |
Volatility. When we did not have a sufficient trading history for our common stock, the expected stock price volatility assumption was determined by examining the historical volatilities of a group of industry peers. As more historical data for our common stock became available, we began to use our own historical stock price volatility to determine expected stock price volatility. |
|
· |
Dividend Yield. The expected dividend assumption is based on our current expectations about our dividend policy. We currently do not expect to issue any dividends. |
|
· |
Forfeiture Rate. The forfeiture rate is calculated based on expected employee turnover. We have applied the same forfeiture rate to our entire employee population. |
The fair value of the employee stock options was estimated using the following assumptions for the periods presented:
|
|
|
Year ended December 31, |
||||
|
|
|
2017 |
|
2016 |
|
2015 |
|
Expected dividend yield |
|
— |
|
— |
|
— |
|
Risk-free interest rate |
|
2.1% |
|
1.4% - 1.5% |
|
1.6% - 1.8% |
|
Expected volatility |
|
40% |
|
42% |
|
43% - 45% |
|
Expected life (in years) |
|
6.1 |
|
6.1 |
|
5.5 - 6.1 |
65
The fair value of the rights to acquire stock under our ESPP was estimated using the following assumptions for the periods presented:
|
|
|
Year ended December 31, |
||||
|
|
|
2017 |
|
2016 |
|
2015 |
|
Expected dividend yield |
|
— |
|
— |
|
— |
|
Risk-free interest rate |
|
0.9% - 1.3% |
|
0.5% - 0.7% |
|
0.1% - 0.7% |
|
Expected volatility |
|
34% - 54% |
|
34% - 41% |
|
34% - 35% |
|
Expected life (in years) |
|
0.5 - 2.0 |
|
0.5 - 2.0 |
|
0.5 - 2.0 |
We estimate the fair value of the rights to acquire stock under our ESPP using the Black-Scholes option pricing formula. Our ESPP typically provides for consecutive 24 month offering periods, consisting of four tranches. We recognize compensation expense on an accelerated-graded basis over the employee’s requisite service period. We account for the fair value of restricted stock units, or RSUs, using the closing market price of our common stock on the date of grant. RSUs typically vest ratably on a quarterly basis over one to four years.
Stock-based compensation expense associated with our stock-settled bonus program is recognized on a straight-line basis over the required service period and the expense is evaluated each quarter based on our company’s performance relative to the metrics that determine the bonus pool.
In 2017, 2016 and 2015, stock-based compensation expense was $33.7 million, $34.4 million and $28.8 million, respectively. As of December 31, 2017, we had approximately $44.9 million of total unrecognized stock-based compensation expense, net of related forfeiture estimates.
Income Taxes
We account for income taxes in accordance with ASC Topic 740, Income Taxes, under which deferred tax liabilities and assets are recognized for the expected future tax consequences of temporary differences between financial statement carrying amounts and the tax basis of assets and liabilities and net operating loss and tax credit carryforwards. Valuation allowances are established when necessary to reduce deferred tax assets to the amount expected to be realized.
We currently have a full valuation allowance against our U.S. net deferred tax assets of $99.7 million as of December 31, 2017. We continue to monitor the relative weight of positive and negative evidence of future profitability in relevant jurisdictions. When evidence indicating that it becomes more likely than not that the tax asset may be utilized, the allowance will be released.
Because we have a full valuation allowance against our U.S. net deferred tax assets, the Tax Cuts and Jobs Act of 2017, or Tax Act, will not materially impact our balance sheet or statement of operations. See Note 15 – Income Taxes in the Notes to Financial Statements (Part II, Item 8 of this Form 10-K) for the Tax Act’s impact to our net deferred tax assets.
Recent Accounting Pronouncements
For discussion on recent accounting pronouncements, see “Summary of Significant Accounting Policies” under Note 1 “Description of Business and Significant Accounting Policies” included in Item 8, “Financial Statements and Supplementary Data” of Part II of this Annual Report on Form 10-K.
Item 7A. Quantitative and Qualitative Disclosures about Market Risk
Foreign Currency Exchange Risk
Our sales contracts are currently primarily denominated in U.S. dollars. A portion of our operating expenses are incurred outside the United States and are denominated in foreign currencies and are subject to fluctuations due to changes in foreign currency exchange rates, particularly changes in the British Pound, Indian Rupee and Euro. In 2015 and 2016, our operating expenses benefitted from the increase in the value of the U.S. dollar versus the Euro and other
66
foreign currencies while in 2017, our operating expenses increased as a result of the appreciation of foreign currencies versus the U.S. dollar. Approximately 23% of our 2017 expenses were denominated in foreign currencies. If, in 2018 or future years, the U.S. dollar continues to decline in value versus the Euro, British Pound, Indian Rupee or other currencies, our operating expenses will increase. The effect of a hypothetical 10% change in foreign currency exchange rates applicable to our business would have a material impact on our consolidated financial statements. To date, we have not engaged in any hedging strategies. As our international operations grow or if we more frequently enter into sales contracts denominated in foreign currencies, we will reassess our approach to managing our risk related to fluctuations in currency rates.
Additionally, fluctuations in foreign currency exchange rates may cause us to recognize transaction gains and losses in our statement of operations. To date, foreign currency transaction gains and losses have not been material to our financial statements.
Interest Rate Risk
We had cash, cash equivalents and fixed income investments of $92.6 million and $90.2 million as of December 31, 2017 and 2016, respectively, consisting of bank deposits, money market funds, corporate debt securities, and commercial paper.
We do not enter into investments for trading or speculative purposes and have not used any derivative financial instruments to manage our interest rate risk exposure. By policy, we limit the amount of credit exposure to any one issuer and our investments are held with capital preservation as the primary objective.
Our cash equivalents and investments are subject to market risk due to changes in interest rates.
Due to increases in interest rates, we may suffer losses in principal if we are forced to sell securities that decline in market value due to changes in interest rates. However, because we classify our investments as “held-to-maturity”, no gains or losses are recognized due to changes in interest rates unless such securities are sold prior to maturity or declines in value are determined to be other-than-temporary. We believe that we do not have any material exposure to changes in the fair value of our investment portfolio as a result of changes in interest rates. Declines in interest rates, however, will reduce future investment income, if any. For instance the effect of a hypothetical 50 basis point increase or decrease in interest rates would result in a change of approximately $350,000 to our annual interest income.
67
Item 8. Financial Statements and Supplementary Data
The Selected Financial Data information contained in Item 6 of Part II hereof is hereby incorporated by reference into this Item 8 of Part II of this Form 10-K.
MobileIron, Inc.
Index to Consolidated Financial Statements
|
|
|
Page No. |
|
|
|
69 |
|
|
|
|
70 |
|
|
|
|
71 |
|
|
|
|
72 |
|
|
|
|
73 |
|
|
|
|
74 |
|
68
REPORT OF INDEPENDENT REGISTERED PUBLIC ACCOUNTING FIRM
To the stockholders and the Board of Directors of MobileIron, Inc.
Opinion on the Financial Statements
We have audited the accompanying consolidated balance sheets of MobileIron, Inc. and subsidiaries (the “Company”) as of December 31, 2017 and 2016, the related consolidated statements of operations, stockholders’ equity (deficit), and cash flows for each of the three years in the period ended December 31, 2017, and the related notes (collectively referred to as the "financial statements"). In our opinion, the financial statements present fairly, in all material respects, the financial position of the Company as of December 31, 2017 and 2016, and the results of its operations and its cash flows for each of the three years in the period ended December 31, 2017, in conformity with accounting principles generally accepted in the United States of America.
Basis for Opinion
These financial statements are the responsibility of the Company’s management. Our responsibility is to express an opinion on the Company’s financial statements based on our audits. We are a public accounting firm registered with the Public Company Accounting Oversight Board (United States) (PCAOB) and are required to be independent with respect to the Company in accordance with the U.S. federal securities laws and the applicable rules and regulations of the Securities and Exchange Commission and the PCAOB.
We conducted our audits in accordance with the standards of the PCAOB. Those standards require that we plan and perform the audit to obtain reasonable assurance about whether the financial statements are free of material misstatement, whether due to error or fraud. The Company is not required to have, nor were we engaged to perform, an audit of its internal control over financial reporting. As part of our audits, we are required to obtain an understanding of internal control over financial reporting but not for the purpose of expressing an opinion on the effectiveness of the Company’s internal control over financial reporting. Accordingly, we express no such opinion.
Our audits included performing procedures to assess the risks of material misstatement of the financial statements, whether due to error or fraud, and performing procedures that respond to those risks. Such procedures included examining, on a test basis, evidence regarding the amounts and disclosures in the financial statements. Our audits also included evaluating the accounting principles used and significant estimates made by management, as well as evaluating the overall presentation of the financial statements. We believe that our audits provide a reasonable basis for our opinion.
/s/ Deloitte & Touche LLP
San Jose, California
March 12, 2018
We have served as the Company’s auditors since 2011
69
MOBILEIRON, INC.
(In thousands, except share and per share data)
|
|
|
December 31, |
|
||||
|
|
|
2017 |
|
2016 |
|
||
|
ASSETS |
|
|
|
|
|
|
|
|
Current assets: |
|
|
|
|
|
|
|
|
Cash and cash equivalents |
|
$ |
85,833 |
|
$ |
54,043 |
|
|
Short-term investments |
|
|
6,797 |
|
|
36,184 |
|
|
Accounts receivable, net of allowance for doubtful accounts of $475 and $433 at December 31, 2017 and December 31, 2016, respectively |
|
|
48,171 |
|
|
43,755 |
|
|
Prepaid expenses and other current assets |
|
|
5,510 |
|
|
6,131 |
|
|
TOTAL CURRENT ASSETS |
|
|
146,311 |
|
|
140,113 |
|
|
Property and equipment—net |
|
|
8,812 |
|
|
5,503 |
|
|
Intangible assets—net |
|
|
100 |
|
|
645 |
|
|
Goodwill |
|
|
5,475 |
|
|
5,475 |
|
|
Other assets |
|
|
1,899 |
|
|
1,370 |
|
|
TOTAL ASSETS |
|
$ |
162,597 |
|
$ |
153,106 |
|
|
|
|
|
|
|
|
|
|
|
LIABILITIES AND STOCKHOLDERS’ EQUITY |
|
|
|
|
|
|
|
|
Current liabilities: |
|
|
|
|
|
|
|
|
Accounts payable |
|
$ |
1,369 |
|
$ |
701 |
|
|
Accrued expenses |
|
|
24,995 |
|
|
21,674 |
|
|
Deferred revenue-current |
|
|
84,467 |
|
|
68,153 |
|
|
TOTAL CURRENT LIABILITIES |
|
|
110,831 |
|
|
90,528 |
|
|
Long-term liabilities: |
|
|
|
|
|
|
|
|
Deferred revenue-noncurrent |
|
|
28,034 |
|
|
19,923 |
|
|
Other long-term liabilities |
|
|
1,881 |
|
|
1,838 |
|
|
TOTAL LIABILITIES |
|
|
140,746 |
|
|
112,289 |
|
|
|
|
|
|
|
|
|
|
|
Commitments and contingencies (Note 12) |
|
|
|
|
|
|
|
|
Stockholders’ equity: |
|
|
|
|
|
|
|
|
Common stock, $0.0001 par value, 300,000,000 shares authorized, 97,203,950 shares and 89,066,031 shares issued and outstanding at December 31, 2017 and December 31, 2016, respectively |
|
|
10 |
|
|
9 |
|
|
Additional paid-in capital |
|
|
420,525 |
|
|
383,193 |
|
|
Accumulated deficit |
|
|
(398,684) |
|
|
(342,385) |
|
|
TOTAL STOCKHOLDERS’ EQUITY |
|
|
21,851 |
|
|
40,817 |
|
|
TOTAL LIABILITIES AND STOCKHOLDERS’ EQUITY |
|
$ |
162,597 |
|
$ |
153,106 |
|
See accompanying notes to the consolidated financial statements
70
MOBILEIRON, INC.
CONSOLIDATED STATEMENTS OF OPERATIONS
(In thousands, except per share data)
|
|
|
|
|
|
|
||||
|
|
|
Year ended December 31, |
|||||||
|
|
|
2017 |
|
2016 |
|
2015 |
|||
|
Revenue |
|
|
|
|
|
|
|
|
|
|
Perpetual license |
|
$ |
41,165 |
|
$ |
45,775 |
|
$ |
53,512 |
|
Subscription |
|
|
70,470 |
|
|
61,357 |
|
|
48,080 |
|
Software support and services |
|
|
64,856 |
|
|
56,794 |
|
|
47,706 |
|
Total revenue |
|
|
176,491 |
|
|
163,926 |
|
|
149,298 |
|
|
|
|
|
|
|
|
|
|
|
|
Cost of revenue |
|
|
|
|
|
|
|
|
|
|
Perpetual license |
|
|
1,869 |
|
|
2,658 |
|
|
2,881 |
|
Subscription |
|
|
8,626 |
|
|
8,297 |
|
|
7,181 |
|
Software support and services |
|
|
19,731 |
|
|
19,412 |
|
|
18,115 |
|
Restructuring charge |
|
|
311 |
|
|
181 |
|
|
— |
|
Total cost of revenue |
|
|
30,537 |
|
|
30,548 |
|
|
28,177 |
|
Gross profit |
|
|
145,954 |
|
|
133,378 |
|
|
121,121 |
|
|
|
|
|
|
|
|
|
|
|
|
Operating expenses: |
|
|
|
|
|
|
|
|
|
|
Research and development |
|
|
75,350 |
|
|
67,398 |
|
|
61,871 |
|
Sales and marketing |
|
|
96,477 |
|
|
101,757 |
|
|
105,520 |
|
General and administrative |
|
|
28,091 |
|
|
29,695 |
|
|
36,037 |
|
Litigation settlement charge |
|
|
1,143 |
|
|
— |
|
|
— |
|
Restructuring charge |
|
|
1,038 |
|
|
871 |
|
|
1,049 |
|
Total operating expenses |
|
|
202,099 |
|
|
199,721 |
|
|
204,477 |
|
|
|
|
|
|
|
|
|
|
|
|
Operating loss |
|
|
(56,145) |
|
|
(66,343) |
|
|
(83,356) |
|
Other income (expense) - net |
|
|
988 |
|
|
145 |
|
|
(274) |
|
Loss before income taxes |
|
|
(55,157) |
|
|
(66,198) |
|
|
(83,630) |
|
Income tax expense |
|
|
1,142 |
|
|
982 |
|
|
852 |
|
Net loss |
|
$ |
(56,299) |
|
$ |
(67,180) |
|
$ |
(84,482) |
|
Net loss per share, basic and diluted |
|
$ |
(0.60) |
|
$ |
(0.78) |
|
$ |
(1.07) |
|
Weighted-average shares used to compute net loss per share, basic and diluted |
|
|
93,770 |
|
|
85,845 |
|
|
78,755 |
See accompanying notes to the consolidated financial statements
71
MOBILEIRON, INC.
CONSOLIDATED STATEMENTS OF STOCKHOLDERS’ EQUITY (DEFICIT)
(In thousands, except share and per share data)
|
|
|
|
|
|
|
|
|
|
|
|
|
|
Total |
|
|
|
|
|
|
|
|
|
|
Additional |
|
|
|
Stockholders’ |
|
|||
|
|
|
Common Stock |
|
Paid-in |
|
Accumulated |
|
Equity |
|
||||||
|
|
|
Shares |
|
Amount |
|
Capital |
|
Deficit |
|
(Deficit) |
|
||||
|
BALANCE—December 31, 2014 |
|
76,153,844 |
|
$ |
8 |
|
$ |
305,809 |
|
$ |
(190,723) |
|
$ |
115,094 |
|
|
Issuance of common stock for stock option exercises, net of repurchases |
|
2,776,221 |
|
|
— |
|
|
5,846 |
|
|
— |
|
|
5,846 |
|
|
Vesting of early exercised stock options and restricted stock |
|
198,564 |
|
|
— |
|
|
246 |
|
|
— |
|
|
246 |
|
|
Issuance of common stock for pursuant to the Employee Stock Purchase Plan |
|
1,273,147 |
|
|
— |
|
|
7,359 |
|
|
— |
|
|
7,359 |
|
|
Vesting of restricted stock units |
|
924,461 |
|
|
— |
|
|
— |
|
|
— |
|
|
— |
|
|
Stock-based compensation |
|
— |
|
|
— |
|
|
24,076 |
|
|
— |
|
|
24,076 |
|
|
Net loss |
|
— |
|
|
— |
|
|
— |
|
|
(84,482) |
|
|
(84,482) |
|
|
BALANCE—December 31, 2015 |
|
81,326,237 |
|
$ |
8 |
|
$ |
343,336 |
|
$ |
(275,205) |
|
$ |
68,139 |
|
|
Issuance of common stock for stock option exercises, net of repurchases |
|
1,040,902 |
|
|
— |
|
|
2,468 |
|
|
— |
|
|
2,468 |
|
|
Vesting of early exercised stock options |
|
9,957 |
|
|
— |
|
|
43 |
|
|
— |
|
|
43 |
|
|
Issuance of common stock pursuant to the Employee Stock Purchase Plan |
|
1,799,341 |
|
|
— |
|
|
4,851 |
|
|
— |
|
|
4,851 |
|
|
Issuance of common stock pursuant to the Employee Stock-Settled Bonus Plan |
|
1,653,371 |
|
|
1 |
|
|
5,638 |
|
|
— |
|
|
5,639 |
|
|
Vesting of restricted stock units |
|
3,236,223 |
|
|
— |
|
|
— |
|
|
— |
|
|
— |
|
|
Stock-based compensation |
|
— |
|
|
— |
|
|
26,857 |
|
|
— |
|
|
26,857 |
|
|
Net loss |
|
— |
|
|
— |
|
|
— |
|
|
(67,180) |
|
|
(67,180) |
|
|
BALANCE—December 31, 2016 |
|
89,066,031 |
|
$ |
9 |
|
$ |
383,193 |
|
$ |
(342,385) |
|
$ |
40,817 |
|
|
Issuance of common stock for stock option exercises, net of repurchases |
|
1,172,409 |
|
|
— |
|
|
3,287 |
|
|
— |
|
|
3,287 |
|
|
Vesting of early exercised stock options |
|
2,477 |
|
|
— |
|
|
— |
|
|
— |
|
|
— |
|
|
Issuance of common stock pursuant to the Employee Stock Purchase Plan |
|
1,676,158 |
|
|
— |
|
|
4,562 |
|
|
— |
|
|
4,562 |
|
|
Issuance of common stock pursuant to the Employee Stock-Settled Bonus Plan |
|
1,688,097 |
|
|
— |
|
|
8,272 |
|
|
— |
|
|
8,272 |
|
|
Shares withheld for net settlement of Stock-Settled Bonus Plans |
|
(677,547) |
|
|
— |
|
|
(3,149) |
|
|
— |
|
|
(3,149) |
|
|
Vesting of restricted stock units |
|
4,276,325 |
|
|
1 |
|
|
— |
|
|
— |
|
|
1 |
|
|
Stock-based compensation |
|
— |
|
|
— |
|
|
24,360 |
|
|
— |
|
|
24,360 |
|
|
Net loss |
|
— |
|
|
— |
|
|
— |
|
|
(56,299) |
|
|
(56,299) |
|
|
BALANCE—December 31, 2017 |
|
97,203,950 |
|
$ |
10 |
|
$ |
420,525 |
|
$ |
(398,684) |
|
$ |
21,851 |
|
|
|
|
|
|
|
|
|
|
|
|
|
|
|
|
|
|
See accompanying notes to the consolidated financial statements
72
MOBILEIRON, INC.
CONSOLIDATED STATEMENTS OF CASH FLOWS
(In thousands)
|
|
|
|
|
|
|
||||
|
|
|
Year ended December 31, |
|||||||
|
|
|
2017 |
|
2016 |
|
2015 |
|||
|
CASH FLOWS FROM OPERATING ACTIVITIES: |
|
|
|
|
|
|
|
|
|
|
Net loss |
|
$ |
(56,299) |
|
$ |
(67,180) |
|
$ |
(84,482) |
|
Adjustments to reconcile net loss to net cash used in operating activities: |
|
|
|
|
|
|
|
|
|
|
Stock-based compensation expense |
|
|
33,731 |
|
|
34,389 |
|
|
28,791 |
|
Depreciation |
|
|
3,389 |
|
|
3,348 |
|
|
2,757 |
|
Amortization of intangible assets |
|
|
545 |
|
|
616 |
|
|
870 |
|
Amortization of premium (accretion) of investment securities |
|
|
(57) |
|
|
(14) |
|
|
368 |
|
Provision for doubtful accounts |
|
|
149 |
|
|
77 |
|
|
150 |
|
Loss on disposal of equipment |
|
|
(16) |
|
|
99 |
|
|
— |
|
Changes in operating assets and liabilities: |
|
|
|
|
|
|
|
|
|
|
Accounts receivable |
|
|
(4,565) |
|
|
(1,158) |
|
|
(8,148) |
|
Other current and noncurrent assets |
|
|
(734) |
|
|
(447) |
|
|
(932) |
|
Accounts payable |
|
|
439 |
|
|
(1,297) |
|
|
1,414 |
|
Accrued expenses and other long-term liabilities |
|
|
2,029 |
|
|
1,637 |
|
|
(5,024) |
|
Deferred revenue |
|
|
24,425 |
|
|
18,201 |
|
|
15,701 |
|
Net cash provided by (used in) operating activities |
|
|
3,036 |
|
|
(11,729) |
|
|
(48,535) |
|
|
|
|
|
|
|
|
|
|
|
|
CASH FLOWS FROM INVESTING ACTIVITIES: |
|
|
|
|
|
|
|
|
|
|
Purchase of property and equipment |
|
|
(6,454) |
|
|
(2,930) |
|
|
(3,730) |
|
Proceeds from maturities of investment securities |
|
|
38,015 |
|
|
94,631 |
|
|
44,964 |
|
Purchase of investment securities |
|
|
(8,570) |
|
|
(79,134) |
|
|
(60,913) |
|
Net cash provided by (used in) investing activities |
|
|
22,991 |
|
|
12,567 |
|
|
(19,679) |
|
|
|
|
|
|
|
|
|
|
|
|
CASH FLOWS FROM FINANCING ACTIVITIES: |
|
|
|
|
|
|
|
|
|
|
Proceeds from Employee Stock Purchase Plan |
|
|
4,798 |
|
|
4,332 |
|
|
5,406 |
|
Proceeds from exercise of stock options |
|
|
4,114 |
|
|
1,639 |
|
|
5,755 |
|
Taxes paid for net settlement of stock-settled bonus |
|
|
(3,149) |
|
|
— |
|
|
— |
|
Net cash provided by financing activities |
|
|
5,763 |
|
|
5,971 |
|
|
11,161 |
|
NET CHANGE IN CASH AND CASH EQUIVALENTS |
|
|
31,790 |
|
|
6,809 |
|
|
(57,053) |
|
CASH AND CASH EQUIVALENTS—Beginning of period |
|
|
54,043 |
|
|
47,234 |
|
|
104,287 |
|
CASH AND CASH EQUIVALENTS—End of period |
|
$ |
85,833 |
|
$ |
54,043 |
|
$ |
47,234 |
|
|
|
|
|
|
|
|
|
|
|
|
SUPPLEMENTAL DISCLOSURES OF CASH FLOW INFORMATION |
|
|
|
|
|
|
|
|
|
|
Cash paid for income taxes |
|
$ |
1,189 |
|
$ |
1,021 |
|
$ |
595 |
|
SUPPLEMENTAL DISCLOSURES OF NONCASH FINANCING ACTIVITIES: |
|
|
|
|
|
|
|
|
|
|
Value of shares issued under Bonus Plans |
|
$ |
5,123 |
|
$ |
5,639 |
|
$ |
— |
|
Value of shares issued under the Employee Stock Purchase Plan |
|
$ |
4,562 |
|
$ |
4,851 |
|
$ |
7,359 |
|
Tenant improvement allowance recorded in property and equipment and liabilities |
|
$ |
— |
|
$ |
— |
|
$ |
1,068 |
|
Other unpaid property and equipment purchases |
|
$ |
228 |
|
$ |
— |
|
$ |
554 |
See accompanying notes to the consolidated financial statements
73
1. Description of Business and Significant Accounting Policies
Description of Business
MobileIron, Inc. and its wholly owned subsidiaries, collectively, the “Company”, “we”, “us” or “our”, provides a purpose-built mobile IT platform that enables enterprises to manage and secure mobile applications, content and devices while providing their employees with device choice, privacy and a native user experience. We were incorporated in Delaware in July 2007 and are headquartered in Mountain View, California, with additional sales and support presence in North America, Europe, the Middle East, Asia and Australia and additional employees in India primarily focused on research and development.
Basis of Presentation and Consolidation
The accompanying audited consolidated financial statements have been prepared in accordance with U.S. generally accepted accounting principles, or GAAP, and include the accounts of our wholly owned subsidiaries. Intercompany accounts and transactions have been eliminated in consolidation.
Foreign Currency Translation
Our reporting currency is the U.S. dollar. The functional currency of all our international operations is the U.S. dollar. All monetary asset and liability accounts are translated into U.S. dollars at the period-end rate, nonmonetary assets and liabilities are translated at historical exchange rates, and revenue and expenses are translated at the weighted-average exchange rates in effect during the period. Translation adjustments arising are recorded as foreign currency gains (losses) in the consolidated statements of operations. We recognized a foreign currency gain of $242,000 in 2017, and foreign currency losses of $339,000 and $518,000 in 2016 and 2015, respectively, in other income (expense)—net in our consolidated statements of operations.
Use of Estimates
The preparation of consolidated financial statements in conformity with U.S. GAAP requires management to make estimates and assumptions that affect the reported amounts of assets and liabilities at the date of the consolidated financial statements and the reported amounts of revenue and expenses during the reporting period. These estimates include, but are not limited to, revenue recognition, stock-based compensation, goodwill, intangible assets and accounting for income taxes. Actual results could differ from those estimates.
Concentrations of Credit Risk
Financial instruments that potentially subject us to a concentration of credit risk consist of cash, money market funds and fixed income investments. Although we deposit our cash with multiple financial institutions, our deposits, at times, exceed federally insured limits. We invest in fixed income securities that are of high-credit quality. Substantially all of our money market funds, or $10.6 million, are held in two funds that are rated “AAA.”
We generally do not require collateral or other security in support of accounts receivable. Allowances are provided for individual accounts receivable when we become aware of a customer’s inability to meet its financial obligations, such as in the case of bankruptcy, deterioration in the customer’s operating results, or change in financial position. If circumstances related to customers change, estimates of the recoverability of receivables would be further adjusted. We also consider broader factors in evaluating the sufficiency of our allowances for doubtful accounts, including the length of time receivables are past due, significant one-time events and historical experience. Activity in our allowance for doubtful accounts was as follow (in thousands):
|
|
|
Balance at |
|
Bad |
|
Write-offs, |
|
Balance at |
||||
|
|
|
Beginning |
|
Debt |
|
Net of |
|
End |
||||
|
|
|
of Period |
|
Expense |
|
Recoveries |
|
of Period |
||||
|
Balance as of December 31, 2017 |
|
$ |
433 |
|
|
149 |
|
|
(107) |
|
$ |
475 |
|
Balance as of December 31, 2016 |
|
$ |
628 |
|
|
77 |
|
|
(272) |
|
$ |
433 |
|
Balance as of December 31, 2015 |
|
$ |
550 |
|
|
150 |
|
|
(72) |
|
$ |
628 |
74
One reseller accounted for 15% (1% as an end customer), 16% (1% as an end customer) and 17% (1% as an end customer) of total revenue in 2017, 2016 and 2015, respectively. The same reseller accounted for 17% and 15% of net accounts receivable as of December 31, 2017 and 2016, respectively.
There were no other resellers or end-user customers that accounted for 10% or more as a percentage of our revenue or net accounts receivable for any period presented.
Segments
We have one reportable segment.
Summary of Significant Accounting Policies
Revenue Recognition
We derive revenue principally from software-related arrangements consisting of perpetual software licenses, post-contract customer support for such licenses, or PCS or software support, including when and if available updates, and professional services such as consulting and training services. We also offer our software as term-based licenses and cloud-based arrangements. In addition, we install our software on servers that we ship to customers.
We begin to recognize revenue when (i) persuasive evidence of an arrangement exists, (ii) delivery has occurred or services have been provided, (iii) the sales price is fixed or determinable, and (iv) collection of the related receivable is probable. If collection is not considered probable, revenue is recognized only upon collection.
Signed agreements, including by electronic acceptance, are used as evidence of an arrangement. Delivery is considered to occur when we provide a customer with a link and credentials to download our software. Delivery of a hardware appliance (an “appliance”) is considered to occur when title and risk of loss has transferred to the customer, which typically occurs when appliances are delivered to a common carrier. Delivery of services occurs when performed.
Prior to January 1, 2013, we had not established vendor specific objective evidence, or VSOE, of fair value for any of the elements in our multiple-element arrangements. As of January 1, 2013, we determined that we had sufficient history to establish VSOE of fair value for PCS and professional services. Prior to January 1, 2013, we did not have VSOE of fair value for our software-related undelivered elements due to limited history of stand-alone sales transactions and inconsistency in pricing. We established VSOE of fair value when we had a substantial majority of stand-alone sales transactions of software support and services pricing within a narrow pricing band. In our VSOE analysis, we generally include stand-alone sales transactions completed during a rolling 12 month period unless a shorter period is appropriate due to changes in our pricing structure.
We typically enter into multiple-element arrangements with our customers in which a customer may purchase a combination of software on a perpetual or subscription license, PCS, and professional services. The professional services are not considered essential to the functionality of the software. All of these elements are considered separate units of accounting. Our standard agreements do not include rights for customers to cancel or terminate arrangements or to return software to obtain refunds.
We use the residual method to recognize revenue when a perpetual license arrangement includes one or more elements to be delivered at a future date provided the following criteria are met: (i) VSOE of fair value does not exist for one or more of the delivered items but exists for all undelivered elements, (ii) all other applicable revenue recognition criteria are met and (iii) the fair value of all of the undelivered elements is less than the arrangement fee. VSOE of fair value is based on the normal pricing practices for those products and services when sold separately by us and contractual customer renewal rates for post-contract customer support services. Under the residual method, the fair value of the undelivered elements is deferred and the remaining portion of the arrangement fee is recognized as revenue in the period in which it was earned. If evidence of the fair value of one or more undelivered elements does not exist, then the revenue is deferred and recognized when delivery of those elements occurs, or when fair value can be established, or ratably over
75
the PCS period if the only undelivered element is PCS—we refer to these deferred revenue elements as the “Deferred Portion.”
Revenue from subscriptions to our on premise term licenses, arrangements where perpetual and subscriptions to our on premise term licenses are sold together, and subscriptions to our cloud service are recognized ratably over the contractual term for all periods presented and are included as a component of subscription revenue within our consolidated statements of operations. We refer to arrangements where perpetual and subscriptions to our on premise term licenses are sold together as “Bundled Arrangements.”
Occasionally, we enter into multiple-element arrangements with our customers in which a customer may purchase a combination of software on a perpetual or term basis, PCS, professional services, and appliances. We generally provide the appliances and software upon the commencement of the arrangement and provide software-related elements throughout the support period. We account for appliance-bundled arrangements under the revised accounting standard related to multiple-element arrangements, Accounting Standard Update, or ASU, No. 2009-13, Multiple Element Arrangements, and determine the revenue to be recognized based on the standard’s fair value hierarchy and then determine the value of each element in the arrangement based on the relative selling price of the arrangement. Amounts related to appliances are generally recognized upon delivery with the remaining consideration allocated to software and software-related elements, which are recognized as described elsewhere in this policy.
Revenue from PCS is recognized ratably over the support term and is included as a component of software support and service revenue within the consolidated statements of operations.
Revenue related to professional services is recognized upon delivery and is included as a component of software support and services revenue within the consolidated statements of operations.
Prior to establishing VSOE of fair value for PCS and professional services on January 1, 2013, we recognized revenue for multiple element software and software-related arrangements ratably from the date of service commencement over the contractual term of the related PCS arrangement. After January 1, 2013, the deferred revenue related to these arrangements continues to be recognized ratably over the remaining contractual term of the PCS arrangement. We recognized $1.8 million of perpetual license revenue in 2015 from sales made prior to January 1, 2013. In 2016 and 2017, we recognized no significant revenue from sales made prior to January 1, 2013.
We allocated the revenue from all multiple-element arrangements entered into prior to the establishment of VSOE of fair value for our PCS and professional services to each respective revenue caption using our best estimate of value of each element based on the facts and circumstances of the arrangements, our go-to-market strategy, price list and discounts from price list as applicable. We believe that the allocation between the revenue captions allows for greater transparency and comparability of revenue from period to period even though VSOE of fair value may not have existed at that time.
Appliance revenue was less than 10% of total revenue for all periods presented and is included as a component of perpetual license revenue within the consolidated statements of operations.
Historically, sales made through resellers were fulfilled directly to end users, and we recognized revenue when we delivered licenses to end users and all other revenue recognition criteria were met. Over time, however, our business has evolved and some of our operators, system integrators and other resellers have requested that we deliver licenses to them. In those instances we recognize revenue at the time that we deliver to our resellers and all other revenue recognition criteria are met; such resellers have no rights of return or exchange.
Shipping charges and sales tax billed to partners are excluded from revenue.
Sales commissions and other incremental costs to acquire contracts are also expensed as incurred and are recorded in sales and marketing expense.
For all arrangements, any revenue that has been deferred and is expected to be recognized beyond one year is classified as long-term deferred revenue in the consolidated balance sheets.
76
Cash Equivalents
We consider all highly liquid investments with an original maturity of three months or less to be cash equivalents. As of December 31, 2017 and 2016, cash and cash equivalents consisted of cash deposited with banks, money market funds and investments that mature within three months of their purchase.
Held-To-Maturity Investments
We determine the appropriate classification of our fixed income investments at the time of purchase and reevaluate their classifications each reporting period. Investments are classified as held-to-maturity since the Company has positive intent and the ability to hold the securities to maturity. Held-to-maturity securities are stated at amortized cost.
Comprehensive Loss
Comprehensive loss includes all changes in equity (net assets) during a period from non-owner sources. In 2017, 2016 and 2015, there were no differences between net loss and comprehensive loss. Therefore, the consolidated statements of comprehensive loss have been omitted.
Net Loss per Share of Common Stock
Basic net loss per common share is calculated by dividing the net loss by the weighted-average number of common shares outstanding during the period, without consideration for potentially dilutive securities. Diluted net loss per share is computed by dividing the net loss by the weighted-average number of common shares and potentially dilutive securities outstanding for the period determined using the treasury-stock and if-converted methods. For purposes of the diluted net loss per share calculation, convertible preferred stock, unvested restricted stock, restricted stock units and stock options are considered to be potentially dilutive securities. Because we have reported a net loss for 2017, 2016 and 2015, the number of shares used to calculate diluted net loss per common share is the same as the number of shares used to calculate basic net loss per common share for those periods presented because the potentially dilutive shares would have been anti-dilutive if included in the calculation.
Software Development Costs Incurred in Connection with Software to be Sold or Marketed
The costs to develop new software products and enhancements to existing software products are expensed as incurred until technological feasibility has been established. We consider technological feasibility to have occurred when all planning, designing, coding and testing have been completed according to design specifications. Once technological feasibility is established, any additional costs would be capitalized. We believe our current process for developing software is essentially completed concurrent with the establishment of technological feasibility, and accordingly, no costs have been capitalized.
Internal Use Software
We capitalize costs incurred during the application development stage related to our internally used software. Such costs are primarily incurred by third-party vendors and consultants. Costs related to preliminary project activities and post-implementation activities are expensed as incurred. Amounts capitalized in all periods presented were not significant.
All software development costs incurred in connection with our cloud offering, or SaaS, are also sold or marketed to partners or end customers, therefore we start capitalizing costs when technological feasibility is achieved. No costs were capitalized in any periods presented as we believe that our current process for developing software is essentially completed concurrent with the establishment of technological feasibility.
Property and Equipment
Property and equipment are stated at cost. Depreciation is computed using the straight-line method over the estimated useful life of the property and equipment, determined to be three years for computers and equipment and
77
software, five years for furniture and fixtures, and the lesser of the remaining lease term or estimated useful life for leasehold improvements. Expenditures for repairs and software support are charged to expense as incurred. Upon disposition, the cost and related accumulated depreciation are removed from the accounts and the resulting gain or loss is reflected as operating expenses in the consolidated statements of operations.
Goodwill and Intangible Assets
We record the excess of the acquisition purchase price over the fair value of the tangible and identifiable intangible assets acquired as goodwill. We perform an impairment test of our goodwill in the third quarter of our fiscal year, or more frequently if indicators of potential impairment arise. We have a single reporting unit and consequently evaluate goodwill for impairment based on an evaluation of the fair value of the Company as a whole. We record purchased intangible assets at their respective estimated fair values at the date of acquisition. Purchased intangible assets are being amortized using the straight-line method over their remaining estimated useful lives, which range from three to five years. We evaluate the remaining useful lives of intangible assets on a periodic basis to determine whether events or circumstances warrant a revision to the remaining estimated amortization period.
We have determined that our intangible assets have not been impaired during the years ended December 31, 2017, 2016 and 2015.
Long-Lived Assets with Finite Lives
Long-lived assets are reviewed for possible impairment whenever events or circumstances indicate that the carrying amount of these assets may not be recoverable. We evaluate the recoverability of each of our long-lived assets, including purchased intangible assets and property and equipment, by comparison of its carrying amount to the future undiscounted cash flows we expect the asset to generate. If we consider the asset to be impaired, we measure the amount of any impairment as the difference between the carrying amount and the fair value of the impaired asset.
Stock-Based Compensation
We use the estimated grant-date fair value method of accounting in accordance with Accounting Standards Codification, or ASC, Topic 718 Compensation—Stock Compensation. Fair value is determined using the Black-Scholes Model using various inputs, including our estimates of expected volatility, term and future dividends. We estimated the forfeiture rate in 2017, 2016 and 2015 based on our historical experience for annual grant years where the majority of the vesting terms have been satisfied. We recognize compensation costs for awards with service and performance vesting conditions and for our Employee Stock Purchase Plan, or ESPP, on an accelerated method over the requisite service period of the award. For stock options or restricted stock grants with no performance condition, we recognize compensation costs on a straight-line basis over the requisite service period of the award, which is generally the vesting term of four years.
Research and Development
Research and development, or R&D, costs are charged to expense as incurred.
Advertising
Advertising costs are expensed and included in sales and marketing expense when incurred. Advertising expense in 2017, 2016 and 2015 was $102,000, $305,000 and $256,000, respectively.
Income Taxes
We account for income taxes in accordance with ASC Topic 740, Income Taxes, under which deferred tax liabilities and assets are recognized for the expected future tax consequences of temporary differences between financial statement carrying amounts and the tax basis of assets and liabilities and net operating loss and tax credit carryforwards. Valuation allowances are established when necessary to reduce deferred tax assets to the amount expected to be realized.
78
We use a recognition threshold and measurement attribute for the financial statement recognition and measurement of a tax position taken or expected to be taken in a tax return. A tax position is recognized when it is more likely than not that the tax position will be sustained upon examination, including resolution of any related appeals or litigation processes. A tax position that meets the more-likely-than-not recognition threshold is measured at the largest amount of benefit that is greater than 50% likely of being realized upon ultimate settlement with a taxing authority. The standard also provides guidance on derecognition of tax benefits, classification on the balance sheet, interest and penalties, accounting in interim periods, disclosure and transition.
Recent Accounting Pronouncements
From time to time, new accounting pronouncements are issued by the Financial Accounting Standards Board, or FASB, or other standard setting bodies and adopted by us as of the specified effective date. Unless otherwise discussed, the impact of recently issued standards that are not yet effective will not have a material impact on our financial position or results of operations upon adoption.
Financial Instruments – Credit Losses
In June 2016, the Financial Accounting Standards Board (“FASB”) issued Accounting Standards Update (“ASU”) No. 2016-13, Financial Instruments – Credit Losses – Measurement of Credit Losses on Financial Instruments, which introduces a model based on expected losses to estimate credit losses for most financial assets and certain other instruments. In addition, for available-for-sale debt securities with unrealized losses, the losses will be recognized as allowances rather than reductions in the amortized cost of the securities. The standard is effective for annual reporting periods beginning after December 15, 2019, with early adoption permitted for annual reporting periods beginning after December 15, 2018. Entities will apply the standard’s provisions by recording a cumulative-effect adjustment to retained earnings. We are evaluating the impact of the adoption on our consolidated balance sheet, results of operations, cash flows and disclosures.
Leases
In February 2016, the FASB finalized the Accounting Standard Update, or ASU, 2016-02, “Leases”. ASU 2016-02 requires lessees to recognize the assets and liabilities on the balance sheet for the rights and obligations created by most leases (leases with the term of 12 months or longer) and continue to recognize expenses on the income statements over the lease term. It will also require disclosure designed to give financial statement users information on the amount, timing, and uncertainty of cash flows arising from leases. The guidance is effective for annual reporting periods beginning after December 15, 2018 and interim periods within those fiscal years. As a result of this new standard, we expect to record a lease commitment liability and corresponding asset for most of our leases. We will adopt ASU 2016-02 effective January 1, 2019.
Revenue from Contracts with Customers
In May 2014, the FASB, jointly with the International Accounting Standards Board, issued a comprehensive new standard, Accounting Standard Codification Topic 606, Revenue Recognition from Contracts with Customers, or ASC 606. The standard’s core principle is that a reporting entity will recognize revenue when it transfers promised goods or services to customers in an amount that reflects the consideration to which the entity expects to be entitled in exchange for those goods or services. In addition, the standard requires disclosure of the nature, amount, timing, and uncertainty of revenue and cash flows arising from contracts with customers.
The guidance permits two methods of adoption: retrospectively to each prior reporting period presented (full retrospective method), or retrospectively with the cumulative effect of initially applying the guidance recognized at the date of initial application (modified retrospective method). We have adopted the standard using the full retrospective method to restate each prior reporting period presented.
The standard is effective for us beginning January 1, 2018. In preparation for adoption of the standard, we have implemented internal controls and key system functionality to enable the preparation of financial information and have
79
reached conclusions on key accounting assessments related to the standard, including our assessment of the impact of accounting for costs incurred to obtain a contract.
The most significant impact of the standard relates to the elimination of the requirement to have VSOE of fair value to separate and recognize revenue for products and services in a contract. The elimination of the VSOE requirement will cause a significant change to the timing of revenue recognition for on-premises software term license revenue and other multiple-element arrangements with products or services that lacked VSOE of fair value. Our on-premises term license agreements include distinct software licenses and software update and support services. Under ASC 606, we will recognize the software license revenue at the time of delivery and will recognize the software update and support services revenue ratably over the term of subscription agreements. Under ASC 605, we have recognized all revenue from those arrangements ratably over the term of the subscription agreements. Due to the complexity of certain of our revenue contracts, the actual revenue recognition treatment required under the new standard will depend on contract-specific terms and in some instances may vary from recognition at the time of billing. The timing of revenue recognized from our cloud offerings, perpetual licenses, professional services and hardware will remain substantially unchanged.
In addition, Accounting Standards Codification Subtopic 340-40, Other Asssets and Deferred Costs - Contracts with Customers, or ASC 340, requires us to recognize an asset for the incremental costs of obtaining a contract with a customer if our sales incentive programs meet requirements for capitalization. Previously we recorded these incremental costs of obtaining a contract, primarily commission expense, when we booked a sales transaction whereas under ASC 340, we record an asset for the incremental cost to obtain a contract and recognize the cost over the expected revenue recognition period.
We expect the adoption of the new standards to impact our 2017 and 2016 financial results as described below.
Adoption of the standard will result in the recognition of additional revenue of $3.3 million and $2.3 million in 2017 and 2016, respectively, primarily due to an increase in revenue recognized from on-premises software subscriptions delivered and recognized in 2017 and 2016 and earlier recognition from other arrangements that lacked VSOE of fair value under ASC 985-605, partially offset by lower on-premises software subscription revenue from amounts billed prior to 2016. The new standard for accounting for costs to obtain a contract will result in an increase in sales and marketing expense of $330,000 and $570,000 in 2017 and 2016, respectively, primarily due to the net impact of the capitalization of commissions earned in 2017 and 2016 and the amortization expense from commissions capitalized prior to 2016.
We do not expect the adoption of the new standard to have a material impact on net cash provided by (used in) operating, financing, or investing activities in our consolidated cash flow statements. In future periods, the new standard will require us to disclose additional information in the notes to our consolidated financial statements, including disaggregation of our revenue, remaining performance obligations, and other quantitative and qualitative information about our contracts with customers.
Adoption of the standard will result in an increase in accounts receivable and other assets of $3.4 million and $2.8 million as of December 31, 2017 and 2016, respectively, driven primarily by unbilled receivables from upfront recognition of revenue for certain multi-period on-premises software subscriptions that include both distinct software licenses and software update and support services.
Unearned revenue will be reduced by $36.7 million and $27.5 million as of December 31, 2017 and 2016, respectively, due to (a) cumulative changes to revenue and (b) a reclassification of approximately $20.8 million and $14.2 million as of December 31, 2017 and 2016, respectively, for arrangements with customers which contain termination rights. Because of the termination rights, the arrangements will not meet the definition of a contract under ASC 606 and will not be recorded as unearned revenue and instead be recorded as “customer arrangements with termination rights” on our consolidated balance sheets.
Total capitalized costs to obtain a contract included in current and non-current prepaid and other current assets on our consolidated balance sheets will be $18.4 million and $18.7 million as of December 31, 2017 and 2016, respectively.
80
The following tables show the expected impact of adoption of the standards related to revenue recognition on our reported results (in thousands except per share information):
|
|
|
Year Ended December 31, 2017 |
|||||||
|
|
|
|
|
|
|
New Revenue |
|
|
|
|
|
|
|
|
|
|
Standard |
|
|
As |
|
Statement of Operations: |
|
As Reported |
|
|
Adjustment |
|
|
Adjusted |
|
|
Revenue |
|
$ |
176,491 |
|
$ |
3,267 |
|
$ |
179,758 |
|
Total operating expenses |
|
|
202,099 |
|
|
330 |
|
|
202,429 |
|
Net loss |
|
|
(56,299) |
|
|
2,937 |
|
|
(53,362) |
|
Net loss per share, basic and diluted |
|
|
(0.60) |
|
|
0.03 |
|
|
(0.57) |
|
|
|
|
|
|
|
|
|
|
|
|
|
|
Year Ended December 31, 2016 |
|||||||
|
|
|
|
|
|
|
New Revenue |
|
|
|
|
|
|
|
|
|
|
Standard |
|
|
As |
|
Statement of Operations: |
|
As Reported |
|
|
Adjustment |
|
|
Adjusted |
|
|
Revenue |
|
$ |
163,926 |
|
$ |
2,256 |
|
$ |
166,182 |
|
Total operating expenses |
|
|
199,721 |
|
|
570 |
|
|
200,291 |
|
Net loss |
|
|
(67,180) |
|
|
1,686 |
|
|
(65,494) |
|
Net loss per share, basic and diluted |
|
|
(0.78) |
|
|
0.02 |
|
|
(0.76) |
|
|
|
|
December 31, 2017 |
||||||
|
|
|
|
|
|
|
New Revenue |
|
|
|
|
|
|
|
|
|
|
Standard |
|
As |
|
|
Balance Sheets: |
|
|
As Reported |
|
Adjustment |
|
Adjusted |
||
|
Assets |
|
|
|
|
|
|
|
|
|
|
Accounts receivable, net |
|
$ |
48,171 |
|
|
2,458 |
|
$ |
50,629 |
|
Deferred commissions-current |
|
|
— |
|
|
9,285 |
|
|
9,285 |
|
Deferred commissions-noncurrent |
|
|
— |
|
|
9,123 |
|
|
9,123 |
|
Other assets |
|
|
1,899 |
|
|
977 |
|
|
2,876 |
|
Liabilities and stockholders' equity |
|
|
|
|
|
|
|
|
|
|
Accrued expenses |
|
|
24,995 |
|
|
75 |
|
|
25,070 |
|
Unearned revenue-current |
|
|
84,467 |
|
|
(30,265) |
|
|
54,202 |
|
Unearned revenue-noncurrent |
|
|
28,034 |
|
|
(6,475) |
|
|
21,559 |
|
Customer arrangements with termination rights |
|
|
— |
|
|
20,807 |
|
|
20,807 |
|
Total stockholders' equity |
|
|
21,851 |
|
|
37,701 |
|
|
59,552 |
|
|
|
|
|
|
|
|
|
|
|
|
|
|
|
December 31, 2016 |
||||||
|
|
|
|
|
|
|
New Revenue |
|
|
|
|
|
|
|
|
|
|
Standard |
|
As |
|
|
Balance Sheets: |
|
|
As Reported |
|
Adjustment |
|
Adjusted |
||
|
Assets |
|
|
|
|
|
|
|
|
|
|
Accounts receivable, net |
|
$ |
43,755 |
|
|
2,107 |
|
$ |
45,862 |
|
Deferred commissions-current |
|
|
— |
|
|
8,067 |
|
|
8,067 |
|
Deferred commissions-noncurrent |
|
|
— |
|
|
10,671 |
|
|
10,671 |
|
Other assets |
|
|
1,370 |
|
|
704 |
|
|
2,074 |
81
|
Liabilities and stockholders' equity |
|
|
|
|
|
|
|
|
|
|
Accrued expenses |
|
|
21,674 |
|
|
75 |
|
|
21,749 |
|
Unearned revenue-current |
|
|
68,153 |
|
|
(22,736) |
|
|
45,417 |
|
Unearned revenue-noncurrent |
|
|
19,923 |
|
|
(4,752) |
|
|
15,171 |
|
Customer arrangements with termination rights |
|
|
— |
|
|
14,198 |
|
|
14,198 |
|
Total stockholders' equity |
|
|
40,817 |
|
|
34,764 |
|
|
75,581 |
2. Significant Balance Sheet Components
Property and Equipment—Property and equipment at December 31, 2017 and 2016 consisted of the following (in thousands):
|
|
|
As of December 31, |
|
||||
|
|
|
2017 |
|
2016 |
|
||
|
Computers and appliances |
|
$ |
13,178 |
|
$ |
9,754 |
|
|
Purchased software |
|
|
4,063 |
|
|
2,297 |
|
|
Furniture and fixtures |
|
|
1,734 |
|
|
1,477 |
|
|
Leasehold improvements |
|
|
3,226 |
|
|
2,985 |
|
|
Total property and equipment |
|
|
22,201 |
|
|
16,513 |
|
|
Accumulated depreciation and amortization |
|
|
(13,389) |
|
|
(11,010) |
|
|
Total property and equipment—net |
|
$ |
8,812 |
|
$ |
5,503 |
|
Accrued Expenses—Accrued expenses at December 31, 2017 and 2016 consisted of the following (in thousands):
|
|
|
As of December 31, |
|
||||
|
|
|
2017 |
|
2016 |
|
||
|
Accrued commissions |
|
$ |
3,989 |
|
$ |
5,908 |
|
|
Accrued stock-settled bonus |
|
|
7,705 |
|
|
6,608 |
|
|
Employee Stock Purchase Plan liability |
|
|
2,047 |
|
|
1,811 |
|
|
Other accrued payroll-related expenses |
|
|
4,285 |
|
|
3,696 |
|
|
Other accrued liabilities |
|
|
6,969 |
|
|
3,651 |
|
|
Total accrued expenses |
|
$ |
24,995 |
|
$ |
21,674 |
|
Deferred Revenue—Current and noncurrent deferred revenue at December 31, 2017 and 2016 consisted of the following (in thousands):
|
|
|
As of December 31, |
|
||||
|
|
|
2017 |
|
2016 |
|
||
|
Perpetual license |
|
$ |
— |
|
$ |
404 |
|
|
Subscription |
|
|
50,776 |
|
|
35,495 |
|
|
Software support |
|
|
58,376 |
|
|
50,117 |
|
|
Professional services |
|
|
3,349 |
|
|
2,060 |
|
|
Total current and noncurrent deferred revenue |
|
$ |
112,501 |
|
$ |
88,076 |
|
3. Fair Value Measurement
With the exception of our held-to-maturity fixed income investments, we report financial assets and liabilities and nonfinancial assets and liabilities that are recognized or disclosed at fair value in the consolidated financial statements on a recurring basis in accordance with ASC 820 (formerly FASB Statement No. 157, Fair Value
82
Measurements). ASC 820 defines fair value as the price that would be received from selling an asset or paid to transfer a liability in an orderly transaction between market participants at the measurement date. When determining the fair value measurements for assets and liabilities, which are required to be recorded at fair value, we consider the principal or most advantageous market in which we would transact and the market-based risk measurements or assumptions that market participants would use in pricing the asset or liability, such as inherent risk, transfer restrictions and credit risk.
ASC 820 also establishes a fair value hierarchy, which prioritizes the inputs to valuation techniques used to measure fair value into three levels. A financial instrument’s categorization within the fair value hierarchy is based upon the lowest level of input that is available and significant to the fair value measurement. ASC 820 establishes and prioritizes three levels of inputs that may be used to measure fair value:
|
· |
Level 1—Inputs are unadjusted quoted prices in active markets for identical assets or liabilities. |
|
· |
Level 2—Inputs are quoted prices for similar assets and liabilities in active markets or inputs other than quoted prices that are observable for the assets or liabilities, either directly or indirectly through market corroboration, for substantially the full term of the financial instruments. |
|
· |
Level 3—Inputs are unobservable inputs based on our own assumptions used to measure assets and liabilities at fair value. The inputs require significant management judgment or estimation. |
Our financial assets that are carried at fair value include cash and money market funds. We had no financial liabilities, or nonfinancial assets and liabilities that were required to be measured at fair value on a recurring basis, or that were measured at fair value as of December 31, 2017 or 2016.
Our financial instruments measured at fair market value as of December 31, 2017 and 2016 were as follows:
|
|
|
As of December 31, 2017 |
|
||||||||||
|
(in thousands) |
|
Level 1 |
|
Level 2 |
|
Level 3 |
|
Total |
|
||||
|
Money market funds |
|
$ |
10,583 |
|
$ |
— |
|
$ |
— |
|
$ |
10,583 |
|
|
Corporate debt securities |
|
|
— |
|
|
7,076 |
|
|
— |
|
|
7,076 |
|
|
Commercial paper |
|
|
— |
|
|
51,796 |
|
|
— |
|
|
51,796 |
|
|
Total |
|
$ |
10,583 |
|
$ |
58,872 |
|
$ |
— |
|
$ |
69,455 |
|
|
|
|
As of December 31, 2016 |
|
||||||||||
|
(in thousands) |
|
Level 1 |
|
Level 2 |
|
Level 3 |
|
Total |
|
||||
|
Money market funds |
|
$ |
15,003 |
|
$ |
— |
|
$ |
— |
|
$ |
15,003 |
|
|
Corporate debt securities |
|
|
— |
|
|
10,738 |
|
|
— |
|
|
10,738 |
|
|
Commercial paper |
|
|
— |
|
|
47,479 |
|
|
— |
|
|
47,479 |
|
|
Total |
|
$ |
15,003 |
|
$ |
58,217 |
|
$ |
— |
|
$ |
73,220 |
|
4. Investments
Our portfolio of fixed income securities consists of commercial paper and corporate debt securities. All our investments in fixed income securities are classified as held-to-maturity. These investments are carried at amortized cost.
Our investments in fixed income securities as of December 31, 2017 and 2016 were as follows:
|
|
|
|
||||||||||
|
|
|
As of December 31, 2017 |
||||||||||
|
|
|
Amortized |
|
|
|
|
|
|
|
Fair |
||
|
(in thousands) |
|
cost |
|
Gains |
|
Losses |
|
Value |
||||
|
Corporate debt securities |
|
$ |
7,078 |
|
$ |
— |
|
$ |
(2) |
|
$ |
7,076 |
|
Commercial paper |
|
|
51,805 |
|
|
— |
|
|
(9) |
|
|
51,796 |
|
Total |
|
$ |
58,883 |
|
$ |
— |
|
$ |
(11) |
|
$ |
58,872 |
83
|
|
|
|
||||||||||
|
|
|
As of December 31, 2016 |
||||||||||
|
|
|
Amortized |
|
|
|
|
|
|
|
Fair |
||
|
(in thousands) |
|
cost |
|
Gains |
|
Losses |
|
Value |
||||
|
Corporate debt securities |
|
$ |
10,740 |
|
$ |
— |
|
$ |
(2) |
|
$ |
10,738 |
|
Commercial paper |
|
|
47,473 |
|
|
8 |
|
|
(2) |
|
|
47,479 |
|
Total |
|
$ |
58,213 |
|
$ |
8 |
|
$ |
(4) |
|
$ |
58,217 |
The following table summarizes the balance sheet classification of our investments:
|
|
|
As of December 31, |
||||
|
(in thousands) |
|
2017 |
|
2016 |
||
|
Cash equivalents |
|
$ |
52,086 |
|
$ |
22,029 |
|
Short-term investments |
|
|
6,797 |
|
|
36,184 |
|
Long-term investments |
|
|
— |
|
|
— |
|
Total investments |
|
$ |
58,883 |
|
$ |
58,213 |
The gross amortized cost and estimated fair value of our held-to-maturity investments at December 31, 2017 and 2016 by contractual maturity are shown below. Actual maturities may differ from contractual maturities because the issuers of the securities may have the right to prepay obligations without prepayment penalties.
|
|
|
As of December 31, |
||||||||||
|
|
|
2017 |
|
2016 |
||||||||
|
|
|
Gross |
|
|
|
Gross |
|
|
||||
|
|
|
Amortized |
|
Fair |
|
Amortized |
|
Fair |
||||
|
(in thousands) |
|
Cost |
|
Value |
|
Cost |
|
Value |
||||
|
Due in one year or less |
|
$ |
58,883 |
|
$ |
58,872 |
|
$ |
58,213 |
|
$ |
58,217 |
|
Due after one year through five years |
|
|
— |
|
|
— |
|
|
— |
|
|
— |
|
Total |
|
$ |
58,883 |
|
$ |
58,872 |
|
$ |
58,213 |
|
$ |
58,217 |
We monitor our investment portfolio for impairment on a periodic basis. In order to determine whether a decline in fair value is other-than-temporary, we evaluate, among other factors: the duration and extent to which the fair value has been less than the carrying value; our financial condition and business outlook, including key operational and cash flow metrics, current market conditions and future trends in our industry; our relative competitive position within the industry; and our intent and ability to retain the investment for a period of time sufficient to allow for any anticipated recovery in fair value. A decline in the fair value of the security below amortized cost that is deemed other-than-temporary is charged to earnings, resulting in the establishment of a new cost basis for the affected securities. In 2017, we had an insignificant amount of unrealized gains or losses, and we did not recognize any other-than-temporary impairments.
5. Goodwill and Intangibles
The following table reflects intangible assets subject to amortization as of December 31, 2017 and 2016 (in thousands):
|
|
|
December 31, 2017 |
|
||||||||||
|
|
|
Gross Carrying |
|
Accumulated |
|
|
|
Net Book |
|
||||
|
|
|
Amount |
|
Amortization |
|
Impairment |
|
Value |
|
||||
|
Technology |
|
$ |
3,080 |
|
$ |
(2,980) |
|
|
— |
|
$ |
100 |
|
|
Total |
|
$ |
3,080 |
|
$ |
(2,980) |
|
$ |
— |
|
$ |
100 |
|
84
|
|
|
December 31, 2016 |
|
||||||||||
|
|
|
Gross Carrying |
|
Accumulated |
|
|
|
Net Book |
|
||||
|
|
|
Amount |
|
Amortization |
|
Impairment |
|
Value |
|
||||
|
Technology |
|
$ |
3,080 |
|
$ |
(2,435) |
|
|
— |
|
$ |
645 |
|
|
Total |
|
$ |
3,080 |
|
$ |
(2,435) |
|
$ |
— |
|
$ |
645 |
|
Amortization of the technology intangible assets of $545,000 and $616,000 in 2017 and 2016, respectively, was recorded in cost of revenue.
The weighted average remaining life of our intangible assets on December 31, 2017 was 3 months.
Estimated remaining intangible assets amortization expense for their remaining lives as follows (in thousands):
|
Year |
|
|
|
|
|
2018 |
|
$ |
100 |
|
|
Total |
|
$ |
100 |
|
At December 31, 2017, 2016 and 2015, the carrying value of goodwill was $5.5 million.
6. Restructuring Charges
We initiated business restructuring plans in 2015, 2016 and 2017 to reduce our cost structure through workforce reductions and, in 2017, to exit an office facility.
The following table sets forth a summary of restructuring activities which took place during the years ended December 31, 2017, 2016 and 2015 (in thousands):
|
|
|
Severance |
|
|
|
|
and Related Costs |
|
|
Balance, December 31, 2014 |
|
$ |
— |
|
Provision for restructuring charges |
|
|
1,049 |
|
Cash payments |
|
|
(1,049) |
|
Balance, December 31, 2015 |
|
$ |
— |
|
Provision for restructuring charges |
|
|
1,052 |
|
Cash payments |
|
|
(1,037) |
|
Balance, December 31, 2016 |
|
$ |
15 |
|
Provision for restructuring charges |
|
|
1,349 |
|
Cash payments |
|
|
(867) |
|
Balance, December 31, 2017 |
|
$ |
497 |
The remaining restructuring balance as of December 31, 2017 relates to employee severance and a liability for the estimated remaining exit costs of one of our office facilities.
7. Line of Credit
We have a $20.0 million revolving line of credit with a financial institution that can be used to (a) borrow for working capital and general business requirements, (b) issue letters of credit, and (c) enter into foreign exchange contracts. Amounts borrowed accrue interest at a floating per annum rate equal to the prime rate. A default interest rate shall apply during an event of default at a rate per annum equal to 5% above the otherwise applicable interest rate. The line of credit is collateralized by substantially all of our assets, except intellectual property, and requires us to comply with working capital, net worth and other covenants, including limitations on indebtedness and restrictions on dividend distributions, among others, and the borrowing capacity is limited to eligible accounts receivable. We are required to maintain an adjusted quick ratio (defined as the ratio of current assets to current liabilities minus deferred revenue) of at least 1.25.
85
In May 2015, we issued a letter of credit for $1.5 million as a security deposit for a new Mountain View facility lease and in November 2017 we issued a bank guarantee to a customer of approximately $3.0 million that can be drawn if we become insolvent or bankrupt. The issuances of the letter of credit and bank guarantee reduced the borrowing capacity under our line of credit to approximately $15.5 million.
In June 2017, we amended our revolving line of credit and extended its maturity date to June 2018.
There were no outstanding amounts under the line of credit at December 31, 2017 and 2016 and we were in compliance with all financial covenants.
8. Preferred Stock
We were authorized to issue up to 10,000,000 shares of convertible preferred stock as of December 31, 2017 and 2016. No shares of convertible preferred stock were issued and outstanding as of December 31, 2017 and 2016.
9. Common Stock
We were authorized to issue 300,000,000 shares of common stock with a par value of $0.0001 per share as of December 31, 2017 and 2016. Each share of common stock is entitled to one vote. The holders of common stock are also entitled to receive dividends from funds available, when and if declared by the board of directors, subject to the approval and priority rights of holders of all classes of preferred stock outstanding.
As of December 31, 2017 and 2016, we reserved shares of common stock for issuance as follows:
|
|
|
|
|
|
|
|
|
As of December 31, |
||
|
|
|
2017 |
|
2016 |
|
Options outstanding |
|
7,738,496 |
|
9,835,992 |
|
Unvested restricted stock units outstanding |
|
12,906,030 |
|
10,474,975 |
|
Unvested early exercised stock options |
|
— |
|
2,471 |
|
Shares available for grant under the 2014 Equity Incentive Plan |
|
1,859,997 |
|
4,199,415 |
|
Shares available for purchase under the Employee Stock Purchase Plan |
|
990,501 |
|
575,974 |
|
Total |
|
23,495,024 |
|
25,088,827 |
10. Share Based Awards
2008 Plan
The 2008 Stock Plan, or 2008 Plan, which expired on June 12, 2014, provided for the grant of incentive and nonstatutory stock options to employees, nonemployee directors and consultants of the Company. Options granted under the 2008 Plan generally become exercisable within three to four years following the date of grant and expire 10 years from the date of grant. When options are subject to our repurchase right, we may buy back any unvested shares at their original exercise price in the event of an employee’s termination prior to full vesting.
Our 2008 Plan was terminated following the date our 2014 Equity Incentive Plan, or the 2014 Plan, became effective. Any outstanding stock awards under our 2008 Plan will continue to be governed by the terms of our 2008 Plan and applicable award agreements.
2014 Equity Incentive Plan
Our board of directors adopted our 2014 Plan on April 17, 2014, and our stockholders subsequently approved the 2014 Plan on May 27, 2014. The 2014 Plan became effective on the date that our registration statement was declared effective by the SEC. The 2014 Plan is the successor to and continuation of our 2008 Plan. Upon the effective date of the 2014 Plan, no further grants can be made under our 2008 Plan.
86
Our 2014 Plan provides for the grant of incentive stock options, or ISOs, within the meaning of Section 422 of the Internal Revenue Code, or the Code, to our employees and our parent and subsidiary corporations’ employees, and for the grant of nonstatutory stock options, or NSOs, stock appreciation rights, restricted stock awards, restricted stock unit awards, performance-based stock awards, and other forms of equity compensation to our employees, directors and consultants. Additionally, our 2014 Plan provides for the grant of performance cash awards to our employees, directors and consultants.
The initial number of shares of our common stock available to be issued under our 2014 Plan was 8,142,857, which number of shares will be increased by any shares subject to stock options or other stock awards granted under the 2008 Plan that would have otherwise returned to our 2008 Plan (such as upon the expiration or termination of a stock award prior to vesting), not to exceed 16,312,202.
The number of shares of our common stock reserved for issuance under our 2014 Plan automatically increase on January 1 of each year, beginning on January 1, 2015 and continuing through and including January 1, 2024, by 5% of the total number of shares of our capital stock outstanding on December 31 of the preceding calendar year, or a lesser number of shares determined by our board of directors. On January 1, 2017, we increased the number of shares of common stock reserved for issuance under our 2014 Plan by 4,453,425 shares, which was 5% of the total number of capital stock outstanding at December 31, 2016. On January 1, 2018, we increased the number of shares of common stock reserved for issuance under our 2014 Plan by 4,860,197 shares, which was 5% of the total number of capital stock outstanding at December 31, 2017.
2015 Inducement Plan
On December 20, 2015, our board of directors adopted our 2015 Inducement Plan, or the Inducement Plan, to reserve 1,600,000 shares of our common stock to be used exclusively for grants of awards to individuals that were not previously employees or directors of the Company. The terms and conditions of the Inducement Plan are substantially similar to our stockholder-approved 2014 Plan. On January 5, 2016 our board of directors approved the amendment and restatement of the Inducement Plan to increase the share reserve under the 2015 Inducement Plan to 1,970,000 shares of our common stock. As of December 31, 2017 there were 1,640,417 options and restricted stock units outstanding under the Amended and Restated 2015 Inducement Plan.
2014 Employee Stock Purchase Plan
Our board of directors adopted our 2014 Employee Stock Purchase Plan, or ESPP, on April 17, 2014, and our stockholders subsequently approved the ESPP on May 27, 2014. The ESPP became effective immediately upon the execution and delivery of the underwriting agreement related to our IPO. The purpose of the ESPP is to secure the services of new employees, to retain the services of existing employees and to provide incentives for such individuals to exert maximum efforts toward our success and that of our affiliates. The ESPP is intended to qualify as an “employee stock purchase plan” within the meaning of Section 423 of the Code. The ESPP permits eligible employees to purchase our common stock through payroll deductions, which may not exceed 15% of the employee’s base compensation. Stock may be purchased under the plan at a price equal to 85% of the fair market value of our common stock on either the first day of the offering or the last day of the applicable purchase period, whichever is lower.
As of December 31, 2017 and 2016, 990,501 and 575,974 shares of common stock were available for future issuance under our ESPP, respectively. The number of shares of our common stock reserved for issuance under our ESPP increase automatically each year, beginning on January 1, 2015 and continuing through and including January 1, 2024, by the lesser of (i) 1% of the total number of shares of our common stock outstanding on December 31 of the preceding calendar year; (ii) 2,142,857 shares of common stock; or (iii) such lesser number as determined by our board of directors. Shares subject to purchase rights granted under our ESPP that terminate without having been exercised in full will not reduce the number of shares available for issuance under our ESPP. On January 1, 2017, we increased the number of shares available for issuance under the ESPP by 890,685 shares, which was 1% of the total number of capital stock outstanding at December 31, 2016. On June 14, 2017, our stockholders approved the amendment and restatement of the ESPP to provide for a one-time increase of 1.2 million shares of common stock available for issuance under the ESPP. On January 1, 2018, we increased the number of shares available for issuance under the ESPP by 972,039 shares, which was 1% of the total number of capital stock outstanding at December 31, 2017.
87
Restricted Stock Units
In 2014 we began granting restricted stock units under our 2014 Plan. For stock-based compensation expense, we measure the value of the restricted stock units based on the fair value of our common stock on the date of grant. Our restricted stock unit grants are subject to service conditions and we expense the fair value of those shares on a straight-line basis over their vesting periods.
Our restricted stock unit activity for 2015, 2016 and 2017 was as follows:
|
|
|
Restricted Stock Units |
|
|||
|
|
|
|
|
Weighted- |
|
|
|
|
|
|
|
Average |
|
|
|
|
|
Number of |
|
Grant Date |
|
|
|
|
|
Shares |
|
Fair Value |
|
|
|
Unvested, December 31, 2014 |
|
478,789 |
|
$ |
9.45 |
|
|
Granted |
|
9,932,561 |
|
|
6.92 |
|
|
Vested |
|
(924,461) |
|
|
8.36 |
|
|
Cancelled/Forfeited |
|
(1,653,927) |
|
|
8.06 |
|
|
Unvested, December 31, 2015 |
|
7,832,962 |
|
$ |
6.66 |
|
|
Granted |
|
10,724,225 |
|
|
3.36 |
|
|
Vested |
|
(4,889,594) |
|
|
4.99 |
|
|
Cancelled/Forfeitures |
|
(3,192,618) |
|
|
5.39 |
|
|
Unvested, December 31, 2016 |
|
10,474,975 |
|
$ |
4.45 |
|
|
Granted |
|
11,017,278 |
|
|
5.04 |
|
|
Vested |
|
(5,964,422) |
|
|
4.70 |
|
|
Cancelled/Forfeitures |
|
(2,621,801) |
|
|
5.01 |
|
|
Unvested, December 31, 2017 |
|
12,906,030 |
|
$ |
4.72 |
|
Bonus Plans
In 2015, our board of directors approved the 2015 Executive Bonus Plan and 2015 Non-Executive Bonus Plan, or 2015 Bonus Plan, which provided for the issuance of shares of unrestricted common stock to employees based on meeting certain Company metrics.
We issued 1,653,371 shares of unrestricted common stock in the first quarter of 2016 based on amounts earned under the 2015 Non-Executive Bonus Plan. No shares were issued under the 2015 Executive Bonus Plan.
In May 2016, our compensation committee approved the 2016 Executive Bonus Plan and 2016 Non-Executive Bonus Plan, or 2016 Bonus Plans, each effective as of January 1, 2016, which provided for the issuance of shares of unrestricted common stock to employees based on meeting certain Company metrics.
We issued 1,010,550 shares of unrestricted common stock in the first quarter of 2017, after withholding 677,547 shares to cover employee payroll taxes, for amounts earned under the 2016 Bonus Plans.
In 2017, the Compensation Committee of our board of directors approved the 2017 Executive Bonus Plan and 2017 Non-executive Bonus Plan, or collectively, the 2017 Bonus Plans, each effective as of January 1, 2017, which provided for the issuance of shares of unrestricted common stock to employees based on meeting certain Company metrics.
Shares issued under the aforementioned Bonus Plans will be issued from our 2014 Plan and reduce the 2014 Plan shares available for issuance.
We recorded stock-based compensation expense related to the 2015, 2016 and 2017 Bonus Plans over the service period of eligible employees based on forecasted performance relative to the Company metrics. To the extent that updated estimates of bonus expense differed from original estimates, the cumulative effect on current and prior periods of those changes was recorded in the period those estimates were revised.
88
In 2015 we recorded $4.7 million of stock-based compensation expense under the 2015 Non-Executive Bonus Plan. In 2016 we recorded $6.6 million of stock-based compensation expense under the 2016 Bonus Plans and $923,000 under the 2015 Non-Executive Bonus Plan. In 2017, we recorded $7.7 million of stock-based compensation expense under the 2017 Bonus Plans and $1.7 million under the 2016 Bonus Plans.
Stock Options
Stock option activity under the 2008 Plan, 2014 Plan and the Inducement Plan in 2015, 2016 and 2017 was as follows:
|
|
|
|
|
Options Outstanding |
|
||||||||
|
|
|
|
|
|
|
|
|
|
Weighted- |
|
|
|
|
|
|
|
Number of |
|
|
|
|
|
|
Average |
|
Aggregate |
|
|
|
|
|
Shares |
|
|
|
Weighted- |
|
Remaining |
|
Intrinsic |
|
||
|
|
|
Available |
|
Number of |
|
Average |
Contractual |
|
Value |
|
|||
|
|
|
for Issuance |
|
Shares |
|
Exercise Price |
|
Term (Years) |
|
(In thousands) |
|
||
|
Balance—December 31, 2014 |
|
7,392,158 |
|
16,435,568 |
|
$ |
4.15 |
|
7.83 |
|
$ |
95,791 |
|
|
Authorized |
|
5,418,242 |
|
— |
|
|
|
|
|
|
|
|
|
|
Stock options granted |
|
(1,089,100) |
|
1,089,100 |
|
|
6.95 |
|
|
|
|
|
|
|
Restricted stock units granted |
|
(9,932,561) |
|
— |
|
|
|
|
|
|
|
|
|
|
Exercised |
|
9,019 |
|
(2,817,915) |
|
|
2.12 |
|
|
|
|
|
|
|
Stock options canceled |
|
3,208,006 |
|
(3,208,006) |
|
|
5.61 |
|
|
|
|
|
|
|
Restricted stock units canceled |
|
1,653,927 |
|
— |
|
|
|
|
|
|
|
|
|
|
Repurchased |
|
12,545 |
|
— |
|
|
|
|
|
|
|
|
|
|
Balance—December 31, 2015 |
|
6,672,236 |
|
11,498,747 |
|
$ |
4.51 |
|
6.86 |
|
$ |
6,256 |
|
|
Authorized |
|
4,436,933 |
|
— |
|
|
|
|
|
|
|
|
|
|
Stock options granted |
|
(1,316,200) |
|
1,316,200 |
|
|
3.36 |
|
|
|
|
|
|
|
Issuance of shares under 2015 Bonus Plans |
|
(1,653,371) |
|
— |
|
|
|
|
|
|
|
|
|
|
Restricted stock units granted |
|
(9,070,854) |
|
— |
|
|
|
|
|
|
|
|
|
|
Exercised |
|
— |
|
(1,040,902) |
|
|
2.37 |
|
|
|
|
|
|
|
Stock options canceled |
|
1,938,053 |
|
(1,938,053) |
|
|
5.46 |
|
|
|
|
|
|
|
Restricted stock units canceled |
|
3,192,618 |
|
— |
|
|
|
|
|
|
|
|
|
|
Balance—December 31, 2016 |
|
4,199,415 |
|
9,835,992 |
|
$ |
4.39 |
|
6.23 |
|
$ |
5,734 |
|
|
Authorized |
|
4,453,425 |
|
— |
|
|
|
|
|
|
|
|
|
|
Stock options granted |
|
(300,000) |
|
300,000 |
|
|
4.20 |
|
|
|
|
|
|
|
Issuance of shares under 2016 Bonus Plans |
|
(1,688,097) |
|
— |
|
|
|
|
|
|
|
|
|
|
Shares withheld from net settlement of restricted stock units |
|
677,547 |
|
— |
|
|
|
|
|
|
|
|
|
|
Restricted stock units granted |
|
(9,329,181) |
|
— |
|
|
|
|
|
|
|
|
|
|
Exercised |
|
— |
|
(1,172,409) |
|
|
2.80 |
|
|
|
|
|
|
|
Stock options canceled |
|
1,225,087 |
|
(1,225,087) |
|
|
6.24 |
|
|
|
|
|
|
|
Restricted stock units canceled |
|
2,621,801 |
|
— |
|
|
|
|
|
|
|
|
|
|
Balance—December 31, 2017 |
|
1,859,997 |
|
7,738,496 |
|
$ |
4.34 |
|
3.96 |
|
$ |
4,897 |
|
|
Vested and exercisable—December 31, 2017 |
|
|
|
6,487,209 |
|
$ |
4.31 |
|
|
|
$ |
4,550 |
|
|
Vested and expected to vest(1)—December 31, 2017 |
|
|
|
7,573,659 |
|
$ |
4.34 |
|
|
|
$ |
4,849 |
|
|
(1) |
Options expected to vest are net of an estimated forfeiture rate. |
89
Additional information regarding options outstanding at December 31, 2017 is as follows:
|
|
|
Options Outstanding |
|
Options Exercisable |
|
||||||||
|
|
|
|
|
Weighted- |
|
|
|
|
|
|
|
|
|
|
|
|
|
|
Average |
|
|
|
|
|
|
|
|
|
|
|
|
|
|
Remaining |
|
Weighted- |
|
|
|
Weighted- |
|
||
|
|
|
Number of |
|
Contractual |
|
Average |
|
Number of |
|
Average |
|
||
|
Range of exercises |
|
Shares |
|
Term (Years) |
|
Exercise Price |
|
Shares |
|
Exercise Price |
|
||
|
$0.04 — $3.08 |
|
1,604,778 |
|
2.89 |
|
$ |
1.35 |
|
1,514,153 |
|
$ |
1.25 |
|
|
$3.39 — $3.70 |
|
2,392,977 |
|
2.01 |
|
|
3.57 |
|
1,874,227 |
|
|
3.62 |
|
|
$3.77 — $5.77 |
|
2,211,667 |
|
5.39 |
|
|
4.94 |
|
1,757,782 |
|
|
5.04 |
|
|
$6.20 — $10.80 |
|
1,488,249 |
|
6.03 |
|
|
7.67 |
|
1,307,008 |
|
|
7.65 |
|
|
$12.05 — $12.05 |
|
40,825 |
|
6.67 |
|
|
12.05 |
|
34,039 |
|
|
12.05 |
|
|
Outstanding at December 31, 2017 |
|
7,738,496 |
|
3.96 |
|
$ |
4.34 |
|
6,487,209 |
|
$ |
4.31 |
|
The aggregate pretax intrinsic value of vested options exercised in 2017, 2016 and 2015 was $2.3 million, $1.4 million and $11.8 million, respectively. The intrinsic value is the difference between the estimated fair value of the Company’s common stock at the date of exercise and the exercise price for in-the-money options. The weighted-average grant-date fair value of options granted in 2017, 2016 and 2015 was $1.74, $1.42 and $3.04 per share, respectively.
Our stock-based compensation expense was recorded in the following cost and expense categories (in thousands):
|
|
|
|
|
|
|
|
|
|
|
|
|
|
Year Ended December 31, |
|||||||
|
|
|
2017 |
|
2016 |
|
2015 |
|||
|
Cost of revenue |
|
$ |
3,772 |
|
$ |
3,043 |
|
$ |
2,774 |
|
Research and development |
|
|
14,520 |
|
|
11,728 |
|
|
10,607 |
|
Sales and marketing |
|
|
8,659 |
|
|
10,474 |
|
|
9,508 |
|
General and administrative |
|
|
6,780 |
|
|
9,144 |
|
|
5,902 |
|
Total |
|
$ |
33,731 |
|
$ |
34,389 |
|
$ |
28,791 |
Determining Fair Value of Stock Options and ESPP
The fair value of each grant of stock options was determined by us using the methods and assumptions discussed below. Each of these inputs is subjective and generally requires significant judgment to determine.
Expected Term—The expected term of stock options represents the weighted-average period the stock options are expected to be outstanding. For option grants that are considered to be “plain vanilla”, we have opted to use the simplified method for estimating the expected term as provided by the Securities and Exchange Commission. The simplified method calculates the expected term as the average of time-to-vesting and the contractual life of the options. For ESPP, the expected term is based on the offering period and purchase periods within the offering period.
Expected Volatility—When we did not have a sufficient trading history for our common stock, the expected stock price volatility assumption was determined by examining the historical volatilities of a group of industry peers. As more historical data for our common stock became available, we began to use our own historical stock price volatility to determine expected stock price volatility.
Risk-Free Interest Rate—The risk free rate assumption was based on the U.S. Treasury instruments with terms that were consistent with the expected term of our stock options and ESPP.
Expected Dividend—The expected dividend assumption was based on our history and expectation of dividend payouts.
Forfeiture Rate—Forfeitures were estimated based on historical experience.
90
Fair Value of Common Stock—Since our IPO, the fair value of our common stock has been determined based on the closing price of our common stock on the NASDAQ Global Select Market.
We used the Black-Scholes Model to estimate the fair value of our stock options granted to employees with the following weighted-average assumptions:
|
|
|
Year ended December 31, |
|
||||
|
|
|
2017 |
|
2016 |
|
2015 |
|
|
Expected dividend yield |
|
— |
|
— |
|
— |
|
|
Risk-free interest rate |
|
2.1% |
|
1.4% - 1.5% |
|
1.6% - 1.8% |
|
|
Expected volatility |
|
40% |
|
42% |
|
43% - 45% |
|
|
Expected life (in years) |
|
6.1 |
|
6.1 |
|
5.5 - 6.1 |
|
We used the Black-Scholes model to estimate the fair value of our Employee Stock Purchase Plan awards with the following assumptions:
|
|
|
Year ended December 31, |
||||
|
|
|
2017 |
|
2016 |
|
2015 |
|
Expected dividend yield |
|
— |
|
— |
|
— |
|
Risk-free interest rate |
|
0.9% - 1.3% |
|
0.5% - 0.7% |
|
0.1% - 0.7% |
|
Expected volatility |
|
34% - 54% |
|
34% - 41% |
|
34% - 35% |
|
Expected life (in years) |
|
0.5 - 2.0 |
|
0.5 - 2.0 |
|
0.5 - 2.0 |
As required by Topic 718 Compensation—Stock Compensation, we estimate expected forfeitures and recognize compensation costs only for those equity awards expected to vest. Our stock options granted are typically granted with vesting terms of 48 months.
The following table summarizes our unrecognized stock-based compensation expense as of December 31, 2017 net of estimated forfeitures:
|
|
|
Unrecognized |
|
Remaining |
|
|
|
|
Stock-based |
|
Weighted-Average |
|
|
|
|
Compensation |
|
Recognition |
|
|
|
|
Expense |
|
Period |
|
|
|
|
(in millions) |
|
(in years) |
|
|
Stock options |
|
$ |
1.1 |
|
2.1 |
|
Restricted stock units |
|
|
42.8 |
|
2.7 |
|
ESPP |
|
|
1.0 |
|
0.6 |
|
Total |
|
$ |
44.9 |
|
|
11. Employee Benefit Plan
We maintain a defined contribution 401(k) plan. The plan covers all full-time U.S. employees over the age of 21. Each employee can contribute up to $18,000 annually (with a $6,000 catch up contribution limit for employees aged 50 or older). We have the option to provide matching contributions, but have not done so to date.
91
12. Commitments and Contingencies
Operating Leases
We lease our office facilities under noncancelable agreements expiring between 2018 and 2023. Rent expense in 2017, 2016 and 2015 was $7.2 million, $6.7 million and $4.7 million, respectively. The aggregate future minimum lease payments under the agreements as of December 31, 2017 are as follows (in thousands):
|
Year |
|
|
|
|
|
2018 |
|
$ |
7,195 |
|
|
2019 |
|
|
7,102 |
|
|
2020 |
|
|
5,573 |
|
|
2021 |
|
|
4,071 |
|
|
2022 |
|
|
3,085 |
|
|
Thereafter |
|
|
1,163 |
|
|
Total |
|
$ |
28,189 |
|
Litigation
On August 5, 2015, August 21, 2015 and August 24, 2015, purported stockholder class action lawsuits were filed in the Superior Court of California, Santa Clara County against the Company, certain of its officers, directors, underwriters and investors, captioned Schneider v. MobileIron, Inc., et al., Kerley v. MobileIron, Inc., et al. and Steinberg v. MobileIron, Inc., et al, which were subsequently consolidated under the case caption In re MobileIron Shareholder Litigation. The actions are purportedly brought on behalf of a putative class of all persons who purchased the Company’s securities issued pursuant or traceable to the Company’s registration statement and the June 12, 2014 initial public offering. The lawsuits assert claims for violations of Sections 11, 12(a)(2) and 15 of the Securities Act of 1933. The complaint sought, among other things, compensatory damages and attorney’s fees and costs on behalf of the putative class. On April 12, 2016, Plaintiffs filed a corrected consolidated complaint, which no longer named the underwriters or investors as defendants. On August 8, 2016 the Company filed a demurrer to the corrected consolidated complaint. The court overruled the demurrer on October 4, 2016.
On March 8, 2017, the Company reached an agreement in principle to settle the above-described actions and the court granted preliminary approval of that settlement on June 9, 2017. The court approved the settlement on August 21, 2017 and entered final judgment in the case on October 11, 2017 releasing all parties. The settlement called for a payment of $7.5 million to the plaintiffs in resolution of all claims against the Company, its officers, directors and the other defendants. The Company contributed $1.1 million to the settlement in 2017. This amount represented the remainder of the Company’s retention amount under its Director & Officer liability insurance policy. The balance was paid by the Company’s Director & Officer liability insurance.
While the Company and the other defendants continue to deny each of the plaintiffs’ claims and deny any liability, the Company agreed to the settlement solely to resolve the disputes, to avoid the costs and risks of further litigation and to avoid further distractions to management.
We continually evaluate uncertainties associated with litigation and record a charge equal to at least the minimum estimated liability for a loss contingency when both of the following conditions are met: (i) information available prior to issuance of the financial statements indicates that it is probable that a liability has been incurred at the date of the financial statements and (ii) the loss or range of loss can be reasonably estimated. If we determine that a loss is possible and a range of the loss can be reasonably estimated, we disclose the range of the possible loss in the Notes to the Consolidated Financial Statements. We evaluate, on a quarterly basis, developments in our legal matters that could affect the amount of liability that has been previously accrued, if any, and the matters and related ranges of possible losses disclosed, and make adjustments and changes to our disclosures as appropriate. Significant judgment is required to determine both likelihood of there being and the estimated amount of a loss related to such matters. Until the final resolution of such matters, there may be an exposure to loss, and such amounts could be material. An estimate of a reasonably possible loss (or a range of loss) cannot be made in our lawsuits at this time.
92
Indemnification
Under the indemnification provisions of our standard sales related contracts, we agree to defend and/or settle claims brought by third parties against our customers and channel partners alleging that our software or the customer’s use thereof infringes the third party’s intellectual property right, such as a patent right. These indemnification obligations are typically not subject to limitation; however if we believe such a claim is reasonably likely to occur and if it is commercially impractical for us to either procure the right for the customer to continue to use our software or modify our software so that it’s not infringing, we can terminate the customer agreement and refund the customer a portion of the license fees paid (prorated over the three year period from initial delivery for software licensed on a perpetual basis). We also on occasion indemnify our customers for other types of third party claims. In addition, we indemnify our officers, directors, and certain key employees while they are serving in such capacities in good faith. Through December 31, 2017, we have not received any material written claim for indemnification.
13. Segment Information
We conduct business globally. Our chief operating decision maker (Chief Executive Officer) reviews financial information presented on a consolidated basis accompanied by information about revenue by geographic region for purposes of allocating resources and evaluating financial performance. We have one business activity, and there are no segment managers who are held accountable for operations, operating results and plans for levels, components or types of products or services below the consolidated unit level. Accordingly, we are considered to be in a single reportable segment and operating unit structure.
Revenue by geographic region based on the billing address was as follows:
|
|
|
Year ended December 31, |
|
|||||||
|
(in thousands) |
|
2017 |
|
2016 |
|
2015 |
|
|||
|
Revenue |
|
|
|
|
|
|
|
|
|
|
|
United States |
|
$ |
81,335 |
|
$ |
77,039 |
|
$ |
74,235 |
|
|
International |
|
|
95,156 |
|
|
86,887 |
|
|
75,063 |
|
|
Total |
|
$ |
176,491 |
|
$ |
163,926 |
|
$ |
149,298 |
|
We recognized revenue of $22.0 million, or 12% of total revenue, from customers with a billing address in Germany in 2017. We recognized revenue of $21.3 million, or 13% of total revenue, from customers with a billing address in Germany in 2016. No other country, outside of the United States, exceeded 10% of the total revenue in 2017 or 2016. No country, outside of the United States, exceeded 10% of the total revenue in the year ended December 31, 2015.
As of December 31, 2017 and 2016, $2.7 million and $1.3 million or 30% and 24%, respectively, of our net Property and Equipment was attributable to our operations located in India. Substantially all other long-lived assets were attributable to operations in the United States.
93
14. Net Loss per Share
The following table sets forth the computation of basic and diluted net loss per share for 2017, 2016 and 2015 (in thousands, except per share data):
|
|
|
|
|
|
|
||||
|
|
|
Year ended December 31, |
|||||||
|
|
|
2017 |
|
2016 |
|
2015 |
|||
|
Numerator: |
|
|
|
|
|
|
|
|
|
|
Net loss |
|
$ |
(56,299) |
|
$ |
(67,180) |
|
$ |
(84,482) |
|
Denominator: |
|
|
|
|
|
|
|
|
|
|
Weighted–average shares outstanding |
|
|
93,771 |
|
|
85,853 |
|
|
78,867 |
|
Less: weighted average shares subject to repurchase |
|
|
(1) |
|
|
(8) |
|
|
(112) |
|
Weighted–average shares used to compute basic and diluted net loss per share |
|
|
93,770 |
|
|
85,845 |
|
|
78,755 |
|
Basic and diluted net loss per share |
|
$ |
(0.60) |
|
$ |
(0.78) |
|
$ |
(1.07) |
Basic net loss per share is computed by dividing the net loss by the weighted-average number of common shares outstanding for the period. Because we have reported a net loss for 2017, 2016 and 2015, the number of shares used to calculate diluted net loss per common share is the same as the number of shares used to calculate basic net loss per common share for those periods presented because the potentially dilutive shares would have been anti-dilutive if included in the calculation.
The following potentially dilutive securities outstanding have been excluded from the computation of diluted weighted-average shares outstanding because such securities have an antidilutive impact due to losses reported (in common stock equivalent shares):
|
|
|
December 31, |
||||
|
|
|
2017 |
|
2016 |
|
2015 |
|
Stock options outstanding, net of unvested exercised stock options |
|
7,738,496 |
|
9,838,463 |
|
11,511,175 |
|
Unvested restricted stock units |
|
12,906,030 |
|
10,474,975 |
|
7,832,962 |
|
ESPP shares |
|
726,643 |
|
676,196 |
|
584,222 |
|
Stock-settled bonus shares |
|
1,185,373 |
|
1,057,093 |
|
1,305,817 |
|
Total potentially dilutive securities |
|
22,556,542 |
|
22,046,727 |
|
21,234,176 |
For December 31, 2016 and 2015, we have corrected the previously reported amount to include 1.7 million and 1.9 million, respectively, of additional shares related to our ESPP and stock-settled bonus plans that were excluded from the computation of the weighted-average diluted shares because such securities have an antidilutive impact due to losses reported. We do not consider this correction to be material, and there was no impact to our consolidated financial statements.
15. Income Taxes
Loss before income taxes consisted of the following (in thousands):
|
|
Year ended December 31, |
|
|||||||
|
|
2017 |
|
2016 |
|
2015 |
|
|||
|
United States |
$ |
(56,852) |
|
$ |
(67,402) |
|
$ |
(84,595) |
|
|
International |
|
1,695 |
|
|
1,204 |
|
|
965 |
|
|
Total |
$ |
(55,157) |
|
$ |
(66,198) |
|
$ |
(83,630) |
|
A significant portion of our international income is earned by foreign branches of our United States parent corporation and thus is already subject to United States taxation. The income of our foreign branches has been included as part of the United States jurisdiction in the table above.
94
Income tax expense for 2017, 2016 and 2015, was composed of the following (in thousands):
|
|
|
Year ended December 31, |
|
|||||||
|
|
|
2017 |
|
2016 |
|
2015 |
|
|||
|
Current: |
|
|
|
|
|
|
|
|
|
|
|
Federal |
|
$ |
— |
|
$ |
— |
|
$ |
— |
|
|
State |
|
|
36 |
|
|
22 |
|
|
26 |
|
|
Foreign |
|
|
1,196 |
|
|
960 |
|
|
826 |
|
|
Total current income tax expense |
|
|
1,232 |
|
|
982 |
|
|
852 |
|
|
Foreign |
|
|
(90) |
|
|
— |
|
|
— |
|
|
Total deferred income tax benefit |
|
|
(90) |
|
|
— |
|
|
— |
|
|
Total income tax expense |
|
$ |
1,142 |
|
$ |
982 |
|
$ |
852 |
|
For 2017, 2016 and 2015, our effective tax rate differs from the amount computed by applying the statutory federal and state income tax rates to net loss before income tax, primarily as the result of changes in our valuation allowance.
|
|
|
Year ended December 31, |
|
||||
|
|
|
2017 |
|
2016 |
|
2015 |
|
|
Federal tax benefit at statutory rate |
|
34.0 |
% |
34.0 |
% |
34.0 |
% |
|
State tax benefit net of federal effect |
|
8.8 |
|
4.4 |
|
2.2 |
|
|
Foreign taxes |
|
(0.7) |
|
(0.4) |
|
(0.4) |
|
|
Change in valuation allowance |
|
42.8 |
|
(33.0) |
|
(33.9) |
|
|
Change in federal tax rate |
|
(86.1) |
|
— |
|
— |
|
|
Credits |
|
3.4 |
|
1.8 |
|
1.5 |
|
|
Stock-based compensation |
|
(3.9) |
|
(8.0) |
|
(4.1) |
|
|
Non-deductible expenses and other |
|
(0.4) |
|
(0.3) |
|
(0.4) |
|
|
Effective tax rate |
|
(2.1) |
% |
(1.5) |
% |
(1.1) |
% |
Income tax expense for 2017, 2016 and 2015 relates to state minimum income tax, income tax on our earnings in foreign jurisdictions and withholding taxes on sales to customers in certain jurisdictions. A significant portion of our international income is earned by foreign branches of our United States parent corporation and thus is already subject to United States taxation. The income of our foreign branches has been included as part of the United States jurisdiction in the table above.
The components of net deferred tax assets at December 31, 2017 and 2016 consisted of the following (in thousands):
|
|
|
As of December 31, |
|
||||
|
|
|
2017 |
|
2016 |
|
||
|
Deferred tax assets: |
|
|
|
|
|
|
|
|
Accruals and allowances |
|
$ |
7,440 |
|
$ |
8,862 |
|
|
Gains on foreign exchange |
|
|
(18) |
|
|
81 |
|
|
Net operating loss carryforwards |
|
|
67,980 |
|
|
81,623 |
|
|
Depreciation and amortization |
|
|
3,512 |
|
|
6,489 |
|
|
R&D tax credits |
|
|
14,560 |
|
|
10,461 |
|
|
Stock-based compensation |
|
|
6,333 |
|
|
10,272 |
|
|
Valuation allowance |
|
|
(99,716) |
|
|
(117,788) |
|
|
Net deferred tax assets |
|
$ |
91 |
|
$ |
— |
|
Our accounting for deferred taxes involves the evaluation of a number of factors concerning the realizability of our net deferred tax assets. We primarily considered such factors as our history of operating losses, the nature of our deferred tax assets and the timing, likelihood and amount, if any, of future taxable income during the periods in which those temporary differences and carryforwards become deductible. At present, we do not believe that it is more likely
95
than not that the deferred tax assets will be realized; accordingly, a full valuation allowance has been established and no deferred tax asset is shown in the accompanying consolidated balance sheets.
On December 22, 2017, the Tax Cuts and Jobs Act of 2017 (the “Tax Act”) was signed into law making significant changes to the Internal Revenue Code. Changes include, but are not limited to, a corporate tax rate decrease from 35% to 21% effective for tax years beginning after December 31, 2017, the transition of U.S. international taxation from a worldwide tax system to a territorial system, and a one-time transition tax on the mandatory deemed repatriation of cumulative foreign earnings as of December 31, 2017.
The Company has calculated its best estimate of the impact of the Tax Act in its year end income tax provision in accordance with its understanding of the Tax Act and guidance available as of the date of this filing. The provisional amount related to the remeasurement of certain deferred tax assets and liabilities based on the rates at which they are expected to reverse in the future was approximately $44.7 million with a corresponding and fully offsetting adjustment to our valuation allowance for the year ended December 31, 2017. The Company does not expect a material impact related to the one-time transition tax on the mandatory deemed repatriation of foreign earnings.
On December 22, 2017, Staff Accounting Bulletin No. 118 ("SAB 118") was issued to address the application of U.S. GAAP in situations when a registrant does not have the necessary information available, prepared, or analyzed (including computations) in reasonable detail to complete the accounting for certain income tax effects of the Tax Act. Because the Company is still in the process of analyzing certain provisions of the Tax Act including the application of new executive compensation limitation provisions under Internal Revenue Section 162(m) and also its treatment of potential global intangible low-taxed income (“GILTI”), in accordance with SAB 118, the Company has determined that the adjustment to its deferred taxes was a provisional amount and a reasonable estimate at December 31, 2017.
As of December 31, 2017, we had net operating loss carryforwards of approximately $288.6 million and $133.6 million available to reduce future taxable income, if any, for both federal and state income tax purposes, respectively. The federal and state net operating loss carryforwards will expire at various dates beginning 2027 and 2028, respectively.
We had federal and California R&D tax credit carryforwards at December 31, 2017 of $11.1 million and $12.0 million, respectively. If not utilized, the federal R&D tax credit carryforward will expire in various portions beginning 2027. The California R&D tax credit can be carried forward indefinitely.
A limitation may apply to the use of the net operation loss and credit carryforwards, under provisions of the Internal Revenue Code that are applicable if we experience an “ownership change”. That may occur, for example, as a result of trading in our stock by significant investors as well as issuance of new equity. Should these limitations apply, the carryforwards would be subject to an annual limitation, resulting in a substantial reduction in the gross deferred tax assets before considering the valuation allowance. Further, a portion of the carryforwards may expire before being applied to reduce future earnings.
On January 1, 2017, the Company adopted ASU 2016-09, which simplified several aspects of accounting for employee share-based payment transactions, including the accounting for income taxes, forfeitures, statutory tax withholding requirements and classification in the statement of cash flows. The adoption of ASU 2016-09 did not have an impact on our balance sheet, results of operations, cash flows or statement of stockholders’ equity because we have a full valuation allowance on our deferred tax assets. Upon adoption, the Company recognized the previously unrecognized excess tax benefits using the modified retrospective transition method. The previously unrecognized excess tax effects were recorded as a deferred tax asset, which was fully offset by a valuation allowance. Without the valuation allowance, the Company’s deferred tax assets would have increased by $5.4 million.
We follow the provisions of ASC 740-10, Accounting for Uncertainty in Income Taxes. ASC 740-10 prescribes a comprehensive model for the recognition, measurement, presentation and disclosure in financial statements of uncertain tax positions that have been taken or expected to be taken on a tax return. No non-current liability related to uncertain tax positions is recorded in the financial statements as the deferred tax assets have been presented net of these unrecognized tax benefits. At December 31, 2017 and 2016, our reserve for unrecognized tax benefits was approximately $6.8 million and $5.3 million, respectively. Due to the full valuation allowance at December 31, 2017, current adjustments to the unrecognized tax benefit will have no impact on our effective income tax rate; any adjustments made
96
after the valuation allowance is released will have an impact on the tax rate. We do not anticipate any significant change in our uncertain tax positions within 12 months of this reporting date. We include penalties and interest expense related to income taxes as a component of other expense and interest expense, respectively, as necessary.
A reconciliation of the gross unrealized tax benefits is as follows (in thousands):
|
|
|
Year ended December 31, |
|
|||||||
|
|
|
2017 |
|
2016 |
|
2015 |
|
|||
|
Unrecognized tax benefits, beginning of year |
|
$ |
5,306 |
|
$ |
4,052 |
|
$ |
2,794 |
|
|
Gross increases—tax positions from prior periods |
|
|
34 |
|
|
43 |
|
|
— |
|
|
Gross increases—tax positions from current period |
|
|
1,499 |
|
|
1,211 |
|
|
1,258 |
|
|
Unrecognized tax benefits, end of year |
|
$ |
6,839 |
|
$ |
5,306 |
|
$ |
4,052 |
|
We are subject to taxation in the United States and various states and foreign jurisdictions. As of December 31, 2017, the statute of limitations is open for all tax years from inception, that is, for the period from July 23, 2007 (date of inception) to December 31, 2017 and forward for federal, state and foreign tax purposes.
Item 9. Changes in and Disagreements with Accountants on Accounting and Financial Disclosure
None.
Item 9A. Controls and Procedures
Limitations on Effectiveness of Controls
In designing and evaluating the disclosure controls and procedures, management recognizes that any controls and procedures, no matter how well designed and operated, can provide only reasonable assurance of achieving the desired control objectives. In addition, the design of disclosure controls and procedures must reflect the fact that there are resource constraints and that management is required to apply its judgment in evaluating the benefits of possible controls and procedures relative to their costs.
Evaluation of Disclosure Controls and Procedures
Our management evaluated, with the participation of our Chief Executive Officer and Chief Financial Officer, the effectiveness of our disclosure controls and procedures as of December 31, 2017. The term “disclosure controls and procedures,” as defined in Rule 13a-15 under the Securities Exchange Act of 1934, as amended, or the Exchange Act, means controls and other procedures of a company that are designed to ensure that information required to be disclosed by a company in the reports that it files or submits under the Exchange Act is recorded, processed, summarized and reported, within the time periods specified in the SEC’s rules and forms. Disclosure controls and procedures include, without limitation, controls and procedures designed to provide a reasonable assurance that information required to be disclosed by a company in the reports that it files or submits under the Exchange Act is accumulated and communicated to the company’s management, including its principal executive and principal financial officers, as appropriate to allow timely decisions regarding required disclosure.
Based on this evaluation, our Chief Executive Officer and Chief Financial Officer concluded that, as of December 31, 2017, our disclosure controls and procedures were effective to provide reasonable assurance that information we are required to disclose in reports that we file or submit under the Exchange Act were (i) recorded, processed, summarized, and reported within the time periods specified in Securities and Exchange Commission rules and forms, and (ii) accumulated and reported to our management, including our Chief Executive Officer and Chief Financial Officer to allow timely decisions regarding required disclosure.
97
Management’s Report on Internal Controls
Our management is responsible for establishing and maintaining effective internal control over financial reporting as defined in Rule 13a-15(f) under the Exchange Act. Our internal controls over financial reporting are designed to provide reasonable assurance to the Company’s management and Board of Directors regarding the preparation and fair presentation of published financial statements in accordance with the GAAP, including those policies and procedures that (i) pertain to the maintenance of records that, in reasonable detail, accurately and fairly reflect the transactions and disposition of the assets of the Company, (ii) provide reasonable assurance that transactions are recorded as necessary to permit preparation of financial statements in accordance with GAAP and that receipts and expenditures are being made only in accordance with authorizations of management and directors of the Company, and (iii) provide reasonable assurance regarding prevention or timely detection of unauthorized acquisition, use or disposition of the Company’s assets that could have a material effect on the financial statements.
Because of its inherent limitations, internal control over financial reporting may not prevent or detect misstatements. Therefore, even those systems determined to be effective can provide only reasonable assurance with respect to financial statement preparation and presentation.
Our Chief Executive Officer and Chief Financial Officer, evaluated the effectiveness of our internal control over financial reporting as of December 31, 2017 based on the criteria established in Internal Control—Integrated Framework (2013) issued by the Committee of Sponsoring Organizations of the Treadway Commission (COSO framework).
Based on our assessment, we concluded that our internal control over financial reporting was effective as of December 31, 2017.
This Annual Report on Form 10-K does not include an audit or attestation report from our registered public accounting firm regarding our internal control over financial reporting. Our management’s report was not subject to audit or attestation by our registered public accounting firm pursuant to rules of the SEC that permits us to provide only management’s report in this annual report for so long as we remain an “emerging growth company” under the Jumpstart Our Business Startups Act.
Changes in Internal Control over Financial Reporting
There were no changes in our internal control over financial reporting identified in connection with the evaluation required by Rule 13a-15(d) and 15d-15(d) of the Exchange Act that occurred during the quarter ended December 31, 2017 that have materially affected, or are reasonably likely to materially affect, our internal control over financial reporting.
98
Certain information required by Part III is omitted from this Annual Report on Form 10-K since we intend to file our definitive proxy statement for our 2017 annual meeting of stockholders, or the Definitive Proxy Statement, pursuant to Regulation 14A of the Securities Exchange Act of 1934, as amended, not later than 120 days after December 31, 2017, and certain information to be included in the Definitive Proxy Statement is incorporated herein by reference
Item 10. Directors, Executive Officers and Corporate Governance
Executive Officers and Directors
Information responsive to this Item with respect to executive officers and directors is incorporated herein by reference to the information from our 2018 Proxy Statement under the sections titled “Executive Officers,” “Election of Directors,” “Section 16(a) Beneficial Ownership Reporting Compliance” and “Information Regarding the Board of Directors and Corporate Governance.”
Code of Conduct
As part of our system of corporate governance, our board of directors has adopted a code of business conduct and ethics. The code applies to all of our employees, officers (including our principal executive officer, principal financial officer, principal accounting officer or controller, or persons performing similar functions), agents and representatives, including our independent directors and consultants, who are not employees of ours, with regard to their MobileIron-related activities. Our code of business conduct and ethics is available on our website at www.mobileiron.com. We will post on our website any amendment to our code of business conduct and ethics, as well as any waivers of our code of business conduct and ethics, that are required to be disclosed by the rules of the SEC or the NASDAQ Stock Market.
Item 11. Executive Compensation
Information responsive to this Item with respect to executive compensation is incorporated herein by reference to the information from our 2018 Proxy Statement under the section titled “Executive Compensation,” “Director Compensation,” “Summary Compensation Table,” “Outstanding Equity Awards at Fiscal Year-End,” and “Compensation Committee.”
Item 12. Security Ownership of Certain Beneficial Owners and Management and Related Stockholder Matters
Information responsive to this Item with respect to security ownership of certain beneficial owners and management is incorporated herein by reference to the information from our 2018 Proxy Statement under the section titled “Security Ownership of Certain Beneficial Owners and Management” and “Potential Payments and Acceleration of Equity upon Termination or Termination in Connection with a Change in Control.” Information regarding our stockholder approved and non-approved equity compensation plans are incorporated by reference to the section entitled “Equity Compensation Plan Information
Item 13. Certain Relationships and Related Transactions, and Director Independence
Information responsive to this item with respect to certain relationships and related transactions, and director independence is incorporated herein by reference to the information from our 2018 Proxy Statement under the section titled “Transactions with Related Persons” and “Independence of the Board of Directors.”
Item 14. Principal Accountant Fees and Services
Information responsive to this item with respect to principal accountant fees and services is incorporated herein by reference to the information from our 2018 Proxy Statement under the section titled “Principal Accountant Fees and Services.”
99
Item 15. Exhibits and Financial Statement Schedules
Documents filed as part of this report are as follows:
|
1. |
Consolidated Financial Statements: |
|
|
|
|
|
Our Consolidated Financial Statements are listed in the “Index to Consolidated Financial Statements” Under Part II, Item 8 of this report. |
|
|
|
|
2. |
Financial Statement Schedules: |
|
|
|
|
|
Financial statement schedules have been omitted because they are not applicable or the required information is shown in the Consolidated Financial Statements or Notes to Consolidated Financial Statements included in Part II, Item 8 “Financial Statements and Supplementary Data” of this report. |
|
|
|
|
3. |
Exhibits: |
100
|
EXHIBIT INDEX |
||||||
|
|
|
Incorporated by Reference |
|
|
|
|
|
Exhibit |
|
Exhibit |
|
Filing |
|
Filed |
|
Number |
Description |
Number |
Filing |
Date |
File No. |
Herewith |
|
Amended and Restated Certificate of Incorporation of MobileIron, Inc. |
3.1 |
8-K |
June 17, 2014 |
001-36471 |
|
|
|
3.4 |
S-1/A |
May 29, 2014 |
333-195089 |
|
||
|
4.1 |
Reference is made to Exhibits 3.1 and 3.2 above |
|
|
|
|
|
|
Amended and Restated Investors’ Rights Agreement, dated August 29, 2013 |
4.2 |
S-1 |
April 7, 2014 |
333-195089 |
|
|
|
10.1(1) |
Amended and Restated MobileIron, Inc. 2014 Equity Incentive Plan |
10.2 |
10-Q |
July 29, 2016 |
001-36471 |
|
|
10.2(1) |
Form of Option Agreement and Option Grant Notice for MobileIron, Inc. 2008 Stock Plan |
10.4 |
S-1/A |
May 29, 2014 |
333-195089 |
|
|
10.3(1) |
10.1 |
10-Q |
October 31, 2014 |
001-36471 |
|
|
|
10.4(1) |
10.5 |
S-1/A |
June 9, 2014 |
333-195089 |
|
|
|
10.5(1) |
10.2 |
10-Q |
July 29, 2016 |
001-36471 |
|
|
|
10.6(1) |
10.2 |
8-K |
January 6, 2016 |
001-36471 |
|
|
101
|
10.7(1) |
10.3 |
8-K |
January 6, 2016 |
001-36471 |
|
|
|
10.8† |
10.17 |
S-1/A |
May 7, 2014 |
333-195089 |
|
|
|
Amendment to Resale Agreement between MobileIron, Inc. and AT&T Services, Inc., dated April 4, 2016 |
10.6 |
10-Q |
July 29, 2016 |
001-36471 |
|
|
|
10.7 |
S-1 |
April 7, 2014 |
333-195089 |
|
||
|
10.8 |
S-1/A |
April 23, 2014 |
333-195089 |
|
||
|
10.8 |
10-Q |
August 7, 2014 |
001-36471 |
|
||
|
Lease between MobileIron, Inc., and WTA Middlefield LLC, dated May 14, 2015 |
10.1 |
8-K |
May 20, 2015 |
001-36471 |
|
|
|
10.1 |
8-K |
November 12, 2015 |
001-36471 |
|
102
|
10.15(1) |
10.6 |
S-1 |
April 7, 2014 |
333-195089 |
|
|
|
10.16(1) |
10.18 |
10-K |
February 14, 2017 |
001-36471 |
|
|
|
10.17(1) |
At-Will Employment Agreement between MobileIron, Inc. and Daniel Fields, dated December 29, 2015 |
10.31 |
10-K |
February 23, 2016 |
001-36471 |
|
|
10.18(1) |
10.21 |
10-K |
February 14, 2017 |
001-36471 |
|
|
|
10.19(1) |
MobileIron, Inc. Severance Benefit Plan and Participation Notice |
10.4 |
10-Q |
May 4, 2015 |
001-36471 |
|
|
10.20(1) |
MobileIron, Inc. Amended and Restated Non-Employee Director Compensation Policy |
10.3 |
10-Q |
July 29, 2016 |
001-36471 |
|
|
Sublease, effective March 1, 2017, between MobileIron, Inc. and Vendavo, Inc. |
10.1 |
8-K |
March 3, 2017 |
001-36471 |
|
|
|
10.1 |
8-K |
April 25, 2017 |
001-36471 |
|
||
|
10.3 |
10-Q |
May 2, 2017 |
001-36471 |
|
||
|
10.1 |
10-Q |
November 3, 2017 |
001-36471 |
|
||
|
Offer Letter between the Company and Greg Randolph, dated October 29, 2017 |
10.2 |
10-Q |
November 3, 2017 |
001-36471 |
|
103
|
Offer Letter between the Company and Simon Biddiscombe, dated November 2, 2017 |
10.3 |
10-Q |
November 3, 2017 |
001-36471 |
|
|
|
Bonus Retention Agreement between the Company and Daniel Fields, dated October 31, 2017 |
10.4 |
10-Q |
November 3, 2017 |
001-36471 |
|
|
|
Separation Agreement between the Company and Barry Mainz, dated October 31, 2017 |
10.5 |
10-Q |
November 3, 2017 |
001-36471 |
|
|
|
|
|
|
|
|||
|
|
|
|
|
|||
|
Consent of Deloitte & Touche LLP, Independent Registered Public Accounting Firm |
|
|
|
|
||
|
|
|
|
|
X |
||
|
|
|
|
|
|||
|
|
|
|
|
|||
|
|
|
|
|
104
|
99.1* |
Amendments to Resale Agreement between MobileIron, Inc. and AT&T Services, Inc., various dates |
99.1 |
8-K |
February 6, 2017 |
|
|
|
EX—101.INS |
|
XBRL Instance Document |
|
EX—101.SCH |
|
XBRL Taxonomy Extension Schema |
|
EX—101.CAL |
|
XBRL Taxonomy Extension Calculation Linkbase |
|
EX—101.DEF |
|
XBRL Taxonomy Extension Definition Linkbase |
|
EX—101.LAB |
|
XBRL Taxonomy Extension Label Linkbase |
|
EX—101.PRE |
|
XBRL Taxonomy Extension Presentation Linkbase |
|
† |
Certain portions of this exhibit are subject to a confidential treatment order. Omitted portions have been filed separately with the Securities and Exchange Commission. |
|
* |
Confidential treatment requested as to certain portions of this exhibit, which portions are omitted and filed separately with the Securities and Exchange Commission. |
|
(1) |
Management contract or compensation plan or arrangement. |
|
(2) |
The certifications attached as Exhibit 32.1 accompany this Annual Report on Form 10-K pursuant to 18 U.S.C. Section 1350, as adopted pursuant to Section 906 of the Sarbanes-Oxley Act of 2002, and shall not be deemed “filed” by the Registrant for purposes of Section 18 of the Securities Exchange Act of 1934, as amended. |
105
Pursuant to the requirements of Section 13 or 15(d) of the Securities Exchange Act of 1934, the registrant has duly caused this report to be signed on its behalf by the undersigned, thereunto duly authorized.
|
|
MOBILEIRON, INC. |
|
|
|
|
|
|
|
|
|
|
|
By: |
/s/ Simon Biddiscombe |
|
|
|
Simon Biddiscombe |
|
|
|
President and Chief Executive Officer (Principal Executive Officer) |
|
|
|
|
|
|
By: |
/s/ Shawn Ayers |
|
|
|
Shawn Ayers |
|
|
|
Interim Chief Financial Officer (Principal Financial Officer and Accounting Officer) |
Dated: March 12, 2018
The undersigned directors and officers of MobileIron, Inc. (the “Company”), a Delaware corporation, hereby constitute and appoint Simon Biddiscombe and Shawn Ayers, and each of them with full power to act without the other, the undersigned’s true and lawful attorney-in-fact, with full power of substitution and re-substitution, for the undersigned and in the undersigned’s name, place and stead in the undersigned’s capacity as an officer and/or director of the Company, to execute in the name and on behalf of the undersigned this Report and to file such Report, with exhibits thereto and other documents in connection therewith and any and all amendments thereto, with the Securities and Exchange Commission, granting unto said attorneys-in-fact, and each of them, full power and authority to do and perform each and every act and thing necessary or desirable to be done and to take any other action of any type whatsoever in connection with the foregoing which, in the opinion of such attorney-in-fact, may be of benefit to, in the best interest of, or legally required of, the undersigned, it being understood that the documents executed by such attorney-in-fact on behalf of the undersigned pursuant to this Power of Attorney shall be in such form and shall contain such terms and conditions as such attorney-in-fact may approve in such attorney-in-fact’s discretion.
106
Pursuant to the requirements of the Securities Exchange Act of 1934, this Report has been signed below (and the above Powers of Attorney granted) by the following persons on behalf of the Registrant and in the capacities and on the dates indicated.
|
Signature |
|
Title |
|
Date |
|
|
|
|
|
|
|
|
|
|
|
|
|
/s/ Simon Biddiscombe |
|
|
|
March 12, 2018 |
|
Simon Biddiscombe |
|
President and Chief Executive Officer (Principal Executive Officer) |
|
|
|
|
|
|
|
|
|
/s/ Shawn Ayers |
|
|
|
March 12, 2018 |
|
Shawn Ayers |
|
Interim Chief Financial Officer (Principal Financial Officer and Accounting Officer) |
|
|
|
|
|
|
|
|
|
/s/ Kenneth Klein |
|
|
|
March 12, 2018 |
|
Kenneth Klein |
|
Director |
|
|
|
|
|
|
|
|
|
/s/ Aaref Hilaly |
|
|
|
March 12, 2018 |
|
Aaref Hilaly |
|
Director |
|
|
|
|
|
|
|
|
|
/s/ Matthew Howard |
|
|
|
March 12, 2018 |
|
Matthew Howard |
|
Director |
|
|
|
|
|
|
|
|
|
/s/ Frank Marshall |
|
|
|
March 12, 2018 |
|
Frank Marshall |
|
Director |
|
|
|
|
|
|
|
|
|
/s/ Tae Hea Nahm |
|
|
|
March 12, 2018 |
|
Tae Hea Nahm |
|
Director |
|
|
|
|
|
|
|
|
|
/s/ James Tolonen |
|
|
|
March 12, 2018 |
|
James Tolonen |
|
Director |
|
|
|
|
|
|
|
|
|
/s/ Jessica Denecour |
|
|
|
March 12, 2018 |
|
Jessica Denecour |
|
Director |
|
|
|
|
|
|
|
|
107