Attached files
| file | filename |
|---|---|
| EX-32.1 - EX-32.1 - MARLIN BUSINESS SERVICES CORP | d503389dex321.htm |
| EX-31.2 - EX-31.2 - MARLIN BUSINESS SERVICES CORP | d503389dex312.htm |
| EX-31.1 - EX-31.1 - MARLIN BUSINESS SERVICES CORP | d503389dex311.htm |
| EX-23.1 - EX-23.1 - MARLIN BUSINESS SERVICES CORP | d503389dex231.htm |
| EX-21.1 - EX-21.1 - MARLIN BUSINESS SERVICES CORP | d503389dex211.htm |
Table of Contents
UNITED STATES
SECURITIES AND EXCHANGE COMMISSION
Washington, D.C. 20549
Form 10-K
(Mark One)
| ☑ | ANNUAL REPORT PURSUANT TO SECTION 13 OR 15(d) OF THE SECURITIES EXCHANGE ACT OF 1934 |
For the fiscal year ended December 31, 2017
or
| ☐ | TRANSITION REPORT PURSUANT TO SECTION 13 OR 15(d) OF THE SECURITIES EXCHANGE ACT OF 1934 |
For the transition period from to
Commission file number 000-50448
Marlin Business Services Corp.
(Exact name of Registrant as specified in its charter)
| Pennsylvania | 38-3686388 | |
| (State of incorporation) | (I.R.S. Employer Identification No.) |
300 Fellowship Road, Mount Laurel, NJ 08054
(Address of principal executive offices)
Registrant’s telephone number, including area code:
(888) 479-9111
Securities registered pursuant to Section 12(b) of the Act:
| Title of Each Class |
Name of Each Exchange on Which Registered | |
| Common Stock, $.01 par value | The NASDAQ Stock Market LLC |
Securities registered pursuant to Section 12(g) of the Act:
None
Indicate by check mark if the registrant is a well-known seasoned issuer, as defined in Rule 405 of the Securities Act. Yes ☐ No ☑
Indicate by check mark if the registrant is not required to file reports pursuant to Section 13 or Section 15(d) of the Act. Yes ☐ No ☑
Indicate by check mark whether the Registrant (1) has filed all reports required to be filed by Section 13 or 15(d) of the Securities Exchange Act of 1934 during the preceding 12 months (or for such shorter period that the Registrant was required to file such reports), and (2) has been subject to such filing requirements for the past 90 days. Yes ☑ No ☐
Indicate by check mark whether the registrant has submitted electronically and posted on its corporate Web site, if any, every Interactive Data File required to be submitted and posted pursuant to Rule 405 of Regulation S-T during the preceding 12 months (or for such shorter period that registrant was required to submit and post such files.) Yes ☑ No ☐
Indicate by check mark if disclosure of delinquent filers pursuant to Item 405 of Regulation S-K is not contained herein, and will not be contained, to the best of Registrant’s knowledge, in definitive proxy or information statements incorporated by reference in Part III of this Form 10-K or any amendment to this Form 10-K. ☐
Indicate by check mark whether the registrant is a large accelerated filer, an accelerated filer, a non-accelerated filer, or a smaller reporting company. See definition of “large accelerated filer,” “accelerated filer,” and “smaller reporting company” in Rule 12b-2 of the Exchange Act. (Check one):
| Large accelerated filer | ☐ | Accelerated filer | ☑ | |||
| Non-accelerated filer | ☐ (Do not check if a smaller reporting company) | Smaller reporting company | ☐ | |||
| Emerging growth company | ☐ |
If an emerging growth company, indicate by check mark if the registrant has elected not to use the extended transition period for complying with any new or revised financial accounting standards provided pursuant to Section 13(a) of the Exchange Act.
Indicate by check mark whether the Registrant is a shell company (as defined in Exchange Act Rule 12b-2). Yes ☐ No ☑
The aggregate market value of the voting common stock held by non-affiliates of the Registrant, based on the closing price of such shares on the NASDAQ Global Select Market was approximately $214,444,267 as of June 30, 2017. Shares of common stock held by each executive officer and director and persons known to us who beneficially own 5% or more of our outstanding common stock have been excluded from this computation in that such persons may be deemed to be affiliates. This determination of affiliate status is not necessarily a conclusive determination for other purposes.
The number of shares of Registrant’s common stock outstanding as of February 27, 2018 was 12,433,527 shares.
DOCUMENTS INCORPORATED BY REFERENCE
Portions of the Registrant’s definitive Proxy Statement related to the 2018 Annual Meeting of Shareholders, to be filed with the Securities and Exchange Commission within 120 days of the close of Registrant’s fiscal year, are incorporated by reference into Part III of this Form 10-K.
Table of Contents
MARLIN BUSINESS SERVICES CORP. AND SUBSIDIARIES
FORM 10-K
Table of Contents
PART I
As used herein, the terms “Company,” “Marlin,” “Registrant,” “we,” “us” or “our” refer to Marlin Business Services Corp. and its subsidiaries.
| Item 1. | Business |
Overview
We are a nationwide provider of credit products and services to small businesses. The products and services we provide to our customers include loans and leases for the acquisition of commercial equipment and working capital loans. Our average original transaction size was approximately $16,000 at December 31, 2017, and we typically do not exceed $250,000 for any single lease or loan transaction. We acquire our small business customers primarily by offering equipment financing through independent commercial equipment dealers and various national account programs, through direct solicitation of our small business customers and through relationships with select lease and loan brokers. We also extend financing through direct solicitation of our existing small business customers. Through these origination partners, we are able to cost-effectively access small business customers while also helping our origination partners obtain financing for their customers. As of December 31, 2017, we serviced approximately 91,000 finance contracts having a total original value of $1.5 billion for approximately 77,000 small business customers. Our revenue consists of interest and fees from our leases and loans and, to a lesser extent, income from our property insurance program and other fee income, and is derived from customers in the United States.
The small balance commercial financing market is highly fragmented. We estimate that there are more than 100,000 independent commercial equipment dealers and other intermediaries who sell the types of equipment we finance or require the types of financing we provide. We believe this segment of equipment dealers is underserved because: (1) large commercial finance companies and large commercial banks typically concentrate their efforts on marketing their products and services directly to larger equipment manufacturers and larger distributors, rather than to independent equipment dealers; and (2) many smaller commercial finance companies and regional banking institutions have not developed the systems and infrastructure required to adequately service large volumes of low-balance transactions. We focus on establishing our relationships with independent equipment dealers who value convenient point-of-sale financing programs because we can make their sale process more effective. By providing them with the ability to offer our financing and related services to their customers as an integrated part of their selling process, our origination partners are able to increase their sales and provide better service to their customers. By doing this, we are also able to gather small business customers to which we can sell additional credit products and services through our fully integrated origination platform which allows us to efficiently solicit, process and service a large number of low-balance financing transactions. From our inception in 1997 to December 31, 2017, we have processed approximately 1,111,000 lease applications and originated over 467,000 new leases.
Through the issuance of Federal Deposit Insurance Corporation (“FDIC”)-insured deposits, the Company’s wholly-owned subsidiary, Marlin Business Bank (“MBB”), serves as the Company’s primary funding source. MBB receives time deposits through a variety of sources including: directly from customers, through the use of on-line listing services, and through the use of deposit brokers. In the future MBB may elect to offer other products and services to the Company’s customer base. As a Utah state-chartered Federal Reserve member bank, MBB is supervised by both the Federal Reserve Bank of San Francisco and the Utah Department of Financial Institutions.
On January 13, 2009, Marlin Business Services Corp. became a bank holding company and is subject to the Bank Holding Company Act and supervised by the Federal Reserve Bank of Philadelphia. On September 15, 2010, the Federal Reserve Bank of Philadelphia confirmed the effectiveness of Marlin Business Services Corp.’s election to become a financial holding company (while remaining a bank holding company) pursuant to Sections 4(k) and (l) of the Bank Holding Company Act and Section 225.82 of the Federal Reserve Board’s Regulation Y.
-2-
Table of Contents
Such election permits Marlin Business Services Corp. to engage in activities that are financial in nature or incidental to a financial activity, including the maintenance and expansion of our reinsurance activities conducted through our wholly-owned subsidiary, AssuranceOne, Ltd. (“AssuranceOne”).
Competitive Strengths
We believe several characteristics may distinguish us from our competitors, including the following:
Multiple Sales Origination Channels. We use multiple sales origination channels to penetrate effectively the highly diversified and fragmented small-ticket equipment leasing market. We use both direct and indirect origination channels. Our direct channel involves soliciting our existing small business customer base for repeat business as well as identifying other small business customers who need financing. The indirect channel sources financing opportunities through our partner network and our broker network. Our indirect origination channels, which accounted for approximately 85% of the 2017 lease and loan new origination fundings, involve: (1) establishing relationships with independent equipment dealers; (2) securing endorsements from national equipment manufacturers and distributors to become the preferred lease financing source for the independent dealers who sell their equipment; and (3) establishing relationships with independent brokers who identify opportunities for us. Our broker network accounted for 14% of the indirect channel’s 2017 lease and loan new origination volume. Our direct origination channel accounted for approximately 15% of the 2017 lease and loan new origination volume.
Highly Effective Account Origination Platform. Our telephonic direct marketing platform and our strategic use of outside sales account executives offer origination partners a high level of personalized service through our team of sales account executives and sales support personnel. Our business model is built on a real-time, fully integrated customer information database and a contact management and telephony application that facilitate our account solicitation and servicing functions.
Comprehensive Credit Process. We seek to manage credit risk effectively at the origination partner as well as at the transaction and portfolio levels. Our comprehensive credit process starts with the qualification and ongoing review of our origination partners. Once the origination partner is approved, our credit process focuses on analyzing and underwriting the small business customer and the specific financing transaction, regardless of whether the transaction was originated through our direct or indirect origination channels. Our underwriting process involves the use of our customized acquisition scorecards along with detailed rules-based analysis conducted by our team of seasoned credit analysts.
Portfolio Diversification. As of December 31, 2017, no single small business customer accounted for more than 0.10% of our portfolio balance and leases from our largest origination partner accounted for only 2.09% of our portfolio. Our portfolio is also diversified nationwide with the largest state portfolios existing in California (13%), Texas (12%) and Florida (10%).
Fully Integrated Information Management System. Our business integrates information technology solutions to optimize the sales origination, credit, collection and account servicing functions. Throughout a transaction, we collect a significant amount of information on our origination partners and small business customers. The enterprise-wide integration of our systems enables data collected by one group, such as credit, to be used by other groups, such as sales or collections, to better perform their functions.
Sophisticated Collections Environment. Our centralized collections department is structured to collect delinquent accounts, minimize credit losses and maximize post charge-off recovery dollars. Our collection strategy employs a delinquency bucket segmentation approach, where certain collectors are assigned to accounts based on their delinquency status. We also stratify and assign our accounts to collectors based on other relevant criteria, such as customers with an early missed payment, risk profile and transaction size. This segmentation approach allows us to assign our more experienced collectors to the late stage delinquent accounts. In addition, the collections department also focuses on collecting delinquent late fees, property taxes, and other outstanding amounts due under the customer’s contracts.
-3-
Table of Contents
Access to Multiple Funding Sources. We have established and maintained diversified funding sources, with our wholly-owned subsidiary, MBB. MBB is currently our primary funding source through the issuance of fixed and variable rate FDIC-insured deposits raised nationally through direct platforms, listing services, and through various deposit brokers. Our proven ability to access funding consistently at competitive rates through various economic cycles provides us with the liquidity necessary to manage our business. (See Liquidity and Capital Resources in Item 7).
Experienced Management Team. Our executive officers have an average of more than 20 years of experience in financial services. As we have grown, we have expanded the management team with a group of successful, seasoned executives.
Disciplined Growth Strategy
Our primary objective is to enhance our current position as a provider of credit services to small and mid-sized businesses by pursuing a strategy focused primarily on organic growth initiatives while actively managing credit risk. We seek to maintain consistent credit quality standards while continuing to pursue strategies designed to increase the number of independent equipment dealers and other origination partners that generate and develop lease and loan customers. We also target strategies to further penetrate our existing origination partners.
Asset Originations
Overview of Origination Process. We access our small business customers through our extensive network of independent equipment dealers and through the direct solicitation of our small business customers. We use both a highly efficient telephonic direct sales model and, for strategic larger accounts, outside sales executives to market to our origination partners. Through these sources, we are able to deliver convenient and flexible financing solutions to our small business customers.
Our origination process begins with our database of thousands of origination partner prospects located throughout the United States. We develop and continually update this database by purchasing marketing data from third parties, such as Dun & Bradstreet, Inc., by joining industry organizations and by attending equipment trade shows. The prospects in our database are systematically distributed to our sales force for solicitation and further data collection. Sales account executives access prospect information and related marketing data through our contact management software. This contact management software enables the sales account executives to sort their origination partners and prospects by any data field captured, schedule calling campaigns, send e-mails, produce correspondence and documents, manage their time and calendar, track activity, recycle leads and review management reports.
Once a sales account executive converts a prospect into an active relationship, that sales account executive becomes the origination partner’s single point of contact for all dealings with us. This approach, which is a cornerstone of our origination platform, offers our origination partners a personal relationship through which they can address all of their questions and needs, including matters relating to pricing, credit, documentation, training and marketing. This single point of contact approach distinguishes us from our competitors, many of whom require origination partners to interface with several people in various departments, such as sales support, credit and customer service, for each application submitted. Since many of our origination partners have little or no prior experience in using lease financing as a sales tool, our personalized, single point of contact approach facilitates the leasing process for them. Other key aspects of our platform aimed at facilitating the lease financing process for the origination partners include:
| • | ability to submit applications via fax, phone, Internet, mail, e-mail, or web portal; |
| • | credit decisions generally within two hours; |
| • | one-page, plain-English form of lease for transactions up to $100,000; |
-4-
Table of Contents
| • | ability to use electronic documents with instantaneous routing; |
| • | check, wire, or ACH funding to the origination partner once all lease and loan origination conditions are satisfied; |
| • | value-added services, such as application and portfolio reporting, marketing support and sales training on the benefits of financing; |
| • | online portal for dealers to view current status and important information about their customers; |
| • | on-site or telephonic training of the equipment dealer’s sales force on leasing as a sales tool; and |
| • | custom leases and loan programs. |
Sales Origination Channels. We primarily use indirect sales origination channels to penetrate effectively a multitude of origination partners in the highly diversified and fragmented small-ticket equipment leasing market. All inside sales account executives use our telephonic direct marketing sales model to solicit these origination partners and small business customers.
Indirect Channels. Our direct sales origination channels, which account for approximately 87% of the active lease contracts in our portfolio, involve:
| • | Independent Equipment Dealer Solicitations. This origination channel focuses on soliciting and establishing relationships with independent equipment dealers in a variety of equipment categories located across the United States. Our typical independent equipment dealer has less than $12.0 million in annual revenues and fewer than 50 employees. Service is a key determinant in becoming the preferred provider of financing recommended by these equipment dealers. |
| • | Major and National Accounts. This channel focuses on two specific areas of development: (i) national equipment manufacturers and distributors, where we seek to leverage their endorsements to become the preferred lease financing source for their independent dealers, and (ii) major accounts (larger independent dealers, distributors and manufacturers) with a consistent flow of business that need a specialized marketing and sales platform to convert more sales using a leasing option. |
| • | Brokers. Our broker channels account for approximately 13% of the active lease contracts in our portfolio and consist of our relationships with lease brokers and certain equipment dealers who refer small business customer transactions to us for a fee or sell us leases that they originated with small business customers. We conduct our own independent credit analysis on each small business customer in a broker lease transaction. We have written agreements with most of our broker origination partners whereby they provide us with certain representations and warranties about the underlying lease transaction. The origination partners in our broker channels generate leases that are similar to those generated by our direct channels. |
| • | Direct Channel: This channel focuses primarily on soliciting our existing portfolio of approximately 77,000 small business customers for additional equipment leasing or working capital opportunities. We view our existing small business customers as an excellent source for additional business for various reasons, including (i) retained credit information; (ii) payment history; and (iii) a demonstrated propensity to finance their equipment. |
Product Offerings
Equipment Leases. The types of lease products offered by each of our sales origination channels share common characteristics, and we generally underwrite our leases using the same criteria. Our leases provide for non-cancelable rental payments due during the initial lease term. The initial non-cancelable lease term is equal to or less than the equipment’s economic life. Initial terms generally range from 36 to 72 months. At December 31, 2017, the average original term of the leases in our portfolio was approximately 48 months, and we had personal
-5-
Table of Contents
guarantees on approximately 42% of our leases. The remaining terms and conditions of our leases are substantially similar, generally requiring small business customers to, among other things:
| • | address any maintenance or service issues directly with the equipment dealer or manufacturer; |
| • | insure the equipment against property and casualty loss; |
| • | pay or reimburse us for all taxes associated with the equipment; |
| • | use the equipment only for business purposes; and |
| • | make all scheduled payments regardless of the performance of the equipment. |
We charge late fees when appropriate throughout the term of the lease. Our standard lease contract provides that in the event of a default, we can require payment of the entire balance due under the lease through the initial term and can take action to seize and remove the equipment for subsequent sale, refinancing or other disposal at our discretion, subject to any limitations imposed by law.
At the time of application, small business customers select a purchase option that will allow them to purchase the equipment at the end of the contract term for either one dollar, the fair market value of the equipment or a specified percentage of the original equipment cost. We seek to realize our recorded residual in leased equipment at the end of the initial lease term by collecting the purchase option price from the small business customer, re-marketing the equipment in the secondary market or receiving additional rental payments pursuant to the applicable contract’s renewal provision.
Property Insurance on Leased Equipment. Our lease agreements specifically require customers to obtain all-risk property insurance in an amount sufficient to cover the value of the equipment and to designate us as the loss payee on the policy. If the customer already has a commercial property policy for its business, it can satisfy its obligation under the lease by delivering a certificate of insurance that evidences us as the loss payee under that policy. At December 31, 2017, approximately 49% of our small business customers insured the equipment under their existing policies. For the others, we have a master property insurance policy underwritten by a third-party national insurance company that is licensed to write insurance under our program in all 50 states and the District of Columbia. This master policy names us as the beneficiary for all of the equipment insured under the policy and provides all-risk coverage for the value of the equipment.
In May 2000, we established AssuranceOne, our Bermuda-based, wholly-owned captive insurance subsidiary which enables us to reinsure the property insurance coverage for the equipment financed by MLC and MBB for our small business customers. Under this contract, AssuranceOne reinsures 100% of the risk under the master policy, and the issuing insurer pays AssuranceOne the policy premiums, less claims, premium tax and a ceding fee based on a percentage of annual net premiums written. The reinsurance contract is scheduled to expire in May 2018. On January 27, 2010, pursuant to an application filed with the Bermuda Monetary Authority, AssuranceOne changed from a Class 1 insurer to a Class 3 insurer under the Bermuda Insurance Act of 1978, as amended. As a Class 3 insurer, AssuranceOne is permitted to collect up to 50% of its premiums in connection with insurance coverage on equipment unrelated to the Company, meaning that, through AssuranceOne, we may offer an insurance product to cover equipment not otherwise financed through the Company.
Funding Stream: Small Business Loans. During the first quarter of 2015, the Company launched Funding Stream, a flexible loan program of MBB. Funding Stream is tailored to the small business market to provide customers a convenient, hassle-free alternative to traditional lenders and access to capital to help grow their businesses. Generally, these loans range from $5,000 to $150,000, have 6 to 24 month terms, and have automated daily or weekly payback. Small business owners can apply online, in ten minutes or less, on Fundingstream.com. Approved borrowers can receive funds in as little as two days.
-6-
Table of Contents
Portfolio Overview
At December 31, 2017, we had approximately 91,000 active Equipment Finance leases and loans in our portfolio, representing a period ending net investment in Equipment Finance lease and loans, excluding the allowance for credit losses, of $901.1 million. With respect to our portfolio at December 31, 2017:
| • | the average original Equipment Finance lease and loan transaction was approximately $16,000, with an average remaining balance of approximately $11,000; |
| • | the average original Equipment Finance lease and loan term was approximately 48 months; |
| • | our active Equipment Finance lease and loans were spread among approximately 77,000 different small business customers, with the largest single small business customer accounting for only 0.10% of the aggregate Equipment Finance minimum lease and loan payments receivable; |
| • | over 78.0% of the aggregate minimum Equipment Finance lease and loan payments receivable were with small business customers who had been in business for more than five years; |
| • | the portfolio was spread among 12,711 origination partners, with the largest source accounting for only 2.09% of the aggregate Equipment Finance minimum lease and loan payments receivable, and our 10 largest origination partners accounting for only 11.1% of the aggregate Equipment Finance minimum lease and loan payments receivable; |
| • | there were over 100 different equipment categories financed, with the largest categories set forth as follows, as a percentage of the December 31, 2017 aggregate Equipment Finance minimum lease and loan payments receivable: |
| Equipment Category |
Percentage | |||
| Copiers |
19.52 | % | ||
| Commercial & Industrial |
8.43 | % | ||
| Restaurant |
5.61 | % | ||
| Titled V-Commercial |
4.70 | % | ||
| Auto Equipment |
3.37 | % | ||
| Computer Software |
2.66 | % | ||
| Medical |
2.27 | % | ||
| VOIP |
2.21 | % | ||
| Cash Registers |
1.96 | % | ||
| Dental Implant Systems |
1.92 | % | ||
| Printing |
1.90 | % | ||
| All others (none more than 1.89%) |
45.45 | % | ||
-7-
Table of Contents
| • | we had leases outstanding with small business customers located in all 50 states and the District of Columbia, with our largest states of origination set forth below, as a percentage of the December 31, 2017 aggregate minimum lease payments receivable: |
| State |
Percentage | |||
| California |
12.55 | % | ||
| Texas |
12.17 | % | ||
| Florida |
10.18 | % | ||
| New York |
6.45 | % | ||
| New Jersey |
4.88 | % | ||
| Georgia |
4.21 | % | ||
| Pennsylvania |
3.89 | % | ||
| North Carolina |
3.46 | % | ||
| Illinois |
3.18 | % | ||
| Ohio |
2.29 | % | ||
| Virginia |
2.26 | % | ||
| Maryland |
2.22 | % | ||
| All others (none more than 2.21%) |
32.26 | % | ||
As of December 31, 2017, the Company had approximately 1,103 Funding Stream loans with a book value of $28.1 million on the balance sheet. Approximately 40% of our Funding Stream customers renew or take additional capital.
Information Management
A critical element of our business operations is our ability to collect detailed information on our origination partners and small business customers at all stages of a financing transaction and to manage that information effectively so that it can be used across all aspects of our business. Our information management system integrates a number of technologies to optimize our sales origination, credit, collection and account servicing functions. Applications used across our business include:
| • | a customer relationship management system that: (1) summarizes vital information on our prospects, origination partners, competitors and small business customers compiled from third-party data, trade associations, manufacturers, transaction information and data collected through the sales solicitation process; and (2) produces detailed reports using a variety of data fields to evaluate the performance and effectiveness of our sales account executives; |
| • | a call management reporting system that systematically analyzes call activity patterns to improve inbound and outbound calling campaigns for originations, collections and customer service; |
| • | a data warehouse that aggregates data from origination, sales, credit and servicing attributes based on the performance and preferences of our origination partners and small business customers. Organization leaders have direct access to monitor origination partners, trends, exposure, portfolio concentration and other key performance indicators; |
| • | an originations processing system that allows the organization to: |
| • | manage departmental tasks attributed to the full life cycle of an application; |
| • | automatically aggregate credit attributes from third party data sources; |
| • | automatically approve applications which qualify under certain guidelines, while rejecting those that do not qualify; and |
| • | allows for the automated submission of applications to syndication partners. |
-8-
Table of Contents
| • | a servicing software platform that facilitates: |
| • | contract maintenance; |
| • | delinquency management and collections; and |
| • | Payment assessment and processing. |
| • | predictive auto dialer technology that is used primarily in the collection processes to improve the efficiencies by which these groups make their daily phone calls; |
| • | imaging technology that enables our employees to retrieve at their desktops all documents evidencing a lease transaction, thereby further improving our operating efficiencies and service levels; |
| • | an integrated voice response unit that enables our small business customers the opportunity to quickly and efficiently obtain certain information from us about their accounts; and |
| • | a web-based, hosted transactional system for our dealer and end user community that provides several business critical functions including: |
| • | application entry and tracking; |
| • | real-time notification for application approvals; |
| • | portfolio management; |
| • | on-line retrieval of the approval package; |
| • | operational metrics; |
| • | invoice presentment and bill payment; and |
| • | contract management tools, such as online documents, change forms and other items. |
| • | eLink – An Application Programming Interface (API) that gives commercial equipment vendors the ability to integrate financing options directly into their ecommerce sales platform. |
Our information technology platform infrastructure is industry standard and fully scalable to support future growth. Our systems are backed up to an off-site storage provider after each business day. In addition, we have contracted with a third party for disaster recovery services.
Credit Underwriting
Credit underwriting is separately performed and managed apart from asset origination. Credit analysts are located in our New Jersey corporate office and at MBB’s office in Salt Lake City, Utah. At December 31, 2017 we had a total of 18 credit analysts and managers with an average of approximately 17 years of experience. Each credit analyst’s performance is measured monthly against a discrete set of performance variables, including decision turnaround time, performance metrics and adherence to our underwriting policies and procedures.
Our typical financing transaction involves three parties: the origination partner, the small business customer and us. The key elements of our comprehensive credit underwriting process include the qualification and ongoing review of origination partners, the performance of due diligence procedures on each small business customer and the monitoring of overall portfolio trends and underwriting standards.
Qualification and Ongoing Review of Origination Partners. Each origination partner is reviewed and qualified by the credit analyst. The origination partner’s credit information and references are reviewed as part of the qualification process. Over time, our database has captured credit profiles on thousands of origination partners. We regularly track all applications and lease and loan originations by source, assessing whether the origination partner has a high application decline rate and analyzing the portfolio performance of the leases and
-9-
Table of Contents
loans originated through that source. Any unusual situations that arise involving the origination partner are noted in the source’s file. Each origination partner is reviewed on a regular basis using portfolio performance statistics as well as any other information noted in the source’s file. We will place an origination partner on watch status if its portfolio performance statistics are consistently below our expectations. If the origination partner’s statistics do not improve in a timely manner, we often stop accepting applications from that origination partner. Some of our business is originated directly with the end user, therefore there is no origination partner involved.
Small Business Customer Review. Each small business customer’s application is reviewed using our customized acquisition scorecards along with our rules-based set of underwriting guidelines that focus on predictive commercial and consumer credit data. These underwriting guidelines have been developed and refined by our management team based on proven best practices and its experience in extending credit to small and mid-sized businesses. The guidelines are reviewed and revised as necessary by our Risk Committee, which is comprised of our Chief Risk Officer, Chief Executive Officer, Chief Operations Officer, General Counsel, President of MBB and Chief Lending Officer of MBB. Our underwriting guidelines require a thorough credit investigation of the small business customer. The guidelines may also include an analysis of the personal credit of the owner, who may guarantee the transaction, and verification of the corporate name and location. The credit analyst may also consider other factors in the credit decision process, including:
| • | financial strength of the business; |
| • | length of time in business; |
| • | confirmation of actual business operations and ownership; |
| • | management history, including prior business experience; |
| • | size of the business, including the number of employees; |
| • | third-party commercial credit data and consumer credit data (when applicable); |
| • | legal structure of business; and |
| • | fraud indicators. |
Transactions over $150,000 receive a higher level of scrutiny which may include a review of financial statements or tax returns and a review of the business purpose of the equipment to the small business customer.
Within two hours of receipt of the application, the credit analyst is usually ready to render a credit decision on transactions less than $50,000. If there is insufficient information to render a credit decision, a request for more information will be made by the credit analyst. Credit approvals are typically valid for up to a 90-day period from the date of initial approval. In the event that the funding does not occur within the initial approval period, a re-approval may be issued after the credit analyst has reprocessed all the relevant credit information to determine that the creditworthiness of the applicant has not deteriorated.
In some instances after a lease is approved, a phone verification with the small business customer is performed by us prior to funding the transaction. The purpose of this call is to review the terms and conditions of the lease contract, confirm the customer’s satisfaction with the equipment and obtain additional billing information. We will delay paying the origination partner for the equipment if the contract management specialist uncovers any material issues during the phone verification.
Since mid-2009, we have been using proprietary, customized acquisition scorecards for use in our credit decisioning process based on our database of historical information. The scorecards are tested and validated on an ongoing basis by credit and non-credit subject matter experts both inside and outside the organization. The scorecards’ key attributes and mathematical computations are periodically modified. The scorecards enable us to increase efficiencies and consistency in the credit decisioning process. In 2017, approximately 46% of credit decisions made on new applications have been made using the scorecards.
-10-
Table of Contents
Monitoring of Portfolio Trends and Underwriting Standards. Credit personnel use our databases and our information management tools to monitor the characteristics and attributes of our overall portfolio. Reports are produced to analyze origination partner performance, small business customer delinquencies, portfolio concentrations, trends and other related indicators of portfolio performance. Any significant findings are presented to the Risk Committee for review and action.
Our credit underwriting is subjected to monitoring by our Governance Risk and Compliance Teams and Internal Audit to ensure that the credit department adheres to all underwriting guidelines and policy. The examinations conducted by these teams and departments are designed to monitor our origination partners, the appropriateness of exceptions to our underwriting guidelines and documentation quality. Management reports are regularly generated by these teams and departments detailing the results of these surveillance and audit activities.
Account Servicing
We service the leases we originate. Account servicing involves a variety of functions performed by numerous work groups, including:
| • | entering the lease into our accounting and billing system; |
| • | preparing the invoice information; |
| • | generally, filing Uniform Commercial Code financing statements on leases in excess of $50,000; |
| • | paying the equipment dealers for leased equipment and services; |
| • | billing, collecting and remitting sales, use and property taxes to the taxing jurisdictions; |
| • | assuring compliance with insurance requirements; and |
| • | providing customer service to the leasing customers. |
Our integrated lease processing and accounting systems automate many of the functions associated with servicing high volumes of small-ticket leasing transactions.
Collection Process
Our centralized collections department is structured to collect delinquent accounts, minimize credit losses and maximize post-default recovery dollars. Our collection strategy employs a delinquency bucket segmentation approach, where certain collectors are assigned to accounts based on their delinquency status. The collectors are individually accountable for their results and a meaningful portion of their compensation is based on the delinquency performance of their accounts. The delinquency bucket segmentation approach allows us to assign our more skilled collectors to the later-stage delinquent accounts.
Our collection activities typically begin with customer contact when a payment becomes five days past due and continue throughout the delinquency period. We utilize a predictive dialer that automates outbound telephone dialing. The dialer is primarily used to focus on and reduce the number of accounts that are between 10 and 30 days delinquent. A collection notice is normally sent once an account initially falls five days delinquent and then once an account reaches the 31- to 60-day delinquency stage, the 61- to 75-day delinquency stage, the 76- to 90-day delinquency stage and the over 90-day delinquency stage. Collectors input notes directly into our servicing system, enabling the collectors to monitor the status of delinquent accounts and promptly take any necessary actions. In addition, late charges are generally assessed when a leasing customer fails to remit payment on a lease by its due date. If the lease continues to be delinquent, we may exercise our remedies under the terms of the contract, including acceleration of the entire lease balance, litigation and/or repossession.
In addition, the collections department also focuses on collecting delinquent late fees, property taxes, and other outstanding amounts due under customers’ contracts.
-11-
Table of Contents
Generally, after an account becomes 120 days or more past due, it is charged-off and referred to our internal recovery group, consisting of a team of paralegals and collectors. The group utilizes several resources in order to maximize recoveries on charged-off accounts, including: (1) initiating litigation against the small business customer and any personal guarantor, using our internal legal staff; (2) referring the account to an outside law firm or collection agency; and/or (3) repossessing and remarketing the equipment through third parties.
At the end of the initial lease term, on fair market value leases, a customer may return the equipment, continue leasing the equipment or purchase the equipment under the guidelines set forth in the purchase option granted to the customer. Our end of term department seeks to realize our recorded residual in the leased equipment at the end of the lease term.
Supervision and Regulation
Although most states do not directly regulate the commercial equipment lease financing business, certain states require lenders and finance companies to be licensed, impose limitations on certain contract terms and on interest rates and other charges, mandate disclosure of certain contract terms and constrain collection practices and remedies. Under certain circumstances, we also may be required to comply with the Equal Credit Opportunity Act and the Fair Credit Reporting Act. These acts require, among other things, that we provide notice to credit applicants of their right to receive a written statement of reasons for declined credit applications. We are also subject to those sections of the Telephone Consumer Protection Act of 1991 that regulate business-to-business telephone and facsimile communication. The Fair and Accurate Credit Transactions Act (“FACT Act”) requires financial institutions to establish a written program to implement “Red Flag Guidelines,” which are intended to detect, prevent and mitigate identity theft. The FACT Act also provides guidance regarding reasonable policies and procedures that a user of consumer credit reports must employ when a consumer reporting agency sends the user a notice of address discrepancy.
Our insurance operations are subject to various types of governmental regulation. Our wholly-owned insurance company subsidiary, AssuranceOne, is a Class 3 Bermuda insurance company and, as such, is subject to the Bermuda Insurance Act 1978, as amended, and related regulations.
Banking Regulation. On January 13, 2009, the Company became a bank holding company and is subject to the Bank Holding Company Act and supervised by the Federal Reserve Bank of Philadelphia. On September 15, 2010, the Federal Reserve Bank of Philadelphia confirmed the effectiveness of the Company’s election to become a financial holding company (while remaining a bank holding company) pursuant to Sections 4(k) and (l) of the Bank Holding Company Act and Section 225.82 of the Federal Reserve Board’s Regulation Y. Such election permits the Company to engage in activities that are financial in nature or incidental to a financial activity, including the maintenance and expansion of our reinsurance activities conducted through AssuranceOne.
Since its opening on March 12, 2008, MBB has been operating in accordance with the agreement entered into with the FDIC on March 20, 2007 (the “FDIC Agreement”) and in accordance with certain requirements and conditions applicable during its three-year de novo period, as well as requirements and conditions applicable thereafter. MBB’s three-year de novo period expired on March 12, 2011, as did certain of the requirements and conditions that were applicable solely during such period.
MBB is also subject to comprehensive federal and state regulations dealing with a wide variety of subjects, including reserve requirements, loan limitations, requirements governing the establishment of branches and numerous other aspects of its operations. These regulations generally have been adopted to protect depositors and creditors rather than shareholders. All of our subsidiaries may be subject to examination by the Federal Reserve Board and the Federal Reserve Bank of Philadelphia even if not otherwise regulated by them, subject to certain conditions in the case of “functionally regulated subsidiaries,” such as broker/dealers and registered investment advisers.
-12-
Table of Contents
Regulations governing the Company and its affiliates restrict extensions of credit by MBB to Marlin Business Services Corp. and, with some exceptions, to other affiliates. For these purposes, extensions of credit include loans and advances to and guarantees and letters of credit on behalf of Marlin Business Services Corp. and such affiliates. These regulations also restrict investments by MBB in the stock or other securities of Marlin Business Services Corp. and the covered affiliates, as well as the acceptance of such stock or other securities as collateral for loans to any borrower, whether or not related to Marlin Business Services Corp.
Additional Activities. Bank holding companies and their banking and non-banking subsidiaries have traditionally been limited to the business of banking and activities that are closely related thereto. The Gramm-Leach-Bliley Act (“GLB Act”) expanded the provisions of the Bank Holding Company Act by including a section that permits bank holding companies to become financial holding companies (which we did effective September 15, 2010, while remaining a bank holding company) and permits them to engage in a wider range of financial activities. A financial holding company is permitted to engage in a wide variety of activities deemed to be “financial in nature” including lending, exchanging, transferring, investing for others, or safeguarding money or securities, providing financial, investment or economic advisory services and underwriting, dealing in, or making a market in securities.
Capital Adequacy. The Company and MBB operate under the Basel III capital adequacy standards adopted by the federal bank regulatory agencies effective on January 1, 2015. Under the risk-based capital requirements applicable to them, bank holding companies must maintain a ratio of total capital to risk-weighted assets (including the asset equivalent of certain off-balance sheet activities such as acceptances and letters of credit) of not less than 8% (10% in order to be considered “well-capitalized”). The requirements include a 6% minimum Tier 1 risk-based ratio (8% to be considered well-capitalized). Tier 1 Capital consists of common stock, related surplus, retained earnings, qualifying perpetual preferred stock and minority interests in the equity accounts of certain consolidated subsidiaries, after deducting goodwill and certain other intangibles. The remainder of total capital (“Tier 2 Capital”) may consist of certain perpetual debt securities, mandatory convertible debt securities, hybrid capital instruments and limited amounts of subordinated debt, qualifying preferred stock, allowance for credit losses on loans and leases, allowance for credit losses on off-balance-sheet credit exposures and unrealized gains on equity securities. At December 31, 2017, the Company’s Tier 1 Capital and total capital ratios were 19.37% and 20.62%, respectively.
The capital standards require a minimum Tier 1 leverage ratio of 4%. The capital requirements also now require a new common equity Tier 1 risk-based capital ratio with a required minimum of 4.5% (6.5% to be considered well-capitalized). The Federal Reserve Board’s guidelines also provide that bank holding companies experiencing internal growth or making acquisitions are expected to maintain capital positions substantially above the minimum supervisory levels without significant reliance on intangible assets. Furthermore, the guidelines indicate that the Federal Reserve Board will continue to consider a “tangible tier 1 leverage ratio” (i.e., after deducting all intangibles) in evaluating proposals for expansion or new activities. MBB is subject to similar capital standards. At December 31, 2017, the Company’s leverage and common equity ratios were 17.25% and 18.22%, respectively.
The Company is required to have a level of regulatory capital in excess of the regulatory minimum and to have a capital buffer above 1.25% for 2017, 1.875% for 2018, and 2.5% for 2019 and thereafter. If a banking organization does not maintain capital above the minimum plus the capital conservation buffer it may be subject to restrictions on dividends, share buybacks, and certain discretionary payments such as bonus payments.
On July 2, 2013, the Federal Reserve Board approved a final rule to help ensure banking organizations maintain strong capital positions that will enable them to continue lending to creditworthy households and businesses even after unforeseen losses and during severe economic downturns. The final rule minimizes the burden on smaller, less complex financial institutions. It establishes an integrated regulatory capital framework that addresses shortcomings in capital requirements, particularly for larger, internationally active banking organizations, that became apparent during the recent financial crisis. The rule implemented in the United States
-13-
Table of Contents
the Basel III regulatory capital reforms from the Basel Committee on Banking Supervision and certain changes required by the Dodd-Frank Wall Street Reform and Consumer Protection Act (the “Dodd-Frank Act”). The final rule was effective January 1, 2014 and phased in over a multiple-year period, becoming fully effective on January 1, 2019.
Under the final rule, minimum requirements will increase for both the quantity and quality of capital held by banking organizations. In addition, for the largest, most internationally active banking organizations, the final rule includes a new minimum supplementary leverage ratio that takes into account off-balance sheet exposures. The rule establishes new criteria for instruments that will qualify as common equity tier 1 capital, additional tier 1 capital, or tier 2 capital; adjusts thresholds for the prompt corrective action capital categories and adds in the common equity tier 1 capital ratio to the prompt corrective action thresholds; places limits on distributions or discretionary bonus payments based on the size of the financial institution’s capital conservation buffer and retained income; and establishes revised risk weights and credit conversion factors for certain loans and equity exposures.
In September 2017, the federal banking agencies proposed a rule that would simplify certain aspects of the capital rules with the goal of reducing regulatory burdens on community banks while maintaining safety and soundness and the quality and quantity of regulatory capital in the banking system. Any changes in the capital rules would apply primarily to banking organizations that are not subject to the advanced approaches capital rules. In anticipation of these possible changes, in October 2017, the federal banking agencies adopted a final rule to extend the regulatory capital treatment applicable during 2017 for certain items. The final rule extends the 2017 capital regulatory treatment for mortgage servicing assets; deferred tax assets arising from temporary differences that could not be realized through net operating loss carrybacks; significant investments in the capital of unconsolidated financial institutions in the form of common stock; non-significant investments in the capital of unconsolidated financial institutions; significant investments in the capital of unconsolidated financial institutions that are not in the form of common stock; and common equity tier 1 minority interest, tier 1 minority interest, and total capital minority interest exceeding the capital rules’ minority interest limitations. This extension would apply only to non-advanced approaches banking organizations.
Prompt Corrective Action. The Federal Deposit Insurance Corporation Improvement Act of 1991 (“FDICIA”) requires federal regulators to take prompt corrective action against any undercapitalized institution. Five capital categories have been established under federal banking regulations: well-capitalized, adequately capitalized, undercapitalized, significantly undercapitalized and critically undercapitalized. Well-capitalized institutions significantly exceed the required minimum level for each relevant capital measure. Adequately capitalized institutions include depository institutions that meet but do not significantly exceed the required minimum level for each relevant capital measure. Undercapitalized institutions consist of those that fail to meet the required minimum level for one or more relevant capital measures. Significantly undercapitalized depository institutions consist of those with capital levels significantly below the minimum requirements for any relevant capital measure. Critically undercapitalized depository institutions are those with minimal capital and at serious risk for government seizure.
Under certain circumstances, a well-capitalized, adequately capitalized or undercapitalized institution may be treated as if the institution were in the next lower capital category. A depository institution is generally prohibited from making capital distributions, including paying dividends, or paying management fees to a holding company if the institution would thereafter be undercapitalized. Institutions that are adequately capitalized but not well-capitalized cannot accept, renew or roll over brokered deposits except with a waiver from the FDIC and are subject to restrictions on the interest rates that can be paid on such deposits. Undercapitalized institutions may not accept, renew or roll over brokered deposits.
-14-
Table of Contents
The federal bank regulatory agencies are permitted or, in certain cases, required to take certain actions with respect to institutions falling within one of the three undercapitalized categories. Depending on the level of an institution’s capital, the agency’s corrective powers include, among other things:
| • | prohibiting the payment of principal and interest on subordinated debt; |
| • | prohibiting the holding company from making distributions without prior regulatory approval; |
| • | placing limits on asset growth and restrictions on activities; |
| • | placing additional restrictions on transactions with affiliates; |
| • | restricting the interest rate the institution may pay on deposits; |
| • | prohibiting the institution from accepting deposits from correspondent banks; and |
| • | in the most severe cases, appointing a conservator or receiver for the institution. |
A banking institution that is undercapitalized is required to submit a capital restoration plan and such a plan will not be accepted unless, among other things, the banking institution’s holding company guarantees the plan up to a certain specified amount. Any such guarantee from a depository institution’s holding company is entitled to a priority of payment in bankruptcy. MBB’s Tier 1 Capital balance was $145.3 million at December 31, 2017, resulting in a Tier 1 leverage ratio, common equity Tier 1 risk based ratio, Tier 1 risk-based capital ratio and a total risk-based capital ratio of 14.81%, 15.21%, 15.21% and 16.46%, respectively, which exceeded the regulatory requirements for well-capitalized status of 5%, 6.5%, 8% and 10%, respectively.
Pursuant to the FDIC Agreement entered into in conjunction with the opening of MBB, MBB must keep its total risk-based capital ratio above 15%. MBB’s total risk-based capital ratio of 16.46% at December 31, 2017 exceeded the threshold for well-capitalized status under the applicable laws and regulations, and also exceeded the 15% minimum total risk-based capital ratio required in the FDIC Agreement.
The federal banking agencies’ final regulatory capital rules, discussed above, also modify the above prompt corrective action requirements to add a common equity tier 1 risk-based ratio requirement, and increase certain other capital requirements for the various prompt corrective action thresholds. For example, the requirements for a bank to be considered well-capitalized under the rules are a 5.0% tier 1 leverage ratio, a 6.5% common equity tier 1 risk-based ratio, an 8.0% tier 1 risk-based capital ratio and a 10.0% total risk-based capital ratio. To be adequately capitalized, those ratios are 4.0%, 4.5%, 6.0% and 8.0%, respectively. These changes took effect for the Company on January 1, 2015.
Federal Deposit Insurance. Under the Federal Deposit Insurance Reform Act of 2005, as amended by the Dodd-Frank Act, the FDIC changed its risk-based premium system for FDIC deposit insurance, providing for quarterly assessments of FDIC-insured institutions based on their respective rankings in one of four risk categories depending upon their examination ratings and capital ratios. Beginning in 2011, the FDIC assessment base changed from total domestic deposits to consolidated total assets minus tangible equity capital, defined as Tier 1 Capital. Institutions in FDIC-assigned Risk Categories II, III and IV are assessed premiums at progressively higher rates.
On July 21, 2010, President Barack Obama signed the Dodd-Frank Act into law, which, in part, (1) required the FDIC to increase reserves for the Deposit Insurance Fund (the “DIF”) against future losses which will necessitate increased deposit insurance premiums that are to be borne primarily by institutions with assets greater than $10 billion and (2) permanently raised the standard maximum deposit insurance amount to $250,000. To bolster the DIF, the Dodd-Frank Act provides for a new minimum reserve ratio of not less than 1.35% of estimated insured deposits and requires that the FDIC take steps necessary to attain this 1.35% ratio by September 30, 2020. The FDIC is required by law to offset the effect on institutions with less than $10 billion in total consolidated assets of increasing the reserve ratio from 1.15% to 1.35%. In April 2016, the Board of
-15-
Table of Contents
Directors of the FDIC approved a final rule that amends the way small banks are assessed for deposit insurance, affecting banks with less than $10 billion in assets that have been FDIC insured for at least five years. Changes in the rules include a revised methodology that the FDIC uses to determine risk-based assessments to better reflect risks and assign insurance assessments based on those risks. This final rule was implemented starting in the third quarter of 2016. These changes took effect at the same time rates were reduced for small banks due to hitting the 1.15 percent ratio.
Source of Strength Doctrine. Under the provisions of the Dodd-Frank Act, as well as Federal Reserve Board policy and regulation, a bank holding company must serve as a source of financial and managerial strength to each of its subsidiary banks and is expected to stand prepared to commit resources to support each of them. Consistent with this policy, the Federal Reserve Board has stated that, as a matter of prudent banking, a bank holding company should generally not maintain a given rate of cash dividends unless its net income available to common shareholders has been sufficient to fully fund the dividends and the prospective rate of earnings retention appears to be consistent with the organization’s capital needs, asset quality and overall financial condition.
USA Patriot Act of 2001. A major focus of governmental policy applicable to financial institutions in recent years has been the effort to combat money laundering and terrorism financing. The USA Patriot Act of 2001 (the “Patriot Act”) was enacted to strengthen the ability of the U.S. law enforcement and intelligence communities to achieve this goal. The Patriot Act requires financial institutions, including our banking subsidiary, to assist in the prevention, detection and prosecution of money laundering and the financing of terrorism. The Patriot Act established standards to be followed by institutions in verifying client identification when accounts are opened and provides rules to promote cooperation among financial institutions, regulators and law enforcement organizations in identifying parties that may be involved in terrorism or money laundering.
Privacy. Title V of the GLB Act is intended to increase the level of privacy protection afforded to customers of financial institutions, including customers of the securities and insurance affiliates of such institutions, partly in recognition of the increased cross-marketing opportunities created by the GLB Act’s elimination of many of the boundaries previously separating various segments of the financial services industry. Among other things, these provisions require institutions to have in place administrative, technical and physical safeguards to ensure the security and confidentiality of customer records and information, to protect against anticipated threats or hazards to the security or integrity of such records and to protect against unauthorized access to or use of such records that could result in substantial harm or inconvenience to a customer.
Future Legislation. From time to time, legislation will be introduced in Congress and state legislatures with respect to the regulation of financial institutions.
These proposals could substantially increase regulation of the financial services industry, impose restrictions on the operations and general ability of firms within the industry to conduct business consistent with historical practices, including in the areas of compensation, interest rates and financial product offerings and disclosures, among other things. Federal and state regulatory agencies also frequently adopt changes to their regulations or change the manner in which existing regulations are applied. We cannot determine the ultimate effect that potential legislation, if enacted, or any regulations issued to implement it, would have on the Company or MBB.
National Monetary Policy. In addition to being affected by general economic conditions, the earnings and growth of the Company and MBB are affected by the policies of the Federal Reserve Board. An important function of the Federal Reserve Board is to regulate the money supply and credit conditions. Among the instruments used by the Federal Reserve Board to implement these objectives are open market operations in U.S. government securities, adjustments of the discount rate and changes in reserve requirements against bank deposits. These instruments are used in varying combinations to influence overall economic growth and the distribution of credit, bank loans, investments and deposits. Their use also affects interest rates charged on loans or paid on deposits.
-16-
Table of Contents
The monetary policies and regulations of the Federal Reserve Board have had a significant effect on the operating results of commercial banks in the past and are expected to continue to do so in the future. The effects of such policies upon our future business, earnings and growth cannot be predicted.
Dividends. The Federal Reserve Board has issued policy statements which provide that, as a general matter, insured banks and bank holding companies should pay dividends only out of current operating earnings. For state-chartered banks which are members of the Federal Reserve System, such as MBB, the approval of the Federal Reserve Board is required for the payment of dividends by the bank subsidiary in any calendar year if the total of all dividends declared by the bank in that calendar year, including the proposed dividend, exceeds the current year’s net income combined with the retained net income for the two preceding calendar years. “Retained net income” for any period means the net income for that period less any common or preferred stock dividends declared in that period. Moreover, no dividends may be paid by such bank in excess of its undivided profits account.
Transfers of Funds and Transactions with Affiliates. Sections 23A and 23B of the Federal Reserve Act and applicable regulations impose restrictions on MBB that limit the transfer of funds by MBB to Marlin Business Services Corp. and certain of its affiliates, in the form of loans, extensions of credit, investments or purchases of assets. These transfers by MBB to Marlin Business Services Corp. or any other single affiliate are limited in amount to 10% of MBB’s capital and surplus, and transfers to all affiliates are limited in the aggregate to 20% of MBB’s capital and surplus. These loans and extensions of credit are also subject to various collateral requirements. Sections 23A and 23B of the Federal Reserve Act and applicable regulations also require generally that MBB’s transactions with its affiliates be on terms no less favorable to MBB than comparable transactions with unrelated third parties.
Restrictions on Ownership. Subject to certain exceptions, the Change in Bank Control Act of 1978, as amended, prohibits a person or group of persons from acquiring “control” of a bank holding company unless the FDIC has been notified 60 days prior to such acquisition and has not objected to the transaction. Under a rebuttable presumption in the Change in Bank Control Act, the acquisition of 10% or more of a class of voting stock of a bank holding company with a class of securities registered under Section 12 of the 1934 Act, such as the Company, would, under the circumstances set forth in the presumption, constitute acquisition of control of the bank holding company. The regulations provide a procedure for challenging this rebuttable control presumption.
We believe that we currently are in substantial compliance with all material statutes and regulations that are applicable to our business.
Competition
We compete with a variety of equipment financing sources that are available to small and mid-sized businesses, including:
| • | national, regional and local finance companies that provide leases and loan products; |
| • | financing through captive finance and leasing companies affiliated with major equipment manufacturers; |
| • | working capital lenders, often referred to as FinTech companies; |
| • | corporate credit cards; and |
| • | commercial banks, savings and loan associations and credit unions. |
Our principal competitors in the small-ticket equipment leasing market are independent finance companies, local and regional banks and, to a lesser extent, in the case of our national accounts channels, national providers
-17-
Table of Contents
of equipment lease financing, some of which are national banks with leasing divisions. Many of our national competitors are substantially larger than we are and generally focus on larger ticket transactions and in some cases international programs. We compete on the quality of service we provide to our origination partners and small business customers. With the introduction of our working capital solution, Funding Stream, we also compete with FinTech lenders. We have encountered and will continue to encounter significant competition.
Employees
As of December 31, 2017, we employed 330 people. None of our employees are covered by a collective bargaining agreement and we have never experienced any work stoppages.
Available Information
We are a Pennsylvania corporation with our principal executive offices located at 300 Fellowship Road, Mount Laurel, NJ 08054. Our telephone number is (888) 479-9111 and our website address is www.marlincorp.com. We make available free of charge through the investor relations section of our website our Annual Reports on Form 10-K, Quarterly Reports on Form 10-Q, current reports on Form 8-K and all amendments to those reports as soon as reasonably practicable after such material is electronically filed with or furnished to the Securities and Exchange Commission. We include our website address in this Annual Report on Form 10-K only as an inactive textual reference and do not intend it to be an active link to our website.
| Item 1A. | Risk Factors |
Set forth below and elsewhere in this report and in other documents we file with the Securities and Exchange Commission are risks and uncertainties, not limited to the risks set forth below, that could cause our actual results to differ materially from the results contemplated by the forward-looking statements contained in this report and other periodic statements we make.
If we cannot obtain deposits or financing, we may be unable to fund our operations. Our business requires a substantial amount of cash to operate. Our cash requirements will increase as our lease and loan originations increase. We obtain a substantial amount of the cash required for operations through a variety of external funding sources, such as deposits raised by MBB. A failure to access the deposits market or to add new funding facilities could affect our ability to fund and originate new leases and loans.
Our ability to obtain continued access to the deposits market or to obtain a renewal of our lender’s commitment and new funding facilities is affected by a number of factors, including:
| • | conditions in the market for FDIC-insured deposits; |
| • | restrictions and costs associated with banking industry regulation which could negatively impact MBB; |
| • | conditions in the long-term lending markets; and |
| • | our ability to service the leases and loans. |
We are and will continue to be dependent upon these funding sources to continue to originate leases and loans and to satisfy our other working capital needs. We may be unable to obtain additional financing on acceptable terms, or at all, as a result of prevailing interest rates or other factors at the time, including the presence of covenants or other restrictions under existing financing arrangements. If any or all of our funding sources become unavailable on acceptable terms or at all, we may not have access to the financing necessary to conduct our business, which would limit our ability to fund our operations. In the event we seek to obtain equity financing, our shareholders may experience dilution as a result of the issuance of additional equity securities. This dilution may be significant depending upon the amount of equity securities that we issue and the prices at which we issue such securities.
-18-
Table of Contents
If we inaccurately assess the creditworthiness of our small business customers, we may experience a higher number of lease and loan defaults, which may restrict our access to funding and reduce our earnings. We specialize in leasing equipment and providing working capital to small and mid-sized businesses. Small and mid-sized businesses may be more vulnerable than large businesses to economic downturns, as they typically depend on the management talents and efforts of one person or a small group of persons and often need substantial additional capital to expand or compete. Small and mid-sized business leases and loans, therefore, may entail a greater risk of delinquencies and defaults than leases and loans entered into with larger leasing customers. In addition, there is typically only limited publicly available financial and other information about small and mid-sized businesses and they often do not have audited financial statements. Accordingly, in making credit decisions, our underwriting guidelines rely upon the accuracy of information about these small and mid-sized businesses obtained from the small and mid-sized business owner and/or third-party sources, such as credit reporting agencies. If the information we obtain from small and mid-sized business owners and/or third-party sources is incorrect or fraudulent, our ability to make appropriate credit decisions will be impaired. If we inaccurately assess the creditworthiness of our small business customers, we may experience a higher number of lease and loan defaults and related decreases in our earnings. Fraudulent activity or significant increases in fraudulent activity could also lead to regulatory intervention, negatively impact our operating results, brand and reputation and require us to take steps to reduce fraud risk, which could increase our costs.
Deteriorated economic or business conditions may lead to greater than anticipated lease or loan defaults and credit losses, which could limit our ability to obtain additional financing and reduce our operating income. Historically, the capital and credit markets have experienced periodic volatility and disruption. In many cases, these markets have produced downward pressure on stock prices of, and credit availability to, certain companies without regard to those companies’ underlying financial strength. Concerns over geopolitical issues and the availability and cost of credit, have contributed to increased volatility for the economy and the capital and credit markets. In the event of extreme and prolonged market events, such as a global credit crisis, we could incur significant losses. Even in the absence of a market downturn, we are exposed to substantial risk of loss due to market volatility.
Our operating income may be reduced by various economic factors and business conditions, including the level of economic activity in the markets in which we operate. Delinquencies and credit losses generally increase during economic slowdowns or recessions. Because we extend credit primarily to small and mid-sized businesses, many of our customers may be particularly susceptible to economic slowdowns or recessions and may be unable to make scheduled lease or loan payments during these periods. Therefore, to the extent that economic activity or business conditions deteriorate, our delinquencies and credit losses may increase. Unfavorable economic conditions may also make it more difficult for us to maintain both our new lease and loan origination volume and the credit quality of new leases and loans at levels previously attained. Unfavorable economic conditions could also increase our funding costs or operating cost structure or limit our access to funding. Any of these events could reduce our operating income.
If losses from leases and loans exceed our allowance for credit losses, our operating income will be reduced or eliminated. In connection with our financing of leases, we record an allowance for credit losses to provide for estimated losses. Our allowance for credit losses is based on both qualitative and quantitative factors including, among other things, past collection experience, lease and loan delinquency data, industry data, economic conditions and our assessment of collection risks. Significant management judgment is required to determine the appropriate level of the allowance and, therefore, our determination of this allowance may prove to be inadequate to cover losses in connection with our portfolio of leases and loans. Factors that could lead to the inadequacy of our allowance may include our inability to manage collections effectively, unanticipated adverse changes in the economy or discrete events adversely affecting specific leasing customers, industries or geographic areas. Losses in excess of our allowance for credit losses would cause us to increase our provision for credit losses, reducing or eliminating our operating income.
We are subject to regulatory capital adequacy guidelines, and if we fail to meet these guidelines, our business, financial condition or results of operations may be adversely affected. Under regulatory capital
-19-
Table of Contents
adequacy guidelines, and other regulatory requirements, we must meet guidelines that include quantitative measures of assets, liabilities and certain off-balance sheet items, subject to qualitative judgments by regulators regarding components, risk weightings and other factors. (See Management’s Discussion and Analysis of Financial Condition and Results of Operations — Liquidity and Capital Resources — Bank Capital and Regulatory Oversight). If we fail to meet these minimum capital guidelines and other regulatory requirements, our business, financial condition or results of operations may be adversely affected. In addition, if we fail to maintain “well-capitalized” status under the regulatory framework, if we are deemed to be not well-managed under regulatory exam procedures or if we experience certain regulatory violations, our status as a financial holding company, our related eligibility for a streamlined review process for acquisition proposals and our ability to offer certain financial products may be compromised or impaired.
We may be required to raise additional capital in the future, but that capital may not be available when it is needed. We are required by regulatory authorities to maintain adequate levels of capital to support our operations. The Dodd-Frank Act sets a statutory floor for risk-based and leverage capital standards, and U.S. regulatory capital rules broadly establish minimum regulatory capital requirements. See “Supervision and Regulation – Capital Adequacy” above. We may at some point need to raise additional capital to support our operations. Our ability to raise additional capital will depend, in part, on conditions in the capital markets at that time, which are outside our control, and on our financial performance. Accordingly, we may be unable to raise additional capital, if and when needed, on terms acceptable to us, or at all. If we cannot raise additional capital when needed, we may become subject to adverse regulatory actions or restrictions, and limitations on growth of our operations. In addition, if we decide to raise additional equity capital, our shareholders’ interests in us could be diluted.
Monetary policies and regulations of the Federal Reserve Board could adversely affect our business, financial condition and results of operations. In addition to being affected by general economic conditions, our earnings and growth are affected by the policies of the Federal Reserve Board. An important function of the Federal Reserve Board is to regulate the money supply and credit conditions. Among the instruments used by the Federal Reserve Board to implement these objectives are open market operations in U.S. government securities, adjustments of the discount rate and changes in reserve requirements against bank deposits. These instruments are used in varying combinations to influence overall economic growth and the distribution of credit, bank loans, investments and deposits. Their use also affects interest rates charged on loans or paid on deposits.
The monetary policies and regulations of the Federal Reserve Board have had a significant affect on the operating results of bank holding companies in the past and are expected to continue to do so in the future. The effects of such policies upon our business, financial condition and results of operations cannot be predicted.
Government regulation significantly affects our business. The banking industry is heavily regulated, and such regulations are intended primarily for the protection of depositors and the federal deposit insurance funds, not shareholders. Since becoming a bank holding company on January 13, 2009, we have been subject to regulation by the Federal Reserve Board and the Federal Reserve Bank of Philadelphia and subject to the Bank Holding Company Act. Our bank subsidiary, MBB, is also subject to regulation by the Federal Reserve Board, the Federal Reserve Board of San Francisco, and the Utah Department of Financial Institutions. Such regulation affects lending practices, capital structure, investment practices, dividend policy and growth.
The financial crisis of 2008 and 2009 resulted in U.S. government and regulatory agencies placing increased focus and scrutiny on the financial services industry, which have subjected financial institutions to additional restrictions, oversight and costs. In addition, new proposals for legislation continue to be introduced in Congress that could further substantially increase regulation of the financial services industry and impose restrictions on the operations and general ability of firms within the industry to conduct business consistent with historical practices, including in the areas of compensation, interest rates and financial product offerings and disclosures, among other things. Federal and state regulatory agencies also frequently adopt changes to their regulations or change the manner in which existing regulations are applied. Such proposed changes in laws, regulations and
-20-
Table of Contents
regulatory practices affecting the banking industry may limit the manner in which we may conduct our business. Such changes may adversely affect us, including our ability to originate loans and leases, and may also result in the imposition of additional costs on us.
Further legislative and regulatory reforms may have a significant impact on our business, results of operations and financial condition. Recent conditions, particularly in the financial markets, have resulted in government regulatory agencies and political bodies placing increased focus and scrutiny on the financial services industry. For example, on July 21, 2010, the Dodd-Frank Act was signed into law. The Dodd-Frank Act contains provisions that, among other things, establish a systemic risk regulator, consolidate certain federal bank regulators and give shareholders an advisory vote on executive compensation. The Dodd-Frank Act substantially increases regulation of the financial services industry, imposes restrictions on the operations and general ability of firms within the industry to conduct business consistent with historical practices, including in the areas of compensation, interest rates, financial product offerings and disclosures, and has an effect on bankruptcy proceedings with respect to consumer residential real estate mortgages, among other things.
The Dodd-Frank Act added sweeping deposit insurance provisions. Deposit insurance assessments are now based upon a bank’s average consolidated total assets minus its average tangible equity, rather than upon its deposit base. The changes also made the temporary $250,000 deposit insurance limit permanent, and expanded the FDIC’s authority to raise insurance premiums by setting a target ratio as high as the FDIC determines to be appropriate. The Dodd-Frank Act also restricts proprietary trading and the derivatives activities of banks and their affiliates.
Many provisions of the Dodd-Frank Act require the adoption of rules to implement it. In addition, the Dodd-Frank Act mandates multiple studies, which could result in additional legislative or regulatory action. The effect of the Dodd-Frank Act and its implementing regulations on our business and operations could be significant. In addition, we may be required to invest significant management time and resources to address the various provisions of the Dodd-Frank Act and the numerous regulations that have been and are still required to be issued under it. The Dodd-Frank Act, any related legislation and any implementing regulations could have a significant adverse effect on our business, results of operations and financial condition.
The current administration and members of Congress have publicly disclosed proposals to change certain laws and regulations affecting the financial services industry. In addition, proposals to change financial services laws and regulations are frequently introduced at the state level. The likelihood and timing of any such changes and the impact such changes may have on us cannot be determined with any certainty.
Further increase in the FDIC deposit insurance premium or required reserves may have a significant financial impact on us. The FDIC insures deposits at FDIC-insured financial institutions up to certain limits. The FDIC charges insured financial institutions premiums to maintain the DIF. In the event of a bank failure, the FDIC takes control of a failed bank and ensures payment of deposits up to insured limits using the resources of the DIF. The FDIC is required by law to maintain adequate funding of the DIF, and the FDIC may increase premium assessments to maintain such funding.
The Dodd-Frank Act required the FDIC to increase the DIF’s reserves against future losses, which will necessitate increased deposit insurance premiums that are to be borne primarily by institutions with assets of greater than $10 billion. Future increases in assessments may decrease our earnings and could have a material effect on the value of, or market for, our common stock.
On October 19, 2010, the FDIC further addressed plans to bolster the DIF by increasing the required reserve ratio for the industry to 1.35% (ratio of reserves to insured deposits) by September 30, 2020, as required by the Dodd-Frank Act. As of the third quarter of 2016, the FDIC implemented new assessment rates when the reserve ratio reached 1.15%. These changes also apply higher or lower insurance premiums based on the risk of an institution’s assets and liabilities.
-21-
Table of Contents
If we are unable to effectively execute our business strategy, we may suffer material operating losses. Our financial position, liquidity and results of operations depend on management’s ability to execute our business strategy and navigate through the ongoing challenging economic environment. Key factors involved in the execution of this strategy include achieving the desired volume of leases and loans of suitable yield and credit quality, effectively managing those leases and loans and obtaining appropriate funding. Accomplishing such a result on a cost-effective basis is largely a function of our marketing capabilities, our management of the leasing process, our credit underwriting guidelines, our ability to provide competent, attentive and efficient servicing to our origination partners and our small business customers, our ability to execute effective credit risk management and collection techniques, our access to financing sources on acceptable terms and our ability to attract and retain high quality employees in all areas of our business. Failure to manage effectively these and other factors related to our business strategy and our overall operations may cause us to suffer material operating losses.
If we cannot effectively compete within the equipment leasing industry, we may be unable to increase our revenues or maintain our current levels of operations. The business of small-ticket equipment leasing is highly fragmented and competitive. Many of our competitors are substantially larger and have considerably greater financial, technical and marketing resources than we do. For example, some competitors may have a lower cost of funds and access to funding sources that are not available to us. A lower cost of funds could enable a competitor to offer leases and loans with yields that are lower than those we use to price our leases and loans, potentially forcing us to decrease our yields or lose origination volume. In addition, certain of our competitors may have higher risk tolerances or different risk assessments, which could allow them to establish more origination partner and small business customer relationships and increase their market share. The barriers to entry are relatively low with respect to our business and, therefore, new competitors could enter the business of small-ticket equipment leasing at any time. The companies that typically provide financing for large-ticket or middle-market transactions could begin competing with us on small-ticket equipment leases. If this occurs, or we are unable to compete effectively with our competitors, we may be unable to sustain our operations at their current levels or generate revenue growth.
If we cannot maintain our relationships with origination partners, our ability to generate lease and loan transactions and related revenues may be significantly impeded. We have formed relationships with thousands of origination partners, comprised primarily of independent equipment dealers. We rely on these relationships to generate lease and loan applications and originations. Most of these relationships are not formalized in written agreements and those that are formalized by written agreements are typically terminable at will. Our typical relationship does not commit the origination partner to provide a minimum number of lease and loan transactions to us nor does it require the origination partner to direct all of its lease and loan transactions to us. The decision by a significant number of our origination partners to refer their leasing transactions to another company could impede our ability to generate lease and loan transactions and related revenues.
If interest rates change significantly, we may be subject to higher interest costs with respect to our funding sources, which may cause us to suffer material losses. Because we use FDIC insured deposits to fund our leases, our margins could be reduced by an increase in interest rates. Each of our leases is structured so that the sum of all scheduled lease payments will equal the cost of the equipment to us, less the residual, plus a return on the amount of our investment. This return is known as the yield. The yield on our leases is fixed because the scheduled payments are fixed at the time of lease origination. When we originate or acquire leases, we base our pricing in part on the spread we expect to achieve between the yield on each lease and the effective interest rate we expect to pay when we finance the lease. To the extent that a lease is financed with variable-rate funding, increases in interest rates during the term of a lease could narrow or eliminate the spread, or result in a negative spread. A negative spread is an interest cost greater than the yield on the lease. Because most of our assets have a fixed interest rate, increases in LIBOR (“LIBOR”) or our MMDA Product would negatively impact our earnings. If interest rates increase faster than we are able to adjust the pricing under our new leases or loans, our net interest margin would be reduced. In addition, with respect to our fixed-rate deposits and borrowings, increases in interest rates could have the effect of increasing our costs on future transactions.
-22-
Table of Contents
The termination or interruption of, or a decrease in volume under, our property insurance program would cause us to experience lower revenues and may result in a significant reduction in our net income. Our customers are required to obtain all-risk property insurance for the replacement value of financed equipment. Each customer has the option of either delivering a certificate of insurance listing us as loss payee under a commercial property policy issued by a third-party insurer or satisfying such insurance obligation through our insurance program. Under our program, the customer pays for coverage under a master property insurance policy written by a national third-party insurer (our “primary insurer”) with whom our captive insurance subsidiary, AssuranceOne, has entered into a 100% reinsurance arrangement. Termination or interruption of our program could occur for a variety of reasons, including: (1) adverse changes in laws or regulations affecting our primary insurer or AssuranceOne; (2) a change in the financial condition or financial strength ratings of our primary insurer or AssuranceOne; (3) negative developments in the loss reserves or future loss experience of AssuranceOne, which render it uneconomical for us to continue the program; (4) termination or expiration of the reinsurance agreement with our primary insurer, coupled with an inability by us to identify quickly and negotiate an acceptable arrangement with a replacement carrier; or (5) competitive factors in the property insurance market. If there is a termination or interruption of this program or if fewer small business customers elected to satisfy their insurance obligations through our program, we would experience lower revenues and our net income may be reduced.
Regulatory and legal uncertainties could result in significant financial losses and may require us to alter our business strategy and operations. Laws or regulations may be adopted with respect to our equipment leases, the equipment leasing, telemarketing and collection processes or the banking industry. Any new legislation or regulation, or changes in the interpretation of existing laws, that affect the equipment leasing industry or the banking industry could increase our costs of compliance or require us to alter our business strategy.
We, like other finance companies, face the risk of litigation, including class action litigation, and regulatory investigations and actions in connection with our business activities. These matters may be difficult to assess or quantify, and their magnitude may remain unknown for substantial periods of time. A substantial legal liability or a significant regulatory action against us could cause us to suffer significant costs and expenses and could require us to alter our business strategy and the manner in which we operate our business.
Failure to realize the projected value of residual interests in equipment we finance would reduce the residual value of equipment recorded as assets on our balance sheet and may reduce our operating income. We estimate the residual value of the equipment which is recorded as an asset on our balance sheet. Realization of residual values depends on numerous factors including: the general market conditions at the time of expiration of the lease; the customer’s election to enter into a renewal period; the cost of comparable new equipment; the obsolescence of the leased equipment; any unusual or excessive wear and tear on or damage to the equipment; the effect of any additional or amended government regulations; and the foreclosure by a secured party of our interest in a defaulted lease. Our failure to realize our recorded residual values would reduce the residual value of equipment recorded as assets on our balance sheet and may reduce our operating income.
If we experience significant telecommunications or technology downtime, our operations would be disrupted and our ability to generate operating income could be negatively impacted. Our business depends in large part on our telecommunications and information management systems. The temporary or permanent loss of our computer systems, telecommunications equipment or software systems, through casualty or operating malfunction, could disrupt our originations and operations and negatively impact our ability to secure new business and to service our customers. This could lead to significant declines in our operating income.
Failure to maintain the security of our information and technology networks, including personally identifiable and other information, non-compliance with our contractual or other legal obligations regarding such information, or a violation of the Company’s privacy and security policies with respect to such information, could adversely affect us. In the normal course of our business, we collect and retain significant volumes of certain types of personally identifiable and other information pertaining to our customers, stockholders and employees. The legal, regulatory and contractual environment surrounding information security and privacy is
-23-
Table of Contents
constantly evolving and companies that collect and retain such information are under increasing attack by cyber-criminals around the world. A significant actual or potential theft, loss, fraudulent use or misuse of customer, stockholder, employee or our data by cybercrime or otherwise, non-compliance with our contractual or other legal obligations regarding such data or a violation of our privacy and security policies with respect to such data could adversely impact our reputation and could result in significant costs, fines, litigation or regulatory action against us. Increasingly, our products and services are accessed through the Internet, and security breaches in connection with the delivery of our services via the Internet may affect us and could be detrimental to our reputation, business, operating results and financial condition. We cannot be certain that advances in criminal capabilities, new discoveries in the field of cryptography or other developments will not compromise or breach the technology protecting the networks that access our products and services.
Customer complaints or negative publicity could result in a decline in our customer growth and our business could suffer. Our reputation is important to attract new customers as well as to obtain repeat business from existing customers. There can be no assurance that we will continue to maintain a good relationship with our customers or avoid negative publicity. Any damage to our reputation, whether arising from our conduct of business, negative publicity, regulatory, supervisory or enforcement actions, matters affecting our financial reporting or compliance with SEC and New York Stock Exchange listing requirements, security breaches or otherwise could have a material adverse effect on our business.
Our quarterly operating results may fluctuate significantly. Our operating results may differ from quarter to quarter, and these differences may be significant. Factors that may cause these differences include: changes in the volume of lease and loan applications, approvals and originations; changes in interest rates; the availability and cost of capital and funding; the degree of competition we face; the levels of charge-offs we incur; changes in the regulatory environment; general economic conditions; and other factors.
Our common stock price is volatile. The trading price of our common stock may fluctuate substantially depending on many factors, some of which are beyond our control and may not be related to our operating performance. These fluctuations could cause investors to lose part or all of their investment in our shares of common stock. Those factors that could cause fluctuations include, but are not limited to, the following:
| • | price and volume fluctuations in the overall stock market from time to time; |
| • | significant volatility in the market price and trading volume of financial services companies; |
| • | actual or anticipated changes in our earnings or fluctuations in our operating results or in the expectations of market analysts; |
| • | investor perceptions of the equipment leasing industry in general and the Company in particular; |
| • | the operating and stock performance of comparable companies; |
| • | legislative and regulatory changes with respect to the financial or banking industries; |
| • | general economic conditions and trends; |
| • | major catastrophic events; |
| • | loss of external funding sources; |
| • | sales of large blocks of our stock or sales by insiders; or |
| • | departures of key personnel. |
It is possible that in some future quarter our operating results may be below the expectations of financial market analysts and investors and, as a result of these and other factors, the price of our common stock may decline.
-24-
Table of Contents
Future sales of our common stock by a certain large shareholder could adversely affect the market price of our common stock. A substantial number of shares of our common stock could be sold into the public market pursuant to a shelf registration statement on Form S-3 (No. 333-128329) that became effective on December 19, 2005. As of December 31, 2017, this large shareholder owned 3,001,925 shares of our common stock. The sale of all or a portion of these shares into the public market, or the perception that such a sale could occur, could adversely affect the market price of our common stock.
Anti-takeover provisions and our right to issue preferred stock could make a third-party acquisition of us difficult. We are a Pennsylvania corporation. Anti-takeover provisions of Pennsylvania law could make it more difficult for a third party to acquire control of us, even if such change in control would be beneficial to our shareholders. Our amended and restated articles of incorporation and our bylaws contain certain other provisions that would make it difficult for a third party to acquire control of us, including a provision that our Board of Directors may issue preferred stock without shareholder approval.
| Item 1B. | Unresolved Staff Comments |
None.
| Item 2. | Properties |
At December 31, 2017, we operated from eight leased facilities including our executive office facility, branch offices and the headquarters of MBB. Our Mount Laurel, New Jersey executive offices are housed in a leased facility of approximately 50,000 square feet under a lease that expires in May 2020. In addition, we have a regional office in Johns Creek, Georgia (a suburb of Atlanta). Our Georgia office is 3,085 square feet and the lease expires in June 2019. The headquarters of MBB in Salt Lake City, Utah is 4,399 square feet and the lease expires in December 2020. We also lease office space in Philadelphia, Pennsylvania; Portsmouth, New Hampshire; Highlands Ranch, Colorado; Denver, Colorado; and Plymouth, Michigan on a month-to-month basis.
In February 2013, the Company extended its lease agreement on its executive offices in Mount Laurel, New Jersey. The original expiration date of May 2013 was extended to May 2020, with an expected obligation of approximately $1.1 million per year. Concurrently, the Company also entered into a lease agreement for an additional 9,700 square feet at the same location, which commenced in June 2014 and expires in May 2020. The expected annual obligation under such lease is approximately $0.2 million per year.
In July 2014, the Company extended its lease agreement on its office in Salt Lake City, Utah. The extended term commenced in November 2014 and expires in December 2020, with an expected obligation of approximately $0.1 million per year.
We believe our leased facilities are adequate for our current needs and sufficient to support our current operations and anticipated future requirements.
| Item 3. | Legal Proceedings |
We are party to various legal proceedings, which include claims and litigation arising in the ordinary course of business. In the opinion of management, these actions will not have a material effect on our business, financial condition or results of operations or cash flows.
| Item 4. | Mine Safety Disclosures |
Not applicable.
-25-
Table of Contents
PART II
| Item 5. | Market for Registrant’s Common Equity, Related Stockholder Matters and Issuer Purchases of Equity Securities |
Marlin Business Services Corp. completed its IPO of common stock and became a publicly traded company on November 12, 2003. The Company’s common stock trades on the NASDAQ Global Select Market under the symbol “MRLN.” The following table sets forth, for the periods indicated, the high and low sales prices per share of our common stock as reported on the NASDAQ Global Select Market and the dividends declared per common share.
| 2017 | 2016 | |||||||||||||||||||||||
| High | Low | Cash Dividends |
High | Low | Cash Dividends |
|||||||||||||||||||
| First Quarter |
$ | 26.65 | $ | 20.50 | $ | 0.14 | $ | 15.74 | $ | 13.59 | $ | 0.14 | ||||||||||||
| Second Quarter |
$ | 26.30 | $ | 23.65 | $ | 0.14 | $ | 16.30 | $ | 14.17 | $ | 0.14 | ||||||||||||
| Third Quarter |
$ | 29.15 | $ | 24.50 | $ | 0.14 | $ | 19.38 | $ | 16.27 | $ | 0.14 | ||||||||||||
| Fourth Quarter |
$ | 29.70 | $ | 21.90 | $ | 0.14 | $ | 22.55 | $ | 17.20 | $ | 0.14 | ||||||||||||
Dividend Policy
On October 26, 2017, Marlin Business Services Corp. declared its twenty-fifth regular quarterly dividend. The dividend of $0.14 per share of common stock was paid on November 16, 2017 to holders of our common stock as of November 6, 2017.
In addition to the Company’s regular quarterly dividend, the Company’s Board of Directors declared a special cash dividend of $2.00 per share on September 14, 2015. The special dividend was paid on October 5, 2015 to shareholders of record on the close of business on September 24, 2015, which resulted in a dividend payment of approximately $25.5 million. In addition to the Company’s regular quarterly dividend, the Company’s Board of Directors declared a special cash dividend of $2.00 per share on September 4, 2013. The special dividend was paid on September 26, 2013 to shareholders of record on the close of business on September 16, 2013, which resulted in a dividend payment of approximately $26.0 million.
Payment of future dividends will also depend upon our earnings, financial condition, capital requirements, cash flow, long-range plans and such other factors as our Board of Directors may deem relevant.
The Federal Reserve Board has issued policy statements which provide that, as a general matter, insured banks and bank holding companies should pay dividends only out of current operating earnings. Payment of dividends by MBB to its sole shareholder, Marlin Business Services Corp., are also subject to the regulatory requirements and restrictions described in the “Supervision and Regulation” portion of Item 1 of Part I of this Form 10-K.
Number of Record Holders
There were 288 holders of record of our common stock at February 27, 2018. We believe that the number of beneficial owners is greater than the number of record holders because a large portion of our common stock is held of record through brokerage firms in “street name.”
Information on Stock Repurchases
On July 29, 2014, the Company’s Board of Directors approved a stock repurchase plan, under which, the Company was authorized to repurchase up to $15 million in value of its outstanding shares of common stock (the “2014 Repurchase Plan”). On May 30, 2017, the Company’s Board of Directors approved a new stock
-26-
Table of Contents
repurchase plan to replace the 2014 Repurchase Plan (the “2017 Repurchase Plan”). Under the 2017 Repurchase Plan, the Company is authorized to repurchase up to $10 million in value of its outstanding shares of common stock. This authority may be exercised from time to time and in such amounts as market conditions warrant. Any shares purchased under this plan are returned to the status of authorized but unissued shares of common stock. The repurchases may be made on the open market or in block trades. The program may be suspended or discontinued at any time. The repurchases are funded using the Company’s working capital.
The number of shares of common stock repurchased by the Company under the 2017 Repurchase Plan during the fourth quarter of 2017 and the average price paid per share is as follows:
| Time Period |
Number of Shares Purchased |
Average Price Paid Per Share(1) |
Maximum Approximate Dollar Value of Shares that May Yet be Purchased Under the Plans or Programs |
|||||||||
| October 1, 2017 to October 31, 2017 |
6,800 | $ | 21.40 | $ | 9,254,512 | |||||||
| November 1, 2017 to November 30, 2017 |
56,920 | $ | 23.75 | $ | 7,902,789 | |||||||
| December 1, 2017 to December 31, 2017 |
— | $ | — | $ | 7,902,789 | |||||||
|
|
|
|||||||||||
| Total for the quarter ended December 31, 2017 |
63,720 | $ | 23.50 | $ | 7,902,789 | |||||||
In addition to the repurchases described above, pursuant to the Company’s 2003 Equity Compensation Plan, as amended (the “2003 Plan”) and the Company’s 2014 Equity Compensation Plan (approved by the Company’s shareholders on June 3, 2014) (the “2014 Plan” and, together with the 2003 Plan, the “Equity Plans”), participants may have shares withheld to cover income taxes. There were 871 shares repurchased to cover income tax withholding in connection with shares granted under the 2014 Plan during the three-month period ended December 31, 2017, at an average cost of $24.58 per share.
-27-
Table of Contents
Shareholder Return Performance Graph
The following graph compares the dollar change in the cumulative total shareholder return on the Company’s common stock against the cumulative total return of the Russell 2000 Index and the SNL Specialty Lender Index for the period commencing on December 31, 2012 and ending on December 31, 2017. The graph shows the cumulative investment return to shareholders based on the assumption that a $100 investment was made on December 31, 2012 in each of the following: the Company’s common stock, the Russell 2000 Index and the SNL Specialty Lender Index. We computed returns assuming the reinvestment of all dividends. The shareholder return shown on the following graph is not indicative of future performance.
Total Return Performance
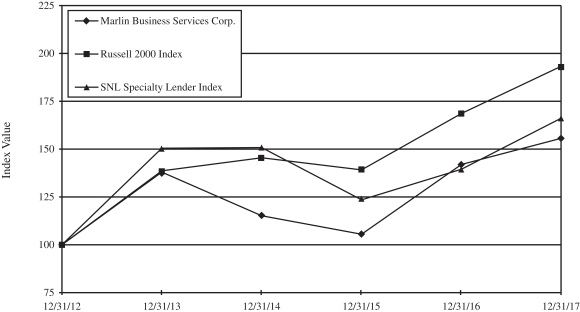
| Period Ending | ||||||||||||||||||||||||
| Index |
12/31/12 | 12/31/13 | 12/31/14 | 12/31/15 | 12/31/16 | 12/31/17 | ||||||||||||||||||
| Marlin Business Services Corp. |
100.00 | 138.07 | 115.14 | 105.41 | 142.07 | 155.84 | ||||||||||||||||||
| Russell 2000 Index |
100.00 | 138.82 | 145.62 | 139.19 | 168.85 | 193.58 | ||||||||||||||||||
| SNL Specialty Lender Index |
100.00 | 150.57 | 150.89 | 123.47 | 139.53 | 166.26 | ||||||||||||||||||
Source : S&P Global Market Intelligence
© 2017
-28-
Table of Contents
| Item 6. | Selected Financial Data |
The following selected financial data as of and for each of the five years ended December 31, 2017 has been derived from the consolidated financial statements. The selected financial data should be read together with the consolidated financial statements and notes thereto and “Management’s Discussion and Analysis of Financial Condition and Results of Operations” included elsewhere in this Form 10-K.
| Year Ended December 31, | ||||||||||||||||||||
| 2017 | 2016 | 2015 | 2014 | 2013 | ||||||||||||||||
| (Dollars in thousands, except per-share data) | ||||||||||||||||||||
| Statement of Operations Data: |
||||||||||||||||||||
| Interest and fee income |
$ | 102,319 | $ | 90,252 | $ | 81,953 | $ | 81,684 | $ | 77,075 | ||||||||||
| Interest expense |
11,180 | 7,778 | 5,696 | 4,965 | 4,545 | |||||||||||||||
|
|
|
|
|
|
|
|
|
|
|
|||||||||||
| Net interest and fee income |
91,139 | 82,474 | 76,257 | 76,719 | 72,530 | |||||||||||||||
| Provision for credit losses |
18,394 | 12,414 | 9,995 | 9,116 | 9,617 | |||||||||||||||
|
|
|
|
|
|
|
|
|
|
|
|||||||||||
| Net interest and fee income after provision for credit losses |
72,745 | 70,060 | 66,262 | 67,603 | 62,913 | |||||||||||||||
| Loss on derivatives |
— | — | — | — | (2 | ) | ||||||||||||||
| Insurance and other income |
16,732 | 9,758 | 7,809 | 7,077 | 6,600 | |||||||||||||||
| Other expense: |
||||||||||||||||||||
| Salaries and benefits |
37,569 | 31,912 | 31,174 | 26,628 | 27,680 | |||||||||||||||
| General and administrative |
28,272 | 19,523 | 17,451 | 15,606 | 14,725 | |||||||||||||||
| Financing related costs |
— | 85 | 218 | 1,174 | 1,106 | |||||||||||||||
|
|
|
|
|
|
|
|
|
|
|
|||||||||||
| Other expense |
65,841 | 51,520 | 48,843 | 43,408 | 43,511 | |||||||||||||||
|
|
|
|
|
|
|
|
|
|
|
|||||||||||
| Income before income taxes |
23,636 | 28,298 | 25,228 | 31,272 | 26,000 | |||||||||||||||
| Income tax expense (benefit) |
(1,656 | ) | 11,019 | 9,262 | 11,922 | 9,769 | ||||||||||||||
|
|
|
|
|
|
|
|
|
|
|
|||||||||||
| Net income |
$ | 25,292 | $ | 17,279 | $ | 15,966 | $ | 19,350 | $ | 16,231 | ||||||||||
|
|
|
|
|
|
|
|
|
|
|
|||||||||||
| Basic earnings per share |
$ | 2.02 | $ | 1.38 | $ | 1.25 | $ | 1.50 | $ | 1.26 | ||||||||||
| Diluted earnings per share |
$ | 2.01 | $ | 1.38 | $ | 1.25 | $ | 1.49 | $ | 1.25 | ||||||||||
| Cash dividends declared per share |
$ | 0.56 | $ | 0.56 | $ | 2.53 | $ | 0.47 | $ | 2.42 | ||||||||||
-29-
Table of Contents
| Year Ended December 31, | ||||||||||||||||||||
| 2017 | 2016 | 2015 | 2014 | 2013 | ||||||||||||||||
| (Dollars in thousands, except per-share data) | ||||||||||||||||||||
| Operating Data: |
||||||||||||||||||||
| Total number of finance receivables originated |
32,189 | 27,583 | 25,307 | 24,228 | 25,712 | |||||||||||||||
| Total finance receivables originated |
$ | 629,445 | $ | 504,282 | $ | 381,071 | $ | 334,835 | $ | 349,461 | ||||||||||
| Average total finance receivables(1) |
$ | 846,743 | $ | 720,060 | $ | 636,790 | $ | 602,923 | $ | 540,717 | ||||||||||
| Weighted average interest rate (implicit) on new finance receivables originated(2) |
11.98 | % | 11.67 | % | 11.13 | % | 11.14 | % | 12.03 | % | ||||||||||
| Interest income as a percent of average total finance receivables(1) |
10.33 | % | 10.38 | % | 10.47 | % | 11.07 | % | 11.78 | % | ||||||||||
| Interest expense as percent of average interest-bearing liabilities |
1.43 | % | 1.20 | % | 1.02 | % | 0.93 | % | 0.99 | % | ||||||||||
| Portfolio Asset Quality Data: |
||||||||||||||||||||
| Total finance receivables, end of period(1) |
$ | 911,242 | $ | 793,285 | $ | 679,738 | $ | 627,922 | $ | 595,253 | ||||||||||
| Delinquencies greater than 60 days past due(3) |
0.55 | % | 0.46 | % | 0.41 | % | 0.51 | % | 0.47 | % | ||||||||||
| Allowance for credit losses |
$ | 14,851 | $ | 10,937 | $ | 8,413 | $ | 8,537 | $ | 8,467 | ||||||||||
| Allowance for credit losses to total finance receivables, end of period(1) |
1.63 | % | 1.38 | % | 1.24 | % | 1.36 | % | 1.42 | % | ||||||||||
| Charge-offs, net |
$ | 14,480 | $ | 9,890 | $ | 10,119 | $ | 9,046 | $ | 7,638 | ||||||||||
| Ratio of net charge-offs to average total finance receivables(1) |
1.71 | % | 1.37 | % | 1.59 | % | 1.50 | % | 1.41 | % | ||||||||||
| Operating Ratios: |
||||||||||||||||||||
| Efficiency ratio(4) |
61.04 | % | 55.77 | % | 57.84 | % | 50.40 | % | 53.59 | % | ||||||||||
| Return on average total assets |
2.59 | % | 2.08 | % | 2.11 | % | 2.64 | % | 2.45 | % | ||||||||||
| Return on average stockholders’ equity |
15.38 | % | 11.15 | % | 9.49 | % | 11.47 | % | 9.31 | % | ||||||||||
| Balance Sheet Data: |
||||||||||||||||||||
| Cash and cash equivalents |
$ | 67,146 | $ | 61,757 | $ | 60,129 | $ | 110,656 | $ | 85,653 | ||||||||||
| Restricted interest-earning deposits with banks |
$ | — | $ | — | $ | 216 | $ | 711 | $ | 1,273 | ||||||||||
| Net investment in leases and loans |
$ | 914,420 | $ | 796,717 | $ | 682,432 | $ | 629,507 | $ | 597,075 | ||||||||||
| Total assets |
$ | 1,040,160 | $ | 892,158 | $ | 772,984 | $ | 758,449 | $ | 702,207 | ||||||||||
| Deposits |
$ | 809,315 | $ | 697,357 | $ | 587,940 | $ | 550,119 | $ | 503,038 | ||||||||||
| Total liabilities |
$ | 860,511 | $ | 729,869 | $ | 622,846 | $ | 584,485 | $ | 539,169 | ||||||||||
| Total stockholders’ equity |
$ | 179,649 | $ | 162,289 | $ | 150,138 | $ | 173,964 | $ | 163,038 | ||||||||||
| (1) | Total finance receivables include net investment in direct financing leases and loans. For purposes of asset quality and allowance calculations the effects of (i) the allowance for credit losses and (ii) initial direct costs and fees deferred, are excluded from total finance receivables. |
| (2) | Excludes initial direct costs and fees deferred. |
| (3) | Calculated as a percentage of minimum lease payments receivable for leases and as a percentage of principal outstanding for loans. |
| (4) | Salaries, benefits, general and administrative expense divided by net interest and fee income, insurance and other income. |
-30-
Table of Contents
| Item 7. | Management’s Discussion and Analysis of Financial Condition and Results of Operations |
FORWARD-LOOKING STATEMENTS
Certain statements in this document may include the words or phrases “can be,” “expects,” “plans,” “may,” “may affect,” “may depend,” “believe,” “estimate,” “intend,” “could,” “should,” “would,” “if” and similar words and phrases that constitute “forward-looking statements” within the meaning of Section 27A of the Securities Act of 1933, as amended (the “1933 Act”), and Section 21E of the Securities Exchange Act of 1934, as amended (the “1934 Act”). Forward-looking statements are subject to various known and unknown risks and uncertainties and the Company cautions that any forward-looking information provided by or on its behalf is not a guarantee of future performance. Statements regarding the following subjects are forward-looking by their nature: (a) our business strategy; (b) our projected operating results; (c) our ability to obtain external deposits or financing; (d) our understanding of our competition; and (e) industry and market trends. The Company’s actual results could differ materially from those anticipated by such forward-looking statements due to a number of factors, some of which are beyond the Company’s control, including, without limitation:
| • | availability, terms and deployment of funding and capital; |
| • | changes in our industry, interest rates, the regulatory environment or the general economy resulting in changes to our business strategy; |
| • | the degree and nature of our competition; |
| • | availability and retention of qualified personnel; |
| • | general volatility of the capital markets; and |
| • | the factors set forth in the section captioned “Risk Factors” in Item 1A of this Form 10-K. |
Forward-looking statements apply only as of the date made and the Company is not required to update forward-looking statements for subsequent or unanticipated events or circumstances. As used herein, the terms “Company,” “Marlin,” “Registrant,” “we,” “us” or “our” refer to Marlin Business Services Corp. and its subsidiaries.
Overview
Founded in 1997, we are a nationwide provider of credit products and services to small and mid-sized businesses. The products and services we provide to our customers include loans and leases for the acquisition of commercial equipment (including Transportation Finance Group (“TFG”) assets) and working capital loans. We access our small business customers primarily through origination partners consisting of independent commercial equipment dealers, various national account programs, through direct solicitation of our small business customers and through relationships with select lease and loan brokers. We use both a telephonic direct sales model and, for strategic larger accounts, outside sales executives to market to our origination partners and small business customers. Through these origination partners, we are able to cost-effectively access small business customers while also helping our origination partners obtain financing for their customers.
Our leases are fixed-rate transactions with terms generally ranging from 36 to 60 months. At December 31, 2017, our lease portfolio consisted of approximately 91,000 accounts with an average original term of 48 months and average original transaction size of approximately $16,000.
During the first quarter of 2015, the Company launched Funding Stream, a new, flexible loan program of MBB. Funding Stream is tailored to the small business market to provide customers a convenient, hassle free alternative to traditional lenders and access to capital to help grow their businesses.
At December 31, 2017, we have $1,040.2 million in total assets. Our assets are substantially comprised of our net investment in leases and loans which totaled $914.4 million at December 31, 2017.
-31-
Table of Contents
Our revenue consists of interest and fees from our leases and loans and, to a lesser extent, income from our property insurance program and other fee income. Our expenses consist of interest expense and operating expenses, which include salaries and benefits and other general and administrative expenses. As a credit lender, our earnings are also impacted by credit losses. For the year ended December 31, 2017, our net credit losses were 1.71% of our average total finance receivables. We establish reserves for credit losses which require us to estimate inherent losses in our portfolio as of the reporting date.
Our leases are classified under generally accepted accounting principles in the United States (“U.S. GAAP”) as direct financing leases, and we recognize interest income over the term of the lease. Our net investment in direct finance leases is included in our consolidated financial statements in “net investment in leases and loans.” Net investment in direct financing leases consists of the sum of total minimum lease payments receivable and the estimated residual value of leased equipment, less unearned lease income. Unearned lease income consists of the excess of the total future minimum lease payments receivable plus the estimated residual value expected to be realized at the end of the lease term plus deferred net initial direct costs and fees less the cost of the related equipment. Approximately 70% of our lease portfolio at December 31, 2017 amortizes over the lease term to a $1 residual value. For the remainder of the portfolio, we must estimate end of term residual values for the leased assets. Failure to correctly estimate residual values could result in losses being realized on the disposition of the equipment at the end of the lease term.
We fund our business primarily through the issuance of fixed-rate FDIC-insured deposits, and money market demand accounts raised nationally by MBB.
Since its opening in 2008, MBB has served as a funding source for a portion of the Company’s new originations through the issuance of FDIC-insured deposits. We anticipate that FDIC-insured deposits issued by MBB will continue to represent our primary source of funds for the foreseeable future. As of December 31, 2017 total MBB deposits were $809.3 million compared to $697.4 million at December 31, 2016. We had no outstanding secured borrowings as of December 31, 2017 and December 31, 2016. In the future MBB may elect to offer other products and services to the Company’s customer base.
Fixed rate leases may be financed with variable-rate funding sources, therefore, our earnings may be exposed to interest rate risk should interest rates rise. We generally benefit in times of falling and low interest rates.
From time to time we use derivative financial instruments to manage exposure to the effects of changes in market interest rates and to fulfill certain covenants in our borrowing arrangements. All derivatives are recorded on the Consolidated Balance Sheets at their fair value as either assets or liabilities. The Company was not a party to any active derivatives at December 31, 2017.
As a Utah state-chartered Federal Reserve member bank, MBB is supervised by both the Federal Reserve Bank of San Francisco and the Utah Department of Financial Institutions.
On January 13, 2009, Marlin Business Services Corp. became a bank holding company and is subject to the Bank Holding Company Act and supervised by the Federal Reserve Board and the Federal Reserve Bank of Philadelphia. On September 15, 2010, the Federal Reserve Bank of Philadelphia confirmed the effectiveness of Marlin Business Services Corp.’s election to become a financial holding company (while remaining a bank holding company) pursuant to Sections 4(k) and (l) of the Bank Holding Company Act and Section 225.82 of the Federal Reserve Board’s Regulation Y. Such election permits Marlin Business Services Corp. to engage in activities that are financial in nature or incidental to a financial activity, including the maintenance and expansion of our reinsurance activities conducted through its wholly-owned subsidiary, AssuranceOne.
On December 22, 2017, the U.S. government enacted comprehensive tax legislation commonly referred to as the Tax Cuts and Jobs Act (the “TCJA”). The TCJA makes broad and complex changes to the U.S. tax code,
-32-
Table of Contents
including, but not limited to, reducing the U.S. federal corporate tax rate from 35 percent to 21 percent, effective January 1, 2018. Consequently, we have recorded a decrease related to deferred tax assets and deferred tax liabilities of $4.5 million and $14.7 million, respectively, with a corresponding net adjustment to deferred income tax benefit of $10.2 million for the year ended December 31, 2017. While we have substantially completed our provisional analysis of the income tax effects of the TCJA and recorded a reasonable estimate of such effects, the net one-time charge related to the TCJA may differ, possibly materially, due to, among other things, further refinement of our calculations, changes in interpretations and assumptions that we have made, additional guidance that may be issued by the U.S. Government, actions and related accounting policy decisions we may take as a result of the TCJA. We will complete our analysis over a one-year measurement period ending December 22, 2018, and any adjustments during this measurement period will be included in net earnings from continuing operations as an adjustment to income tax expense in the reporting period when such adjustments are determined. Additional information is provided in Note 13, Income Taxes in the accompanying Notes to Consolidated Financial Statements.
Stock Repurchase Plan
On July 29, 2014, the Company’s Board of Directors approved the 2014 Repurchase Plan, under which, the Company was authorized to repurchase up to $15 million in value of its outstanding shares of common stock. On May 30, 2017, the Company’s Board of Directors approved the 2017 Repurchase Plan to replace the 2014 Repurchase Plan. Under the 2017 Repurchase Plan, the Company is authorized to repurchase up to $10 million in value of its outstanding shares of common stock. This authority may be exercised from time to time and in such amounts as market conditions warrant. Any shares purchased under this plan are returned to the status of authorized but unissued shares of common stock. The repurchases may be made on the open market or in block trades. The program may be suspended or discontinued at any time. The repurchases are funded using the Company’s working capital.
During the year ended December 31, 2017, the Company purchased 87,210 shares of its common stock in the open market under the 2017 Repurchase Plan at an average cost of $24.05 per share and 58,914 shares of its common stock under the 2014 Repurchase Plan at an average cost of $25.09 per share.. As of December 31, 2017, the maximum approximate dollar value of shares that may yet be purchased under the 2017 Stock Repurchase Plan is approximately $7.9 million.
In addition to the repurchases described above, pursuant to the Equity Plans, participants may have shares withheld to cover income taxes. There were 38,139 shares repurchased to cover income tax withholding in connection with shares granted under the 2014 Equity Plan during the year ended December 31, 2017, at an average cost of $24.27 per share.
Critical Accounting Policies
Our discussion and analysis of our financial condition and results of operations are based upon our consolidated financial statements, which have been prepared in accordance with U.S. GAAP. Preparation of these financial statements requires us to make estimates and judgments that affect reported amounts of assets, liabilities, revenues and expenses and affect related disclosure of contingent assets and liabilities at the date of our financial statements. On an ongoing basis, we evaluate our estimates, including credit losses, residuals, initial direct costs and fees, other fees, the fair value of financial instruments, self-insurance reserves and the realization of deferred tax assets. We base our estimates on historical experience and on various other assumptions that are believed to be reasonable under the circumstances, the results of which form the basis for making judgments about the carrying values of assets and liabilities that are not readily apparent from other sources. Critical accounting policies are defined as those that are reflective of significant judgments and uncertainties. Our consolidated financial statements are based on the selection and application of critical accounting policies, the most significant of which are described below.
-33-
Table of Contents
Lease residual values. A direct financing lease is recorded at the aggregate future minimum lease payments plus the estimated residual value less unearned income. Residual values are established at lease inception based on our estimate of the expected fair value of the equipment at the end of the lease term. Residual values may be realized at lease termination from lease extensions, sales or other dispositions of leased equipment. These estimates are based on industry data, management’s experience, and historical performance.
The Company records an estimated residual value at lease inception for all fair market value and fixed purchase option leases based on a percentage of the equipment cost of the asset being leased. The percentages used depend on equipment type and term. The Company records an estimated residual value on fixed purchase option leases based on the contractual fixed purchase price. In setting and reviewing estimated residual values, the Company focuses its analysis primarily on total historical and expected realization statistics pertaining to sales of equipment. In subsequent evaluations for the impairment of the booked residual values, the Company reviews historical realization statistics, including lease renewals and equipment sales. Anticipated renewal income is not included in the determination of fair value; however, it is one of the ways that fair value may be realized at the end of the lease term.
At the end of an original lease term, lessees may choose to purchase the equipment, renew the lease or return the equipment to the Company. The Company receives income from lease renewals when the lessee elects to retain the equipment longer than the original term of the lease. This income, net of appropriate periodic reductions in the estimated residual values of the related equipment, is included in fee income as net residual income.
When a lessee elects to return equipment at lease termination, the equipment is transferred to other assets at the lower of its basis or fair market value. The Company generally sells returned equipment to independent third parties, rather than leasing the equipment a second time. The Company generally charges off the value of equipment within other assets once it has been aged greater than 120 days. Any loss recognized on transferring equipment to other assets, and any gain or loss realized on the sale or disposal of equipment to a lessee or to others is included in fee income as net residual income.
Based on the Company’s experience, the amount of ultimate realization of the residual value tends to relate more to the customer’s election at the end of the lease term to enter into a renewal period, to purchase the leased equipment or to return the leased equipment than it does to the equipment type. Management performs reviews of the estimated residual values and historic realization statistics no less frequently than quarterly and any impairment, if other than temporary, is recognized in the current period.
Allowance for credit losses. In accordance with the Contingencies Topic of the Financial Accounting Standards Board (the “FASB”) ASC, we maintain an allowance for credit losses at an amount sufficient to absorb losses inherent in our existing lease and loan portfolios as of the reporting dates based on our projection of probable net credit losses. We identify portfolio segments, which represent the level at which we develop and document a systematic methodology to determine the allowance for credit losses. As of December 31, 2017, we have identified four segments, which consist of equipment lease and loan, Funding Stream, TFG, and Community Reinvestment Act (“CRA”) loans, which all methodologies are evaluated on a pooled basis, due to their composition of similar accounts with similar general credit risk characteristics, diversified among industry, geography, equipment type (if applicable), obligor and vendor (if applicable). The Company has determined there to be one class of financing receivable within each portfolio segment as finance receivables of each segment contain the same initial measurement attributes, risk characteristics, and has the same method for monitoring and assessing credit risk within the segment.
Each segment generally considers both quantitative and qualitative factors in determining the allowance for credit losses. Quantitative factors for the equipment lease and loan segment include a migration analysis stratified by industry classification, historic delinquencies and charge-offs, and a static pool analysis of historic recoveries. A migration analysis is a technique used to estimate the likelihood that an account will progress through the
-34-
Table of Contents
various delinquency stages and ultimately charge off. A loss emergence period (LEP), which is the period of time between an event that triggers the probability of a loss and the confirmation of loss, is applied to the migration results to develop an estimate of losses inherent in the portfolio at the reporting period. Quantitative factors for the TFG and Funding Stream segments include establishing a loss curve based on historical analysis of net charge-offs. The loss curve technique is used to estimate the likelihood and timing of when an account will charge-off relative to the month in which it was funded. An LEP is applied to the loss curve results to develop an estimate of losses inherent in the portfolio at the reporting period. The TFG and Funding Stream segments utilize different assumptions for the historical charge-offs and loss emergence which is based on analysis specific to each segment. The CRA loan segment quantitative factor includes the analysis of historical losses that are used in conjunction with an LEP to develop a quantitative allowance for credit losses. As part of all of our quantitative analyses for each segment we may also consider specifically identified pools of equipment leases or loans separately from the quantitative analysis, whenever certain identified pools are not expected to perform consistently with their credit characteristics or the portfolio segment as a whole. These lease and loan pools may be analyzed for impairment separately quantitative analysis and a specific reserve established.
Qualitative factors that may result in further adjustments to the quantitative analyses include items such as changes in the composition of our lease and loan portfolio segments (including geography, industry, equipment type and vendor source), seasonality, economic or business conditions and other external factors, business practices or policies at the reporting date that are different from the periods used in the quantitative analyses and changes in experience and ability of leasing and lending management and other relevant staff. The total net adjustments due to all qualitative factors decreased the allowance for credit losses by approximately $0.3 million at December 31, 2017. There were no adjustments due to qualitative factors at December 31, 2016.
The various factors used in the analysis are reviewed periodically, and no less frequently than quarterly. We then establish an allowance for credit losses for the projected probable net credit losses inherent in the portfolio based on this analysis. A provision is charged against earnings to maintain the allowance for credit losses at the appropriate level. Our policy is to generally charge-off against the allowance the estimated unrecoverable portion of accounts once they reach 120 or more days delinquent.
Our projections of probable net credit losses are inherently uncertain, and as a result we cannot predict with certainty the amount of such losses. Changes in economic conditions, the risk characteristics and composition of the portfolio, bankruptcy laws, and other factors could impact our actual and projected net credit losses and the related allowance for credit losses. Actual losses may vary from current estimates.
Income taxes. The Income Taxes Topic of the FASB ASC requires the use of the asset and liability method under which deferred taxes are determined based on the estimated future tax effects of differences between the financial statement and tax basis of assets and liabilities, given the provisions of the enacted tax laws. In assessing the realizability of deferred tax assets, management considers whether it is more likely than not that some portion of the deferred tax assets will not be realized. The ultimate realization of deferred tax assets is dependent upon the generation of future taxable income during the periods in which those temporary differences become deductible. In making this assessment, management considers the scheduled reversal of deferred tax liabilities and projected future taxable income, the level of historical taxable income, projections for future taxable income over the periods which the deferred tax assets are deductible and available tax planning strategies.
Significant management judgment is required in determining the provision for income taxes, deferred tax assets and liabilities and any necessary valuation allowance recorded against net deferred tax assets. The process involves summarizing temporary differences resulting from the different treatment of items such as leases for tax and accounting purposes. These differences result in deferred tax assets and liabilities, which are included within the Consolidated Balance Sheets. Our management then assesses the likelihood that deferred tax assets will be recovered from future taxable income or tax carry-back availability and, to the extent our management believes recovery is not likely, a valuation allowance is established. To the extent that we establish a valuation allowance in a period, an expense is recorded within the tax provision in the Consolidated Statements of Operations.
-35-
Table of Contents
The periods subject to general examination for the Company’s federal return include the 2014 tax year to the present. The Company files state income tax returns in various states which may have different statutes of limitations. Generally, state income tax returns for years 2014 through the present are subject to examination.
The Company records penalties and accrued interest related to taxes in income tax expense. Uncertain tax positions are recognized when we believe it is more likely than not that the tax position will be upheld on examination by the taxing authorities based on merits of the position. As of December 31, 2017 and 2016, there are no unrecognized tax benefits, and we did not have any accrued interest and penalties.
Other Income. Other income includes various administrative transaction fees, insurance policy fees, fees received from referral of leases to third parties, and gain on sale of leases and servicing fees, recognized as earned. Effective third quarter 2016, on a prospective basis, the insurance policy fees are recognized in the Consolidated Statements of Operations in “Other income” and for all previous annual and interim periods are recorded net in “Insurance premiums written and earned.” Selected major components of other income for the year ended December 31, 2017 included $2.5 million of referral income, $1.8 million of insurance policy fees, and $3.7 million gain on the sale of leases and servicing fee income. Selected major components of other income for the year ended December 31, 2016 included $0.5 million of referral income, $0.8 million of insurance policy fees, and $0.7 million gain on the sale of leases and servicing fee income. Selected major components of other income for the year ended December 31, 2015 included $0.4 million of referral income and $0.1 million gain on the sale of leases and servicing fee income.
Insurance Premiums Written and Earned. Insurance premiums written and earned are recognized over the term of the policy, which is month to month. Since the policy’s premiums are recognized month to month, there is no unearned premium on the Consolidated Balance Sheets as these are fully recognized through the Consolidated Statements of Operations in the month written. For all annual and interim periods, second quarter 2016 and prior, income and expense related to insurance premiums written and earned, insurance policy fees, deferred acquisition costs, premium taxes and provision for losses and loss adjustment expenses is recorded within the “Insurance premiums written and earned” line on the Consolidated Statement of Operations. Effective third quarter 2016, on a prospective basis, only insurance premium written and earned was recorded to that line. Effective third quarter 2016, on a prospective basis, insurance policy fees were recorded to “Other income” and deferred acquisition costs, premium taxes and provision for losses and loss adjustment expenses were recorded in “General and administrative” expense. For the years ended December 31, 2017, 2016, and 2015, insurance premiums written and earned were $7.2 million, $6.2 million, and $5.5 million respectively.
Insurance Program Deferred Acquisition Costs. Deferred acquisitions costs represent the fees paid to a third-party insurance company. Effective third quarter 2016, on a prospective basis, the costs are recognized on the Consolidated Statements of Operations in “General and administrative” expense and for all previous interim and annual periods are recognized net in “Insurance premiums written and earned.” For each of the years ended December 31, 2017, 2016, and 2015, the Company recognized deferred acquisition costs $0.9 million, $0.7 million, and $0.8 million, respectively. Since the policy’s premiums are recognized on a month to month basis, there is no deferred acquisition costs on the Consolidated Balance Sheet as these are fully recognized through the Consolidated Statements of Operations in the month written.
Provision for Unpaid Losses and Loss Adjustment Expenses. The Company records a provision for insurance losses and loss adjustment expenses. Effective third quarter 2016, on a prospective basis, the expense was recorded in “General and administrative” expense on the Consolidated Statements of Operations and for all previous annual and interim periods is recorded net in “Insurance premiums written and earned.” The liability for losses and loss adjustment expenses includes an amount determined from loss reports and individual cases and an amount, based on historical loss experience and industry statistics, for losses incurred but not reported (“IBNR”). These estimates are continually reviewed and are subject to the impact of future changes in such factors as claim severity and frequency. Loss and loss expenses are paid when advised by the third-party insurance company. Outstanding losses comprise estimates of the amount of reported losses and loss expenses received from the
-36-
Table of Contents
third-party insurance company plus a provision for losses IBNR. IBNR is determined with the assistance of a third-party actuary. For each of the years ended December 31, 2017, 2016, and 2015, the Company recognized provision for unpaid losses and loss adjustment expenses of $0.8 million, $0.6 million, and $0.4 million, respectively.
RESULTS OF OPERATIONS
Comparison of the Years Ended December 31, 2017 and 2016
Net income. Net income of $25.3 million was reported for the year ended December 31, 2017, resulting in diluted earnings per share of $2.01, compared to net income of $17.3 million and diluted earnings per share of $1.38 for the year ended December 31, 2016. The increase is primarily due to $12.1 million increase in interest and fee income on higher average interest earning assets, $7.0 million increase in Other income on expanded capital markets activities and increased gains on sales of leases and loans, and $12.7 million decrease in tax expense primarily due to revaluation of deferred tax assets and liabilities associated with the TCJA. These increases in net income were partially offset by increase in interest expense of $3.4 million on increasing cost of funds and higher average deposit balances, an increase of $6.0 million in the Allowance for Credit losses, and $14.3 million increase in other expense.
Return on average assets was 2.59% for the year ended December 31, 2017, compared to a return of 2.08% for the year ended December 31, 2016. Return on average equity was 15.38% for the year ended December 31, 2017, compared to a return of 11.15% for the year ended December 31, 2016.
Overall, our average net investment in total finance receivables for the year ended December 31, 2017 increased 17.6% to $846.7 million, compared to $720.1 million for the year ended December 31, 2016. This change was primarily due to origination volume continuing to exceed lease repayments. The end-of-period net investment in total finance receivables at December 31, 2017 was $914.4 million, an increase of 14.8% from $796.7 million at December 31, 2016.
During the year ended December 31, 2017, we generated 32,189 new leases and loans in the amount of $629.4 million, compared to 27,583 new leases and loans in the amount of $504.3 million originated for the year ended December 31, 2016. Approval rates decreased from 58% at December 31, 2016 to 56% at December 31, 2017.
For the year ended December 31, 2017 compared to the year ended December 31, 2016, net interest and fee income increased $8.6 million, or 10.4%, primarily due $12.8 million increase in interest income offset by a $0.6 million decrease in fee income and a $3.4 million increase in interest expense. The provision for credit losses increased $6.0 million, or 48.4%, to $18.4 million for the year ended December 31, 2017 from $12.4 million for the year ended December 31, 2016, due to increased delinquency and charge-offs and to a lesser extent growth in the portfolio, and an additional $0.5 million for estimated inherent credit losses from the areas hardest hit by Hurricane Harvey and Hurricane Irma during third quarter 2017.
-37-
Table of Contents
Average balances and net interest margin. The following table summarizes the Company’s average balances, interest income, interest expense and average yields and rates on major categories of interest-earning assets and interest-bearing liabilities for the years ended December 31, 2017 and 2016.
| Year Ended December 31, | ||||||||||||||||||||||||
| 2017 | 2016 | |||||||||||||||||||||||
| (Dollars in thousands) | ||||||||||||||||||||||||
| Average Balance(1) |
Interest | Average Yields/ Rates |
Average Balance(1) |
Interest | Average Yields/ Rates |
|||||||||||||||||||
| Interest-earning assets: |
||||||||||||||||||||||||
| Interest-earning deposits with banks |
$ | 81,249 | $ | 646 | 0.80 | % | $ | 73,458 | $ | 185 | 0.25 | % | ||||||||||||
| Time deposits |
8,704 | 110 | 1.26 | 8,872 | 108 | 1.22 | ||||||||||||||||||
| Restricted interest-earning deposits with banks |
— | — | — | 62 | — | 0.08 | ||||||||||||||||||
| Securities available for sale |
8,778 | 173 | 1.97 | 6,171 | 141 | 2.29 | ||||||||||||||||||
| Net investment in leases(2) |
806,677 | 77,084 | 9.56 | 703,423 | 69,699 | 9.91 | ||||||||||||||||||
| Loans receivable(2) |
40,066 | 9,442 | 23.57 | 16,637 | 4,576 | 27.51 | ||||||||||||||||||
|
|
|
|
|
|
|
|
|
|||||||||||||||||
| Total interest-earning assets |
945,474 | 87,455 | 9.25 | 808,623 | 74,709 | 9.24 | ||||||||||||||||||
|
|
|
|
|
|
|
|
|
|||||||||||||||||
| Non-interest-earning assets: |
||||||||||||||||||||||||
| Cash and due from banks |
2,283 | 2,675 | ||||||||||||||||||||||
| Intangible assets |
729 | — | ||||||||||||||||||||||
| Goodwill |
705 | — | ||||||||||||||||||||||
| Property and equipment, net |
4,005 | 3,731 | ||||||||||||||||||||||
| Property tax receivables |
8,063 | 4,100 | ||||||||||||||||||||||
| Other assets(3) |
13,730 | 10,719 | ||||||||||||||||||||||
|
|
|
|
|
|||||||||||||||||||||
| Total non-interest-earning assets |
29,515 | 21,225 | ||||||||||||||||||||||
|
|
|
|
|
|||||||||||||||||||||
| Total assets |
$ | 974,989 | $ | 829,848 | ||||||||||||||||||||
|
|
|
|
|
|||||||||||||||||||||
| Interest-bearing liabilities: |
||||||||||||||||||||||||
| Certificate of Deposits(4) |
$ | 732,772 | $ | 10,654 | 1.45 | % | $ | 595,148 | $ | 7,471 | 1.26 | % | ||||||||||||
| Money Market Deposits(4) |
44,954 | 526 | 1.17 | 52,253 | 307 | 0.59 | ||||||||||||||||||
|
|
|
|
|
|
|
|
|
|||||||||||||||||
| Total interest-bearing liabilities |
777,726 | 11,180 | 1.43 | 647,401 | 7,778 | 1.20 | ||||||||||||||||||
|
|
|
|
|
|
|
|
|
|||||||||||||||||
| Non-interest-bearing liabilities: |
||||||||||||||||||||||||
| Sales and property taxes payable |
5,054 | 4,717 | ||||||||||||||||||||||
| Accounts payable and accrued expenses |
14,224 | 6,303 | ||||||||||||||||||||||
| Net deferred income tax liability |
13,534 | 16,478 | ||||||||||||||||||||||
|
|
|
|
|
|||||||||||||||||||||
| Total non-interest-bearing liabilities |
32,812 | 27,498 | ||||||||||||||||||||||
|
|
|
|
|
|||||||||||||||||||||
| Total liabilities |
810,538 | 674,899 | ||||||||||||||||||||||
| Stockholders’ equity |
164,451 | 154,949 | ||||||||||||||||||||||
|
|
|
|
|
|||||||||||||||||||||
| Total liabilities and stockholders’ equity |
$ | 974,989 | $ | 829,848 | ||||||||||||||||||||
|
|
|
|
|
|||||||||||||||||||||
| Net interest income |
$ | 76,275 | $ | 66,931 | ||||||||||||||||||||
|
|
|
|
|
|||||||||||||||||||||
| Interest rate spread(5) |
7.82 | % | 8.03 | % | ||||||||||||||||||||
| Net interest margin(6) |
8.07 | % | 8.28 | % | ||||||||||||||||||||
| Ratio of average interest-earning assets to average interest-bearing liabilities |
121.57 | % | 124.90 | % | ||||||||||||||||||||
| (1) | Average balances were calculated using average daily balances. |
-38-
Table of Contents
| (2) | Average balances of leases and loans include non-accrual leases and loans, and are presented net of unearned income. The average balances of leases and loans do not include the effects of (i) the allowance for credit losses and (ii) initial direct costs and fees deferred. |
| (3) | Includes operating leases. |
| (4) | Includes effect of transaction costs. Amortization of transaction costs is on a straight-line basis, resulting in an increased average rate whenever average portfolio balances are at reduced levels. |
| (5) | Interest rate spread represents the difference between the average yield on interest-earning assets and the average rate on interest-bearing liabilities. |
| (6) | Net interest margin represents net interest income as a percentage of average interest-earning assets. |
The following table presents the components of the changes in net interest income by volume and rate.
| Year Ended December 31, 2017 Compared To Year Ended December 31, 2016 |
||||||||||||
| Increase (Decrease) Due To: | ||||||||||||
| Volume(1) | Rate(1) | Total | ||||||||||
| (Dollars in thousands) | ||||||||||||
| Interest income: |
||||||||||||
| Interest-earning deposits with banks |
$ | 19 | $ | 442 | $ | 461 | ||||||
| Time Deposits |
(1 | ) | 3 | 2 | ||||||||
| Securities available for sale |
53 | (21 | ) | 32 | ||||||||
| Net investment in leases |
9,938 | (2,553 | ) | 7,385 | ||||||||
| Loans receivable |
5,607 | (741 | ) | 4,866 | ||||||||
| Total interest income |
12,658 | 88 | 12,746 | |||||||||
| Interest expense: |
||||||||||||
| Certificate of Deposits |
1,890 | 1,293 | 3,183 | |||||||||
| Money Market Deposits |
(48 | ) | 267 | 219 | ||||||||
| Total interest expense |
1,721 | 1,681 | 3,402 | |||||||||
| Net interest income |
$ | 11,078 | $ | (1,734 | ) | $ | 9,344 | |||||
| (1) | Changes due to volume and rate are calculated independently for each line item presented rather than presenting vertical subtotals for the individual volume and rate columns. Changes attributable to changes in volume represent changes in average balances multiplied by the prior period’s average rates. Changes attributable to changes in rate represent changes in average rates multiplied by the prior year’s average balances. Changes attributable to the combined impact of volume and rate have been allocated proportionately to the change due to volume and the change due to rate. |
-39-
Table of Contents
Net interest and fee margin. The following table summarizes the Company’s net interest and fee income as a percentage of average total finance receivables for the years ended December 31, 2017 and 2016.
| Year Ended December 31, | ||||||||
| 2017 | 2016 | |||||||
| (Dollars in thousands) | ||||||||
| Interest income |
$ | 87,455 | $ | 74,709 | ||||
| Fee income |
14,864 | 15,543 | ||||||
|
|
|
|
|
|||||
| Interest and fee income |
102,319 | 90,252 | ||||||
| Interest expense |
11,180 | 7,778 | ||||||
|
|
|
|
|
|||||
| Net interest and fee income |
$ | 91,139 | $ | 82,474 | ||||
|
|
|
|
|
|||||
| Average total finance receivables(1) |
$ | 846,743 | $ | 720,060 | ||||
| Percent of average total finance receivables: |
||||||||
| Interest income |
10.33 | % | 10.38 | % | ||||
| Fee income |
1.76 | 2.16 | ||||||
|
|
|
|
|
|||||
| Interest and fee income |
12.09 | 12.54 | ||||||
| Interest expense |
1.32 | 1.08 | ||||||
|
|
|
|
|
|||||
| Net interest and fee margin |
10.77 | % | 11.46 | % | ||||
|
|
|
|
|
|||||
| (1) | Total finance receivables include net investment in direct financing leases and loans. For the calculations above, the effects of (i) the allowance for credit losses and (ii) initial direct costs and fees deferred are excluded. |
Net interest and fee income increased $8.6 million, or 10.4%, to $91.1 million for the year ended December 31, 2017 from $82.5 million for the year ended December 31, 2016. The net interest and fee margin was 10.77% and 11.46% for the years ended December 31, 2017 and December 31, 2016, respectively.
Interest income, net of amortized initial direct costs and fees, increased $12.8 million, or 17.1%, to $87.5 million for the year ended December 31, 2017 from $74.7 million for the year ended December 31, 2016. The increase in interest income was principally due to a 17.6% increase in average total finance receivables, which increased $126.6 million to $846.7 million at December 31, 2017 from $720.1 million at December 31, 2016. The increase in average total finance receivables was primarily due to origination volume continuing to exceed lease repayments. The weighted average implicit interest rate on new finance receivables increased 31 basis point to 11.98% for the year ended December 31, 2017, from 11.67% for the year ended December 31, 2016.
Fee income decreased $0.6 million, or 3.9%, to $14.9 million for the year ended December 31, 2017 from $15.5 million for the year ended December 31, 2016. Fee income included approximately $3.6 million of net residual income for the year ended December 31, 2017 and $4.1 million for the year ended December 31, 2016.
Fee income also included approximately $9.0 million in late fee income for the year ended December 31, 2017, which decreased 3.2%, compared to $9.3 million for the year ended December 31, 2016.
Fee income, as a percentage of average total finance receivables, decreased 40 basis points to 1.76% for the year ended December 31, 2017 from 2.16% for the year ended December 31, 2016. Late fees remained the largest component of fee income at 1.06% as a percentage of average total finance receivables for the year ended December 31, 2017, compared to 1.29% for the year ended December 31, 2016. As a percentage of average total finance receivables, net residual income was 0.43% for the year ended December 31, 2017, compared to 0.57% for the year ended December 31, 2016.
-40-
Table of Contents
Interest expense increased $3.4 million to $11.2 million, or 1.43% as a percentage of average deposits, for the year ended December 31, 2017 from $7.8 million, or 1.20% as a percentage of average deposits, for the year ended December 31, 2016. The increase was almost equally due to increases in rate and average balance of interest bearing liabilities. Interest expense, as an annualized percentage of average total finance receivables, increased 24 basis points to 1.32% for the year ended December 31, 2017, from 1.08% for the year ended December 31, 2016. The average balance of deposits was $777.7 million and $647.4 million for the years ended December 31, 2017 and December 31, 2016, respectively.
For the year ended December 31, 2017 and December 31, 2016, there were no borrowings outstanding. (See Liquidity and Capital Resources in this Item 7).
Our wholly-owned subsidiary, MBB, serves as our primary funding source. MBB raises time deposits through a variety of sources including: directly from customers, through the use of on-line listing services, and through the use of deposit brokers. At December 31, 2017, brokered certificates of deposit represented approximately 55.2% of total deposits, while approximately 40.0% of total deposits were obtained from direct channels, and 4.8% were in the brokered MMDA Product.
Insurance premiums written and earned. Insurance premiums written and earned increased $0.8 million to $7.2 million for the year ended December 31, 2017 from $6.4 million for the year ended December 31, 2016, primarily due to an increase in the number of contracts enrolled in the insurance program as well as higher average ticket size. For all annual and interim periods, second quarter 2016 and prior, income and expense related to insurance premiums written and earned, insurance policy fees, deferred acquisition costs, premium taxes and provision for losses and loss adjustment expenses is recorded within the “Insurance premiums written and earned” line on the Consolidated Statement of Operations. Effective third quarter 2016, on a prospective basis, only insurance premiums written and earned were recorded to that line. Effective third quarter 2016, on a prospective basis, insurance policy fees were recorded to “Other income” and deferred acquisition costs, premium taxes and provision for losses and loss adjustment expenses were recorded in the “General and administrative” expense line.
Other income. Other income increased $6.2 million to $9.6 million for the year ended December 31, 2017 from $3.4 million for the year ended December 31, 2016. Other income primarily includes various administrative transaction fees and fees received from referral of leases to third parties, and gain on sale of leases and servicing fee income, recognized as earned. Selected major components of other income for the year ended December 31, 2017 included $2.5 million of referral income, $1.8 million of insurance policy fees, and $3.7 million gain on the sale of leases and servicing fee income. In comparison, selected major components of other income for the year ended December 31, 2016 included $0.5 million of referral income, $0.8 million of insurance policy fees, and $0.7 million gain the on sale of leases and servicing fee income. Gain on sale of leases and servicing fee income and referral fee income increases are due to the Company’s expanded capital markets activities and capabilities.
Salaries and benefits expense. Salaries and benefits expense increased $5.7 million, or 17.9%, to $37.6 million for the year ended December 31, 2017 from $31.9 million for the year ended December 31, 2016. The increase was primarily due to an increase in total personnel and increased compensation related to increased origination volume. Salaries and benefits expense, as a percentage of average total finance receivables, was 4.44% for the year ended December 31, 2017 compared with 4.43% for the year ended December 31, 2016. Total personnel was 330 at December 31, 2017 compared to 318 at December 31, 2016.
General and administrative expense. General and administrative expense increased $8.8 million, or 45.1%, to $28.3 million for the year ended December 31, 2017 from $19.5 million for the year ended December 31, 2016. General and administrative expense as a percentage of average total finance receivables was 3.34% for the year ended December 31, 2017, compared to 2.71% for the year ended December 31, 2016.
Selected major components of general and administrative expense for the year ended December 31, 2017 included $3.5 million of premises and occupancy expense, $1.6 million of audit and tax compliance expense,
-41-
Table of Contents
$3.3 million of data processing expense, $1.8 million of marketing expense, $1.2 million of FDIC insurance fees, a $4.2 million estimated charge for restitution expense in connection with MBB’s regulatory examination preliminary findings (See Note 10, Commitments and Contingencies, in the accompanying Notes to Consolidated Financial Statements), and $1.6 million of insurance related expenses which were recognized net in “Insurance premiums written and earned” in prior quarters. In comparison, selected major components of general and administrative expense for the year ended December 31, 2016 included $3.3 million of premises and occupancy expense, $1.4 million of audit and tax compliance expense, $2.4 million of data processing expense, $1.9 million of marketing expense, $0.7 million of FDIC insurance fees, and $0.7 million of insurance related expenses which were recognized net in “Insurance premiums written and earned” in prior quarters.
Financing related costs. Financing related costs primarily represent bank commitment fees paid to our financing sources on the unused portion of our loan facility. There were no financing related costs for the year ended December 31, 2017, compared to $0.1 million for the year ended December 31, 2016.
Provision for credit losses. The provision for credit losses increased $6.0 million, or 48.4%, to $18.4 million for the year ended December 31, 2017 from $12.4 million for the year ended December 31, 2016. Lease portfolio losses tend to follow patterns based on the mix of origination vintages comprising the portfolio. The anticipated credit losses from the inception of a particular lease origination vintage to charge-off generally follow a pattern of lower losses for the first few months, followed by increased losses in subsequent months, then lower losses during the later periods of the lease term. Therefore, the seasoning, or mix of origination vintages, of the portfolio affects the timing and amount of anticipated probable and estimable credit losses.
The increase in our provision for credit losses resulted from increased delinquency and charge-offs and to a lesser extent growth in the portfolio, and an additional $0.5 million for estimated inherent losses from the areas hardest hit by Hurricane Harvey and Hurricane Irma during third quarter 2017. This additional reserve is an estimate based on information currently available which includes information obtained from contacting affected customers. As of December 31, 2017, the Company did not have any charge-offs associated with Hurricane activity, however, the $0.5 million established reserve was still deemed appropriate at December 31, 2017.
Net charge-offs were $14.5 million for the year ended December 31, 2017, compared to $9.9 million for the year ended December 31, 2016. The increase in charge-offs was primarily due to a return to a more normalized credit environment and higher than expected charge-offs in the TFG channel and also partially due to an increase in portfolio size. Net charge-offs as a percentage of average total finance receivables increased to 1.71% during the year ended December 31, 2017, from 1.37% for the year ended December 31, 2016. The allowance for credit losses was $14.9 million and $10.9 million at December 31, 2017 and December 31, 2016, respectively.
Additional information regarding asset quality is included herein in the subsequent section, “Finance Receivables and Asset Quality.”
Provision for income taxes. Income tax benefit of $1.7 million was recorded for the year ended December 31, 2017, compared to expense of $11.0 million for the year ended December 31, 2016. The decrease was primarily due to the Company’s revaluation of its deferred tax assets and liabilities at the new federal corporate tax rate of 21% resulting in a $12.7 million reduction in income tax expense and, to a lesser extent, excess tax benefits pertaining to share-based payment arrangements that were recognized in income tax expense instead of additional-paid-in-capital because of the January 1, 2017 adoption of ASU 2016-09. Our effective tax rate, which is a combination of federal and state income tax rates, was approximately (7.0%) for the year ended December 31, 2017, compared to 38.9% for the year ended December 31, 2016. The change in effective tax rate is primarily due to the TCJA enacted December 22, 2017.
Comparison of the Years Ended December 31, 2016 and 2015
Net income. Net income of $17.3 million was reported for the year ended December 31, 2016, resulting in diluted earnings per share of $1.38, compared to net income of $16.0 million and diluted earnings per share of $1.25 for the year ended December 31, 2015.
-42-
Table of Contents
Return on average assets was 2.08% for the year ended December 31, 2016, compared to a return of 2.11% for the year ended December 31, 2015. Return on average equity was 11.15% for the year ended December 31, 2016, compared to a return of 9.49% for the year ended December 31, 2015.
Overall, our average net investment in total finance receivables for the year ended December 31, 2016 increased 13.1% to $720.1 million, compared to $636.8 million for the year ended December 31, 2015. This change was primarily due to origination volume continuing to exceed lease repayments. The end-of-period net investment in total finance receivables at December 31, 2016 was $796.7 million, an increase of 16.7% from $682.4 million at December 31, 2015.
During the year ended December 31, 2016, we originated 27,583 new leases and loans in the amount of $504.3 million, compared to 25,307 new leases and loans in the amount of $381.1 million originated for the year ended December 31, 2015. Sales staffing levels decreased slightly from 136 sales account executives at December 31, 2015 to 135 sales account executives at December 31, 2016. Approval rates decreased from 63% at December 31, 2015 to 58% at December 31, 2016.
For the year ended December 31, 2016 compared to the year ended December 31, 2015, net interest and fee income increased $6.2 million, or 8.1%, primarily due to an $8.0 million increase in interest income and a $0.2 million increase in fee income, offset by a $2.1 million increase in interest expense. The provision for credit losses increased $2.4 million, or 24.0%, to $12.4 million for the year ended December 31, 2016 from $10.0 million for the year ended December 31, 2015, primarily due to growth in the portfolio. Other expenses increased $2.7 million, or 5.5%, for the year ended December 31, 2016, compared to the year ended December 31, 2015.
-43-
Table of Contents
Average balances and net interest margin. The following table summarizes the Company’s average balances, interest income, interest expense and average yields and rates on major categories of interest-earning assets and interest-bearing liabilities for the years ended December 31, 2016 and 2015.
| Year Ended December 31, | ||||||||||||||||||||||||
| 2016 | 2015 | |||||||||||||||||||||||
| (Dollars in thousands) | ||||||||||||||||||||||||
| Average Balance(1) |
Interest | Average Yields/ Rates |
Average Balance(1) |
Interest | Average Yields/ Rates |
|||||||||||||||||||
| Interest-earning assets: |
||||||||||||||||||||||||
| Interest-earning deposits with banks |
$ | 73,458 | $ | 185 | 0.25 | % | $ | 90,538 | $ | 117 | 0.13 | % | ||||||||||||
| Time deposits |
8,872 | 108 | 1.22 | 5,264 | 60 | 1.14 | ||||||||||||||||||
| Restricted interest-earning deposits with banks |
62 | — | 0.08 | 671 | — | 0.01 | ||||||||||||||||||
| Securities available for sale |
6,171 | 141 | 2.29 | 5,903 | 128 | 2.17 | ||||||||||||||||||
| Net investment in leases(2) |
703,423 | 69,699 | 9.91 | 634,200 | 65,808 | 10.38 | ||||||||||||||||||
| Loans receivable(2) |
16,637 | 4,576 | 27.51 | 2,590 | 549 | 21.20 | ||||||||||||||||||
|
|
|
|
|
|
|
|
|
|||||||||||||||||
| Total interest-earning assets |
808,623 | 74,709 | 9.24 | 739,166 | 66,662 | 9.02 | ||||||||||||||||||
|
|
|
|
|
|
|
|
|
|||||||||||||||||
| Non-interest-earning assets: |
||||||||||||||||||||||||
| Cash and due from banks |
2,675 | 2,232 | ||||||||||||||||||||||
| Property and equipment, net |
3,731 | 3,721 | ||||||||||||||||||||||
| Property tax receivables |
4,100 | 2,513 | ||||||||||||||||||||||
| Other assets(3) |
10,719 | 10,155 | ||||||||||||||||||||||
|
|
|
|
|
|||||||||||||||||||||
| Total non-interest-earning assets |
21,225 | 18,621 | ||||||||||||||||||||||
|
|
|
|
|
|||||||||||||||||||||
| Total assets |
$ | 829,848 | $ | 757,787 | ||||||||||||||||||||
|
|
|
|
|
|||||||||||||||||||||
| Interest-bearing liabilities: |
||||||||||||||||||||||||
| Certificate of Deposits(4) |
$ | 595,148 | $ | 7,471 | 1.26 | % | $ | 512,751 | $ | 5,553 | 1.08 | % | ||||||||||||
| Money Market Deposits(4) |
52,253 | 307 | 0.59 | 48,123 | 143 | 0.30 | ||||||||||||||||||
|
|
|
|
|
|
|
|
|
|||||||||||||||||
| Total interest-bearing liabilities |
647,401 | 7,778 | 1.20 | 560,874 | 5,696 | 1.02 | ||||||||||||||||||
|
|
|
|
|
|
|
|
|
|||||||||||||||||
| Non-interest-bearing liabilities: |
||||||||||||||||||||||||
| Sales and property taxes payable |
4,717 | 4,588 | ||||||||||||||||||||||
| Accounts payable and accrued expenses |
6,303 | 7,080 | ||||||||||||||||||||||
| Net deferred income tax liability |
16,478 | 16,993 | ||||||||||||||||||||||
|
|
|
|
|
|||||||||||||||||||||
| Total non-interest-bearing liabilities |
27,498 | 28,661 | ||||||||||||||||||||||
|
|
|
|
|
|||||||||||||||||||||
| Total liabilities |
674,898 | 589,535 | ||||||||||||||||||||||
| Stockholders’ equity |
154,949 | 168,252 | ||||||||||||||||||||||
|
|
|
|
|
|||||||||||||||||||||
| Total liabilities and stockholders’ equity |
$ | 829,848 | $ | 757,787 | ||||||||||||||||||||
|
|
|
|
|
|||||||||||||||||||||
| Net interest income |
$ | 66,931 | $ | 60,966 | ||||||||||||||||||||
|
|
|
|
|
|||||||||||||||||||||
| Interest rate spread(5) |
8.03 | % | 8.00 | % | ||||||||||||||||||||
| Net interest margin(6) |
8.28 | % | 8.25 | % | ||||||||||||||||||||
| Ratio of average interest-earning assets to average interest-bearing liabilities |
124.90 | % | 131.79 | % | ||||||||||||||||||||
| (1) | Average balances were calculated using average daily balances. |
| (2) | Average balances of leases and loans include non-accrual leases and loans, and are presented net of unearned income. The average balances of leases and loans do not include the effects of (i) the allowance for credit losses and (ii) initial direct costs and fees deferred. |
| (3) | Includes operating leases. |
-44-
Table of Contents
| (4) | Includes effect of transaction costs. Amortization of transaction costs is on a straight-line basis, resulting in an increased average rate whenever average portfolio balances are at reduced levels. |
| (5) | Interest rate spread represents the difference between the average yield on interest-earning assets and the average rate on interest-bearing liabilities. |
| (6) | Net interest margin represents net interest income as a percentage of average interest-earning assets. |
The following table presents the components of the changes in net interest income by volume and rate.
| Year Ended December 31, 2016 Compared To Year Ended December 31, 2015 |
||||||||||||
| Increase (Decrease) Due To: | ||||||||||||
| Volume(1) | Rate(1) | Total | ||||||||||
| (Dollars in thousands) | ||||||||||||
| Interest income: |
||||||||||||
| Interest-earning deposits with banks |
$ | (25 | ) | $ | 93 | $ | 68 | |||||
| Time Deposits |
44 | 4 | 48 | |||||||||
| Securities available for sale |
6 | 7 | 13 | |||||||||
| Net investment in leases |
6,953 | (3,062 | ) | 3,891 | ||||||||
| Loans receivable |
3,818 | 209 | 4,027 | |||||||||
| Total interest income |
6,385 | 1,662 | 8,047 | |||||||||
| Interest expense: |
||||||||||||
| Certificate of Deposits |
964 | 954 | 1,918 | |||||||||
| Money Market Deposits |
13 | 151 | 164 | |||||||||
| Total interest expense |
953 | 1,129 | 2,082 | |||||||||
| Net interest income |
$ | 5,747 | $ | 217 | $ | 5,964 | ||||||
| (1) | Changes due to volume and rate are calculated independently for each line item presented rather than presenting vertical subtotals for the individual volume and rate columns. Changes attributable to changes in volume represent changes in average balances multiplied by the prior period’s average rates. Changes attributable to changes in rate represent changes in average rates multiplied by the prior year’s average balances. Changes attributable to the combined impact of volume and rate have been allocated proportionately to the change due to volume and the change due to rate. |
-45-
Table of Contents
Net interest and fee margin. The following table summarizes the Company’s net interest and fee income as a percentage of average total finance receivables for the years ended December 31, 2016 and 2015.
| Year Ended December 31, | ||||||||
| 2016 | 2015 | |||||||
| (Dollars in thousands) | ||||||||
| Interest income |
$ | 74,709 | $ | 66,662 | ||||
| Fee income |
15,543 | 15,291 | ||||||
|
|
|
|
|
|||||
| Interest and fee income |
90,252 | 81,953 | ||||||
| Interest expense |
7,778 | 5,696 | ||||||
|
|
|
|
|
|||||
| Net interest and fee income |
$ | 82,474 | $ | 76,257 | ||||
|
|
|
|
|
|||||
| Average total finance receivables(1) |
$ | 720,060 | $ | 636,790 | ||||
| Percent of average total finance receivables: |
||||||||
| Interest income |
10.38 | % | 10.47 | % | ||||
| Fee income |
2.16 | 2.40 | ||||||
|
|
|
|
|
|||||
| Interest and fee income |
12.54 | 12.87 | ||||||
| Interest expense |
1.08 | 0.89 | ||||||
|
|
|
|
|
|||||
| Net interest and fee margin |
11.46 | % | 11.98 | % | ||||
|
|
|
|
|
|||||
| (1) | Total finance receivables include net investment in direct financing leases and loans. For the calculations above, the effects of (i) the allowance for credit losses and (ii) initial direct costs and fees deferred are excluded. |
Net interest and fee income increased $6.2 million, or 8.1%, to $82.5 million for the year ended December 31, 2016 from $76.3 million for the year ended December 31, 2015. The net interest and fee margin was 11.46% and 11.98% for the years ended December 31, 2016 and December 31, 2015, respectively.
Interest income, net of amortized initial direct costs and fees, increased $8.0 million, or 12.0%, to $74.7 million for the year ended December 31, 2016 from $66.7 million for the year ended December 31, 2015. The increase in interest income was principally due to a 13.1% increase in average total finance receivables, which increased $83.3 million to $720.1 million at December 31, 2016 from $636.8 million at December 31, 2015. The increase in average total finance receivables was primarily due to origination volume continuing to exceed lease repayments. The weighted average implicit interest rate on new finance receivables increased 54 basis point to 11.67% for the year ended December 31, 2016, from 11.13% for the year ended December 31, 2015.
Fee income increased $0.2 million, or 1.3%, to $15.5 million for the year ended December 31, 2016 from $15.3 million for the year ended December 31, 2015. Fee income included approximately $4.1 million of net residual income for the year ended December 31, 2016 and $3.8 million for the year ended December 31, 2015.
Fee income also included approximately $9.3 million in late fee income for the year ended December 31, 2016, which increased 2.2%, compared to $9.1 million for the year ended December 31, 2015. The increase in late fee income was primarily due to the increase in average total finance receivables.
Fee income, as a percentage of average total finance receivables, decreased 24 basis points to 2.16% for the year ended December 31, 2016 from 2.40% for the year ended December 31, 2015. Late fees remained the largest component of fee income at 1.29% as a percentage of average total finance receivables for the year ended December 31, 2016, compared to 1.43% for the year ended December 31, 2015. As a percentage of average total finance receivables, net residual income was 0.57% for the year ended December 31, 2016, compared to 0.60% for the year ended December 31, 2015.
-46-
Table of Contents
Interest expense increased $2.1 million to $7.8 million, or 1.20% as a percentage of average deposits, for the year ended December 31, 2016 from $5.7 million, or 1.02% as a percentage of average deposits, for the year ended December 31, 2015. The increase was primarily due to increase in rate paid on interest-bearing liabilities and to a lesser degree, the increase in the average balances of interest-bearing liabilities. Interest expense, as an annualized percentage of average total finance receivables, increased 19 basis points to 1.08% for the year ended December 31, 2016, from 0.89% for the year ended December 31, 2015. The average balance of deposits was $647.4 million and $560.9 million for the years ended December 31, 2016 and December 31, 2015, respectively.
For the year ended December 31, 2016 and December 31, 2015, there were no borrowings outstanding. (See Liquidity and Capital Resources in this Item 7).
Our wholly-owned subsidiary, MBB, serves as our primary funding source. MBB raises time deposits through a variety of sources including: directly from customers, through the use of on-line listing services, and through the use of deposit brokers. At December 31, 2016, brokered certificates of deposit represented approximately 58.8% of total deposits, while approximately 33.8% of total deposits were obtained from direct channels, and 7.4% were in the brokered MMDA Product.
Insurance premiums written and earned. Insurance premiums written and earned increased $0.5 million to $6.4 million for the year ended December 31, 2016 from $5.9 million for the year ended December 31, 2015, primarily due to an increase in the number of contracts enrolled in the insurance program as well as higher average ticket size.
Other income. Other income increased $1.5 million to $3.4 million for the year ended December 31, 2016 from $1.9 million for the year ended December 31, 2015. Other income primarily includes various administrative transaction fees and fees received from referral of leases to third parties and gain on sale of leases, recognized as earned. Effective third quarter 2016, on a prospective basis, insurance policy fees of $0.8 million are recognized in the Consolidated Statements of Operations in “Other income” and for all previous quarters were recognized net in “Insurance premiums written and earned.”
Salaries and benefits expense. Salaries and benefits expense increased $0.7 million, or 2.2%, to $31.9 million for the year ended December 31, 2016 from $31.2 million for the year ended December 31, 2015. The increase was primarily due to an increase in sales incentive compensation related to increased lease and loan originations offset by a salary and benefit expense associated with the separation agreements related to the departure of the Company’s Chief Financial Officer and Chief Executive Officer during 2015. Salaries and benefits expense, as a percentage of average total finance receivables, was 4.43% for the year ended December 31, 2016 compared with 4.90% for the year ended December 31, 2015. Total personnel was 318 at December 31, 2016 compared to 314 at December 31, 2015.
General and administrative expense. General and administrative expense increased $2.0 million, or 11.4%, to $19.5 million for the year ended December 31, 2016 from $17.5 million for the year ended December 31, 2015. General and administrative expense as a percentage of average total finance receivables was 2.71% for the year ended December 31, 2016, compared to 2.74% for the year ended December 31, 2015.
Selected major components of general and administrative expense for the year ended December 31, 2016 included $3.3 million of premises and occupancy expense, $1.4 million of audit and tax compliance expense, $2.4 million of data processing expense, $1.9 million of marketing expense, $0.7 million of FDIC insurance fees, and $0.7 million of insurance related expenses which were recognized net in “Insurance premiums written and earned” in prior quarters. In comparison, selected major components of general and administrative expense for the year ended December 31, 2015 included $3.4 million of premises and occupancy expense, $1.4 million of audit and tax compliance expense, $2.0 million of data processing expense, $1.2 million of marketing expense, and $0.5 million of FDIC insurance fees.
-47-
Table of Contents
Financing related costs. Financing related costs primarily represent bank commitment fees paid to our financing sources on the unused portion of our loan facility. Financing related costs were $0.1 million for the year ended December 31, 2016, compared to $0.2 million for the year ended December 31, 2015.
Provision for credit losses. The provision for credit losses increased $2.4 million, or 24.0%, to $12.4 million for the year ended December 31, 2016 from $10.0 million for the year ended December 31, 2015, primarily due to growth in the portfolio. Lease portfolio losses tend to follow patterns based on the mix of origination vintages comprising the portfolio. The anticipated credit losses from the inception of a particular lease origination vintage to charge-off generally follow a pattern of lower losses for the first few months, followed by increased losses in subsequent months, then lower losses during the later periods of the lease term. Therefore, the seasoning, or mix of origination vintages, of the portfolio affects the timing and amount of anticipated probable and estimable credit losses.
Net charge-offs were $9.9 million for the year ended December 31, 2016, compared to $10.1 million for the year ended December 31, 2015. Net charge-offs as a percentage of average total finance receivables decreased to 1.37% during the year ended December 31, 2016, from 1.59% for the year ended December 31, 2015. The allowance for credit losses was $10.9 million and $8.4 million at December 31, 2016 and December 31, 2015, respectively.
Additional information regarding asset quality is included herein in the subsequent section, “Finance Receivables and Asset Quality.”
Provision for income taxes. Income tax expense of $11.0 million was recorded for the year ended December 31, 2016, compared to $9.3 million for the year ended December 31, 2015. The change is primarily attributable to the change in pretax income. Our effective tax rate, which is a combination of federal and state income tax rates, was approximately 38.9% for the year ended December 31, 2016, compared to 36.7% for the year ended December 31, 2015. The change in effective tax rate is primarily due to changes in the mix of projected pretax book income across the jurisdictions and entities.
Operating Data
We manage expenditures using a comprehensive budgetary review process. Expenses are monitored by departmental heads and are reviewed by senior management monthly. The efficiency ratio (relating expenses with revenues) and the ratio of salaries and benefits and general and administrative expense as a percentage of the average total finance receivables shown below are metrics used by management to monitor productivity and spending levels. Please refer to Management’s Discussion and Analysis of Financial Condition and Results of Operations—Results of Operations for additional information regarding factors influencing these metrics.
| Year Ended December 31, | ||||||||||||
| 2017 | 2016 | 2015 | ||||||||||
| (Dollars in thousands) | ||||||||||||
| Average total finance receivables |
$ | 846,743 | $ | 720,060 | $ | 636,790 | ||||||
| Salaries and benefits expense |
37,569 | 31,912 | 31,174 | |||||||||
| General and administrative expense |
28,272 | 19,523 | 17,451 | |||||||||
| Efficiency ratio (1) |
61.04 | % | 55.77 | % | 57.84 | % | ||||||
| Percent of average total finance receivables: |
||||||||||||
| Salaries and benefits |
4.44 | % | 4.43 | % | 4.90 | % | ||||||
| General and administrative |
3.34 | % | 2.71 | % | 2.74 | % | ||||||
| (1) | Represents expenses (salaries and benefits expense and general and administrative expense) divided by the sum of net interest and fee income, insurance income and other income. |
-48-
Table of Contents
We generally reach our lessees through a network of independent equipment dealers and, to a much lesser extent, lease brokers. The number of dealers and brokers with whom we conduct business depends on, among other things, the number of sales account executives we have.
Finance Receivables and Asset Quality
Our net investment in leases and loans increased $117.7 million, or 14.8%, to $914.4 million at December 31, 2017, from $796.7 million at December 31, 2016. During 2017, we increased origination activity through continued development of our internal sales organization and through an acquisition of Horizon Keystone Financial (“HKF”). A portion of the Company’s lease portfolio is generally assigned as collateral for borrowings as described below in Liquidity and Capital Resources in this Item 7.
The chart which follows provides our asset quality statistics for each of the five years ended December 31, 2017:
| Year Ended December 31, | ||||||||||||||||||||
| 2017 | 2016 | 2015 | 2014 | 2013 | ||||||||||||||||
| (Dollars in thousands) | ||||||||||||||||||||
| Allowance for credit losses, beginning of period |
$ | 10,937 | $ | 8,413 | $ | 8,537 | $ | 8,467 | $ | 6,488 | ||||||||||
| Provision for credit losses |
18,394 | 12,414 | 9,995 | 9,116 | 9,617 | |||||||||||||||
| Charge-offs: |
||||||||||||||||||||
| Commercial loans: |
||||||||||||||||||||
| Funding Stream |
(1,219 | ) | (455 | ) | (14 | ) | — | — | ||||||||||||
| CRA |
— | — | — | — | — | |||||||||||||||
| Equipment Finance (1) |
(14,343 | ) | (11,893 | ) | (12,439 | ) | (11,463 | ) | (9,499 | ) | ||||||||||
| TFG |
(1,154 | ) | (39 | ) | — | — | — | |||||||||||||
|
|
|
|
|
|
|
|
|
|
|
|||||||||||
| Total charge-offs |
(16,716 | ) | (12,387 | ) | (12,453 | ) | (11,463 | ) | (9,499 | ) | ||||||||||
|
|
|
|
|
|
|
|
|
|
|
|||||||||||
| Recoveries: |
||||||||||||||||||||
| Commercial loans: |
||||||||||||||||||||
| Funding Stream |
121 | 93 | — | — | — | |||||||||||||||
| CRA |
— | — | — | — | — — | |||||||||||||||
| Equipment Finance (1) |
2,066 | 2,404 | 2,334 | 2,417 | 1,861 | |||||||||||||||
| TFG |
49 | — | — | — | — | |||||||||||||||
|
|
|
|
|
|
|
|
|
|
|
|||||||||||
| Total recoveries |
2,236 | 2,497 | 2,334 | 2,417 | 1,861 | |||||||||||||||
|
|
|
|
|
|
|
|
|
|
|
|||||||||||
| Net charge-offs |
(14,480 | ) | (9,890 | ) | (10,119 | ) | (9,046 | ) | (7,638 | ) | ||||||||||
|
|
|
|
|
|
|
|
|
|
|
|||||||||||
| Allowance for credit losses, end of period |
$ | 14,851 | $ | 10,937 | $ | 8,413 | $ | 8,537 | $ | 8,467 | ||||||||||
|
|
|
|
|
|
|
|
|
|
|
|||||||||||
| Allowance to total loans(2) |
1.63 | % | 1.38 | % | 1.24 | % | 1.36 | % | 1.42 | % | ||||||||||
| Net charge-offs to average loans(2) |
1.71 | % | 1.37 | % | 1.59 | % | 1.50 | % | 1.41 | % | ||||||||||
| (1) | Equipment Finance consists of Equipment Finance Agreements, Install Purchase Agreements, and other leases and loans. |
| (2) | For purposes of asset quality and allowance calculations, the effects of (i) the allowance for credit losses and (ii) initial direct costs and fees deferred are excluded. |
-49-
Table of Contents
The following tables provide information about delinquent and non-accrual leases and loans in the Company’s portfolio each of the five years ended December 31, 2017:
| Year Ended December 31, | ||||||||||||||||||||
| 2017 | 2016 | 2015 | 2014 | 2013 | ||||||||||||||||
| (Dollars in thousands) | ||||||||||||||||||||
| Non-accrual loans: |
||||||||||||||||||||
| Commercial loans: |
||||||||||||||||||||
| Funding Stream |
$ | 118 | $ | 66 | $ | — | $ | — | $ | — | ||||||||||
| CRA |
— | — | — | — | — | |||||||||||||||
| Equipment Finance (1) |
3,023 | 2,176 | 1,677 | 1,742 | 1,665 | |||||||||||||||
| TFG |
42 | — | — | — | — | |||||||||||||||
|
|
|
|
|
|
|
|
|
|
|
|||||||||||
| Total non-accrual loans |
3,183 | 2,242 | 1,677 | 1,742 | 1,665 | |||||||||||||||
|
|
|
|
|
|
|
|
|
|
|
|||||||||||
| Accruing loans past due 90 days or more: |
||||||||||||||||||||
| Commercial loans: |
||||||||||||||||||||
| Funding Stream |
— | — | — | — | — | |||||||||||||||
| CRA |
— | — | — | — | — | |||||||||||||||
| Equipment Finance (1) |
— | — | — | — | — | |||||||||||||||
| TFG |
— | — | — | — | — | |||||||||||||||
|
|
|
|
|
|
|
|
|
|
|
|||||||||||
| Total accruing loans past 90 days or more |
— | — | — | — | — | |||||||||||||||
|
|
|
|
|
|
|
|
|
|
|
|||||||||||
| (1) | Equipment Finance consists of Equipment Finance Agreements, Install Purchase Agreements, and other leases and loans. |
Net investments in leases and loans are generally charged-off when they are contractually past due for 120 days or more. Income recognition is discontinued on leases or loans when a default on monthly payment exists for a period of 90 days or more. Income recognition resumes when a lease or loan becomes less than 90 days delinquent. At December 31, 2017 and December 31, 2016, there were no finance receivables past due 90 days or more and still accruing.
Funding Stream loans are generally placed in non-accrual status when they are 30 days past due and charged-off at 60 days past due. The loan is removed from non-accrual status once sufficient payments are made to bring the loan current and reviewed by management. There were no Funding Stream loans past due 30 days or more and still accruing.
Net charge-offs for the year ended December 31, 2017 were $14.5 million, or 1.71% of average total finance receivables, compared to $9.9 million, or 1.37% of average total finance receivables, for the year ended December 31, 2016. The increase in charge-offs was primarily due to a return to a more normalized credit environment and higher than expected charge-offs in the TFG channel and also partially due to an increase in portfolio size.
Net charge-offs for the year ended December 31, 2016 were $9.9 million, or 1.37% of average total finance receivables, compared to $10.1 million, or 1.59% of average total finance receivables, for the year ended December 31, 2015. The increase in charge-off rate is primarily due to the growth in average total finance receivables, the ongoing seasoning of the portfolio as reflected in the mix of origination vintages, the mix of credit profiles, and a slight increase in average charge-offs. Lease portfolio losses tend to follow patterns based on the mix of origination vintages comprising the portfolio. The timing of credit losses from the inception of a particular lease origination vintage to charge-off generally follows a pattern of lower losses for the first few months, followed by increased losses in subsequent months, then lower losses during the later periods of the lease term. Therefore, the seasoning, or mix of origination vintages, of the portfolio affects the timing and amount of charge-offs.
-50-
Table of Contents
Delinquent accounts 60 days or more past due (as a percentage of minimum lease payments receivable for leases and as a percentage of principal outstanding for loans) were 0.55% at December 31, 2017, 0.46% at December 31, 2016 and 0.41% at December 31, 2015. Supplemental information regarding loss statistics and delinquencies is available on the investor relations section of Marlin’s website at www.marlincorp.com.
In accordance with the Contingencies and Receivables Topic of the FASB ASC, we maintain an allowance for credit losses at an amount sufficient to absorb losses inherent in our existing lease and loan portfolios as of the reporting dates based on our projection of probable net credit losses. The factors and trends discussed above were included in the Company’s analysis to determine its allowance for credit losses. (See “Critical Accounting Policies.”)
Residual Performance
Our leases offer our small business customers the option to own the equipment at lease expiration. As of December 31, 2017, approximately 70% of our leases were one dollar purchase option leases, 29% were fair market value leases and less than 1% were fixed purchase option leases, the latter of which typically contain an end-of-term purchase option equal to 10% of the original equipment cost. As of December 31, 2017, there were $26.9 million of residual assets retained on our Consolidated Balance Sheet, of which $22.6 million, or 84.8%, were related to copiers. As of December 31, 2016, there were $26.8 million of residual assets retained on our Consolidated Balance Sheet, of which $22.5 million, or 83.8%, were related to copiers. No other group of equipment represented more than 10% of equipment residuals as of December 31, 2017 and 2016, respectively. Improvements in technology and other market changes, particularly in copiers, could adversely impact our ability to realize the recorded residual values of this equipment.
Fee income included approximately $3.6 million, $4.1 million and $3.8 million of net residual income for the years ended December 31, 2017, 2016 and 2015, respectively. Net residual income includes income from lease renewals and gains and losses on the realization of residual values of leased equipment disposed at the end of term as further described below.
Our leases generally include renewal provisions and many leases continue beyond their initial contractual term. Based on the Company’s experience, the amount of ultimate realization of the residual value tends to relate more to the customer’s election at the end of the lease term to enter into a renewal period, purchase the leased equipment or return the leased equipment than it does to the equipment type. We consider renewal income a component of residual performance. Renewal income, net of depreciation, totaled approximately $4.7 million, $5.0 million and $4.4 million for the years ended December 31, 2017, 2016 and 2015, respectively.
For the year ended December 31, 2017, the net loss on residual values disposed at end of term totaled $1.1 million compared to a net loss of $0.8 million and $0.5 million for the years ended December 31, 2016 and December 31, 2015, respectively. The primary driver of the changes was a shift in the mix of the amounts, types of disposition and age of equipment disposed at the end of the applicable lease term. Historically and currently, our net residual income has exceeded 100% of the residual recorded on such leases. Management performs reviews of the estimated residual values and historical realization statistics no less frequently than quarterly. There was no impairment recognized on estimated residual values during the years ended December 31, 2017, 2016 and 2015, respectively.
Liquidity and Capital Resources
Our business requires a substantial amount of cash to operate and grow. Our primary liquidity need is to fund new originations. In addition, we need liquidity to pay interest and principal on our deposits and borrowings, to pay fees and expenses incurred in connection with our financing transactions, to fund infrastructure and technology investment, to pay dividends and to pay administrative and other operating expenses.
-51-
Table of Contents
We are dependent upon the availability of financing from a variety of funding sources to satisfy these liquidity needs. Historically, we have relied upon four principal types of external funding sources for our operations:
| • | FDIC-insured deposits issued by our wholly-owned subsidiary, MBB; |
| • | borrowings under various bank facilities; |
| • | financing of leases and loans in various warehouse facilities (all of which have been repaid in full); and |
| • | financing of leases through term note securitizations (all of which have been repaid in full). |
With the opening of MBB in 2008, we began to fund increasing amounts of new originations through the issuance of FDIC-insured deposits. Deposits issued by MBB represent our primary funding source for new originations.
MBB receives time deposits through a variety of sources including: directly from customers, through the use of on-line listing services, and through the use of deposit brokers. Over time, MBB may offer other products and services to the Company’s customer base. MBB is a Utah state-chartered, Federal Reserve member commercial bank. As such, MBB is supervised by both the Federal Reserve Bank of San Francisco and the Utah Department of Financial Institutions.
On January 13, 2009, Marlin Business Services Corp. became a bank holding company and is subject to the Bank Holding Company Act and supervised by the Federal Reserve Board and the Federal Reserve Bank of Philadelphia. On September 15, 2010, the Federal Reserve Bank of Philadelphia confirmed the effectiveness of Marlin Business Services Corp.’s election to become a financial holding company (while remaining a bank holding company) pursuant to Sections 4(k) and (l) of the Bank Holding Company Act and Section 225.82 of the Federal Reserve Board’s Regulation Y. Such election permits Marlin Business Services Corp. to engage in activities that are financial in nature or incidental to a financial activity, including the maintenance and expansion of our reinsurance activities conducted through our wholly-owned subsidiary, AssuranceOne.
On October 26, 2017, Marlin Business Services Corp. declared its twenty-fifth consecutive regular quarterly dividend. The dividend of $0.14 per share of common stock was paid on November 16, 2017 to holders of our common stock as of November 6, 2017.
In addition to the Company’s regular quarterly dividend, the Company’s Board of Directors declared a special cash dividend of $2.00 per share on September 14, 2015. The special dividend was paid on October 5, 2015 to shareholders of record on the close of business on September 24, 2015, which resulted in a dividend payment of approximately $25.5 million. In addition to the Company’s regular quarterly dividend, the Company’s Board of Directors declared a special cash dividend of $2.00 per share on September 4, 2013. The special dividend was paid on September 26, 2013 to shareholders of record on the close of business on September 16, 2013, which resulted in a dividend payment of approximately $26.0 million.
At December 31, 2017, we have approximately $25.0 million of available borrowing capacity in addition to available cash and cash equivalents of $67.1 million. This amount excludes additional liquidity that may be provided by the issuance of insured deposits through MBB and additional borrowing capacity under the Federal Reserve Discount Window.
Net cash used in investing activities was $148.8 million for the year ended December 31, 2017, compared to net cash used in investing activities of $138.3 million for the year ended December 31, 2016 and $81.1 million for the year ended December 31, 2015. The decrease in cash flows from investing activities from 2016 to 2017 is primarily due to $124.8 million more of purchases of equipment for direct financing lease contracts partially offset by $47.5 more of proceeds from sale of leases originated for investment and $67.2 million more of principal collections on leases and loans due to higher average finance receivables. The decrease in cash flows
-52-
Table of Contents
from investing activities from 2015 to 2016 is primarily due to $125.4 million more of purchases of equipment for direct financing lease contracts partially offset by $5.1 million less in time deposits with banks and $43.4 million more of principal collections on leases and loans due to higher average finance receivables. Included in the purchases of equipment for direct financing lease contracts and funds used to originate loans was $12.0 million and $8.5 million of deferred initial direct costs and fees for the year ended December 31, 2015 and for the year ended December 31, 2014, respectively.
Net cash provided by financing activities was $101.3 million for the year ended December 31, 2017, compared to net cash provided by financing activities of $102.5 million for the year ended December 31, 2016 and net cash used in financing activities of $4.6 million for the year ended December 31, 2015. The increase in cash flows from financing activities from 2015 to 2016 is primarily due to a $71.6 million increase in deposits. Financing activities include net advances and repayments on our various deposit and borrowing sources and transactions related to the Company’s common stock, such as repurchasing common stock and paying dividends.
Additional liquidity is provided by or used by our cash flow from operations. Net cash provided by operating activities was $52.9 million for the year ended December 31, 2017, compared to net cash provided by operating activities of $37.5 million for the year ended December 31, 2016 and $35.1 million for the year ended December 31, 2015. The increase in cash flows from operating activities from 2016 to 2017 is primarily due to an increase in the provision for credit loss, proceeds from sale of leases originated for sale, and change in other liabilities.
We expect cash from operations, additional borrowings on existing and future credit facilities and funds from deposits issued through brokers, direct deposit sources, and the MMDA Product to be adequate to support our operations and projected growth for the next 12 months and the foreseeable future.
Total Cash and Cash Equivalents. Our objective is to maintain an adequate level of cash, investing any free cash in leases and loans. We primarily fund our originations and growth using certificates of deposit issued through MBB. Total cash and cash equivalents available as of December 31, 2017 totaled $67.1 million compared to $61.8 million at December 31, 2016.
Time Deposits with Banks. Time deposits with banks are primarily composed of FDIC-insured certificates of deposits that have original maturity dates of greater than 90 days. Generally, the certificates of deposits have the ability to redeem early, however, early redemption penalties may be incurred. Total time deposits as of December 31, 2017 and December 31, 2016 totaled $8.1 million and $9.6 million, respectively.
Borrowings. Our primary borrowing relationships may require the pledging of eligible lease and loan receivables to secure amounts advanced. We had no aggregate outstanding secured borrowings at December 31, 2017 and December 31, 2016. Borrowings outstanding consist of the following:
| For the Twelve Months Ended December 31, 2017 | As of December 31, 2017 | |||||||||||||||||||||||||||
| Maximum Facility Amount |
Maximum Month End Amount Outstanding |
Average Amount Outstanding |
Weighted Average Rate(2) |
Amount Outstanding |
Weighted Average Rate(2) |
Unused Capacity(1) |
||||||||||||||||||||||
| (Dollars in thousands) | ||||||||||||||||||||||||||||
| Federal funds purchased |
$ | 25,000 | $ | — | $ | — | — | % | $ | — | — | % | $ | 25,000 | ||||||||||||||
|
|
|
|
|
|
|
|
|
|||||||||||||||||||||
| $ | 25,000 | $ | — | — | % | $ | — | — | % | $ | 25,000 | |||||||||||||||||
|
|
|
|
|
|
|
|
|
|||||||||||||||||||||
| (1) | Does not include MBB’s access to the Federal Reserve Discount Window, which is based on the amount of assets MBB chooses to pledge. Based on assets pledged at December 31, 2017, MBB had $33.6 million in unused, secured borrowing capacity at the Federal Reserve Discount Window. Additional liquidity that may be provided by the issuance of insured deposits is also excluded from this table. |
| (2) | Does not include transaction costs. |
-53-
Table of Contents
Federal Funds Line of Credit with Correspondent Bank. MBB has established a federal funds line of credit with a correspondent bank. This line allows for both selling and purchasing of federal funds. The amount that can be drawn against the line is limited to $25.0 million.
Federal Reserve Discount Window. In addition, MBB has received approval to borrow from the Federal Reserve Discount Window based on the amount of assets MBB chooses to pledge. MBB had $33.6 million in unused, secured borrowing capacity at the Federal Reserve Discount Window, based on $37.8 million of net investment in leases pledged at December 31, 2017.
Bank Capital and Regulatory Oversight
On January 13, 2009, we became a bank holding company by order of the Federal Reserve Board and are subject to regulation under the Bank Holding Company Act. All of our subsidiaries may be subject to examination by the Federal Reserve Board and the Federal Reserve Bank of Philadelphia even if not otherwise regulated by the Federal Reserve Board. On September 15, 2010, the Federal Reserve Bank of Philadelphia confirmed the effectiveness of our election to become a financial holding company (while remaining a bank holding company) pursuant to Sections 4(k) and (l) of the Bank Holding Company Act and Section 225.82 of the Federal Reserve Board’s Regulation Y. Such election permits us to engage in activities that are financial in nature or incidental to a financial activity, including the maintenance and expansion of our reinsurance activities conducted through our wholly-owned subsidiary, AssuranceOne.
MBB is also subject to comprehensive federal and state regulations dealing with a wide variety of subjects, including minimum capital standards, reserve requirements, terms on which a bank may engage in transactions with its affiliates, restrictions as to dividend payments and numerous other aspects of its operations. These regulations generally have been adopted to protect depositors and creditors rather than shareholders.
There are a number of restrictions on bank holding companies that are designed to minimize potential loss to depositors and the FDIC insurance funds. If an FDIC-insured depository subsidiary is “undercapitalized,” the bank holding company is required to ensure (subject to certain limits) the subsidiary’s compliance with the terms of any capital restoration plan filed with its appropriate banking agency. Also, a bank holding company is required to serve as a source of financial strength to its depository institution subsidiaries and to commit resources to support such institutions in circumstances where it might not do so absent such policy. Under the Bank Holding Company Act, the Federal Reserve Board has the authority to require a bank holding company to terminate any activity or to relinquish control of a non-bank subsidiary upon the Federal Reserve Board’s determination that such activity or control constitutes a serious risk to the financial soundness and stability of a depository institution subsidiary of the bank holding company.
Capital Adequacy. The Company and MBB operate under the Basel III capital adequacy standards adopted by the federal bank regulatory agencies effective on January 1, 2015. Under the risk-based capital requirements applicable to them, bank holding companies must maintain a ratio of total capital to risk-weighted assets (including the asset equivalent of certain off-balance sheet activities such as acceptances and letters of credit) of not less than 8% (10% in order to be considered “well-capitalized”). The requirements include a 6% minimum Tier 1 risk-based ratio (8% to be considered well-capitalized). Tier 1 Capital consists of common stock, related surplus, retained earnings, qualifying perpetual preferred stock and minority interests in the equity accounts of certain consolidated subsidiaries, after deducting goodwill and certain other intangibles. The remainder of total capital (“Tier 2 Capital”) may consist of certain perpetual debt securities, mandatory convertible debt securities, hybrid capital instruments and limited amounts of subordinated debt, qualifying preferred stock, allowance for credit losses on loans and leases, allowance for credit losses on off-balance-sheet credit exposures and unrealized gains on equity securities.
The capital standards require a minimum Tier 1 leverage ratio of 4%. The capital requirements also require a common equity Tier 1 risk-based capital ratio with a required minimum of 4.5% (6.5% to be considered well-
-54-
Table of Contents
capitalized). The Federal Reserve Board’s guidelines also provide that bank holding companies experiencing internal growth or making acquisitions may be expected to maintain capital positions substantially above the minimum supervisory levels without significant reliance on intangible assets. Furthermore, the guidelines indicate that the Federal Reserve Board will continue to consider a “tangible tier 1 leverage ratio” (i.e., after deducting all intangibles) in evaluating proposals for expansion or new activities. MBB is subject to similar capital standards.
The Company is required to have a level of regulatory capital in excess of the regulatory minimum and to have a capital buffer above 1.25% for 2017, 1.875% for 2018, and 2.5% for 2019 and thereafter. If a banking organization does not maintain capital above the minimum plus the capital conservation buffer it may be subject to restrictions on dividends, share buybacks, and certain discretionary payments such as bonus payments.
At December 31, 2017, MBB’s Tier 1 leverage ratio, common equity Tier 1 risk-based ratio, Tier 1 risk-based capital ratio and total risk-based capital ratio were 14.81%,15.21%, 15.21% and 16.46%, respectively, which exceeds requirements for well-capitalized status of 5%, 6.5%, 8% and 10%, respectively. At December 31, 2017, Marlin Business Services Corp.’s Tier 1 leverage ratio, common equity Tier 1 risk based ratio, Tier 1 risk-based capital ratio and total risk-based capital ratio were 17.25%,18.22%, 18.22% and 19.47%, respectively, which exceeds requirements for well-capitalized status of 5%, 6.5%, 8% and 10%, respectively.
Pursuant to the FDIC Agreement entered into in conjunction with the opening of MBB, MBB is required to keep its total risk-based capital ratio above 15%. MBB’s Tier 1 Capital balance at December 31, 2017 was $145.3 million, which exceeds the regulatory threshold for “well capitalized” status.
As an FDIC-insured state-chartered bank, MBB is subject to ongoing supervision and regular examination by state and federal banking agencies including the Federal Reserve Bank of San Francisco and the Utah Department of Financial Institutions. In the course of these examinations, the banking regulators may identify issues and request further information from MBB. In 2017, MBB received letters from one of its banking regulators describing findings in connection with certain of MBB’s past payment processing practices related to the assessment of late fees. The Company and MBB reviewed the letters and the past practices and responded to the findings. The Company believes that the resolution of this matter will require the Company to pay restitution to customers. The Company estimated such resolution at $4.2 million, which was expensed and the related liability was recorded in the first quarter of 2017. However, the ultimate resolution of this matter could be materially different from the current estimate, including with respect to the timing, the exact amount of any required restitution or the possible imposition of any fines and penalties.
Information on Stock Repurchases
Information on Stock Repurchases is provided in “Part II, Item 5, Market for Registrant’s Common Equity, Related Stockholder Matters and Issuer Purchases of Equity Securities,” herein.
Items Subsequent to December 31, 2017
The Company declared a dividend of $0.14 per share on February 1, 2018. The quarterly dividend, which amounted to a dividend payment of approximately $1.7 million, was paid on February 22, 2018 to shareholders of record on the close of business on February 12, 2018. It represents the Company’s twenty-sixth consecutive quarterly cash dividend. The payment of future dividends will be subject to approval by the Company’s Board of Directors.
Contractual Obligations
In addition to our scheduled maturities on our deposits, we have future cash obligations under various types of contracts. We lease office space and office equipment under long-term operating leases. The contractual
-55-
Table of Contents
obligations under our deposits, credit facilities, operating leases, agreements and commitments under non-cancelable contracts as of December 31, 2017 were as follows:
| Contractual Obligations as of December 31, 2017 | ||||||||||||||||||||||||||||
| Period Ending December 31, |
Certificates of Deposits(1) |
Borrowings | Contractual Interest Payments(2) |
Operating Leases |
Leased Facilities |
Capital Leases |
Total | |||||||||||||||||||||
| (Dollars in thousands) | ||||||||||||||||||||||||||||
| 2018 |
$ | 334,366 | $ | — | $ | 9,512 | $ | 22 | $ | 1,574 | $ | 112 | $ | 345,586 | ||||||||||||||
| 2019 |
215,867 | — | 5,566 | 22 | 1,505 | 112 | 223,072 | |||||||||||||||||||||
| 2020 |
120,966 | — | 2,874 | 6 | 681 | 112 | 124,639 | |||||||||||||||||||||
| 2021 |
71,424 | — | 1,196 | — | — | 65 | 72,685 | |||||||||||||||||||||
| 2022 |
28,087 | — | 287 | — | — | — | 28,374 | |||||||||||||||||||||
| Thereafter |
— | — | — | — | — | — | — | |||||||||||||||||||||
|
|
|
|
|
|
|
|
|
|
|
|
|
|
|
|||||||||||||||
| Total |
$ | 770,710 | $ | — | $ | 19,435 | $ | 50 | $ | 3,760 | $ | 401 | $ | 794,356 | ||||||||||||||
|
|
|
|
|
|
|
|
|
|
|
|
|
|
|
|||||||||||||||
| (1) | Money market deposit accounts are not included. As of December 31, 2017, money market deposit accounts totaled $38.6 million. |
| (2) | Includes interest on certificates of deposits and borrowings. |
Off-Balance Sheet Arrangements
There were no off-balance sheet arrangements requiring disclosure at December 31, 2017.
Market Interest-Rate Risk and Sensitivity
Market risk is the risk of losses arising from changes in values of financial instruments. We engage in transactions in the normal course of business that expose us to market risks. We attempt to mitigate such risks through prudent management practices and strategies such as attempting to match the expected cash flows of our assets and liabilities.
We are exposed to market risks associated with changes in interest rates and our earnings may fluctuate with changes in interest rates. The lease assets we originate are almost entirely fixed-rate. Accordingly, we generally seek to finance these assets with fixed interest certificates of deposit issued by MBB, and to a lesser extent through the variable-rate MMDA Product at MBB.
Our earnings are sensitive to fluctuations in interest rates. Since the Company has no outstanding variable-rate borrowings as of December 31, 2017, it is not directly exposed to interest rate risk. However, there can be no assurance that we will be able to offset higher deposits costs with increased pricing of our assets. As such, the major sources of the Company’s interest rate risk are timing differences in the maturity and repricing characteristics of assets and liabilities, changes in the shape of the yield curve, changes in customer behavior and changes in relationship between rate indices (basis risk).
We manage and monitor our exposure to interest rate risk using balance sheet simulation models. Such models incorporate many of our assumptions about our business including new asset production and pricing, interest rate forecasts, overhead expense forecasts and assumed credit losses. Many of the assumptions we use in our simulation models are based on past experience and actual results could vary substantially.
Recently Issued Accounting Standards
Information on recently issued accounting pronouncements and the expected impact on our financial statements is provided in Note 2, Summary of Significant Accounting Policies in the accompanying Notes to Consolidated Financial Statements.
-56-
Table of Contents
Recently Adopted Accounting Standards
Information on recently issued accounting pronouncements and the expected impact on our financial statements is provided in Note 2, Summary of Significant Accounting Policies in the accompanying Notes to Consolidated Financial Statements.
| Item 7A. | Quantitative and Qualitative Disclosures About Market Risk |
The information appearing in the section captioned “Management’s Discussion and Analysis of Operations and Financial Condition — Market Interest-Rate Risk and Sensitivity” under Item 7 of this Form 10-K is incorporated herein by reference.
| Item 8. | Financial Statements and Supplementary Data |
Management’s Annual Report on Internal Control over Financial Reporting
Management of the Company is responsible for establishing and maintaining adequate internal control over financial reporting as defined in Rule 13a-15(f) under the 1934 Act. The Company’s internal control over financial reporting is designed to provide reasonable assurance to the Company’s management and Board of Directors regarding the preparation and fair presentation of published financial statements. Because of its inherent limitations, internal control over financial reporting may not prevent or detect misstatements.
Management has assessed the effectiveness of the Company’s internal control over financial reporting as of December 31, 2017. In making its assessment of internal control over financial reporting, management used the criteria set forth by the Committee of Sponsoring Organizations (“COSO”) of the Treadway Commission in Internal Control — Integrated Framework (2013).
Management has concluded that, as of December 31, 2017, the Company’s internal control over financial reporting was effective based on the criteria set forth by the COSO of the Treadway Commission in Internal Control — Integrated Framework (2013).
The effectiveness of our internal control over financial reporting as of December 31, 2017 has been audited by Deloitte & Touche LLP, an independent registered public accounting firm, as stated in their report, which is included herein.
-57-
Table of Contents
REPORT OF INDEPENDENT REGISTERED PUBLIC ACCOUNTING FIRM
To the Stockholders and the Board of Directors of Marlin Business Services Corp.
Opinion on Internal Control over Financial Reporting
We have audited the internal control over financial reporting of Marlin Business Services Corp. and subsidiaries (the “Company”) as of December 31, 2017, based on criteria established in Internal Control — Integrated Framework (2013) issued by the Committee of Sponsoring Organizations of the Treadway Commission (COSO). In our opinion, the Company maintained, in all material respects, effective internal control over financial reporting as of December 31, 2017, based on criteria established in Internal Control – Integrated Framework (2013) issued by COSO.
We have also audited, in accordance with the standards of the Public Company Accounting Oversight Board (United States) (PCAOB), the consolidated financial statements as of and for the year ended December 31, 2017, of the Company and our report dated March 9, 2018, expressed an unqualified opinion on those financial statements.
Basis for Opinion
The Company’s management is responsible for maintaining effective internal control over financial reporting and for its assessment of the effectiveness of internal control over financial reporting, included in the accompanying Management’s Annual Report on Internal Control over Financial Reporting. Our responsibility is to express an opinion on the Company’s internal control over financial reporting based on our audit. We are a public accounting firm registered with the PCAOB and are required to be independent with respect to the Company in accordance with the U.S. federal securities laws and the applicable rules and regulations of the Securities and Exchange Commission and the PCAOB.
We conducted our audit in accordance with the standards of the PCAOB. Those standards require that we plan and perform the audit to obtain reasonable assurance about whether effective internal control over financial reporting was maintained in all material respects. Our audit included obtaining an understanding of internal control over financial reporting, assessing the risk that a material weakness exists, testing and evaluating the design and operating effectiveness of internal control based on the assessed risk, and performing such other procedures as we considered necessary in the circumstances. We believe that our audit provides a reasonable basis for our opinion.
Definition and Limitations of Internal Control over Financial Reporting
A company’s internal control over financial reporting is a process designed to provide reasonable assurance regarding the reliability of financial reporting and the preparation of financial statements for external purposes in accordance with generally accepted accounting principles. A company’s internal control over financial reporting includes those policies and procedures that (1) pertain to the maintenance of records that, in reasonable detail, accurately and fairly reflect the transactions and dispositions of the assets of the company; (2) provide reasonable assurance that transactions are recorded as necessary to permit preparation of financial statements in accordance with generally accepted accounting principles, and that receipts and expenditures of the company are being made only in accordance with authorizations of management and directors of the company; and (3) provide reasonable assurance regarding prevention or timely detection of unauthorized acquisition, use, or disposition of the company’s assets that could have a material effect on the financial statements.
Because of its inherent limitations, internal control over financial reporting may not prevent or detect misstatements. Also, projections of any evaluation of effectiveness to future periods are subject to the risk that controls may become inadequate because of changes in conditions, or that the degree of compliance with the policies or procedures may deteriorate.
/s/ Deloitte & Touche LLP
Philadelphia, Pennsylvania
March 9, 2018
-58-
Table of Contents
Table of Contents
REPORT OF INDEPENDENT REGISTERED PUBLIC ACCOUNTING FIRM
To the Stockholders and the Board of Directors of Marlin Business Services Corp.
Opinion on the Financial Statements
We have audited the accompanying consolidated balance sheets of Marlin Business Services Corp. and subsidiaries (the “Company”) as of December 31, 2017 and 2016, the related consolidated statements of operations, comprehensive income, stockholders’ equity, and cash flows for each of the three years in the period ended December 31, 2017, and the related notes (collectively referred to as the “financial statements”). In our opinion, the financial statements present fairly, in all material respects, the financial position of the Company as of December 31, 2017 and 2016, and the results of its operations and its cash flows for each of the three years in the period ended December 31, 2017, in conformity with accounting principles generally accepted in the United States of America.
We have also audited, in accordance with the standards of the Public Company Accounting Oversight Board (United States) (PCAOB), the Company’s internal control over financial reporting as of December 31, 2017, based on the criteria established in Internal Control — Integrated Framework (2013) issued by the Committee of Sponsoring Organizations of the Treadway Commission and our report dated March 9, 2018, expressed an unqualified opinion on the Company’s internal control over financial reporting.
Basis for Opinion
These financial statements are the responsibility of the Company’s management. Our responsibility is to express an opinion on the Company’s financial statements based on our audits. We are a public accounting firm registered with the PCAOB and are required to be independent with respect to the Company in accordance with the U.S. federal securities law and the applicable rules and regulations of the Securities and Exchange Commission and the PCAOB.
We conducted our audits in accordance with the standards of the PCAOB. Those standards require that we plan and perform the audit to obtain reasonable assurance about whether the financial statements are free of material misstatement, whether due to error or fraud. Our audits included performing procedures to assess the risks of material misstatement of the financial statements, whether due to error or fraud, and performing procedures that respond to those risks. Such procedures included examining, on a test basis, evidence regarding the amounts and disclosures in the financial statements. Our audits also included evaluating the accounting principles used and significant estimates made by management, as well as evaluating the overall presentation of the financial statements. We believe that our audits provide a reasonable basis for our opinion.
/s/ Deloitte & Touche LLP
Philadelphia, Pennsylvania
March 9, 2018
We have served as the Company’s auditor since 2005.
-60-
Table of Contents
MARLIN BUSINESS SERVICES CORP.
AND SUBSIDIARIES
| December 31, | ||||||||
| 2017 | 2016 | |||||||
| (Dollars in thousands, except per-share data) |
||||||||
| ASSETS |
||||||||
| Cash and due from banks |
$ | 3,544 | $ | 4,055 | ||||
| Interest-earning deposits with banks |
63,602 | 57,702 | ||||||
|
|
|
|
|
|||||
| Total cash and cash equivalents |
67,146 | 61,757 | ||||||
| Time deposits with banks |
8,110 | 9,605 | ||||||
| Securities available for sale (amortized cost of $11.7 million and $6.1 million at December 31, 2017 and 2016, respectively) |
11,533 | 5,880 | ||||||
| Net investment in leases and loans: |
||||||||
| Net investment in leases and loans, excluding allowance for credit losses |
929,271 | 807,654 | ||||||
| Allowance for credit losses |
(14,851 | ) | (10,937 | ) | ||||
|
|
|
|
|
|||||
| Total net investment in leases and loans |
914,420 | 796,717 | ||||||
| Intangible assets |
1,128 | — | ||||||
| Goodwill |
1,160 | — | ||||||
| Property and equipment, net |
4,204 | 3,495 | ||||||
| Property tax receivables |
6,292 | 5,296 | ||||||
| Other assets |
26,167 | 9,408 | ||||||
|
|
|
|
|
|||||
| Total assets |
$ | 1,040,160 | $ | 892,158 | ||||
|
|
|
|
|
|||||
| LIABILITIES AND STOCKHOLDERS’ EQUITY |
||||||||
| Deposits |
$ | 809,315 | $ | 697,357 | ||||
| Other liabilities: |
||||||||
| Sales and property taxes payable |
2,963 | 2,586 | ||||||
| Accounts payable and accrued expenses |
31,492 | 14,809 | ||||||
| Net deferred income tax liability |
16,741 | 15,117 | ||||||
|
|
|
|
|
|||||
| Total liabilities |
860,511 | 729,869 | ||||||
|
|
|
|
|
|||||
| Commitments and contingencies (Note 8) |
||||||||
| Stockholders’ equity: |
||||||||
| Preferred Stock, $0.01 par value; 5,000,000 shares authorized; none issued |
— | — | ||||||
| Common Stock, $0.01 par value; 75,000,000 shares authorized; 12,449,458 and 12,572,114 shares issued and outstanding at December 31, 2017 and 2016, respectively |
124 | 126 | ||||||
| Additional paid-in capital |
82,588 | 83,505 | ||||||
| Stock subscription receivable |
(2 | ) | (2 | ) | ||||
| Accumulated other comprehensive loss |
(96 | ) | (138 | ) | ||||
| Retained earnings |
97,035 | 78,798 | ||||||
|
|
|
|
|
|||||
| Total stockholders’ equity |
179,649 | 162,289 | ||||||
|
|
|
|
|
|||||
| Total liabilities and stockholders’ equity |
$ | 1,040,160 | $ | 892,158 | ||||
|
|
|
|
|
|||||
The accompanying notes are an integral part of the consolidated financial statements.
-61-
Table of Contents
MARLIN BUSINESS SERVICES CORP.
AND SUBSIDIARIES
CONSOLIDATED STATEMENTS OF OPERATIONS
| Year Ended December 31, | ||||||||||||
| 2017 | 2016 | 2015 | ||||||||||
| (Dollars in thousands, except per-share data) |
||||||||||||
| Interest income |
$ | 87,455 | $ | 74,709 | $ | 66,662 | ||||||
| Fee income |
14,864 | 15,543 | 15,291 | |||||||||
|
|
|
|
|
|
|
|||||||
| Interest and fee income |
102,319 | 90,252 | 81,953 | |||||||||
| Interest expense |
11,180 | 7,778 | 5,696 | |||||||||
|
|
|
|
|
|
|
|||||||
| Net interest and fee income |
91,139 | 82,474 | 76,257 | |||||||||
| Provision for credit losses |
18,394 | 12,414 | 9,995 | |||||||||
|
|
|
|
|
|
|
|||||||
| Net interest and fee income after provision for credit losses |
72,745 | 70,060 | 66,262 | |||||||||
|
|
|
|
|
|
|
|||||||
| Other income: |
||||||||||||
| Insurance premiums written and earned |
7,155 | 6,398 | 5,940 | |||||||||
| Other income |
9,577 | 3,360 | 1,869 | |||||||||
|
|
|
|
|
|
|
|||||||
| Other income |
16,732 | 9,758 | 7,809 | |||||||||
|
|
|
|
|
|
|
|||||||
| Other expense: |
||||||||||||
| Salaries and benefits |
37,569 | 31,912 | 31,174 | |||||||||
| General and administrative |
28,272 | 19,523 | 17,451 | |||||||||
| Financing related costs |
— | 85 | 218 | |||||||||
|
|
|
|
|
|
|
|||||||
| Other expense |
65,841 | 51,520 | 48,843 | |||||||||
|
|
|
|
|
|
|
|||||||
| Income before income taxes |
23,636 | 28,298 | 25,228 | |||||||||
| Income tax expense (benefit) |
(1,656 | ) | 11,019 | 9,262 | ||||||||
|
|
|
|
|
|
|
|||||||
| Net income |
$ | 25,292 | $ | 17,279 | $ | 15,966 | ||||||
|
|
|
|
|
|
|
|||||||
| Basic earnings per share |
$ | 2.02 | $ | 1.38 | $ | 1.25 | ||||||
| Diluted earnings per share |
$ | 2.01 | $ | 1.38 | $ | 1.25 | ||||||
The accompanying notes are an integral part of the consolidated financial statements.
-62-
Table of Contents
MARLIN BUSINESS SERVICES CORP.
AND SUBSIDIARIES
CONSOLIDATED STATEMENTS OF COMPREHENSIVE INCOME
| Year Ended December 31, | ||||||||||||
| 2017 | 2016 | 2015 | ||||||||||
| (Dollars in thousands) | ||||||||||||
| Net income |
$ | 25,292 | $ | 17,279 | $ | 15,966 | ||||||
|
|
|
|
|
|
|
|||||||
| Other comprehensive income: |
||||||||||||
| Amortization of net deferred losses on |
||||||||||||
| Increase (decrease) in fair value of securities available for sale |
68 | (15 | ) | (181 | ) | |||||||
| Tax effect |
(26 | ) | 6 | 69 | ||||||||
|
|
|
|
|
|
|
|||||||
| Total other comprehensive income (loss) |
42 | (9 | ) | (112 | ) | |||||||
|
|
|
|
|
|
|
|||||||
| Comprehensive income |
$ | 25,334 | $ | 17,270 | $ | 15,854 | ||||||
|
|
|
|
|
|
|
|||||||
The accompanying notes are an integral part of the consolidated financial statements.
-63-
Table of Contents
MARLIN BUSINESS SERVICES CORP.
AND SUBSIDIARIES
CONSOLIDATED STATEMENTS OF STOCKHOLDERS’ EQUITY
| Common Shares |
Common Stock Amount |
Additional Paid-In Capital |
Stock Subscription Receivable |
Accumulated Other Comprehensive Income (Loss) |
Retained Earnings |
Total Stockholders’ Equity |
||||||||||||||||||||||
| (Dollars in thousands) | ||||||||||||||||||||||||||||
| Balance, December 31, 2014 |
12,838,449 | $ | 128 | $ | 89,130 | $ | (2 | ) | $ | (17 | ) | $ | 84,725 | $ | 173,964 | |||||||||||||
| Issuance of common stock |
14,929 | — | 234 | — | — | — | 234 | |||||||||||||||||||||
| Repurchase of common stock |
(659,903 | ) | (7 | ) | (11,313 | ) | — | — | — | (11,320 | ) | |||||||||||||||||
| Exercise of stock options |
61,937 | 1 | 585 | — | — | — | 586 | |||||||||||||||||||||
| Excess tax benefits from stock-based payment arrangements |
— | — | 333 | — | — | — | 333 | |||||||||||||||||||||
| Restricted stock grant, net of forfeitures |
155,487 | 2 | (2 | ) | — | — | — | — | ||||||||||||||||||||
| Stock-based compensation recognized |
— | — | 2,736 | — | — | — | 2,736 | |||||||||||||||||||||
| Net change in unrealized gain/loss on securities available for sale, net of tax |
— | — | — | — | (112 | ) | — | (112 | ) | |||||||||||||||||||
| Net income |
— | — | — | — | — | 15,966 | 15,966 | |||||||||||||||||||||
| Cash dividends paid ($2.53 per share) |
— | — | — | — | — | (32,249 | ) | (32,249 | ) | |||||||||||||||||||
|
|
|
|
|
|
|
|
|
|
|
|
|
|
|
|||||||||||||||
| Balance, December 31, 2015 |
12,410,899 | $ | 124 | $ | 81,703 | $ | (2 | ) | $ | (129 | ) | $ | 68,442 | $ | 150,138 | |||||||||||||
| Issuance of common stock |
16,813 | — | 259 | — | — | — | 259 | |||||||||||||||||||||
| Repurchase of common stock |
(23,409 | ) | — | (345 | ) | — | — | — | (345 | ) | ||||||||||||||||||
| Exercise of stock options |
7,380 | — | 77 | — | — | — | 77 | |||||||||||||||||||||
| Excess tax benefits from stock-based payment arrangements |
— | — | (24 | ) | — | — | — | (24 | ) | |||||||||||||||||||
| Restricted stock grant, net of forfeitures |
160,431 | 2 | (2 | ) | — | — | — | — | ||||||||||||||||||||
| Stock-based compensation recognized |
— | — | 1,837 | — | — | — | 1,837 | |||||||||||||||||||||
| Net change in unrealized gain/loss on securities available for sale, net of tax |
— | — | — | — | (9 | ) | — | (9 | ) | |||||||||||||||||||
| Net income |
— | — | — | — | — | 17,279 | 17,279 | |||||||||||||||||||||
| Cash dividends paid ($0.56 per share) |
— | — | — | — | — | (6,923 | ) | (6,923 | ) | |||||||||||||||||||
|
|
|
|
|
|
|
|
|
|
|
|
|
|
|
|||||||||||||||
| Balance, December 31, 2016 |
12,572,114 | $ | 126 | $ | 83,505 | $ | (2 | ) | $ | (138 | ) | $ | 78,798 | $ | 162,289 | |||||||||||||
| Issuance of common stock |
18,890 | — | 356 | — | — | — | 356 | |||||||||||||||||||||
| Repurchase of common stock |
(184,263 | ) | (2 | ) | (4,499 | ) | — | — | — | (4,501 | ) | |||||||||||||||||
| Exercise of stock options |
39,416 | — | 488 | — | — | — | 488 | |||||||||||||||||||||
| Excess tax benefits from stock-based payment arrangements |
— | — | — | — | — | — | — | |||||||||||||||||||||
| Stock option compensation recognized |
— | — | — | — | — | — | — | |||||||||||||||||||||
| Restricted stock grant, net of forfeitures |
3,301 | — | — | — | — | — | — | |||||||||||||||||||||
| Stock-based compensation recognized |
— | — | 2,738 | — | — | — | 2,738 | |||||||||||||||||||||
| Net change in unrealized gain/loss on securities available for sale, net of tax |
— | — | — | — | 42 | — | 42 | |||||||||||||||||||||
| Net income |
— | — | — | — | — | 25,292 | 25,292 | |||||||||||||||||||||
| Cash dividends paid ($0.56 per share) |
— | — | — | — | — | (7,055 | ) | (7,055 | ) | |||||||||||||||||||
|
|
|
|
|
|
|
|
|
|
|
|
|
|
|
|||||||||||||||
| Balance, December 31, 2017 |
12,449,458 | $ | 124 | $ | 82,588 | $ | (2 | ) | $ | (96 | ) | $ | 97,035 | $ | 179,649 | |||||||||||||
|
|
|
|
|
|
|
|
|
|
|
|
|
|
|
|||||||||||||||
The accompanying notes are an integral part of the consolidated financial statements.
-64-
Table of Contents
MARLIN BUSINESS SERVICES CORP.
AND SUBSIDIARIES
CONSOLIDATED STATEMENTS OF CASH FLOWS
| Year Ended December 31, | ||||||||||||
| 2017 | 2016 | 2015 | ||||||||||
| (Dollars in thousands) | ||||||||||||
| Cash flows from operating activities: |
||||||||||||
| Net income |
$ | 25,292 | $ | 17,279 | $ | 15,966 | ||||||
| Adjustments to reconcile net income to net cash provided by operating activities: |
||||||||||||
| Depreciation and amortization |
2,964 | 1,823 | 1,684 | |||||||||
| Stock-based compensation |
2,738 | 1,837 | 2,736 | |||||||||
| Excess tax (benefits) deficit from stock-based payment arrangements |
— | 24 | (333 | ) | ||||||||
| Provision for credit losses |
18,394 | 12,414 | 9,995 | |||||||||
| Net deferred income taxes |
1,598 | (1,746 | ) | (382 | ) | |||||||
| Amortization of deferred initial direct costs and fees |
11,375 | 8,694 | 7,530 | |||||||||
| Loss on equipment disposed |
1,070 | 846 | 537 | |||||||||
| Gain on leases sold |
(2,876 | ) | (473 | ) | (76 | ) | ||||||
| Leases originated for sale |
(4,669 | ) | (1,226 | ) | (3,589 | ) | ||||||
| Proceeds from the sale of leases originated for sale |
4,727 | 1,234 | 3,665 | |||||||||
| Effect of changes in other operating items: |
||||||||||||
| Other assets |
(19,026 | ) | (2,657 | ) | (3,598 | ) | ||||||
| Other liabilities |
11,284 | (587 | ) | 1,001 | ||||||||
|
|
|
|
|
|
|
|||||||
| Net cash provided by operating activities |
52,871 | 37,462 | 35,136 | |||||||||
|
|
|
|
|
|
|
|||||||
| Cash flows from investing activities: |
||||||||||||
| Net change in time deposits with banks |
1,495 | (2,237 | ) | (7,368 | ) | |||||||
| Purchases of equipment for direct financing lease contracts and funds used to originate loans |
(634,709 | ) | (515,237 | ) | (389,810 | ) | ||||||
| Principal collections on leases and loans |
426,482 | 359,273 | 315,847 | |||||||||
| Proceeds from sale of leases originated for investment |
64,895 | 17,371 | — | |||||||||
| Security deposits collected, net of refunds |
(448 | ) | (715 | ) | (392 | ) | ||||||
| Proceeds from the sale of equipment |
3,415 | 3,533 | 3,368 | |||||||||
| Acquisitions of property and equipment |
(1,854 | ) | (1,019 | ) | (2,350 | ) | ||||||
| Acquisition of intangible assets |
(2,500 | ) | — | — | ||||||||
| Change in restricted interest-earning deposits with banks |
— | 216 | 495 | |||||||||
| Purchases of securities available for sale |
(5,601 | ) | 504 | (858 | ) | |||||||
|
|
|
|
|
|
|
|||||||
| Net cash (used in) investing activities |
(148,825 | ) | (138,311 | ) | (81,068 | ) | ||||||
|
|
|
|
|
|
|
|||||||
| Cash flows from financing activities: |
||||||||||||
| Increase in deposits |
111,958 | 109,417 | 37,821 | |||||||||
| Issuances of common stock |
356 | 259 | 234 | |||||||||
| Repurchases of common stock |
(4,501 | ) | (345 | ) | (11,320 | ) | ||||||
| Dividends paid |
(6,958 | ) | (6,907 | ) | (32,249 | ) | ||||||
| Exercise of stock options |
488 | 77 | 586 | |||||||||
| Excess tax benefits (deficit) from stock-based payment arrangements |
— | (24 | ) | 333 | ||||||||
|
|
|
|
|
|
|
|||||||
| Net cash provided by (used in) financing activities |
101,343 | 102,477 | (4,595 | ) | ||||||||
|
|
|
|
|
|
|
|||||||
| Net increase (decrease) in total cash and cash equivalents |
5,389 | 1,628 | (50,527 | ) | ||||||||
| Total cash and cash equivalents, beginning of period |
61,757 | 60,129 | 110,656 | |||||||||
|
|
|
|
|
|
|
|||||||
| Total cash and cash equivalents, end of period |
$ | 67,146 | $ | 61,757 | $ | 60,129 | ||||||
|
|
|
|
|
|
|
|||||||
| Supplemental disclosures of cash flow information: |
||||||||||||
| Cash paid for interest on deposits and borrowings |
$ | 10,329 | $ | 7,145 | $ | 5,118 | ||||||
| Net cash paid for income taxes |
$ | 10,195 | $ | 8,185 | $ | 13,309 | ||||||
| Leases transferred into held for sale from investment |
$ | 62,077 | $ | 16,884 | $ | — | ||||||
| Supplemental disclosures of noncash investing activities: |
||||||||||||
| Acquisition of property and equipment through capital lease arrangements |
$ | 385 | $ | — | $ | — | ||||||
| Purchases of equipment for direct financing lease contracts and loans originated |
$ | 10,681 | $ | — | $ | — | ||||||
The accompanying notes are an integral part of the consolidated financial statements.
-65-
Table of Contents
MARLIN BUSINESS SERVICES CORP. AND SUBSIDIARIES
NOTES TO CONSOLIDATED FINANCIAL STATEMENTS
NOTE 1 — The Company
Marlin Business Services Corp. (the “Company”) is a nationwide provider of credit products and services to small and mid-sized businesses. The products and services we provide to our customers include loans and leases for the acquisition of commercial equipment (including Transportation Finance Group (“TFG”) assets) and working capital loans. The Company was incorporated in the Commonwealth of Pennsylvania on August 5, 2003. In May 2000, we established AssuranceOne, Ltd., a Bermuda-based, wholly-owned captive insurance subsidiary (“Assurance One”), which enables us to reinsure the property insurance coverage for the equipment financed by Marlin Leasing Corporation (“MLC”) and Marlin Business Bank (“MBB”) for our small business customers. Effective March 12, 2008, the Company opened MBB, a commercial bank chartered by the State of Utah and a member of the Federal Reserve System. MBB serves as the Company’s primary funding source through its issuance of Federal Deposit Insurance Corporation (“FDIC”)-insured deposits.
On January 4, 2017, the Company completed the acquisition of Horizon Keystone Financial (“HKF”), an equipment leasing company which primarily identifies and sources lease and loan contracts for investor partners for a fee. With this acquisition, the Company will expand the current leasing business, grow annual originations and increase its presence in certain industry sectors. Additionally, the Company expects to leverage HKF’s valuable relationships with lenders and equipment vendors. The Company paid $2.5 million in cash for HKF and incurred an immaterial amount of acquisition-related cost for the acquisition. Cash settlement occurred on the date of acquisition. The Company performed an allocation of the purchase price with $1.2 million recorded to goodwill and $1.3 million recorded to intangible assets for vendor relationships, customer relationships, and the corporate trade name. See Note 7 for additional information regarding the identified intangible assets acquired.
References to the “Company,” “Marlin,” “Registrant,” “we,” “us” and “our” herein refer to Marlin Business Services Corp. and its wholly-owned subsidiaries, unless the context otherwise requires.
NOTE 2 — Summary of Significant Accounting Policies
Basis of Financial Statement Presentation
The consolidated financial statements include the accounts of the Company and its wholly-owned subsidiaries. MLC and MBB are managed together as a single business segment and are aggregated for financial reporting purposes as they exhibit similar economic characteristics, share the same leasing and loan portfolio and have the same product offerings. All intercompany accounts and transactions have been eliminated in consolidation.
During the second quarter of 2017, the Company identified that the sale of certain leases had been reported as cash flows from operating activities that should have been presented as investing activities. In addition, the Company also identified that the deferral of certain expenses associated with the cost of originating leases had been reported as an adjustment to operating cash flow rather than as an investing activity. The Company corrected the previously presented cash flows for these items and in doing so, the consolidated statement of cash flow for the year ended December 31, 2016 was adjusted to decrease net cash flows from operating activities by $5.4 million and increase net cash flows used in investing activities by the same amount. The Company corrected the previously presented cash flows for these items and in doing so, the consolidated statement of cash flow for the year ended December 31, 2015 was adjusted to increase net cash flows from operating activities by $8.5 million and decrease net cash flows used in investing activities by the same amount.
During the fourth quarter of 2017, the Company identified that the Company’s equipment finance agreements should have been presented as loans rather than as part of minimum lease payments receivable. The Company corrected the previously presented disclosures within the Net Investment in Leases and Loans footnote
-66-
Table of Contents
MARLIN BUSINESS SERVICES CORP. AND SUBSIDIARIES
NOTES TO CONSOLIDATED FINANCIAL STATEMENTS
for this item and in doing so, the minimum lease payments receivable as of December 31, 2016 was adjusted to decrease the balance by $221.7 million and increase the Equipment Loans by $187.7 million and TFG by $34.0 million. The Company also adjusted the unearned lease income, net of initial direct costs and fees incurred to decrease the balance by $26.3 million and decrease the equipment loans by $21.6 million and TFG by $4.7 million. Additionally, the Company corrected the previously presented disclosures within the Fair Value Measurements and Disclosures about the Fair Value of Financial Instruments footnote for this item and in doing so, the carrying amount and fair value of loans, net of allowance as of December 31, 2016 increased by $192.7 million and $186.7 million, respectively. The Company has evaluated the effect of the incorrect presentation, both qualitatively and quantitatively, and concluded that it is immaterial to previously filed consolidated financial statements.
Use of Estimates
The preparation of financial statements in accordance with generally accepted accounting principles in the United States (“U.S. GAAP”) requires management to make estimates and assumptions that affect the reported amounts of assets and liabilities and disclosure of contingent assets and liabilities at the date of the financial statements and the reported amounts of revenues and expenses during the reporting period. Estimates are used when accounting for income recognition, the residual values of leased equipment, the allowance for credit losses, deferred initial direct costs and fees, late fee receivables, the fair value of financial instruments, self-insurance reserves, and income taxes. Actual results could differ from those estimates.
Cash and Cash Equivalents
Cash and cash equivalents include cash and interest-bearing money market funds. For purposes of the consolidated statement of cash flows, the Company considers all highly liquid investments purchased with a maturity of three months or less to be cash equivalents.
Time Deposits with Banks
Time deposits with banks are composed of FDIC-insured certificates of deposits that generally have original maturity dates of greater than 90 days. These deposits are held on the balance sheet at amortized cost. Generally, the certificates of deposits issued directly have the ability to redeem early; however early redemption penalties may be incurred. The certificates of deposit issued through deposit brokers generally do not have the ability to redeem early.
Net Investment in Leases and Loans
As required by U.S. GAAP, the Company uses the direct finance method of accounting to record its direct financing leases and related interest income. At the inception of a lease, the Company records as an asset, the aggregate future minimum lease payments receivable, plus the estimated residual value of the leased equipment, less unearned lease income. Residual values are established at lease inception based on our estimate of the expected fair value of the equipment at the end of the lease term. Residual values may be realized at lease termination from lease extensions, sales or other dispositions of leased equipment. Estimates are based on industry data, management’s experience, and historical performance.
The Company records an estimated residual value at lease inception for all fair market value and fixed purchase option leases based on a percentage of the equipment cost of the asset being leased. The percentages used depend on equipment type and term. In setting estimated residual values, the Company focuses its analysis primarily on the Company’s total historical and expected realization statistics pertaining to sales of equipment. In
-67-
Table of Contents
MARLIN BUSINESS SERVICES CORP. AND SUBSIDIARIES
NOTES TO CONSOLIDATED FINANCIAL STATEMENTS
subsequent evaluations for the impairment of the booked residual values, the Company reviews historical realization statistics including lease renewals and equipment sales. Anticipated renewal income is not included in the determination of fair value; however, it is one of the ways that fair value may be realized at the end of the lease term.
At the end of an original lease term, lessees may choose to purchase the equipment, renew the lease or return the equipment to the Company. The Company receives income from lease renewals when the lessee elects to retain the equipment longer than the original term of the lease. This income, net of appropriate periodic reductions in the estimated residual values of the related equipment, is included in fee income as net residual income.
When a lessee elects to return equipment at lease termination, the equipment is transferred to other assets at the lower of its basis or fair market value. The Company generally sells returned equipment to independent third parties, rather than leasing the equipment a second time. The Company generally charges off the value of equipment within other assets once it has been aged greater than 120 days. Any loss recognized on transferring equipment to other assets and any gain or loss realized on the sale or disposal of equipment to a lessee or to others is included in fee income as net residual income.
Based on the Company’s experience, the amount of ultimate realization of the residual value tends to relate more to the customer’s election at the end of the lease term to enter into a renewal period, to purchase the leased equipment or to return the leased equipment than it does to the equipment type. Management performs reviews of the estimated residual values and historic realization statistics no less frequently than quarterly and any impairment, if other than temporary, is recognized in the current period.
Loans are stated at principal balance, net of deferred fees and costs. Loan origination fees, commitment fees and direct loan origination costs are deferred and recognized over the life of the related loans using an effective yield method over the period to maturity.
Initial direct costs and fees related to lease originations are deferred as part of the investment and amortized over the lease term. Unearned lease income is the amount by which the total lease receivable plus the estimated residual value exceeds the cost of the equipment. Unearned lease income, net of initial direct costs and fees, is recognized as revenue over the lease term using the effective interest method.
Allowance for Credit Losses
In accordance with the Contingencies Topic of the Financial Accounting Standards Board (the “FASB”) ASC, we maintain an allowance for credit losses at an amount sufficient to absorb losses inherent in our existing lease and loan portfolios as of the reporting dates based on our projection of probable net credit losses. We identify portfolio segments, which represent the level at which we develop and document a systematic methodology to determine the allowance for credit losses. As of December 31, 2017, we have identified four segments, which consist of equipment lease and loan, Funding Stream, TFG, and Community Reinvestment Act (“CRA”) loans, of which all methodologies are evaluated on a pooled basis, due to their composition of similar accounts with similar general credit risk characteristics, diversified among industry, geography, equipment type (if applicable), obligor and vendor (if applicable). The Company has determined there to be one class of financing receivable within each portfolio segment as finance receivables of each segment contain the same initial measurement attributes, risk characteristics, and has the same method for monitoring and assessing credit risk within the segment.
Each segment generally considers both quantitative and qualitative factors in determining the allowance for credit losses. Quantitative factors for the equipment lease and loan segment include a migration analysis stratified
-68-
Table of Contents
MARLIN BUSINESS SERVICES CORP. AND SUBSIDIARIES
NOTES TO CONSOLIDATED FINANCIAL STATEMENTS
by industry classification, historic delinquencies and charge-offs, and a static pool analysis of historic recoveries. A migration analysis is a technique used to estimate the likelihood that an account will progress through the various delinquency stages and ultimately charge off. A loss emergence period (LEP), which is the period of time between an event that triggers the probability of a loss and the confirmation of loss, is applied to the migration results to develop an estimate of losses inherent in the portfolio at the reporting period. Quantitative factors for the TFG and Funding Stream segments include establishing a loss curve based on historical analysis of net charge-offs. The loss curve technique is used to estimate the likelihood and timing of when an account will charge-off relative to the month in which it was funded. An LEP is applied to the loss curve results to develop an estimate of losses inherent in the portfolio at the reporting period. The TFG and Funding Stream segments utilize different assumptions for the historical charge-offs and loss emergence which is based on analysis specific to each segment. The CRA loan segment quantitative factor includes the analysis of historical losses that are used in conjunction with an LEP to develop a quantitative allowance for credit losses. As part of all of our quantitative analyses for each segment we may also consider specifically identified pools of equipment leases or loans separately from the quantitative analysis, whenever certain identified pools are not expected to perform consistently with their credit characteristics or the portfolio segment as a whole. These lease and loan pools may be analyzed for impairment separately quantitative analysis and a specific reserve established.
Qualitative factors that may result in further adjustments to the quantitative analyses include items such as changes in the composition of our lease and loan portfolio segments (including geography, industry, equipment type and vendor source), seasonality, economic or business conditions and other external factors, business practices or policies at the reporting date that are different from the periods used in the quantitative analyses and changes in experience and ability of leasing and lending management and other relevant staff.
The various factors used in the analysis are reviewed periodically, and no less frequently than quarterly. We then establish an allowance for credit losses for the projected probable net credit losses inherent in the portfolio based on this analysis. A provision is charged against earnings to maintain the allowance for credit losses at the appropriate level. Our policy is to generally charge-off against the allowance the estimated unrecoverable portion of accounts once they reach 120 or more days delinquent.
Our projections of probable net credit losses are inherently uncertain, and as a result we cannot predict with certainty the amount of such losses. Changes in economic conditions, the risk characteristics and composition of the portfolio, bankruptcy laws, and other factors could impact our actual and projected net credit losses and the related allowance for credit losses. Actual losses may vary from current estimates.
Property and Equipment
The Company records property and equipment at cost. Equipment capitalized under capital leases is recorded at the present value of the minimum lease payments due over the lease term. Depreciation and amortization are provided using the straight-line method over the estimated useful lives of the related assets or lease term, whichever is shorter. The Company generally uses depreciable lives that range from three to seven years based on equipment type.
Other Assets
Included in other assets on the Consolidated Balance Sheets are income taxes receivable, prepaid expenses, accrued fee income, progress payments on equipment purchased to lease and Federal Reserve Bank stock.
Interest Income
Interest income is recognized under the effective interest method. The effective interest method of income recognition applies a constant rate of interest equal to the internal rate of return on each lease at inception.
-69-
Table of Contents
MARLIN BUSINESS SERVICES CORP. AND SUBSIDIARIES
NOTES TO CONSOLIDATED FINANCIAL STATEMENTS
Based on the historical payment behavior of the Company’s equipment finance lease and loan portfolio as a whole, payments are considered reasonably assured when a lease or loan’s delinquency status is less than 90 days. Therefore, when a lease or loan is 90 days or more delinquent, the contract is classified as non-accrual and interest income recognition is discontinued. Interest income recognition resumes when the borrower makes payments sufficient to bring the status to less than 90 days delinquent. Funding Stream loans are generally placed in non-accrual status when they are 30 days past due and charged-off at 60 days past due. The loan is removed from non-accrual status once sufficient payments are made to bring the loan current and reviewed by management.
Modifications resulting in renegotiated leases may include reductions in payment and extensions in term. However, such renegotiated leases are not granted concessions regarding implicit rates or reductions in total amounts due. Modifications may be granted on a one-time basis in situations that indicate the lessee is experiencing a temporary, timing issue and has a high likelihood of success with a revised payment plan. After a modification, a lease or loan’s accrual status is based on compliance with the modified terms.
Fee Income
Fee income consists of fees for delinquent lease and loan payments, cash collected on early termination of leases and net residual income. Net residual income includes income from lease renewals and gains and losses on the realization of residual values of leased equipment disposed at the end of a lease’s term. Residual income is recognized as earned.
Fee income from delinquent lease payments is recognized on an accrual basis based on anticipated collection rates. At a minimum of every quarter, an analysis of anticipated collection rates is performed based on updates to collection history. Adjustments in the anticipated collection rate assumptions are made as needed based on this analysis. Other fees are recognized when received.
Other Income
Other income includes various administrative transaction fees, insurance policy fees, fees received from referral of leases to third parties, and gain on sale of leases and servicing fees, recognized as earned. Effective third quarter 2016, on a prospective basis, the insurance policy fees are recognized in the Consolidated Statements of Operations in “Other income” and for all previous annual and interim periods are recorded net in “Insurance premiums written and earned.” Selected major components of other income for the year ended December 31, 2017 included $2.5 million of referral income, $1.8 million of insurance policy fees, and $3.7 million gain on the sale of leases and servicing fee income. Selected major components of other income for the year ended December 31, 2016 included $0.5 million of referral income, $0.8 million of insurance policy fees, and $0.7 million gain on the sale of leases and servicing fee income. Selected major components of other income for the year ended December 31, 2015 included $0.4 million of referral income and $0.1 million gain on the sale of leases and servicing fee income.
Securities Available for Sale
Securities available for sale consist of asset-backed securities (“ABS”), mutual funds and municipal bonds that are measured at fair value on a recurring basis. Unrealized holding gains or losses of all securities available for sale, net of related deferred income taxes, are reported in accumulated other comprehensive income. Fair value measurement is based upon quoted prices in active markets, if available. If quoted prices in active markets are not available, fair values are based on prices obtained from third-party pricing vendors. See Note 12 for more information on fair value measurement of securities.
-70-
Table of Contents
MARLIN BUSINESS SERVICES CORP. AND SUBSIDIARIES
NOTES TO CONSOLIDATED FINANCIAL STATEMENTS
Securities are evaluated on a quarterly basis, and more frequently when market conditions warrant such an evaluation, to determine whether declines in their value are other-than-temporary. To determine whether a loss in value is other-than-temporary, management utilizes criteria such as the reasons underlying the decline, the magnitude and duration of the decline and whether management intends to sell or expects that it is more likely than not that it will be required to sell the security prior to an anticipated recovery of the fair value. The term “other-than-temporary” is not intended to indicate that the decline is permanent, but indicates that the prospects for a near-term recovery of value is not necessarily favorable, or that there is a lack of evidence to support a realizable value equal to or greater than the carrying value of the investment. Once a decline in value for a debt security is determined to be other-than-temporary, the other-than-temporary impairment is separated into (a) the amount of the total other-than-temporary impairment related to a decrease in cash flows expected to be collected from the debt security (the credit loss) and (b) the amount of the total other-than-temporary impairment related to all other factors. The amount of the total other-than-temporary impairment related to the credit loss is recognized in earnings. The amount of the total other-than-temporary impairment related to all other factors is recognized in other comprehensive income.
Goodwill and Intangible Assets
The Company tests for impairment of goodwill at least annually and more frequently as circumstances warrant in accordance with applicable accounting guidance. Accounting guidance allows for the testing of goodwill for impairment using both qualitative and quantitative factors. Impairment of goodwill is recognized only if the carrying amount of the Company, including goodwill, exceeds the fair value of the Company. The amount of the impairment loss would be equal to the excess carrying value of the goodwill over the implied fair value of the Company’s goodwill.
Currently, the Company does not have any intangible assets with indefinite useful lives.
Intangible assets that are not deemed to have an indefinite useful life are amortized over their estimated useful lives. The carrying amounts of intangible assets are regularly reviewed for indicators of impairment in accordance with applicable accounting guidance. Impairment is recognized only if the carrying amount of the intangible asset is in excess of its undiscounted projected cash flows. Impairment is measured as the difference between the carrying amount and the estimated fair value of the asset.
Initial Direct Costs and Fees
We defer initial direct costs incurred and fees received to originate our leases and loans in accordance with the Receivables Topic and the Nonrefundable Fees and Other Costs Subtopic of the FASB ASC. The initial direct costs and fees we defer are part of the net investment in leases and loans and are amortized to interest income using the effective interest method. We defer third-party commission costs, as well as certain internal costs directly related to the origination activity. Costs subject to deferral include evaluating each prospective customer’s financial condition, evaluating and recording guarantees and other security arrangements, negotiating terms, preparing and processing documents and closing each transaction. The fees we defer are documentation fees collected at inception. The realization of the initial direct costs, net of fees deferred, is predicated on the net future cash flows generated by our lease and loan portfolios.
Common Stock and Equity
On July 29, 2014, the Company’s Board of Directors approved a stock repurchase plan, under which, the Company was authorized to repurchase up to $15 million in value of its outstanding shares of common stock (the “2014 Repurchase Plan”). On May 30, 2017, the Company’s Board of Directors approved a new stock
-71-
Table of Contents
MARLIN BUSINESS SERVICES CORP. AND SUBSIDIARIES
NOTES TO CONSOLIDATED FINANCIAL STATEMENTS
repurchase plan to replace the 2014 Repurchase Plan (the “2017 Repurchase Plan”). Under the 2017 Repurchase Plan, the Company is authorized to repurchase up to $10 million in value of its outstanding shares of common stock on the open market. The par value of the shares repurchased is charged to common stock with the excess of the purchase price over par charged against any available additional paid-in capital.
Financing Related Costs
Financing related costs primarily consist of bank commitment fees paid to our financing sources on the unused portion of our loan facility. These fees are recognized as incurred.
Stock-Based Compensation
The Compensation — Stock Compensation Topic of the FASB ASC establishes fair value as the measurement objective in accounting for share-based payment arrangements and requires all entities to apply a fair-value-based measurement method in accounting for share-based payment transactions with employees and non-employees, except for equity instruments held by employee share ownership plans.
The Company measures stock-based compensation cost at grant date, based on the fair value of the awards ultimately expected to vest. Stock-based compensation expense is recognized on a straight-line basis over the service period. We generally use the Black-Scholes valuation model to measure the fair value of our stock options and the Monte Carlo simulation valuation model to measure the fair value of our restricted stock units utilizing various assumptions with respect to expected holding period, risk-free interest rates, stock price volatility, and dividend yield. The assumptions are based on management’s judgment concerning future events.
Based on the October 28, 2009 amendment to the 2003 Equity Compensation Plan, the fair value calculations for the one-time stock option exchange program were based on a binomial valuation model which considered many variables, such as the volatility of our stock and the expected term of an option, including consideration of the ratio of stock price to the exercise price at which exercise is expected to occur. The binomial valuation model was used for both the surrendered stock options and the new replacement options under the stock option exchange program.
As required by U.S. GAAP, the Company uses its judgment in estimating the amount of awards that are expected to be forfeited, with subsequent revisions to the assumptions if actual forfeitures differ from those estimates. The vesting of certain restricted shares may be accelerated to a minimum of three years based on achievement of various individual performance measures. Acceleration of expense for awards based on individual performance factors occurs when the achievement of the performance criteria is determined.
Non-forfeitable dividends paid on shares of restricted stock are recorded to retained earnings for shares that are expected to vest and to compensation expense for shares that are not expected to vest.
Self-Insurance
Beginning in 2014, the Company assumed financial risk for providing health care benefits to its employees through a self-insured group health plan. The estimate of our self-insurance liability contains uncertainty since we must use judgment to estimate the ultimate cost that will be incurred to settle reported claims and unreported claims for incidents incurred but not reported as of the balance sheet date. Liabilities associated with the risk that we retain are estimated by considering historical claims experience, including frequency, severity, demographic factors and other actuarial assumptions. In calculating our liability, we analyze our historical trends, including loss development, and apply appropriate loss development factors to the incurred costs associated with the claims made against our self-insured program. The estimated accruals for these liabilities could be significantly affected if future occurrences or loss development differ from these assumptions.
-72-
Table of Contents
MARLIN BUSINESS SERVICES CORP. AND SUBSIDIARIES
NOTES TO CONSOLIDATED FINANCIAL STATEMENTS
Income Taxes
The Income Taxes Topic of the FASB ASC requires the use of the asset and liability method under which deferred taxes are determined based on the estimated future tax effects of differences between the financial statement and tax bases of assets and liabilities, given the provisions of the enacted tax laws. In assessing the realizability of deferred tax assets, management considers whether it is more likely than not that some portion of the deferred tax assets will not be realized. The ultimate realization of deferred tax assets is dependent upon the generation of future taxable income during the periods in which those temporary differences become deductible. In making this assessment, management considers the scheduled reversal of deferred tax liabilities and projected future taxable income, the level of historical taxable income, projections for future taxable income over the periods which the deferred tax assets are deductible and available tax planning strategies.
Management judgment is required in determining the provision for income taxes, deferred tax assets and liabilities and any necessary valuation allowance recorded against net deferred tax assets. The process involves summarizing temporary differences resulting from the different treatment of items, such as leases, for tax and accounting purposes. These differences result in deferred tax assets and liabilities which are included within the Consolidated Balance Sheets. Management then assesses the likelihood that deferred tax assets will be recovered from future taxable income or tax carry-back availability and, to the extent our management believes recovery is not likely, a valuation allowance is established. To the extent that we establish a valuation allowance in a period, an expense is recorded within the tax provision in the Consolidated Statements of Operations.
The periods subject to examination for the Company’s federal return include the 2014 tax year to the present. The Company files state income tax returns in various states which may have different statutes of limitations. Generally, state income tax returns for the years 2014 through the present are subject to examination.
The Company records penalties and accrued interest related to taxes in income tax expense. Uncertain tax positions are recognized when we believe it is more likely than not that the tax position will be upheld on examination by the taxing authorities based on merits of the position. As of December 31, 2017 and 2016, there are no unrecognized tax benefits, and we did not have any accrued interest and penalties.
Earnings Per Share
The Company’s restricted stock awards are paid non-forfeitable common stock dividends and thus meet the criteria of participating securities. Accordingly, earnings per share (“EPS”) is calculated using the two-class method, under which earnings are allocated to both common shares and participating securities. All shares of restricted stock are deducted from the weighted average shares outstanding for the computation of basic EPS.
Diluted EPS is computed based on the weighted average number of common shares outstanding for the period including the dilutive impact of the exercise or conversion of common stock equivalents, such as stock options, into shares of common stock as if those securities were exercised or converted.
Insurance Premiums Written and Earned
Insurance premiums written and earned are recognized on an accrual basis over the term of the policy, which is month to month. Generally, insurance payments that are 120 days or more past due are charged against income. Since the policy’s premiums are recognized month to month, there is no unearned premium on the Consolidated Balance Sheets as these are fully recognized through the Consolidated Statements of Operations in the month written. For all annual and interim periods, second quarter 2016 and prior, income and expense related to insurance premiums written and earned, insurance policy fees, deferred acquisition costs, premium taxes and
-73-
Table of Contents
MARLIN BUSINESS SERVICES CORP. AND SUBSIDIARIES
NOTES TO CONSOLIDATED FINANCIAL STATEMENTS
provision for losses and loss adjustment expenses is recorded within the “Insurance premiums written and earned” line on the Consolidated Statement of Operations. Effective third quarter 2016, on a prospective basis, only insurance premium written and earned was recorded to that line. Effective third quarter 2016, on a prospective basis, insurance policy fees were recorded to “Other income” and deferred acquisition costs, premium taxes and provision for losses and loss adjustment expenses were recorded in “General and administrative” expense. For the years ended December 31, 2017, 2016, and 2015, insurance premiums written and earned were $7.2 million, $6.2 million, and $5.5 million respectively.
Insurance Program Deferred Acquisition Costs
Deferred acquisitions costs represent the fees paid to a third-party insurance company. Effective third quarter 2016, on a prospective basis, the costs are recognized on the Consolidated Statements of Operations in “General and administrative” expense and for all previous interim and annual periods are recognized net in “Insurance premiums written and earned.” For the years ended December 31, 2017, 2016, and 2015, the Company recognized deferred acquisition costs of $0.9 million, $0.7 million, and $0.8 million, respectively. Since the policy’s premiums are recognized on a month to month basis, there is no deferred acquisition costs on the Consolidated Balance Sheet as these are fully recognized through the Consolidated Statements of Operations in the month written.
Provision for Unpaid Losses and Loss Adjustment Expenses
The Company records a provision for insurance losses and loss adjustment expenses. Effective third quarter 2016, on a prospective basis, the expense was recorded in “General and administrative” expense on the Consolidated Statements of Operations and for all previous annual and interim periods is recorded net in “Insurance premiums written and earned.” The liability for losses and loss adjustment expenses includes an amount determined from loss reports and individual cases and an amount, based on historical loss experience and industry statistics, for losses incurred but not reported (“IBNR”). These estimates are continually reviewed and are subject to the impact of future changes in such factors as claim severity and frequency. Loss and loss expenses are paid when advised by the third-party insurance company. Outstanding losses comprise estimates of the amount of reported losses and loss expenses received from the third-party insurance company plus a provision for losses IBNR. IBNR is determined with the assistance of a third-party actuary. For the years ended December 31, 2017, 2016, and 2015, the Company recognized provision for unpaid losses and loss adjustment expenses of $0.8 million, $0.6 million, and $0.4 million, respectively.
Recent Issued Accounting Standards
Income Statement. In February 2018, the FASB issued Accounting Standards Update (“ASU”) 2018-02, Income Statement — Reporting Comprehensive Income (Topic 220): Reclassification of Certain Tax Effects from Accumulated Other Comprehensive Income. The amendments in this Update allow a reclassification from accumulated other comprehensive income to retained earnings for stranded tax effects resulting from the Tax Cuts and Jobs Act (the “TCJA”). Consequently, the amendments eliminate the stranded tax effects resulting from the TCJA and will improve the usefulness of information reported to financial statement users. All entities may adopt the amendments in this Update earlier as of the fiscal years beginning after December 15, 2018, including interim periods within those fiscal years. Early adoption is permitted. The amendments in this Update should be applied either in the period of adoption or retrospectively to each period (or periods) in which the effect of the change in the U.S. federal corporate income tax rate in the TCJA is recognized. The Company intends to comply with the amendments in this Update and will reclassify the amount stranded in accumulated other comprehensive income to retained earnings in the first quarter of 2018.
-74-
Table of Contents
MARLIN BUSINESS SERVICES CORP. AND SUBSIDIARIES
NOTES TO CONSOLIDATED FINANCIAL STATEMENTS
Stock-Based Compensation. In May 2017, the FASB issued ASU 2017-09, Compensation — Stock Compensation (Topic 718): Scope of Modification Accounting. The amendments in this ASU provide guidance about which changes to the terms or conditions of a share-based payment award require an entity to apply modification accounting in Topic 718. An entity should account for the effects of modifications unless all the following are met: 1) the fair value (or calculated value or intrinsic value, if such an alternative measurement method is used) of the modified award is the same as the fair value (or calculated value or intrinsic value, if such an alternative measurement method is used) of the original award immediately before the original award is modified; 2) the vesting conditions of the modified award are the same as the vesting conditions of the original award immediately before the original award is modified; and 3) the classification of the modified award as an equity instrument or a liability instrument is the same as the classification of the original award immediately before the original award is modified. The current disclosure requirements in Topic 718 apply regardless of whether an entity is required to apply modification accounting under the amendments in this ASU. The amendments in this ASU are effective for all entities for annual periods, and interim periods within those annual periods, beginning after December 15, 2017. The Company adopted these changes effective January 1, 2018 on a prospective basis. Adoption of this ASU did not have a material impact on our results of operations or financial position.
Other Income. In February 2017, the FASB issued ASU 2017-05, Other Income — Gains and Losses from the Derecognition of Nonfinancial Assets (Subtopic 610-20): Clarifying the Scope of Asset Derecognition Guidance and Accounting for Partial Sales of Nonfinancial Assets. The amendments in this ASU clarify that a financial asset is within the scope of Subtopic 610-20 if it meets the definition of an in substance nonfinancial asset. The amendments define the term in substance nonfinancial asset, in part, as a financial asset promised to a counterparty in a contract if substantially all of the fair value of the assets (recognized and unrecognized) that are promised to the counterparty in the contract is concentrated in nonfinancial assets. If substantially all of the fair value of the assets that are promised to the counterparty in a contract is concentrated in nonfinancial assets, then all of the financial assets promised to the counterparty are in substance nonfinancial assets within the scope of Subtopic 610-20. The amendments in this ASU also clarify that nonfinancial assets within the scope of Subtopic 610-20 may include nonfinancial assets transferred within a legal entity to a counterparty. The amendments in this ASU are effective for public business entities for fiscal years beginning after December 15, 2017, and interim periods within those fiscal years. The Company adopted these changes effective January 1, 2018 on a prospective basis. Adoption of this ASU did not have a material impact on our results of operations or financial position.
Business Combinations. In January 2017, the FASB issued ASU 2017-01, Business Combinations (Topic 805): Clarifying the Definition of a Business. The amendments in this Update provide a screen to determine when a set is not a business. The screen requires that when substantially all of the fair value of the gross assets acquired (or disposed of) is concentrated in a single identifiable asset or a group of similar identifiable assets, the set is not a business. The amendments in this Update are effective for public business entities for fiscal years beginning after December 15, 2017, and interim periods within those fiscal years. The Company adopted these changes effective January 1, 2018 on a prospective basis. Adoption of this ASU did not have a material impact on our results of operations or financial position.
Intangibles. In January 2017, the FASB issued ASU 2017-04, Intangibles — Goodwill and Other (Topic 350): Simplifying the Test for Goodwill Impairment. Under the amendments in this Update, an entity should perform its annual, or interim, goodwill impairment test by comparing the fair value of a reporting unit with its carrying amount. An entity should recognize an impairment charge for the amount by which the carrying amount exceeds the reporting unit’s fair value; however, the loss recognized should not exceed the total amount of goodwill allocated to that reporting unit. The amendments in this Update are effective for public business entities for fiscal years beginning after December 15, 2019, and interim periods within those fiscal years. Early
-75-
Table of Contents
MARLIN BUSINESS SERVICES CORP. AND SUBSIDIARIES
NOTES TO CONSOLIDATED FINANCIAL STATEMENTS
adoption is permitted for interim or annual goodwill impairment tests performed on testing dates after January 1, 2017. The Company does not expect to early adopt these changes. The Company will apply the amendments in this Update prospectively to each period presented. The Company is evaluating the impact of this new requirement on the financial position, results of operations, and cash flows of the Company.
Statement of Cash Flows. In August 2016, the FASB issued ASU 2016-15, Statement of Cash Flows (Topic 230): Classification of Certain Cash Receipts and Cash Payments (a consensus of the Emerging Issues Task Force). The amendments in this Update provide guidance on eight specific cash flow issues. The amendments in this Update are effective for public business entities for fiscal years beginning after December 15, 2017, and interim periods within those fiscal years. The Company elected to adopt these changes effective January 1, 2018. Adoption of this ASU did not have a material impact on our results of operations or financial position.
In November 2016, the FASB issued ASU 2016-18, Statement of Cash Flows (Topic 230): Restricted Cash (a consensus of the FASB Emerging Issues Task Force). The amendments in this Update require that a statement of cash flows explain the change during the period in the total cash, cash equivalents, and amounts generally described as restricted cash or restricted cash equivalents. Amounts generally described as restricted cash and restricted cash equivalents should be included with cash and cash equivalents when reconciling the beginning-of-period and end-of-period total amounts shown on the statement of cash flows. The amendments in this Update are effective for public business entities for fiscal years beginning after December 15, 2017, and interim periods within those fiscal years. The Company elected to adopt these changes effective January 1, 2018. Adoption of this ASU did not have a material impact on our results of operations or financial position.
Financial Instruments. In June 2016, the FASB issued ASU 2016-13, Financial Instruments — Credit Losses (Topic 326): Measurement of Credit Losses on Financial Instruments. The amendments in this Update require a financial asset (or a group of financial assets) measured at amortized cost basis to be presented at the net amount expected to be collected. Credit losses relating to available-for-sale debt securities should be recorded through an allowance for credit losses. The amendments in this Update are effective for fiscal years beginning after December 15, 2019, including interim periods within those fiscal years. All entities may adopt the amendments in this Update earlier as of the fiscal years beginning after December 15, 2018, including interim periods within those fiscal years. The Company does not expect to early adopt these changes. The Company is evaluating the impact of this new requirement on the consolidated earnings, financial position and cash flows of the Company.
Leases. In February 2016, the FASB issued ASU 2016-02, Leases (Topic 842). The update requires lessees to recognize, as of the lease commencement date, assets and liabilities for all such leases with lease terms of more than 12 months, which is a change from the current GAAP requirement to recognize only capital leases on the balance sheet. Pursuant to the new standard, the liability initially recognized for the lease obligation is equal to the present value of the lease payments not yet made, discounted over the lease term at the implicit interest rate of the lease, if available, or otherwise at the lessee’s incremental borrowing rate. The lessee is also required to recognize an asset for its right to use the underlying asset for the lease term, based on the liability subject to certain adjustments, such as for initial direct costs. Leases are required to be classified as either operating or finance, with expense on operating leases recorded as a single lease cost on a straight-line basis. For finance leases, interest expense on the lease liability is required to be recognized separately from the straight-line amortization of the right-of-use asset. Quantitative disclosures are required for certain items, including the cost of leases, the weighted-average remaining lease term, the weighted-average discount rate and a maturity analysis of lease liabilities. Additional qualitative disclosures are also required regarding the nature of the leases, such as basis, terms and conditions of: (i) variable interest payments; (ii) extension and termination options; and (iii) residual value guarantees. For lessors, the standard modifies classification criteria and accounting for sales-
-76-
Table of Contents
MARLIN BUSINESS SERVICES CORP. AND SUBSIDIARIES
NOTES TO CONSOLIDATED FINANCIAL STATEMENTS
type and direct financing leases and requires a lessor to derecognize the carrying value of the leased asset that is considered to have been transferred to a lessee and record a lease receivable and residual asset (“receivable and residual” approach). This update is effective for public companies for fiscal years beginning after December 15, 2018, including interim periods within those fiscal years. Early adoption is permitted. The Company does not expect to early adopt this standard. The new standard must be adopted by applying the new guidance as of the beginning of the earliest comparative period presented, using a modified retrospective transition approach with certain optional practical expedients. The Company is still evaluating the impact of this new guidance.
Financial Instruments. In January 2016, the FASB issued ASU 2016-01, Financial Instruments — Overall (Subtopic 825-10): Recognition and Measurement of Financial Assets and Financial Liabilities. The amendments in this Update require equity securities (including other ownership interests, such as partnerships, unincorporated joint ventures, and limited liability companies) to be measured at fair value with changes in the fair value recognized through net income. The amendments in this Update are effective for fiscal years beginning after December 15, 2017, including interim periods within those fiscal years. The Company adopted these changes effective January 1, 2018 on a prospective basis. Adoption of this ASU did not have a material impact on our results of operations or financial position.
Revenue Recognition. In May 2014, the FASB issued ASU 2014-09, Revenue from Contracts with Customers (a new revenue recognition standard). The ASU’s core principle is that a company will recognize revenue to depict the transfer of goods or services to customers in an amount that reflects the consideration to which the entity expects to be entitled in exchange for those goods or services. In addition, this ASU specifies the accounting for certain costs to obtain or fulfill a contract with a customer and expands disclosure requirements for revenue recognition. This ASU is effective, as a result of ASU 2015-14, for annual reporting periods beginning after December 15, 2017, including interim periods within that reporting period. The Company adopted the revenue recognition guidance on January 1, 2018 using the modified retrospective approach. A significant amount of the Company’s revenues is excluded from the scope of the amended guidance, including interest income, fee income, and insurance premiums written and earned, as seen on the Consolidated Statements of Operations. Revenue streams that will be subject to the new revenue recognition guidance includes certain revenues associated with lease and loan contracts including property tax administrative fees, fees billed to customers for the convenience of paying through ACH, and insurance administrative fees. In addition, referral fee income generated from referring lease and loan customers to third parties was deemed to be in scope of the amended guidance. The Company analyzed the in scope contracts and determined there were no material changes in the timing of revenue recognition when considering the amended guidance. The adoption of this ASU did not have a material impact on our results of operations, financial position or disclosure to the notes of the consolidated financial statements.
-77-
Table of Contents
MARLIN BUSINESS SERVICES CORP. AND SUBSIDIARIES
NOTES TO CONSOLIDATED FINANCIAL STATEMENTS
Note 3 — Investments
Available for sale investments are recorded at fair value and unrealized gains and losses are reported, net of taxes, in accumulated other comprehensive income (loss) included in stockholders’ equity unless management determines that an investment is other-than-temporarily impaired (OTTI). The amortized cost and estimated fair value of investments, with gross unrealized gains and losses, were as follows as of December 31, 2017 and December 31, 2016:
| December 31, 2017 | ||||||||||||||||
| Amortized Cost |
Gross Unrealized Gains |
Gross Unrealized Losses |
Estimated Fair Value |
|||||||||||||
| (Dollars in thousands) | ||||||||||||||||
| Securities Available for Sale: |
||||||||||||||||
| ABS |
$ | 5,717 | $ | 27 | $ | (39 | ) | $ | 5,705 | |||||||
| Municipal securities |
2,420 | 18 | (36 | ) | 2,402 | |||||||||||
| Mutual fund |
3,553 | — | (127 | ) | 3,426 | |||||||||||
|
|
|
|
|
|
|
|
|
|||||||||
| Total securities available for sale |
$ | 11,690 | $ | 45 | $ | (202 | ) | $ | 11,533 | |||||||
|
|
|
|
|
|
|
|
|
|||||||||
| December 31, 2016 | ||||||||||||||||
| Amortized Cost |
Gross Unrealized Gains |
Gross Unrealized Losses |
Estimated Fair Value |
|||||||||||||
| (Dollars in thousands) | ||||||||||||||||
| Securities Available for Sale: |
||||||||||||||||
| ABS |
$ | — | $ | — | $ | — | $ | — | ||||||||
| Municipal securities |
2,625 | — | (97 | ) | 2,528 | |||||||||||
| Mutual fund |
3,479 | — | (127 | ) | 3,352 | |||||||||||
|
|
|
|
|
|
|
|
|
|||||||||
| Total securities available for sale |
$ | 6,104 | $ | — | $ | (224 | ) | $ | 5,880 | |||||||
|
|
|
|
|
|
|
|
|
|||||||||
The following tables present the aggregate amount of unrealized losses on securities in the Company’s available-for-sale investment portfolios classified according to the amount of time those securities have been in a continuous loss position as of December 31, 2017 and December 31, 2016:
| December 31, 2017 | ||||||||||||||||||||||||
| Less than 12 months | 12 months or longer | Total | ||||||||||||||||||||||
| Gross Unrealized Losses |
Fair Value |
Gross Unrealized Losses |
Fair Value |
Gross Unrealized Losses |
Fair Value |
|||||||||||||||||||
| (Dollars in thousands) | ||||||||||||||||||||||||
| Securities Available for Sale: |
||||||||||||||||||||||||
| ABS |
$ | (39 | ) | $ | 3,703 | $ | — | $ | — | $ | (39 | ) | $ | 3,703 | ||||||||||
| Municipal securities |
(36 | ) | (2,402 | ) | (36 | ) | 2,402 | |||||||||||||||||
| Mutual fund |
— | — | (127 | ) | 3,426 | (127 | ) | 3,426 | ||||||||||||||||
|
|
|
|
|
|
|
|
|
|
|
|
|
|||||||||||||
| Total debt securities available for sale |
$ | (39 | ) | $ | 3,703 | $ | (163 | ) | $ | 5,828 | $ | (202 | ) | $ | 9,531 | |||||||||
|
|
|
|
|
|
|
|
|
|
|
|
|
|||||||||||||
-78-
Table of Contents
MARLIN BUSINESS SERVICES CORP. AND SUBSIDIARIES
NOTES TO CONSOLIDATED FINANCIAL STATEMENTS
| December 31, 2016 | ||||||||||||||||||||||||
| Less than 12 months | 12 months or longer | Total | ||||||||||||||||||||||
| Gross Unrealized Losses |
Fair Value |
Gross Unrealized Losses |
Fair Value |
Gross Unrealized Losses |
Fair Value |
|||||||||||||||||||
| (Dollars in thousands) | ||||||||||||||||||||||||
| Securities Available for Sale: |
||||||||||||||||||||||||
| ABS |
$ | — | $ | — | $ | — | $ | — | $ | — | $ | — | ||||||||||||
| Municipal securities |
(97 | ) | 2,528 | — | — | (97 | ) | 2,528 | ||||||||||||||||
| Mutual fund |
— | — | (127 | ) | 3,352 | (127 | ) | 3,352 | ||||||||||||||||
|
|
|
|
|
|
|
|
|
|
|
|
|
|||||||||||||
| Total debt securities available for sale |
$ | (97 | ) | $ | 2,528 | $ | (127 | ) | $ | 3,352 | $ | (224 | ) | $ | 5,880 | |||||||||
|
|
|
|
|
|
|
|
|
|
|
|
|
|||||||||||||
Based on current facts and circumstances, the Company believes the unrealized losses presented in the December 31, 2017 securities in a gross unrealized loss position in the table above are not indicative of the ultimate collectability of the current amortized cost of the securities, but rather are attributable to changes in interest rates, credit spreads and other factors.
The following table presents the amortized cost, fair value, and weighted average yield of investments in debt securities available for sale at December 31, 2017, by remaining contractual maturity, with the exception of ABS and municipal securities, which are based on estimated average life. Receipt of cash flows may differ from contractual maturities because borrowers may have the right to call or prepay obligations with or without penalties:
| Distribution of Maturities | ||||||||||||||||||||
| 1 Year or Less |
1-5 Years |
5-10 Years |
After 10 Years |
Total | ||||||||||||||||
| (Dollars in thousands) | ||||||||||||||||||||
| Amortized Cost: |
||||||||||||||||||||
| Available for Sale: |
||||||||||||||||||||
| ABS |
$ | — | $ | 3,710 | $ | 1,006 | $ | 1,001 | $ | 5,717 | ||||||||||
| Municipal securities |
— | 20 | 1,442 | 958 | 2,420 | |||||||||||||||
|
|
|
|
|
|
|
|
|
|
|
|||||||||||
| Total debt securities available for sale |
$ | — | $ | 3,730 | $ | 2,448 | $ | 1,959 | $ | 8,137 | ||||||||||
|
|
|
|
|
|
|
|
|
|
|
|||||||||||
| Estimated fair value |
$ | — | $ | 3,683 | $ | 2,550 | $ | 1,920 | $ | 8,153 | ||||||||||
| Weighted-average yield, GAAP basis |
— | 1.91 | % | 2.41 | % | 2.09 | % | 2.10 | % | |||||||||||
OTTI
The Company evaluates all investment securities in an unrealized loss position for OTTI on at least a quarterly basis. An unrealized loss exists when the current fair value of an individual security is less than its amortized cost basis. The OTTI assessment is a subjective process requiring the use of judgments and assumptions. During the securities-level assessments, consideration is given to (1) the intent not to sell and probability that the Company will not be required to sell the security before recovery of its cost basis to allow for any anticipated recovery in fair value, (2) the financial condition and near-term prospects of the issuer, as well as company news and current events, and (3) the ability to collect the future expected cash flows. Key assumptions utilized to forecast expected cash flows may include loss severity, expected cumulative loss percentage, cumulative loss percentage to date, weighted average Fair Isaac Corporation (“FICO®”) scores and weighted average LTV ratio, rating or scoring, credit ratings and market spreads, as applicable.
According to accounting guidance for debt securities in an unrealized loss position, the Company is required to assess whether it has the intent to sell the debt security or more likely than not will be required to sell the debt
-79-
Table of Contents
MARLIN BUSINESS SERVICES CORP. AND SUBSIDIARIES
NOTES TO CONSOLIDATED FINANCIAL STATEMENTS
security before the anticipated recovery. If either of these conditions is met the Company must recognize an other than temporary impairment with the entire unrealized loss being recorded through earnings. For debt securities in an unrealized loss position not meeting these conditions, the Company assesses whether the impairment of a security is other than temporary. If the impairment is deemed to be other than temporary, the Company must separate the other than temporary impairment into two components: the amount representing the credit loss and the amount related to all other factors, such as changes in interest rates. The credit loss represents the portion of the amortized book value in excess of the net present value of the projected future cash flows discounted at the effective interest rate implicit in the debt security prior to impairment. The credit loss component of the other than temporary impairment is recorded through earnings, whereas the amount relating to factors other than credit losses is recorded in other comprehensive income, net of taxes. The Company did not recognize any OTTI in earnings related to its investment securities for each of the years ended December 31, 2017 and December 31, 2016.
NOTE 4 — Net Investment in Leases and Loans
Net investment in leases and loans consists of the following:
| December 31, | ||||||||
| 2017 | 2016 | |||||||
| (Dollars in thousands) | ||||||||
| Minimum lease payments receivable |
$ | 607,736 | $ | 646,127 | ||||
| Estimated residual value of equipment |
26,922 | 26,790 | ||||||
| Unearned lease income, net of initial direct costs and fees deferred |
(81,769 | ) | (88,853 | ) | ||||
| Security deposits |
(1,046 | ) | (1,493 | ) | ||||
|
|
|
|
|
|||||
| Total leases |
551,843 | 582,571 | ||||||
| Commercial loans, net of origination costs and fees deferred |
||||||||
| Funding Stream |
28,128 | 19,870 | ||||||
| CRA(1) |
1,222 | 1,098 | ||||||
| Equipment Loans(2) |
291,333 | 174,870 | ||||||
| TFG |
56,745 | 29,245 | ||||||
|
|
|
|
|
|||||
| Total commercial loans |
377,428 | 225,083 | ||||||
| Allowance for credit losses |
(14,851 | ) | (10,937 | ) | ||||
|
|
|
|
|
|||||
| $ | 914,420 | $ | 796,717 | |||||
|
|
|
|
|
|||||
| (1) | CRA loans are comprised of loans originated under a line of credit to satisfy its obligations under the Community Reinvestment Act of 1977. |
| (2) | Equipment loans are comprised of Equipment Finance Agreements, Install Purchase Agreements, and other loans. |
At December 31, 2017, $37.8 million in net investment in leases are pledged as collateral for the secured borrowing capacity at the Federal Reserve Discount Window.
Initial direct costs net of fees deferred were $17.2 million and $13.9 million as of December 31, 2017 and December 31, 2016, respectively. Initial direct costs are netted in unearned income and are amortized to income using the effective interest method. Origination costs net of fees deferred were $0.8 million and $0.4 million as of December 31, 2017 and December 31, 2016, respectively. Origination costs are netted in commercial loans and are amortized to income using the effective interest method. At December 31, 2017 and December 31, 2016, $22.6 million and $22.5 million, respectively, of the estimated residual value of equipment retained on our Consolidated Balance Sheets was related to copiers.
-80-
Table of Contents
MARLIN BUSINESS SERVICES CORP. AND SUBSIDIARIES
NOTES TO CONSOLIDATED FINANCIAL STATEMENTS
Minimum lease payments receivable under lease contracts and the amortization of unearned lease income, including initial direct costs and fees deferred, are as follows as of December 31, 2017:
| Minimum Lease Payments Receivable |
Income Amortization |
|||||||
| (Dollars in thousands) | ||||||||
| Period Ending December 31, |
||||||||
| 2018 |
$ | 249,107 | $ | 42,090 | ||||
| 2019 |
173,458 | 23,383 | ||||||
| 2020 |
107,523 | 11,194 | ||||||
| 2021 |
55,876 | 4,200 | ||||||
| 2022 |
20,224 | 841 | ||||||
| Thereafter |
1,548 | 61 | ||||||
|
|
|
|
|
|||||
| $ | 607,736 | $ | 81,769 | |||||
|
|
|
|
|
|||||
As of December 31, 2017 and December 31, 2016, the Company maintained total finance receivables which were on a non-accrual basis of $3.2 million and $2.2 million, respectively. As of December 31, 2017 and December 31, 2016, the Company had total finance receivables in which the terms of the original agreements had been renegotiated in the amount of $4.5 million and $0.8 million, respectively. (See Note 6 for additional asset quality information).
NOTE 5 — Concentrations of Risk
As of December 31, 2017, leases approximating 13%, 12% and 10% of the net investment balance of leases by the Company were located in the states of California, Texas and Florida, respectively. As of December 31, 2016, leases approximating 13%, 10% and 10% of the net investment balance of leases by the Company were located in the states of California, Texas and Florida, respectively. No other state accounted for more than 7% of the net investment balance of leases owned and serviced by the Company as of December 31, 2017 and December 31, 2016. As of December 31, 2017 and December 31, 2016 , no single vendor source accounted for more than 2% of the net investment balance of leases owned by the Company. The largest single obligor accounted for less than 1% of the net investment balance of leases owned by the Company as of December 31, 2017 and December 31, 2016. Although the Company’s portfolio of leases includes lessees located throughout the United States, such lessees’ ability to honor their contracts may be substantially dependent on economic conditions in these states. All such contracts are collateralized by the related equipment. The Company leases to a variety of different industries, including the medical, retail, service, manufacturing and restaurant industries, among others. To the extent that the economic or regulatory conditions prevalent in such industries change, the lessees’ ability to honor their lease obligations may be adversely impacted. As of December 31, 2017 and December 31, 2016, copiers comprised 84.8% and 83.8%, respectively, of the estimated residual value of leased equipment. No other group of equipment represented more than 10% of equipment residuals as of December 31, 2017 and December 31, 2016. Improvements and other changes in technology could adversely impact the Company’s ability to realize the recorded value of this equipment. There were no impairments of estimated residual value recorded during the years ended December 31, 2017, 2016 or 2015.
NOTE 6 — Allowance for Credit Losses
In accordance with the Contingencies Topic of the FASB ASC, we maintain an allowance for credit losses at an amount sufficient to absorb losses inherent in our existing lease and loan portfolios as of the reporting dates based on our estimate of probable net credit losses.
-81-
Table of Contents
MARLIN BUSINESS SERVICES CORP. AND SUBSIDIARIES
NOTES TO CONSOLIDATED FINANCIAL STATEMENTS
The following tables provides activity in the allowance for credit losses and asset quality statistics for each of the years ended December 31, 2017, 2016 and 2015.
| December 31, 2017 | ||||||||||||||||||||
| Commercial Loans | ||||||||||||||||||||
| Funding Stream |
CRA | Equipment Finance(2) |
TFG | Total | ||||||||||||||||
| (Dollars in thousands) | ||||||||||||||||||||
| Allowance for credit losses, beginning of period |
$ | 760 | $ | — | $ | 9,808 | $ | 369 | $ | 10,937 | ||||||||||
|
|
|
|
|
|
|
|
|
|
|
|||||||||||
| Charge-offs |
(1,219 | ) | — | (14,343 | ) | (1,154 | ) | (16,716 | ) | |||||||||||
| Recoveries |
121 | — | 2,066 | 49 | 2,236 | |||||||||||||||
|
|
|
|
|
|
|
|
|
|
|
|||||||||||
| Net charge-offs |
(1,098 | ) | — | (12,277 | ) | (1,105 | ) | (14,480 | ) | |||||||||||
|
|
|
|
|
|
|
|
|
|
|
|||||||||||
| Provision for credit losses |
1,374 | — | 15,132 | 1,888 | 18,394 | |||||||||||||||
|
|
|
|
|
|
|
|
|
|
|
|||||||||||
| Allowance for credit losses, end of period |
$ | 1,036 | $ | — | $ | 12,663 | $ | 1,152 | $ | 14,851 | ||||||||||
|
|
|
|
|
|
|
|
|
|
|
|||||||||||
| Ending lease or loan balance(1) |
$ | 27,810 | $ | 1,222 | $ | 826,880 | $ | 55,330 | $ | 911,242 | ||||||||||
| December 31, 2016 | ||||||||||||||||||||
| Commercial Loans | Total | |||||||||||||||||||
| Funding Stream |
CRA | Equipment Finance(2) |
TFG | |||||||||||||||||
| (Dollars in thousands) | ||||||||||||||||||||
| Allowance for credit losses, beginning of period |
$ | 174 | $ | — | $ | 8,217 | $ | 22 | $ | 8,413 | ||||||||||
|
|
|
|
|
|
|
|
|
|
|
|||||||||||
| Charge-offs |
(455 | ) | — | (11,893 | ) | (39 | ) | (12,387 | ) | |||||||||||
| Recoveries |
93 | — | 2,404 | — | 2,497 | |||||||||||||||
|
|
|
|
|
|
|
|
|
|
|
|||||||||||
| Net charge-offs |
(362 | ) | — | (9,489 | ) | (39 | ) | (9,890 | ) | |||||||||||
|
|
|
|
|
|
|
|
|
|
|
|||||||||||
| Provision for credit losses |
948 | — | 11,080 | 386 | 12,414 | |||||||||||||||
|
|
|
|
|
|
|
|
|
|
|
|||||||||||
| Allowance for credit losses, end of period |
$ | 760 | $ | — | $ | 9,808 | $ | 369 | $ | 10,937 | ||||||||||
|
|
|
|
|
|
|
|
|
|
|
|||||||||||
| Ending lease or loan balance(1) |
$ | 19,676 | $ | 1,098 | $ | 744,103 | $ | 28,408 | $ | 793,285 | ||||||||||
| December 31, 2015 | ||||||||||||||||||||
| Commercial Loans | Total | |||||||||||||||||||
| Funding Stream |
CRA | Equipment Finance(2) |
TFG | |||||||||||||||||
| (Dollars in thousands) | ||||||||||||||||||||
| Allowance for credit losses, beginning of period |
$ | — | $ | — | $ | 8,537 | $ | — | $ | 8,537 | ||||||||||
|
|
|
|
|
|
|
|
|
|
|
|||||||||||
| Charge-offs |
(14 | ) | — | (12,439 | ) | — | (12,453 | ) | ||||||||||||
| Recoveries |
— | — | 2,334 | — | 2,334 | |||||||||||||||
|
|
|
|
|
|
|
|
|
|
|
|||||||||||
| Net charge-offs |
(14 | ) | — | (10,105 | ) | — | (10,119 | ) | ||||||||||||
|
|
|
|
|
|
|
|
|
|
|
|||||||||||
| Provision for credit losses |
188 | — | 9,785 | 22 | 9,995 | |||||||||||||||
|
|
|
|
|
|
|
|
|
|
|
|||||||||||
| Allowance for credit losses, end of period |
$ | 174 | $ | — | $ | 8,217 | $ | 22 | $ | 8,413 | ||||||||||
|
|
|
|
|
|
|
|
|
|
|
|||||||||||
| Ending lease or loan balance(1) |
$ | 4,991 | $ | 1,115 | $ | 671,922 | $ | 1,710 | $ | 679,738 | ||||||||||
| (1) | For purposes of asset quality and allowance calculations, the effects of (i) the allowance for credit losses and (ii) initial direct costs and fees deferred are excluded. |
| (2) | Equipment Finance consists of Equipment Finance Agreements, Install Purchase Agreements, and other leases and loans. |
-82-
Table of Contents
MARLIN BUSINESS SERVICES CORP. AND SUBSIDIARIES
NOTES TO CONSOLIDATED FINANCIAL STATEMENTS
As of December 31, 2017, 2016, and 2015 all leases and loans were collectively evaluated for impairment. As of December 31, 2017 and 2016, sales of leases and loans were $62.1 million and $16.9 million, respectively. No leases or loans have been acquired with deteriorated credit quality.
Credit Quality Indicators
The Company’s credit review process includes a risk classification of all leases and loans that includes pass, special mention, substandard, doubtful, and loss. The classification of a lease or loan may change based on changes in the creditworthiness of the borrower. The description of the risk classifications are as follows:
Pass: A lease or loan is classified as pass when payments are current and it is performing under the original contractual terms.
Special Mention: A lease or loan is classified as special mention when the borrower exhibits potential credit weakness or a downward trend which, if not checked or corrected, will weaken the asset or inadequately protect the Company’s position. While potentially weak, the borrower is currently marginally acceptable; no loss of principal or interest is envisioned.
Substandard: A lease or loan is classified as substandard when the borrower has a well-defined weakness or weaknesses that jeopardize the orderly liquidation of the debt. A substandard loan is inadequately protected by the current net worth and paying capacity of the obligor, normal repayment from this borrower is in jeopardy, and there is a distinct possibility that a partial loss of interest and/or principal will occur if the deficiencies are not corrected.
Doubtful: A lease or loan is classified as doubtful when a borrower has all weaknesses inherent in a loan classified as substandard with the added provision that: (1) the weaknesses make collection of debt in full on the basis of currently existing facts, conditions and values highly questionable and improbable; (2) serious problems exist to the point where a partial loss of principal is likely; and (3) the possibility of loss is extremely high, but because of certain important, reasonably specific pending factors which may work to the advantage and strengthening of the assets, its classification as an estimated loss is deferred until its more exact status may be determined. Pending factors include proposed merger, acquisition, or liquidation procedures, capital injection, perfecting liens and additional refinancing plans.
Loss: A lease or loan is classified as loss when uncollectible and of such little value that its continuance as a bankable asset is not warranted. This classification does not mean that the loan has absolutely no recovery or salvage value but rather that it is not practical or desirable to defer writing off this basically worthless asset even though partial recovery may be effected in the future.
The Company charges-off the collateral or discounted cash flow deficiency on all loans on non-accrual status. In all cases, leases and loans are placed on non-accrual when 90 days past due or earlier if collection of principal or interest is considered doubtful.
-83-
Table of Contents
MARLIN BUSINESS SERVICES CORP. AND SUBSIDIARIES
NOTES TO CONSOLIDATED FINANCIAL STATEMENTS
The following tables present the segments of the loan portfolio in which a formal risk weighting system is utilized summarized by the categories of “pass” and “special mention”, and the classified categories of “substandard”, “doubtful”, and “loss” within the Bank’s risk rating system at December 31, 2017 and December 31, 2016. The data within the tables reflect net investment, excluding deferred fees and allowance.
| December 31, 2017 | ||||||||||||||||||||
| Commercial Loans | ||||||||||||||||||||
| Funding Stream |
CRA | Equipment Finance(1) |
TFG | Total | ||||||||||||||||
| (Dollars in thousands) | ||||||||||||||||||||
| Pass |
$ | 27,405 | $ | 1,222 | $ | 801,894 | $ | 50,342 | $ | 880,863 | ||||||||||
| Special Mention |
56 | — | 15,141 | 4,906 | 20,103 | |||||||||||||||
| Substandard |
47 | — | 6,428 | 44 | 6,519 | |||||||||||||||
| Doubtful |
163 | — | 2,995 | 38 | 3,196 | |||||||||||||||
| Loss |
139 | — | 422 | — | 561 | |||||||||||||||
|
|
|
|
|
|
|
|
|
|
|
|||||||||||
| Total |
$ | 27,810 | $ | 1,222 | $ | 826,880 | $ | 55,330 | $ | 911,242 | ||||||||||
|
|
|
|
|
|
|
|
|
|
|
|||||||||||
| December 31, 2016 | ||||||||||||||||||||
| Commercial Loans | ||||||||||||||||||||
| Funding Stream |
CRA | Equipment Finance(1) |
TFG | Total | ||||||||||||||||
| (Dollars in thousands) | ||||||||||||||||||||
| Pass |
$ | 19,304 | $ | 1,098 | $ | 729,769 | $ | 23,573 | $ | 773,744 | ||||||||||
| Special Mention |
67 | — | 9,772 | 4,666 | 14,505 | |||||||||||||||
| Substandard |
169 | — | 1,651 | 169 | 1,989 | |||||||||||||||
| Doubtful |
136 | — | 2,649 | — | 2,785 | |||||||||||||||
| Loss |
— | — | 262 | — | 262 | |||||||||||||||
|
|
|
|
|
|
|
|
|
|
|
|||||||||||
| Total |
$ | 19,676 | $ | 1,098 | $ | 744,103 | $ | 28,408 | $ | 793,285 | ||||||||||
|
|
|
|
|
|
|
|
|
|
|
|||||||||||
| (1) | Equipment Finance consists of Equipment Finance Agreements, Install Purchase Agreements, and other leases and loans. |
Loan Delinquencies and Non-accrual Leases and Loans
Net investments in leases and loans are generally charged-off when they are contractually past due for 120 days or more. Income recognition is discontinued on leases or loans when a default on monthly payment exists for a period of 90 days or more. Income recognition resumes when a lease or loan becomes less than 90 days delinquent. At December 31, 2017 and December 31, 2016, there were no finance receivables past due 90 days or more and still accruing.
Funding Stream loans are generally placed in non-accrual status when they are 30 days past due and charged-off at 60 days past due. The loan is removed from non-accrual status once sufficient payments are made to bring the loan current and reviewed by management. There were no Funding Stream loans past due 30 days or more and still accruing.
Management further monitors the performance and credit quality of the loan portfolio as determined by the length of time a recorded payment is due.
-84-
Table of Contents
MARLIN BUSINESS SERVICES CORP. AND SUBSIDIARIES
NOTES TO CONSOLIDATED FINANCIAL STATEMENTS
The following tables provide information about delinquent and non-accrual leases and loans in the Company’s portfolio each of the years ended December 31, 2017 and December 31, 2016.
| December 31, 2017 |
30-59 Days Past Due |
60-89 Days Past Due |
>90 Days Past Due |
Total Past Due |
Current | Total Finance Receivables |
Non- Accruing |
|||||||||||||||||||||
| (Dollars in thousands) | ||||||||||||||||||||||||||||
| Commercial Loans: |
||||||||||||||||||||||||||||
| Funding Stream |
$ | 119 | $ | — | $ | — | $ | 119 | $ | 27,691 | $ | 27,810 | $ | 118 | ||||||||||||||
| CRA |
— | — | — | — | 1,222 | 1,222 | — | |||||||||||||||||||||
| Equipment Finance(1) |
4,621 | 2,532 | 3,023 | 10,176 | 928,963 | 939,139 | 3,023 | |||||||||||||||||||||
| TFG |
178 | 50 | 42 | 270 | 64,499 | 64,769 | 42 | |||||||||||||||||||||
|
|
|
|
|
|
|
|
|
|
|
|
|
|
|
|||||||||||||||
| Total Leases and Loans(2) |
$ | 4,918 | $ | 2,582 | $ | 3,065 | $ | 10,565 | $ | 1,022,375 | $ | 1,032,940 | $ | 3,183 | ||||||||||||||
| December 31, 2016 |
30-59 Days Past Due |
60-89 Days Past Due |
>90 Days Past Due |
Total Past Due |
Current | Total Finance Receivables |
Non- Accruing |
|||||||||||||||||||||
| (Dollars in thousands) | ||||||||||||||||||||||||||||
| Commercial Loans: |
||||||||||||||||||||||||||||
| Funding Stream |
$ | — | $ | — | $ | — | $ | — | $ | 19,676 | $ | 19,676 | $ | 66 | ||||||||||||||
| CRA |
— | — | — | — | 1,098 | 1,098 | — | |||||||||||||||||||||
| Equipment Finance(1) |
2,999 | 1,768 | 2,176 | 6,943 | 835,506 | 842,449 | 2,176 | |||||||||||||||||||||
| TFG |
90 | 193 | — | 283 | 33,673 | 33,956 | — | |||||||||||||||||||||
|
|
|
|
|
|
|
|
|
|
|
|
|
|
|
|||||||||||||||
| Total Leases and Loans(2) |
$ | 3,089 | $ | 1,961 | $ | 2,176 | $ | 7,226 | $ | 889,953 | $ | 897,179 | $ | 2,242 | ||||||||||||||
| (1) | Equipment Finance consists of Equipment Finance Agreements, Install Purchase Agreements, and other leases and loans. |
| (2) | Represents total minimum lease and loan payments receivable for Equipment Finance and TFG and as a percentage of principal outstanding for Funding Stream and CRA. |
NOTE 7 — Goodwill and Intangible Assets
Goodwill
As a result of the HKF acquisition on January 4, 2017, the Company recorded goodwill of $1.2 million as of December 31, 2017, which represents the excess purchase price over the Company’s fair value of the assets acquired. The recorded goodwill is not amortizable but is deductible for tax purposes. The purchase price allocation was finalized in the third quarter of 2017 and no changes made to the preliminary valuations were recorded. Impairment testing will be performed in the fourth quarter of each year and more frequently as warranted in accordance with the applicable accounting guidance. There was no impairment recorded during the twelve-month period ended December 31, 2017.
The changes in the carrying amount of goodwill for the twelve-month period ended December 31, 2017 are as follows:
| Total Company | ||||
| (Dollars in thousands) | ||||
| Balance at December 31, 2016 |
$ | — | ||
| Acquisition of HKF on January 4, 2017 |
1,160 | |||
|
|
|
|||
| Balance at December 31, 2017 |
$ | 1,160 | ||
|
|
|
|||
-85-
Table of Contents
MARLIN BUSINESS SERVICES CORP. AND SUBSIDIARIES
NOTES TO CONSOLIDATED FINANCIAL STATEMENTS
Intangible assets
The Company had no intangible assets at December 31, 2016.
During the first quarter of 2017, in connection with the acquisition of HKF, the Company acquired certain definite-lived intangible assets with a total cost of $1.3 million and a weighted average amortization period of 8.7 years. The Company had no indefinite-lived intangible assets at December 31, 2017.
The following table presents details of the Company’s intangible assets as of December 31, 2017:
| Description |
Useful Life | Cost | Accumulated Amortization |
Net Value |
||||||||||||
| (Dollars in thousands) | ||||||||||||||||
| Lender relationships |
3 years | $ | 360 | $ | 120 | $ | 240 | |||||||||
| Vendor relationships |
11 years | 920 | 84 | 836 | ||||||||||||
| Corporate trade name |
7 years | 60 | 8 | 52 | ||||||||||||
|
|
|
|
|
|
|
|||||||||||
| $ | 1,340 | $ | 212 | $ | 1,128 | |||||||||||
|
|
|
|
|
|
|
|||||||||||
There was no impairment of these assets in 2017. Amortization related to the Company’s definite lived intangible assets was $0.2 million for the twelve-month period ended December 31, 2017. The Company expects the amortization expense for the next five years will be as follows:
| Amortization Expense |
||||
| (Dollars in thousands) |
||||
| 2018 |
$ | 212 | ||
| 2019 |
212 | |||
| 2020 |
92 | |||
| 2021 |
92 | |||
| 2022 |
92 | |||
NOTE 8 — Property and Equipment, Net
Property and equipment, net consist of the following:
| December 31, | ||||||||||||
| 2017 | 2016 | Depreciable Life | ||||||||||
| (Dollars in thousands) | ||||||||||||
| Furniture and equipment |
$ | 2,859 | $ | 2,831 | 7 years | |||||||
| Computer systems and equipment |
15,619 | 13,804 | 3-5 years | |||||||||
| Leasehold improvements |
1,194 | 1,194 | |
Shorter of estimated useful life or remaining lease term |
| |||||||
|
|
|
|
|
|||||||||
| Total property and equipment |
19,672 | 17,829 | ||||||||||
| Less — Accumulated depreciation and amortization |
(15,468 | ) | (14,334 | ) | ||||||||
|
|
|
|
|
|||||||||
| Property and equipment, net |
$ | 4,204 | $ | 3,495 | ||||||||
|
|
|
|
|
|||||||||
Depreciation and amortization expense was $1.5 million, $1.3 million and $1.2 million for each of the years ended December 31, 2017, 2016 and 2015, respectively.
-86-
Table of Contents
MARLIN BUSINESS SERVICES CORP. AND SUBSIDIARIES
NOTES TO CONSOLIDATED FINANCIAL STATEMENTS
NOTE 9 — Other Assets
Other assets are comprised of the following:
| December 31, | ||||||||
| 2017 | 2016 | |||||||
| (Dollars in thousands) | ||||||||
| Accrued fees receivable |
$ | 3,052 | $ | 2,762 | ||||
| Prepaid expenses |
2,026 | 2,201 | ||||||
| Income taxes receivable (See Note 13 for further discussion) |
13,306 | — | ||||||
| Federal Reserve bank stock |
1,711 | 1,711 | ||||||
| Other |
6,072 | 2,734 | ||||||
|
|
|
|
|
|||||
| $ | 26,167 | $ | 9,408 | |||||
|
|
|
|
|
|||||
NOTE 10 — Commitments and Contingencies
MBB is a member bank in a non-profit, multi-financial institution Community Development Financial Institution (“CDFI”) organization. The CDFI serves as a catalyst for community development by offering flexible financing for affordable, quality housing to low- and moderate-income residents, helping the Bank meet its CRA obligations. Currently, MBB receives approximately 1.2% participation in each funded loan which is collateral for the loan issued to the CDFI under the program. MBB records loans in its financial statements when they have been funded or become payable. Such loans help MBB satisfy its obligations under the Community Reinvestment Act of 1977. At December 31, 2017 and 2016, MBB had an unfunded commitment of $0.8 million and $0.9 million, respectively, for this activity. Unless renewed prior to termination, MBB’s membership in the consortium will expire in September 2018.
The Company is involved in legal proceedings, which include claims, litigation and suits arising in the ordinary course of business. In the opinion of management, these actions will not have a material effect on the Company’s consolidated balance sheet, statement of operations or cash flows.
Banking institutions are subject to periodic reviews and examinations from banking regulators. In the first quarter of 2017, one of MBB’s regulatory agencies communicated preliminary findings in connection with the timing of certain aspects of payment application process in effect prior to February 2016 related to the assessment of late fees. The Company believes that the resolution of this matter will require the Company to pay restitution to customers. The Company estimated such restitution at $4.2 million, which was expensed and related liability was recorded in the first quarter of 2017. However, the ultimate resolution of this matter could be materially different from the current estimate, including with respect to the timing, the exact amount of any required restitution or the possible imposition of any fines and penalties.
As of December 31, 2017, the Company leases all eight of its office locations including its executive offices in Mt. Laurel, New Jersey, and its offices in or near Atlanta, Georgia; Salt Lake City, Utah; Portsmouth, New Hampshire; Highlands Ranch, Colorado; Denver, Colorado; Plymouth, Michigan; and Philadelphia, Pennsylvania. These lease commitments are accounted for as operating leases. The Company has entered into several capital leases to finance corporate property and equipment.
-87-
Table of Contents
MARLIN BUSINESS SERVICES CORP. AND SUBSIDIARIES
NOTES TO CONSOLIDATED FINANCIAL STATEMENTS
The following is a schedule of future minimum lease payments for capital and operating leases as of December 31, 2017:
| Future Minimum Lease Payment Obligations | ||||||||||||
| Period Ending December 31, |
Capital Leases |
Operating Leases |
Total | |||||||||
| (Dollars in thousands) | ||||||||||||
| 2018 |
$ | 112 | $ | 1,596 | $ | 1,708 | ||||||
| 2019 |
112 | 1,527 | 1,639 | |||||||||
| 2020 |
112 | 687 | 799 | |||||||||
| 2021 |
65 | — | 65 | |||||||||
| 2022 |
— | — | — | |||||||||
|
|
|
|
|
|
|
|||||||
| Total minimum lease payments |
$ | 401 | $ | 3,810 | $ | 4,111 | ||||||
|
|
|
|
|
|||||||||
| Less: amount representing interest |
(16 | ) | ||||||||||
|
|
|
|||||||||||
| Present value of minimum lease payments |
$ | 385 | ||||||||||
|
|
|
|||||||||||
Rent expense was $1.1 million for each of the years ended December 31, 2017, 2016, and 2015.
NOTE 11 — Deposits
MBB serves as the Company’s primary funding source. MBB issues fixed-rate FDIC-insured certificates of deposit raised nationally through various brokered deposit relationships and fixed-rate FDIC-insured deposits received from direct sources. MBB offers FDIC-insured money market deposit accounts (the “MMDA Product”) through participation in a partner bank’s insured savings account product. This brokered deposit product has a variable rate, no maturity date and is offered to the clients of the partner bank and recorded as a single deposit account at MBB. As of December 31, 2017, money market deposit accounts totaled $38.6 million.
As of December 31, 2017, the remaining scheduled maturities of certificates of deposits are as follows:
| Scheduled Maturities | ||||
| (Dollars in thousands) | ||||
| Period Ending December 31, |
||||
| 2018 |
$ | 334,366 | ||
| 2019 |
215,867 | |||
| 2020 |
120,966 | |||
| 2021 |
71,424 | |||
| 2022 |
28,087 | |||
|
|
|
|||
| $ | 770,710 | |||
|
|
|
|||
Certificates of deposits issued by MBB are time deposits and are generally issued in denominations of $250,000 or less. The MMDA Product is also issued to customers in amounts less than $250,000. The FDIC insures deposits up to $250,000 per depositor. The weighted average all-in interest rate of deposits outstanding at December 31, 2017 was 1.60%.
-88-
Table of Contents
MARLIN BUSINESS SERVICES CORP. AND SUBSIDIARIES
NOTES TO CONSOLIDATED FINANCIAL STATEMENTS
NOTE 12 — Fair Value Measurements and Disclosures about the Fair Value of Financial Instruments
Fair Value Measurements
The Fair Value Measurements and Disclosures Topic of the FASB ASC establishes a framework for measuring fair value and requires certain disclosures about fair value measurements. Its provisions do not apply to fair value measurements for purposes of lease classification and measurement, which is addressed in the Leases Topic of the FASB ASC.
Fair value is defined in GAAP as the price that would be received to sell an asset or the price that would be paid to transfer a liability on the measurement date. GAAP focuses on the exit price in the principal or most advantageous market for the asset or liability in an orderly transaction between market participants. A three-level valuation hierarchy is required for disclosure of fair value measurements based upon the transparency of inputs to the valuation of an asset or liability as of the measurement date. The fair value hierarchy gives the highest priority to quoted prices (unadjusted) in active markets for identical assets or liabilities (Level 1) and the lowest priority to unobservable inputs (Level 3). The level in the fair value hierarchy within which the fair value measurement in its entirety falls is determined based on the lowest level input that is significant to the measurement in its entirety.
The three levels are defined as follows:
| • | Level 1 — Inputs to the valuation are unadjusted quoted prices in active markets for identical assets or liabilities. |
| • | Level 2 — Inputs to the valuation may include quoted prices for similar assets and liabilities in active or inactive markets, and inputs other than quoted prices, such as interest rates and yield curves, which are observable for the asset or liability for substantially the full term of the financial instrument. |
| • | Level 3 — Inputs to the valuation are unobservable and significant to the fair value measurement. Level 3 inputs shall be used to measure fair value only to the extent that observable inputs are not available. |
The Company characterizes active markets as those where transaction volumes are sufficient to provide objective pricing information, such as an exchange traded price. Inactive markets are typically characterized by low transaction volumes, and price quotations that vary substantially among market participants or are not based on current information.
The Company’s balances measured at fair value on a recurring basis include the following as of December 31, 2017 and 2016:
| December 31, 2017 | December 31, 2016 | |||||||||||||||
| Fair Value Measurements Using |
Fair Value Measurements Using |
|||||||||||||||
| Level 1 | Level 2 | Level 1 | Level 2 | |||||||||||||
| (Dollars in thousands) | ||||||||||||||||
| Assets |
||||||||||||||||
| ABS |
— | 5,705 | — | — | ||||||||||||
| Municipal securities |
$ | — | $ | 2,402 | $ | — | $ | 2,528 | ||||||||
| Mutual fund |
$ | 3,426 | $ | — | $ | 3,352 | $ | — | ||||||||
At this time, the Company has not elected to report any assets and liabilities using the fair value option available under the Financial Instruments Topic of the FASB ASC. There have been no transfers between Level 1 and Level 2 of the fair value hierarchy.
-89-
Table of Contents
MARLIN BUSINESS SERVICES CORP. AND SUBSIDIARIES
NOTES TO CONSOLIDATED FINANCIAL STATEMENTS
Disclosures about the Fair Value of Financial Instruments
The Financial Instruments Topic of the FASB ASC requires the disclosure of the estimated fair value of financial instruments including those financial instruments not measured at fair value on a recurring basis. This requirement excludes certain instruments, such as the net investment in leases and all nonfinancial instruments.
The fair values shown below have been derived, in part, by management’s assumptions, the estimated amount and timing of future cash flows and estimated discount rates. Valuation techniques involve uncertainties and require assumptions and judgments regarding prepayments, credit risk and discount rates. Changes in these assumptions will result in different valuation estimates. The fair values presented would not necessarily be realized in an immediate sale. Derived fair value estimates cannot necessarily be substantiated by comparison to independent markets or to other companies’ fair value information.
The following summarizes the carrying amount and estimated fair value of the Company’s financial instruments:
| December 31, 2017 | December 31, 2016 | |||||||||||||||
| Carrying Amount |
Fair Value | Carrying Amount |
Fair Value | |||||||||||||
| (Dollars in thousands) | ||||||||||||||||
| Assets |
||||||||||||||||
| Cash and cash equivalents |
$ | 67,146 | $ | 67,146 | $ | 61,757 | $ | 61,757 | ||||||||
| Time deposits with banks |
8,110 | 7,843 | 9,605 | 9,614 | ||||||||||||
| Loans, net of allowance |
370,865 | 358,089 | 221,690 | 215,843 | ||||||||||||
| Federal Reserve Bank stock |
1,711 | 1,711 | 1,711 | 1,711 | ||||||||||||
| Servicing Rights |
2,518 | 2,554 | — | — | ||||||||||||
| Liabilities |
||||||||||||||||
| Deposits |
$ | 809,315 | $ | 803,470 | $ | 697,357 | $ | 694,721 | ||||||||
The paragraphs which follow describe the methods and assumptions used in estimating the fair values of financial instruments.
Cash and Cash Equivalents
The carrying amounts of the Company’s cash and cash equivalents approximate fair value as of December 31, 2017 and December 31, 2016, because they bear interest at market rates and had maturities of less than 90 days at the time of purchase. This fair value measurement is classified as Level 1.
Time Deposits with Banks
Fair value of time deposits is estimated by discounting cash flows of current rates paid by market participants for similar time deposits of the same or similar remaining maturities. This fair value measurement is classified as Level 2.
Securities Available for Sale
Securities available for sale are recorded at fair value on a recurring basis. Fair value measurement is based upon various sources of market pricing. Securities are classified within the fair value hierarchy after giving consideration to the activity level in the market for the security type and the observability of the inputs used to determine the fair value. When available, the Company uses quoted prices in active markets and classifies such instruments within Level 1 of the fair value hierarchy. Level 1 securities include mutual funds. When instruments are traded in secondary markets and quoted market prices do not exist for such securities, the Company relies on
-90-
Table of Contents
MARLIN BUSINESS SERVICES CORP. AND SUBSIDIARIES
NOTES TO CONSOLIDATED FINANCIAL STATEMENTS
prices obtained from third-party pricing vendors and classifies these instruments within Level 2 of the fair value hierarchy. The third- party vendors use a variety of methods when pricing securities that incorporate relevant market data to arrive at an estimate of what a buyer in the marketplace would pay for a security under current market conditions. Level 2 securities include municipal bonds.
Loans
The loan balances are comprised of three types of loans. Loans made as a member bank in a non-profit, multi-financial institution CDFI serve as a catalyst for community development by offering financing for affordable, quality housing to low- and moderate-income residents. Such loans help MBB satisfy its obligations under the Community Reinvestment Act of 1977. The fair value of these loans approximates the carrying amount at December 31, 2017 and December 31, 2016 as it is based on recent comparable sales transactions with consideration of current market rates. This fair value measurement is classified as Level 2. The Company also invests in a small business loan product tailored to the small business market. Fair value for these loans is estimated by discounting cash flows at an imputed market rate for similar loan products with similar characteristics. This fair value measurement is classified as Level 2. The Company also invests in Equipment Finance loans. These loans may be secured by equipment being acquired, blanket liens on personal property, or specific equipment already owned by the customer. The fair value of loans is estimated by discounting the future cash flows using the current rate at which similar loans would be made to borrowers with similar credit, collateral, and for the same remaining maturities. This fair value measurement is classified as Level 2.
Federal Reserve Bank Stock
Federal Reserve Bank Stock is comprised of non-marketable equity securities that are reported at their redeemable carrying amounts, which approximate the fair value. This fair value measurement is classified as Level 1.
Servicing Rights
Fair value is based on market prices for comparable service rights contracts, when available, or alternatively, is based on a valuation model that calculates the present value of estimated future net servicing income. This fair value measurement is classified as Level 2.
Deposits
Deposit liabilities with no defined maturity such as MMDA deposits have a fair value equal to the amount payable on demand at the reporting date (i.e., their carrying amount). Fair value for certificates of deposits is estimated by discounting cash flows at current rates paid by the Company for similar certificates of deposit of the same or similar remaining maturities. This fair value measurement is classified as Level 2.
-91-
Table of Contents
MARLIN BUSINESS SERVICES CORP. AND SUBSIDIARIES
NOTES TO CONSOLIDATED FINANCIAL STATEMENTS
NOTE 13 — Income Taxes
The Company’s income tax provision consisted of the following components:
| Year Ended December 31, | ||||||||||||
| 2017 | 2016 | 2015 | ||||||||||
| (Dollars in thousands) | ||||||||||||
| Current: |
||||||||||||
| Federal |
$ | (4,591 | ) | $ | 11,073 | $ | 7,983 | |||||
| State |
1,419 | 1,722 | 1,582 | |||||||||
|
|
|
|
|
|
|
|||||||
| Total current |
(3,172 | ) | 12,795 | 9,565 | ||||||||
|
|
|
|
|
|
|
|||||||
| Deferred |
||||||||||||
| Federal |
986 | (1,742 | ) | 475 | ||||||||
| State |
530 | (34 | ) | (778 | ) | |||||||
|
|
|
|
|
|
|
|||||||
| Total deferred |
1,516 | (1,776 | ) | (303 | ) | |||||||
|
|
|
|
|
|
|
|||||||
| Total income tax expense (benefit) |
$ | (1,656 | ) | $ | 11,019 | $ | 9,262 | |||||
|
|
|
|
|
|
|
|||||||
In accordance with U.S. GAAP, uncertain tax positions taken or expected to be taken in a tax return are subject to potential financial statement recognition based on prescribed recognition and measurement criteria. Based on our evaluation, there are no unrecognized tax benefits, and we did not have any accrued interest and penalties as of December 31, 2017 and 2016 and for the years ended December 31, 2017, 2016, and 2015. We do not expect our unrecognized tax positions to change significantly over the next 12 months.
The periods subject to examination for the Company’s federal return include the 2014 tax year to the present. The Company files state income tax returns in various states which may have different statutes of limitations. Generally, state income tax returns for the years 2014 through the present are subject to examination. No material income tax interest or penalties were incurred for the years ended December 31, 2017, 2016 or 2015.
Deferred income tax expense results principally from the use of different revenue and expense recognition methods for tax and financial accounting purposes, primarily related to lease accounting. The Company estimates these differences and adjusts to actual upon preparation of the income tax returns.
On December 22, 2017, the U.S. government enacted comprehensive tax legislation commonly referred to as the TCJA. The TCJA makes broad and complex changes to the U.S. tax code, including, but not limited to, reducing the U.S. federal corporate tax rate from 35 percent to 21 percent, effective January 1, 2018. Consequently, we have recorded a decrease related to deferred tax assets and deferred tax liabilities of $4.5 million and $14.7 million, respectively, with a corresponding net adjustment to deferred income tax benefit of $10.2 million for the year ended December 31, 2017. The Company will continue to analyze the TCJA as additional information becomes available to determine the full effects the new law has on its financial statements.
While we have substantially completed our provisional analysis of the income tax effects of the TCJA and recorded a reasonable estimate of such effects, the net one-time charge related to the TCJA may differ, possibly materially, due to, among other things, further refinement of our calculations, changes in interpretations and assumptions that we have made, additional guidance that may be issued by the U.S. Government, actions and related accounting policy decisions we may take as a result of the TCJA. We will complete our analysis over a one-year measurement period ending December 22, 2018, and any adjustments during this measurement period will be included in net earnings from continuing operations as an adjustment to income tax expense in the reporting period when such adjustments are determined.
-92-
Table of Contents
MARLIN BUSINESS SERVICES CORP. AND SUBSIDIARIES
NOTES TO CONSOLIDATED FINANCIAL STATEMENTS
The sources of these temporary differences and the related tax effects were as follows:
| December 31, | ||||||||
| 2017 | 2016 | |||||||
| (Dollars in thousands) | ||||||||
| Deferred income tax assets: |
||||||||
| Allowance for credit losses |
$ | 4,143 | $ | 4,656 | ||||
| Accrued expenses |
1,977 | 1,109 | ||||||
| Deferred income |
1,548 | 2,027 | ||||||
| Deferred compensation |
945 | 1,072 | ||||||
| Other comprehensive income |
60 | 86 | ||||||
| Other |
399 | 354 | ||||||
|
|
|
|
|
|||||
| Total deferred income tax assets |
9,072 | 9,304 | ||||||
|
|
|
|
|
|||||
| Deferred income tax liabilities: |
||||||||
| Lease accounting |
(23,077 | ) | (21,049 | ) | ||||
| Deferred acquisition costs |
(2,338 | ) | (3,113 | ) | ||||
| Depreciation |
(398 | ) | (259 | ) | ||||
|
|
|
|
|
|||||
| Total deferred income tax liabilities |
(25,813 | ) | (24,421 | ) | ||||
|
|
|
|
|
|||||
| Net deferred income tax liability |
$ | (16,741 | ) | $ | (15,117 | ) | ||
|
|
|
|
|
|||||
The company has a gross state income tax net operating loss carryforward in that amount of $6.7 million and $8.0 million for years ending December 31, 2017 and December 31, 2016, respectively. Most of these net operating loss carryforwards are set to expire between 2028 and 2034. The deferred tax asset related to this carryforward item, net of federal benefit, is included in “Other deferred income tax assets.”
The following is a reconciliation of the statutory federal income tax rate to the effective income tax rate:
| Year Ended December 31, | ||||||||||||
| 2017 | 2016 | 2015 | ||||||||||
| Statutory federal income tax rate |
35.0 | % | 35.0 | % | 35.0 | % | ||||||
| State taxes, net of federal benefit |
2.7 | % | 4.1 | % | 3.2 | % | ||||||
| Other permanent differences |
(0.1 | )% | (0.3 | )% | (0.6 | )% | ||||||
| Excess stock based compensation |
(1.5 | )% | — | % | — | % | ||||||
| Tax benefit due to TCJA |
(43.4 | )% | — | % | — | % | ||||||
| Other |
0.3 | % | 0.1 | % | (0.9 | )% | ||||||
|
|
|
|
|
|
|
|||||||
| Effective rate |
(7.0 | )% | 38.9 | % | 36.7 | % | ||||||
|
|
|
|
|
|
|
|||||||
NOTE 14 — Earnings Per Share
The Company’s restricted stock awards are paid non-forfeitable common stock dividends and thus meet the criteria of participating securities. Accordingly, earnings per share (“EPS”) has been calculated using the two-class method, under which earnings are allocated to both common stock and participating securities.
Basic EPS has been computed by dividing net income allocated to common stock by the weighted average common shares used in computing basic EPS. For the computation of basic EPS, all shares of restricted stock have been deducted from the weighted average shares outstanding.
-93-
Table of Contents
MARLIN BUSINESS SERVICES CORP. AND SUBSIDIARIES
NOTES TO CONSOLIDATED FINANCIAL STATEMENTS
Diluted EPS has been computed by dividing net income allocated to common stock by the weighted average number of common shares used in computing basic EPS, further adjusted by including the dilutive impact of the exercise or conversion of common stock equivalents, such as stock options, into shares of common stock as if those securities were exercised or converted.
The following table provides net income and shares used in computing basic and diluted EPS:
| Year Ended December 31, | ||||||||||||
| 2017 | 2016 | 2015 | ||||||||||
| (Dollars in thousands, except per-share data) | ||||||||||||
| Basic EPS |
||||||||||||
| Net income |
$ | 25,292 | $ | 17,279 | $ | 15,966 | ||||||
| Less: net income allocated to participating securities |
(628 | ) | (518 | ) | (465 | ) | ||||||
|
|
|
|
|
|
|
|||||||
| Net income allocated to common stock |
$ | 24,664 | $ | 16,761 | $ | 15,501 | ||||||
|
|
|
|
|
|
|
|||||||
| Weighted average common shares outstanding |
12,528,195 | 12,521,962 | 12,722,234 | |||||||||
| Less: Unvested restricted stock awards considered participating securities |
(312,175 | ) | (380,367 | ) | (357,361 | ) | ||||||
|
|
|
|
|
|
|
|||||||
| Adjusted weighted average common shares used in computing basic EPS |
12,216,020 | 12,141,595 | 12,364,873 | |||||||||
|
|
|
|
|
|
|
|||||||
| Basic EPS |
$ | 2.02 | $ | 1.38 | $ | 1.25 | ||||||
|
|
|
|
|
|
|
|||||||
| Diluted EPS |
||||||||||||
| Net income allocated to common stock |
$ | 24,664 | $ | 16,761 | $ | 15,501 | ||||||
|
|
|
|
|
|
|
|||||||
| Adjusted weighted average common shares used in computing basic EPS |
12,216,020 | 12,141,595 | 12,364,873 | |||||||||
| Add: Effect of dilutive stock options |
33,603 | 9,102 | 16,679 | |||||||||
|
|
|
|
|
|
|
|||||||
| Adjusted weighted average common shares used in computing diluted EPS |
12,249,623 | 12,150,697 | 12,381,552 | |||||||||
|
|
|
|
|
|
|
|||||||
| Diluted EPS |
$ | 2.01 | $ | 1.38 | $ | 1.25 | ||||||
|
|
|
|
|
|
|
|||||||
For the years ended December 31, 2017, 2016 and 2015, outstanding stock-based compensation awards in the amount of 101,157, 37,333 and 5,203, respectively, were considered antidilutive and therefore were not considered in the computation of potential common shares for purposes of diluted EPS.
NOTE 15 — Stockholders’ Equity
Stockholders’ Equity
On July 29, 2014, the Company’s Board of Directors approved the 2014 Repurchase Plan, under which, the Company was authorized to repurchase up to $15 million in value of its outstanding shares of common stock. On May 30, 2017, the Company’s Board of Directors approved the 2017 Repurchase Plan to replace the 2014 Repurchase Plan. Under the 2017 Repurchase Plan, the Company is authorized to repurchase up to $10 million in value of its outstanding shares of common stock. This authority may be exercised from time to time and in such amounts as market conditions warrant. Any shares purchased under this plan are returned to the status of authorized but unissued shares of common stock. The repurchases may be made on the open market or in block trades. The program may be suspended or discontinued at any time. The repurchases are funded using the Company’s working capital.
-94-
Table of Contents
MARLIN BUSINESS SERVICES CORP. AND SUBSIDIARIES
NOTES TO CONSOLIDATED FINANCIAL STATEMENTS
During the year ended December 31, 2017, the Company purchased 87,210 shares of its common stock in the open market under the 2017 Repurchase Plan at an average cost of $24.05 per share and 58,914 shares of its common stock under the 2014 Repurchase Plan at an average cost of $25.09 per share. During the year ended December 31, 2016, the Company did not repurchase any of its common stock under the 2014 Repurchase Plan in the open market. The Company purchased 594,760 shares of its common stock in the open market under the 2014 Repurchase Plan at an average cost of $17.09 per share during the year ended December 31, 2015. At December 31, 2017, the Company had $ 7.9 million remaining in the 2017 Repurchase Plan.
In addition to the repurchases described above, participants in the Company’s 2003 Equity Compensation Plan, as amended (the “2003 Plan”) and the Company’s 2014 Equity Compensation Plan (approved by the Company’s shareholders on June 3, 2014) (the “2014 Plan” and, together with the 2003 Plan, the “Equity Plans”) may have shares withheld to cover income taxes. There were 38,139, 23,409 and 65,143 shares repurchased to cover income tax withholding in connection with shares granted under the Equity Plans during the years ended December 31, 2017, 2016 and 2015, respectively, at average per-share costs of $24.27, $14.73 and $17.74, respectively.
Regulatory Capital Requirements
Through its issuance of FDIC-insured deposits, MBB serves as the Company’s primary funding source. Over time, MBB may offer other products and services to the Company’s customer base. MBB operates as a Utah state-chartered, Federal Reserve member commercial bank, insured by the FDIC. As a state-chartered Federal Reserve member bank, MBB is supervised by both the Federal Reserve Bank of San Francisco and the Utah Department of Financial Institutions.
The Company and MBB are subject to capital adequacy regulations issued jointly by the federal bank regulatory agencies. These risk-based capital and leverage guidelines make regulatory capital requirements more sensitive to differences in risk profiles among banking organizations and consider off-balance sheet exposures in determining capital adequacy. The federal bank regulatory agencies and/or the U.S. Congress may determine to increase capital requirements in the future due to the current economic environment. Under the capital adequacy regulation, at least half of a banking organization’s total capital is required to be “Tier 1 Capital” as defined in the regulations, comprised of common equity, retained earnings and a limited amount of non-cumulative perpetual preferred stock. The remaining capital, “Tier 2 Capital,” as defined in the regulations, may consist of other preferred stock, a limited amount of term subordinated debt or a limited amount of the reserve for possible credit losses. The regulations establish minimum leverage ratios for banking organizations, which are calculated by dividing Tier 1 Capital by total quarterly average assets. Recognizing that the risk-based capital standards principally address credit risk rather than interest rate, liquidity, operational or other risks, many banking organizations are expected to maintain capital in excess of the minimum standards.
The Company and MBB operate under the Basel III rules. These standards require a minimum for Tier 1 leverage ratio of 4%, minimum Tier 1 risk-based ratio of 6%, and a total risk-based capital ratio of 8%. The Basel III adequacy standards established a new common equity Tier 1 risk-based capital ratio with a required 4.5% minimum (6.5% to be considered well-capitalized). The Company is required to have a level of regulatory capital in excess of the regulatory minimum and to have a capital buffer above 1.25% for 2017, 1.875% for 2018, and 2.5% for 2019 and thereafter. If a banking organization does not maintain capital above the minimum plus the capital conservation buffer it may be subject to restrictions on dividends, share buybacks, and certain discretionary payments such as bonus payments.
The Company plans to provide the necessary capital to maintain MBB at “well-capitalized” status as defined by banking regulations and as required by an agreement entered into by and among MBB, MLC, Marlin Business
-95-
Table of Contents
MARLIN BUSINESS SERVICES CORP. AND SUBSIDIARIES
NOTES TO CONSOLIDATED FINANCIAL STATEMENTS
Services Corp. and the FDIC in conjunction with the opening of MBB (the “FDIC Agreement”). MBB’s Tier 1 Capital balance at December 31, 2017 was $145.3 million, which met all capital requirements to which MBB is subject and qualified MBB for “well-capitalized” status. At December 31, 2017, the Company also exceeded its regulatory capital requirements and was considered “well-capitalized” as defined by federal banking regulations and as required by the FDIC Agreement.
The following table sets forth the Tier 1 leverage ratio, common equity Tier 1 risk-based capital ratio, Tier 1 risk-based capital ratio and total risk-based capital ratio for Marlin Business Services Corp. and MBB at December 31, 2017.
| Actual | Minimum Capital Requirement |
Well-Capitalized Capital Requirement |
||||||||||||||||||||||
| Ratio | Amount | Ratio(1) | Amount | Ratio | Amount | |||||||||||||||||||
| (Dollars in thousands) | ||||||||||||||||||||||||
| Tier 1 Leverage Capital |
||||||||||||||||||||||||
| Marlin Business Services Corp. |
17.25 | % | $ | 177,605 | 4 | % | $ | 41,175 | 5 | % | $ | 51,468 | ||||||||||||
| Marlin Business Bank |
14.81 | % | $ | 145,269 | 5 | % | $ | 49,058 | 5 | % | $ | 49,058 | ||||||||||||
| Common Equity Tier 1 Risk-Based Capital |
||||||||||||||||||||||||
| Marlin Business Services Corp. |
18.22 | % | $ | 177,605 | 4.5 | % | $ | 43,877 | 6.5 | % | $ | 63,378 | ||||||||||||
| Marlin Business Bank |
15.21 | % | $ | 145,269 | 6.5 | % | $ | 62,088 | 6.5 | % | $ | 62,088 | ||||||||||||
| Tier 1 Risk-based Capital |
||||||||||||||||||||||||
| Marlin Business Services Corp. |
18.22 | % | $ | 177,605 | 6 | % | $ | 58,503 | 8 | % | $ | 78,003 | ||||||||||||
| Marlin Business Bank |
15.21 | % | $ | 145,269 | 8 | % | $ | 76,416 | 8 | % | $ | 76,416 | ||||||||||||
| Total Risk-based Capital |
||||||||||||||||||||||||
| Marlin Business Services Corp. |
19.47 | % | $ | 189,826 | 8 | % | $ | 78,003 | 10 | % | $ | 97,504 | ||||||||||||
| Marlin Business Bank |
16.46 | % | $ | 157,244 | 15 | % | $ | 143,280 | 10 | %(1) | $ | 95,520 | ||||||||||||
| (1) | MBB is required to maintain “well-capitalized” status and must also maintain a total risk-based capital ratio greater than 15% pursuant to the FDIC Agreement. |
Prompt Corrective Action. The Federal Deposit Insurance Corporation Improvement Act of 1991 (“FDICIA”) requires the federal regulators to take prompt corrective action against any undercapitalized institution. Five capital categories have been established under federal banking regulations: well-capitalized, adequately capitalized, undercapitalized, significantly undercapitalized and critically undercapitalized. Well-capitalized institutions significantly exceed the required minimum level for each relevant capital measure. Adequately capitalized institutions include depository institutions that meet but do not significantly exceed the required minimum level for each relevant capital measure. Undercapitalized institutions consist of those that fail to meet the required minimum level for one or more relevant capital measures. Significantly undercapitalized characterizes depository institutions with capital levels significantly below the minimum requirements for any relevant capital measure. Critically undercapitalized refers to depository institutions with minimal capital and at serious risk for government seizure.
Under certain circumstances, a well-capitalized, adequately capitalized or undercapitalized institution may be treated as if the institution were in the next lower capital category. A depository institution is generally prohibited from making capital distributions, including paying dividends, or paying management fees to a holding company if the institution would thereafter be undercapitalized. Institutions that are adequately capitalized but not well-capitalized cannot accept, renew or roll over brokered deposits except with a waiver from the FDIC and are subject to restrictions on the interest rates that can be paid on such deposits. Undercapitalized institutions may not accept, renew or roll over brokered deposits.
-96-
Table of Contents
MARLIN BUSINESS SERVICES CORP. AND SUBSIDIARIES
NOTES TO CONSOLIDATED FINANCIAL STATEMENTS
The federal bank regulatory agencies are permitted or, in certain cases, required to take certain actions with respect to institutions falling within one of the three undercapitalized categories. Depending on the level of an institution’s capital, the agency’s corrective powers include, among other things:
| • | prohibiting the payment of principal and interest on subordinated debt; |
| • | prohibiting the holding company from making distributions without prior regulatory approval; |
| • | placing limits on asset growth and restrictions on activities; |
| • | placing additional restrictions on transactions with affiliates; |
| • | restricting the interest rate the institution may pay on deposits; |
| • | prohibiting the institution from accepting deposits from correspondent banks; and |
| • | in the most severe cases, appointing a conservator or receiver for the institution. |
A banking institution that is undercapitalized is required to submit a capital restoration plan, and such a plan will not be accepted unless, among other things, the banking institution’s holding company guarantees the plan up to a certain specified amount. Any such guarantee from a depository institution’s holding company is entitled to a priority of payment in bankruptcy.
Pursuant to the FDIC Agreement entered into in conjunction with the opening of MBB, MBB must keep its total risk-based capital ratio above 15%. MBB’s total risk-based capital ratio of 16.46% at December 31, 2017 exceeded the threshold for “well capitalized” status under the applicable laws and regulations, and also exceeded the 15% minimum total risk-based capital ratio required in the FDIC Agreement.
Dividends. The Federal Reserve Board has issued policy statements requiring insured banks and bank holding companies to have an established assessment process for maintaining capital commensurate with their overall risk profile. Such assessment process may affect the ability of the organizations to pay dividends. Although generally organizations may pay dividends only out of current operating earnings, dividends may be paid if the distribution is prudent relative to the organization’s financial position and risk profile, after consideration of current and prospective economic conditions.
In addition to the Company’s regular quarterly dividend, the Company’s Board of Directors declared a special cash dividend of $2.00 per share on September 14, 2015. The special dividend was paid on October 5, 2015 to shareholders of record on the close of business on September 24, 2015, which resulted in a dividend payment of approximately $25.5 million.
NOTE 16 — Stock-Based Compensation
Under the terms of the Company’s 2014 Plan, employees, certain consultants and advisors and non-employee members of the Company’s Board of Directors have the opportunity to receive incentive and nonqualified grants of stock options, stock appreciation rights, restricted stock and other equity-based awards as approved by the Company’s Board of Directors. These award programs are used to attract, retain and motivate employees and to encourage individuals in key management roles to retain stock. The Company has a policy of issuing new shares to satisfy awards under the 2014 Plan. The aggregate number of shares under the 2014 Plan that may be issued pursuant to stock options, stock units, stock awards, and other equity awards is 1,200,000 with not more than 1,000,000 of such shares shall be available for issuance as stock units, stock awards, and other equity awards. There were 472,913 shares available for future awards under the 2014 Plan as of December 31, 2017, of which 369,898 shares were available to be issued as stock units, stock awards, and other equity awards.
-97-
Table of Contents
MARLIN BUSINESS SERVICES CORP. AND SUBSIDIARIES
NOTES TO CONSOLIDATED FINANCIAL STATEMENTS
Total stock-based compensation expense was $2.8 million, $1.9 million and $2.8 million for the years ended December 31, 2017, 2016 and 2015, respectively. Excess tax benefits from stock-based payment arrangements was $0.4 million for the year ended December 31, 2017. An excess tax deficit from stock-based payment arrangements decreased cash provided by financing activities and increased cash provided by operating activities by less than $0.1 million for the year ended December 31, 2016. Excess tax benefits from stock-based payment arrangements increased cash provided by financing activities and decreased cash provided by operating activities by $0.3 million for the year ended December 31, 2015.
Stock Options
Option awards were generally granted with an exercise price equal to the market price of the Company’s stock at the date of the grant and have 7- to 10-year contractual terms. All options issued contain service conditions based on the participant’s continued service with the Company, and provide for accelerated vesting if there is a change in control as defined in the 2014 Plan. Employee stock options generally vest over four years. In previous years, the Company also issued stock options to independent directors. These options generally vest in one year.
There were 115,883 stock options granted during the year ended December 31, 2017. There were no stock options granted during the years ended 2016 and 2015.
The fair value of stock options granted during the year ended December 31, 2017 was $6.56 and was estimated on the date of grant using the Black-Scholes option pricing model using the following weighted average assumptions:
| Assumptions | ||||
| Weighted Averages: |
||||
| Risk-free interest rate |
1.82 | % | ||
| Expected life (years) |
4.50 | |||
| Expected volatility |
34.62 | % | ||
| Expected dividends |
2.17 | % | ||
The expected life for options is estimated based on their vesting and contractual terms and was determined by applying the simplified method as defined by the SEC’s Staff Accounting Bulletin No. 107 (“SAB 107”). The risk-free interest rate reflected the yield on zero-coupon Treasury securities with a term approximating the expected life of the stock options. The expected volatility was determined using historical volatilities based on historical stock prices.
-98-
Table of Contents
MARLIN BUSINESS SERVICES CORP. AND SUBSIDIARIES
NOTES TO CONSOLIDATED FINANCIAL STATEMENTS
A summary of option activity for the each of the three years in the period ended December 31, 2017 follows:
| Options |
Number of Shares |
Weighted Average Exercise Price Per Share |
||||||
| Outstanding, December 31, 2014 |
193,351 | $ | 10.23 | |||||
| Granted |
— | — | ||||||
| Exercised |
(61,937 | ) | 9.48 | |||||
| Forfeited |
(80,728 | ) | 9.64 | |||||
| Expired |
— | — | ||||||
|
|
|
|||||||
| Outstanding, December 31, 2015 |
50,686 | $ | 12.09 | |||||
| Granted |
— | — | ||||||
| Exercised |
(7,380 | ) | 10.44 | |||||
| Forfeited |
(1,666 | ) | 12.41 | |||||
| Expired |
— | — | ||||||
|
|
|
|||||||
| Outstanding, December 31, 2016 |
41,640 | $ | 12.37 | |||||
| Granted |
115,883 | 25.75 | ||||||
| Exercised |
(39,416 | ) | 12.37 | |||||
| Forfeited |
(21,122 | ) | 24.35 | |||||
| Expired |
— | — | ||||||
|
|
|
|||||||
| Outstanding, December 31, 2017 |
96,985 | $ | 25.75 | |||||
|
|
|
|||||||
During the year ended December 31, 2017, the Company recognized total compensation expense related to options of $0.2 million. During the year ended December 31, 2016 the Company did not recognize any compensation expense related to options. During the year ended December 31, 2015, the Company recognized total compensation expense related to options of $0.1 million.
There were 39,416, 7,380 and 61,937 stock options exercised during the years ended December 31, 2017, 2016 and 2015, respectively. The total pretax intrinsic value of stock options exercised was $0.4 million, $0.1 million and $0.6 million for the years ended December 31, 2017, 2016 and 2015, respectively.
The following table summarizes information about the stock options outstanding and exercisable as of December 31, 2017:
| Options Outstanding |
Options Exercisable | |||||||||||||||||||||||||||||||
| Range of Exercise Prices |
Number Outstanding |
Weighted Average Remaining Life (Years) |
Weighted Average Exercise Price |
Aggregate Intrinsic Value (In thousands) |
Number Exercisable |
Weighted Average Remaining Life (Years) |
Weighted Average Exercise Price |
Aggregate Intrinsic Value (In thousands) |
||||||||||||||||||||||||
| $25.75 |
96,985 | 6.2 | $ | 25.75 | $ | — | — | — | — | $ | — | |||||||||||||||||||||
|
|
|
|
|
|
|
|
|
|||||||||||||||||||||||||
| 96,985 | 6.2 | $ | 25.75 | $ | — | — | — | — | $ | — | ||||||||||||||||||||||
|
|
|
|
|
|
|
|
|
|||||||||||||||||||||||||
The aggregate intrinsic value in the preceding table represents the total pretax intrinsic value, based on the Company’s closing stock price of $22.40 as of December 31, 2017, which would have been received by the option holders had all option holders exercised their options as of that date.
-99-
Table of Contents
MARLIN BUSINESS SERVICES CORP. AND SUBSIDIARIES
NOTES TO CONSOLIDATED FINANCIAL STATEMENTS
As of December 31, 2017, there was $0.5 million of unrecognized compensation cost related to non-vested stock options not yet recognized in the Consolidated Statements of Operations scheduled to be recognized over a weighted average period of 1.6 years.
Restricted Stock Awards
Restricted stock awards provide that, during the applicable vesting periods, the shares awarded may not be sold or transferred by the participant. The vesting period for restricted stock awards generally ranges from three to seven years. All awards issued contain service conditions based on the participant’s continued service with the Company, and provide for accelerated vesting if there is a change in control as defined in the 2014 Plan.
The vesting of certain restricted shares may be accelerated to a minimum of three years based on achievement of various individual performance measures. Acceleration of expense for awards based on individual performance factors occurs when the achievement of the performance criteria is determined.
Of the total restricted stock awards granted during the year ended December 31, 2017, no shares may be subject to accelerated vesting based on individual performance factors; no shares have vesting contingent upon performance factors. Vesting was accelerated in 2017, 2016 and 2015 on certain awards based on the achievement of certain performance criteria determined annually, as described below.
The Company also issues restricted stock to non-employee independent directors. These shares generally vest in seven years from the grant date or six months following the director’s termination from Board of Directors service.
The following table summarizes the activity of the non-vested restricted stock during the each of the three years in the period ended December 31, 2017:
| Non-vested restricted stock |
Shares | Weighted Average Grant-Date Fair Value |
||||||
| Outstanding at December 31, 2014 |
346,036 | $ | 15.99 | |||||
| Granted |
179,162 | 16.87 | ||||||
| Vested |
(188,287 | ) | 15.41 | |||||
| Forfeited |
(23,675 | ) | 18.53 | |||||
|
|
|
|||||||
| Outstanding at December 31, 2015 |
313,236 | $ | 16.65 | |||||
| Granted |
183,506 | 15.31 | ||||||
| Vested |
(77,149 | ) | 16.11 | |||||
| Forfeited |
(23,075 | ) | 17.73 | |||||
|
|
|
|||||||
| Outstanding at December 31, 2016 |
396,518 | $ | 16.07 | |||||
| Granted |
44,758 | 25.36 | ||||||
| Vested |
(122,202 | ) | 16.19 | |||||
| Forfeited |
(41,457 | ) | 16.07 | |||||
|
|
|
|||||||
| Outstanding at December 31, 2017 |
277,617 | $ | 17.51 | |||||
|
|
|
|||||||
During the years ended December 31, 2017, 2016 and 2015, the Company granted restricted stock awards with grant date fair values totaling $1.1 million, $2.8 million and $3.0 million, respectively. The grant date fair value per share was equivalent to the Company’s closing stock price on the date of the grant.
-100-
Table of Contents
MARLIN BUSINESS SERVICES CORP. AND SUBSIDIARIES
NOTES TO CONSOLIDATED FINANCIAL STATEMENTS
As vesting occurs, or is deemed likely to occur, compensation expense is recognized over the requisite service period and additional paid-in capital is increased. The Company recognized $1.7 million, $1.9 million and $2.7 million of compensation expense related to restricted stock for the years ended December 31, 2017, 2016 and 2015, respectively.
Of the $1.7 million total compensation expense related to restricted stock for the year ended December 31, 2017, approximately $0.5 million related to accelerated vesting during the first quarter of 2017, based on the achievement of certain performance criteria determined annually. Of the $1.9 million total compensation expense related to restricted stock for the year ended December 31, 2016, approximately $0.4 million related to accelerated vesting during the first quarter of 2016, which was also based on the achievement of certain performance criteria determined annually.
As of December 31, 2017, there was $3.0 million of unrecognized compensation cost related to non-vested restricted stock compensation scheduled to be recognized over a weighted average period of 3.6 years. In the event individual performance targets are achieved, $0.5 million of the unrecognized compensation cost would accelerate to be recognized over a weighted average period of 0.6 years. In addition, certain of the awards granted may result in the issuance of 24,023 additional shares of stock if achievement of certain targets is greater than 100%. The expense related to the additional shares awarded will be dependent on the Company’s stock price when the achievement level is determined.
The fair values of shares that vested during the years ended December 31, 2017, 2016 and 2015 were $3.0 million, $1.2 million and $3.4 million, respectively.
Restricted Stock Units
Restricted stock units (“RSUs”) are granted with vesting conditions based on fulfillment of a service condition (generally three to four years from the grant date), and may also require achievement of certain operating performance criteria or achievement of certain market-based targets associated with the Company’s stock price. The market based target measurement period begins one year from the grant date and ends three years from the grant date. Expense for equity based awards with market and service conditions is recognized over the service period based on the grant-date fair value of the award.
-101-
Table of Contents
MARLIN BUSINESS SERVICES CORP. AND SUBSIDIARIES
NOTES TO CONSOLIDATED FINANCIAL STATEMENTS
The following tables summarize market restricted stock unit activity for the twelve-month period ended December 31, 2017:
| Performance-based & market-based RSUs |
Number of RSUs |
Weighted Average Grant-Date Fair Value |
||||||
| Outstanding at December 31, 2015 |
— | $ | — | |||||
| Granted |
120,000 | 9.47 | ||||||
| Forfeited |
— | — | ||||||
| Converted |
— | — | ||||||
|
|
|
|||||||
| Outstanding at December 31, 2016 |
120,000 | $ | 9.47 | |||||
| Granted |
72,180 | 24.06 | ||||||
| Forfeited |
(33,627 | ) | 14.13 | |||||
| Converted |
— | — | ||||||
|
|
|
|||||||
| Outstanding at December 31, 2017 |
158,553 | $ | 15.13 | |||||
|
|
|
|||||||
| Service-based RSUs |
||||||||
| Outstanding at December 31, 2016 |
— | $ | — | |||||
| Granted |
30,653 | 25.65 | ||||||
| Forfeited |
(4,813 | ) | 25.75 | |||||
| Converted |
— | — | ||||||
|
|
|
|||||||
| Outstanding at December 31, 2017 |
25,840 | $ | 25.63 | |||||
|
|
|
|||||||
The weighted average grant-date fair value of RSUs with market based vesting conditions granted during the twelve-month period ended December 31, 2017 was $13.32 per unit. The weighted average grant-date fair value of RSUs with market based vesting conditions granted during the twelve-month period ended December 31, 2016 was $9.47 per unit. The weighted average grant date fair value of these market based RSUs was estimated using a Monte Carlo simulation valuation model with the following assumptions:
| Year Ended December 31, | ||||||||||||
| 2017 | 2016 | 2015 | ||||||||||
| Grant date stock price |
$ | 25.75 | 18.24 | — | ||||||||
| Risk-free interest rate |
1.72 | % | 1.06 | % | — | |||||||
| Expected volatility |
33.42 | % | 35.16 | % | — | |||||||
| Dividend yield |
— | — | — | |||||||||
The risk free interest rate reflected the yield on zero coupon Treasury securities with a term approximating the expected life of the RSUs. The expected volatility was based on historical volatility of the Company’s common stock. Dividend yield was assumed at zero as the grant assumes dividends distributed during the performance period are reinvested. When valuing the grant, we have assumed a dividend yield of zero, which is mathematically equivalent to reinvesting dividends in the issuing entity.
During the years ended December 31, 2017 and 2016, the Company granted RSUs with grant-date fair values totaling $2.5 million and $1.1 million, respectively. The Company recognized $0.9 million and less than $0.1 million of compensation expense related to RSUs for the years ended December 31, 2017 and 2016, respectively. As of December 31, 2017, there was $2.8 million of unrecognized compensation cost related to RSUs scheduled to be recognized over a weighted average period of 2.2 years and based on the most probable
-102-
Table of Contents
MARLIN BUSINESS SERVICES CORP. AND SUBSIDIARIES
NOTES TO CONSOLIDATED FINANCIAL STATEMENTS
performance assumptions, would result in the conversion of 26,748 additional units into shares of common stock. In the event maximum performance targets are achieved, an additional $0.7 million of compensation cost would be recognized over a weighted average period of 2.0 years and may result in the conversion of 26,748 additional units into shares of common stock.
Employee Stock Purchase Plan
In May 2012, the Company’s shareholders approved the adoption of the Company’s 2012 Employee Stock Purchase Plan (the “2012 ESPP”). Under the terms of the 2012 ESPP, employees have the opportunity to set aside up to 10% of their compensation (subject to certain maximums) and to purchase shares of common stock during designated offering periods at a price equal to the lesser of 95% of the fair market value per share on the first day of the offering period or the fair market value per share on the purchase date. The aggregate number of shares that may be issued under the 2012 ESPP is 140,000. During the years ended 2017 and 2016, 18,890 and 16,813 shares, respectively, of common stock were sold for $0.4 million and $0.3 million, respectively, pursuant to the terms of the 2012 ESPP. As of December 31, 2017, there were 51,425 shares remaining available for issuance under the 2012 ESPP. During the year ended December 31, 2017, the Company recognized total compensation expense of $0.1 million related to the 2012 ESPP. During the years ended December 31, 2016 and December 31, 2015, the Company did not recognize any compensation expense related to the 2012 ESPP.
NOTE 17 — Employee 401(k) Plan
The Company adopted a 401(k) plan (the “401(k) Plan”) which originally became effective as of January 1, 1997. The Company’s employees are entitled to participate in the 401(k) Plan, which provides savings and investment opportunities. Employees can contribute up to the maximum annual amount allowable per Internal Revenue Service guidelines. Effective July 1, 2007, the 401(k) Plan provides for Company contributions equal to 25% of an employee’s contribution percentage up to a maximum employee contribution of 6%. The Company’s contributions to the 401(k) Plan for the years ended December 31, 2017, 2016 and 2015 were approximately $0.3 million, $0.2 million and $0.2 million, respectively.
NOTE 18 — Related Party Transactions
The Company previously obtained all of its commercial, healthcare and other insurance coverage through The Selzer Company, an insurance broker located in Warrington, Pennsylvania. Richard Dyer, the brother of Daniel P. Dyer, the Company’s former Chief Executive Officer, is the President of The Selzer Company. The Company does not have any contractual arrangement with The Selzer Group or Richard Dyer, nor does it pay either of them any direct fees. There were no insurance premiums paid to The Selzer Company during each of the years ended December 31, 2017 and December 31, 2016. Insurance premiums paid to The Selzer Company were $0.4 million for the year ended December 31, 2015.
-103-
Table of Contents
MARLIN BUSINESS SERVICES CORP. AND SUBSIDIARIES
NOTES TO CONSOLIDATED FINANCIAL STATEMENTS
NOTE 19 — Parent Company
Summarized financial information of the parent company is as follows:
Parent Company — Balance Sheet
| December 31, | ||||||||
| 2017 | 2016 | |||||||
| (Dollars in thousands, except per-share data) |
||||||||
| ASSETS |
||||||||
| Investment in and advances to subsidiaries: |
||||||||
| Bank subsidiary |
$ | 145,249 | $ | 130,636 | ||||
| Nonbank subsidiaries |
34,400 | 31,653 | ||||||
|
|
|
|
|
|||||
| Total assets |
$ | 179,649 | $ | 162,289 | ||||
|
|
|
|
|
|||||
| LIABILITIES AND STOCKHOLDERS’ EQUITY |
||||||||
| Total liabilities |
— | — | ||||||
| Stockholders’ equity: |
||||||||
| Preferred Stock, $0.01 par value; 5,000,000 shares authorized; none issued |
— | — | ||||||
| Common Stock, $0.01 par value; 75,000,000 shares authorized; 12,449,458 and 12,572,114 shares issued and outstanding at December 31, 2017 and 2016, respectively |
124 | 126 | ||||||
| Additional paid-in capital |
82,588 | 83,505 | ||||||
| Stock subscription receivable |
(2 | ) | (2 | ) | ||||
| Accumulated other comprehensive loss |
(96 | ) | (138 | ) | ||||
| Retained earnings |
97,035 | 78,798 | ||||||
|
|
|
|
|
|||||
| Total stockholders’ equity |
179,649 | 162,289 | ||||||
|
|
|
|
|
|||||
| Total liabilities and stockholders’ equity |
$ | 179,649 | $ | 162,289 | ||||
|
|
|
|
|
|||||
-104-
Table of Contents
MARLIN BUSINESS SERVICES CORP. AND SUBSIDIARIES
NOTES TO CONSOLIDATED FINANCIAL STATEMENTS
Parent Company — Income Statement
| Year Ended December 31, | ||||||||||||
| 2017 | 2016 | 2015 | ||||||||||
| (Dollars in thousands) | ||||||||||||
| Income: |
||||||||||||
| Dividends from nonbank subsidiaries |
$ | 11,556 | $ | 7,268 | $ | 43,569 | ||||||
| Dividends from bank subsidiary |
6,000 | 7,600 | 13,000 | |||||||||
|
|
|
|
|
|
|
|||||||
| Total revenue |
17,556 | 14,868 | 56,569 | |||||||||
| Total expense |
— | — | — | |||||||||
| Income before income taxes and equity in undistributed net income of subsidiaries |
17,556 | 14,868 | 56,569 | |||||||||
| Income tax (benefit) expense |
— | — | — | |||||||||
| Equity in undistributed income (loss): |
||||||||||||
| Bank subsidiary |
14,571 | 7,247 | 7,532 | |||||||||
| Nonbank subsidiaries |
(6,835 | ) | (4,836 | ) | (48,135 | ) | ||||||
|
|
|
|
|
|
|
|||||||
| Net Income |
$ | 25,292 | $ | 17,279 | $ | 15,966 | ||||||
|
|
|
|
|
|
|
|||||||
| Other comprehensive income: |
||||||||||||
| Amortization of net deferred losses on Increase (decrease) in fair value of securities available for sale |
68 | (15 | ) | (181 | ) | |||||||
| Tax effect |
(26 | ) | 6 | 69 | ||||||||
|
|
|
|
|
|
|
|||||||
| Total other comprehensive income (loss) |
42 | (9 | ) | (112 | ) | |||||||
|
|
|
|
|
|
|
|||||||
| Comprehensive income |
$ | 25,334 | $ | 17,270 | $ | 15,854 | ||||||
|
|
|
|
|
|
|
|||||||
-105-
Table of Contents
MARLIN BUSINESS SERVICES CORP. AND SUBSIDIARIES
NOTES TO CONSOLIDATED FINANCIAL STATEMENTS
Parent Company — Statement of Cash Flows
| Year Ended December 31, | ||||||||||||
| 2017 | 2016 | 2015 | ||||||||||
| (Dollars in thousands) | ||||||||||||
| Cash flows from operating activities: |
||||||||||||
| Net income |
$ | 25,292 | $ | 17,279 | $ | 15,966 | ||||||
| Adjustments to reconcile net income to net cash from operating activities: |
||||||||||||
| Equity in undistributed net (income) losses of subsidiaries |
(19,292 | ) | (9,679 | ) | (2,966 | ) | ||||||
|
|
|
|
|
|
|
|||||||
| Net cash provided by operating activities |
6,000 | 7,600 | 13,000 | |||||||||
|
|
|
|
|
|
|
|||||||
| Cash flows from investing activities: |
||||||||||||
| Capital returned from nonbank subsidiaries |
11,556 | 7,268 | 43,569 | |||||||||
| Capital contributed to subsidiaries |
(6,941 | ) | (7,952 | ) | (13,820 | ) | ||||||
|
|
|
|
|
|
|
|||||||
| Net cash provided by (used in) investing activities |
4,615 | (684 | ) | 29,749 | ||||||||
|
|
|
|
|
|
|
|||||||
| Cash flows from financing activities: |
||||||||||||
| Issuances of common stock |
356 | 259 | 234 | |||||||||
| Repurchases of common stock |
(4,501 | ) | (345 | ) | (11,320 | ) | ||||||
| Dividends paid to common stockholders |
(6,958 | ) | (6,907 | ) | (32,249 | ) | ||||||
| Exercise of stock options |
488 | 77 | 586 | |||||||||
|
|
|
|
|
|
|
|||||||
| Net cash used in financing activities |
(10,615 | ) | (6,916 | ) | (42,749 | ) | ||||||
|
|
|
|
|
|
|
|||||||
| Net increase in total cash and cash equivalents |
— | — | — | |||||||||
| Total cash and cash equivalents, beginning of period |
— | — | — | |||||||||
| Total cash and cash equivalents, end of period |
$ | — | $ | — | $ | — | ||||||
NOTE 20 — Events Subsequent to Year-End
The Company declared a dividend of $0.14 per share on February 1, 2018. The quarterly dividend, which amounted to a dividend payment of approximately $1.7 million, was paid on February 22, 2018 to shareholders of record on the close of business on February 12, 2018. It represented the Company’s twenty-sixth consecutive quarterly cash dividend. The payment of future dividends will be subject to approval by the Company’s Board of Directors.
-106-
Table of Contents
Supplementary Data
The selected unaudited quarterly financial data presented below should be read in conjunction with the Consolidated Financial Statements and related notes.
Selected Quarterly Financial Data (Unaudited)
| Fiscal Year Quarters | ||||||||||||||||
| First | Second | Third | Fourth | |||||||||||||
| (Dollars in thousands, except per-share data) | ||||||||||||||||
| Year ended December 31, 2017 |
||||||||||||||||
| Interest income |
$ | 20,531 | $ | 21,567 | $ | 22,363 | $ | 22,994 | ||||||||
| Fee income |
3,530 | 3,745 | 3,780 | 3,809 | ||||||||||||
| Interest and fee income |
24,061 | 25,312 | 26,143 | 26,803 | ||||||||||||
| Interest expense |
2,340 | 2,612 | 3,000 | 3,228 | ||||||||||||
| Provision for credit losses |
3,884 | 4,314 | 5,680 | 4,516 | ||||||||||||
| Other Income |
3,753 | 4,079 | 3,602 | 5,298 | ||||||||||||
| Income tax expense (benefit) |
489 | 2,732 | 2,049 | (6,926 | ) | |||||||||||
| Net income |
1,540 | 4,553 | 3,305 | 15,894 | ||||||||||||
| Basic earnings per share |
0.12 | 0.36 | 0.26 | 1.27 | ||||||||||||
| Diluted earnings per share |
0.12 | 0.36 | 0.26 | 1.27 | ||||||||||||
| Cash dividends declared per share |
0.14 | 0.14 | 0.14 | 0.14 | ||||||||||||
| Net investment in leases and loans |
828,840 | 862,703 | 886,430 | 914,420 | ||||||||||||
| Total assets |
944,492 | 985,082 | 1,013,017 | 1,040,160 | ||||||||||||
| Year ended December 31, 2016 |
||||||||||||||||
| Interest income |
$ | 17,531 | $ | 18,187 | $ | 18,803 | $ | 20,188 | ||||||||
| Fee income |
3,834 | 3,969 | 3,944 | 3,796 | ||||||||||||
| Interest and fee income |
21,365 | 22,156 | 22,747 | 23,984 | ||||||||||||
| Interest expense |
1,692 | 1,857 | 2,055 | 2,174 | ||||||||||||
| Provision for credit losses |
3,075 | 2,668 | 3,137 | 3,534 | ||||||||||||
| Other Income |
2,077 | 2,063 | 2,632 | 2,986 | ||||||||||||
| Income tax expense |
2,325 | 2,752 | 3,028 | 2,914 | ||||||||||||
| Net income |
3,651 | 4,468 | 4,345 | 4,815 | ||||||||||||
| Basic earnings per share |
0.29 | 0.36 | 0.35 | 0.38 | ||||||||||||
| Diluted earnings per share |
0.29 | 0.36 | 0.35 | 0.38 | ||||||||||||
| Cash dividends declared per share |
0.14 | 0.14 | 0.14 | 0.14 | ||||||||||||
| Net investment in leases and loans |
702,126 | 703,750 | 759,422 | 796,717 | ||||||||||||
| Total assets |
801,106 | 841,791 | 869,001 | 892,158 | ||||||||||||
-107-
Table of Contents
| Item 9. | Changes in and Disagreements with Accountants on Accounting and Financial Disclosure |
None.
| Item 9A. | Controls and Procedures |
Disclosure Controls and Procedures — The Company maintains disclosure controls and procedures that are designed to ensure that information required to be disclosed in the Company’s reports under the Securities Exchange Act of 1934, as amended (the “1934 Act”) is recorded, processed, summarized and reported within the time periods specified in the Securities and Exchange Commission’s rules and forms, and that such information is accumulated and communicated to management, including the Company’s Chief Executive Officer and Chief Financial Officer, as appropriate, to allow timely decisions regarding required disclosure.
In connection with the preparation of this Annual Report on Form 10-K, as of December 31, 2017, we updated our evaluation of the effectiveness of the design and operation of our disclosure controls and procedures for purposes of filing reports under the 1934 Act. This controls evaluation was done under the supervision and with the participation of management, including our Chief Executive Officer and our Chief Financial Officer. Our Chief Executive Officer and our Chief Financial Officer have concluded that our disclosure controls and procedures (as defined in Rule 13(a)-15(e) and 15(d)-15(e) under the 1934 Act) are designed and operating effectively to provide reasonable assurance that information relating to us and our subsidiaries that we are required to disclose in the reports that we file or submit to the Securities and Exchange Commission is accumulated and communicated to management as appropriate to allow timely decisions regarding required disclosure, and is recorded, processed, summarized and reported with the time periods specified in the Securities and Exchange Commission’s rules and forms.
Management’s Annual Report on Internal Control over Financial Reporting — Our Chief Executive Officer and Chief Financial Officer provided a report on behalf of management on our internal control over financial reporting. The full text of management’s report is contained in Item 8 of this Form 10-K and is incorporated herein by reference.
Attestation Report of the Registered Public Accounting Firm — The attestation report of our independent registered public accounting firm on their assessment of internal control over financial reporting is contained in Item 8 of this Form 10-K and is incorporated herein by reference.
Changes in Internal Control Over Financial Reporting — There were no changes in the Company’s internal control over financial reporting identified in connection with management’s evaluation that occurred during the three months ended December 31, 2017 that have materially affected, or are reasonably likely to materially affect, the Company’s internal control over financial reporting.
| Item 9B. | Other Information |
None.
-108-
Table of Contents
PART III
| Item 10. | Directors, Executive Officers and Corporate Governance |
The information required by Item 10 is incorporated by reference from the information in the Registrant’s definitive Proxy Statement to be filed pursuant to Regulation 14A for its 2018 Annual Meeting of Stockholders.
We have adopted a code of ethics and business conduct that applies to all of our directors, officers and employees, including our principal executive officer, principal financial officer, principal accounting officer and persons performing similar functions. Our code of ethics and business conduct is available free of charge within the investor relations section of our website at www.marlincorp.com. We intend to post on our website any amendments and waivers to the code of ethics and business conduct that are required to be disclosed by the rules of the Securities and Exchange Commission, or file a Form 8-K, Item 5.05 to the extent required by NASDAQ listing standards.
| Item 11. | Executive Compensation |
The information required by Item 11 is incorporated by reference from the information in the Registrant’s definitive Proxy Statement to be filed pursuant to Regulation 14A for its 2018 Annual Meeting of Stockholders.
| Item 12. | Security Ownership of Certain Beneficial Owners and Management and Related Stockholder Matters |
The information required by Item 12 is incorporated by reference from the information in the Registrant’s definitive Proxy Statement to be filed pursuant to Regulation 14A for its 2018 Annual Meeting of Stockholders.
| Item 13. | Certain Relationships and Related Transactions, and Director Independence |
The information required by Item 13 is incorporated by reference from the information in the Registrant’s definitive Proxy Statement to be filed pursuant to Regulation 14A for its 2018 Annual Meeting of Stockholders.
| Item 14. | Principal Accountant Fees and Services |
The information required by Item 14 is incorporated by reference from the information in the Registrant’s definitive Proxy Statement to be filed pursuant to Regulation 14A for its 2018 Annual Meeting of Stockholders.
-109-
Table of Contents
PART IV
| Item 15. | Exhibits and Financial Statement Schedules |
(a) Documents filed as part of this Report
The following is a list of consolidated and combined financial statements and supplementary data included in this report under Item 8 of Part II hereof:
| 1. | Financial Statements and Supplemental Data |
Reports of Independent Registered Public Accounting Firm.
Consolidated Balance Sheets as of December 31, 2017 and 2016.
Consolidated Statements of Operations for the years ended December 31, 2017, 2016 and 2015.
Consolidated Statements of Comprehensive Income for the years ended December 31, 2017, 2016 and 2015.
Consolidated Statements of Stockholders’ Equity for the years ended December 31, 2017, 2016 and 2015.
Consolidated Statements of Cash Flows for the years ended December 31, 2017, 2016 and 2015.
Notes to Consolidated Financial Statements.
Supplementary Data.
| 2. | Financial Statement Schedules |
Schedules are omitted because they are not applicable or are not required or because the required information is included in the consolidated and combined financial statements or notes thereto.
(b) Exhibits
-110-
Table of Contents
-111-
Table of Contents
-112-
Table of Contents
| † | Management contract or compensatory plan or arrangement. |
| (1) | Previously filed with the Securities and Exchange Commission as an exhibit to the Registrant’s Amendment No. 1 to Registration Statement on Form S-1 (File No. 333-108530), filed on October 14, 2003, and incorporated by reference herein. |
| (2) | Previously filed with the Securities and Exchange Commission as an exhibit to the Registrant’s Annual Report on Form 10-K for the fiscal year ended December 31, 2003 filed on March 29, 2004, and incorporated by reference herein. |
| (3) | Previously filed with the Securities and Exchange Commission as an exhibit to the Registrant’s Current Report on Form 8-K dated June 24, 2005 filed on June 29, 2005, and incorporated by reference herein. |
| (4) | Previously filed with the Securities and Exchange Commission as an exhibit to the Registrant’s Current Report on Form 8-K dated May 19, 2006 and filed on May 25, 2006, and incorporated by reference herein. |
| (5) | Previously filed with the Securities and Exchange Commission as an exhibit to the Registrant’s Current Report on Form 8-K dated November 15, 2006 and filed on November 17, 2006, and incorporated by reference herein. |
| (6) | Previously filed with the Securities and Exchange Commission as an exhibit to the Registrant’s Annual Report on Form 10-K for the fiscal year ended December 31, 2007 filed on March 5, 2008, and incorporated by reference herein. |
| (7) | Previously filed with the Securities and Exchange Commission as an exhibit to the Registrant’s Current Report on Form 8-K dated March 11, 2008 and filed on March 17, 2008, and incorporated by reference herein. |
| (8) | Previously filed with the Securities and Exchange Commission as an exhibit to the Registrant’s Current Report on Form 8-K dated December 31, 2008 and filed on January 7, 2009, and incorporated by reference herein. |
| (9) | Previously filed with the Securities and Exchange Commission as an exhibit to the Registrant’s Current Report on Form 8-K dated October 9, 2009 and filed on October 13, 2009, and incorporated by reference herein. |
| (10) | Previously filed with the Securities and Exchange Commission as an exhibit to the Registrant’s Current Report on Form 8-K dated October 28, 2009 and filed on November 2, 2009, and incorporated by reference herein. |
| (11) | Previously filed with the Securities and Exchange Commission as an exhibit to the Registrant’s Current Report on Form 8-K dated September 24, 2010 and filed on September 27, 2010, and incorporated by reference herein. |
| (12) | Previously filed with the Securities and Exchange Commission as an exhibit to the Registrant’s Annual Report on Form 10-K for the fiscal year ended December 31, 2009 filed on March 5, 2010, and incorporated by reference herein. |
| (13) | Previously filed with the Securities and Exchange Commission as an exhibit to the Registrant’s Current Report on Form 8-K dated June 26, 2012 filed on July 2, 2012, and incorporated by reference herein. |
| (14) | Previously filed with the Securities and Exchange Commission as an exhibit to the Registrant’s Form DEF 14A filed on April 23, 2012, and incorporated by reference herein. |
| (15) | Previously filed with the Securities and Exchange Commission as an exhibit to the Registrant’s Current Report on Form 8-K dated November 6, 2013, and incorporated by reference herein. |
| (16) | Previously filed with the SEC as an exhibit to the Registrant’s Current Report on Form 8-K filed on June 9, 2014, and incorporated by reference herein. |
| (17) | Previously filed with the SEC as an exhibit to the Registrant’s Current Report on Form 8-K filed on June 12, 2014, and incorporated by reference herein. |
| (18) | Previously filed with the SEC as an exhibit to the Registrant’s Current Report on Form 8-K filed on June 12, 2014, and incorporated by reference herein. |
| (19) | Previously filed with the Securities and Exchange Commission as an exhibit to the Registrant’s Quarterly Report on Form 10-Q for the period ended September 30, 2015 filed on November 3, 2015, and incorporated by reference herein. |
-113-
Table of Contents
| (20) | Previously filed with the Securities and Exchange Commission as an exhibit to the Registrant’s Quarterly Report on Form 10-Q for the period ended June 30, 2015 filed on August 5, 2015, and incorporated by reference herein. |
| (21) | Previously filed with the Securities and Exchange Commission as an exhibit to the Registrant’s Current Report on Form 8-K filed on February 8, 2016, and incorporated by reference herein. |
| (22) | Previously filed with the Securities and Exchange Commission as an exhibit to the Registrant’s Current Report on Form 8-K filed on October 20, 2015, and incorporated by reference herein. |
| (23) | Previously filed with the Securities and Exchange Commission as an exhibit to the Registrant’s Current Report on Form 8-K filed on October 20, 2015, and incorporated by reference herein. |
| (24) | Previously filed with the Securities and Exchange Commission as an exhibit to the Registrant’s Current Report on Form 8-K filed on October 9, 2015, and incorporated by reference herein. |
| (25) | Previously filed with the Securities and Exchange Commission as an exhibit to the Registrant’s Current Report on Form 8-K filed on July 8, 2015, and incorporated by reference herein. |
| (26) | Previously filed with the Securities and Exchange Commission as an exhibit to the Registrant’s Current Report on Form 8-K filed on April 30, 2015, and incorporated by reference herein. |
| (27) | Previously filed with the Securities and Exchange Commission as an exhibit to the Registrant’s Current Report on Form 8-K filed on April 8, 2015, and incorporated by reference herein. |
| (28) | Previously filed with the Securities and Exchange Commission as an exhibit to the Registrant’s Current Report on Form 8-K filed on January 12, 2015, and incorporated by reference herein. |
| 29) | Previously filed with the Securities and Exchange Commission as an exhibit to the Registrant’s Current Report on Form 8-K filed on May 5, 2016, and incorporated by reference herein. |
| (30) | Previously filed with the Securities and Exchange Commission as an exhibit to the Registrant’s Current Report on Form 8-K filed on May 10, 2016, and incorporated by reference herein. |
| (31) | Previously filed with the Securities and Exchange Commission as an exhibit to the Registrant’s Current Report on Form 8-K filed on September 19, 2016, and incorporated by reference herein. |
| (32) | Previously filed with the Securities and Exchange Commission as an exhibit to the Registrant’s Current Report on Form 8-K filed on October 20, 2016, and incorporated by reference herein. |
-114-
Table of Contents
SIGNATURES
Pursuant to the requirements of Section 13 or 15(d) of the Securities Exchange Act of 1934, the Registrant has duly caused this report to be signed on its behalf by the undersigned, thereunto duly authorized.
Date: March 9, 2018
| MARLIN BUSINESS SERVICES CORP. | ||
| By: | /s/ JEFFREY HILZINGER | |
| Jeffrey Hilzinger | ||
| Chief Executive Officer | ||
Pursuant to the requirements of the Securities Exchange Act of 1934, this report has been signed below by the following persons on behalf of the Registrant and in the capacities and on the dates indicated.
| Signature |
Title |
Date | ||||
| By: | /S/ JEFFREY HILZINGER |
Chief Executive Officer | March 9, 2018 | |||
| Jeffrey Hilzinger | (Principal Executive Officer) | |||||
| By: | /S/ W. TAYLOR KAMP |
Chief Financial Officer and | March 9, 2018 | |||
| W. Taylor Kamp | Senior Vice President | |||||
| (Principal Financial and | ||||||
| Accounting Officer) | ||||||
| By: | /S/ LAWRENCE J. DEANGELO |
Chairman of the Board of Directors | March 9, 2018 | |||
| Lawrence J. DeAngelo | ||||||
| By: | /S/ JOHN J. CALAMARI |
Director | March 9, 2018 | |||
| John J. Calamari | ||||||
| By: | /S/ SCOTT HEIMES |
Director | March 9, 2018 | |||
| Scott Heimes | ||||||
| By: | /S/ MATTHEW J. SULLIVAN |
Director | March 9, 2018 | |||
| Matthew J. Sullivan | ||||||
| By: | /S/ J. CHRISTOPHER TEETS |
Director | March 9, 2018 | |||
| J. Christopher Teets | ||||||
| By: | /S/ JAMES W. WERT |
Director | March 9, 2018 | |||
| James W. Wert | ||||||
-115-